Item 1: Report to Shareholders
 |
| Institutional Global Equity Fund | October 31, 2006 |
The views and opinions in this report were current as of October 31, 2006. They are not guarantees of performance or investment results and should not be taken as investment advice. Investment decisions reflect a variety of factors, and the managers reserve the right to change their views about individual stocks, sectors, and the markets at any time. As a result, the views expressed should not be relied upon as a forecast of the fund’s future investment intent. The report is certified under the Sarbanes-Oxley Act of 2002, which requires mutual funds and other public companies to affirm that, to the best of their knowledge, the information in their financial reports is fairly and accurately stated in all material respects.
Dear Investor
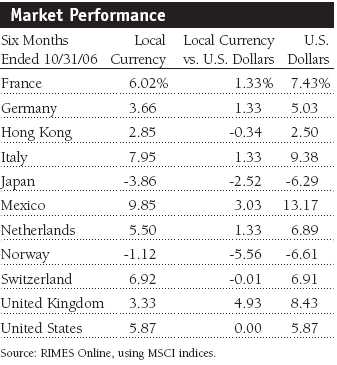
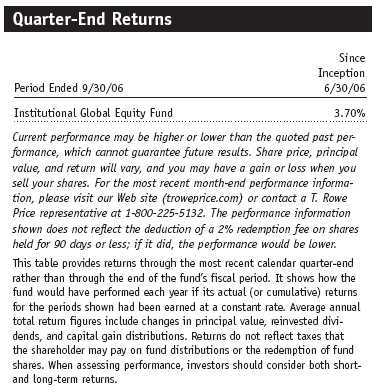
We would like to welcome new investors to the fund. The fund’s fiscal year ends on October 31 of each year, and our reports typically cover activity during the previous six-month period. Since the fund’s inception on June 30, 2006, global stocks produced attractive gains, although performance was generally modest during the six months under review. Developed European markets posted the strongest gains during the half-year period. In the U.S., large-cap stocks were positive while small- and mid-caps were flat to negative. Japan was sharply lower, and a declining yen versus the dollar deepened losses for U.S. investors. Emerging markets couldn’t quite make up losses sustained earlier in the period.
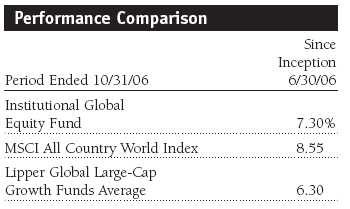
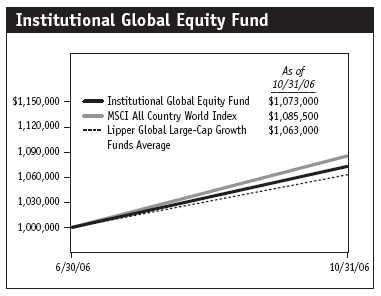
Your fund trailed the return of the MSCI All Country World Index but surpassed that of the Lipper Global Large-Cap Growth Funds Average during the four months ended October 31, 2006. Strength in telecommunication services and health care contrasted with weakness in consumer discretionary, energy, and industrials.
MARKET REVIEW
Global economic data remained strong, and most countries are experiencing healthy noninflationary growth. Oil and commodity prices fell, but ongoing conflict in the Middle East and further instability in North Korea weighed on the markets. The European Central Bank (ECB) and the Bank of Japan raised interest rates to head off inflation, but the U.S. Federal Reserve paused in its two-year cycle of monetary tightening.
The U.S. economy began to slow during the past six months as higher interest rates exerted an increasing drag on growth. The slowdown was most apparent in the housing sector, which had provided a significant stimulus to the economy since the last recession. New home construction slowed considerably, and housing prices began to fall, especially in markets that had seen significant appreciation over the past few years. Flat or falling prices and higher short-term mortgage rates meant consumers were less able to draw on any equity they had accumulated to finance home improvements and other types of spending.
In Europe, economic fundamentals were encouraging. The Continent’s economy grew faster in the first half of the year than previously reported, but by the end of the period, there were fears that it might be slowing. The ECB projected the growth rate for the year at about 2.5%, which would be the fastest pace since 2000. ECB President Jean-Claude Trichet warned of higher rates of inflation and said the bank would exercise “strong vigilance” to defend price stability. Merger activity continued at a fast pace, enhancing returns.
Japan’s economic data painted a confusing picture. In late August, data indicated year-to-date capital spending had grown at its fastest pace since the bubble years, but later reports led some to believe that Japan’s recovery might be in jeopardy. China continues to record strong economic growth despite attempts by the authorities to rein it in. The central bank raised interest rates in August for the second time in four months, and officials indicated they could continue to squeeze the nation’s money supply. China’s trade surplus is expected to exceed last year’s before year-end. Two other regional heavyweights, Taiwan and South Korea, were hamstrung by internal political trouble, disappointing corporate earnings, and slowing economies.
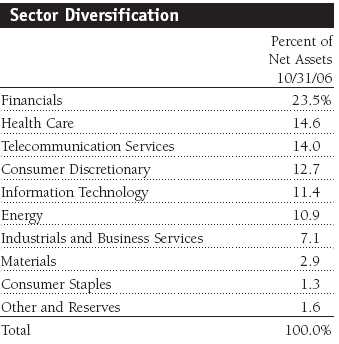
The stocks we select for your portfolio represent our best global investment ideas. We focus on companies with competitive advantages operating in industries with stable to improving fundamentals. Our worldwide investment team attempts to recognize market trends in their early stages and, based on that analysis, to identify the best investment opportunities that we see unfolding. The themes and companies that we have been focusing on include our best ideas covering a broad range of industries.
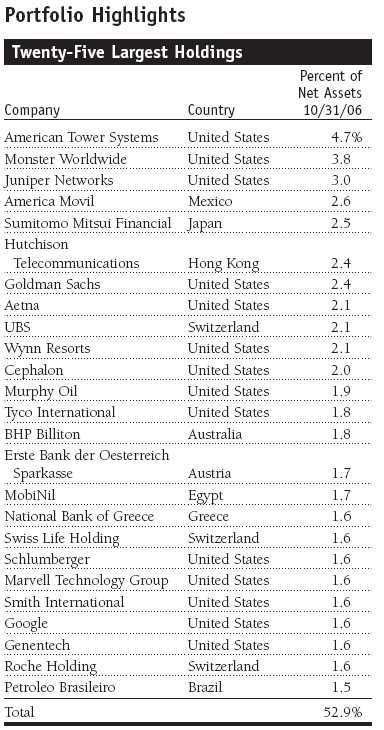
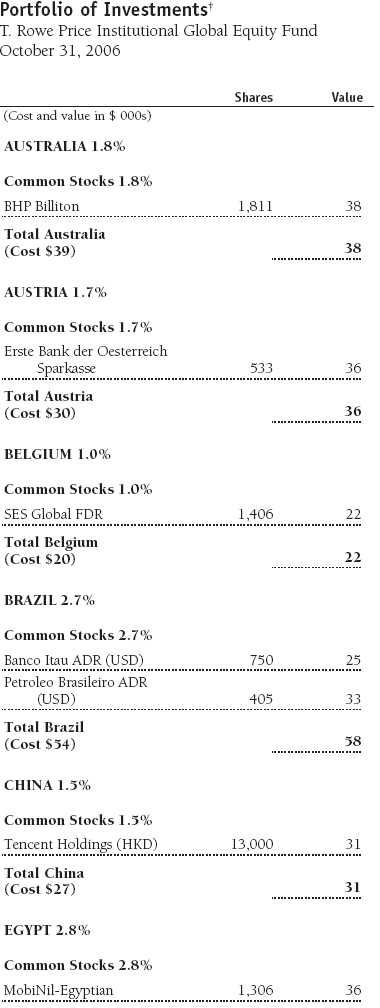
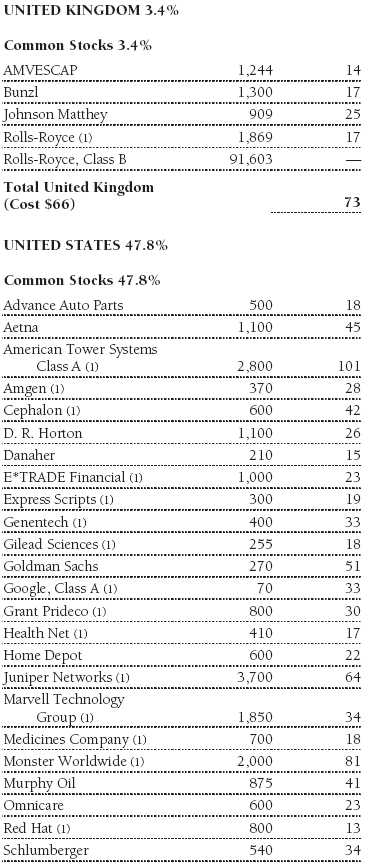
We are emphasizing the growth of mobile communication in both emerging markets (increased penetration) and North America (wireless towers). Emerging markets wireless companies have been benefiting from low penetration rates and rational competition. Some of the companies currently represented in the portfolio include India’s Bharti Televentures, Hong Kong’s Hutchison Telecommunications, and Mexico’s America Movil. By contrast, there is limited potential for subscriber growth in many developed markets. For example, the U.S. wireless industry has prospered because of consolidation, but the penetration rate has climbed from about 50% in 2001 to more than 70% in 2006, compared with less than 15% in some emerging markets. It is possible for developed market penetration to increase as technology becomes more efficient and less costly, but at a much slower pace than in emerging markets. There are, however, opportunities in developed markets, especially in the wireless tower companies, due to high barriers to entry, pricing power, fixed costs, and the ability to support high amounts of financial leverage. In fact, the portfolio’s largest holding is American Tower Systems. (Please refer to the fund’s portfolio of investments for a detailed list of holdings and the amount each represents of the portfolio.)
Within energy, we are focusing on U.S.-based energy and equipment firms. The competitive advantages of scale, technology, and diversification allow them to have a significant global presence as the challenges of finding new sources of oil and gas lead to more complex exploration and production projects. Accordingly, customers need technologically advanced equipment as well as assistance from companies with true expertise in the field. Within health care, aging global populations, particularly in developed regions, should continue to drive up costs as a percentage of GDP. We like U.S. biotechnology companies with the ability to produce novel therapeutics for unmet medical needs, including Gilead Sciences with its market-leading anti-HIV franchise and Genentech’s strong suite of cancer drugs.
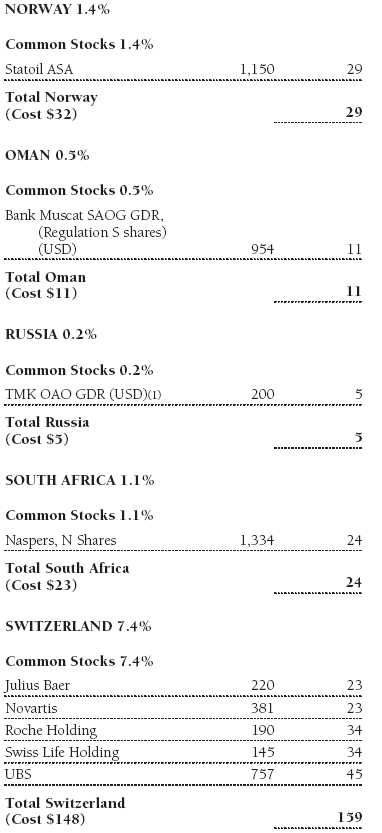
We also are optimistic about prospects in the financials area where we especially like the prospects for capital markets companies. The group looks attractive behind improving financial markets and M&A activity. A significant holding in the group is UBS. With high barriers to entry and a strong position in the private wealth management business, we believe UBS could continue to attract inflows and drive strong growth. The company remains well positioned for growth, especially with Europe’s supportive interest rate outlook. We are overweight commercial banks and find most opportunity in emerging markets and Japan, which should benefit from improving GDP growth that should be supportive of consumer loan growth.
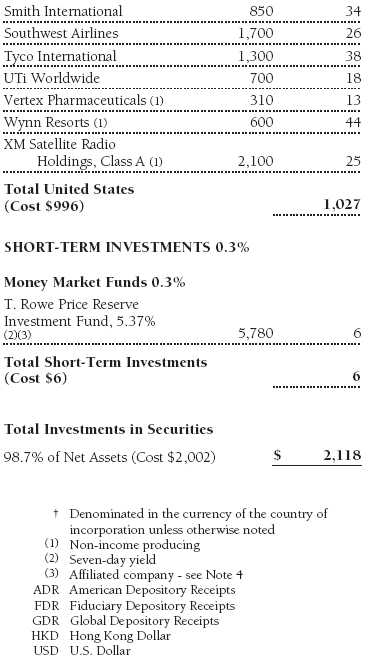
Not all of our investment themes will work simultaneously, which is a key factor in our diversified portfolio approach. For example, energy stocks, which benefited performance in the first half of the year, restrained results this period. In future reports, we will discuss in detail which ideas worked and which did not pan out during the preceding six-month period. Despite recent weakness, we believe in the power of the business model and continued growth in demand for energy. Some of our holdings in this sector included Grant Prideco, Schlumberger, and Smith International.
Some of our best ideas in telecommunication services included wireless service providers Bharti Airtel, America Movil, and American Tower Systems. As service providers continue to build out next-generation networks in an effort to provide better services, tower companies should continue to do well. Health care stocks are also promising, particularly service providers and biotechnology. We are sanguine about the prospects for biotechnology company Sepracor because of the strong sales of its sleep maintenance drug, Lunesta, and news that a competing drug would be delayed to market.
INVESTMENT OUTLOOK
We believe that the themes we are employing in our investment strategy will reward investors over the long term. Growing demand and infrastructure creation in both China and India should put upward pressure on energy and materials prices. The aging population in developed markets, along with greater buying power through wealth creation, should propel the health care industry. Merger and acquisition activity, consumer loan growth, and private wealth management should drive financials. Rising market share for Internet advertising will aid media, and communication equipment companies are likely to participate in the growing emerging markets wireless industry. These are the trends that inform our stock selection process as we look toward the future.
Global economic growth should expand through the convergence of global business practices that are fostering structural changes. Against this backdrop, stock valuations appear reasonable, particularly in developed European markets. Emerging market stock valuations are not overly expensive, but neither are they as compelling relative to developed European markets as they had been. Risks to global expansion remain, of course, including ongoing geopolitical instability, rising commodities prices, potential compression in earnings margins, etc.
Balancing the risks against the potential rewards, however, we are upbeat about the future of global investing. Our strategy will emphasize the stocks of companies we believe have the greatest growth potential in a dynamic global environment during the months ahead.
Respectfully submitted,

Robert N. Gensler
Chairman of the fund’s Investment Advisory Committee
November 17, 2006
The committee chairman has day-to-day responsibility for managing the portfolio and works with committee members in developing and executing the fund’s investment program.
| Risks of International Investing |
Funds that invest overseas generally carry more risk than funds that invest strictly in U.S. assets. Funds investing in a single country or in a limited geographic region tend to be riskier than more diversified funds. Risks can result from varying stages of economic and political development; differing regulatory environments, trading days, and accounting standards; and higher transaction costs of non-U.S. markets. Non-U.S. investments are also subject to currency risk, or a decline in the value of a foreign currency versus the U.S. dollar, which reduces the dollar value of securities denominated in that currency.
| Glossary |
GDP: Gross domestic product is the total market value of all goods and services produced in a country in a given year.
Lipper averages: The averages of available mutual fund performance returns for specified periods in defined categories as tracked by Lipper Inc.
MSCI All Country World Index: A capitalization-weighted index of stocks from developed and emerging markets worldwide.
MSCI USA Index: A capitalization-weighted index of stocks based in the United States.
Price/earnings (P/E) ratio: Calculated by dividing a stock’s market value per share by the company’s earnings per share for the past 12 months or by expected earnings for the coming year.
| Performance Comparison |
This chart shows the value of a hypothetical $1,000,000 investment in the fund over the past 10 fiscal year periods or since inception (for funds lacking 10-year records). The result is compared with benchmarks, which may include a broad-based market index and a peer group average or index. Market indexes do not include expenses, which are deducted from fund returns as well as mutual fund averages and indexes.
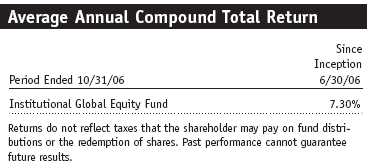
This table shows how the portfolio would have performed each year if its actual (or cumulative) returns for the period shown had been earned at a constant rate.
Fund Expense Example
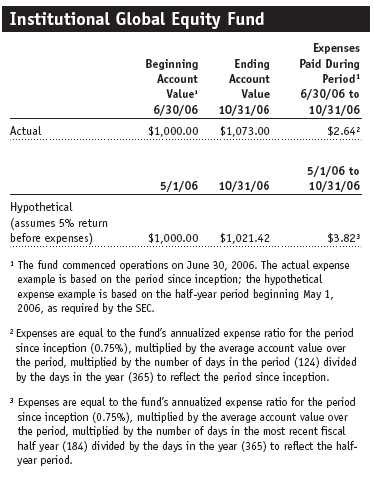
As a mutual fund shareholder, you may incur two types of costs: (1) transaction costs, such as redemption fees or sales loads, and (2) ongoing costs, including management fees, distribution and service (12b-1) fees, and other fund expenses. The following example is intended to help you understand your ongoing costs (in dollars) of investing in the fund and to compare these costs with the ongoing costs of investing in other mutual funds. The example is based on an investment of $1,000 invested at the beginning of the most recent six-month period and held for the entire period.
Actual Expenses
The first line of the following table (“Actual”) provides information about actual account values and actual expenses. You may use the information in this line, together with your account balance, to estimate the expenses that you paid over the period. Simply divide your account value by $1,000 (for example, an $8,600 account value divided by $1,000 = 8.6), then multiply the result by the number in the first line under the heading “Expenses Paid During Period” to estimate the expenses you paid on your account during this period.
Hypothetical Example for Comparison Purposes
The information on the second line of the table (“Hypothetical”) is based on hypothetical account values and expenses derived from the fund’s actual expense ratio and an assumed 5% per year rate of return before expenses (not the fund’s actual return). You may compare the ongoing costs of investing in the fund with other funds by contrasting this 5% hypothetical example and the 5% hypothetical examples that appear in the shareholder reports of the other funds. The hypothetical account values and expenses may not be used to estimate the actual ending account balance or expenses you paid for the period.
You should also be aware that the expenses shown in the table highlight only your ongoing costs and do not reflect any transaction costs, such as redemption fees or sales loads. Therefore, the second line of the table is useful in comparing ongoing costs only and will not help you determine the relative total costs of owning different funds. To the extent a fund charges transaction costs, however, the total cost of owning that fund is higher.
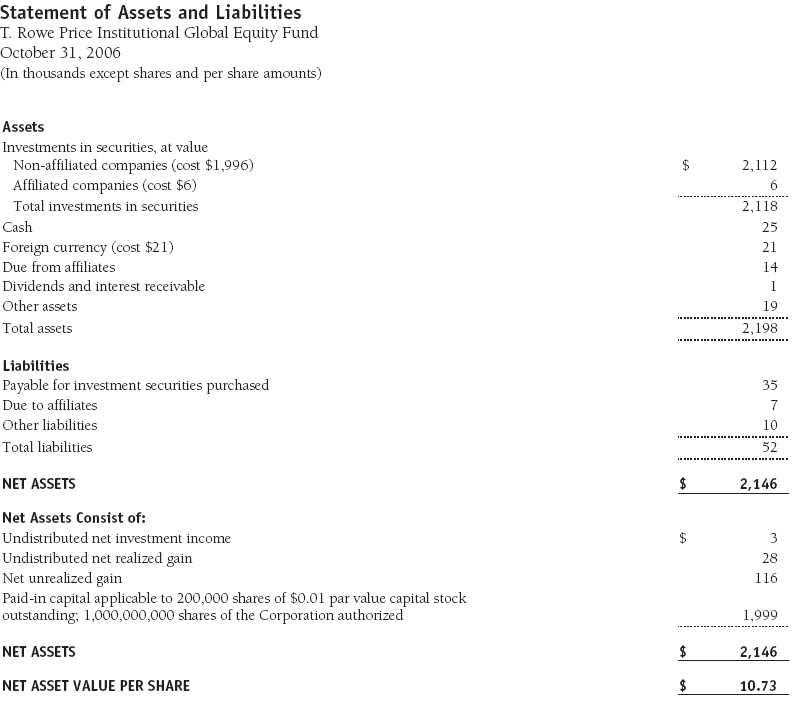
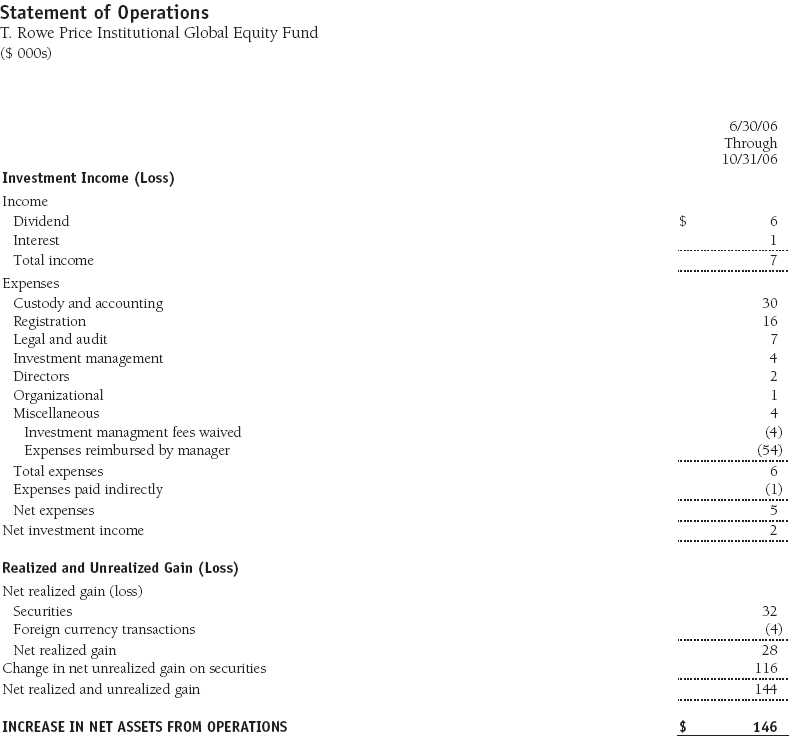
The accompanying notes are an integral part of these financial statements.

The accompanying notes are an integral part of these financial statements.
The accompanying notes are an integral part of these financial statements.
The accompanying notes are an integral part of these financial statements.
The accompanying notes are an integral part of these financial statements.
Notes to Financial Statements
T. Rowe Price Institutional Global Equity Fund
October 31, 2006
NOTE 1 - SIGNIFICANT ACCOUNTING POLICIES
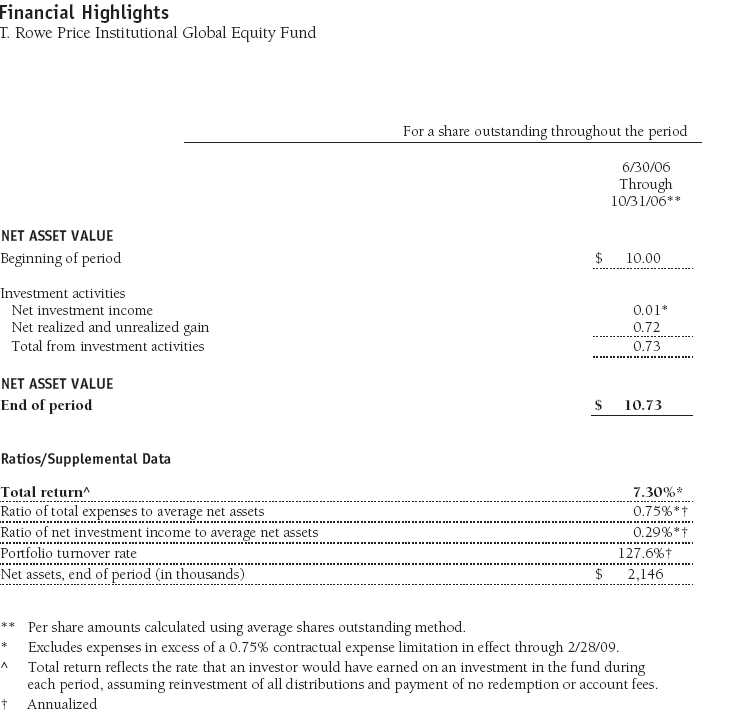
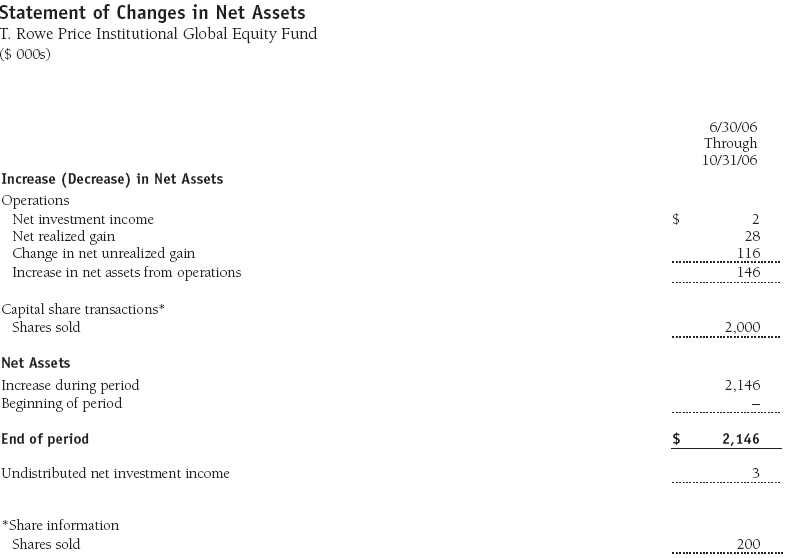
T. Rowe Price Institutional International Funds, Inc. (the corporation), is registered under the Investment Company Act of 1940 (the 1940 Act). The Institutional Global Equity Fund (the fund), a diversified, open-end management investment company, is one portfolio established by the corporation. The fund commenced operations on June 30, 2006. The fund seeks long-term growth of capital through investments primarily in the common stocks of established companies throughout the world, including the U.S.
The accompanying financial statements were prepared in accordance with accounting principles generally accepted in the United States of America, which require the use of estimates made by fund management. Fund management believes that estimates and security valuations are appropriate; however, actual results may differ from those estimates, and the security valuations reflected in the financial statements may differ from the value the fund ultimately realizes upon sale of the securities.
Valuation The fund values its investments and computes its net asset value per share at the close of the New York Stock Exchange (NYSE), normally 4 p.m. ET, each day that the NYSE is open for business. Equity securities listed or regularly traded on a securities exchange or in the over-the-counter (OTC) market are valued at the last quoted sale price or, for certain markets, the official closing price at the time the valuations are made, except for OTC Bulletin Board securities, which are valued at the mean of the latest bid and asked prices. A security that is listed or traded on more than one exchange is valued at the quotation on the exchange determined to be the primary market for such security. Listed securities not traded on a particular day are valued at the mean of the latest bid and asked prices for domestic securities and the last quoted sale price for international securities. Debt securities with original maturities of less than one year are valued at amortized cost in local currency, which approximates fair value when combined with accrued interest.
Investments in mutual funds are valued at the mutual fund’s closing net asset value per share on the day of valuation.
Other investments, including restricted securities, and those for which the above valuation procedures are inappropriate or are deemed not to reflect fair value are stated at fair value as determined in good faith by the T. Rowe Price Valuation Committee, established by the fund’s Board of Directors.
Most foreign markets close before the close of trading on the NYSE. If the fund determines that developments between the close of a foreign market and the close of the NYSE will, in its judgment, materially affect the value of some or all of its portfolio securities, which in turn will affect the fund’s share price, the fund will adjust the previous closing prices to reflect the fair value of the securities as of the close of the NYSE, as determined in good faith by the T. Rowe Price Valuation Committee, established by the fund’s Board of Directors. A fund may also fair value securities in other situations, such as when a particular foreign market is closed but the fund is open. In deciding whether to make fair value adjustments, the fund reviews a variety of factors, including developments in foreign markets, the performance of U.S. securities markets, and the performance of instruments trading in U.S. markets that represent foreign securities and baskets of foreign securities. The fund uses outside pricing services to provide it with closing market prices and information used for adjusting those prices. The fund cannot predict when and how often it will use closing prices and when it will adjust those prices to reflect fair value. As a means of evaluating its fair value process, the fund routinely compares closing market prices, the next day’s opening prices in the same markets, and adjusted prices.
Currency Translation Assets, including investments, and liabilities denominated in foreign currencies are translated into U.S. dollar values each day at the prevailing exchange rate, using the mean of the bid and asked prices of such currencies against U.S. dollars as quoted by a major bank. Purchases and sales of securities, income, and expenses are translated into U.S. dollars at the prevailing exchange rate on the date of the transaction. The effect of changes in foreign currency exchange rates on realized and unrealized security gains and losses is reflected as a component of security gains and losses.
Credits The fund earns credits on temporarily uninvested cash balances at the custodian that reduce the fund’s custody charges. Custody expense in the accompanying financial statements is presented before reduction for credits, which are reflected as expenses paid indirectly.
Redemption Fees A 2% fee is assessed on redemptions of fund shares held less than 90 days to deter short-term trading and to protect the interests of long-term shareholders. Redemption fees are withheld from proceeds that shareholders receive from the sale or exchange of fund shares. The fees are paid to the fund, and are recorded as an increase to paid-in capital. The fees may cause the redemption price per share to differ from the net asset value per share.
Investment Transactions, Investment Income, and Distributions Income and expenses are recorded on the accrual basis. Premiums and discounts on debt securities are amortized for financial reporting purposes. Dividends received from mutual fund investments are reflected as dividend income; capital gain distributions are reflected as realized gain/loss. Dividend income and capital gain distributions are recorded on the ex-dividend date. Investment transactions are accounted for on the trade date. Realized gains and losses are reported on the identified cost basis. Distributions to shareholders are recorded on the ex-dividend date. Income distributions are declared and paid on an annual basis. Capital gain distributions, if any, are declared and paid by the fund, typically on an annual basis.
New Accounting Pronouncements In June 2006, the Financial Accounting Standards Board (“FASB”) issued FASB Interpretation No. 48 (“FIN 48”), Accounting for Uncertainty in Income Taxes, a clarification of FASB Statement No. 109, Accounting for Income Taxes. FIN 48 establishes financial reporting rules regarding recognition and measurement of tax positions taken or expected to be taken on a tax return. Management is evaluating the anticipated impact on the fund from FIN 48, which is effective for the fund’s fiscal year beginning November 1, 2007.
NOTE 2 - INVESTMENT TRANSACTIONS
Consistent with its investment objective, the fund engages in the following practices to manage exposure to certain risks or to enhance performance. The investment objective, policies, program, and risk factors of the fund are described more fully in the fund’s prospectus and Statement of Additional Information.
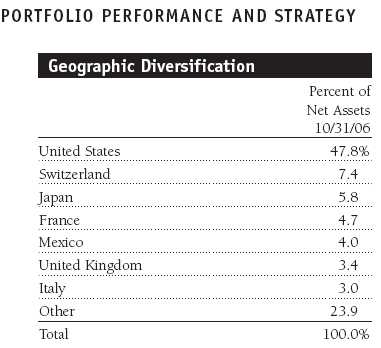
Emerging Markets At October 31, 2006, approximately 16% of the fund’s net assets were invested in securities of companies located in emerging markets or denominated in or linked to the currencies of emerging market countries. Future economic or political developments could adversely affect the liquidity or value, or both, of such securities.
Other Purchases and sales of portfolio securities, other than short-term securities, aggregated $1,208,000 and $821,000, respectively, for the year ended October 31, 2006.
NOTE 3 - FEDERAL INCOME TAXES
No provision for federal income taxes is required since the fund intends to qualify as a regulated investment company under Subchapter M of the Internal Revenue Code and distribute to shareholders all of its taxable income and gains. Federal income tax regulations differ from generally accepted accounting principles; therefore, distributions determined in accordance with tax regulations may differ significantly in amount or character from net investment income and realized gains for financial reporting purposes. Financial reporting records are adjusted for permanent book/tax differences to reflect tax character. Financial records are not adjusted for temporary differences.
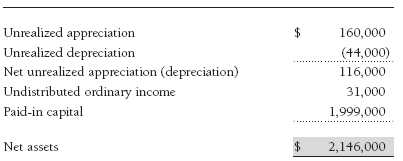
There were no distributions in the year ended October 31, 2006. At October 31, 2006, the tax-basis components of net assets were as follows:
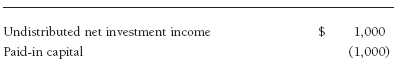
For the year ended October 31, 2006, the fund recorded the following permanent reclassifications to reflect tax character. Reclassifications to paid-in capital relate primarily to nondeductible organizational expenses. Results of operations and net assets were not affected by these reclassifications.
At October 31, 2006, the cost of investments for federal income tax purposes was $2,002,000.
NOTE 4 - RELATED PARTY TRANSACTIONS
The fund is managed by T. Rowe Price International, Inc. (the manager), a wholly owned subsidiary of T. Rowe Price Associates, Inc. (Price Associates), which is wholly owned by T. Rowe Price Group, Inc. The investment management agreement between the fund and the manager provides for an annual investment management fee equal to 0.65% of the fund’s average daily net assets. The fee is computed daily and paid monthly.
The fund is also subject to a contractual expense limitation through February 28, 2009. During the limitation period, the manager is required to waive its management fee and reimburse the fund for any expenses, excluding interest, taxes, brokerage commissions, and extraordinary expenses, that would otherwise cause the fund’s ratio of total expenses to average net assets (expense ratio) to exceed its expense limitation of 0.75%. For a period of three years after the date of any reimbursement or waiver, the fund is required to repay the manager for expenses previously reimbursed and management fees waived to the extent its net assets have grown or expenses have declined sufficiently to allow repayment without causing the fund’s expense ratio to exceed its expense limitation. Pursuant to this agreement, management fees in the amount of $4,000 were waived and expenses in the amount of $54,000 were reimbursed by the manager during the year ended October 31, 2006.
In addition, the fund has entered into service agreements with Price Associates and a wholly owned subsidiary of Price Associates (collectively, Price). Price Associates computes the daily share price and provides certain other administrative services to the fund. T. Rowe Price Services, Inc., provides shareholder and administrative services in its capacity as the fund’s transfer and dividend disbursing agent. For the year ended October 31, 2006, expenses incurred pursuant to these service agreements were $28,000 for Price Associates and $0 for T. Rowe Price Services. The total amount payable at period-end pursuant to these service agreements is reflected as Due to Affiliates in the accompanying financial statements.
The fund may invest in the T. Rowe Price Reserve Investment Fund and the T. Rowe Price Government Reserve Investment Fund (collectively, the T. Rowe Price Reserve Funds), open-end management investment companies managed by Price Associates and affiliates of the fund. The T. Rowe Price Reserve Funds are offered as cash management options to mutual funds, trusts, and other accounts managed by Price Associates and/or its affiliates, and are not available for direct purchase by members of the public. The T. Rowe Price Reserve Funds pay no investment management fees. During the year ended October 31, 2006, dividend income from the T. Rowe Price Reserve Funds totaled $0, and the value of shares of the T. Rowe Price Reserve Funds held at October 31, 2006 was $6,000.
As of October 31, 2006, T. Rowe Price Group, Inc., and/or its wholly owned subsidiaries owned 200,000 shares of the fund, representing 100% of the fund’s net assets.
Report of Independent Registered Public Accounting Firm
To the Board of Directors of T. Rowe Price Institutional International Funds, Inc. and Shareholders of T. Rowe Price Institutional Global Equity Fund
In our opinion, the accompanying statement of assets and liabilities, including the portfolio of investments, and the related statements of operations and of changes in net assets and the financial highlights present fairly, in all material respects, the financial position of T. Rowe Price Institutional Global Equity Fund (one of the portfolios comprising T. Rowe Price Institutional International Funds, Inc., hereafter referred to as the “Fund”) at October 31, 2006, and the results of its operations, the changes in its net assets and the financial highlights for the period June 30, 2006 (commencement of operations) through October 31, 2006, in conformity with accounting principles generally accepted in the United States of America. These financial statements and financial highlights (hereafter referred to as “financial statements”) are the responsibility of the Fund’s management; our responsibility is to express an opinion on these financial statements based on our audit. We conducted our audit of these financial statements in accordance with the auditing standards of the Public Company Accounting Oversight Board (United States). Those standards require that we plan and perform the audit to obtain reasonable assurance about whether the financial statements are free of material misstatement. An audit includes examining, on a test basis, evidence supporting the amounts and disclosures in the financial statements, assessing the accounting principles used and significant estimates made by management, and evaluating the overall financial statement presentation. We believe that our audit, which included confirmation of securities at October 31, 2006 by correspondence with the custodian and by agreement to the underlying ownership records for T. Rowe Price Reserve Investment Fund, provide a reasonable basis for our opinion.
PricewaterhouseCoopers LLP
Baltimore, Maryland
December 12, 2006
| Tax Information (Unaudited) for the Tax Year Ended 10/31/06 |
We are providing this information as required by the Internal Revenue Code. The amounts shown may differ from those elsewhere in this report because of differences between tax and financial reporting requirements.
For taxable non-corporate shareholders, $5,000 of the fund’s income represents qualified dividend income subject to the 15% rate category.
For corporate shareholders, $1,000 of the fund’s income qualifies for the dividends-received deduction.
The fund will pass through foreign source income of $5,000.
| Information on Proxy Voting Policies, Procedures, and Records |
A description of the policies and procedures used by T. Rowe Price funds and portfolios to determine how to vote proxies relating to portfolio securities is available in each fund’s Statement of Additional Information, which you may request by calling 1-800-225-5132 or by accessing the SEC’s Web site, www.sec.gov. The description of our proxy voting policies and procedures is also available on our Web site, www.troweprice.com. To access it, click on the words “Company Info” at the top of our homepage for individual investors. Then, in the window that appears, click on the “Proxy Voting Policy” navigation button in the top left corner.
Each fund’s most recent annual proxy voting record is available on our Web site and through the SEC’s Web site. To access it through our Web site, follow the directions above, then click on the words “Proxy Voting Record” at the bottom of the Proxy Voting Policy page.
| How to Obtain Quarterly Portfolio Holdings |
The fund files a complete schedule of portfolio holdings with the Securities and Exchange Commission for the first and third quarters of each fiscal year on Form N-Q. The fund’s Form N-Q is available electronically on the SEC’s Web site (www.sec.gov); hard copies may be reviewed and copied at the SEC’s Public Reference Room, 450 Fifth St. N.W., Washington, DC 20549. For more information on the Public Reference Room, call 1-800-SEC-0330.
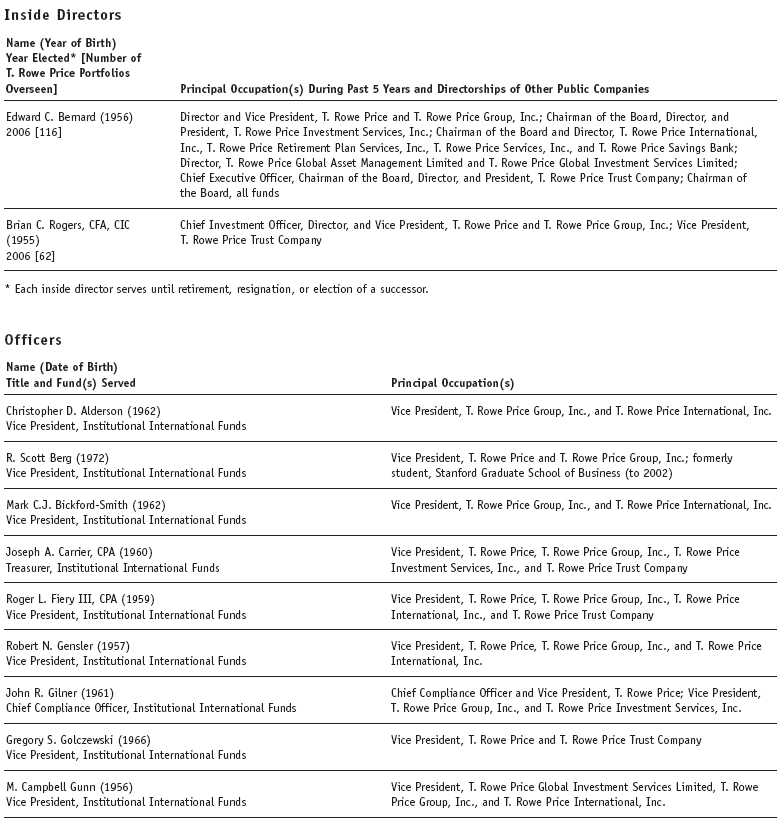
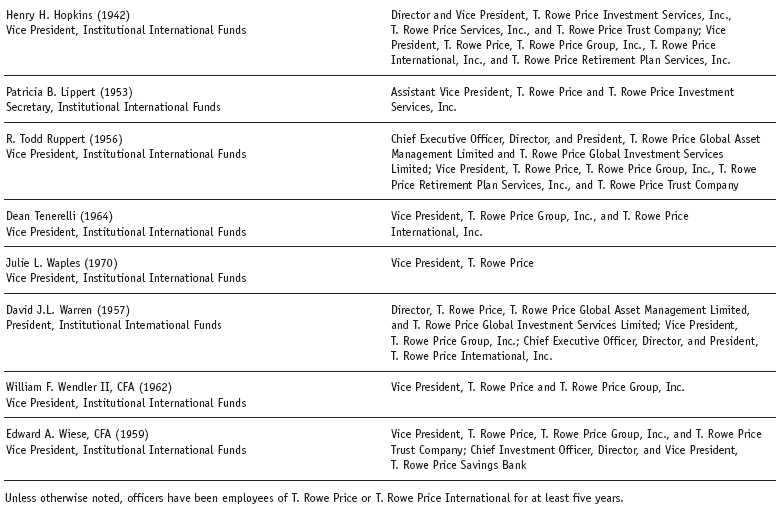
| About the Fund’s Directors and Officers |
Item 2. Code of Ethics.
The registrant has adopted a code of ethics, as defined in Item 2 of Form N-CSR, applicable to its principal executive officer, principal financial officer, principal accounting officer or controller, or persons performing similar functions. A copy of this code of ethics is filed as an exhibit to this Form N-CSR. No substantive amendments were approved or waivers were granted to this code of ethics during the period covered by this report.
Item 3. Audit Committee Financial Expert.
The registrant’s Board of Directors/Trustees has determined that Mr. Donald W. Dick Jr. qualifies as an audit committee financial expert, as defined in Item 3 of Form N-CSR. Mr. Dick is considered independent for purposes of Item 3 of Form N-CSR.
Item 4. Principal Accountant Fees and Services.
(a) – (d) Aggregate fees billed to the registrant for the last two fiscal years for professional services rendered by the registrant’s principal accountant were as follows:
| 2006 | 2005* | |
| Audit Fees | $4,898 | n/a |
| Audit-Related Fees | 526 | n/a |
| Tax Fees | 587 | n/a |
| All Other Fees | 75 | n/a |
| * - fund incepted in fiscal 2006 |
Audit fees include amounts related to the audit of the registrant’s annual financial statements and services normally provided by the accountant in connection with statutory and regulatory filings. Audit-related fees include amounts reasonably related to the performance of the audit of the registrant’s financial statements and specifically include the issuance of a report on internal controls and, if applicable, agreed-upon procedures related to fund acquisitions. Tax fees include amounts related to services for tax compliance, tax planning, and tax advice. The nature of these services specifically includes the review of distribution calculations and the preparation of Federal, state, and excise tax returns. Reclassification from tax fees to audit fees of fiscal 2005 amounts related to the auditing of tax disclosures within the registrant’s annual financial statements has been made in order to conform to fiscal 2006 presentation. All other fees include the registrant’s pro-rata share of amounts for agreed-upon procedures in conjunction with service contract approvals by the registrant’s Board of Directors/Trustees.
(e)(1) The registrant’s audit committee has adopted a policy whereby audit and non-audit services performed by the registrant’s principal accountant for the registrant, its investment adviser, and any entity controlling, controlled by, or under common control with the investment adviser that provides ongoing services to the registrant require pre-approval in advance at regularly scheduled audit committee meetings. If such a service is required between regularly scheduled audit committee meetings, pre-approval may be authorized by one audit committee member with ratification at the next scheduled audit committee meeting. Waiver of pre-approval for audit or non-audit services requiring fees of a de minimis amount is not permitted.
(2) No services included in (b) – (d) above were approved pursuant to paragraph (c)(7)(i)(C) of Rule 2-01 of Regulation S-X.
(f) Less than 50 percent of the hours expended on the principal accountant’s engagement to audit the registrant’s financial statements for the most recent fiscal year were attributed to work performed by persons other than the principal accountant’s full-time, permanent employees.
(g) The aggregate fees billed for the most recent fiscal year and the preceding fiscal year by the registrant’s principal accountant for non-audit services rendered to the registrant, its investment adviser, and any entity controlling, controlled by, or under common control with the investment adviser that provides ongoing services to the registrant were $1,200,000 and $883,000, respectively, and were less than the aggregate fees billed for those same periods by the registrant’s principal accountant for audit services rendered to the T. Rowe Price Funds. Preceding fiscal year amount reflects the reclassification of tax fees described in (a) – (d) above.
(h) All non-audit services rendered in (g) above were pre-approved by the registrant’s audit committee. Accordingly, these services were considered by the registrant’s audit committee in maintaining the principal accountant’s independence.Item 5. Audit Committee of Listed Registrants.
Not applicable.
Item 6. Schedule of Investments.
Not applicable. The complete schedule of investments is included in Item 1 of this Form N-CSR.
Item 7. Disclosure of Proxy Voting Policies and Procedures for Closed-End Management Investment Companies.
Not applicable.
Item 8. Portfolio Managers of Closed-End Management Investment Companies.
Not applicable.
Item 9. Purchases of Equity Securities by Closed-End Management Investment Company and Affiliated Purchasers.
Not applicable.
Item 10. Submission of Matters to a Vote of Security Holders.
Not applicable.
Item 11. Controls and Procedures.
(a) The registrant’s principal executive officer and principal financial officer have evaluated the registrant’s disclosure controls and procedures within 90 days of this filing and have concluded that the registrant’s disclosure controls and procedures were effective, as of that date, in ensuring that information required to be disclosed by the registrant in this Form N-CSR was recorded, processed, summarized, and reported timely.
(b) The registrant’s principal executive officer and principal financial officer are aware of no change in the registrant’s internal control over financial reporting that occurred during the registrant’s second fiscal quarter covered by this report that has materially affected, or is reasonably likely to materially affect, the registrant’s internal control over financial reporting.
Item 12. Exhibits.
(a)(1) The registrant’s code of ethics pursuant to Item 2 of Form N-CSR is attached.
(2) Separate certifications by the registrant's principal executive officer and principal financial officer, pursuant to Section 302 of the Sarbanes-Oxley Act of 2002 and required by Rule 30a-2(a) under the Investment Company Act of 1940, are attached.
(3) Written solicitation to repurchase securities issued by closed-end companies: not applicable.
(b) A certification by the registrant's principal executive officer and principal financial officer, pursuant to Section 906 of the Sarbanes-Oxley Act of 2002 and required by Rule 30a-2(b) under the Investment Company Act of 1940, is attached.
SIGNATURES | |
| Pursuant to the requirements of the Securities Exchange Act of 1934 and the Investment | |
| Company Act of 1940, the registrant has duly caused this report to be signed on its behalf by the | |
| undersigned, thereunto duly authorized. | |
| T. Rowe Price Institutional International Funds, Inc. | |
| By | /s/ Edward C. Bernard |
| Edward C. Bernard | |
| Principal Executive Officer | |
| Date | December 15, 2006 |
| Pursuant to the requirements of the Securities Exchange Act of 1934 and the Investment | |
| Company Act of 1940, this report has been signed below by the following persons on behalf of | |
| the registrant and in the capacities and on the dates indicated. | |
| By | /s/ Edward C. Bernard |
| Edward C. Bernard | |
| Principal Executive Officer | |
| Date | December 15, 2006 |
| By | /s/ Joseph A. Carrier |
| Joseph A. Carrier | |
| Principal Financial Officer | |
| Date | December 15, 2006 |