UNITED STATES
SECURITIES AND EXCHANGE COMMISSION
Washington, D.C. 20549
FORM N-CSR
CERTIFIED SHAREHOLDER REPORT OF REGISTERED
MANAGEMENT INVESTMENT COMPANIES
Investment Company Act File Number: 811-05833
| T. Rowe Price Institutional International Funds, Inc. |
| (Exact name of registrant as specified in charter) |
| 100 East Pratt Street, Baltimore, MD 21202 |
| (Address of principal executive offices) |
| David Oestreicher |
| 100 East Pratt Street, Baltimore, MD 21202 |
| (Name and address of agent for service) |
Registrant’s telephone number, including area code: (410) 345-2000
Date of fiscal year end: October 31
Date of reporting period: October 31, 2013
Item 1. Report to Shareholders
 |
| Institutional Emerging Markets Equity Fund | October 31, 2013 |
| Highlights |
- Emerging markets stocks rose over our fiscal year as accommodative central bank policies in the developed world lifted demand for higher-risk assets.
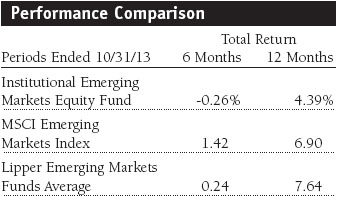
- The Institutional Emerging Markets Equity Fund advanced for the year but trailed its benchmark index and Lipper peer group average.
- We continue to focus on sectors driven by domestic demand, which we believe represents a sustainable and secular growth theme in many emerging markets.
- China, Brazil, and South Korea represented our biggest country allocations. We increased our allocations to India and Russia, where valuations fell to attractive levels. We reduced our exposure to China.
- We believe that recent underperformance of emerging markets stocks relative to developed markets affords investors a good opportunity to build exposure to the asset class, despite lingering short-term risks. There are many excellent growth opportunities, but careful stock selection is necessary to sort out long-term winners and losers.
The views and opinions in this report were current as of October 31, 2013. They are not guarantees of performance or investment results and should not be taken as investment advice. Investment decisions reflect a variety of factors, and the managers reserve the right to change their views about individual stocks, sectors, and the markets at any time. As a result, the views expressed should not be relied upon as a forecast of the fund’s future investment intent. The report is certified under the Sarbanes-Oxley Act, which requires mutual funds and other public companies to affirm that, to the best of their knowledge, the information in their financial reports is fairly and accurately stated in all material respects.
Manager’s Letter
T. Rowe Price Institutional Emerging Markets Equity Fund
Dear Investor
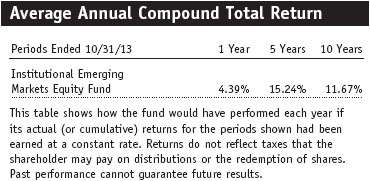
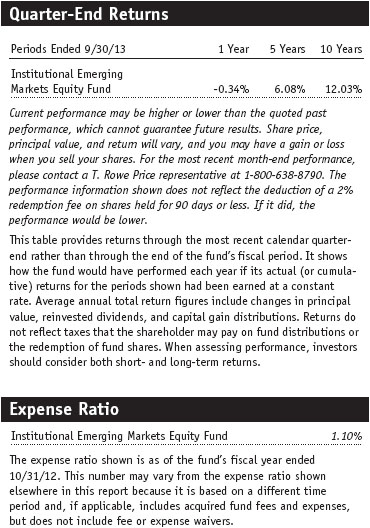
Emerging markets stocks rose modestly over our fiscal year as accommodative monetary policies implemented by central banks in the first half drew investors into emerging markets and other higher-risk assets. Over the summer, however, emerging markets stocks fell after the Federal Reserve said it might begin winding down the economic stimulus measures it has provided in recent years, which caused currencies to drop and exposed economic weaknesses across the developing world. By the fall, emerging markets assets partially rebounded after the Fed decided to maintain the pace of its stimulus for the time being. Against this volatile backdrop, the Institutional Emerging Markets Equity Fund returned -0.26% over the past six months and 4.39% for the year ended October 31, 2013. The fund trailed its benchmark and Lipper peer group average over both periods chiefly due to stock selection in Latin America, the hardest-hit emerging region in the summer sell-off, and poor performance in some companies and sectors exposed to weaker domestic demand.
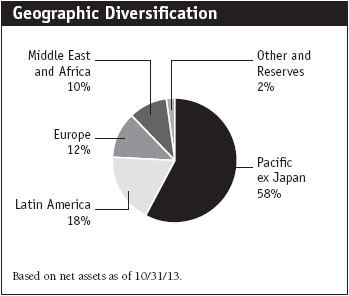
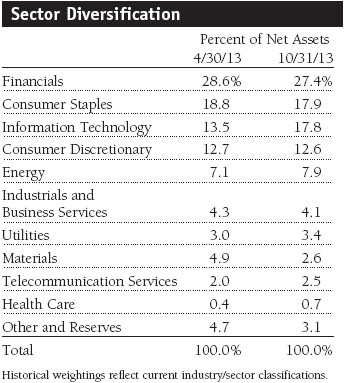
The fund is widely diversified in its country and sector allocations. At the end of October, the fund was underweight in emerging Asia and in Latin America and in line with the benchmark in emerging Europe, Middle East, and Africa (EMEA). The fund also holds a few non-benchmark companies based in developed Europe that generate a significant portion of their profits in emerging markets. In the dominant BRIC economies of Brazil, Russia, India, and China, we marginally increased our allocations to the first three but reduced our exposure to China. Our sector allocations continue to reflect our bias for areas driven by domestic consumption, which should see solid long-term growth as the middle class expands and incomes rise across the developing world. Consumer staples and discretionary stocks accounted for our top overweight sectors at fiscal year-end. We remain underweight in materials, telecommunication services, and energy due to the lack of good growth opportunities and our continued concerns about commodity prices.
Market Environment
Emerging markets endured a difficult environment in our fiscal year’s second half as investors anticipated a sudden end to the Fed’s years-long stimulus program. Expectations of this policy shift arose in May when Fed Chairman Ben Bernanke said the central bank could start curtailing its monthly $85 billion asset purchase program later this year if the U.S. economy was strong enough. Bernanke’s comments caused stocks, bonds, and currencies across the developing world to drop throughout the summer as investors sold out of emerging markets in favor of the U.S., where long-term yields jumped after his remarks. The currency weakness highlighted longstanding problems in many emerging markets, such as high inflation and large financial imbalances. The sell-off also coincided with cyclical slowdowns already underway across Asia and Latin America due to fading demand from China. Emerging markets stocks partially rebounded in the fall after the Fed unexpectedly announced in September that it would maintain the current pace of its monetary stimulus. However, the damage inflicted by the summer sell-off eroded the positive returns from the first half of our reporting period.
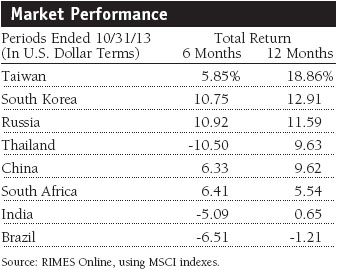
Returns varied widely across the emerging markets universe. Emerging Asia fared best, led by the relatively mature markets of Taiwan and South Korea, both of which posted double-digit gains as healthy external demand benefited their export-driven economies. Stocks in China rose as its economy stabilized after a surprisingly weak first half, but activity is expected to slow in the coming years as its government tries to steer the economy toward more balanced and sustainable growth after three decades of double-digit expansion. India edged up slightly for the year despite falling 5% in the second half. Fears about a looming economic crisis in India reached a fever pitch over the summer as its currency and stock market plunged, but recent measures under a new central bank chief have restored some confidence in the country’s outlook.
The EMEA region performed well as investors’ risk appetite rebounded in the final two months of our reporting period, but countries there continued to struggle with weakening growth and other domestic problems. Turkey, for example, suffered from antigovernment protests in June and a currency that sank to record lows this past summer. South Africa is still trying to contain widespread labor unrest sparked by last year’s Lonmin strike.
Latin America was the emerging universe’s worst-performing region over the past year. Slowing growth in China—the largest importer of Latin American commodities—weighed heavily on the region’s commodity-driven economies. Brazil was among the biggest targets of the summer’s emerging markets sell-off, which pushed its currency to multiyear lows. Its stock market dropped as the country continued to wrestle with high inflation, slowing growth, and investors’ concerns about the flagging pace of its modernization efforts. Mexican stocks advanced, but growth there also hit a rough patch as the economy unexpectedly contracted in this year’s second quarter.
Asia
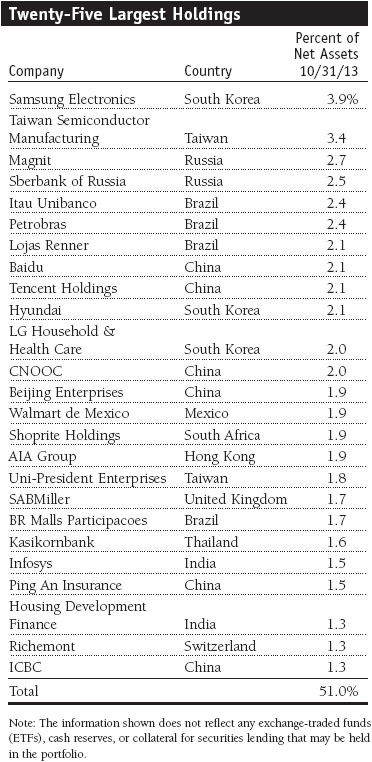
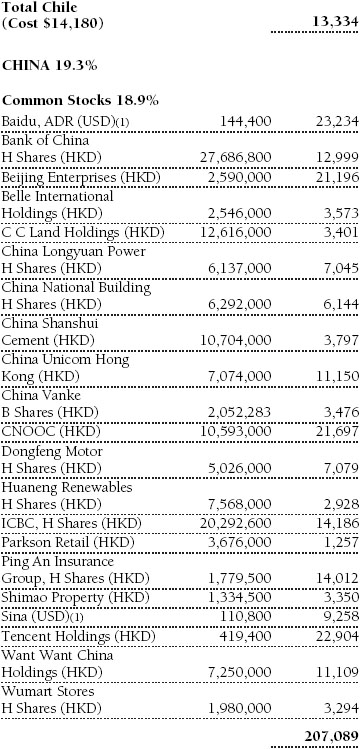
China helped your fund’s returns, thanks to good stock selection led by Internet companies Tencent Holdings, which is moving beyond instant messaging into online search and e-commerce, and Baidu, which enjoys a virtual monopoly in China’s fast-growing search market. The Philippines lifted relative performance owing to stock selection led by packaged food maker Universal Robina. Unfortunately, our positioning in other Asian countries proved less helpful. In South Korea, our holdings in personal care products company LG Household & Health Care and cosmetics maker Amorepacific lagged. These consumer staples companies have suffered from flagging consumer confidence and weak consumption trends for the past year. But they remain high-quality, defensive businesses with attractive valuations and exposure to fast-growing overseas markets, and we believe they will soon return to stronger growth. Our relatively large exposure to India, whose economy and currency deteriorated over the fiscal year, also weighed on performance. (Please refer to the portfolio of investments for a complete list of holdings and the amount each represents in the portfolio.)
Our allocation to China declined over the period. We continue to believe that China will achieve a soft landing as it shifts to an economy driven by consumption and winds down the government spending that has fueled activity in recent years. After our reporting period closed, China convened a meeting of top leaders to outline the government’s economic priorities for the next decade. Details from the November meeting, known as the Third Plenum, suggest that the leadership’s appetite for economic and social reform has exceeded most analysts’ expectations. While we are encouraged by their reform conviction, overhauling China’s state-dominated economy will be difficult to carry out in the short term. Even if China’s government manages to push through tough reforms, we don’t believe that doing so would translate into an immediate catalyst for stocks, though reforms could benefit the economy and some companies over the longer term. Our holdings are focused on consumption-driven businesses such as Baidu and Tencent. We also favor names in the renewable energy space such as wind power company China Longyuan Power, which should benefit as cleaning up pollution takes on greater urgency.
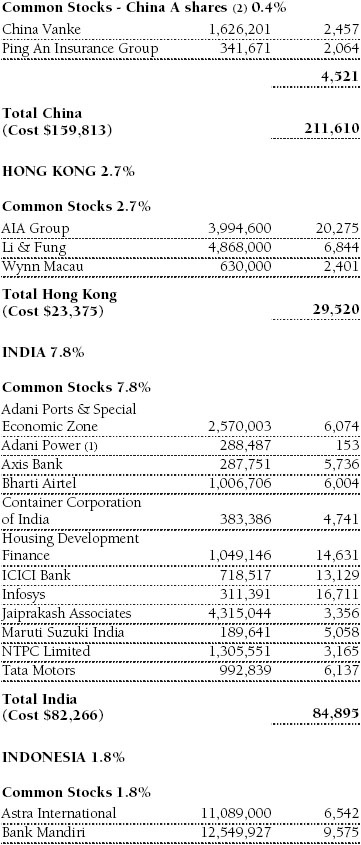
Our exposure to India increased over the year. India was hit hard as investors sold off emerging markets with large current account deficits and the rupee sank to record lows. Despite dire headlines about India’s outlook, we believe the country offers investors huge long-term potential. India is home to many industry-leading companies with superior growth prospects, excellent management, and strong entrepreneurial talent. At the macro level, India has a huge young population and other favorable demographics that should drive consumption and support economic growth for many years. We took advantage of market weakness to add to our Indian holdings and maintained core positions in high-quality names such as software maker Infosys and mortgage provider Housing Development Finance, which should benefit from rising consumption and urbanization of India’s rapidly growing middle class.
Latin America
Latin America weighed heavily on returns over our fiscal year. Significant detractors included Mexican mining company Fresnillo, Brazilian department store Lojas Renner, and Chilean fertilizer and chemicals producer Sociedad Quimica y Minera de Chile (SQM). These companies performed strongly in prior years but have encountered both domestic and external headwinds more recently. For example, Fresnillo, a top silver and gold producer, suffered as fading commodities demand pressured metals prices. Lojas Renner and other consumer discretionary names in Brazil disappointed as high inflation, made worse by currency weakness, eroded Brazilians’ purchasing power and antigovernment street protests in June sapped consumer confidence. SQM shares sank to a five-year low as prices for potash, a fertilizer ingredient, tumbled after the rupture in July of an industry cartel that had propped up global prices.
We are disappointed in the performance of these names but sought to take advantage of weakness to add to positions in companies in which we have a high level of conviction. We increased our holdings in Lojas Renner and Brazilian mall operator BR Malls Participacoes, both of which remain among our largest Brazilian holdings. Lojas Renner, a leading clothing retailer, is well positioned for strong growth in Brazil’s fragmented and underpenetrated retail sector and has an experienced management team and excellent corporate governance. As for Fresnillo, we maintained a small position for its excellent assets, attractive growth prospects, strong balance sheet, and good management. However, we sold other commodity producers due to our belief that the global commodities boom sustained by China over the past decade is over. We eliminated Brazilian miner Vale, the world’s top iron ore producer, and Chilean copper mining group Antofagasta.
Our exposure to Brazil increased slightly over the period. Brazil is suffering from mild stagflation, a troubling economic development marked by slow growth and rising prices. Even so, we believe that the valuations of our holdings already reflect the country’s immediate economic challenges. Brazil remains a good place to invest due to its strong corporate governance and the sheer size of its stock market, which is much larger and more liquid than any other market in Latin America. Moreover, the country’s massive middle class and other demographic factors bode well for consumption-driven areas of the economy over the long run. Our allocation to Mexico declined following our sale of wireless leader America Movil. We eliminated our position due to impending regulatory changes that would harm the company’s profitability in Mexico, where it has long enjoyed a virtual monopoly.
Europe, Middle East, and Africa
The EMEA region lifted returns thanks to favorable stock selection in Russia, where we focused on consumer-driven names like food retailer Magnit and avoided state-controlled energy and utility companies that fared poorly over the period. Russia’s economy weakened over our fiscal year, and its government cut its 2013 growth forecast twice this year to 1.8% from a previous 2.4% estimate. Most analysts believe that Russia needs to overhaul its economy, clean up corruption, and reduce the state’s role in business before it can return to strong growth. But with President Vladimir Putin maintaining power and entrenched interests in state-owned businesses resisting change, we don’t see significant reforms happening anytime soon. In the meantime, we have taken advantage of market weakness and added to positions in Magnit and Sberbank of Russia, the country’s largest retail bank, where nearly half of Russian consumers deposit their money. Sberbank is majority owned by the government but is a rare example of a state-controlled company managed by a team of professionals who are devoted to shareholder returns. We have a high level of conviction in both Magnit and Sberbank, and both ranked among our biggest positions at fiscal year-end.
Qatar and the United Arab Emirates (UAE) helped performance due to the strong performance of both markets, which are not held in the benchmark. Stocks in Qatar and UAE soared 20% and 65%, respectively, over our fiscal year as both countries benefited from strong economic growth and MSCI’s decision in June to upgrade them to emerging markets status effective May 2014. Our holdings in Qatar National Bank and Dubai-based port operator DP World benefited returns.
South Africa detracted from fund returns due to unfavorable stock picking, particularly our position in food retailer Shoprite Holdings, which suffered as the weak economy hurt low- to middle-income consumers. South Africa has been wrestling with high inflation and unemployment and labor strife that has spread from mining to manufacturing and other industries. In October, the International Monetary Fund warned that the country faces continued sluggish growth and elevated account deficits, adding that risks “are tilted firmly to the downside.” We have long maintained an underweight allocation to South Africa because of its chronic economic problems but took advantage of weakness to top up our position in Shoprite, a high-quality company with good exposure to Africa’s fast-growing food retail industry. In general, we have limited our holdings to a few consumer-driven companies that offer exposure to South Africa’s growing middle class or rapidly growing markets in sub-Saharan Africa.
Outlook
Growth in emerging markets has significantly weakened over the past year due to a combination of domestic cyclical slowdowns and external forces arising from an expected shift in U.S. monetary policy. Most emerging markets are still growing faster than developed ones, but the rapid deceleration in some countries has left many investors wondering if double-digit expansion rates will ever return. India and China each posted nominal growth exceeding 10% in 2010, but it is unlikely that either will deliver similar rates in the foreseeable future.
Some analysts have recently speculated that consumer-driven growth in emerging markets is a thesis that has already played out in the investing world. On the contrary, we believe that we are in the early stages of a multiyear growth cycle driven by rising wealth in emerging countries. For example, from 2003 to 2009, the size of Latin America’s middle class soared by 50% to 152 million, roughly 30% of the continent’s population, according to the World Bank. Over the same period, the portion of people in poverty fell to 30% from 44%. These trends—an expanding middle class, declining poverty, rising consumption, and real wage growth—are the drivers of huge economic potential across the developing world. We don’t see these trends fading anytime soon.
Looking ahead, we believe that stock selection will take on more importance for emerging markets investors. In recent years, we have noted significant dispersion in the returns of emerging markets stocks even within the same country and industry. Over time, we expect this trend to continue in the asset class, particularly with the end of the global commodities boom and double-digit annual gross domestic product growth in China. Given the removal of these longtime tailwinds to global growth, we believe that investing in the right countries and in the right companies will be crucial for producing good returns over the long run. We have taken advantage of recent declines to buy high-quality companies at reasonable prices, and we remain focused on positioning your fund for good long-term performance.
Thank you for investing with T. Rowe Price.
Respectfully submitted,

Gonzalo Pángaro
Portfolio manager and chairman of the fund’s
Investment Advisory Committee
November 20, 2013
The committee chairman has day-to-day responsibility for managing the portfolio and executing the fund’s investment program.
| Risks of International Investing |
Funds that invest overseas generally carry more risk than funds that invest strictly in U.S. assets. Funds investing in a single country or in a limited geographic region tend to be riskier than more diversified funds. Risks can result from varying stages of economic and political development; differing regulatory environments, trading days, and accounting standards; and higher transaction costs of non-U.S. markets. Non-U.S. investments are also subject to currency risk, or a decline in the value of a foreign currency versus the U.S. dollar, which reduces the dollar value of securities denominated in that currency.
| Glossary |
Gross domestic product: The total market value of all goods and services produced in a country in a given year.
Lipper averages: The averages of available mutual fund performance returns for specified time periods in categories defined by Lipper Inc.
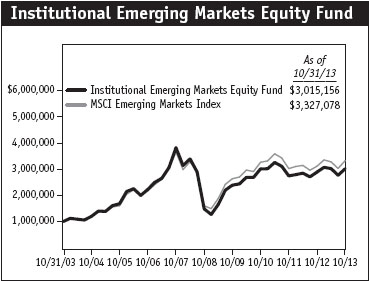
MSCI Emerging Markets Index: A capitalization-weighted index of stocks from 26 emerging market countries that only includes securities that may be traded by foreign investors.
Note: MSCI makes no express or implied warranties or representations and shall have no liability whatsoever with respect to any MSCI data contained herein. The MSCI data may not be further redistributed or used as a basis for other indices or any securities or financial products. This report is not approved, reviewed, or produced by MSCI.
Portfolio Highlights
Performance and Expenses
T. Rowe Price Institutional Emerging Markets Equity Fund
| Performance Comparison |
This chart shows the value of a hypothetical $1 million investment in the fund over the past 10 fiscal year periods or since inception (for funds lacking 10-year records). The result is compared with benchmarks, which may include a broad-based market index and a peer group average or index. Market indexes do not include expenses, which are deducted from fund returns as well as mutual fund averages and indexes.
Fund Expense Example
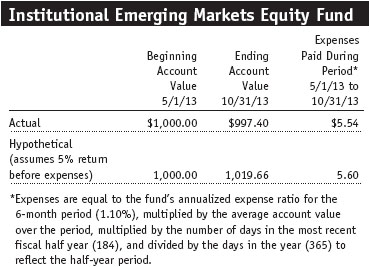
As a mutual fund shareholder, you may incur two types of costs: (1) transaction costs, such as redemption fees or sales loads, and (2) ongoing costs, including management fees, distribution and service (12b-1) fees, and other fund expenses. The following example is intended to help you understand your ongoing costs (in dollars) of investing in the fund and to compare these costs with the ongoing costs of investing in other mutual funds. The example is based on an investment of $1,000 invested at the beginning of the most recent six-month period and held for the entire period.
Actual Expenses
The first line of the following table (Actual) provides information about actual account values and actual expenses. You may use the information on this line, together with your account balance, to estimate the expenses that you paid over the period. Simply divide your account value by $1,000 (for example, an $8,600 account value divided by $1,000 = 8.6), then multiply the result by the number on the first line under the heading “Expenses Paid During Period” to estimate the expenses you paid on your account during this period.
Hypothetical Example for Comparison Purposes
The information on the second line of the table (Hypothetical) is based on hypothetical account values and expenses derived from the fund’s actual expense ratio and an assumed 5% per year rate of return before expenses (not the fund’s actual return). You may compare the ongoing costs of investing in the fund with other funds by contrasting this 5% hypothetical example and the 5% hypothetical examples that appear in the shareholder reports of the other funds. The hypothetical account values and expenses may not be used to estimate the actual ending account balance or expenses you paid for the period.
You should also be aware that the expenses shown in the table highlight only your ongoing costs and do not reflect any transaction costs, such as redemption fees or sales loads. Therefore, the second line of the table is useful in comparing ongoing costs only and will not help you determine the relative total costs of owning different funds. To the extent a fund charges transaction costs, however, the total cost of owning that fund is higher.
Financial Highlights
T. Rowe Price Institutional Emerging Markets Equity Fund
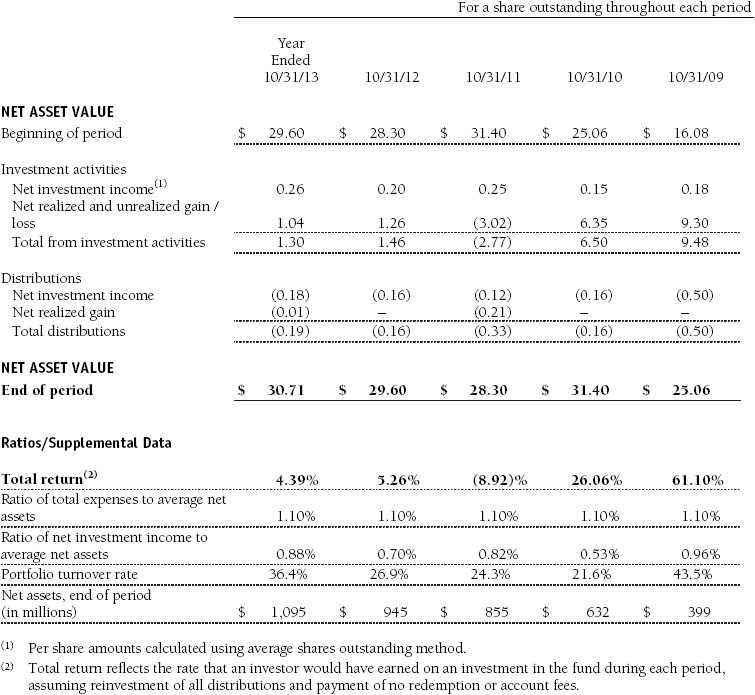
The accompanying notes are an integral part of these financial statements.
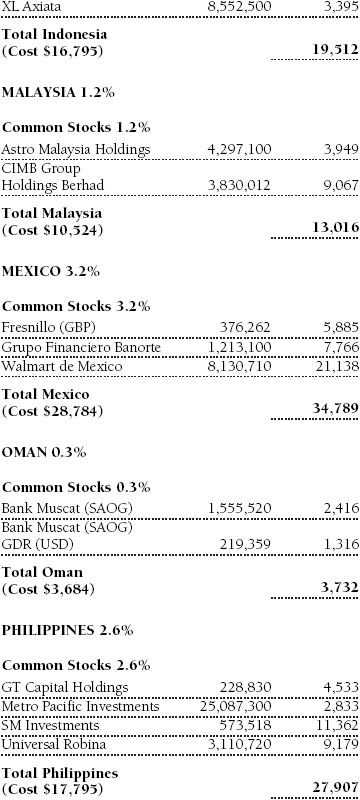
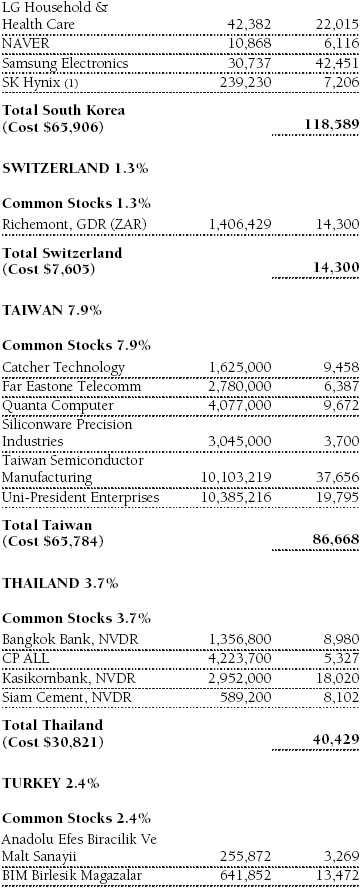
Portfolio of Investments‡
T. Rowe Price Institutional Emerging Markets Equity Fund
October 31, 2013


The accompanying notes are an integral part of these financial statements.
Statement of Assets and Liabilities
T. Rowe Price Institutional Emerging Markets Equity Fund
October 31, 2013
($000s, except shares and per share amounts)
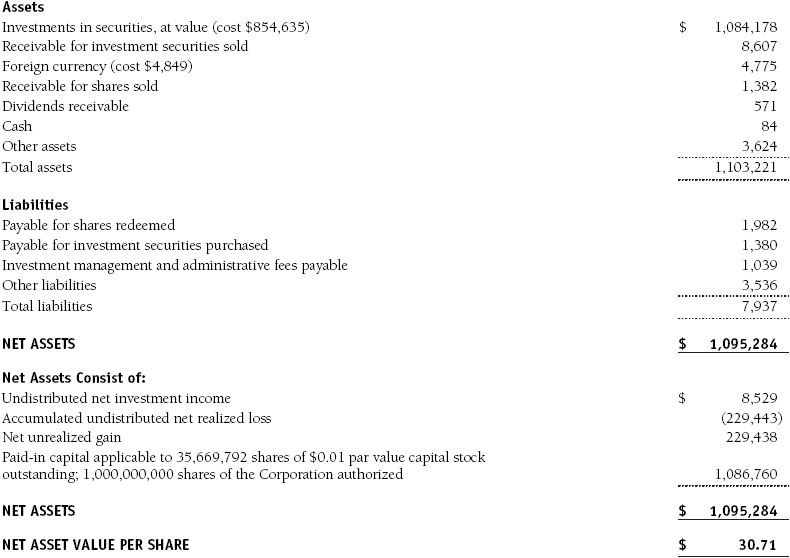
The accompanying notes are an integral part of these financial statements.
Statement of Operations
T. Rowe Price Institutional Emerging Markets Equity Fund
($000s)
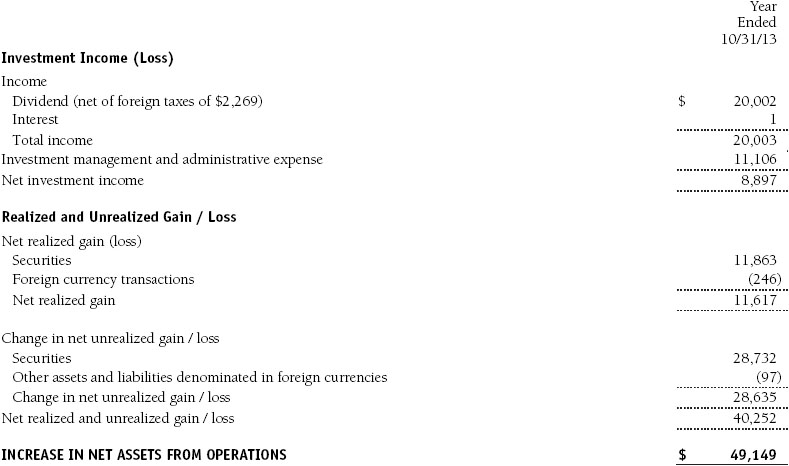
The accompanying notes are an integral part of these financial statements.
Statement of Changes in Net Assets
T. Rowe Price Institutional Emerging Markets Equity Fund
($000s)
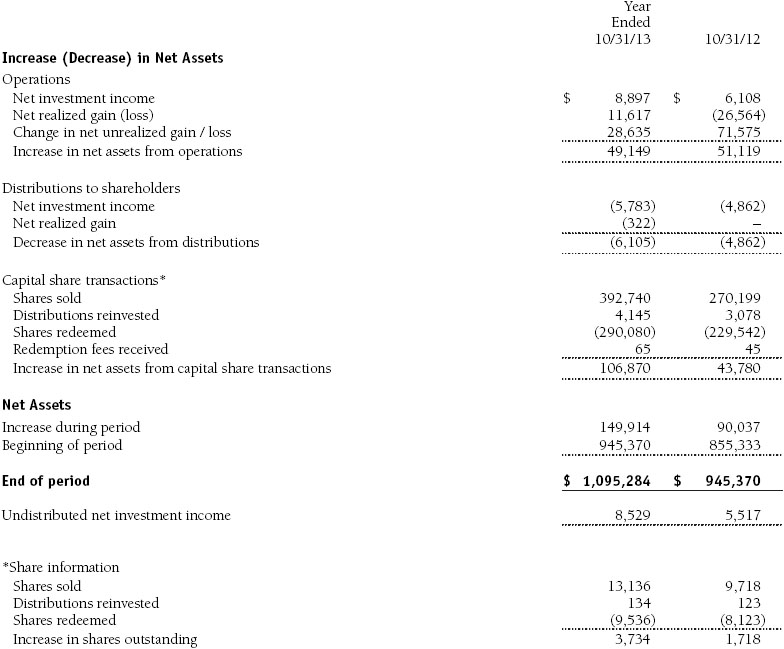
The accompanying notes are an integral part of these financial statements.
Notes to Financial Statements
T. Rowe Price Institutional Emerging Markets Equity Fund
October 31, 2013
T. Rowe Price Institutional International Funds, Inc. (the corporation), is registered under the Investment Company Act of 1940 (the 1940 Act). The Institutional Emerging Markets Equity Fund (the fund) is a diversified, open-end management investment company established by the corporation. The fund commenced operations on October 31, 2002. The fund seeks long-term growth of capital through investments primarily in the common stocks of companies located (or with primary operations) in emerging markets.
NOTE 1 - SIGNIFICANT ACCOUNTING POLICIES
Basis of Preparation The accompanying financial statements were prepared in accordance with accounting principles generally accepted in the United States of America (GAAP), which require the use of estimates made by management. Management believes that estimates and valuations are appropriate; however, actual results may differ from those estimates, and the valuations reflected in the accompanying financial statements may differ from the value ultimately realized upon sale or maturity.
Investment Transactions, Investment Income, and Distributions Income and expenses are recorded on the accrual basis. Dividends received from mutual fund investments are reflected as dividend income; capital gain distributions are reflected as realized gain/loss. Dividend income and capital gain distributions are recorded on the ex-dividend date. Income tax-related interest and penalties, if incurred, would be recorded as income tax expense. Investment transactions are accounted for on the trade date. Realized gains and losses are reported on the identified cost basis. Distributions to shareholders are recorded on the ex-dividend date. Income distributions are declared and paid annually. Capital gain distributions, if any, are generally declared and paid by the fund annually.
Currency Translation Assets, including investments, and liabilities denominated in foreign currencies are translated into U.S. dollar values each day at the prevailing exchange rate, using the mean of the bid and asked prices of such currencies against U.S. dollars as quoted by a major bank. Purchases and sales of securities, income, and expenses are translated into U.S. dollars at the prevailing exchange rate on the date of the transaction. The effect of changes in foreign currency exchange rates on realized and unrealized security gains and losses is reflected as a component of security gains and losses.
Credits Credits are earned on the fund’s temporarily uninvested cash balances held at the custodian, and such credits reduce the amount paid by the manager for custody of the fund’s assets. In order to pass the benefit of custody credits to the fund, the manager has voluntarily reduced its investment management and administrative expense in the accompanying financial statements.
Redemption Fees A 2% fee is assessed on redemptions of fund shares held for 90 days or less to deter short-term trading and to protect the interests of long-term shareholders. Redemption fees are withheld from proceeds that shareholders receive from the sale or exchange of fund shares. The fees are paid to the fund and are recorded as an increase to paid-in capital. The fees may cause the redemption price per share to differ from the net asset value per share.
In-Kind Redemptions In accordance with guidelines described in the fund’s prospectus, the fund may distribute portfolio securities rather than cash as payment for a redemption of fund shares (in-kind redemption). For financial reporting purposes, the fund recognizes a gain on in-kind redemptions to the extent the value of the distributed securities on the date of redemption exceeds the cost of those securities. Gains and losses realized on in-kind redemptions are not recognized for tax purposes and are reclassified from undistributed realized gain (loss) to paid-in capital. During the year ended October 31, 2013, the fund realized $36,744,000 of net gain on $63,684,000 of in-kind redemptions.
New Accounting Guidance On May 1, 2013, the fund adopted new accounting guidance, issued by the Financial Accounting Standards Board, that requires an entity to disclose information about offsetting and related arrangements to enable users of its financial statements to understand the effect of those arrangements on its financial position. Adoption had no effect on the fund’s net assets or results of operations.
NOTE 2 - VALUATION
The fund’s financial instruments are valued, and its net asset value (NAV) per share is computed at the close of the New York Stock Exchange (NYSE), normally 4 p.m. ET, each day the NYSE is open for business.
Fair Value The fund’s financial instruments are reported at fair value, which GAAP defines as the price that would be received to sell an asset or paid to transfer a liability in an orderly transaction between market participants at the measurement date. The T. Rowe Price Valuation Committee (the Valuation Committee) has been established by the fund’s Board of Directors (the Board) to ensure that financial instruments are appropriately priced at fair value in accordance with GAAP and the 1940 Act. Subject to oversight by the Board, the Valuation Committee develops and oversees pricing-related policies and procedures and approves all fair value determinations. Specifically, the Valuation Committee establishes procedures to value securities; determines pricing techniques, sources, and persons eligible to effect fair value pricing actions; oversees the selection, services, and performance of pricing vendors; oversees valuation-related business continuity practices; and provides guidance on internal controls and valuation-related matters. The Valuation Committee reports to the fund’s Board; is chaired by the fund’s treasurer; and has representation from legal, portfolio management and trading, operations, and risk management.
Various valuation techniques and inputs are used to determine the fair value of financial instruments. GAAP establishes the following fair value hierarchy that categorizes the inputs used to measure fair value:
Level 1 – quoted prices (unadjusted) in active markets for identical financial instruments that the fund can access at the reporting date
Level 2 – inputs other than Level 1 quoted prices that are observable, either directly or indirectly (including, but not limited to, quoted prices for similar financial instruments in active markets, quoted prices for identical or similar financial instruments in inactive markets, interest rates and yield curves, implied volatilities, and credit spreads)
Level 3 – unobservable inputs
Observable inputs are developed using market data, such as publicly available information about actual events or transactions, and reflect the assumptions that market participants would use to price the financial instrument. Unobservable inputs are those for which market data are not available and are developed using the best information available about the assumptions that market participants would use to price the financial instrument. GAAP requires valuation techniques to maximize the use of relevant observable inputs and minimize the use of unobservable inputs. When multiple inputs are used to derive fair value, the financial instrument is assigned to the level within the fair value hierarchy based on the lowest-level input that is significant to the fair value of the financial instrument. Input levels are not necessarily an indication of the risk or liquidity associated with financial instruments at that level but rather the degree of judgment used in determining those values.
Valuation Techniques Equity securities listed or regularly traded on a securities exchange or in the over-the-counter (OTC) market are valued at the last quoted sale price or, for certain markets, the official closing price at the time the valuations are made. OTC Bulletin Board securities are valued at the mean of the closing bid and asked prices. A security that is listed or traded on more than one exchange is valued at the quotation on the exchange determined to be the primary market for such security. Listed securities not traded on a particular day are valued at the mean of the closing bid and asked prices for domestic securities and the last quoted sale or closing price for international securities.
For valuation purposes, the last quoted prices of non-U.S. equity securities may be adjusted to reflect the fair value of such securities at the close of the NYSE. If the fund determines that developments between the close of a foreign market and the close of the NYSE will, in its judgment, materially affect the value of some or all of its portfolio securities, the fund will adjust the previous quoted prices to reflect what it believes to be the fair value of the securities as of the close of the NYSE. In deciding whether it is necessary to adjust quoted prices to reflect fair value, the fund reviews a variety of factors, including developments in foreign markets, the performance of U.S. securities markets, and the performance of instruments trading in U.S. markets that represent foreign securities and baskets of foreign securities. The fund may also fair value securities in other situations, such as when a particular foreign market is closed but the fund is open. The fund uses outside pricing services to provide it with quoted prices and information to evaluate or adjust those prices. The fund cannot predict how often it will use quoted prices and how often it will determine it necessary to adjust those prices to reflect fair value. As a means of evaluating its security valuation process, the fund routinely compares quoted prices, the next day’s opening prices in the same markets, and adjusted prices.
Actively traded domestic equity securities generally are categorized in Level 1 of the fair value hierarchy. Non-U.S. equity securities generally are categorized in Level 2 of the fair value hierarchy despite the availability of quoted prices because, as described above, the fund evaluates and determines whether those quoted prices reflect fair value at the close of the NYSE or require adjustment. OTC Bulletin Board securities, certain preferred securities, and equity securities traded in inactive markets generally are categorized in Level 2 of the fair value hierarchy.
Investments in mutual funds are valued at the mutual fund’s closing NAV per share on the day of valuation and are categorized in Level 1 of the fair value hierarchy. Assets and liabilities other than financial instruments, including short-term receivables and payables, are carried at cost, or estimated realizable value, if less, which approximates fair value.
Thinly traded financial instruments and those for which the above valuation procedures are inappropriate or are deemed not to reflect fair value are stated at fair value as determined in good faith by the Valuation Committee. The objective of any fair value pricing determination is to arrive at a price that could reasonably be expected from a current sale. Financial instruments fair valued by the Valuation Committee are primarily private placements, restricted securities, warrants, rights, and other securities that are not publicly traded.
Subject to oversight by the Board, the Valuation Committee regularly makes good faith judgments to establish and adjust the fair valuations of certain securities as events occur and circumstances warrant. For instance, in determining the fair value of an equity investment with limited market activity, such as a private placement or a thinly traded public company stock, the Valuation Committee considers a variety of factors, which may include, but are not limited to, the issuer’s business prospects, its financial standing and performance, recent investment transactions in the issuer, new rounds of financing, negotiated transactions of significant size between other investors in the company, relevant market valuations of peer companies, strategic events affecting the company, market liquidity for the issuer, and general economic conditions and events. In consultation with the investment and pricing teams, the Valuation Committee will determine an appropriate valuation technique based on available information, which may include both observable and unobservable inputs. The Valuation Committee typically will afford greatest weight to actual prices in arm’s length transactions, to the extent they represent orderly transactions between market participants; transaction information can be reliably obtained; and prices are deemed representative of fair value. However, the Valuation Committee may also consider other valuation methods such as market-based valuation multiples; a discount or premium from market value of a similar, freely traded security of the same issuer; or some combination. Fair value determinations are reviewed on a regular basis and updated as information becomes available, including actual purchase and sale transactions of the issue. Because any fair value determination involves a significant amount of judgment, there is a degree of subjectivity inherent in such pricing decisions and fair value prices determined by the Valuation Committee could differ from those of other market participants. Depending on the relative significance of unobservable inputs, including the valuation technique(s) used, fair valued securities may be categorized in Level 2 or 3 of the fair value hierarchy.
Valuation Inputs The following table summarizes the fund’s financial instruments, based on the inputs used to determine their fair values on October 31, 2013:
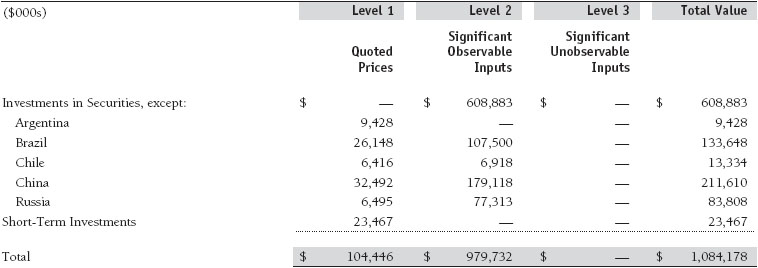
There were no material transfers between Levels 1 and 2 during the year.
NOTE 3 - OTHER INVESTMENT TRANSACTIONS
Consistent with its investment objective, the fund engages in the following practices to manage exposure to certain risks and/or to enhance performance. The investment objective, policies, program, and risk factors of the fund are described more fully in the fund’s prospectus and Statement of Additional Information.
Emerging Markets At October 31, 2013, approximately 94% of the fund’s net assets were invested, either directly or through investments in T. Rowe Price institutional funds, in securities of companies located in emerging markets, securities issued by governments of emerging market countries, or securities denominated in or linked to the currencies of emerging market countries. Emerging market securities are often subject to greater price volatility, less liquidity, and higher rates of inflation than U.S. securities. In addition, emerging markets may be subject to greater political, economic, and social uncertainty, and differing regulatory environments that may potentially impact the fund’s ability to buy or sell certain securities or repatriate proceeds to U.S. dollars.
China A shares The fund invests in certain Chinese equity securities (A shares) available only to local Chinese investors and Qualified Foreign Institutional Investors (QFII). The fund gains access to the A-share market through T. Rowe Price Associates, Inc., which serves as the registered QFII for all participating T. Rowe Price-sponsored products (each a participating account). Investment decisions related to A shares are specific to each participating account, and each account bears the resultant economic and tax consequences of its holdings and transactions in A shares. The fund is subject to certain restrictions and administrative processes relating to its ability to repatriate cash balances, investment proceeds, and earnings associated with its A shares and may incur substantial delays in gaining access to its assets or a loss of value in the event of noncompliance with applicable Chinese rules or requirements. Current Chinese tax law is unclear whether capital gains realized on the fund’s investments in A shares will be subject to tax. Because management believes it more likely than not that Chinese capital gains tax ultimately will not be imposed, there are no accrued taxes reflected in the accompanying financial statements.
Other Purchases and sales of portfolio securities other than short-term securities aggregated $457,231,000 and $354,113,000, respectively, for the year ended October 31, 2013.
NOTE 4 - FEDERAL INCOME TAXES
No provision for federal income taxes is required since the fund intends to continue to qualify as a regulated investment company under Subchapter M of the Internal Revenue Code and distribute to shareholders all of its taxable income and gains. Distributions determined in accordance with federal income tax regulations may differ in amount or character from net investment income and realized gains for financial reporting purposes. Financial reporting records are adjusted for permanent book/tax differences to reflect tax character but are not adjusted for temporary differences.
The fund files U.S. federal, state, and local tax returns as required. The fund’s tax returns are subject to examination by the relevant tax authorities until expiration of the applicable statute of limitations, which is generally three years after the filing of the tax return but which can be extended to six years in certain circumstances. Tax returns for open years have incorporated no uncertain tax positions that require a provision for income taxes.
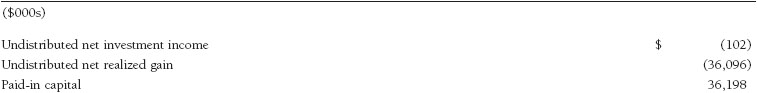
Reclassifications to paid-in capital relate primarily to redemptions in kind. Reclassifications between income and gain relate primarily to the character of net currency losses. For the year ended October 31, 2013, the following reclassifications were recorded to reflect tax character (there was no impact on results of operations or net assets):
Distributions during the years ended October 31, 2013 and October 31, 2012, totaled $6,105,000 and $4,862,000, respectively, and were characterized as ordinary income for tax purposes. At October 31, 2013, the tax-basis cost of investments and components of net assets were as follows:
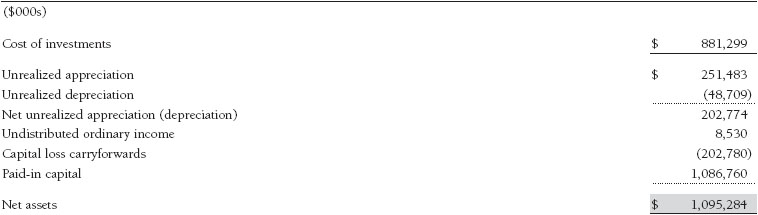
The difference between book-basis and tax-basis net unrealized appreciation (depreciation) is attributable to the deferral of losses from wash sales and the realization of gains/losses on passive foreign investment companies for tax purposes. The fund intends to retain realized gains to the extent of available capital loss carryforwards. Because the fund is required to use capital loss carryforwards that do not expire before those with expiration dates, all or a portion of its capital loss carryforwards subject to expiration could ultimately go unused. The fund’s available capital loss carryforwards as of October 31, 2013, expire as follows: $20,924,000 in fiscal 2016, $124,951,000 in fiscal 2017, $2,830,000 in fiscal 2018, and $1,881,000 in fiscal 2019; $52,194,000 have no expiration.
NOTE 5 - FOREIGN TAXES
The fund is subject to foreign income taxes imposed by certain countries in which it invests. Additionally, certain foreign currency transactions are subject to tax and capital gains realized upon disposition of securities issued in or by certain foreign countries and are subject to capital gains tax imposed by those countries. All taxes are computed in accordance with the applicable foreign tax law, and, to the extent permitted, capital losses are used to offset capital gains. Taxes attributable to income are accrued by the fund as a reduction of income. Taxes incurred on the purchase of foreign currencies are recorded as realized loss on foreign currency transactions. Current and deferred tax expense attributable to capital gains is reflected as a component of realized or change in unrealized gain/loss on securities in the accompanying financial statements. At October 31, 2013, the fund had no deferred tax liability attributable to foreign securities and $3,740,000 of foreign capital loss carryforwards, including $2,729,000 that expire in 2017, $854,000 that expire in 2020, and $157,000 that expire in 2022.
NOTE 6 - RELATED PARTY TRANSACTIONS
The fund is managed by T. Rowe Price Associates, Inc. (Price Associates), a wholly owned subsidiary of T. Rowe Price Group, Inc. (Price Group). Price Associates has entered into a subadvisory agreement(s) with one or more of its wholly owned subsidiaries, to provide investment advisory services to the fund. The investment management and administrative agreement between the fund and Price Associates provides for an all-inclusive annual fee equal to 1.10% of the fund’s average daily net assets. The fee is computed daily and paid monthly. The all-inclusive fee covers investment management, shareholder servicing, transfer agency, accounting, and custody services provided to the fund, as well as fund directors’ fees and expenses. Interest, taxes, brokerage commissions, and extraordinary expenses are paid directly by the fund.
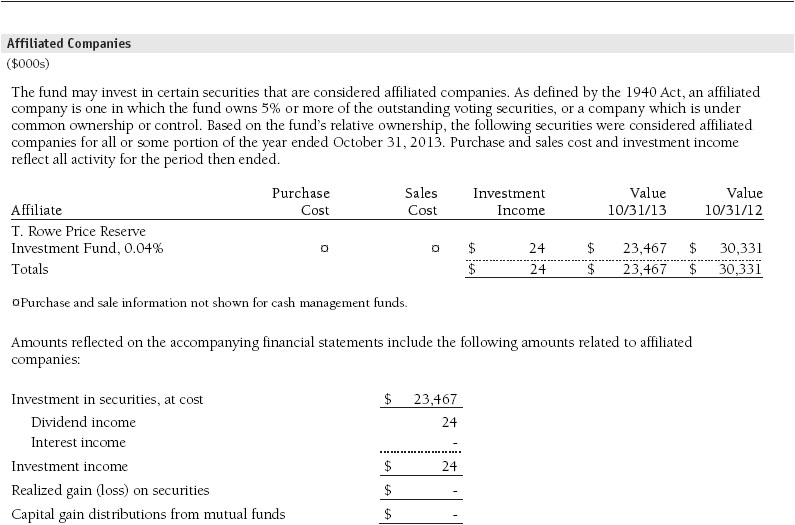
The fund may invest in the T. Rowe Price Reserve Investment Fund, the T. Rowe Price Government Reserve Investment Fund, or the T. Rowe Price Short-Term Reserve Fund (collectively, the Price Reserve Investment Funds), open-end management investment companies managed by Price Associates and considered affiliates of the fund. The Price Reserve Investment Funds are offered as short-term investment options to mutual funds, trusts, and other accounts managed by Price Associates or its affiliates and are not available for direct purchase by members of the public. The Price Reserve Investment Funds pay no investment management fees.
Mutual funds and other accounts managed by T. Rowe Price and its affiliates (collectively, T. Rowe Price funds) may invest in the fund; however, no T. Rowe Price fund may invest for the purpose of exercising management or control over the fund. At October 31, 2013, approximately 18% of the fund’s outstanding shares were held by T. Rowe Price funds.
As of October 31, 2013, T. Rowe Price Group, Inc., or its wholly owned subsidiaries owned 232,470 shares of the fund, representing less than 1% of the fund’s net assets.
Report of Independent Registered Public Accounting Firm
To the Board of Directors of T. Rowe Price Institutional International Funds, Inc. and
Shareholders of T. Rowe Price Institutional Emerging Markets Equity Fund
In our opinion, the accompanying statement of assets and liabilities, including the portfolio of investments, and the related statements of operations and of changes in net assets and the financial highlights present fairly, in all material respects, the financial position of T. Rowe Price Institutional Emerging Markets Equity Fund (one of the portfolios comprising T. Rowe Price Institutional International Funds, Inc., hereafter referred to as the “Fund”) at October 31, 2013, and the results of its operations, the changes in its net assets and the financial highlights for each of the periods indicated therein, in conformity with accounting principles generally accepted in the United States of America. These financial statements and financial highlights (hereafter referred to as “financial statements”) are the responsibility of the Fund’s management; our responsibility is to express an opinion on these financial statements based on our audits. We conducted our audits of these financial statements in accordance with the standards of the Public Company Accounting Oversight Board (United States). Those standards require that we plan and perform the audit to obtain reasonable assurance about whether the financial statements are free of material misstatement. An audit includes examining, on a test basis, evidence supporting the amounts and disclosures in the financial statements, assessing the accounting principles used and significant estimates made by management, and evaluating the overall financial statement presentation. We believe that our audits, which included confirmation of securities at October 31, 2013 by correspondence with the custodian and brokers, and confirmation of the underlying funds by correspondence with the transfer agent, provide a reasonable basis for our opinion.
PricewaterhouseCoopers LLP
Baltimore, Maryland
December 13, 2013
| Tax Information (Unaudited) for the Tax Year Ended 10/31/13 |
We are providing this information as required by the Internal Revenue Code. The amounts shown may differ from those elsewhere in this report because of differences between tax and financial reporting requirements.
The fund’s distributions to shareholders included $483,000 from short-term capital gains.
For taxable non-corporate shareholders, $10,895,000 of the fund’s income represents qualified dividend income subject to the 15% rate category.
For corporate shareholders, $27,000 of the fund’s income qualifies for the dividends-received deduction.
The fund will pass through foreign source income of $10,895,000 and foreign taxes paid of $2,261,000.
| Information on Proxy Voting Policies, Procedures, and Records |
A description of the policies and procedures used by T. Rowe Price funds and portfolios to determine how to vote proxies relating to portfolio securities is available in each fund’s Statement of Additional Information. You may request this document by calling 1-800-225-5132 or by accessing the SEC’s website, sec.gov.
The description of our proxy voting policies and procedures is also available on our website, troweprice.com. To access it, click on the words “Social Responsibility” at the top of our corporate homepage. Next, click on the words “Conducting Business Responsibly” on the left side of the page that appears. Finally, click on the words “Proxy Voting Policies” on the left side of the page that appears.
Each fund’s most recent annual proxy voting record is available on our website and through the SEC’s website. To access it through our website, follow the directions above to reach the “Conducting Business Responsibly” page. Click on the words “Proxy Voting Records” on the left side of that page, and then click on the “View Proxy Voting Records” link at the bottom of the page that appears.
| How to Obtain Quarterly Portfolio Holdings |
The fund files a complete schedule of portfolio holdings with the Securities and Exchange Commission for the first and third quarters of each fiscal year on Form N-Q. The fund’s Form N-Q is available electronically on the SEC’s website (sec.gov); hard copies may be reviewed and copied at the SEC’s Public Reference Room, 100 F St. N.E., Washington, DC 20549. For more information on the Public Reference Room, call 1-800-SEC-0330.
| About the Fund’s Directors and Officers |
Your fund is overseen by a Board of Directors (Board) that meets regularly to review a wide variety of matters affecting or potentially affecting the fund, including performance, investment programs, compliance matters, advisory fees and expenses, service providers, and business and regulatory affairs. The Board elects the fund’s officers, who are listed in the final table. At least 75% of the Board’s members are independent of T. Rowe Price Associates, Inc. (T. Rowe Price), and its affiliates; “inside” or “interested” directors are employees or officers of T. Rowe Price. The business address of each director and officer is 100 East Pratt Street, Baltimore, Maryland 21202. The Statement of Additional Information includes additional information about the fund directors and is available without charge by calling a T. Rowe Price representative at 1-800-638-5660.
Independent Directors
| Name (Year of Birth) Year Elected* [Number of T. Rowe Price Portfolios Overseen] | Principal Occupation(s) and Directorships of Public Companies and Other Investment Companies During the Past Five Years | |
| William R. Brody (1944) 2009 [157] | President and Trustee, Salk Institute for Biological Studies (2009 to present); Director, Novartis, Inc. (2009 to present); Director, IBM (2007 to present); President and Trustee, Johns Hopkins University (1996 to 2009); Chairman of Executive Committee and Trustee, Johns Hopkins Health System (1996 to 2009) | |
| Anthony W. Deering (1945) 1991 [157] | Chairman, Exeter Capital, LLC, a private investment firm (2004 to present); Director and Member of the Advisory Board, Deutsche Bank North America (2004 to present); Director, Under Armour (2008 to present); Director, Vornado Real Estate Investment Trust (2004 to 2012) | |
| Donald W. Dick, Jr. (1943) 1989 [157] | Principal, EuroCapital Partners, LLC, an acquisition and management advisory firm (1995 to present) | |
| Bruce W. Duncan (1951) 2013 [157] | President, Chief Executive Officer, and Director, First Industrial Realty Trust, owner and operator of industrial properties (2009 to present); Chairman of the Board (2005 to present), Interim Chief Executive Officer (2007), and Director (1999 to present), Starwood Hotels & Resorts, hotel and leisure company; Senior Advisor, Kohlberg, Kravis, Roberts & Co. LP, a global investment firm (2008 to 2009); Trustee, Starwood Lodging Trust, a real estate investment trust and former subsidiary of Starwood (1995 to 2006) | |
| Robert J. Gerrard, Jr. (1952) 2012 [157] | Advisory Board Member, Pipeline Crisis/Winning Strategies (1997 to present); Chairman of Compensation Committee and Director, Syniverse Holdings, Inc. (2008 to 2011); Executive Vice President and General Counsel, Scripps Networks, LLC (1997 to 2009) | |
| Karen N. Horn (1943) 2003 [157] | Limited Partner and Senior Managing Director, Brock Capital Group, an advisory and investment banking firm (2004 to present); Director, Eli Lilly and Company (1987 to present); Director, Simon Property Group (2004 to present); Director, Norfolk Southern (2008 to present); Director, Fannie Mae (2006 to 2008) | |
| Paul F. McBride (1956) 2013 [157] | Former Company Officer and Senior Vice President, Human Resources and Corporate Initiatives (2004 to 2010) | |
| Theo C. Rodgers (1941) 2005 [157] | Founder and President, A&R Development Corporation (1977 to present) and A&R Management, Inc. (1984 to present) | |
| Cecilia E. Rouse, Ph.D. (1963) 2012 [157] | Dean, Woodrow Wilson School (2012 to present); Professor and Researcher, Princeton University (1992 to present); Director, MDRC (2011 to present); Member, National Academy of Education (2010 to present); Research Associate, National Bureau of Economic Research’s Labor Studies Program (1998 to 2009 and 2011 to present); Member, President’s Council of Economic Advisors (2009 to 2011); Member, The MacArthur Foundation Network on the Transition to Adulthood and Public Policy (2000 to 2008); Member, National Advisory Committee for the Robert Wood Johnson Foundation’s Scholars in Health Policy Research Program (2008); Director and Member, National Economic Association (2006 to 2008); Member, Association of Public Policy Analysis and Management Policy Council (2006 to 2008); Member, Hamilton Project’s Advisory Board at The Brookings Institute (2006 to 2008); Chair of Committee on the Status of Minority Groups in the Economic Profession, American Economic Association (2006 to 2008 and 2012 to present) | |
| John G. Schreiber (1946) 2001 [157] | Owner/President, Centaur Capital Partners, Inc., a real estate investment company (1991 to present); Cofounder and Partner, Blackstone Real Estate Advisors, L.P. (1992 to present); Director, General Growth Properties, Inc. (2010 to present); Director, BXMT (formerly Capital Trust, Inc.), a real estate investment company (2012 to present); Director and Chairman of the Board, Brixmor Property Group, Inc. (2013 to present) | |
| Mark R. Tercek (1957) 2009 [157] | President and Chief Executive Officer, The Nature Conservancy (2008 to present); Managing Director, The Goldman Sachs Group, Inc. (1984 to 2008) | |
| *Each independent director serves until retirement, resignation, or election of a successor. | ||
Inside Directors | ||
| Name (Year of Birth) Year Elected* [Number of T. Rowe Price Portfolios Overseen] | Principal Occupation(s) and Directorships of Public Companies and Other Investment Companies During the Past Five Years | |
| Edward C. Bernard (1956) 2006 [157] | Director and Vice President, T. Rowe Price; Vice Chairman of the Board, Director, and Vice President, T. Rowe Price Group, Inc.; Chairman of the Board, Director, and President, T. Rowe Price Investment Services, Inc.; Chairman of the Board and Director, T. Rowe Price Retirement Plan Services, Inc., T. Rowe Price Savings Bank, and T. Rowe Price Services, Inc.; Chairman of the Board, Chief Executive Officer, and Director, T. Rowe Price International; Chairman of the Board, Chief Executive Officer, Director, and President, T. Rowe Price Trust Company; Chairman of the Board, all funds | |
| Brian C. Rogers, CFA, CIC (1955) 2006 [105] | Chief Investment Officer, Director, and Vice President, T. Rowe Price; Chairman of the Board, Chief Investment Officer, Director, and Vice President, T. Rowe Price Group, Inc.; Vice President, T. Rowe Price Trust Company | |
| *Each inside director serves until retirement, resignation, or election of a successor. | ||
Officers | ||
| Name (Year of Birth) | ||
| Position Held With Institutional International Funds | Principal Occupation(s) | |
| Ulle Adamson, CFA (1979) Vice President | Vice President, T. Rowe Price Group, Inc., and T. Rowe Price International | |
| Roy H. Adkins (1970) Vice President | Vice President, T. Rowe Price Group, Inc., and T. Rowe Price International | |
| Christopher D. Alderson (1962) President | Director and President–International Equity, T. Rowe Price International; Company’s Representative, Director, and Vice President, Price Hong Kong; Director and Vice President, Price Singapore; Vice President, T. Rowe Price Group, Inc. | |
| Paulina Amieva (1981) Vice President | Vice President, T. Rowe Price Group, Inc., and T. Rowe Price International | |
| Malik S. Asif (1981) Vice President | Employee, T. Rowe Price; formerly student, The University of Chicago Booth School of Business (to 2012); Investment Consultant–Middle East and North Africa Investment Team, International Finance Corporation–The World Bank Group (to 2010); Equity Research Associate, Keefe, Bruyette & Woods, Inc. (to 2009) | |
| Peter J. Bates, CFA (1974) Vice President | Vice President, T. Rowe Price and T. Rowe Price Group, Inc. | |
| Oliver D.M. Bell, IMC (1969) Executive Vice President | Vice President, T. Rowe Price Group, Inc., and T. Rowe Price International; formerly Head of Global Emerging Markets Research, Pictet Asset Management Ltd. (to 2011), and Portfolio Manager of Africa and Middle East portfolios and other emerging markets strategies, Pictet Asset Management Ltd. (to 2009) | |
| R. Scott Berg, CFA (1972) Executive Vice President | Vice President, T. Rowe Price and T. Rowe Price Group, Inc. | |
| Peter I. Botoucharov (1965) Vice President | Vice President, T. Rowe Price International; formerly Director–EMEA Macroeconomic Research and Strategy (to 2012); Independent Financial Advisor, Global Source (to 2010) | |
| Brian J. Brennan, CFA (1964) Vice President | Vice President, T. Rowe Price, T. Rowe Price Group, Inc., T. Rowe Price International, and T. Rowe Price Trust Company | |
| Carolyn Hoi Che Chu (1974) Vice President | Vice President, Price Hong Kong and T. Rowe Price Group, Inc.; formerly Director, Bank of America Merrill Lynch and Co-head of credit and convertibles research team in Hong Kong (to 2010) | |
| Archibald Ciganer Albeniz, CFA (1976) Vice President | Vice President, T. Rowe Price Group, Inc., and T. Rowe Price International | |
| Richard N. Clattenburg, CFA (1979) Executive Vice President | Vice President, Price Singapore, T. Rowe Price, T. Rowe Price Group, Inc., and T. Rowe Price International | |
| Michael J. Conelius, CFA (1964) Executive Vice President | Vice President, T. Rowe Price, T. Rowe Price Group, Inc., T. Rowe Price International, and T. Rowe Price Trust Company | |
| José Costa Buck (1972) Vice President | Vice President, T. Rowe Price Group, Inc., and T. Rowe Price International | |
| Richard de los Reyes (1975) Vice President | Vice President, T. Rowe Price and T. Rowe Price Group, Inc. | |
| Michael Della Vedova (1969) Vice President | Vice President, T. Rowe Price Group, Inc., and T. Rowe Price International; formerly Cofounder and Partner, Four Quarter Capital (to 2009) | |
| Shawn T. Driscoll (1975) Vice President | Vice President, T. Rowe Price and T. Rowe Price Group, Inc. | |
| Bridget A. Ebner (1970) Vice President | Vice President, T. Rowe Price and T. Rowe Price Group, Inc. | |
| Mark J.T. Edwards (1957) Executive Vice President | Vice President, T. Rowe Price Group, Inc., and T. Rowe Price International | |
| David J. Eiswert, CFA (1972) Executive Vice President | Vice President, T. Rowe Price, T. Rowe Price Group, Inc., and T. Rowe Price International | |
| Roger L. Fiery III, CPA (1959) Vice President | Vice President, Price Hong Kong, Price Singapore, T. Rowe Price, T. Rowe Price Group, Inc., T. Rowe Price International, and T. Rowe Price Trust Company | |
| Mark S. Finn, CFA, CPA (1963) Vice President | Vice President, T. Rowe Price, T. Rowe Price Group, Inc., and T. Rowe Price Trust Company | |
| John R. Gilner (1961) Chief Compliance Officer | Chief Compliance Officer and Vice President, T. Rowe Price; Vice President, T. Rowe Price Group, Inc., and T. Rowe Price Investment Services, Inc. | |
| Gregory S. Golczewski (1966) Vice President | Vice President, T. Rowe Price and T. Rowe Price Trust Company | |
| Paul D. Greene II (1978) Vice President | Vice President, T. Rowe Price and T. Rowe Price Group, Inc. | |
| M. Campbell Gunn (1956) Vice President | Vice President, T. Rowe Price Group, Inc., and T. Rowe Price International | |
| Gregory K. Hinkle, CPA (1958) Treasurer | Vice President, T. Rowe Price, T. Rowe Price Group, Inc., and T. Rowe Price Trust Company | |
| Stefan Hubrich, Ph.D., CFA (1974) Vice President | Vice President, T. Rowe Price and T. Rowe Price Group, Inc. | |
| Leigh Innes, CFA (1976) Vice President | Vice President, T. Rowe Price Group, Inc., and T. Rowe Price International | |
| Randal S. Jenneke (1971) Vice President | Vice President, T. Rowe Price Group, Inc., and T. Rowe Price International; formerly Senior Portfolio Manager, Australian Equities (to 2010) | |
| Yoichiro Kai (1973) Vice President | Vice President, T. Rowe Price Group, Inc., and T. Rowe Price International; formerly Japanese Financial/Real Estate Sector Analyst/Portfolio Manager, Citadel Investment Group, Asia Limited (to 2009) | |
| Andrew J. Keirle (1974) Executive Vice President | Vice President, T. Rowe Price Group, Inc., and T. Rowe Price International | |
| Ian D. Kelson (1956) Executive Vice President | Director and President–International Fixed Income, T. Rowe Price International; Vice President, T. Rowe Price and T. Rowe Price Group, Inc. | |
| Christopher J. Kushlis, CFA (1976) Vice President | Vice President, T. Rowe Price Group, Inc., and T. Rowe Price International | |
| Mark J. Lawrence (1970) Vice President | Vice President, T. Rowe Price Group, Inc., and T. Rowe Price International | |
| David M. Lee, CFA (1962) Vice President | Vice President, T. Rowe Price and T. Rowe Price Group, Inc. | |
| Patricia B. Lippert (1953) Secretary | Assistant Vice President, T. Rowe Price and T. Rowe Price Investment Services, Inc. | |
| Christopher C. Loop, CFA (1966) Vice President | Vice President, T. Rowe Price, T. Rowe Price Group, Inc., and T. Rowe Price International | |
| Anh Lu (1968) Vice President | Vice President, Price Hong Kong and T. Rowe Price Group, Inc. | |
| Sebastien Mallet (1974) Executive Vice President | Vice President, T. Rowe Price Group, Inc., and T. Rowe Price International | |
| Daniel Martino, CFA (1974) Vice President | Vice President, T. Rowe Price and T. Rowe Price Group, Inc. | |
| Jonathan H.W. Matthews, CFA (1975) Vice President | Vice President, T. Rowe Price Group, Inc., and T. Rowe Price International | |
| Susanta Mazumdar (1968) Vice President | Vice President, Price Singapore and T. Rowe Price Group, Inc. | |
| Raymond A. Mills, Ph.D., CFA (1960) Executive Vice President | Vice President, T. Rowe Price, T. Rowe Price Group, Inc., T. Rowe Price International, and T. Rowe Price Trust Company | |
| Sudhir Nanda, Ph.D., CFA (1959) Vice President | Vice President, T. Rowe Price and T. Rowe Price Group, Inc. | |
| Joshua Nelson (1977) Executive Vice President | Vice President, T. Rowe Price and T. Rowe Price Group, Inc. | |
Jason Nogueira, CFA (1974) | Vice President, T. Rowe Price and T. Rowe Price Group, Inc. | |
| David Oestreicher (1967) Vice President | Director, Vice President, and Secretary, T. Rowe Price Investment Services, Inc., T. Rowe Price Retirement Plan Services, Inc., T. Rowe Price Services, Inc., and T. Rowe Price Trust Company; Vice President and Secretary, T. Rowe Price, T. Rowe Price Group, Inc., and T. Rowe Price International; Vice President, Price Hong Kong and Price Singapore | |
| Michael D. Oh, CFA (1974) Vice President | Vice President, T. Rowe Price and T. Rowe Price Group, Inc. | |
| Kenneth A. Orchard (1975) Vice President | Vice President, T. Rowe Price Group, Inc., and T. Rowe Price International; formerly Vice President, Moody’s Investors Service (to 2010) | |
| Gonzalo Pángaro, CFA (1968) Executive Vice President | Vice President, T. Rowe Price Group, Inc., and T. Rowe Price International | |
| Timothy E. Parker, CFA (1974) Vice President | Vice President, T. Rowe Price and T. Rowe Price Group, Inc. | |
| Craig J. Pennington, CFA (1971) Vice President | Vice President, T. Rowe Price Group, Inc., and T. Rowe Price International; formerly Global Energy Analyst, Insight Investment (to 2010) | |
| Frederick A. Rizzo (1969) Vice President | Vice President, T. Rowe Price Group, Inc., and T. Rowe Price International | |
| Christopher J. Rothery (1963) Executive Vice President | Vice President, T. Rowe Price Group, Inc., and T. Rowe Price International | |
| Federico Santilli, CFA (1974) Executive Vice President | Vice President, T. Rowe Price Group, Inc., and T. Rowe Price International | |
| Sebastian Schrott (1977) Vice President | Vice President, T. Rowe Price Group, Inc., and T. Rowe Price International | |
| Deborah D. Seidel (1962) Vice President | Vice President, T. Rowe Price, T. Rowe Price Group, Inc., T. Rowe Price Investment Services, Inc., and T. Rowe Price Services, Inc. | |
| Robert W. Sharps, CFA, CPA (1971) Vice President | Vice President, T. Rowe Price, T. Rowe Price Group, Inc., and T. Rowe Price Trust Company | |
| John C.A. Sherman (1969) Vice President | Vice President, T. Rowe Price Group, Inc., and T. Rowe Price International | |
| Robert W. Smith (1961) Executive Vice President | Vice President, T. Rowe Price, T. Rowe Price Group, Inc., and T. Rowe Price Trust Company | |
| Joshua K. Spencer, CFA (1973) Vice President | Vice President, T. Rowe Price and T. Rowe Price Group, Inc. | |
| David A. Stanley (1963) Vice President | Vice President, T. Rowe Price Group, Inc., and T. Rowe Price International | |
| Jonty Starbuck, Ph.D. (1975) Vice President | Vice President, T. Rowe Price Group, Inc., and T. Rowe Price International | |
| Taymour R. Tamaddon, CFA (1976) Vice President | Vice President, T. Rowe Price and T. Rowe Price Group, Inc. | |
| Ju Yen Tan (1972) Vice President | Vice President, T. Rowe Price Group, Inc., and T. Rowe Price International | |
| Dean Tenerelli (1964) Vice President | Vice President, T. Rowe Price Group, Inc., and T. Rowe Price International | |
| Eric L. Veiel, CFA (1972) Vice President | Vice President, T. Rowe Price and T. Rowe Price Group, Inc. | |
| Julie L. Waples (1970) Vice President | Vice President, T. Rowe Price | |
| Christopher S. Whitehouse (1972) Vice President | Vice President, T. Rowe Price Group, Inc., and T. Rowe Price International | |
| J. Howard Woodward, CFA (1974) Vice President | Vice President, T. Rowe Price Group, Inc., and T. Rowe Price International | |
| Ernest C. Yeung (1979) Vice President | Vice President, Price Hong Kong and T. Rowe Price Group, Inc. | |
Unless otherwise noted, officers have been employees of T. Rowe Price or T. Rowe Price International for at least 5 years. | ||
Item 2. Code of Ethics.
The registrant has adopted a code of ethics, as defined in Item 2 of Form N-CSR, applicable to its principal executive officer, principal financial officer, principal accounting officer or controller, or persons performing similar functions. A copy of this code of ethics is filed as an exhibit to this Form N-CSR. No substantive amendments were approved or waivers were granted to this code of ethics during the period covered by this report.
Item 3. Audit Committee Financial Expert.
The registrant’s Board of Directors/Trustees has determined that Mr. Anthony W. Deering qualifies as an audit committee financial expert, as defined in Item 3 of Form N-CSR. Mr. Deering is considered independent for purposes of Item 3 of Form N-CSR.
Item 4. Principal Accountant Fees and Services.
(a) – (d) Aggregate fees billed for the last two fiscal years for professional services rendered to, or on behalf of, the registrant by the registrant’s principal accountant were as follows:
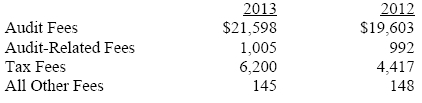
Audit fees include amounts related to the audit of the registrant’s annual financial statements and services normally provided by the accountant in connection with statutory and regulatory filings. Audit-related fees include amounts reasonably related to the performance of the audit of the registrant’s financial statements and specifically include the issuance of a report on internal controls and, if applicable, agreed-upon procedures related to fund acquisitions. Tax fees include amounts related to services for tax compliance, tax planning, and tax advice. The nature of these services specifically includes the review of distribution calculations and the preparation of Federal, state, and excise tax returns. All other fees include the registrant’s pro-rata share of amounts for agreed-upon procedures in conjunction with service contract approvals by the registrant’s Board of Directors/Trustees.
(e)(1) The registrant’s audit committee has adopted a policy whereby audit and non-audit services performed by the registrant’s principal accountant for the registrant, its investment adviser, and any entity controlling, controlled by, or under common control with the investment adviser that provides ongoing services to the registrant require pre-approval in advance at regularly scheduled audit committee meetings. If such a service is required between regularly scheduled audit committee meetings, pre-approval may be authorized by one audit committee member with ratification at the next scheduled audit committee meeting. Waiver of pre-approval for audit or non-audit services requiring fees of a de minimis amount is not permitted.
(2) No services included in (b) – (d) above were approved pursuant to paragraph (c)(7)(i)(C) of Rule 2-01 of Regulation S-X.
(f) Less than 50 percent of the hours expended on the principal accountant’s engagement to audit the registrant’s financial statements for the most recent fiscal year were attributed to work performed by persons other than the principal accountant’s full-time, permanent employees.
(g) The aggregate fees billed for the most recent fiscal year and the preceding fiscal year by the registrant’s principal accountant for non-audit services rendered to the registrant, its investment adviser, and any entity controlling, controlled by, or under common control with the investment adviser that provides ongoing services to the registrant were $1,828,000 and $1,333,000, respectively.
(h) All non-audit services rendered in (g) above were pre-approved by the registrant’s audit committee. Accordingly, these services were considered by the registrant’s audit committee in maintaining the principal accountant’s independence.
Item 5. Audit Committee of Listed Registrants.
Not applicable.
Item 6. Investments.
(a) Not applicable. The complete schedule of investments is included in Item 1 of this Form N-CSR.
(b) Not applicable.
Item 7. Disclosure of Proxy Voting Policies and Procedures for Closed-End Management Investment Companies.
Not applicable.
Item 8. Portfolio Managers of Closed-End Management Investment Companies.
Not applicable.
Item 9. Purchases of Equity Securities by Closed-End Management Investment Company and Affiliated Purchasers.
Not applicable.
Item 10. Submission of Matters to a Vote of Security Holders.
Not applicable.
Item 11. Controls and Procedures.
(a) The registrant’s principal executive officer and principal financial officer have evaluated the registrant’s disclosure controls and procedures within 90 days of this filing and have concluded that the registrant’s disclosure controls and procedures were effective, as of that date, in ensuring that information required to be disclosed by the registrant in this Form N-CSR was recorded, processed, summarized, and reported timely.
(b) The registrant’s principal executive officer and principal financial officer are aware of no change in the registrant’s internal control over financial reporting that occurred during the registrant’s second fiscal quarter covered by this report that has materially affected, or is reasonably likely to materially affect, the registrant’s internal control over financial reporting.
Item 12. Exhibits.
(a)(1) The registrant’s code of ethics pursuant to Item 2 of Form N-CSR is attached.
(b) A certification by the registrant's principal executive officer and principal financial officer, pursuant to Section 906 of the Sarbanes-Oxley Act of 2002 and required by Rule 30a-2(b) under the Investment Company Act of 1940, is attached.
SIGNATURES
Pursuant to the requirements of the Securities Exchange Act of 1934 and the Investment Company Act of 1940, the registrant has duly caused this report to be signed on its behalf by the undersigned, thereunto duly authorized.
T. Rowe Price Institutional International Funds, Inc.
| By | /s/ Edward C. Bernard | |
| Edward C. Bernard | ||
| Principal Executive Officer | ||
| Date December 13, 2013 | ||
Pursuant to the requirements of the Securities Exchange Act of 1934 and the Investment Company Act of 1940, this report has been signed below by the following persons on behalf of the registrant and in the capacities and on the dates indicated.
| By | /s/ Edward C. Bernard | |
| Edward C. Bernard | ||
| Principal Executive Officer | ||
| Date December 13, 2013 | ||
| By | /s/ Gregory K. Hinkle | |
| Gregory K. Hinkle | ||
| Principal Financial Officer | ||
| Date December 13, 2013 | ||