Exhibit (c)(i)
REPORT OF THE AUDITOR-GENERAL OF QUEENSLAND
The books, accounts and financial records relating to the Public Accounts of Queensland prepared by the State Treasury Department, for the years 1989-90 through 2003-2004 inclusive and Queensland Treasury Corporation for the years 1989-90 through 2003-2004 inclusive have been audited in accordance with recognised professional Australian Auditing Standards and practices and the relevant provisions of the Financial Administration and Audit Act 1977 (Queensland legislation governing State financial administration and practice).
Audit Certificates were subsequently provided to the Legislative Assembly of Queensland that, inter alia, all explanations and information required had been obtained in respect of these audits and that, in the opinion of the Auditor General, the various financial statements had been properly drawn up so as to present a true and fair view of transactions for the financial years concerned and the position of the accounts at the close of the respective years. There were no material audit qualifications to these accounts for any of the periods referred to with the exception of the Queensland Treasury Corporation financial statements for the periods 1 July 1989 to 30 June 1990 and 1 July 1990 to 30 June 1991. These qualifications related to the validity of specific significant assumptions and the outcome of certain litigation which, having been resolved, did not materially impact upon the accounts of Queensland Treasury Corporation for the subsequent years and accordingly an unqualified opinion was given in respect of these subsequent years.
In relation to the Statement of Financial Performance, Statement of Cashflows and the Statement of Financial Position of the Queensland Treasury Corporation for the year ended 30 June 2004 set out in the Queensland Treasury Corporation Annual Report for 2003-2004, I hereby certify that these Statements are an accurate reproduction of the financial statements duly certified in accordance with paragraph two of this Report and, in my opinion, have been properly drawn up so as to show a true and fair view of the transactions of the Corporation for the periods shown and the financial position of the Corporation as at 30 June 2003 and 30 June 2004.
Dated December 14, 2004
| | | | |
| | |
/s/ L J Scanlan | | | | |
L J SCANLAN | | | | Queensland Audit Office |
Auditor General of Queensland Brisbane | | | | |
QUEENSLAND TREASURY CORPORATION
ANNUAL REPORT 2003-04
FOR THE YEAR ENDED 30 JUNE 2004
CONTENTS
3
QUEENSLAND TREASURY CORPORATION
As the State’s corporate treasury services provider, our role is to implement the operational functions of a corporate treasury for the benefit of our customers and the State. In performing this role, our primary responsibilities include:
| | • | providing financial risk management services and advice to the State and its public sector organisations |
| | • | sourcing the State’s long-term debt funding requirements in the most cost effective manner, and |
| | • | investing the State’s short to medium-term cash surpluses with the aim of maximising returns to Queensland’s public sector bodies within a conservative risk management framework. |
We do not formulate Government policy, but work within the policy frameworks developed by Queensland Treasury and the Government.
DEBT FUNDING
In our funding role, we borrow funds in the domestic and international markets in a manner that minimises the State’s and QTC’s liquidity and rollover risk. We then lend these funds to our customers, or use them to manage our customers’ debt or refinance maturing debt.
Through our responsibility for more than 99% of the State’s debt raisings, we are able to capture significant economies of scale and scope in the issuance, management and administration of debt.
These economies, together with our AAA rating (from the State of Queensland’s guarantee of our securities), result in a low cost of debt for Queensland’s public sector. This funding is used to provide tailored financial solutions for our customers.
SHORT TO MEDIUM-TERM INVESTMENTS
We use our financial markets expertise, developed through our relationships with the domestic and international markets, together with our understanding of debt management and experience in implementing systems, to provide our customers with investment solutions that achieve a high return within a conservative risk environment. Customers have a choice of a managed short-term fund, an overnight facility, or fixed term facilities.
FINANCIAL RISK MANAGEMENT SERVICES
We work closely with our public sector customers, using our combined skills and knowledge, to assist them to manage risk in their financial transactions and achieve the best financial solution for their organisations and the State. In assisting our customers, we do not provide advice that is contrary to the interests of the State.
We encourage our customers and Queensland Treasury, our major stakeholder, to use our organisation as an extension of their resources, by:
| | • | Providing them with access, on a cost-recovery basis, to professional skills and resources to ensure that their financial risks are identified and managed on a consistent basis. |
| | • | Acting as a central store of knowledge and expertise on financial structures and transactions, and the risks and benefits that they encompass. |
| | • | Providing Queensland Treasury with independent advice on matters of financial and commercial policy and financial and commercial risk relating to the State and its entities. |
| | • | Working as a conduit between the Government and the private sector, using our economies of scale and scope to ensure that the best possible solutions are obtained. |
4
VISION, MISSION AND VALUES
Our Vision
Efficient and effective financial risk management practices across our customers and the State.
Our Mission
To provide corporate treasury services to our customers and the State, by striving to understand our customers’ current and future needs and by delivering solutions to meet those needs.
Our Values
We value:
| | • | respect for the individual |
| | • | integrity and honesty in all our dealings |
| | • | good corporate citizenship, and |
| | • | strong commitment and valuable contributions. |
5
HIGHLIGHTS
In 2003-04, Queensland Treasury Corporation performed strongly for its customers and the State, as the State’s corporate treasury services provider.
This strengthened performance was organisation-wide and resulted from improved teamwork and cooperation across teams and a greater focus on core value-adding activities.
FINANCIAL PERFORMANCE
A key aspect of the value QTC provides its customers is the hard dollar savings generated through efficient borrowing activities, and the ongoing management of these liabilities.
During the 2003-04 financial year, QTC achieved, for its customers, savings on borrowing margins of $63.1 million and savings from portfolio management of $54.6 million. This brought total savings in relation to QTC’s funding and management of the public sector’s debt to $1.3 billion since 1991.
QTC further assists its customers in the management of their financial risks by providing a vehicle for the investment of their surplus cash balances. The QTC Cash Fund has outperformed its benchmark in every year since 1991 and in financial year 2003-04 achieved $7.2 million in additional benefits for customers.
Customers also benefited from the flexibility provided by QTC’s debt management products. Their ability to take timely advantage of market opportunities generated savings in excess of $19 million this financial year.
QTC achieved an operating surplus, before payments in lieu of income tax, of $35.8 million.
In reaffirming the State’s credit rating, Standard & Poor’s stated that it considers QTC’s operations and risk-management practices are positive factors in Queensland’s AAA rating.
FINANCIAL MARKETS ACTIVITIES
In 2003-04, QTC was once again the foremost Australian semi-government issuer of A$ denominated bonds in both the domestic and offshore markets.
Our dealer panels and investors have continued to support our various funding facilities. These facilities form the building blocks on which our customers’ financial solutions are based.
Our Investor and Market Relations Program, designed to maintain and enhance the State’s and QTC’s reputation in both the domestic and offshore markets, continued with meetings held throughout Australia, Asia, the United States, the United Kingdom and Europe. QTC representatives also conducted an Asian central banks roadshow and participated in the Fixed Link Forum in Hong Kong and Singapore, and the Nomura Central Bankers Seminar in Tokyo.
In August, we hosted our biennial conference for representatives of domestic investor institutions to strengthen communication channels between QTC and some of the ultimate lenders to the State, and to ensure we remain well informed of investor requirements.
In July, we elevated our 2015 domestic preferred bond line to domestic benchmark bond status and simultaneously launched a global tranche maturing in 2015. This increased the amount of 2015 domestic bonds on issue to more than A$1.0 billion. The 2015 domestic bond is currently QTC’s longest benchmark maturity.
We experienced significant demand—issuing more than A$3.0 billion—from offshore investors for our benchmark bonds in 2003-04. Solid demand for both global and domestic bonds particularly evident from investors in Japan, the UK and continental Europe. We also completed three bond issues, totalling A$357 million, in the Japanese retail (uridashi) market, which provided additional attractive medium-term funding.
6
PROVIDING TREASURY SERVICES
Our relationships with customers continue to strengthen, as evidenced by our customers’ feedback on completed projects, and increasing involvement with our customers in a range of matters. On a scale of one to seven, our customers consistently rated our overall work on their advisory assignments as a six.
Our customers have increasingly involved us, at an early stage, in their business matters, particularly their procurement projects.
In addition to the savings created from borrowing margins ($63.1M) and portfolio management ($54.6M), we generated a further $52.9 million in value for our customers. This can be broken down as follows:
| | • | The management of long-term liquidity and refinancing risk on behalf of our customers: $18.9 million. |
| | • | The provision of strategic interest rate risk advice: $19 million. |
| | • | The provision of advice to our customers with respect to the management of financial risk: around $15 million. |
We met a significant increase in demand for our employees to work on secondment with our customers. Over the past year, 10 of QTC’s 130 employees took the opportunity to work within our customers’ organisations, adding value to their projects, as well as gaining a better understanding of those customers’ businesses. Following the success of these short-to-medium term placements, we anticipate that demand for customer secondments is likely to continue to increase.
During the year, QTC has assisted customers with financial training, conducting programs in Brisbane and a number of regional areas in Queensland. One key program, developed and delivered in conjunction with the Department of Local Government, provided customers with information and practical training in Project Evaluation. This course was well attended and received positive feedback from customers.
In November, we hosted our inaugural Departments and Agencies Financial Forum. This one-day Forum provided an opportunity for our Queensland Government customers to share knowledge, experiences and ideas regarding financial and project risk management issues.
QTC has facilitated risk workshops and training seminars for customers to assist them with risk identification, assessment and management. We also completed a number of risk assessment assignments for customers, and assisted them to establish risk assessment and analysis as part of their processes.
In response to the National Competition Policy reforms, we have provided our Local Government customers with advice, training and support on the issues of capital structure, cost of capital and pricing, for various commercialised business units.
On behalf of Queensland Treasury, we completed credit reviews of the larger Government Owned Corporations (GOCs), as well as a number of ad hoc reviews in relation to proposed GOC investments.
QTC was involved in providing financial advice with respect to all major procurement projects, and provided assistance on a number of significant whole-of-State risk issues including resolution of the arrangements between the State and Australian Magnesium Corporation, and consultation with the Commonwealth and other stakeholders on the proposed introduction of Division 250 tax law changes.
CORPORATE
We reviewed our Corporate Plan to ensure our direction and focus is in line with the issues facing our customers. Our primary objective is to build customer loyalty through developing and delivering solutions that provide value from a whole-of-State perspective.
7
During the year, we developed a strategy to achieve our vision for our information management—to provide staff, customers and stakeholders with seamless and secure access to quality information. An enterprise architecture plan is being developed to define those projects essential to achieving our vision.
The Employee Survey was completed with a very positive outcome for QTC. Feedback from a global human resources consultancy specialising in organisational climate surveys indicated that QTC was in the top 10% of employee organisations, with the highest ‘engagement’ score ever recorded for any participant in the firm’s survey.
The team based performance system, together with a new remuneration system, was implemented.
The office refurbishment was completed. From a staff and teamwork perspective this has been very positive.
Our Chief Executive was awarded ‘Public Sector Financial Manager of the Year’ by CFO magazine.
We operated within budget, and our overall control environment has operated soundly with no significant issues being raised by internal or external audit.
8
CHAIRMAN’S REPORT
In a year of rising market interest rates, Queensland Treasury Corporation (QTC) maintained its position as Australia’s premier semi-government issuer, with interest rates on our new money raisings better on average than any other Australian semi-government issuer.
The global economic climate steadily improved over the past year. Furthermore, Government and monetary policy stimulated economic growth, and confidence in the economic outlook seems to have become less susceptible to geo-political threats and activity. The net result in the financial markets has been higher share prices, rising commodity prices and a lift in market interest rates.
In this environment of rising interest rates, QTC’s active portfolio management sought to minimise the interest costs incurred by its customers. It was successful to the extent that the total interest savings for Queensland over the past twelve months were $117.7 million, bringing the cumulative total of savings to more than $1.3 billion since QTC’s establishment in 1991.
Queensland’s Economy
The Queensland economy performed strongly during 2003-04, despite a number of factors adversely affecting the State’s trade sector. Queensland is estimated to have recorded economic growth of 4% in 2003-04, compared with 3 3/4% nationally. During this year, the domestic sector has driven overall economic growth, with household consumption growing at a near-record rate, underpinned by continued strength in the housing sector.
However, the surge in consumer spending, along with continuing growth in business investment, has led to a rapid increase in imports in 2003-04, while the high A$ exchange rate and continuing impact of the drought on rural production have restrained export growth. The resulting trade sector detraction from the State’s aggregate growth figures made the strong performance of the domestic sector through the year all the more important and impressive.
Borrowing Requirements
Solid economic growth in Queensland and higher returns on world financial markets were the main drivers of a better than expected Budget outcome for 2003-04. As a result, the State’s debt funding requirements were less in the year relative to earlier years. However, strong economic outcomes continue to place growing demands on existing infrastructure. The Government has allocated some of its recent Budget surplus towards meeting this enhanced capital requirement but the capital works needed in South East Queensland and other areas of rapid population growth in the State mean that borrowing programs will be maintained or increased well into the foreseeable future.
Financial Markets Relationships
In 2003-04, QTC maintained its overall position as the strongest semi-government issuer of Australian dollar (A$) denominated bonds both in Australia and overseas.
To maintain and enhance the State’s and QTC’s reputation in both the domestic and offshore markets, we continued our Investor and Market Relations Program, conducting meetings in Australia, Asia, Japan, the United States, the United Kingdom and Europe. Attended by representatives of QTC and the Queensland Government, these meetings are key to ensuring that the markets are fully informed on matters concerning the State and QTC’s operations and borrowing strategies. Additionally, of course, we continue our good relations and understanding in the domestic market, which included, this year, our biennial conference for domestic institutional investors.
9
Looking Ahead
In 2004-05, we will pursue opportunities to work with our customers as an extension of their resources, assisting them to manage risk in their financial transactions and achieve the best financial solutions for their organisations and for the State.
Acknowledgments
With the retirement of Elizabeth Nosworthy from the Board in October, and Bernie Fraser and Bill Norton retiring as Board Members at the end of their terms (on 30 June), I thank them for their vision, contribution and support to QTC over the past years. Into these vacancies, I am pleased to welcome Gillian Brown, David Coe and Bill Shields, who have been appointed to the Board for the period 2004-07.
I also mention the achievements of our Chief Executive, Stephen Rochester, who was awarded the CFO Magazine’s prestigious national ‘Public Sector Financial Manager of the Year’ award. It was a well deserved recognition.
On behalf of the Board, I thank QTC’s management and employees for their achievement of positive financial results for Queensland and its public sector organisations for 2003-04. The Board acknowledges the staff’s ongoing commitment to this objective.
Sir Leo Hielscher AC
10
CHIEF EXECUTIVE’S REPORT
Queensland Treasury Corporation (QTC) has had a very successful year, providing corporate advisory, risk management, debt funding and short-to-medium term investment services to meet unprecedented demand from Queensland’s public sector. This organisation-wide improvement in performance resulted from a greater focus on core value-adding activities, teamwork and cooperation.
At 30 June 2004, QTC funded almost all of the Queensland public sector’s borrowings, with total borrowings of $21.70 billion, and $4.16 billion of refinancings and new capital being raised in the 2003-04 financial year. QTC also had $4.48 billion of funds invested for customers in competitively priced and strongly performing vehicles for short to medium term cash or investment requirements.
Global Demand Increases
During the past year, we have experienced renewed interest from global financial markets for Australian dollar (A$) denominated assets. With many industrialised countries experiencing historically low interest rates, international investors have sought higher quality, higher yielding Australian investments, and we issued more than A$3.0 billion of benchmark bonds to offshore investors. This has diversified our funding sources and improved our ability to provide competitively-priced funding solutions to our customers.
Building Customer Franchise
Our relationships with customers continued to strengthen, as our customers have expanded the use of our corporate treasury services. On corporate advisory assignments, our customers have consistently rated our overall work as a six, on a scale of one to seven.
Similarly, our customers have sought to involve us at an early stage in an increasing range of business matters, particularly their major procurement projects, and 10 of our employees have been seconded into our customers’ organisations to assist with key projects.
With Government’s focus on ensuring value for money outcomes, we have seen a continued trend towards the use of whole-of life-financial analysis as a means of assessing value for money. In the past year, QTC has applied its specialist competencies in whole-of-life financial analysis for the benefit of its customers by assisting with specific projects, and participating in the development of a consistent Government approach to the use of these financial analysis tools.
Strategic Planning
In recognition of the increasingly complex and risky business environment in which our customers operate, we have continued to focus on developing our services to best meet the needs of our public sector customers. We reviewed our strategic and corporate plan to ensure our direction and focus is in line with the issues facing our customers, so that we can better build customer loyalty through developing and delivering solutions that provide value from a whole-of-State perspective.
Corporate Achievements
Following the completion of our employee survey, which provided positive results and feedback from our staff, the surveyor indicated that QTC was in the top 10% of employee organisations, with the highest ‘engagement’ score ever recorded for any participant in the consultancy’s survey.
During the year, we completed our office refurbishment, providing facilities that encourage and support teamwork and cooperation, and implemented a new team-based performance and remuneration system.
11
We also developed and began implementation of a strategy to achieve our vision for our information management—to provide staff, customers and stakeholders with seamless and secure access to quality information.
Acknowledgments
QTC’s success in the past year is clearly attributable to the expertise and dedication of our employees. With their ongoing commitment to developing and delivering financial solutions to meet our customers’ current and emerging needs, QTC is well placed to continue to deliver value for money outcomes for Queensland and its public sector entities.
Stephen Rochester
12
FINANCIAL SUMMARY
| | | | |
| | | 2002-03 $000
| | 2003-04 $000
|
Operating Surplus from ordinary activities before payment in lieu of income tax | | 60 098 | | 35 830 |
Payment in lieu of income tax | | 13 176 | | 12 553 |
| | |
| |
|
Operating Surplus from ordinary activities after payment in lieu of income tax | | 46 922 | | 23 277 |
| | |
Distribution paid to Consolidated Fund | | 33 000 | | — |
Total Assets | | 26 866 311 | | 26 809 429 |
Total Liabilities | | 26 657 745 | | 26 477 586 |
Equity | | 208 566 | | 231 843 |
Onlendings | | 19 670 526 | | 17 714 737 |
Managed Deposit Funds | | 4 148 083 | | 4 476 280 |
Savings due to portfolio management | | 13 618 | | 54 632 |
Savings due to borrowing margin | | 56 094 | | 63 061 |
13
FIVE-YEAR BUSINESS SUMMARY
| | | | | | | | | | | | |
| | | Financial Year 99-00
| | Financial Year 00-01
| | | Financial Year 01-02
| | Financial
Year 02-03
| | | Financial
Year 03-04
|
FINANCIAL | | | | | | | | | | | | |
Operating Statement ($000) | | | | | | | | | | | | |
Interest from onlendings | | 940 476 | | 1 203 279 | | | 1 092 077 | | 1 826 847 | | | 371 737 |
Management fees | | 18 321 | | 20 945 | | | 21 970 | | 24 318 | | | 22 144 |
Fees from professional services | | 644 | | 371 | | | 377 | | 873 | | | 505 |
Interest on borrowings | | 1 169 658 | | 1 437 089 | | | 1 295 279 | | 2 157 121 | | | 468 243 |
Income distribution | | 148 114 | | 141 402 | | | 149 264 | | 166 529 | | | 239 933 |
Operating surplus before abnormal items and payment in lieu of income tax | | 31 299 | | 40 117 | | | 42 610 | | 60 098 | | | 35 830 |
Abnormal items | | 8 717 | | — | | | — | | — | | | — |
Payment in lieu of income tax | | 14 518 | | 15 156 | | | 13 694 | | 13 176 | | | 12 553 |
Operating surplus after payment in lieu of income tax | | 25 498 | | 24 961 | | | 28 916 | | 46 922 | | | 23 277 |
| | | | | |
Balance Sheet ($000) | | | | | | | | | | | | |
Total assets | | 22 107 020 | | 24 880 096 | | | 26 039 139 | | 26 866 311 | | | 26 809 429 |
Total liabilities | | 21 916 253 | | 24 714 368 | | | 25 844 495 | | 26 657 745 | | | 26 577 586 |
Net assets | | 190 767 | | 165 728 | | | 194 644 | | 208 566 | | | 231 843 |
| | | | | |
CUSTOMER | | | | | | | | | | | | |
Savings for Customers ($M) | | | | | | | | | | | | |
Savings due to portfolio management | | 38.0 | | (26.5 | ) | | 17.9 | | 13.6 | | | 54.6 |
Savings due to borrowing margin | | 71.0 | | 67.7 | | | 53.3 | | 56.1 | | | 63.1 |
Total savings for customers | | 109.0 | | 41.2 | | | 71.2 | | 69.7 | | | 117.7 |
Cumulative savings for customers | | 999.0 | | 1 040.2 | | | 1 111.4 | | 1 181.1 | | | 1 298.8 |
| | | | | |
Onlendings | | | | | | | | | | | | |
Onlendings ($000) | | 16 734 769 | | 17 347 345 | | | 18 419 899 | | 19 670 526 | | | 17 714 737 |
Number of onlending customers | | 337 | | 374 | | | 383 | | 363 | | | 342 |
Outperformance of benchmark (% pa semi-annual) | | | | | | | | | | | | |
Floating Rate Debt Pool | | 0.24 | | 0.41 | | | 0.46 | | 0.14 | | | 0.18 |
3 Year Debt Pool | | 0.21 | | (0.27 | ) | | 0.20 | | (0.02 | ) | | 0.22 |
6 Year Debt Pool | | 0.21 | | (0.29 | ) | | 0.04 | | 0.00 | | | 0.28 |
9 Year Debt Pool | | 0.27 | | (0.29 | ) | | 0.00 | | 0.06 | | | 0.28 |
12 Year Debt Pool | | 0.33 | | (0.26 | ) | | 0.01 | | 0.07 | | | 0.34 |
15 Year Debt Pool | | 0.33 | | (0.25 | ) | | 0.02 | | 0.05 | | | 0.36 |
| | | | | |
Managed Funds | | | | | | | | | | | | |
Deposits ($000) | | 2 197 252 | | 1 611 255 | | | 3 171 913 | | 4 148 083 | | | 4 476 280 |
Number of depositors | | 194 | | 202 | | | 215 | | 223 | | | 353 |
Outperformance of benchmark (% pa semi-annual) | | | | | | | | | | | | |
Cash Fund | | 0.19 | | 0.18 | | | 0.17 | | 0.18 | | | 0.18 |
| | | | | |
FINANCIAL MARKETS | | | | | | | | | | | | |
Debt outstanding ($000) | | 19 031 349 | | 22 203 640 | | | 22 025 716 | | 22 219 443 | | | 21 702 155 |
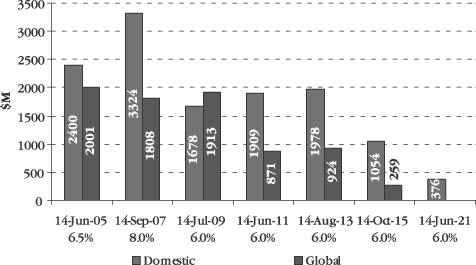
QTC bond rates (% at 30 June) | | | | | | | | | | | | |
July 1999 | | — | | — | | | — | | — | | | — |
August 2001 | | 6.10 | | 4.95 | | | — | | — | | | — |
May 2003 | | 6.26 | | 5.50 | | | 5.25 | | — | | | — |
June 2005 | | 6.36 | | 5.99 | | | 5.81 | | 4.51 | | | 5.45 |
September 2007 | | 6.48 | | 6.18 | | | 6.03 | | 4.78 | | | 5.70 |
July 2009 | | 6.52 | | 6.30 | | | 6.18 | | 4.98 | | | 5.87 |
June 2011 | | 6.57 | | 6.39 | | | 6.29 | | 5.13 | | | 5.98 |
August 2013 | | — | | — | | | 6.38 | | 5.24 | | | 6.07 |
October 2015 | | 6.61 | | 6.46 | | | 6.42 | | 5.30 | | | 6.12 |
June 2021 | | 6.62 | | 6.52 | | | 6.47 | | 5.38 | | | 6.18 |
Basis point margin over C’wealth bonds | | 32.7 | | 29.5 | | | 24.3 | | 16.7 | | | 19.3 |
Basis point margin under NSW TCorp bonds | | 5.1 | | 2.6 | | | 3.3 | | 2.1 | | | 3.1 |
QTC global & domestic bonds on issue ($M) | | 16 723 | | 18 463 | | | 19 148 | | 18 406 | | | 20 486 |
| | | | | |
CORPORATE | | | | | | | | | | | | |
Number of employees | | 121 | | 126 | | | 121 | | 129 | | | 130 |
Administration expenses ($000) | | 20 725 | | 23 415 | | | 23 716 | | 24 555 | | | 28 403 |
14
ACHIEVING WHOLE-OF-STATE OUTCOMES
In supporting the implementation of the State’s value-for-money framework, we provided ongoing support and input on matters of commercial and financial risk to Queensland Treasury, our major stakeholder, in relation to a variety of transactions, including the:
| | • | Southbank Education Precinct Redevelopment |
| | • | Gateway Duplication Project, and |
| | • | Brisbane City Council North/South Tunnel Project. |
We also assisted the State in the resolution of arrangements between the Government stakeholders and the Australian Magnesium Corporation.
We again conducted stakeholder feedback sessions with senior representatives of our major stakeholder, Queensland Treasury. The objective of these sessions was to gain feedback on the extent of our value delivery to Treasury and Government and to identify their emerging needs in terms of our provision of advice.
CREDIT REVIEWS
On behalf of Queensland Treasury, we completed annual credit reviews of the larger Queensland Government Owned Corporations (GOCs) to assist with assessing the GOCs’ applications for funding under the State Borrowing Program. We also completed a number of ad hoc credit reviews in relation to proposed GOC investments.
PROCUREMENT
We continue to provide financial risk management support to our public sector customers who are undertaking record Government capital expenditure activities.
With the Government’s focus on ensuring value for money outcomes, we have seen a continued trend towards the use of whole-of-life financial analysis as a means of assessing value for money.
QTC has applied its specialist competencies in whole-of-life financial analysis for the benefit of its customers by:
| | • | assisting with specific projects, and |
| | • | participating in the development of a consistent Government approach to the use of these financial analysis tools. |
Whole-of-life financial analysis is a powerful analytical tool for the evaluation of projects; however, it needs to be used carefully, particularly when assessing long-term government projects. Current topical issues that can affect the outcome of this analysis include the appropriate use of discounted cash flow analysis techniques (especially in relation to discount rate and cash flow determination for very long-term projects involving payment streams from Government), and the implications of various specific funding instruments on the comparison of delivery alternatives.
We have also continued to work closely with relevant agencies in progressing issues associated with tax reform relating to private sector participation in public infrastructure projects. This is a significant issue for both the State and Federal Government, particularly as so much of the financial benefit from State infrastructure projects flows to the Federal Government in the form of tax receipts.
Another critical issue has been the ongoing misconception that budget-funded PPPs allow projects that would otherwise not be considered as affordable government priorities to be undertaken.
15
We are continuing to work closely with Queensland Treasury and our customers across a broad spectrum of projects and issues to ensure that private sector involvement in projects contributes to the objective of delivering value for money for the State.
INTEREST RATE RISK
QTC worked closely with the State’s regulated entities to manage their interest rate risk for the current regulatory cycle, as well as plan for the management of similar financial risks in the next cycle. QTC has sought to coordinate ongoing discussions with customers, key stakeholders and industry participants to ensure funding and market risks are managed appropriately.
16
ADDING VALUE TO OUR CUSTOMERS’ BUSINESSES
QTC’s primary objective is to build customer loyalty through developing and delivering solutions that provide value.
It is through strong relationships with our customers that we gain a better understanding of their current and emerging needs, which then assists us in designing, developing and delivering tailored solutions for each customer. These solutions are designed to add value to our customers’ businesses and, ultimately, ensure the best financial outcomes for Queensland.
During the past 12 months, our relationships with our customers have continued to strengthen, as evidenced by our customers’ feedback on completed projects, and our increasing involvement with our customers in a range of matters. On a scale of one to seven, our customers consistently rated our overall work on their advisory assignments as a six.
CORPORATE ADVISORY AND RISK MANAGEMENT
QTC has experienced increased demand for our corporate advisory and risk management services across all of our customer groups, completing more projects of a wider variety over the past 12 months.
We advised the public sector on operating and financial risk matters and worked with them to identity and develop optimal value for money solutions in transactions in a range of projects, including the:
| | • | Department of Natural Resources, Mines and Energy’s Water Metering Project |
| | • | National Housing Project: Developing Options for a National Approach to Affordable Housing |
| | • | Tennyson Riverside Development, and |
| | • | Smart Driver Licence Project. |
We provided the State’s Government Owned Corporations (GOCs), and their Boards, with updates on the current economic and interest rate environment, enabling effective management of their debt portfolios. In addition, we continued to provide specialist advice and assistance in the areas of:
| | • | liability benchmark structuring |
| | • | implementing and monitoring their liability management |
| | • | foreign exchange exposure management, and |
We assisted a number of GOCs in implementing their business plans, including risk management and funding advice.
We provided advice on capital structure, cost of capital and pricing to:
| | • | South-East Queensland Councils’ Feasibility Study into the Establishment of a Shared Fleet Model |
| | • | Gladstone Area Water Board, and |
| | • | a number of regional councils in relation to their commercialised business units. |
We also assisted a number of customers in the development of policy frameworks to improve their risk management practices.
17
MANAGING OUR CUSTOMERS’ DEBT
Many of our customers authorise QTC to manage the interest rate risk inherent in their debt. This management is undertaken within customer approved parameters in the form of a duration benchmark and defined duration management range. Our management performance is subject to monthly review by the QTC Capital Markets Board, as well as by our customers.
The 2003-04 financial year was characterised by a somewhat less volatile geo-political environment than that experienced in the previous twelve months. Although uncertainties relating to the Middle East and terrorism in general were still apparent, there were no major incidents to significantly shake global confidence.
The United States Federal Reserve Board added to the generally positive environment by maintaining relatively easy monetary and fiscal conditions throughout the year. With countries such as China and India exhibiting strong economic growth even Japan appeared to have entered into a long awaited period of sustained economic recovery.
Against this backdrop, global interest rates took on a decidedly bearish tone as central banks adjusted their focus towards anticipated inflation.
Within this environment, we used our portfolio management skills to generate an aggregate $54.6 million in interest cost savings for its customers. Our customers also benefited by a further $19 million, as they took advantage of duration benchmark management opportunities we identified and facilitated in the market.
MANAGING OUR CUSTOMERS’ SURPLUS CASH
QTC offers a number of facilities for our customers to deposit their surplus cash. Terms of these facilities range from one day out to three years. One such facility is the Capital Guaranteed Cash Fund where QTC’s Board approves the benchmark and defined management ranges. Through our management of this fund QTC added $7.2 million, when compared to benchmark, during financial year 2003-04.
PROVIDING AN OPERATING LEASE FACILITY
An analysis of operating leases undertaken over the past several years indicates that they typically do not represent value for money relative to financing through debt funding. This is mainly due to:
| | • | customers not returning the equipment on time |
| | • | customers returning the equipment in damaged condition |
| | • | there being no residual risk transfer from the customer, or |
| | • | the equipment having a useful life significantly longer than the lease period. |
Although these factors limit the value of leasing in the public sector, there are occasions when our customers prefer to use leases.
Established in 2002-03, QTC’s Whole-of-Government Leasing Facility provides our customers with a lower cost and risk alternative than those provided by the private sector. This has been achieved through access to our low cost funding, balanced leasing terms and on-going customer communications regarding our customers’ end of lease intentions.
The demand for this facility is now decreasing as our customers’ compare the value of leasing to the debt financing alternative. QTC frequently assists its customers in conducting such evaluations. During the year, we completed significant assignments for the Police, Environmental Protection Agency, CITEC and many local councils.
18
KNOWLEDGE SHARING
In November 2003, we held our inaugural Departments and Agencies Financial Forum. This one-day forum highlighted key strategic financial and project risk management issues facing departments and agencies, as well as strategies for managing these risks. It also provided an opportunity for our customers to share their knowledge, experiences and ideas.
In addition, we conducted our Central Treasury Management course and Foreign Exchange Hedging workshop. A series of Financial Evaluation and Procurement workshops was conducted with branches of Queensland Treasury.
Together with the Department of Local Government, Planning, Sport and Recreation, we ran a series of one-day project evaluation courses for our regional local government customers in Toowoomba, Cairns, Longreach and Bundaberg.
RELATIONSHIP MANAGEMENT
Our customer calling program for customers in regional Queensland remained an integral component in establishing strong relationships. This program provides our employees with an opportunity to better understand our regional Queensland customers’ unique business needs and operating environments, and has assisted them in providing better customer solutions. It has in the past 12 months also seen our employees travel more than 140,000 kms, visiting customers as far west as Mt Isa and Winton, north to Normanton, Etheridge, Cairns and south-west to Charleville.
Over the past year, we have participated in a number of industry and project working groups and provided 10 employees on secondments to our customers’ organisations. We have also continued to support and sponsor a range of Local Government conferences throughout Queensland, and maintained our support of the Finance and Treasury Association (FTA) annual conference.
During the year, QTC has supported and assisted customers with financial training programs, risk assessment workshops and risk training seminars, sharing skills to assist customers to better manage their projects.
At the request of the Department of Local Government, QTC presented at the Department’s Accounting and Audit forums, in various locations across the State. These forums provide Local Governments with information of a financial nature, and an opportunity to discuss common issues and share experiences.
PRODUCTS AND SERVICES FRAMEWORK
Recognising that QTC’s products and services are the building blocks through which we can deliver value to our customers, a project to review our products and services for alignment to our customers’ needs is now underway.
Initially, the project focused on reviewing our core funding and investment products and services to ensure they satisfy our customer needs, and reviewing product guidelines to ensure customers are provided with a consistent level of service. Under this project, new products and services have also been identified and these will be further developed over the next year.
19
RAISING FUNDS FOR QUEENSLAND
Queensland Treasury Corporation continues to offer its customers the lowest cost of funds available from any of Australia’s semi-government issuers.
Our global approach to funding and our diverse range of funding facilities enable us to maintain flexibility to source the most cost-effective funds.
The strength of QTC’s securities has been underpinned by our commitment to:
| | • | maximising the benefits flowing from Queensland’s AAA credit rating |
| | • | maintaining liquid bond lines supported by a strong Distribution Group |
| | • | ensuring the financial markets are kept well informed on Queensland’s economic and fiscal standing, and our business direction |
| | • | maintaining transparency, integrity and credibility in our relationships with the domestic and international markets, and |
| | • | issuing debt instruments that meet investors’ needs whenever possible. |
QTC does not compete with financial intermediaries as a price-maker or trader, and does not use Queensland’s superior borrowing position for pure arbitrage activities.
Queensland’s strong credit rating, combined with QTC’s expert financial management skills and issuing flexibility, have helped ensure we attract a broad base of Australian and international investors.
CREDIT RATINGS OF QTC SECURITIES
| | | | |
Local Currency (A$)
| | Short-Term Rating
| | Long-Term Rating
|
Standard & Poor’s | | A-1+ | | AAA |
Moody’s Investor Services | | P1 | | Aaa |
| | |
Foreign Currency
| | Short Term Rating
| | Long Term Rating
|
Standard & Poor’s | | A-1+ | | AAA |
Moody’s Investor Services | | P1 | | Aaa |
FUNDING FACILITIES
Domestic and Global $A Bonds
QTC currently offers investors:
| | • | domestic and global benchmark bonds maturing every two years, from 2005 to 2015, and |
| | • | a preferred domestic bond line maturing in 2021. |
These bond facilities are our core source of funds. In July and October 2003, QTC increased the amount on issue of the domestic 2015 bond, by way of a tender and consolidation switches, to promote the line to benchmark status. The global tranche of the 2015 bond line was launched in September 2003.
20
Domestic and global QTC bonds on issue are detailed in the following graph and table:
QTC Benchmark Bonds as at 30 June 2004
| | | | | | | | | | | | | |
Facility
| | Size $M
| | Governing
Law
| | Maturities
| | Currencies
| | Amount on
Issue $M
| | Placement
|
| Domestic A$ Bond | | Unlimited | | Queensland | | 6 benchmark
lines
2005 - 2015 | | A$ | | | 12,344 | | By tap or tender through Distribution Group |
| | | | | | |
| | | | | | | Preferred
Line 2021 | | A$ | | | 376 | | Reverse enquiry through Distribution Group |
| | | | | | |
| Global A$ Bond | | A$10,000 | | New York &
Queensland | | 6 benchmark
lines
2005 - 2015 | | A$ | | | 7,776 | | Continuously offered through Distribution Group |
Treasury Notes, Commercial Paper and Medium Term Notes
Supplementing the domestic and global bond facilities are our various short-term and medium-term note facilities.
The QTC Treasury Note facility is an electronic issuance facility and is our chief source of short-term domestic A$ funds. QTC’s main offshore programs are the Commercial Paper (CP) and Medium Term Note (MTN) facilities in both the Euro and the US markets.
21
The following table details these facilities:
| | | | | | | | | | | | |
Facility
| | Size $M
| | Governing
Law
| | Maturities
| | Currencies
| | Amount on
Issue $M
| | Placement
|
| Domestic Treasury Note | | Unlimited | | Queensland | | 7 – 365
days | | A$ | | A$130 | | By tap or tender through Dealer Panel |
| | | | | | |
Euro CP | | US$3,000 | | English &
Queensland | | 7 – 365
days | | Multicurrency | | US$310 | | By tap through Dealer Panel |
| | | | | | |
US CP | | US$1,500 | | New York &
Queensland | | 1 – 270
days | | Multicurrency | | US$0 | | By tap through Dealer Panel |
| | | | | | |
Euro MTN | | US$3,000 | | English &
Queensland | | Subject to
market
regulations | | Multicurrency | | US$506 | | Reverse enquiry through Dealer Panel |
| | | | | | |
US MTN | | US$500 | | New York &
Queensland | | 9 months
to 30 years | | Multicurrency | | US$0 | | Reverse enquiry through Dealer Panel |
These funding facilities are supplemented with public issues and private placements.
Appendix B details the Distribution and Dealer Groups for QTC’s funding facilities at 30 June 2004.
More detailed information on QTC’s funding facilities and outstanding indebtedness is available on request from QTC’s Financial Markets Team (see Appendix C for details).
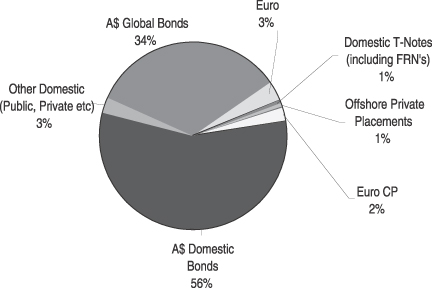
Percentage outstandings under QTC’s various funding facilities, as at 30 June 2004, are shown in the following chart:
QTC Funding Facilities
30 June 2004
22
BORROWING PROGRAM
QTC reviews its borrowing requirements as at 30 June and 31 December each year to provide a funding estimate for the following 12 months.
Financial Year 2003-04
In 2003-04, QTC estimated that its gross borrowing requirement would be $3,819 million.
With no benchmark bond maturity to be refinanced during 2003-04, the estimated demand on the market for funding was approximately $1,719 million less than actual raisings of $5,537 million in the previous year.
QTC’S INDICATIVE BORROWING PROGRAM 2003-04
| | | | | | |
Borrowing Estimate 2002-03 A$M
| | | | Borrowing Estimate
2003-04 A$M
| |
| | | Refinancings—Commercial Paper: | | | | |
| 596 | | Domestic T-Notes 1 | | | 1,344 | |
| 1,363 | | Euro Commercial Paper 1 | | | 1,072 | |
| 313 | | US Commercial Paper 1 | | | 165 | |
| | | Refinancings—Term Debt: | | | | |
| 2,388 | | Bonds | | | 90 | |
| 1,412 | | A$ Global Bonds and MTNs | | | 0 | |
| 16 | | Foreign Currency Loans and MTNs | | | 135 | |
| 6,088 | | SUBTOTAL | | | 2,806 | |
| | | New Raisings: | | | | |
| 2,648 | | Capital Works Program | | | 1,800 | |
| | | Adjustments: | | | | |
| (795) | | Debt repayments from QTC customers | | | (787 | ) |
| (1,500) | | Decrease in funding reserves due to expected reduced liability management requirement. | | | — | |
| $ 6,441 | | TOTAL | | $ | 3,819 | |
| 1 | Commercial Paper outstanding estimate as at 30 June 2003 (including FRNs). |
The 2003-04 funding estimate of $3,819 million was expected to be financed as follows:
FUNDING SOURCE
| | | | | | | | |
Actual Raisings 2002-03 $M
| | | | Expected Raisings 2003-04
|
| | | | Range %
| | Low $M
| | High $M
|
| | | Commercial Paper Raisings: | | | | | | |
| 2,467 | | Domestic CP, ECP, USCP | | 40 – 60 | | 1,528 | | 2,291 |
| | | Term Raisings: | | | | | | |
| 2,570 | | A$ Benchmark Bonds 2 | | 40 – 60 | | 1,528 | | 2,291 |
| 500 | | Multicurrency Loans and MTNs | | 0 – 10 | | 0 | | 382 |
| $5,537 | | | | | | | | |
| 2 | Includes benchmark Domestic and Global A$ Bonds, 2015 and 2021 preferred lines and other term issuance. |
23
Actual raisings for 2003-04 of $4,163 million were above expected raisings, due mainly to an improvement in State revenue raisings against budget and reduced capital requirements by government-owned corporations, together with stronger offshore investor demand for QTC Global Bonds.
Over the last financial year, funding was sourced principally from:
| | |
• Commercial Paper | | $ 643 million |
• Domestic A$ Benchmark Bonds | | $ 284 million |
• Global A$ Benchmark Bonds | | $2,893 million |
• Euro MTNs | | $ 343 million |
During 2003-04, QTC increased the amount of the October 2015 domestic bond on issue to elevate it to benchmark status and also launched the global tranche of the same bond line.
Financial Year 2004-05 Estimate
QTC estimates its borrowing requirement for the next financial year will be $6,819 million 3.
With the maturity of the 2005 benchmark bonds in June, the demand on the market for funding will be approximately $2,656 million more than last year’s actual raisings of $4,163 million.
QTC INDICATIVE BORROWING PROGRAM FOR 2004-05
| | | | | | |
Borrowing Estimate
2003-04 A$M
| | | | Borrowing Estimate
2004-05 A$M
| |
| | | Refinancing—Commercial Paper: | | | | |
| 1,344 | | Domestic T-Notes 4 | | | 198 | |
| 1,072 | | Euro Commercial Paper 1 | | | 513 | |
| 165 | | US Commercial Paper 1 | | | 0 | |
| | | Refinancing—Term Debt: | | | | |
| 90 | | Domestic Bonds | | | 2,515 | |
| 0 | | A$ Global Bonds and MTNs | | | 1,990 | |
| 135 | | Foreign Currency Loans and MTNs | | | 154 | |
| 2,806 | | SUBTOTAL | | | 5,369 | |
| 1,800 | | New Raisings | | | 2,050 | |
| (787) | | Principal Repayments from QTC Customers | | | (600 | ) |
| $3,819 | | TOTAL | | $ | 6,819 | |
| 3 | Actual financial market activity and funding requirements may vary depending upon customer requirements and financial market conditions. |
| 4 | Commercial Paper outstanding as at 30 June 2004 (includes FRNs). |
24
The 2004-05 funding estimate of $6,819 million is expected to be financed as follows:
FUNDING SOURCE
| | | | | | | | |
Actual Raisings
2003-04 $M
| | | | Expected Raisings 2004-05
|
| | | | Range %
| | Low $M
| | High $M
|
| | | Commercial Paper Raisings: | | | | | | |
| 643 | | T-Notes, ECP, USCP | | 40 – 50 | | 2,728 | | 3,410 |
| | | Term Raisings: | | | | | | |
| 3,177 | | A$ Benchmark Bonds 5 | | 45 – 55 | | 3,069 | | 3,751 |
| 343 | | Multicurrency Loans and MTNs | | 0 - 10 | | 0 | | 682 |
| $4,163 | | TOTAL | | | | | | |
| 5 | Includes benchmark Domestic and Global A$ Bonds and other term issuance. |
We anticipate that approximately 50% of this year’s program ($3,410 million) will be funded through the issuance of term debt, utilising domestic and global benchmark bonds with the balance funded via commercial paper and Medium Term Note (MTN) issuance.
Actual financial market activity and funding requirements may vary, depending on customer requirements and financial market conditions.
25
ACHIEVING OUR GOALS THROUGH TEAMWORK
Over the past year, our teams continued to demonstrate a commitment to our core strategy of achieving customer loyalty. We use this framework to build customer relationships so that teams have a better understanding of their customers’ specific needs and are then able to develop and deliver tailored solutions that meet those needs.
Following the review of our Corporate Plan, work was done to identify and establish the following cultural statement that supports our direction and focus and our people.
We encourage and support:
| | • | developing and implementing ideas to both improve customer outcomes and our processes |
| | • | listening to and understanding our stakeholders, staff and customers |
| | • | learning from successes and mistakes through reflection |
| | • | taking responsibility for our actions and being personally accountable |
| | • | developing the potential of our people, and |
| | • | being challenged at work, achieving our career and personal objectives through a healthy work/life balance. |
PERFORMANCE-BASED REMUNERATION SYSTEM REVIEW
In the year under review, QTC’s existing team based performance and remuneration systems were reviewed and a new system was implemented as part of the integrated suite of programs that support QTC’s strategy. The new system reflects the market and environment in which QTC operates, aligns with our strategic direction and operating structure, and reinforces QTC’s values and culture.
QTC’s reward philosophy is to be market competitive and align with other large conservative financial institutions. Accordingly, QTC has set its remuneration policy at the market median for large conservative industry organisations.
Team Reward Policy
As part of the integrated remuneration system, QTC implemented a team-based reward model that recognises each team for its collective contribution to organisational and team outcomes and delivering customer value. All teams members are eligible for a reward.
FLEXIBLE WORK POLICY
We introduced a flexible work/life policy, which has received positive feedback. In a recent work/life benchmarking study, which involved more than 300 organisations, QTC was ranked in the top 25 Australian organisations for work/life initiatives.
EMPLOYEE SURVEY
We conducted an employee survey in December 2003, which was voluntarily completed by 81% of all staff. The outcomes of this year’s survey were positive and feedback from the consulting firm that conducted the survey indicated that QTC was in the top 10% of surveyed employee organisations in Australia. Many of the recommendations resulting from the survey have since been implemented, and the next employee survey is planned for 2005.
26
SECONDMENTS AND GRADUATES
QTC continued to develop and implement an internal and external secondment program, which provides employees with relevant career development opportunities, the ability to share and exchange knowledge, and an opportunity to enhance customer loyalty through experiencing our customers’ business operations. Several employees participated in the external secondment program to assist customers in meeting their business needs as well as developing and transferring skills.
We also continued our support of the Queensland University of Technology’s Corporate Partners in Excellence program for undergraduates in finance and related fields.
OFFICE ACCOMMODATION
During 2003-04, our office accommodation was refurbished to create an open-plan work environment to further enhance our team-based structure and improve communication within the organisation. Completed in February, the new office environment has provided increased meeting, project and training space for our teams and customers. The project achieved its objectives and received positive feedback from employees.
STAFF DEVELOPMENT
During the year, all employees were invited to participate in a number of initiatives to further develop their skills in the workplace. One key initiative to enhance self-awareness used the Herrmann Brain Dominance Instrument (HBDI) to identify and understand the unique attributes that each employee brings to QTC, enabling teams to then leverage those attributes to achieve successful outcomes. This instrument was also used to assist team leaders with their day-to-day approach to team management. To further support team leaders, we established a panel of experienced coaches, which many of our team leaders have accessed.
The Team Align leadership tool and Team Leaders’ Forum continued to be an effective way of consulting with team leaders and ensuring that all teams were regularly updated on our focus and direction.
CORPORATE WELLBEING
We established a corporate wellbeing program to inform and educate our people on issues relating to health, stress management and general wellbeing.
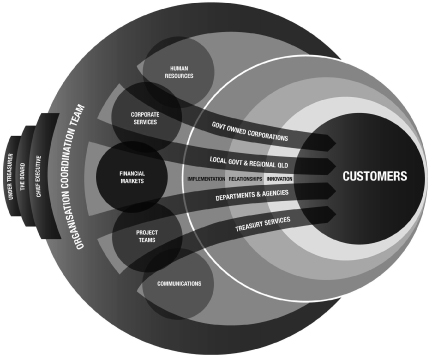
OPERATIONAL STRUCTURE
QTC is structured to reflect our overarching value-delivering strategy of customer loyalty, recognising that we achieve our corporate goals through the efforts of our teams. This diagram depicts our organisational structure, showing how all teams work together to deliver value to our customers.
Our teams work in an integrated and collaborative way to implement the three core processes of the customer loyalty operating model—developing and maintaining relationships, solution design and development, and the delivery of tailored solutions. The diagram demonstrates that, through these processes and supporting teams, our customer-focused teams work directly with our customers to assist them in maximising outcomes and appropriately managing risks for their organisations and Queensland.
27
QTC’s ORGANISATION CHART
QTC Operational Structure
28
DELIVERING BETTER SYSTEMS AND PROCESSES
Across the organisation, our teams strive to continually improve their own abilities to deliver value to our customers. This process of continual improvement drives QTC’s strategic goal to ensure that all internal systems and business processes are cost-effective, reliable, flexible and relevant.
ENTERPRISE RISK MANAGEMENT
QTC’s organisation-wide risk management system has continued to ensure that significant risks were identified and managed consistently and appropriately. In 2003-04, after its first year of implementation, we reviewed the framework for risk management to ensure that it was operating effectively. Next year, the focus will be on ensuring consistency of risk management practices across all teams in the organisation.
FINANCIAL RISK MANAGEMENT
We have undertaken a number of key financial risk projects in the past year, including an internal review of the relevance to QTC of the issues surrounding the National Australia Bank’s foreign exchange trading losses.
This review, while highlighting some areas where we could enhance our controls, confirmed that we have in place appropriate risk management procedures to support our business activities; all of our exposures are subject to appropriate control by the Board; and our corporate governance procedures are appropriate, given our business activities. We have either implemented or are in the process of implementing the enhancements.
In addition to our internal review, independent assessments by both internal and external audit raised no significant issues.
BUSINESS CONTINUITY PLANNING
As part of QTC’s Business Continuity Plan, scenario-based tests of QTC’s readiness to deal with major crises and disruptions to business operations were conducted in August 2003 and February 2004, with no significant issues identified. During the year, the Plan was further bolstered by the development of a ‘worst case contingency plan’, and over the next year it will be incorporated into a new crisis management plan, in line with the Government Agency Preparedness program requirements.
COMPLIANCE
We continued our commitment to a strong compliance program to assist us in managing compliance risk and delivering the best outcomes for our customers and the State. During the year, a significant amount of work in monitoring and reviewing QTC’s compliance was completed. This included an internal audit and the conduct of a legal compliance audit by an external law firm of various areas of QTC (and which for some areas is continuing past the year under review). Both audits have delivered strong and positive outcomes about the nature of QTC’s compliance.
QTC also undertook a review of its fraud risks, which identified QTC’s fraud risks, established that QTC’s fraud risks were being appropriately managed and controlled, and identified some improvements that are currently being considered.
IT STRATEGY
During the year, we developed a new vision for QTC’s information management—to provide staff, customers and stakeholders with seamless and secure access to quality information. Established in conjunction with the corporate planning process, this vision statement provided direction to the current IT Strategy, which presents a series of initiatives to:
| | • | strategically direct IT investment |
| | • | establish a robust IT governance framework |
29
| | • | emphasise the alignment of IT with corporate objectives, and |
| | • | manage the development of staff competencies in relation to JAVA/J2EE. |
Cornerstone initiatives under the IT Strategy include the formal adoption of JAVA/J2EE as QTC’s application environment and the commencement of an Enterprise Architecture Planning project, which will define those projects essential to achieving our vision for information management.
PROGRAM MANAGEMENT PRACTICES
QTC’s internal Project Management Office (PMO) promotes, develops and implements consistent and pragmatic project management practices across QTC. In the past year, PMO has worked with QTC’s teams to introduce program management practices to ensure the effective management of risks and opportunities across related projects. This is particularly necessary where the related projects require broad contribution from across the organisation and have a significant change management component.
QTC recognises program management as an effective means of managing the delivery of these complex undertakings while also supporting effective resource management and benefits realisation objectives.
CAPITAL FRAMEWORK
Our policy is to monitor the level of capital required to operate as a corporate treasury services provider. In line with conventional capital adequacy models, we monitor the level of capital required for credit, market and operational risk. With respect to credit risk, we calculate our capital requirements using the risk weightings outlined in the New Basel Capital Accord, released in January 2001 for comment by the Bank of International Settlements. The capital required for market risk is calculated based on JP Morgan’s value-at-risk methodology. To date, no substantive methodology has been developed to calculate capital required for operating risk. As a consequence, a notional amount has been allocated to cover operational risk.
No capital is set aside to reflect the risk of the loans to the State and its public sector entities as the risk of these loans is directly or indirectly carried by the State. As a consequence, and in line with our corporate treasury services provider role, we lend to the State and its public sector entities at cost (QTC’s borrowing cost) plus an administration fee.
Our capital requirements based on portfolio holdings at 30 June 2004 were $228.9 million.
In determining its capital holdings, QTC treats its equity as Tier One Capital and Cross Border Lease Deferred Income as Tier Two Capital. As at 30 June 2004, QTC held $230.5 million in Tier One Capital and $153.5 million in Tier Two Capital, resulting in a total capital of $384 million.
While QTC monitors the level of capital required and currently has adequate capital coverage, there are no requirements to hold capital to cover this capital requirement.
30
POSITIONING FOR THE FUTURE
QTC’S CORPORATE PLAN
During the first half of the year, we reviewed our Corporate Plan to ensure our direction and focus remained appropriate, given the issues facing our customers either internally or as a consequence of changes in their business environment. The key customer issues identified were:
| | • | With the growing complexity of the business environment due to increasing globalisation, improved communication, and increasing regulation, many of our customers have a great deal of difficulty acquiring the specialist resources needed to address the issues arising from this increasing complexity. |
| | • | The strain on financial resources, together with the capacity of our customers to operate and manage significant infrastructure, has led many of our customers to consider the merits of alternative procurement models. In many instances, these models involve the bundling of several important activities. While there is merit in considering all procurement alternatives our customers’ capacity to assess these alternatives, and quantify the risks associated with each alternative needs to be enhanced. |
| | • | The public is demanding a greater range of services at higher performance levels and lower cost, thereby placing greater strain on the financial and human resources of our customers. |
Our response to these issues was reflected in the Corporate Plan. In addition, the structure of the Plan was changed to better reflect our operating model and to ensure greater focus of our teams and staff on the attainment of our overall objective, which is to build customer loyalty through developing and delivering solutions that provide value from a whole-of-State perspective.
Achieving customer loyalty involves three key processes:
| | • | Relationship management: This relates to the development of close relationships with our customers as a basis for understanding their needs. |
| | • | Solution design and development: With information regarding our customers’ current and emerging needs, we need to design and develop solutions that meet those needs, within the scope of our role as corporate treasury services provider. |
| | • | Solution delivery: Once developed, we need to be able to deliver the solutions to our customers in a cost-effective and timely manner, in a form they can understand and apply to their businesses. |
Our teams found that the restructuring of the Corporate Plan better enabled them to express their core activities in terms of one or more of these processes.
An additional section entitled ‘Alignment’ was also created in the Corporate Plan to address the three key competencies underpinning these core processes. The three key competencies are:
| | • | Knowledge management, which is central to developing a level of understanding of our customers, and their businesses in order to develop and deliver solutions that meet their requirements. |
| | • | Teamwork, which is seen as integral to achieving our outcomes, by empowering our teams to proactively find ways to deliver customer value within the scope of our corporate treasury services provider model. Teamwork and empowerment are essential steps in optimising our intellectual capital. |
| | • | Risk management, which ensures that the risks created by our business activities and operating model are identified and managed on a whole of QTC basis. Failure to do this will impede our ability to deliver value to our customers. |
Other areas addressed in this section of the Plan are compliance, reputation and people.
31
Where do we want to be?
In reviewing our Corporate Plan, we arrived at what we believe would be an appropriate vision for our organisation in 2006:
| | • | Our corporate treasury services provider role is clearly understood by employees, our customers, our stakeholder and the financial markets. |
| | • | Our customers and stakeholder report that we are their first choice financial services provider, as an outcome of being highly professional and consistently delivering value. |
| | • | Our information is current, readily accessible and valuable to both our staff and our customers. |
| | • | Our customers and stakeholder willingly share their knowledge with us. |
| | • | The financial markets report that we know the markets and that we are proactive in dealing with issues. |
| | • | Our processes to manage our risks continue to be enhanced and do not expose us to unnecessary risk. |
| | • | A culture of self, team and organisational improvement is evident throughout the organisation. |
| | • | Teams work together efficiently and effectively to address issues. |
| | • | Our employees are seen as an excellent source of financial risk management skills by our customers and stakeholder. Access to these skills is facilitated through secondment, and training and development programs. |
| | • | Our culture and systems support the access to, and the use, of our information. |
32
BOARD
The Board Directors of Queensland Treasury Corporation to 30 June 2004 were:
Sir Leo Hielscher AC
B.Comm., D Univ Griffith (Hon), AAUQ, AASA, FAIM, FCPA, FFTP (Hon)
Chairman
Chairman, Risk Management Committee
Appointed in 1988. Tenure 30 June 2007
Sir Leo Hielscher has more than fifty years’ experience in the areas of Government, banking and finance, domestic and global financial markets, superannuation and as an independent Company Director. He was the Under Treasurer of Queensland for 14 years (1974–1988) before his appointment as Chairman of the Queensland Treasury Corporation (Advisory Board) in 1988. In 1991, the Advisory Board became the Queensland Treasury Corporation Board and Sir Leo was appointed as its inaugural Chairman. Sir Leo is also Chairman of Austsafe Ltd, Independent Superannuation Preservation Fund, a Director of the Australian Institute of Commercialisation, and Chairman of Trustees of the General Douglas MacArthur Memorial Trust. As a Company Director, Sir Leo has considerable experience at Board level and has been associated with a number of public and private sector Boards. Sir Leo was awarded an Eisenhower Fellowship in 1973, a Knight Bachelor in 1987, an Honorary Doctorate of Griffith University in 1993, and a Companion in the Order of Australia (AC) in the General Division in 2004.
Gerard Bradley
B.Comm., Dip Adv Acc., CPA., FAICD, FAIM
Deputy Chairman
Member, Accounts and Audit Committee
Member, Risk Management Committee
Member, Human Resources Committee
Appointed in 2000. Tenure 30 June 2007
Gerard Bradley is currently Under Treasurer and Under Secretary of Queensland Treasury Department, a position he has held since 1998, and has extensive experience in public sector finance gained in both the Queensland and South Australian treasury departments. He was Under Treasurer for the South Australian Department of Treasury and Finance during 1996–1998 and of Queensland Treasury during 1995–1996. Mr Bradley held various positions in Queensland Treasury from 1976–1995 encompassing responsibility for the preparation and management of the State Budget and the fiscal and economic development of Queensland. He holds Directorships with Queensland Treasury Holdings Pty Ltd and related companies, and is the Chair of the QSuper Board of Trustees.
Marian Micalizzi
B.Bus, FCA, SIA (Associate)
Chairman, Accounts and Audit Committee
Member, Risk Management Committee
Appointed in 2000. Tenure 30 June 2007
Marian Micalizzi is a chartered accountant with more than 20 years’ experience, a Company Director and a consultant in both the public and private sector. She is a former Partner of PricewaterhouseCoopers (until 2000), having been admitted as a Partner of its predecessor firm in 1986. Ms Micalizzi brings considerable expertise and knowledge of specialist corporate financial and advisory services, financial institutions’ regulation and prudential supervision, and valuation related assessments. She is also currently a Director of Queensland Investment Corporation, Enertrade, Opera Queensland, Australian Reinsurance Pool Corporation and a Member of
33
Corporations and Markets Advisory Committee, the Takeovers Panel, Independent Investment Committee of Queensland Development Fund, Fund Management Committee of the Industry Research and Development Board, and a Councillor of the Australian Institute of Company Directors (Qld Div.).
Shauna Tomkins
B.Sc., MBA
Member, Risk Management Committee
Appointed in 2000. Tenure 30 June 2007
Shauna Tomkins is a consultant who works internationally in the development and implementation of regulatory frameworks for prudential supervision and corporate regulation of deposit taking, funds management, insurance and lending institutions. Ms Tomkins has a thorough understanding of Australia’s financial system, risk management analysis, prudential supervision and corporate and structured finance. She also has a strong background in long-term policy and strategic management and planning and has a working familiarity with Government objectives and processes. Ms Tomkins is also a Member of the Advisory Committee to Queensland’s Motor Accident Insurance Commission.
Elizabeth Nosworthy
BA, LLB, LLM
Chairman, Human Resources Committee
Member, Risk Management Committee
Appointed in 1991. Resigned from Board October 2003
Elizabeth Nosworthy has more than 20 years’ experience as a commercial lawyer, specialising in banking and finance, corporations, major projects and tax-based financing arrangements before leaving the law to follow a career as a full time non-executive Director. Ms Nosworthy has considerable experience at Board level in public and private sectors and is currently Chairman of Prime Infrastructure Management Limited, Commander Communications Limited, and Stanwell Corporation Limited. She is a Director of GPT Management Limited (General Property Trust) and Ventracor Limited. Ms Nosworthy is an adjunct Professor of Law at the University of Queensland. She holds degrees in Arts and Law from the University of Queensland and a Master of Laws from London School of Economics.
Ms Nosworthy was a member of the Queensland Treasury Corporation Board since its establishment in 1991. She resigned from the Board effective 3 October 2003.
Bernie Fraser
BA, MEcon., D Univ New England (Hon), D Univ Charles Sturt (Hon)
Member, Accounts and Audit Committee
Member, Risk Management Committee
Appointed in 1999. Tenure to 30 June 2004
Bernie Fraser had a long career in the Commonwealth Public Service, particularly the Commonwealth Treasury, and extensive exposure to the superannuation industry, and domestic and global financial markets. He was appointed Secretary to the Commonwealth Treasury in September 1984 and was Governor of the Reserve Bank of Australia from 1989 to 1996. Mr Fraser is Chairman of Members Equity Bank, and President of the Government Superannuation Office (Victoria). He is also a Director of three large industry superannuation funds (ARF, STA, and Cbus). Mr Fraser has received Honorary Doctorates from the University of New England and Charles Sturt University and is an Adjunct Professor of Economics at the University of Canberra.
Mr Fraser retired from the Board at the expiry of his term on 30 June 2004.
34
Dr William Norton
B.Comm, MA (Econ), Ph.D.
Member, Risk Management Committee
Appointed in 2000. Tenure to 30 June 2004
Dr Norton held the position of Professor and Director at Macquarie University Applied Finance Centre from mid 1991 to the end of 2003. He has extensive knowledge and experience in education and research in economics and finance. Previously, Dr Norton had 23 years experience in senior positions in economics and finance at the Reserve Bank of Australia, including six years as the Head of Financial Markets. Throughout his career, he has participated in numerous professional publications on economics and finance. Dr Norton is regarded as a leader in that field, having built the Macquarie University postgraduate program in finance to a recognised world-class standard.
Dr Norton retired from the Board at the expiry of his term on 30 June 2004.
35
CORPORATE GOVERNANCE
The Board of QTC and QTC’s management team endorse and are committed to achieving high standards of corporate governance, accountability, compliance, and financial and ethical behaviour. The Board guides this commitment, which is critical for maintaining our strong market reputation, as well as our ability to achieve success as Queensland’s corporate treasury services provider. During the year, we reviewed the Principles of Good Corporate Governance and Best Practice Recommendations issued by the Australian Stock Exchange (ASX) Corporate Governance Council and the Australian Standard 8000/2003—Good Governance Principles. While these are not mandatory for QTC, QTC has implemented changes to its corporate governance practices based on the ASX principles and standards, so far as they are relevant and appropriate to QTC. Our corporate governance practices include:
| | • | QTC’s Chairman is a non-executive Director, and the Board is entirely constituted of non-executive Directors. |
| | • | The Board has its own Charter, which specifies a commitment to corporate governance, the Board’s responsibilities, operations, and the roles and responsibilities of Directors. It also provides for self assessment, and guidelines for managing conflicts of interest. |
| | • | The Board has three Committees—Risk Management Committee, Accounts and Audit Committee and Human Resources Committee—each with its own Charter and which assist in oversight and control. |
| | • | Board Directors are appointed by the Governor-in-Council, who considers each person’s qualifications and experience, and their ability to contribute to QTC’s strategic direction and performance. |
| | • | A commitment to a continuous disclosure regime with its key stakeholders. |
| | • | A Code of Conduct that applies to all staff. |
| | • | A Compliance program that drives a compliance culture with the organisation’s approved mandate, its legal obligations and code of conduct. |
| | • | A Policy and Procedures Manual that outlines the requirements for disclosure of personal interests. |
A description of QTC’s main corporate governance practices follows. All these practices, unless otherwise stated, were in place throughout 2003-04.
QTC is a ‘Corporation Sole’
QTC was established by the Queensland Treasury Corporation Act 1988 (QTC Act), as a Corporation Sole (ie, a corporation that consists solely of a nominated office holder). The Under Treasurer of Queensland is QTC’s nominated office holder.
QTC Board
The Queensland Treasury Corporation Capital Markets Board (Board) was established on 29 August 1991. Pursuant to the QTC Act, QTC has delegated its powers to the Board. QTC and the Board have agreed the terms and administrative arrangement that govern the exercise or performance of those powers and the reports by the Board to QTC.
The Board is responsible to the Under Treasurer as Corporation Sole. Its Directors meet monthly (except in January), and may meet at other times as required. Decisions are made by a majority vote of those Directors, or approved delegates, present. A minimum of four Board Directors must be present to constitute a meeting. One of the four must be the Chairman, the Under Treasurer or the Under Treasurer’s delegate.
The Board has a formal Board Charter that provides a clear framework for good corporate governance at QTC and incorporates the Board’s existing operating guidelines.
36
Appointment of Board Directors
Board Directors are appointed by the Governor-in-Council, pursuant to section 10(2) of the QTC Act. Directors are selected for their qualifications, experience, skills, strategic ability and commitment to contribute to QTC’s performance and achievement of its corporate objectives. The Governor-in-Council can, at any time, terminate the appointment of all, or any, Directors.
Board Composition
During the year, the Board comprised:
| | • | Sir Leo Hielscher (Chairman) |
| | • | Gerard Bradley (Deputy Chairman) |
| | • | Elizabeth Nosworthy (resigned 3 October 2003) |
At 30 June 2004, the terms of the Board expired. At this time, Sir Leo Hielscher, Gerard Bradley, Marian Micalizzi and Shauna Tomkins were reappointed, and Bernie Fraser and Dr Norton retired as Directors of the Board. From 1 July 2004, appointments to the Board for a new term were made. The complement of the Board from 1 July 2004 is:
| | • | Sir Leo Hielscher (Chairman) |
| | • | Gerard Bradley (Deputy Chairman) |
The Board equips QTC with diverse corporate, financial, commercial, economic and legal skills.
The tenure of all Directors is until 30 June 2007.
The profiles of the new Directors appointed from 1 July 2004 are:
Gillian Brown
LLB (Hons) University of Queensland
Grad. Dip. Applied Finance and Investment, SIA
Member, Risk Management Committee
Appointed July 2004. Tenure 30 June 2007
Gillian Brown has more than 15 years’ experience as a specialist finance lawyer and has gained extensive corporate, financing and major project experience. Ms Brown is a Partner of Minter Ellison Lawyers (admitted as Partner 1994) and currently heads the Finance practice in Queensland. Her principal areas of practice include
37
corporate finance, investment and financial services, financial markets, project/infrastructure finance, and property finance. Ms Brown has advised Government bodies on a number of project and transactional arrangements and has a working knowledge of the mechanics of Government and its objectives. She is also a Director of DBCT (Dalrymple Bay Coal Terminal) Holdings Pty Ltd and a Committee member of the Law Council of Australia.
David Coe
B.A. (Hons), LLB (University of Sydney)
Member, Risk Management Committee
Appointed July 2004. Tenure 30 June 2007
David Coe worked for five years as a lawyer specialising in international financing and leasing, before leaving the law to pursue commercial business interests. He has a diverse blend of specialist legal, corporate and financing knowledge, and extensive experience as a Company Director of a number of public and private companies. David Coe is currently Chairman and Managing Director of Allco Finance Group Limited, an Australian company that provides sophisticated financing services in both the domestic and international markets. Mr Coe is Chairman (and co-founder) of Sports and Entertainment Ltd, Chairman of the MCA (Museum of Contemporary Art in Sydney), a Director of Record Investments Limited, Rubicon Holdings Limited and Mobius Financial Processing Pty Ltd, a Board Member of the National Gallery of Australia Foundation, and the Sydney Children’s Hospital Foundation, and a Member of the Tate International Council.
Bill Shields
B. Econ (Hons) with First Class Honours in Economics
M. Ec.
Member, Risk Management Committee
Member, Accounts and Audit Committee
Appointed July 2004. Tenure 30 June 2007
Mr Shields has considerable experience in the banking and finance industry as well as government policy advice, specialising in Economics. His career responsibilities have included economic and financial market research in Australia and overseas, providing analytical and strategic advice, analysing the Australian Financial system and monetary policy, working on Australia’s exchange rate arrangements and international financial developments. Mr Shields was previously Chief Economist and Executive Director, Macquarie Bank Limited (1987-2001). In addition to Macquarie Bank, he has held positions with the Reserve Bank of Australia (1983-1985), the International Monetary Fund (1975-1983) and, prior to that, the Commonwealth Treasury. Mr Shields is a visiting Professor of Macquarie Graduate School of Management, Macquarie University; a Director of (and Chair, Audit and Compliance Committee) M-co International Limited; and Chairman of the Australia Korea Business Council.
Board Responsibilities
The QTC Board is responsible for the development of strategy, and oversight and measurement of the organisation’s financial and operational activities and performance. The Board’s primary responsibilities and corporate governance functions are set out in the Board Charter and include:
| | • | oversee QTC, including its control and accountability systems |
| | • | developing and monitoring QTC’s strategic and corporate plan, operational policy and yearly Budget |
| | • | regularly measuring financial and operational performance |
| | • | monitoring organisational performance and staff development programs |
38
| | • | monitoring and measuring the performance of QTC’s management |
| | • | monitoring key risks and risk management processes, and |
| | • | ensuring that QTC’s compliance meets best practice. |
Board Remuneration
Remuneration of Board Directors is approved by the Governor-in-Council, in accordance with approved Government procedures. Details are provided in the Notes to and forming part of the Financial Statements.
Board Committees
The Board discharges several of its responsibilities through Board Committees to assist in the execution of its duties and to allow detailed consideration of various issues. Current Committees of the Board include the Accounts and Audit Committee, Risk Management Committee and Human Resources Committee.
Each of the Committees has its own formal charter setting out the authority delegated to it by the Board and the manner in which the Committee is to operate.
Matters determined by the Committees are submitted to the Board for ratification.
Board Directors who are not a member of a particular Committee have a standing invitation to attend any Committee meeting. Management representatives may also attend Committee meetings by invitation.
QTC does not have a Nominations Committee as Board Directors are appointed by the Governor-in-Council.
Accounts and Audit Committee
The Accounts and Audit Committee was established in November 1991 to assist the Board in fulfilling its oversight responsibilities within an appropriate framework of internal control and risk management. This is achieved by reviewing and reporting to the Board on specified aspects of corporate and operational risk areas, which are set out in the Committee’s Terms of Reference and include:
| | • | compliance with laws, regulations and QTC’s own policies and procedures, and |
Until 30 June 2004, the Committee comprised three Board Directors:
| | • | Marian Micalizzi (Chairman) |
The Committee meets at least four times a year to monitor the financial accounts and audit process through active communication with management and internal and external auditors.
The Committee has observed its terms of reference and has had due regard to the Audit Committee Guidelines—Improving Accountability and Outcomes prepared by Queensland Treasury.
Risk Management Committee
The Risk Management Committee was established in its current form in December 2002 (its predecessor was the Financial Risk Management Committee) as part of a new enterprise-wide risk management structure and program. During the year, the Committee comprised the whole Board, and the Board Chairman was the Committee Chairman.
39
Until February 2004, the Committee met every second month. It now considers risk matters as part of the monthly Board meeting. The Committee monitors risk management through regular reports from the Chief Executive and a management level Risk Management Team. This enables the Board and management to identify key business and financial risks to ensure that appropriate controls and strategies are in place to effectively manage those risks.
The core responsibilities of the Committee are set out in its Terms of Reference and include:
| | • | oversee the adequacy and implementation of QTC’s enterprise-wide risk management policy and framework for the management of QTC’s significant corporate risks |
| | • | monitor and assess QTC’s organisation-wide risk profile and exposure to significant risk |
| | • | monitor and assess the adequacy of risk management policies in relation to QTC’s significant risks |
| | • | assess and review reports received from the management level Risk Management Team |
| | • | assess and make recommendations on commitment to significant transactions or projects entailing significant risks; |
| | • | assess the effectiveness of strategy and value of proposed projects or transactions in light of any significant risks, and |
| | • | monitor and evaluate the effectiveness of the management level Risk Management Team. |
Human Resources Committee
The Human Resources Committee was established in December 1992 and during the year comprised:
| | • | Elizabeth Nosworthy (Committee Chairman, until resignation October 2003), and |
Sir Leo Hielscher acted as Committee Chairman upon the resignation of Ms Nosworthy and until 30 June 2004. Prior to October 2003, the Chairman attended meetings, from time to time, on an ex-officio basis.
The Committee meets at least four times a year to consider matters relating to the management of QTC’s employees and human resources issues and human resources policy. The Committee’s role is set out in its Terms of Reference and is to review and report to the Board on:
| | • | the appropriateness of any new or amended human resources policy |
| | • | amendments to the Employment Terms and Conditions, particularly policy |
| | • | the framework for remuneration and performance reviews |
| | • | employee performance and remuneration, and |
Board Performance
The Board’s Charter and the Terms of Reference for the Accounts and Audit Committee provide that they shall undertake an annual evaluation of performance. The Terms of Reference for the Risk Management Committee and Human Resources Committee currently do not provide for a review of performance. As part of a review of the Board Committees’ Terms of Reference in the coming year, consideration will be given to providing for a review of performance of all the Board Committees.
40
Attendance at Board Meetings
The following table details the Board Directors’ attendance at Board and Committee meetings:
| | | | | | | | |
| | | Board
| | Risk Management
Committee#
| | Accounts and
Audit Committee
| | Human
Resources
Committee
|
| | | Meetings Held: 11 | | Meetings Held: 4 | | Meetings Held: 4 | | Meetings Held: 4 |
Sir Leo Hielscher | | 11 | | 4 | | | | 3 |
Gerard Bradley | | 11 | | 4 | | 4 | | 4 |
Bernie Fraser | | 8 | | 3 | | 4 | | |
Marian Micalizzi | | 11 | | 4 | | 4 | | |
Bill Norton | | 11 | | 4 | | | | |
Elizabeth Nosworthy* | | 1 | | 0 | | | | 1 |
Shauna Tomkins | | 10 | | 3 | | | | |
| * | Resigned—effective 3 October 2003 |
| # | Bi-monthly meetings July 2003 – February 2004 |
Communication to Stakeholders
QTC ensures that its key stakeholders are regularly informed of its activities and performance and any material matter pertaining to its activities or performance. This is achieved through regular meetings with, and briefings to, the Minister, the Under Treasurer, our customers, market analysts and institutional investors, as required. Corporate announcements, media releases, strategic initiatives, financial data and presentations regarding its operations are published on QTC’s website (www.qtc.qld.gov.au) for all interested stakeholders.
Ethical Standards
The Board’s corporate governance policies and practices ensure that QTC acts ethically, within appropriate law, policy and convention, and addresses the systems and processes necessary for the proper direction and the management of QTC’s business and affairs.
QTC is committed to observing high standards of integrity and fair dealing in the conduct of its business and to acting with due care, diligence and skill. Our policy requires that QTC and all employees comply with the letter and the spirit of all relevant laws and regulations, industry standards, relevant government policies and QTC’s own policies and procedures.
The Board’s charter provides that the Board is committed to ensuring the effective corporate governance of QTC and will, in performing its responsibilities and exercising its powers at all times, recognise its overriding responsibility to act honestly, fairly, diligently and in accordance with the law. The charter also sets out the standards of behaviour that the Board Directors should strive to achieve, including the obligation to discharge their duties in good faith and honestly in the best interests of QTC with the level of skill and care expected, and to avoid conflicts of interest.
During the year, an enhanced Code of Conduct for all QTC employees was drafted and provided to staff for consultation. This Code is expected to be completed and approved during the coming year.
QTC is a member of the Australian Financial Markets Association (AFMA). All QTC staff are required to adhere to the AFMA Code of Conduct. (Also see Public Sector Ethics Act Implementation, on page 45 of this report).
QTC has also established during the year a Fraud Control Policy and Procedures Manual and updated its fraud risk assessment to assist QTC to eliminate or minimise internally and externally instigated fraud against QTC and to promote ethical conduct within QTC.
41
Employee Remuneration System
QTC’s new Remuneration System is part of the integrated suite of programs that support QTC’s business strategy, and reflect the market and the environment in which QTC operates. The System aligns with the strategic direction and business goals of the organisation, the operating structure, and reinforces behaviour that is consistent with QTC’s beliefs, culture and style. The system has been designed to be as simple as possible and to ensure that QTC’s cost structure remains consistent with QTC’s corporate objectives.
The objectives of the Remuneration System are:
| | • | To encourage commitment to the achievement of the organisation’s strategic direction. |
| | • | To reinforce a team based culture, focused on delivering customer value. |
| | • | To reinforce behaviour that is consistent with QTC’s beliefs, culture and style. |
| | • | To motivate high performance. |
| | • | To ensure QTC’s cost structure remains consistent with its Government corporate treasury service provider role. |
| | • | To reward our people for their achievement and contribution. |
| | • | To contribute to the attraction and retention of key staff. |
QTC’s reward philosophy is to be market competitive and align with other large conservative financial institutions. Accordingly, QTC has set its remuneration policy line at the market median for large conservative industry organisations.
The new system comprises three parts: Base Remuneration, Team Contribution Rewards, and an Individual Performance Payment.
The Board considers the recommendations of the HR Committee and approves at their discretion the amount of the Chief Executive’s performance payment and the total pool available for distribution to eligible employees. In considering the aggregate amount recommended for payment, the Board takes into account QTC’s organisational performance, governmental requirements and environmental issues.
For details on the at-risk-incentive payments, please refer to the Consolidated Financial Statements.
Auditors
In accordance with the provisions of the Financial Administration and Audit Act 1977, the Queensland Audit Office is the external auditor for QTC. The Queensland Audit Office has the responsibility for providing Queensland’s Parliament with assurances as to the adequacy of QTC’s discharge of its financial and administrative obligations.
PricewaterhouseCoopers is QTC’s internal auditor from 1 July 2002 to 30 June 2005.
Public Sector Ethics Act implementation
Under section 23 of the Public Sector Ethics Act 1994 (Qld), QTC is required to report on action taken to comply with certain sections of the Act. In all of its business, QTC is committed to maintaining high standards of accountability and ethical behaviour.
Codes of conduct
QTC’s Employment Manual, which is available in electronic format to all employees, provides for certain standards of behaviour by employees. The Employment Manual also requires all staff to adhere to the Code of Conduct established by the Australian Financial Markets Association (AFMA), of which QTC is a member.
42
QTC recognises the importance of establishing appropriate standards of ethical conduct and communicating those standards to its employees and has, during the period under review, drafted enhancements to the Code of Conduct for employees and has consulted with employees about the enhanced Code.
Access
Both the Employment Manual and the AFMA Code of Conduct are available electronically to employees through QTC’s in-house information management system. Each employee is required, at the beginning of their employment and then annually, to declare whether they have read, are aware of, and complied with the obligations in the Employment Manual and the AFMA Code of Conduct.
Inspection
The Code of Conduct in QTC’s Employment Manual, as well as the AFMA Code of Conduct, can be reviewed by contacting QTC’s People Team.
Education and training
Training is provided to all new employees on their ethical obligations under QTC’s Employment Manual and the AFMA Code of Conduct as part of their induction process. Further training will be provided in the coming year for all employees on their ethical obligations.
Procedures and practices
QTC seeks to ensure that all employees understand and have regard to the high standards of ethical behaviour required of them in all aspects of their employment, including in their dealings with customers, other employees and service providers. For example, QTC has a policy and procedures on the appropriate level and type of entertainment expenditure and appropriate giving and receiving of gifts.
Further, QTC has a Compliance Policy and Program that sets out its commitment to observing high standards of integrity and fair dealing in the conduct of its business and to act with due care, diligence and skill. To those ends, QTC and all employees must comply with the letter and the spirit of all relevant laws, regulations, industry standards, relevant government policies and QTC’s own policies and procedures.
Every employee is required to be familiar with the laws, regulations, industry codes and QTC’s own policies and procedures that relate to their employment.
Further, QTC and all employees must ensure that any irregularities that arise are promptly resolved in a manner that minimises financial loss and protects QTC’s reputation.
Whistleblowers Protection Act 1994
The Whistleblowers Protection Act 1994 applies to QTC and protects persons who disclose, to certain entities, information about:
| | • | dangers to public health or safety, or |
| | • | dangers to the environment. |
Section 30(1) of that Act requires QTC to disclose in its annual report statistical information for the report period in respect of each type of information received about the number of disclosures received and the number of disclosures substantially verified.
43
During the year under review, QTC has not received or substantially verified any disclosures.
Privacy
QTC is committed to protecting the privacy of the personal information that it collects, under the requirements of the Privacy Act. QTC understands and appreciates that individuals are concerned about the privacy of personal information and the confidentiality and security of that information.
QTC has established a privacy plan, which is available on QTC’s website (www.qtc.qld.gov.au), that sets out the personal information that QTC holds and how it deals with that information. For information about how to access and amend your personal information, please refer to ‘Access by members of the community to QTC documents and amendments’ on page 48 of this report.
Statement of Affairs—Freedom of Information Act 1992
This Statement of Affairs is produced pursuant to section 18 of the Freedom of Information Act 1992 (Qld), which provides for the publication of a Statement of Affairs. Section 11(m) of the FOI Act provides that the FOI Act does not apply to QTC in relation to its borrowing, liability and asset management related functions.
Structure and functions
QTC’s structure and functions are outlined in the Role, Chairman’s and Chief Executive’s reports, Adding value to our Customers’ Businesses, Positioning for the Future, and Consolidated Financial Statements sections of this report.
How QTC functions affect members of the community
QTC’s primary focus is providing liability and fund management services and debt management and financial advice to public sector entities.
Our vision is: Efficient and effective financial risk management practices across our customers and the State.
Members of the community can invest in Queensland Bonds that are issued by QTC. QTC also, as the delegate of the Under Treasurer, supervises the Cooperative Housing Societies under the Financial Intermediaries Act 1996.
Arrangements to enable members of the community to participate in the formulation of QTC’s policies and exercise of QTC functions.
While no formal mechanisms are in place, QTC consults interested parties prior to formulating policies and carrying out its functions, as determined appropriate and desirable. As the State’s corporate treasury services provider, QTC does not formulate Government policy but works within the policy frameworks developed by Queensland Treasury and the Government as a whole.
Documents held by QTC
QTC holds the documents necessary to conduct its business, including documents about:
| | • | contractors, secondees and external service providers |
44
| | • | directors of QTC, related corporations and other companies |
| | • | cooperative housing societies |
| | • | public sector entities and the advice provided to them by QTC, and |
| | • | management of QTC, including corporate governance. |
Pursuant to section 11(m) of the FOI Act, QTC is not required to disclose documents in relation to its borrowing, liability and asset management-related functions.
Documents available to the public
The following QTC documents are available to the public:
| | • | Inscribed stock register (subject to provisions of Queensland Treasury Corporation Act 1988 and the Queensland Treasury Corporation Regulation 1999) |
| | • | QTC annual and half-yearly reports |
| | • | Information provided on QTC’s web site to members of the public |
| | • | Prospectuses for debt raising |
| | • | Queensland Bonds Prospectus forms |
| | • | Shelf Registration Statement, Forms 18K or 18K/A filed with the US SEC |
| | • | Documentation filed with the Luxembourg Stock Exchange, and |
| | • | Annual Securities Report, Shelf Registration Statements (for primary and secondary issuance) and any amendments, and the Supplemental Document to Shelf Registration Statement filed with the Japanese Kanto Local Finance Bureau. |
Literature available by way of subscription or free mailing services
No information is available to the public generally by way of subscription or free mailing service. From time to time, QTC provides its public sector customers with information by email.
List of Boards, committees etc whose meetings are available to the public
QTC does not have Boards or committees whose meetings are available to the public.
Access by Members of the Community to QTC Documents and Amendments
Access and amendment rights are governed by the FOI Act, Information Standard No. 42—Personal Information and the Public Records Act 2002. Further, access to the inscribed Stock Register is governed by the Queensland Treasury Corporation Act 1988 and the Queensland Treasury Corporation Regulation 1999. Access to information held by QTC as delegate of the Registrar under the Financial Intermediaries (FI) Act is also governed by the FI Act and the Financial Intermediaries Regulation 1996.
Anyone who wishes to make an application under the FOI Act, makes that application in writing and addresses it to the FOI officer Queensland Treasury Corporation, GPO Box 1096, Brisbane Qld 4001, or emails it to foiofficer@qtc.com.au or faxes it to 07 3221 4122.
If a staff member wishes to make an amendment with respect to their personal information, they should contact the relevant QTC team member or QTC’s privacy contact officer. QTC may require the staff member to verify their identity and/or provide the request for personal information in writing and to include, in that request, such information as is reasonably necessary to enable QTC to identify the information. The contact details for the privacy contact officer are telephone 07 3842 4739, fax 07 3221 4122 and email to privacyofficer@qtc.com.au.
45
Overseas Travel
Up to half of QTC’s capital requirements are raised in offshore financial markets. From time to time, these markets are visited by Board Directors and employees to transact business on behalf of QTC. All overseas travel is undertaken in accordance with the Overseas Travel Guidelines endorsed by Queensland Cabinet.
In the year under review, international travel included:
| | | | | | |
Officer
| | Country/s Visited
| | Period
| | Purpose of Visit
|
| Senior Portfolio Manager | | Germany, Spain, USA | | 8 July – 15 July 2003 | | Participate in Deutsche Bank’s Annual International Investment Mission and program with offshore investors, involving a series of meetings with offshore central banks and policy authorities |
| | | |
| Portfolio Manager | | Japan | | 11 September – 17 September 2003 | | As part of a larger delegation, meet with Japanese securities houses, financial institutions and QTC’s A$ Global Distribution Group. |
| | | |
| Deputy Premier and Treasurer, Ministerial Special Advisor-Treasury, Under Treasurer, Chief Executive, Team Leader Financial Markets | | Japan, UK, Germany, Switzerland, Canada, USA | | 15 September – 26 September 2003 | | Meet with prime global financial institutions (investors) and QTC’s A$ Global Distribution Group to discuss Queensland’s fiscal and economic position, QTC’s borrowing requirements/capital markets activities, and to gain an appreciation, from leading industry figures, of the drivers of the world economy and any implications for Queensland. |
| | | |
| Chief Executive, Team Leader Financial Markets | | Philippines, Brunei, Taiwan, Korea, Malaysia, China, Hong Kong, Singapore | | 22 November – 8 December 2003 | | Undertake a series of meetings with Asian central banks and prime financial institutions to re-establish a market presence in the Asian region and to canvass funding opportunities. |
| | | |
| Team Leader Financial Markets, Senior Portfolio Manager Financial Markets, Portfolio Manager Financial Markets | | Japan, Hong, Singapore | | 25 March 2004 – 2 April 2004 | | Participate in Deutsche Bank’s International Investment Mission, conduct a performance and activities review of QTC’s Euro-Commercial Panel, and participate in the Pacific Prospects Fixed Linked (Asian) Forum. |
| | | |
| Team Leader Financial Markets, Senior Portfolio Manager, Financial Markets | | UK, USA | | 18 April 2004 – 1 May 2004 | | Participate in Nomura’s Central Bank Seminar 2004 and conduct a performance and activities review of QTC’s A$ Global Distribution Group. |
46
QUEENSLAND’S FISCAL ENVIRONMENT
2004-05 BUDGETED OPERATING RESULT
On an accrual basis, the Queensland State Budget provided for a General Government net operating surplus of $646 million in 2004-05. The General Government forward estimates project continuing strong surpluses over the State Budget forecast horizon, consistent with the fiscal principles outlined in the Charter of Social and Fiscal Responsibility.
General Government Operating Statement
Key Financial Aggregates
(GFS Basis)
| | | | | | | | | | |
| | | 2003-04 Est. Actual $ million
| | 2004-05 Budget $ million
| | 2005-06 Projected $ million
| | 2006-07 Projected $ million
| | 2007-08 Projected $ million
|
General Government Sector: | | | | | | | | | | |
Revenue | | 24,506 | | 24,009 | | 24,765 | | 26,033 | | 27,324 |
Expenses | | 22,132 | | 23,363 | | 24,311 | | 25,560 | | 26,842 |
Net operating balance | | 2,374 | | 646 | | 454 | | 473 | | 482 |
Cash surplus/deficit | | 2,249 | | 1,059 | | 438 | | 600 | | 909 |
Capital purchases | | 2,578 | | 2,718 | | 2,690 | | 2,492 | | 2,413 |
Net worth | | 69,366 | | 72,464 | | 74,976 | | 77,670 | | 80,336 |
Source: 2004-05 Queensland Government Budget Papers
General Government Net Operating Balance
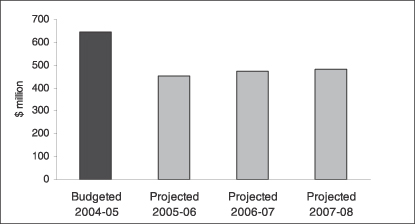
Source: 2004-05 Queensland Government Budget Papers
The 2004-05 Budget also provided for a cash surplus of $1,059 million in the General Government sector on a GFS basis.
2003-04 ESTIMATED ACTUAL RESULT
The Estimated Actual General Government net operating result, on a GFS basis for 2003-04, is a $2.374 billion surplus.
The estimated 2003-04 operating surplus reflects the continuing strength of the property market and economy generally with higher taxation revenues, increased investment returns above the long-term assumed rate of return, and upward revisions to GST payments by the Australian Government.
47
Investment market volatility impacts more on the Queensland Budget than it does for other states. This is in part due to differences in the way Queensland’s public sector superannuation arrangements are structured, with investment returns impacting directly on the operating result as an increase or decrease in revenue associated with the investment of financial assets held to meet future liabilities. If Queensland’s superannuation arrangements were structured on the same basis as that which generally applies in other states, the General Government sector underlying operating result for 2003-04 would be a surplus of $1,437 million.
Balance Sheet
Queensland continues to maintain a strong balance sheet compared with the other states. At 30 June 2005, Queensland’s estimated net debt in the General Government sector is negative, implying a strong net asset position. Queensland’s negative net debt of $3,725 per capita (net financial assets) compares to the average net debt of $253 per capita (net financial liabilities) in the other states.
Net Debt Per Capita as at 30 June 2005
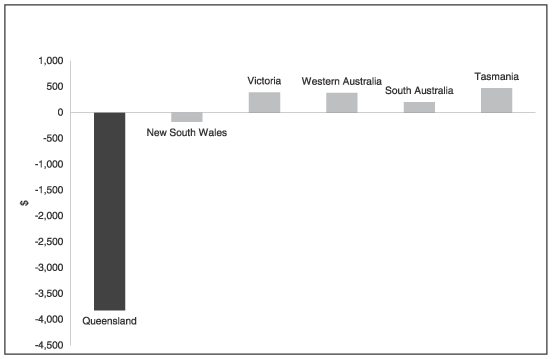
Source: 2004-05 Queensland Government Budget Papers
The State’s net financial asset position remains extremely sound. Based on current projections, the General Government sector will continue to meet the commitment in the Government’s Charter to ensure that financial assets cover all accruing and expected future liabilities in all years through to 30 June 2008.
Queensland has consistently pursued sound long-term fiscal policies such as the full funding of employee superannuation entitlements. The strong balance sheet and high levels of liquidity in the General Government sector clearly demonstrate the success of these policies.
48
Ratio of Financial Assets to Liabilities Excluding Investments in Public Trading
Enterprises as at 30 June 2005
General Government Sector
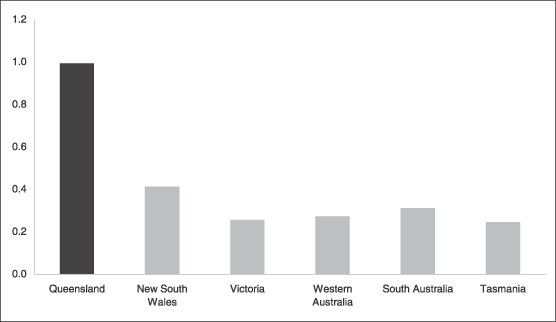
Source: 2004-05 Queensland Government Budget Papers
One of the Queensland Government’s key fiscal objectives is to maintain a competitive tax environment while raising sufficient revenue to meet the infrastructure and government service delivery needs of the people of Queensland. In 2004-05, tax collections per capita in Queensland are expected to be $1,614, which compares to an estimated average tax collection of $2,056 for the other states and territories.
Taxation Revenue Per Capita, 2004-05
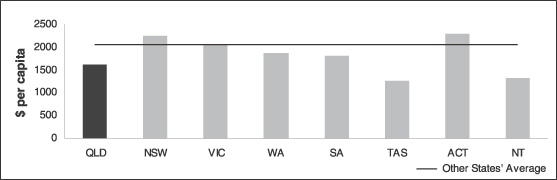
Source: 2004-05 Queensland Government Budget Papers
49
QUEENSLAND’S ECONOMIC OUTLOOK
Queensland is estimated to have recorded growth in gross state product of 4% in 2003-04, driven by the strength of the domestic sector. Household consumption is estimated to have grown at a near-record rate, with a strong housing sector and increased consumer wealth, due to the recent rapid increase in house prices, helping underpin spending on consumer durables and other retailing. As a result, Gross State Expenditure, a measure of domestic economic activity, is estimated to have grown by 8 1/2%, the strongest growth since the Expo-led boom in the late 1980s.
In contrast, net exports are anticipated to detract substantially (5 1/4 percentage points) from Queensland’s overall growth in 2003-04. Strong consumer spending, along with continued growth in business investment, has boosted growth in imports during the year. Meanwhile, the higher A$ exchange rate and the ongoing impact of the drought restrained export growth.
Queensland’s economic growth is forecast to strengthen to 4 1/4% in 2004-05. The composition of growth is also predicted to change over the coming year, with a general easing in the growth of domestic activity being more than offset by an improvement in the trade sector. Consumption growth is forecast to return to a more sustainable rate while dwelling investment is forecast to remain unchanged in 2004-05. Furthermore, net exports are anticipated to detract only one percentage point from overall growth in 2004-05, with a continued recovery in the global economy, increasing demand for commodities and a partial recovery from the drought bolstering growth in exports, while an easing in domestic demand should lead to a moderation in import growth.
Contributions to Growth in Queensland’s Gross State Product
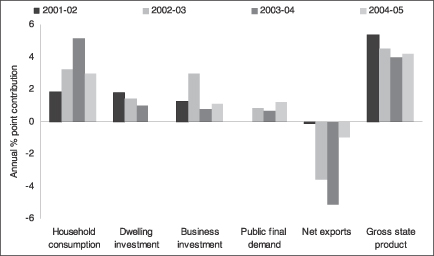
Notes:
Contributions for 2003-04 represent estimated actuals while contributions for 2004-05 represent forecasts.
Source: Queensland Treasury
Consumer Price Index (CPI) inflation in Queensland is expected to average 3% in 2003-04. Domestic pressures have driven inflation in Queensland in 2003-04, with rapid increases in housing costs contributing almost 70% of the increase in the Brisbane CPI over the year to March quarter 2004. The ongoing impact of the drought on fruit and vegetable prices and increasing health costs have also pushed the level of consumer prices higher over the year. Partially offsetting many of the domestic pressures has been the steady appreciation of the A$ until early 2004, which has put downward pressure on import prices. Inflation is forecast to moderate to 2½% in 2004-05, in line with the impact on domestic prices of an easing in drought conditions and a moderation in growth of housing activity.
50
Employment growth in Queensland has remained strong in 2003-04, reflecting the performance of many of Queensland’s labour-intensive industries. Employment is estimated to have increased by 3 1/4% (almost 60,000 jobs) in 2003-04, lowering the unemployment rate to 6¼%—its lowest year average rate in over two decades. Jobs growth of 2 1/4% is forecast to match labour force growth in 2004-05, leaving the year average unemployment rate unchanged at 6 1/4% in the coming year.
SIGNIFICANT ECONOMIC OUTCOMES DURING 2003-04
| | • | The Queensland economy is estimated to have grown by 4% in 2003-04, higher than the estimated growth of 3 3/4% nationally. |
| | • | Household consumption in Queensland is estimated to have risen by 8 1/2%, representing the highest growth rate since 1989-90. |
| | • | Total employment in Queensland is estimated to have increased by 3 1/4% in year-average terms, compared with estimated growth of 1 3/4% nationally. |
| | • | The year-average State unemployment rate is estimated to have fallen by around one percentage point to 6 1/4%, its lowest rate since 1981-82. |
| | • | Dwelling investment in Queensland continued to grow strongly in 2003-04, at 12 1/2%, more than double the rate of growth estimated nationally (6%). |
| | • | Population growth is estimated to have strengthened to 2 1/4%, compared with expected 1 1/4% growth nationally. |
Key Economic Variables 2003-04
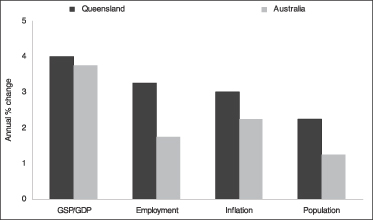
Notes:
All figures represent estimated actuals.
Source: Queensland Treasury and Commonwealth Treasury
51
CONSOLIDATED FINANCIAL STATEMENTS
For the Year Ended 30 June 2004
52
Statement of Financial Performance
For the Year Ended 30 June 2004
| | | | | | | | |
| | | Note
| | 2004
$000
| | | 2003 $000
| |
Revenue from Ordinary Activities | | | | | | | | |
Interest Income | | 2 | | 740,232 | | | 2,364,228 | |
Fees - management | | 3 | | 22,144 | | | 24,318 | |
- professional | | | | 505 | | | 873 | |
- other | | | | 452 | | | 405 | |
Amortisation of cross border lease deferred income | | | | 8,705 | | | 7,234 | |
Transfer from provision for basis risk | | | | — | | | 11,000 | |
Write back of provisions - co-operative housing societies | | | | 670 | | | 702 | |
Gain on sale of property, plant and equipment | | | | 147 | | | — | |
Other income | | | | 112 | | | 101 | |
| | | | |
|
| |
|
|
Total Revenue from Ordinary Activities | | | | 772,967 | | | 2,408,861 | |
| | | | |
|
| |
|
|
Expenses from Ordinary Activities | | | | | | | | |
Interest Expense | | 2 | | 708,176 | | | 2,323,650 | |
Administration expenses | | 4 | | 28,403 | | | 24,555 | |
Realised loan losses co-operative housing societies | | | | 558 | | | 513 | |
Loss on sale of property, plant and equipment | | | | — | | | 45 | |
| | | | |
|
| |
|
|
Total Expenses from Ordinary Activities | | | | 737,137 | | | 2,348,763 | |
| | | | |
|
| |
|
|
Operating surplus from ordinary activities before payment in lieu of income tax | | | | 35,830 | | | 60,098 | |
Payment in lieu of income tax | | 6 | | 12,553 | | | 13,176 | |
| | | | |
|
| |
|
|
Operating surplus from ordinary activities after payment in lieu of income tax | | | | 23,277 | | | 46,922 | |
| | | | |
|
| |
|
|
Total changes in equity other than those resulting from transactions with owners as owners | | | | 23,277 | | | 46,922 | |
Retained surplus at the beginning of the financial year | | | | 157,151 | | | 150,479 | |
| | | | |
|
| |
|
|
Total available for appropriation | | | | 180,428 | | | 197,401 | |
Distribution to Consolidated Fund | | | | — | | | (33,000 | ) |
Aggregate of amounts transferred to reserves | | 18 | | (11,524 | ) | | (7,250 | ) |
| | | | |
|
| |
|
|
Retained surplus at the end of the financial year | | | | 168,904 | | | 157,151 | |
| | | | |
|
| |
|
|
The accompanying notes form part of these financial statements.
| | | | |
Queensland Treasury Corporation | | Consolidated Financial Statements | | 1 |
Statement of Financial Position
As at 30 June 2004
| | | | | | |
| | | Note
| | 2004 $000
| | 2003 $000
|
Assets | | | | | | |
Cash assets | | 7 | | 168 | | 82 |
Other financial assets | | 8 | | 9,006,926 | | 7,119,399 |
Receivables | | 9 | | 37,273 | | 35,842 |
Prepayments | | | | 456 | | 378 |
Onlendings | | 10 | | 17,714,737 | | 19,670,526 |
Property, plant and equipment | | 13 | | 48,488 | | 36,740 |
Tax assets | | 6 | | 1,381 | | 3,344 |
| | | | |
| |
|
Total Assets | | | | 26,809,429 | | 26,866,311 |
| | | | |
| |
|
Liabilities | | | | | | |
Deposits | | 14 | | 4,692,442 | | 4,194,787 |
Payables | | 15 | | 168,786 | | 225,600 |
Interest bearing liabilities | | 16 | | 21,702,155 | | 22,219,443 |
Tax liabilities | | 6 | | 11,319 | | 15,188 |
Provisions | | 17 | | 2,876 | | 2,663 |
Other | | | | 8 | | 64 |
| | | | |
| |
|
Total Liabilities | | | | 26,577,586 | | 26,657,745 |
| | | | |
| |
|
Net Assets | | | | 231,843 | | 208,566 |
| | | | |
| |
|
Equity | | | | | | |
Reserves | | 18 | | 62,939 | | 51,415 |
Retained surplus | | | | 168,904 | | 157,151 |
| | | | |
| |
|
Total Equity | | | | 231,843 | | 208,566 |
| | | | |
| |
|
The accompanying notes form part of these financial statements.
| | | | |
Queensland Treasury Corporation | | Consolidated Financial Statements | | 2 |
Statement of Cash Flows
For the Year Ended 30 June 2004
| | | | | | | | | | |
| | | | | Note
| | 2004 $000
| | | 2003 $000
| |
Cash Flows from Operating Activities | | | | | | | | |
Interest income | | -onlendings | | | | 515,153 | | | 1,703,087 | |
Investment income | | -financial assets | | | | 454,745 | | | 429,932 | |
| | | -other | | | | 5,728 | | | 1,463 | |
Fees | | -management | | | | 22,186 | | | 24,113 | |
| | | -professsional | | | | 1,053 | | | 307 | |
| | | -arrangement | | | | — | | | (95 | ) |
| | | -other | | | | 453 | | | 396 | |
GST paid to suppliers | | | | (4,545 | ) | | (5,726 | ) |
GST refunds from ATO | | | | 4,848 | | | 5,116 | |
GST paid to ATO | | | | (3,007 | ) | | (3,894 | ) |
GST received from customers | | | | 2,982 | | | 3,785 | |
Interest from interest bearing liabilities | | | | (1,255,802 | ) | | (1,484,557 | ) |
Income distributions to depositors | | | | (239,078 | ) | | (166,808 | ) |
Administration expenses | | | | (27,644 | ) | | (22,338 | ) |
Payment in lieu of income tax | | | | (14,460 | ) | | (49,000 | ) |
| | | | |
|
| |
|
|
Net Cash Inflow (Outflow) from Operating Activities | | 19 | | (537,388 | ) | | 435,781 | |
| | | | |
|
| |
|
|
Cash Flows from Investing Activities | | | | | | | | |
Proceeds from sale of other financial assets | | | | 32,410,812 | | | 35,343,231 | |
Payments for other financial assets | | | | (34,374,472 | ) | | (34,778,251 | ) |
Net onlendings | | | | 1,812,726 | | | (1,125,854 | ) |
Payments for property, plant and equipment | | | | (18,656 | ) | | (30,080 | ) |
Proceeds from sale of property, plant and equipment | | | | 544 | | | 203 | |
| | | | |
|
| |
|
|
Net Cash Inflow (Outflow) from Investing Activities | | | | (169,046 | ) | | (590,751 | ) |
| | | | |
|
| |
|
|
Cash Flows from Financing Activities | | | | | | | | |
Proceeds from interest bearing liabilities | | | | 45,830,698 | | | 31,195,767 | |
Repayment of interest bearing liabilities | | | | (45,569,632 | ) | | (31,655,251 | ) |
Net deposits | | | | 478,344 | | | 614,475 | |
Fees collected on behalf of Consolidated Fund | | | | 110 | | | 14 | |
Distribution to Consolidated Fund | | | | (33,000 | ) | | — | |
| | | | |
|
| |
|
|
Net Cash Inflow (Outflow) from Financing Activities | | | | 706,520 | | | 155,005 | |
| | | | |
|
| |
|
|
Net Increase (Decrease) in Cash Held | | | | 86 | | | 35 | |
| | | | |
|
| |
|
|
Cash at the beginning of the year | | | | 82 | | | 47 | |
| | | | |
|
| |
|
|
Cash at the End of the Year | | 7 | | 168 | | | 82 | |
| | | | |
|
| |
|
|
The accompanying notes form part of these financial statements.
| | | | |
Queensland Treasury Corporation | | Consolidated Financial Statements | | 3 |
Notes to and Forming Part of the Financial Statements
For the year ended 30 June 2004
Contents
| | | | |
Note
| | | | Page
|
| 1. | | Summary of Significant Accounting Policies | | 5 |
| | |
| 2. | | Interest Income and Interest Expense | | 14 |
| | |
| 3. | | Management Fees | | 16 |
| | |
| 4. | | Administration Expenses | | 16 |
| | |
| 5. | | Average Financial Assets’ and Liabilities’ Balance and Related Interest | | 17 |
| | |
| 6. | | Payment in Lieu of Income Tax | | 19 |
| | |
| 7. | | Cash Assets | | 19 |
| | |
| 8. | | Other Financial Assets | | 20 |
| | |
| 9. | | Receivables | | 20 |
| | |
| 10. | | Onlendings | | 21 |
| | |
| 11. | | Provisions for Impaired Loans | | 21 |
| | |
| 12. | | Asset Quality | | 21 |
| | |
| 13. | | Property, Plant and Equipment | | 22 |
| | |
| 14. | | Deposits | | 23 |
| | |
| 15. | | Payables | | 23 |
| | |
| 16. | | Interest Bearing Liabilities | | 24 |
| | |
| 17. | | Provisions | | 25 |
| | |
| 18. | | Reserves | | 25 |
| | |
| 19. | | Notes to the Statement of Cash Flows | | 26 |
| | |
| 20. | | Financial Instruments and Risk Management | | 27 |
| | |
| 21. | | Maturity Analysis of Monetary Assets and Liabilities | | 32 |
| | |
| 22. | | Concentrations of Borrowings and Deposits | | 33 |
| | |
| 23. | | Contingent Liabilities | | 33 |
| | |
| 24. | | Commitments | | 34 |
| | |
| 25. | | Stock Lending | | 34 |
| | |
| 26. | | Investments in Controlled Entities | | 34 |
| | |
| 27. | | Investments in Companies | | 35 |
| | |
| 28. | | Segment Information | | 35 |
| | |
| 29. | | Funding Facilities | | 36 |
| | |
| 30. | | Remuneration of Officers | | 36 |
| | |
| 31. | | Other Director and Executive Disclosures | | 37 |
| | | | |
Queensland Treasury Corporation | | Consolidated Financial Statements | | 4 |
Notes to and Forming Part of the Financial Statements
For the year ended 30 June 2004 continued
| 1. | Summary of Significant Accounting Policies |
The principal accounting policies adopted by Queensland Treasury Corporation (QTC) are stated to assist in a general understanding of the accounts.
QTC is constituted under the Queensland Treasury Corporation Act 1988 (the “Act”) with the Under Treasurer designated as the corporation sole under section 5(2) of the Act.
The financial statements are a general purpose financial report that have been prepared in accordance with applicable Australian Accounting Standards, the Financial Management Standard 1997 issued pursuant to the Financial Administration and Audit Act 1977, and other mandatory professional reporting requirements (Urgent Issues Group Consensus Views).
| (b) | Principles of Consolidation |
QTC in preparing these financial statements does not make the division between parent entity and consolidated entities. This is because QTC is a corporation sole and all transactions are performed through either controlled or associated entities or through delegated power given to the Capital Markets Board. As a consequence, the parent entity concept for financial reporting does not provide additional information.
The accounts comprise consolidated accounts of QTC and Sunshine Locos Pty. Limited.
All internal transactions and any profits/losses resulting from these transactions together with internal contra transactions are eliminated.
The cost method of accounting is used for all acquisitions of assets. Cost is determined as the fair value of the assets given up at the date of acquisition plus costs incidental to the acquisition.
Foreign currency transactions are initially translated into Australian dollars at the rate of exchange applying at the date of the transaction. At balance date, amounts payable to and by QTC in foreign currencies have been valued using current exchange rates after taking into account interest rates and accrued interest.
In relation to borrowings covered by swaps denominated in foreign currencies, both the loan and the underlying swap are valued at the relevant swap yield existing on balance date.
Where transactions involve forward foreign exchange, the amount payable or receivable under the forward exchange contract is also adjusted to reflect forward rates of exchange applicable at balance date.
Exchange gains/losses are brought to account in the Statement of Financial Performance.
| | | | |
Queensland Treasury Corporation | | Consolidated Financial Statements | | 5 |
Notes to and Forming Part of the Financial Statements
For the year ended 30 June 2004 continued
| 1. | Summary of Significant Accounting Policies continued |
QTC’s accounting policies, including the terms and conditions of financial assets and financial liabilities are listed below.
Other Financial Assets
Other financial assets are valued at market value at balance date. Unrealised gains or losses arising from this valuation policy are brought to account in the Statement of Financial Performance.
Money market deposits are amounts of money lent to financial institutions from overnight to 7 days on which interest is paid to the lender at the end of the month.
Discount securities are instruments which are purchased at a discount. Interest and principal on these securities are paid on maturity.
Commonwealth and State securities are issued by the Commonwealth Government and the central financing authorities of each Australian State. The issuer contracts to pay the holder the face value of the security on maturity and a series of interest payments during the term to maturity.
Floating rate notes have coupons which are paid at the end of each interest period. The interest rate is set at the start of each interest period at a margin based on a short term reference interest rate.
Medium term notes are unsecured debt instruments which have either a fixed or floating coupon and a maturity tailored to meet the investor’s requirements.
Fixed interest deposits and letters of credit are amounts lent to institutions for set periods on which interest is paid to the lender based on a fixed rate.
Other investments include other bonds and debentures and futures deposits. Other bonds and debentures are securities where the face value is paid on maturity and interest payments are paid during the term to maturity. Futures deposits vary daily based on the deposit required for the open positions. Interest is paid on these deposits.
Receivables
Receivables other than the cross border lease deferred benefit are recognised at cost. The deferred benefit represents the present value of the expected future benefit.
Onlendings
Onlendings with the exception of loans to cooperative housing societies are included in the Statement of Financial Position at their redemption value which is representative of market value. The majority of onlendings are made from debt pools. Each pool is designed to match a borrowing for a given term to maturity. Refer to note 1(g). Loans to cooperative housing societies are based on the balance of each housing society’s loans to its members adjusted where necessary for a specific provision for impairment.
| | | | |
Queensland Treasury Corporation | | Consolidated Financial Statements | | 6 |
Notes to and Forming Part of the Financial Statements
For the year ended 30 June 2004 continued
| 1. | Summary of Significant Accounting Policies continued |
| (d) | Financial Instruments continued |
Repurchase Agreements
Securities which are sold under agreements to repurchase remain as an investment whilst the obligation to repurchase is disclosed as a deposit (refer note 14).
Deposits
Deposits are accepted to either the Working Capital Facility (11AM Fund) or the Cash Fund for portfolio management. Income derived from the investment of these deposits accrues to depositors daily. The amount shown in the Statement of Financial Position represents the market value of deposits held at balance date.
Stock lending and repurchase agreement deposits are accepted at an agreed interest rate and are held as security for stock lent.
Payables
Payables are recognised as amounts to be paid in the future for goods and services received whether or not billed.
Interest Bearing Liabilities
Interest bearing liabilities are recorded at market value at balance date. Any unrealised gains and losses arising from changes in market value are taken to the Statement of Financial Performance.
Treasury notes are short term discount securities where the principal and interest are paid on maturity.
Australian bonds include QTC’s domestic bonds and public bonds. Interest payments are made during the term of the bond and the face value is paid on maturity.
Credit foncier loans are loans where principal amounts and interest are paid during the course of the loan with some having balloon payments on maturity.
State Debt to the Commonwealth represents credit foncier loans made by the Commonwealth under Loan Council Agreements with the State. All loans have a floating interest rate.
Commercial paper is a negotiable short term instrument in the form of a promissory note. The paper is issued at a discount and interest and principal are paid at maturity.
Overseas bonds include global bonds and eurobonds. Interest payments are made during the term of the bonds and the face value is paid on maturity. Global bonds are Australian dollar denominated bonds issued overseas. A eurobond is any bond denominated in any currency issued outside the borrower’s domestic market.
| | | | |
Queensland Treasury Corporation | | Consolidated Financial Statements | | 7 |
Notes to and Forming Part of the Financial Statements
For the year ended 30 June 2004 continued
| 1. | Summary of Significant Accounting Policies continued |
| (d) | Financial Instruments continued |
Medium-term notes are unsecured debt instruments which have either a fixed or floating coupon and a maturity tailored to meet the investor’s requirements.
Private placements are discrete issues with interest paid during the term and the principal paid at maturity.
Derivatives
Derivatives are used to hedge either financial assets or liabilities and are recorded at market value at balance date. Gains and losses on derivatives are accounted for on the same basis as the underlying physical exposures being hedged. The market values of all derivatives are recorded as financial assets or financial liabilities in the Statement of Financial Position.
Futures contracts are agreements to buy or sell a standard quantity of a specific financial instrument at a future date at a price agreed at the outset between two parties. Futures are exchange traded.
Forward rate agreements are agreements between two parties to set an interest rate for a specified future period that will apply to a notional amount.
Forward exchange contracts are agreements between two parties to exchange the amount of one currency for an amount of another at a specific future date.
Cross currency swaps are agreements which provide for the exchange of payments denominated in one currency for those denominated in another.
Interest rate swaps are contracts in which two parties agree to make future exchanges of interest payments within the same currency. These payments are based on a common notional principal.
Credit Derivatives including credit default swaps and synthetic collateralised debt obligations are contractual agreements designed to transfer credit risk from one party to another. By synthetically creating or eliminating credit exposures, they allow institutions to more effectively manage credit risks.
The carrying value of cash assets, receivables, onlendings, payables and deposits is their net fair value. With the exception of loans to cooperative housing societies, the net fair value of other financial assets and financial liabilities is the market value which has been derived utilising accepted financial market methodologies and using quoted market rates and exchange rates at balance date. The net fair value of loans to cooperative housing societies is described in note 1(d) under Onlendings.
| | | | |
Queensland Treasury Corporation | | Consolidated Financial Statements | | 8 |
Notes to and Forming Part of the Financial Statements
For the year ended 30 June 2004 continued
| 1. | Summary of Significant Accounting Policies continued |
Lease payments on minor operating leases are charged as expenses in the period in which they are incurred. Incentives received on entering into operating leases are recognised as liabilities. Lease payments are allocated between rental expense and reduction of the liability.
Under the Debt Pool Agreements, QTC assumes debt service responsibility for loans issued in the name of participants and in turn each participant makes a quarterly debt service contribution based on the market value of their debt outstanding at the time of the agreement.
The quarterly contributions have been calculated to meet day to day interest costs of the debt pool and to extinguish the debt over an agreed period. Contributions may be varied following new loan advances or early repayment of redemption. Unrealised gains/losses in the value of debt pool liabilities each quarter are brought to account in the Statement of Financial Performance and as a decrease/increase in the asset Onlendings in the Statement of Financial Position.
The basis risk reserve has been created to provide for the probability of loss occurring due to QTC borrowings being in excess of its loans to clients. These loans are managed in either the Fixed Interest Funding Pool or Floating Rate Funding Pool. The excess borrowings are needed to enable QTC to manage debt pools and liquidity, and are hedged through the purchase of assets. Gains/losses may occur due to interest yields on borrowings not moving in exactly the same manner as interest yields on assets. Basis risk has been measured using the value at risk methodology. QTC is confident at 99% that the accumulated loss in the Fixed Interest Funding Pool over a 10 business day period will be no greater than the value of the reserve for the Fixed Interest Funding Pool. Further at 99% confidence, the accumulated loss in the Floating Rate Funding Pool over a 20 business day period will be no greater than the value of the reserve for the Floating Rate Funding Pool.
QTC’s Cash Fund and Working Capital Fund are capital guaranteed to the extent that in the event of a credit failure in any one month, QTC guarantees there will be no erosion of a customer’s capital being the deposit balance at the start of the month adjusted for any deposits or withdrawals during the month. To reduce the impact of a credit failure on retained earnings, QTC sets aside a certain proportion of its fees earned from the Cash Fund and Working Capital Fund and credits this amount to the Credit Risk Reserve. This Reserve will be utilised if the credit event results in there being a shortfall between the guaranteed capital and the investments of either Fund.
The remaining reserves are maintained for general purposes.
| | | | |
Queensland Treasury Corporation | | Consolidated Financial Statements | | 9 |
Notes to and Forming Part of the Financial Statements
For the year ended 30 June 2004 continued
| 1. | Summary of Significant Accounting Policies continued |
| (i) | Interest Income and Interest Expense |
The recognition of investment income and borrowing costs includes net realised gains/losses from the sale of investments (interest income) and the preredemption of borrowings (interest expense) together with the net unrealised gains/losses arising from holding investments and certain onlendings (interest income) and net unrealised gains/losses from borrowings (interest expense). These unrealised gains/losses are a result of revaluing to market daily.
The majority of onlendings are provided to customers on a pooled fund basis. Interest costs are allocated to customers based on the daily movement in the market value of the pooled fund. With the exception of fixed rate loans, interest charged to clients includes unrealised gains and losses (refer note 2).
Unless otherwise determined by the Governor in Council, the Queensland Treasury Corporation Act 1988 requires that all profits shall accrue to the benefit of Consolidated Fund and all losses shall be the responsibility of Consolidated Fund.
| (k) | Income Recognition – Cross Border Leases |
The portion of the cross border lease income received which is regarded as an advisory fee for the transaction is recognised on receipt. The balance of income received is deferred and amortised over the term of each lease.
| (l) | Property, Plant and Equipment |
Property, plant and equipment are included at cost and are depreciated on a straight line basis over their estimated useful lives commencing from the date of acquisition. The gain or loss on disposal of all non-current assets is determined as the difference between the written down value at the time of disposal and the proceeds on disposal, and is recognised in the Statement of Financial Performance.
| (m) | Payment in Lieu of Income Tax |
QTC is exempt from the payment of income tax under section 50-25 of the Income Tax Assessment Act 1997 (as amended).
QTC makes a payment in lieu of income tax to the Consolidated Fund. The calculation of the income tax liability is based on the income of certain activities controlled by the Capital Markets Board.
In calculating the payment in lieu of income tax expense, tax effect accounting principles are adopted for income received and expenses paid in relation to the management and administration of clients’ borrowings and deposits as well as for advisory services and structured finance transactions. A payment in lieu of income tax expense in the Statement of Financial.
| | | | |
Queensland Treasury Corporation | | Consolidated Financial Statements | | 10 |
Notes to and Forming Part of the Financial Statements
For the year ended 30 June 2004 continued
| 1. | Summary of Significant Accounting Policies continued |
| (m) | Payment in Lieu of Income Tax continued |
Performance is matched with the accounting profit after allowing for permanent differences. Income tax on net cumulative timing differences is set aside to the accounts, Provision for Deferred Income Tax and Future Income Tax Benefit at the rates which are expected to apply when the timing differences reverse. For all other QTC operations on which a payment in lieu of income tax is made, tax effect accounting principles are not applied.
QTC’s subsidiaries are defined as state and territory bodies under section 24AO of the Income Tax Assessment Act 1936 and as a consequence are exempt from Commonwealth tax under section 24AM of this Act.
Sick Leave
No provision is made for sick leave entitlements as these entitlements are not vested and the sick leave taken during any financial year is not expected to exceed normal usage of sick leave credits.
Annual Leave and Long Service Leave
Amounts payable to employees for their pro-rata entitlement to recreation leave and long service leave are accrued annually based on entitlements at the end of the year. The entitlement is reported as a liability and is the amount unpaid at reporting date at current pay rates grossed up by a payroll on-cost factor.
Contributions made by QTC to employee contributory superannuation funds (to provide benefits for employees and their dependants on retirement, disability or death) are charged to the Statement of Financial Performance. QTC is not responsible for any shortfalls.
| (p) | Acquisitions of Assets |
The cost method of accounting is used for all acquisitions of assets. Cost is determined as the fair value of the assets given up at the date of acquisition plus costs incidental to the acquisition.
| (q) | Provisions for Impaired Loans |
In recent years QTC has, at the direction of the Queensland Government, acquired loans provided to a number of cooperative housing societies at a cost equivalent to book value. At the time of acquisition, there were a number of non performing loans. Specific provisions have been made where full recovery of principal and interest are considered doubtful based on the net realisable value of the underlying security. Such loans are treated as impaired assets and categorised as non accrual loans as set out and explained in note 12.
| | | | |
Queensland Treasury Corporation | | Consolidated Financial Statements | | 11 |
Notes to and Forming Part of the Financial Statements
For the year ended 30 June 2004 continued
| 1. | Summary of Significant Accounting Policies continued |
Amounts have been rounded to the nearest thousand dollars except for note 29 which is rounded to the nearest million dollars and note 30 which is in whole dollars.
Where necessary, comparative figures have been adjusted to conform with changes in presentation in the current year.
| (t) | Adoption of Australian Equivalents to International Financial Reporting Standards |
Australia is currently preparing for the introduction of International Financial Reporting Standards (IFRS) effective for financial years commencing 1 January 2005. The adoption of Australian equivalents to IFRS will be first reflected in QTC’s financial statements for the half-year ending 31 December 2005 and the year ending 30 June 2006.
QTC’s management, along with its auditors, are assessing the significance of these changes and preparing for their implementation. An IFRS project team has been established to oversee and manage the economic entity’s transition to IFRS and to identify possible implications on policies, procedures, systems and financial impacts arising from such changes.
The transition to IFRSs for QTC involves:
| | • | Understanding the new reporting requirements and how this differs to current Australian reporting requirements |
| | • | Identifying changes relevant to QTC and understanding the impact, both financially and operationally |
| | • | Communication of these impacts to the business and other stakeholders |
| | • | Development of new internal policies and procedures to ensure compliance |
| | • | Implementing procedures to ensure that the IFRSs are fully complied with |
| | | | |
Queensland Treasury Corporation | | Consolidated Financial Statements | | 12 |
Notes to and Forming Part of the Financial Statements
For the year ended 30 June 2004 continued
| 1. | Summary of Significant Accounting Policies continued |
| (t) | Adoption of Australian Equivalents to International Financial Reporting Standards continued |
QTC’s management are of the opinion that the key areas of QTC’s accounting policies where potential differences may arise from the adoption of IFRS and which require further investigation are :
| | | | |
Potential Accounting Policy Change
| | Treatment Under IFRS
| | Treatment Under Current Accounting Policies
|
Classification of Financial Instruments | | All derivative instruments will be recorded in the balance sheet at fair value with changes in the fair value recorded in the income statement. | | The majority of financial instruments are recorded in the statement of financial position at market value. Changes in fair value are recorded in the statement of financial performance. |
| | |
Property, Plant and Equipment | | The residual values of assets and hence depreciation rates are to be reviewed annually. Revaluation increments and decrements relating to revalued property, plant and equipment will be recognised on an individual asset basis. | | Residual values are established when the asset is acquired. Due to their recent acquisition, valuation adjustments to individual or classes of assets have not been required. |
| | |
Income Tax | | Deferred tax balances are to be calculated using the “balance sheet” method, which calculates the temporary or timing differences based on the carrying amounts of an entity’s assets and liabilities in the balance sheet and their associated tax bases. | | Deferred tax balances are calculated using the income statement method, where items are only tax-effected if they are included in the determination of pre-tax accounting profit or loss and/or taxable income or loss and current and deferred taxes cannot be recognised directly in equity. Refer note 1(m). |
The above should not be regarded as a complete list of potential changes in accounting policies that may result from the transition to Australian equivalents to IFRS, as not all standards have been analysed as yet, and some decisions have not yet been made where choices of accounting policies are available.
A detailed timetable has been established to ensure that the 31 December 2005 and 30 June 2006 financial statements are fully compliant with IFRS and this is currently on schedule. The dollar values of any changes identified cannot be reliably estimated at the date of preparation of this financial report.
| | | | |
Queensland Treasury Corporation | | Consolidated Financial Statements | | 13 |
Notes to and Forming Part of the Financial Statements
For the year ended 30 June 2004 continued
| 2. | Interest Income and Interest Expense |
| | | | | | | | | | | | |
| | | For the year ended 30 June 2004
| |
| | | Interest $000
| | | Net
unrealised
gain/loss $000
| | | Net
realised
gain/loss $000
| | | Total
Interest $000
| |
Interest Income | | | | | | | | | | | | |
Australia | | | | | | | | | | | | |
Money market deposits | | 59,192 | | | (4 | ) | | — | | | 59,188 | |
Discount securities | | 177,813 | | | 68 | | | (267 | ) | | 177,614 | |
Commonwealth and State securities | | 152,578 | | | (48,811 | ) | | (63,420 | ) | | 40,347 | |
Floating rate notes | | 70,917 | | | (41 | ) | | 271 | | | 71,147 | |
Other investments | | 19, 905 | | | (2, 476 | ) | | — | | | 17,429 | |
Interest rate swaps | | (1,237 | ) | | 4,318 | | | — | | | 3,081 | |
Forward rate agreements | | — | | | (1,570 | ) | | (739 | ) | | (2,309 | ) |
Onlendings* | | 514,254 | | | (142,240 | ) | | (277 | ) | | 371,737 | |
Overseas | | | | | | | | | | | | |
Medium term notes | | — | | | — | | | — | | | — | |
Floating rate notes | | 376 | | | (5 | ) | | (1 | ) | | 370 | |
Cross currency swaps | | 1,243 | | | 10 | | | — | | | 1,253 | |
Credit derivatives | | 223 | | | 152 | | | — | | | 375 | |
| | |
|
| |
|
| |
|
| |
|
|
| | | 995,264 | | | (190,599 | ) | | (64,433 | ) | | 740,232 | |
| | |
|
| |
|
| |
|
| |
|
|
Interest Expense | | | | | | | | | | | | |
Australia | | | | | | | | | | | | |
Deposits | | 239,935 | | | (2 | ) | | — | | | 239,933 | |
Treasury notes | | 32,167 | | | (30 | ) | | (85 | ) | | 32,052 | |
Bonds | | 674,329 | | | (516,694 | ) | | 27,432 | | | 185,067 | |
Floating rate notes | | 10,503 | | | 14 | | | — | | | 10,517 | |
Credit foncier loans | | 512 | | | (391 | ) | | — | | | 121 | |
State Debt to the Commonwealth | | 5,743 | | | 286 | | | — | | | 6,029 | |
Interest rate swaps | | (47,097 | ) | | 58,887 | | | — | | | 11,790 | |
Forward rate agreements | | — | | | (76 | ) | | 2,815 | | | 2,739 | |
Futures | | — | | | 357 | | | (10,609 | ) | | (10,252 | ) |
Overseas | | | | | | | | | | | | |
Commercial paper | | 16,951 | | | (4,615 | ) | | — | | | 12,336 | |
Bonds | | 379,365 | | | (199,121 | ) | | (25,696 | ) | | 154,548 | |
Medium term notes | | 35,452 | | | (19,244 | ) | | (2,939 | ) | | 13,269 | |
Private placement | | 8,951 | | | (7,542 | ) | | (563 | ) | | 846 | |
Cross currency swaps | | 13,748 | | | (1,967 | ) | | — | | | 11,781 | |
Forward exchange contracts | | 3 | | | (91,325 | ) | | 125,917 | | | 34,595 | |
Other | | | | | | | | | | | | |
Registration and Issue Costs | | 1,819 | | | — | | | — | | | 1,819 | |
Commissions on Futures | | 986 | | | — | | | — | | | 986 | |
| | |
|
| |
|
| |
|
| |
|
|
| | | 1,373,367 | | | (781,463 | ) | | 116,272 | | | 708,176 | |
| | |
|
| |
|
| |
|
| |
|
|
| | | | |
Queensland Treasury Corporation | | Consolidated Financial Statements | | 14 |
Notes to and Forming Part of the Financial Statements
For the year ended 30 June 2004 continued
| 2. | Interest Income and Interest Expense continued |
| | | | | | | | | | | | |
| | | For the year ended 30 June 2003
| |
| | | Interest $000
| | | Net
unrealised
gain/loss $000
| | | Net
realised
gain/loss
$000
| | | Total
Interest $000
| |
Interest Income | | | | | | | | | | | | |
Australia | | | | | | | | | | | | |
Money market deposits | | 39,751 | | | 1 | | | — | | | 39,752 | |
Discount securities | | 177,654 | | | 415 | | | 77 | | | 178,146 | |
Commonwealth and State securities | | 109,017 | | | 20,493 | | | 121,679 | | | 251,189 | |
Floating rate notes | | 45,398 | | | 228 | | | — | | | 45,626 | |
Other investments | | 10,787 | | | 4,989 | | | 391 | | | 16,167 | |
Interest rate swaps | | (8,085 | ) | | 2,127 | | | — | | | (5,958 | ) |
Forward rate agreements | | — | | | 1,346 | | | 5,989 | | | 7,335 | |
Onlendings* | | 1,698,303 | | | 128,544 | | | — | | | 1,826,847 | |
Overseas | | | | | | | | | | | | |
Medium term notes | | 3,298 | | | (2,059 | ) | | (95 | ) | | 1,144 | |
Floating rate notes | | 1,100 | | | (32 | ) | | 2 | | | 1,070 | |
Cross currency swaps | | 409 | | | 2,409 | | | 92 | | | 2,910 | |
| | |
|
| |
|
| |
|
| |
|
|
| | | 2,077,632 | | | 158,461 | | | 128,135 | | | 2,364,228 | |
| | |
|
| |
|
| |
|
| |
|
|
Interest Expense | | | | | | | | | | | | |
Australia | | | | | | | | | | | | |
Deposits | | 166,527 | | | 2 | | | — | | | 166,529 | |
Treasury notes | | 38,274 | | | 31 | | | — | | | 38,305 | |
Bonds | | 753,474 | | | 444,683 | | | 178,792 | | | 1,376,949 | |
Floating rate notes | | 23,890 | | | 20 | | | — | | | 23,910 | |
Credit fonciers loans | | 535 | | | 249 | | | 10 | | | 794 | |
State Debt to the Commonwealth | | 9,015 | | | 1 | | | — | | | 9,016 | |
Interest rate swaps | | 26,625 | | | (8,428 | ) | | — | | | 18,197 | |
Forward rate agreements | | — | | | 375 | | | (581 | ) | | (206 | ) |
Futures | | — | | | (344 | ) | | (20,704 | ) | | (21,048 | ) |
Overseas | | | | | | | | | | | | |
Commercial paper | | 30,505 | | | (135,640 | ) | | — | | | (105,135 | ) |
Bonds | | 339,992 | | | 212,384 | | | 51,662 | | | 604,038 | |
Medium term notes | | 17,081 | | | 2,080 | | | 3,079 | | | 22,240 | |
Private placement | | 12,492 | | | (13,275 | ) | | 48 | | | (735 | ) |
Cross currency swaps | | 683 | | | 13,250 | | | — | | | 13,933 | |
Forward exchange contracts | | (13 | ) | | (111,410 | ) | | 285,311 | | | 173,888 | |
Other | | | | | | | | | | | | |
Registration and issue costs | | 1,825 | | | — | | | — | | | 1,825 | |
Commissions on futures | | 1,150 | | | — | | | — | | | 1,150 | |
| | |
|
| |
|
| |
|
| |
|
|
| | | 1,422,055 | | | 403,978 | | | 497,617 | | | 2,323,650 | |
| | |
|
| |
|
| |
|
| |
|
|
| * | The majority of onlendings are provided to customers on a pooled fund basis. Interest costs are allocated to customers based on the daily movement in the market value of the pooled fund. Except for fixed rate loans, the interest from onlendings figure includes unrealised gains and losses which reflects the amount charged to clients (refer note 1 (i)). |
In periods of rising interest rates, the market value of the funding pool will fall leading to lower interest income from onlendings. During the year ended 30 June 2004, interest rates increased in comparison to the previous year when rates fell, leading to a substantial decrease in interest income for the period.
| | | | |
Queensland Treasury Corporation | | Consolidated Financial Statements | | 15 |
Notes to and Forming Part of the Financial Statements
For the year ended 30 June 2004 continued
Management fees represent income earned from the management of various assets and liabilities. A further amount of $6.505 million (2003 $5.812 million) derived from interest rate margins on certain managed funds and pools has been included under interest income.
| 4. | Administration Expenses |
| | | | |
| | | 2004
$000
| | 2003
$000
|
Salaries and related costs | | 13,268 | | 12,477 |
Consultant fees (i) | | 2,675 | | 3,951 |
Outsourced services (ii) | | 1,090 | | 1,056 |
Depreciation on property, plant and equipment | | 6,511 | | 2,193 |
Computer and maintenance charges | | 664 | | 889 |
Property charges including rental | | 1,170 | | 909 |
External audit fees | | 282 | | 273 |
Internal audit fees | | 393 | | 474 |
Staff training and development | | 469 | | 312 |
Investor and market relations program | | 374 | | 381 |
Other administration expenses | | 1,507 | | 1,640 |
| | |
| |
|
| | | | | | |
| | | | | 28,403 | | 24,555 |
| | | | |
| |
|
(i) | | Consultants’ Fees | | | | |
| | | Legal costs professional/technical | | 1,152 | | 1,293 |
| | | Electricity modelling | | — | | 933 |
| | | Information technology | | 354 | | 433 |
| | | Contractors/secondment | | 524 | | 850 |
| | | Finance/accounting | | 217 | | 81 |
| | | Human resource management | | 283 | | 194 |
| | | Management | | 22 | | — |
| | | Communications | | 76 | | 91 |
| | | Other | | 47 | | 76 |
| | | | |
| |
|
| | | | | 2,675 | | 3,951 |
| | | | |
| |
|
(ii) | | Outsourced Services | | | | |
| | | Information services | | 641 | | 626 |
| | | Registry charges | | 85 | | 96 |
| | | Economic services | | 128 | | 105 |
| | | Domestic and international clearing charges | | 117 | | 125 |
| | | Bank charges | | 64 | | 53 |
| | | Other | | 55 | | 51 |
| | | | |
| |
|
| | | | | 1,090 | | 1,056 |
| | | | |
| |
|
| | | | |
Queensland Treasury Corporation | | Consolidated Financial Statements | | 16 |
Notes to and Forming Part of the Financial Statements
For the year ended 30 June 2004 continued
| 5. | Average Financial Assets’ and Liabilities’ Balance and Related Interest |
The following tables show the average balance for each of the major categories of interest earning assets and interest bearing liabilities, the amount of interest revenue or expense and the average interest rate. Averages are based on monthly balances which are representative of QTC’s operations during the relevant period. In relation to onlendings, except for fixed rate loans, total interest includes unrealised gains and losses which reflects the amount charged to clients (refer note 1(i) and note 2).
| | | | | | | |
| | | 2004
|
| | | Total
Interest $000
| | | Average
Balance
$000
| | Average
Rate
%
|
Average Assets and Interest Income | | | | | | | |
Australia | | | | | | | |
Money market deposits | | 59,192 | | | 1,229,639 | | 4.81 |
Discount securities | | 177,813 | | | 3,392,194 | | 5.24 |
Commonwealth and State securities | | 152,578 | | | 2,820,307 | | 5.41 |
Floating rate notes | | 70,917 | | | 1,298,152 | | 5.46 |
Other investments | | 19,905 | | | 226,106 | | 8.80 |
Interest rate swaps | | (1,237 | ) | | # | | # |
Onlendings | | 514,254 | | | 18,729,737 | | 2.75 |
Overseas | | | | | | | |
Medium term notes | | — | | | — | | — |
Floating rate notes | | 376 | | | 27,829 | | (1)1.35 |
Cross currency swaps | | 1,243 | | | # | | # |
Credit derivatives | | 223 | | | # | | # |
| | |
|
| | | | |
| | | 995,264 | | | | | |
| | |
|
| | | | |
Average Liabilities and Interest Expense | | | | | | | |
Australia | | | | | | | |
Deposits | | 239,935 | | | 4,702,102 | | 5.10 |
Treasury notes | | 32,167 | | | 653,711 | | 4.92 |
Bonds | | 674,329 | | | 12,926,308 | | 5.22 |
Floating rate notes | | 10,503 | | | 217,880 | | 4.82 |
Credit foncier loans | | 512 | | | 5,156 | | 9.94 |
State Debt to the Commonwealth | | 5,743 | | | 129,249 | | 4.44 |
Interest rate swaps | | (47,097 | ) | | # | | # |
Overseas | | | | | | | |
Commercial paper | | 16,951 | | | 943,576 | | (1)1.80 |
Bonds | | 379,365 | | | 6 898,515 | | 5.50 |
Medium term notes | | 35,452 | | | 758,799 | | (1)4.67 |
Private placement | | 8,951 | | | 211,259 | | (1)4.24 |
Cross currency swaps | | 13,748 | | | # | | # |
Forward contracts* | | 3 | | | # | | # |
Other | | | | | | | |
Registration and issue costs | | 1,819 | | | # | | # |
Commissions on futures | | 986 | | | # | | # |
| | |
|
| | | | |
| | | 1,373,367 | | | | | |
| | |
|
| | | | |
| * | Includes net foreign exchange loss of $0.003 million. |
| (1) | A substantial proportion of these instruments is sourced in foreign currencies. All foreign currency exposure is hedged though the use of cross currency swaps and forward exchange contracts. The net exposure to foreign currencies is detailed in note 20(d). The average interest for these instruments should be read in conjunction with interest on cross currency swaps and forward exchange contracts. |
| | | | |
Queensland Treasury Corporation | | Consolidated Financial Statements | | 17 |
Notes to and Forming Part of the Financial Statements
For the year ended 30 June 2004 continued
| 5. | Average Financial Assets’ and Liabilities’ Balance and Related Interest continued |
| | | | | | | |
| | | 2003
|
| | | Total
Interest
$000
| | | Average
Balance $000
| | Average
Rate %
|
Average Assets and Interest Income | | | | | | | |
Australia | | | | | | | |
Money market deposits | | 39,751 | | | 983,384 | | 4.04 |
Discount securities | | 177,654 | | | 3,615,495 | | 4.91 |
Commonwealth and State securities | | 109,017 | | | 1,968,264 | | 5.54 |
Floating rate notes | | 45,398 | | | 918,949 | | 4.94 |
Fixed interest deposits and letters of credit | | — | | | — | | — |
Other investments | | 10,787 | | | 163,452 | | 6.60 |
Interest rate swaps | | (8,085 | ) | | # | | # |
Forward rate agreements | | — | | | # | | # |
Onlendings | | 1,698,303 | | | 19,142,984 | | 8.87 |
Operating rights | | — | | | — | | — |
Overseas | | | | | | | |
Medium term notes | | 3,298 | | | 56,890 | | (1)5.80 |
Floating rate notes | | 1,100 | | | 55,993 | | (1)1.97 |
Cross currency swaps | | 409 | | | # | | # |
| | |
|
| | | | |
| | | 2,077,632 | | | | | |
| | |
|
| | | | |
Average Liabilities and Interest Expense | | | | | | | |
Australia | | | | | | | |
Deposits | | 166,527 | | | 3,551,606 | | 4.69 |
Treasury notes | | 38,274 | | | 837,963 | | 4.57 |
Bonds | | 753,474 | | | 13,105,972 | | 5.75 |
Floating rate notes | | 23,890 | | | 502,446 | | 4.75 |
Credit foncier loans | | 535 | | | 5,988 | | 8.93 |
State Debt to the Commonwealth | | 9,015 | | | 196,088 | | 4.60 |
Interest rate swaps | | 26,625 | | | # | | # |
Overseas | | | | | | | |
Commercial paper | | 30,505 | | | 1,415,942 | | (1)2.15 |
Bonds | | 339,992 | | | 6,088,316 | | 5.58 |
Medium term notes | | 17,081 | | | 349,994 | | (1)4.88 |
Private placement | | 12,492 | | | 262,687 | | (1)4.76 |
Cross currency swaps | | 683 | | | # | | # |
Forward contracts* | | (13 | ) | | # | | # |
Other | | | | | | | |
Registration and issue costs | | 1,825 | | | # | | # |
Commissions on futures | | 1,150 | | | # | | # |
| | |
|
| | | | |
| | | 1,422,055 | | | | | |
| | |
|
| | | | |
| * | Includes net foreign exchange loss of $0.013 million. |
| (1) | A substantial proportion of these instruments is sourced in foreign currencies. All foreign currency exposure is hedged though the use of cross currency swaps and forward exchange contracts. The net exposure to foreign currencies is detailed in note 20(d). The average interest for these instruments should be read in conjunction with interest on cross currency swaps and forward exchange contracts. |
| | | | |
Queensland Treasury Corporation | | Consolidated Financial Statements | | 18 |
Notes to and Forming Part of the Financial Statements
For the year ended 30 June 2004 continued
| 6. | Payment in Lieu of Income Tax |
| | | | | | | | |
| | | | | 2004 $000
| | | 2003 $000
| |
(a) | | The prima facie tax on operating surplus from ordinary activities is reconciled to the payment in lieu of income tax in the accounts as follows: | | | | | | |
| | | Operating surplus from ordinary activities before payment in lieu of income tax | | 35,830 | | | 60,098 | |
| | | Operating (surplus)/deficit from ordinary activities not subject to income tax (refer note 1(m)) | | 5,985 | | | (16,177 | ) |
| | | | |
|
| |
|
|
| | | Operating surplus from ordinary activities subject to income tax | | 41,815 | | | 43,921 | |
| | | | |
|
| |
|
|
| | | Prima facie amount payable on operating surplus from ordinary activities subject to income tax at 30%: | | 12,544 | | | 13,176 | |
| | | Tax effect of non-allowable items | | 9 | | | — | |
| | | | |
|
| |
|
|
| | | Payment in lieu of income tax | | 12,553 | | | 13,176 | |
| | | | |
|
| |
|
|
(b) | | Payment in lieu of income tax comprises amounts set aside as: | | | | | | |
| | | Income tax attributable to current year | | 10,927 | | | 14,385 | |
| | | Income tax attributable to future years: | | | | | | |
| | | - Provision for deferred income tax | | (336 | ) | | 382 | |
| | | - Future income tax benefit | | 1,962 | | | (1,591 | ) |
| | | | |
|
| |
|
|
| | | Payment in lieu of income tax | | 12,553 | | | 13,176 | |
| | | | |
|
| |
|
|
(c) | | Provision for income tax movement: | | | | | | |
| | | Balance at 1 July | | 14,460 | | | 49,075 | |
| | | Payment in lieu of income tax attributable to current year | | 10,927 | | | 14,385 | |
| | | Payment in lieu of income tax to Queensland Treasury | | (14,460 | ) | | (49,000 | ) |
| | | | |
|
| |
|
|
| | | Balance at 30 June | | 10,927 | | | 14,460 | |
| | | | |
|
| |
|
|
(d) | | Tax Assets: | | | | | | |
| | | Future income tax benefit | | 1,381 | | | 3,344 | |
| | | | |
|
| |
|
|
(e) | | Tax Liabilities: | | | | | | |
| | | Provision for deferred income tax | | 392 | | | 728 | |
| | | Provision for income tax | | 10,927 | | | 14,460 | |
| | | | |
|
| |
|
|
| | | | | 11,319 | | | 15,188 | |
| | | | |
|
| |
|
|
Cash Assets includes only those funds held at bank and does not include money market deposits.
| | | | |
Queensland Treasury Corporation | | Consolidated Financial Statements | | 19 |
Notes to and Forming Part of the Financial Statements
For the year ended 30 June 2004 continued
| | | | | | |
| | | 2004 $000
| | | 2003 $000
| |
Australia | | | | | | |
Money market deposits | | 1,376,788 | | | 1,099,484 | |
Discount securities | | 2,591,702 | | | 2,743,835 | |
Commonwealth and State securities* | | 3,075,319 | | | 2,108,553 | |
Floating rate notes | | 1,643,652 | | | 902, 932 | |
Other investments | | 321,121 | | | 215, 898 | |
Interest rate swaps | | (1,614 | ) | | (4, 498 | ) |
Forward rate agreements | | (207 | ) | | 1, 364 | |
Overseas | | | | | | |
Floating rate notes | | — | | | 47, 955 | |
Cross currency swaps | | — | | | 3, 876 | |
Credit derivatives | | 165 | | | — | |
| | |
|
| |
|
|
| | | 9,006,926 | | | 7,119,399 | |
| | |
|
| |
|
|
The total includes investments made to manage
| | • | deposits of $ 4,692.442 million (2003 $4,194.787 million), |
| | • | surpluses and reserves of $231.843 million (2003 $208.566 million), |
| | • | cross border lease deferred income of $153.533 million (2003 $159.580 million), |
The remaining investments are used to facilitate yield curve management or result from QTC borrowing in advance of requirements.
| * | QTC maintains holdings of its own stocks. These holdings have been excluded from both Other Financial Assets and Interest Bearing Liabilities (refer note 16). |
| | | | |
| | | 2004 $000
| | 2003 $000
|
Cross border lease deferred benefit | | 34,206 | | 33,139 |
Accrued interest and investment income | | 431 | | 674 |
GST Receivable | | 250 | | 528 |
Operating Leases | | 1,486 | | — |
Sundry debtors | | 900 | | 1, 501 |
| | |
| |
|
| | | 37,273 | | 35,842 |
| | |
| |
|
| | | | |
Queensland Treasury Corporation | | Consolidated Financial Statements | | 20 |
Notes to and Forming Part of the Financial Statements
For the year ended 30 June 2004 continued
| | | | | | | | |
| | | Note
| | 2004
$000
| | | 2003
$000
| |
Government departments and agencies | | | | 2,712,055 | | | 3,169,475 | |
Government owned corporations | | | | 10,172,148 | | | 11,260,251 | |
Local government | | | | 2,699,239 | | | 2,866,752 | |
Tollway companies | | | | 960,994 | | | 1,068,682 | |
QTC related entities(1) | | | | 490,731 | | | 542,123 | |
Statutory bodies | | | | 645,170 | | | 685,380 | |
Cooperative housing society loans | | | | 22,186 | | | 48,669 | |
Provisions for impaired loans | | 11 & 12 | | (85 | ) | | (1,616 | ) |
Other bodies | | | | 12,299 | | | 30,810 | |
| | | | |
|
| |
|
|
| | | | | 17,714,737 | | | 19,670,526 | |
| | | | |
|
| |
|
|
| (1) | Included in the above figure is an onlending to DBCT Holdings Pty Ltd to fund the purchase and lease of operating rights to the Dalrymple Bay Coal Terminal (refer note 14 and note 27). The onlending is offset by a deposit of $456 million (2003 $509 million) held by QTC on behalf of the lessee of the terminal (refer note 14). |
| 11. | Provisions for Impaired Loans |
| | | | | | |
| | | 2004
$000
| | | 2003
$000
| |
Specific Provisions | | | | | | |
Opening Balance | | 1,616 | | | 4,904 | |
Write back of provisions | | (670 | ) | | (702 | ) |
Bad debts written off | | (861 | ) | | (2,586 | ) |
| | |
|
| |
|
|
Closing Balance | | 85 | | | 1,616 | |
| | |
|
| |
|
|
Impaired assets consist of non accrual loans and restructured loans in respect of co-operative housing societies. Non accrual loans are loans for which there is reasonable doubt about the recovery of principal and interest and therefore provisions for impairment are recognised. Restructured loans consist of loans where the original contractual terms have been modified as a concession to the borrowers and revised terms are not comparable with those for new loans of similar risk.
Past due loans are loans where principal and or interest are at least 90 days in arrears but full recovery of principal and interest is expected.
| | | | |
Queensland Treasury Corporation | | Consolidated Financial Statements | | 21 |
Notes to and Forming Part of the Financial Statements
For the year ended 30 June 2004 continued
| 12. | Asset Quality continued |
The following table provides an analysis of QTC’s impaired assets and related disclosures mentioned above. There were no restructured loans at 30 June 2004.
| | | | |
| | | 2004 $000
| | 2003 $000
|
Non Accrual Loans | | | | |
With specific provisions | | 1,862 | | 5,006 |
Less specific provisions for impaired loans | | 85 | | 1,616 |
| | |
| |
|
Net non accrual loans | | 1,777 | | 3,390 |
| | |
| |
|
Past due loans | | 2,473 | | 2,172 |
| | |
| |
|
| 13. | Property, Plant and Equipment |
| | | | |
| | | 2004
$000
| | 2003
$000
|
Gross property, plant and equipment | | 60,778 | | 44,514 |
Less accumulated depreciation | | 12,290 | | 7,774 |
| | |
| |
|
Net property, plant and equipment | | 48,488 | | 36,740 |
| | |
| |
|
Represented by | | | | |
Information technology equipment | | 15,215 | | 11,112 |
Less accumulated depreciation | | 8,330 | | 5,438 |
| | |
| |
|
| | | 6,885 | | 5,674 |
| | |
| |
|
Furniture, fittings and office equipment | | 31,141 | | 32,505 |
Less accumulated depreciation | | 3,427 | | 2,106 |
| | |
| |
|
| | | 27,714 | | 30,399 |
| | |
| |
|
Property | | — | | 442 |
Less accumulated depreciation | | — | | 35 |
| | |
| |
|
| | | — | | 407 |
| | |
| |
|
Plant and Machinery | | 14,421 | | 455 |
Less accumulated depreciation | | 532 | | 195 |
| | |
| |
|
| | | 13,889 | | 260 |
| | |
| |
|
Net property, plant and equipment | | 48,488 | | 36,740 |
| | |
| |
|
| | | | |
Queensland Treasury Corporation | | Consolidated Financial Statements | | 22 |
Notes to and Forming Part of the Financial Statements
For the year ended 30 June 2004 continued
| 13. | Property, Plant and Equipment continued |
Reconciliations of the carrying amounts for each class of Property, Plant and Equipment are set out below:
| | | | | | | | | | | | | | | |
Description
| | Information
technology
equipment $000
| | | Furniture,
fittings
and office
equipment $000
| | | Property $000
| | | Plant and
Machinery $000
| | | Total $000
| |
Carrying Amount at 1/7/2003 | | 5,674 | | | 30,399 | | | 407 | | | 260 | | | 36,740 | |
Acquisitions | | 4,395 | | | 286 | | | — | | | 13,967 | | | 18,648 | |
Disposals | | (41 | ) | | — | | | (347 | ) | | — | | | (388 | ) |
Depreciation | | (3,143 | ) | | (2,971 | ) | | (60 | ) | | (338 | ) | | (6,512 | ) |
| | |
|
| |
|
| |
|
| |
|
| |
|
|
Carrying Amount at 30/6/2004 | | 6,885 | | | 27,714 | | | — | | | 13,889 | | | 48,488 | |
| | |
|
| |
|
| |
|
| |
|
| |
|
|
| | | | |
| | | 2004
$000
| | 2003
$000
|
Fund Management | | | | |
Government departments and agencies | | 1,632,048 | | 1,441,788 |
Government owned corporations | | 876,721 | | 850,653 |
Local government | | 1,066,443 | | 868,838 |
Statutory bodies | | 379,805 | | 368,682 |
QTC related entities | | 8,617 | | 33,042 |
Other depositors(1) | | 512,646 | | 585,080 |
| | |
| |
|
| | | 4,476,280 | | 4,148,083 |
Stock lending | | 216,162 | | 22,078 |
Repurchase agreements | | — | | 24,626 |
| | |
| |
|
| | | 4,692,442 | | 4,194,787 |
| | |
| |
|
| (1) | Includes a security deposit of $456 million (2003 $509 million) held on behalf of the lessee of the Dalrymple Bay Coal Terminal. |
| | | | |
| | | 2004
$000
| | 2003
$000
|
Cross border lease deferred income | | 153,533 | | 159,580 |
Distribution to Consolidated Fund | | — | | 33,000 |
Cross border lease payables | | — | | 2,659 |
Interest | | 12,515 | | 21,722 |
Administration expenses | | 2,265 | | 8,292 |
Other creditors | | 473 | | 347 |
| | |
| |
|
| | | 168,786 | | 225,600 |
| | |
| |
|
| | | | |
Queensland Treasury Corporation | | Consolidated Financial Statements | | 23 |
Notes to and Forming Part of the Financial Statements
For the year ended 30 June 2004 continued
| 16. | Interest Bearing Liabilities |
| | | | | | |
| | | 2004 $000
| | | 2003 $000
| |
Australia | | | | | | |
Treasury notes | | 29,685 | | | 1,041,672 | |
Bonds | | 12,084,409 | | | 13,279,951 | |
Floating rate notes | | 100,958 | | | 504,524 | |
Credit foncier loans | | 5,731 | | | 6,706 | |
State Debt to the Commonwealth | | 67,942 | | | 182,285 | |
Interest rate swaps | | 18,728 | | | (25,136 | ) |
Forward rate agreements | | (113 | ) | | (37 | ) |
| | |
|
| |
|
|
| | | 12,307,340 | | | 14,989,965 | |
| | |
|
| |
|
|
Overseas | | | | | | |
Commercial paper (a) | | 511,943 | | | 976,824 | |
Bonds (b) | | 8,039,105 | | | 5,231,635 | |
Medium term notes (c) | | 738,834 | | | 698,433 | |
Private placement | | 139,599 | | | 240,324 | |
Cross currency swaps | | (1,391 | ) | | 24,212 | |
Forward exchange contracts | | (33,275 | ) | | 58,050 | |
| | |
|
| |
|
|
| | | 9,394,815 | | | 7,229,478 | |
| | |
|
| |
|
|
| | | 21,702,155 | | | 22,219,443 | |
| | |
|
| |
|
|
| (a) | Includes $25.587 million (2003 $132.233 million) of commercial paper borrowed in the Euro Australian dollar commercial paper markets. |
| (b) | Consists of $8 039.105 million (2003 $5 231.635 million) of global bonds which are borrowed in the United States domestic and Euro bond markets in Australian dollars. |
| (c) | Includes $715.689 million (2003 $565.739 million) borrowed in the United States domestic and Euro medium term note markets in Australian dollars. |
The offshore sourced debt results in net exposure to the following currencies after accounting for derivatives. Details of QTC’s exposure to foreign currencies and the derivatives used to hedge this exposure are disclosed in note 20(d).
| | | | |
| | | 2004 $000
| | 2003 $000
|
Australian dollars | | 9,394,815 | | 7,229,478 |
| | |
| |
|
QTC borrowings are guaranteed by the Queensland Government under the Queensland Treasury Corporation Act 1988 and in respect of borrowings undertaken under the name of the Queensland Government Development Authority under the Statutory Bodies Financial Arrangements Act 1982. Other debt for which QTC has assumed debt service responsibility has been guaranteed under the appropriate Act which covered each borrowing at the time the loan was raised.
| | | | |
Queensland Treasury Corporation | | Consolidated Financial Statements | | 24 |
Notes to and Forming Part of the Financial Statements
For the year ended 30 June 2004 continued
| | | | |
| | | 2004
$000
| | 2003
$000
|
Employee entitlements | | 2,758 | | 2,623 |
Other | | 118 | | 40 |
| | |
| |
|
| | | 2,876 | | 2,663 |
| | |
| |
|
18. Reserves
| | | | |
| | | 2004 $000
| | 2003 $000
|
General Reserve | | | | |
Opening balance | | 39,082 | | 39,082 |
| | |
| |
|
Closing balance | | 39,082 | | 39,082 |
| | |
| |
|
Credit Risk Reserve | | | | |
Opening balance | | 5,833 | | 5,084 |
Transfer from Retained Surplus | | 3,024 | | 749 |
| | |
| |
|
Closing balance | | 8,857 | | 5,833 |
| | |
| |
|
Basis Risk Reserve | | | | |
Opening balance | | 6,500 | | — |
Transfer from Retained Surplus | | 8,500 | | 6,500 |
| | |
| |
|
Closing balance | | 15,000 | | 6,500 |
| | |
| |
|
Total Reserves | | 62,939 | | 51,415 |
| | |
| |
|
Movements during the year | | | | |
Credit Risk Reserve | | 3,024 | | 750 |
Basis Risk Reserve | | 8,500 | | 6,500 |
| | |
| |
|
| | | 11,524 | | 7,250 |
| | |
| |
|
| | | | |
Queensland Treasury Corporation | | Consolidated Financial Statements | | 25 |
Notes to and Forming Part of the Financial Statements
For the year ended 30 June 2004 continued
| 19. | Notes to the Statement of Cash Flows |
| (a) | Reconciliation of Operating Surplus after Payment in Lieu of Income Tax to Net Cash Inflow from Operating Activities |
| | | | | | |
| | | 2004 $000
| | | 2003 $000
| |
Operating surplus from ordinary activities after payment in lieu of income tax for year | | 23,277 | | | 46,922 | |
Non-cash flows in operating surplus | | | | | | |
Interest bearing liabilities net unrealised (gain) loss | | (777,435 | ) | | 404,398 | |
Interest bearing liabilities net unrealised exchange (gain) loss | | 8,752 | | | 134,076 | |
Onlendings net unrealised (gain) loss | | 142,240 | | | (128,544 | ) |
Other financial assets net unrealised (gain) loss | | 49,146 | | | (28,039 | ) |
Other financial assets net unrealised exchange (gain) loss | | 280 | | | 707 | |
Deposits net unrealised (gain) loss | | (2 | ) | | 2 | |
Depreciation of property, plant and equipment | | 6,511 | | | 2,193 | |
Net gain on sale of property, plant and equipment | | (147 | ) | | 45 | |
Realised loan losses co-operative housing societies | | 558 | | | 513 | |
Doubtful debts expense co-operative housing societies | | (670 | ) | | (702 | ) |
Changes in assets and liabilities | | | | | | |
Interest bearing liabilities net accrued interest | | 47,463 | | | (43,765 | ) |
Interest bearing liabilities net discount/premium | | (57,133 | ) | | 158,704 | |
Onlendings net accrued interest | | 670 | | | 1,394 | |
Onlendings net discount/premium | | — | | | 2,511 | |
Other financial assets net accrued interest | | (11,259 | ) | | (5,860 | ) |
Other financial assets net discount/premium | | 56,422 | | | (70,614 | ) |
Deposits net accrued interest | | 857 | | | (283 | ) |
Decrease (increase) in receivables | | (1,143 | ) | | (2,816 | ) |
Decrease (increase) in prepayments | | (75 | ) | | (40 | ) |
Increase (decrease) in payables | | (23,951 | ) | | 11,398 | |
Increase (decrease) in provisions | | 214 | | | (10,499 | ) |
Increase (decrease) in income tax equivalent payable | | (3,533 | ) | | (34,616 | ) |
Increase (decrease) in provision for deferred income tax | | (336 | ) | | 383 | |
Increase (decrease) in other liabilities | | (57 | ) | | (96 | ) |
Decrease (increase) in future income tax benefit equivalent | | 1,963 | | | (1,591 | ) |
| | |
|
| |
|
|
Net cash inflow (outflow) from operating activities | | (537,388 | ) | | 435,781 | |
| | |
|
| |
|
|
| (b) | Cash Flows Presented on a Net Basis |
Cash flows arising from the following activities are presented on a net basis in the statement of cash flows:
| | • | loan advances to and redemptions from borrowing authorities |
| | • | receipt and withdrawal of client deposits |
| | • | money market and other deposits |
| | | | |
Queensland Treasury Corporation | | Consolidated Financial Statements | | 26 |
Notes to and Forming Part of the Financial Statements
For the year ended 30 June 2004 continued
| 20. | Financial Instruments and Risk Management |
| (a) | Derivative Financial Instruments |
Derivatives namely swaps, forward rate agreements, futures and forward exchange contracts are used in the normal course of business for portfolio management purposes. They may be used to hedge exposure to fluctuations in interest rates or exchange rates, and to deliver either long term floating rate exposure or long term fixed rate exposure.
QTC is a portfolio manager and manages each portfolio based on a duration benchmark. To minimise the risk of non parallel yield curve movements, QTC allocates portfolio cash flows to a series of time periods and calculates the duration for each of these time periods against the benchmark duration for each of these periods.
QTC enters into interest rate swaps, forward rate agreements and futures contracts to assist in the management of interest rate risk.
In most instances, interest rate swaps are utilised to change the interest rate profiles of medium to long term fixed rate borrowings to floating rate borrowings at rates that are lower than those available to QTC if short term borrowings were utilised. It also ensures a medium to long term source of floating rate funding. At times, floating to fixed swaps are undertaken to generate a fixed rate term funding profile. Under interest rate swaps, QTC agrees with other parties to exchange at specified intervals the difference between fixed rate and floating rate interest amounts calculated by reference to an agreed notional principal amount.
Forward rate agreements are used by QTC to lock in a guaranteed return on known cash flows as and when they fall due or to manage the duration of a particular pool or fund.
Futures contracts are used primarily for the same purpose as forward rate agreements. These contracts have little credit risk as organised exchanges are the counterparties.
QTC’s exposure as at 30 June 2004 to interest rate risk and the effective interest rates of financial assets and financial liabilities are shown in the following table. All assets and liabilities are shown by the earlier of maturity or contractual repricing dates and at face value except for derivatives which are shown at notional amount and debt pool onlendings which are based on cash flows relating to the repayment of market value onlendings outstanding. Notional principal amounts of derivatives represent the contract or face value of these derivatives. The notional amounts do not represent amounts exchanged by parties. The amounts to be exchanged are calculated with reference to the notional principal and other terms of the derivatives including interest rates, exchange rate and securities’ prices.
The weighted average effective interest rate is the rate effective as at 30 June 2004.
| | | | |
Queensland Treasury Corporation | | Consolidated Financial Statements | | 27 |
Notes to and Forming Part of the Financial Statements
For the year ended 30 June 2004 continued
| 20. | Financial Instruments and Risk Management continued |
| (b) | Interest Rate Risk continued |
| | | | | | | | | | | | | | | | | | | | | | | | |
| | | As at 30 June 2004 Contractual repricing/maturing date
| |
Financial Instruments
| | 0 to 3 months $000
| | | 3 to 6 months $000
| | | 6 to 12 months $000
| | | 1 to 5 years $000
| | | Over 5 years $000
| | | Non interest bearing $000
| | | Total $000
| | | Weighted
average rate %
| |
Financial Assets | | | | | | | | | | | | | | | | | | | | | | | | |
Australia | | | | | | | | | | | | | | | | | | | | | | | | |
Cash Assets | | 168 | | | — | | | — | | | — | | | — | | | — | | | 168 | | | 5.39 | |
Money market deposits | | 1,371,610 | | | — | | | — | | | — | | | — | | | — | | | 1,371,610 | | | 5.36 | |
Discount securities | | 2,582,728 | | | 20,000 | | | — | | | — | | | — | | | — | | | 2,602,728 | | | 5.48 | |
Commonwealth and State securities | | — | | | — | | | — | | | 150,979 | | | 2,795,634 | | | — | | | 2,946,613 | | | 6.00 | |
Floating rate notes | | 1,633,950 | | | — | | | — | | | — | | | — | | | — | | | 1,633,950 | | | 5.77 | |
Other investments | | 22,531 | | | — | | | 20,000 | | | 250,000 | | | 25,000 | | | — | | | 317,531 | | | 5.91 | |
Receivables | | — | | | — | | | — | | | — | | | — | | | 36,843 | | | 36,843 | | | # | |
Onlendings | | (1)(532,860 | ) | | 238,665 | | | 3,741,059 | | | 2,535,610 | | | 11,732,262 | | | — | | | 17,714,736 | | | 6.15 | |
Overseas | | | | | | | | | | | | | | | | | | | | | | | | |
Floating rate notes | | — | | | — | | | — | | | — | | | — | | | — | | | — | | | | |
| | |
|
| |
|
| |
|
| |
|
| |
|
| |
|
| |
|
| | | |
Total financial assets | | 5,078,127 | | | 258,665 | | | 3,761,059 | | | 2,936,589 | | | 14,552,896 | | | 36,843 | | | 26,624,179 | | | | |
| | |
|
| |
|
| |
|
| |
|
| |
|
| |
|
| |
|
| | | |
Financial Liabilities | | | | | | | | | | | | | | | | | | | | | | | | |
Australia | | | | | | | | | | | | | | | | | | | | | | | | |
Deposits | | (4,691,480 | ) | | — | | | — | | | — | | | — | | | — | | | (4,691,480 | ) | | 5.39 | |
Payables | | — | | | — | | | — | | | — | | | — | | | (15,253 | ) | | (15,253 | ) | | # | |
Tax liabilities | | — | | | — | | | — | | | — | | | — | | | (10,927 | ) | | (10,927 | ) | | # | |
Floating rate notes | | (100,000 | ) | | — | | | — | | | — | | | — | | | — | | | (100,000 | ) | | 5.40 | |
Treasury notes | | (30,000 | ) | | — | | | — | | | — | | | — | | | — | | | (30,000 | ) | | 5.33 | |
Bonds | | (37,451 | ) | | (27,365 | ) | | (2,430,060 | ) | | (3,326,284 | ) | | (5,982,804 | ) | | — | | | (11,803,964 | ) | | 5.80 | |
Credit foncier loans | | —�� | | | (37 | ) | | (8 | ) | | (324 | ) | | (4,302 | ) | | — | | | (4,671 | ) | | 5.93 | |
State debt to the Commonwealth | | (67,650 | ) | | — | | | — | | | — | | | — | | | — | | | (67,650 | ) | | 5.29 | |
Overseas | | | | | | | | | | | | | | | | | | | | | | | | |
Commercial paper | | (513,461 | ) | | — | | | — | | | — | | | — | | | — | | | (513,461 | ) | | 2.29 | * |
Bonds | | — | | | — | | | (2,000,620 | ) | | (1,807,977 | ) | | (3,957,704 | ) | | — | | | (7,766,301 | ) | | 5.76 | |
Medium term notes | | — | | | — | | | (20,000 | ) | | (624,487 | ) | | (102,000 | ) | | — | | | (746,487 | ) | | 5.88 | * |
Private placement | | (133,514 | ) | | — | | | — | | | — | | | — | | | — | | | (133,514 | ) | | 0.04 | * |
| | |
|
| |
|
| |
|
| |
|
| |
|
| |
|
| |
|
| |
|
|
Total financial liabilities | | (5,573,556 | ) | | (27,402 | ) | | (4,450,688 | ) | | (5,759,072 | ) | | (10,046,810 | ) | | (26,180 | ) | | (25,883,708 | ) | | | |
| | |
|
| |
|
| |
|
| |
|
| |
|
| |
|
| |
|
| | | |
Derivatives | | | | | | | | | | | | | | | | | | | | | | | | |
Futures | | (743,500 | ) | | (598,000 | ) | | 1,200,000 | | | — | | | 141,500 | | | — | | | — | | | # | |
Interest rate swaps | | (4,638,593 | ) | | 285,135 | | | 2,067,000 | | | 2,726,500 | | | (366,329 | ) | | — | | | 73,713 | | | # | |
Forward rate agreements | | 350,000 | | | (350,000 | ) | | — | | | — | | | — | | | — | | | — | | | # | |
Forward exchange contracts | | 29,480 | | | 8 | | | 3,323 | | | 112 | | | — | | | — | | | 32,923 | | | # | |
Cross currency swaps | | (27,504 | ) | | — | | | — | | | 23,477 | | | — | | | — | | | (4,027 | ) | | # | |
| | |
|
| |
|
| |
|
| |
|
| |
|
| |
|
| |
|
| |
|
|
Total derivatives | | (5,030,117 | ) | | (662,857 | ) | | 3,270,323 | | | 2,750,089 | | | (224,829 | ) | | — | | | 102,609 | | | | |
| | |
|
| |
|
| |
|
| |
|
| |
|
| |
|
| |
|
| | | |
Net mismatch | | (5,525,546 | ) | | (431,594 | ) | | 2,580,694 | | | (72,394 | ) | | 4,281,257 | | | 10,663 | | | 843,080 | | | | |
| | |
|
| |
|
| |
|
| |
|
| |
|
| |
|
| |
|
| | | |
Cumulative mismatch | | (5,525,546 | ) | | (5,947,140 | ) | | (3,376,446 | ) | | (3,448,840 | ) | | 832,417 | | | 843,080 | | | | | | | |
| | |
|
| |
|
| |
|
| |
|
| |
|
| |
|
| | | | | | |
| * | The weighted average rate for foreign currency denominated securities is the closing 30 June foreign currency interest rate for the particular security. All foreign currency borrowings and investments are hedged to Australian dollars through the use of forward exchange contracts and cross currency swaps resulting in a rate close to that achieved for similar instruments denominated in Australian dollars. |
| (1) | The balance of client offset deposits held exceeds the debt outstanding in the 0-3 months maturity group. |
| | | | |
Queensland Treasury Corporation | | Consolidated Financial Statements | | 28 |
Notes to and Forming Part of the Financial Statements
For the year ended 30 June 2004 continued
| 20. | Financial Instruments and Risk Management continued |
| (b) | Interest Rate Risk continued |
| | | | | | | | | | | | | | | | | | | | | | | | |
| | | As at 30 June 2003 Contractual repricing/maturing date
| |
Financial Instruments
| | 0 to 3 months $000
| | | 3 to 6 months $000
| | | 6 to 12 months $000
| | | 1 to 5 years $000
| | | Over 5 years $000
| | | Non interest bearing $000
| | | Total $000
| | | Weighted
average rate %
| |
Financial Assets | | | | | | | | | | | | | | | | | | | | | | | | |
Australia | | | | | | | | | | | | | | | | | | | | | | | | |
Cash assets | | 82 | | | — | | | — | | | — | | | — | | | — | | | 82 | | | 4.86 | |
Money markets deposits | | 1,095,218 | | | — | | | — | | | — | | | — | | | — | | | 1,095,218 | | | 4.81 | |
Discount securities | | 2,743,654 | | | 10,000 | | | — | | | — | | | — | | | — | | | 2,753,654 | | | 4.83 | |
Commonwealth and State securities | | — | | | — | | | — | | | 501,000 | | | 1,379,834 | | | — | | | 1,880,834 | | | 4.93 | |
Floating rate notes | | 899,432 | | | — | | | — | | | — | | | — | | | — | | | 899,432 | | | 5.15 | |
Other investments | | 74,483 | | | — | | | 10 000 | | | 125,000 | | | — | | | — | | | 209,483 | | | 4.80 | |
Receivables | | — | | | — | | | — | | | — | | | — | | | 35 842 | | | 35,842 | | | # | |
Onlendings | | 225,368 | | | 318,439 | | | 496 137 | | | 6,703,813 | | | 11,941,737 | | | — | | | 19,685,494 | | | 5.44 | |
Overseas | | | | | | | | | | | | | | | | | | | | | | | | |
Floating rate notes | | — | | | 47,911 | | | — | | �� | — | | | — | | | — | | | 47,911 | | | 1.47 | * |
| | |
|
| |
|
| |
|
| |
|
| |
|
| |
|
| |
|
| |
|
|
Total financial assets | | 5,038,237 | | | 376,350 | | | 506,137 | | | 7,329,813 | | | 13,321,571 | | | 35,842 | | | 26,607,950 | | | | |
| | |
|
| |
|
| |
|
| |
|
| |
|
| |
|
| |
|
| | | |
Financial Liabilities | | | | | | | | | | | | | | | | | | | | | | | | |
Australia | | | | | | | | | | | | | | | | | | | | | | | | |
Deposits | | (4,194,681 | ) | | — | | | — | | | — | | | — | | | — | | | (4,194,681 | ) | | 4.86 | |
Payables | | — | | | — | | | — | | | — | | | — | | | (66 020 | ) | | (66,020 | ) | | # | |
Tax liabilities | | — | | | — | | | — | | | — | | | — | | | (14 460 | ) | | (14,460 | ) | | # | |
Floating rate notes | | (500,000 | ) | | — | | | — | | | — | | | — | | | — | | | (500,000 | ) | | 4.74 | |
Treasury notes | | (995,000 | ) | | (50,000 | ) | | — | | | — | | | — | | | — | | | (1,045,000 | ) | | 4.72 | |
Bonds | | (24,811 | ) | | (21,102 | ) | | (74,478 | ) | | (6,326,387 | ) | | (5,929,700 | ) | | — | | | (12,376,478 | ) | | 4.87 | |
Credit foncier loans | | (9 | ) | | (1 | ) | | (130 | ) | | (529 | ) | | (4,595 | ) | | — | | | (5,264 | ) | | 5.02 | |
State debt to the Commonwealth | | (181,019 | ) | | — | | | — | | | — | | | — | | | — | | | (181,019 | ) | | 4.54 | |
Overseas | | | | | | | | | | | | | | | | | | | | | | | | |
Commercial paper | | (653,948 | ) | | (146,353 | ) | | (180,876 | ) | | — | | | — | | | — | | | (981,177 | ) | | 1.78 | * |
Bonds | | — | | | — | | | — | | | (2,444,867 | ) | | (2,428,120 | ) | | — | | | (4,872,987 | ) | | 4.85 | |
Medium term notes | | — | | | (132,719 | ) | | — | | | (408,000 | ) | | (145,000 | ) | | — | | | (685,719 | ) | | 4.01 | * |
Private placement | | — | | | — | | | (100,051 | ) | | (125,064 | ) | | — | | | — | | | (225,115 | ) | | 0.09 | * |
| | |
|
| |
|
| |
|
| |
|
| |
|
| |
|
| |
|
| |
|
|
Total financial liabilities | | (6,549,468 | ) | | (350,175 | ) | | (355,535 | ) | | (9,304,847 | ) | | (8,507,415 | ) | | (80,480 | ) | | (25,147,920 | ) | | | |
| | |
|
| |
|
| |
|
| |
|
| |
|
| |
|
| |
|
| | | |
Derivatives | | | | | | | | | | | | | | | | | | | | | | | | |
Futures | | (934,900 | ) | | 900,000 | | | 100,000 | | | (36,400 | ) | | (28,700 | ) | | — | | | — | | | # | |
Interest rate swaps | | (462,420 | ) | | 300,000 | | | 90,000 | | | 803,000 | | | (646,329 | ) | | — | | | 84,251 | | | # | |
Forward rate agreements | | (150,000 | ) | | 150,000 | | | — | | | — | | | — | | | — | | | — | | | # | |
Forward exchange contracts | | (33,838 | ) | | (13,805 | ) | | (18,424 | ) | | 2,417 | | | — | | | — | | | (63,650 | ) | | # | |
Cross currency swaps | | (191,304 | ) | | (66,325 | ) | | 100,051 | | | 125,064 | | | — | | | — | | | (32,514 | ) | | # | |
| | |
|
| |
|
| |
|
| |
|
| |
|
| |
|
| |
|
| |
|
|
Total derivatives | | (1,772,462 | ) | | 1,269,870 | | | 271,627 | | | 894,081 | | | (675,029 | ) | | — | | | (11,913 | ) | | | |
| | |
|
| |
|
| |
|
| |
|
| |
|
| |
|
| |
|
| | | |
Net mismatch | | (3,283,694 | ) | | 1,296,045 | | | 422,229 | | | (1,080,953 | ) | | 4,139,127 | | | (44,638 | ) | | 1,448,117 | | | | |
| | |
|
| |
|
| |
|
| |
|
| |
|
| |
|
| |
|
| | | |
Cumulative mismatch | | (3,283,694 | ) | | (1,987,648 | ) | | (1,565,419 | ) | | (2,646,372 | ) | | 1,492,755 | | | 1,448,117 | | | | | | | |
| | |
|
| |
|
| |
|
| |
|
| |
|
| |
|
| |
|
| | | |
| * | The weighted average rate for foreign currency denominated securities is the closing 30 June foreign currency interest rate for the particular security. All foreign currency borrowings and investments are hedged to Australian dollars through the use of forward exchange contracts and cross currency swaps resulting in a rate close to that achieved for similar instruments denominated in Australian dollars. |
| | | | |
Queensland Treasury Corporation | | Consolidated Financial Statements | | 29 |
Notes to and Forming Part of the Financial Statements
For the year ended 30 June 2004 continued
| 20. | Financial Instruments and Risk Management continued |
Credit exposure is QTC’s estimate of its potential loss at balance date in relation to derivative contracts and investments in the event of non-performance by all counterparties. The credit exposure for derivative contracts is calculated utilising the value at risk methodology which takes into account the current market value, duration, term to maturity and interest rate and/or exchange rate volatility. The credit exposure for investments is the market value at balance date provided in note 8. Credit risk exposures related to derivative financial instruments are listed below.
| | | | |
| | | Credit Exposure
|
| | | 2004 $000
| | 2003 $000
|
Interest rate swaps | | 501,573 | | 359,536 |
Forward rate agreements | | 3,534 | | 1,128 |
Forward exchange contracts | | 126,627 | | 86,701 |
Cross currency swaps | | 24,360 | | 70,853 |
Credit derivatives | | 81,607 | | — |
Whilst there is a significant concentration of credit risk with the finance and investment industry, QTC limits exposures to individual counterparties based on the counterparty’s rating and size. Counterparties for onlendings with the exception of Suncorp-Metway Ltd, cooperative housing societies and primary producer cooperatives are principally Queensland Government sector entities for which either an explicit government guarantee exists or there is implicit government support. There is a specific Queensland Government guarantee in place for the Suncorp-Metway Ltd loans.
QTC maintains a ratings based approach in determining maximum credit exposures to counterparties. The size of the balance sheet of the counterparty and the size of its fund raising programs are also taken into account when determining limits. Counterparty exposure by rating for all derivatives and investments is listed below.
| | | | |
| | | Credit
Exposure
|
Rating
| | 2004 %
| | 2003 %
|
AAA | | 57 | | 62 |
AA+ | | 4 | | 3 |
AA | | 4 | | 6 |
AA- | | 21 | | 15 |
A+ | | 9 | | 10 |
A | | 4 | | 2 |
A- | | 1 | | 2 |
| | | | |
Queensland Treasury Corporation | | Consolidated Financial Statements | | 30 |
Notes to and Forming Part of the Financial Statements
For the year ended 30 June 2004 continued
| 20. | Financial Instruments and Risk Management continued |
| (d) | Foreign Exchange Risk Management |
QTC enters into both forward exchange contracts and cross currency swaps to manage the exposure of foreign currency borrowings and offshore investments to fluctuations in exchange rates. QTC borrows offshore to gain access to additional sources of low cost funding and to diversify its exposure to investors.
The following table summarizes the hedging effect that cross currency swaps and forward exchange contracts have had on face value offshore borrowings and investments stated in Australian Dollars.
| | | | | | | | | | | | | | | | | | | | | | | | | | | | |
| | | Borrowings
| | | Offshore Investments
| | Cross Currency Swaps
| | | Forward Exchange Contracts
| | | Net Exposure
| |
| | | 2004 $000
| | | 2003 $000
| | | 2004 $000
| | 2003 $000
| | 2004 $000
| | | 2003 $000
| | | 2004 $000
| | | 2003 $000
| | | 2004 $000
| | | 2003 $000
| |
USD | | (254,047 | ) | | (657,579 | ) | | — | | 47,907 | | — | | | (47,907 | ) | | 254,047 | | | 657,579 | | | — | | | — | |
YEN | | (133,514 | ) | | (357,834 | ) | | — | | — | | 133,514 | | | 357,834 | | | — | | | — | | | — | | | — | |
HKD | | — | | | (52,826 | ) | | — | | — | | — | | | — | | | — | | | 52,826 | | | — | | | — | |
GBP | | (65,397 | ) | | — | | | — | | — | | — | | | — | | | 65,397 | | | — | | | — | | | — | |
EUR | | (168,218 | ) | | (128,485 | ) | | — | | — | | — | | | — | | | 168,218 | | | 128,485 | | | — | | | — | |
NZD | | (23,477 | ) | | (8,739 | ) | | — | | — | | 23,477 | | | — | | | — | | | 8,739 | | | — | | | — | |
AUD | | (8,515,111 | ) | | (5,559,487 | ) | | — | | — | | (161,018 | ) | | (342,437 | ) | | (456,949 | ) | | (913,745 | ) | | (9,133,078 | ) | | (6,815,669 | ) |
Liquidity risk arises from the possibility that QTC may be unable to settle a transaction on the due date. QTC has an extensive range of funding facilities in place to prevent this situation from occurring (refer note 29).
| (f) | Risk Management Policies |
All portfolio management activities are conducted within Board approved policy. Robust systems are in place for the management of risk. Compliance is monitored closely. The financial risk management process, including credit reviews of counterparties and total credit exposure, is performed by teams separate from the teams transacting and is subject to review by the Risk Management Team (comprising management representatives) and the Risk Management Committee. The Risk Management Committee was established during 2002 and comprises the entire Board. Members of QTC’s Risk Management Team are invited to attend Committee meetings as required.
| | | | |
Queensland Treasury Corporation | | Consolidated Financial Statements | | 31 |
Notes to and Forming Part of the Financial Statements
For the year ended 30 June 2004 continued
| 21. | Maturity Analysis of Monetary Assets and Liabilities |
With the exception of debt pool onlendings and deposits, the maturity analysis below has been calculated based on cash flows relating to the repayment of the principal (face value) amount outstanding at balance date and contractual terms. Debt pool onlendings are based on cash flows relating to the payment of market value. Deposits on account of the Cash Fund and Working Capital Facility (11AM Fund) are repayable at call whilst deposits held as security for stock lending and repurchase agreements are repayable when the security is lodged with QTC.
| | | | | | | | | | | | | | |
| | | Maturity period at 30 June 2004
|
| | | At call $000
| | 0 to 3 months $000
| | 3 to 12 months $000
| | 1 to 5 years $000
| | Over 5 Years $000
| | Not
specified $000
| | Total $000
|
Assets | | | | | | | | | | | | | | |
Other financial assets | | 1,390,065 | | 2,676,803 | | 111,500 | | 1,429,955 | | 3,264,109 | | — | | 8,872,432 |
Onlendings | | — | | (1)(532,860) | | 3,979,724 | | 2,535,610 | | 11,732,262 | | — | | 17,714,736 |
| | |
| |
| |
| |
| |
| |
| |
|
Total monetary assets | | 1,390,065 | | 2,143,943 | | 4,091,224 | | 3,965,565 | | 14,996,371 | | — | | 26,587,168 |
| | |
| |
| |
| |
| |
| |
| |
|
Liabilities | | | | | | | | | | | | | | |
Deposits | | 4,476,279 | | 215,201 | | — | | — | | — | | — | | 4 691,480 |
Interest bearing liabilities | | — | | 714,426 | | 4,645,741 | | 5,759,072 | | 10,046,811 | | — | | 21,166,050 |
| | |
| |
| |
| |
| |
| |
| |
|
Total monetary liabilities | | 4,476,279 | | 929,627 | | 4,645,741 | | 5,759,072 | | 10,046,811 | | — | | 25,857,530 |
| | |
| |
| |
| |
| |
| |
| |
|
| (1) | The balance of client offset deposits held exceeds the debt outstanding in the 0-3 months maturity group. |
| | | | | | | | | | | | | | |
| | | Maturity period at 30 June 2003
|
| | | At call $000
| | 0 to 3 months
$000
| | 3 to 12 months $000
| | 1 to 5 years $000
| | Over 5 Years $000
| | Not
specified $000
| | Total $000
|
Assets | | | | | | | | | | | | | | |
Other financial assets | | 1,095,218 | | 2,904,137 | | 83,731 | | 1,053,804 | | 1,749,642 | | — | | 6,886,532 |
Onlendings | | — | | 225,368 | | 814,576 | | 6,703,813 | | 11,941,725 | | — | | 19,685,482 |
| | |
| |
| |
| |
| |
| |
| |
|
Total monetary assets | | 1,095,218 | | 3,129,505 | | 898,307 | | 7,757,617 | | 13,691,367 | | — | | 26,572,014 |
| | |
| |
| |
| |
| |
| |
| |
|
Liabilities | | | | | | | | | | | | | | |
Deposits | | 4,172,694 | | 21,987 | | — | | — | | — | | — | | 4,194,681 |
Interest bearing liabilities | | — | | 1,693,296 | | 1,299,551 | | 9,372,497 | | 8,507,416 | | — | | 20,872,760 |
| | |
| |
| |
| |
| |
| |
| |
|
Total monetary liabilities | | 4,172,694 | | 1,715,283 | | 1,299,551 | | 9,372,497 | | 8,507,416 | | — | | 25,067,441 |
| | |
| |
| |
| |
| |
| |
| |
|
| | | | |
Queensland Treasury Corporation | | Consolidated Financial Statements | | 32 |
Notes to and Forming Part of the Financial Statements
For the year ended 30 June 2004 continued
| 22. | Concentrations of Borrowings and Deposits |
There are no material concentrations of borrowings as these funds are raised from diversified sources through various facilities disclosed under funding facilities in note 29. Managed fund depositors are Queensland Government sector entities. These deposits are invested in either QTC’s Cash Fund or Working Capital Facility (11AM Fund) which have a large core of liquid investments. Deposits for Stock Lending and Repurchase Agreements are invested in the Working Capital Facility (11AM Fund) which can be liquidated daily at no cost.
| 23. | Contingent Liabilities |
The following contingent liabilities existed at balance date:
| | • | A total of $1,243 million (2003 $641 million) of Queensland Treasury Corporation inscribed stock was lent to various financial institutions. These stock loans form part of QTC’s total credit exposure to these financial institutions (refer note 25). |
| | • | With regard to certain cross border lease transactions, QTC has assumed responsibility for a significant portion of the transaction risk. If certain events occur, QTC could be liable to make additional payments under the transactions. However external advice and history to date indicate the likelihood of these events occurring is remote. In addition, QTC has provided certain guarantees and indemnities to various participants in the cross border lease transactions. Expert external advisors consider, that unless exceptional and extreme circumstances arise, QTC will not be required to make a significant payment under these guarantees and indemnities. |
| | • | To facilitate the merger of the former State owned financial institutions, Suncorp and QIDC with Metway Bank Ltd, QTC provided guarantees relating to certain obligations of the Queensland Government and Suncorp General Insurance Ltd. These guarantees are supported by counter indemnities from the Treasurer on behalf of the State of Queensland. |
| | • | QTC has provided guarantees relating to the trading activities of Ergon Energy, Energex and Enertrade, Queensland Government owned corporations, and their subsidiaries, in the National Electricity Market to the value of $320.7 million (2003 $398.9 million) which are supported by counter indemnities from these Queensland Government owned corporations. |
| | • | QTC has provided guarantees to the value of $66.5 million (2003 $132.8 million) to support the commercial activities of various Queensland public sector government entities. In each case, a counter indemnity has been obtained by QTC from the appropriate public sector entity. |
| | • | To provide support in relation to the sale by Tarong Electricity Corporation Ltd of a 50% share in the Tarong North Power Station, QTC provided a guarantee of certain payment obligations of Tarong Electricity Corporation Ltd under the transaction together with providing an irrevocable put option for 50% of the power station exercisable by the option holder under certain circumstances. This guarantee and put option are supported by an indemnity from Tarong Electricity Corporation Ltd and an indemnity from the Treasurer for and on behalf of the State of Queensland. |
| | | | |
Queensland Treasury Corporation | | Consolidated Financial Statements | | 33 |
Notes to and Forming Part of the Financial Statements
For the year ended 30 June 2004 continued
Operating Lease Commitments
| | | | |
| | | 2004 $000
| | 2003 $000
|
Payable | | | | |
Not longer than 1 year | | 992 | | 933 |
Longer than 1 year but not longer than 5 years | | 3,209 | | 3,227 |
Longer than 5 years | | 2,738 | | 3,384 |
| | |
| |
|
| | | 6,939 | | 7,544 |
| | |
| |
|
In support of an active trading and pricing market for QTC stock, QTC lends stock to various financial institutions. QTC’s stock lending policy ensures that all such transactions are covered by appropriate credit arrangements: credit limits; cash securities; or the lodgement of collateral securities.
Stock lent which forms part of QTC’s exposure to a financial institution is reported as a contingent liability (refer note 23). In situations where the financial institution does not have an approved exposure or the limit of the exposure has been reached, the financial institution must either pledge stock which has a market value 10% greater than QTC stock, or deposit cash equivalent to the market value of QTC stock lent.
At 30 June 2004, there was no stock lent (2003 nil) in return for pledged stock whilst $211 million (2003 $20.2 million) of QTC stock was lent with cash held as security. Cash held was $216.162 million (2003 $22.078 million).
| 26. | Investments in Controlled Entities |
| | | | | | | | |
Name of Entity
| | Class of Shares
| | Equity Holding
| |
| | | | | 2004
| | | 2003
| |
Sunshine Locos Pty. Limited | | Ordinary | | 100 | % | | 100 | % |
Sunshine Locos Pty Limited company has issued capital of 2 ordinary shares of $1 each with two fully paid shares on issue. The company has been dormant throughout the period.
| | | | |
Queensland Treasury Corporation | | Consolidated Financial Statements | | 34 |
Notes to and Forming Part of the Financial Statements
For the year ended 30 June 2004 continued
| 27. | Investments in Companies |
Investments in the following companies are held at cost:
| | | | | | | | | | |
Name
| | Principal Activities
| | Beneficial Interest 2004 %
| | Voting Rights 2004 %
| | Beneficial Interest 2003 %
| | Voting Rights 2003 %
|
| Queensland Treasury Holdings Pty Ltd | | Holding company for a number of subsidiaries and investments | | 40 | | 24 | | 40 | | 24 |
| | | | | |
| Nickel Resources North Queensland Pty Limited (in liquidation) * | | Management of investments | | 40 | | 24 | | 40 | | 24 |
| | | | | |
| DBCT Holdings Pty Ltd* | | Owns & leases bulk coal port facilities in North Queensland | | 20 | | 12 | | 20 | | 12 |
| | | | | |
| South East Queensland Water Corporation * | | Owns & operates bulk water storage facility in South East Queensland | | 8 | | 4.8 | | 8 | | 4.8 |
| * | Beneficial interest and voting rights in the company are held indirectly through QTC’s holdings in Queensland Treasury Holdings Pty Ltd. |
QTC operates predominantly in the finance and investment industry through liability and fund management activities. Liability management activities relate to the borrowing of funds to finance the capital works programs of the State and the management of these borrowings so as to achieve the lowest cost to borrowers. The fund management activities of QTC relate to the investment of the short term surpluses of these bodies in order to achieve the highest possible return for a given level of risk.
QTC operates in Queensland, Australia.
| | | | |
Queensland Treasury Corporation | | Consolidated Financial Statements | | 35 |
Notes to and Forming Part of the Financial Statements
For the year ended 30 June 2004 continued
| | | | | | |
Facility
| | Limit
| | Face Value on
Issue 30 June 2004 $M
| | Face Value on
Issue 30 June 2003 $M
|
Domestic Treasury Note | | Unlimited | | A$130 | | A$1,045 |
Domestic A$ Bond | | Unlimited | | A$12,720 | | A$13,053 |
Global A$ Bond | | A$10,000M | | A$7,766 | | A$4,892 |
Multicurrency US Commercial Paper | | US$1,500M | | — | | US$135 |
Multicurrency Euro Commercial Paper | | US$3,000M | | US$310 | | US$465 |
Multicurrency Euro Medium-Term Note | | US$3,000M | | US$506 | | US$417 |
Multicurrency US Medium-Term Note | | US$500M | | — | | — |
| 30. | Remuneration of Officers |
| (a) | Remuneration of Board and Committee Members |
Details of the nature and amount of each major element of the remuneration of the Board Members are:
| | | | | | | | | | | | |
| | | Salary & Fees
| | Other Benefits
| | Total
|
| | | 2004
| | 2003
| | 2004
| | 2003
| | 2004
| | 2003
|
Sir Leo Hielscher | | 69,002 | | 69,001 | | 8,094 | | 7,844 | | 77,096 | | 76,845 |
Gerard Bradley* | | 46,200 | | 46,200 | | — | | — | | 46,200 | | 46,200 |
Marian Micalizzi | | 30,085 | | 27,577 | | — | | — | | 30,085 | | 27,577 |
Bernie Fraser (retired 30 June 2004) | | 28,886 | | 28,885 | | — | | — | | 28,886 | | 28,885 |
Dr William Norton (retired 30 June 2004) | | 25,071 | | 22,981 | | — | | — | | 25,071 | | 22,981 |
Shauna Tomkins | | 25,071 | | 25,071 | | — | | — | | 25,071 | | 25,071 |
Elizabeth Nosworthy (resigned 3 October 2003) | | 10,028 | | 30,084 | | — | | — | | 10,028 | | 30,084 |
Other benefits include reimbursement of telephone expenses and the provision of a car park. The Chairman also has access to an office and secretarial support.
| * | Remuneration is paid to Queensland Treasury and remitted to the Consolidated Fund. |
| | | | |
Queensland Treasury Corporation | | Consolidated Financial Statements | | 36 |
Notes to and Forming Part of the Financial Statements
For the year ended 30 June 2004 continued
| 30. | Remuneration of Officers continued |
| (b) | Remuneration of Executive Officers |
Executive Officers are those officers who are members of the Organisation Management Team involved in the strategic direction, general management or control of the business at an organisational level.
Details of the nature and amount of each major element of the remuneration of the Executive Officers are:
| | | | | | | | | | | | |
| | | Salary & Fees
| | Other Benefits
| | Total
|
| | | 2004
| | 2003
| | 2004
| | 2003
| | 2004
| | 2003
|
Chief Executive Officer | | 431,270 | | 417,247 | | 8,229 | | 8,114 | | 439,499 | | 425,361 |
Team Leader - Financial Markets | | 288,203 | | 276,518 | | 4,202 | | 2,739 | | 292,405 | | 279,257 |
Organisational Coordinator | | 223,496 | | 215,039 | | 6,817 | | 6,680 | | 230,313 | | 221,719 |
Organisational Coordinator | | 223,496 | | 214,895 | | 6,459 | | 6,406 | | 229,955 | | 221,301 |
Organisational Coordinator | | 180,952 | | 174,030 | | 6,220 | | 6,164 | | 187,172 | | 180,194 |
Executive officers’ Salary and Fees include salary, superannuation and salary sacrificed benefits but exclude any at-risk performance payments for which they may be eligible and changes in annual leave entitlements. Other benefits include reimbursement of telephone expenses and motor vehicle costs.
| (c) | Aggregate At-Risk Performance Incentive Remuneration |
| | | | | | |
| | | Year of Assessment
|
| | | 2004
| | 2003
|
Aggregate At-Risk Performance Incentive Remuneration | | $ | 1,125,006 | | $ | 9,36,111 |
Aggregate Remuneration (including At-Risk Performance Incentive Remuneration) paid to Employees to whom a Performance Payment was paid | | $ | 11,006,455 | | $ | 9,439,258 |
Number of Employees to whom a Performance Payment was paid | | | 104 | | | 93 |
| 31. | Other Director and Executive Disclosures |
Transactions
Directors and executives held directorships with the following entities with which QTC conducted commercial transactions during the year. These transactions included the provision of investment, advisory, banking and company secretarial services and were in the normal course of business and on commercial terms and conditions.
| | • | Queensland Treasury of which Gerard Bradley is Under Treasurer |
| | • | Q Super of which Gerard Bradley is Chairman of the Board of Trustees |
| | • | Stanwell Corporation Limited of which Elizabeth Nosworthy is Chairman |
| | | | |
Queensland Treasury Corporation | | Consolidated Financial Statements | | 37 |
Notes to and Forming Part of the Financial Statements
For the year ended 30 June 2004 continued
| 31. | Other Director and Executive Disclosures continued |
| | • | General Property Trust of which Elizabeth Nosworthy is a Director of its responsible entity GPT Management Limited |
| | • | Macquarie University of which Dr William Norton was a Professor and Director of the Macquarie University Applied Finance Centre |
| | • | Prime Infrastructure Management Limited of which Elizabeth Nosworthy is Chairman |
| | • | Queensland Investment Corporation of which Marian Micalizzi is a Director |
| | • | Enertrade of which Marian Micalizzi is a Director |
| | • | Queensland Nickel Resources North Queensland Pty Ltd, Queensland Treasury Holdings Pty Ltd and SGH Limited, all controlled entities of QTC, of which Gerard Bradley, Stephen Rochester, QTC’s Chief Executive, and Neil Castles, Organisational Coordinator, are Directors |
| | • | Islander Board of Industry and Service of which Neil Castles is a Director |
| | | | |
Queensland Treasury Corporation | | Consolidated Financial Statements | | 38 |
Certificate of the Queensland Treasury Corporation
The foregoing annual financial statements have been prepared pursuant to the provisions of the Financial Administration and Audit Act 1977 and other prescribed requirements.
We certify that in our opinion:
| | (i) | the prescribed requirements for establishing and keeping the accounts have been complied with in all material respects, and |
| | (ii) | the foregoing annual financial statements have been drawn up so as to present a true and fair view, in accordance with prescribed accounting standards, of the transactions of the Queensland Treasury Corporation for the period 1 July 2003 to 30 June 2004 and of the financial position as at the close of that year. |
| | | | |
G P Garrett | | S R Rochester | | G P Bradley |
Team Leader Corporate Services | | Chief Executive | | Queensland Treasury
Corporation |
Brisbane
August 2004
| | | | |
Queensland Treasury Corporation | | Consolidated Financial Statements | | 39 |
Independent Audit Report
to Queensland Treasury Corporation
Scope
The financial statements
The financial statements of Queensland Treasury Corporation consist of the statement of financial performance, statement of financial position, statement of cash flows, notes to and forming part of the financial statements and certificates given by the Under Treasurer-Queensland Treasury as the corporation sole, Chief Executive and Team Leader Corporate Services for the year ended 30 June 2004.
The corporation sole’s responsibility
The corporation sole is responsible for the preparation and true and fair presentation of the financial statements, the maintenance of adequate accounting records and internal controls that are designed to prevent and detect fraud and error, and for the accounting policies and accounting estimates inherent in the financial statements.
Audit approach
As required by law, an independent audit was conducted in accordance with QAO Auditing Standards to enable me to provide an independent opinion whether in all material respects the financial statements are presented fairly, in accordance with the prescribed requirements, including any mandatory financial reporting requirements as approved by the Treasurer for application in Queensland.
Audit procedures included -
| | • | examining information on a test/sample basis to provide evidence supporting the amounts and disclosures in the financial statements, |
| | • | assessing the appropriateness of the accounting policies and disclosures used and the reasonableness of significant accounting estimates made by the Board, |
| | • | obtaining written confirmation regarding the material representations made in conjunction with the audit, and |
| | • | reviewing the overall presentation of information in the financial statements. |
Independence
The Financial Administration and Audit Act 1977 promotes the independence of the Auditor-General and QAO authorised auditors.
The Auditor-General is the auditor of all public sector entities and can only be removed by Parliament.
The Auditor-General may conduct an audit in any way considered appropriate and is not subject to direction by any person about the way in which powers are to be exercised.
The Auditor-General has for the purposes of conducting an audit, access to all documents and property and can report to Parliament matters which in the Auditor-General’s opinion are significant.
Audit Opinion
In accordance with section 46G of the Financial Administration and Audit Act 1977 -
| | (a) | I have received all the information and explanations which I have required; and |
| | (i) | the prescribed requirements in respect of the establishment and keeping of accounts have been complied with in all material respects; and |
| | (ii) | the statements have been drawn up so as to present a true and fair view, in accordance with the prescribed accounting standards of the transactions of the Queensland Treasury Corporation for the financial year 1 July 2003 to 30 June 2004 and of the financial position as at the end of that year. |
| | | | |
L J SCANLAN, FCPA | | | | Queensland Audit Office |
Auditor-General of Queensland | | | | Brisbane |
| | | | |
Queensland Treasury Corporation | | Consolidated Financial Statements | | 40 |
APPENDICES
93
APPENDIX A: QTC ONLENDINGS
Queensland Treasury Corporation
| | | | | | | | |
Onlendings
| | Total Debt Outstanding
(Market Value)
June 30 2003
$A’000
| | Total Debt Outstanding
(Market Value)
June 30 2004
$A’000
| | Average Expected
Term (Yrs)*
June 30 2003
| | Average Expected
Term (Yrs)*
June 30 2004
|
Bodies within the Public Accounts | | | | | | | | |
Arts Queensland | | 10,877 | | 10,318 | | 7.41 | | 6.31 |
CITEC | | 2,744 | | 2,234 | | N/A | | 1.21 |
Corptech | | — | | 1,697 | | — | | 2.45 |
Department of Aboriginal & Torres Strait Islander Policy | | 264 | | 199 | | 3.96 | | 2.96 |
Department of Corrective Services | | 224,009 | | — | | 6.86 | | — |
Department of Education and the Arts | | 145,522 | | 125,386 | | 6.86 | | 7.28 |
Department of Emergency Services | | 8,906 | | 6,785 | | 5.94 | | 5.58 |
Department of Employment and Training | | 14,573 | | 7,845 | | 3.67 | | 3.29 |
Dept of Innovation & Information Economy | | 10,523 | | — | | 9.72 | | — |
Department of Justice and Attorney General | | 5,925 | | 78,616 | | N/A | | N/A |
Department of Main Roads | | 1,080,982 | | 948,015 | | N/A | | 11.31 |
Department of Natural Resources and Mines | | 99,264 | | — | | 5.22 | | — |
Department of Primary Industries - Forestry | | 88,865 | | 85,279 | | N/A | | N/A |
Department of Public Works - Administrative Services | | 253,396 | | 256,591 | | 6.32 | | N/A |
Department of Public Works - GoPrint | | 3,465 | | 3,296 | | N/A | | N/A |
Department of Public Works - Q-Fleet | | 235,924 | | 253,918 | | N/A | | N/A |
Department of State Development and Innovation | | 77,174 | | 182,255 | | 9.93 | | N/A |
Department of the Premier and Cabinet | | 13,486 | | 12,511 | | 5.66 | | 4.64 |
Department of Tourism, Fair Trading and Wine Industry Development | | 435 | | 350 | | N/A | | N/A |
Environmental Protection Agency | | 111 | | — | | 0.61 | | — |
Monte Carlo Caravan Park Pty Ltd | | 1,112 | | 944 | | 6.72 | | 5.71 |
Moreton Institute of TAFE | | 5 | | — | | 0.09 | | — |
Open Learning Institute of TAFE | | 7 | | — | | 0.25 | | — |
Queensland Ambulance Service | | 2,706 | | 2,276 | | 6.13 | | 5.13 |
Queensland Audit Office | | 47 | | — | | 0.21 | | — |
Queensland Fire and Rescue Authority | | 9,043 | | 7,497 | | 8.04 | | 7.53 |
Queensland Health | | 623,650 | | 538,630 | | 11.82 | | 11.26 |
Queensland Police Service | | 21,624 | | — | | 8.72 | | — |
Queensland Transport | | 168,384 | | 186,708 | | 8.11 | | 7.97 |
Sales and Distribution Services | | 1,819 | | 704 | | N/A | | 2.48 |
Treasury Department | | 65,743 | | — | | 8.22 | | — |
| | |
| |
| |
| |
|
Total | | 3,170,587 | | 2,712,055 | | | | |
| | |
| |
| | | | |
Cooperative Housing Society Loans | | | | | | | | |
Cooperative Housing Society Loans | | 47,052 | | 22,101 | | N/A | | N/A |
| | |
| |
| |
| |
|
Total | | 47,052 | | 22,101 | | | | |
| | |
| |
| | | | |
Government Owned Corporations | | | | | | | | |
CS Energy Mica Creek Pty Ltd | | 146,295 | | 128,473 | | 8.84 | | 7.84 |
Bundaberg Port Authority | | 1,624 | | — | | 3.32 | | — |
Cairns Port Authority | | 60,101 | | 59,968 | | N/A | | N/A |
CS Energy Ltd | | 567,222 | | 260,247 | | N/A | | N/A |
Energex Limited | | 1,880,296 | | 1,763,344 | | N/A | | N/A |
Ergon Energy Corporation Limited | | 1,451,550 | | 1,453,261 | | N/A | | N/A |
Gateway Investments Corporation Pty Ltd | | 304,303 | | 300,437 | | N/A | | N/A |
Gladstone Port Authority | | 151,940 | | 140,377 | | N/A | | N/A |
NW Qld Water Pipeline Co. | | 14,680 | | — | | 7.05 | | — |
Port of Brisbane Corporation | | 79,693 | | 86,275 | | N/A | | N/A |
Queensland Electricity Transmission Corporation Ltd (Powerlink) | | 1,395,391 | | 1,409,910 | | N/A | | N/A |
Queensland Rail | | 3,960,185 | | 3,826,554 | | N/A | | N/A |
South East Qld Water Corporation Limited | | 208,659 | | 198,653 | | N/A | | N/A |
Stanwell Corporation Limited | | 338,207 | | 231,483 | | N/A | | N/A |
SunWater | | 9,930 | | 8,595 | | 8.04 | | 6.99 |
Tarong Energy Corporation Limited | | 684,399 | | 286,888 | | N/A | | 12.57 |
Townsville Port Authority | | 20,456 | | 17,685 | | 8.13 | | 7.06 |
| | |
| |
| |
| |
|
Total | | 11,274,931 | | 10,172,148 | | | | |
| | |
| |
| | | | |
Local Governments | | | | | | | | |
Aramac Shire Council | | 648 | | 52 | | 5.75 | | 6.40 |
Atherton Shire Council | | 2,313 | | 1,721 | | 6.38 | | 5.40 |
Aurukun Shire Council | | 266 | | — | | 0.97 | | — |
Balonne Shire Council | | 4,449 | | 4,263 | | 12.38 | | 11.42 |
Banana Shire Council | | 3,632 | | 3,079 | | 8.09 | | 7.21 |
Barcaldine Shire Council | | 989 | | 879 | | 11.44 | | 10.41 |
Bauhinia Shire Council | | 385 | | 345 | | 14.82 | | 13.70 |
Beaudesert Shire Council | | 7,369 | | 6,252 | | 7.87 | | 5.97 |
Blackall Shire Council | | 1,100 | | 1,523 | | 8.74 | | 10.37 |
Boonah Shire Council | | 2,801 | | 2,823 | | 17.29 | | 15.39 |
Booringa Shire Council | | 34 | | — | | 1.79 | | — |
Bowen Shire Council | | 14,029 | | 11,993 | | 7.97 | | 7.08 |
Brisbane City Council | | 1,124,683 | | 1,012,559 | | 12.14 | | 12.20 |
Bulloo Shire Council | | 1,103 | | 885 | | 5.37 | | 4.11 |
Bundaberg City Council | | 19,881 | | 15,593 | | 3.39 | | 2.63 |
Bungil Shire Council | | 841 | | 738 | | 9.13 | | 8.12 |
Burdekin Shire Council | | 15,023 | | 14,902 | | 8.00 | | 7.44 |
Burnett Shire Council | | 16,199 | | 15,223 | | 8.64 | | 9.16 |
Caboolture Shire Council | | 26,684 | | 23,600 | | 10.03 | | 9.15 |
Cairns City Council | | 108,686 | | 92,189 | | 6.48 | | 5.59 |
Calliope Shire Council | | — | | 4,355 | | — | | 14.60 |
Caloundra City Council | | 73,683 | | 78,402 | | 13.61 | | 13.03 |
Caloundra/Maroochy Water Supply Board | | 30,929 | | 25,625 | | 14.20 | | 14.49 |
Cambooya Shire Council | | 304 | | 244 | | 5.14 | | 4.11 |
94
| | | | | | | | |
Cardwell Shire Council | | 9,304 | | 13,793 | | 6.06 | | 11.92 |
Carpentaria Shire Council | | 2,438 | | 2,124 | | 12.29 | | 11.51 |
Chinchilla Shire Council | | 3,159 | | 2,864 | | 15.82 | | 14.76 |
Clifton Shire Council | | 286 | | 258 | | 15.23 | | 14.29 |
Cloncurry Shire Council | | 13,418 | | 10,261 | | 4.99 | | 4.30 |
Cook Shire Council | | 1,041 | | 3,085 | | 5.61 | | 17.21 |
Cooloola Shire Council | | 8,627 | | 7,342 | | 9.05 | | 8.24 |
Crow’s Nest Shire Council | | 3,880 | | 4,547 | | 10.18 | | 9.19 |
Dalby Wambo Library Board | | 41 | | 35 | | 6.98 | | 5.98 |
Dalby Wambo Salesyard Board | | — | | 244 | | — | | 19.54 |
Dalrymple Shire Council | | 2,086 | | 1,183 | | 4.65 | | 3.77 |
Diamantina Shire Council | | 504 | | 462 | | 19.31 | | 18.49 |
Douglas Shire Council | | 14,515 | | 11,552 | | 5.13 | | 4.15 |
Duaringa Shire Council | | 2,306 | | 1,761 | | 7.09 | | 6.93 |
Eacham Shire Council | | 1,821 | | 1,653 | | 11.62 | | 10.56 |
Eidsvold Shire Council | | 150 | | 41 | | 1.34 | | 0.32 |
Emerald Shire Council | | 1,693 | | 1,453 | | 7.75 | | 6.77 |
Emerald/Peak Downs Saleyards Board | | 346 | | 232 | | 13.05 | | 9.02 |
Esk Shire Council | | 6,161 | | 5,356 | | 6.95 | | 6.17 |
Esk, Gatton & Laidley Water Board | | 225 | | 31 | | 1.31 | | 1.06 |
Etheridge Shire Council | | 485 | | 439 | | 15.59 | | 14.51 |
Fitzroy Shire Council | | 4,841 | | 4,297 | | 6.01 | | 7.71 |
Gatton Shire Council | | 6,955 | | 5,799 | | 8.03 | | 7.26 |
Gayndah Shire Council | | 678 | | 536 | | 6.66 | | 6.03 |
Gladstone Calliope Aerodrome Board | | 1,248 | | 1,050 | | 6.47 | | 5.47 |
Gladstone City Council | | 28,124 | | 23,922 | | 8.41 | | 8.38 |
Gold Coast City Council | | 331,366 | | 346,889 | | 7.17 | | 7.35 |
Goondiwindi Town Council | | 4,122 | | 3,310 | | 6.28 | | 5.48 |
Goondiwindi Waggamba Community Cultural Centre Board | | 6 | | 6 | | 3.82 | | 2.89 |
Herberton Shire Council | | 308 | | 245 | | 4.94 | | 3.90 |
Hervey Bay City Council | | 57,494 | | 51,449 | | 15.53 | | 14.78 |
Hinchinbrook Shire Council | | 1,163 | | 773 | | 2.04 | | 1.06 |
Inglewood Shire Council | | 151 | | 129 | | 8.11 | | 7.21 |
Ipswich City Council | | 77,189 | | 87,400 | | N/A | | N/A |
Isis Shire Council | | 2,860 | | 2,326 | | 15.01 | | 15.73 |
Jericho Shire Council | | 944 | | 696 | | 3.89 | | 2.96 |
Johnstone Shire Council | | 17,416 | | 14,883 | | 8.54 | | 7.39 |
Jondaryan Shire Council | | 4,279 | | 5,629 | | 13.45 | | 13.48 |
Kilcoy Shire Council | | 1,088 | | 834 | | 9.27 | | 9.53 |
Kilkivan Shire Council | | 539 | | 276 | | 2.00 | | 0.99 |
Kingaroy Shire Council | | 5,960 | | 5,390 | | 5.99 | | 8.50 |
Kolan Shire Council | | 946 | | 1,321 | | 7.67 | | 12.72 |
Laidley Shire Council | | 7,680 | | 6,063 | | 6.60 | | 5.98 |
Livingstone Shire Council | | 16,386 | | 17,769 | | 9.59 | | 10.65 |
Local Government Association | | 3,398 | | — | | 15.01 | | — |
Logan City Council | | 110,179 | | 97,561 | | 7.94 | | 7.61 |
Longreach Shire Council | | 1,178 | | 839 | | 7.22 | | 6.85 |
Mackay City Council | | 48,051 | | 42,665 | | 12.15 | | 11.39 |
Mareeba Shire Council | | 12,190 | | 12,179 | | 5.99 | | 7.93 |
Maroochy Shire Council | | 166,999 | | 157,187 | | 8.31 | | 6.85 |
Maryborough City Council | | 15,443 | | 14,556 | | 7.50 | | 7.85 |
McKinlay Shire Council | | 846 | | 755 | | 14.00 | | 12.98 |
Mirani Shire Council | | 3,147 | | 2,058 | | 11.62 | | 14.87 |
Miriam Vale Shire Council | | 5,417 | | 4,658 | | 12.82 | | 12.39 |
Monto Shire Council | | 627 | | 453 | | 4.92 | | 4.36 |
Mount Morgan Shire Council | | 444 | | 213 | | 1.88 | | 0.87 |
Mount Isa City Council | | — | | 2,398 | | — | | 9.37 |
Mundubbera Shire Council | | 225 | | 144 | | 2.95 | | 2.09 |
Murgon Shire Council | | 149 | | 117 | | 4.88 | | 3.83 |
Murweh Shire Council | | 4,102 | | 3,504 | | 14.83 | | 14.71 |
Nanango Shire Council | | — | | 691 | | — | | 19.86 |
Noosa Shire Council | | 35,995 | | 34,952 | | 10.47 | | 10.16 |
Paroo Shire Council | | 515 | | 412 | | 5.06 | | 4.03 |
Pine Rivers Shire Council | | 95,184 | | 89,577 | | 7.86 | | 7.67 |
Pittsworth Shire Council | | 198 | | — | | 1.11 | | — |
Redcliffe City Council | | 13,199 | | 11,506 | | 7.69 | | 6.78 |
Redland Shire Council | | 104,874 | | 106,414 | | 7.48 | | 8.72 |
Richmond Shire Council | | 7 | | 9 | | 5.50 | | 4.72 |
Rockhampton City Council | | 34,292 | | 43,453 | | 13.15 | | 12.61 |
Rockhampton District Saleyards Board | | 2,023 | | 1,813 | | 16.91 | | 16.33 |
Roma Town Council | | 2,335 | | 2,034 | | 8.51 | | 7.45 |
Roma-Bungil Showgrounds & Saleyards Board | | 438 | | 356 | | 7.62 | | 7.04 |
Rosalie Shire Council | | 2,896 | | 2,983 | | 14.20 | | 14.30 |
Sarina Shire Council | | 11,048 | | 9,492 | | 7.43 | | 6.41 |
Seisa Island Council | | 781 | | 741 | | N/A | | N/A |
Stanthorpe Shire Council | | 1,151 | | 2,067 | | 8.23 | | 13.31 |
Tiaro Shire Council | | 384 | | 319 | | 7.23 | | 6.40 |
Toowoomba City Council | | 51,797 | | 47,796 | | 12.85 | | 11.99 |
Torres Shire Council | | 2,897 | | 2,596 | | 13.16 | | 11.89 |
Townsville City Council | | 4,974 | | 7,045 | | 9.45 | | 9.01 |
Waggamba Shire Council | | 1,124 | | 373 | | 1.73 | | 0.70 |
Warwick Shire Council | | 6,235 | | 4,627 | | 13.72 | | 13.37 |
Whitsunday Shire Council | | 20,880 | | 20,709 | | 7.91 | | 7.19 |
Willows Sports Complex Joint Board | | 804 | | — | | 1.40 | | — |
Winton Shire Council | | 876 | | 691 | | 5.34 | | 4.44 |
Wondai Shire Council | | 2,587 | | 2,343 | | 8.75 | | 8.44 |
| | |
| |
| |
| |
|
Total | | 2,870,150 | | 2,699,239 | | | | |
| | |
| |
| | | | |
Statutory Bodies | | | | | | | | |
Drainage Boards | | | | | | | | |
East Deeral Drainage Board | | 60 | | 48 | | 6.61 | | 6.00 |
Eugan Bore Water Authority | | 532 | | 479 | | 14.48 | | 13.35 |
Matthews Road Drainage Board | | 52 | | 47 | | 12.14 | | 11.10 |
95
| | | | | | | | |
South Maroochy Drainage Board | | 16 | | 13 | | 5.52 | | 4.48 |
Grammar Schools | | | | | | | | |
Brisbane Girls’ Grammar School | | 7,606 | | 6,341 | | 6.82 | | 5.74 |
Brisbane Grammar School | | 15,381 | | 14,578 | | 7.87 | | 7.05 |
Ipswich Girls Grammar School | | 2,102 | | 1,768 | | 2.15 | | 11.43 |
Ipswich Grammar School | | 5,148 | | 4,664 | | N/A | | 9.67 |
Rockhampton Girls Grammar School | | 4,532 | | 4,344 | | N/A | | 19.09 |
Rockhampton Grammar School | | 2,921 | | 3,433 | | 8.72 | | 9.68 |
Toowoomba Grammar School | | 3,890 | | 3,109 | | 6.53 | | 5.48 |
Townsville Grammar School | | 7,741 | | 7,173 | | 10.72 | | 9.47 |
River Improvement Trusts | | | | | | | | |
Don River Improvement Trust | | 43 | | 22 | | 1.94 | | 0.93 |
Pioneer River Improvement Trust | | 1,096 | | 887 | | 3.36 | | 5.05 |
Whitsunday Rivers Improvement Trust | | 133 | | 74 | | 4.18 | | 4.76 |
Universities | | | | | | | | |
Griffith University | | 41,693 | | 35,939 | | 8.19 | | 7.21 |
James Cook University | | 20,028 | | 21,844 | | 8.60 | | 12.55 |
Sunshine Coast University | | 4,358 | | 6,579 | | 7.71 | | 6.67 |
Water Boards | | | | | | | | |
Avondale Water Board | | 896 | | 798 | | 10.29 | | 9.30 |
Condamine Plains Water Board | | 55 | | — | | 0.50 | | — |
Crowley Vale Water Board | | 91 | | 52 | | 2.28 | | 1.26 |
Gladstone Area Water Board | | 147,199 | | 129,887 | | N/A | | N/A |
Glamorgan Vale Water Board | | 172 | | 142 | | 6.03 | | 5.10 |
Grevillea Water Board | | 22 | | 16 | | 3.97 | | 2.97 |
Kelsey Creek Water Board | | 2,139 | | 1,914 | | 11.85 | | 10.79 |
Merlwood Water Board | | 155 | | 123 | | 4.86 | | 3.82 |
North Burdekin Water Board | | 1,767 | | 1,383 | | 4.80 | | 3.80 |
Pioneer Valley Water Board | | 6,477 | | 5,779 | | 11.51 | | 10.46 |
Riversdale Murray Valley Water Management Board | | 699 | | 1,117 | | 14.19 | | 13.54 |
Six Mile Creek Water Board | | 119 | | 99 | | 6.10 | | 5.08 |
Yambocully Water Board | | 36 | | — | | 0.20 | | — |
Water Supply Boards | | | | | | | | |
Callandoon Water Supply Board | | 498 | | 325 | | 2.78 | | 1.77 |
Kaywanna Bore Water Supply Board | | 80 | | 48 | | 2.50 | | 1.47 |
Townsville Thuringowa Water Supply Board | | 80,695 | | 73,990 | | 17.76 | | N/A |
Other Statutory Bodies | | | | | | | | |
Agricultural Colleges | | 7,127 | | 6,273 | | N/A | | 5.05 |
Cherbourg Aboriginal Council | | — | | 649 | | — | | 4.54 |
Far North Qld Hospital Foundation | | 146 | | 109 | | 3.77 | | 2.77 |
Island Co-ordinating Council | | 950 | | 853 | | 16.05 | | 15.33 |
Islander Board of Industry and Service | | 3,849 | | 3,415 | | N/A | | N/A |
Major Sports Facilities Authority | | 269,366 | | 266,371 | | 16.30 | | 9.54 |
Mt Gravatt Showgrounds Trust | | 98 | | 83 | | 6.66 | | 5.64 |
Queensland Art Gallery | | 172 | | 316 | | 2.86 | | 2.16 |
Queensland Harness Racing Board | | 111 | | 56 | | 2.01 | | 1.00 |
Tourism Queensland | | 1,166 | | 771 | | 2.86 | | 1.85 |
South Bank Corporation | | 43,303 | | 38,619 | | N/A | | N/A |
State Library of Queensland | | 772 | | 640 | | 5.91 | | 4.88 |
| | |
| |
| |
| |
|
Total | | 685,491 | | 645,170 | | | | |
| | |
| |
| | | | |
Suncorp-Metway Ltd | | | | | | | | |
Suncorp Metway Facility | | 4,702 | | 4,024 | | 10.83 | | 9.87 |
| | |
| |
| |
| |
|
Total | | 4,702 | | 4,024 | | | | |
| | |
| |
| | | | |
Tollway company | | | | | | | | |
Queensland Motorways Limited | | 1,068,682 | | 960,994 | | N/A | | N/A |
| | |
| |
| |
| |
|
Total | | 1,068,682 | | 960,994 | | | | |
| | |
| |
| | | | |
QTC related entities | | | | | | | | |
DBCT Holdings Pty Ltd | | 509,141 | | 455,943 | | N/A | | N/A |
Queensland Treasury Holdings Pty Ltd | | 32,982 | | 34,787 | | 0.40 | | 0.40 |
| | |
| |
| |
| |
|
Total | | 542,123 | | 490,731 | | | | |
| | |
| |
| | | | |
Other Bodies | | | | | | | | |
Agricultural Co-operative Societies | | 1,039 | | 910 | | 4.00 | | 3.00 |
Department of Education - State Schools | | 191 | | 207 | | 2.60 | | 2.26 |
Parents and Citizens Associations | | 5,578 | | 7,158 | | 6.91 | | 7.00 |
| | |
| |
| |
| |
|
Total | | 6,808 | | 8,275 | | | | |
| | |
| |
| | | | |
GRAND TOTAL | | 19,670,526 | | 17,714,737 | | | | |
| | |
| |
| | | | |
Total Debt Outstanding includes Fixed Rate Loans, Operating Leases and Debenture Assets held by QTC (previously recorded as Investments).
The balance of clients’ offset deposits held in various pools is offset against clients’ debt outstanding.
Working Capital Accounts and Unsettled Operating Leases are not included.
Average Expected Term - only includes standard principal and interest accounts
| | • | ignores temporary funding and debt offset facility |
| | • | is not applicable (N/A) for any non-standard principal and interest accounts |
96