Exhibit (c)(iii)
APPROPRIATION BILL 2004
(Second Reading Speech, 15 June 2004)
TREASURER
The Honourable Terry Mackenroth MP
Deputy Premier, Treasurer and Minister for Sport
APPROPRIATION BILL 2004
(Second Reading Speech, 15 June 2004)
TREASURER
The Honourable Terry Mackenroth MP
Deputy Premier, Treasurer and Minister for Sport
Mr Speaker, I move that the Bill now be read a second time.
INTRODUCTION
The Budget that I present today sets the agenda for the third term of the Beattie Government.
A Government with a clear vision for building the new Queensland for all Queenslanders.
A strong stable Government which delivers disciplined fiscal and economic management.
A Government delivering on its promises to improve the quality and range of services and infrastructure to the Queensland community.
We clearly articulated our policies and priorities at the election and through this Budget we keep faith with the trust that Queenslanders placed in us.
Our election commitments were targeted at our key priorities and were affordable.
This Budget fully funds all of our election commitments to the Queensland community.
This Budget continues to build the Smart State.
1
Today I will announce substantial improvements in services and infrastructure for Queensland, including:
| | • | a record $6 billion capital program for 2004-05 to meet the challenges facing the growth State, including initiatives announced as part of our Smart State Building Fund; |
| | • | full implementation of child safety reforms which will involve additional funding of approximately $214 million per annum by 2006-07; and |
| | • | new funding of $220 million over four years to enhance disability services, well above our election commitment. |
Given the strength of our finances, this Budget also provides for $300 million of tax concessions involving the abolition of debits tax, the abolition of credit card duty, a reduced rate of duty on general insurance and stamp duty concessions for home purchases.
ECONOMIC OUTLOOK
In 2003-04 the Queensland economy has again outperformed the rest of the nation, with year-average growth in gross state product estimated to be 4%, the eighth consecutive year that Queensland has recorded higher growth than the rest of Australia.
This growth has been underpinned by the stellar performance of the domestic economy. Dwelling investment has continued to grow strongly driven by a mix of new house and unit construction and a surge in renovation activity as home owners have capitalised on exceptionally strong increases in house prices.
This increase in house prices and related activity in dwelling investment has also supported rapid growth in household consumption over the past year.
Businesses have also shared in the strength of domestic demand, with business confidence at record levels during the year and business investment enjoying another year of solid growth. Major projects investment also rose 4% to $56.8 billion in the March quarter, the highest growth of any State.
2
Queensland has once again been the engine room for job creation in Australia. Since our Government came to power in June 1998, more than a quarter of a million jobs have been created in Queensland.
The State accounted for a quarter of the jobs created nationally over this period, compared with our population share of around 19%.
Employment in Queensland this year is expected to grow by an estimated 3¼%, more than double the estimated growth in the rest of Australia. In the eleven months to May this year, almost 65,000 jobs have been created in Queensland, almost 27,000 more than forecast for the entire year.
With such strong employment growth, the trend unemployment rate has continued to fall, reaching a 22 year low of 6% in May this year.
This has occurred despite strong population growth.
Queensland is currently experiencing population growth of 2.3%, more than double the rate of the rest of Australia.
In 2004-05 economic growth in Queensland will strengthen to 4¼%, underpinned by the expected improved performance of the State’s trade sector.
Increased world demand for our exports and improved competitiveness are forecast to lead to a 5% growth in exports of goods and services. Meanwhile, growth in imports is forecast to moderate in line with a return to more normal domestic demand conditions, with household consumption forecast to grow by 4¾% following its exceptionally strong growth of 8½% in 2003-04.
Dwelling investment is forecast to stay at its current record levels. Demand for new dwellings continues to be supported by our strong population growth, while demand for renovation activity by home owners will remain high.
Business investment is also forecast to continue to grow solidly with a further 8½% increase in 2004-05.
3
In line with the forecast of continued strong economic growth, employment growth in Queensland is once again expected to outperform the rest of Australia in 2004-05. Employment is forecast to grow by 2¼%, with the creation of more than 40,000 jobs, compared with forecast employment growth of 1¾% nationally. The State’s year-average unemployment rate is forecast to remain unchanged at 6¼%, the lowest since 1981-82.
Mr Speaker, I confidently expect that Queensland will maintain its reputation as Australia’s growth State.
GROWING A DIVERSE ECONOMY AND CREATING JOBS
Our Smart State vision is about using knowledge, creativity and innovation to maintain prosperity and quality of life for all Queenslanders.
The Beattie Government has established new world class research institutes in biotechnology, medical research, cancer research, fibre composites, nanotechnology and other emerging areas.
A range of Cooperative Research Centres with strong links to Queensland are driving innovation in agriculture, fisheries, forestry, mining, satellite communications, environmental management and medicine.
As announced earlier this year, our Government will invest $20 million in a new $60 million world-leading Brain Institute to be built at the University of Queensland to research diseases such as Alzheimer’s, stroke and mental illness.
The Premier recently announced the latest round of funding commitments under the Smart State Research Facilities Fund. These commitments, of $33.8 million, include:
| | • | $9.5 million for the Centre for Advanced Animal Science; |
| | • | $8.1 million for the Queensland Preclinical Drug Development Facility; and |
| | • | $5 million for the Medical Engineering Research Facility. |
4
The investments under this fund, $130 million since its establishment, are providing Queensland’s brightest students and researchers with the opportunity to realise their potential – opportunities that historically were sadly lacking in this State.
Additional funding of $3.2 million over four years has been provided for a range of programs to help grow Queensland’s small business sector, including the establishment of a technology incubator in Cairns.
The Beattie Government’s Manufacturing Strategy will be expanded with an additional $11 million over four years to develop manufacturing excellence, improve manufacturing training and education programs and to provide a more highly skilled workforce for the manufacturing sector.
The 2004-05 Budget includes an additional $3 million over four years to provide specialist advisory services to support Information and Communications Technology uptake by businesses and the development of industry clusters.
This Budget allocates $9.8 million over four years to support the Queensland Biotechnology Strategy which will include measures to promote the Clinical Trials Network to assess new drugs, vaccines and therapies.
The Beattie Government has a clear focus on creating jobs. Our unemployment rate has dropped to the lowest level in over 22 years. However, it is important that long term unemployed Queenslanders are able to get their share of the jobs being created.
The Breaking the Unemployment Cycle initiative commenced in 1998 with a key focus to help the most disadvantaged job seekers to get jobs and acquire new skills. Through this initiative more than 71,000 unemployed people have been placed in jobs.
An additional $3 million over three years will be invested in the Strategic Employment Development program, taking total funding for the Breaking the Unemployment Cycle initiative up to $278 million over three years.
5
REALISING THE SMART STATE THROUGH EDUCATION, SKILLS AND INNOVATION
Building on the success of our preparatory year trials, this Budget provides for the introduction of a universally available Prep Year in 2007.
Investing in the early years of schooling pays dividends throughout a person’s life and the Prep Year will strengthen the foundation of our education and training reforms.
As part of the move to full implementation in 2007, the Prep Year will be phased-in at a further 40 State schools and 10 non-state schools over the next two years.
Late last week, agreement was reached with the non-State schooling sector in relation to the capital funding for facilities for the implementation of the Prep Year. The findings of the Independent Review Team appointed by the Government were accepted with a total of $56 million being allocated for new and refurbished facilities for students attending independent and Catholic schools across the State.
Building on the Government’s commitment in the 2002-03 Budget to provide an additional $60 million over four years for students with disabilities, a further $14 million will be allocated in 2004-05, bringing 2004-05 funding up to $32 million for this important program.
This year a total of $329 million will be invested in Education capital including upgrades of classrooms, libraries and administration blocks, Prep Year requirements and to complete the air conditioning of up to 560 classrooms in the Cooler Schools zone.
This Budget provides additional new and growth funding of $118 million over three years for the SmartVET strategy – an approach to vocational education and training that targets skill shortages and the skilling and workforce needs of industry.
Over the next three years the SmartVET strategy will create an estimated 17,800 new training places in priority industry areas that are central to the economic growth of the Smart State. Approximately 11,800 of those new training places will be apprenticeships and traineeships.
6
New entrants to Queensland’s growing aviation industry will benefit from an additional $3.8 million over three years to fund aeroskills training.
This additional funding will bring total investment including specialist infrastructure and training funding over the next three years to an estimated $15.9 million under Queensland Takes Off – the Government’s Smart State strategy to establish Queensland as the aviation hub of the Asia Pacific region.
MANAGING URBAN GROWTH AND BUILDING QUEENSLAND’S REGIONS
During 2003, Queensland’s population grew by an estimated 86,000 including 37,600 interstate migrants and 23,600 international migrants.
Queensland’s growth brings benefits but it also brings challenges for transport systems and other infrastructure, services and our environment.
With around 80% of this population growth occurring in south east Queensland, the Beattie Government is making the management and co-ordination of urban growth in south east Queensland a priority.
An Office of Urban Management has been established with funding of $6.7 million in 2004-05.
The Office will coordinate regional planning in south east Queensland and work with councils and the community to expedite the review of the existing framework for growth management and implement a South East Queensland 2021 Regional Plan.
Regional planning outside south east Queensland will be maintained and further enhanced with additional funding of $3.6 million over four years.
Last year we committed to an additional investment in infrastructure of $1.4 billion over three years through our Smart State Building Fund to assist in meeting the needs of a growing State. This additional investment was made possible by a prudent approach to managing the State’s finances through a period of difficult equity market conditions.
7
Reflecting this commitment and additional infrastructure initiatives in this Budget, our capital program for 2004-05 is $6 billion – a record capital program. Around 60% of this investment will be outside the Brisbane region.
Funding for the State’s roads program has been significantly increased. The Smart State Building Fund provided an extra $186 million for road projects over three years from 2004-05. An additional $301 million was committed in the election for road infrastructure.
This Budget provides a new four-year $571 million Arterial Roads Infrastructure Package, including $19.8 million in 2004-05.
Over the next four years the Beattie Government will spend an extra $1.9 billion on road and rail infrastructure while the Australian Government’s AusLink total five year funding to Queensland is less than $1.5 billion.
On current projections, passenger rail services in south east Queensland will require the capacity to carry an additional 13 million passengers a year by 2011. By 2007-08, over $900 million will be spent by our Government on increasing the capacity of Citytrain.
The Government will also continue its investment in the Busway network. In 2004-05, $27 million will be allocated as part of a $200 million, four-year program of bus infrastructure initiatives.
Mr Speaker, an efficient transport system is vital for our exporters operating in increasingly competitive markets.
In 2004-05, Queensland Rail will spend over $300 million on track infrastructure and rolling stock, largely to support the State’s coal industry.
The RG Tanna Coal Terminal at Gladstone will be expanded at a cost of $167 million over three years, and a further $34 million will be spent in 2004-05 on the Port of Brisbane expansion.
Reliable, inexpensive electricity is fundamental to Queensland’s ongoing development. Over the next 5 years, Queensland’s consumption of electricity is forecast to significantly increase.
8
In 2004-05 alone, energy GOCs will be spending approximately $1.7 billion on energy infrastructure throughout Queensland, including $1.2 billion on expanding and upgrading Queensland’s transmission and distribution network.
Another major highlight is the commencement of the $1.1 billion Kogan Creek power project near Chinchilla. Queensland continues to lead the country in investment in power generation.
IMPROVING HEALTH CARE AND STRENGTHENING SERVICES TO THE COMMUNITY
Queenslanders enjoy a world-class health system and the Beattie Government is committed to improving health services.
In contrast, the Australian Government is putting bulk-billing General Practitioners out of the reach of many Queenslanders, putting more pressure on our emergency departments and not putting in their fair share of hospital funding.
The Beattie Government wants to improve the standard and accessibility of hospital and health services for Queenslanders.
Consistent with this priority, the 2004-05 Health Budget will increase by $500 million or 10.8% over last year’s Budget.
After the State election we immediately began to implement our elective surgery commitment and Queenslanders today are benefiting from the extra $20 million injected this financial year with a further program of $90 million over the next three years.
Over the next four years this Budget provides for additional funding of:
| | • | $20 million for cardiac services; |
| | • | $44 million for cancer care; |
| | • | $13.2 million for oral health care; and |
| | • | $37.8 million to relieve pressure on public hospital emergency departments. |
9
There is also an additional $24.2 million over two years for replacement of three Royal Flying Doctor Service aircraft operating from bases in Brisbane, Rockhampton and Townsville.
In 2004-05, the Budget also includes funding for:
| | • | an additional $13 million for mental health services including the establishment of additional community, clinical and administrative support positions; |
| | • | an additional $8.5 million to ensure Queensland patients continue to have access to a safe and sufficient supply of blood and blood products; |
| | • | an increase in State funding for the Home and Community Care program of over $8 million; |
| | • | an additional $7.2 million for child health initiatives; and |
| | • | an additional $4 million to improve access to health services for Indigenous Queenslanders. |
The Beattie Government is also continuing to address the key infrastructure needed to deliver quality health services, beyond what we have delivered through our massive hospital building program.
Over the next three years more than $1 billion is allocated for the Health capital program including:
| | • | $77 million for a new emergency department and 120 extra beds at Prince Charles Hospital; |
| | • | $200 million as part of the Smart State Building Fund initiative for the integration of community and hospital based health services, hospital redevelopments and emergency department upgrades and staff accommodation upgrades across Queensland; |
| | • | $249 million will be invested in information and communication technologies to improve access to clinical information in both community care and hospital settings, and continue the development and replacement of technical infrastructure; |
10
| | • | $148 million for medical technology; |
| | • | $10 million to enhance renal services across the State; and |
| | • | $10 million to develop a 24 Hour Health Hotline to assist the community to access appropriate health services. |
The Government will also finance the $88 million public component of the Mater Hospital Reconstruction Project, which will include construction of a new Mater Mother’s Hospital, refurbishment of the Mater Adult Hospital and deliver an additional 112 public beds, 11 neonatal cots and 2 delivery suites.
Mr Speaker, in last year’s Budget the Beattie Government committed $200 million in new funding over four years as part of our agenda to deliver a better deal to people with disabilities, their families and carers.
Expenditure on disability services has been a priority of our Government so I am pleased to announce that this Budget provides an additional $220 million over four years to further advance our agenda for disability services. This goes much further than the commitment we made in the recent election.
This new funding will be targeted towards priority areas such as the Adult Lifestyle Program, Support for Children and Families, enhancing the viability of service providers, respite services and alternative services to support people with high support needs and challenging behaviours.
Safe, secure and affordable housing is essential to individual wellbeing and helps lay a foundation of stability in the lives of Queenslanders and the communities they live in.
This is why the Budget allocates:
| | • | $76.9 million for public rental housing allowing for the commencement of 320 dwellings and the completion of 285 dwellings; |
| | • | $11.9 million to the Brisbane Housing Company for the completion of approximately 150 units of accommodation, taking the total stock to over 300; |
11
| | • | $30 million over three years including $10 million in the first year to improve the supply of affordable housing; and |
| | • | $30 million over three years as part of the Smart State Building Fund initiative for the construction of Boarding Housing accommodation and for public housing upgrades across Queensland. |
The Beattie Government’s successful Community Renewal Program will continue at a cost of $75 million over five years and will be expanded into nine new areas from Cairns to the Gold Coast.
Infrastructure in the Torres Strait and the Northern Peninsula area will be further improved with funding of $16.2 million over three years, matched by the Australian Government. We will also be seeking the Australian Government’s support for infrastructure improvements in mainland aboriginal communities throughout the State.
PROTECTING OUR CHILDREN AND ENHANCING COMMUNITY SAFETY
The Crime and Misconduct Commission inquiry into the abuse of children in foster care identified that over a long period of time the Queensland child protection system had failed to deliver the necessary support and services.
The Beattie Government is absolutely committed to changing that by reforming foster care and enhancing the child protection system in Queensland.
We have a Blueprint for implementing the Crime and Misconduct Commission’s recommendations and are committed to its implementation.
The resources committed in this Budget and through the last Mid Year Budget Review involves approximately $214 million in additional annual funding by 2006-07.
This additional funding provides for a range of initiatives, including:
| | • | over 500 additional staff for the new Department of Child Safety; |
| | • | additional staff for the Commissioner for Children and Young People, including an expanded community visitor program; |
12
| | • | increasing the number of alternative care places to 680 over the next four years for young people not suited to conventional foster care; |
| | • | more training and recruitment and retention strategies for staff; |
| | • | staged increases in payments for foster carers; |
| | • | more therapeutic services such as counselling and disability support for children in care; and |
| | • | enhanced Suspected Child Abuse and Neglect Team arrangements. |
The Beattie Government is committed to ensuring our police are properly resourced and equipped.
In 2004-05 the number of sworn officers will grow by 350 reaching our target of 9,100 officers by September 2005. That represents over 2,300 extra police since we came to Government.
On achieving this target the Beattie Government will maintain the police to population ratio above the national average.
The Budget also provides $29.5 million for new and replacement facilities for the Queensland Police Service.
The Community Ambulance Cover is now giving the Queensland Ambulance Service a solid funding base.
Over the next three years ambulance services will be improved through:
| | • | the employment of 240 extra paramedics; |
| | • | 22 new or refurbished ambulance stations; and |
| | • | 200 new or refurbished ambulance vehicles. |
PROTECTING THE ENVIRONMENT FOR A SUSTAINABLE FUTURE
Mr Speaker, it is essential that we manage the development of our natural resources in an ecologically sustainable way.
13
The sustainable use of natural resources will secure the future of key industries and the maintenance of biodiversity will secure the integrity of the natural environment for future generations.
Historic new laws were recently passed to phase out broadscale land clearing in Queensland by December 2006.
This is the most significant environmental decision in Queensland’s history.
In the absence of Australian Government support, the Beattie Government will double its previous funding commitment to provide a $150 million adjustment assistance package.
This package will include funding to help landholders build up existing enterprises or establish new enterprises on their land, to support rural industry groups in promoting best practice sustainable agriculture and for incentives to support landholders willing to manage and maintain native vegetation as part of their operation.
To enhance the protection of Queensland’s natural heritage, this Budget commits funding of $15 million over three years to buy strategic parcels of high conservation value land to add to the protected estate. This includes $12.5 million for land acquisition in Cape York and the Daintree.
We will also contribute $5 million to the Queensland Trust for Nature to initiate the establishment of a public fund which will purchase land for conservation purposes.
An additional $6 million over three years is also provided to upgrade visitor facilities in our National Parks.
GOVERNMENT FINANCES
Mr Speaker, the fiscal principles that have been the foundation of successive Beattie Government budgets have allowed us to manage the effects of external factors, the impact of geopolitical events on equity markets and maintain our AAA credit rating.
14
While the equity markets in recent years adversely impacted our investment returns and our operating result, 2003-04 has seen a major upturn in global equity markets.
This equity market upturn, coupled with strong property market activity, has contributed to a revision to the forecast operating surplus for 2003-04 to over $2.3 billion. Even after adjusting for the structure of Queensland superannuation arrangements, our underlying surplus is estimated at over $1.4 billion.
This result more than offsets the two deficits recorded in 2000-01 and 2001-02.
Based on our longer term investment return expectations and allowing for a moderation in property market activity, the 2004-05 Budget provides for a net operating surplus of $646 million with surpluses of the order of $400-$500 million over the forward estimates period.
The improved operating result forecast for 2003-04 and over the forward estimates period has provided both the capacity for a major boost to the expansion and upgrading of our service infrastructure and an enhanced capacity to manage external impacts on our operating position.
REVENUES
Mr Speaker, every Queenslander and every Queensland business benefits from our competitive tax regime.
Based on Budget forecasts if you live in Queensland you will pay $1,614 per capita in State taxes compared with $2,056 per capita for the average of the other States. In other words taxpayers in other States pay 27% more than Queenslanders.
Our payroll tax rate is 4.75% - the lowest in Australia.
We have committed to abolishing the Bank Account Debits Tax from 1 July 2005 at a cost to revenue of around $190 million.
The Beattie Government has already honoured our election commitment to help young Queenslanders who are finding it hard to buy their first home by providing stamp duty relief.
15
From 1 May this year first home buyers buying a house up to $250,000 pay no transfer duty and no mortgage duty and between $250,000 and $500,000 receive a transfer duty rebate on a sliding scale.
Most states and territories in Australia do not provide a transfer duty concession for a home purchase that is not the first home.
Currently in Queensland a concessional transfer duty rate of 1% applies for the first $250,000 of the purchase price for homes other than first homes.
As announced from 1 August 2004 the threshold for this concessional duty rate will be increased from $250,000 to $300,000.
This enhanced concession will mean that Queenslanders purchasing a home valued at $300,000 or more will pay $1,250 less in transfer duty.
From 1 August 2004 the duty rate for Class 1 general insurance will be reduced from 8.5% to 7.5%. This reduced rate will particularly benefit policy-holders of building and contents cover.
In addition, credit card duty, currently applied at 10 cents per credit card transaction, will be abolished from 1 August 2004.
Together, the abolition of debits tax and credit card duty, the reduced rate of duty on general insurance and our stamp duty concessions for home purchases will save taxpayers approximately $300 million per annum from 1 July 2005.
DELIVERING RESPONSIVE GOVERNMENT
The Beattie Government is a responsive Government.
We listen to the community through our regional community forums and regional Cabinet meetings. We have held a history-making sitting of Parliament in Townsville and, as the Premier has already announced, we will be taking a sitting of Parliament to Rockhampton.
A number of e-democracy initiatives designed to use information technology to enhance community access to and participation in government decision making processes have been successfully trialled and will be continued.
16
A significant part of being responsive and accountable is ensuring that the community gets value for money through cost effective services.
We are continuing to develop and expand services available to the public through our single access point, Smart Service Queensland.
Value for money opportunities to deliver infrastructure are being pursued through our Public Private Partnerships framework.
Value for money is also being driven through our shared services model for the delivery of corporate services within Government.
CONCLUSION
Mr Speaker, at the State election we asked the voters to support the Beattie Government to keep our State moving and to keep building the new Queensland for all Queenslanders.
This Budget delivers on our election commitments and goes beyond that.
We are improving core services particularly for those most in need including vulnerable children and people with a disability.
We are boosting infrastructure spending, including essential transport infrastructure.
Our fiscal position is stronger and confirms the Government’s fiscal management over recent turbulent times.
Our economy is growing, diversifying and performing strongly.
We are building the new Queensland for all Queenslanders.
I commend the Bill to the House.
17

STATE BUDGET
2004-05
BUDGET STRATEGY AND OUTLOOK
Budget Paper No. 2
TABLE OF CONTENTS
| | | | |
| 1. | | Budget Strategy, Performance and Outlook | | |
| | |
| | | Introduction | | 1 |
| | | Fiscal Strategy | | 1 |
| | | Summary of Key Financial Aggregates | | 4 |
| | | Budget Outcomes 2003-04 | | 4 |
| | | Budget 2004-05 and Outyear Projections | | 8 |
| | | Reconciliation of Operating Result | | 9 |
| | |
| 2. | | Economic Performance and Outlook | | |
| | |
| | | Introduction | | 10 |
| | | External Environment | | 11 |
| | | The Queensland Economy | | 14 |
| | |
| 3. | | Economic Strategy | | |
| | |
| | | Positioning Queensland for Future Growth | | 25 |
| | | Queensland’s Demographic Challenges | | 26 |
| | | Responding to Queensland’s Demographic Challenges | | 31 |
| | | Need for Collaboration Across Governments | | 39 |
| | |
| 4. | | Budget Priorities | | |
| | |
| | | Introduction | | 41 |
| | | Queensland Government Policy Priorities | | 42 |
| | | Service Delivery Highlights | | 43 |
| | | Financial Management and Governance | | 55 |
| | |
| 5. | | Revenue | | |
| | |
| | | Introduction | | 57 |
| | | Revenue by Operating Statement Category | | 58 |
| | | Taxation Revenue | | 58 |
| | | Queensland’s Competitive Tax Status | | 61 |
| | | Grants and Subsidies | | 62 |
| | | Sales of Goods and Services | | 66 |
| | | Interest Income | | 67 |
| | | Other Revenue | | 67 |
| | | | |
| 6. | | Expenses | | |
| | |
| | | Introduction | | 70 |
| | | Expenditure by Category | | 71 |
| | | Details of Expenses | | 71 |
| | | Operating Expenses by Purpose | | 73 |
| | |
| 7. | | Balance Sheet and Cash Flows | | |
| | |
| | | Introduction | | 76 |
| | | Balance Sheet | | 76 |
| | | Cash Flows | | 79 |
| | | Reconciliation of Operating Cash Flows to the Operating Statement | | 83 |
| | |
| 8. | | Inter-Governmental Financial Relations | | |
| | |
| | | Commonwealth-State Financial Relations | | 84 |
| | | Australian Government Funding to the States | | 85 |
| | | State Shares of Australian Government Funding | | 86 |
| | | Queensland’s Share of Funding | | 86 |
| | | Institutional Arrangements | | 87 |
| | | Specific Purpose Payments | | 91 |
| | | State-Local Government Relations | | 95 |
| | | Queensland Government as a Taxpayer | | 97 |
| |
| Appendix A – Tax Expenditure Statement | | 99 |
| |
| Appendix B – Concessions Statement | | 105 |
| |
| Appendix C – Statement of Risks and Sensitivity Analysis | | 109 |
| |
| Appendix D – Government Finance Statistics | | 114 |
| |
| Appendix E – Departmental Expenses | | 122 |
| |
| Appendix F – Reconciliation of Government Finance Statistics Net Operating Balance to Accounting Surplus | | 123 |
| |
| Appendix G – General Government Times Series | | 124 |
| 1. | BUDGET STRATEGY, PERFORMANCE AND OUTLOOK |
KEY POINTS
| | • | In 2003-04, the General Government sector is forecast to have a net operating surplus of $2.374 billion. |
| | • | For 2004-05, there is a budgeted net operating surplus of $646 million, with a strong surplus position throughout the outyears. |
| | • | Cash surpluses are forecast for 2003-04, 2004-05 and the outyears in the General Government sector. |
| | • | The State’s net worth is forecast to increase in 2003-04, 2004-05 and the outyears to $80.3 billion. |
| | • | The State capital program in 2004-05 is budgeted to be $6.049 billion, a 19% increase on the estimated 2003-04 outlays. Sixty percent of the capital program will be spent outside the Brisbane region. |
INTRODUCTION
This chapter discusses:
| | • | the Government’s fiscal strategy as outlined under the Charter of Social and Fiscal Responsibility |
| | • | the summary financial aggregates of the 2004-05 Budget. |
FISCAL STRATEGY
The Charter of Social and Fiscal Responsibility outlines the Government’s fiscal principles, and is an integral part of the Government’s commitment to the community. The fiscal principles, which are detailed in Box 1.1, have been framed to meet a number of objectives, with the overriding requirement to maintain the integrity of the State’s finances.
The fiscal principles establish the basis for sustainability of the Government’s policies. They require that the services provided by Government be funded from tax and other revenue sources over the long-term. The principles are supported by an accrual budgeting framework, which recognises future liabilities of the State and highlights the full cost of sustaining the Government’s operations on an ongoing basis.
The principles recognise the importance of a strong financial position for the State. A state government, because of its more limited tax base, does not have the same capacity as a national government to cushion economic and financial shocks. At the same time, state governments have a responsibility to provide continuity of services, such as health, police and education.
A strong financial position, as indicated by a AAA credit rating, enables lower borrowing costs and is an indication of the soundness of the financial position and policies of the Government, rather than a goal in itself.
1
The success of Queensland’s financial and economic management has been consistently affirmed by international ratings agencies. These agencies have cited Queensland’s strong balance sheet, sound financial operations, modest debt levels and dynamic economic base as reasons underpinning the State’s AAA credit rating.
|
Box 1.1 The Fiscal Principles of the Queensland Government |
Competitive tax environment The Government has a key policy priority to maintain a competitive tax environment for business development and jobs growth. The Government will ensure that State taxes and charges remain competitive with the other states and territories. Affordable service provision The Government will ensure that its level of service provision is sustainable by maintaining an overall General Government operating surplus, as measured in Government Finance Statistics terms. Sustainable borrowings for capital investment Borrowings or other financial arrangements will only be undertaken for capital investments and only where these can be serviced within the operating surplus, consistent with maintaining a AAA credit rating. Prudent management of financial risk The Government will ensure that the State’s financial assets cover all accruing and expected future liabilities of the General Government sector. Building the State’s net worth The Government will maintain, and seek to increase, total State net worth. |
2
Competitive Tax Environment
One of the Queensland Government’s key social and fiscal objectives is to maintain a competitive tax environment which raises sufficient revenue to meet the infrastructure and Government service delivery needs of the people of Queensland, while at the same time providing a low cost environment for business to promote economic development and jobs growth.
The competitiveness of a state’s tax system is usually assessed by using one of the following measures:
| | • | taxation revenue on a per capita basis |
| | • | taxation relativities based on Commonwealth Grants Commission methodology |
| | • | taxation revenue expressed as a percentage of gross state product (GSP). |
Queensland’s competitive tax position is confirmed by all three measures.
| | • | Per capita tax collections in Queensland in 2004-05 are estimated at $1,614, compared with an estimated $2,056 for the average of the other states. |
| | • | Commonwealth Grants Commission data indicates that Queensland’s taxation effort ratio of 85.8% is considerably less than the standard (100%). |
| | • | Latest Australian Bureau of Statistics data shows Queensland’s tax collections are 4.4% of GSP compared to 4.9% for the average of the other states. |
The 2004-05 Budget includes transfer duty, mortgage duty and insurance duty relief measures. The Budget also includes the abolition of credit card duty with effect from 1 August 2004. Details of this change and other revenue items are provided in Chapter 5.
Affordable Service Provision
The objective of maintaining affordable service provision requires the maintenance of a budget operating surplus, to ensure recurrent services can be funded from recurrent sources.
The Government’s expenditure strategy is based around providing targeted funding for high priority community services. The strategy is built upon the delivery of commitments made in the context of the recent State election which are reflected in the Government’s outcome and priorities for Queensland as outlined in its Charter of Social and Fiscal Responsibility.
Consistent with the Government’s stated priorities, the 2004-05 Budget provides for the implementation of a range of election commitments and other service enhancements in key areas including child safety, health and disability services.
The 2004-05 Budget and forward estimates also continues the implementation of the Government’s Education and Training Reforms for the Future including a preparatory year of schooling from 2007 and substantial investment in information and communication technology.
More information on these initiatives is provided in Chapter 4.
Queensland is already one of the more efficient providers of government services among the states. Nevertheless, further improving the efficiency and effectiveness of Government services is an essential element of delivering on these key policy priorities in a way that is both affordable and sustainable.
The Government has in place an ongoing Aligning Services and Priorities (ASAP) program which provides for a process of ongoing activity and process review to ensure that Government resources are used efficiently so that funding can be directed to the high priority areas outlined above.
In this context, the Government has implemented a Shared Service Initiative designed to achieve best practice in corporate services across Government, with the savings achieved from this initiative to be directed to service delivery.
Capital Funding
The provision of adequate levels of infrastructure is an ongoing challenge for a State such as Queensland which continues to experience high levels of economic and population growth. Meeting this challenge, the Government provides for consistently higher levels of capital expenditure per capita than any other State.
Investment in core infrastructure is a key feature of the 2004-05 Budget with a record capital program of over $6 billion.
In recognition of Queensland’s capital requirements, the Charter allows borrowing for capital only where the costs of the borrowing can be serviced within the context of an overall operating surplus.
Despite this capacity, the bulk of Queensland’s 2004-05 capital program will be funded from recurrent sources and the forward estimates provide for only modest levels of borrowing reflecting improved cash flows and operating surpluses.
Details of the State capital program for 2004-05 and sources of funds are provided in Budget Paper No. 3 – Capital Statement.
Managing Financial Risk
Queensland has a long-standing policy of setting aside funds to accumulate financial assets sufficient to meet future liabilities, the largest being for future employee entitlements, most notably superannuation.
In this respect, Queensland is far better placed than any of the other state or territory governments, or indeed the Australian Government, to fund future accruing liabilities as most other jurisdictions have substantial unfunded superannuation liabilities.
In common with other superannuation managers in both the public and private sectors Queensland experienced poor investment returns in recent years. However 2003-04 has seen
3
significant growth in equity markets which will produce investment returns well in excess of actuarially assumed long-term rates of return.
The State’s policy of managing financial risk and setting aside funds to meet future liabilities provides the capacity to manage cycles in investment markets without impacting on the Government’s ability to fund ongoing services to the community.
Building the State’s Net Worth
The Charter policy of building the State’s net worth is intended to ensure that infrastructure and other assets are not run-down to the detriment of future citizens and taxpayers. It is an important element in ensuring intergenerational equity.
Queensland’s net worth is forecast to grow over the forward estimates. Queensland’s per capita net worth is expected to be 27% greater in 2004-05 than the average per capita net worth of the other states.
Further information on State net worth and other balance sheet aggregates can be found in Chapter 7.
Summary Of Key Financial Aggregates
Table 1.1 provides aggregate estimated actual outcome information for 2003-04 and projections for 2004-05 and the outyears.
| | | | | | | | | | | | |
Table 1.1 General Government sector – Key Financial Aggregates1 |
| | | 2003-04 Budget $ million | | 2003-04 Est. Act. $ million | | 2004-05 Budget $ million | | 2005-06 Projected $ million | | 2006-07 Projected $ million | | 2007-08 Projected $ million |
Revenue | | 21,382 | | 24,506 | | 24,009 | | 24,765 | | 26,033 | | 27,324 |
| | | | | | | |
Expenses | | 21,229 | | 22,132 | | 23,363 | | 24,311 | | 25,560 | | 26,842 |
| | | | | | | |
Net operating balance | | 153 | | 2,374 | | 646 | | 454 | | 473 | | 482 |
| | | | | | | |
Cash surplus | | 152 | | 2,249 | | 1,059 | | 438 | | 600 | | 909 |
| | | | | | | |
Capital purchases | | 2,545 | | 2,578 | | 2,718 | | 2,690 | | 2,492 | | 2,413 |
| | | | | | | |
Net worth | | 60,312 | | 69,366 | | 72,464 | | 74,976 | | 77,670 | | 80,336 |
Note: 1. Numbers may not add due to rounding. |
Budget Outcomes 2003-04
Operating Result
The operating result expected for 2003-04 is a surplus of $2.374 billion. The estimated 2003-04 surplus reflects the continuing strength of the property market and economy generally with higher taxation revenues, increased investment returns above the long-term assumed rate of return, and upward revisions to GST payments by the Australian Government.
Budget estimates for investment returns are based on the expected long-term average return for the portfolio of 7.5%.
With over $14.1 billion in funds invested in a portfolio of equities, property, cash and fixed interest, the performance of international financial markets has a major influence on the Budget result.
Following a period of very high returns in the 1990s, equity markets performed very poorly in recent years. However 2003-04 has seen a significant improvement in the performance of domestic and international equity markets resulting in an estimated investment return of 18%. Chart 1.1 illustrates the investment return rate achieved over time.
4
Chart 1.1
Investment Returns
1989-90 to 2003-041 (% per annum)
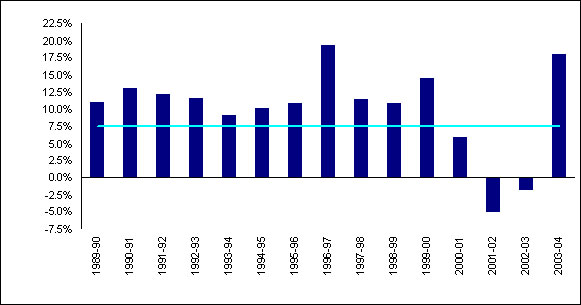
Note:
| 1. | 2003-04 is an estimate. |
Source: 1989-90 to 2002-03: Queensland Investment Corporation.
5
The Underlying Operating Result
Investment market volatility impacts on the Queensland Budget more in Government Finance Statistics (GFS) terms than it does for other states. This is in part due to differences in the way Queensland’s public sector superannuation arrangements are structured. Queensland’s financial assets set aside to meet future employer superannuation liabilities are held as General Government sector assets and associated superannuation liabilities are similarly recorded as General Government sector financial liabilities. In contrast, other jurisdictions generally have structures whereby only the net superannuation liability is recorded in the balance sheet.
The differing superannuation structure leads to a significant difference in GFS accounting treatment between states. For example, in other states poor investment returns are largely treated as negative asset revaluations, reflecting changes in the net superannuation liability. In contrast, poor investment returns impact directly on Queensland’s operating result as a decrease in revenue associated with the investment of financial assets held to meet future liabilities. Conversely, when investment returns exceed the expected long-term average return rate of 7.5%, Queensland’s operating result is improved.
If Queensland’s superannuation arrangements were structured on the same basis as generally applies in other states, the General Government sector underlying operating result for 2003-04 would be a surplus of approximately $1.4 billion, as outlined in Table 1.2 below. The underlying result concept is based on the treatment of variations between Budget and revised assumptions. For the 2004-05 Budget no adjustment is required to the forecast operating result as both the earnings rate on financial assets and the interest rate for the nominal superannuation interest expense are based on long-term actuarial assumptions.
| | |
Table 1.2 Calculation of Underlying Result |
| | | 2003-04 Est. Act. $ million |
Operating Balance | | 2,374 |
Less Investment Earnings 1 | | 1,682 |
Plus Nominal Superannuation Expense 2 | | 745 |
Underlying Balance | | 1,437 |
Notes: 1. Represents investment earnings on financial assets held to meet future defined benefit superannuation liabilities. 2. Represents the adjustment required to the nominal superannuation expense to be calculated on the basis of the net superannuation liability. |
Cash Surplus
The General Government sector is estimated to achieve a cash surplus in 2003-04 of $2.249 billion.
At Mid-Year Review, the cash surplus for 2003-04 was an estimated $216 million. Factors contributing to the improvement in the estimated surplus include the cash impact of upward revision to investment returns from 7.5% to 18%, higher receipts from duty on property transfer transactions resulting from significant growth within the housing and non-residential property sector, and upward revisions to specific purpose payments and GST payments.
The underlying strength of the General Government cash flow for 2003-04 is demonstrated through the borrowing requirement.
Borrowings for 2003-04 have been further revised down to a net repayment of $288 million, compared to net increase of $344 million at the Mid-Year Review 2003-04 (Budget estimate $570 million).
Capital Purchases
General Government investment in capital in 2003-04 is estimated to be $2.578 billion, broadly consistent with the amount forecast at Mid-Year Review.
Net Worth
The net worth, or equity, of the State is the amount by which the State’s assets exceed its liabilities. This is the value of the investment held on behalf of the people of Queensland by public sector instrumentalities. The net worth of the General Government sector at
6
30 June 2004 is estimated at $69.366 billion. This is $2.42 billion higher than net worth forecast at the Mid-Year Review, and reflects the improved operating position together with the impact of a downward revaluation of the Government’s accruing liabilities for employee superannuation.
7
Budget 2004-05 and Outyear Projections
Operating Result
The budgeted position for the General Government sector is for an operating surplus of $646 million in 2004-05, with continuing strong surpluses in the outyears.
The surpluses provide capacity to manage external factors that can impact on the Budget and also support a significant increase in infrastructure investment over the next four years.
The increase in expenditure relative to 2003-04 levels primarily relates to employee expenses, implementation of election commitments and other service enhancements and parameter based adjustments.
Taxation revenue growth is expected to decline in 2004-05 with an easing in property market activity, while investment returns are based on the assumption of long-term investment return rates.
Further details on revenue and expenditure projections are contained in chapters 5 and 6 respectively.
Cash Surplus
A cash surplus of $1.059 billion is expected in 2004-05 for the General Government sector. The cash surplus is forecast to decline in 2005-06 as a result of the abolition of debits tax and a resumption of superannuation beneficiary payments funding following a prepayment in 2003-04.
Growth in the cash surplus in the outyears is due to a moderation in net capital purchases from the high levels budgeted for 2004-05 and 2005-06.
Capital Purchases
This Budget continues the trend of sizeable State capital works programs in both nominal and per capita terms. General Government capital purchases are forecast to grow to approximately $2.7 billion per annum in 2004-05 and 2005-06 reflecting a range of infrastructure initiatives including the Smart State Building Fund. Budget Paper No. 3 – Capital Statement provides details by portfolio of 2003-04 estimated actual and budgeted 2004-05 capital outlays.
Net Worth
State net worth is projected to increase from the 2003-04 estimated actual by $3.098 billion to $72.464 billion at 30 June 2005. Net worth is also expected to increase in all forward estimate years.
More information on the State’s net worth, assets and liabilities is provided in Chapter 7.
8
Reconciliation of Operating Result
Table 1.3 provides a reconciliation of the General Government sector operating result for 2003-04 and 2004-05 published in the Mid-Year Fiscal and Economic Review (MYFER) and current Budget estimates.
| | | | | | |
Table 1.3 Reconciliation of 2003-04 and 2004-05 Operating Result to MYFER Estimates1 | |
| | | 2003-04 Est. Act. $ million | | | 2004-05 Budget $ million | |
MYFER Operating Result | | 401 | | | 192 | |
Expenditure Policy Decisions2 | | (47 | ) | | (381 | ) |
Revenue Policy Decisions3 | | (5 | ) | | (103 | ) |
Other Significant Variations Impacting on Operating Result | | | | | | |
- Investment Returns4 | | 1,181 | | | 141 | |
- Commonwealth General Revenue Grants5 | | 211 | | | 504 | |
- Government Owned Corporation net flows6 | | 201 | | | (2 | ) |
- Other Parameter Adjustments7 | | 432 | | | 295 | |
2004-05 Budget | | 2,374 | | | 646 | |
Notes: 1. Denotes impact on Operating Result. 2. Reflects expenditure policy decisions taken in the Budget context as well as election commitments. 3. Concessions to first home buyers, principal place of residence, insurance duty rate reductions and abolition of credit card duty provided in 2004-05 Budget – see Chapter 5. 4. Reflects revisions of estimated rate of return on investments from 7.5% to 18% in 2003-04. 5. Includes outcomes of Commonwealth Grants Commission 2003 Update, population changes and most recent estimates of GST revenue included in the 2004-05 Commonwealth Budget. 6. Includes revised dividend and tax equivalent revenues less community service obligation payments as a result of improved operating results by public enterprises. 7. Generally refers to adjustments relating to movements in underlying social and/or economic parameters or other no policy change adjustments to estimates. Includes upward revisions to taxation estimates of approximately $349 million in 2003-04 and $327 million in 2004-05. | |
9
| 2. | ECONOMIC PERFORMANCE AND OUTLOOK |
KEY POINTS
| | • | The Queensland economy is expected to grow by 4% in 2003-04, exceeding estimated national growth (3¾%) for the eighth consecutive year. |
| | • | The domestic sector has driven overall economic growth in 2003-04, with household consumption growing at a near-record rate, underpinned by continued strength in the housing sector. |
| | • | A surge in consumer spending, along with continuing growth in business investment, has led to a rapid increase in imports in 2003-04, while the high A$ exchange rate and continuing impact of the drought on rural production have restrained export growth. As a result, net exports are expected to detract 5¼ percentage points from overall growth in 2003-04. |
| | • | The strength of the domestic sector has seen further substantial job creation in 2003-04, with estimated employment growth of 3¼% (almost 60,000 jobs) reducing the year-average unemployment rate to 6¼%, the lowest since 1981-82. |
| | • | Queensland’s economic growth is forecast to strengthen to 4¼% in 2004-05, in contrast to national growth, which is forecast to ease to 3½%. However, the composition of growth in the State’s economy is expected to change considerably, with growth in domestic economic activity expected to moderate and the performance of the trade sector forecast to improve substantially. |
| | • | Consumer spending is forecast to return to more sustainable rates of growth and the level of dwelling investment is predicted to remain unchanged, following several years of strong growth. Offsetting these trends, net exports are anticipated to improve, with a continued recovery in the global economy leading to stronger growth in exports. Meanwhile, import growth is forecast to moderate in line with an easing in growth of domestic economic activity. |
| | • | With overall economic activity remaining strong in 2004-05, employment is forecast to grow a further 2¼%, maintaining unemployment at its lowest year-average rate in more than two decades. |
INTRODUCTION
This chapter presents the economic framework within which the 2004-05 Budget has been produced. It examines recent developments in Queensland’s external economic environment, reviews the performance and outlook for the Queensland economy, and highlights any risks and opportunities to economic growth in Queensland in the forecast horizon. The chapter details estimated actuals and forecasts for the major components of State economic activity for 2003-04 and 2004-05 respectively (see Table 2.2), and presents projections for key State economic variables over the medium-term to 2007-081 (see Table 2.3).
| 1 | Decimals have been used to describe actual outcomes, with fractions used for estimated actuals, forecasts and projections. |
10
EXTERNAL ENVIRONMENT
Current Conditions
International
The outlook for growth in Queensland’s major trading partners has improved markedly over the past 12 months, as the world economy continues to recover from the economic slowdown experienced during 2001 and 2002. Remarkable growth in Asia, driven by a surging Chinese economy and a recovery in Japan, and a return to strong growth in North America have more than offset continuing sluggish growth in Europe. As a result, economic growth in Queensland’s major trading partners is likely to strengthen in 2004, before moderating slightly in 2005, as tightening monetary policy begins to affect the world’s major economies (see Chart 2.1).
Chart 2.1
Economic Growth in Queensland’s Major Trading Partners1
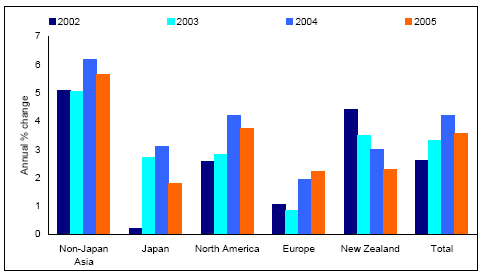
Note:
| 1. | Growth in calendar years 2004 and 2005 represent forecasts. |
Sources: Queensland Treasury and Consensus Forecasts.
The world’s largest economy, the United States, has grown strongly over recent quarters, providing substantial stimulus to the global economy. Stronger than expected employment growth in the United States in recent months has partially alleviated fears regarding the sustainability of the current recovery, while leading indicators in the United States have also risen considerably over the past 12 months and remain at high levels, implying a positive outlook for growth. Historically low interest rates and improving business sentiment have encouraged strong business investment, an important driver of economic growth in the United States.
However, the expected tightening of monetary policy in the United States over the second half of 2004 is likely to lead to a moderation of economic growth in 2005. Meanwhile, the persistence of large budget and trade deficits in the United States remains a concern and may result in either a tightening of fiscal policy or a moderation in foreign investment inflows, both of which may potentially have negative implications for growth in the United States. Growth in the Euro area is forecast to remain sluggish over 2004-05, as the leading economies in the region, including Germany and France, continue to experience subdued growth and high unemployment. The currently high value of the Euro also remains an impediment to an export-led recovery in the Euro area.
Non-Japan Asia has experienced a resurgence in growth as the global economy improves, with the rapidly expanding Chinese economy continuing to increase in importance as an export market and a stimulus to growth in the entire Asian region. Recent economic growth in China has been so strong that authorities have recently attempted to slow the economy by moderating credit growth to some sectors most at risk of overheating. Meanwhile, potential health risks such as Severe Acute Respiratory Syndrome and Avian Influenza appear to have abated and Asia is set to continue to outperform the global economy in terms of growth.
Japan has participated in the Asian region’s strengthening growth, with increased consumer spending and private investment in Japan now contributing to what was initially an export-led recovery. Concerns remain about the level of deflation, structural problems and the rapidly aging population in Japan. However, the short-term outlook for the world’s second largest economy has improved markedly, with Consensus Forecasts revising Japan’s expected growth in 2004 from 2.1% in its January 2004 survey to 3.1% in the May survey.
11
Overall, the outlook for the international economy in 2004 remains strong, although a slight moderation in growth is expected in 2005, following a tightening in global monetary conditions.
National
Strong domestic demand has been the primary driver of the Australian economy which is expected to grow by 3¾% in 2003-04. Household consumption is estimated to rise strongly in 2003-04, as increasing house prices and favourable employment conditions led to increases in both household wealth and household income. Business investment is also estimated to grow strongly in 2003-04 due to solid demand, higher profits, low interest rates and relatively less expensive imported machinery and equipment.
The strong growth in the domestic economy in 2003-04 has been partially offset by the weak performance of the trade sector. The combination of the drought and rising A$ are expected to result in subdued export growth in 2003-04, while imports have been bolstered by strong domestic demand and lower import prices. As a result, net exports are expected to detract 2¼ percentage points from growth in 2003-04.
This composition of growth is likely to slowly rebalance over the coming year, with an easing in national economic growth to 3½% expected in 2004-05. The gains in housing wealth appear to have peaked and employment growth is forecast to remain unchanged over the coming year, while the official interest rate increases at the end of 2003 may also impact on domestic demand and consumption in 2004-05. Business investment growth is also expected to ease in 2004-05 in line with slightly lower growth in domestic economic activity.
Export growth is forecast to strengthen in 2004-05, due to stronger global growth, rising commodity prices, the gradual recovery from drought conditions and the recent decline in the A$. Meanwhile, growth in imports is forecast to moderate slightly, in line with the expected easing in growth in domestic activity and stabilisation of import prices, resulting in an overall improvement in the trade sector in 2004-05.
Chart 2.2
Household Consumption and Dwelling Investment, Australia1
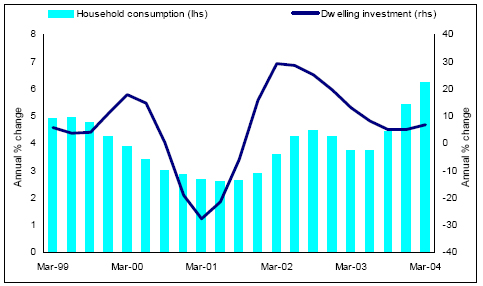
Note:
| 1. | Chain volume measure, 2001-02 reference year. 2003-04 represents an estimated actual, 2004-05 represents a forecast. |
Source: Australian Bureau of Statistics (ABS) 5206.0.
Chart 2.3
The Exchange Rate and Net Exports, Australia1
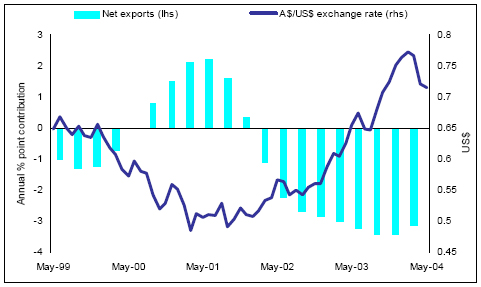
Note:
| 1. | Net exports presented as contribution to annual growth in quarterly trend gross domestic product. Exchange rates have been calculated on an end of month basis. |
Sources: ABS 5206.0 and Reuters.
External Assumptions
Queensland is a vibrant, open economy with strong trade links with the rest of the world. The State’s economic performance is therefore partly dependent on the outlook for both the national and international economies. As a result, the forecasts for the Queensland economy in 2004-05 are based on a range of key assumptions about the State’s external environment, including the national economy, major trading partners and financial markets (see Table 2.1).
| | • | The economic performance of Queensland’s major trading partners is expected to continue to improve over the coming year, with forecast year-average growth of 3¾% in 2004-05, compared with estimated growth of 3½% in 2003-04. This recovery is expected to be driven largely by a return to solid economic growth in the United States, ongoing |
12
| | improvement in the Japanese economy and continued robust growth in China, which should continue to provide substantial economic stimulus to the Asian region. |
| | • | Inflation in Queensland’s major trading partners is forecast to remain at 1½% in 2004-05. |
| | • | Australian monetary policy is assumed to be broadly unchanged over 2004-05, with interest rates to remain around their current levels. |
| | • | The Australian Government’s economic forecasts and projections, as outlined in the Commonwealth Budget delivered on 11 May 2004, have been adopted as the basis for national economic performance over the forecast horizon, with national growth of 3¾% assumed for 2003-04 and 3½% in the subsequent years to 2007-08. |
| | • | Queensland economic forecasts have been based on an A$ exchange rate at around current levels, in both US$ and trade-weighted index terms. |
| | • | Forecasts and projections of rural production and exports are based on an assumption of a return to average seasonal conditions in Queensland in 2004-05 and beyond. |
A discussion of the risks to these assumptions is contained in a later section of this chapter.
| | | | | | | | |
Table 2.1 External Assumptions |
| | | Outcomes | | Est. Act. 2003-04 % | | Forecast 2004-05 % |
| | | 2001-02 % | | 2002-03 % | | |
International assumptions | | | | | | | | |
Major trading partner economic growth | | 1.5 | | 3.1 | | 3 1/2 | | 3 3/4 |
Major trading partner inflation | | 1.2 | | 1.4 | | 1 1/2 | | 1 1/2 |
| | | | | |
National assumptions | | | | | | | | |
Economic growth | | 3.9 | | 2.9 | | 3 3/4 | | 3 1/2 |
Inflation | | 2.9 | | 3.1 | | 2 1/4 | | 2 |
Sources: Queensland Treasury, ABS 5206.0, ABS 6401.0, Commonwealth Treasury and Consensus Forecasts. |
13
THE QUEENSLAND ECONOMY
Overall Economic Growth
Rapid growth in domestic activity is expected to see Queensland maintain strong overall economic growth in 2003-04, despite a number of factors adversely affecting the economy’s trade sector. Gross state product in Queensland is expected to grow by 4% in 2003-04, outperforming estimated national growth for the eighth consecutive year.
Household consumption is expected to grow by 8½% in 2003-04, the highest yearly growth rate since 1989-90. A strong housing sector has helped underpin spending on consumer durables while higher house prices have led to increased consumer wealth. However, the resulting record consumer spending, along with continued growth in business investment, has boosted growth in imports during the year. With a higher A$ exchange rate and low levels of rural production due to the drought restraining export growth, net exports are anticipated to detract 5¼ percentage points from overall growth in 2003-04.
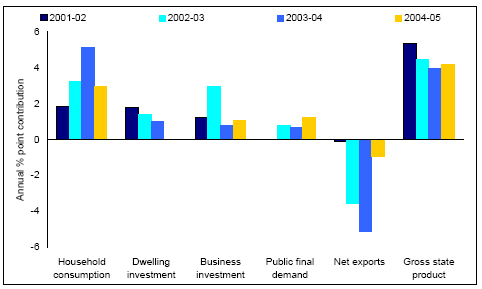
Queensland’s economic growth is forecast to strengthen to 4¼% in 2004-05. Furthermore, the composition of growth is predicted to change over the coming year, with a general easing in the growth of domestic activity being more than offset by an improvement in the trade sector (see Chart 2.4). After growing strongly in previous years, dwelling investment is forecast to remain unchanged in 2004-05, while consumption growth is forecast to return to a more sustainable rate. In contrast, public final demand is forecast to grow more strongly, largely reflecting the State Government’s substantial capital spending planned for 2004-05.
The performance of the trade sector is forecast to improve significantly in 2004-05, with net exports anticipated to detract only one percentage point from overall growth. A continued recovery in the global economy, increasing demand for commodities and a partial recovery from the drought are expected to bolster growth in exports. Meanwhile, import growth is expected to ease in line with the forecast moderation in domestic demand in 2004-05.
Chart 2.4
Queensland Economic Growth1

Note:
| 1. | Chain volume measure, 2001-02 reference year. 2003-04 represents an estimated actual, 2004-05 represents a forecast. |
Source: Queensland Treasury.
14
| | | | | | | | | | | | |
Table 2.2 State and National Economic Forecasts8 | |
| | | Outcomes | | | Est. Act. | | | Forecast | |
| | | 2001-02 % | | | 2002-03 % | | | 2003-04 % | | | 2004-05 % | |
Queensland forecasts | | | | | | | | | | | | |
Domestic production1 | | | | | | | | | | | | |
Household consumption | | 3 | | | 5.5 | | | 8 1/2 | | | 4 3/4 | |
Private investment2,3 | | 21 | | | 21.4 | | | 10 1/4 | | | 4 1/4 | |
Dwellings | | 32.9 | | | 20.8 | | | 12 1/2 | | | 0 | |
Business investment3, 4 | | 13.8 | | | 30.6 | | | 6 1/2 | | | 8 1/2 | |
Other buildings and structures3 | | (6.2 | ) | | 36.4 | | | 5 | | | 10 | |
Machinery and equipment3 | | 24.7 | | | 28.2 | | | 7 | | | 8 | |
Private final demand3 | | 7.0 | | | 9.5 | | | 9 | | | 4 3/4 | |
Public final demand3 | | 0.0 | | | 3.6 | | | 3 | | | 5 1/2 | |
Gross state expenditure5 | | 5.4 | | | 7.9 | | | 8 1/2 | | | 4 3/4 | |
Exports of goods and services | | 4.3 | | | 2.8 | | | 3 | | | 5 | |
Imports of goods and services | | 4.5 | | | 12.0 | | | 15 | | | 6 | |
Net exports6 | | (0.1 | ) | | (3.6 | ) | | (5 1/4 | ) | | (1 | ) |
Gross state product | | 5.4 | | | 4.5 | | | 4 | | | 4 1/4 | |
| | | | | |
Other state economic measures | | | | | | | | | | | | |
Population | | 2.1 | | | 2.3 | | | 2 1/4 | | | 2 1/4 | |
Inflation | | 2.9 | | | 3.2 | | | 3 | | | 2 1/2 | |
Average earnings (state accounts basis) 7 | | 2.8 | | | 3.4 | | | 3 1/2 | | | 4 | |
Employment (labour force survey) | | 2.4 | | | 3.7 | | | 3 1/4 | | | 2 1/4 | |
Unemployment rate (%, year-average) | | 8.0 | | | 7.2 | | | 6 1/4 | | | 6 1/4 | |
Labour force | | 2.4 | | | 2.8 | | | 2 1/4 | | | 2 1/4 | |
Participation rate | | 64.9 | | | 65.0 | | | 64 3/4 | | | 64 3/4 | |
| | | | | |
National forecasts | | | | | | | | | | | | |
Domestic production1 | | | | | | | | | | | | |
Household consumption | | 3.3 | | | 4.1 | | | 5 1/2 | | | 4 1/4 | |
Private investment | | na | | | na | | | na | | | na | |
Dwellings | | 19.2 | | | 15.5 | | | 6 | | | (3 | ) |
Business investment3,4 | | na | | | 16.8 | | | 11 | | | 7 | |
Other buildings and structures3 | | na | | | 31.9 | | | 16 | | | 6 | |
Machinery and equipment3 | | na | | | 16.4 | | | 10 | | | 8 | |
Private final demand3 | | na | | | 6.7 | | | 6 1/2 | | | 4 | |
Public final demand3 | | na | | | 4.3 | | | 2 3/4 | | | 3 1/2 | |
Gross national expenditure5 | | 4.6 | | | 6.2 | | | 6 | | | 3 3/4 | |
Exports of goods and services | | (1.1 | ) | | (0.5 | ) | | 2 | | | 8 | |
Imports of goods and services | | 2.2 | | | 13.5 | | | 12 | | | 9 | |
Net exports6 | | (0.7 | ) | | (3.0 | ) | | (2 1/2 | ) | | ( 1/2 | ) |
Gross domestic product | | 3.9 | | | 2.9 | | | 3 3/4 | | | 3 1/2 | |
| | | | | |
Other national economic measures | | | | | | | | | | | | |
Population | | 1.3 | | | 1.2 | | | 1 1/4 | | | 1 1/2 | |
Inflation | | 2.9 | | | 3.1 | | | 2 1/4 | | | 2 | |
Wage Cost Index7 | | 3.3 | | | 3.5 | | | 3 3/4 | | | 3 3/4 | |
Employment (labour force survey) | | 1.2 | | | 2.5 | | | 1 3/4 | | | 1 3/4 | |
Unemployment rate (%, year-average) | | 6.7 | | | 6.2 | | | 5 3/4 | | | 5 3/4 | |
Labour force | | 1.6 | | | 1.9 | | | 1 3/4 | | | 1 3/4 | |
Participation rate | | 63.4 | | | 63.7 | | | 63 1/2 | | | 63 1/2 | |
Notes: 1. Chain volume measure, 2001-02 reference year. 2. Private investment includes livestock, intangible fixed assets and ownership transfer costs. 3. Excluding private sector net purchases of second-hand public sector assets. 4. National calculations of business investment includes investment in livestock and intangible fixed assets, which are not included in the Queensland calculations. 5. Includes statistical discrepancy and change in inventories. 6. Percentage point contribution to growth in gross state or domestic product. 7. The Australian Government has moved to a measure of growth in wages based on the ABS Wage Cost Index, whereas the State measure of average earnings is still estimated on a State Accounts basis. 8. Unless otherwise stated, all figures are annual% changes. Decimal point figures indicate an actual outcome. na – Indicates not available. Sources: Queensland Treasury, Commonwealth Treasury and ABS 5206.0. | |
Chart 2.5
Contribution to Growth in Queensland’s Gross State Product1
Note:
| 1. | Chain volume measure, 2001-02 reference year. Contributions for 2003-04 represent estimated actuals while contributions for 2004-05 represent forecasts. |
Source: Queensland Treasury.
15
Chart 2.6
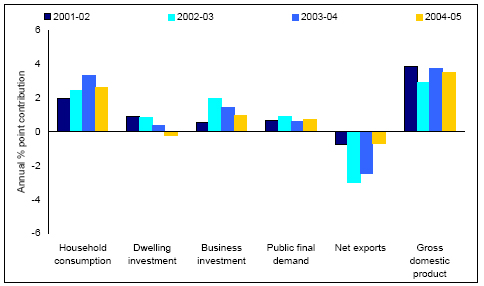
Contribution to Growth in Australia’s Gross Domestic Product1
Note:
| 1. | Chain volume measure, 2001-02 reference year. Contributions for 2003-04 represent estimated actuals while contributions for 2004-05 represent forecasts. |
Sources: Queensland Treasury and Commonwealth Treasury.
Household Consumption
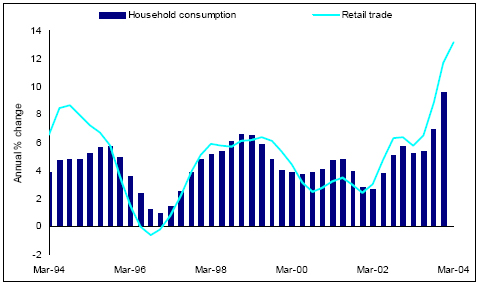
Household consumption has continued to be one of the key drivers of economic activity in Queensland over the last year and is expected to grow at a near-record rate in 2003-04. As the largest single component of the Queensland economy, household consumption is forecast to grow by 8 1/2% over the year, a rate of growth not seen since the late 1980s. Consumption expenditure has been largely underpinned by strong population and employment growth, as well as the robust housing market, which has resulted in increased household wealth and a higher level of consumer confidence. In addition, continuing low interest rates and a stronger A$, which has made imported consumption goods less expensive, have also contributed to this surge in consumption spending.
Retail trade, which accounts for approximately 40% of household consumption, experienced particularly strong growth during the first three quarters of 2003-04, reflecting strong growth in retail spending across all major industry groups.
Growth in household consumption is forecast to moderate in 2004-05, returning to a more sustainable rate of growth of 4 3/4%. This easing reflects an anticipated moderation in the growth of both housing-related consumer purchases and wealth-related spending, in line with the apparent peaking of the housing cycle and the recent stabilisation of house prices. The impact of interest rate increases in late 2003 may also dampen household consumption growth in 2004-05. However, underpinned by continued solid population growth and rising real incomes (with the increase in average earnings once again expected to outpace inflation), growth in consumption expenditure is expected to remain robust in 2004-05.
Chart 2.7
Household Consumption and Retail Trade, Queensland1
Note:
| 1. | Chain volume measure, 2001-02 reference year. |
Sources: Queensland Treasury and ABS 8501.0.
Dwelling Investment
After very strong growth in 2001-02 and 2002-03, dwelling investment has continued to increase through the first half of 2003-04 and is expected to rise by 12 1/2% over the year.
New dwelling construction grew strongly over the first three quarters of 2003-04, with owner occupied home construction buoyed by continued high population growth in Queensland and low home loan interest rates. The surge in demand for investment property throughout 2002-03 continued into 2003-04, supported by exceptionally strong house price growth. Building approvals data suggest that, while construction of owner-occupied and investment dwellings could moderate slightly during the final quarter of 2003-04, the overall level of activity should remain high. After record growth in 2002-03, alterations and additions spending has continued to increase in 2003-04, as home owners continued to utilise the increased equity in their properties resulting from the rapid house price growth.
Dwelling investment in 2004-05 is forecast to remain unchanged from the very high level expected in 2003-04. This compares with a forecast decline of 3% nationally in 2004-05. Box 2.1 highlights some of the reasons why the outlook for dwelling investment is stronger in Queensland compared with nationally.
Recent dwelling approvals data indicate new dwelling construction in Queensland may be nearing a peak, with the gradual easing in approvals of new dwellings likely to continue into 2004-05. In addition, the demand for investment property is expected to moderate in anticipation of more subdued growth in house prices in the coming year.
16
However, the anticipated decline in new housing construction is likely to be tempered by Queensland’s strong population growth which remains substantially higher than in the rest of Australia, and is expected to be offset by further growth in renovation-related construction. Alterations and additions activity currently represents almost half of total dwelling investment and is expected to continue to grow solidly in 2004-05, as home owners continue to draw on their increased equity to invest in their properties.
Chart 2.8
Alterations, Additions and New Dwelling Investment, Queensland
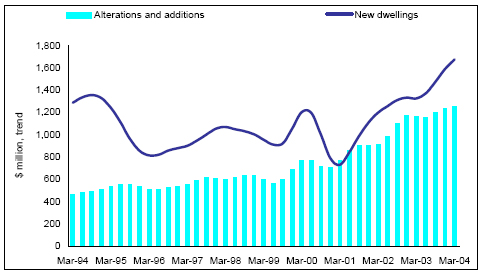
Source: ABS 5206.0
17
|
Box 2.1 The Queensland Housing Sector |
Dwelling investment in Queensland, as in the rest of Australia, has boomed in recent years. However, while Commonwealth Treasury has forecast a 3% decline in dwelling investment nationally in 2004-05, a number of factors are likely to support dwelling investment more in Queensland than in the rest of Australia in the coming year. In particular, recent data suggest that Queensland faces much less risk of an over-supply in the housing market than New South Wales or Victoria. A recent surge in net migration to Queensland saw more than 120,000 interstate and overseas migrants move to the State during the two years to December quarter 2003. As a result, Queensland recorded annual population growth of 2.3% in each of the seven quarters to December 2003, compared with around 1% growth in the rest of Australia, the largest population growth differential since the interstate migration boom in the mid 1990s. In addition, Queensland has recorded substantially lower growth in its dwelling stock, relative to population growth, than either New South Wales or Victoria. Over the two years to December quarter 2003, population growth in New South Wales and Victoria totalled 225,000 persons, while new dwelling approvals totalled 191,000. In contrast, Queensland’s population growth over the period totalled 171,000, while only 84,000 new dwellings were approved for construction in the State. As a result, the ratio of dwelling approvals to population growth in Queensland remains substantially below that in either New South Wales or Victoria and is also markedly lower than that recorded throughout most of the last decade, particularly the period leading up to the downturn in dwelling investment in the mid 1990s. Partial indicators suggest that, as in previous booms, Queensland lags behind New South Wales and Victoria in the current housing cycle. Brisbane house prices began the recent period of rapid growth later than in Sydney or Melbourne and have grown at a faster pace in recent quarters. This fuelled a surge in demand for investment property in Queensland. Furthermore, approvals of other residential dwellings (apartments, townhouses, etc) suggest that supply growth in this segment of the market, relative to population growth, has also been more subdued in Queensland than in other states. Another key factor likely to underpin high levels of dwelling investment in Queensland is the stronger growth in renovation activity in Queensland over most of the past four years. Queenslanders are increasingly investing in their own properties, with alterations and additions activity now comprising almost half of total dwelling investment in the State, compared with about one-third of dwelling investment throughout most of the 1990s. Furthermore, previous significant downturns in dwelling investment in Queensland have occurred in periods characterised by sharp falls in migration, low economic growth or weakening labour market conditions. However, Queensland is currently enjoying a surge in interstate and overseas migration to the State, solid economic growth and the lowest trend unemployment rate for more than 20 years. Dwelling Approvals per Increase in Population 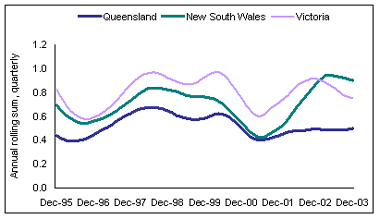
|
Business Investment
Following two years of particularly strong growth in 2001-02 and 2002-03, business investment in Queensland is expected to once again record solid growth of 6½% in 2003-04. Economic conditions have remained conducive to continued high levels of business investment in 2003-04. The strength of the domestic economy has supported high levels of business confidence, continuing low interest rates have maintained low borrowing costs and the substantial appreciation of the A$ in the first half of the year has assisted businesses in the purchase of imported capital items.
With particularly strong growth in domestic consumer demand throughout the year and the international economic outlook improving, both major components of business investment are expected to grow solidly in 2003-04. Machinery and equipment investment is expected to rise by 7% while investment in other buildings and structures is predicted to rise by 5%.
Despite the interest rate rises in late 2003 and the recent depreciation of the A$, business investment in Queensland in 2004-05 is forecast to be buoyed substantially by the improved outlook for world economic growth and the recent increase in world commodity prices. As a result, total business investment is forecast to grow by a further 8½% in 2004-05.
Reflecting the more positive external economic environment, growth in other buildings and structures investment is forecast to accelerate to 10% in 2004-05. This positive outlook reflects a wide range of small, medium and large projects across various sectors which are currently under construction or due to commence construction in the near future, but is partially dependant on the progress of a number of large projects in the mining and metals manufacturing industries. Meanwhile, growth in machinery and equipment investment, which comprises more than two-thirds of total business investment, is forecast to strengthen only slightly to 8% in 2004-05, reflecting the recent depreciation of the A$.
18
Chart 2.9
Major Components of Business Investment, Queensland1
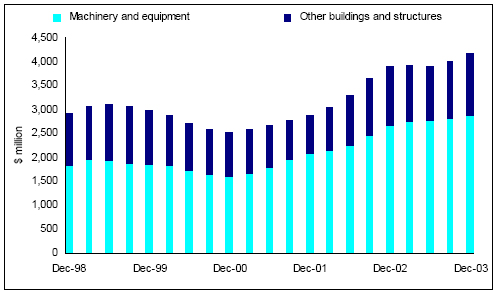
Note:
| 1. | Chain volume measure, 2001-02 reference year. |
Source: Queensland Treasury.
Public Final Demand
Following strong growth in 2002-03, total public final demand in Queensland is estimated to increase by 3% in 2003-04.
Public final demand growth is forecast to strengthen to 5½% in 2004-05, largely reflecting the State Government’s substantial infrastructure investment and increased capital expenditure by Queensland’s Government-owned corporations.
General Government capital works to be undertaken in 2004-05 include substantial spending on key Government priorities, including transport infrastructure, education and training, health, housing and child safety. Major transport projects include further improvements to the State’s arterial roads, passenger rail services and busways. Other capital projects include the redevelopment and upgrading of the State’s schools and hospitals, and the development of the Department of Child Safety’s new integrated Client Management Information System.
Capital expenditure by Queensland’s Government-owned corporations is also forecast to increase rapidly in 2004-05, partially reflecting the demand for additional infrastructure to support Queensland’s rapidly growing energy and export-orientated sectors.
Key projects in the energy sector include the commencement of CS Energy’s Kogan Creek power project and the completion of Enertrade’s Townsville Power Station gas pipeline. Meanwhile, reflecting the expected future growth in Queensland’s coal sector as world demand increases, the State’s coal rail network is to be upgraded and the Gladstone Port Authority is planning to expand the RG Tanna Coal Terminal. Other major capital projects expected in 2004-05 include additional substantial work to be undertaken by the Gladstone Port Authority, further spending in relation to the Port of Brisbane Corporation’s Future Port Expansion Project and the construction of a new baggage checking facility at Cairns Airport.
19
Chart 2.10
Public Final Demand, Queensland1
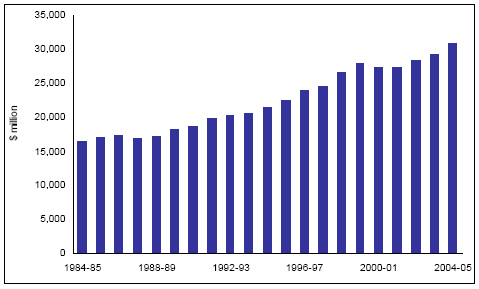
Note:
| 1. | Chain volume measure, 2001-02 reference year. 2003-04 represents an estimated actual, 2004-05 represents a forecast. |
Source: Queensland Treasury.
Net Exports
A combination of external and internal factors are expected to significantly affect the performance of the trade sector, with net exports estimated to detract 5¼ percentage points from overall economic growth in 2003-04.
Queensland’s export growth has remained relatively subdued, primarily due to the impact of the recent strength of the A$ on commodity exports and the effect of the drought on agricultural production. Growth in tourism exports has shown signs of a recovery in 2003-04, with confidence among international travellers improving since the terrorist attacks in the United States and Bali, the War in Iraq and the SARS epidemic. Overall, total exports of goods and services are expected to grow by 3% in 2003-04.
Meanwhile, import growth is estimated to have strengthened to near-record rates in 2003-04, growing by 15%. Increased demand for overseas goods has been generated by the strong growth in household spending and business investment, with the higher A$ making imports of machinery and equipment relatively less expensive.
Export growth is forecast to strengthen to 5% in 2004-05. Higher world economic growth is expected to lead to increased global industrial production, with coal and non-ferrous metal exports expected to drive Queensland’s stronger export growth. Coupled with higher commodity prices, this will increase the income earned by the State’s commodity exporters. Box 2.2 outlines how Queenslanders are likely to benefit from the recent improvement in Queensland and Australia’s terms of trade. A further recovery in agricultural production in Queensland should boost rural exports while a lower A$ should help underpin overall export growth in 2004-05, including international tourism to Queensland. Growth in imports is forecast to ease to 6% in 2004-05, in line with a moderation in domestic economic growth.
As a result of this stronger export growth and more sustainable import growth, net exports are forecast to detract only one percentage point from overall growth in 2004-05.
20
Chart 2.11
Exports and Imports, Queensland1
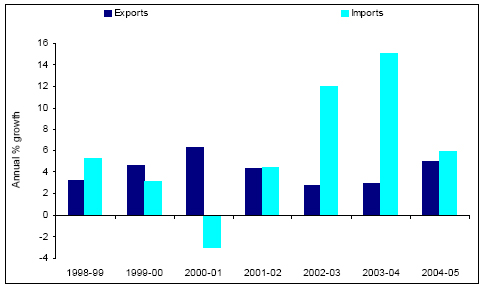
Note:
| 1. | Chain volume measure, 2001-02 reference year. 2003-04 represents an estimated actual, 2004-05 represents a forecast. |
Source: Queensland Treasury.
|
Box 2.2 The Terms of Trade |
Australia’s terms of trade (TOT) measures the price of goods and services that Australia exports, relative to the price of Australia’s imports. The TOT is an important economic indicator, as it measures the ability of the country to purchase imports for a given level of exports. A rise in the TOT means that the purchasing power of Australia’s exports has improved, increasing real incomes in the economy. Chart 1: Commodity Prices and the Terms of Trade 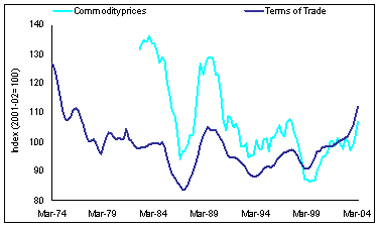
Australia’s TOT has improved dramatically over the past five years (Chart 1), reaching its highest level since December 1974. This improvement reflects changes in prices on both sides of the TOT, with Australia largely exporting commodities and importing manufactured goods. In terms of export prices, the recent rise in world commodity prices has coincided with a substantial increase in the TOT. Meanwhile, the improvement in quality and reduction in price of many information and communication technology products, and the increase in global competition in the production of manufactured goods, particularly from China, has led to a downward trend in the price of Australia’s manufactured imports. This sustained fall in import prices also explains why the rise in the TOT has outstripped growth in commodity prices over the past decade (Chart 1). Queensland, like Australia, is also benefiting from the improvement in Australia’s TOT2. The recent improvement in Australia’s TOT will have an even more positive effect on Queensland, given its different export focus than the rest of Australia. The State is sharing the benefits of cheaper imported goods, while Queensland’s export mix has an even greater share of rural and mineral commodities (Chart 2). As a result, recent increases in world commodity prices should have had a more beneficial effect on Queensland’s TOT, and thus the wider economy, relative to the rest of Australia. |
Chart 2: Composition of Merchandise Exports, 2002-031 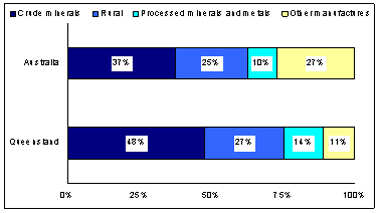
Note: 1. Excludes confidential items |
| 2 | Queensland’s TOT cannot be readily calculated with some key data unavailable at the State level at a sufficient level of detail. |
Employment
The number of persons employed in Queensland, in year-average terms, is estimated to increase by 3¼%, or an increase of almost 60,000 jobs, in 2003-04. Queensland’s employment growth is expected to be stronger than labour force growth in 2003-04, with the year-average unemployment rate forecast to fall to 6¼%, the lowest since 1981-82.
Employment growth in Queensland has remained strong throughout most of 2003-04, reflecting the performance of many of Queensland’s labour-intensive industries. In particular, the exceptional performance of the State’s housing market and associated consumption has supported employment growth in construction, retail trade and housing-related service industries. This strong growth has more than offset a decline in agricultural employment due to the ongoing impacts of the drought.
Jobs growth has moderated slightly in the second half of 2003-04 and is expected to remain relatively subdued in coming quarters, in line with an easing of growth in some of the industries which have enjoyed the strongest growth in recent years. Therefore, as economic activity in Queensland switches further from these labour-intensive domestic sectors to more capital-intensive export-orientated industries, Queensland’s employment growth is forecast to ease to 2¼% in 2004-05. This is in line with the State’s strong population growth and remains above the 1¾% employment growth forecast nationally.
Queensland’s forecast employment growth is expected to result in the creation of more than 40,000 additional jobs in Queensland in 2004-05. Furthermore, with employment growth and labour force growth expected to be similar in 2004-05, the year-average unemployment rate is forecast to remain unchanged at its two decade low of 6¼%.
21
Chart 2.12
Employment Growth, Labour Force Growth and Unemployment Rate, Queensland1

Note:
| 1. | Growth rates and unemployment rates for 2003-04 represent estimated actuals while figures for 2004-05 represent forecasts. |
Sources: Queensland Treasury and ABS 6202.0.
Population
Continued strong population growth of 2¼% is estimated for Queensland in 2003-04, with a similar rate of growth forecast for 2004-05. As a result, Queensland’s population is expected to increase by approximately 170,000 over these two years, to a total of more than 3.9 million in 2004-05, representing almost one fifth of the forecast national population.
The rapid population growth expected in Queensland in 2003-04 may be partly in response to the substantial rise in house prices throughout Australia in recent years. This has increased the relative cost of housing in southern capitals and may have contributed to the acceleration in interstate migration to Queensland, as it has following previous housing booms. Meanwhile, Queensland’s stronger employment growth continues to attract interstate migrants searching for improved employment opportunities.
Population growth in Queensland is forecast to remain substantially higher than that nationally in 2004-05, underpinned by strong net interstate and overseas migration. Migration to Queensland will continue to be underpinned by traditional factors, such as Queensland’s stronger employment growth, the State’s generally lower cost of living and other socio-economic factors such as Queensland’s lifestyle and preferable climate. This is reflected in the State’s sustained strong growth in net interstate migration and the substantial increase in Queensland’s share of Australia’s net overseas migration over the last decade.
Chart 2.13
Components of Population Growth, Queensland
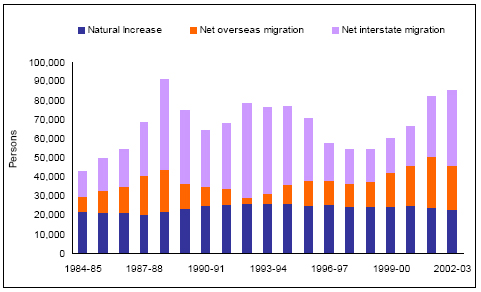
Source: ABS 3101.0.
Average Earnings
Nominal average earnings in Queensland are expected to increase by 3½% in 2003-04, outpacing estimated inflation and implying a rise in real average earnings during the year. Nominal earnings growth is expected to strengthen to around 4% in 2004-05. Therefore, with the rate of inflation expected to ease in the coming year, real earnings are expected to increase further in 2004-05, underpinned by continued growth in labour productivity.
Inflation
Domestic pressures have driven inflation in Queensland in 2003-04, with rapid increases in house prices and housing activity resulting in housing costs contributing almost 70% of the increase in the Brisbane Consumer Price Index (CPI) over the year to March quarter 2004. The ongoing impact of the drought on fruit and vegetable prices and increasing health costs have also pushed the level of Queensland consumer prices higher over the year.
Partially offsetting many of the domestic pressures has been the steady appreciation of the A$ over late 2003 and early 2004, which has put downward pressure on the price of imported goods and services. Overall, Brisbane CPI inflation is expected to average 3% in 2003-04.
Inflation is forecast to moderate to 2½% in 2004-05, as the impact on domestic prices of an easing in drought conditions and a moderation in housing activity more than offsets the influence of a lower A$ on the prices of tradeable goods and services. Furthermore, the lags between changes in the level of the A$ and the final price of imported goods suggest that the
22
current downward pressure on the prices of imported goods may continue for some time. In contrast, recent increases in oil prices are likely to impact heavily on the cost of transportation and automotive fuel and remain a key risk to inflation.
Inflation in Queensland in 2004-05 is forecast to be higher than the 2% forecast nationally, as there are a range of factors likely to have Queensland-specific influences on inflation in 2004-05. Higher population growth and a delayed start to the recent housing boom imply that housing costs may contribute more to inflation in Queensland than in the rest of Australia over the next 12 months. Meanwhile, Queensland’s forecast of higher growth in domestic demand, compared with nationally, may also place slightly greater upward pressure on prices generally in Queensland than in the rest of Australia in 2004-05.
Chart 2.14
Percentage Contribution to Growth in the CPI by Component, Queensland1
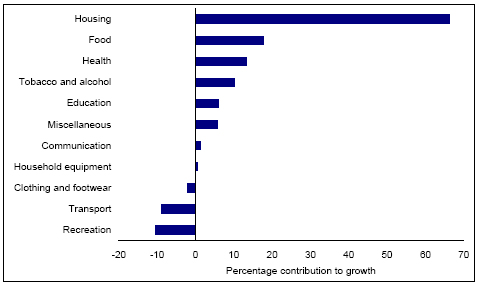
Note:
| 1. | Percentage contributions to growth in the Brisbane CPI over the four quarters to March quarter 2004. |
Source: ABS 6401.0
Risks and Opportunities
The forecast 4¼% economic growth in Queensland in 2004-05 is based on a significant improvement in the trade sector offsetting an easing in domestic activity. Consequently, economic conditions internationally and nationally will have a major impact on the outlook for Queensland in 2004-05. Key external risks include the sustainability of growth in China and the United States, as well as the possibility of higher oil prices and domestic inflation.
In addition, several factors will influence the extent of easing in activity in the domestic sector in 2004-05. These include the possibility of a sharper than expected downturn in the housing sector, the extent of recovery from the drought and the strength of population growth.
International Conditions
The sustainability of economic growth in two of the world’s largest economies, China and the United States, poses a potential risk to world economic growth and therefore the performance of Queensland’s trade sector in both 2004-05 and beyond.
While annual GDP growth in China surged to 9.7% in March quarter 2004, there has been growing concern regarding the sustainability of the current expansion, with inflation over the year to April 2004 reaching a seven-year high of 3.8%. As a result, Chinese authorities have attempted to slow the economy by raising reserve requirements for banks and preventing the provision of credit to sectors most subject to significant over-lending and over-investment.
There is a risk that the Chinese economy may experience a ‘hard landing’ rather than a smooth transition to lower growth. If this was to eventuate, this would adversely affect growth in Queensland’s and China’s mutual trading partners, such as Japan, leading to lower than forecast growth in Queensland exports in 2004-05.
The sustainability of the recovery in the United States also poses a risk to world economic growth. Recent indicators suggest the pace of recovery has been stronger than previously expected. This has translated into underlying consumer prices increasing at a faster rate than anticipated in April, following a sharp rise in March. If inflation continues to accelerate, the pace of monetary tightening in the United States may be faster than previously expected. At the same time, the recovery has coincided with growing ‘twin deficits’ (budget and trade deficits), while the ongoing threat of further terrorist incidents has the potential to adversely impact on consumer and business confidence.
23
However, it should be noted that any faster than expected monetary tightening in the United States may also decrease the interest rate differential between the United States and Australia, leading to the possibility that the A$/US$ exchange rate may depreciate in 2004-05. This would have some offsetting beneficial impact on Queensland’s trade sector.
Oil Prices
The potential for continuing high, or further increases in, nominal oil prices has emerged as a risk to growth in most economies in 2004-05, including Queensland. The price of oil fell to US$27.50 per barrel in March 2003 after the United States first claimed victory in Iraq, but has since increased by more than 50% to above US$42.00 in early June 2004, following continued tension in the Middle East and strengthening world economic growth.
The appreciation of the A$ to around US80c in February 2004 has largely offset the impact of higher US denominated oil prices in Queensland, but the A$ has depreciated since that time. Any further increase in oil prices, given a steady A$/US$ exchange rate, may begin to affect economic growth in Queensland. In particular, by increasing the price of automotive fuel, higher oil prices will reduce discretionary incomes and therefore possibly result in lower than forecast consumption growth in 2004-05.
Furthermore, sustained high oil prices will influence the cost of production in Queensland’s trading partners that are heavily dependent on oil imports, such as Japan, South Korea, South East Asia and Germany, and will therefore affect the State’s trade sector. However, this will be partly offset by the fact that demand for oil substitutes should also rise, benefiting Queensland coal exports (which account for around 30% of total merchandise exports).
Inflation
The Australian Government has forecast national inflation to average 2% in 2004-05. The appreciation in the A$ over much of 2003 and early 2004 has assisted in keeping inflation low, with national prices of tradeable goods and services falling 0.5% over the year to March quarter 2004, compared with a rise in non-tradeable prices of 4.1%. Therefore, the possibility of any further depreciation in the A$, along with higher oil prices, represent significant risks to the inflation outlook in 2004-05. If underlying inflation moves toward the upper limit of the Reserve Bank of Australia’s 2-3% target band in 2004, this may require some tightening in interest rates, adversely impacting on Queensland and Australian economic growth in 2004-05.
Dwelling Cycle
The dwelling cycle represents the main short-term domestic risk to Queensland economic growth. The economic forecasts for 2004-05 are based on a ‘levelling off’ of house prices, with recent signs that the current housing cycle has peaked or is nearing a peak in many parts of Queensland. As a result, the level of construction activity in the dwelling sector is forecast to remain unchanged in 2004-05, with a decline in the construction of new houses likely to be offset by an increase in alterations and additions activity (which currently comprises almost half of total dwelling investment).
If any combination of factors, including the impact of any future interest rate rises and the relative performance of other investment classes such as equities, leads to a substantial fall in house prices, dwelling investment and related consumption expenditure in 2004-05 may be weaker than currently forecast. However, the combination of Queensland’s stronger population growth, the wealth effect created by recent house price increases and the apparent lack of any oversupply of housing in Queensland may result in dwelling investment continuing to grow in 2004-05, leading to stronger than forecast economic growth.
24
|
Box 2.3 Impacts of the drought on the Queensland economy |
The drought which persisted throughout much of Queensland in 2002-03 is expected to continue to affect the State’s economic performance in 2003-04 and 2004-05. Although seasonal conditions have improved in many regions, rainfall deficiencies persist in a number of areas and around 60% of the land area of the State remained drought declared in late May 2004. Due to the different mix of the Queensland’s agricultural commodities (primarily beef, horticulture and sugar), the most significant impacts of the drought appear to be occurring at a later stage than in the southern states. Agricultural production in Queensland is estimated to have fallen by 5.4% in 2002-03, although this impact was not as large as that experienced in either New South Wales (-20.0%) or Victoria (-18.2%), where crop production comprises a larger proportion of agricultural output. However, while the Australian Bureau of Agricultural and Resource Economics (ABARE) forecasts that agricultural production nationally will recover substantially in 2003-04, increasing by more than 13%, Queensland’s Department of Primary Industries and Fisheries estimates the State’s agricultural production will remain largely unchanged compared with the previous year. The beef industry has been particularly hard hit by the drought. The stock of meat cattle in the State is estimated to have fallen by 588,000 head in 2002-03, with ongoing impacts likely to be felt for some time as farmers withhold cattle from sale to rebuild stock. Sugar production in Australia (of which Queensland comprises more than 90%) is also expected to decrease in 2003-04, with ABARE forecasting a decline of around 8.0% compared with 2002-03. In contrast, Queensland’s crop production is forecast to grow substantially in 2003-04, with ABARE forecasting winter and summer harvests to increase by 62% and 55% respectively. However, this improvement is not as large as that forecast in the southern states, where vastly improved seasonal conditions are expected to result in record winter crop production. Furthermore, crop production represents a smaller share of agricultural production in Queensland than in those states. The drought has also continued to have a substantial impact on the State’s rural exports in 2003-04. Queensland’s rural exports fell by 13.7% in 2002-03 and declined a further 12.3% in the first three quarters of 2003-04, compared with the same period a year earlier. Meanwhile, the more delayed impact of the drought in Queensland is most apparent in terms of its employment impacts. Agricultural employment in Queensland declined by only 8.5% in 2002-03, compared with a decline of 18.0% in the rest of Australia. However, during the first three quarters of 2003-04, while agricultural employment in the rest of Australia increased by 3.5%, employment in Queensland’s agricultural sector continued to fall by 12.9%, compared with the same period a year earlier. The outlook for Queensland’s agricultural sector in 2004-05 and beyond remains heavily dependent on the weather. While seasonal conditions appear to be improving, a State-wide recovery from the drought is expected to take some time, with ongoing impacts on Queensland’s agricultural production, exports, employment and overall economic growth. Chart 1: Employment Growth in Agriculture1 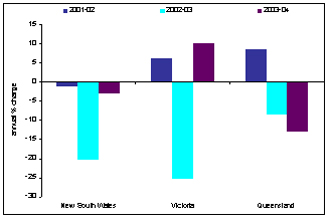
Note: 1. Annual growth in 2003-04 is calculated as the average level of employment in the first three quarters of 2003-04 compared with the first three quarters of 2002-03 |
Drought
The number of Queensland shires officially drought declared has been reduced in recent months, following improved rainfalls throughout parts of the State in early 2004. However, some regions have not experienced any improvement in water availability and further rainfalls are required to result in a significant increase in rural production. Furthermore, there is still some possibility that the El Nino conditions, normally associated with reduced rainfalls, may continue to influence Queensland’s weather throughout 2004-05. Box 2.3 provides more details of current drought conditions and the outlook for the agriculture sector.
Should the drought persist for longer than expected or conditions worsen, rural production and exports, and therefore overall economic activity and employment, may grow at a lower rate than currently forecast.
Population Growth
At the time of preparing the economic forecasts, data related to the components of population growth in Queensland were only available up to September quarter 2003, the first quarter of 2003-04. Queensland has experienced high levels of both net interstate migration and net overseas migration over the last three years and the forecast population growth of 2¼% in 2004-05 is based on this trend continuing. However, if net migration eases to levels similar to those experienced prior to the recent period of strong growth, this would result in lower population growth and weaker economic growth than currently forecast, particularly in relation to household consumption and dwelling investment.
Medium-Term Outlook
Queensland Treasury compiles projections for key economic parameters for the three years following the immediate forecast period in the annual Budget and in the Mid-Year Fiscal and Economic Review. The projections for the years 2005-06 to 2007-08, shown in Table 2.3, provide a broad indication of the likely path of economic conditions in the State and nationally over the medium-term, rather than point estimates of actual growth for this period.
While economic growth in Queensland’s major trading partners is forecast to strengthen in 2004-05, world economic conditions are expected to then stabilize over the projection period, following an expected monetary tightening in the United States and other major economies. As discussed earlier, the sustainability of economic growth in China and the recovery in the United States remain key risks to major trading partner growth.
The projections also assume a continuation of the longer-term Australian Government fiscal policy and the monetary policy stance of the Reserve Bank of Australia. These aim to maintain a stable budget position and a low inflation environment to foster sustainable economic growth. The projections incorporate the anticipated impacts of the 2004-05 Commonwealth Budget released on 11 May 2004, including changes to income taxation and family benefit arrangements.
Economic growth in Queensland is projected to return towards the average growth rate over the past decade, with an increase of around 4½% per annum projected for the period to 2007-08. Jobs growth of 2½% per annum over this period is projected to outpace population
25
growth of 1¾% per annum. This implies an ongoing improvement in the unemployment rate over the medium term, provided there is no unanticipated rise in labour force participation.
An economic strategy, focused on infrastructure provision and raising productivity, is expected to see Queensland’s economic growth continue to outperform that nationally over the longer-term. This economic strategy is described in detail in the following chapter.
| | | | | | | | |
Table 2.3 Economic Parameters/Projections1 (annual % change) |
| | | Outcome
2002-03
% | | Est. Act.
2003-04
% | | Forecast
2004-05
% | | Projections2
2005-06 to
2007-08 % |
Queensland | | | | | | | | |
Gross state product3 | | 4.5 | | 4 | | 4 1/4 | | 4 1/2 |
Employment | | 3.7 | | 3 1/4 | | 2 1/4 | | 2 1/2 |
Inflation | | 3.2 | | 3 | | 2 1/2 | | 2 1/2 |
Average earnings4 | | 3.4 | | 3 1/2 | | 4 | | 3 3/4 |
Population | | 2.3 | | 2 1/4 | | 2 1/4 | | 1 3/4 |
| | | | | |
Australia | | | | | | | | |
Gross domestic product3 | | 2.9 | | 3 3/4 | | 3 1/2 | | 3 1/2 |
Employment | | 2.5 | | 1 3/4 | | 1 3/4 | | 1 1/2 |
Inflation | | 3.1 | | 2 1/4 | | 2 | | 2 1/2 |
Wage Cost Index4 | | 3.5 | | 3 3/4 | | 3 3/4 | | 3 3/4 |
Population | | 1.2 | | 1 1/4 | | 1 1/4 | | 1 1/4 |
Notes: 1. Decimal point figures indicate an actual outcome. 2. Average annual percentage change over the period. 3. Chain volume measure, 2001-02 reference year. 4. The Australian Government has moved to a measure of growth in wages based on the ABS Wage Cost Index, whereas the State measure of average earnings is still estimated on a State Accounts basis. Sources: Queensland Treasury and Commonwealth Treasury. |
26
KEY POINTS
| | • | Queensland’s economic strategy targets the key drivers of economic growth – productivity and participation – by fostering innovation and investment in infrastructure and human capital. |
| | • | A focus on drivers of growth will generate higher rates of sustainable economic growth and living standards to support the State’s strong population growth and, over the longer-term, the ageing of the population. |
| | • | Queensland’s strong population growth is projected to continue, with the State’s population expected to increase from 3.8 million people in 2003 to around 5.3 million people in 2026. As a result, Queensland is projected to increase its share of Australia’s population from 19% to around 22% by 2026. |
| | • | To accommodate this expected population growth, the Government is investing in new infrastructure, improving urban growth management and infrastructure planning, and encouraging private sector investment. |
| | • | Through the economic strategy, the Government is raising the State’s capacity for sustainable growth in economic activity and living standards to ensure Queensland is well placed to respond to population ageing. |
POSITIONING QUEENSLAND FOR FUTURE GROWTH
The Queensland Government’s economic strategy aims to enhance Queensland’s economic performance and provide a better quality of life for all Queenslanders, in keeping with the Government’s key economic and social policy priorities outlined in its Charter of Social and Fiscal Responsibility.
The economic strategy not only supports Queensland’s economic performance over the medium-term but positions the State for solid growth in the future. Increasing the capacity of the economy to generate sustainable, long-term rates of growth will support future improvements in living standards and increased employment opportunities for all Queenslanders.
The economic strategy will also ensure the Queensland economy is well placed to respond to the State’s immediate population pressures and the longer-term challenge of population ageing.
This chapter discusses how the economic strategy frames the Government’s response to the demographic challenges facing the State.
27
QUEENSLAND’S DEMOGRAPHIC CHALLENGES
Population Growth
Queensland has been Australia’s fastest growing state since the mid-1970s. A comparison of population growth rates over the last 20 years is shown in Chart 3.1. Queensland recorded an average annual rate of population growth of 2.1% over the two decades to June 2003, compared with growth in the rest of Australia of 1.1%. As a result, Queensland has accounted for an increasing share of Australia’s population, rising from 16.1% in 1982-83 to 19.0% in 2002-03.
Chart 3.1
Annual Population Growth, Queensland and Rest of Australia
1982-83 to 2002-03
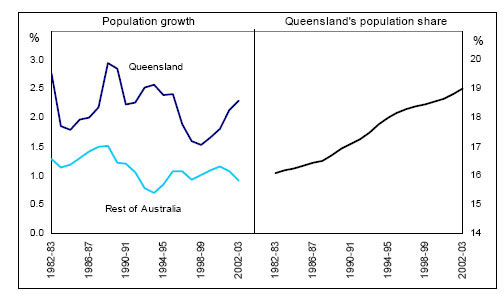
Source: ABS 3101.0.
Queensland’s strong population growth is expected to continue over the short-to-medium term: by 2010 the State’s population is projected to increase by around 13%, nearly double the national rate of population growth. Long-term growth projections indicate that although the number of deaths is projected to exceed the number of births from the 2040s, this is expected to be more than offset by continuing net gains from migration.2 Under specific assumptions relating to future levels of fertility, mortality, overseas migration and interstate migration, Queensland’s population is expected to rise from 3.8 million people in 2003 to around 5.3 million people in 2026, increasing the State’s population share from 19% to around 22%. If future fertility and migration outcomes are at the high end of expectations, Queensland’s population could more than double from its current level over the next half century.
| 1 | Queensland Government Population Projections, 2003. |
28
Chart 3.2 compares projected population growth rates across a range of developed countries. Queensland is projected to grow at an average annual rate of around 1¼% over the 50 years to 2050, well exceeding the growth projected in other developed economies and the State’s key trading partners.
Chart 3.2
Projected Population Growth, Selected Countries and Queensland
2000 to 2050, Average annual growth rate
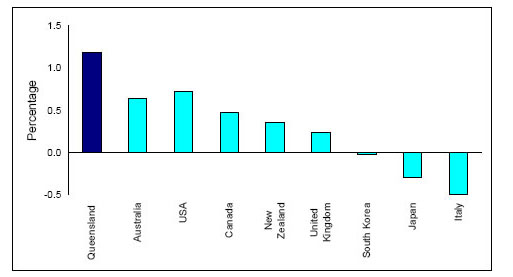
Sources: United Nations, World Population Prospects - The 2002 Revision, Population Database 2003; ABS 3101.0 and 3222.0; Queensland Government Population Projections, 2003
Projected population changes in Queensland’s regions for the period 2001 to 2026 are illustrated in Figure 3.1. Nearly three-quarters of the State’s population increase over this period will be concentrated in the south east region (Brisbane and Moreton). South East Queensland has absorbed more than one million people in the last 25 years and a further one million people are projected within the next 20 years.
While this rapid population growth offers opportunities, there are also many challenges. The State’s growing population increases demand for infrastructure, goods and services, including government-provided education and health services. As the population becomes increasingly concentrated in South East Queensland, there is also a need for an effective and coordinated approach to urban management to respond to the environmental and infrastructure pressures created by a growing population.
29
Figure 3.1
Queensland Population 2026 and Population Changes 2001 to 2026,
by Statistical Division
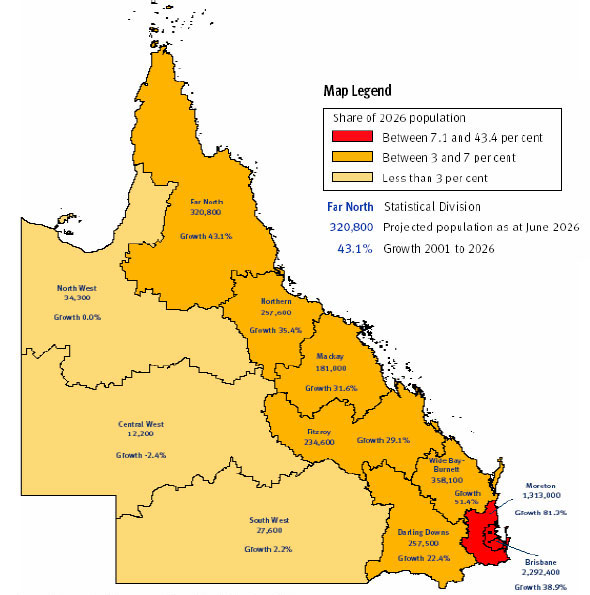
Source: Queensland Government Population Projections, 2003
Population Ageing
Population ageing is a global trend which is increasing the proportion of older people in the population. It is the result of three beneficial trends shared by developed countries – longer healthier lives, higher material living standards and increased participation of women in the labour force – which have combined to reduce fertility and mortality rates.
The aged dependency ratio – the ratio of persons aged 65 years and above, to persons aged between 20 and 64 – is expected to double in the majority of OECD countries, including Australia, by 2050 (Chart 3.3). A rising ratio indicates a growing aged population being supported by relatively fewer people of working age. Queensland’s population is projected to age at a similar rate to that of the rest of Australia.
Chart 3.3
Aged Dependency Ratios for Selected OECD Countries, 2000 and 2050
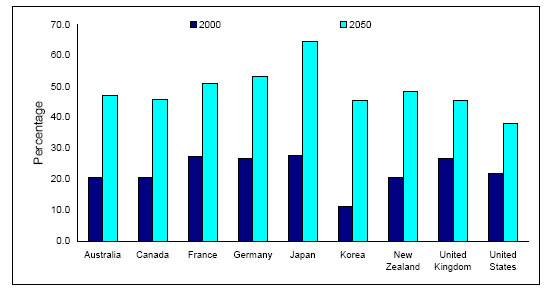
Note: Aged dependency ratio based on working age population of 20-64 years.
Source: Casey et.al. (2003) Policies for an Ageing Society: Recent Measures and Areas for Further Reform, OECD Economics Department Working Paper.
Reflecting the anticipated ageing of the State’s population, the median age of Queenslanders is projected to increase from 35.5 years in 2003, to 40.2 years by 2021, and then to 47.3 years by 2051. Queensland’s current, past and future age profiles are shown in Chart 3.4, which also shows the progression of the ‘baby boom’ age groups (those born between 1946 and 1965).
While Queensland’s total population in 2051 is expected to be 78% larger than in 2001, there are marked differences in the growth patterns across age cohorts. Over this 50 year period, the fastest growing cohorts are those aged 65 years and over – projected to increase more than fourfold (324.2%) – and the older working age group (45 to 64 years) – projected to almost double (92.8%). In contrast, those aged less than 15 years are projected to increase by only 18.6% and those of young working age (15 to 44 years) by only 34.3%.
30
Chart 3.4
Population Pyramids, Queensland, 1976, 2001, 2026 and 2051
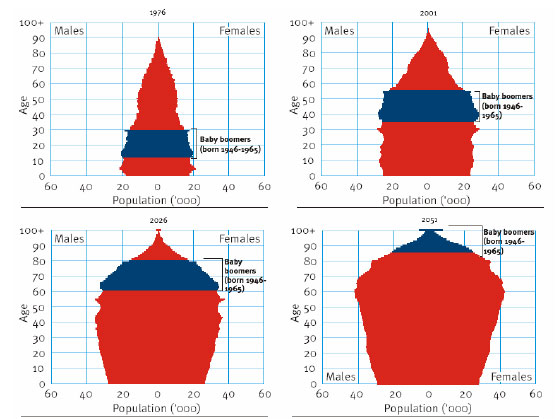
Sources: ABS 3101.0; Queensland Government Population Projections, 2003 (medium series)
Implications for the Economy
The changing age structure of the population is expected to have implications for the growth of the Queensland economy. The pace of future economic growth depends on the rate at which the workforce grows, and on the growth of output per worker (productivity). While the impacts of population ageing on future productivity growth are uncertain, the potential rate of workforce growth going forward is more readily analysed, given its links with population growth and current information on age-specific participation rates.
Labour force participation currently declines sharply after 54 years of age (Chart 3.5). As a result, the age groups which are projected to grow the most rapidly in the future are those that currently participate least in the workforce. Accordingly, based on current patterns of labour force participation, an ageing population is projected to result in a slower pace of labour force growth in Queensland.
31
Chart 3.5
Age-Specific Participation Rates, Queensland, 2003
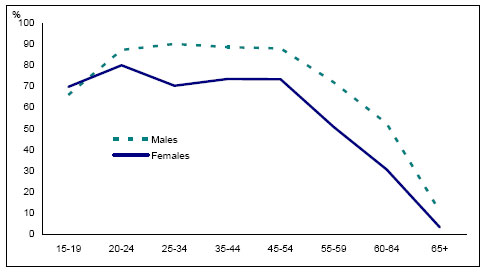
Source: ABS 6202.0
Assuming labour productivity continues to grow at its historical average rate and without any associated change in government policy, slower labour force growth would be accompanied by a slower rate of economic growth. During the 1990s, Queensland’s real gross state product (GSP) grew at an average of 4.5% per annum. With the projected slowing of labour force growth, GSP growth could moderate to around 3% per annum by 2020, and then slow further to around 2½% per annum by 2040. Under these projections, growth of real GSP per capita, a measure of material living standards, could also slow from 2.4% per annum over the 1990s to around 1¾% per annum in the 2030s.
With the potential to slow economic growth, population ageing raises concerns about future improvements in living standards and governments’ capacity to pay for the services consumed by older people. Without policy intervention, population ageing is expected to put pressure on the States’ fiscal position as a result of higher expenditure growth associated largely with increased demand for health services and, to a lesser extent, slower revenue growth.
It is important to note that most projections of the impact of ageing represent a ‘worst case scenario’, in the sense that they assume no change to government policy settings. However, governments have an important role to play in responding to the challenges of an ageing population. Through the economic strategy, the Queensland Government is implementing pre-emptive policies to raise the State’s long-run, sustainable rate of economic growth.
32
RESPONDING TO QUEENSLAND’S DEMOGRAPHIC CHALLENGES
The Queensland Government’s response to these short and long-term demographic trends is underpinned by the State’s economic strategy. Through a focus on increasing productivity growth and labour force participation – the key drivers of economic growth – the strategy aims to generate higher rates of sustainable economic growth and real incomes to support the State’s population growth and ageing population. Raising real per capita incomes is important to addressing the fiscal pressures associated with strong population growth and ageing. Higher incomes raise the revenue base of government, providing the means to increase spending on core services, such as health, education and infrastructure, without the need for increased tax rates. The strategy aims to achieve this by fostering innovation and investment in human capital and infrastructure (see Figure 3.2).
Figure 3.2
Queensland’s Response to Demographic Challenges
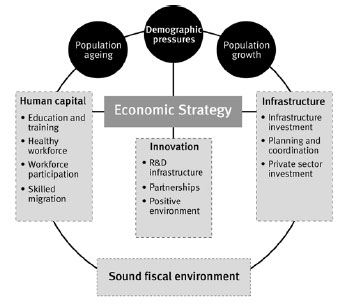
Population Growth
The Queensland Government is responding to the pressures of strong population growth by ensuring Queensland has an appropriate infrastructure base to accommodate a growing population. This policy objective is supported by the Government’s commitment to investing in public infrastructure, managing urban growth and infrastructure planning, and encouraging private sector investment.
Investing in Public Infrastructure
The provision of appropriate capital infrastructure forms a key element of the economic strategy in recognition of the role of infrastructure investment in increasing the State’s productive capacity, enhancing economic growth and raising the living standards of all Queenslanders. The Queensland Government recognises the need to maintain rates of capital investment in an environment of rapid population growth if Queensland is to sustain economic growth.
However, public infrastructure is not only a platform for sustainable economic growth but also for government service provision, with many core services required by a growing population, such as health and education, reliant on General Government sector infrastructure.
Despite increased capacity for private provision in recent years, infrastructure development remains a core policy priority of the Government. Public investment in capital works continues to provide much of the key infrastructure used by the private sector in the production of goods and services. Through the investments of Government-owned corporations in key infrastructure, such as energy and transport infrastructure, the Government has an important influence on the performance of the State’s business and industry.
The Government’s commitment to improving the State’s infrastructure base is reflected in the scale of the State’s capital program over the last decade and its priority in this term to support Queensland’s regions through state-wide infrastructure development. Capital outlays are estimated to be around $6.049 billion in 2004-05, representing a 19% increase on 2003-04 estimated actual capital outlays. Budget Paper No. 3 - Capital Statement details the Government’s proposed capital outlays in 2004-05.
33
Purchases of non-financial assets by the General Government sector are expected to represent around 47% of total State purchases in 2004-05. On a per capita basis, the Queensland Government will continue to fund the largest capital program of any state (Chart 3.6).
34
Chart 3.6
General Government Purchases of Non-Financial Assets
$ per capita
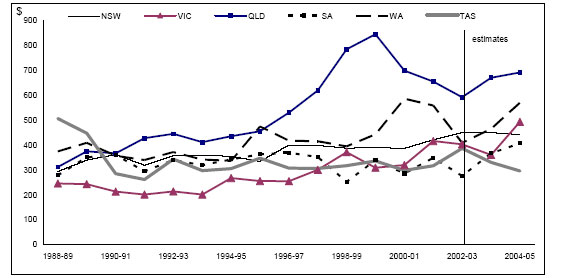
Sources: Unpublished ABS data; ABS 5512.0 and 3101.0; various State Budget papers; NSW Mid-Year Review; population estimates from Commonwealth Budget Paper No.3, 2004-05.
Over recent years, State Government investment has returned to its long-term trend following the completion of a number of major capital works programs, such as the Pacific Motorway upgrade and Statewide Health Building Program. Significant capital expenditure will occur over the next few years, reflecting new spending programs announced in this Budget and capital commitments under the $1.4 billion Smart State Building Fund and $400 million Priority Infrastructure Package.
Queensland compares well against other states in terms of holdings of General Government assets per capita (Chart 3.7). The majority of these assets are roads, schools, hospitals and other infrastructure used to provide services to Queenslanders. In 2004-05, per capita levels of non-financial asset holdings in the General Government sector are expected to be $14,890 in Queensland, compared with the all states’ average of $11,621. General Government non-financial assets are projected to total $58.479 billion at 30 June 2005.
Chart 3.7
General Government Non-Financial Assets, Per Capita, 2004-05
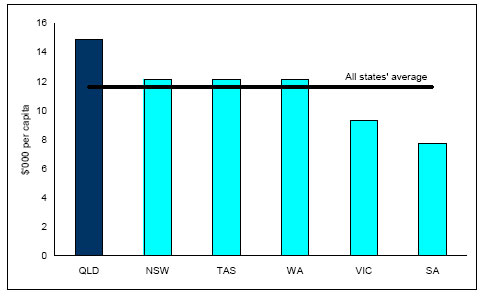
Note:
| 1. | Western Australia values land under roads as part of its overall asset base. This has been adjusted to allow comparison with other jurisdictions which do not value land under roads. |
Sources: various State Budget papers; NSW Mid-Year Review; population estimates from Commonwealth Budget Paper No.3, 2004-05.
The Queensland Government also supports infrastructure provision by local government through grants for capital works. These grants include capital works subsidies provided towards the costs of local public infrastructure and road subsidies for local roads, networks and drainage. In 2004-05, the Queensland Government will provide around $300 million in capital grants to local governments.
35
Managing Urban Growth and Infrastructure Planning
Infrastructure planning and coordination have a central role in the Government’s strategy for managing urban growth and ensuring the State has the infrastructure base to support the needs of a growing population. As infrastructure is typically lumpy and long-lived, infrastructure needs to be provided within a strategic and forward-looking planning framework which anticipates demographic, environmental, industry and technological change and appropriately manages risk to maintain economic growth and standards of living.
The State Government is committed to regional planning throughout Queensland. In support of the integrated plans for seven key growth regions outside the South East Queensland metropolitan region, $3.6 million has been committed over the next four years to carry out regional plan implementation strategies. This funding recognises the increasing importance of regional plans in informing both infrastructure and service delivery strategies.
The Government has also recently established an Office of Urban Management responsible for the development and coordination of regional planning and infrastructure provision in South East Queensland. The establishment of the Office reflects the Government’s priority to ensure that accelerated growth in South East Queensland is managed in an integrated and coordinated manner (refer Box 3.1).
Transport planning is a key priority in South East Queensland and the Government continues to invest in roads and public transport infrastructure to ensure that population growth does not compromise the region’s liveability. Through initiatives, such as TransLink and bus corridor infrastructure, the Queensland Government is seeking to manage urban transport demand and the challenges associated with the region’s growing population, such as traffic congestion and declining air quality. The newly opened Inner Northern Busway and the already successful South East Busway are recent examples of the Queensland Government’s commitment to improving public transport infrastructure.
The Queensland Government is introducing integrated ticketing and improved coordination of transport services across South East Queensland to increase the number of public transport users as a means of reducing pressure on the State’s road infrastructure. From 1 July 2004, TransLink will provide one single public transport network covering South East Queensland, transforming the region’s public transport system with cheaper and integrated fares and new regional services. By improving transport choice, access and flexibility, TransLink is expected to lead to a 5% increase in public transport use over the next two years.
36
| | |
Box 3.1 Office of Urban Management |
The Office of Urban Management has been established to manage urban growth and infrastructure provision in South East Queensland in recognition of the region’s very strong population pressures and the need for a more coordinated approach to infrastructure planning, management and delivery to meet the region’s future infrastructure requirements. The Office will progress the completion and implementation of the SEQ2021 regional planning process and review the Integrated Planning Act to ensure State Government agencies and local governments in South East Queensland take proper account of the SEQ2021 Regional Plan in their infrastructure programs and planning schemes (Figure 3.3). To develop the new SEQ 2021 Regional Plan, the Office will work with local governments in the region, through the Regional Coordination Committee and the South East Queensland Regional Organisation of Councils, and with business and community groups. |
| | |
The Plan will identify areas suitable for urban development, regional business/economic centres, rural areas to be retained as non-urban, regional open space, water catchments and major infrastructure projects and corridors. A draft of the Plan is expected to be completed by the end of October 2004 for stakeholder and public consultation prior to finalisation by April 2005. The Office will also prepare a regional infrastructure plan and have the power to ensure that major capital works and infrastructure programs of State agencies and local governments align with, and support implementation of, the Regional Plan. To better coordinate infrastructure planning and development with the Budget process, the Office will work with Queensland Treasury to ensure major infrastructure projects are programmed into Budget Forward Estimates sufficiently ahead of time to ensure infrastructure is delivered when required by the Regional Plan. Operating as a separate entity within the Department of Local Government, Planning, Sport and Recreation, the Office reports directly to the Deputy Premier, Treasurer and Minister for Sport on all regional planning and policy matters. | | Figure 3.3 Coverage of SEQ2021
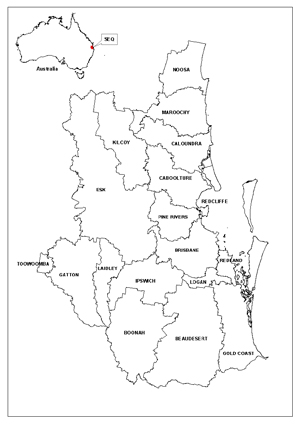 |
37
Private Sector Investment in Infrastructure
The private sector plays a significant role in providing the necessary infrastructure and services to support the State’s population growth, with the private sector contributing nearly 80% of the State’s fixed capital investment on average over the last five years (Chart 3.8). The maintenance of a stable, supportive economic environment is important to enabling Queensland’s industries and businesses to make effective and efficient investment decisions. Accordingly, the Queensland Government recognises its responsibility in providing a sound business environment and efficient tax and regulatory arrangements to support capital investment by the private sector.
Chart 3.8
Composition of Gross Fixed Capital Formation in Queensland
Five-year average, 1998-99 - 2002-03
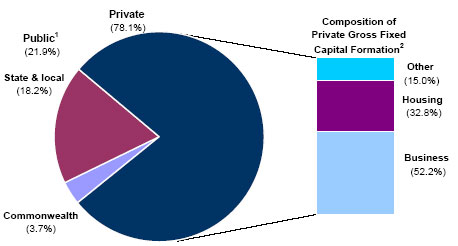
Notes:
| 1. | Includes public trading enterprises. |
| 2. | Business investment includes machinery and equipment and other buildings and structures and excludes net purchases of second-hand public-sector assets. |
Source: Queensland State Accounts
The Government’s policy role in the reform of key infrastructure industries, such as water and energy, also represents a critical factor in generating economy-wide productivity improvements and encouraging investment in infrastructure. For example, the Queensland Government’s Office of Energy is participating in the Ministerial Council on Energy’s review of gas market arrangements to support private sector investment in gas infrastructure to meet rapidly growing demand.
In order to meet the infrastructure needs of the State’s growing population, the Queensland Government also continues to encourage private sector investment in public infrastructure delivery, when it can be shown the State will achieve a better value for money outcome. There are currently eight major infrastructure projects which have progressed beyond the preliminary assessment stage of the Government’s Public Private Partnership Policy and Value for Money Framework, including the Southbank Education and Training Precinct. (See Budget Paper No. 3 for more information on the private sector’s contribution to the delivery of public infrastructure.)
Responding to Population Ageing
Population ageing raises the importance of increasing real per capita incomes to address the potential fiscal pressures associated with ageing. Real incomes can be increased by raising productivity (output per hour worked) or by increasing workforce participation (total hours worked). By identifying these key drivers of growth – productivity and participation – the economic strategy plays a significant role in informing the State Government’s response to population ageing. The Queensland Government is pursuing a number of complementary policies and initiatives to increase productivity and labour force participation through a focus on innovation and human capital.
Innovation
Innovation is a core part of the Government’s Smart State vision and broader economic strategy, reflecting the role of innovation as a primary source of productivity growth and improved living standards. Innovation, the process of converting ideas and knowledge into goods and services valued by the community, will represent a critical source of economic growth as the population ages.
38
The Queensland Government’s innovation strategy has three elements – providing research and development infrastructure to increase the innovative capacity of the economy, promoting public-private joint ventures where public sector innovations are developed into commercial products of broad community benefit, and ensuring an environment conducive to innovation.
In August 2003, as part of Queensland the Smart State – Investing in Science: Research, Education and Innovation, the Government announced an additional $100 million in investment towards research and development infrastructure and research projects over four years. This Budget supports the Government’s commitment to innovation with $43 million allocated to new programs and projects over the five years commencing in 2004-05.
Human Capital
The Queensland Government recognises the importance of investing in human capital as a means of raising labour force participation and productivity. Increases in human capital – the stock of knowledge, skills and attributes available in the workforce – represent a significant driver of improved employment outcomes, productivity growth and higher living standards (Table 3.1). The Government is playing a proactive role in increasing the State’s human capital by investing in education, training and health, implementing measures to increase the capacity for people to participate in the labour force, and encouraging skilled migration to Queensland.
| | | | | | |
Table 3.1 Labour Force Outcomes by Education Level, Australia, 2003 |
| Highest level of education | | Labour force outcomes | | % with gross weekly Income >$1,0001 |
| | | Participation rate | | Unemployment rate | |
Postgraduate degree | | 89.4 | | 3.1 | | 45.4 |
Bachelor degree | | 86.5 | | 3.1 | | 29.2 |
Advanced diploma / diploma | | 82.6 | | 4.2 | | 16.9 |
Certificate III / IV | | 87.2 | | 4.1 | | 11.3 |
No post school qualification | | 66.9 | | 8.6 | | 4.4 |
Note: 1. In 2001. Sources: ABS 6227.0; ABS Census of Population and Housing 2001, unpublished data |
39
Investing in Education and Training
The Government’s commitment to education and training is reflected in the Queensland State Education — 2010 strategy and Queensland the Smart State, Education and Training Reforms for the Future (ETRF) package. Recognising the link between education and employment outcomes, the strategy aims to lift the Year 12 completion rate from 68% in 1998 to 88% in 2010. The ETRF package introduces a range of initiatives to ensure young people complete at least a Senior Certificate or Certificate III vocational qualification. The reforms also include a full-time preparatory year of schooling prior to Year 1, along with improved curriculum, teaching and assessment in the Middle Phase of Learning. Queensland has allocated significant funding to senior school initiatives over the next four years to expand senior schooling pathways that lead to further education, training and work. Vocational education and training (VET) in schools is an important component of Queensland’s ETRF package.
In the context of population ageing, the ETRF package makes a significant contribution by developing the skills and capacity of the current generation of youth who will reach their prime working age as the baby-boomer generation retires.
Investing in a Healthy Workforce
Health can affect the ability of Queenslanders to participate fully in all areas of the community, including employment. The Queensland Government is committed to providing high-quality healthcare and supports the need to invest in preventative health and early intervention to improve the health outcomes of all Queenslanders and manage health care costs into the future. It is well recognised that many of the health gains over the next 20 years are to be made by targeting lifestyle factors and by influencing socioeconomic factors which have a significant role in determining people’s health and wellbeing.
The Smart State: Health 2020 Directions Statement provides a broad overview of the key directions for the Queensland health system and establishes the objective of Queensland Health, which is to promote the health and wellbeing of Queenslanders. Central to this objective is the provision of health promotion and illness prevention services, acute treatment and rehabilitation services, and health maintenance activities directed to people with chronic conditions.
Providing Quality Workplaces
The Queensland Government recognises the importance of quality workplaces to raising labour force participation and productivity. A quality workplace is one which is safe, supports effective relationships between management and employees, provides meaningful work, and supports a balance between work and other commitments, such as family responsibilities.
The Government supports quality workplaces through an industrial relations system that provides social justice for all employees and employers, assists in balancing work and family life, and ensures wages and employment conditions provide fair standards that are conducive to job creation and labour force participation.
40
Supporting Employment Programs
Employment programs form a key part of the State Government’s strategy to raise labour force participation. Despite the centrality of education and training to raising labour force participation, some groups within the community are unlikely to participate in the paid labour force without the assistance of targeted employment programs.
The Government’s Breaking the Unemployment Cycle initiative plays a crucial role in increasing the State’s overall human capital and the productive capacity of Queensland’s labour force. The initiative assists those job seekers least competitive in the labour market to develop skills through paid work experience on community projects, job preparation and employment and training assistance. It also helps to alleviate skills shortages through additional apprenticeships and traineeships. Implemented in 1998, the initiative comprises a suite of labour market programs that originally aimed to create over 56,000 apprentice, trainee and job placement opportunities over six years to June 2004 at a cost of $470 million. The Queensland Government has committed a further $278 million in funding, including up to $15 million for the Worker Assistance Program, to extend the initiative to 2006-07.
The initiative has already secured over 71,000 job placements, putting it on track to achieve over 100,000 by June 2007. Mature-age jobseekers will be among those to receive assistance over the next three years. Two new programs – Get Set for Work and the Youth Training Incentive – will target young people as part of the Government’s ETRF package.
Encouraging Labour Force Participation of Older Workers
Encouraging workers approaching retirement to remain in the labour market is a critical strategy to increase labour force participation. However, ensuring older workers have access to the labour market is also important on social equity grounds, since employment provides the opportunity to build the savings necessary to support a comfortable lifestyle in retirement. Although much of the focus in developed economies has been on removing incentives to retire (through changes to retirement ages) and reform of superannuation, pensions and welfare, the Queensland Government supports positive strategies to encourage the participation of older workers in the labour force, such as addressing age discrimination, smoothing the work-to-retirement transition and promoting lifelong learning.
Retention of mature-aged workers is emerging as an important labour market issue and the Queensland public service workforce is not unaffected. The Queensland Government is currently implementing measures to encourage the extended participation of mature-aged workers in the public sector workforce. Encouraging the increased workforce participation of older workers ensures improved transfer and retention of valuable organisational knowledge and skills and increased scope and capacity for Queensland public sector agencies to continue to build highly skilled and committed workforces.
Improving Access to Employment for Disabled Queenslanders
Disability can represent a significant barrier to full and inclusive participation in the community, including employment. People with a disability have the same right to work and contribute to society as other people, but they can find it much harder to get a job. For instance, across the OECD, employment rates for working age disabled people are nearly 30 percentage points lower, on average, than for non-disabled people.3
| 2 | OECD (2003) Society at a Glance – OECD Social Indicators 2002. OECD: Paris. |
41
The Queensland Government is committed to providing appropriate support to disabled Queenslanders with the ability and skills to participate in employment. Programs delivered by the Queensland Government, through Disability Services Queensland, provide valuable social and developmental support to prepare and equip disabled Queenslanders to participate in employment, and to ensure they are better able to sustain employment once employed. These programs offer a range of services, including assistance with the transition from education to work and coordinated access to employment services and work experience.
Providing Access to Housing and Public Transport
In some communities, lack of appropriate housing and inadequate transport can represent an impediment to labour force participation. The availability of public transport, especially for those without ready access to a car, is clearly important to facilitating access to the labour market. Similarly, secure, affordable, appropriately located housing can provide a stable base for people to participate in the labour force and education and training.
The Queensland Government provides a range of housing products and services to Queensland households and communities, while also seeking to facilitate the provision of affordable housing in the wider housing system. Through Transport 2007, the transport access plan for South East Queensland, and Translink (as discussed above), the Queensland Government is improving access to employment by focusing on the provision of an efficient, cost-effective, safe and equitable transport system. The Queensland Government has also developed several Integrated Transport Plans across the State focusing on modal and service integration and the integration of land use and transport planning.
Encouraging Skilled Migration
Skilled migration forms an important element of the Government’s economic strategy, as skilled migrants can assist in addressing local skills shortages and, by increasing the State’s human capital, support productivity growth. The Queensland Government actively encourages skilled migration and is implementing measures to increase Queensland’s share of net international migration, focusing on highly skilled and professional occupations as part of its Smart State strategy.
NEED FOR COLLABORATION ACROSS GOVERNMENTS
The State Government’s economic strategy provides a significant response to Queensland’s demographic challenges. However, collaboration across all levels of government will be important in delivering a coherent and comprehensive strategy to respond to the pressures of population growth and, over the longer term, population ageing.
The importance of infrastructure as a platform for sustainable economic growth and affordable social service provision demands the effective coordination of infrastructure across tiers of government to ensure infrastructure is appropriately planned and funded. For instance, the new Office of Urban Management will adopt a cooperative model recognising that both State and local government are partners in the process of regional planning.
42
Inter-governmental coordination will be paramount in preparing coherent national responses to population ageing. The need for cooperation between tiers of government is reinforced by current inter-governmental financial arrangements, where decisions by the Australian Government have the capacity to affect the states’ abilities to afford future expenditure pressures. Accordingly, there is a need for the Australian Government to work with the states and ensure that its decisions do not compromise the capacity of the states to meet the demands of an ageing population.
43
KEY POINTS
| | • | The key areas for service enhancements in the 2004-05 Budget include child protection, disability services, education and health. |
| | • | A significant investment in health services will be made across the State, involving a range of enhancements such as $90 million over three years to treat additional elective surgery patients and reduce elective surgery waiting lists, and $77 million in capital funding over three years for the redevelopment of the Prince Charles Hospital emergency department and provision of general hospital services. |
| | • | A continuation of initiatives will make Education and Training Reforms for the Future a reality for more Queenslanders. Funding for the reform package of more than $135 million in 2004-05, rising to over $231 million in 2005-06 and more than $307 million in 2006-07, includes substantial investment in schools participating in the Preparing for School trial and planning for state-wide implementation of the Preparatory Year for 2007, reducing state school class sizes in Years 4 to 10, reform to secondary schooling pathways and information and communication technologies. |
| | • | The full implementation of child safety reforms will involve additional resourcing since the 2003-04 Budget across all agencies in excess of $214 million per annum by 2006-07. This will provide for a range of service enhancements including additional staffing, increased alternative care placements, therapeutic services and enhanced Suspected Child Abuse and Neglect Teams. |
| | • | An additional $220 million over four years will further enhance and expand disability services and support the viability and sustainability of service providers. |
| | • | The Budget commits $75 million over five years to end the broadscale clearing of remnant native vegetation by 2006. This brings total State funding for this initiative to $150 million over five years. |
INTRODUCTION
This chapter details:
| | • | the Government’s priorities which underpin the 2004-05 Budget |
| | • | service delivery highlights for each of the Government’s seven key priorities |
| | • | Queensland’s financial management and governance framework. |
44
QUEENSLAND GOVERNMENT PRIORITIES
The Queensland Government Priorities specify the current policy focus. These are areas in which the Government will concentrate efforts in order to improve performance and in response to changing community needs and expectations. The priority of Delivering responsive government explains ways in which the Government will continue to develop its capacity to meet community needs.
|
Box 4.1 Government’s seven key priorities |
Growing a diverse economy and creating jobs • expand market access, export and trade opportunities • create additional job opportunities and break the unemployment cycle • maintain a competitive tax environment for business development and jobs growth • ensure a fairer industrial relations system and improve workforce management by putting people, safe jobs and workplaces first • diversify and strengthen the economy through value adding, productivity growth and the development of future growth industries |
Realising the Smart State through education, skills and innovation • implement education and training reforms and upgrade education and training facilities • improve workforce skills for current and future needs by focusing on lifelong learning • encourage world-class research that builds on Queensland’s unique resources • encourage and reward ideas, innovation, entrepreneurship and hard work across all sectors of the Queensland community, industry and government |
Managing urban growth and building Queensland’s regions • support Queensland’s regions through statewide infrastructure development and regional job creation • ensure that accelerated growth in South-East Queensland is managed in an integrated and coordinated manner • link Queensland through efficient and integrated transport options • build on the strengths of Queensland’s diverse regions |
Improving health care and strengthening services to the community • improve the standard and accessibility of hospital and health services • support an increased quality of life through disease prevention and active participation • develop and implement strategies to support Queensland families • improve the lives of people with a disability, their families and carers • work with Aboriginal and Torres Strait Islander communities to improve economic and social wellbeing • improve Queenslanders’ access to affordable housing |
Protecting our children and enhancing community safety • reform the child protection system for the wellbeing of Queensland children • implement strategies which contribute to safe communities • address crime and the social and economic causes of crime • minimise the risk and impact of accidents, emergencies and disasters |
Protecting the environment for a sustainable future • protect Queensland’s unique environmental and heritage assets • promote sustainable development through responsible use of the State’s natural resources • encourage the development of environmentally sustainable industries and jobs • protect Queensland’s diverse plants and animals |
Delivering responsive government • engage communities in government decisions and processes • ensure service provision is financially sustainable and that Total State Worth is at least maintained • strengthen government policy development and implementation to focus on future policy challenges • support a responsive public sector, focused on improving government service delivery |
45
SERVICE DELIVERY HIGHLIGHTS
This section provides a summary of key service delivery developments and initiatives provided for in the Budget to support the achievement of the Government’s priorities. Although highlights of the Budget have been described in terms of their primary impact on the community, many will assist the Government in pursuing more than one key priority. More details on service delivery development and initiatives can be found in individual Ministerial Portfolio Statements.
Growing a diverse economy and creating jobs
Building on Queensland’s strong economic base benefits all Queenslanders through job creation and an enhanced quality of life. The Government will continue to stimulate economic development throughout Queensland with initiatives designed to expand export and trade opportunities, develop new and emerging industries, create jobs and break the unemployment cycle for Queenslanders out of work, and ensure a fair industrial relations system is in place across the State.
Initiatives to support this priority include:
| | • | $20 million towards the construction of the Queensland Brain Institute, which will be located at the University of Queensland. The Brain Institute will be a $60 million facility, with the University of Queensland and a philanthropic trust matching the Queensland Government’s contribution. The research program for the Brain Institute will focus on diseases of the brain, and possible treatments. |
| | • | $33 million over three years for the Government’s State Sugar Industry Reform Package, made up of a $10 million Sugar Industry Innovation Fund, a $13 million Change Management Program (including $5.2 million for FutureCane), and a $10 million Farm Consolidation Loan Program. This package has been activated following agreement with industry and the passing of legislative reforms in April 2004. FutureCane will be delivered collaboratively with the Bureau of Sugar Experiment Stations and will service four cane growing regions (Far North Queensland, Burdekin, Central and South Bundaberg) by encouraging widespread adoption of a whole farm systems approach to cane growing. This will result in more profitable and sustainable farms by increasing operational efficiency and reducing costly soil and nutrient loss and soil compaction. |
| | • | up to $7 million over three years for cane farmers as part of the Government’s broader policy of providing transfer duty relief for intergenerational gifting of farms. In addition, transfer duty relief of up to $5 million over two years will assist cane farmers to purchase adjoining cane farms in order to improve the efficiency and productivity in the sugar industry. |
| | • | $5.8 million to continue implementation of the six-year, $30.1 million Future Directions Strategy. DPI Forestry will plant a further 750 hectares of hardwood plantation on State and privately-owned land in South East Queensland (further strengthening the growth potential of the region’s timber industry) and will also maintain more than 6,000 hectares of existing hardwood plantations. |
| | • | $9.3 million to establish and re-establish 5,530 hectares of State-owned softwood plantations to provide for future timber supplies to Queensland’s regionally based timber industry. |
46
| | • | $11 million over four years in new funding for an Advanced Manufacturing Plan to enhance Queensland’s position as the leading State for value-added manufacturing growth. The Advanced Manufacturing Plan will build on the 2003 initiative, Making Queensland’s Future – A Manufacturing Development Plan by focusing on developing skills, providing training and promoting best practice and efficiency through innovation. |
| | • | $9.8 million over four years for the adoption of the Queensland Biotechnology Strategy, which will include measures to promote the Clinical Trials Network (to assess new drugs, vaccines or therapies before they are manufactured), Biodiscovery Network (to encourage collaboration between different researchers), and Future Foods (to allow technological advances to improve health and nutrition characteristics of food products). These measures will assist in the testing and commercialisation of biotechnology research, and contribute to improved health standards. |
| | • | an additional $3 million over three years will be invested in the Strategic Employment Development program, taking total funding for the Breaking the Unemployment Cycle initiative up to $278 million over three years. |
| | • | continued support for Queensland’s film and television industry through one-off funding of $5 million to the Griffith University Film School. The funding will be used to upgrade production facilities at South Bank, Nathan and Gold Coast campuses. |
| | • | $2 million over four years to develop and commence implementation of a wine industry development strategy and promote the industry to national and international markets. |
Realising the Smart State through education, skills and innovation
In recent years, the Government has laid the foundation for establishing Queensland as the Smart State. Initiatives funded within this Budget will continue this effort by realising the Smart State vision through education, training and innovation.
Service developments that will support the Smart State vision include:
| | • | Funding for the Education and Training Reforms for the Future reform package in excess of $135 million in 2004-05, rising to $231 million in 2005-06 and $307 million in 2006-07, including: |
| | • | from 2007 a full-time, non-compulsory preparatory year of education prior to Year 1 will replace the current part-time preschool program. As part of the lead up to full implementation, an additional 20 State and up to five non-State schools will commence the preparatory year in 2005. In 2004-05, funding of $46 million, including $29.4 million for facilities, will be allocated for the continuation of the preparatory year trial in preparation for full implementation in 2007. The preparatory year will be available at all schools offering primary education; |
| | • | trials of reforms to the senior phase of schooling to improve outcomes for all students in the senior phase of learning, including support for students at risk of leaving school early. The investment in 2004-05 of $14.2 million will be used to trial the reforms State-wide, and fund a range of initiatives for youth support and local education and training initiatives. This will improve opportunities in the senior phase of learning, including flexible opportunities for young people to achieve a Senior Certificate or vocational education qualifications; and |
47
| | • | $63.4 million for information communication technologies (ICTs), including $31.9 million in ongoing funds through the ICTs for Learning strategy. These funds will improve ICT access and ICT skills for both students and teachers and support schools to ensure that ICTs are used as tools for everyday learning and are integrated into curriculum and classroom practice. |
| | • | From Semester 1, 2005 it is projected4 that an additional 589 teachers will be employed comprising: |
| | • | 150 additional teachers as the first tranche towards the middle years class size reduction where Years 4-10 class size targets will reduce from 30-28 by 2007; |
| | • | 322 teachers for enrolment growth and the opening of new facilities; and |
| | • | 117 additional teachers to support students with disabilities. |
| | • | The 2004-05 schools capital works program includes $336.7 million (including $46.7 million for expensed items) to provide school accommodation and employee housing, an increase of more than 22% over funds expended in the 2003-04 financial year. This significant increase will not only provide classrooms for Queensland’s rapidly growing student population but will also allow the extension of the Cooler Schools Program to a further round, continuation of the Smart Schools Renewal Program, and commence the provision of facilities for the full introduction of the preparatory year of schooling. In 2004-05 the Government, through the Department of Education and the Arts, will allocate: |
| | • | $17.5 million to provide airconditioning and passive cooling measures in State schools; |
| | • | $18.2 million for the continuation of the Triple R Maintenance Program across Queensland schools. This forms part of an overall commitment of an additional $72.7 million to extend this program for a further four years. The program will not only continue the repainting of schools and the replacement of deteriorated roofing and water reticulation but will now also encompass the upgrading of sewerage and other drainage systems; |
| | • | $15 million to deliver the four-year, $80 million Smart Schools Renewal Program. The second year of this program will continue the renewal of facilities at participating primary, secondary and special schools; and |
| | • | $8.2 million for the continuation of the High Priority Building Asset Maintenance Program. Total program funds to Queensland schools of $20.2 million have been approved over a three-year period, commencing in 2003-04. The program focuses on a number of asset maintenance categories, such as re-carpeting, re-flooring, refurbishment of classrooms, playground structures and tuckshops. |
| | • | New and growth funding totalling $118 million over three years for the SmartVET strategy – an innovative approach to the planning, purchasing and delivery of vocational education and training that targets skill shortages and the skilling and workforce needs of industries central to the Smart State vision and Queensland’s economic growth. The |
| 1 | Based on forecast Semester 1, 2005 enrolments. |
48
SmartVET strategy over the next three years will create an estimated 17,800 new training places in priority industry areas that are central to the economic growth of the Smart State. Approximately 11,800 of these new training places will be apprenticeships and traineeships. Included within this funding is the following initiatives for 2004-05:
| | • | $2.5 million for the new Industry Training Partnerships program, which will provide 2,120 additional apprenticeship and traineeship training places for existing workers to support employers in re-skilling and up-skilling employees in critical skill shortage areas and industries that are able to take advantage of technological improvements and innovation; |
| | • | $3 million to design and create 182 accelerated apprenticeship training places, in partnership with local government authorities, group training companies and the private sector. The focus will be on the building and construction, mining, manufacturing and engineering industries in Queensland regions attracting large scale industry investment; and |
| | • | $3.6 million to develop and trial Skilling Solutions Queensland – a revolutionary new service providing formal competency recognition and customised skilling solutions to meet the needs of individuals, businesses and industries. |
Managing urban growth and building Queensland’s regions
Queensland’s strong population growth, particularly in South East Queensland, presents challenges for transport systems and other infrastructure, services and the environment. The Government has attached a high priority to ensuring growth in South East Queensland is managed in an integrated and coordinated manner. The Government is also continuing to focus on building all of Queensland’s regions through State-wide infrastructure development and regional job creation, efficient and integrated transport options, and capitalising on regional strengths.
Budget initiatives that will assist in managing urban growth and building Queensland’s regions include:
| | • | $6.7 million for the establishment of the Office of Urban Management (OUM) to coordinate and manage urban growth in South East Queensland (SEQ) through the completion and oversight of the implementation of the SEQ Regional Plan. |
| | • | The Budget includes a number of significant road and transport initiatives, including: |
| | • | more than $200 million ($37 million in 2004-05) for bus priority and infrastructure improvements, including $12 million in 2004-05 towards the Queen Street Bus Station to Roma Street tunnel extension of the Inner Northern Busway, and $10 million for the Royal Children’s Hospital and Normanby bus stations; |
| | • | $19 million as part of total Government funding of $237 million for improvements to the Sunshine Motorway; |
| | • | $3.7 million as part of total Government funding of $120 million to construct the South-West Arterial Road from Springfield to Ripley; |
| | • | $35.7 million, provided under the Smart State Building Fund, for additional rollingstock and infrastructure for the Citytrain MetTrip initiative. Funding for |
49
| | MetTrip Stage 2 will commence in 2005-06, bringing total Government funding for MetTrip to $742.2 million with aggregate infrastructure investment to exceed $900 million; |
| | • | $19.8 million in 2004-05 towards a four-year $571 million Arterial Roads Infrastructure package to accelerate key roads capital projects; |
| | • | $22.6 million to construct the Tugun Bypass along a route west of Coolangatta Airport, as part of total project funding of $360 million, including $120 million from the Australian Government; and |
| | • | $3.6 million as part of a total $26 million package of works including construction of the Yeppoon Western Bypass and upgrade of Yeppoon – Tanby Road. |
| | • | $35.9 million towards the implementation of TransLink, improving the integration and coordination of bus, ferry and rail services in South East Queensland by progressing integrated ticketing, together with standardising concessions and fares |
| | • | approximately $11 million for new infrastructure for the State’s bus and rail corridors, including $5 million towards improvements to rail intermodal facilities and corridor acquisitions, and $6 million towards the provision of new infrastructure and upgrading of existing infrastructure in the Petrie to Kippa-Ring and Gympie Road corridors |
| | • | the Government will continue its high priority investment to continue drought assistance activities in 2004-05 and for activation of drought recovery. This includes resourcing and administering the Drought Relief Assistance Scheme, reviewing Exceptional Circumstances drought declarations, providing farm financial counselling, drought management and/or risk management workshops, climate modelling and research into drought management strategies. It also includes Queensland’s contribution to Exceptional Circumstances payments. Strategic policy advice will be provided at national drought forums to address deficiencies identified in drought programs during the current drought. |
50
| | • | an additional $3.9 million in 2004-05, increasing to $6.7 million in 2007-08, to continue attraction, securement and development of major events in Queensland. The highly successful Queensland Events Regional Development Program will be continued with $2 million provided for the first two years of the scheme. The program will be expanded to include a Significant Regional Events Scheme (SRES) and a Regional Events Innovation Scheme (REIS). SRES will provide for the long-term development of some of our most significant regional events and each event supported under SRES could receive up to $50,000 each year for three years. The aim of REIS is to provide targeted assistance for innovative and creative regional event concepts. |
| | • | $8.5 million to refurbish Stage 1 of the Cairns Convention Centre to maintain the attractiveness of the Centre as a world-class facility. |
| | • | $9.5 million in capital and $1 million in recurrent funding over four years to revitalize the Fitzroy River riverbank in Rockhampton. $0.8 million has been allocated for 2004-05 and $8.5 million for the following year. |
Improving health care and strengthening services to the community
The improvement of health and other services to the community is a continuing area of priority for the Government. This Budget includes service delivery developments which will improve the standard and accessibility of hospital and health services and support an increased quality of life through disease prevention and active participation. Initiatives also focus on supporting families and those with a disability, working with Aboriginal and Torres Strait Islander communities, and improving Queenslanders’ access to affordable housing. The following service developments and initiatives will improve health care and strengthen services to the community:
| | • | $90 million over three years to treat additional elective surgery patients and reduce elective surgery waiting lists in Queensland public hospitals |
| | • | $44 million ($18 million in 2004-05) for additional cancer services, including early detection and cancer treatment. In addition, $9.75 million over four years ($7.65 million in 2004-05) has been provided for cancer equipment, such as $5 million for Queensland’s first public hospital Positron Emission Tomography (PET) scanner, located at the Royal Brisbane Hospital |
| | • | $25 million ($10 million capital and $15 million recurrent funding) over three years to fund a 24-hour, State-wide health advice hotline, providing easy access to health advice and information from one central number. A further $6.6 million for extra emergency department staff and $3 million to establish four bulk-billing GP clinics near public hospitals over the next three years. In addition, $6 million is allocated in 2004-05 to relieve pressure on emergency departments, as part of an $8 million investment in additional medical inpatients’ services at Logan and Caboolture Hospitals. |
| | • | $77 million in capital funding over three years for the redevelopment of the Prince Charles Hospital emergency department and provision of general hospital services |
| | • | $5 million each year for improved access to cardiac services, including a new cardiac team based at the Princess Alexandra Hospital, additional early intervention procedures and a program for cardiac prevention fitness and rehabilitation |
51
| | • | $3.3 million each year to deliver additional oral health services across the State, including travelling dental teams and initiatives to target waiting lists |
| | • | up to $9.5 million each year over 15 years, commencing in 2006-07, to finance the $88 million public component of the Mater Hospital redevelopment, including construction of a new Mater Mothers’ Hospital and refurbishment of the Mater Adult Hospital. A further $3 million over the next two years will be provided for planning. |
| | • | new capital funding of $10 million in 2004-05 for additional renal equipment, and recurrent funding of $6 million in 2004-05 for enhanced renal services across the State. This includes renal dialysis services at Cooktown, Torres Strait, Redlands, Sunshine Coast, Gold Coast and Rockhampton |
| | • | $6 million per annum for stroke prevention, treatment and rehabilitation across the State, plus an additional $2.2 million to purchase and operate a CT scanner for the Redland Hospital to assist the assessment and treatment of stroke and other neurological conditions locally |
| | • | in excess of $24 million over two years to purchase three new Royal Flying Doctor Service (RFDS) aircraft to replace those currently operating from RFDS bases in Brisbane, Rockhampton and Townsville |
| | • | an additional $3 million for the Medical Aids Subsidy Scheme to assist in managing the waiting list |
| | • | $11.5 million in 2004-05 to significantly enhance mental health services, including the establishment of additional community, clinical and administrative support positions |
| | • | $8.5 million to ensure Queensland patients continue to have access to a safe and sufficient supply of blood and blood products |
| | • | in excess of $8 million for the Home and Community Care Program |
| | • | $5.3 million in 2004-05 for sub and non-acute patient care services, as well as rehabilitation and step-down care, assisting patients to achieve a smoother transition to home after an acute hospital admission |
| | • | an additional $4 million in 2004-05 to improve access to health services for Indigenous people |
| | • | $4 million towards public health initiatives, including a strategy to promote healthy weight in children, and a range of strategies to manage the use of tobacco |
| | • | $3.9 million additional funding to continue to expand the Healthy Hearing Program, which will provide access to universal hearing screening for newborn babies by 2006 |
| | • | $3 million in 2004-05 to maintain the spectacle supply scheme and meet increasing costs |
| | • | an additional $2.7 million for non-government organisations to meet increasing costs of health service delivery |
| | • | $2.6 million to support the enhancement of pathology services |
52
| | • | Building on the $200 million four year funding enhancements provided in the 2003-04 Budget, the Government will allocate an additional $220 million ($40 million in 2004-05) to Disability Services Queensland over four years from 2004-05. As a result of these funding enhancements, the Disability Services Queensland’s budget has increased by 37% since 2002-03. The 2004-05 funding enhancement will improve services and support for children, young people and adults with a disability, their families and carers, including: |
| | • | $106.4 million ($18.9 million in 2004-05) to enhance support to adults, school leavers and young adults with a disability; |
| | • | $63.8 million over four years ($10.6 million in 2004-05) to enhance support for children with a disability and their families; and |
| | • | $49.8 million over four years ($10.5 in 2004-05) to increase community and infrastructure support for disability services, including enhancing the viability of non-government disability service providers in Queensland. |
| | • | $3.1 million to enable 92 premises operated by non-government organisations (funded by Disability Services Queensland) to comply with fire safety legislation by 1 July 2005 |
| | • | $20 million to make additional modifications to the Citytrain network to further improve access to trains and train stations for people with a disability |
| | • | $45.7 million in capital grants for 34 discrete Aboriginal and Torres Strait Islander councils under the new 2004-09 Capital Grants Program for constructing new houses and upgrading existing dwellings |
| | • | $76.9 million for public rental housing, allowing for the commencement of 320 dwellings and the completion of 285 dwellings. In 2004-05, $11.9 million will be provided to the Brisbane Housing Company, the third payment, as part of a four year commitment by the Queensland Government to complete approximately 150 units of accommodation, taking the total stock to over 300. A further $21.9 million has been allocated in 2004-05 for the urban renewal of public housing properties, and $30 million over three years ($10 million in 2004-05) to improve the supply of affordable housing across Queensland |
| | • | $75 million over five years to continue the Community Renewal program and expand the program into nine new areas from Cairns to the Gold Coast and continuing work in ten existing areas |
| | • | $5.5 million to purchase properties that are adaptable, or have the facilities to appropriately accommodate people with a disability |
| | • | the Government will contribute matched funding of $16.2 million over three years towards the Major Infrastructure Program, continuing its commitment to deliver significant health outcomes for residents in Torres Strait and the Northern Peninsula Area |
| | • | in addition to the $2.4 million each year committed under the Multicultural Assistance Program, $1 million each year for community groups to enhance multicultural relations. Funding will be available for the staging of cultural festivals, ethnic celebrations and other events which help preserve cultural heritage |
53
| | • | an additional $4.9 million each year for the Millennium Arts Project for the development of new programs, services, systems and equipment and additional positions in preparation for the opening of the new facilities, including $2.6 million for the State Library of Queensland and $2 million for the Queensland Art Gallery. $3 million in capital funding has been allocated for a new costume and scenery workshop at the Queensland Theatre Company site. |
Protecting our children and enhancing community safety
Protecting our children and enhancing community safety is a particular focus for the Government. The Government is implementing a blueprint for reform and enhancement of the child protection system. Resources committed since the 2003-04 Budget involve additional funding across a range of agencies amounting to $109 million in 2004-05, rising to approximately $214 million in 2006-07. The Budget also continues to implement strategies which contribute to safe communities, and address the social and economic causes of crime. Minimising the risk and impact of accidents, emergencies and disasters will also remain a key focus for the Government.
Service developments and initiatives designed to protect Queensland’s children and enhance community safety include:
| | • | $70.2 million in 2004-05, rising to $161.6 million in 2006-07 to the Department of Child Safety and the Commission for Children and Young People to implement the recommendations of the Crime and Misconduct Commission report Protecting Children: an inquiry into abuse of children in foster care. Funding increases will provide for enhancements including: |
| | • | 518 extra frontline service and support staff for the Department of Child Safety over the next three years; |
| | • | additional staff for the Commission for Children and Young People over the next three years, including an expanded community visitor program; |
| | • | 23 new or expanded Aboriginal and Islander Child Care Agencies; |
| | • | a new Indigenous Support and Development Unit to work with the non-Government sector; |
| | • | staged increases in foster carer reimbursement; |
| | • | an increase in the number of alternative care places for young people to 680, phased in over four years; |
| | • | more training and recruitment and retention strategies for staff; and |
| | • | more therapeutic services such as counselling and disability support for children in care. |
| | • | the new Department of Child Safety will be fully operational by December 2004 and will operate as a new decentralised service delivery organisation, working with other Government agencies and community partners to deliver comprehensive, integrated services to vulnerable children. The Department will operate with 46 Child Safety Service Centres throughout Queensland, supported by zonal offices. |
54
an additional $7.3 million in 2004-05, rising to $12.4 million in 2006-07, across the departments of Health, Police, Education, Justice and the Attorney-General, Disability Services, Aboriginal and Torres Strait Islander Policy and Communities. Funding increases will provide enhancements including:
| | • | expanding Suspected Child Abuse and Neglect teams; |
| | • | additional police officers for the Juvenile Aid Bureau in 2004-05; and |
| | • | the appointment of Child Safety Directors in Government agencies providing child protection services. |
| | • | significant investment in the Information Renewal Initiative, including the Integrated Client Management System, so that workers in the new child protection system will be able to keep better client and case management records. An additional $44 million in capital funding has been provided to implement this system over the period 2004-05 to 2006-07 |
| | • | $5 million in 2004-05, $11 million over three years to clear the DNA profiling and crime scenes samples backlog and to cater for future profiling demands at Queensland Health Pathology and Scientific Services – John Tonge Centre |
| | • | $10.5 million over four years ($1.4 million in 2004-05) to expand community safety initiatives, including whole-of-Government and community-based crime prevention activities, such as the Volatile Substance Misuse Program |
| | • | $9.5 million over four years ($2.0 million in 2004-05) to enhance the successful youth justice conferencing services, including increasing the availability of services to the Gold Coast, Wide Bay-Burnett and Mackay. In addition, $3.2 million each year has been allocated to implement a new youth justice service delivery model, as well as $5.5 million in capital to develop youth-friendly juvenile justice centres |
| | • | $2.4 million each year for youth detention centres, including the opening of an additional unit of the Cleveland Youth Detention Centre (Townsville) to reduce the number of young people transferred to Brisbane |
| | • | $10 million capital funding in 2004-05 as part of an allocation of $37.2 million over five years to upgrade the State’s existing Correctional Facilities, including perimeter security systems. The Budget also includes an additional $2 million each year for maintenance of the State’s Correctional Facilities |
| | • | $35.9 million over three years for the Queensland Ambulance Service to employ 240 additional officers to address growth in demand, maintain emergency response times and improve services in rural and remote communities. The Budget also includes capital investments of $31.1 million, which includes: |
| | • | the commencement or completion of nine replacement stations and two new stations; |
| | • | $9.9 million for replacement ambulances; |
| | • | $2 million for improved technical communications and operational equipment; and |
| | • | $3.5 million for electronic data capture capability to enhance service availability. |
55
| | • | $9.5 million over three years for the Counter Disaster and Rescue Services (CDRS) to provide equipment, vehicles, training and support for State Emergency Service Volunteers, and an additional $5.4 million over three years for CDRS to enhance disaster mitigation and management at the State and local levels |
| | • | $40.8 million over two years from 2005-06 for the replacement of the Queensland Rescue Bell 412 Helicopter fleet |
| | • | capital investments of $38.7 million, which includes the upgrade of 11 Queensland Fire and Rescue Service stations or facilities and one relocation and a new facility. The service will invest $2.1 million for land purchases for future stations, $12 million in new or replacement urban vehicles to meet enhanced service delivery requirements, $3.8 million investment in rural vehicles and $5.7 million on developing operational support systems |
| | • | $12.5 million over three years to contribute to the redevelopment of Roma Street Fire and Ambulance Stations |
| | • | an additional $10.6 million capital in 2004-05 for the Integrated Justice Information Strategy to improve community safety through sharing information and increasing collaboration across the criminal justice system |
| | • | $15 million for the Queensland Police Service’s Information Management Strategic Plan 2001-10. Main priorities for this year include the incident recording, management and investigation system and an upgrade of the information technology network |
| | • | an additional $2.6 million for a replacement aircraft for the Queensland Police Service’s existing Beechcraft Super King B350 |
| | • | an additional $10 million over three years to support operational police in the areas of training, equipment, radios and safety equipment (for example, bullet proof vests) |
| | • | a further $10 million over three years for the establishment of 25 Neighbourhood Police Beats throughout Queensland |
| | • | an additional $20 million over three years for enhancements and/or the acceleration of the Queensland Police Service’s capital works program |
| | • | $3.9 million towards the New Queensland Driver Licence project. |
Protecting the environment for a sustainable future
The sustainable use of natural resources and the maintenance of biodiversity are key priorities of the Government. Initiatives included within the 2004-05 Budget put into practice policies which protect Queensland’s unique environmental and heritage assets, promote sustainable development and responsible use of the State’s natural resources, encourage environmentally sustainable industries and protect Queensland’s diverse plants and animals.
56
Service developments and initiatives in the 2004-05 Budget build on recent strategies, policies and reforms to address environmental priorities, including:
| | • | $31 million (reflecting the combined contributions from the States, Territory and Australian Government under national cost sharing arrangements) to continue the eradication of the Red Imported Fire Ant. The agreement of the Australian, State and Territory governments to provide extra funding for an extended campaign to eradicate fire ants in the State’s south east (taking the total fire ant budget to $175.4 million over six years to 2006-07) is contingent on their respective budgetary considerations |
| | • | $10 million over three years for the acquisition of strategic parcels of land of high conservation value to add to the protected estate in Cape York and the Daintree |
| | • | $8.5 million over three years to enhance planning for and implementation of maintenance of roads and infrastructure in national parks |
| | • | $2.3 million for the continued development of the Great Walks of Queensland, as part of a five-year $10 million plan |
| | • | $75 million over five years to end the broadscale clearing of remnant native vegetation by 2006, bringing total State funding to $150 million over five years. The package includes financial incentives to assist landholders with the transition, or exit if necessary, incentives to improve the management of more valuable remnant vegetation, funding to develop best practice for farm management plans and to acquire property in strategic locations as it becomes available |
| | • | $3 million in 2004-05, plus capital funding of $0.5 million, as part of the completion of the Dee River Dams Remediation Project. With funding allocated in 2003-04, total funding for this project is $7 million over two years. Contaminated tailings from the Dee River adjacent to the Mt Morgan Mine site will be removed and three heritage listed dams will be decommissioned. |
Delivering responsive government
To create the best outcomes for Queenslanders, the Government will continue to be responsive to the community. Initiatives within the 2004-05 Budget will ensure the Government continues to engage communities in decisions and processes, while ensuring service provision is financially sustainable for current and future generations. These initiatives include:
| | • | the continuation of regional community forums and regional Cabinet meetings |
| | • | implementation of a number of e-democracy initiatives designed to use information technology to enhance community access to and participation in government decision making processes, following recent trials |
| | • | the expansion of services available to the public through a single access point, Smart Service Queensland |
| | • | pursuit of value for money opportunities to deliver infrastructure through the Public Private Partnerships framework |
| | • | further development of a shared corporate services delivery model within Government. |
57
FINANCIAL MANAGEMENT AND GOVERNANCE
Overview
High standards of financial management and governance are critical to the Government’s pursuit of its social and fiscal objectives. The Governments’ financial, regulatory and administrative framework supports the development and management of its budget and ensures accountability to the community. The foundation of financial management and accountability across the Queensland Government is the Financial Administration and Audit Act 1977. This Act in turn gives effect to the Government’s Charter of Social and Fiscal Responsibility and the Financial Management Standard 1997.
The Charter of Social and Fiscal Responsibility outlines the Government’s commitment to delivering improved outcomes for the community. This includes the outcomes that the Government seeks to achieve for the community and priorities for service delivery, as well as the Government’s fiscal objectives. The Charter also outlines the requirements of the Government in outlining its progress and achievements against it priorities for the community outlined in the Charter.
The alignment of the Government’s desired outcomes for the community, including indicators, and its priorities, is shown in Box 4.2. The Government directs service delivery and other policies towards these priorities. Ministerial Portfolio Statements prepared as part of Budget documents illustrate how departmental outputs, and more specific activities, contribute to the community outcomes that the Government seeks to achieve.
The Financial Administration and Audit Act 1977 and the associated Financial Management Standard 1997 put in place a comprehensive framework of governance and accountability for the Queensland Government and its agencies. This legislation ensures that all Government departments and statutory bodies operate within the boundaries of sound corporate governance and transparent accountability to Parliament and the wider community. Key requirements of the Government and its agencies include full compliance with relevant provisions of Australian Accounting Standards, comprehensive planning and management of organisational resources and services, and in-depth review of activities and reporting of all Government entities by the Queensland Auditor-General.
58
| | | | | | | | | | | | | | |
Box 4.2 Alignment of the Government’s Outcomes for the Community and Policy Priorities |
| Building Queensland’s economy | | Strengthening Queensland communities | | Protecting Queensland’s environment |
Community Outcomes |
A strong diversified economy | | A community of well-skilled and knowledgeable people | | Improved standard of living for all Queenslanders | | Safe and secure communities | | Healthy, active individuals and communities | | A fair, socially cohesive and culturally vibrant society | | A clean, liveable and healthy environment | | Maintenance of the natural resource base |
Priorities | | ñ | | | | | | ñ | | | | ñ |
Growing a diverse economy and creating jobs | | Realising the Smart State through education, skills and innovation | | Managing urban growth and building Queensland’s regions | | Improving health care and strengthening services to the community | | Protecting our children and enhancing community safety | | Protecting the environment for a sustainable future |
Delivering responsive government |
Priorities in Progress
A critical part of government accountability is the requirement to publish regular, informative reports on the outcomes of the Government’s activities against previously announced priorities. The Charter of Social and Fiscal Responsibility establishes a framework for assessing the Government’s overall performance in achieving progress towards its priorities, and ensures that performance is not assessed purely against economic and financial criteria, but that the social and environmental consequences are considered as well.
As a result, the Government has released the Priorities in Progress report to inform the community about the efficiency and effectiveness of its activities in delivering its priorities and community outcomes.
The fourth Priorities in Progress report, released in December 2003, informs the community about the impact of the Government’s policies and initiatives in the 2002-03 financial year. The report highlights areas where Queensland is performing well, and identifies opportunities for improvement. The Priorities in Progress report 2003-04 may be viewed online at www.treasury.qld.gov.au around December 2004.
Shared Services Initiative
The Shared Service Initiative (SSI) is a whole-of-Government project with the vision of delivering high-quality, cost effective corporate services across government. It will result in corporate services that are sustainable and forward looking. This initiative is expected to yield savings of over $100 million per annum once fully implemented. These savings will be allocated by the Government to key priority service delivery activities.
The implementation of the Initiative will reach another major milestone on 1 July 2004 with the 12 month anniversary of the formation of new shared service providers and CorpTech (a technology centre of skill). Almost 5,000 people work in these new organisations providing a range of corporate services including finance, human resources (including payroll), procurement, documents and records management and facilities management to staff in agencies across the Queensland Government.
In 2003-04 a significant focus for the SSI was the Business Process Review (BPR) of corporate service business processes to achieve measurable improvements in quality, cost, and timeliness through standardisation and optimisation of government resources.
Building on this body of work, during 2004-05, agencies and their corporate service providers, CorpTech and the Shared Service Implementation Office will collaboratively implement new business solutions. These solutions will ensure the business capability is in place for effective corporate service delivery, assisting agencies to maintain a strategic focus on delivering government priorities and services to the community.
Continuous refinement of the shared service model will ensure that optimal efficiency and effectiveness in corporate service delivery across all Queensland Government agencies is actively promoted. This includes the development of a standard suite of services for delivery by shared service providers.
Major elements of the SSI implementation will be undertaken progressively over the next two years to June 2006.
59
KEY POINTS
| | • | Total General Government sector revenue is estimated to be $24.009 billion in 2004-05, a decrease of $497 million (or 2%) on 2003-04 estimated actual revenue primarily reflecting a moderation in housing market activity and investment income assumed to return to the long-term average return rate. |
| | • | The first home transfer duty exemption threshold was increased to $250,000 from 1 May 2004. A rebate of up to $2,500 applies above $250,000, phasing out at $500,000. The mortgage duty exemption threshold was also increased so that no mortgage duty applies to the first $250,000 of a loan for a home buyer borrowing to purchase or build their first home. |
| | • | The principal place of residence transfer duty concession will be extended. From 1 August 2004, a concessional duty rate of 1% will apply to the first $300,000 of the value of the home. This will provide a saving of $35 million to Queensland home buyers, including first home buyers, in 2004-05. |
| | • | The general insurance duty rate will be reduced from 8.5% to 7.5% from 1 August 2004, providing a saving of $17.6 million to taxpayers in 2004-05. |
| | • | Credit card duty will be abolished on 1 August 2004, providing a saving to taxpayers of $17 million in 2004-05. |
| | • | Debits tax will be abolished from 1 July 2005, at a cost of approximately $190 million per annum. |
| | • | Queensland will retain its competitive tax status, with per capita tax estimated at $1,614 in 2004-05 compared to an average of $2,056 for the other states. |
INTRODUCTION
This chapter provides an overview of General Government sector revenue for the estimated actual outcome for 2003-04, forecasts for the 2004-05 Budget year and projections for 2005-06 to 2007-08.
| | | | | | | | | | | | |
Table 5.1 General Government Revenue1 |
| | | 2003-04 Budget $ million | | 2003-04 Est. Act. $ million | | 2004-05 Budget $ million | | 2005-06 Projected $ million | | 2006-07 Projected $ million | | 2007-08 Projected $ million |
Revenue | | | | | | | | | | | | |
Taxation Revenue | | 5,664 | | 6,474 | | 6,338 | | 6,365 | | 6,766 | | 7,126 |
Current Grants and Subsidies | | 10,389 | | 11,036 | | 11,803 | | 12,245 | | 12,782 | | 13,421 |
Capital Grants | | 480 | | 563 | | 468 | | 386 | | 386 | | 367 |
Sales of Goods and Services | | 1,914 | | 1,984 | | 2,142 | | 2,265 | | 2,359 | | 2,445 |
Interest Income | | 1,038 | | 2,332 | | 1,215 | | 1,299 | | 1,375 | | 1,451 |
Other | | 1,897 | | 2,117 | | 2,043 | | 2,205 | | 2,365 | | 2,514 |
| | | | | | | |
Total Revenue | | 21,382 | | 24,506 | | 24,009 | | 24,765 | | 26,033 | | 27,324 |
Note: 1. Numbers may not add due to rounding. |
| | | | |
| | | Budget Strategy and Outlook 2004-05 | | 60 |
The forward estimates are based on the economic projections outlined in Chapter 2 and are formulated on a no policy change basis.
General Government revenue in 2003-04 is estimated to be $3.124 billion or 14.6% more than the 2003-04 Budget estimate.
Significant variations include:
| | • | higher interest income, reflecting the strong performance of domestic and international equity markets which has significantly improved the returns from the State’s financial assets held to meet future employee entitlements. Excluding the higher interest income reduces estimated actual revenue to 8.6% higher than budgeted. |
| | • | higher taxation revenue, primarily due to higher revenue from duty on property transfer transactions resulting from continuing strong market activity within the housing and non-residential property sector |
| | • | higher current and capital grants, reflecting additional specific purpose payments and GST payments |
| | • | higher other revenue, reflecting higher dividend and tax equivalent payments from Government-owned corporations, partially offset by lower royalty payments. |
General Government revenue in 2004-05 is estimated to be $24.009 billion, a decrease of $497 million or 2% on the 2003-04 estimated actual of $24.506 billion. This is largely due to:
| | • | reduced interest income, reflecting a return to the assumed long-term average earnings rate of 7.5% on investments |
| | • | reduced taxation revenue, reflecting an expected decline in duty revenues associated with a moderation in property market activity. The transfer duty estimate assumes a maintenance of property values but a decline in the volume of transactions. |
These declines are partially offset by growth in current grants and subsidies, in particular reflecting an increase in GST revenue grants as a consequence of the implementation of the new relativities distribution.
REVENUE BY OPERATING STATEMENT CATEGORY
Major sources of General Government revenue are current grants and subsidies (49% of revenue) and State taxation revenue (26% of revenue). Chart 5.1 illustrates the composition of General Government revenue.
Chart 5.1
Revenue by Operating Statement Category 2004-05
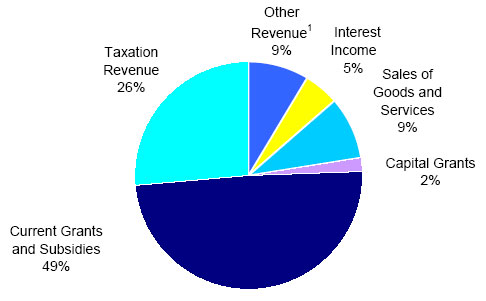
Note:
| 1. | The major components of Other Revenue are dividends (2.5%), royalties (3.4%) and tax equivalent payments from public corporations (1.3%). |
Chart 5.2 compares the composition of General Government revenue, based on 2003-04 estimated actuals and 2004-05 estimates.
The overall decline primarily reflects anticipated decreases in interest income and taxation revenue, partially offset by an increase in grants and subsidies.
Chart 5.2
Revenue by Operating Statement Category for 2003-04 and 2004-05
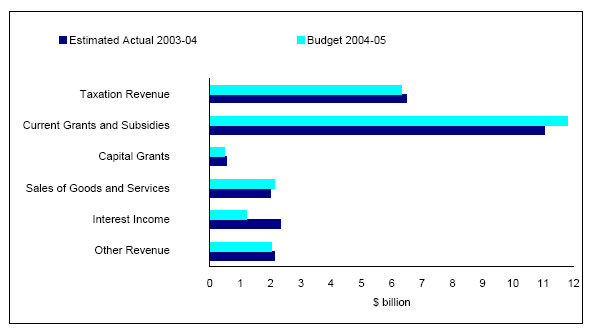
| | | | |
| | | Budget Strategy and Outlook 2004-05 | | 61 |
TAXATION REVENUE
One of the Queensland Government’s key social and fiscal objectives is to maintain a competitive tax environment while raising sufficient revenue to meet the infrastructure and Government service delivery needs of the people of Queensland.
Total revenue from taxation is expected to decrease by 2.1% in 2004-05. This reflects the impacts of a number of taxation initiatives announced prior to and in this Budget, and an anticipated moderation in property market activity on duty revenue.
| | | | | | | | | |
Table 5.2 Taxation Revenue1 | |
| | | 2002-03
Actual $ million | | 2003-04 Est. Act. $ million | | 2004-05 Budget $ million | | Change Budget over
Est. Act. % | |
| | | | | |
Payroll Tax | | 1,334 | | 1,416 | | 1,505 | | 6.3 | |
Duties | | | | | | | | | |
Transfer | | 1,382 | | 1,830 | | 1,438 | | (21.4 | ) |
Vehicle Registration | | 234 | | 240 | | 246 | | 2.5 | |
Insurance2 | | 286 | | 312 | | 307 | | (1.6 | ) |
Mortgages | | 183 | | 251 | | 205 | | (18.3 | ) |
Other Duties3 | | 96 | | 80 | | 85 | | 6.3 | |
Total Duties | | 2,182 | | 2,713 | | 2,281 | | (15.9 | ) |
| | | | | |
Gambling Taxes and Levies4 | | | | | | | | | |
Gaming Machine Tax and Levies5 | | 375 | | 450 | | 519 | | 15.3 | |
Lotteries Taxes | | 170 | | 178 | | 185 | | 3.9 | |
Wagering Taxes | | 29 | | 30 | | 32 | | 6.7 | |
Casino Taxes and Levies | | 53 | | 55 | | 58 | | 5.5 | |
Keno Tax | | 11 | | 12 | | 13 | | 8.3 | |
Total Gambling Taxes and Levies | | 638 | | 725 | | 806 | | 11.2 | |
| | | | | |
Other Taxes | | | | | | | | | |
Land Tax | | 279 | | 305 | | 379 | | 24.3 | |
Debits Tax | | 191 | | 190 | | 190 | | 0.0 | |
Motor Vehicle Registration | | 649 | | 692 | | 720 | | 4.0 | |
Fire Levy | | 203 | | 214 | | 224 | | 4.7 | |
Community Ambulance Cover6 | | n.a. | | 92 | | 104 | | 13.0 | |
Guarantee Fees | | 55 | | 72 | | 74 | | 2.8 | |
Other Taxes | | 67 | | 53 | | 54 | | 1.9 | |
| | | | | |
Total Taxation | | 5,598 | | 6,474 | | 6,338 | | (2.1 | ) |
Notes: 1. Numbers may not add due to rounding. 2. Includes accident insurance premiums. 3. Includes duty on leases, rental arrangements, credit business, marketable securities and life insurance premiums. 4. Includes community benefit levies. 5. Includes the Major Facilities Levy. 6. Growth in 2004-05 reflects full-year collection of the Cover, CPI adjustment and growth of non-exempt electricity accounts. | |
Payroll Tax
Payroll tax collections are estimated to increase by 6.3% in 2004-05, reflecting growth in employment and wages.
The payroll tax rate has been reduced in recent years from 5% to its current level of 4.75%, making Queensland’s payroll tax rate overall the lowest of any state. Further, an employer paying annual taxable wages of less than $850,000 is not liable for payroll tax – one of the highest thresholds of any state.
Duties
Duties are levied on a range of financial and property transactions. Overall, total revenue from duties is forecast to decrease by 15.9% in 2004-05. This is largely driven by declining revenues from transfer and mortgage duty due to an anticipated moderations in housing and non-residential property transactions from very high levels of activity in 2003-04. The transfer duty estimate assumes a maintenance of property values but a decline in the volume of transactions.
Vehicle registration duties are expected to show positive growth in 2004-05 in line with projections for activity within the sector, while insurance duty revenue is expected to decline slightly as a result of the budget initiative described below.
Concessions for First Home Buyers
From 1 May 2004, the Government extended duty concessions for first home buyers, at a revenue cost of $32.7 million in 2004-05. No transfer or mortgage duty is now payable on the purchase of a first home valued up to $250,000.
| | • | The transfer duty exemption threshold for the purchase of a first home increased to $250,000. A $2,500 first home rebate applies above $250,000, reducing by $100 for every $10,000 above $250,000 |
| | • | The mortgage duty exemption threshold has also been increased so that no mortgage duty applies to the first $250,000 of a loan for a home buyer borrowing to purchase or build their first home |
Principal Place of Residence Transfer Duty Concession
Home buyers not purchasing their first home already receive a generous principal place of residence concessional transfer duty rate of 1% on the first $250,000 of the value of the home.
From 1 August 2004, this concession will be extended, with the concessional duty rate of 1% to apply to the first $300,000 of the value of a principal place of residence. Normal marginal rates of transfer duty apply above $300,000.
This will provide a saving of up to $1,250 to home buyers, including first home buyers, on the purchase of a home valued over $250,000, with a saving of $35 million in 2004-05 and $149.5 million over four years for Queensland home buyers.
| | | | |
| | | Budget Strategy and Outlook 2004-05 | | 62 |
Insurance Duty Rate Reduction
Currently insurance duty rates of 8.5% or 5% are imposed on contracts relating to general insurance.
The higher duty rate of 8.5% applies to most forms of general insurance (referred to as class 1 general insurance). The lower rate of 5% applies to general insurance for professional indemnity, comprehensive motor vehicle cover, a home mortgage that is a first mortgage and travel personal accident cover (class 2 general insurance).
From 1 August 2004, the rate of duty for class 1 general insurance will be reduced from 8.5% to 7.5%.
This will reduce the difference between the two rates of insurance duty and make the Queensland insurance duty rate the second lowest in Australia, increasing the affordability of insurance to Queenslanders.
This initiative will provide a saving of $17.6 million in 2004-05 and $75.2 million over four years to Queensland taxpayers.
Abolition of Credit Card Duty
Credit card duty is imposed on credit card transactions at the rate of 10 cents per transaction.
Credit card duty will be abolished on 1 August 2004, providing a saving to taxpayers of approximately $17 million in 2004-05.
Gambling Taxes and Levies
A range of gambling activities are subject to state taxes and levies. Total gambling tax and levy collections are estimated to increase by 11.2% in 2004-05.
Land Tax
Land tax is estimated to grow by 24.3% in 2004-05 due to increases in land valuations across the State. The Government’s application of three-year averaging – whereby the land value is determined by averaging the unimproved property values for the current and preceding two years, rather than simply using the current year valuation – has mitigated the impact of these valuation increases on land tax payers. It is estimated that the revenue foregone as a result of three-year averaging will be approximately $87 million in 2003-04. Queensland is the only state to apply three-year averaging to land tax.
Debits Tax
Debits tax is levied on debits to accounts with a cheque drawing facility. Debits tax revenue is expected to remain steady in 2004-05.
The Government has announced the abolition of debits tax from July 2005, saving taxpayers approximately $190 million each year.
Motor Vehicle Registration Fees
Motor vehicle registration is influenced primarily by the growth of the vehicle fleet and fee adjustments related to the consumer price index (CPI).
| | | | |
| | | Budget Strategy and Outlook 2004-05 | | 63 |
Fire Levy
Fire levy revenue, which is used to fund the Queensland Fire and Rescue Authority, is expected to increase in line with the growth of contributors and CPI.
Community Ambulance Cover
The Community Ambulance Cover was introduced in 2003-04 to replace the ambulance subscription scheme and to provide a sustainable funding base for the Queensland Ambulance Service. It is collected through a payment on non-exempt electricity accounts.
Growth in 2004-05 reflects full-year collection of the Cover, CPI adjustment and growth of non-exempt electricity accounts.
Guarantee Fees
Guarantee fees are revenues collected by Queensland Treasury Corporation (QTC) on behalf of the State and comprise performance dividends, competitive neutrality fees and credit margin fees. These fees promote competitive neutrality between public sector agencies and those in the private sector, and ensure that the benefits accruing from the financial backing and superior borrowing performance of the State (through QTC) are shared between the borrower and the State. Guarantee fee revenues are expected to grow moderately in 2004-05.
Other Taxes
Revenue from other taxes includes the Statutory Insurance Scheme Levy, the Nominal Defendant Levy and other sundry taxes.
Tax Expenditures
Taxation expenditures are reductions in tax revenue that result from the use of the taxation system as a policy tool to deliver Government policy objectives. Taxation expenditures are provided through a range of concessions, including tax exemptions, reduced tax rates, tax rebates, tax deductions and provisions which defer payment of a tax liability to a future period. Appendix A provides details of tax expenditure arrangements set in place by the Queensland Government.
QUEENSLAND’S COMPETITIVE TAX STATUS
Taxation can impact on business decisions regarding investment and employment. The maintenance of Queensland’s competitive tax system provides a competitive advantage to business and a moderate tax burden for its citizens, and is fundamental to the Government’s commitment to job creation and economic development.
Recent increases in taxation collections have been driven by the strength in the underlying economic conditions rather than a policy of revenue raising. Recent tax changes have sought to improve the efficiency and equity of the State tax system, strengthen the funding base of essential services, and reduce or eliminate State taxes to the benefit of taxpayers. In pursuit of these objectives over recent years, the Government has:
| | • | rationalised the payroll tax system by reducing the rate from 5% to 4.75%, offset by broadening of the tax base |
| | • | abolished duty on quoted marketable securities |
| | • | increased the land tax exemption threshold for companies, trustees and absentees from $100,000 to $170,000, with the abolition of the general rebate for companies, trustees and |
| | | | |
| | | Budget Strategy and Outlook 2004-05 | | 64 |
absentees. Increased the resident deduction from $200,000 to $220,000, with the minimum payment increased from $100 to $350
| | • | introduced the Community Ambulance Cover to replace the voluntary ambulance subscription scheme, securing the funding base for the Queensland Ambulance Service |
| | • | extended the first home buyer transfer duty exemption for purchases of first homes from $80,000 (with a concession phasing out at $160,000) to $250,000 (with a concession phasing out at $500,000) |
| | • | extended the mortgage duty exemption threshold for first home buyers from $100,000 to $250,000. |
In this Budget, the Government has also announced its intention to:
| | • | extend the principal place of residence transfer duty concession threshold from $250,000 to $300,000, from 1 August 2004 |
| | • | reduce the base insurance duty rate from 8.5% to 7.5%, from 1 August 2004 |
| �� | • | abolish credit card duty, from 1 August 2004 |
| | • | abolish debits tax, from 1 July 2005. |
Revenue raising effort ratios, assessed by the impartial Commonwealth Grants Commission, isolate policy impacts from revenue capacity impacts and therefore are a good indicator of the extent to which the Government burdens its revenue base. Chart 5.3 confirms that Queensland’s tax revenue raising effort has remained steady and is well below the Australian policy standard (equal to 100%). The moderate increase in effort from 2000-01 primarily reflects the abolition of taxes in other states which Queensland did not collect, most notably Financial Institutions Duty on 1 July 2001.
Chart 5.3
Taxation Revenue Raising Effort Ratios for Queensland1
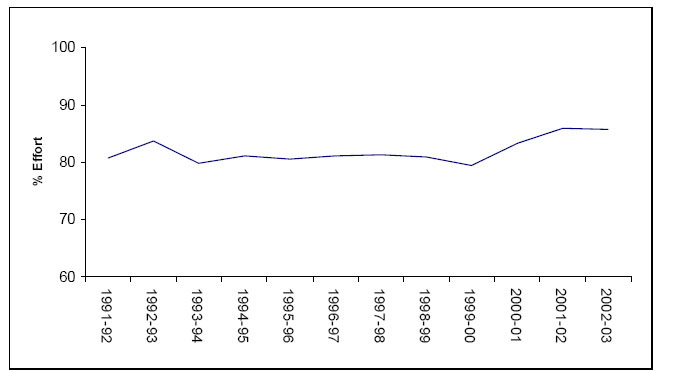
Note:
| 1. | Financial Assistance Grant relativities are used to 1999-00, GST relativities from 2000-01. |
Source: Commonwealth Grants Commission.
The Charter of Social and Fiscal Responsibility commits the Government to maintaining competitive tax levels in relation to other states. Table 5.3 demonstrates that this commitment continues to be met, with various measures of tax competitiveness all indicating that the Queensland state tax system remains amongst the most competitive in Australia.
| | | | | | | | | | | | | | | | | | |
Table 5.3 Queensland’s Tax Competitiveness |
| | | QLD | | NSW | | VIC | | WA | | SA | | TAS4 | | ACT | | NT4 | | Avg5 |
Taxation per Capita1 ($) | | 1,614 | | 2,237 | | 2,053 | | 1,873 | | 1,806 | | 1,251 | | 2,292 | | 1,326 | | 2,056 |
Taxation Effort2 (%) | | 85.8 | | 101.0 | | 107.2 | | 99.5 | | 111.0 | | 91.9 | | 101.6 | | 90.1 | | n.a. |
Taxation % of GSP3 (%) | | 4.4 | | 5.3 | | 4.8 | | 4.1 | | 5.0 | | 4.4 | | 4.5 | | 2.7 | | 4.9 |
Notes: 1. 2004-05 data. Sources: State Budget Papers, and Half-Yearly Review for NSW. 2. 2002-03 data. Source: Commonwealth Grants Commission: 2004 Review. 3. 2002-03 data. Sources: ABS 5506.0 and ABS 5220.0. 4. Low taxation per capita reflects the lower revenue raising capacity of those jurisdictions. 5. Weighted average of states, excluding Queensland. |
GRANTS AND SUBSIDIES
Current grants and subsidies comprise revenues from the Australian Government, grants from the community and industry, and other miscellaneous grants.
The moderate growth of 5.8% in 2004-05 largely reflects the expected growth in Australian Government grants.
| | | | | | | | | |
Table 5.4 Grants and Subsidies1 | |
| | | 2002-03 Actual $ million | | 2003-04 Est. Act. $ million | | 2004-05 Budget $ million | | Change Budget
over Est. Act. % | |
| | | | | |
Current Grants and Subsidies | | | | | | | | | |
Australian Government Grants | | 9,703 | | 10,521 | | 11,318 | | 7.6 | |
Other Grants and Contributions | | 472 | | 515 | | 485 | | (5.8 | ) |
Total Current Grants and Subsidies | | 10,175 | | 11,036 | | 11,803 | | 6.9 | |
| | | | | |
Capital Grants and Subsidies | | | | | | | | | |
Australian Government Grants | | 479 | | 540 | | 456 | | (15.6 | ) |
Other Grants and Contributions | | 31 | | 23 | | 12 | | (47.8 | ) |
Total Capital Grants and Subsidies | | 510 | | 563 | | 468 | | (16.9 | ) |
| | | | | |
Total Grants and Subsidies | | 10,685 | | 11,599 | | 12,271 | | 5.8 | |
Note: 1. Numbers may not add due to rounding. | |
Australian Government Payments
Australian Government payments to Queensland in 2004-05 are expected to total $11.8 billion, an increase of $712 million or 6.4% over payments in 2003-04. Australian Government payments to Queensland in 2004-05 will comprise:
| | • | General purpose payments, including GST revenue grants, Budget Balancing Assistance (BBA) and National Competition Policy (NCP) payments. General purpose payments are “untied” and are used for both recurrent and capital purposes. |
| | • | Specific purpose payments (SPPs), including grants for health, education and transport, which are used to meet Australian Government and shared policy objectives. |
| | | | |
| | | Budget Strategy and Outlook 2004-05 | | 65 |
Differences between SPPs in this Chapter and Australian Government Budget estimates can arise and generally reflect the outcome of agency-to-agency discussions or the absence of State level information. For example, details of Australian Government payments to Queensland under the AusLink program were not available at the time of the finalisation of the Budget and are not included in Table 5.5. Chapter 8 provides more detailed background on Commonwealth-State financial arrangements.
| | | | | | | | | |
Table 5.5 Australian Government Payments1 | |
| | | 2002-03 Actual $ million | | 2003-04 Est. Act. $ million | | 2004-05 Budget $ million | | Change Budget
over Est. Act. % | |
| | | | | |
General Purpose Payments | | | | | | | | | |
GST Revenue Grants | | 5,890 | | 6,576 | | 7,169 | | 9.0 | |
Budget Balancing Assistance | | 38 | | — | | — | | n.a. | |
Compensation for Deferral of GST Revenue | | — | | — | | 68 | | n.a. | |
National Competition Policy Payments | | 139 | | 88 | | 151 | | 71.6 | |
Total General Purpose Payments | | 6,067 | | 6,664 | | 7,388 | | 10.9 | |
| | | | | |
Specific Purpose Payments2 | | | | | | | | | |
Health | | 1,711 | | 1,751 | | 1,837 | | 4.9 | |
Education | | 1,146 | | 1,296 | | 1,351 | | 4.2 | |
Local Government, Planning, Sport and Recreation | | 275 | | 286 | | 293 | | 2.4 | |
Employment and Training | | 191 | | 199 | | 196 | | (1.2 | ) |
Housing | | 202 | | 182 | | 184 | | 1.1 | |
Treasury | | 78 | | 69 | | 87 | | 26.1 | |
Disability Services Queensland | | 103 | | 106 | | 109 | | 2.8 | |
Main Roads | | 253 | | 289 | | 201 | | (30.4 | ) |
Other | | 157 | | 219 | | 128 | | (41.6 | ) |
Total Specific Purpose Payments | | 4,115 | | 4,398 | | 4,387 | | (0.3 | ) |
| | | | | |
Total Australian Government Payments | | 10,182 | | 11,062 | | 11,774 | | 6.4 | |
Notes: 1. Numbers may not add due to rounding. 2. Specific Purpose Payments are shown below by relevant Queensland Government department. | |
| | | | |
| | | Budget Strategy and Outlook 2004-05 | | 66 |
GENERAL PURPOSE PAYMENTS
GST Revenue Grants
The GST revenue grant to Queensland in 2004-05 is expected to be $7.169 billion which represents an increase of $593 million on 2003-04.
GST revenue projections are based on consumption estimates, which incorporate assumed growth in the outyears. The distribution of these revenues is based on the recommendations of the Commonwealth Grants Commission in accordance with the application of horizontal fiscal equalisation principles. The strong growth in GST revenue grants primarily reflects the adoption of new distribution relativities following the 2004 Review of State Revenue Sharing Relativities. Further details on this review are provided in Chapter 8 – Inter-Governmental Financial Relations.
Budget Balancing Assistance (BBA)
Under the Intergovernmental Agreement on the Reform of Commonwealth-State Financial Relations, the Australian Government guaranteed that no state would be worse off as a result of national tax reform. The guaranteed minimum amount (GMA) has been used by the Australian Government and state governments as a benchmark for the funding each state would have received had national tax reform not been implemented.
To meet this guarantee, any shortfall between a state’s GMA and its share of GST revenue is met by BBA funded by the Australian Government.
Queensland is not expected to receive any BBA in 2003-04 or 2004-05, since GST revenue grants are expected to exceed the GMA.
Compensation for Deferral of GST Revenue
The Australian Government will be compensating the states for the deferred GST revenue resulting from its decision to allow businesses who are below the GST registration threshold and voluntarily registered for GST to report and pay GST annually instead of quarterly.
National Competition Policy Payments
The distribution of NCP payments is population based, with payments dependent on the states making satisfactory progress with the implementation of the specified reforms. NCP payments to Queensland are expected to be $151 million in 2004-05.
| | | | |
| | | Budget Strategy and Outlook 2004-05 | | 67 |
Specific Purpose Payments
SPPs for Queensland in 2004-05 are estimated at $4.4 billion, a decrease of 0.3% from 2003-04. Table 5.5 provides the distribution of SPPs by Queensland Government department.
Health
Queensland receives funding for public hospital and other health services from the Australian Government under the Australian Health Care Agreement (AHCA). The AHCA provides the majority of Queensland Health’s revenue from the Australian Government, and is adjusted each year for population growth and increases in costs and utilisation of hospitals.
The 2003-2008 AHCA commenced on 1 July 2003. Under the current Agreement, Queensland will receive $1.5 billion in 2004-05. The 2004-05 AHCA payments include $56 million to cover mental health, palliative care and quality programs as well as the Australian Government’s Pathways Home Program.
The 2003-2008 AHCA provides Queensland with $8 billion over five years. However, this represents a withdrawal by the Australian Government of $160 million over five years from Queensland’s public hospitals. The funding growth rates provided by the Australian Government in the 2003-08 AHCA are lower than the previous AHCA and fail to keep pace with rising costs and demand pressures.
In 2004-05, Queensland Health will also receive an estimated $288 million in recurrent and capital funding from the Australian Government for a range of specific health programs. These include home and community care, public health and high-cost drugs. Queensland Health will also receive an estimated $55 million for nursing home benefits.
Education
SPPs to the Department of Education comprise recurrent and capital grants for distribution to State and non-State schools and other organisations. A 4.2% increase in Australian Government grants in 2004-05 reflects cost indexation, enrolment growth, commencement of new programs and funding for capital projects.
Local Government, Planning, Sport and Recreation
Australian Government recurrent SPPs to the Department of Local Government, Planning, Sport and Recreation are grants to Queensland Local Government Authorities (formerly grants to Local Authorities Trust Fund). The 2.4% increase in 2004-05 reflects an increase in Financial Assistance Grants for local government following the 2004-05 Australian Government Budget.
Employment and Training
In 2004-05, the Department of Employment and Training will receive $196 million in SPP funding from the Australian Government for a range of vocational education and training programs. This represents a decrease of 1.5% on 2003-04. The decrease is mainly attributed to the completion of National Priority Projects in 2003. New funds for National Priority
| | | | |
| | | Budget Strategy and Outlook 2004-05 | | 68 |
Projects are linked to the Australian National Training Authority (ANTA) Agreement with States and Territories. The new ANTA agreement for 2004-2006 is as yet unsigned.
Housing
The current Commonwealth-State Housing Agreement covering the period 2003-08 was finalised in August 2003. The Budget estimate for 2004-05 represents a reduction in real terms against estimated payments in 2003-04.
The Australian Government has refused to continue compensation for the impact of the GST on public housing. Although the Australian Government has allowed for some indexation of its funding from 2004-05, this is partially offset by continuing to impose a 1% per annum productivity dividend reduction to funding under the agreement.
This funding will be used for the continued development of a core social housing sector to assist people unable to access alternative suitable housing options through the delivery of affordable, appropriate, flexible and diverse housing assistance responses that provide people with choice and are tailored to their needs, local conditions and opportunities.
Treasury
Treasury receives payments from the Australian Government for joint Commonwealth-State natural disaster relief measures, concessions for Pensioner Concession Card Holders and to compensate the State for foregone revenue on the establishment of the Australian Securities Commission. The increase in 2004-05 is due to higher scheduled debt redemption payments paid to states under the Commonwealth Financial Agreements Act 1994.
Disability Services Queensland
A new Commonwealth-State Disability Agreement for the period 2002-07 was signed by the Queensland Government in June last year. Australian Government funding for Disability Services Queensland is estimated to increase by 2.8% in 2004-05.
Main Roads
Funding is received from the Australian Government for infrastructure and maintenance works on the National Highway System, Roads of National Importance and for Black Spot Road Safety projects. The 2004-05 reduction in funding reflects the absence of new project funding details in the Australian Government Budget.
Other
Other SPPs are expected to decline in 2004-05, with a number of agencies expected to receive reduced payments from the Australian Government.
Other Grants and Contributions
Grants and contributions are funds received from other state and local government agencies, other bodies and individuals where there is no direct benefit to the provider. Contributions
| | | | |
| | | Budget Strategy and Outlook 2004-05 | | 69 |
exclude Australian Government grants and user charges. The main sources of contributions are:
| | • | those received from private enterprise and community groups to fund research projects and community services, including the contributions of Parents and Citizens Associations to State schools |
| | • | contributed assets and goods and services received for a nominal amount |
| | • | revenues received from statutory authorities outside the General Government sector, where that money is used to meet Government policy objectives – for example, community service obligation payments. |
| | | | | | | | | |
Table 5.6 Other Grants and Contributions | |
| | | 2002-03
Actual $ million | | 2003-04 Est. Act. $ million | | 2004-05 Budget $ million | | Change Budget over
Est. Act. % | |
| | | | | | | | | | |
Other Grants and Contributions | | 503 | | 538 | | 496 | | (7.8 | ) |
| | | | | | | | | | |
Revenues will vary from year to year based on the number and size of research projects, assets transferred between the Government and the private sector, and contributed assets and services. The 2004-05 estimate includes $20 million from local government as a contribution to the operation of the TransLink public transport system.
Sales of Goods and Services
Sales of goods and services revenue comprises cost recoveries from the provision of goods or services. Revenue from this source is expected to increase by 8% in 2004-05.
| | | | | | | | | |
Table 5.7 Sales of Goods and Services1 | |
| | | 2002-03 Actual $ million | | 2003-04 Est. Act. $ million | | 2004-05 Budget $ million | | Change Budget over
Est. Act. % | |
| | | | | |
Fee for Service Activities | | 972 | | 874 | | 916 | | 4.8 | |
TransLink | | — | | — | | 187 | | n.a. | |
Rent Revenue | | 248 | | 252 | | 253 | | 0.4 | |
Sale of Land Inventory | | 58 | | 78 | | 38 | | (51.3 | ) |
Hospital Fees | | 148 | | 193 | | 176 | | (8.8 | ) |
Transport and Traffic fees | | 154 | | 158 | | 165 | | 4.4 | |
Other Sales of Goods and Services | | 385 | | 430 | | 406 | | (5.6 | ) |
Total Sales of Goods and Services | | 1,964 | | 1,984 | | 2,142 | | 8.0 | |
Note: 1. Numbers may not add due to rounding. | |
Fee for Service Activities
Major items of fee for service activities across the General Government sector include:
| | • | recoverable works carried out by both the Department of Main Roads and the commercialised arm of the department |
| | • | fees charged by Technical and Further Education (TAFE) colleges |
| | • | water charges for rural and industrial users |
| | • | fees charged by CITEC for information and telecommunications services to the private sector. |
TransLink
In 2004-05, Sales of Goods and Services includes revenues arising from the arrangements associated with TransLink integrated ticketing and public transport arrangements, which will commence in July 2004. Instead of subsidising public transport operators for the gap between operating costs and revenues, the TransLink entity will collect revenues from the operation of public transport services in South East Queensland to fund public transport services in the region. These revenues are estimated at $187 million in 2004-05.
Rent Revenue
Rent revenue is earned on the rent or lease of Government buildings, housing, plant and equipment, motor vehicles and car parks. Major items under this category include public housing rentals and rents charged for Government buildings.
| | | | |
| | | Budget Strategy and Outlook 2004-05 | | 70 |
Sale of Land Inventory
Sale of land inventory comprises land sales undertaken by agencies, where the buying and selling of land is a core business activity of the agency, such as the Department of State Development’s Property Services Group. As such, it is distinct from property disposals undertaken by most Government agencies.
Hospital Fees
Hospital fees are collected by public hospitals for chargeable bed days. In 2004-05, hospital fee revenue is expected to decrease by 8.8% on 2003-04 collections. This reduction is largely due to an expected decrease in private patient revenue and third party payments.
Transport and Traffic Fees
This category comprises State transport fees, the Traffic Improvement Fee, drivers’ licence fees and various marine licence and registration fees.
Other Sales of Goods and Services
Revenues from other sales of goods and services are expected to decrease by 5.6% in 2004-05. This decline is largely attributable to reduced title registration fees with the easing of the property market.
The Government provides concessions in the form of discounts, rebates and subsidies to improve access to and the affordability of a range of services for individuals or families based on eligibility criteria relating to factors such as age, income and special needs or disadvantaged.
Appendix B provides details of the concession arrangements set in place by the Queensland Government.
| | | | |
| | | Budget Strategy and Outlook 2004-05 | | 71 |
INTEREST INCOME
Interest income primarily comprises interest earned on the Treasurer’s Cash Balances and investments held to finance future employee entitlements, for example superannuation and long service leave.
| | | | | | | | | | |
Table 5.8 Interest Income | |
| | | 2002-03 Actual $ million | | | 2003-04 Est. Act. $ million | | 2004-05 Budget $ million | | Change Budget over
Est. Act. % | |
Interest Income | | (128 | ) | | 2,332 | | 1,215 | | (47.9 | ) |
| | | | | | | | | | | |
Queensland Treasury Corporation manages the State’s short term investments, such as the Treasurer’s Cash Balances, while Queensland Investment Corporation manages the State’s long-term investments, primarily employee entitlement provisions. The State’s investment portfolio includes a diversified holding of equities, property and fixed interest.
The strong performance of domestic and international equity markets positively impacted interest income in 2003-04, with an estimated return of 18%. This estimate is based on year-to-date earnings as at 31 May 2004.
Interest income in 2004-05 is based on the assumed long term average earnings rate of 7.5% on investments. Chart 1.1 shows investment return rates achieved over time.
OTHER REVENUE
Other revenue comprises dividends, tax equivalent payments, royalties, fines and forfeitures, and other sundry revenues. Other revenue is expected to decline in 2004-05, largely due to an expected decrease in dividends.
| | | | | | | | | |
Table 5.9 Other Revenue1 | |
| | | 2002-03 Actual $ million | | 2003-04 Est. Act. $ million | | 2004-05 Budget $ million | | Change Budget over Est. Act. % | |
| | | | | |
Dividends | | 802 | | 710 | | 599 | | (15.6 | ) |
Tax Equivalents | | 235 | | 365 | | 317 | | (13.2 | ) |
Royalties | | 724 | | 688 | | 827 | | 20.2 | |
Fines and forfeitures | | 144 | | 175 | | 168 | | (4.0 | ) |
Revenue nec | | 234 | | 178 | | 132 | | (25.8 | ) |
Total Other Revenue | | 2,138 | | 2,117 | | 2,043 | | (3.5 | ) |
Note: 1. Numbers may not add due to rounding. | |
| | | | |
| | | Budget Strategy and Outlook 2004-05 | | 72 |
Dividends
Dividends are received from the State’s equity in Public Non-financial corporations (PNFCs) and Public Financial corporations (PFCs). These include, for example, the Queensland Electricity Supply Industry, Queensland Investment Corporation, port authorities, Queensland Rail and Golden Casket.
| | | | | | | | | |
Table 5.10 Dividends1 | |
| | | 2002-03 Actual $ million | | 2003-04 Est. Act. $ million | | 2004-05 Budget $ million | | Change Budget over Est. Act. % | |
| | | | | |
Electricity Sector | | 455 | | 475 | | 375 | | (21.1 | ) |
Transport Sector (Rail and Ports) | | 196 | | 193 | | 186 | | (3.6 | ) |
Other2 | | 151 | | 42 | | 38 | | (9.5 | ) |
Total Dividends | | 802 | | 710 | | 599 | | (15.6 | ) |
Notes: 1. Numbers may not add due to rounding. 2. Includes dividends from Forestry, Golden Casket Corporation, Queensland Treasury Corporation and Queensland Investment Corporation. 2002-03 Actual also includes $43 million dividend from retained profits prior to the sale of Brisbane Market Corporation. | |
Dividends of $599 million are forecast for 2004-05.
Dividend revenue from public enterprises is a function of both net operating profits and dividend payout ratios.
The dividend payout ratio set by the Government for its public enterprises does not impact on the capacity and requirement of these entities to carry out necessary maintenance and repairs and asset replacement (via provision for depreciation). Dividends are paid after providing for such costs.
In total, dividends account for less than 2.5% of total General Government revenue in 2004-05.
Tax Equivalent Payments
Tax equivalent payments comprise payments by Government-owned corporations in lieu of state and Australian Government taxes and levies from which they are exempt. These payments arise from an agreement reached between the Australian Government and state governments in 1994 to establish a process for achieving tax uniformity and competitive neutrality between public sector and private sector trading activities.
Tax equivalent payments are expected to decline by 13.2% in 2004-05. This is primarily due to lower Workcover tax equivalent payments based on an assumed return to normal levels of investment earnings in 2004-05, following higher than average returns in 2003-04.
| | | | | | | | | |
Table 5.11 Tax Equivalent Payments1 | |
| | | 2002-03 Actual $ million | | 2003-04 Est. Act. $ million | | 2004-05 Budget $ million | | Change Budget over
Est. Act. % | |
| | | | | |
Electricity Sector | | 179 | | 191 | | 179 | | (6.3 | ) |
Transport Sector (Rail and Ports) | | 44 | | 81 | | 89 | | 9.9 | |
Other2 | | 12 | | 93 | | 49 | | (47.3 | ) |
Total Tax Equivalent Payments | | 235 | | 365 | | 317 | | (13.2 | ) |
Notes: 1. Numbers may not add due to rounding. 2. Poor investment returns experienced by Workcover in 2002-03 are offset by strong investment returns in 2003-04. This has substantially impacted on the result for tax equivalent payments over these two years. 2004-05 represents a return to the long-term interest rate earning assumption. | |
Royalties
The State earns royalties from the extraction of coal, base and precious metals, bauxite, petroleum, mineral sands and other minerals. In addition, royalty revenue includes rents received by the State from pastoral holdings, mining and other leases. Royalties return some of the proceeds for the extraction of non-renewable resources to the community.
Estimates of mining royalties are based predominantly on forecasts of production compiled by the Department of Natural Resources, Mines and Energy. Royalties are expected to decline slightly in 2003-04 due to the rising exchange rate, then increase in 2004-05 as a result of forecast higher coal prices and increases in volumes resulting from growth in international demand for coal.
Fines and Forfeitures
The major fines included in this category are traffic and court fines. There is an expected decline of 4% in collections of fines and forfeitures in 2004-05. This is partly due to the conduct of a trial of extended hours of speed camera operation in 2003-04 which has not been reflected in 2004-05 subject to trial evaluation.
| | | | |
| | | Budget Strategy and Outlook 2004-05 | | 73 |
Revenue nec
Revenue nec includes other revenues not included elsewhere. These revenues are estimated to decrease by 25.8% in 2004-05 reflecting a number of one-off receipts across agencies in 2003-04.
| | | | |
| | | Budget Strategy and Outlook 2004-05 | | 74 |
KEY POINTS
| | • | Total General Government sector expenses is expected to increase by $1.231 billion (or 5.6%) over the estimated actual for 2003-04, to $23.363 billion in 2004-05. |
| | • | Growth in expenses includes a range of service developments including the implementation of election commitments and other initiatives with a particular focus in the areas of child protection services, disability services, education and health. |
| | • | The major areas of expenditure are education and health which together constitute some 47% of General Government sector expenses. |
INTRODUCTION
This chapter provides an overview of General Government sector expenses for the estimated actual outcome for 2003-04, forecasts for the 2004-05 Budget year, and projections for 2005-06 to 2007-08.
The forward estimates are based on the economic projections outlined in Chapter 2 and are formulated on a no policy change basis.
The Ministerial Portfolio Statements and Appendix E provide details on total expenditure for departments.
| | | | | | | | | | | | |
Table 6.1 General Government Sector Expenses1 |
| | | 2003-04 Budget2
$ million | | 2003-04 Est.Act.
$ million | | 2004-05 Budget
$ million | | 2005-06 Projected
$ million | | 2006-07 Projected
$ million | | 2007-08 Projected
$ million |
Expenses | | | | | | | | | | | | |
Gross operating expenses | | | | | | | | | | | | |
Employee expenses | | 9,962 | | 10,025 | | 10,666 | | 11,200 | | 11,779 | | 12,430 |
Other operating expenses | | 3,614 | | 4,177 | | 4,406 | | 4,617 | | 4,884 | | 5,158 |
Depreciation | | 1,429 | | 1,483 | | 1,585 | | 1,643 | | 1,690 | | 1,738 |
Current transfers | | 4,804 | | 4,643 | | 5,006 | | 5,208 | | 5,478 | | 5,729 |
Capital transfers | | 422 | | 835 | | 741 | | 605 | | 608 | | 612 |
Nominal superannuation interest | | 751 | | 745 | | 757 | | 811 | | 849 | | 883 |
Other interest | | 247 | | 224 | | 202 | | 227 | | 272 | | 292 |
Total Expenses | | 21,229 | | 22,132 | | 23,363 | | 24,311 | | 25,560 | | 26,842 |
Notes: 1. Numbers may not add due to rounding. 2. Discussions with Australian Bureau of Statistics resulted in reclassification of expenses from 2003-04 Published Budget for the following: First Home Owners Grant payments from current transfers to capital transfers, some pensioner subsidy payments from current transfers to other operating expenses and expenses relating to the superannuation benefits of retired public sector employees from employee expenses to other operating expenses. |
General Government expenses in 2003-04 are estimated to be $22.132 billion broadly consistent with the Mid-Year Review revised estimate of $21.95 billion. The increase in expenses over the Budget estimate of $21.229 billion is primarily due to:
| | • | additional expenditure to match increases in specific purpose payments and other own source revenues |
| | • | actuarial revisions to estimates for superannuation and long service leave expense and insurance liabilities |
| | • | the delay in the transfer of the Bureau of Sugar Experiment Stations to the non-Government sector from 2002-03 to 2003-04 |
| | • | the creation of the Workers’ Compensation Regulatory Authority which has resulted in expenditure previously recorded in the Public Financial Corporations sector now being included in the General Government sector |
| | • | increased depreciation expense as a result of asset revaluations |
| | • | the final timing of expenses between 2002-03 and 2003-04 |
| | • | policy decisions including child protection and elective surgery initiatives. |
| | | | |
| | | Budget Strategy and Outlook 2004-05 | | 75 |
The General Government operating statement provides for aggregate expenses of $23.363 billion in 2004-05, representing an increase of $1.231 billion (or 5.6%) over the 2003-04 estimated actual. Factors influencing the growth in expenses include the implementation of election commitments and other service enhancements outlined in Chapter 4 and other cost increases such as the impact of enterprise bargaining agreements.
EXPENDITURE BY CATEGORY
This section provides a breakdown of the General Government operating statement in 2004-05 by category and discusses the significant variances between 2003-04 estimated actual and 2004-05 Budget by expense category.
Chart 6.1 indicates that the single largest expense category in the General Government sector is employee expenses – reflecting the direct service provision nature of State Government activities, followed by current transfers that include community service obligation payments to Government-owned corporations (GOCs) and the fuel subsidy scheme.
Chart 6.1
Expenses by Operating Statement Category for 2004-05
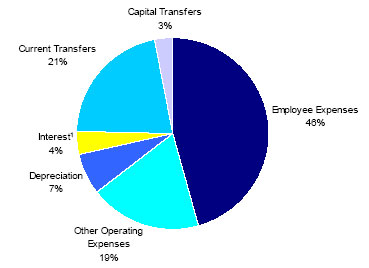
Note:
| 1. | Includes Nominal Superannuation Interest Expense. |
Chart 6.2 compares the 2003-04 estimated actual expenses for each operating statement category with the 2004-05 Budget.
Chart 6.2
Expenses by Operating Statement Category
for 2003-04 and 2004-05
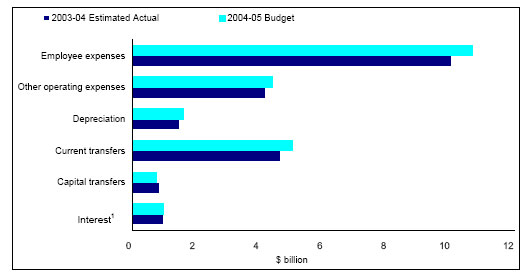
Note:
| 1. | Includes Nominal Superannuation Interest expense. |
DETAILS OF EXPENSES
Employee expenses
Employee expenses include salaries and wages, annual leave, long service leave and superannuation expense. Superannuation expense represents the employer’s superannuation contribution of Government employees.
Employee expenses are forecast to increase by $641 million or 6.4% to $10.666 billion in 2004-05. The increase reflects a combination of wage increases based on established enterprise bargaining agreements and additional staffing associated with service growth, election commitments and other service enhancements.
The additional staffing provided in the 2004-05 Budget is predominantly in key service delivery areas, including 589 additional teachers, an additional 500 new nursing graduates, emergency department doctors and nurses, specialist staff and community-based mental health clinicians, 350 additional police, additional paramedics, additional frontline and support staff for the Department of Child Safety and additional staff for the Commission for Children and Young People.
Other operating expenses
Other operating expenses comprise the non-labour costs of providing goods and services, repairs and maintenance, consultancies, contractors, electricity, communications and marketing.
The significant increase in this expense category is related to the Department of Transport’s implementation of Translink from 1 July 2004. The aim of this initiative is to improve the integration and coordination of bus, ferry and rail services in south east Queensland by progressing integrated ticketing, together with standardising concessions and fares. As part of the process of integrated ticketing, revenues of approximately $207 million (including concessional subsidies) in 2004-05 are forecast to be derived from participating bus, ferry and rail operators will now be received by the Department of Transport with payments made to
| | | | |
| | | Budget Strategy and Outlook 2004-05 | | 76 |
the public transport operators for the full contracted services (previously a subsidy was made to the operators for the difference between operating costs and revenues).
Depreciation
Depreciation expense is an estimate of the progressive consumption of the State’s assets through normal usage, wear and tear and obsolescence.
Queensland’s depreciation expense as a percentage of fixed assets is generally higher than that of other states, reflecting a more conservative provision for asset replacement over time. Although this results in lower operating surpluses, over time it will lead to a younger asset base. It is also more sustainable by making available larger amounts of funding from recurrent sources to finance capital expenditure.
Growth in this expense category primarily reflects asset revaluations and additions to the asset base.
Current transfers
Current transfers include grants and subsidies to the community (such as to schools, hospitals, benevolent institutions, and local governments), personal benefit payments, and Commonwealth taxes such as Fringe Benefits Tax. Grants and subsidies include payments made under the State’s fuel subsidy scheme and community service obligation payments to Government-owned corporations.
CSO payments are made by Government as a way of purchasing products and services that would otherwise not be undertaken (or undertaken at a higher price) in a commercial environment. In Queensland, CSO payments are mainly provided for rail (for example, passenger transport) and electricity services (for example, maintenance of uniform tariffs).
Information on concessions provided in the form of subsidies and rebates to organisations and individuals are provided in Appendix B.
Increases in CSO payments to Government-owned corporations and grants to non-Government schools are factors contributing to an estimated increase of $363 million in 2004-05 (see Table 6.2). Higher CSO payments are a result of a new shareholders agreement to support services undertaken by Queensland Rail on behalf of the Government.
| | | | |
Table 6.2 Current Transfers1 |
| | | 2003-04 Est. Act. $ million | | 2004-05 Budget $ million |
Fringe Benefit Tax payments to Commonwealth | | 21 | | 23 |
Fuel Subsidy | | 492 | | 511 |
Grants to local government | | 370 | | 376 |
Grants to non-government schools | | 1,108 | | 1,172 |
Grants to non-profit organisations | | 660 | | 697 |
Grants to other non-government recipients | | 1,067 | | 1,178 |
Payments to GOCs | | 925 | | 1,049 |
Total Current Transfers | | 4,643 | | 5,006 |
Note: 1. Numbers may not add due to rounding. |
Capital transfers
Capital transfers represent grants by the Government for capital purposes to local governments, non-profit institutions and other non-Government entities, such as households and businesses. The primary purpose of capital grants in 2004-05 relates to funding for road, water and sewerage projects undertaken by local governments, Aboriginal and Community housing projects, grants under the First Home Owners Grant scheme and transfers to non-Government schools for infrastructure.
Movements from year to year in capital transfers are influenced by the timing of capital projects and the progressive completion of approved projects. Donations of capital assets are also included as capital transfers.
Capital transfers are forecast to decline by $94 million relative to the 2003-04 estimated actual (see Table 6.3). The decrease is partially the result of the transfer of the Bureau of
| | | | |
| | | Budget Strategy and Outlook 2004-05 | | 77 |
Sugar Experiment Stations (BSES), a statutory body, to an industry-controlled corporate structure in 2003-04. The transfer of the BSES (valued at $43 million) is treated as a grant to the sugar industry.
During the 2003-04 financial year, the Queensland Government also transferred the Albion Park Paceway asset ($23 million) from the State’s ownership to the Greyhound Racing Authority and the Queensland Harness Racing Board.
Also contributing to the decline in 2004-05 is the extinguishment of a loan made to Australian Magnesium Corporation (AMC) Limited to provide payments to distribution entitled shareholders. This loan is being extinguished in 2003-04 upon receipt of part payment, thereby exiting the State’s involvement with the company.
| | | | |
Table 6.3 Capital Transfers1 |
| | | 2003-04 Est. Act. $ million | | 2004-05 Budget $ million |
First Home Owners Grant scheme | | 177 | | 187 |
Local Government grants | | 294 | | 296 |
Grants to non-profit organisations | | 117 | | 91 |
Grants to other non-government recipients | | 247 | | 167 |
Total Capital Transfers | | 835 | | 741 |
Note: 1. Numbers may not add due to rounding. |
Table 6.3 provides a breakdown of capital transfers by recipients. The major recipient of capital transfers by the Government is local government (40%). Further information on grants to local government authorities is provided in Chapter 8.
Interest
The nominal superannuation interest expense represents the imputed interest on the Government’s accruing defined benefit superannuation liability.
The other interest expense includes interest paid by agencies, principally to the Queensland Treasury Corporation, on borrowings to acquire capital assets and infrastructure such as roads and government buildings. The decline in this expense in 2004-05 reflects the full year effect of debt redemption payments made in 2003-04 as a result of improved cash inflows, particularly transfer duty revenues related to property market activity. The growth in this expense over the forward estimates reflects a moderate growth in borrowings for capital asset acquisitions.
Nominal superannuation interest expense is estimated to grow consistently in 2004-05 and the forward years, relative to the 2003-04 amount, due to factors including actuarial estimates of the liabilities, enterprise bargaining agreements and increases in the number of public sector employees associated with planned growth in services.
Operating Expenses by Purpose
Chart 6.3 indicates the proportion of expenditure by major purpose classification for the 2004-05 Budget. Education accounts for the largest share of expenses (25%), followed by Health (22%) and Transport and communications (12%).
Chart 6.3
General Government Expenses by Purpose 2004-05
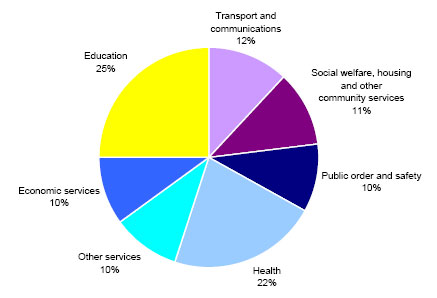
| | | | |
| | | Budget Strategy and Outlook 2004-05 | | 78 |
A comparison of General Government expenditure by purpose growth from 2003-04 to 2004-05 Budget is outlined in Chart 6.4 (see also Table D.10 in Appendix D).
Chart 6.4
General Government Expenses By Purpose
for 2003-04 and 2004-05
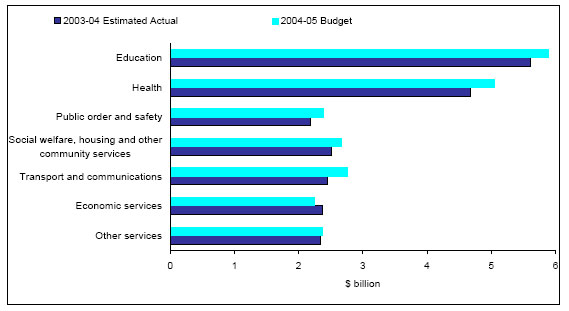
The Government’s Charter of Social and Fiscal Responsibility sets out the Government’s priorities for delivering high quality services and to improve the quality of life for Queenslanders. The Government has consistently had a clear focus on improving key service areas such as education, health, public order and safety and community services.
An indication of the Queensland Government’s focus in these areas since 1998-99 can be seen in the following chart.
Chart 6.5
General Government Expenses by Purpose
Growth from 1998-99 to 2004-05
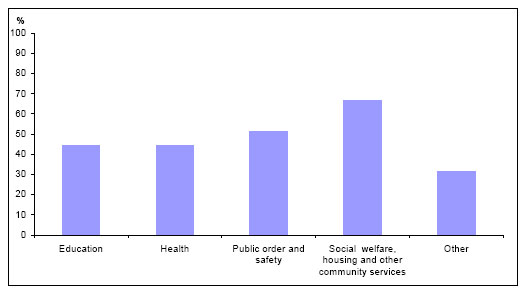
Source: Queensland Treasury’s data supplied to ABS.
The Education function includes primary and secondary education, tertiary education (including technical and further education) and the transportation of school students. The 2004-05 Budget for this functional area is $5.9 billion in 2004-05 representing an increase of 44% ($1.8 billion) between 1998-99 and 2004-05.
The consistently strong annual growth in education and training expenditure has ensured that in addition to services having kept pace with cost increases, services have also been expanded and enhanced significantly over this time. Significant enhancements over this period include a large increase in the number of school-based apprenticeships and traineeships, enhanced services in special education, significant investments in literacy and numeracy initiatives and computers in schools.
The Health Function includes expenses relating to acute care institutions, mental health institutions, nursing homes for the aged and community health services including patient transport. By 2004-05, expenses on providing Health services are estimated to have increased by 45% ($1.6 billion) since 1998-99 reflecting a range of service developments including growth in service capacity (including elective surgery initiatives), implementation of new medical technology, expansion of Home and Community Care Services and the operational costs of new facilities.
The Public Order and Safety Function includes police and fire protection services, law courts and legal services and prisons and corrective services. Expenditure on the Public Order and Safety Function are estimated to total $2.4 billion in 2004-05, an increase of 51% since 1998-99.
One of the most significant factors contributing to this growth is the Government’s commitment to increase the number of police officers in Queensland. In 1995, the Queensland Police Service released its ten-year forward planning document Towards the 21st Century. Support for the plan resulted in a commitment to increase police numbers in Queensland to the average Australian police to population ratio (225 police officers per 100,000 population). This commitment resulted in a requirement for 9,100 officers by 2005 (or 300 additional police officers per annum).
Services provided under the category of Social Welfare, Housing and other Community Services include family and disability services, child protection, housing and community amenities including Aboriginal and Torres Strait Islander communities, environmental services, arts and cultural outlays. The 2004-05 Budget provides for total expenditure of almost $2.7 billion representing an estimated increase of over $1 billion or 67% between 1998-99 and 2004-05.
| | | | |
| | | Budget Strategy and Outlook 2004-05 | | 79 |
Growth in expenditure in this category reflects a range of initiatives over this period spanning a number of functional areas. Particular areas experiencing major service enhancements have been disability services, child protection and family support services.
Details of 2004-05 initiatives and service developments are provided in Chapter 4 — Budget Priorities.
| | | | |
| | | Budget Strategy and Outlook 2004-05 | | 80 |
| 7. | BALANCE SHEET AND CASH FLOWS |
KEY POINTS
| | • | The Queensland Government’s already strong financial position is expected to strengthen further in 2004-05. State net worth is projected to rise by $3.098 billion through the year to $72.464 billion. |
| | • | Net worth is also forecast to increase each year over the forward estimates period, meeting the Government’s commitment in its Charter of Social and Fiscal Responsibility to maintain and seek to increase total State net worth. |
| | • | The General Government sector is well placed to meet all its present and future liabilities. Financial assets are projected to exceed liabilities by $14 billion in the General Government sector at 30 June 2005, consistent with another of the Government’s Charter principles. |
| | • | The General Government sector is estimated to record a cash surplus of $1.059 billion in 2004-05, after allowing for $2.434 billion in net asset purchases. |
| | • | The General Government sector is budgeted to achieve strong cash surpluses in the forward years. |
INTRODUCTION
The 2004-05 balance sheet shows the projected assets, liabilities and net worth of the General Government sector as at 30 June 2005. It is important for the Government to maintain a strong balance sheet to provide it with the stability, flexibility and capacity to deal with any emerging financial and economic pressures.
The assets and liabilities in the balance sheet are defined according to the Government Finance Statistics (GFS) standard of the Australian Bureau of Statistics.
Detailed balance sheet and cashflow information for the General Government sector and the rest of the public sector is contained in Appendix D.
Table 7.1 provides a summary of the key balance sheet measures for the General Government sector.
| | | | | | | | | | | | | | | | | | | | | |
Table 7.1 General Government Sector: Summary of Budgeted Balance Sheet1 | |
| | | 2002-03 Actual $ million | | | 2003-04 Budget $ million | | | 2003-04 Est. Act. $ million | | | 2004-05 Budget $ million | | | 2005-06 Projected $ million | | | 2006-07 Projected $ million | | | 2007-08 Projected $ million | |
Financial assets | | 32,161 | | | 32,935 | | | 34,481 | | | 36,817 | | | 38,715 | | | 41,288 | | | 43,563 | |
| | | | | | | | |
Non-financial assets | | 53,914 | | | 49,655 | | | 56,103 | | | 58,479 | | | 60,827 | | | 62,981 | | | 65,028 | |
| | | | | | | | |
Total Assets2 | | 86,075 | | | 82,590 | | | 90,584 | | | 95,296 | | | 99,542 | | | 104,269 | | | 108,591 | |
| | | | | | | | |
Borrowings | | 3,690 | | | 4,383 | | | 3,443 | | | 3,571 | | | 4,200 | | | 5,095 | | | 5,569 | |
| | | | | | | | |
Superannuation | | 11,770 | | | 12,722 | | | 12,127 | | | 13,607 | | | 14,669 | | | 15,752 | | | 16,849 | |
| | | | | | | | |
Other provisions and liabilities | | 5,721 | | | 5,173 | | | 5,648 | | | 5,654 | | | 5,697 | | | 5,752 | | | 5,837 | |
| | | | | | | | |
Total Liabilities | | 21,181 | | | 22,278 | | | 21,218 | | | 22,832 | | | 24,566 | | | 26,599 | | | 28,255 | |
| | | | | | | | |
Net Worth | | 64,894 | | | 60,312 | | | 69,366 | | | 72,464 | | | 74,976 | | | 77,670 | | | 80,336 | |
| | | | | | | | |
Net Debt | | (11,843 | ) | | (10,800 | ) | | (14,040 | ) | | (15,015 | ) | | (15,242 | ) | | (15,465 | ) | | (16,199 | ) |
Notes: 1. Numbers may not add due to rounding. 2. For GFS purposes, the State’s assets are classed as either financial or non-financial assets. | |
BALANCE SHEET
Financial Assets
The General Government sector holds the full equity of the State’s public enterprises, principally its shareholding in Government-owned corporations, in much the same manner as the parent or holding company in a group of companies. The estimated net investment in public enterprises ($14.131 billion at 30 June 2005) is included in the General Government sector’s financial assets5.
| 1 | Some credit rating agencies and analysts set aside the equity investment in public enterprises in assessing net financial assets. Their view is that as these investments are held for policy purposes and are not readily realisable, they cannot, in practice, be used to offset liabilities. |
| | | | |
| | | Budget Strategy and Outlook 2004-05 | | 81 |
In the year to 30 June 2005, financial assets are projected to increase by $2.336 billion, attributable principally to increased investment in superannuation assets. Growth of $2.320 billion in financial assets in 2003-04 reflects the impact of strong earnings on investments in that year. Investment earnings in 2004-05 and the outyears are based on long-term rate of return assumptions.
Chart 7.1 shows General Government sector financial assets by category at 30 June 2005. Investments held to meet future liabilities for superannuation and long service leave comprise the major part of the State’s financial assets.
Chart 7.1
General Government Financial Assets by Category as at 30 June 2005
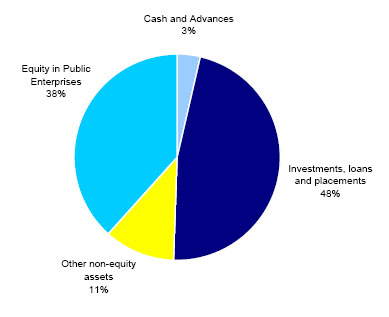
Non-Financial Assets
General Government non-financial assets are projected to total $58.479 billion at 30 June 2005. The majority of these non-financial assets are roads, schools, hospitals and other infrastructure used to provide services to Queenslanders. Other non-financial assets held by the State include intangibles (mainly computer software and licences), inventories and land.
After allowing for the purchase and/or construction of replacement or new assets, asset revaluations, depreciation and disposals, physical assets in the year ending 30 June 2005 are expected to grow by $2.376 billion during 2004-05.
The Government has traditionally funded new infrastructure at levels well beyond that of the other states. General Government purchases of non-financial assets per capita have exceeded that of all other major states for well over a decade (see Chart 3.6).
Liabilities
The largest single accruing liability in the General Government sector is employee entitlements (principally superannuation and long service leave) which are projected to total $16.382 billion as at 30 June 2005. Other liabilities include borrowings and advances received.
Liabilities are budgeted to increase by $1.614 billion in 2004-05, largely on account of normal growth in the General Government superannuation liability.
State Public sector superannuation liabilities include both defined benefit liabilities for current employees and the balance of former scheme members (retirement, resignation etc) who choose to invest in QSuper’s range of post retirement products.
Defined benefit superannuation liabilities are forecast to increase $995 million in 2004-05.
The liabilities related to former scheme member balances grow in line with investment earnings and changes in investment balances arising from new entrants or withdrawals. In 2004-05, this liability is forecast to increase by $457 million.
The proportion of the State’s total superannuation liability relating to former scheme members is expected to increase over the forward estimates period as these investment balances grow and new public sector employees join the accumulation, as opposed to defined benefit, fund.
| | | | |
| | | Budget Strategy and Outlook 2004-05 | | 82 |
Other non-equity liabilities include payables, unearned revenue and other liabilities excluding borrowings and provisions.
The composition of the General Government sector’s liabilities is illustrated in Chart 7.2.
Chart 7.2
General Government Liabilities by Category as at 30 June 2005
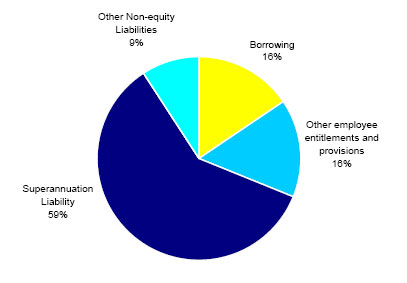
Net Financial Assets
The net financial assets (net financial worth) measure is an indicator of financial strength. Net financial assets are defined as financial assets less all existing and accruing liabilities. Financial assets include cash and deposits, advances, financial investments, loans, receivables and equity in public enterprises.
The net financial assets measure is broader than the alternative measure, net debt, which measures only cash, advances and investments on the assets side and borrowings and advances on the liabilities side. Because of its comprehensive nature, the net financial assets measure is more appropriate in an accrual accounting framework.
The net financial assets of the General Government sector for 2004-05 are forecast at $13.985 billion, reflecting the cumulative impact of sound fiscal policies and indicate that the State is capable of meeting all its current and recognised future obligations, without recourse to material adjustments in fiscal policy settings.
This position is consistent with the Government’s Charter principle that the State’s financial assets cover all accruing and expected future liabilities of the General Government sector.
The State’s net financial asset position remains extremely sound. Based on current projections, the General Government sector will continue to meet the commitment in the Government’s Charter to ensure that financial assets cover all accruing and expected future liabilities in all the years through to 30 June 2008.
Queensland has consistently pursued sound long-term fiscal policies such as the full funding of employee superannuation entitlements. The strong balance sheet and high levels of liquidity in the General Government sector clearly demonstrate the success of these policies.
Queensland’s level of liquidity is well in excess of that of other states as illustrated in Chart 7.3.
Chart 7.3
Ratio of Financial Assets to Liabilities (excluding Investments
in Public Enterprises) as at 30 June 2005
General Government Sector
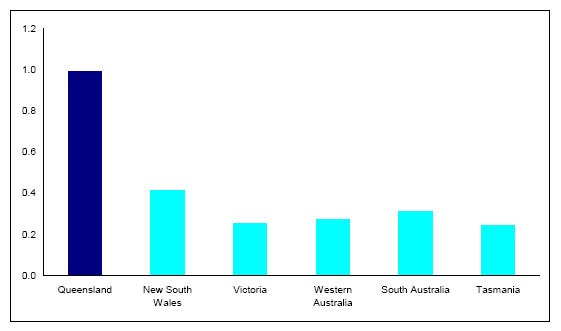
Source: State budget papers for QLD, VIC, SA, WA and TAS. NSW is Mid-Year Budget Review.
Net Worth
The Charter of Social and Fiscal Responsibility specifically requires the Government to maintain and seek to increase total State net worth.
The net worth, or equity, of the State is the amount by which the State’s assets exceed its liabilities (which is equivalent to General Government net worth). This is the value of the investment held on behalf of the people of Queensland by public sector instrumentalities.
Changes in the State’s net worth occur for a number of reasons including:
| | • | operating surpluses (deficits) that increase (decrease) the Government’s equity |
| | | | |
| | | Budget Strategy and Outlook 2004-05 | | 83 |
| | • | revaluation of assets and liabilities as required by accounting standards. Some financial liabilities are revalued on a regular basis. For example, the Government’s accruing liabilities for employee superannuation and long service leave are determined by actuarial assessments |
| | • | movements in the net worth of the State’s investments in the Public Non-financial Corporations and Public Financial Corporations sectors |
| | • | gains or losses on disposal of assets. Government agencies routinely buy and sell assets. Where the selling price of an asset is greater (less) than its value in an agency’s accounts, the resultant profit (loss) affects net worth. |
Net worth of the General Government sector is expected to grow by $4.472 billion over the 2002-03 actual net worth. This growth reflects the impact of the Government’s substantial operating surplus in 2003-04, increases in assets as a result of revaluations of assets as part of the State’s asset revaluation cycle, and the downward revaluation of the Government’s accruing liabilities for employee superannuation.
Chart 7.4 illustrates the State’s strong net worth compared with the other states. Queensland’s per capita net worth is 27% greater than the average per capita net worth of the other states.
Chart 7.4
Interstate Comparison of Per Capita Net Worth as at 30 June 2005
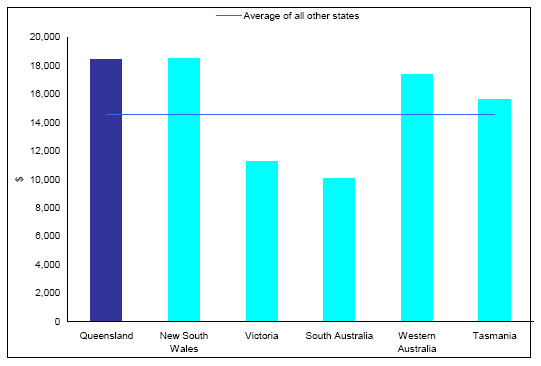
Note:
| 1. | Western Australia values land under roads as part of its overall asset base. This has been adjusted to allow comparison with other jurisdictions which do not value land under roads. |
Source: State Budget Papers for QLD, VIC, SA, WA and TAS. NSW is Mid-Year Budget Review. Population data from Australian Government Budget Paper 3.
Net Debt
Net debt is the difference between gross debt and financial assets (less equity in public enterprises and non-equity assets). The extent of accumulated net debt is currently the most common measure used to judge the overall strength of a jurisdiction’s fiscal position. High levels of net debt impose a call on future revenue flows to service that debt and meeting these payments can limit Government flexibility to adjust outlays. Excessive net debt can call into question the ability of Government to service that debt. As seen in Chart 7.5, the Queensland General Government sector has negative net debt – that is, a surplus of financial assets over financial liabilities, in comparison to other states, thus indicating the strength of Queensland’s financial position relative to the other states.
Queensland’s negative net debt of $3,725 per capita (net financial assets), compares to the average net debt of $253 per capita (net financial liabilities) in the other states.
Chart 7.5
Net Debt Per Capita as at 30 June 2005
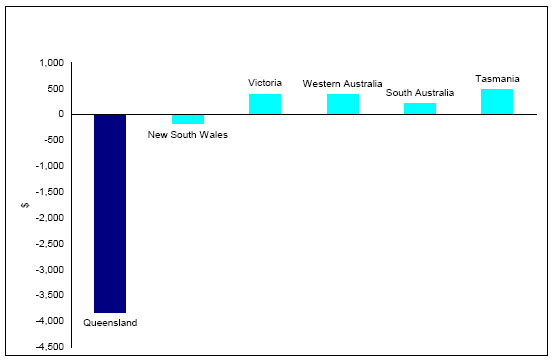
Source: Net debt from State Budget Papers for QLD, VIC, SA, WA and TAS. NSW is Mid-Year Budget Review.
Population Data from Australian Government Budget Paper 3.
CASH FLOWS
The cash flow statement provides information on the Government’s estimated cash flows from its operating, financing and investing activities.
The cash flow statement records estimated cash payments and cash receipts and hence differs from accrued revenue and expenditure recorded in the operating statement. In particular, the operating statement often records revenues and expenses that do not have an associated cash flow (for example, depreciation expense). The timing of recognition of accrued revenue or expense in the operating statement may differ from the actual cash disbursement or receipt (for example, tax equivalents). A detailed reconciliation between the cash flows from operations and the operating statement is provided later in this chapter.
The cash flow statement also records cash flows associated with investing and financing activities that are otherwise reflected in the balance sheet. For example, purchases of capital
| | | | |
| | | Budget Strategy and Outlook 2004-05 | | 84 |
equipment are recorded in the cash flow statement and impact on the balance sheet through an increase in physical assets.
The cash flow statement provides the cash surplus (deficit) measure which is a key aggregate or fiscal indicator used by a number of financial and economic commentators and analysts. The cash (deficit) measure is comprised of the net cash flow from operating activities plus the net cash flow from investment in non-financial assets (or physical capital). This measure is also used to derive the Loan Council Allocation nomination, provided in Appendix D.
Table 7.2 provides summary cash flow information for the General Government sector for 2003-04, 2004-05 and the outyears. Detailed cash flow tables are included in Appendix D.
| | | | | | | | | | | | | | | | | | |
Table 7.2 General Government Sector: Summary of Budgeted Cash Flows1 | |
| | | 2003-04 Budget $ million | | | 2003-04 Est. Actual $ million | | | 2004-05 Projected $ million | | | 2005-06 Projected $ million | | | 2006-07 Projected $ million | | | 2007-08 Projected $ million | |
| | | | | | | |
Cash receipts from operating activities | | 21,772 | | | 25,105 | | | 24,646 | | | 25,265 | | | 26,402 | | | 27,826 | |
| | | | | | | |
Cash payments for operating activities | | (19,300 | ) | | (20,658 | ) | | (21,150 | ) | | (22,381 | ) | | (23,532 | ) | | (24,719 | ) |
| | | | | | | |
Net cash flow from operating activities | | 2,472 | | | 4,447 | | | 3,496 | | | 2,884 | | | 2,870 | | | 3,107 | |
| | | | | | | |
Net cash flows from investing activities | | (3,264 | ) | | (4,195 | ) | | (4,031 | ) | | (3,718 | ) | | (3,716 | ) | | (3,457 | ) |
| | | | | | | |
Net cash flows from financing activities | | 570 | | | (288 | ) | | 40 | | | 610 | | | 879 | | | 466 | |
| | | | | | | |
Net increase/(decrease) in cash held | | (222 | ) | | (36 | ) | | (495 | ) | | (224 | ) | | 33 | | | 116 | |
| | | | | | | |
Derivation of GFS cash surplus (deficit) | | | | | | | | | | | | | | | | | | |
| | | | | | | |
Net cash flow from operating activities | | 2,472 | | | 4,447 | | | 3,496 | | | 2,884 | | | 2,870 | | | 3,107 | |
| | | | | | | |
Less net cash flow from investments in non- financial assets | | 2,320 | | | 2,198 | | | 2,434 | | | 2,446 | | | 2,270 | | | 2,198 | |
| | | | | | | |
Less Finance leases and similar arrangements | | — | | | — | | | 3 | | | — | | | — | | | — | |
| | | | | | | |
Equals GFS cash surplus (deficit) | | 152 | | | 2,249 | | | 1,059 | | | 438 | | | 600 | | | 909 | |
Note: 1. Numbers may not add due to rounding. | |
Cash Flows from Operating Activities
Table 7.3 provides a disaggregation of operating cash flows.
| | | | | | | | | |
Table 7.3 General Government Sector: Cash Flows from Operating Activities | |
| | | 2003-04
Budget $ million | | | 2003-04 Est. Act. $ million | | | 2004-05 Budget $ million | |
| | | | |
Receipts from operating activities | | | | | | | | | |
| | | | |
Taxes received | | 5,664 | | | 6,473 | | | 6,337 | |
| | | | |
Grants and subsidies received | | 10,865 | | | 11,642 | | | 12,273 | |
| | | | |
Sales of goods and services | | 2,155 | | | 2,279 | | | 2,384 | |
| | | | |
Other receipts | | 3,088 | | | 4,711 | | | 3,652 | |
| | | | |
Total receipts from operating activities | | 21,772 | | | 25,105 | | | 24,646 | |
| | | | |
Payments for operating activities | | | | | | | | | |
| | | | |
Payments for goods and services | | (13,365 | ) | | (14,514 | ) | | (14,691 | ) |
| | | | |
Grants and subsidies | | (4,806 | ) | | (5,250 | ) | | (5,603 | ) |
| | | | |
Interest | | (245 | ) | | (224 | ) | | (202 | ) |
| | | | |
Other payments | | (884 | ) | | (670 | ) | | (654 | ) |
| | | | |
Total payments for operating activities | | (19,300 | ) | | (20,658 | ) | | (21,150 | ) |
| | | | |
Net cash inflows from operating activities | | 2,472 | | | 4,447 | | | 3,496 | |
Cash inflows from operating activities include receipts from taxes, grants from the Australian Government, fees and charges levied on the provision of goods and services, interest receipts from investments, and dividend and tax receipts from Public Financial and Non-financial Corporations.
Taxes received by the General Government sector are forecast at $6.337 billion in 2004-05, down marginally on the 2003-04 estimated actual of $6.473 billion. In 2004-05, taxation revenue is expected to moderate as a result of a projected fall in transfer duty on property conveyancing transactions relative to 2003-04 levels, in line with expectations of an easing in the property market.
Grants and subsidies receipts are expected to increase in 2004-05 by $631 million to $12.273 billion, of which Australian Government grants are expected to account for $11.774 billion.
Other receipts include investment earnings, dividends and tax equivalents received from Government-owned corporations (GOCs) and royalties. Other receipts are expected to decrease in 2004-05 by $1.059 billion to $3.652 billion. This largely reflects that the 2004-05 estimates are based on the return to the long-term average earnings rate of 7.5% on investments. The higher investment earnings in 2003-04 are largely the result of an estimated investment return of 18% on investments held to meet future employee liabilities such as superannuation.
Cash outflows represent payment for goods and services, wages and salaries, finance costs and grants and subsidies paid to households, businesses and other Government agencies. In 2004-05 the largest cash disbursement is employee expenses at $10.040 billion or 48% of total cash payments from operating activities.
In 2004-05 payments for goods and services, including wages and salaries, are expected to increase marginally to $14.691 billion. This marginal increase is a result of the transfer of $450 million in superannuation assets held for employee entitlements to the QSuper Fund which was recorded as an employee disbursement in 2003-04. This transfer was effected to improve efficiency in the Fund of cash flows and overall cost of member benefits. Adjusting for this one-off transfer which is offset by an equivalent reduction in 2004-05, payments for goods and services are estimated to increase 7.7% in 2004-05, reflecting payments pertaining
| | | | |
| | | Budget Strategy and Outlook 2004-05 | | 85 |
to employer superannuation (accumulation scheme) contributions and State share of superannuation beneficiary payments, increased employee entitlements in line with enterprise bargaining agreements, and growth related to new and enhanced services.
��
Cash payments for grants and subsidies are expected to increase by $353 million or 6.7% in 2004-05 to $5.603 billion. This item includes recurrent grants paid by the Australian Government through the State to non-State schools, grants paid to industry, and grants to non-profit institutions. This item also includes capital grants which are largely paid to local government authorities to fund capital works.
Other payments mainly comprise personal benefit payments and other transfer payments. This item is estimated to decline by 2.4% in 2004-05 to $654 million. This is primarily attributable to lower HIH Insurance compulsory third party claim payments.
Cash Flows from Investments
Cash flows from investments include both financial and non-financial assets. Table 7.4 provides a disaggregation of investment cash flows into the different types.
| | | | | | | | | |
Table 7.4 General Government Sector: Cash Flows from Investing Activities | |
| | | 2003-04
Budget $ million | | | 2003-04 Est. Act. $ million | | | 2004-05 Budget $ million | |
Net payments for investments in non-financial assets | | (2,320 | ) | | (2,198 | ) | | (2,434 | ) |
| | | | |
Net cash flows from investing activities in financial assets for policy purposes | | 3 | | | (135 | ) | | (105 | ) |
| | | | |
Net cash flows from investing activities in financial assets for liquidity purposes | | (947 | ) | | (1,862 | ) | | (1,492 | ) |
| | | | |
Net increase/(decrease) in cash held from investing activities | | (3,264 | ) | | (4,195 | ) | | (4,031 | ) |
The largest cash disbursement for the Government, outside of recurrent operations, is investments in non-financial assets. This represents the Government’s capital works program which provides for infrastructure such as schools, hospitals and roads.
Cash outflows from investing in non-financial assets are expected to increase to $2.434 billion in 2004-05 from $2.198 billion in 2003-04 reflecting increased net capital purchases in 2004-05.
The cash expenditure on investment in non-financial assets differs from the estimates of capital works expenditure in Budget Paper No. 3 – Capital Statement. The estimates contained in that paper are on a gross basis and incorporate both departmental agencies and GOCs. In addition, Budget Paper No. 3 includes capital grants and does not offset proceeds from asset sales.
Apart from investing in new capital expenditure, governments also manage financial assets in order to finance overall expenditures. In addition, Queensland manages financial assets set aside to provide for future employee benefits (for example, superannuation and long service leave). The Government manages its financial assets through a combination of borrowing or investing funds and reducing or increasing equity in government or private sector entities. Investments in financial assets include activities relating to both policy and liquidity.
Investments for policy purposes include net equity injections into Government and other business enterprises and the net cash flow from disposal or return of equity in Government business enterprises.
Cash outflows from investments for policy purposes for 2003-04 of $135 million reflect equity transactions by the General Government sector with Public Non-financial Corporations. In 2003-04, this includes the injection of $110 million into Enertrade to facilitate its recapitalisation and $37 million to Queensland Motorways. These outflows are partially offset by a $15 million share buy-back payment instigated by the Ports Corporation of Queensland to return surplus funds to the Government as its shareholder.
| | | | |
| | | Budget Strategy and Outlook 2004-05 | | 86 |
Cash outflows from investments for policy purposes for 2004-05 of $105 million reflect equity transactions with public enterprises, in particular a further $15 million share buy-back by the Ports Corporation of Queensland, offset by equity injections of $25 million into Queensland Motorways, $60 million into Gladstone Port and $36 million into QR.
Cash flows from investments for liquidity purposes represent net investment in financial assets such as to cover superannuation and other employee entitlements.
Estimated cash outflows from investments in financial assets for liquidity purpose of $1.862 billion in 2003-04, reflect the re-investment of interest and the investment of contributions set aside for the Government’s defined benefit superannuation scheme. These cash outflows are partially offset by the payment of employee entitlements and the transfer of superannuation assets to cover the State’s share of superannuation beneficiary payments.
Cash outflows from investments in financial assets for liquidity purposes are estimated to be $1.492 billion in 2004-05, a net purchase of investments. This primarily reflects the re-investment of interest earnings and the investment of contributions set aside for the Government’s defined benefit superannuation scheme.
Cash Flows from Financing Activities
Cash flows generated from financing activities are outlined in Table 7.5 below.
| | | | | | | |
Table 7.5 General Government Sector: Cash Flows from Financing Activities |
| | | 2003-04 Budget $ million | | 2003-04 Est. Act. $ million | | | 2004-05 Budget $ million |
Net cash flows from borrowing (net) | | 570 | | (288 | ) | | 40 |
| | | | |
Net increase/(decrease) in cash held from financing activities | | 570 | | (288 | ) | | 40 |
Cash flows from financing activities include cash flows from net borrowing (increase in borrowing less redemption), net advances (gross investment in new loans less redemption of loans issued) and other financing (net movement in government securities on issue). Cash flows from borrowings are estimated to increase in 2004-05 to $40 million, reflecting borrowings to fund capital projects. The repayment of borrowings in 2003-04 reflects reduced borrowing requirements as a result of stronger cash receipts, particularly taxation receipts. These receipts were utilised to retire debt from previous years.
| | | | |
| | | Budget Strategy and Outlook 2004-05 | | 87 |
RECONCILIATION OF OPERATING CASH FLOWS TO THE OPERATING STATEMENT
Table 7.6 provides a reconciliation of the cash flows from operating activities to the operating result for the General Government sector for the Budget year.
| | | | | | | | | |
Table 7.6 General Government Sector: Reconciliation of Cash Flows from Operating Activities to Accrual Operating Activities | |
| | | 2003-04 Budget $ million | | | 2003-04 Est. Act. $ million | | | 2004-05 Budget $ million | |
| | | | |
GFS accrual revenue | | 21,382 | | | 24,506 | | | 24,009 | |
| | | | |
Add/(less) movement in tax equivalent and dividend receivables | | (41 | ) | | (276 | ) | | (93 | ) |
| | | | |
Add GST receipts from ATO | | 351 | | | 643 | | | 623 | |
| | | | |
Add/(less) movement in other receivables | | 80 | | | 232 | | | 107 | |
| | | | |
Equals GFS cash receipts | | 21,772 | | | 25,105 | | | 24,646 | |
| | | | |
GFS accrual expense | | 21,229 | | | 22,132 | | | 23,363 | |
| | | | |
Less non-cash items | | | | | | | | | |
| | | | |
Depreciation and amortisation expense | | 1,429 | | | 1,483 | | | 1,585 | |
| | | | |
Accrued superannuation expense | | 1,456 | | | 1,507 | | | 1,479 | |
| | | | |
Accrued employee entitlements | | 496 | | | 534 | | | 518 | |
| | | | |
Other accrued costs | | 150 | | | 338 | | | 187 | |
| | | | |
Add/(less) movement in employee entitlement provisions | | 767 | | | 1,256 | | | 532 | |
| | | | |
Add/(less) GST paid to ATO | | 369 | | | 675 | | | 654 | |
| | | | |
Add/(less) movement in other provisions and payables | | 466 | | | 457 | | | 370 | |
| | | | |
Equals GFS cash expenditure | | 19,300 | | | 20,658 | | | 21,150 | |
The main difference between the accrual operating statement and the cash flow relates to the timing of cash payments and receipts and their recognition in accrual terms, and the inclusion of non-cash expenses and revenues. The largest difference is on the expenses (expenditure) side, with large non-cash expenses associated with depreciation and superannuation. Differences due to the timing of receipt or payment of amounts are recorded as either a receivable or payable in the balance sheet.
| | | | |
| | | Budget Strategy and Outlook 2004-05 | | 88 |
| 8. | INTER-GOVERNMENTAL FINANCIAL RELATIONS |
KEY POINTS
| | • | Following the introduction of the Goods and Services Tax in 2000 and the abolition of a number of state taxes, states have become increasingly reliant on Australian Government funding. |
| | • | Queensland is a long-standing supporter of the principle of horizontal fiscal equalisation and was an active participant in the Commonwealth Grants Commission’s 2004 Review of State Revenue Sharing Relativities. |
| | • | The Commonwealth Grants Commission, an independent expert body, delivered an open and transparent review process which considered the various concerns of all states. After taking into account the available evidence, the Commission recommended Queensland receive an underlying increase of $262.7 million in GST funding in 2004-05. |
| | • | Queensland’s increased funding as a result of the 2004 Review recognises Queensland’s high population growth and the associated expense of providing essential infrastructure. |
| | • | Overall, Queensland is expected to receive 19.9% of total Australian Government funding to the states in 2004-05, compared with its population share of 19.4%. |
| | • | Specific Purpose Payment negotiations continue to be problematic as the states are increasingly required to commit to the priorities of the Australian Government and meet strict input and accountability controls. The Queensland Government would prefer a more cooperative, outcome focussed model. |
| | • | In 2004-05, the Queensland Government will provide 58% of all grants to Queensland local government. |
COMMONWEALTH-STATE FINANCIAL RELATIONS
Commonwealth-state financial relations are characterised by a mismatch between states’ expenditure responsibilities and access to own-source revenues. The Australian Government collects the major share of taxation revenues and increasingly states must rely on grants from the Australian Government to meet expenditure requirements.
Chart 8.1 shows states’ funding sources for 1999-2000 and 2004-05 and shows the states’ increased reliance on Australian Government funding since the introduction of the Australian Government’s national tax reforms in 2000. In 1999-2000 the states received 37% of their revenues from the Australian Government. This has increased to an estimated 49% in 2004-05. In contrast, the proportion of states’ revenues from state taxes has reduced from 40% in 1999-2000 to an estimated 32% in 2004-05.
| | | | |
| | | Budget Strategy and Outlook 2004-05 | | 89 |
Chart 8.1
Revenue Sources, All States, 1999-2000 and 2004-051
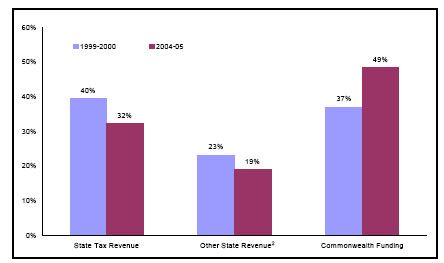
Notes:
| 1. | 2004-05 data are estimates. |
| 2. | Includes user charges, interest earnings, contributions from trading enterprises and mining revenue. Source: ABS Government Finance Statistics Cat No. 5512.0 and State and Australian Government Budget Papers. |
Chart 8.2
Revenue Sources, Queensland, 1999-2000 and 2004-051
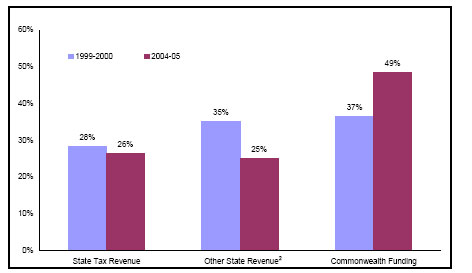
Notes:
| 1. | 2004-05 data are estimates. |
| 2. | Includes user charges, interest earnings, contributions from trading enterprises and mining revenue. |
Source: ABS Government Finance Statistics Cat No. 5512.0 and Queensland Budget estimates.
Queensland’s reliance on Australian Government funding, as shown in Chart 8.2, follows the national trend with its share of total funding sourced from the Australian Government rising from 37% in 1999-2000 to an estimated 49% in 2004-05, while its state taxation revenue has decreased from 28% in 1999-2000 to an estimated 26% in 2004-05. Queensland’s lower than average dependence on taxation revenue reflects its competitive taxation policy.
| | | | |
| | | Budget Strategy and Outlook 2004-05 | | 90 |
Australian Government Funding to the states
Australian Government payments to the states in 2004-05 are expected to total $59.855 billion, an increase of $3.178 billion or 5.6% compared with 2003-04. Table 8.1 compares estimated Australian Government payments to the states in 2004-05 with those for 2003-04.
| | | | | | | | | | |
Table 8.1 Estimated Australian Government Payments to the States, 2003-04 and 2004-051 |
| | | 2003-04 $ million | | 2004-05 $ million | | Change Nominal Terms % | | Change Real2 Terms % | | Change Real2 Per Capita % |
General Purpose Payments | | | | | | | | | | |
GST Revenues | | 33,297 | | 34,460 | | 3.5 | | 1.2 | | — |
Budget Balancing Assistance | | 46 | | — | | na | | na | | na |
Compensation for GST deferral | | — | | 330 | | na | | na | | na |
NCP Payments | | 579 | | 778 | | 34.5 | | 31.5 | | 29.9 |
Total General Purpose Payments | | 33,922 | | 35,568 | | 4.9 | | 2.5 | | 1.3 |
| | | | | | |
Specific Purpose Payments | | | | | | | | | | |
SPPs ‘to’ the States | | 16,788 | | 17,925 | | 6.8 | | 4.4 | | 3.1 |
SPPs ‘through’ the States | | 5,967 | | 6,363 | | 6.6 | | 4.3 | | 3.0 |
Total Specific Purpose Payments | | 22,755 | | 24,288 | | 6.7 | | 4.4 | | 3.1 |
| | | | | | |
Total Payments | | 56,676 | | 59,855 | | 5.6 | | 3.3 | | 2.0 |
Notes: 1. Numbers may not add due to rounding. 2. Deflated by 2004-05 year-average national forecast inflation of 2.25% and Australian population growth of 1.25%. Source:Australian Government Budget Paper No.3, 2004-05. |
General Purpose Payments
General purpose payments comprise Goods and Services Tax (GST) revenue, budget balancing assistance (BBA) and National Competition Policy (NCP) payments. General purpose payments from the Australian Government are expected to increase from $33.922 billion in 2003-04 to $35.568 billion in 2004-05, an increase of 4.9% in nominal terms. However, in real per capita terms, general purpose payments are expected to increase by 1.3%.
GST Revenue
The Australian Government distributes GST to states based on the principles of horizontal fiscal equalisation (HFE), with the per capita relativities recommended by the Commonwealth Grants Commission (CGC). Queensland supports the principle of HFE and the role of the independent CGC in determining each state’s share of GST revenue.
The principle of HFE is that state governments should receive funding from the Australian Government such that, if each made the same effort to raise revenue from its own sources and operated at the same level of efficiency, each would have the capacity to provide services at the same standard.
HFE provides the capacity for all communities to enjoy a similar level of state government services regardless of where they are located. This is a key feature of the Australian Federation, made necessary because the Australian Government generally imposes taxes at uniform rates across Australia. If the distribution of these taxes to the states were on any basis other than HFE, some taxpayers would be forced to accept either a lower standard of state services or a higher level of state taxation than other taxpayers in similar circumstances.
GST collections for 2004-05 are expected to be $34.46 billion, an increase of $1.163 billion compared with 2003-04.
Budget Balancing Assistance
Under the Intergovernmental Agreement on the Reform of Commonwealth-State Financial Relations (IGA), the Australian Government guaranteed that no state would be worse off as a result of national tax reform. Since the introduction of the GST, any shortfall between a state’s guaranteed minimum amount and its share of GST revenue is met by Budget Balancing Assistance (BBA), funded by the Australian Government. Each state’s guaranteed minimum amount includes Australian Government revenues foregone, abolished state taxes and the costs of new expenditure responsibilities.
No state is expected to require BBA in 2004-05. New South Wales is the only state expected to require budget balancing assistance in 2003-04.
Compensation for GST Deferral
The Australian Government’s 2004-05 Budget introduced a number of measures aimed at reducing the paperwork burden the GST places on small business and non-profit
| | | | |
| | | Budget Strategy and Outlook 2004-05 | | 91 |
organisations. Queensland has given in-principle support to these measures, which will require all states’ approval prior to implementation.
The most significant measure allows small business and non-profit organisations, which have voluntarily registered for GST, to lodge business activity statements annually, rather than monthly or quarterly. In 2004-05, the first year in which this measure will apply, entities will effectively defer their payment of GST until early 2005-06 rather than paying monthly or quarterly during 2004-05. The Australian Government will be required to compensate the states for the impact of this deferral, estimated to be $330 million.
National Competition Policy Payments
National Competition Policy (NCP) payments to the states are expected to be $777.7 million in 2004-05. No provision has been made for NCP payments beyond 2005-06 in the Australian Government Budget. As the Australian Government will continue to receive benefits from NCP reform beyond 2005-06, States should continue to receive NCP payments.
The distribution of NCP payments is based on states’ population shares and their progress with the implementation of specified reforms. States’ performances are subject to review by the National Competition Council which is expected to release its assessment mid year.
Specific Purpose Payments
Specific Purpose Payments (SPPs) are provided by the Australian Government to states for particular purposes under conditions negotiated between Governments. Separate agreements are negotiated for each SPP, with the agreements covering both funding and policy issues.
SPPs to states are provided either to or through the state. SPPs to a state assist in funding areas of state responsibility – for example, health and disability services. Payments through the state are passed to other service providers and are largely comprised of payments to non-government schools and grants to local government.
Total SPPs in 2004-05 are expected to be $24.288 billion. This represents an increase of $1.533 billion or 6.7%, in nominal terms over 2003-04. Payments to the states increased by 6.8% which represents a real increase of 3.1% when inflation and population growth are taken into account. Similarly, SPPs through the states are expected to increase by 6.6%.
STATE SHARES OF AUSTRALIAN GOVERNMENT FUNDING
Relative Shares of Funding to the States
Table 8.2 shows the expected shares of total Australian Government payments to each state for 2004-05 compared with each state’s population share. Queensland’s Australian Government funding share of 19.9% is more than its population share of 19.4%.
| | | | | | |
Table 8.2 Relative Shares of Payments to the States, 2004-051 |
| | | Share of
Payments % | | Share of
Population % | | Relative
Share2 % |
New South Wales | | 30.1 | | 33.5 | | 89.9 |
Victoria | | 21.9 | | 24.7 | | 88.6 |
Queensland | | 19.9 | | 19.4 | | 102.6 |
Western Australia | | 10.7 | | 9.9 | | 108.1 |
South Australia | | 8.8 | | 7.6 | | 115.2 |
Tasmania | | 3.4 | | 2.4 | | 141.7 |
Australian Capital Territory | | 1.8 | | 1.6 | | 115.4 |
Northern Territory | | 3.5 | | 1.0 | | 352.8 |
Notes: 1. Numbers may not add due to rounding. 2. A state’s relative share is measured as its funding share expressed as a percentage of its population share. Source:Australian Government Budget Paper No. 3, 2004-05. |
Queensland’s share of funding
Table 8.3 details Queensland’s share of estimated Australian Government payments in 2004-05 and the difference from a population share. (Detailed revenue data are provided in Chapter 5.)
| | | | | |
Table 8.3 Queensland’s Share of Estimated Australian Government Payments, 2004-051 | |
| | | Queensland’s
Share % | | Difference from
Population
Share $ million | |
General Purpose Payments | | | | | |
GST Revenues | | 20.8 | | 485.7 | |
Compensation for GST deferral | | 20.5 | | 3.6 | |
NCP Payments | | 19.5 | | 0.6 | |
Total General Purpose Payments | | 20.8 | | 489.9 | |
| | | |
Specific Purpose Payments2 | | | | | |
SPPs ‘to’ the State | | 18.5 | | (148.0 | ) |
SPPs ‘through’ the State | | 18.7 | | (41.6 | ) |
Total Specific Purpose Payments | | 18.6 | | (189.6 | ) |
| | | |
Total Australian Government Payments | | 19.9 | | 300.3 | |
Note: 1. Numbers may not add due to rounding. 2. Excludes AusLink payments as these have not yet been allocated among States. Source:Australian Government Budget Paper No. 3, 2004-05. | |
Queensland is expected to receive $489.9 million more than a per capita share of GST in 2004-05. This is partly offset by the $189.6 million less than a per capita share of other Australian Government payments Queensland is expected to receive. In terms of total
| | | | |
| | | Budget Strategy and Outlook 2004-05 | | 92 |
Australian Government funding, Queensland expects to receive $300.3 million more than a per capita share in 2004-05.
Any future benefits to Queensland from GST revenue growth are contingent on a number of factors, including:
| | • | Growth in private final consumption expenditure, particularly in the areas of retail trade and construction activity, and the effectiveness of ongoing GST compliance |
| | • | The outcome of the CGC’s 2005 Update of State Revenue Sharing Relativities, which will affect the distribution of the GST revenue grants in 2005-06. Although Queensland’s relative share of funding has increased as a result of the 2004 Review, a downward trend over the medium term is evident (see Chart 8.3). |
| | • | Future reviews of state taxes. At the 2004 meeting of the Ministerial Council for the Reform of Commonwealth-State Financial Relations, Queensland announced a decision to abolish debits tax from 1 July 2005, while the 2005 meeting of the Ministerial Council will review the need for retention of a number of stamp duties. |
INSTITUTIONAL ARRANGEMENTS
The institutions that provide the framework for Commonwealth-state financial arrangements are:
| | • | the Ministerial Council for the Reform of Commonwealth-State Financial Relations |
| | • | the Australian Loan Council |
| | • | the Commonwealth Grants Commission. |
Ministerial Council
The Ministerial Council for the Reform of Commonwealth-State Financial Relations comprises the Australian Government and State Treasurers and was established to oversee the operation of the IGA. At the meeting of 26 March 2004, the Council considered the following issues:
| | • | GST administration issues |
| | • | GST revenue and transitional assistance |
| | • | monitoring the level of SPPs. |
GST Administration Issues
The Australian Taxation Office (ATO) collects all GST revenue on behalf of the states. The costs of collection and compliance are borne by the states and administered under the GST Administration Performance Agreement.
| | | | |
| | | Budget Strategy and Outlook 2004-05 | | 93 |
The Ministerial Council considered a report from the GST Administration Subcommittee (GSTAS) about GST administration issues. The Council agreed to revised ATO performance measures and accepted the ATO’s budget for 2004-05.
In addition to the GSTAS, Queensland is represented on the States GST Policy Group. The States GST Policy Group monitors and researches issues relating to the application and administration of GST in Australia. The group reports to State Heads of Treasury on potential risks to the GST revenue base. Queensland also currently represents all States and Territories on the Indirect Taxes Rulings Panel and the Cash Economy Taskforce.
GST Revenue and Distribution
The Australian Government accepted the CGC’s 2004 Review Report on State Revenue Sharing Relativities as the basis for the distribution of the GST general revenue to the states in 2004-05.
The Ministerial Council agreed to a work program on the CGC’s methodology examining:
| | • | whether the present approach, which is based on a comprehensive assessment of virtually all receipts and expenses in the operating statements of States, is appropriate and necessary |
| | • | the size and trend of the redistributions |
| | • | simplification – the Commission’s current approach is based on high levels of disaggregation and large numbers of adjustments. Is this necessary and does it deliver a better equalisation outcome than possible alternatives? |
| | • | data issues – a consultative examination of the robustness and comparability of key data sets and likely data availability in the future. |
Heads of Treasuries will decide on the administrative arrangements applying to this program in the near future.
Review of State Taxes
Queensland confirmed its decision to abolish debits tax from 1 July 2005.
The Ministerial Council also endorsed a terms of reference for reviewing a number of stamp duties listed under the IGA. The taxes scheduled for review are:
| | • | Stamp Duty on Non-residential Conveyances |
| | • | Stamp Duty on Non-quotable Marketable Securities |
| | • | Stamp Duty on Mortgages, Bonds, Debentures and Other Loan Securities |
| | • | Stamp Duty on Credit Arrangements, Installment Purchase Arrangements and Rental Arrangements |
| | | | |
| | | Budget Strategy and Outlook 2004-05 | | 94 |
| | • | Stamp Duty on Cheques, Bills of Exchange and Promissory Notes. |
The Ministerial Council will consider a report regarding the implications of abolition of these taxes at its meeting scheduled for March 2005.
Monitoring the Level of Specific Purpose Payments
In the IGA, the Australian Government undertook to not reduce aggregate SPPs as a result of national tax reform. The Australian Government has met this undertaking in real per capita terms when current payments are compared with the level of SPPs in 1999-2000. However, SPPs ‘through’ states have increased more than SPPs ‘to’ states over this time.
The position taken by the Australian Government in negotiating SPPs with the states represents a significant risk to the provision of essential services, particularly health and disability services in Queensland. The Queensland Government’s concerns in this area are discussed later in this chapter.
Australian Loan Council
The Australian Loan Council also comprises the Australian Government and State Treasurers. Its 2004 meeting was held immediately following the March 2004 Ministerial Council meeting. Loan Council Allocations (LCAs) nominations for 2004-05 reflected current best estimates of non-financial public sector deficits or surpluses. For 2004-05, the Loan Council endorsed total LCAs of $2.475 billion (a projected public sector surplus). This amount reflects a surplus of $3.749 billion for the Australian Government and a net deficit of $1.274 billion for the states. Queensland’s projected LCA deficit for 2004-05 was estimated at $435 million.
Commonwealth Grants Commission
The role of the CGC is to advise the Australian Government on the distribution of the GST revenue among the states. Under its terms of reference the CGC is required to determine its recommendations on the basis of HFE. The CGC reviews its methods every five years, with the last review completed in February 2004. During the intervening period it updates annually the financial, economic and demographic data that underpin its recommendations.
2004 Review – Underlying Changes
In the 2004 Review Report on State Revenue Sharing Relativities, the CGC recommended Queensland receive an underlying increase in GST revenue of $262.7 million in 2004-05. This recommendation is the result of the CGC’s comprehensive five-year review of State revenue sharing arrangements. All states participated extensively in this review, which was conducted in an open and transparent manner. States had the opportunity to present their views on the Commission���s methods through numerous submissions, conferences, working groups, workplace visits and bilateral discussions.
The recommended increase in Queensland’s share of grants is largely due to the CGC’s reconsideration of the treatment of capital expenditure. The CGC recognised the previous formula underestimated Queensland’s need for infrastructure – particularly with regard to Queensland’s high population growth. The changes to the capital components of the CGC’s formula are responsible for an increase of $367.1 million in Queensland’s grant share.
Further gains in expenditure assessments were mainly the result of revisions to the socio-demographic composition factor. Queensland gained $254.4 million from changes to
| | | | |
| | | Budget Strategy and Outlook 2004-05 | | 95 |
this factor, with gains spread over a large number of expenditure assessments, including capital. Notable gains from changes to the socio-demographic factor were made in the areas of:
| | • | Health services ($64.8 million) |
| | • | Community services ($43.6 million) |
| | • | Law, order and public safety ($22.8 million). |
Queensland also suffered a number of losses in various categories, partially offsetting the gains to result in the net increase of $262.7 million. The largest of these losses was caused by the CGC’s assessment of Queensland’s increased capacity to raise revenue, as a result of Queensland’s strong economic growth. The CGC’s revenue assessments reduced Queensland’s underlying share of funding by $85.2 million.
Further losses occurred in the expenditure areas of:
| | • | Education ($34.8 million) |
| | • | Culture and Recreation ($46.9 million) |
| | • | Transport ($84 million). |
Table 8.4 shows the underlying impact the outcomes of the 2004 Review have on each state’s GST revenue, broken down into the three major assessment areas of revenue, expenditure and SPPs.
| | | | | | | | | | | | | | | | | | | | | | | |
Table 8.4 Underlying Change Resulting from 2004 Review, by State1 | |
| | | NSW $ million | | | Vic $ million | | | Qld $ million | | | WA $ million | | SA $ million | | | Tas $ million | | | ACT $ million | | | NT $ million | |
Revenue | | (103.5 | ) | | 21.3 | | | (85.2 | ) | | 131.6 | | 41.3 | | | 5.9 | | | 1.7 | | | (13.1 | ) |
Expenditure | | (197.6 | ) | | (45.1 | ) | | 343.3 | | | 49.6 | | (66.6 | ) | | (33.1 | ) | | (3.6 | ) | | (47.0 | ) |
SPPs | | (16.7 | ) | | (28.2 | ) | | 4.6 | | | 49.6 | | (0.6 | ) | | (10.3 | ) | | (11.5 | ) | | 13.2 | |
Total | | (317.0 | ) | | (51.2 | ) | | 262.7 | | | 230.9 | | (26.3 | ) | | (37.9 | ) | | (13.4 | ) | | (47.7 | ) |
| | | | | | | | | | | | | | | | |
Note: 1. Numbers may not add due to rounding. Source:Commonwealth Grants Commission Report on State Revenue Sharing Relativities, 2004 Review. |
2004 Review – Net Results
The net results of the 2004 Review are shown in Table 8.5. In its determinations of the distribution of GST, the CGC assessed Queensland as having a higher fiscal need compared with the average of all states. This higher fiscal need takes into account Queensland’s relatively lower capacity to raise revenue, relatively higher cost of delivering services, and below average share of SPPs. Accordingly, in 2004-05, Queensland is expected to receive $416.7 million more than a per capita share of GST revenue to ensure Queenslanders are not disadvantaged.
| | | | | | | | | | | | | | | | | | | | | | | |
Table 8.5 2004 Review Results, Difference to Equal Per Capita Distribution, by State1,2 | |
| | | NSW $ million | | | Vic $ million | | | Qld $ million | | WA $ million | | | SA $ million | | | Tas $ million | | | ACT $ million | | | NT $ million | |
Revenue | | (1,159.6 | ) | | 488.6 | | | 262.6 | | (721.2 | ) | | 668.8 | | | 327.5 | | | 102.1 | | | 31.1 | |
Expenditure | | (626.5 | ) | | (1,871.9 | ) | | 132.4 | | 840.8 | | | (9.4 | ) | | 226.3 | | | (13.7 | ) | | 1,321.9 | |
SPPs | | 69.6 | | | 97.9 | | | 21.2 | | 0.6 | | | (49.9 | ) | | (37.8 | ) | | (6.0 | ) | | (95.6 | ) |
Total | | (1,718.3 | ) | | (1,286.9 | ) | | 416.7 | | 120.7 | | | 610.1 | | | 516.5 | | | 82.5 | | | 1,258.7 | |
| | | | | | | | | | | | | | | | |
Note: 1. Numbers may not add due to rounding. 2. The total for Queensland is different to that presented in Table 8.3 as it was calculated by the CGC prior to the Australian Government revising upwards the 2004-05 GST revenue estimate in its 2004-05 Budget. Source:Commonwealth Grants Commission Report on State Revenue Sharing Relativities, 2004 Review. |
Revenue
Queensland is assessed as requiring $262.6 million more than a per capita share of GST revenue as a result of a lower than average capacity to raise revenue. This is largely due to Queensland’s relatively low wages, with Queensland assessed as requiring $296.6 million to balance a below average capacity to raise payroll tax.
Expenditure
Queensland’s relatively higher cost of delivering services is due to the socio-demographic composition and dispersed nature of the Queensland population. Queensland is assessed as requiring $767.4 million more than a per capita share of GST revenue as a result of these two factors.
| | | | |
| | | Budget Strategy and Outlook 2004-05 | | 96 |
However, Queensland is also assessed as requiring $403.1 million less than a per capita share of GST revenue because of Queensland’s lower wages (measured on a private sector benchmark). Queensland is also assessed as requiring less than a per capita share of funding due to some economies of scale ($91.2 million) and because Queensland has a relatively small urban population ($71.4 million).
The net result provides Queensland with $132.4 million more than a per capita share of GST revenue in relation to expenditure.
Specific Purpose Payments
Queensland is assessed as requiring $21.2 million in recognition of the less than per capita share of SPP funding Queensland receives.
SPECIFIC PURPOSE PAYMENTS
Current Issues
The Australian Government has taken a strong position in recent SPP negotiations with the states and has used individual SPP negotiations to actively pursue its own policy objectives. This resulted in many SPP negotiations becoming protracted and problematic during 2003-04. Several SPP negotiations were not finalised until after existing SPP agreements expired, which placed additional pressure on state budgetary positions.
All states have expressed concerns over the Australian Government’s manner of negotiating SPPs. These concerns include:
| | • | The Australian Government insisting states provide a public commitment to future state funding in a number of SPP portfolio areas, which constrains an individual state’s future budgetary flexibility. |
The Australian Government’s five-year forward estimates Budget Framework is consistent with its focus on forward estimates for the SPPs. In contrast, Queensland and the other states focus more on rolling forward estimates, revised annually to allow state commitments to respond and vary in accordance with changing local needs. As a result, state commitments are better measured retrospectively.
| | • | Tight input and accountability controls imposed by the Australian Government which inhibit reform and efficiency improvements in service delivery at the state level. Queensland supports the use of broader outcome-based objectives to facilitate innovation and provide broader opportunities to introduce efficiencies. The Australian Government’s focus on input controls implies states have no sovereign interest in delivering more efficient services to the community. The Australian Government needs to work with states to create an environment where innovation and improved efficiencies can be explored, rather than micro-managing the program being funded. |
| | • | The trend for the Australian Government to apply its policy objectives in SPP agreements to promote, and even impose on states, federally focused policies. The Australian Government aims to ensure states deliver on federally imposed SPP terms and conditions by withholding a percentage of total funding if states do not comply. The funding risk resulting from non-compliance with the terms and conditions has significant potential budget impacts for Queensland. For example, the Australian Government is making the |
| | | | |
| | | Budget Strategy and Outlook 2004-05 | | 97 |
| | adoption of its industrial relations practices under the National Building Code a condition of receiving federal capital grants. |
The states have acknowledged the need to work cooperatively to address common concerns about the Australian Government’s current approach to SPP negotiations and have formed an SPP Working Group to review and progress these SPP issues with the Australian Government.
Australian Health Care Agreements
The Australian Health Care Agreements (AHCAs) provide federal financial support for the provision of public hospital services. The Queensland Government signed the 2003-08 AHCA with the Australian Government on 31 August 2003, the last day before significant financial penalties would have been imposed.
The 2003-08 AHCA provides Queensland with $8 billion over five years. However, this represents a withdrawal by the Australian Government of $160 million over five years from Queensland’s public hospitals compared with a rollover of the previous agreement. The funding growth rates provided by the Australian Government in the 2003-08 AHCA are lower than the previous AHCA and fail to keep pace with rising costs and demand pressures. At the time Queensland was negotiating with the Australian Government for indexation to meet even the basic cost pressures, the Australian Government approved increases to private health insurance premiums at an industry average of over 7 per cent. Despite this, the Australian Government offered Queensland equivalent indexation of only 3.4 per cent. This has placed significant financial pressure on the Queensland Government.
For the first time, the Australian Government requires the states to match its rate of funding growth under the 2003-08 AHCA, with penalties imposed for non-compliance. In order to maintain a quality health service, the Queensland Government will exceed the Australian Government’s required AHCA growth rate by 1.6%, or $1.5 billion, over the next five years. The difficulty for Queensland, as for many states, is that although the Australian Government imposed this new funding condition, it has not accepted any funding risk during the life of the 2003-08 AHCA. This has effectively shifted the risk of cost and demand increases onto the states. As the states also have responsibility for broader community health services, the Australian Government’s demand for matched funding for public hospitals can limit states’ capacity to allocate appropriate priorities across all health services.
The 2003-08 AHCA does not provide funding for health reforms identified by Ministers at the Australian Health Ministers Conference prior to the AHCA negotiations. The reforms identified included a reform of the interface between hospitals and aged care, reforms to general practitioners and emergency departments, and long-term workforce reforms. States are continuing to pursue health reform with the Australian Government to ensure the long term sustainability of the health system.
Commonwealth State/Territory Disability Agreement
The Commonwealth State/Territory Disability Agreement (CSTDA) expired on 30 June 2002. After long and difficult negotiations, most states have now reached agreement with the Australian Government on the new CSTDA. Queensland signed the new CSTDA on 27 June 2003.
| | | | |
| | | Budget Strategy and Outlook 2004-05 | | 98 |
The delay was due in part to the Australian Government’s limited growth funding for accommodation and specialist disability services, which are provided by the states with financial assistance from the Australian Government. Federal growth funding under the new CSTDA will not match the growth in real costs of delivering services to the increasing population of Queenslanders with a disability.
Another issue was the Australian Government’s attempt to prescribe how much the states will allocate from their own resources for disability services over the period of the new CSTDA. This attempt by the Australian Government was inappropriate as the states are responsible for the delivery of accommodation and specialist disability services, as well as being the sector’s primary funding source.
Commonwealth State Housing Agreement
The Commonwealth State Housing Agreement 2003-08 (CSHA) was signed in August 2003 after the expiry of the previous agreement on 30 June 2003.
The Australian Government commitment under the new CSHA represents a further real decline in funding. The Australian Government has refused to continue compensation for the impact of the GST on public housing. Although the Australian Government has allowed for some indexation of its funding from 2004-05, this is partially offset by continuing to impose a 1% per annum productivity dividend reduction to funding under the agreement.
Overall, CSHA funding to Queensland is expected to decline from $201.7 million in 2002-03 to $181.8 million in 2003-04, with a small increase to $184.2 million in 2004-05.
Australian National Training Authority Agreement
The Australian National Training Authority (ANTA) Agreement 2001-2003 expired on 31 December 2003. On 13 May 2003, States and Territories were provided with an initial offer for the 2004-06 ANTA Agreement. Following negotiations with the Australian Government, Queensland along with the other states and territories rejected this offer in December 2003 due to the inadequacy of the funds being offered by the Australian Government. In particular, there was no offer of new or additional funding other than indexation and funding for Australian Government priority areas. Under the rejected proposal, Queensland would have received an additional $42 million, the majority of which was indexation.
Following the rejection of the Australian Government’s offer, all parties agreed to roll over the 2001-03 ANTA Agreement for a year. The Australian Government then penalised states and territories by withdrawing the indexation on growth funding and additional funding for Australian Government priority areas offered in 2003. The Australian Government will use the withdrawn funds to directly purchase training places for people with a disability, older workers and parents returning to work through brokers.
The Australian Government has indicated it will not commence negotiations for a new ANTA Agreement until late in 2004.
Government and Non-Government Schools Recurrent Grants
The current quadrennial funding agreement for Government and Non-Government schools expires on 31 December 2004. The Australian Government announced its funding commitment to education for 2005-08 in March 2004. Queensland is expected to receive
| | | | |
| | | Budget Strategy and Outlook 2004-05 | | 99 |
around $5.7 billion in recurrent grant funding over the next four years or approximately 21% of available Australian Government funds. This is an increase of $1.7 billion over the current four year program.
However, of the total $5.7 billion in Australian Government funding being offered to Queensland, only 33%, or $1.9 billion, will be made available to government schools. The Australian Government directs the balance of funds to non-government schools.
From 1 January 2005 for states to receive this funding, the Australian Government requires state and territory Governments to match the increased general recurrent grant funding to schools by at least the rate of inflation and will tie recurrent grant funding to a series of performance measures. These requirements do not recognise the fact that Queensland is already meeting its commitment to the education of our young people through its Smart State vision. The Australian Government’s requirement of increased state funding in this area only serves to limit Queensland’s future budgetary position and ability to respond to changing local and social needs. Despite this, the Queensland Government has commenced a public consultation process on the performance measures via the release of its discussion paper, Taking Schools to the Next Level: The National Education Framework for Schools.
Negotiations between the Queensland and Australian Governments continue.
AusLink
In November 2002, the Australian Government released its AusLink Green Paper. In this paper the Australian Government proposes AusLink will improve the national land transport network by integrating separate rail and road networks and various intermodal developments to enhance future economic growth, development and connectivity at national and regional levels.
All States and Territories have made their submissions to the Australian Government on the AusLink Green Paper. While generally supportive of the development of a National Land Transport Plan, there are several areas of concern with the AusLink proposal as contained in the Green Paper including:
| | • | The intention of the Australian Government to back away from fully funding and maintaining the national highway system. This was further highlighted as part of the Australian Government’s 2004-05 Budget, which indicated the Queensland Government will be required to make a substantial contribution to road projects on key urban freight links. The Australian Government currently has full funding responsibility for these projects. |
| | • | The narrow focus on land freight at the expense of urban passenger transport and consideration of seaports and airports. |
| | • | A lack of clarity regarding the responsibilities of the three tiers of government under AusLink. |
The Queensland Government’s response to the AusLink White Paper is currently being formulated following its release by the Australian Government on 7 June 2004.
| | | | |
| | | Budget Strategy and Outlook 2004-05 | | 100 |
STATE-LOCAL GOVERNMENT RELATIONS
While Queensland’s major cities and coastal towns continue to absorb significant population growth, they are experiencing challenges regarding their natural environments, productive land, water resources, urban air quality, and the maintenance of public infrastructure. In regional and rural/remote Queensland, many inland towns and communities are facing different challenges associated with declining populations and economic well being. Despite divergent issues, all communities have high expectations for amenity and livability outcomes to be delivered by government.
Local government has a responsibility to deliver a variety of facilities and services to their individual communities. At the same time, the Queensland Government has an interest in assisting local government across the State achieve and improve delivery standards, and enhance equitable access to services and facilities, particularly in smaller communities. To enable this, the Queensland Government provides considerable financial assistance to local government by way of grant and program funding. The Australian Government also provides funding to local government through financial assistance grants and SPPs.
Grant Assistance
There is a large disparity in local governments’ ability to raise revenue due to large differences in the tax base (rating ability) and differential ability to levy user charges among urban, regional and rural/remote councils. Of Queensland’s 157 councils, 17 are located in the south east corner of the State (Noosa Shire to the New South Wales border), eight regional city councils along the eastern seaboard (Cook Shire to Noosa Shire), while the remaining 132 are located in rural or remote parts of the State6. Urban councils are less reliant on grants compared to regional councils, and regional councils are less reliant than rural councils. Remote councils are the most reliant7. For some councils, grants can comprise over 50% of their total revenue8.
Historically, Queensland has provided the highest per capita grant funding to local government of any state. This reflects the significant proportion of regional and rural/remote councils within Queensland. Table 8.6 provides the most recent data on total and per capita grants from states to local government.
| | | | |
Table 8.6 Grants from States to Local Government 2001-02 |
| | | State Grants
$ million | | State Grants
$ per capita |
New South Wales | | 197 | | 29.66 |
| | | |
Victoria | | 301 | | 62.01 |
| | | |
Queensland | | 483 | | 131.59 |
| | | |
Western Australia | | 124 | | 64.62 |
| | | |
South Australia | | 33 | | 21.73 |
| | | |
Tasmania | | 5 | | 10.57 |
| | | |
Northern Territory | | 19 | | 90.06 |
| | | |
Total | | 1,148 | | 59.55 |
| | | | |
Source: Australian Government Department of Transport and Regional Services 2002-03 Report on the operation of the Local Government (Financial Assistance) Act 1995 |
In 2002-03, $762 million in grants were provided to Queensland’s local governments. Of this amount 58% was provided by the Queensland Government with the balance being provided by the Australian Government. Current estimates for 2003-04 indicate the proportion of funding provided by the Queensland Government will increase to 60%, and moderately decrease to 58% in 2004-05. Table 8.7 details State and Australian Government grants to local government.
| | | | | | |
Table 8.7 Grants to Local Government in Queensland1 |
| | | 2002-03 Actual $’000 | | 2003-04
Estimated
Actual $’000 | | 2004-05
Budget2 $’000 |
Queensland Grants | | | | | | |
Communities | | 49,903 | | 56,597 | | 56,766 |
- includes Pensioner Rates Rebate | | 41,775 | | 46,650 | | 48,328 |
Education and the Arts | | 40,114 | | 21,401 | | 18,307 |
Emergency Services | | 1,720 | | 1,933 | | 7,902 |
Employment and Training | | 27,312 | | 23,266 | | 19,538 |
Environmental Protection Agency | | 3,213 | | 1,320 | | 610 |
Health | | 9,085 | | 9,127 | | 9,054 |
Housing | | 53,307 | | 58,369 | | 61,210 |
Local Government, Planning, Sport and Recreation | | 172,181 | | 242,794 | | 233,165 |
Main Roads | | 37,323 | | 68,516 | | 70,148 |
Natural Resources, Mines and Energy | | 4,571 | | 4,700 | | 5,000 |
Premier and Cabinet | | 3,093 | | 1,374 | | 1,126 |
Transport3 | | 34,395 | | 34,692 | | 4,722 |
Other | | 2,232 | | 1,598 | | 1,016 |
Total Queensland Grants | | 438,449 | | 525,687 | | 488,564 |
| | | | |
Australian Government Grants | | | | | | |
Australian Government “through” | | 274,600 | | 284,943 | | 292,642 |
Australian Government “direct” | | 48,612 | | 69,798 | | 61,188 |
Total Australian Government Grants | | 323,212 | | 354,741 | | 353,830 |
| | | | |
Total Grants to Local Government Authorities and Aboriginal and Islander Councils | | 761,661 | | 880,428 | | 842,394 |
Notes: 1. Grants for current and capital purposes to local government authorities and Aboriginal and Islander councils. 2. Numbers yet to be confirmed and may be subject to revision. 3. Funds provided to Brisbane City Council for bus services, estimated at $30 million in 2003-04, will be classified as contract payments, rather than grants to local government, from 2004-05 onwards. Source:Queensland Treasury and Australian Government Budget Paper No.3, 2002-03 and 2003-04. |
The reduction in grants by some Queensland Government agencies in 2004-05 compared to previous years reflects the completion, or near completion of several projects including:
| | • | Millennium Arts Regional Program (Education and the Arts) |
| 6 | Department of Transport and Regional Services 2002-03 Report on the operation of the Local Government (Financial Assistance) Act 1995 – Appendix F |
| 7 | Ibid – Chapter 1 Page 13 |
| 8 | Ibid – Chapter 1 Page 19 |
| | | | |
| | | Budget Strategy and Outlook 2004-05 | | 101 |
| | • | Queensland Heritage Trails Network (Education and the Arts) |
| | • | Demand Management Industry Program (Environmental Protection Agency) |
| | • | Local Street Speed Limits in Regional Queensland (Queensland Transport) |
| | • | NCP Financial Incentive Scheme (Local Government and Planning). |
The Queensland Government provides subsidy funding to support urban bus services throughout the State. In 2003-04, Queensland Transport estimates that $30 million in Queensland Government grant funding will be paid to the Brisbane City Council for bus services. However from 1 July 2004, with the implementation of Integrated Ticketing within south east Queensland, bus services provided by the Brisbane City Council will be operating under contract and will be paid on the basis of agreed services delivered. In 2004-05, bus service payments are contract payments and are no longer accounted for as a grant to local government.
Further, several agencies provide responsive, demand driven programs where local government has the opportunity of pursuing funding.
Grant Purposes
The composition of Queensland’s grants to local government can vary from year to year. Nonetheless, the major areas of funding in 2002-03 were:
| | • | general public services including contribution to the costs of providing local government services where councils are unable to levy land rates |
| | • | public library schemes where funding is provided to purchase books, upgrade equipment and increase the community use of library services |
| | • | employment and training programs to support and mentor trainees and apprentices, and enhance community employment |
| | • | the provision of rate subsidies to eligible pensioners |
| | • | bus service funding to the Brisbane City Council to support urban bus services |
| | • | capital works subsidies provided towards the costs of local public infrastructure |
| | • | road subsidies for local roads, networks and drainage. |
Chart 8.3 highlights the broad range of purposes for which local government grants were provided by the Queensland Government in 2002-03.
Chart 8.3
State Grants to Local Government in Queensland by Purpose 2003-04
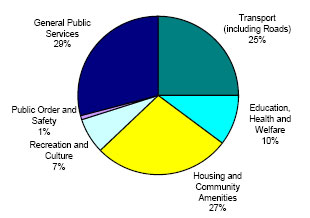
Source: Queensland Treasury
Future Developments
Australian Government Cost Shifting Inquiry
In June 2002, the House of Representatives Standing Committee on Economics, Finance and Public Administration (the Committee) commenced an inquiry into perceived cost shifting
| | | | |
| | | Budget Strategy and Outlook 2004-05 | | 102 |
from states to local government. At this time, the Queensland Government expressed its concern to the Committee regarding its lack of consultation and its failure to address the Australian Government’s cost shifting to local government. The Queensland Government argued for the need to extend the inquiry’s terms of reference to cover this omission. It also provided the Committee with an overview of Queensland’s local government system demonstrating strong and positive state/local government relations.
The Committee’s report, Rates and Taxes: A Fair Share for Responsible Local Government was tabled in the Australian Parliament in November 2003. The report made recommendations relating to intergovernmental relations, specific purpose payments, financial assistance grant administration, the tax system and capacity building in local government. An Australian Government taskforce is assessing the report’s recommendations and was due to report to the Australian Parliament in mid 2004. The Queensland Government continues to monitor the outcomes of this inquiry and its recommendations.
Review by the Local Government Grants Commission
The Queensland Local Government Grants Commission is an independent body created under the Local Government Act 1993. The Commission’s primary role is to recommend to the State Local Government Minister the distribution of the Australian Government’s financial assistance grant between Queensland’s 157 councils.
The Commission recently reviewed the method for recommending the distribution of the Australian Government’s grants to local government and the new distribution methodology commenced in 2003-04. In its Final Report – Methodology Review, the Commission recommended that the new methodology be phased in over a five-year term to enable councils whose grants will significantly decline to plan for the change9. The agreement reached between the Australian and Queensland Governments is for a phase-in over four years, with the exception of councils that receive minimum grant share and Aboriginal and Torres Strait Islander councils, whose grants will move immediately to their new entitlements10.
Over the next three years, the Commission will continue to undertake research and refine its methodology on issues that were not resolved in the review. These issues include local government revenue raising capacity, inconsistencies in traffic volume and cost weightings.
QUEENSLAND GOVERNMENT AS A TAXPAYER
The Queensland Government, like other state governments, is liable for certain Australian Government taxes including the GST and Fringe Benefits Tax (FBT). In addition, the National Tax Equivalents Regime (NTER) for Government-owned corporations (GOCs) and selected business units imposes the equivalent of an income tax on these entities. Based on these taxes, the Queensland Government’s annual Australian Government tax exposure is over $2 billion.
This exposure means there is a requirement to manage any liability associated with these taxes and the flow-on effects to Queensland’s operating position and balance sheet. Proper
| 9 | Queensland Local Government Grants Commission Final Report – Methodology Review – Executive Summary Page XVI |
| 10 | Queensland Local Government Grants Commission Report on the Allocation of the Commonwealth Financial Assistance Grant in Queensland for 2003-04 – Foreword Page IV |
| | | | |
| | | Budget Strategy and Outlook 2004-05 | | 103 |
management of these Australian Government and other tax liabilities ensures there is minimal impost to the Queensland community.
GST Input Tax Credits and GST Liabilities
Overall there are some 3,300 Queensland Government bodies registered for the GST, of a total of almost 19,000 government bodies registered nationwide. As reported in the 2003-04 Budget papers, this creates an ongoing compliance requirement for Queensland Government bodies to ensure all steps are being taken to accurately account for the GST, including claiming input tax credits and accounting for GST liabilities.
In 2003-04, the major Queensland Government departments’ and agencies’ GST exposure is estimated to be $1.127 billion, comprising $865 million in gross GST credits and $262 million in gross GST payable. For 2004-05, the major Queensland Government departments and agencies are again expected to generate a GST exposure of over $1 billion, comprising gross GST input tax credits and gross GST liabilities.
The Queensland Government’s GST exposure continues to be driven by the Departments of Health, Transport, Education (including schools), Main Roads, Public Works and Child Safety (formerly Families). This reflects the size of these agencies and their dealings with other Queensland Government departments.
Fringe Benefits Tax
In 2003-04, Queensland’s FBT liability is estimated to be similar to the 2002-03 FBT liability of approximately $23 million. The Education, Justice and Attorney-General, Police, Main Roads and Health portfolios are the major contributors to Queensland’s total FBT liability, collectively comprising 48.5% of the total FBT liability.
National Tax Equivalents Regime
The National Tax Equivalents Regime (NTER) is an administrative arrangement between the Australian Government and the states under which Australian Government income tax laws are applied to certain government bodies, namely GOCs and commercialised business units (CBUs). The NTER regime is administered by the ATO which charges the Queensland Government on a fee-for-service basis.
The primary objective of the NTER is to promote competitive neutrality, through a uniform application of income tax laws, between NTER entities and their privately held counterparts.
In 2003-04, Queensland’s NTER entities will generate an estimated $126.8 million in income tax equivalent receipts. GOCs comprise 94% of these receipts with the remainder coming from CBUs.
Initiatives for 2004-05
Further emphasis will be placed on agencies’ corporate governance arrangements where the GST is concerned, to ensure Queensland Government agencies registered for the GST meet their Australian Government tax obligations. A focus for 2004-05 will be promoting the ATO’s Better Practice Guide for the Management of GST Administration and its six GST compliance outcomes to departments and agencies for use in their Australian Government taxes compliance frameworks.
| | | | |
| | | Budget Strategy and Outlook 2004-05 | | 104 |
APPENDIX A – TAX EXPENDITURE STATEMENT
OVERVIEW
Governments employ a range of policy tools to achieve social and economic objectives. These include use of direct budgetary outlays, regulatory mechanisms and taxation. As required by the Charter of Social and Fiscal Responsibility, this Tax Expenditure Statement (TES) details revenue foregone as a result of Government decisions relating to the provision of tax concessions.
The TES is designed to improve transparency in the use of tax expenditures and increase public understanding of the fiscal process.
Tax expenditures are reductions in tax revenue that result from the use of the taxation system as a policy tool to deliver Government policy objectives. Tax expenditures are provided through a range of concessions, including:
| | • | the application of reduced tax rates to certain groups or sectors of the community |
| | • | provisions which defer payment of a tax liability to a future period. |
Labelling an exemption or concession as a tax expenditure does not necessarily imply any judgement as to its appropriateness. It merely makes the amount of the exemption or concession explicit and thereby facilitates its scrutiny as part of the annual Budget process.
Methodology
Revenue Foregone Approach
The method used almost exclusively by governments to quantify the value of their tax expenditures is the revenue foregone approach. This method estimates the revenue foregone through use of the concession by applying the benchmark rate of taxation to the volume of activities or assets exempted by the concession. One of the deficiencies of the revenue foregone approach is that the effect on taxpayer behaviour resulting from the removal of the particular tax expenditure is not factored into the estimate. Consequently, the aggregation of costings for individual tax expenditure items presented in the TES will not necessarily provide an accurate estimate of the total level of assistance that is provided through tax expenditures.
Measuring tax expenditures requires the identification of:
| | • | concessionally taxed components of the benchmark tax base such as a specific activity or class of taxpayer |
| | • | a benchmark tax rate to apply to the concessionally taxed components of the tax base |
105
Defining the Tax Benchmark
The most important step in the preparation of a TES is the establishment of a benchmark for each tax included in the statement. The benchmark provides a basis against which each tax concession can be evaluated. The aim of the benchmark is to determine which concessions are tax expenditures as opposed to structural elements of the tax. The key features of a tax benchmark are:
| | • | any specific accounting conventions applicable to the tax |
| | • | the deductibility of compulsory payments |
| | • | any provisions to facilitate administration |
| | • | provisions relating to any fiscal obligations. |
By definition, tax expenditures are those tax concessions not included as part of the tax benchmark.
Identification of benchmark revenue bases and rates requires a degree of judgement and is not definitive. Furthermore, data limitations mean that the tax expenditures are approximations and are not exhaustive. This statement does not include estimates of revenue foregone from exemptions or concessions provided to Government agencies. Very small exemptions or concessions are also excluded.
THE TAX EXPENDITURE STATEMENT
This year’s statement includes 2003-04 estimates of tax expenditures for payroll tax, land tax, stamp duties and gambling taxes. A summary of the major tax expenditures valued on the basis of revenue foregone is presented in Table A.1. Not all expenditures can be quantified at this time. Accordingly, the total value of tax expenditures should be considered as indicative only.
| | | | |
Table A.1 Tax Expenditure Summary1 |
| | | 2002-032 $ million | | 2003-04 $ million |
| | | |
Payroll Tax | | | | |
Exemption Threshold | | 722 | | 766 |
Deduction Scheme3 | | 94 | | 100 |
Offshore Banking Units and Regional Headquarters Concession | | 1 | | 1 |
Section 10 Exemptions4 | | | | |
Local Government | | 65 | | 69 |
Education | | 59 | | 63 |
Hospitals | | 101 | | 107 |
Total Payroll Tax | | 1,042 | | 1,106 |
| | | |
Land Tax | | | | |
Liability Thresholds5 | | 161 | | 185 |
Graduated Land Tax Scale | | 71 | | 81 |
Primary Production Deduction | | 51 | | 44 |
Section 13 Exemptions Not Included Elsewhere4 | | 27 | | 28 |
General Land Tax Rebate | | 6 | | 7 |
Additional Land Tax Rebate | | 2 | | 2 |
Land Developers’ Concession | | 3 | | 4 |
Total Land Tax | | 321 | | 351 |
| | | |
Duties | | | | |
Transfer Duty on Residential Property | | | | |
Home Concession | | 296 | | 319 |
First Home Concession | | 28 | | 17 |
Insurance Duty on General Insurance | | | | |
Non-life Insurance | | 52 | | 57 |
Workcover | | 25 | | 27 |
Health Insurance | | 121 | | 122 |
Total Duties | | 522 | | 542 |
| | | |
Taxes on Gambling | | | | |
Gaming Machine Taxes | | 97 | | 103 |
Casino Taxes | | 10 | | 16 |
Total Gambling Tax | | 107 | | 119 |
Notes: 1. Numbers may not add due to rounding. 2. 2002-03 estimates may have been revised since last year’s Budget. 3. Deduction of $0.85 million, which reduces by $1 for every $3 above $0.85 million, is applicable to employers with an annual payroll between $0.85 million and $3.4 million. 4. Applicable but not limited to religious bodies, public benevolent institutions and other exempt charitable institutions. 5. Land tax is payable only on the value of taxable land above a threshold which depends on the ownership structure. |
106
DISCUSSION OF INDIVIDUAL TAXES
Payroll Tax
The benchmark tax base for payroll tax is assumed to be all wages, salaries and supplements (including employer superannuation contributions) paid in Queensland, as defined in the Pay-roll Tax Act 1971. The benchmark tax rate for payroll tax is assumed to be the statutory rate applying in each financial year.
Payroll Tax Exemption Threshold
Sole employers who employ in Queensland (not those who are part of a group for payroll tax purposes) with an annual payroll of $0.85 million or less are exempt from payroll tax. On the basis of average weekly earnings, this threshold corresponds to approximately 23 full-time equivalent employees. This concession is designed to assist small business.
Deduction Scheme
Sole employers who employ in Queensland with payrolls between $0.85 million and $3.4 million benefit from a deduction of $0.85 million, which reduces by $1 for every $3 by which the annual payroll exceeds $0.85 million. There is no deduction for employers or groups with an annual payroll in excess of $3.4 million.
Offshore Banking Units (OBUs) and Regional Headquarters Concessions (RHQs)
Under the Offshore Banking Units and Regional Headquarters Act 1993 and Offshore Banking Units and Regional Headquarters Regulation 1994, offshore banking units and regional headquarters licencees received state tax concessions in relation to prescribed activities carried out in support of the multi-national groups’ offshore activities. These concessions included debits tax, land tax, payroll tax and duty concessions. With the sunsetting of these Acts at the end of 2003, new administrative arrangements were set in place for the existing licensees.
Section 10 Exemptions
A number of organisations are provided with exemptions from payroll tax under Section 10 of the Pay-roll Tax Act 1971. The activities for which estimates have been calculated are wages paid by public hospitals, non-tertiary private educational institutions and local governments (excluding commercial activities).
Land Tax
The benchmark tax base is assumed to be all freehold land within Queensland, excluding residential land used as a principal place of residence and land owned by individuals with a value for that year below the threshold. The benchmark tax rate for land tax is assumed to be the top rate of land tax applicable in Queensland in each financial year.
Liability Thresholds
Land tax is payable on the value of taxable land above a threshold which depends on the land’s ownership. In 2002-03, the thresholds were $150,000 for companies, absentees and trusts, and $200,000 for individuals. In 2003-04, the thresholds were increased to $170,000 for companies, absentees and trusts, and $220,000 for individuals.
Residential land owned by individuals is excluded from the estimate. The exemption from paying below a minimum amount ($100 in 2002-03 and $350 in 2003-04) is not included as a tax expenditure as it is regarded as the application of an administration threshold.
107
Graduated Land Tax Scale
A graduated (concessional) scale of land tax rates is applicable to land with a taxable value of less than $1.5 million.
Primary Production Deduction
The taxable value of land owned by an individual, trustee or some absentees and companies does not include all or part of the land that is used for the business of agriculture, pasturage or dairy farming.
Section 13 Exemptions (not elsewhere included)
A number of land tax exemptions are granted under Section 13 of the Land Tax Act 1915 to eligible organisations. These include, but are not limited to, public benevolent institutions, religious institutions and other exempt charitable institutions, retirement villages, trade unions and show grounds.
General Land Tax Rebate
A general rebate on land tax of 15% is provided to non-absentee individual land tax payers.
Additional Land Tax Rebate
Trustees, companies and absentees receive a phasing-in rebate of a maximum of 36%, reducing by 0.5 percentage points for every $1000 of taxable value over $150,000 in 2002-03 and $170,000 in 2003-04.
Land Developers’ Concession
From 1 July 1998, land developers have been charged land tax on 60% of the unimproved value of (undeveloped) land subdivided in the previous financial year and which remains unsold at 30 June of that year. This concession is outlined in Section 3CA of the Land Tax Act 1915.
Transfer Duty Concession on Residential Property
The benchmark tax base is assumed to be all sales of residential property within Queensland. The benchmark tax scale is assumed to be the scale that actually applied in each financial year.
Home Concession
A concessional rate of duty applies to purchases intended to be a principal place of residence. A concessional rate of 1% applies on values up to $250,000 compared to the normal schedule of rates between 1.5% and 3.25%. For properties valued greater than $250,000, the scheduled scale of transfer duty applies on the excess.
From 1 August 2004, the concessional rate of 1% will apply to the purchase of a principal place of residence valued up to $300,000.
108
First Home Concession
Where a purchaser has not previously owned a residence in Queensland or elsewhere, a rebate on duty in addition to the home concession has been applicable on properties valued up to $160,000 (this concession is not applicable if the purchase price is less than the full market value of the property). The size of the rebate depends on the value of the property and ranges in value from $800 for properties valued under $80,000 to $200 for properties valued between $155,000 and $160,000.
From 1 May 2004, the first home duty concession was extended such that no duty is payable for properties valued up to $250,000 and a rebate of up to $2,500 is payable for properties valued between $250,000 and $500,000.
Insurance Duty
The benchmark tax base is assumed to be all premiums for general insurance policies (except for life assurance). The benchmark tax scale is assumed to be the scale that actually applied in each financial year.
The rate of duty applicable to general insurance is 8.5%. However, concessional rates apply to other insurance types (5% for motor vehicle other than compulsory third party (CTP), workers’ compensation and professional indemnity insurance and 10c on a premium for CTP insurance). Data limitations mean that these insurance types are categorised into non-life insurance cover and WorkCover. An exemption from duty is also provided for private health insurance.
From 1 August 2004, the rate of duty applicable to general insurance will fall from 8.5% to 7.5%.
Duty on Mortgages – Home Concessions and First Home Concessions
The benchmark tax base is assumed to be all mortgages and loans taken out in Queensland. The benchmark tax scale is assumed to be the scale that actually applied in each financial year.
A concession from duty is allowed where a home mortgage secures an advance attributable to the purchase or construction of the borrower’s home. The mortgage has been exempt from duty up to an amount of $100,000 advanced for a first home and $70,000 advanced for others, with mortgage duty payable on the balance of the amount secured. Similarly, a concession from mortgage duty has also been available for an amount up to the first $100,000, for refinancing an amount outstanding under a mortgage on the borrower’s home.
From 1 May 2004, the first home concession was extended such that the mortgage is now exempt up to an amount of $250,000 advanced for a first home.
The data required to estimate the revenue foregone is not available.
109
Gambling Taxes
Gaming Machine Tax Concessions for Licensed Clubs
The benchmark tax base is assumed to be all gaming machines operated by clubs and hotels in Queensland. The benchmark tax scale is assumed to be the rate of taxation that applies to gaming machines in hotels in each financial year (which is 35.9% of the monthly metered win).
A concessional graduated tax rate scale applies to gaming machines operated by licensed clubs. The tax rate is calculated on the gaming machine monthly metered win and the full tax rate (as applies to hotel gaming machines) is only applied to gaming machine revenue where the monthly metered win exceeds $1.4 million for any licensed club.
Casino Tax Concessions
The benchmark tax base is assumed to be all casinos operating in Queensland. The benchmark tax scale is assumed to be the flat rate of 20% of casino gross revenue that applies for standard transactions in the Brisbane and Gold Coast casinos.
A concessional tax rate of 10% applies for normal gross revenue for the Cairns and Townsville casinos. In addition concessional rates apply for revenue from high rollers in all casinos. High roller revenue is taxed at 10% for the Brisbane and Gold Coast casinos and 8% for the Cairns and Townsville casinos.
110
APPENDIX B – CONCESSIONS STATEMENT
INTRODUCTION
The Government provides concessions in the form of discounts, rebates and subsidies to improve access to and the affordability of a range of services for individuals or families based on eligibility criteria relating to factors such as age, income and special needs or disadvantage.
This concessions statement serves to highlight the cost and nature of concessions covering both concessions which are reflected as outlays in the Budget (for example, direct subsidy payments) and revenue foregone through fees and charges which are set at a rate lower than that applying to the wider community.
Varying methods have been used to estimate the cost of concessions depending on the nature of the concession, including:
| | • | direct Budget outlay cost (eg. direct subsidy or rebate payments) |
| | • | revenue foregone (eg. concessional fees and charges) |
| | • | cost of goods and services provided. |
Table B.1 sets out the cost of concessions by agency. The total value of concessions is estimated at $785 million in 2004-05 - an increase of $45 million on the 2003-04 Budget.
111
| | | | | | |
Table B.1 Concessions by Agency1 |
| Agency | | 2003-04 Budget $ million | | 2003-04 Est.Act. $ million | | 2004-05 Estimate $ million |
Department of Communities2 | | | | | | |
Electricity Rebate Scheme | | 47.7 | | 47.7 | | 50.8 |
Electricity Life Support Scheme | | 0.5 | | 0.5 | | 0.5 |
Pensioner Rate Subsidy Scheme | | 46.7 | | 46.7 | | 48.3 |
Rail Concession Scheme | | 35.2 | | 35.1 | | 36.5 |
| | | | |
Department of Education and the Arts | | | | | | |
Arts Concessional Entry Fees | | 0.4 | | 0.4 | | 0.4 |
Living Away from Home Allowances Scheme | | 5.8 | | 5.8 | | 5.9 |
School Transport Assistance for Students with Disabilities | | 22.8 | | 23.6 | | 26.2 |
Non-State School Transport Assistance Scheme | | 3.8 | | 3.8 | | 3.9 |
| | | | |
Department of Emergency Services | | | | | | |
Provision of Free Ambulance Services to Pensioners and Seniors | | 124.5 | | 124.5 | | 130.2 |
Urban Fire Levy Concession | | 4.9 | | 4.9 | | 5.1 |
| | | | |
Department of Employment and Training | | | | | | |
TAFE Concessions | | 9.9 | | 10.3 | | 10.3 |
| | | | |
Environment Protection Agency | | | | | | |
Environmental Licence Fee Waiver3 | | 0.5 | | 0.5 | | 0.5 |
Concessions Entry and Tour Fees | | 0.2 | | 0.2 | | 0.2 |
| | | | |
Department of Health | | | | | | |
Spectacles Supply Scheme | | 3.3 | | 3.3 | | 5.0 |
Medical Aids Subsidy Scheme4 | | 13.0 | | 20.3 | | 16.2 |
Patient Travel Subsidy Scheme | | 1.6 | | 1.5 | | 1.6 |
Oral Health | | 78.3 | | 81.0 | | 87.4 |
| | | | |
Department of Housing | | | | | | |
ATSI Housing Rental Rebate | | 8.0 | | 8.2 | | 8.4 |
Public Rental Housing Rebate5 | | 130.0 | | 125.6 | | 126.0 |
| | | | |
Department of Justice and Attorney-General | | | | | | |
Public Trustee of Queensland – Rebates of Fees | | 8.2 | | 9.0 | | 10.5 |
| | | | |
Department of the Premier and Cabinet | | | | | | |
South Bank Corporation – Venue Hire Discounts and Car Park Student Concession | | 0.2 | | 0.2 | | 0.2 |
| | | | |
Department of Transport | | | | | | |
Transport Concessions incl. Taxi Subsidies6,7 | | 39.5 | | 39.2 | | 47.4 |
Motor Vehicle Registration Concession | | 48.2 | | 48.0 | | 51.3 |
Recreational Ship Registration Concession | | 0.7 | | 0.7 | | 0.7 |
School Transport Assistance Scheme | | 106.2 | | 103.8 | | 111.2 |
| | | | |
Total | | 739.9 | | 744.8 | | 784.7 |
| | | | |
| | | | | | | |
| |
Notes to Table B.1 Concessions by Agency1 |
| |
Notes: 1. Numbers may not add due to rounding. 2. These concessions were previously offered/administered by the former Department of Families. 3. The Environmental Licence Fee Waiver was not included in the 2003-04 Concessions Statement. 4. The large increase in the estimated actual for the Medical Aids Subsidy Scheme is largely the result of a funding injection provided to clear waiting lists in the scheme. 5. The reduction in the Public Rental Housing Rebate since the 2003-04 Budget is primarily the result of the ongoing refinement of available information and an improvement in the method of analysing rent foregone. 6. The variance between the 2003-04 estimated actual and the 2004-05 Budget is mainly due to the inclusion of concessions for tertiary students which were not previously funded. 7. The methodology used to calculate the concession is based upon the subsidies paid to the various transport operators. With the introduction of Integrated Ticketing in South East Queensland in 2004-05, the methodology will change to reflect the concession component of total fare revenue to be collected by Queensland Transport under the new system. |
112
Department of Communities
The Department of Communities has responsibility for the Queensland Government Electricity Rebate Scheme and reimburses the electricity retail corporations for electricity rebates provided. The scheme provides a rebate on the cost of domestic electricity supply to eligible pensioners, Seniors Card and other eligible card holders throughout Queensland.
The Electricity Life Support Concession Scheme is aimed at assisting seriously ill people who use home-based life support systems (oxygen concentrators and kidney dialysis machines).
The Pensioner Rate Subsidy Scheme alleviates the impact of local government rates and charges on pensioners, thereby assisting them to live in their own homes.
The Queensland Rail Concessions Scheme assists pensioners, veterans and seniors to reduce the cost of public transport and to maintain an active and healthy lifestyle.
Department of Education and the Arts
Concessional ticket entry fees apply to a variety of concession card holders, students, children and families for special exhibitions at the Queensland Art Gallery and the Queensland Museum.
The Department of Education provides a living away from home allowance to students in Years 1 to 12 in State and non-State schools whose homes are geographically isolated from local schools. The allowances offset the costs associated with boarding away from home to attend school on a daily basis and include tuition costs and travel costs.
The department also offers assistance to students with disabilities to access school programs able to meet their educational needs. Assistance is in the form of the provision of taxis or specialised contracted minibuses, payment of fares on regular buses or trains, or an allowance for parents who drive their children to school.
The Non-State School Transport Assistance Scheme assists families of students attending non-State schools outside Brisbane whose bus fare is over a weekly threshold amount. The program also assists families of students with disabilities who attend a non-State school.
Department of Emergency Services
Pensioners and Seniors Card holders are provided with access to free ambulance and patient transport services through the Queensland Ambulance Service.
Pensioners are eligible for a 20% discount on the Urban Fire Levy payable on prescribed properties of which they are the owner or part owner.
Department of Employment and Training
Concessions on TAFE tuition fees for Government-funded training are offered to a range of concession card holders, students of Aboriginal and Torres Strait Islander descent and students who can demonstrate extreme financial hardship.
113
Environment Protection Agency
A fee waiver may be granted on environmental licences on the grounds of financial hardship or if there is a small or insignificant environmental risk.
The department offers concessional entry fees for specified protected areas including St Helena Island, David Fleay Wildlife Park and Mon Repos Conservation Park, among others.
Department of Health
The Spectacles Supply Scheme assists eligible Queensland residents by providing a comprehensive range of free basic prescription spectacles.
The Medical Aids Subsidy Scheme subsidises the cost of a range of aids and equipment from an approved list to assist eligible people with stabilised or permanent disabilities to remain living at home.
The Patient Travel Subsidy Scheme (PTSS) provides subsidised assistance for travel and accommodation to all eligible Queensland patients and in some cases their carers to enable patients to access specialist medical services from which they are isolated. Concession card holders qualify for a level of accommodation assistance through the PTSS and this is the sole expenditure reflected in Table B.1.
The Oral Health Scheme provides free dental care to eligible clients and their dependents who possess a current Health Care Card, Pensioner Concession Card or Queensland or Commonwealth Seniors Card. In rural and remote areas where no private dental practitioner exists, access to dental care for the general public is provided at a concessional rate.
Department of Housing
The Aboriginal and Torres Strait Islander Housing Rental Rebate concession represents revenue foregone in rental agreements with Indigenous households in targeted public housing. The target group is low-to-moderate income Indigenous households.
The Public Rental Housing Rebate targets low to moderate income families and individuals and represents the difference between market rent and the rent that is charged based on the tenant’s income.
Department of Justice and Attorney-General
The Public Trustee offers fee rebates (full or partial) for clients who, because of financial circumstances, cannot pay the full amount of a fees that have been levied.
Department of the Premier and Cabinet
Community groups and charities are given discounted charges for the hire of venues within the South Bank parklands.
Discounted charges apply to students when they park in the South Bank carpark.
114
Department of Transport
Transport concessions are provided by Government in a variety of forms and across a range of activities to ensure access and mobility for Queenslanders who are transport disadvantaged. Eligible categories to receive a concession include Pensioner Concession Card holders, Seniors Card holders, children, secondary and tertiary students as from July 2004. Members of the department’s Taxi Subsidy Scheme also receive concessions on taxi travel.
Motor vehicle and boat registration concessions are provided to holders of a Pensioner Concession Card, Queensland Seniors Card and Totally or Permanently Incapacitated Ex-serviceperson Pension as a means of improving pensioners and seniors access to travel.
The School Transport Assistance Scheme is a program for students whose access to school is disadvantaged by distance or are from defined low-income groups. Assistance is provided towards the cost of travel on bus, rail and/or ferry with allowances for private vehicle transport.
115
APPENDIX C – STATEMENT OF RISKS AND SENSITIVITY ANALYSIS
INTRODUCTION
The Queensland State Budget, like those of other States, is based in part on assumptions made about future elements of uncertainty both internal and external to the State which can impact directly on economic and fiscal forecasts. Operating results achieved in recent years reflect the fact that the actual fiscal result achieved depends on the direction of such variables.
Consistent with the Charter of Social and Fiscal Responsibility, this section analyses the sensitivity of the estimates to changes in the economic and other assumptions used in developing the Budget and forward estimates. This analysis is provided, as required under the Charter, to enhance the level of transparency and accountability of the Government.
Notwithstanding the risks associated with the Budget, Queensland is well placed to manage adverse impacts. Queensland’s strong balance sheet and low tax status means it has greater capacity than any other jurisdiction in Australia to withstand the risks that are normally associated with any state or territory budget.
The forward estimates in the Budget are framed on a no policy change basis. That is, the expenditure and revenue policies in place at the time of the Budget (including those announced in the Budget) are applied consistently throughout the forward estimates period.
The following discussion provides details of some of the key assumptions and risks associated with revenue and expenditure forecasts and, where a direct link can be established, the indicative impact on forecasts resulting from a movement in those variables.
SENSITIVITY OF EXPENDITURE ESTIMATES and expenditure risks
Public Sector Wage Costs
Salaries and wages form a large proportion of General Government operating expenditure. Increases in salaries and wages are negotiated through Enterprise Bargaining Agreements.
All major Enterprise Bargaining Agreements across the General Government sector have now been finalised. The outcomes generally provide for wage increases of the order of 3½% per annum and were included in the Mid-Year Review Budget estimates published in January.
The Enterprise Bargaining Agreement for the Core public sector does not expire until the end of July 2006.
The conclusion of the recent round of enterprise bargaining negotiations provides some medium term certainty in regard to public sector wage costs.
116
Electricity Pool Prices – Impact on Community Service Obligation Payments
The Queensland Government is committed to a policy of uniform electricity tariffs. This policy provides that all franchise customers of the same class in Queensland pay the same rate for electricity no matter where they are located in the State. The Government gives effect to this policy through the provision of Community Service Obligation (CSO) payments to Queensland electricity retailers.
The Government negotiated a long-term procurement agreement with Energex and Ergon for the purchase of electricity for the franchise load. The outcome from these negotiations is that the price risk associated with the cost of electricity will now be borne by the retailers. As a consequence of this agreement, unlike previous years, any variations in the pool price or contract levels secured by retailers will not affect CSO payments.
Interest Rates
The General Government sector has a very moderate level of debt with a total debt servicing cost forecast at $202 million in 2004-05.
The current average duration of General Government debt is approximately three years. Accordingly, a one percentage point variation in interest rates would lead to a very modest change in debt servicing costs in 2004-05.
Actuarial Estimates of Superannuation and Long Service Leave
Liabilities for superannuation and long service leave are estimated by the State Actuary with reference to, among other things, assumed rates of investment returns, salary growth and inflation. These liabilities are therefore subject to changes in these parameters. Similarly, the long service leave liabilities are subject to the risk that the actual rates of employee retention will vary from those assumed in the liability calculation.
While these impacts have been estimated and allowances made in the Budget and forward estimates to accommodate them, the actual outcome may differ from the estimates calculated for the Budget.
Demographic and Demand Based Risks
Unforeseen changes in the size, location and composition of Queensland’s population can impact on the demand for goods and services, and therefore the cost of maintaining existing policies. This is particularly evident in the health, education, community services and criminal justice sectors.
State Government expenditure is often more closely associated with socio-demographic factors, such as the number of school age children or the number of elderly residents, than with economic activity. However, such changes are unlikely to impact significantly in the short term (i.e. within a given Budget year).
For this reason, the composition, size and location of the State’s population is critical in projecting the State’s expenditure needs across the forward estimates period.
117
Unforeseen Events
It is almost inevitable that some events will occur during the year which will require additional expenditure but could not be foreseen or quantified at the time of the Budget.
Contingency funding for such events is provided in the Budget through the Treasurer’s Advance. The Treasurer’s Advance is an amount of appropriation within Treasury’s administered Budget as a whole-of-Government provision for potentially emergent costs.
In 2004-05 the Treasurer’s Advance allocation is $100 million.
SENSITIVITY OF REVENUE ESTIMATES and revenue risks
The rate of growth in tax revenues is dependent on a range of factors that are linked to the rate of growth in economic activity in the State. Some taxes are closely related to activity in specific sectors of the economy, whilst others are broadly related to the general rate of economic growth, employment, inflation and wages. A change in the level of economic activity, resulting from economic growth differing from forecast levels, would impact upon a broad range of taxation receipts.
Other revenue items are influenced by external variables such as the exchange rate or the performance of financial markets.
Performance of Financial Markets — Investment Returns
Investment earnings are based on the assumption of long-term average market returns for an acceptable level of risk. These investments principally cover the superannuation investment funds. The Government’s financial investments are held in a portfolio comprising property, domestic and offshore equities and fixed interest.
The assumed long-term rate of return used in Budget estimates is 7½%. Actual returns will depend on the performance of sectors which comprise the portfolio.
Given Queensland’s large holding of financial assets, actual revenues are highly sensitive to small variations from the assumed long run rate of return.
A one percentage point variation in investment earnings on assets held to meet future employee entitlements would lead to a change in investment revenue of approximately $100 million.
Exchange Rate and Coal Prices and Volumes – Royalties Estimates
Estimates of mining royalties are sensitive to movements in the A$/US$ exchange rate, and commodity prices and volumes.
Contracts for the supply of commodities are generally written in US$. Accordingly, a change in the exchange rate impacts on the A$ price of commodities and therefore expected royalties collections.
A one cent variation in the A$/US$ would lead to a change in royalties revenue of approximately $10 million in 2004-05.
Also impacting on royalty estimates are volume effects. A large component of Queensland’s royalty collections is derived from coal. A 1% variation in export coking and thermal coal volumes would lead to a change in royalty revenue of approximately $6 million.
118
The 2004-05 Budget assumptions for export coal prices are derived taking into account various price forecasts made by coal companies. A US$1 variation in the price of export coal would lead to a change in royalty revenue of approximately $13 million.
Property Prices and Volumes – Transfer Duty Estimates
Over recent years, strong growth in State taxation receipts has been a result of high levels of activity in the residential property market through its impact on transfer duty receipts. The increase in stamp duty receipts flowing from residential property market activity has two elements – the price of properties changing hands and the volume of properties changing hands.
For 2004-05, an easing in the property market is forecast. The assumption underpinning the expected reduction in stamp duties is for property prices to remain at current levels, but for a reduction in transaction volumes.
A one percentage point variation in the average value of property transactions would change transfer duty collections by approximately $14.8 million in 2004-05.
A one percentage point variation in the volume of transactions would change transfer duty revenues by approximately $12.8 million in 2004-05.
Wages and Employment Growth – Payroll Tax Collections
Wages and employment growth have a direct impact on payroll tax collections. The 2004-05 Budget assumptions are for average earnings growth of 4% and employment growth of 2¼%.
A one percentage point variation in average earnings growth would change payroll tax collections by approximately $11.9 million.
A one percentage point variation in employment growth would change payroll tax collections by approximately $12.1 million.
Parameters Influencing Commonwealth GST Payments to Queensland
The Australian Government’s national tax reform package was introduced with effect from 1 July 2000. As part of this package, the Australian Government and all state and territory governments signed an Intergovernmental Agreement on the Reform of Commonwealth - State Financial Relations (IGA). Under this agreement, there have been substantial changes to the funding arrangements for states and territories, including compensation for certain costs and revenue foregone.
Estimates of Commonwealth GST revenue grants to states and territories are dependent on GST revenue collection which is likely to be closely correlated with the general level of economic activity. The Australian Government has provided estimates of GST collections in its Budget Papers. In 2004-05, Queensland’s Budget will bear the risks of fluctuations in GST revenues and the other components of the package, such as the First Home Owners Grant scheme, administrative costs associated with the GST and gambling tax losses.
The Australian Government’s estimate of collections in 2004-05 is based on its forecast of national GDP growth of 3½% and consumption growth of 4¼%. As with all other tax estimates, there is a risk of lower collections than estimated by the Australian Government if economic growth and consumption is weaker than expected.
119
There is not enough information provided in the Commonwealth Budget Papers to prepare indicative forecasts of the sensitivity of GST estimates to key variables.
Commonwealth Grants (Specific Purpose Payments)
Specific Purpose Payments (SPPs) are payments made by the Australian Government to promote its policy objectives. Indexation arrangements and distribution among the states vary for each SPP. The Australian Government reviews the payments each year and it has guaranteed it will not reduce SPPs as a result of national tax reform. However, the State has no guarantee that the Australian Government will not reduce SPPs for other purposes.
CONTINGENT LIABILITIES
Contingent liabilities represent items that are not included in the Budget as significant uncertainty exists as to whether the Government would sacrifice future economic benefits in respect of these items. Nevertheless, such contingencies need to be recognised and managed wherever possible in terms of their potential impact on the Government’s financial position in the future.
The State’s quantifiable and non-quantifiable contingent liabilities are detailed in the 2002-03 Report on State Finances – Consolidated Financial Statements (Note 33).
A summary of the State’s quantifiable contingent liabilities as at 30 June 2003 is provided below.
| | |
Table C.1 Contingent Liabilities |
| | | 2003 $ million |
Nature of Contingent Liability | | |
| | |
Guarantees and indemnities | | 5,938 |
QTC – stock loans | | 641 |
Training agreement | | — |
Grants and subsidies | | 6 |
Other | | 29 |
| | |
Total | | 6,614 |
120
APPENDIX D – GOVERNMENT FINANCE STATISTICS
INTRODUCTION
Government Finance Statistics (GFS) data is used extensively in the presentation of financial statement information in the Budget Papers.
This appendix contains detailed financial statements for the Queensland Public Sector based on Australian Bureau of Statistics (ABS) Government Finance Statistics standards. These tables provide financial information prepared under the Uniform Presentation Framework of reporting as required under the Australian Loan Council arrangements. In line with these requirements, budgeted financial information for the Public Financial Corporations sector is not included.
In addition, the appendix provides background information on GFS, including the conceptual basis for GFS, sector definitions and a list of reporting entities.
The following tables present the operating statement, balance sheet and cash flow statements for the General Government, Public Non-financial Corporations (PNFC) and Non-financial Public sectors on an accrual GFS basis.
General Government Sector
For a detailed analysis of the General Government sector readers should refer to Chapter 5 – Revenue, Chapter 6 – Expenses, and Chapter 7 – Balance Sheet and Cash Flows.
Public Non-financial Corporations Sector
The Public Non-financial Corporations (PNFC) sector is projected to have a net operating surplus in 2004-05 of $37 million ($85 million deficit in 2003-04).
The net operating surplus of the PNFC sector in GFS terms is not equivalent to net profit and therefore should not be regarded as a reflection of the underlying operating performance of the PNFC sector.
Under a normal accounting presentation, the net operating result excludes dividend payments which are treated as returns to shareholders and therefore ‘below the line’.
Under GFS, dividends are recorded as an expense ‘above the line’ thereby having the effect of reducing the net operating result relative to normal accounting presentations.
The PNFC sector is expected to produce a net operating surplus of $104 million in 2005-06 and continue to grow in the outyears.
Payments for investments in non-financial assets, which represents capital expenditure less sales of physical assets, are projected to increase by $1.508 billion in 2004-05 from the 2003-04 estimated actual of $1.564 billion. This is partly due to the commencement of work on the $1.129 billion Kogan Creek power project and the $234 million Citytrain MetTrip Stage 1 initiative.
Construction, replacement and upgrade of infrastructure supporting the electrical distribution network in regional areas and addressing the impact of continuing strong growth in demand across Queensland by electricity entities contribute further to increased capital investment.
121
The partial sale of an interest in Tarong North Power Station contributed $322 million to the total 2003-04 sales of non-financial assets amount of $394 million.
The PNFC sector’s net worth was $12.096 billion in 2002-03, and is expected to increase to $12.325 billion in 2003-04 and $13.452 billion in 2004-05. Further strong increases in net worth are expected across all the outyears.
UNIFORM PRESENTATION FRAMEWORK FINANCIAL INFORMATION
The following tables present operating statements, balance sheets and cash flow statements prepared on an accrual GFS basis for the General Government, Public Non-financial Corporations and Non-financial Public sectors.
| | | | | | | | | | | | | | | | | | | | | | |
Table D.1 General Government Sector Operating Statement 1 | |
| | | | | 2002-03 Actual $ million | | | 2003-04 Est. Act. $ million | | | 2004-05 Budget $ million | | | 2005-06 Projection $ million | | | 2006-07 Projection $ million | | | 2007-08 Projection $ million | |
| | | GFS Revenue | | | | | | | | | | | | | | | | | | |
| | | Taxation revenue | | 5,598 | | | 6,474 | | | 6,338 | | | 6,365 | | | 6,766 | | | 7,126 | |
| | | Current grants and subsidies | | 10,175 | | | 11,036 | | | 11,803 | | | 12,245 | | | 12,782 | | | 13,421 | |
| | | Capital grants | | 510 | | | 563 | | | 468 | | | 386 | | | 386 | | | 367 | |
| | | Sales of goods and services | | 1,964 | | | 1,984 | | | 2,142 | | | 2,265 | | | 2,359 | | | 2,445 | |
| | | Interest income | | (128 | ) | | 2,332 | | | 1,215 | | | 1,299 | | | 1,375 | | | 1,451 | |
| | | Other | | 2,138 | | | 2,117 | | | 2,043 | | | 2,205 | | | 2,365 | | | 2,514 | |
| | | Total Revenue | | 20,256 | | | 24,506 | | | 24,009 | | | 24,765 | | | 26,033 | | | 27,324 | |
| | | | | | | | |
Less | | GFS Expenses | | | | | | | | | | | | | | | | | | |
| | | Gross operating expenses | | | | | | | | | | | | | | | | | | |
| | | Employee expenses | | 9,303 | | | 10,025 | | | 10,666 | | | 11,200 | | | 11,779 | | | 12,430 | |
| | | Other operating expenses | | 3,799 | | | 4,177 | | | 4,406 | | | 4,617 | | | 4,884 | | | 5,158 | |
| | | Depreciation | | 1,460 | | | 1,483 | | | 1,585 | | | 1,643 | | | 1,690 | | | 1,738 | |
| | | Superannuation interest expense | | 630 | | | 745 | | | 757 | | | 811 | | | 849 | | | 883 | |
| | | Other interest expense | | 220 | | | 224 | | | 202 | | | 227 | | | 272 | | | 292 | |
| | | Current transfers | | 4,271 | | | 4,643 | | | 5,006 | | | 5,208 | | | 5,478 | | | 5,729 | |
| | | Capital transfers | | 558 | | | 835 | | | 741 | | | 605 | | | 608 | | | 612 | |
| | | Total Expenses | | 20,241 | | | 22,132 | | | 23,363 | | | 24,311 | | | 25,560 | | | 26,842 | |
| | | | | | | | |
Equals | | GFS net operating balance | | 15 | | | 2,374 | | | 646 | | | 454 | | | 473 | | | 482 | |
| | | | | | | | |
Less | | Net acquisition of non-financial assets | | | | | | | | | | | | | | | | | | |
| | | Purchases of non-financial assets | | 2,232 | | | 2,578 | | | 2,718 | | | 2,690 | | | 2,492 | | | 2,413 | |
| | | Sales of non-financial assets | | (636 | ) | | (380 | ) | | (284 | ) | | (244 | ) | | (222 | ) | | (215 | ) |
| | | Less | | Depreciation | | 1,460 | | | 1,483 | | | 1,585 | | | 1,643 | | | 1,690 | | | 1,738 | |
| | | Plus | | Change in inventories | | 9 | | | 18 | | | 37 | | | — | | | (20 | ) | | (14 | ) |
| | | Plus | | Other movements in non-financial assets | | 11 | | | (75 | ) | | 3 | | | (1 | ) | | — | | | — | |
| | | Equals | | Total net acquisition of non-financial assets | | 155 | | | 658 | | | 889 | | | 802 | | | 560 | | | 446 | |
| | | | | | | | |
Equals | | GFS Net lending / (borrowing) (Fiscal Balance) | | (140 | ) | | 1,716 | | | (243 | ) | | (348 | ) | | (87 | ) | | 36 | |
Note: 1. Numbers may not add due to rounding. | | | | |
| | | | | | | | | | | | | | | | | | | | | | |
Table D.2 Public Non-financial Corporations Sector Operating Statement (1) | |
| | | | | | | 2002-03 Actual $ million | | | 2003-04 Est. Act. $ million | | | 2004-05 Budget $ million | | | 2005-06 Projection $ million | | | 2006-07 Projection $ million | | | 2007-08 Projection $ million | |
| | | GFS Revenue | | | | | | | | | | | | | | | | | | |
| | | Current grants and subsidies | | 948 | | | 915 | | | 1,082 | | | 1,204 | | | 1,294 | | | 1,342 | |
| | | Capital grants | | 58 | | | 49 | | | 49 | | | 50 | | | 54 | | | 54 | |
| | | Sales of goods and services | | 6,323 | | | 6,362 | | | 6,700 | | | 7,271 | | | 7,685 | | | 8,036 | |
| | | Interest income | | 85 | | | 91 | | | 72 | | | 65 | | | 68 | | | 75 | |
| | | Other | | 337 | | | 324 | | | 339 | | | 269 | | | 301 | | | 341 | |
| | | Total Revenue | | 7,751 | | | 7,741 | | | 8,242 | | | 8,859 | | | 9,402 | | | 9,848 | |
| | | | | | | | |
Less | | GFS Expenses | | | | | | | | | | | | | | | | | | |
| | | Gross operating expenses | | | | | | | | | | | | | | | | | | |
| | | Employee expenses | | 1,386 | | | 1,555 | | | 1,634 | | | 1,642 | | | 1,671 | | | 1,690 | |
| | | Other operating expenses | | 3,350 | | | 3,125 | | | 3,477 | | | 3,765 | | | 3,838 | | | 4,002 | |
| | | Depreciation | | 1,159 | | | 1,209 | | | 1,280 | | | 1,403 | | | 1,489 | | | 1,582 | |
| | | Other interest expense | | 777 | | | 768 | | | 811 | | | 871 | | | 920 | | | 1,007 | |
| | | Other property expenses | | 999 | | | 982 | | | 868 | | | 951 | | | 1,171 | | | 1,265 | |
| | | Current transfers | | 132 | | | 162 | | | 135 | | | 123 | | | 103 | | | 84 | |
| | | Capital transfers | | — | | | 25 | | | — | | | — | | | — | | | — | |
| | | Total Expenses | | 7,803 | | | 7,826 | | | 8,205 | | | 8,755 | | | 9,192 | | | 9,630 | |
| | | | | | | | |
Equals | | GFS net operating balance | | (52 | ) | | (85 | ) | | 37 | | | 104 | | | 210 | | | 218 | |
| | | | | | | | |
Less | | Net acquisition of non-financial assets | | | | | | | | | | | | | | | | | | |
| | | Purchases of non-financial assets | | 2,076 | | | 1,958 | | | 3,123 | | | 2,877 | | | 3,033 | | | 2,501 | |
| | | Sales of non-financial assets | | (142 | ) | | (394 | ) | | (51 | ) | | (72 | ) | | (47 | ) | | (47 | ) |
| | | Less | | Depreciation | | 1,159 | | | 1,209 | | | 1,280 | | | 1,403 | | | 1,489 | | | 1,582 | |
| | | Plus | | Change in inventories | | 52 | | | 13 | | | (3 | ) | | (28 | ) | | 7 | | | 15 | |
| | | Plus | | Other movements in non-financial assets | | 14 | | | — | | | 25 | | | 26 | | | 26 | | | 27 | |
| | | Equals | | Total net acquisition of non-financial assets | | 841 | | | 368 | | | 1,814 | | | 1,400 | | | 1,530 | | | 914 | |
| | | | | | | | |
Equals | | GFS Net lending / (borrowing) (Fiscal Balance) | | (894 | ) | | (453 | ) | | (1,777 | ) | | (1,296 | ) | | (1,320 | ) | | (696 | ) |
| | |
Note: | | | | |
1. Numbers may not add due to rounding | | | | |
| | | | | | | | | | | | | | | | | | | | | | |
Table D.3 Non-financial Public Sector Operating Statement1 | |
| | | | | 2002-03 Actual2 $ million | | | 2003-04 Est. Act. $ million | | | 2004-05 Budget $ million | | | 2005-06 Projection $ million | | | 2006-07 Projection $ million | | | 2007-08 Projection $ million | |
| | | GFS Revenue | | | | | | | | | | | | | | | | | | |
| | | Taxation revenue | | 5,295 | | | 6,108 | | | 5,960 | | | 5,970 | | | 6,354 | | | 6,701 | |
| | | Current grants and subsidies | | 9,997 | | | 10,883 | | | 11,710 | | | 12,194 | | | 12,738 | | | 13,359 | |
| | | Capital grants | | 555 | | | 610 | | | 517 | | | 436 | | | 439 | | | 420 | |
| | | Sales of goods and services | | 8,161 | | | 8,171 | | | 8,665 | | | 9,356 | | | 9,867 | | | 10,304 | |
| | | Interest income | | (45 | ) | | 2,410 | | | 1,273 | | | 1,351 | | | 1,430 | | | 1,513 | |
| | | Other | | 1,460 | | | 1,478 | | | 1,514 | | | 1,523 | | | 1,494 | | | 1,590 | |
| | | Total Revenue | | 25,423 | | | 29,660 | | | 29,639 | | | 30,830 | | | 32,322 | | | 33,887 | |
| | | | | | | | |
Less | | GFS Expenses | | | | | | | | | | | | | | | | | | |
| | | Gross operating expenses | | | | | | | | | | | | | | | | | | |
| | | Employee expenses | | 10,689 | | | 11,529 | | | 12,250 | | | 12,791 | | | 13,399 | | | 14,069 | |
| | | Other operating expenses | | 6,688 | | | 6,819 | | | 7,361 | | | 7,839 | | | 8,162 | | | 8,585 | |
| | | Depreciation | | 2,619 | | | 2,691 | | | 2,864 | | | 3,046 | | | 3,179 | | | 3,320 | |
| | | Superannuation interest expense | | 630 | | | 745 | | | 757 | | | 811 | | | 849 | | | 883 | |
| | | Other interest expense | | 995 | | | 979 | | | 1,000 | | | 1,084 | | | 1,178 | | | 1,286 | |
| | | Current transfers | | 3,292 | | | 3,751 | | | 3,983 | | | 4,095 | | | 4,264 | | | 4,430 | |
| | | Capital transfers | | 547 | | | 856 | | | 740 | | | 605 | | | 608 | | | 612 | |
| | | Total Expenses | | 25,460 | | | 27,370 | | | 28,955 | | | 30,271 | | | 31,639 | | | 33,185 | |
| | | | | | | | |
Equals | | GFS net operating balance | | (37 | ) | | 2,290 | | | 684 | | | 559 | | | 683 | | | 702 | |
| | | | | | | | |
Less | | Net acquisition of non-financial assets | | | | | | | | | | | | | | | | | | |
| | | Purchases of non-financial assets | | 4,054 | | | 4,536 | | | 5,841 | | | 5,567 | | | 5,525 | | | 4,913 | |
| | | Sales of non-financial assets | | (524 | ) | | (775 | ) | | (335 | ) | | (316 | ) | | (269 | ) | | (263 | ) |
| | | Less | | Depreciation | | 2,619 | | | 2,691 | | | 2,864 | | | 3,046 | | | 3,179 | | | 3,320 | |
| | | Plus | | Change in inventories | | 60 | | | 31 | | | 34 | | | (28 | ) | | (13 | ) | | 1 | |
| | | Plus | | Other movements in non-financial assets | | 26 | | | (76 | ) | | 28 | | | 25 | | | 26 | | | 27 | |
| | | Equals | | Total net acquisition of non-financial assets | | 997 | | | 1,025 | | | 2,704 | | | 2,202 | | | 2,090 | | | 1,358 | |
| | | | | | | | |
Equals | | GFS Net lending / (borrowing) (Fiscal Balance) | | (1,034 | ) | | 1,265 | | | (2,020 | ) | | (1,643 | ) | | (1,407 | ) | | (656 | ) |
| | |
Note: | | | | |
1. Numbers may not add due to rounding. | | | | |
2. Actuals have been restated where subsequent changes in classification have occurred, to ensure comparability with estimates. | | | | |
| | | | | | | | | | | | | | | | | | |
Table D.4 General Government Sector Balance Sheet1 | |
| | | 2002-03 Actual2 $ million | | | 2003-04 Est. Act. $ million | | | 2004-05 Budget $ million | | | 2005-06 Projection $ million | | | 2006-07 Projection $ million | | | 2007-08 Projection $ million | |
Assets | | | | | | | | | | | | | | | | | | |
Financial Assets | | | | | | | | | | | | | | | | | | |
Cash and deposits | | 1,613 | | | 1,577 | | | 1,081 | | | 857 | | | 891 | | | 1,009 | |
Advances paid | | 164 | | | 181 | | | 202 | | | 214 | | | 223 | | | 233 | |
Investments, loans and placements | | 13,756 | | | 15,725 | | | 17,303 | | | 18,371 | | | 19,446 | | | 20,526 | |
Other non-equity assets | | 3,852 | | | 3,993 | | | 4,100 | | | 4,346 | | | 4,703 | | | 4,914 | |
Equity | | 12,775 | | | 13,005 | | | 14,131 | | | 14,927 | | | 16,025 | | | 16,881 | |
Total Financial Assets | | 32,161 | | | 34,481 | | | 36,817 | | | 38,715 | | | 41,288 | | | 43,563 | |
| | | | | | | |
Non-Financial Assets | | 53,914 | | | 56,103 | | | 58,479 | | | 60,827 | | | 62,981 | | | 65,028 | |
| | | | | | | |
Total Assets | | 86,075 | | | 90,584 | | | 95,296 | | | 99,542 | | | 104,269 | | | 108,591 | |
| | | | | | | |
Liabilities | | | | | | | | | | | | | | | | | | |
Borrowing | | 3,690 | | | 3,443 | | | 3,571 | | | 4,200 | | | 5,095 | | | 5,569 | |
Superannuation liability | | 11,770 | | | 12,127 | | | 13,607 | | | 14,669 | | | 15,752 | | | 16,849 | |
Other employee entitlements and provisions | | 3,583 | | | 3,485 | | | 3,540 | | | 3,591 | | | 3,650 | | | 3,735 | |
Other non-equity liabilities | | 2,138 | | | 2,163 | | | 2,114 | | | 2,106 | | | 2,102 | | | 2,102 | |
Total Liabilities | | 21,181 | | | 21,218 | | | 22,832 | | | 24,566 | | | 26,599 | | | 28,255 | |
| | | | | | | |
Net Worth | | 64,894 | | | 69,366 | | | 72,464 | | | 74,976 | | | 77,670 | | | 80,336 | |
Net Financial Worth | | 10,980 | | | 13,263 | | | 13,985 | | | 14,149 | | | 14,689 | | | 15,308 | |
Net Debt | | (11,843 | ) | | (14,040 | ) | | (15,015 | ) | | (15,242 | ) | | (15,465 | ) | | (16,199 | ) |
| |
Note: | |
1. Numbers may not add due to rounding. | |
2. Actuals have been restated where subsequent changes in classification have occurred, to ensure comparability with estimates. | |
| | | | | | | | | | | | | | | | | | |
Table D.5 Public Non-financial Corporations Sector Balance Sheet1 | |
| | | 2002-03 Actual $ million | | | 2003-04 Est. Act. $ million | | | 2004-05 Budget $ million | | | 2005-06 Projection $ million | | | 2006-07 Projection $ million | | | 2007-08 Projection $ million | |
Assets | | | | | | | | | | | | | | | | | | |
Financial Assets | | | | | | | | | | | | | | | | | | |
Cash and deposits | | 1,078 | | | 878 | | | 771 | | | 883 | | | 1,119 | | | 1,412 | |
Investments, loans and placements | | 901 | | | 908 | | | 938 | | | 937 | | | 942 | | | 945 | |
Other non-equity assets | | 1,750 | | | 1,605 | | | 1,718 | | | 1,804 | | | 1,834 | | | 1,833 | |
Equity | | 54 | | | 58 | | | 60 | | | 65 | | | 73 | | | 82 | |
Total Financial Assets | | 3,784 | | | 3,449 | | | 3,487 | | | 3,689 | | | 3,968 | | | 4,272 | |
| | | | | | | |
Non-Financial Assets | | 26,561 | | | 27,075 | | | 29,826 | | | 31,628 | | | 33,586 | | | 34,850 | |
| | | | | | | |
Total Assets | | 30,345 | | | 30,524 | | | 33,313 | | | 35,317 | | | 37,554 | | | 39,122 | |
| | | | | | | |
Liabilities | | | | | | | | | | | | | | | | | | |
Deposits held | | 82 | | | 77 | | | 77 | | | 78 | | | 78 | | | 79 | |
Borrowing | | 13,376 | | | 13,220 | | | 14,664 | | | 15,407 | | | 16,201 | | | 16,545 | |
Other employee entitlements and provisions | | 3,669 | | | 3,760 | | | 3,834 | | | 4,033 | | | 4,332 | | | 4,506 | |
Other non-equity liabilities | | 1,122 | | | 1,142 | | | 1,286 | | | 1,551 | | | 1,598 | | | 1,788 | |
Total Liabilities | | 18,249 | | | 18,199 | | | 19,861 | | | 21,069 | | | 22,209 | | | 22,918 | |
| | | | | | | |
Net Worth | | 12,096 | | | 12,325 | | | 13,452 | | | 14,248 | | | 15,345 | | | 16,204 | |
Net Financial Worth | | (14,465 | ) | | (14,750 | ) | | (16,374 | ) | | (17,380 | ) | | (18,241 | ) | | (18,646 | ) |
Net Debt | | 11,479 | | | 11,511 | | | 13,032 | | | 13,665 | | | 14,218 | | | 14,267 | |
| |
Note: | |
1. Numbers may not add due to rounding | |
| | | | | | | | | | | | | | | | | | |
Table D.6 Non-financial Public Sector Balance Sheet1 | |
| | | 2002-03 Actual2 $ million | | | 2003-04 Est. Act. $ million | | | 2004-05 Budget $ million | | | 2005-06 Projection $ million | | | 2006-07 Projection $ million | | | 2007-08 Projection $ million | |
Assets | | | | | | | | | | | | | | | | | | |
Financial Assets | | | | | | | | | | | | | | | | | | |
Cash and deposits | | 2,691 | | | 2,455 | | | 1,852 | | | 1,740 | | | 2,011 | | | 2,421 | |
Advances paid | | 147 | | | 165 | | | 186 | | | 199 | | | 209 | | | 220 | |
Investments, loans and placements | | 14,590 | | | 16,576 | | | 18,184 | | | 19,251 | | | 20,331 | | | 21,414 | |
Other non-equity assets | | 2,410 | | | 2,246 | | | 2,254 | | | 2,254 | | | 2,243 | | | 2,202 | |
Equity | | 767 | | | 771 | | | 772 | | | 777 | | | 784 | | | 793 | |
Total Financial Assets | | 20,606 | | | 22,213 | | | 23,248 | | | 24,221 | | | 25,578 | | | 27,050 | |
| | | | | | | |
Non-Financial Assets | | 80,442 | | | 83,144 | | | 88,271 | | | 92,421 | | | 96,534 | | | 99,844 | |
| | | | | | | |
Total Assets | | 101,048 | | | 105,357 | | | 111,519 | | | 116,642 | | | 122,112 | | | 126,894 | |
| | | | | | | |
Liabilities | | | | | | | | | | | | | | | | | | |
Deposits held | | 82 | | | 87 | | | 86 | | | 88 | | | 88 | | | 88 | |
Borrowing | | 16,983 | | | 16,582 | | | 18,152 | | | 19,525 | | | 21,217 | | | 22,038 | |
Superannuation liability | | 11,770 | | | 12,127 | | | 13,607 | | | 14,669 | | | 15,752 | | | 16,849 | |
Other employee entitlements and provisions | | 4,191 | | | 4,147 | | | 4,172 | | | 4,225 | | | 4,319 | | | 4,462 | |
Other non-equity liabilities | | 3,128 | | | 3,048 | | | 3,038 | | | 3,159 | | | 3,066 | | | 3,121 | |
Total Liabilities | | 36,154 | | | 35,991 | | | 39,055 | | | 41,666 | | | 44,442 | | | 46,558 | |
| | | | | | | |
Net Worth | | 64,894 | | | 69,366 | | | 72,464 | | | 74,976 | | | 77,670 | | | 80,336 | |
Net Financial Worth | | (15,548 | ) | | (13,778 | ) | | (15,807 | ) | | (17,445 | ) | | (18,864 | ) | | (19,508 | ) |
Net Debt | | (364 | ) | | (2,527 | ) | | (1,984 | ) | | (1,577 | ) | | (1,246 | ) | | (1,929 | ) |
| |
Note: | |
1. Numbers may not add due to rounding | |
2. Actuals have been restated where subsequent changes in classification have occurred, to ensure comparability with estimates. | |
| | | | | | | | | | | | | | | | |
Table D.7 General Government Sector Cash Flow Statement1 |
| | | | | | | | | | | | | | | | | | |
| | | 2002-03 Actual $ million | | | 2003-04 Est. Act. $ million | | | 2004-05 Budget $ million | | | 2005-06 Projection $ million | | | 2006-07 Projection $ million | | | 2007-08 Projection $ million | |
Receipts from operating activities | | | | | | | | | | | | | | | | | | |
Taxes received | | 5,603 | | | 6,473 | | | 6,337 | | | 6,364 | | | 6,765 | | | 7,125 | |
Grants and subsidies received | | 10,693 | | | 11,642 | | | 12,273 | | | 12,640 | | | 13,176 | | | 13,796 | |
Sales of goods and services | | 2,042 | | | 2,279 | | | 2,384 | | | 2,520 | | | 2,611 | | | 2,695 | |
Other receipts | | 2,363 | | | 4,711 | | | 3,652 | | | 3,741 | | | 3,850 | | | 4,210 | |
Total | | 20,701 | | | 25,105 | | | 24,646 | | | 25,265 | | | 26,402 | | | 27,826 | |
| | | | | | | |
Payments for operating activities | | | | | | | | | | | | | | | | | | |
Payments for goods and services | | (12,856 | ) | | (14,514 | ) | | (14,691 | ) | | (15,863 | ) | | (16,704 | ) | | (17,634 | ) |
Grants and subsidies | | (4,724 | ) | | (5,250 | ) | | (5,603 | ) | | (5,654 | ) | | (5,924 | ) | | (6,179 | ) |
Interest | | (215 | ) | | (224 | ) | | (202 | ) | | (227 | ) | | (272 | ) | | (292 | ) |
Other payments | | (666 | ) | | (670 | ) | | (654 | ) | | (637 | ) | | (632 | ) | | (614 | ) |
Total | | (18,461 | ) | | (20,658 | ) | | (21,150 | ) | | (22,381 | ) | | (23,532 | ) | | (24,719 | ) |
| | | | | | | |
Net cash inflows from operating activities | | 2,241 | | | 4,447 | | | 3,496 | | | 2,884 | | | 2,870 | | | 3,107 | |
| | | | | | | |
Payments for investments in non-financial assets | | | | | | | | | | | | | | | | | | |
Purchases of non-financial assets | | (2,232 | ) | | (2,578 | ) | | (2,718 | ) | | (2,690 | ) | | (2,492 | ) | | (2,413 | ) |
Sales of non-financial assets | | 636 | | | 380 | | | 284 | | | 244 | | | 222 | | | 215 | |
Total | | (1,596 | ) | | (2,198 | ) | | (2,434 | ) | | (2,446 | ) | | (2,270 | ) | | (2,198 | ) |
| | | | | | | |
Payments for investments in financial assets for policy purposes | | (380 | ) | | (135 | ) | | (105 | ) | | (233 | ) | | (402 | ) | | (198 | ) |
| | | | | | | |
Payments for investments in financial assets for liquidity purposes | | 74 | | | (1,862 | ) | | (1,492 | ) | | (1,039 | ) | | (1,044 | ) | | (1,061 | ) |
| | | | | | | |
Receipts from financing activities | | | | | | | | | | | | | | | | | | |
Borrowing (net) | | 96 | | | (288 | ) | | 40 | | | 610 | | | 879 | | | 466 | |
Total | | 96 | | | (288 | ) | | 40 | | | 610 | | | 879 | | | 466 | |
| | | | | | | |
Net increase/(decrease) in cash held | | 434 | | | (36 | ) | | (495 | ) | | (224 | ) | | 33 | | | 116 | |
| | | | | | | |
Net cash from operating activities and investments in non-financial assets | | 645 | | | 2,249 | | | 1,062 | | | 438 | | | 600 | | | 909 | |
less Finance leases and similar arrangements | | — | | | — | | | 3 | | | — | | | — | | | — | |
GFS Surplus/(deficit) | | 645 | | | 2,249 | | | 1,059 | | | 438 | | | 600 | | | 909 | |
Note: 1. Numbers may not add due to rounding. | |
| | | | | | | | | | | | | | | | |
Table D.8 Public Non-financial Corporations Sector Cash Flow Statement1 |
| | | | | | | | | | | | | | | | | | |
| | | 2002-03 Actual $ million | | | 2003-04 Est. Act. $ million | | | 2004-05 Budget $ million | | | 2005-06 Projection $ million | | | 2006-07 Projection $ million | | | 2007-08 Projection $ million | |
Receipts from operating activities | | | | | | | | | | | | | | | | | | |
Grants and subsidies received | | 985 | | | 938 | | | 1,007 | | | 1,216 | | | 1,307 | | | 1,353 | |
Sales of goods and services | | 6,784 | | | 7,049 | | | 7,436 | | | 8,070 | | | 8,389 | | | 8,948 | |
Other receipts | | 750 | | | 810 | | | 789 | | | 753 | | | 788 | | | 825 | |
Total | | 8,520 | | | 8,797 | | | 9,232 | | | 10,039 | | | 10,484 | | | 11,126 | |
| | | | | | | |
Payments for operating activities | | | | | | | | | | | | | | | | | | |
Payments for goods and services | | (4,663 | ) | | (4,730 | ) | | (5,109 | ) | | (5,367 | ) | | (5,515 | ) | | (5,677 | ) |
Grants and subsidies | | (129 | ) | | (151 | ) | | (126 | ) | | (112 | ) | | (92 | ) | | (72 | ) |
Interest | | (847 | ) | | (755 | ) | | (798 | ) | | (861 | ) | | (910 | ) | | (1,002 | ) |
Other payments | | (873 | ) | | (973 | ) | | (915 | ) | | (982 | ) | | (1,046 | ) | | (1,073 | ) |
Total | | (6,513 | ) | | (6,609 | ) | | (6,948 | ) | | (7,322 | ) | | (7,563 | ) | | (7,824 | ) |
| | | | | | | |
Net cash inflows from operating activities | | 2,008 | | | 2,188 | | | 2,284 | | | 2,717 | | | 2,921 | | | 3,302 | |
| | | | | | | |
Payments for investments | | | | | | | | | | | | | | | | | | |
in non-financial assets | | | | | | | | | | | | | | | | | | |
Purchases of non-financial assets | | (2,076 | ) | | (1,958 | ) | | (3,123 | ) | | (2,877 | ) | | (3,033 | ) | | (2,501 | ) |
Sales of non-financial assets | | 142 | | | 394 | | | 51 | | | 72 | | | 47 | | | 47 | |
Total | | (1,934 | ) | | (1,564 | ) | | (3,072 | ) | | (2,805 | ) | | (2,986 | ) | | (2,454 | ) |
| | | | | | | |
Payments for investments in financial assets for policy purposes | | 54 | | | (1 | ) | | — | | | — | | | — | | | — | |
| | | | | | | |
Payments for investments in financial assets for liquidity purposes | | (67 | ) | | (11 | ) | | (64 | ) | | (38 | ) | | (37 | ) | | (36 | ) |
| | | | | | | |
Receipts from financing activities | | | | | | | | | | | | | | | | | | |
Borrowing (net) | | 728 | | | (181 | ) | | 1,393 | | | 691 | | | 727 | | | 277 | |
Deposits received (net) | | 10 | | | 5 | | | | | | 1 | | | 1 | | | 1 | |
Distributions paid | | (796 | ) | | (771 | ) | | (753 | ) | | (685 | ) | | (792 | ) | | (995 | ) |
Other financing (net) | | 343 | | | 135 | | | 106 | | | 233 | | | 402 | | | 198 | |
Total | | 285 | | | (812 | ) | | 746 | | | 240 | | | 338 | | | (519 | ) |
| | | | | | | |
Net increase/(decrease) in cash held | | 346 | | | (200 | ) | | (106 | ) | | 114 | | | 236 | | | 293 | |
| | | | | | | |
Net cash from operating activities | | | | | | | | | | | | | | | | | | |
and investments in non-financial assets | | 73 | | | 624 | | | (788 | ) | | (88 | ) | | (65 | ) | | 848 | |
Distributions paid | | (796 | ) | | (771 | ) | | (753 | ) | | (685 | ) | | (792 | ) | | (995 | ) |
GFS Surplus/(deficit) | | (722 | ) | | (147 | ) | | (1,541 | ) | | (773 | ) | | (857 | ) | | (147 | ) |
Note: 1. Numbers may not add due to rounding | |
| | | | | | | | | | | | | | | | |
Table D.9 Non-financial Public Sector Cash Flow Statement1 |
| | | | | | | | | | | | | | | | | | |
| | | 2002-03 Actual $ million | | | 2003-04 Est. Act. $ million | | | 2004-05 Budget $ million | | | 2005-06 Projection $ million | | | 2006-07 Projection $ million | | | 2007-08 Projection $ million | |
Receipts from operating activities | | | | | | | | | | | | | | | | | | |
Taxes received | | 5,291 | | | 6,107 | | | 5,959 | | | 5,969 | | | 6,353 | | | 6,700 | |
Grants and subsidies received | | 10,556 | | | 11,510 | | | 12,105 | | | 12,600 | | | 13,144 | | | 13,745 | |
Sales of goods and services | | 8,744 | | | 9,148 | | | 9,644 | | | 10,413 | | | 10,823 | | | 11,465 | |
Other receipts | | 2,267 | | | 4,751 | | | 3,699 | | | 3,805 | | | 3,846 | | | 4,038 | |
Total | | 26,858 | | | 31,516 | | | 31,407 | | | 32,787 | | | 34,166 | | | 35,948 | |
| | | | | | | |
Payments for operating activities | | | | | | | | | | | | | | | | | | |
Payments for goods and services | | (17,424 | ) | | (19,011 | ) | | (19,595 | ) | | (21,006 | ) | | (21,996 | ) | | (23,093 | ) |
Grants and subsidies | | (3,686 | ) | | (4,329 | ) | | (4,555 | ) | | (4,513 | ) | | (4,681 | ) | | (4,851 | ) |
Interest | | (996 | ) | | (908 | ) | | (928 | ) | | (1,010 | ) | | (1,096 | ) | | (1,199 | ) |
Other payments | | (1,300 | ) | | (1,404 | ) | | (1,302 | ) | | (1,343 | ) | | (1,392 | ) | | (1,391 | ) |
Total | | (23,406 | ) | | (25,652 | ) | | (26,380 | ) | | (27,872 | ) | | (29,165 | ) | | (30,534 | ) |
| | | | | | | |
Net cash inflows from operating activities | | 3,453 | | | 5,864 | | | 5,027 | | | 4,915 | | | 5,001 | | | 5,414 | |
| | | | | | | |
Payments for investments in non-financial assets | | | | | | | | | | | | | | | | | | |
Purchases of non-financial assets | | (4,054 | ) | | (4,536 | ) | | (5,841 | ) | | (5,567 | ) | | (5,525 | ) | | (4,913 | ) |
Sales of non-financial assets | | 524 | | | 775 | | | 335 | | | 316 | | | 269 | | | 263 | |
Total | | (3,530 | ) | | (3,761 | ) | | (5,506 | ) | | (5,251 | ) | | (5,256 | ) | | (4,650 | ) |
| | | | | | | |
Payments for investments in financial assets for policy purposes | | 5 | | | (1 | ) | | — | | | — | | | — | | | — | |
| | | | | | | |
Payments for investments in financial assets for liquidity purposes | | (26 | ) | | (1,873 | ) | | (1,557 | ) | | (1,077 | ) | | (1,081 | ) | | (1,096 | ) |
| | | | | | | |
Receipts from financing activities | | | | | | | | | | | | | | | | | | |
Borrowing (net) | | 869 | | | (468 | ) | | 1,432 | | | 1,301 | | | 1,606 | | | 743 | |
Deposits received (net) | | 10 | | | 5 | | | — | | | 1 | | | 1 | | | 1 | |
Total | | 879 | | | (463 | ) | | 1,432 | | | 1,302 | | | 1,607 | | | 744 | |
| | | | | | | |
Net increase/(decrease) in cash held | | 781 | | | (234 | ) | | (604 | ) | | (111 | ) | | 271 | | | 412 | |
| | | | | | | |
Net cash from operating activities and investments in non-financial assets | | (78 | ) | | 2,103 | | | (479 | ) | | (336 | ) | | (255 | ) | | 764 | |
less Finance leases and similar arrangements | | — | | | — | | | 3 | | | — | | | — | | | — | |
GFS Surplus/(deficit) | | (78 | ) | | 2,103 | | | (482 | ) | | (336 | ) | | (255 | ) | | 764 | |
Note: 1. Numbers may not add due to rounding | |
Other GFS Data
Data presented in the following tables are presented in accordance with GFS and Uniform Presentation Framework guidelines which present data on a consolidated basis.
Expenses by Function
Data presented in Table D.10 provides details of General Government sector expenses by function.
| | | | | | | | | | | | | | | | |
Table D.10 General Government Sector Expenses by Function1 |
| | | | | | | | | | | | |
| | | 2002-03
Actual
$ million | | 2003-04
Est. Act. $ million | | 2004-05
Budget
$ million | | 2005-06
Projection
$ million | | 2006-07
Projection
$ million | | 2007-08
Projection
$ million |
General public services | | 873 | | 907 | | 980 | | 961 | | 1,156 | | 1,236 |
Public order and safety | | 1,946 | | 2,186 | | 2,382 | | 2,468 | | 2,566 | | 2,672 |
Education | | 5,346 | | 5,612 | | 5,892 | | 6,209 | | 6,501 | | 6,928 |
Health | | 4,370 | | 4,675 | | 5,055 | | 5,250 | | 5,558 | | 5,939 |
Social security and welfare | | 827 | | 961 | | 1,083 | | 1,189 | | 1,292 | | 1,380 |
Housing and community amenities | | 936 | | 963 | | 1,009 | | 1,058 | | 1,062 | | 1,053 |
Recreation and culture | | 505 | | 588 | | 581 | | 574 | | 587 | | 588 |
Fuel and energy | | 710 | | 693 | | 741 | | 891 | | 911 | | 946 |
Agriculture, forestry, fishing and hunting | | 612 | | 734 | | 672 | | 645 | | 630 | | 601 |
Mining, manufacturing and construction | | 72 | | 114 | | 116 | | 115 | | 114 | | 115 |
Transport and communications | | 2,055 | | 2,443 | | 2,754 | | 2,770 | | 2,910 | | 3,025 |
Other economic affairs | | 676 | | 827 | | 710 | | 700 | | 711 | | 655 |
Other purposes | | 1,313 | | 1,428 | | 1,386 | | 1,481 | | 1,562 | | 1,703 |
| | | | | | | |
Total Expenses | | 20,241 | | 22,132 | | 23,363 | | 24,311 | | 25,560 | | 26,842 |
Note: 1. Numbers may not add due to rounding. |
Purchases of non-financial Assets by Function
Data presented in Table D.11 provides details of General Government sector purchases of non-financial assets by function.
| | | | | | | | | | | | | | | | |
Table D.11 General Government Sector Purchases of Non-financial Assets by Function1 |
| | | | |
| | | 2003-04 Est. Act. $ million | | 2004-05
Budget
$ million |
General public services | | 136 | | 72 |
Public order and safety | | 288 | | 244 |
Education | | 309 | | 370 |
Health | | 300 | | 408 |
Social security and welfare | | 25 | | 76 |
Housing and community amenities | | 268 | | 279 |
Recreation and culture | | 109 | | 165 |
Fuel and energy | | — | | 1 |
Agriculture, forestry, fishing and hunting | | 45 | | 54 |
Mining, manufacturing and construction | | 2 | | 5 |
Transport and communications | | 792 | | 845 |
Other economic affairs | | 280 | | 171 |
Other purposes | | 23 | | 28 |
| | | |
Total Purchases | | 2,578 | | 2,718 |
Note: | | | | |
1. Numbers may not add due to rounding. | | | | |
Taxes
Data presented in Table D.12 provides details of taxation revenue collected by the General Government sector.
| | | | | | | | | | | | | | | | |
Table D.12 General Government Sector Taxes1 |
| | | | |
| | | 2003-04 Est. Act. $ million | | 2004-05
Budget $ million |
Taxes on employers’ payroll and labour force | | 1,416 | | 1,505 |
| | | |
Taxes on property | | | | |
Land taxes | | 305 | | 379 |
Stamp duties on financial and capital transactions | | 2,131 | | 1,696 |
Financial Institutions’ Transactions Taxes | | 190 | | 190 |
Other | | 317 | | 330 |
| | | |
Taxes on the provision of goods and services | | | | |
Taxes on gambling | | 725 | | 806 |
Taxes on insurance | | 365 | | 362 |
| | | |
Taxes on use of goods and performance of activities | | | | |
Motor vehicle taxes | | 932 | | 966 |
Other | | 93 | | 104 |
| | | |
Total Taxation Revenue | | 6,474 | | 6,338 |
Note: | | | | |
1. Numbers may not add due to rounding. | | | | |
Loan Council Allocation
The Australian Loan Council requires all jurisdictions to prepare Loan Council Allocations (LCA) to provide an indication of each government’s probable call on financial markets over the forthcoming financial year.
Table D.13 presents the State’s revised LCA Budget update and the Loan Council endorsed, LCA for 2004-05.
| | | | | | | | | | | | | | | | |
Table D.13 Loan Council Allocation1 |
| | | | | | | | |
| | | | | 2004-05 Nomination $ million | | | 2004-05 Budget $ million | |
| | | General Government sector cash deficit/(surplus)2 | | (429 | ) | | (1,059 | ) |
| | | PNFC sector cash deficit/(surplus)2 | | 727 | | | 1,541 | |
| | | | |
| | | Non Financial Public Sector cash deficit/(surplus)2 | | 297 | | | 482 | |
| | | | |
Less | | Net cash flows from investments in financial assets for policy purposes | | — | | | — | |
| | | | |
Plus | | Memorandum items3 | | 138 | | | 138 | |
| | | | |
| | | Loan Council Allocation | | 435 | | | 620 | |
Note: 1. Numbers may not add due to rounding. 2. Figures in brackets represent surpluses. 3. Memorandum items include operating leases and local government borrowings. | |
The State’s Budget LCA nomination is a deficit of $620 million. This compares to the LCA nomination in March of $435 million.
The increase in the General Government sector cash surplus from the LCA nomination reflects increased cash inflows from operating activities whilst the higher PNFC sector cash deficit reflects higher net borrowing requirements by the Public Non-financial Corporation sector as a result of increased spending on capital infrastructure.
| | | | |
| | | Budget Strategy and Outlook 2004-05 | | 122 |
BACKGROUND AND INTERPRETATION OF GOVERNMENT FINANCE STATISTICS
Accrual GFS Framework
The GFS reporting framework, developed by the Australian Bureau of Statistics (ABS), is based on international statistical standards (the International Monetary Fund Manual on Government Finance Statistics and the United Nations System of National Accounts). This allows comprehensive assessments to be made of the economic impact of government.
Nature of the GFS framework
The accrual GFS framework is based on an integrated recording of stocks and flows. Stocks refer to a unit’s holdings of assets, liabilities and net worth at a point in time, whilst flows represent the movement in the stock of assets and liabilities between two points in time. Flows comprise of two separate types, transactions and other economic flows. Transactions come about as a result of mutually agreed interactions between units or within a single unit. Other economic flows would include revaluations and destruction or discovery of assets that do not result from a transaction. In GFS operating statements, other economic flows, being outside of the control of government, are excluded and do not affect the net operating result.
The GFS statements reported in the Budget are the operating statement, balance sheet and cash flow statement.
Operating Statement
This statement is designed to capture the details of transaction flows of GFS revenue and GFS expense items as well as net acquisition of non-financial assets for an accounting period. Unlike operating statements prepared on Australian Accounting Standard principles, a GFS operating statement reports two major fiscal measures – the GFS net operating balance and GFS net lending/borrowing.
Net operating balance is represented by GFS revenues less GFS expenses and excludes any other economic flows such as revaluations, gain or loss on assets disposals and allowances for doubtful debts.
Net lending is the net operating balance less net acquisition of non-financial assets. It also is referred to as the fiscal balance. It measures, in accrual terms, the gap between Government savings plus net capital transfers and investment in non-financial assets. A surplus indicates that the State Government is placing financial resources at the disposal of other sectors of the economy, whilst a deficit reflects the state utilising the financial resources of other sectors.
Balance Sheet
The balance sheet shows stocks of financial and non-financial assets and liabilities. Key indicators in the balance sheet are net debt and net worth.
Net debt is represented by the sum of selected financial liabilities (such as deposits held and borrowings) minus the sum of selected financial assets (cash and deposits, loans and placements). It provides an indication of the strength of a government’s financial position.
Net worth, known as net assets, is defined as total assets less total liabilities. It provides a more comprehensive picture of a government’s position as all assets and liabilities are taken into account.
123
Net financial worth, on the other hand, is calculated as financial assets minus total liabilities. It measures a government’s net holdings of financial assets.
Cash Flow Statement
Cash means cash on hand (notes and coins held and deposits held at call with a bank or financial institution) and cash equivalents (highly liquid investments readily convertible to cash and overdrafts considered integral to the cash management functions). The cash flow statement demonstrates how cash is generated and applied in a single accounting period.
The GFS surplus/deficit is the cash counterpart of the fiscal balance as disclosed in the GFS operating statement. A surplus reflects the availability of cash to increase the State’s financial assets or decrease its liabilities, whilst a deficit reflects the requirement for cash either by running down the State’s financial assets or by drawing on the cash reserves of other sectors of the economy. It comprises net cash received/paid from operating activities, from sales and purchases of non-financial assets and from financing activities.
SECTOR CLASSIFICATION
GFS data is presented by institutional sector, distinguishing between the General Government sector and the Public Non-financial Corporations (PNFC) sector.
Budget reporting focuses on the General Government sector that provides regulatory services and goods and services of a non-market nature that are provided at less than cost or at no cost. These services are largely financed by general revenue (taxation). This sector comprises government departments, their commercialised business units/shared service providers and certain statutory bodies.
The PNFC sector comprises bodies that provide mainly market goods and services that are of a non-regulatory and non-financial nature. PNFCs are financed through sales to consumers of their goods and services and may be supplemented by explicit government subsidy to satisfy community service obligations. In general, PNFCs are legally distinguishable from the governments that own them. Examples of PNFCs include QR and the electricity entities.
Together, the general government sector and the PNFC sector comprise the Non-financial Public sector.
Further discussions of the GFS framework of reporting, including definitions of GFS terms can be obtained from the webpage of the Australian Bureau of Statistics at www.abs.gov.au.
REPORTING ENTITIES
The reporting entities included in the General Government and PNFC sectors are detailed below.
General Government
Departments
Aboriginal and Torres Strait Islander Policy
Child Safety
Communities
Corrective Services
Disability Services Queensland
124
Education and the Arts
Electoral Commission of Queensland
Emergency Services
Employment and Training
Environmental Protection Agency
Families (ceased 12/02/04)
Health
Housing (includes Racing)
Industrial Relations
Innovation and Information Economy, Sport and Recreation Queensland (ceased 12/02/04)
Justice and Attorney-General
Legislative Assembly
Local Government, Planning, Sport and Recreation
Main Roads
Natural Resources, Mines and Energy
Office of the Governor
Office of the Ombudsman and Office of Information Commissioner
Office of the Public Service Commissioner
Police
Premier and Cabinet
Primary Industries and Fisheries
Public Works
Queensland Audit Office
State Development and Innovation
The Public Trustee of Queensland
Tourism, Fair Trading and Wine Industry Development
Transport
Treasury
Statutory Authorities
Anti-Discrimination Commission Queensland
Board of the Queensland Museum
Bureau of Sugar Experiment Stations (gifted 01/09/03)
Commission for Children and Young People
Crime and Misconduct Commission
Dalby Agricultural College Board
Emerald Agricultural College Board
Legal Aid Queensland
Library Board of Queensland
Longreach Pastoral College Board
Motor Accident Insurance Commission
Nickel Resources North Queensland Pty Ltd (ceased 31/12/03)
Nominal Defendant
Prostitution Licensing Authority
Queensland Art Gallery Board of Trustees
Queensland Building Services Authority
125
Queensland Events Corporation Pty Ltd
Queensland Performing Arts Trust
Queensland Rural Adjustment Authority
Queensland Studies Authority
Queensland Theatre Company
Queensland Treasury Holdings Pty Ltd
Residential Tenancy Authority
SGH Ltd
South Bank Corporation
The Australian College of Tropical Agriculture
Queensland Institute of Medical Research
Royal Children’s Hospital Foundation
Tourism Queensland
Workers Compensation Regulatory Authority
Commercialised Business Units
Citec
GoPrint
Main Roads – RoadTek
Project Services
Property Services Group
Q-Build
Q-Fleet
Sales and Distribution Services
Shared Service Providers
Corporate Administration Agency
Corporate and Professional Services
Corporate Solutions Queensland
Queensland Health Shared Service Provider
PartnerOne
CorporateLink
CorpTech
Public Non-financial Corporations
2001 Goodwill Games Brisbane Ltd (ceased 2003-04)
Brisbane Market Corporation (ceased 2003-04)
Bundaberg Port Authority
Cairns Port Authority
CS Energy Ltd
DBCT Holdings Pty Ltd
DPI Forestry
ENERGEX Ltd
Ergon Energy Corporation Ltd
Eungella Water Pipeline Pty Ltd
Gladstone Area Water Board
Gladstone Port Authority
126
Gold Coast Events Co Pty Ltd
Golden Casket Lottery Corporation Ltd
Heritage Train Company Pty Ltd
Mackay Port Authority
Major Sports Facilities Authority
Mount Isa Water Board
On Track Insurance Pty Ltd
North West Queensland Water Pipeline Pty Ltd
Pioneer Valley Water Board
Port of Brisbane Corporation
Ports Corporation of Queensland
Powerlink QueenslandCorporate Solutions Queensland
Queensland Health Shared Service Provider
PartnerOne
CorporateLink
CorpTech
Public Non-financial Corporations
2001 Goodwill Games Brisbane Ltd (ceased 2003-04)
Brisbane Market Corporation (ceased 2003-04)
Bundaberg Port Authority
Cairns Port Authority
CS Energy Ltd
DBCT Holdings Pty Ltd
DPI Forestry
ENERGEX Ltd
Ergon Energy Corporation Ltd
Eungella Water Pipeline Pty Ltd
Gladstone Area Water Board
Gladstone Port Authority
Gold Coast Events Co Pty Ltd
Golden Casket Lottery Corporation Ltd
Heritage Train Company Pty Ltd
Mackay Port Authority
Major Sports Facilities Authority
Mount Isa Water Board
On Track Insurance Pty Ltd
North West Queensland Water Pipeline Pty Ltd
Pioneer Valley Water Board
Port of Brisbane Corporation
Ports Corporation of Queensland
Powerlink Queensland
Queensland Motorways Ltd
Queensland Power Trading Corporation (Enertrade)
QR (Queensland Rail)
QR National Pty Ltd (Interail Australia)
127
Rockhampton Port Authority
Stanwell Corporation Ltd
SunWater
Tarong Energy Corporation Ltd
Townsville Port Authority
Trustees of the Albion Park Paceway (gifted 01/07/03)
128
APPENDIX E – DEPARTMENTAL EXPENSES
| | | | |
Table E.1 Departmental Controlled Expenses1 |
| | | 2003-04 Est. Act. $’000 | | 2004-05 Estimate $’000 |
Aboriginal and Torres Strait Islander Policy* | | 103,958 | | 54,732 |
Arts | | 94,015 | | 86,635 |
Child Safety* | | 91,226 | | 269,372 |
Communities* | | 111,789 | | 290,605 |
Corrective Services | | 412,167 | | 422,560 |
Disability Services Queensland | | 390,203 | | 454,739 |
Education | | 4,210,223 | | 4,374,340 |
Electoral Commission | | 22,256 | | 8,528 |
Emergency Services | | 609,716 | | 658,204 |
Employment and Training* | | 905,333 | | 921,240 |
Environmental Protection Agency | | 379,414 | | 372,021 |
Families* (ceased 12/02/04) | | 254,216 | | — |
Health | | 4,766,633 | | 5,131,833 |
Housing* | | 898,300 | | 924,602 |
Industrial Relations | | 80,030 | | 87,841 |
Innovation and Information Economy, Sport and Recreation Qld* (ceased 12/02/04) | | 149,070 | | — |
Justice and Attorney-General | | 213,776 | | 235,359 |
Legislative Assembly | | 61,079 | | 62,764 |
Local Government, Planning, Sport and Recreation* | | 251,237 | | 417,439 |
Main Roads | | 2,272,214 | | 2,319,685 |
Natural Resources, Mines and Energy* | | 448,301 | | 455,079 |
Office of the Governor | | 3,569 | | 3,604 |
Office of the Public Service Commissioner | | 5,204 | | 4,657 |
Ombudsman | | 5,965 | | 6,034 |
Police | | 1,018,431 | | 1,093,549 |
Premier and Cabinet* | | 90,554 | | 108,148 |
Primary Industries and Fisheries* | | 345,915 | | 335,627 |
Public Trustee | | 42,408 | | 45,696 |
Public Works* | | 327,321 | | 335,070 |
Queensland Audit Office | | 23,611 | | 23,957 |
State Development and Innovation* | | 259,872 | | 178,593 |
Tourism, Fair Trading and Wine Industry Development* | | 53,939 | | 50,983 |
Transport | | 1,366,397 | | 1,704,691 |
Treasury | | 188,310 | | 176,385 |
Total Expenses2 | | 20,456,652 | | 21,614,572 |
Notes: 1. This table provides a summary drawn from financial statements contained in the Ministerial Portfolio Statements (MPS). Further information on the composition of expenses, outputs delivered and factors influencing the movement in expenses can be obtained in individual Ministerial Portfolio Statements. 2. Total expenses by department does not equate to total general government expenses in Government Finance Statistics (GFS) terms reported elsewhere in the Budget Papers as GFS General Government expenses include a wider range of entities including State Government statutory authorities. In addition transactions between entities within the General Government sector (for example payroll tax payments) are excluded in the preparation of whole-of-Government GFS financial statements. * Machinery-of-government changes implemented on 12 February 2004 should be taken into account when comparing 2003-04 estimated actuals with 2004-05 estimates. |
| | | | |
Table E.2 Departmental Administered Expenses1 |
| | | | |
| | | 2003-04 Est. Act. $’000 | | 2004-05 Estimate $’000 |
Arts | | 95,260 | | 99,585 |
Communities* | | 55,229 | | 136,210 |
Education | | 1,260,282 | | 1,344,665 |
Employment and Training | | 1,885 | | 1,885 |
Families* (ceased 12/02/04) | | 74,910 | | — |
Health | | 7 | | 7 |
Innovation and Information Economy, Sport and Recreation Qld* (ceased 12/02/04) | | 156,660 | | — |
Justice and Attorney-General | | 119,162 | | 123,748 |
Local Government, Planning, Sport and Recreation* | | 318,811 | | 304,255 |
Natural Resources, Mines and Energy* | | 61,769 | | 241,363 |
Police | | 24,803 | | 806 |
Premier and Cabinet | | 92,419 | | 106,134 |
Primary Industries and Fisheries | | 11,476 | | 9,866 |
Public Works | | 37,108 | | 14,349 |
State Development and Innovation* | | 32,405 | | 29,165 |
Tourism, Fair Trading and Wine Industry Development | | 47,646 | | 45,399 |
Transport | | 2,120 | | 1,400 |
Treasury | | 2,283,086 | | 1,498,429 |
Total Expenses2 | | 4,675,038 | | 3,957,266 |
Notes: 1. This table provides a summary drawn from financial statements contained in the Ministerial Portfolio Statements (MPS). Further information on the composition of expenses, outputs delivered and factors influencing the movement in expenses can be obtained in individual Ministerial Portfolio Statements. 2. Total expenses by department does not equate to total general government expenses in Government Finance Statistics (GFS) terms reported elsewhere in the Budget Papers as GFS General Government expenses include a wider range of entities including State Government statutory authorities. In addition transactions between entities within the General Government sector (for example payroll tax payments) are excluded in the preparation of whole-of-Government GFS financial statements. * Machinery-of-government changes implemented on 12 February 2004 should be taken into account when comparing 2003-04 estimated actuals with 2004-05 estimates. |
| | | | |
Table E.3 Reconciliation of Departmental to GFS Expenses1 |
| | | | | | |
| | | 2003-04 Est. Act. $ million | | | 2004-05 Estimate $ million | |
Departmental expenditure per MPS - Controlled | | 20,457 | | | 21,615 | |
- Administered | | 4,675 | | | 3,957 | |
| | | |
Non-GFS departmental expenses2 | | (967 | ) | | (247 | ) |
| | | |
Other General Government entities (e.g. CBUs, Statutory Bodies) | | 2,825 | | | 2,467 | |
| | | |
| | | 26,990 | | | 27,792 | |
| | | |
Nominal Superannuation Interest expense | | 745 | | | 757 | |
| | | |
Eliminations and Other whole-of-Government adjustments | | | | | | |
Equity Return elimination | | (2,530 | ) | | (2,621 | ) |
Payments to Commercialised Business Units elimination | | (1,827 | ) | | (1,825 | ) |
Payroll Tax elimination | | (367 | ) | | (387 | ) |
Other eliminations and adjustments | | (878 | ) | | (355 | ) |
| | | |
Total General Government GFS Expenses | | 22,132 | | | 23,363 | |
Notes: 1. Numbers may not add due to rounding. 2. Certain expenses such as asset valuation changes are excluded from GFS reporting. In addition, this item removes the effect of cash payments for whole-of-Government schemes such as the State’s share of defined superannuation beneficiary payments reported in Treasury Administered’s expenses. Costs associated with these schemes are accrued annually. 2003-04 includes a $450 million prepayment of superannuation beneficiary payments to QSuper for distribution in 2004-05. | | | | | | |
| | | | |
| | | Budget Statement 2004-05 | | 129 |
APPENDIX F – RECONCILIATION OF GFS NET OPERATING BALANCE TO ACCOUNTING SURPLUS
Government Finance Statistics (GFS) data is used in the presentation of financial statement information in the Budget Papers. Details of GFS concepts and definitions are provided in Appendix D.
The primary difference between GFS net operating balance and the accounting surplus calculated reporting under Australian Accounting Standards (AAS) is that valuation adjustments are excluded from the GFS net operating balance.
| | | | |
Table F.1 Reconciliation of General Government GFS net operating balance to Accounting surplus1 |
| | | | | | | | | |
| | | 2002-03 Actual $ million | | | 2003-04 Est.Act. $ million | | | 2004-05 Budget $ million | |
GFS net operating balance General Government sector | | 15 | | | 2,374 | | | 646 | |
| | | | |
Remeasurement/valuation adjustments | | | | | | | | | |
Bad debts and amortisation | | (45 | ) | | (42 | ) | | (44 | ) |
Market value adjustments QTC loans2 | | (120 | ) | | 120 | | | — | |
Market value adjustments investments | | 10 | | | 69 | | | 4 | |
Revaluation of superannuation provision3 | | (718 | ) | | 397 | | | — | |
Revaluation of other provisions | | (177 | ) | | 62 | | | 2 | |
Decommissioned Main Roads assets and | | | | | | | | | |
land under roads written off | | (124 | ) | | (145 | ) | | (145 | ) |
Gain/(loss) on assets sold/written off | | 140 | | | 8 | | | 3 | |
Prior year adjustments | | (52 | ) | | — | | | — | |
| | | | |
Presentation differences | | | | | | | | | |
Dividends returned to owners | | 75 | | | — | | | — | |
| | | | |
AAS net surplus General Government sector | | (996 | ) | | 2,843 | | | 466 | |
Notes: 1 Numbers may not add due to rounding. 2 The adjustment from book value to market value on QTC loans for 2003-04 has been based on market values as at 31 March 2004, being the best available estimate. No market value estimate has been made for the Budget as the calculation is dependent on future interest rates. 3 The superannuation provision is heavily dependent on investment returns as it represents the residual liability of the State after deducting members’ fund assets. Any variation from the long term rate of 7.5% results in a revaluation of the provision. The estimated return of 18% for 2003-04 results in a reduction in the provision for the estimated actual. | |
| | | | |
| | | Budget Strategy and Outlook 2004-05 | | 130 |
APPENDIX G – GENERAL GOVERNMENT TIME SERIES
The table below provides an historical time series from 1999-2000 on the key Government Finance Statistics (GFS) indicators used by the Government to measure financial performance.
| | | | | | | | | | | | |
Table G.1 General Government Sector1 | |
| | | 1999-00 Actual $ million | | | 2000-01 Actual $ million | | | 2001-02 Actual $ million | | | 2002-03 Actual $ million | |
OPERATING STATEMENT | | | | | | | | | | | | |
GFS Revenue | | | | | | | | | | | | |
Taxation revenue | | 5,051 | | | 4,255 | | | 4,815 | | | 5,598 | |
Current grants and subsidies | | 6,203 | | | 8,539 | | | 9,520 | | | 10,175 | |
Capital grants | | 448 | | | 483 | | | 696 | | | 510 | |
Sales of goods and services | | 1,695 | | | 1,747 | | | 1,837 | | | 1,964 | |
Interest income | | 1,773 | | | 852 | | | (464 | ) | | (128 | ) |
Other | | 2,222 | | | 2,382 | | | 2,453 | | | 2,138 | |
Total Revenue | | 17,392 | | | 18,258 | | | 18,857 | | | 20,256 | |
| | | | | |
Less GFS Expenses | | | | | | | | | | | | |
Gross operating expenses | | 11,060 | | | 12,844 | | | 13,733 | | | 14,562 | |
Superannuation interest expense | | 710 | | | 467 | | | 626 | | | 630 | |
Other interest expense | | 283 | | | 339 | | | 223 | | | 220 | |
Current transfers | | 3,511 | | | 4,413 | | | 4,713 | | | 4,271 | |
Capital transfers | | 766 | | | 1,052 | | | 456 | | | 558 | |
Total Expenses | | 16,330 | | | 19,116 | | | 19,751 | | | 20,241 | |
| | | | | |
Equals GFS net operating balance | | 1,062 | | | (858 | ) | | (894 | ) | | 15 | |
| | | | | |
OTHER KEY AGGREGATES | | | | | | | | | | | | |
| | | | | |
Purchases of non-financial assets | | 2,992 | | | 2,520 | | | 2,416 | | | 2,232 | |
| | | | | |
Net acquisition of non-financial assets | | 1,166 | | | 813 | | | 708 | | | 155 | |
| | | | | |
GFS Net lending / (borrowing) | | | | | | | | | | | | |
(Fiscal Balance) | | (104 | ) | | (1,671 | ) | | (1,602 | ) | | (140 | ) |
| | | | | |
Net W orth | | 57,293 | | | 57,623 | | | 58,093 | | | 64,894 | |
| | | | | |
Net Debt | | (10,122 | ) | | (10,082 | ) | | (11,032 | ) | | (11,260 | ) |
| | | | | |
Cash Surplus/Deficit | | (1,281 | ) | | 534 | | | 188 | | | 645 | |
| |
Note: 1. Numbers may not add due to rounding. Source:Budget Papers and Outcomes Reports for Queensland 1999-2000 to 2002-03. | |
| | | | |
| | | Budget Strategy and Outlook 2004-05 | | 131 |
STATE BUDGET
2004-05
CAPITAL STATEMENT
Budget Paper No. 3
| | | | |
| | | Capital Statement 2004-05 | | 1 |
TABLE OF CONTENTS
| | |
1. Overview | | |
| |
Introduction | | 1 |
Employment Generation | | 4 |
Funding the State Capital Program | | 5 |
Key Concepts, Scope and Coverage | | 8 |
| |
2. State Capital Program - Planning and Priorities | | |
| |
Introduction | | 9 |
General Government Sector Capital Planning and Priorities | | 9 |
2004-05 Highlights | | 11 |
Public Non-Financial Corporations Sector Capital Planning and Priorities | | 13 |
Appendix 2.1 | | 17 |
| |
3. Private Sector Contribution to the Delivery of Public Infrastructure | | |
| |
Queensland’s Public Private Partnership Policy and Value for Money | | |
Framework | | 19 |
Potential Public Private Partnership Projects | | 19 |
Other Projects Involving the Private Sector | | 21 |
| |
4. Capital Outlays by Entity | | |
| |
Aboriginal and Torres Strait Islander Policy | | 23 |
Child Safety | | 25 |
Communities | | 26 |
Corrective Services | | 27 |
Disability Services | | 28 |
Education and the Arts | | 30 |
Electoral Commission of Queensland | | 41 |
Emergency Services | | 42 |
Employment and Training | | 46 |
Environmental Protection Agency | | 48 |
Health | | 50 |
Housing | | 55 |
Industrial Relations | | 62 |
Justice and Attorney-General | | 63 |
Legislative Assembly of Queensland | | 66 |
Local Government, Planning, Sport and Recreation | | 67 |
Main Roads | | 70 |
Natural Resources, Mines and Energy | | 79 |
Office of the Governor | | 91 |
Offices of the Ombudsman and Information Commissioner | | 92 |
Office of the Public Service Commissioner | | 93 |
| | | | |
| 2 | | Capital Statement 2004-05 | | |
| | |
Police | | 94 |
Premier and Cabinet | | 97 |
Primary Industries and Fisheries | | 100 |
Public Works | | 103 |
Queensland Audit Office | | 107 |
State Development and Innovation | | 109 |
Tourism, Fair Trading and Wine Industry Development | | 111 |
Transport | | 113 |
Treasury | | 124 |
| |
Appendix A – Entities included in Capital Outlays | | 127 |
| | | | |
| | | Capital Statement 2004-05 | | 3 |
Key Points
| | • | Capital outlays in 2004-05 are estimated to be $6.049 billion, the first time the capital works program has exceeded $6 billion. |
| | • | The 2004-05 capital program represents an increase of 19% or $957.6 million, on estimated actual 2003-04 capital outlays. |
| | • | Capital outlays will contribute to the net provision of some 49,070 full-time jobs in Queensland. |
| | • | The three-year, $1.4 billion Smart State Building Fund will commence in 2004-05 to aid future growth and development across the State, particularly in the areas of health, education, roads and transport. |
| | • | In 2004-05 there will be capital outlays of $1.905 billion for transport and main roads, $1.661 billion for energy, $452 million for education and training and $406 million for health. |
| | • | The Government will continue its investment in the Busway network with an additional allocation of $200 million over four years. Additional funding of $19.8 million is provided as part of a new four-year $571 million Arterial Roads Infrastructure Package. |
| | • | The capital outlays of Government-owned corporations constitute approximately 44% of total outlays in 2004-05, including the commencement of work on the $1.129 billion Kogan Creek power project and the $234 million Citytrain MetTrip Stage 1 initiative. |
| | • | Capital outlays in 2004-05 reflect an ongoing commitment to regional and rural Queensland with 60% of capital expenditure occurring outside the Brisbane Statistical Division. |
INTRODUCTION
This Capital Statement presents an overview of proposed capital outlays by the Queensland Government in 2004-05, as well as a summary of the State Government’s approach to infrastructure provision. Capital outlays in 2004-05 are estimated to be $6.049 billion, net of a capital contingency reserve of $200 million. This represents an increase of 19% on estimated actual outlays in 2003-04, and provides for the commencement of the three-year $1.4 billion Smart State Building Fund.
The Government’s increased capital outlays in 2004-05, combined with the growth of private sector involvement in public infrastructure projects, reflects the Government’s commitment to broadening Queensland’s infrastructure base, in order to better meet the social and economic needs of Queensland’s growing population.
| | | | |
| 4 | | Capital Statement 2004-05 | | |
The capital outlays of Queensland’s Government-owned corporations will constitute 44% of total outlays in 2004-05.
Expenditure in 2004-05 is highest in the Brisbane Statistical Division – the most populated area of the State – at $2.473 billion. However, consistent with the Government’s commitment to building Queensland’s regions, 60% of capital expenditure is expected to occur outside the Brisbane Statistical Division.
Capital outlays by purpose in 2004-05 are shown in Chart 1.1. Capital outlays by State Government entity are listed in Table 1.1. Table 1.2 outlines major sources of funding for the State capital program, while Table 1.3 details estimated capital outlays by entity in each of the State’s statistical divisions.
Chart 1.1
Capital Outlays by Purpose, 2004-05
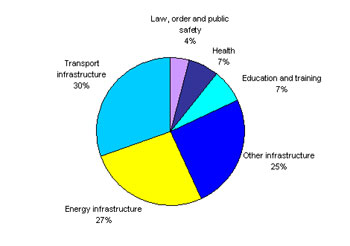
| | | | |
| | | Capital Statement 2004-05 | | 5 |
Table 1.1
Capital Outlays by Entity1,2
| | | | |
Entity
| | 2003-04 Est. Actual
| | 2004-05
Budget
|
| | | $’000 | | $’000 |
Aboriginal and Torres Strait Islander Policy | | 14,364 | | 5,311 |
Child Safety | | 2,664 | | 35,130 |
Communities | | 12,631 | | 10,979 |
Corrective Services | | 12,704 | | 19,737 |
Disability Services | | 8,295 | | 34,291 |
Education and the Arts Portfolio | | | | |
Education | | 346,113 | | 390,303 |
Arts | | 50,924 | | 113,501 |
Emergency Services | | 83,695 | | 76,117 |
Employment and Training | | 59,843 | | 61,477 |
Environmental Protection Agency | | 26,343 | | 25,143 |
Health | | 276,657 | | 406,398 |
Housing | | 346,131 | | 365,974 |
Justice and Attorney-General | | 108,542 | | 70,806 |
Legislative Assembly of Queensland | | 2,163 | | 2,660 |
Local Government, Planning, Sport and Recreation Portfolio | | | | |
Local Government, Planning, Sport and Recreation | | 181,287 | | 226,108 |
Major Sports Facilities Authority | | 35,336 | | 1,600 |
Main Roads Portfolio | | | | |
Main Roads | | 716,593 | | 782,496 |
Roadtek | | 19,675 | | 19,952 |
Queensland Motorways Limited | | 5,000 | | 10,000 |
Natural Resources, Mines and Energy Portfolio | | | | |
Natural Resources, Mines and Energy | | 37,051 | | 45,056 |
Water Boards | | 24,175 | | 12,281 |
SunWater | | 20,923 | | 69,047 |
Energy GOCs | | 1,180,021 | | 1,661,410 |
Police | | 114,847 | | 101,605 |
Premier and Cabinet | | 17,292 | | 16,715 |
Primary Industries and Fisheries Portfolio | | | | |
Primary Industries and Fisheries | | 21,346 | | 24,355 |
Forestry | | 9,920 | | 9,543 |
Queensland Rural Adjustment Authority | | 100 | | 350 |
Public Works Portfolio | | | | |
Public Works | | 69,906 | | 31,576 |
CITEC | | 8,268 | | 8,018 |
QFleet | | 176,927 | | 175,206 |
Other CBUs | | 4,336 | | 11,388 |
| | | | |
| 6 | | Capital Statement 2004-05 | | |
Table 1.1
Capital Outlays by Entity1,2 (continued)
| | | | | | |
Entity
| | 2003-04
Est. Actual
| | | 2004-05
Budget
| |
| | | $’000 | | | $’000 | |
State Development and Innovation Portfolio | | | | | | |
State Development and Innovation | | 295,433 | | | 190,990 | |
Property Services Group | | 59,973 | | | 55,243 | |
Tourism, Fair Trading and Wine Industry Development | | 2,236 | | | 10,925 | |
Transport Portfolio | | | | | | |
Queensland Transport | | 125,387 | | | 119,810 | |
Port Authorities | | 171,588 | | | 351,142 | |
Queensland Rail | | 515,000 | | | 622,000 | |
Treasury Portfolio | | | | | | |
Treasury | | 19,989 | | | 15,937 | |
CorpTech | | 10,867 | | | 42,649 | |
Golden Casket Lottery Corporation | | 8,668 | | | 13,208 | |
Other3 | | 38,112 | | | 2,480 | |
Anticipated Capital Contingency Reserve4 | | (150,000 | ) | | (200,000 | ) |
Total Capital Outlays5,6 | | 5,091,325 | | | 6,048,917 | |
| 1. | Includes associated statutory bodies. |
| 2. | Abstract 31, issued by the Australian Accounting Research Foundation, deals with accounting for the Goods and Services Tax (GST). This Abstract states that in relation to acquisitions of assets, any recoverable GST (in the form of GST input tax credits) would not be included in the cost of acquiring an asset. On this basis, capital works projects are shown on a GST exclusive basis – that is, net of any recoverable GST input tax credits. The current exception to this is where an agency, because of its GST status, is unable to recover some GST input tax credits, for example the Department of Housing. |
| 3. | Includes the Department of Industrial Relations, Electoral Commission of Queensland, Office of the Governor, Office of the Public Service Commissioner, Offices of the Ombudsman and Information Commissioner, the Queensland Audit Office and the former departments of Families and Innovation and Information Economy, Sport and Recreation Queensland. |
| 4. | Adjustment recognises that individual agencies may budget to fully expend their capital works allocations, however on a whole-of-Government basis, there is likely to be underspending, resulting in a carryover of capital allocations. |
| 5. | Capital works outside of Queensland are not included in the capital program. |
| 6. | Numbers may not add due to rounding. |
EMPLOYMENT GENERATION
The 2004-05 capital program will have a significant effect on employment supporting some 49,070 full-time jobs, directly and indirectly. Estimated employment generation from budgeted capital expenditure in 2004-05 exceeds the forecast in the 2003-04 Capital Statement. This is primarily due to increased expenditure on employment generating capital in the areas of health, education, energy, ports and transport infrastructure. Employment generating capital does not include expenditure on land purchases and plant and equipment.
| | | | |
| | | Capital Statement 2004-05 | | 7 |
FUNDING THE STATE CAPITAL PROGRAM
Table 1.2 below outlines the major sources of funding for the State capital program.
The State capital program is primarily funded through recurrent sources. After allowing for the reinvestment of earnings on the State’s superannuation investments, free cash flow of approximately $3.5 billion is expected to be available for investment in capital in 2004-05.
The Government’s Charter of Social and Fiscal Responsibility recognises the legitimate role of borrowings in funding additions to the capital stock to support Queensland’s growth.
Despite estimated capital outlays of over $5 billion in 2003-04, the strong Budget position and a high level of recurrent cash flow have allowed for a net reduction in borrowing. This has further improved the State’s strong balance sheet position and provided scope for further enhancements to the capital program in 2004-05 and beyond.
Some $1.4 billion in borrowings are scheduled for 2004-05. These borrowings will mainly be undertaken by Government-owned corporations.
Table 1.2
Sources of Funding for Capital1
| | | | | |
| | | 2003-04 Est. Actual
| | | 2004-05 Budget
|
| | | $ million | | | $ million |
Total Capital Expenditure | | 5,091 | | | 6,049 |
Less Capital Grants (Funded from Operating Revenue) | | 514 | | | 546 |
Net State Capital Funding Task | | 4,577 | | | 5,503 |
Funding Sources | | | | | |
Cash Flows from Operating Activities | | 5,864 | | | 5,027 |
Less Reinvestments2 | | 1,873 | | | 1,557 |
Equals Net Cash Flow for Capital Acquisitions | | 3,991 | | | 3,470 |
Asset Sales | | 7753 | | | 335 |
Borrowings | | (468 | ) | | 1,432 |
Cash Balances and Other Financing Sources | | 279 | | | 266 |
Total Funding Sources | | 4,577 | | | 5,503 |
Notes:
| 1. | Numbers may not add due to rounding. |
| 2. | Primarily reflects reinvestment of General Government investment earnings relating to accruing entitlements. |
| 3. | Primarily reflects the partial sale of an interest in Tarong North Power Station, originally planned for 2002-03. |
The remaining chapters of this Budget Paper provide further details of State Government capital outlays. Chapter 2 outlines the Government’s approach to planning and delivery of infrastructure. Chapter 3 provides an update on the role of the private sector in providing public infrastructure in Queensland. Chapter 4 lists capital outlays on a project basis by entity.
| | | | |
| 8 | | Capital Statement 2004-05 | | |
Table 1.3
Total Capital Outlays by Entity within Statistical Division for 2004-051,2
| | | | | | | | | | | | | | | | | | | | | | | | | |
Northern Entity
| | 05 Brisbane
| | 10
Moreton
| | 15 W/Bay
| | 20 D/Downs
| | 25 S/West
| | 30 Fitzroy
| | 35 C/West
| | 40
Mackay
| | 45 Northern
| | 50 F/North
| | 55 N/West
| | Totals
| |
| | | $’000 | | $’000 | | $’000 | | $’000 | | $’000 | | $’000 | | $’000 | | $’000 | | $’000 | | $’000 | | $’000 | | $’000 | |
Aboriginal and Torres Strait Islander Policy | | | | | | | | | | | | 703 | | | | | | 2,543 | | 1,454 | | 611 | | 5,311 | |
Child Safety | | 16,037 | | 7,167 | | 2,262 | | 1,995 | | 249 | | 1,714 | | 116 | | 1,310 | | 1,827 | | 2,139 | | 313 | | 35,130 | |
Communities | | 5,012 | | 2,240 | | 707 | | 624 | | 78 | | 536 | | 36 | | 410 | | 571 | | 669 | | 98 | | 10,979 | |
Corrective Services | | 6,547 | | 4,876 | | 845 | | 745 | | 93 | | 4,501 | | 43 | | 489 | | 682 | | 799 | | 117 | | 19,737 | |
Disability Services Queensland | | 22,589 | | 4,381 | | 1,333 | | 1,079 | | 97 | | 1,411 | | 45 | | 511 | | 1,887 | | 835 | | 122 | | 34,291 | |
Education and the Arts Portfolio | | | | | | | | | | | | | | | | | | | | | | | | | |
Education | | 180,193 | | 85,505 | | 23,239 | | 20,762 | | 2,376 | | 21,734 | | 1,984 | | 12,593 | | 16,444 | | 21,524 | | 3,948 | | 390,303 | |
Arts | | 111,194 | | 507 | | 160 | | 141 | | 18 | | 121 | | 8 | | 93 | | 334 | | 901 | | 22 | | 113,501 | |
Emergency Services | | 39,145 | | 11,207 | | 3,080 | | 3,042 | | 640 | | 3,684 | | 158 | | 1,784 | | 6,037 | | 6,617 | | 726 | | 76,117 | |
Employment and Training | | 22,462 | | 13,486 | | 2,152 | | 15,969 | | 550 | | 2,529 | | 242 | | 6 | | 1,773 | | 1,976 | | 332 | | 61,477 | |
Environmental Protection Agency | | 6,131 | | 4,604 | | 1,502 | | 707 | | 88 | | 1,407 | | 41 | | 1,337 | | 1,147 | | 8,067 | | 111 | | 25,143 | |
Health | | 199,037 | | 48,024 | | 30,507 | | 18,525 | | 8,494 | | 16,201 | | 662 | | 8,683 | | 44,195 | | 28,785 | | 3,285 | | 406,398 | |
Housing | | 161,697 | | 39,827 | | 16,296 | | 12,622 | | 2,685 | | 16,402 | | 1,084 | | 11,256 | | 29,425 | | 61,222 | | 13,459 | | 365,974 | |
Justice and Attorney-General | | 54,073 | | 7,134 | | 2,233 | | 470 | | 59 | | 404 | | 27 | | 2,382 | | 663 | | 3,287 | | 74 | | 70,806 | |
Legislative Assembly of Queensland | | 2,660 | | | | | | | | | | | | | | | | | | | | | | 2,660 | |
Local Government, Planning, Sport and Recreation | | 72,079 | | 29,187 | | 17,414 | | 9,728 | | 2,261 | | 12,343 | | 9,225 | | 15,717 | | 13,565 | | 41,633 | | 4,554 | | 277,708 | |
Main Roads | | 260,578 | | 222,659 | | 44,239 | | 34,153 | | 18,019 | | 39,932 | | 11,677 | | 29,780 | | 45,749 | | 61,769 | | 43,894 | | 812,448 | |
Natural Resources, Mines and Energy Portfolio | | | | | | | | | | | | | | | | | | | | | | | | | |
Natural Resources, Mines and Energy | | 28,594 | | 27,847 | | 29,635 | | 1,553 | | 1,119 | | 7,206 | | 659 | | 1,214 | | 17,890 | | 2,255 | | 8,413 | | 126,384 | |
Government Owned Electricity Corporations | | 468,941 | | 255,685 | | 136,704 | | 257,729 | | 26,892 | | 152,909 | | 27,482 | | 57,205 | | 119,222 | | 121,664 | | 36,977 | | 1,661,410 | |
Police | | 51,799 | | 17,882 | | 4,221 | | 6,523 | | 465 | | 3,199 | | 216 | | 5,289 | | 5,409 | | 5,188 | | 1,413 | | 101,605 | |
Premier and Cabinet | | 16,172 | | 204 | | 64 | | 57 | | 7 | | 49 | | 3 | | 37 | | 52 | | 61 | | 9 | | 16,715 | |
Primary Industries and Fisheries | | 17,560 | | 5,926 | | 1,839 | | 1,622 | | 203 | | 2,461 | | 94 | | 1,065 | | 1,485 | | 1,739 | | 254 | | 34,248 | |
Public Works | | 112,690 | | 37,271 | | 12,366 | | 10,377 | | 1,297 | | 9,716 | | 603 | | 11,115 | | 9,500 | | 19,626 | | 1,626 | | 226,188 | |
State Development and Innovation | | 49,047 | | 29,779 | | 118,187 | | 2,347 | | 12 | | 37,727 | | 6 | | 414 | | 4,089 | | 4,609 | | 15 | | 246,233 | |
Tourism, Fair Trading and Wine Industry Development | | 10,146 | | 292 | | 92 | | 81 | | 10 | | 70 | | 5 | | 53 | | 75 | | 87 | | 13 | | 10,925 | |
Transport Portfolio | | | | | | | | | | | | | | | | | | | | | | | | | |
Queensland Transport | | 94,626 | | 12,086 | | 2,452 | | 1,942 | | 243 | | 1,794 | | 113 | | 1,575 | | 1,778 | | 2,897 | | 304 | | 119,810 | |
Port Authorities | | 140,272 | | | | 667 | | | | | | 102,276 | | | | 15,875 | | 9,730 | | 82,316 | | 6 | | 351,142 | |
Queensland Rail | | 249,985 | | 46,124 | | 27,778 | | 11,993 | | 6,472 | | 205,204 | | 697 | | 36,036 | | 22,973 | | 12,859 | | 1,879 | | 622,000 | |
Treasury | | 71,794 | | | | | | | | | | | | | | | | | | | | | | 71,794 | |
Other3 | | 2,082 | | 150 | | 47 | | 42 | | 5 | | 36 | | 2 | | 27 | | 38 | | 45 | | 7 | | 2,480 | |
Anticipated Capital Contingency Reserve | | | | | | | | | | | | | | | | | | | | | | | | (200,000 | ) |
Funds Allocated4 | | 2,473,140 | | 914,050 | | 480,023 | | 414,829 | | 72,434 | | 646,268 | | 55,229 | | 216,257 | | 359,083 | | 495,024 | | 122,581 | | 6,048,917 | |
Notes:
| 1. | Includes associated statutory bodies. Capital works outside of Queensland are not included in the 2004-05 capital program. |
| 2. | Capital works projects are shown on a GST exclusive basis, except where an agency is unable to recover some GST input tax credits, for example the Department of Housing (Australian Accounting Research Foundation). |
| 3. | Includes Department of Industrial Relations, Queensland Audit Office, Electoral Commission of Queensland, Office of the Governor, Office of the Public Service Commissioner, and Offices of the Ombudsman and Information Commissioner. |
| 4. | Numbers may not add due to rounding. Where an entity does not have capital expenditure in a particular statistical division, no dollar figures are shown in the table. |
| | | | |
| | | Capital Statement 2004-05 | | 9 |
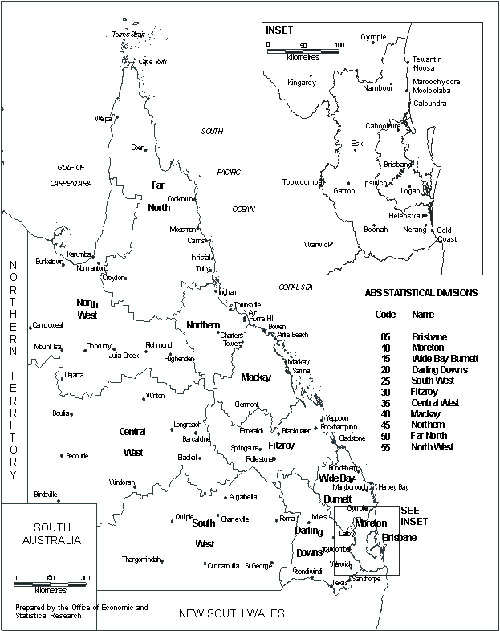
| | | | |
| 10 | | Capital Statement 2004-05 | | |
KEY CONCEPTS, SCOPE AND COVERAGE
Capital Contingency
Consistent with the approach adopted in previous years, a capital contingency reserve has been included. This reserve recognises that while departments budget to fully utilise their capital works allocation, circumstances such as poor weather or production delays may prevent full utilisation. On a whole-of-Government basis, there is likely to be underspending, resulting in a carryover of capital allocations.
Coverage
Under accrual output budgeting, capital is the stock of assets including property, plant and equipment, intangible assets and inventories that an agency owns and/or controls and uses in the delivery of services, as well as capital grants made to other entities. For the purpose of this Budget Paper, capital outlays refer to the gross acquisition of these assets. The following definitions are applicable throughout this document:
| | • | total capital outlays – property, plant and equipment outlays, other capital expenditure and capital grants |
| | • | property, plant and equipment outlays – property, plant and equipment outlays as per the financial statements excluding asset sales, depreciation and revaluations |
| | • | other capital expenditure – intangibles, inventories, and self-generating and regenerating assets |
| | • | capital grants – capital grants to other entities (excluding grants to other Government departments, statutory bodies and individuals under the First Home Owners Grant scheme). |
Capital outlays include information for all bodies defined as reporting entities for the purpose of whole-of-Government financial reporting requirements, excluding Public Financial Corporations. Projects without a recorded total estimated cost are ongoing. The entities included in scope for the Capital Statement are listed in Appendix A.
Capital Works and the GST
Abstract 31, issued by the Australian Accounting Research Foundation, deals with accounting for the Goods and Services Tax (GST). This Abstract states that in relation to acquisitions of assets, any recoverable GST (in the form of GST input tax credits) would not be included in the cost of acquiring an asset. On this basis, capital works projects are shown on a GST exclusive basis, that is, net of any recoverable GST input tax credits. The exception to this is where an agency is unable to recover some GST input tax credits because of their GST status– for example the Department of Housing.
| | | | |
| | | Capital Statement 2004-05 | | 11 |
| 2. | STATE CAPITAL PROGRAM – PLANNING AND PRIORITIES |
INTRODUCTION
The Queensland Government is committed to creating the infrastructure necessary to support the economic and social development of the State. It does so:
| | • | by providing infrastructure in support of core service delivery priorities – General Government sector investment |
| | • | through investments made by Government-owned corporations – Public Non-Financial Corporations sector investment |
| | • | where appropriate, by fostering private sector investment. |
This Chapter outlines key capital planning and expenditure priorities for the General Government sector and Public Non-Financial Corporations sector.
Further details on the current status of projects with private sector involvement are provided in Chapter 3 of this Budget Paper.
GENERAL GOVERNMENT SECTOR CAPITAL PLANNING AND PRIORITIES
General Government sector capital investment decisions are driven by the policy priorities of Government and factors such as demographic changes and planning requirements which affect service delivery needs.
The Charter of Social and Fiscal Responsibility outlines the Government’s key policy priorities, as follows:
| | • | Growing a diverse economy and creating jobs |
| | • | Realising the Smart State through education, skills and innovation |
| | • | Managing urban growth and building Queensland’s regions |
| | • | Improving health care and strengthening services to the community |
| | • | Protecting our children and enhancing community safety |
| | • | Protecting the environment for a sustainable future. |
Details of recent capital enhancements supporting these priorities can be found in Budget Paper No. 2 – Budget Strategy and Outlook.
| | | | |
| 12 | | Capital Statement 2004-05 | | |
The Government has several mechanisms available to it to deliver the capital needed to support these priorities. These include funding and constructing its own infrastructure, and providing capital grants to local government, the private sector and profit and not-for-profit organisations to build capital and provide services on behalf of the Government. Government also examines private sector involvement in public sector infrastructure delivery either through joint ventures or stand-alone projects.
Determining which of these mechanisms represents the best value for money outcome for taxpayers forms part of the planning phase of infrastructure investment and is closely scrutinised by the Government.
In the face of a rapidly growing population, the ability of Government to continue to deliver services is critically linked to its asset base. This requires careful planning of infrastructure to ensure that the right assets are being constructed in the appropriate places.
At an agency level, many areas of Government have well developed planning and management strategies to support specific service delivery priorities. These plans are largely based on projections of agency-specific demand based factors.
However, a more coordinated whole-of-Government approach is required in order to meet the capital challenges facing Queensland. A major focus of the Government for the future is the improvement of the planning, management and delivery of infrastructure across Government.
A key initiative is the establishment of the Office of Urban Management (OUM). The OUM, reporting to the Deputy Premier, Treasurer and Minister for Sport, will work in collaboration with Government agencies, local governments and other stakeholders to manage urban growth and infrastructure in south east Queensland – the fastest growing region in Australia.
The OUM has as its primary role the finalisation of the SEQ 2021 Regional Plan by April 2005 and the implementation of that plan through local councils and State Government agencies.
The OUM will have the operational and legislative power to implement a comprehensive, workable plan. The SEQ 2021 Regional Plan will have statutory recognition, ensuring all local government planning schemes comply with the Regional Plan. The legislative status of the Plan will also ensure that all other State Government plans are consistent with, and subservient to, the strategic objectives stipulated in the Regional Plan. The legislative status of the Regional Plan will be supported by strong administrative linkages between the OUM and Queensland Treasury.
Further support for delivering outcomes from the SEQ 2021 Regional Plan will be provided from a whole-of-Government approach to managing the State Government’s significant land assets. This strategic approach to asset management will ensure that decisions regarding the sale, purchase and consolidation of land assets are not made in isolation of other agencies or in isolation to the broader Government objectives and priorities encapsulated within the SEQ 2021 Regional Plan.
| | | | |
| | | Capital Statement 2004-05 | | 13 |
2004-05 HIGHLIGHTS
While capital investment decisions in the General Government sector are driven by service delivery needs, prudent management of the State’s finances also requires that the level of investment have due consideration to the availability of funding.
The Government has undertaken a number of major capital programs and investments over recent times. The most recent of these is the $1.4 billion Smart State Building Fund, which was announced in late 2003.
Funding for the Smart State Building Fund became available as a result of the strong cash position of the Government over recent years. A list of Smart State Building Fund allocations by portfolio is outlined in the appendix to this chapter (Appendix 2.1). Further details of the projects being delivered through the Fund are contained in the portfolio specific sections of this Budget Paper, and are indicated by an asterisk (*).
Some of the key 2004-05 General Government sector capital highlights are outlined below.
Transport Infrastructure
The Government is working to ensure the State has the appropriate transport infrastructure and public transport services to accommodate the demand from its rapidly growing population. The pressures of the growing population on the State’s transport system are pronounced in south east Queensland where the State’s population is becoming increasingly concentrated.
Funding for the State’s roads program has been significantly increased. The Smart State Building Fund provided an extra $186.3 million for capital projects over three years from 2004-05. An additional $301 million was committed in the 2004 election for road infrastructure.
In the 2004-05 Budget, additional funding of $19.8 million is provided as part of a new four-year $571 million Arterial Roads Infrastructure Package. This funding package will be used to accelerate key roads capital projects. Projects to be accelerated using funding under the package, as well as funding of $168.8 million from existing road sources, include construction of Stages 2 and 3 of the Caboolture Northern Bypass; a new two-lane link between Caloundra and Mooloolaba; four-laning works on the Sunshine Motorway between Maroochydore Road and Pacific Paradise (including duplication of the Maroochy River Bridge); extension of four-laning of the Mt Lindesay Highway to Rosia Road; four-laning of the Gold Coast Highway between Robert and Stevens Streets; and four-laning of the Nerang-Broadbeach Road from Allambe Cemetery to Ross Street.
On current projections, passenger rail services (Citytrain) in south east Queensland will require the capacity to carry an additional 13 million passengers a year by 2011. In 2004-05, $72.8 million will fund improved intermodal facilities, disabled access, infrastructure and rollingstock upgrades. By 2007-08, over $900 million will be spent on increasing the capacity of Citytrain, largely implementing MetTrip Stage 1 and Stage 2.
| | | | |
| 14 | | Capital Statement 2004-05 | | |
The Government will also continue its investment in the Busway network. In 2004-05, $27 million will be allocated toward initial works on Section 1 of the Inner Northern Busway (a tunnel linking the Queen Street Bus Station and Roma Street) and bus infrastructure. This forms part of a $200 million, four-year program of bus infrastructure initiatives.
Education and Training
Education continues to be a key priority of capital investment for Government, with capital outlays of $390.3 million in 2004-05. Priority projects cover a range of educational infrastructure including a new school in the Narangba area, land purchases, significant staged works at nine schools and additional classrooms in growth areas.
In 2004-05, the Government has allocated $29.4 million to commence construction work in readiness for the introduction of the Prep Year in 2007. In addition, the Government will provide $118.3 million of enhanced learning facilities at existing schools, including additional and replacement toilet facilities. The Cooler Schools program will continue to be a focus for Government, with $17.5 million allocated to the program in 2004-05.
In 2004-05, $8 million in new capital funding ($25 million over three years) will be invested for the construction of a new Gold Coast Institute of TAFE campus of Coomera. This reflects the Government’s commitments to providing Queenslanders with better access to TAFE training facilities. A total of $53.7 million will be invested in 2004-05 for capital acquisitions in the Department of Employment and Training.
Arts
As part of the Government’s commitment to the five-year redevelopment of the Queensland Cultural Centre and associated projects, approximately $100 million is allocated in 2004-05 for commencement of major construction as part of the Millennium Arts project.
Health
The Health portfolio’s capital program is $406.4 million in 2004-05, compared to estimated actual expenditure of $276.7 million in 2003-04. Queensland Health’s capital works program is prioritised towards meeting the demands of an integrated health care system with an increasing focus on promotion and prevention.
The focus for the capital works program for 2004-05 includes the redevelopment of the Prince Charles Hospital emergency department and provision of general hospital services, emergency department upgrades at Gympie, Redcliffe, Redland, Robina and Logan Hospitals. In addition, the Government is providing $1 million for scoping of the Mater Hospital Reconstruction project. Funding for the Mater redevelopment will see the Government allocating $1 million in 2004-05 rising to $9.5 million per annum to service the $88 million public component of the Mater’s loan repayments on the $135 million redevelopment.
As part of the Smart State Building Fund, Queensland Health will also be directing capital funding towards the integration of community and hospital based health services to further improve patient care and reduce pressure on the hospital system.
| | | | |
| | | Capital Statement 2004-05 | | 15 |
Housing
The Department of Housing is responsible for constructing, maintaining and upgrading one of the State’s largest assets, the housing portfolio, which provides assistance to approximately 70,000 Queensland households. In 2004-05 the department will spend $366 million on capital.
A number of factors are influencing a gradual realignment of the portfolio. These include a growing and increasingly younger Indigenous population; increases in the number of single-parent families; an aging general population; a general contraction in household size; and a loss of affordable private housing for low income households.
In order to supplement traditional capital responses, the department is increasingly looking to innovative options to provide capacity through partnership arrangements such as those with the Brisbane Housing Company and Kelvin Grove Urban Village.
The 2004-05 Budget provides for an additional $30 million over three years to improve the supply of affordable housing through partnerships with non-government organisations.
Child Safety
The Government has allocated $44.4 million over three years to the Department of Child Safety, of which $22.1 million will be invested in 2004-05 in a new Integrated Client Management Information System (ICMS). The ICMS will be a critical component for the long-term reforms in the new department by providing improved and more accessible information on children in care.
PUBLIC NON-FINANCIAL CORPORATIONS SECTOR CAPITAL PLANNING AND PRIORITIES
The Public Non-Financial Corporations sector is vital to the future development of Queensland. Importantly, a major part of the Queensland Government’s capital program is undertaken through Government-owned corporations (GOCs).
While the capital program undertaken across the GOC sector contributes significantly towards meeting the Government’s priorities for Queensland, the process in which this capital program is developed and funded is different from the General Government sector. GOCs operate as commercial business entities, generally within competitive markets, and as such progress their capital programs on the basis of needs identified within the market sectors they service. Each GOC develops its capital program through its own board. Major projects are directly authorised by a GOC’s shareholding Ministers.
There are a number of ways in which the GOC capital expenditure program can be funded. These options include utilising cash flow from their business, borrowings, and, in certain situations, requesting a dividend reinvestment or equity injection from shareholding Ministers. The method of financing will differ according to the individual circumstances of the relevant GOC, and the specific nature of the project in question. The Queensland Government is committed to ensuring that GOCs are at all times able to fund viable projects while at the same time retaining a sound financial position. This ensures that all GOCs remain sufficiently well capitalised to enable an investment grade credit rating as determined by credit ratings agencies.
| | | | |
| 16 | | Capital Statement 2004-05 | | |
Energy
Reliable, inexpensive electricity is fundamental to Queensland – both for the international competitiveness of Queensland industries – and to support population growth as record numbers of people choose Queensland as their home. Over the next five years, Queensland’s consumption of electricity is forecast to significantly increase, particularly in the summer peaks. This will place considerable pressure on existing infrastructure and highlights the need for Queensland to increase its level of generating capacity and strengthen its transmission and distribution networks to improve the efficiency of the delivery of electricity to the community and industry.
To maintain the supply of reliable, low cost electricity to Queensland, the energy GOCs will be spending approximately $1.7 billion in 2004-05 on energy infrastructure throughout Queensland. While a large component of this capital program is directed to the electricity industry’s traditional generation, transmission and distribution assets, the growing environmental awareness of the energy GOCs means they are also keenly pursuing capital projects which increase the amount of green energy available in the national electricity market.
Key electricity generation highlights of the 2004-05 capital program include:
| | • | Kogan Creek Power Project – CS Energy is forecasting capital expenditure of $219.4 million which includes commencement of the construction of the Kogan Creek Power Project. The new generation power plant to be built at Kogan Creek, near Chinchilla, will be the most efficient, low cost black coal fired power station in Australia and will be able to deliver 750 megawatts of electricity or 7% of Queensland’s electricity demand, once it comes on line in the summer of 2007-08. |
| | • | Townsville Power Station Gas Pipeline – $33.1 million will be spent by Enertrade to manage the project to provide the first gas-fired base load power station in north Queensland supplying to the National Electricity Grid. Enertrade’s project in north Queensland is converting the existing Townsville Power Station at Yabulu to combined-cycle operation using natural gas as its fuel. This project will ensure north Queensland has a secure and reliable source of energy in close proximity to its major users, with the first gas being delivered to Townsville in September 2004 and full completion of all works by February 2005. |
| | • | Isis Central Sugar Mill Co-generation Project – $6 million will be spent by Ergon Energy in 2004-05 as part of a $23 million project to install a condensing steam turbine at the Isis Central Sugar Mill in Childers, increasing its onsite generation from six Megawatts to 25 Megawatts. In return for underwriting the generation asset, Ergon Energy will have access to the physical electricity produced by the plant as well as the Renewable Energy Certificates. |
The continued investment in Queensland’s transmission and distribution networks is essential to the delivery of a reliable service to Queensland’s electricity consumers. In the 2004-05 year, $1.2 billion will be expended by Queensland transmission and distribution entities. The primary aim of the increased expenditure on the State’s electricity networks is to maintain system performance and reliability in the face of continued strong growth in demand. Key projects include:
| | • | Darling Downs Transmission Reinforcement – $57 million will be spent by Powerlink Queensland to augment the transmission system to the Darling Downs region. |
| | | | |
| | | Capital Statement 2004-05 | | 17 |
| | • | Brisbane Central Business District Upgrade – $48.5 million will be spent by ENERGEX and Powerlink Queensland on the Brisbane City CBD project to strengthen the distribution and transmission system to the Brisbane CBD. |
| | • | Gold Coast Network Reinforcement – $7.6 million will be spent by ENERGEX and Powerlink Queensland to reinforce the distribution and transmission system supplying the Gold Coast area. |
Rail and Ports
In the last 10 years the nature of the transport industry has fundamentally changed with the introduction of competitive reforms and the emergence of a nationally integrated transport market which combines all transport modes (road, rail and ports) to ensure optimal linkages so goods may be moved in a coordinated and timely manner. An efficient integrated transport process maximises the efficiency of the flow of goods, increases returns to the State and makes our importers and exporters more competitive in an increasingly competitive world market. The Government-owned corporations (GOCs) perform a vital role in ensuring an efficient transportation chain underpins industry development.
The coal industry in particular is of critical importance to the Queensland economy, as it is one of the State’s largest industries by value. In 2002-03, the estimated value of production of saleable coal in Queensland was approximately $9.3 billion, or roughly 7% as a proportion of Queensland’s Gross State Product for that year. Furthermore, the value of Queensland’s coal exports totalled approximately $6.7 billion in 2002-03, or around 31% of the value of Queensland’s total merchandise exports.
Over the next five years, demand for Queensland’s coal is forecast to significantly rise with Chinese, South-East Asian (including India), Japanese and Brazilian markets growing strongly. The ability of Queensland’s coal industry to respond to the positive economic climate will hinge on the integrated network of transport services provided by the GOCs.
Key rail and port highlights of the 2004-05 capital program include:
| | • | Coal Network Upgrades – $227.9 million will be spent by Queensland Rail maintaining and upgrading track infrastructure on the coal network. This includes commencement of the construction of a new 110 kilometre spur line and upgrades to the existing Blackwater system as part of Queensland Rail’s commitment to the Xstrata Rolleston Coal project. |
| | • | Expansion of the RG Tanna Coal Terminal – $58.8 million will be spent by Gladstone Port Authority as part of its project to expand the RG Tanna coal terminal. Once completed, this expansion will increase the terminal’s coal throughput from 40 million tonnes per annum to 54 million tonnes per annum. The total cost of the expansion is forecast to be $167 million over three years. |
| | • | Gladstone Port Authority – $43.4 million will be spent by the Gladstone Port Authority on the development of port infrastructure, reclamation earthworks and port access roads to achieve greater future efficiencies for the Port. |
| | | | |
| 18 | | Capital Statement 2004-05 | | |
| | • | Future Expansion of Port of Brisbane Corporation – $34 million will be spent by the Port of Brisbane Corporation as part of the Future Port Expansion Project. This project involves the construction of a seawall and reclamation by the Port of Brisbane Corporation for the expansion of the Fisherman Islands land area. The project will achieve even greater future efficiencies for the Port, as well as improved asset usage, increased logistics, and greater future throughput. |
| | • | Baggage Check Screen Facility at Cairns Airport – $34.3 million will be spent by the Cairns Port Authority on the construction of a new baggage facility; the implementation of a 100% checked bag screening; and the installation of other security equipment at the Cairns airport. As a major Queensland tourism destination (both for international and domestic visitors), the safety and security of the many tourists to the Cairns and northern Queensland region is paramount. |
| | | | |
| | | Capital Statement 2004-05 | | 19 |
APPENDIX 2.1
SMART STATE BUILDING FUND ALLOCATIONS BY PORTFOLIO
| | | | |
Smart State Building Fund1 |
| | | | | | |
Department
| | 2004-05
| | 2005-06
| | 2006-07
|
| | | $ million | | $ million | | $ million |
Aboriginal and Torres Strait Islander Policy | | 3.2 | | — | | — |
Disability Services Queensland | | 5.0 | | 5.0 | | 5.0 |
Department of Education and the Arts | | 50.8 | | 137.3 | | 163.0 |
Environmental Protection Agency | | 4.0 | | 7.0 | | 4.0 |
Emergency Services | | 1.1 | | 6.9 | | 2.0 |
Employment and Training | | 8.0 | | 8.3 | | 8.8 |
Health | | 29.2 | | 79.4 | | 91.4 |
Housing | | 8.0 | | 10.8 | | 11.2 |
Justice and Attorney-General | | 2.5 | | 4.5 | | 4.0 |
Main Roads | | 26.8 | | 77.0 | | 82.5 |
Natural Resources, Mines and Energy | | 5.5 | | 4.3 | | 2.4 |
Police | | 7.0 | | 10.0 | | 13.0 |
Primary Industries and Fisheries | | 1.2 | | 3.8 | | — |
Public Works2 | | 3.3 | | 1.1 | | 8.1 |
State Development and Innovation3 | | 20.0 | | — | | — |
Transport | | 23.7 | | 22.9 | | 17.2 |
Sub-Total Departments | | 199.1 | | 378.2 | | 412.5 |
Queensland Rail | | 35.7 | | 137.8 | | 226.5 |
Total | | 234.8 | | 516.0 | | 639.0 |
Notes:
| 1. | Numbers may not add due to rounding. |
| 2. | $0.8 million of funding for Anzac Square was subsequently reallocated as recurrent funding. |
| 3. | $9 million of funding for the Gold Coast Convention Centre was moved from 2004-05 to 2003-04 to better meet the cash flow requirements of the project. |
| | | | |
| 20 | | Capital Statement 2004-05 | | |
| 3. | PRIVATE SECTOR CONTRIBUTION TO THE DELIVERY OF PUBLIC INFRASTRUCTURE |
QUEENSLAND’S PUBLIC PRIVATE PARTNERSHIP POLICY AND VALUE FOR MONEY FRAMEWORK
The Queensland Government launched its Public Private Partnership (PPP) Policy – Achieving Value for Money in Public Infrastructure and Service Delivery – in September 2001, and supporting guidance material in August 2002.
Queensland’s PPP Policy and Value for Money Framework are consistent with similar initiatives being pursued nationally and internationally. The Government’s aim in pursuing these initiatives is to achieve better value for money on a whole-of-project-life-basis, in the provision of public infrastructure and related non-core services. The Value for Money Framework measures traditional delivery against PPP delivery to determine the most optimal delivery method.
The Government believes that greater private sector participation in the provision of public infrastructure can assist the timely delivery of efficient and effective infrastructure to the Queensland community. However, the Queensland Government recognises this can introduce new risks, and as a result, there is a need for careful analysis and management before any commitment is made to private sector involvement in the delivery of a project.
POTENTIAL PUBLIC PRIVATE PARTNERSHIP PROJECTS
The Queensland Government is analysing several potential PPP projects to address a range of infrastructure needs. These projects are at various stages of the Value for Money Framework (preliminary assessment, PPP business case development, expression of interest, to binding bid stage).
Currently there are six major infrastructure projects at the preliminary assessment stage spanning transport infrastructure, building expansion, information and communication technology, port facilities and water supply. It is expected that a number of the preliminary assessments will be completed by the end of 2004.
In addition, eight major infrastructure projects which could involve capital investments of approximately $2.7 billion, have progressed beyond the preliminary assessment stage. These projects are outlined below.
Gateway Upgrade Project
The Department of Main Roads is coordinating the development of a PPP business case for the construction of a new river crossing and an upgrade of the Gateway Motorway. Market sounding has been conducted to identify the potential interest from the private sector in the delivery of the project.
| | | | |
| | | Capital Statement 2004-05 | | 21 |
New Queensland Driver Licence
Queensland Transport is developing a PPP business case for a new Queensland driver licence featuring smartcard technology. The business case is also investigating the potential for commercial applications to deliver value for money for the Government.
Smart Classrooms
Education Queensland is currently preparing a PPP business case to evaluate the best value for money procurement options for delivering ICT learning environments in Queensland state schools.
Townsville Ocean Terminal
The Department of State Development and Innovation is undertaking a PPP business case investigating potential value for money delivery options for the establishment of a cruise and military vessel facility in Townsville.
The projects described above are currently in the PPP business case development stage. It should be noted that the Government has not committed to these projects proceeding, nor has it identified any preferred delivery options (this would only be considered after completion of the PPP Business Case).
Southbank Education and Training Precinct
The Southbank Education and Training Precinct will be Queensland’s first large-scale multi-sectoral campus and will incorporate the redevelopment of the Southbank Institute of Technical and Further Education and elements of Brisbane State High School.
The private sector has submitted binding bids for the design, construction, financing, operation (of non-core activities) and maintenance of the facilities required for the precinct. Core service delivery, such as teaching and curriculum, will remain the responsibility of the State. These bids are currently being evaluated to determine whether delivery via a PPP will provide the best value for money outcome.
If the Queensland Government decides to proceed with the project as a PPP, it is expected that project agreements with the successful private sector proponent will be executed by late 2004.
In addition to the above State projects, the Queensland Government is assisting local governments to undertake business case and expressions of interest stage analysis for infrastructure projects in Brisbane, Toowoomba and Townsville.
| | | | |
| 22 | | Capital Statement 2004-05 | | |
OTHER PROJECTS INVOLVING THE PRIVATE SECTOR
The Queensland Government is progressing several other major infrastructure projects with private sector involvement in addition to those within the PPP Framework. The projects include road, rail and port infrastructure and entertainment, innovation and sporting facilities worth some $800 million.
Gold Coast Convention and Exhibition Centre
The $127 million Gold Coast Convention and Exhibition Centre is due to be officially opened on June 29, 2004. Situated on the Gold Coast Highway at Broadbeach, the centre will be managed by Jupiters Limited (a subsidiary of Tabcorp) under agreements with the State as the owner. The centre will be capable of hosting conventions for up to 2,000 delegates, or up to 6,000 patrons in a combination of seating arrangements for various sport, concert and other entertainment events or for large convention plenary sessions. The private sector has been innovative in design and operational philosophies for the centre and the State expects to receive significant benefits from these innovations.
Brisbane Cruise Terminal
The Brisbane Cruise Terminal project is an integrated cruise terminal, retail and residential development on the Brisbane River at Hamilton, with an estimated value of $236 million, and is currently in the planning approvals stage of development. The Multiplex group of companies has been appointed as the developer of the project, and the construction will take place on land presently owned by the Queensland Government.
The cruise terminal and wharf are expected to be operational by the end of 2005 and a Multiplex subsidiary will be required to operate those components for a 15-year period under an agreement with the State. In return, the Queensland Government will be responsible for keeping the main shipping channel serviceable for cruise shipping.
The terminal is designed to cater for the largest cruise ship that can cruise under the Gateway Bridge and make its way up the Brisbane River to Hamilton. These ships typically carry up to 1,850 passengers and 830 crew members. In addition to transit stops, the cruise terminal will also be capable of accommodating base porting operations, which the Queensland Government is keen to see established in Brisbane.
Tennyson Riverside Development
The Queensland Government is progressing the Tennyson Riverside Development project through a competitive bid process, which calls for proposals from the private sector for the development of an international-standard State tennis centre and associated development on prime riverfront land in Brisbane.
In making the site available for the project, the Government recognises the Tennyson Riverside development represents a unique opportunity for the private sector to deliver an outstanding landmark project for both the Brisbane River and for tennis in Queensland.
| | | | |
| | | Capital Statement 2004-05 | | 23 |
| 4. | CAPITAL OUTLAYS BY ENTITY |
ABORIGINAL AND TORRES STRAIT ISLANDER POLICY
The department’s capital expenditure program for 2004-05 is $5.3 million and principally comprises projects approved under the Smart State Building Fund, including the refurbishment of a number of departmental facilities.
Investment in this infrastructure forms a vital part in delivering a key departmental output of Community Development.
(Note: From 1 July 2004, responsibility for capital grants associated with the upgrading of infrastructure within Queensland’s Indigenous communities will be transferred to the Department of Local Government, Planning, Sport and Recreation. Accordingly, information on these capital grant programs is outlined in the section dealing with that agency.)
PROGRAM HIGHLIGHTS
| | • | $3.2 million provided under the Smart State Building Fund will upgrade accommodation facilities throughout the State including the Aitkenvale Hostel in Townsville, Retail Store houses on a number of communities, Diversion from Custody Centres in Rockhampton, Townsville and Mt Isa and the improvement of facilities at Happy Valley, Townsville. |
| | • | $0.8 million in capital grants will be provided for fuel outlets at five Torres Strait Islander communities. |
| | • | A further $1.3 million is provided for capital acquisitions and minor upgrades for the department. |
| | | | |
| 24 | | Capital Statement 2004-05 | | |
Aboriginal and Torres Strait Islander Policy
| | | | | | | | | | |
Project
| | Statistical
Division
| | Total
Estimated
Cost
| | Expenditure
to 30-06-04
| | Budget 2004-05
| | Post 2004-05
|
| | | | | $’000 | | $’000 | | $’000 | | $’000 |
DEPARTMENT OF ABORIGINAL AND TORRES STRAIT ISLANDER POLICY | | | | | | | | | | |
Property, Plant and Equipment | | | | | | | | | | |
Refurbishment of the Aitkenvale Hostel* | | 45 | | 1,500 | | | | 1,500 | | |
Refurbishment of Retail Store Houses* | | | | | | | | | | |
Woorabinda | | 30 | | 50 | | | | 50 | | |
Lockhart River | | 50 | | 250 | | | | 250 | | |
Pormpuraaw | | 50 | | 250 | | | | 250 | | |
Kowanyama | | 50 | | 100 | | | | 100 | | |
Bamaga | | 50 | | 100 | | | | 100 | | |
Doomadgee | | 55 | | 250 | | | | 250 | | |
Refurbishment of Diversionary from Custody Centres* | | | | | | | | | | |
Rockhampton | | 30 | | 50 | | | | 50 | | |
Townsville | | 45 | | 150 | | | | 150 | | |
Mt Isa | | 55 | | 250 | | | | 250 | | |
Improve facilities at Happy Valley, Townsville* | | 45 | | 500 | | 250 | | 250 | | |
Plant and equipment replacement | | Various | | | | | | 711 | | Ongoing |
Minor works improvement | | Various | | | | | | 600 | | Ongoing |
Total Property, Plant and Equipment | | | | | | | | 4,511 | | |
Capital Grants | | | | | | | | | | |
IBIS Stores Fuel Outlets | | Various | | 800 | | | | 800 | | |
Total Capital Grants | | | | | | | | 800 | | |
TOTAL ABORIGINAL AND TORRES STRAIT ISLANDER POLICY | | | | | | | | 5,311 | | |
| * | Funded under the Smart State Building Fund. |
| | | | |
| | | Capital Statement 2004-05 | | 25 |
CHILD SAFETY
The Department of Child Safety’s estimated capital expenditure in 2004-05 is $35.1 million. This investment will be made as part of the establishment of the new department through the investment in information systems and to accommodate and support departmental staff.
Program Highlights
| | • | The Government has allocated $44.4 million for information systems over three years, of which $22.1 million will be invested in 2004-05 in a new Integrated Client Management Information System (ICMS). The proposed new ICMS will be an integral component for the long-term reforms in the new department by providing improved and more accessible information on children in care. It will greatly enhance the maintenance of clear case plans for children, provide risk assessment and decision support tools to workers, provide better foster care records, improve the efficiency of foster care payments and improve management and oversight of service delivery. It is expected to have a positive impact on the quality and efficiency of service delivery. |
| | • | Capital investment will be undertaken to establish additional child safety service centres. |
| | • | Plant and equipment acquisitions will be targeted at office equipment and information technology, property refurbishment and minor works across the State. |
Child Safety
| | | | | | | | | | |
Project
| | Statistical
Division
| | Total
Estimated
Cost
| | Expenditure
to 30-06-04
| | Budget
2004-05
| | Post
2004-05
|
| | | | | $’000 | | $’000 | | $’000 | | $’000 |
DEPARTMENT OF CHILD SAFETY | | | | | | | | | | |
Property, Plant and Equipment | | | | | | | | | | |
Child safety service centres and other plant and equipment | | Various | | 12,506 | | | | 12,506 | | |
Total Property, Plant and Equipment | | | | | | | | 12,506 | | |
Other Capital Expenditure | | | | | | | | | | |
Information system | | 05 | | 44,423 | | | | 22,124 | | 22,299 |
Other software | | 05 | | 500 | | | | 500 | | |
Total Other Capital Expenditure | | | | | | | | 22,624 | | |
TOTAL CHILD SAFETY | | | | | | | | 35,130 | | |
| | | | |
| 26 | | Capital Statement 2004-05 | | |
COMMUNITIES
The Department of Communities’ estimated capital expenditure in 2004-05 is $11 million. This investment will be made as part of the establishment of the new department through the investment in information systems and to accommodate and support departmental staff and in targeted community sector infrastructure (usually in partnership with non-government service providers).
Program Highlights
| | • | Expenditure of $5.5 million will expand youth justice services State-wide. Youth justice services will operate from youth-friendly premises, which combine office accommodation with activity spaces and storage areas for plant and equipment. Premises are chosen to provide a less intimidating environment for young people and their families as well as to allow greater interaction between young people, staff, the community and other agencies involved in service provision. This initiative will support the implementation of the child protection Blueprint. |
It is intended that the additional youth justice service delivery centres will be established in the Greater Brisbane area (2), the Gold Coast, Far North Queensland (2), Central Queensland, the North Coast, the Toowoomba/Darling Downs area, and in the Whitsundays.
| | • | Plant and equipment will be targeted to the purchase of office equipment and information technology, property refurbishment and minor works across the State. |
| | • | Capital grants of approximately $2 million will be provided to non-government organisations in 2004-05. |
Communities
| | | | | | | | | | |
Project
| | Statistical
Division
| | Total
Estimated Cost
| | Expenditure
to 30-06-04
| | Budget
2004-05
| | Post 2004-05
|
| | | | | $’000 | | $’000 | | $’000 | | $’000 |
DEPARTMENT OF COMMUNITIES | | | | | | | | | | |
Property, Plant and Equipment | | | | | | | | | | |
Establishment of youth service delivery centres | | Various | | 5,500 | | | | 5,500 | | |
Integrated Justice Information Strategy | | Various | | 382 | | | | 382 | | |
Other plant and equipment | | Various | | | | | | 3,067 | | Ongoing |
Total Property, Plant and Equipment | | | | | | | | 8,949 | | |
Capital Grants | | | | | | | | | | |
Capital grants to non-government organisations | | Various | | | | | | 2,030 | | Ongoing |
Total Capital Grants | | | | | | | | 2,030 | | |
TOTAL COMMUNITIES | | | | | | | | 10,979 | | |
| | | | |
| | | Capital Statement 2004-05 | | 27 |
CORRECTIVE SERVICES
Program Highlights
| | • | The Department of Corrective Services will see the conclusion of the expansion of prison infrastructure necessitated by the doubling of prisoner numbers since 1993 with the finalisation of payments on the new Capricornia Correctional Centre project. |
| | • | $10 million in 2004-05 as part of an allocation of $37.2 million over five years (2004-05 to 2008-09) to upgrade the State’s existing correctional facilities including perimeter security systems. |
Corrective Services
| | | | | | | | | | |
Project
| | Statistical
Division
| | Total
Estimated Cost
| | Expenditure
to 30-06-04
| | Budget
2004-05
| | Post 2004-05
|
| | | | | $’000 | | $’000 | | $’000 | | $’000 |
DEPARTMENT OF CORRECTIVE SERVICES | | | | | | | | | | |
Property, Plant and Equipment | | | | | | | | | | |
Capricornia Correctional Centre (CC) | | 30 | | 89,500 | | 85,639 | | 3,861 | | |
Intercom upgrade at Borallon CC | | 10 | | 700 | | | | 700 | | |
Officer stations at Woodford CC | | 10 | | 1,500 | | | | 1,500 | | |
Correctional centre lightning protection | | Various | | 3,600 | | | | 1,800 | | 1,800 |
Perimeter security systems | | Various | | 30,000 | | | | 6,000 | | 24,000 |
Other acquisitions of property, plant and equipment | | Various | | | | | | 5,317 | | Ongoing |
Total Property, Plant and Equipment | | | | | | | | 19,178 | | |
Other Capital Expenditure | | | | | | | | | | |
Integrated Justice Information System | | 05 | | 559 | | | | 559 | | |
Total Other Capital Expenditure | | | | | | | | 559 | | |
TOTAL CORRECTIVE SERVICES | | | | | | | | 19,737 | | |
| | | | |
| 28 | | Capital Statement 2004-05 | | |
DISABILITY SERVICES QUEENSLAND
Investment in capital infrastructure forms a vital part of delivering the three outputs for Disability Services Queensland, Support for Adults, Support for Children and Families and Community Infrastructure.
As a human services provider and funder, the agency invests in capital infrastructure in cases where it is required for government service provision.
Capital infrastructure is also utilised to accommodate and support departmental staff and in targeted community sector infrastructure (usually in partnership with non-government service providers) accommodation for people with an intellectual disability and respite centres. The major portion of non-government service delivery utilises existing community sector capital infrastructure.
Program Highlights
The 2004-05 Budget commits $34.3 million in capital funding to enhance disability services delivered within the government and non-government sectors. These funds are being applied towards a range of strategies including:
| | • | significant investment in the Disability Information System |
| | • | capital and equipment upgrades for services operated by Disability Services Queensland and community-based organisations |
| | • | additional respite and family support services. |
Building will also commence on the third innovative support and housing trial in Townsville in 2004-05 and two further trials will commence in Morayfield and Wacol. Three additional trials will be developed in Maryborough, Loganlea and Ipswich by 2008-09.
| | | | |
| | | Capital Statement 2004-05 | | 29 |
Disability Services
| | | | | | | | | | |
Project
| | Statistical
Division
| | Total
Estimated
Cost
| | Expenditure
to 30-06-04
| | Budget
2004-05
| | Post 2004-05
|
| | | | | $’000 | | $’000 | | $’000 | | $’000 |
DISABILITY SERVICES QUEENSLAND | | | | | | | | | | |
Property, Plant and Equipment | | | | | | | | | | |
Respite services | | | | | | | | | | |
North Queensland | | 45 | | 1,033 | | 340 | | 693 | | |
North Coast (Yandina) | | 10 | | 1,033 | | 400 | | 633 | | |
Innovative housing | | Various | | 5,995 | | 2,061 | | 3,933 | | |
Redevelopment of Wacol site | | 05 | | 4,400 | | 1,700 | | 2,700 | | |
Smart State Building Fund* | | | | | | | | | | |
Maryborough area office | | 15 | | 337 | | | | 337 | | |
Rockhampton regional/area office | | 30 | | 500 | | | | 500 | | |
Goodna/Mt Gravatt area office | | 05 | | 500 | | | | 500 | | |
Ipswich regional/area office | | 05 | | 998 | | | | 200 | | 798 |
Toowoomba area office | | 20 | | 300 | | | | 300 | | |
Yandina respite | | 10 | | 750 | | | | 750 | | |
Townsville respite | | 45 | | 500 | | | | 300 | | 200 |
ALS Villas (Maryborough) | | 15 | | 1,000 | | | | 113 | | 887 |
Systems | | Various | | 2,500 | | | | 500 | | 2,000 |
Equipment | | Various | | 2,500 | | | | 1,500 | | 1,000 |
Other property, plant and equipment | | | | | | | | | | |
Brisbane region | | 05 | | 950 | | 100 | | 850 | | |
WAN upgrade | | Various | | 1,209 | | 115 | | 1,094 | | |
Infrastructure renewal | | Various | | 1,218 | | | | 1,218 | | |
Asset purchases | | Various | | | | | | 1,548 | | Ongoing |
Minor works | | Various | | 320 | | 166 | | 154 | | |
Total Property, Plant and Equipment | | | | | | | | 17,825 | | |
Other Capital Expenditure | | | | | | | | | | |
Software development | | 05 | | 12,789 | | 120 | | 11,630 | | 1,039 |
Total Other Capital Expenditure | | | | | | | | 11,630 | | |
Capital Grants | | | | | | | | | | |
Respite Services | | | | | | | | | | |
Mareeba | | 45 | | 181 | | | | 181 | | |
Rockhampton | | 30 | | 300 | | 58 | | 242 | | |
Boonah | | 10 | | 400 | | 200 | | 200 | | |
Ipswich | | 05 | | 450 | | | | 450 | | |
Fire safety compliance | | Various | | 3,100 | | | | 3,100 | | |
Other capital grants | | Various | | | | | | 663 | | Ongoing |
Total Capital Grants | | | | | | | | 4,836 | | |
TOTAL DISABILITY SERVICES | | | | | | | | 34,291 | | |
| * | Funded under the Smart State Building Fund. |
| | | | |
| 30 | | Capital Statement 2004-05 | | |
EDUCATION AND THE ARTS
EDUCATION QUEENSLAND
The 2004-05 schools capital works program allocates $336.7 million to school accommodation and employee housing, including $46.7 million in capitalised expenses. The program supports the Preschool Education, Primary Education, Secondary Education and Students with Special Needs outputs. Other plant and equipment of $39.2 million provides for information technology infrastructure and schools based plant and equipment outlays. In addition, capital grants of $60.1 million are provided for non-state education facilities.
PROGRAM HIGHLIGHTS
| | • | $145.8 million to construct one new school, undertake further staged work at nine schools, make land acquisitions and provide additional classrooms at existing schools in growth areas throughout the State. $22 million has been funded as part of the Smart State Building Fund initiative. |
| | • | $118.3 million to replace and enhance learning facilities at existing schools, and to provide additional and replacement toilet facilities. $12 million has been funded as part of the Smart State Building Fund initiative. |
| | • | $29.4 million to commence construction work for the introduction of the preparatory year in 2007. |
| | • | $17.5 million to air-condition facilities in Queensland state schools under the continuing Cooler Schools program (this does not include grants to non-state schools for Cooler Schools). $16 million has been funded as part of the Smart State Building Fund. |
| | • | $6.6 million to acquire new employee accommodation and refurbish existing housing stock. |
| | • | Capital expenditure of $2.5 million in relation to Education and Training Reforms for the Future (Information and Communication Technologies). |
Education Queensland’s planning for capital meets the Government’s priorities by considering the following factors:
| | • | population growth and shifts and the consequent impact on enrolments |
| | • | changes to educational standards and educational delivery methods |
| | • | meeting school renewal requirements |
| | • | fulfilling government commitments such as the introduction of the preparatory year and the Cooler Schools program |
| | • | addressing other high priority needs such as student and staff health and safety. |
These factors are managed through a formal needs and priority analysis involving local communities.
| | | | |
| | | Capital Statement 2004-05 | | 31 |
Education and the Arts 1, 2, 3, 4, 5
| | | | | | | | | | |
Project
| | Statistical
Division
| | Total
Estimated
Cost
| | Expenditure
to 30-06-04
| | Budget
2004-05
| | Post 2004-05
|
| | | | | $’000 | | $’000 | | $’000 | | $’000 |
EDUCATION QUEENSLAND | | | | | | | | | | |
Key to Abbreviations | | | | | | | | | | |
EEC - Environmental Education Centre | | | | | | | | | | |
GLAB - General Learning Area Block | | | | | | | | | | |
OEC - Outdoor Education Centre | | | | | | | | | | |
SEC - Special Education Class | | | | | | | | | | |
SEDU - Special Education Developmental Unit | | | | | | | | | | |
SEU - Special Education Unit | | | | | | | | | | |
SPS - Special School | | | | | | | | | | |
Property, Plant and Equipment | | | | | | | | | | |
Albany Creek (P - 7), 2 space relocatable | | 05 | | 255 | | | | 255 | | |
Algester (P - 7), Additional toilets | | 05 | | 276 | | | | 276 | | |
Ascot (P - 7), Library upgrade* | | 05 | | 910 | | | | 910 | | |
Ascot (P - 7), Major classroom upgrade to support Arts initiatives | | 05 | | 329 | | | | 329 | | |
Bald Hills (P - 7), GLAB - 2 storey - 8 spaces | | 05 | | 1,820 | | | | 1,820 | | |
Beenleigh (SPS), Administration upgrade* | | 05 | | 410 | | | | 410 | | |
Beenleigh (SPS), Upgrade to special education facilities to support inclusion | | 05 | | 455 | | | | 455 | | |
Belmont (P - 7), Additional toilets | | 05 | | 475 | | | | 475 | | |
Birkdale (P - 7), Relocation of Preschool | | 05 | | 405 | | 22 | | 383 | | |
Browns Plains (8 - 12), Upgrade to special education facilities to support inclusion | | 05 | | 364 | | | | 364 | | |
Bunyaville (EEC), Additional toilets | | 05 | | 352 | | | | 352 | | |
Calamvale Community College (P - 10), 4 x 2 space relocatable | | 05 | | 1,020 | | 228 | | 792 | | |
Calamvale Community College (P - 10), Stage 2B - Hall | | 05 | | 1,242 | | 46 | | 1,196 | | |
Chapel Hill (P - 7), Major classroom upgrade to support Arts and Technology initiatives | | 05 | | 381 | | | | 381 | | |
Coolnwynpin (P - 7), Upgrade to special education facilities to support inclusion | | 05 | | 328 | | | | 328 | | |
Coorparoo (1 - 7), Renewal - Stage 3 | | 05 | | 2,349 | | 2,078 | | 271 | | |
Coorparoo (1 - 7), Renewal - Stage 4 | | 05 | | 518 | | | | 518 | | |
Craigslea (8 - 12), Home Economics upgrade | | 05 | | 675 | | | | 675 | | |
Eagleby (P - 7), 2 space relocatable | | 05 | | 255 | | | | 255 | | |
Earnshaw State College (P - 12), School refurbishment - Stage 3 (senior school) | | 05 | | 7,458 | | 5,899 | | 1,559 | | |
Eatons Hill (P - 7), 2 space relocatable | | 05 | | 255 | | | | 255 | | |
Ferny Grove (8 - 12), GLAB - 2 storey - 8 spaces and toilets | | 05 | | 1,820 | | | | 1,820 | | |
Ferny Grove (8 - 12), Major classroom upgrade to support Arts and ICT initiatives | | 05 | | 1,365 | | | | 1,365 | | |
Ferny Grove (P - 7), Additional toilets | | 05 | | 342 | | 54 | | 288 | | |
| | | | |
| 32 | | Capital Statement 2004-05 | | |
| | | | | | | | | | |
Ferny Grove (P - 7), GLAB - 2 storey open under - 4 spaces | | 05 | | 1,001 | | | | 1,001 | | |
Flagstone (P - 7), GLAB - 2 spaces and music | | 05 | | 774 | | | | 774 | | |
Flagstone State Community College (8 - 10), Stage 4 - Years 11-12 | | 05 | | 5,621 | | 736 | | 4,885 | | |
Glenala (8 - 12), Upgrade Home Economics | | 05 | | 450 | | | | 450 | | |
Goodna (SPS), GLAB - 4 spaces and amenities | | 05 | | 1,456 | | | | 1,456 | | |
Grand Avenue (P - 7), GLAB - 2 storey open under - 4 spaces | | 05 | | 1,593 | | | | 1,593 | | |
Greenbank (P - 7), Additional toilets | | 05 | | 409 | | | | 409 | | |
Hercules Road (P - 7), Additional toilets | | 05 | | 276 | | | | 276 | | |
Ipswich North (P - 7), Upgrade to special education facilities to support inclusion | | 05 | | 328 | | | | 328 | | |
Jimboomba (P - 7), 2 space relocatable | | 05 | | 255 | | | | 255 | | |
Jinibara (P - 7), GLAB - 2 spaces and music | | 05 | | 801 | | | | 801 | | |
Kallangur (P - 7), Toilet upgrade | | 05 | | 285 | | | | 285 | | |
Karalee (P - 7), Extend Administration Block | | 05 | | 315 | | | | 315 | | |
Karalee (P - 7), Library upgrade* | | 05 | | 273 | | | | 273 | | |
Kedron (8 - 12), Science upgrade | | 05 | | 450 | | | | 450 | | |
Kelvin Grove State College (P - 12), Preschool relocation | | 05 | | 943 | | 124 | | 819 | | |
Kelvin Grove State College (P - 12), Upgrade existing SEU | | 05 | | 410 | | | | 410 | | |
Kenmore South (P - 7), Relocate SEDU | | 05 | | 865 | | | | 865 | | |
Kurwongbah (P - 7), GLAB - 2 spaces and music | | 05 | | 774 | | | | 774 | | |
Logan Reserve (P - 7), GLAB - 2 spaces | | 05 | | 410 | | | | 410 | | |
Manly (1 - 7), Administration Block | | 05 | | 707 | | 244 | | 463 | | |
Marsden (8 - 12), GLAB - 2 storey with SEU under | | 05 | | 3,445 | | 2,244 | | 1,201 | | |
Morningside (P - 7), SEC upgrade | | 05 | | 328 | | | | 328 | | |
Narangba Area, New school P-7, Stage 1 (P-3)* | | 05 | | 13,195 | | 246 | | 6,579 | | 6,370 |
Norman Park (P - 7), GLAB - 3 storey | | 05 | | 3,345 | | 224 | | 3,121 | | |
North Lakes (P - 7), Stage 4 - Year 9 | | 05 | | 19,182 | | 2,148 | | 17,034 | | |
North Lakes (P - 7), Stage 5 - Years 10 - 12 | | 05 | | 13,156 | | | | 1,840 | | 11,316 |
Park Ridge (P - 7), Toilet upgrade | | 05 | | 333 | | | | 333 | | |
Redland Bay (P - 7), GLAB - 2 storey open under - 4 spaces | | 05 | | 1,365 | | | | 1,365 | | |
Runcorn Heights (P - 7), GLAB - 2 spaces | | 05 | | 501 | | | | 501 | | |
Samford (P - 7), Additional toilets | | 05 | | 447 | | | | 447 | | |
Sunnybank Hills (P - 7), Major Resource Centre upgrade to support ICT initiatives | | 05 | | 549 | | | | 549 | | |
Waterford West (P - 7), Administration upgrade* | | 05 | | 637 | | | | 637 | | |
Wellers Hill (1 - 7), Major Resource Centre upgrade to support ICT initiatives | | 05 | | 400 | | | | 400 | | |
West End (P - 7), GLAB - 2 storey - 8 spaces | | 05 | | 1,800 | | 90 | | 360 | | 1,350 |
Windaroo Valley (8 - 12), 2 space relocatable | | 05 | | 255 | | | | 255 | | |
| | | | |
| | | Capital Statement 2004-05 | | 33 |
| | | | | | | | | | |
Yugumbir (P - 7), Additional toilets | | 05 | | 409 | | | | 409 | | |
Bellevue Park (P - 7), Major classroom upgrade to support Arts initiatives | | 10 | | 377 | | | | 377 | | |
Benowa (P - 7), Administration upgrade* | | 10 | | 410 | | | | 410 | | |
Bli Bli (P - 7), GLAB - 2 storey open under 4 spaces and Amenities | | 10 | | 2,093 | | | | 910 | | 1,183 |
Boonah (8 - 12), Major classroom upgrade to support Science and multi-media initiatives | | 10 | | 537 | | | | 537 | | |
Chancellor State College (P - 8), Stage 2 - Year 10-11 | | 10 | | 7,986 | | | | 1,380 | | 6,606 |
Clover Hill (P - 7), Stage 2 | | 10 | | 3,680 | | 264 | | 3,416 | | |
Coolangatta (SPS), School replacement | | 10 | | 5,461 | | 46 | | 4,960 | | 455 |
Currimundi (SPS), Administration upgrade* | | 10 | | 637 | | | | 637 | | |
Federal (P - 7), Additional toilets | | 10 | | 342 | | | | 342 | | |
Golden Beach (P - 7), Additional toilets | | 10 | | 304 | | | | 304 | | |
Helensvale (P - 7), GLAB - 2 storey - 8 spaces | | 10 | | 1,800 | | | | 1,800 | | |
Lockyer District (8 - 12), Upgrade to special education facilities to support inclusion | | 10 | | 328 | | | | 328 | | |
Maroochydore (8 - 12), Industrial Arts and Technology Building | | 10 | | 1,800 | | | | 1,800 | | |
Merrimac (8 - 12), Upgrade SEU | | 10 | | 410 | | | | 410 | | |
Mountain Creek (8 - 12), GLAB - 8 spaces and staff facilities | | 10 | | 1,820 | | | | 364 | | 1,456 |
Nambour (SPS), Upgrade to special education facilities to support inclusion | | 10 | | 1,365 | | 91 | | 1,274 | | |
Noosa District (8 - 12), Additional toilets | | 10 | | 380 | | | | 380 | | |
Noosa District (8 - 12), Home upgrade | | 10 | | 900 | | | | 900 | | |
Noosaville (P - 7), Upgrade to special education facilities to support inclusion | | 10 | | 456 | | 46 | | 410 | | |
Ormeau (P - 7), Additional amenities | | 10 | | 581 | | 276 | | 305 | | |
Ormeau (P - 7), GLAB - 2 storey open under 4 spaces | | 10 | | 1,299 | | 76 | | 1,223 | | |
Pacific Pines (8 - 12), Stage 5 - planning only | | 10 | | 414 | | | | 414 | | |
Pacific Pines (P - 7), 2 space relocatable | | 10 | | 255 | | | | 255 | | |
Sunshine Beach (8 - 12), 2 space relocatable | | 10 | | 255 | | | | 255 | | |
Sunshine Beach (8 - 12), Additional amenities | | 10 | | 684 | | | | 684 | | |
Sunshine Beach (8 - 12), Upgrade to special education facilities to support inclusion | | 10 | | 410 | | | | 410 | | |
Sunshine Beach (P - 7), Additional toilets and Covered Area | | 10 | | 333 | | | | 333 | | |
Talara Primary College (P - 7), 2 space GLA and Music by enclosure | | 10 | | 683 | | | | 683 | | |
Tamrookum (1 - 7), Toilet upgrade | | 10 | | 374 | | 29 | | 345 | | |
Tarampa (1 - 7), Toilet upgrade | | 10 | | 428 | | | | 428 | | |
Upper Coomera (P - 9), Stage 2 - Years 10 - 11 | | 10 | | 14,444 | | 5,444 | | 9,000 | | |
Woodhill (1 - 7), Additional staff toilets | | 10 | | 285 | | 19 | | 266 | | |
Agnes Water (P - 7), Administration upgrade | | 15 | | 817 | | 209 | | 608 | | |
Agnes Water (P - 7), Library upgrade* | | 15 | | 637 | | | | 637 | | |
Aldridge (8 - 12), Upgrade to special education facilities to support inclusion | | 15 | | 455 | | 73 | | 382 | | |
Gayndah (8 - 12), Administration upgrade | | 15 | | 450 | | | | 450 | | |
Gympie (8 - 12), Replace agricultural facility | | 15 | | 450 | | | | 450 | | |
Isis District (8 - 12), Major classroom upgrade to support middle schooling | | 15 | | 334 | | | | 334 | | |
| | | | |
| 34 | | Capital Statemant 2004-05 | | |
| | | | | | | | | | |
Jones Hill (P - 7), 2 space relocatable | | 15 | | 255 | | | | 255 | | |
Kalkie (P - 7), Library upgrade* | | 15 | | 637 | | | | 637 | | |
Kawungan (P - 7), Additional toilets | | 15 | | 361 | | | | 361 | | |
Kawungan (P - 7), GLAB - 4 spaces | | 15 | | 865 | | | | 865 | | |
Kingaroy (8 - 12), Upgrade to special education facilities to support inclusion | | 15 | | 328 | | | | 328 | | |
Nanango (8 - 12), Major classroom upgrade to support home economics initiatives | | 15 | | 425 | | | | 425 | | |
Proston (P - 10), Toilet upgrade | | 15 | | 285 | | | | 285 | | |
Urangan (8 - 12), 2 space relocatable | | 15 | | 255 | | | | 255 | | |
Walkervale (P - 7), Major classroom upgrade to provide for practical learning activities | | 15 | | 693 | | | | 693 | | |
Walkervale (P - 7), Upgrade to special education facilities to support inclusion | | 15 | | 501 | | | | 501 | | |
Allora (P - 10), Home Economics Block | | 20 | | 334 | | 23 | | 311 | | |
Dalby (P - 7), Major upgrade to outdoor learning environment | | 20 | | 451 | | | | 451 | | |
Drayton (P - 7), Administration Block | | 20 | | 493 | | 187 | | 306 | | |
Goondiwindi (P - 7), 2 space relocatable | | 20 | | 255 | | | | 255 | | |
Meringandan (P - 7), GLAB - 2 spaces | | 20 | | 410 | | | | 410 | | |
Oakey (P - 7), SEU upgrade | | 20 | | 410 | | | | 410 | | |
Ryeford (1 - 7), Administration upgrade* | | 20 | | 273 | | | | 273 | | |
Stanthorpe (8 - 12), Major classroom upgrade to support agricultural science initiatives | | 20 | | 610 | | | | 610 | | |
Tara (P - 12), Major classroom upgrade to support agricultural science initiatives | | 20 | | 509 | | | | 509 | | |
Tara (P - 12), Upgrade to special education facilities to support inclusion | | 20 | | 328 | | | | 328 | | |
Taroom (P - 10), Demolish & replace GLA Block | | 20 | | 1,082 | | 653 | | 429 | | |
Wandoan (P - 10), Administration upgrade* | | 20 | | 410 | | | | 410 | | |
Warwick (8 - 12), Science block | | 20 | | 1,820 | | | | 1,820 | | |
Warwick West (P - 7), Upgrade to special education facilities to support inclusion | | 20 | | 328 | | | | 328 | | |
St George (P - 7), Administration upgrade* | | 25 | | 637 | | | | 637 | | |
Allenstown (P - 7), Administration upgrade* | | 30 | | 410 | | | | 410 | | |
Benaraby (P - 7), Toilet upgrade | | 30 | | 428 | | | | 428 | | |
Biloela (8 - 12), Cooler Schools Round 4 | | 30 | | 319 | | 43 | | 276 | | |
Emerald (8 - 12), Major classroom upgrade to support industrial technology initiatives | | 30 | | 547 | | | | 547 | | |
Emerald (8 - 12), Upgrade to special education facilities to support inclusion | | 30 | | 364 | | | | 364 | | |
Frenchville (P - 7), Toilet upgrade | | 30 | | 380 | | | | 380 | | |
Mount Archer (P - 7), 2 space relocatable | | 30 | | 255 | | | | 255 | | |
Tannum Sands (8 - 12), Stage 5 | | 30 | | 3,128 | | 354 | | 2,774 | | |
Tannum Sands (P - 7), Additional toilets | | 30 | | 466 | | | | 466 | | |
Tannum Sands (P - 7), GLAB - 2 storey 8 spaces | | 30 | | 2,184 | | 182 | | 2,002 | | |
Tannum Sands (P - 7), Library upgrade* | | 30 | | 319 | | | | 319 | | |
| | | | |
| | | Capital Statement 2004-05 | | 35 |
| | | | | | | | | | |
Taranganba (P - 7), Additional toilets | | 30 | | 314 | | | | 314 | | |
Taranganba (P - 7), Music by Stage 2 | | 30 | | 364 | | | | 364 | | |
Thangool (P - 7), Administration upgrade* | | 30 | | 410 | | | | 410 | | |
Yeppoon (8 - 12), Upgrade to special education facilities to support inclusion | | 30 | | 546 | | 73 | | 473 | | |
Longreach (P - 7), Administration and classroom upgrade | | 35 | | 630 | | | | 630 | | |
Longreach (P - 7), Library upgrade* | | 35 | | 546 | | | | 546 | | |
Alligator Creek (P - 7), Administration upgrade* | | 40 | | 683 | | | | 683 | | |
Kinchant Dam (OEC), Toilet upgrade | | 40 | | 450 | | | | 450 | | |
Mackay (SPS), Administration upgrade* | | 40 | | 637 | | | | 637 | | |
Mackay (SPS), Upgrade to special education facilities to support inclusion | | 40 | | 637 | | | | 637 | | |
Pioneer (8 - 12), Additional toilets | | 40 | | 409 | | | | 409 | | |
Sarina (8 - 12), Major classroom upgrade to support agricultural science initiatives | | 40 | | 599 | | 291 | | 308 | | |
Victoria Park (P - 7), Toilet block | | 40 | | 333 | | | | 333 | | |
Annandale (P - 7), GLAB - 4 spaces and covered area | | 45 | | 1,365 | | | | 1,365 | | |
Oonoonba (P - 7), GLAB - 2 spaces | | 45 | | 455 | | | | 455 | | |
Railway Estate (P - 7), Toilet upgrade | | 45 | | 285 | | | | 285 | | |
The Willows (P - 7), Additional toilets | | 45 | | 513 | | | | 513 | | |
The Willows (P - 7), Library upgrade* | | 45 | | 455 | | | | 455 | | |
William Ross (8 - 12), Additional classrooms and amenities | | 45 | | 2,065 | | 1,430 | | 635 | | |
Balaclava (P - 7), Administration upgrade* | | 50 | | 637 | | | | 637 | | |
Daradgee (EEC), Additional toilets | | 50 | | 720 | | 405 | | 315 | | |
Edge Hill (P - 7), Major classroom upgrade to support arts and science initiatives | | 50 | | 343 | | | | 343 | | |
Malanda (8 - 12), Additional toilets | | 50 | | 285 | | | | 285 | | |
Mareeba (8 - 12), Multi-purpose learning centre | | 50 | | 1,350 | | | | 1,350 | | |
Mossman (8 - 12), Additional toilets | | 50 | | 304 | | | | 304 | | |
Mossman (8 - 12), Major classroom upgrade to support arts initiatives | | 50 | | 572 | | | | 572 | | |
Redlynch (P - 7), Administration upgrade | | 50 | | 450 | | | | 450 | | |
Redlynch (P - 7), Library upgrade* | | 50 | | 319 | | | | 319 | | |
Saibai Island (P - 7), Replace Administration Block | | 50 | | 1,245 | | 505 | | 740 | | |
Thursday Island (P - 7), SEU upgrade | | 50 | | 865 | | | | 865 | | |
Warraber Island (P - 7), Toilet upgrade | | 50 | | 428 | | | | 428 | | |
Cloncurry (P - 12), Administration upgrade* | | 55 | | 637 | | | | 637 | | |
Spinifex College - Mount Isa - Senior Campus (11 - 12), Spinifex - Senior Campus Stage 2 | | 55 | | 326 | | 33 | | 293 | | |
Spinifex College - Mount Isa - Senior Campus (11 - 12), Upgrade SEU | | 55 | | 410 | | | | 410 | | |
Townview (P - 7), Toilet upgrade | | 55 | | 428 | | | | 428 | | |
Minor works | | Various | | 54,311 | | 15,172 | | 14,269 | | 24,870 |
Additional accommodation | | Various | | | | | | 8,741 | | Ongoing |
Land acquisition | | Various | | | | | | 24,010 | | Ongoing |
General works6 | | Various | | | | | | 97,606 | | Ongoing |
Other Acquisitions of Property, Plant and Equipment | | | | | | | | | | |
Plant and equipment | | Various | | | | 26,445 | | 28,432 | | Ongoing |
Information technology infrastructure | | Various | | | | 8,837 | | 10,770 | | Ongoing |
Total Property, Plant and Equipment | | | | | | | | 329,203 | | |
| | | | |
| 36 | | Capital Statement 2004-05 | | |
| | | | | | | | | | |
Other Capital Expenditure | | | | | | | | | | |
Major software development | | Various | | | | 731 | | 500 | | Ongoing |
Total Other Capital Expenditure | | | | | | | | 500 | | |
Capital Grants | | | | | | | | | | |
Non-State Government grants | | Various | | | | 75,673 | | 60,054 | | Ongoing |
Total Capital Grants | | | | | | | | 60,054 | | |
TOTAL EDUCATION QUEENSLAND | | | | | | | | 389,757 | | |
QUEENSLAND STUDIES AUTHORITY | | | | | | | | | | |
Queensland Studies Authority | | Various | | | | 380 | | 246 | | Ongoing |
TOTAL QUEENSLAND STUDIES AUTHORITY | | | | | | | | 246 | | |
CORPORATE AND PROFESSIONAL SERVICES | | | | | | | | | | |
Plant and equipment | | Various | | | | 236 | | 300 | | Ongoing |
TOTAL CORPORATE AND PROFESSIONAL SERVICES | | | | | | | | 300 | | |
TOTAL EDUCATION | | | | | | | | 390,303 | | |
Notes:
| 1. | The amounts quoted in the text above (and in the Ministerial Portfolio Statement) are the full financial cost of projects (i.e. they include some expensed capital items). The amounts quoted in the table reflect the estimated portion of project costs that will be capitalised. |
| 2. | Projects contained in the table have been included on the basis of projected enrolments. If projected enrolments do not eventuate, then listed projects may be deferred or stopped, or new projects added during the course of the financial year. |
| 3. | Project budgets listed in the table are in some cases indicative and are subject to refinement as projects are further developed. |
| 4. | Numbers outlined in project description represent year level with “P” representing Preschool – for example, (P-12) represents Preschool to Year 12. |
| 5. | Capital grants are distributed by non-state entities throughout Queensland’s statistical divisions. |
| 6. | The General Works items include a number of Cooler Schools projects funded from the Smart State Building Fund. The locations of these projects will not be known until the application process is complete. |
| * | Funded fully or in part under the Smart State Building Fund. |
| | | | |
| | | Capital Statement 2004-05 | | 37 |
ARTS QUEENSLAND
Total capital expenditure for Arts Queensland, together with Queensland Performing Arts Trust, Queensland Museum, Library Board of Queensland and Queensland Art Gallery is $113.5 million in 2004-05.
Arts Queensland’s capital expenditure program for 2004-05 is $103.4 million. The Millennium Arts program in 2004-05 will provide $100 million as part of the five-year redevelopment of the Queensland Cultural Centre at South Brisbane and associated projects. This year will see major construction commenced for the Queensland Gallery of Modern Art and the redevelopment of the State Library of Queensland. Regional Queensland will benefit from the completion of the Regional Millennium Arts grants program and the completion of the State-Commonwealth Queensland Heritage Trails Network. Construction will also commence on the second stage of the Cairns Centre of Contemporary Art ($0.75 million), funded as part of the Smart State Building Fund.
LIBRARY BOARD OF QUEENSLAND
The capital outlays for 2004-05 include continued enhancements of the state library of Queensland’s Heritage, general reference and public libraries collections as well as some plant and equipment replacement. It also includes an allocation for the innovation grants scheme which is payable to successful public library applicants and is designed to encourage the use of innovative strategies for increasing community use of library services.
QUEENSLAND MUSEUM
The construction of a new Sciencentre, new entrance and an Aboriginal & Torres Strait Islanders Cultures Centre at Queensland Museum South Bank will revitalise the flag-ship campus of the Queensland Museum network.
The new Sciencentre will provide the people of Queensland with an updated, state of the art science discovery and educational facility, while the Aboriginal and Torres Strait Islander Cultures Centre will contribute substantially to the Queensland Museum’s continuing programs of repatriation and reconciliation.
Funding provided to enhance the collection data base system will facilitate State-wide access to this important resource, greatly increasing its value to the people of Queensland.
QUEENSLAND ART GALLERY
The Gallery’s property, plant and equipment expenditure program for 2004-05 principally comprises purchases of works of art for the Queensland Gallery of Modern Art and ongoing operational plant and equipment for the existing Queensland Art Gallery.
QUEENSLAND PERFORMING ARTS TRUST
The Trust’s capital expenditure program for 2004-05 is $1.5 million and is directed at replacing some of the Trust’s depreciated theatrical production equipment and the replacement of the Trust’s ticketing system.
The Trust has also prioritised the refurbishment of catering facilities to improve services to customers and to ensure a sustainable catering operation.
| | | | |
| 38 | | Capital Statement 2004-05 | | |
Education and the Arts
| | | | | | | | | | |
Project
| | Statistical
Division
| | Total
Estimated
Cost
| | Expenditure
to
30-06-04
| | Budget
2004-05
| | Post
2004-05
|
| | | | | $’000 | | $’000 | | $’000 | | $’000 |
ARTS QUEENSLAND | | | | | | | | | | |
Property, Plant and Equipment | | | | | | | | | | |
Millennium Arts Program | | | | | | | | | | |
Gallery of Modern Art | | 05 | | 112,330 | | 11,866 | | 36,159 | | 64,305 |
Millennium Library | | 05 | | 69,905 | | 7,462 | | 28,408 | | 34,035 |
Plaza Development - Common infrastructure works at South Bank | | 05 | | 85,405 | | 22,445 | | 31,253 | | 31,707 |
Queensland Museum | | 05 | | 10,000 | | 9,374 | | 626 | | |
Musgrave Park Cultural Centre | | 05 | | 5,000 | | 970 | | 4,030 | | |
Sub-total Millennium Arts Program | | | | | | | | 100,476 | | |
Cairns Centre of Contemporary Art* | | 50 | | 1,000 | | | | 750 | | 250 |
Other plant and equipment | | 05 | | | | | | 100 | | |
Total Property, Plant and Equipment | | | | | | | | 101,326 | | |
Capital Grants | | | | | | | | | | |
Millennium Arts regional initiatives | | Various | | 15,000 | | 13,000 | | 2,000 | | |
Other capital grants | | Various | | | | | | 100 | | |
Total Capital Grants | | | | | | | | 2,100 | | |
TOTAL ARTS QUEENSLAND | | | | | | | | 103,426 | | |
LIBRARY BOARD OF QUEENSLAND | | | | | | | | | | |
Property, Plant and Equipment | | | | | | | | | | |
Plant and equipment - general | | 05 | | | | | | 850 | | Ongoing |
Total Property, Plant and Equipment | | | | | | | | 850 | | |
Other Capital Expenditure | | | | | | | | | | |
Library expenditure | | 05 | | | | | | 3,893 | | Ongoing |
Total Other Capital Expenditure | | | | | | | | 3,893 | | |
Capital Grants | | | | | | | | | | |
Public Library innovations grants | | Various | | | | | | 250 | | Ongoing |
Total Capital Grants | | | | | | | | 250 | | |
TOTAL LIBRARY BOARD OF QUEENSLAND | | | | | | | | 4,993 | | |
QUEENSLAND ART GALLERY | | | | | | | | | | |
Property, Plant and Equipment | | | | | | | | | | |
Property, plant and equipment | | 05 | | | | | | 1,300 | | Ongoing |
Total Property, Plant and Equipment | | | | | | | | | | |
TOTAL QUEENSLAND ART GALLERY | | | | | | | | 1,300 | | |
| | | | | |
QUEENSLAND MUSEUM | | | | | | | | | | |
Property, Plant and Equipment | | | | | | | | | | |
Collection Management System | | 05 | | 700 | | 300 | | 200 | | 200 |
New Sciencentre at South Bank | | 05 | | 1,605 | | 895 | | 710 | | |
ATSI Cultures Centre | | 05 | | 1,195 | | 265 | | 930 | | |
MTQ exhibition | | 45 | | 805 | | 500 | | 205 | | 100 |
| | | | |
| | | Capital Statement 2004-05 | | 39 |
| | | | | | | | | | |
Other plant and equipment | | Various | | | | 69 | | 137 | | Ongoing |
Total Property, Plant and Equipment | | | | | | | | 2,182 | | |
Other Capital Expenditure | | | | | | | | | | |
Intangibles (software) | | 05 | | 300 | | 200 | | 100 | | |
Total Other Capital Expenditure | | | | | | | | 100 | | |
TOTAL QUEENSLAND MUSEUM | | | | | | | | 2,282 | | |
QUEENSLAND PERFORMING ARTS TRUST | | | | | | | | | | |
Property, Plant and Equipment | | | | | | | | | | |
Property, plant and equipment | | 05 | | | | 1,500 | | 1,500 | | Ongoing |
Total Property, Plant and Equipment | | | | | | | | 1,500 | | |
TOTAL QUEENSLAND PERFORMING ARTS TRUST | | | | | | | | 1,500 | | |
TOTAL ARTS QUEENSLAND | | | | | | | | 113,501 | | |
TOTAL EDUCATION AND THE ARTS | | | | | | | | 503,804 | | |
| | | | |
| 40 | | Capital Statement 2004-05 | | |
ELECTORAL COMMISSION OF QUEENSLAND
An amount of $0.04 million is allocated towards the acquisition of replacement plant and equipment in 2004-05. This will provide for the ongoing operational requirements associated with the efficient and effective provision of electoral services in the state of Queensland.
Electoral Commission of Queensland
| | | | | | | | | | |
Project
| | Statistical
Division
| | Total
Estimated
Cost
| | Expenditure
to
30-06-04
| | Budget 2004-05
| | Post
2004-05
|
| | | | | $’000 | | $’000 | | $’000 | | $’000 |
ELECTORAL COMMISSION OF QUEENSLAND | | | | | | | | | | |
Property, Plant and Equipment | | | | | | | | | | |
Plant and equipment | | 05 | | | | | | 40 | | Ongoing |
Total Property, Plant and Equipment | | | | | | | | 40 | | |
TOTAL ELECTORAL COMMISSION OF QUEENSLAND | | | | | | | | 40 | | |
| | | | |
| | | Capital Statement 2004-05 | | 41 |
EMERGENCY SERVICES
The Department of Emergency Services’ capital program will see $76.1 million invested in 2004-05 on capital acquisitions and grants.
The capital investment plan provides for essential infrastructure and information technology investment to support operations, and to achieve economic and operational effectiveness through contemporary asset management strategies. The capital investment program reflects the Government’s ongoing commitment to the provision of essential emergency services to ensure that Queenslanders live in safe and secure communities.
The department will continue to invest in essential operational and corporate information technology infrastructure, equipment and systems, as well as $1.9 million to finalise purchase of the replacement of the Queensland Rescue Squirrel helicopter.
Queensland Ambulance Service
Capital investments by the Queensland Ambulance Service in 2004-05 total $31.1 million and include joint facilities and communication projects.
Program Highlights
| | • | Nine replacement ambulance stations, two new stations and one field officer residence will be commenced or completed in 2004-05. |
| | • | $9.9 million for replacement ambulance vehicles as part of its vehicle replacement program. |
| | • | $2 million for continued improvement in technical communications and operational equipment across the State. |
| | • | A further $3.5 million for the development an electronic data capture capability to reduce administrative effort and improve service availability. |
Queensland Fire and Rescue Service
Capital investments by the Queensland Fire and Rescue Service in 2004-05 total $38.7 million, including joint facilities and communication projects.
Program Highlights
| | • | Eleven fire station or facility upgrades and one station relocation and new facility will be commenced or completed in 2004-05. |
| | • | $12 million for new or replacement urban vehicles as part of its fleet replacement program and to meet enhanced service delivery requirements. |
| | • | A further $3.8 million will be invested in rural vehicles and $2.4 million on a program of continued improvement in technical communications and operational equipment. |
| | | | |
| 42 | | Capital Statement 2004-05 | | |
Joint Facilities
Capital investments on joint facilities in 2004-05 totalling $3 million, including joint facilities at Palm Island and Mornington Island and one co-located facility at Highfields will be commenced or completed in 2004-05. The redevelopment of the joint facility at Roma Street, Brisbane, will commence in 2004-05 and will be funded in part under the Smart State Building Fund. The total cost of the project is estimated to be $15.8 million.
Emergency Services
| | | | | | | | | | |
Project
| | Statistical
Division
| | Total
Estimated
Cost
| | Expenditure
to 30-06-04
| | Budget
2004-05
| | Post
2004-05
|
| | | | | $’000 | | $’000 | | $’000 | | $’000 |
DEPARTMENT OF EMERGENCY SERVICES | | | | | | | | | | |
Property, Plant and Equipment | | | | | | | | | | |
QUEENSLAND AMBULANCE SERVICE | | | | | | | | | | |
Building/General Works | | | | | | | | | | |
Atherton replacement station | | 50 | | 1,503 | | 103 | | 1,400 | | |
Ayr replacement station | | 45 | | 1,378 | | 78 | | 1,300 | | |
Balmoral replacement station | | 05 | | 1,720 | | 20 | | 1,700 | | |
Birkdale new station | | 05 | | 803 | | 3 | | 800 | | |
Cooktown field officer residence | | 50 | | 700 | | | | 700 | | |
Dirrinbandi replacement station | | 25 | | 544 | | 244 | | 300 | | |
Emu Park new station | | 30 | | 750 | | | | 750 | | |
Gemfields/Sapphire replacement station and residence | | 30 | | 600 | | | | 600 | | |
Innisfail replacement station | | 50 | | 1,380 | | 780 | | 600 | | |
Minor works | | Various | | 1,500 | | | | 1,500 | | |
Narangba replacement station | | 05 | | 1,004 | | 704 | | 300 | | |
Springwood replacement station | | 05 | | 1,279 | | 79 | | 1,200 | | |
Townsville stations redevelopment | | 45 | | 4,500 | | | | 1,000 | | 3,500 |
Land | | | | | | | | | | |
Balmoral | | 05 | | 500 | | | | 500 | | |
Birkdale | | 05 | | 650 | | | | 650 | | |
Nerang | | 05 | | 500 | | | | 500 | | |
Other Plant and Equipment | | | | | | | | | | |
Ambulance vehicle purchases | | Various | | 9,850 | | | | 9,850 | | |
Operational and communications equipment | | Various | | 2,000 | | | | 2,000 | | |
Sub-total Property, Plant and Equipment | | | | | | | | 25,650 | | |
QUEENSLAND FIRE AND RESCUE SERVICES | | | | | | | | | | |
Building/General Works | | | | | | | | | | |
Arana Hills Fire Station redevelopment | | 05 | | 305 | | | | 305 | | |
Ayr Fire Station upgrade | | 45 | | 262 | | 12 | | 250 | | |
Cairns BA Hazmat training facility | | 50 | | 604 | | | | 604 | | |
Cannon Hill Special Operations Centre and Balmoral Fire Station relocation | | 05 | | 8,002 | | 4,475 | | 3,527 | | |
Forest Hill Fire Station upgrade | | 10 | | 465 | | 15 | | 450 | | |
Innisfail Fire Station upgrade | | 50 | | 400 | | | | 400 | | |
Minor works | | Various | | 262 | | | | 262 | | |
Mt Gravatt Station upgrade | | 05 | | 2,150 | | 50 | | 500 | | 1,600 |
Petrie Fire Station refurbishment | | 05 | | 950 | | 50 | | 450 | | 450 |
Project development | | Various | | 1,900 | | | | 1,900 | | |
QFRS Academy Air Emission | | 05 | | 2,000 | | | | 1,000 | | 1,000 |
| | | | |
| | | Capital Statement 2004-05 | | 43 |
| | | | | | | | | | |
QFRS Academy upgrade | | 05 | | 2,250 | | | | 750 | | 1,500 |
Taigum Fire Station redevelopment | | 05 | | 859 | | 316 | | 543 | | |
Taringa Fire Station redevelopment | | 05 | | 963 | | 627 | | 336 | | |
Land | | | | | | | | | | |
Brisbane City | | 05 | | 1,000 | | | | 1,000 | | |
Sippy Downs | | 10 | | 1,000 | | | | 1,000 | | |
QFRS (rural operations) land | | Various | | 100 | | | | 100 | | |
Other Plant and Equipment | | | | | | | | | | |
Rural Fire appliances | | Various | | | | | | 3,750 | | Ongoing |
Urban Fire appliances | | Various | | | | | | 12,000 | | Ongoing |
Operational and communications equipment | | Various | | | | | | 2,410 | | Ongoing |
Sub-Total Property, Plant and Equipment | | | | | | | | 31,537 | | |
JOINT EMERGENCY SERVICE FACILITIES | | | | | | | | | | |
Palm Island DES joint facility | | 45 | | 1,200 | | 200 | | 1,000 | | |
Roma Street, Brisbane redevelopment* | | 05 | | 15,750 | | 50 | | 1,350 | | 14,350 |
Mornington Island SES/QFRS (rural operations) joint facility | | 55 | | 300 | | | | 300 | | |
Highfields QFRS/QAS co-located facility | | 20 | | 825 | | | | 325 | | 500 |
Sub-Total Property, Plant and Equipment | | | | | | | | 2,975 | | |
OTHER DEPARTMENTAL | | | | | | | | | | |
Buildings | | Various | | 545 | | | | 545 | | |
Squirrel helicopter replacement | | 05 | | 8,000 | | 6,099 | | 1,901 | | |
Plant and equipment | | Various | | 50 | | | | 68 | | |
IT infrastructure | | Various | | 1,160 | | | | 1,160 | | |
Sub-Total Property, Plant and Equipment | | | | | | | | 3,674 | | |
TOTAL PROPERTY, PLANT AND EQUIPMENT | | | | | | | | 63,836 | | |
Other Capital Expenditure | | | | | | | | | | |
QUEENSLAND AMBULANCE SERVICE | | | | | | | | | | |
Operational information and communications systems | | Various | | 3,500 | | | | 3,500 | | |
QUEENSLAND FIRE AND RESCUE SERVICE | | | | | | | | | | |
Operational information and communications systems | | Various | | 7,120 | | 820 | | 3,300 | | 3,000 |
Sub-Total Other Capital Expenditure | | | | | | | | 6,800 | | |
OTHER DEPARTMENTAL | | | | | | | | | | |
Information systems development | | Various | | 10,564 | | 1,087 | | 4,999 | | 4,478 |
Sub-Total Other Departmental | | | | | | | | 4,999 | | |
TOTAL OTHER CAPITAL EXPENDITURE | | | | | | | | 11,799 | | |
Capital Grants | | | | | | | | | | |
Rural Fire Brigades | | Various | | | | | | 150 | | Ongoing |
State Emergency Service units | | Various | | | | | | 332 | | Ongoing |
TOTAL CAPITAL GRANTS | | | | | | | | 482 | | |
TOTAL EMERGENCY SERVICES | | | | | | | | 76,117 | | |
| * | Funded in part under the Smart State Building Fund. |
| | | | |
| 44 | | Capital Statement 2004-05 | | |
EMPLOYMENT AND TRAINING
The department’s capital expenditure program (including Corporate Solutions Queensland) for 2004-05 is $61.5 million, of which $37.1 million is for the construction and refurbishment of TAFE training facilities. The department is continuing to target the utilisation and quality of physical facilities to improve the training capacity of TAFE Institutes. In parallel with the physical facilities strategy, a three-to-five year information and communication technology (ICT) infrastructure plan is being implemented to leverage further productivity and increased training from the department’s capital investment. In 2004-05, $11.3 million will be invested directly in ICT, while a further $5.6 million will be available for other equipment. Capital grants of $7.5 million will also be available to enhance agricultural colleges and establish new skill centres.
Program Highlights
| | • | $11.3 million for continued capital investment in information and communication technology assets, a SmartVET initiative. |
| | • | $13.7 million to continue the construction of the new Health and Social Services facility in Toowoomba for the Southern Queensland Institute of TAFE. This facility will provide for community services, health and child care studies training, and is the penultimate development to consolidate Toowoomba training activities into a single location. |
| | • | $8 million for site acquisition and facilities planning activities for the establishment of a new Coomera campus for the Gold Coast Institute of TAFE, a Smart State Building Fund initiative. The new campus will deliver programs with a focus on creative industries including film and television, graphic design, interior design, architecture, building technology and information technology. |
| | • | A further $15.4 million for construction and refurbishment of facilities, including the commencement of a new campus at Yeppoon to relocate engineering, business and clerical studies; and the redevelopment of the existing Hervey Bay campus for training across industries that include community and health services, tourism and hospitality, business, information technology and retail. |
The formation of education precincts with both Education Queensland and universities will contribute to achieving Education and Training Reforms for the Future. The department has completed precincts at Mt Isa, Mossman and Atherton, and in 2004-05 will focus on precincts at Yeppoon, Coomera and Caboolture.
The above targeted capital investments will increasingly contribute to the achievement of the Smart State initiative and building Queensland’s regions by investing in training facilities for mature age workers, Central Queensland, manufacturing, tourism and hospitality, community services and health, and creative industries.
| | | | |
| | | Capital Statement 2004-05 | | 45 |
Employment and Training
| | | | | | | | | | |
Project
| | Statistical
Division
| | Total
Estimated
Cost
| | Expenditure
to 30-06-04
| | Budget
2004-05
| | Post
2004-05
|
| | | | | $’000 | | $’000 | | $’000 | | $’000 |
DEPARTMENT OF EMPLOYMENT AND TRAINING | | | | | | | | | | |
Property, Plant and Equipment | | | | | | | | | | |
TAFE Institutes | | | | | | | | | | |
Barrier Reef Institute of TAFE Townsville redevelopment | | 45 | | 10,000 | | | | 500 | | 9,500 |
Brisbane North Institute of TAFE Caboolture Community Campus | | 05 | | 4,356 | | 506 | | 3,850 | | |
Central Queensland Institute of TAFE Yeppoon TAFE | | 30 | | 1,000 | | | | 1,000 | | |
Cooloola Sunshine Institute of TAFE New Tewantin Campus | | 10 | | 7,550 | | 4,737 | | 2,813 | | |
Gold Coast Institute of TAFE Coomera Educational Precinct* | | 10 | | 25,000 | | | | 8,000 | | 17,000 |
Ridgeway redevelopment | | 10 | | 2,900 | | | | 300 | | 2,600 |
Logan Institute of TAFE Meadowbrook car park | | 10 | | 600 | | 400 | | 200 | | |
Moreton Institute of TAFE Mt Gravatt redevelopment | | 05 | | 11,000 | | 1,388 | | 1,462 | | 8,150 |
Southern Queensland Institute of TAFE Toowoomba consolidation | | 20 | | 18,000 | | 2,028 | | 13,747 | | 2,225 |
Wide Bay Institute of TAFE Consolidation / engineering | | 15 | | 5,310 | | 4,935 | | 375 | | |
Hervey Bay consolidation | | 15 | | 550 | | | | 550 | | |
Bundaberg redevelopment | | 15 | | 4,450 | | | | 400 | | 4,050 |
Yeronga Institute of TAFE trades relocation | | 05 | | 6,000 | | | | 400 | | 5,600 |
Information and communication technology | | Various | | | | | | 11,250 | | Ongoing |
Minor capital works | | Various | | | | | | 3,500 | | Ongoing |
Infrastructure equipment | | Various | | | | | | 3,250 | | Ongoing |
Disability adaptive equipment | | 05 | | | | | | 50 | | Ongoing |
Other plant and equipment | | 05 | | | | | | 2,003 | | Ongoing |
Corporate Solutions Queensland plant and equipment | | Various | | | | | | 327 | | Ongoing |
Total Property, Plant and Equipment | | | | | | | | 53,977 | | |
Capital Grants | | | | | | | | | | |
Agricultural Colleges backlog maintenance | | Various | | | | | | 1,000 | | Ongoing |
Skill Centre program | | Various | | | | | | 5,000 | | Ongoing |
Aviation Australia | | 05 | | 5,200 | | 3,500 | | 1,500 | | 200 |
Total Capital Grants | | | | | | | | 7,500 | | |
TOTAL DEPARTMENT OF EMPLOYMENT AND TRAINING | | | | | | | | 61,477 | | |
| * | Funded under the Smart State Building Fund. |
| | | | |
| 46 | | Capital Statement 2004-05 | | |
ENVIRONMENTAL PROTECTION AGENCY
The Environmental Protection Agency capital program for 2004-05 is $25.1 million ranging from the ongoing replacement of the agency’s plant and equipment, recreational and services infrastructure to new capital projects and land acquisitions. This includes $4 million provided under the Government’s Smart State Building Fund and another $5 million for further acquisitions of land in the Cape York and Daintree areas.
In addition to this amount is the agency’s ongoing capital works program on parks, forests and administrative buildings of $10 million. These funds are used to improve the agency’s built infrastructure both on protected estate and on other lands, where necessary replacing or upgrading existing infrastructure in accordance to priority projects identified in the agency’s three year rolling capital works plan.
Program Highlights
| | • | $5 million in 2004-05 in land acquisition funds in the Cape York and Daintree areas and another $1 million for acquisition of other strategic lands under the Smart State Building Fund. $15 million in total is provided for land acquisitions over the next three years. |
| | • | $3 million in 2004-05 under the Smart State Building Fund for capital works on Parks including $1 million for the Palmerston Ma:Mu Walk and $2 million for the Better and Sustainable Parks program, which is in addition to the agency’s ongoing Capital Works on Parks and Forests program. |
| | • | $2.3 million in 2004-05, the fourth year of the Great Walks of Queensland project ($10 million over five years). |
| | | | |
| | | Capital Statement 2004-05 | | 47 |
Environmental Protection Agency
| | | | | | | | | | |
Project
| | Statistical
Division
| | Total
Estimated
Cost
| | Expenditure
to 30-06-04
| | Budget
2004-05
| | Post
2004-05
|
| | | | | $’000 | | $’000 | | $’000 | | $’000 |
ENVIRONMENTAL PROTECTION AGENCY | | | | | | | | | | |
Property, Plant and Equipment | | | | | | | | | | |
Plant and equipment | | Various | | | | | | 3,798 | | Ongoing |
Capital works - administrative Building centres Rockhampton regional office | | 30 | | 800 | | | | 800 | | |
Savannah district office | | 45 | | 1,000 | | | | 500 | | 500 |
Minor works | | Various | | | | | | 267 | | Ongoing |
Capital works - parks and forests Staff housing | | Various | | 5,265 | | 1,674 | | 2,203 | | 1,388 |
Fleay’s redevelopment, Fleay’s Wildlife Park | | 10 | | 1,023 | | 117 | | 441 | | 465 |
North Point campground and day use centre Moreton Island | | 05 | | 640 | | 74 | | 449 | | 117 |
Broken River car park and day use centre Eungella National Park | | 40 | | 753 | | 441 | | 312 | | |
Waste treatment, Eurong ranger base Great Sandy National Park | | 15 | | 405 | | 105 | | 300 | | |
Minor works | | Various | | | | | | 4,773 | | Ongoing |
Great Walks of Queensland Mackay Highlands Great Walk | | 40 | | 1,421 | | 829 | | 408 | | 184 |
Whitsundays Great Walk | | 40 | | 1,407 | | 1,254 | | 153 | | |
Wet Tropics Great Walk | | 50 | | 970 | | 528 | | 442 | | |
Gold Coast Hinterland Great Walk | | 10 | | 1,476 | | 793 | | 563 | | 120 |
Sunshine Coast Hinterland Great Walk | | 10 | | 1,521 | | 829 | | 478 | | 214 |
Minor works | | Various | | 2,241 | | 503 | | 256 | | 1,482 |
New acquisition of lands - Cape York and Daintree | | 50 | | 10,000 | | | | 5,000 | | 5,000 |
Smart State Building Fund* | | | | | | | | | | |
Better and sustainable parks Cape York visitor facilities | | 50 | | 1,000 | | | | 367 | | 633 |
Wet tropics visitor facilities and upgrade of tourist roads | | 50 | | 1,500 | | | �� | 500 | | 1,000 |
Cooloola, Great Sandy National Park visitor facilities | | 15 | | 1,000 | | | | 400 | | 600 |
Bribie Island National Park visitor facilities | | 10 | | 1,000 | | | | 583 | | 417 |
Minor works | | Various | | 1,500 | | | | 150 | | 1,350 |
Biodiversity protection - strategic lands | | Various | | 5,000 | | | | 1,000 | | 4,000 |
Palmerston Ma:Mu Walk | | 50 | | 4,000 | | | | 1,000 | | 3,000 |
Total Property, Plant and Equipment | | | | | | | | 25,143 | | |
TOTAL ENVIRONMENTAL PROTECTION AGENCY | | | | | | | | 25,143 | | |
| | | | |
| 48 | | Capital Statement 2004-05 | | |
HEALTH
The Health portfolio’s capital program (inclusive of the Queensland Institute of Medical Research) will see $406.4 million invested in new capital acquisitions in 2004-05.
The total Queensland Health capital program expenditure for 2004-05 is estimated to be $404.8 million. The capital works program is being prioritised to meet the demands of an integrated health care system, with an increasing focus on prevention, promotion, integration and partnerships. This strategic focus is aligned with the Queensland Government’s Smart State vision and the Health 2020 Directions Statement.
Program Highlights
| | • | Over the next three years, Queensland Health will contribute $200 million, as part of the Smart State Building Fund, toward the integration of community and hospital based health services to further improve patient care and reduce pressure on the hospital system. Initiatives included in this investment are the Cairns Central Community Health Centre, North Lakes Ambulatory and Community Centre, Sunshine Coast Ambulatory and Community Centre, and the Gin Gin Health Service. |
| | • | A further $107 million over four years will be invested in initiatives such as the redevelopment of The Prince Charles Hospital emergency department and provision of general hospital services, enhancing the Queensland Cancer Registry, the purchase of specialised health technology for cancer care, renal dialysis units and the Health Hotline Initiative. |
| | • | In 2004-05 $34.7 million, partly funded under the Smart State Building Fund, will be spent on community-based projects. Major community projects commencing include a Community Health Centre (CHC) and a rehabilitation/dual diagnosis unit in Cairns, consolidation of Community, Mental Health, and Oral Health service at Gladstone, a new Ambulatory and Community Centre at North Lakes and collocation of health services in the Sunshine Coast. |
| | • | Major hospital redevelopments will see $54.1 million being spent in 2004-05. The projects include the Ingham and Weipa hospital redevelopments, emergency department upgrades at Gympie, Redcliffe, Redland, Robina and Logan Hospitals, upgrade to the Atherton Hospital and a new clinic building at Hervey Bay. |
| | • | Continuing provision of medical equipment is one of the fundamental tools for the effective delivery of health services. Accordingly, in 2004-05, $56.7 million will be spent on health technology. |
| | • | Information is a critical resource for ensuring and supporting the effective delivery of health care services. Funding of $339 million over the next four years will be invested in information and communication technologies to improve access to clinical information in both community care and hospital settings, and to continue the development and replacement of technical infrastructure. $79 million will be spent on information and communication technology in 2004-05. |
| | | | |
| | | Capital Statement 2004-05 | | 49 |
| | • | A total of $24.2 million is provided for the purchase of three new Royal Flying Doctor Service aircraft that will operate from bases in Brisbane, Rockhampton and Townsville to provide emergency patient transfer services across the State, along with $1 million towards scoping the reconstruction of the Mater Hospital. |
QUEENSLAND INSTITUTE OF MEDICAL RESEARCH
To remain internationally competitive at the forefront of medical research, the Queensland Institute of Medical Research (QIMR) must have access to cutting edge technology. Therefore, QIMR is expecting to spend $1.6 million for scientific and general capital purchases in 2004-05 including for the update of the QIMR animal house and the purchase of a proteomic system.
Health
| | | | | | | | | | |
Project
| | Statistical
Division
| | Total
Estimated
Cost
| | Expenditure
to 30-06-04
| | Budget
2004-05
| | Post
2004-05
|
| | | | | $’000 | | $’000 | | $’000 | | $’000 |
DEPARTMENT OF HEALTH | | | | | | | | | | |
Property, Plant and Equipment | | | | | | | | | | |
Community Health Centres (CHC) | | | | | | | | | | |
Cairns Central CHC* | | 50 | | 7,000 | | | | 2,100 | | 4,900 |
Emerald CHC & staff accommodation | | 30 | | 1,400 | | 290 | | 1,110 | | |
Gladstone community/mental health/ oral health consolidation* | | 30 | | 6,000 | | | | 1,300 | | 4,700 |
Nambour Hospital Breastscreen | | 10 | | 2,400 | | 500 | | 1,900 | | |
North Lakes Ambulatory and Community Centre* | | 05 | | 10,000 | | | | 600 | | 9,400 |
North West CHC | | 05 | | 5,980 | | 812 | | 5,068 | | 100 |
Nundah CHC | | 05 | | 5,865 | | 1,503 | | 4,000 | | 362 |
Rosemount CHC | | 05 | | 3,201 | | 755 | | 2,446 | | |
St Pauls Tce Centre, A/C system upgrade | | 05 | | 900 | | | | 300 | | 600 |
Sunshine Coast Ambulatory and Community Centre* | | 10 | | 9,742 | | | | 1,000 | | 8,742 |
Thuringowa CHC - Kirwan | | 45 | | 12,041 | | 1,094 | | 10,437 | | 510 |
Townsville CHC - North Ward | | 45 | | 5,590 | | 2,226 | | 2,911 | | 453 |
Weipa Hospital redevelopment* | | 50 | | 14,600 | | | | 500 | | 14,100 |
Yeronga oral health upgrade* | | 05 | | 525 | | | | 525 | | |
Rural hospitals projects, emergent works | | Various | | | | | | 500 | | Ongoing |
Sub-total Community Health Centres | | | | | | | | 34,697 | | |
Multi-Purpose Health Service (MPHS) Springsure MPHS | | 30 | | 5,356 | | 3,390 | | 1,966 | | |
Sub-total Multi-Purpose Health Service | | | | | | | | 1,966 | | |
Primary Health Care Centres (PHCC) | | | | | | | | | | |
Gin Gin Health Service* | | 15 | | 4,000 | | | | 2,000 | | 2,000 |
Sub-total Primary Health Care Centres | | | | | | | | 2,000 | | |
Hospitals | | | | | | | | | | |
Atherton Hospital stage 2 upgrade | | 50 | | 1,000 | | | | 1,000 | | |
| | | | |
| 50 | | Capital Statement 2004-05 | | |
| | | | | | | | | | |
Ayr Hospital redevelopment | | 45 | | 12,521 | | 6,306 | | 6,215 | | |
Gold Coast Hospital, cardiac catheter lab* | | 10 | | 2,500 | | | | 2,500 | | |
Gympie Hospital, clinical services building | | 15 | | 5,702 | | 4,191 | | 1,511 | | |
Herston Hospitals, education centre, auditorium and demolition | | 05 | | 15,103 | | 12,150 | | 2,953 | | |
Herston Hospitals, Halwyn Centre upgrade | | 05 | | 1,200 | | 200 | | 1,000 | | |
Herston Hospitals, skills development centre | | 05 | | 11,000 | | 9,512 | | 1,488 | | |
Hervey Bay Hospital, clinics building | | 15 | | 3,200 | | | | 100 | | 3,100 |
Ingham Hospital redevelopment* | | 45 | | 11,000 | | | | 700 | | 10,300 |
Innisfail Hospital redevelopment | | 50 | | 23,200 | | 1,132 | | 7,858 | | 14,210 |
Mackay Hospital specialist outpatients and administrative upgrade | | 40 | | 2,300 | | 535 | | 1,200 | | 565 |
Nambour Hospital mortuary modifications | | 10 | | 800 | | | | 800 | | |
Queen Elizabeth II Hospital, A/C system upgrade* | | 05 | | 2,300 | | | | 2,300 | | |
The Prince Charles Hospital upgrade to general hospital | | 05 | | 77,000 | | | | 5,000 | | 72,000 |
Emergency Department upgrades | | | | | | | | | | |
Gympie Hospital* | | 15 | | 4,000 | | | | 1,000 | | 3,000 |
Logan Hospital* | | 05 | | 3,333 | | | | 3,333 | | |
Redcliffe Hospital* | | 05 | | 13,500 | | | | 800 | | 12,700 |
Redland Hospital* | | 05 | | 4,200 | | | | 1,300 | | 2,900 |
Robina Hospital* | | 10 | | 9,500 | | | | 600 | | 8,900 |
Renal Services, enhancement | | Various | | 10,000 | | | | 10,000 | | |
Building engineering services | | Various | | | | | | 500 | | Ongoing |
Planning & management studies | | Various | | | | | | 850 | | Ongoing |
Program management | | 05 | | | | | | 850 | | Ongoing |
Projects finalisation | | 50 | | | | | | 290 | | Ongoing |
Sub-total Hospital Projects | | | | | | | | 54,148 | | |
Health Technology Replacement | | | | | | | | | | |
Enhanced skin cancer awareness program | | Various | | 250 | | | | 250 | | |
Equipment Replacement | | | | | | | | | | |
Northern Zone | | Various | | | | | | 10,613 | | Ongoing |
Central Zone | | Various | | | | | | 19,743 | | Ongoing |
Southern Zone | | Various | | | | | | 14,234 | | Ongoing |
Pathology and Scientific Services | | 05 | | | | | | 2,678 | | Ongoing |
Public Health | | 05 | | | | | | 113 | | Ongoing |
Projects finalisation | | 05 | | | | | | 1,000 | | Ongoing |
Healthy Hearing* | | Various | | 2,825 | | 325 | | 600 | | 1,900 |
Positron Emission Topography | | | | | | | | | | |
Scanner program, Herston | | 05 | | 5,000 | | | | 5,000 | | |
Townsville cancer treatment | | 45 | | 2,000 | | | | 2,000 | | |
Sterilising services - equipment | | Various | | 2,400 | | 900 | | 500 | | 1,000 |
Sub-total Health Technology Projects | | | | | | | | 56,731 | | |
Mental Health (MHS) | | | | | | | | | | |
Cairns Rehabilitation and Dual Diagnosis Unit* | | 50 | | 3,000 | | | | 3,000 | | |
Rockhampton Child and Youth MHS - relocation | | 30 | | 637 | | 102 | | 535 | | |
Sub-total Mental Health | | | | | | | | 3,535 | | |
Residential Care | | | | | | | | | | |
State Government Residential Aged Care Facilities Program | | | | | | | | | | |
Dalby | | 20 | | 14,558 | | 566 | | 4,060 | | 9,932 |
| | | | |
| | | Capital Statement 2004-05 | | 51 |
| | | | | | | | | | |
Maryborough | | 15 | | 15,667 | | 2,452 | | 10,000 | | 3,215 |
Redcliffe | | 05 | | 10,718 | | 5,907 | | 4,630 | | 181 |
Redland | | 05 | | 19,875 | | 3,790 | | 15,835 | | 250 |
Roma | | 25 | | 8,968 | | 512 | | 7,070 | | 1,386 |
Sandgate | | 05 | | 11,946 | | 4,130 | | 7,477 | | 339 |
Townsville | | 45 | | 15,760 | | 3,639 | | 11,500 | | 621 |
Warwick | | 20 | | 6,676 | | 323 | | 3,070 | | 3,283 |
Wondai | | 15 | | 8,564 | | 229 | | 2,677 | | 5,658 |
Program management | | Various | | 4,381 | | 1,140 | | 1,181 | | 2,060 |
Miscellaneous upgrade works | | Various | | 1,294 | | 494 | | 200 | | 600 |
Sub-total Residential Care Projects | | | | | | | | 67,700 | | |
Staff Accommodation Program | | | | | | | | | | |
Mt Isa staff accommodation (Block 2)* | | 55 | | 1,500 | | | | 1,500 | | |
Rockhampton staff accommodation* | | 30 | | 3,000 | | | | 1,500 | | 1,500 |
South Burnett staff accommodation | | 15 | | 450 | | 150 | | 300 | | |
Thursday Island staff accommodation | | 50 | | 2,535 | | 528 | | 1,820 | | 187 |
Other staff accommodation* | | Various | | 5,000 | | | | 2,000 | | 3,000 |
Emergent accommodation needs | | Various | | | | | | 500 | | Ongoing |
Project finalisation | | Various | | | | | | 210 | | Ongoing |
Sub-total Staff Accommodation | | | | | | | | 7,830 | | |
Other Acquisitions of Property, Plant and Equipment | | | | | | | | | | |
Minor capital projects and acquisitions(1) | | Various | | | | | | 24,814 | | Ongoing |
Gold Coast Hospital, birthing centre(2) | | 10 | | 300 | | | | 300 | | |
Caboolture mental health accommodation (2) | | 05 | | 600 | | | | 600 | | |
Herston block 7 refurbishment | | 05 | | 75,600 | | 15,145 | | 27,700 | | 32,755 |
Corporate priorities and emergent needs | | Various | | | | | | 2,300 | | |
Health Hotline initiative | | Various | | 10,000 | | | | 5,000 | | 5,000 |
Queensland Bone Bank redevelopment | | 05 | | 6,630 | | 702 | | 5,928 | | |
Support service facilities and corporate accommodation | | Various | | | | | | 500 | | Ongoing |
Sub-total Other Acquisitions of Property, Plant and Equipment | | | | | | | | 67,142 | | |
Total Property, Plant and Equipment | | | | | | | | 295,749 | | |
Other Capital Expenditure | | | | | | | | | | |
Inventory movement | | Various | | | | | | 1,521 | | Ongoing |
Information and communication technology | | | | | | | | | | |
Clinical enablement | | | | | | | | | | |
Hospital and community health care system(3) | | Various | | 287,871 | | 28,352 | | 33,243 | | 226,276 |
Resource management enablement | | | | | | | | | | |
Asset maintenance system | | Various | | 5,700 | | 3,272 | | 2,428 | | |
Decision support enablement | | | | | | | | | | |
Health Information Centre system | | 05 | | | | | | 1,535 | | Ongoing |
Qld Cancer registry | | 05 | | 1,000 | | | | 400 | | 600 |
IT infrastructure | | | | | | | | | | |
Workstation management | | Various | | 30,767 | | 22,709 | | 7,558 | | 500 |
Communications and networks | | Various | | | | | | 14,821 | | Ongoing |
Data centre program | | Various | | 48,536 | | 26,511 | | 12,025 | | 10,000 |
Telecommunications replacements Infrastructure | | Various | | | | | | 500 | | Ongoing |
| | | | |
| 52 | | Capital Statement 2004-05 | | |
| | | | | | | | | | |
I-Net infrastructure | | Various | | 14,046 | | 5,714 | | 2,238 | | 6,094 |
Security services | | Various | | 12,696 | | 8,204 | | 3,292 | | 1,200 |
IT service support | | Various | | | | | | 631 | | Ongoing |
IT emergent needs | | Various | | | | | | 588 | | Ongoing |
Sub-total Information and Communication Technology | | | | | | | | 79,259 | | |
Total Other Capital Expenditure | | | | | | | | 80,780 | | |
Capital Grants | | | | | | | | | | |
Corporate Capital Grants | | | | | | | | | | |
Home and Community Care | | Various | | | | | | 5,500 | | Ongoing |
Mater Hospital reconstruction - scoping | | 05 | | | | | | 1,000 | | Ongoing |
Royal Flying Doctor Service | | Various | | 24,188 | | 2,419 | | 21,769 | | |
Total Capital Grants | | | | | | | | 28,269 | | |
TOTAL - DEPARTMENT OF HEALTH | | | | | | | | 404,798 | | |
QUEENSLAND INSTITUTE OF MEDICAL RESEARCH | | | | | | | | | | |
Property, Plant and Equipment | | | | | | | | | | |
Other plant & equipment | | 05 | | | | | | 1,600 | | Ongoing |
Total Property, Plant and Equipment | | | | | | | | 1,600 | | |
TOTAL - QUEENSLAND INSTITUTE OF MEDICAL RESEARCH | | | | | | | | 1,600 | | |
TOTAL HEALTH | | | | | | | | 406,398 | | |
Notes:
| 1. | Amount is net of Capital Expense - $14.3 million. |
| 2. | Minor capital project funded internally. |
| 3. | $38.7 million included in Hospital and Community Health Care System is funded from the Commonwealth for QIEP projects. |
| * | Funded under Smart State Building Fund |
| | | | |
| | | Capital Statement 2004-05 | | 53 |
HOUSING
The department has in place a Capital Investment Strategic Plan 2003-08 which complements the department’s Strategic Plan 2003-08 by establishing appropriate asset management practices to support service delivery and the department’s output strategies.
The department’s capital expenditure program for 2004-05 is $366 million. The capital program contributes to the achievement of the department’s outputs, providing a range of solutions including public housing, Aboriginal and Torres Strait Islander housing, community housing, community renewal and private housing.
Program Highlights
| | • | $10 million will be allocated to improve the supply of affordable housing in Brisbane. $20 million from 2005 to 2007 is provided for a small number of regional centres to improve the supply of affordable housing. Funding will be provided where councils have demonstrated they genuinely want to work with the Government to improve the supply of affordable housing in their area. |
| | • | Capital grants of $45.7 million will be allocated to 34 discrete Indigenous communities for the construction of new houses to reduce overcrowding and provide for major upgrades to ensure existing buildings are safe and healthy. |
| | • | $14.2 million will be invested to commence the construction of 36 new dwellings (including six on Thursday Island) complete dwellings commenced in previous years, purchase land, and continue further major redevelopment and expansion of housing on Thursday Island under the Aboriginal and Torres Strait Housing Output. Upgrades will also commence on 326 rental dwellings totalling $7.7 million. |
| | • | $17.6 million will be expended through the Community Housing Output for crisis accommodation initiatives including: |
| | • | commence construction of two new and upgrade five existing women’s shelters in remote Aboriginal and Torres Strait Islander communities; |
| | • | commence preliminary design of four women’s shelters in remote Aboriginal and Torres Strait Islander communities and one in Brisbane; |
| | • | commence construction of five accommodation units for women and children escaping domestic and family violence; |
| | • | undertake initial consultation for three shelters to target men and youth; |
| | • | acquire 25 additional dwellings for use as transitional housing; |
| | • | upgrade existing men’s hostel in Townsville; and |
| | • | provide upgrades to 50 Department of Housing properties. |
| | | | |
| 54 | | Capital Statement 2004-05 | | |
| | • | $6 million will be allocated to provide an additional 19 units of accommodation for transitional housing to provide improved options for homeless people. $4.1 million will be allocated to commence construction of 25 units of accommodation for single persons at Hervey Bay and 25 units of accommodation at Gympie under the Boarding House Program ($3 million funding as part of the Smart State Building Fund for 2004-05). $15 million will be allocated under the Long Term Community Housing Program initiative to: |
| | • | complete construction of 31 dwellings; |
| | • | commence construction of 15 dwellings; and |
| | • | acquire an additional 20 dwellings. |
| | • | $8.1 million will be allocated towards improving community facilities and neighbourhood amenities in targeted areas across Queensland under the Community Renewal Program. |
| | • | $11.9 million will be allocated under the Private Housing output for the Brisbane Housing Company to complete the construction of approximately 150 units of accommodation taking the total stock to over 300. |
| | • | Under the Private Housing output, the department will be marketing lots for sale throughout the Kelvin Grove Urban Village in a staged process. The Department will assist the Brisbane Housing Company through the proposed development of suitable vacant land at the Kelvin Grove Urban Village for affordable Housing outcomes. |
| | • | $10 million will be allocated to improve the supply of affordable housing. |
| | • | The Public Rental Housing output will invest $76.9 million to commence 320 new dwellings and complete 285 dwellings commenced in 2003-04 or previous years. Of the 320 dwelling commencements, 164 will be built to adaptable standards, with an estimated 22 being specifically adapted for clients with a disability. |
| | • | Sixteen dwellings will be acquired for future public rental housing solutions at a cost of $7.5 million and land purchased to facilitate future construction of approximately 165 units of accommodation at a cost of $20.1 million. |
| | • | The condition of existing public rental housing dwellings will be enhanced through a $110.3 million upgrade program which includes the continuation of urban and portfolio renewal across Queensland ($5 million funding as part of the Smart State Building Fund). Two new renewal projects will commence in Bracken Ridge and New Auckland. |
| | • | An estimated 1,318 FTE jobs directly sustained in the residential construction sector and a further 1,338 FTE jobs in related supply sectors, based on construction related capital investment of $216.3 million and capital grants expenditure of $95.6 million. |
| | | | |
| | | Capital Statement 2004-05 | | 55 |
Housing
| | | | | | | | | | |
Project
| | Statistical
Division
| | Total
Estimated Cost
| | Expenditure
to 30-06-04
| | Budget 2004-05
| | Post
2004-05
|
| | | | | $’000 | | $’000 | | $’000 | | $’000 |
DEPARTMENT OF HOUSING | | | | | | | | | | |
PUBLIC HOUSING | | | | | | | | | | |
Property, Plant and Equipment | | | | | | | | | | |
New Construction and Acquisition | | | | | | | | | | |
Brisbane | | | | | | | | | | |
Detached houses | | 05 | | | | | | 10,470 | | Ongoing |
Medium density | | 05 | | | | | | 28,060 | | Ongoing |
Seniors’ units | | 05 | | | | | | 2,067 | | Ongoing |
Moreton | | | | | | | | | | |
Detached houses | | 10 | | | | | | 2,630 | | Ongoing |
Medium density | | 10 | | | | | | 3,327 | | Ongoing |
Seniors’ units | | 10 | | | | | | 1,430 | | Ongoing |
Wide Bay-Burnett | | | | | | | | | | |
Detached houses | | 15 | | | | | | 1,159 | | Ongoing |
Medium density | | 15 | | | | | | 162 | | Ongoing |
Seniors’ units | | 15 | | | | | | 2,553 | | Ongoing |
Darling Downs | | | | | | | | | | |
Detached houses | | 20 | | | | | | 1,203 | | Ongoing |
Medium density | | 20 | | | | | | 1,958 | | Ongoing |
Seniors’ units | | 20 | | | | | | 952 | | Ongoing |
Fitzroy | | | | | | | | | | |
Detached houses | | 30 | | | | | | 512 | | Ongoing |
Medium density | | 30 | | | | | | 1,741 | | Ongoing |
Singles’ accommodation | | | | | | | | 1,500 | | |
Mackay | | | | | | | | | | |
Detached houses | | 40 | | | | | | 585 | | Ongoing |
Medium density | | 40 | | | | | | 2,007 | | Ongoing |
Northern | | | | | | | | | | |
Detached houses | | 45 | | | | | | 536 | | Ongoing |
Medium density | | 45 | | | | | | 2,549 | | Ongoing |
Seniors’ units | | 45 | | | | | | 1,581 | | Ongoing |
Singles’ accommodation | | 45 | | | | | | 750 | | Ongoing |
Far North | | | | | | | | | | |
| | | | |
| 56 | | Capital Statement 2004-05 | | |
| | | | | | | | | | |
Detached houses | | 50 | | | | | | 1,781 | | Ongoing |
Medium density | | 50 | | | | | | 3,336 | | Ongoing |
Seniors’ units | | 50 | | | | | | 234 | | Ongoing |
Singles’ accommodation | | | | | | | | 750 | | Ongoing |
North West | | | | | | | | | | |
Detached houses | | 55 | | | | | | 2,038 | | Ongoing |
Seniors’ units | | 55 | | | | | | 1,045 | | Ongoing |
Sub-total New Construction and Acquisition | | | | | | | | 76,916 | | |
Capital works on existing dwellings | | | | | | | | | | |
Brisbane | | 05 | | | | | | 64,206 | | Ongoing |
Moreton | | 10 | | | | | | 13,651 | | Ongoing |
Wide Bay-Burnett | | 15 | | | | | | 3,871 | | Ongoing |
Darling Downs | | 20 | | | | | | 3,989 | | Ongoing |
South West (QLD) | | 25 | | | | | | 450 | | Ongoing |
Fitzroy | | 30 | | | | | | 4,449 | | Ongoing |
Central West (QLD) | | 35 | | | | | | 470 | | Ongoing |
Mackay | | 40 | | | | | | 3,792 | | Ongoing |
Northern (QLD) | | 45 | | | | | | 9,431 | | Ongoing |
Far North | | 50 | | | | | | 3,517 | | Ongoing |
North West | | 55 | | | | | | 2,499 | | Ongoing |
Sub-total capital works on existing dwellings * | | | | | | | | 110,325 | | |
Land purchases and development | | Various | | | | | | 20,144 | | Ongoing |
Spot purchases | | Various | | | | | | 7,500 | | Ongoing |
Total Property, Plant and Equipment | | | | | | | | 214,885 | | |
TOTAL PUBLIC HOUSING | | | | | | | | 214,885 | | |
PRIVATE HOUSING | | | | | | | | | | |
Property, Plant and Equipment | | | | | | | | | | |
Land purchases and development | | 05 | | | | | | 3,091 | | Ongoing |
Total Property, Plant and Equipment | | | | | | | | 3,091 | | |
| | | | |
| | | Capital Statement 2004-05 | | 57 |
| | | | | | | | | | |
Other Capital Expenditure | | | | | | | | | | |
Inventory | | 05 | | | | | | 2,300 | | Ongoing |
Total Other Capital Expenditure | | | | | | | | 2,300 | | |
Capital Grants | | | | | | | | | | |
Residential Service Industry and Budget Accommodation Grant | | Various | | | | | | 1,222 | | Ongoing |
Brisbane Housing Company | | 05 | | | | | | 11,900 | | Ongoing |
Other | | | | | | | | 10,000 | | |
Total Capital Grants | | | | | | | | 23,122 | | |
TOTAL PRIVATE HOUSING | | | | | | | | 28,513 | | |
| ABORIGINAL AND TORRES STRAIT ISLANDER HOUSING | | | | | | | | | | |
Property, Plant and Equipment | | | | | | | | | | |
New construction | | | | | | | | | | |
Brisbane | | 05 | | | | | | 1,621 | | Ongoing |
Moreton | | 10 | | | | | | 395 | | Ongoing |
Wide Bay-Burnett | | 15 | | | | | | 448 | | Ongoing |
Darling Downs | | 20 | | | | | | 190 | | Ongoing |
South West | | 25 | | | | | | 392 | | Ongoing |
Fitzroy | | 30 | | | | | | 702 | | Ongoing |
Mackay | | 40 | | | | | | 690 | | Ongoing |
Northern | | 45 | | | | | | 1,610 | | Ongoing |
Far North | | 50 | | | | | | 5,602 | | Ongoing |
North West | | 55 | | | | | | 550 | | Ongoing |
Various | | | | | | | | 500 | | Ongoing |
Sub-total new construction | | | | | | | | 12,700 | | |
Capital works on existing | | | | | | | | | | |
Brisbane | | 05 | | | | | | 527 | | Ongoing |
Moreton | | 10 | | | | | | 50 | | Ongoing |
| | | | |
| 58 | | Capital Statement 2004-05 | | |
| | | | | | | | | | |
Wide Bay-Burnett | | 15 | | | | | | 70 | | Ongoing |
Darling Downs | | 20 | | | | | | 100 | | Ongoing |
South West | | 25 | | | | | | 723 | | Ongoing |
Fitzroy | | 30 | | | | | | 490 | | Ongoing |
Central West | | 35 | | | | | | 9 | | Ongoing |
Mackay | | 40 | | | | | | 200 | | Ongoing |
Northern | | 45 | | | | | | 1,000 | | Ongoing |
Far North | | 50 | | | | | | 3,230 | | Ongoing |
North West | | 55 | | | | | | 1,301 | | Ongoing |
Sub-total capital works on existing | | | | | | | | 7,700 | | |
Purchase of land | | | | | | | | | | |
Brisbane | | 05 | | | | | | 310 | | Ongoing |
Fitzroy | | 30 | | | | | | 120 | | Ongoing |
Mackay | | 40 | | | | | | 180 | | Ongoing |
Northern | | 45 | | | | | | 140 | | Ongoing |
Far North | | 50 | | | | | | 630 | | Ongoing |
North West | | 55 | | | | | | 120 | | Ongoing |
Sub-total purchase of land | | | | | | | | 1,500 | | |
Total Property, Plant and Equipment | | | | | | | | 21,900 | | |
Capital Grants | | | | | | | | | | |
Capital grants to Aboriginal and Torres Strait Islander Councils | | | | | | | | | | |
Wide Bay-Burnett | | 15 | | | | | | 945 | | Ongoing |
Fitzroy | | 30 | | | | | | 1,084 | | Ongoing |
Northern | | 45 | | | | | | 2,708 | | Ongoing |
Far North | | 50 | | | | | | 34,727 | | Ongoing |
North West | | 55 | | | | | | 2,853 | | Ongoing |
Various | | | | | | | | 3,371 | | Ongoing |
Total Capital Grants | | | | | | | | 45,688 | | |
TOTAL ABORIGINAL AND TORRES STRAIT ISLANDER HOUSING | | | | | | | | 67,588 | | |
| | | | |
| | | Capital Statement 2004-05 | | 59 |
| | | | | | | | | | |
COMMUNITY HOUSING | | | | | | | | | | |
Property, Plant and Equipment | | | | | | | | | | |
New capital works | | | | | | | | | | |
Brisbane | | 05 | | | | | | 1,113 | | Ongoing |
Moreton * | | 10 | | | | | | 3,700 | | Ongoing |
Wide Bay-Burnett * | | 15 | | | | | | 2,020 | | Ongoing |
Darling Downs | | 20 | | | | | | 20 | | Ongoing |
Fitzroy * | | 30 | | | | | | 250 | | Ongoing |
North West | | 55 | | | | | | 20 | | Ongoing |
Various * | | Various | | | | | | 500 | | Ongoing |
Sub-total new capital works | | | | | | | | 7,623 | | |
Spot purchase | | | | | | | | | | |
Northern | | 45 | | | | | | 1,475 | | Ongoing |
Various | | Various | | | | | | 13,538 | | Ongoing |
Sub-total spot purchase | | | | | | | | 15,013 | | |
Capital works on existing | | Various | | | | | | 1,000 | | Ongoing |
Land acquisition | | Various | | | | | | 300 | | Ongoing |
Total Property, Plant and Equipment | | | | | | | | 23,936 | | |
Capital Grants | | | | | | | | | | |
Brisbane | | 05 | | | | | | 2,341 | | Ongoing |
Moreton | | 10 | | | | | | 1,562 | | Ongoing |
Wide Bay-Burnett | | 15 | | | | | | 938 | | Ongoing |
Darling Downs | | 20 | | | | | | 568 | | Ongoing |
South West | | 25 | | | | | | 665 | | Ongoing |
Fitzroy | | 30 | | | | | | 2,425 | | Ongoing |
Central West | | 35 | | | | | | 393 | | Ongoing |
Mackay | | 40 | | | | | | 1,410 | | Ongoing |
Northern | | 45 | | | | | | 3,144 | | Ongoing |
Far North | | 50 | | | | | | 2,755 | | Ongoing |
North West | | 55 | | | | | | 2,462 | | Ongoing |
Total Capital Grants | | | | | | | | 18,663 | | |
TOTAL COMMUNITY HOUSING | | | | | | | | 42,599 | | |
COMMUNITY RENEWAL | | | | | | | | | | |
| | | | |
| 60 | | Capital Statement 2004-05 | | |
| | | | | | | | | | |
Capital Grants | | | | | | | | | | |
Brisbane | | 05 | | | | | | 4,417 | | Ongoing |
Northern | | 45 | | | | | | 1,166 | | Ongoing |
Far North | | 50 | | | | | | 755 | | Ongoing |
Statewide | | Various | | | | | | 1,771 | | Ongoing |
Total Capital Grants | | | | | | | | 8,109 | | |
TOTAL COMMUNITY RENEWAL | | | | | | | | 8,109 | | |
HOME PURCHASE ASSISTANCE | | | | | | | | | | |
Property, Plant and Equipment | | | | | | | | | | |
Rental Purchase Plan | | Various | | | | | | 200 | | Ongoing |
Total Property, Plant and Equipment | | | | | | | | 200 | | |
TOTAL HOME PURCHASE ASSISTANCE | | | | | | | | 200 | | |
PLANT AND EQUIPMENT | | | | | | | | | | |
Property, Plant and Equipment | | | | | | | | | | |
Property, plant and equipment | | Various | | | | | | 800 | | Ongoing |
Total Property, Plant and Equipment | | | | | | | | 800 | | |
Other Capital Expenditure | | | | | | | | | | |
Intangibles | | Various | | | | | | 3,280 | | Ongoing |
Total Other Capital Expenditure | | | | | | | | 3,280 | | |
TOTAL PLANT AND EQUIPMENT | | | | | | | | 4,080 | | |
TOTAL HOUSING | | | | | | | | 365,974 | | |
| * | Funded fully or in part under the Smart State Building Fund. |
| | | | |
| | | Capital Statement 2004-05 | | 61 |
INDUSTRIAL RELATIONS
Program Highlights
| | • | In 2004-05 expenditure on capital items for the Department of Industrial Relations will amount to $1.9 million, mainly to invest in the information technology business systems that support service delivery and to replace computer equipment. |
| | • | Part of this funding has been provided for capital investment in the Queensland Industrial Relations Commission (QIRC) Case Management System, modernisation of QIRC systems and the Government On-Line Delivery project as part of the whole-of-Government learning and development initiative. |
Industrial Relations
| | | | | | | | | | |
Project
| | Statistical
Division
| | Total
Estimated
Cost
| | Expenditure
to 30-06-04
| | Budget
2004-05
| | Post
2004-05
|
| | | | | $’000 | | $’000 | | $’000 | | $’000 |
DEPARTMENT OF INDUSTRIAL RELATIONS | | | | | | | | | | |
Property, Plant and Equipment | | | | | | | | | | |
Plant and equipment | | Various | | | | | | 733 | | Ongoing |
Total Property, Plant and Equipment | | | | | | | | 733 | | |
Other Capital Expenditure | | | | | | | | | | |
Information Technology systems | | 05 | | 810 | | | | 810 | | |
QIRC case management system and modernisation of business systems | | 05 | | 514 | | 174 | | 340 | | |
Total Other Capital Expenditure | | | | | | | | 1,150 | | |
TOTAL DEPARTMENT OF INDUSTRIAL RELATIONS | | | | | | | | 1,883 | | |
| | | | |
| 52 | | Capital Statement 2004-05 | | |
JUSTICE AND ATTORNEY-GENERAL
The 2004-05 capital expenditure program for Justice and Attorney-General (Department of Justice and Attorney-General, Legal Aid Queensland, the Public Trust Office and PartnerOne) is $70.8 million.
The Department of Justice and Attorney-General’s capital expenditure program for 2004-05 is $63.8 million. The department’s capital program focuses mainly on designing, constructing and managing facilities and assets to ensure that the services in the justice system are effective, accessible and safe.
Program Highlights
| | • | Construction will continue on new courthouses at Caloundra and Thursday Island, land will be purchased for the Northern Districts (Brisbane) courthouse, provided under the Smart State Building Fund, and the Brisbane new magistrates courthouse is to be completed. |
| | • | The Smart State Building Fund provides funding for the upgrade of the Bowen courthouse with upgrades also commencing on the Hervey Bay courthouse and continuing on the Mackay courthouse. |
| | • | Funding is provided for the Integrated Justice Information Strategy to improve community safety through information sharing and increasing collaboration across the criminal justice system. Projects include the implementation of the bench charge sheet initiative and the transfer of results from the Magistrates Court and notifications of court results, court dates and orders to the criminal justice agencies. |
| | • | Funding is provided for the State Penalties Enforcement Registry to further develop the technology and infrastructure which underpins the system, enabling electronic registration of overdue fines, automated collection facilities and enforcement mechanisms. |
| | • | The State Reporting Bureau evidence, transcription and reporting system upgrade project will commence. The upgrade will provide core infrastructure in the Brisbane Magistrates Courts, fitout at the new Brisbane Magistrates Courts and audio and video infrastructure at Brisbane CBD Higher Courts. |
| | • | Legal Aid Queensland (LAQ) will invest $4.4 million in capital projects in 2004-05. In line with its Information Technology Strategic Plan, LAQ will deploy technologies to improve network information and performance, and ensure that the overall business strategy will continue to be aligned with IT investment. |
| | • | The Public Trust Office will spend $0.92 million on upgrading the foyer and the building at 444 Queen Street Brisbane (Head Office). This expenditure will enable the Public Trust Office to continue to provide a wide range of efficient services to the Queensland community. |
| | • | The PartnerOne (shared service provided located in the Justice portfolio) capital program will focus on developing and maintaining the environment and infrastructure for delivering high quality and cost effective corporate services. The program is based on the replacement of computers, printers and office equipment. |
| | | | |
| | | Capital Statement 2004-05 | | 63 |
Justice and Attorney-General
| | | | | | | | | | |
Project
| | Statistical
Division
| | Total
Estimated
Cost
| | Expenditure
to 30-06-04
| | Budget
2004-05
| | Post 2004-05
|
| | | | | $’000 | | $’000 | | $’000 | | $’000 |
DEPARTMENT OF JUSTICE AND ATTORNEY-GENERAL | | | | | | | | | | |
Property, Plant and Equipment | | | | | | | | | | |
Brisbane, new Magistrates’ courthouse | | 05 | | 135,500 | | 102,928 | | 32,572 | | |
Caloundra, land purchase and new courthouse | | 10 | | 7,040 | | 1,595 | | 5,445 | | |
Mackay, extend courthouse | | 40 | | 11,400 | | 10,327 | | 1,073 | | |
Thursday Island, new courthouse | | 50 | | 3,400 | | 617 | | 2,783 | | |
Hervey Bay, courthouse upgrade | | 15 | | 2,000 | | 300 | | 1,700 | | |
Bowen, courthouse upgrade* | | 40 | | 3,000 | | | | 1,000 | | 2,000 |
Northern Districts, land purchase and new courthouse* | | 05 | | 8,000 | | | | 1,500 | | 6,500 |
Court improvement program | | Various | | 4,160 | | 3,160 | | 1,000 | | |
Minor capital works | | Various | | | | | | 1,386 | | Ongoing |
Other plant and equipment | | Various | | | | | | 4,353 | | Ongoing |
Prosecutions accommodation fitout | | | | | | | | | | |
Brisbane | | 05 | | 500 | | | | 500 | | |
Townsville | | 45 | | 232 | | | | 232 | | |
Total Property, Plant and Equipment | | | | | | | | 53,544 | | |
Other Capital Expenditure | | | | | | | | | | |
Integrated Justice Information Strategy | | 05 | | 10,101 | | 2,791 | | 7,310 | | |
State Penalties Enforcement Registry project | | 05 | | 10,680 | | 8,680 | | 2,000 | | |
SRB - state of the art evidence, transcription and reporting system1 | | 05 | | 2,539 | | | | 237 | | 2,302 |
Other capital expenditure | | 05 | | | | | | 677 | | Ongoing |
Total Other Capital Expenditure | | | | | | | | 10,224 | | |
TOTAL DEPARTMENT OF JUSTICE AND ATTORNEY-GENERAL | | | | | | | | 63,768 | | |
PUBLIC TRUST OFFICE | | | | | | | | | | |
Property, Plant and Equipment | | | | | | | | | | |
Refurbishment of Queen Street Brisbane premises | | 05 | | 915 | | | | 915 | | |
Minor works | | Various | | | | | | 963 | | Ongoing |
Total Property, Plant and Equipment | | | | | | | | 1,878 | | |
Other Capital Expenditure | | | | | | | | | | |
Computer software | | Various | | | | | | 247 | | Ongoing |
Total Other Capital Expenditure | | | | | | | | 247 | | |
TOTAL PUBLIC TRUST OFFICE | | | | | | | | 2,125 | | |
LEGAL AID QUEENSLAND | | | | | | | | | | |
Property, Plant and Equipment | | | | | | | | | | |
General property, plant and equipment | | | | | | | | | | |
Brisbane | | 05 | | | | | | 362 | | Ongoing |
Regional office plant and equipment | | Various | | | | | | 74 | | Ongoing |
| | | | |
| 64 | | Capital Statement 2004-05 | | |
| | | | | | | | | | |
Motor vehicle replacements | | | | | | | | | | |
Brisbane | | 05 | | | | | | 399 | | Ongoing |
Regional office motor vehicle replacements | | Various | | | | | | 101 | | Ongoing |
Information Technology Projects | | 05 | | | | | | 3,477 | | Ongoing |
Total Property, Plant and Equipment | | | | | | | | 4,413 | | |
TOTAL LEGAL AID QUEENSLAND | | | | | | | | 4,413 | | |
PARTNERONE | | | | | | | | | | |
Property, Plant and Equipment | | | | | | | | | | |
General property, plant and equipment Brisbane | | 05 | | | | | | 344 | | Ongoing |
Regional office plant and equipment | | Various | | | | | | 156 | | Ongoing |
Total Property, Plant and Equipment | | | | | | | | 500 | | |
TOTAL PARTNERONE | | | | | | | | 500 | | |
TOTAL JUSTICE AND ATTORNEY-GENERAL | | | | | | | | 70,806 | | |
Note:
| 1. | The total expenditure on the State of the Art Evidence, Transcription and Reporting System in 2004-05 will be $1.937 million. In addition to the $0.237 million reported against the project, $1.2 million is funded from the new Brisbane Magistrates Courthouse 2004-05 Budget. The balance is funded internally by the Department of Justice and Attorney-General. |
| * | Funded under the Smart State Building Fund. |
| | | | |
| | | Capital Statement 2004-05 | | 65 |
LEGISLATIVE ASSEMBLY OF QUEENSLAND
Capital outlays in the area of property, plant and equipment are critical to the delivery of the Legislative Assembly and Parliamentary Service output. The 2004-05 capital outlay program for the Legislative Assembly is $2.7 million and will principally be allocated towards replacement of plant and equipment within in the Parliamentary precinct, and also address a range of minor capital works projects designed to improve the functionality and performance of existing building infrastructure.
Legislative Assembly of Queensland
| | | | | | | | | | |
Project
| | Statistical
Division
| | Total
Estimated
Cost
| | Expenditure
to 30-06-04
| | Budget
2004-05
| | Post
2004-05
|
| | | | | $’000 | | $’000 | | $’000 | | $’000 |
LEGISLATIVE ASSEMBLY OF QUEENSLAND | | | | | | | | | | |
Property, Plant and Equipment | | | | | | | | | | |
Parliament House stonework restoration | | 05 | | 12,384 | | 2,604 | | 100 | | 9,680 |
Redevelopment of loading dock | | 05 | | 690 | | | | 690 | | |
Upgrade of Parliament House evacuation system | | 05 | | 103 | | | | 103 | | |
Plant and equipment | | 05 | | | | | | 1,767 | | Ongoing |
Total Property, Plant and Equipment | | | | | | | | 2,660 | | |
TOTAL LEGISLATIVE ASSEMBLY OF QUEENSLAND | | | | | | | | 2,660 | | |
| | | | |
| 66 | | Capital Statement 2004-05 | | |
LOCAL GOVERNMENT, PLANNING, SPORT AND RECREATION
The Department of Local Government, Planning, Sport and Recreation capital works subsidy programs are designed to facilitate the creation of new or enhanced facilities to improve the delivery of services and products to communities and clients, and support the delivery of the Government’s policy priorities. This capital program provides for infrastructure to:
| | • | improve the general quality of life in Queensland communities |
| | • | improve participation in sport and active recreation |
| | • | improve access to services |
| | • | promote economic and social development. |
The majority of capital expenditure incurred by the department relates to capital grants and subsidies provided to local government bodies, sport and recreation organisations and Indigenous organisations to:
| | • | assist with the creation or upgrading of a range of capital infrastructure such as water supply and sewerage works |
| | • | assist with the building or upgrading of facilities which enhance the opportunities for communities to participate in sport and active recreation |
| | • | undertake capital works and purchase plant and equipment for outdoor recreation centres and the Townsville Sports Reserve. |
Program Highlights
Major capital expenditure also includes election commitments of:
| | • | $67 million for implementation plans for the augmentation of Brisbane wastewater treatment plants including Wacol, Sandgate and Oxley Creek |
| | • | $28.6 million for the Mackay wastewater reuse scheme |
| | • | $11 million subsidy towards the cost of upgrading Toowoomba City Council’s Wetalla wastewater treatment plant |
| | • | $6.2 million for the Yeppoon wastewater treatment and reuse scheme |
| | • | $3.1 million to develop an integrated Sports House facility adjacent to the Townsville Sports Reserve. |
In addition $16.2 million over three years has been allocated for the third stage of the Torres Strait Major Infrastructure Program. This funding will be matched by the Australian Government.
| | | | |
| | | Capital Statement 2004-05 | | 67 |
Other capital expenditure by the department is to ensure the ongoing maintenance and provision of an appropriate level of office equipment and information technology hardware for technical and administrative staff in Brisbane and regional offices.
| | | | |
| 68 | | Capital Statement 2004-05 | | |
Major Sports Facilities Authority
The capital program for the Major Sports Facilities Authority reflects the investment required to maintain existing sporting infrastructure to a standard appropriate for the conduct of national and international sporting events. In 2004-05, the provision of infrastructure and plant and equipment funding to the Brisbane Cricket Ground will further its ability to attract world class sporting events.
Local Government, Planning, Sport and Recreation
| | | | | | | | | | |
Project
| | Statistical
Division
| | Total
Estimated
Cost
| | Expenditure
to 30-06-04
| | Budget
2004-05
| | Post
2004-05
|
| | | | | $’000 | | $’000 | | $’000 | | $’000 |
DEPARTMENT OF LOCAL GOVERNMENT, PLANNING, SPORT AND RECREATION | | | | | | | | | | |
Property, Plant and Equipment | | | | | | | | | | |
Buildings | | | | | | | | | | |
Outdoor recreation centres | | Various | | | | | | 2,834 | | Ongoing |
Townsville Sports House | | 45 | | 3,100 | | 550 | | 2,550 | | |
Plant and equipment | | Various | | | | | | 1,731 | | Ongoing |
Total Property, Plant and Equipment | | | | | | | | 7,115 | | |
Capital Grants | | | | | | | | | | |
Local government infrastructure | | | | | | | | | | |
Roads | | Various | | | | | | 29,411 | | Ongoing |
Water | | Various | | | | | | 25,877 | | Ongoing |
Sewerage | | Various | | | | | | 76,924 | | Ongoing |
Other works | | Various | | | | | | 34,657 | | Ongoing |
Sport infrastructure | | | | | | | | | | |
Major facilities | | Various | | | | | | 10,000 | | Ongoing |
Minor facilities | | Various | | | | | | 5,000 | | Ongoing |
National standards sports facilities | | Various | | | | | | 20,079 | | Ongoing |
Indigenous Community Infrastructure | | | | | | | | | | |
Torres Strait – Major infrastructure program | | 50 | | 32,400 | | | | 10,600 | | 21,800 |
Wujal Wujal sewerage system | | 50 | | 3,658 | | 158 | | 3,500 | | |
Northern Peninsula Area water supply upgrade | | 50 | | 2,545 | | 2,145 | | 400 | | |
Lockhart River solid waste feasibility | | 50 | | 451 | | 103 | | 348 | | |
Aboriginal Council Chambers Doomadgee | | 55 | | 1,400 | | 1,000 | | 400 | | |
Doomadgee sewerage upgrade | | 55 | | 1,150 | | 950 | | 200 | | |
Pormpuraaw water supply upgrade | | 55 | | 200 | | | | 200 | | |
Other capital grants to | | Various | | | | | | 1,397 | | Ongoing |
Communities including heavy equipment | | | | | | | | | | |
Total Capital Grants | | | | | | | | 218,993 | | |
TOTAL DEPARTMENT OF LOCAL GOVERNMENT, PLANNING, SPORT AND RECREATION | | | | | | | | 226,108 | | |
MAJOR SPORTS FACILITIES AUTHORITY | | | | | | | | | | |
Property, Plant and Equipment | | | | | | | | | | |
Brisbane Cricket Ground1 | | 05 | | 1,600 | | | | 1,600 | | |
Total Property, Plant and Equipment | | | | | | | | 1,600 | | |
TOTAL MAJOR SPORTS FACILITIES AUTHORITY | | | | | | | | 1,600 | | |
TOTAL LOCAL GOVERNMENT, PLANNING, SPORT AND RECREATION | | | | | | | | 227,708 | | |
Note:
| 1. | Funding does not include final stage of the Gabba redevelopment to be undertaken in 2004-05. Funding will be determined once design and construction documentation is complete. |
| | | | |
| | | Capital Statement 2004-05 | | 69 |
MAIN ROADS
Main Roads strategically manages, plans, develops, operates and maintains the State road network, while recognising and taking into account the wider transport task, community and industry needs and the environment.
The State’s investment in the road network not only provides the people of Queensland with a safe and efficient mode of transportation, but also contributes to the Government objectives, particularly job creation, by:
| | • | promoting economic development, especially in regional areas |
| | • | assisting the competitiveness of Queensland industry through improved transport efficiency |
| | • | upgrading the standard of living for the Queensland public, especially in rural communities and remote areas. |
The five-year Roads Implementation Program, which is published annually, reflects more than $1 billion per year for regional roadworks throughout Queensland (including some $700 million in roads capital projects), generating sustainable employment and training opportunities for some 17,500 people, each year, over the life of the five-year program.
The road network plays a vital role in the economic well-being of the state. Road transport forms a significant input cost to many industries and the availability and cost of access can have a major impact on their future viability. An efficient network of major urban and rural roads reduces these industries’ transport costs and facilitates their competitive position in the domestic and global marketplace.
Program Highlights
| | • | Extra funds of $186.3 million over three years as part of the Smart State Building Fund announced by the State Government in December 2003 to accelerate various road projects throughout Queensland; boosted by a further $301 million committed in the 2004 state election for key initiatives, namely: a further $120 million for the $360 million Tugun Bypass project ($240 million State Government/$120 million Australian Government); $120 million to construct Stage 1 of the Centenary Highway extension from Springfield to Ripley Road; $35 million to construct the Pacific Paradise interchange on the Sunshine Motorway; and $26 million for construction of the Yeppoon Western bypass, upgrade of Yeppoon – Tanby Road and associated road demaining package. |
| | • | Further extra funding of $19.8 million in 2004-05 towards a four-year $571 million Arterial Roads Infrastructure package of roadworks. This funding package will be used to accelerate key roads capital projects. Projects to be accelerated using funding under the package, as well as funding of $168.8 million from existing road sources, include construction of Stages 2 and 3 of the Caboolture Northern Bypass; a new two-lane link between Caloundra and Mooloolaba; four-laning works on the Sunshine Motorway between Maroochydore Road and Pacific Paradise (including duplication of the Maroochy River Bridge); extension of four-laning of the Mt Lindesay Highway to Rosia Road; four-laning of the Gold Coast Highway between Robert and Stevens Streets; and four-laning of the Nerang-Broadbeach Road from Allambe Cemetery to Ross Street. |
| | | | |
| 70 | | Capital Statement 2004-05 | | |
| | • | $19 million to complete the duplication of the Mount Lindesay Highway between Middle Road and Green Road and Fedrick Streets in 2004-05. |
| | • | $17.1 million to complete the construction of the Douglas Arterial in Townsville between University Road and Upper Ross River Road (jointly funded by the State and Australian Governments). |
| | • | $14.3 million towards the continuation of the duplication of the Sunshine Motorway between Mooloolaba and Maroochydore Roads. |
| | • | $10 million towards construction of the $26.5 million Linkfield Connection Road, funded as part of the Smart State Building Fund. |
| | • | $24.5 million in federal funding to continue upgrading sections of the Barkly Highway between Mt Isa and Camooweal at Johnson and Nowranie Creeks. |
| | • | $23.6 million to continue the federally-funded Ipswich Motorway interim safety works package. |
| | • | $7.1 million to complete sealing upgrades on sections of the Hervey’s Range Developmental Road between Ella Creek and Gregory Developmental Road. |
| | • | $3.9 million towards sealing improvements on the Peninsula Developmental Road between Coalseam and the Laura River. |
| | • | $2 million to begin four-laning the Mackay-Bucasia Road between George Fordyce Drive and Golf Links roundabout, funded as part of the Smart State Building Fund. |
| | • | $1.8 million to continue the construction of bridge and approaches on Gatton - Clifton Road at Heifer Creek. |
Main Roads
| | | | | | | | | | |
Project
| | Statistical
Division
| | Total
Estimated
Cost
| | Expenditure
to 30-06-04
| | Budget
2004-05
| | Post
2004-05
|
| | | | | $’000 | | $’000 | | $’000 | | $’000 |
DEPARTMENT OF MAIN ROADS | | | | | | | | | | |
Property, Plant and Equipment | | | | | | | | | | |
Corporate Buildings | | | | | | | | | | |
Nerang replacement of air conditioning | | 10 | | 500 | | 10 | | 490 | | |
Charleville new staff housing | | 25 | | 250 | | | | 250 | | |
Emerald single quarters accommodation | | 30 | | 600 | | 200 | | 400 | | |
Minor works | | Various | | | | | | 1,860 | | |
Sub-total Corporate buildings | | | | | | | | 3,000 | | |
National Highways | | | | | | | | | | |
| | | | |
| | | Capital Statement 2004-05 | | 71 |
| | | | | | | | | | |
Barkly Highway | | | | | | | | | | |
Mt Isa - Camooweal, Johnson Creek and Nowranie Creek, upgrade sections | | 55 | | 45,700 | | 6,360 | | 24,500 | | 14,840 |
Bruce Highway | | | | | | | | | | |
Burdekin Road safety audit improvements | | 45 | | 7,000 | | 1,100 | | 5,900 | | |
Cooroy - Gympie, duplication, planning study | | 10 | | 4,300 | | 1,084 | | 3,216 | | |
Innisfail - Cairns, Sheehy Road - Foster Road, construct additional lanes | | 50 | | 8,700 | | 1,751 | | 6,949 | | |
Mackay - Proserpine, Mandurana turnout - The Leap, realignment of 2 lanes | | 40 | | 8,200 | | 735 | | 2,000 | | 5,465 |
Maryborough - Gin Gin, Apple Tree Creek, realign 2 lanes | | 15 | | 6,000 | | 480 | | 3,000 | | 2,520 |
Cunningham Arterial | | | | | | | | | | |
Ipswich Motorway, priority interim safety works package | | 05 | | 66,000 | | 14,100 | | 23,600 | | 28,300 |
Cunningham Highway | | | | | | | | | | |
Ipswich - Warwick, Eight Mile - Kellys Hill (Sladevale Hill section), rehabilitate and widen | | 20 | | 4,000 | | 518 | | 3,482 | | |
Landsborough Highway | | | | | | | | | | |
Kynuna - Cloncurry, Williams River - Turpentine Creek, rehabilitate and widen | | 55 | | 5,000 | | 729 | | 4,271 | | |
Warrego Highway | | | | | | | | | | |
Ipswich - Toowoomba, Laidley - Plainland Road, construct interchange | | 10 | | 12,000 | | 1,480 | | 3,000 | | 7,520 |
Other construction | | Various | | | | | | 47,682 | | Ongoing |
Sub-total National Highways | | | | | | | | 127,600 | | |
Other State-controlled Roads | | | | | | | | | | |
Arterial Roads Infrastructure Package Caloundra – Mooloolaba Road, construct two lane link between Caloundra Road and Creekside Boulevard | | 10 | | 56,000 | | 1,489 | | 500 | | 54,011 |
D’Aguilar Highway, construct two lane bypass north of Caboolture from Bruce Highway to Old Gympie Road | | 05 | | 37,700 | | 192 | | 1,300 | | 36,208 |
Gold Coast Highway, four-laning from Robert Street to Stevens Street | | 10 | | 15,000 | | 100 | | 900 | | 14,000 |
Mount Lindesay Highway, Four-laning from Green Road to Rosia Road | | 05 | | 60,000 | | 4,007 | | 1,500 | | 54,493 |
Nerang – Broadbeach Road, Four-laning from Allambe Cemetery to Ross Street | | 10 | | 18,000 | | 200 | | 1,400 | | 16,400 |
Sunshine Motorway, Four-laning from Maroochydore Road to Pacific Paradise | | 10 | | 110,000 | | | | 1,000 | | 109,000 |
| | | | |
| 72 | | Capital Statement 2004-05 | | |
| | | | | | | | | | |
Arterial Roads Infrastructure Package 435,770 - Other | | Various | | | | | | 13,213 | | |
Blackwater - Rolleston Road, Tannyfoil section (20.70 - 31.05km), realign 2 lanes | | 30 | | 6,300 | | 3,000 | | 3,300 | | |
Boreen Point - Tewantin Road, Kimbah Court towards Noosa, rehabilitate and widen | | 10 | | 3,250 | | 250 | | 3,000 | | |
Brighton - Redcliffe Road, Bells Creek - Oxley Avenue, At-grade intersection improvement | | 05 | | 2,900 | | 560 | | 2,340 | | |
Bruce Highway, Ayr - Townsville, Douglas Arterial, University Road - Upper Ross River Road, construct to new sealed 2 lane standard | | 45 | | 46,890 | | 29,816 | | 17,074 | | |
Burke Developmental Road, Normanton - Dimbulah, Deadman’s Gully, upgrade floodway | | 55 | | 2,400 | | 780 | | 1,620 | | |
Burnett Highway, Gayndah - Monto, Burnett River at Ceratodus (89.2 - 89.3km), replace bridge | | 15 | | 2,294 | | 700 | | 1,594 | | |
Capalaba - Victoria Point Road, Windemere Road - Vienna Road, duplicate 2 to 4 lanes | | 05 | | 4,665 | | 865 | | 3,800 | | |
Capricorn Highway, Alpha - Barcaldine, (88.6 - 94.9km) from Alpha, widen and seal | | 35 | | 1,050 | | 9 | | 641 | | 400 |
Capricorn Highway, Alpha - Barcaldine, Shire boundary east, seal shoulders | | 30 | | 2,074 | | 59 | | 2,015 | | |
Carnarvon Highway, Roma - Injune, (63.66 - 71.2km), widen existing pavement | | 25 | | 2,530 | | 1,049 | | 1,481 | | |
Collinsville - Elphinstone Road, Cerito Road, construct to new unsealed standard, form and improve drainage | | 45 | | 9,000 | | 1,030 | | 1,795 | | 6,175 |
Cooktown Developmental Road, Cooktown - Butcher’s Hill, Little Annan River - Scrubby Creek, construct to seal standard | | 50 | | 4,336 | | 1,175 | | 3,161 | | |
Cooktown Developmental Road, Scrubby Creek - Sackleys Hill, construct to seal standard | | 50 | | 14,119 | | 1,520 | | 2,995 | | 9,604 |
Cunningham Highway, Inglewood - Goondiwindi, Sections: (33.47 - 85.18km), seal shoulders | | 20 | | 2,000 | | | | 1,300 | | 700 |
Dawson Highway, Gladstone - Biloela, Briffney roundabout - Chapman Drive, duplicate 2 to 4 lanes | | 30 | | 2,195 | | 46 | | 1,000 | | 1,149 |
Diamantina Developmental Road, Bedourie - Boulia, (177.3 - 184.7km), pave and seal | | 35 | | 1,012 | | 312 | | 700 | | |
Diamantina Developmental Road, Quilpie - Windorah, (0.0 - 37.5km section 1), widen existing pavement | | 25 | | 1,244 | | 4 | | 620 | | 620 |
| | | | |
| | | Capital Statement 2004-05 | | 73 |
| | | | | | | | | | |
Flinders Highway, Charters Towers - Hughenden, Mundic Creek - district boundary (86.46 - 132.17km and 136.45 - 139.95km), widen existing pavement | | 45 | | 8,201 | | 3,054 | | 5,147 | | |
Flinders Highway, Charters Towers - Hughenden, Burra Range (132.17 - 136.45km), Construct to new sealed 2 lane standard | | 45 | | 2,065 | | 317 | | 1,748 | | |
Flinders Highway, Richmond - Julia Creek, Boundary Creek and Nonda Creek, widen and seal | | 55 | | 1,275 | | 50 | | 1,225 | | |
Gatton - Clifton Road, Heifer Creek, Second crossing near Doyles Camp: (26.0 - 26.79km), construct bridge and approaches | | 10 | | 2,600 | | 788 | | 1,812 | | |
Gregory Highway, Springsure- Emerald, North of Fairbairn Dam turnoff, widen and seal | | 30 | | 2,093 | | 91 | | 2,002 | | |
Hervey’s Range Developmental Road, Townsville - Battery, Ella Creek - Gregory Developmental Road (101.5 - 126.3km), construct to new sealed 2 lane standard | | 45 | | 10,000 | | 2,935 | | 7,065 | | |
Hope Island Road, Columbus Avenue - Lae Drive, duplicate 2 to 4 lanes | | 10 | | 11,000 | | 4,600 | | 6,400 | | |
Innisfail - Japoon Road, South Johnstone Bridge (near mill), construct bridge and approaches | | 50 | | 9,860 | | 5,860 | | 4,000 | | |
Kennedy Developmental Road, Hughenden - Winton, (4.5 – 16.8km) widen shoulders and sealing | | 55 | | 2,729 | | 526 | | 2,203 | | |
Kennedy Developmental Road, Winton - Boulia, Poddy Creek west (85.0 - 95.0km), rehabilitate and widen | | 35 | | 1,400 | | 2 | | 1,398 | | |
Landsborough - Maleny Road, Sections: Bald Knob Road - Mountain View Road, reconstruct pavement | | 10 | | 8,500 | | 2,700 | | 5,800 | | |
Leichhardt Highway, Miles - Goondiwindi, Sections: (98.0 - 111.0km section 1), widen and seal | | 20 | | 2,000 | | 39 | | 1,130 | | 831 |
Linkfield Connection Road, construct to new sealed 2 lane standard* | | 05 | | 26,461 | | 7,461 | | 10,000 | | 9,000 |
Mackay - Bucasia Road, Habana Road - George Fordyce Drive, Duplicate 2 to 4 lanes* | | 40 | | 6,000 | | | | 2,000 | | 4,000 |
Mareeba - Dimbulah Road, Chettle Road - Barbetti Road, widen and seal | | 50 | | 1,640 | | 135 | | 1,505 | | |
| | | | |
| 74 | | Capital Statement 2004-05 | | |
| | | | | | | | | | |
Maryborough - Cooloola Road, Big Tuan Creek approaches (24.1-28.2km), widen existing pavement | | 15 | | 2,100 | | 1,000 | | 1,100 | | |
Mount Lindesay Highway, Brisbane-Beaudesert, Middle Road - Green Road/ Fedrick Street, duplicate 2 to 4 lanes | | 05 | | 47,000 | | 28,000 | | 19,000 | | |
Nerang - Broadbeach Road, Ross Street - Nielsens Road, Duplicate 2 to 4 lanes* | | 10 | | 21,500 | | 6,250 | | 550 | | 14,700 |
New England Highway, Yarraman-Toowoomba, Mt Kynoch - Highfields (107.01-109.4km), rehabilitate pavement | | 20 | | 1,600 | | 695 | | 905 | | |
Pacific Highway, Pacific 310,000 Motorway, Tugun - Tweed Heads, construct 4 lane bypass | | 10 | | 360,000 | | 27,400 | | 22,600 | | |
Peak Downs Highway, Nebo - Mackay, Stockyard Creek - Spring Creek, widen existing pavement | | 40 | | 2,750 | | 2,050 | | 700 | | |
Peninsula Developmental Road, Mt Molloy - Laura, Coalseam - Laura River, construct to seal standard | | 50 | | 7,046 | | 3,109 | | 3,937 | | |
Redlynch Intake Road, Rice’s Gully, construct bridge and approaches | | 50 | | 3,030 | | 126 | | 2,904 | | |
South West Arterial, Springfield 115,000 - Ripley, construct 2 lane road | | 05 | | 120,000 | | 1,300 | | 3,700 | | |
Sunshine Motorway, Mooloolaba - Peregian, Mooloolaba Road - Maroochydore Road, duplicate 2 to 4 lanes | | 10 | | 20,000 | | 5,660 | | 14,340 | | |
Sunshine Motorway, Pacific Paradise, construct interchange | | 10 | | 35,000 | | 20 | | 1,980 | | 33,000 |
Yeppoon Western Bypass Road and Tanby Road, construct Yeppoon Western bypass and upgrade Yeppoon - Tanby Road | | 30 | | 26,000 | | | | 3,600 | | 22,400 |
Other construction* | | Various | | | | | | 375,628 | | Ongoing |
Sub-total Other State - controlled Roads | | | | | | | | 572,628 | | |
Plant and Equipment | | | | | | | | 7,000 | | |
Total Property, Plant and Equipment | | | | | | | | 710,228 | | |
Other Capital Expenditure | | | | | | | | | | |
Information Technology | | | | | | | | 2,120 | | |
Total Other Capital Expenditure | | | | | | | | 2,120 | | |
Capital Grants | | | | | | | | | | |
Transport Infrastructure Development Scheme | | | | | | | | | | |
Balham Road extension to Beatty Road, Brisbane City, full road construction | | 05 | | 5,000 | | | | 2,200 | | 2,800 |
| | | | |
| | | Capital Statement 2004-05 | | 75 |
| | | | | | | | | | |
Bilbad - Balaleah Road, Mornington Shire, Form and gravel | | 55 | | 180 | | | | 180 | | |
Boulia - Tobermorey - Northern Territory, gravelling | | 35 | | 100 | | | | 100 | | |
Capella - Rubyvale Road (18.7 - 24.2km), Peak Downs Shire, bitumen seal | | 30 | | 100 | | | | 100 | | |
Doomadgee East Road (stage 2), upgrade formation and seal | | 55 | | 750 | | | | 350 | | 400 |
Eromanga - Thylungra Road, Quilpie Shire, pave and seal | | 25 | | 250 | | 165 | | 85 | | |
Fingerboard Road, Miriam Vale Shire, upgrade and seal | | 15 | | 2,100 | | 1,400 | | 700 | | |
Glenvale Road / McDougall Street, Toowoomba City, roundabout | | 15 | | 158 | | | | 158 | | |
Hopevale access road, sealing | | 50 | | 3,415 | | 1,089 | | 749 | | 1,577 |
Jundah - Winton Road (143 - 153km), Barcoo Shire, pavement and drainage | | 35 | | 90 | | | | 90 | | |
Kerwee Road, Perry Shire, realign and upgrade | | 15 | | 150 | | | | 126 | | 24 |
Laroona - Hidden Valley Road, Dalrymple Shire, drainage improvements | | 45 | | 300 | | 103 | | 197 | | |
Mabuiag Island Access road, town - airport - ramp, Upgrade drainage, form and gravel | | 50 | | 1,400 | | 500 | | 900 | | |
Mt Stewart - Bedford Weir Road (26.1 - 28.1km), Broadsound Shire, pave and seal | | 40 | | 100 | | | | 100 | | |
Naccowlah - Innaminka Road, Bulloo Shire, upgrade | | 25 | | 170 | | 85 | | 85 | | |
Niagara Road, Wambo Shire, upgrade to bitumen seal | | 20 | | 195 | | | | 122 | | 73 |
Noosa, demaining package | | 10 | | 65,587 | | 20,800 | | 22,600 | | 22,187 |
Northern Road, Bassett Lane - McPhee Street, Roma Town, parking area | | 25 | | 135 | | | | 135 | | |
Old Doomadgee Road, upgrade formation and resheet | | 55 | | 750 | | 450 | | 300 | | |
One Mile Bridge, West Ipswich and Six Mile Creek, Redbank, construct new bridge and approaches | | 05 | | 7,500 | | 5,100 | | 2,400 | | |
Pacific Motorway, Nathan - Logan Road, Bikeways | | 05 | | 4,000 | | 400 | | 1,740 | | 1,860 |
Pacific Motorway, Smith Street - Logan River, Bikeways | | 10 | | 3,500 | | 2,500 | | 700 | | 300 |
Point Cartwright Drive, Roundabout - Pacific Boulevard, Caloundra City, rehabilitate and upgrade | | 10 | | 120 | | | | 120 | | |
Riverside access road - North Goonyella Mine access road (13.7 - 17.9km), form and pave | | 40 | | 100 | | | | 100 | | |
Springvale - Diamantina Lakes Road, Diamantina Shire, upgrade | | 35 | | 100 | | | | 100 | | |
| | | | |
| 76 | | Capital Statement 2004-05 | | |
| | | | | | | | | | |
Stanwell - Waroula Road, Fitzroy Shire, bitumen seal | | 30 | | 135 | | 40 | | 95 | | |
Walter Gunn Bridge, Kondar Road, realign and widen | | 20 | | 500 | | 270 | | 97 | | 133 |
Western Road (37.4 - 43km), Tara Shire, seal gravelled sections | | 20 | | 97 | | | | 97 | | |
Other Capital Grants | | Various | | | | | | 26,499 | | Ongoing |
Sub-total Transport Infrastructure Development Scheme | | | | | | | | 61,225 | | |
Federal Black Spot | | 05 | | | | | | 8,923 | | Ongoing |
Total Capital Grants | | | | | | | | 70,148 | | |
TOTAL DEPARTMENT OF MAIN ROADS | | | | | | | | 782,496 | | |
ROADTEK | | | | | | | | | | |
Plant Hire Services | | | | | | | | | | |
Hire plant | | Various | | | | | | 18,169 | | Ongoing |
RoadTek Services | | | | | | | | | | |
Plant and equipment | | Various | | | | | | 1,783 | | Ongoing |
TOTAL ROADTEK | | | | | | | | 19,952 | | |
QUEENSLAND MOTORWAYS LIMITED | | | | | | | | | | |
Property Plant and Equipment | | | | | | | | | | |
Minor works | | 05 | | | | | | 10,000 | | |
TOTAL QUEENSLAND MOTORWAYS LIMITED | | | | | | | | 10,000 | | |
TOTAL MAIN ROADS | | | | | | | | 812,448 | | |
| * | Funded fully or in part under the Smart State Building Fund. |
| | | | |
| | | Capital Statement 2004-05 | | 77 |
NATURAL RESOURCES, MINES AND ENERGY
Estimated capital expenditure for Natural Resources, Mines and Energy (including the department, SunWater, Government-owned energy corporations and various water boards) in 2004-05 is $1.788 billion.
The department’s capital expenditure program of $39.4 million for 2004-05 principally comprises expenditure which supports the planning and management of the State’s land, water and native vegetation resources, the development of the State’s mineral resources and progresses the development and delivery of energy to the Queensland community.
Program Highlights
| | • | $20 million of capital funding over four years is provided to purchase land to meet the State’s commitment to end the broad-scale clearing of remnant native vegetation by 2006. |
| | • | $5 million is provided over the next three years from the Smart State Building Fund to enhance existing water resource monitoring programs. |
| | • | The department is the lead agency for Information Queensland – a three-year, $6.3 million initiative. The initiative includes funding of $3.3 million from the Smart State Building Fund. Currently in the planning phase, Information Queensland will offer information about Queensland’s physical, environmental, economic and social characteristics. Delivery will be through various electronic channels, particularly the Internet. |
| | • | $3.9 million over three years is provided from the Smart State Building Fund to upgrade security at the Bajool and Helidon Explosives Reserves. |
| | • | $67.5 million over five years is provided to modernise the Ross River Dam, including $5 million allocated in 2004-05. |
The department is the host of the shared service provider, CorporateLink, for eight government agencies. Approximately $5.6 million will be spent on information technology and office equipment in providing services to these agencies.
GOVERNMENT-OWNED ENERGY CORPORATIONS
CS Energy Limited
CS Energy is forecasting capital expenditure of $219.4 million in 2004-05. This capital expenditure program includes commencement of the construction of the Kogan Creek power project, along with ongoing capital requirements and major overhauls at the Callide, Swanbank and Mica Creek power stations.
Program Highlights
| | • | The Kogan Creek power project is forecast to cost $1.129 billion over 39 months. The project consists of a 750 Megawatt coal-fired base load power station and dedicated coal mine. The project is being developed in response to the projected growth in electricity consumption in Queensland and the National Electricity Market. |
| | | | |
| 78 | | Capital Statement 2004-05 | | |
| | • | Ongoing capital requirements at Callide, Swanbank and Mica Creek power stations are estimated at $47.4 million. These include the conversion of the boiler ashing system at Callide B to a dry ashing system in order to manage better long-term ash disposal requirements. |
| | • | The provision of $36.8 million for ongoing overhaul requirements at Callide, Swanbank and Mica Creek power stations. |
| | • | A further $5.3 million will be spent on a range of other business development projects. |
Stanwell Corporation Limited
Stanwell Corporation’s expected capital expenditure program for 2004-05 is $145.1 million. This relates predominantly to improving the efficiency of existing generation assets and investing in additional generation supply.
In addition, capital works will be directed at the development of additional generation supply in Queensland to support population growth and increasing energy demands, and generation opportunities outside the State to maximise shareholder value.
During 2004-05, $53.7 million will be invested in various regions for maintaining and improving the efficiency of existing assets to ensure reliable electricity supply in Queensland.
Tarong Energy Corporation Limited
Tarong Energy’s capital expenditure program in 2004-05 is $70.6 million and relates predominantly to maintaining operations at Tarong, Tarong North and Wivenhoe Power Stations.
Program Highlights
Major projects included in the capital expenditure program for 2004-05, include:
| | • | The purchase of land surrounding the ash dam to be used for a protection bund is budgeted to commence during this financial year |
| | • | Overhaul expenditure for 2004-05 includes two majors overhauls at Tarong Power Station, one minor overhaul at Tarong North Power Station and a major overhaul at the Wivenhoe Power Station |
| | • | The Generator Midlife Refit project, encompassing stator rewinds on all four generators commenced in 2002-03, with an expected completion in 2006-07 |
| | • | The commencement of the Wivenhoe Pipeline augmentation project. |
| | | | |
| | | Capital Statement 2004-05 | | 79 |
Enertrade
Enertrade’s proposed capital program for 2004-05 is $34.8 million. This capital expenditure relates predominantly to Enertrade’s management of the project to provide a gas-fired base load power station in north Queensland.
Enertrade’s project in north Queensland is converting the existing Townsville Power Station at Yabulu to combined-cycle operation using natural gas as its fuel. Enertrade has commenced construction of the pipeline between Moranbah and Townsville and the associated gas compression facilities. This project will see the first gas being delivered to Townsville in September 2004 and full completion of all works by February 2005.
This project assists in the delivery of the Government’s Cleaner Energy Strategy which is aimed at ensuring that adequate, reliable and competitively priced energy is available to users throughout Queensland. The project will also create employment, improve the environment and provide industrial and commercial development opportunities in the region.
In June 2003, Enertrade purchased the Barcaldine Power Station and associated gas pipeline from Cheepie to Barcaldine. Enertrade is carrying out refurbishment work on these assets, which will continue into 2004-05.
Powerlink Queensland
Powerlink Queensland is the transmission entity for Queensland. Powerlink’s core business includes the delivery of a secure, reliable transmission service to electricity market participants via open, non-discriminatory access to the Queensland transmission grid.
Capital expenditure program for 2004-05 is $168.7 million and includes a broad range of capital projects.
Program Highlights
Key projects to be undertaken during 2004-05 include:
| | • | Belmont–Murarrie transmission reinforcement to strengthen the transmission system to the Trade Coast area and Brisbane CBD |
| | • | Gold Coast transmission reinforcement to augment the transmission system supplying the Gold Coast area |
| | • | Darling Downs transmission reinforcement to augment the transmission system to the Darling Downs area |
| | • | Woree 132kV Static Var compensator to reinforce the network in the Cairns region with provision of dynamic voltage support equipment |
| | • | Cairns 132kV substation rebuild to replace aged equipment. |
| | | | |
| 80 | | Capital Statement 2004-05 | | |
ENERGEX Limited
ENERGEX Group continues to commit to higher levels of expenditure on the electricity and gas networks to cater for the load growth in south east Queensland, which continues to be the highest in Australia, and maintain system performance and reliability.
ENERGEX has an extensive condition-monitoring program to ensure those portions of the franchise license-area with aging infrastructure are identified in time to allow cost-effective replacement and upgrade projects to be implemented with minimal effect on customer supply.
The capital expenditure program for 2004-05 is $493.3 million, up from $316 million in 2003-04 – an increase of 56%. This includes $118.7 million on sub-station works, $105.1 million on customer requested works, $68.1 million on feeder related works and $28.3 million on transformer related works.
Program Highlights
Specific projects and their impact are as follows:
| | • | $26.4 million for the CBD (McLachlin St) 110/11 kV substation works in 2004-05. The works are required to meet the increasing demand growth in the Brisbane CBD. This will also contribute to an improved level of reliability of supply. |
| | • | $17.1 million for the Newstead 110kV substation upgrade in 2004-05. The upgrade is needed to meet the capacity requirements of future high voltage cable connections, ultimately reinforcing the CBD. |
| | • | $9.5 million for the Varsity Lakes 110/11 kV substation in 2004-05. The establishment of a new substation is needed to meet the expected demand growth in this developing area. |
| | • | $2.6 million for the Lytton bulk supply / Fisherman’s Island double circuits 110kV in 2004-05. This is integral to reinforce the Australian Trade Coast due to the continued load growth expected. |
| | • | $7.1 million for the Coomera 110/33kV transformer and 33/11kV zone substation in 2004-05. This is part of the $9.4 million second stage of the 110kv feeder project between Molendinar and Southport to the reinforce supply to the Gold Coast area. |
| | • | $8.3 million in 2004-05 for two projects in the Tewantin area being Tewantin 33/11kV modular substation and 2 x 33 kV feeders. These represent the commencement of a $9.7 million reinforcement project in the Tewantin/North Coast area. |
| | • | $6.7 million for business development opportunities in the regulated business. |
| | • | The 2004-05 capital works program will also target areas of declining reliability including: $2.4 million substation upgrade at Albany Creek; feeder related works at Archerfield, Toowong and Cleveland totalling $11.1 million; and an additional $3.2 million for transformer related works in Mooloolaba. |
| | | | |
| | | Capital Statement 2004-05 | | 81 |
Ergon Energy Corporation Limited
During the 2004-05 financial year Ergon Energy has budgeted capital expenditure of $529.5 million, up from $372.5 million – an increase of 42%. Ergon Energy’s capital program is focused on improving the performance of its electricity distribution network across regional Queensland and includes expenditure related to the construction, refurbishment, replacement and augmentation of network-related assets.
The 2004-05 capital expenditure program will continue to improve asset management practices and streamline work systems, enhance the electricity network and reduce the frequency and duration of interruptions to supply.
Program Highlights
| | • | $10.7 million for the installation of SCADA (system control and data acquisition) Master Station |
| | • | $4.9 million for the establishment of substations at Bargara and Point Vernon in the Wide Bay-Burnett Division. |
Natural Resources, Mines and Energy
| | | | | | | | | | |
| | | Statistical
Division
| | Total
Estimated
Cost
| | Expenditure
to 30-06-04
| | Budget
2004-05
| | Post
2004-05
Project
|
| | | | | $’000 | | $’000 | | $’000 | | $’000 |
DEPARTMENT OF NATURAL RESOURCES, MINES AND ENERGY | | | | | | | | | | |
Property, Plant and Equipment | | | | | | | | | | |
Building and accommodation upgrades | | | | | | | | | | |
Bundall Office refurbishment | | 10 | | 500 | | | | 500 | | |
Caboolture Office fitout | | 10 | | 150 | | | | 150 | | |
Indooroopilly Block B fitout | | 05 | | 130 | | | | 130 | | |
LandCentre fitouts | | 05 | | | | | | 850 | | Ongoing |
Mareeba - Peters Street Office | | 50 | | 320 | | | | 320 | | |
Mineral House fitouts | | 05 | | 180 | | | | 180 | | |
Rocklea Technical Centre | | 05 | | 150 | | | | 150 | | |
Minor works | | Various | | 887 | | | | 887 | | |
Dee River Dams - restoration works | | 25 | | 500 | | | | 500 | | |
Explosive magazine upgrades* | | | | | | | | | | |
Bajool | | 30 | | 1,850 | | | | 1,100 | | 750 |
Helidon | | 10 | | 2,300 | | 300 | | 900 | | 1,100 |
Land acquisitions for vegetation management | | Various | | 20,000 | | | | 5,000 | | 15,000 |
Government Land Register development | | Various | | | | | | 2,100 | | Ongoing |
Minor works | | Various | | | | | | 475 | | Ongoing |
Plant and equipment | | Various | | | | | | 14,221 | | Ongoing |
Information Queensland* Information access portal | | 05 | | 1,625 | | | | 875 | | 750 |
Water monitoring network upgrades* | | 05 | | | | | | 1,735 | | Ongoing |
Total Property, Plant and Equipment | | | | | | | | 30,073 | | |
| | | | |
| 82 | | Capital Statement 2004-05 | | |
| | | | | | | | | | |
Other Capital Expenditure | | | | | | | | | | |
Systems development | | | | | | | | | | |
13% Gas Scheme system | | 05 | | 600 | | | | 500 | | 100 |
Electronic access for registry lodgement | | 05 | | 682 | | | | 682 | | |
Electronic land and vegetation administration system | | 05 | | 2,363 | | 1,643 | | 720 | | |
Information Queensland* information access portal | | 05 | | 1,625 | | | | 875 | | 750 |
Other systems development | | 05 | | | | | | 1,598 | | Ongoing |
Total Other Capital Expenditure | | | | | | | | 4,375 | | |
Capital Grants | | | | | | | | | | |
Ross River Dam modernisation | | 45 | | 67,500 | | 2,500 | | 5,000 | | 60,000 |
Total Capital Grants | | | | | | | | 5,000 | | |
TOTAL DEPARTMENT OF NATURAL RESOURCES, MINES AND ENERGY | | | | | | | | 39,448 | | |
CORPORATELINK | | | | | | | | | | |
Property, Plant and Equipment | | | | | | | | | | |
Information technology | | 05 | | | | | | 2,951 | | Ongoing |
Information technology | | Various | | | | | | 328 | | Ongoing |
Office equipment | | 05 | | | | | | 1,863 | | Ongoing |
Office equipment | | Various | | | | | | 466 | | Ongoing |
Total Property, Plant and Equipment | | | | | | | | 5,608 | | |
TOTAL CORPORATELINK | | | | | | | | 5,608 | | |
GLADSTONE AREA WATER BOARD | | | | | | | | | | |
Property, Plant and Equipment | | | | | | | | | | |
Untreated water assets | | | | | | | | | | |
Raw water delivery system | | 30 | | 1,030 | | | | 740 | | 290 |
Other minor works | | 30 | | 405 | | | | 175 | | 230 |
Treated water assets | | | | | | | | | | |
Gladstone Water Treatment Plant | | 30 | | 2,500 | | | | 650 | | 1,850 |
Calliope Shire treated water assets | | 30 | | 1,500 | | | | 1,500 | | |
Treated water delivery system | | 30 | | 380 | | | | 380 | | |
Other minor works | | 30 | | 275 | | | | 125 | | 150 |
Minor works and other plant | | 30 | | 1,520 | | 30 | | 465 | | 1,025 |
Administration plant and equipment | | 30 | | 537 | | 50 | | 277 | | 210 |
Total Property, Plant and Equipment | | | | | | | | 4,312 | | |
TOTAL GLADSTONE AREA WATER BOARD | | | | | | | | 4,312 | | |
| | | | |
| | | Capital Statement 2004-05 | | 83 |
| | | | | | | | | | |
MOUNT ISA WATER BOARD | | | | | | | | | | |
Property, Plant and Equipment | | | | | | | | | | |
Lake Moondarra to Mount Isa terminal reservoir chlorination upgrade | | 55 | | 1,360 | | 162 | | 638 | | 560 |
Lake Moondarra to Mount Isa terminal reservoir pipeline repairs | | 55 | | 1,748 | | 1,604 | | 144 | | |
Mount Isa Terminal Reservoir pump station | | 55 | | 6,500 | | 354 | | 3,510 | | 2,636 |
Recreation Reserve R48 facilities upgrade | | 55 | | 1,380 | | 630 | | 250 | | 500 |
Lake Julius pumping system upgrade | | 55 | | 10,000 | | 2,300 | | 1,700 | | 6,000 |
Clear Water Lagoon embankment | | 55 | | 700 | | | | 700 | | |
Other | | 55 | | 1,027 | | | | 1,027 | | |
Total Property, Plant and Equipment | | | | | | | | 7,969 | | |
TOTAL MOUNT ISA WATER BOARD | | | | | | | | 7,969 | | |
SUNWATER | | | | | | | | | | |
Property, Plant and Equipment | | | | | | | | | | |
Water infrastructure – backlog and | | Various | | 60,075 | | 11,669 | | 12,142 | | 36,264 |
renewals | | | | | | | | | | |
Other water infrastructure and projects | | Various | | 94,053 | | 3,775 | | 52,930 | | 37,348 |
Minor works | | Various | | 9,219 | | 2,248 | | 3,975 | | 2,996 |
Total Property, Plant and Equipment | | | | | | | | 69,047 | | |
TOTAL SUNWATER | | | | | | | | 69,047 | | |
GOVERNMENT OWNED ENERGY CORPORATIONS | | | | | | | | | | |
CS ENERGY LIMITED | | | | | | | | | | |
Property, Plant and Equipment | | | | | | | | | | |
Callide | | 30 | | | | | | 55,175 | | Ongoing |
Swanbank | | 05 | | | | | | 13,115 | | Ongoing |
Mica Creek | | 55 | | | | | | 15,881 | | Ongoing |
Business development / other | | Various | | | | | | 5,324 | | Ongoing |
Kogan Creek | | 20 | | 1,129,210 | | 96,157 | | 129,923 | | 903,130 |
Total Property, Plant and Equipment | | | | | | | | 219,418 | | |
TOTAL CS ENERGY LIMITED | | | | | | | | 219,418 | | |
STANWELL CORPORATION LIMITED | | | | | | | | | | |
Property, Plant and Equipment | | | | | | | | | | |
Corporate | | | | | | | | | | |
Minor works | | 05 | | | | | | 3,175 | | Ongoing |
Thermal project | | 05 | | | | | | 73,306 | | Ongoing |
| | | | |
| 84 | | Capital Statement 2004-05 | | |
| | | | | | | | | | |
Generic feasibility projects | | 05 | | | | | | 7,138 | | Ongoing |
Rocky Point | | | | | | | | | | |
Ongoing minor works | | 05 | | | | | | 3,177 | | Ongoing |
Capital works and modifications | | 05 | | 9,468 | | 13 | | 4,675 | | 4,780 |
Stanwell Power Station | | | | | | | | | | |
Capital works and modifications | | 30 | | 23,290 | | 3,593 | | 15,632 | | 4,065 |
Ongoing minor works and overhauls | | 30 | | | | | | 14,981 | | Ongoing |
Barron Gorge | | | | | | | | | | |
Capital works and modifications | | 50 | | 6,571 | | 17 | | 6,450 | | 104 |
Ongoing minor works | | 50 | | | | | | 2,830 | | Ongoing |
Kareeya | | | | | | | | | | |
Capital works and modifications | | 50 | | 3,028 | | 285 | | 2,430 | | 313 |
Ongoing minor works | | 50 | | | | | | 1,095 | | Ongoing |
Koombooloomba | | | | | | | | | | |
Capital works and modifications | | 50 | | 110 | | | | 110 | | |
Mackay Gas Turbine | | | | | | | | | | |
Capital works and modifications | | 40 | | 3,238 | | 1,013 | | 2,225 | | |
Ongoing minor works | | 40 | | | | | | 5 | | Ongoing |
Windy Hill | | | | | | | | | | |
Ongoing minor works | | 50 | | | | | | 70 | | Ongoing |
Burdekin Hydro | | | | | | | | | | |
Hydro project | | 50 | | 32,692 | | 594 | | 7,791 | | 24,307 |
Total Property, Plant and Equipment | | | | | | | | 145,090 | | |
TOTAL STANWELL CORPORATION LIMITED | | | | | | | | 145,090 | | |
TARONG ENERGY CORPORATION LIMITED | | | | | | | | | | |
Property, Plant and Equipment | | | | | | | | | | |
Power Station | | | | | | | | | | |
Forestry land protection | | 15 | | 8,965 | | | | 8,965 | | |
Generator midlife refit (stator rewind) | | 15 | | 19,687 | | 6,836 | | 7,401 | | 5,450 |
Titanium treated water coolers/condensers | | 15 | | 19,967 | | 14,670 | | 4,229 | | 1,068 |
Ash Dam life extension | | 15 | | 8,443 | | 4,342 | | 4,101 | | |
Wivenhoe Pipeline augmentation | | 10 | | 20,050 | | 50 | | 3,000 | | 17,000 |
Develop locked isolations capabilities | | 15 | | 6,069 | | 52 | | 2,833 | | 3,184 |
Above ground ash emplace on adjacent land | | 15 | | 8,489 | | 180 | | 2,808 | | 5,501 |
Land acquisition - capital component | | 15 | | 3,169 | | 2,166 | | 1,003 | | |
Improve stormwater management system | | 15 | | 762 | | 98 | | 664 | | |
Particulate emission control options | | 15 | | 563 | | 3 | | 560 | | |
Direct treated cooling H2O to condensers | | 15 | | 1,616 | | 16 | | 400 | | 1,200 |
Facilities, furniture and fittings | | 15 | | 805 | | 8 | | 397 | | 400 |
Tools and equipment >$1,000 | | 15 | | 2,028 | | 238 | | 390 | | 1,400 |
Rocky Creek Road upgrade | | 15 | | 900 | | | | 350 | | 550 |
Purchase of forestry land adjacent Ash Dam | | 15 | | 588 | | 269 | | 319 | | |
Installation stack emission monitor | | 15 | | 1,391 | | 791 | | 300 | | 300 |
Relocate Ash Dam reclaim water pump station | | 15 | | 263 | | 8 | | 255 | | |
| | | | |
| | | Capital Statement 2004-05 | | 85 |
| | | | | | | | | | |
Minor works | | Various | | | | | | 2,796 | | Ongoing |
Overhauls | | | | | | | | | | |
Overhauls - Tarong Power Station | | 15 | | 57,173 | | 10,836 | | 17,320 | | 29,017 |
Overhauls - Wivenhoe Power Station | | 10 | | 3,388 | | | | 1,947 | | 1,441 |
Overhauls - Tarong North Power Station | | 15 | | 5,003 | | | | 726 | | 4,277 |
Information technology | | | | | | | | | | |
Windows 2000 migration | | 05 | | 550 | | | | 400 | | 150 |
Office/ Windows 2000, Tarong North | | 15 | | 325 | | | | 325 | | |
Personal computer replacement | | 05 | | 400 | | | | 300 | | 100 |
Energy trading risk and settlements | | 05 | | 410 | | | | 250 | | 160 |
Other projects | | 05 | | | | | | 1,705 | | Ongoing |
Other corporate | | | | | | | | | | |
Records management project | | 05 | | 690 | | 90 | | 400 | | 200 |
Other projects | | 05 | | 3,300 | | 800 | | 500 | | 2,000 |
Total Property, Plant and Equipment | | | | | | | | 64,644 | | |
Other Capital Expenditure | | | | | | | | | | |
Glen Wilga project parent | | 20 | | 41,103 | | 25,779 | | 2,553 | | 12,771 |
Renewable projects | | 05 | | 2,000 | | | | 2,000 | | |
Coal transportation project - capital | | 20 | | 14,847 | | 6,397 | | 1,033 | | 7,417 |
Other Projects | | 05 | | | | | | 392 | | Ongoing |
Total Other Capital Expenditure | | | | | | | | 5,978 | | |
TOTAL TARONG ENERGY CORPORATION LIMITED | | | | | | | | 70,622 | | |
ENERTRADE | | | | | | | | | | |
Property, Plant and Equipment | | | | | | | | | | |
North Queensland Gas Pipeline project | | 40 | | 106,045 | | 83,906 | | 22,139 | | |
North Queensland Gas Pipeline project | | 45 | | 52,726 | | 41,719 | | 11,007 | | |
Barcaldine Power Station refurbishment | | 35 | | 2,533 | | 1,533 | | 1,000 | | |
Barcaldine Pipeline refurbishment | | 35 | | 152 | | 32 | | 120 | | |
Barcaldine Pipeline refurbishment | | 25 | | 102 | | 22 | | 80 | | |
Minor works | | 05 | | | | | | 193 | | Ongoing |
Total Property, Plant and Equipment | | | | | | | | 34,539 | | |
Other Capital Expenditure | | | | | | | | | | |
Minor works | | 05 | | | | | | 220 | | Ongoing |
Total Other Capital Expenditure | | | | | | | | 220 | | |
TOTAL ENERTRADE | | | | | | | | 34,759 | | |
| | | | |
| 86 | | Capital Statement 2004-05 | | |
| | | | | | | | | | |
POWERLINK QUEENSLAND | | | | | | | | | | |
Property, Plant and Equipment | | | | | | | | | | |
Belmont - Murarrie transmission reinforcement | | 05 | | 42,000 | | 1,000 | | 10,000 | | 31,000 |
Gold Coast transmission reinforcement | | 10 | | 57,900 | | 100 | | 2,050 | | 55,750 |
Non-network projects | | 05 | | 25,995 | | | | 25,995 | | |
Various Moreton and Brisbane | | 05/10 | | 18,164 | | | | 18,164 | | |
Darling Downs transmission reinforcement | | 20 | | 74,000 | | 16,950 | | 57,050 | | |
Woree 132kV Static Var Compensator | | 50 | | 16,300 | | 178 | | 10,000 | | 6,122 |
Cairns 132kV Substation refurbishment | | 50 | | 11,000 | | 670 | | 6,553 | | 3,777 |
Edmonton 132/22kV Substation establishment | | 50 | | 9,400 | | 4,351 | | 5,049 | | |
Broadsound - Lilyvale 275kV Line reinforcement | | 30 | | 26,000 | | 20,991 | | 5,009 | | |
Ingham 132kV Substation rebuild | | 45 | | 6,400 | | 535 | | 3,701 | | 2,164 |
Nebo 275kV Transformer augmentation | | 40 | | 7,500 | | 3,766 | | 3,662 | | 72 |
Ross Chalumbin Substation additions | | 45 | | 6,400 | | 4,563 | | 1,837 | | |
Middle Ridge 110kV Substation rebuild | | 20 | | 8,700 | | 6,891 | | 1,660 | | 149 |
Various regions (except Moreton and Brisbane) | | Various | | 18,006 | | | | | | |
Total Property, Plant and Equipment | | | | | | | | 168,736 | | |
TOTAL POWERLINK QUEENSLAND | | | | | | | | 168,736 | | |
ENERGEX LIMITED | | | | | | | | | | |
Property, Plant and Equipment | | | | | | | | | | |
Major Corporation Initiated Works | | | | | | | | | | |
Substation related works | | 05/10 | | 93,457 | | 7,413 | | 80,531 | | 5,513 |
Substation related works | | 15 | | 2,325 | | | | 2,135 | | 190 |
Substation related works | | 05/10 | | | | | | 36,011 | | Ongoing |
Feeder related works | | 05/10 | | 88,667 | | 5,205 | | 65,929 | | 17,533 |
Feeder related works | | 15 | | 2,857 | | 550 | | 2,138 | | 169 |
Transformer related works | | 05/10 | | 34,469 | | 3,990 | | 28,291 | | 2,188 |
Sub-total major corporation initiated works | | | | | | | | 215,035 | | |
Customer works - domestic / rural | | 05/10 | | | | | | 48,141 | | Ongoing |
Customer works - commercial / industrial / transaction | | 05/10 | | | | | | 21,905 | | Ongoing |
Customer works - service connections | | 05/10 | | | | | | 35,091 | | Ongoing |
Public lighting | | 05/10 | | | | | | 13,889 | | Ongoing |
Distribution works | | 05/10 | | | | | | 12,933 | | Ongoing |
Other works | | 05/10 | | | | | | 18,057 | | Ongoing |
| | | | |
| | | Capital Statement 2004-05 | | 87 |
| | | | | | | | | | |
Business development | | Various | | | | | | 71,700 | | Ongoing |
Other property, plant and equipment | | Various | | | | | | 56,547 | | Ongoing |
Total Property, Plant and Equipment | | | | | | | | 493,298 | | |
TOTAL ENERGEX LIMITED | | | | | | | | 493,298 | | |
ERGON ENERGY CORPORATION LIMITED | | | | | | | | | | |
Property, Plant and Equipment | | | | | | | | | | |
Hughenden Sub - install static VaR compensator | | 55 | | 6,625 | | | | 166 | | 6,459 |
Cairns North 132kV line | | 50 | | 5,411 | | 64 | | 320 | | 5,027 |
Rebuild 66kV Feeder, Dawson Callide, (Stage 2) | | 30 | | 7,519 | | | | 7,519 | | |
Establish new Kearneys Springs Zone substation | | 20 | | 5,559 | | | | 734 | | 4,825 |
Bargara - establish zone substation | | 15 | | 6,426 | | | | 2,076 | | 4,350 |
Point Vernon - Establish 66/11kV substation | | 15 | | 5,023 | | 254 | | 2,774 | | 1,995 |
Bamaga - new power station | | 50 | | 11,166 | | | | 2,297 | | 8,869 |
Pormpuraaw - new power station | | 50 | | 5,296 | | | | 1,444 | | 3,852 |
Augment supply to Goondiwindi | | 20 | | 28,879 | | 5,132 | | 23,535 | | 212 |
Supply to Rolleston Coal Mine | | 30 | | 15,022 | | | | 15,022 | | |
Install Ergon System Control and Data Acquisition Master Station 04/05 | | 45 | | 10,859 | | | | 10,657 | | 202 |
CSR Pioneer Mill connection requirements | | 45 | | 5,203 | | | | 5,203 | | |
Connection of Burdekin Dam co-generation substation | | 45 | | 5,005 | | | | 5,005 | | |
Isis central sugar mill cogeneration project | | 15 | | 23,000 | | 2,400 | | 5,977 | | 14,623 |
New 66kV feeder to Agnes Waters | | 15 | | 5,338 | | 99 | | 548 | | 4,691 |
Sub-total property, plant and equipment | | | | | | | | 83,277 | | |
Other Network Capital Expenditure | | | | | | | | | | |
All | | Various | | | | | | 27,432 | | Ongoing |
Capricornia | | 30,35 | | | | | | 50,808 | | Ongoing |
Far North | | 50 | | | | | | 57,545 | | Ongoing |
Mackay | | 40,55 | | | | | | 36,692 | | Ongoing |
Northern | | 45 | | | | | | 66,716 | | Ongoing |
South West | | 20,25 | | | | | | 49,503 | | Ongoing |
Wide Bay | | 15 | | | | | | 49,014 | | Ongoing |
Sub-total other network capital expenditure | | | | | | | | 337,710 | | |
Fixed Asset Acquisitions and Capitalised Projects | | | | | | | | 106,914 | | |
Other Capital Acquisitions | | | | | | | | 1,586 | | |
TOTAL ERGON ENERGY CORPORATION LIMITED | | | | | | | | 529,487 | | |
TOTAL NATURAL RESOURCES, MINES AND ENERGY | | | | | | | | 1,787,794 | | |
| * | Funded under the Smart State Building Fund. |
| | | | |
| 88 | | Capital Statement 2004-05 | | |
OFFICE OF THE GOVERNOR
Total capital expenditure of the Office of the Governor in 2004-05 is estimated to be $0.04 million. The expenditure relates to capital acquisitions, particularly vehicles and office equipment.
Continuing maintenance and enhancement of the facilities at Government House enables the Governor to undertake the full range of duties expected of Head of State, including those that promote and support whole-of-Government priorities.
Office of the Governor
| | | | | | | | | | |
Project
| | Statistical
Division
| | Total
Estimated
Cost
| | Expenditure
to 30-06-04
| | Budget
2004-05
| | Post
2004-05
|
| | | | | $’000 | | $’000 | | $’000 | | $’000 |
OFFICE OF THE GOVERNOR | | | | | | | | | | |
Property, Plant and Equipment | | | | | | | | | | |
Asset replacement | | 05 | | | | | | 42 | | Ongoing |
Total Property, Plant and Equipment | | | | | | | | 42 | | |
TOTAL OFFICE OF THE GOVERNOR | | | | | | | | 42 | | |
| | | | |
| | | Capital Statement 2004-05 | | 89 |
OFFICES OF THE OMBUDSMAN AND INFORMATION COMMISSIONER
The Offices of the Ombudsman and Information Commissioner are responsible for:
| | • | investigating and, if necessary, redressing administrative illegality, unfairness or error in the public sector, including local government, where no other specific remedy exists |
| | • | ensuring as far as possible that applications by the community for access to information held by state and local government are decided correctly according to law. |
By providing for public scrutiny of the activities of executive government, this output supports a strong corporate governance and accountability framework in the Queensland public sector.
Capital funding of $0.12 million is provided in 2004-05 for the provision of office and information technology tools to enable investigative staff to review complaints and appeals about Government administration.
Offices of the Ombudsman and Information Commissioner
| | | | | | | | | | |
Project
| | Statistical
Division
| | Total
Estimated
Cost
| | Expenditure
to 30-06-04
| | Budget
2004-05
| | Post 2004-05
|
| | | | | $’000 | | $’000 | | $’000 | | $’000 |
OFFICES OF THE OMBUDSMAN AND INFORMATION COMMISSIONER | | | | | | | | | | |
Property, Plant and Equipment | | | | | | | | | | |
Other acquisitions of property | | | | | | | | | | |
New personal computers and software | | 05 | | | | | | 100 | | Ongoing |
Office equipment | | 05 | | | | | | 20 | | Ongoing |
Total Property, Plant and Equipment | | | | | | | | 120 | | |
TOTAL OFFICES OF THE OMBUDSMAN AND INFORMATION COMMISSIONER | | | | | | | | 120 | | |
| | | | |
| 90 | | Capital Statement 2004-05 | | |
OFFICE OF THE PUBLIC SERVICE COMMISSIONER
The Office of the Public Service Commissioner is committed to the development of a strong and sustainable public service, which achieves the best results for Queenslanders. The Office has a mandate to deliver legislative and regulatory functions as well as strategies that enable the Queensland Public Service to deliver on the Government’s priorities.
Accordingly, the Office’s capital acquisition plan amounting to $0.07 million in 2004-05 focuses on the replacement of computer and office equipment required to efficiently provide the above service.
Office of the Public Service Commissioner
| | | | | | | | | | |
Project
| | Statistical
Division
| | Total
Estimated Cost
| | Expenditure
to 30-06-04
| | Budget
2004-05
| | Post 2004-05
|
| | | | | $’000 | | $’000 | | $’000 | | $’000 |
OFFICE OF THE PUBLIC SERVICE COMMISSIONER | | | | | | | | | | |
Property, Plant and Equipment | | | | | | | | | | |
Plant and equipment | | 05 | | | | | | 65 | | Ongoing |
Total Property, Plant and Equipment | | | | | | | | 65 | | |
TOTAL OFFICE OF THE PUBLIC SERVICE COMMISSIONER | | | | | | | | 65 | | |
| | | | |
| | | Capital Statement 2004-05 | | 91 |
POLICE
The delivery of effective policing services to the community of Queensland requires the establishment and maintenance of appropriate infrastructure. To this end, the Service has developed a number of infrastructure plans in respect of capital works, information technology and other equipment needs. An allocation of $101.6 million in 2004-05 will enable the Service to progress key projects identified in these plans.
Program Highlights
| | • | $29.5 million, of which $4 million is provided under the Smart State Building Fund, to construct new and replacement facilities and undertake planning for future facilities under the Queensland Police Service’s Ten-Year Capital Investment Strategic Plan. Projects under construction and due to be completed in 2004-05 include: |
| | • | $2.4 million to complete a new watchhouse at Caloundra; and |
| | • | $0.64 million to compete a new kennel complex at Oxley for the puppy development program. |
| | • | Construction is expected to commence in 2004-05 on several new projects including: |
| | • | $2 million for a replacement police station and watchhouse at Ingham; |
| | • | $1.9 million to upgrade the Southport police station; |
| | • | $1.6 million for a new police station at Mackay North; |
| | • | $1.5 million for a replacement police station at Stafford; |
| | • | $1 million for Stage two of the Redland Bay police station; |
| | • | $0.5 million for a replacement Sarina police station; and |
| | • | $0.5 million for a new police station at Hopevale. |
| | • | An allocation of $15 million for information management directed towards projects identified as priorities in the Service’s Information Strategic Plan 2001-10, including the ongoing development of the Incident Recording and Management System and the commencement of the network infrastructure upgrade. |
| | • | $57.1 million to support the purchase of other plant and equipment including motor vehicles, vessels and other equipment. |
| | • | $3 million is provided under the Smart State Building Fund for eight police beats. |
| | | | |
| 92 | | Capital Statement 2004-05 | | |
Police
| | | | | | | | | | |
Project
| | Statistical
Division
| | Total
Estimated
Cost
| | Expenditure
to
30-06-04
| | Budget
2004-05
| | Post
2004-05
|
| | | | | $’000 | | $’000 | | $’000 | | $’000 |
DEPARTMENT OF POLICE | | | | | | | | | | |
Property, Plant and Equipment | | | | | | | | | | |
Major Capital* | | | | | | | | | | |
Caloundra - New watchhouse | | 10 | | 3,500 | | 1,100 | | 2,400 | | |
Ingham - Replacement police station and watchhouse | | 45 | | 3,800 | | 190 | | 2,000 | | 1,610 |
Mackay North - New police station | | 40 | | 3,500 | | 213 | | 1,550 | | 1,737 |
Redland Bay - Stage 2 | | 05 | | 3,000 | | | | 1,000 | | 2,000 |
Oxley - Dog squad puppy kennels | | 05 | | 700 | | 60 | | 640 | | |
Sarina - Replacement police station | | 40 | | 3,000 | | | | 500 | | 2,500 |
Southport - Upgrade police station | | 10 | | 4,000 | | 119 | | 1,900 | | 1,981 |
Stafford - Replacement police station | | 05 | | 3,750 | | 209 | | 1,500 | | 2,041 |
Toowoomba - Replacement police station, watchhouse, DHQ and regional office Stage 3 | | 20 | | 4,500 | | 308 | | 2,800 | | 1,392 |
Other major capital | | Various | | | | | | 1,720 | | Ongoing |
Sub-total Major Capital | | | | | | | | 16,010 | | |
Sub-programs | | | | | | | | | | |
Academy upgrade program | | 05 | | | | | | 500 | | Ongoing |
Brisbane - Police headquarters accommodation changes | | 05 | | | | | | 300 | | Ongoing |
Dayroom upgrade program | | Various | | | | | | 500 | | Ongoing |
Housing program | | | | | | | | | | |
Hopevale - 2 new residences | | 50 | | 700 | | | | 700 | | |
Kowanyama - New twin dwelling unit | | 55 | | 480 | | | | 480 | | |
Mornington Island - Twin dwelling unit | | 55 | | 550 | | 200 | | 350 | | |
Other housing | | Various | | 1,279 | | 485 | | 794 | | |
Land acquisition | | Various | | | | | | 1,650 | | Ongoing |
Police Beats* | | Various | | 10,000 | | | | 3,000 | | 7,000 |
Sub-total Sub-programs | | | | | | | | 8,274 | | |
Minor Works | | | | | | | | | | |
Brisbane | | 05 | | | | | | 707 | | Ongoing |
Moreton | | 10 | | | | | | 210 | | Ongoing |
Other minor works | | Various | | | | | | 1,529 | | Ongoing |
Sub-total Minor Works | | | | | | | | 2,446 | | |
Small Station Program | | | | | | | | | | |
Hopevale - New police station | | 50 | | 500 | | 4 | | 496 | | |
Other small stations | | Various | | | | | | 1,234 | | Ongoing |
Sub-total Small Station Program | | | | | | | | 1,730 | | |
Station security program | | Various | | | | | | 500 | | Ongoing |
Watchhouse upgrade program | | Various | | | | | | 504 | | Ongoing |
Information Management Strategic Plan | | 05 | | | | | | 13,000 | | Ongoing |
Other plant and equipment (includes motor vehicles) | | Various | | | | | | 54,913 | | Ongoing |
Total Property, Plant and Equipment | | | | | | | | 97,377 | | |
Other Capital Expenditure | | | | | | | | | | |
Other Capital Expenditure | | 05 | | | | | | 4,228 | | Ongoing |
Total Other Capital Expenditure | | | | | | | | 4,228 | | |
TOTAL POLICE | | | | | | | | 101,605 | | |
| * | Funded partly under the Smart State Building Fund. |
| | | | |
| | | Capital Statement 2004-05 | | 93 |
PREMIER AND CABINET
The department’s primary responsibility is to support and enhance Government decision making through the provision of timely information and policy advice to the Premier, Executive Council, Cabinet and other Government departments. The department’s capital expenditure program for 2004-05 is $4.3 million.
Program Highlights
Highlights for the department include:
| | • | management of the development of the whole-of-Government Integrated Justice Information System |
| | • | the enhancement and replacement of office and computer equipment as well as information systems required to efficiently deliver the department’s outputs |
| | • | miscellaneous capital grants to community groups throughout the State. |
Crime and Misconduct Commission
The Crime and Misconduct Commission’s 2004-05 plant and equipment program relates to computer and motor vehicle replacements to maintain existing service levels. Other capital works represent minor alterations to the leased premises.
South Bank Corporation
The capital works program for South Bank Corporation for 2004-05 will be directed at a range of precinct enhancements, which will complement the completed masterplan works. Minor works expenditure will be allocated towards the ongoing operational requirements of both the Parklands and the Brisbane Convention and Exhibition Centre.
Queensland Events Corporation
Capital expenditure for Queensland Events Corporation relates to scheduled asset replacement. This is comprised of miscellaneous office and computer equipment.
Commission for Children and Young People
The 2004-05 capital program of the Commission for Children and Young People will see the continuation of programs from the 2003-04 financial year.
Program Highlights
| | • | There will be continued focus on the expanded facilities and equipment required for the implementation of the Crime and Misconduct Commission report Protecting Children: An Inquiry into Abuse of Children in Foster Care |
| | • | the expanded processing requirements of the Working With Children Check program |
| | • | the ongoing replacement and upgrading of office equipment. |
| | | | |
| 94 | | Capital Statement 2004-05 | | |
Premier and Cabinet
| | | | | | | | | | |
Project
| | Statistical
Division
| | Total
Estimated Cost
| | Expenditure
to 30-06-04
| | Budget
2004-05
| | Post 2004-05
|
| | | | | $’000 | | $’000 | | $’000 | | $’000 |
DEPARTMENT OF THE PREMIER AND CABINET | | | | | | | | | | |
Property, Plant and Equipment | | | | | | | | | | |
Plant and equipment | | 05 | | | | | | 3,341 | | Ongoing |
Total Property, Plant and Equipment | | | | | | | | 3,341 | | |
Capital Grants | | | | | | | | | | |
Other capital grants | | Various | | | | | | 1,000 | | Ongoing |
Total Capital Grants | | | | | | | | 1,000 | | |
TOTAL DEPARTMENT OF THE PREMIER AND CABINET | | | | | | | | 4,341 | | |
CRIME AND MISCONDUCT COMMISSION | | | | | | | | | | |
Property, Plant and Equipment | | | | | | | | | | |
Plant and equipment | | 05 | | | | | | 1,343 | | Ongoing |
Minor leasehold improvements | | 05 | | | | | | 70 | | Ongoing |
Total Property, Plant and Equipment | | | | | | | | 1,413 | | |
TOTAL CRIME AND MISCONDUCT COMMISSION | | | | | | | | 1,413 | | |
SOUTH BANK CORPORATION | | | | | | | | | | |
Property, Plant and Equipment | | | | | | | | | | |
South Bank Corporation | | | | | | | | | | |
Southern entry portal | | 05 | | 4,500 | | 1,800 | | 2,700 | | |
Glenelg Street upgrade | | 05 | | 450 | | 150 | | 300 | | |
Riverside moorings | | 05 | | 650 | | 100 | | 550 | | |
Russell Street lighting | | 05 | | 300 | | 20 | | 280 | | |
Russell Street pedestrian access | | 05 | | 700 | | 100 | | 600 | | |
Children’s playgrounds | | 05 | | 500 | | 25 | | 275 | | 200 |
Sundry projects | | 05 | | 1,750 | | 254 | | 492 | | 1,004 |
Minor works | | 05 | | | | | | 1,274 | | Ongoing |
Brisbane Convention and Exhibition Centre minor works | | | | | | | | | | |
Glenelg Street upgrade | | 05 | | 645 | | | | 645 | | |
Food and beverage equipment | | 05 | | | | | | 215 | | Ongoing |
Information technology equipment | | 05 | | | | | | 340 | | Ongoing |
Audio visual equipment | | 05 | | | | | | 439 | | Ongoing |
Operations equipment | | 05 | | | | | | 873 | | Ongoing |
Minor works | | 05 | | | | | | 320 | | Ongoing |
Total Property, Plant and Equipment | | | | | | | | 9,303 | | |
Other Capital Expenditure | | | | | | | | | | |
Inventory/land development | | 05 | | | | | | 690 | | Ongoing |
Total Other Capital Expenditure | | | | | | | | 690 | | |
TOTAL SOUTH BANK CORPORATION | | | | | | | | 9,993 | | |
QUEENSLAND EVENTS CORPORATION | | | | | | | | | | |
Property, Plant and Equipment | | | | | | | | | | |
Furniture and fittings | | 05 | | | | | | 3 | | Ongoing |
Computer | | 05 | | | | | | 10 | | Ongoing |
Total Property, Plant and Equipment | | | | | | | | 13 | | |
| | | | |
| | | Capital Statement 2004-05 | | 95 |
| | | | | | | | | | |
TOTAL QUEENSLAND EVENTS CORPORATION | | | | | | | | 13 | | |
COMMISSION FOR CHILDREN AND YOUNG PEOPLE | | | | | | | | | | |
Property, Plant and Equipment | | | | | | | | | | |
Plant and equipment | | 05 | | | | | | 555 | | Ongoing |
Total Property, Plant and Equipment | | | | | | | | 555 | | |
Other Capital Expenditure | | | | | | | | | | |
Intangibles | | | | | | | | | | |
Development of databases | | 05 | | | | | | 400 | | Ongoing |
Total Other Capital Expenditure | | | | | | | | 400 | | |
TOTAL COMMISSION FOR CHILDREN AND YOUNG PEOPLE | | | | | | | | 955 | | |
TOTAL PREMIER AND CABINET | | | | | | | | 16,715 | | |
| | | | |
| 96 | | Capital Statement 2004-05 | | |
PRIMARY INDUSTRIES AND FISHERIES
The Department Primary Industries and Fisheries’ capital expenditure program for 2004-05 is $24.4 million, which is principally focused on the continuing development of research facilities along with addressing existing and emerging plant and equipment needs.
Program Highlights
| | • | A new facility at Redlands will be used to conduct research in the area of amenity horticulture. This project together with the completion of a new sorghum processing facility at Biloela will contribute to the Industry Development output. Capital funds will also be used for the acquisition of diagnostic equipment and development of information systems to enhance laboratory disease diagnosis and testing capability. This will provide enhanced preparedness and risk management against foot and mouth disease under the Biosecurity output. |
| | • | The development of new facilities at Eagle Farm (a new Queensland Fisheries Complex) and the Bribie Island Aquaculture Research Centre will begin during 2004-05 and are initiatives of the Smart State Building Fund. These facilities will consolidate the southern node of fisheries and aquaculture research and development and will contribute to the Industry Development output. The new Queensland Boating and Fisheries Patrol complex at Rosslyn Bay will contribute to the Fisheries output. |
FORESTRY
| | • | The capital expenditure budget for 2004-05 is $9.5 million. The Budget includes $2.5 million for the purchase of freehold land for plantation establishment. An amount of $4.9 million has been included for the replacement of heavy plant and motor vehicles. |
QUEENSLAND RURAL ADJUSTMENT AUTHORITY
| | • | Capital expenditure includes $0.15 million to upgrade or replace general office equipment and furniture and fittings and $0.2 million to continue the process of improving Queensland Rural Adjustment Authority’s main computer systems in order to improve the delivery of financial assistance to Queensland’s rural producers. |
| | | | |
| | | Capital Statement 2004-05 | | 97 |
Primary Industries and Fisheries
| | | | | | | | | | |
Project
| | Statistical
Division
| | Total
Estimated Cost
| | Expenditure
to
30-06-04
| | Budget
2004-05
| | Post 2004-05
|
| | | | | $’000 | | $’000 | | $’000 | | $’000 |
DEPARTMENT OF PRIMARY INDUSTRIES AND FISHERIES | | | | | | | | | | |
Property, Plant and Equipment | | | | | | | | | | |
Foot and mouth disease - enhanced preparedness | | Various | | 1,200 | | 106 | | 1,112 | | |
Centre for Amenity Horticulture - Redlands | | 05 | | 2,300 | | 177 | | 1,592 | | |
Eagle Farm - new QFS complex* | | 05 | | 1,500 | | | | 1,500 | | |
Bribie Island Aquaculture Research Centre* | | 10 | | 3,800 | | | | 100 | | 3,700 |
Rosslyn Bay QBFP complex | | 30 | | 497 | | | | 497 | | |
Biloela Research Station - residence | | 30 | | 220 | | | | 220 | | |
Biloela Research Station - sorghum processing facility | | 30 | | 350 | | | | 350 | | |
Minor works | | Various | | | | | | 1,520 | | Ongoing |
Mechanical items | | Various | | | | | | 300 | | Ongoing |
Heavy plant and equipment | | Various | | | | | | 1,500 | | Ongoing |
Vessel replacement | | Various | | | | | | 950 | | Ongoing |
Research facilities development | | Various | | | | | | 1,500 | | Ongoing |
Relocation and refurbishment | | Various | | | | | | 800 | | Ongoing |
Computer equipment and infrastructure | | Various | | | | | | 2,650 | | Ongoing |
Scientific equipment | | Various | | | | | | 1,000 | | Ongoing |
Other property, plant and equipment | | Various | | | | | | 7,697 | | Ongoing |
Total Property, Plant and Equipment | | | | | | | | 23,288 | | |
Other Capital Expenditure | | | | | | | | | | |
Intangible assets | | 05 | | | | | | 717 | | |
Other projects | | 05 | | | | | | 350 | | |
Total Other Capital Expenditure | | | | | | | | 1,067 | | |
TOTAL DEPARTMENT PRIMARY INDUSTRIES AND FISHERIES | | | | | | | | 24,355 | | |
FORESTRY | | | | | | | | | | |
Property, Plant and Equipment | | | | | | | | | | |
Plant and equipment | | Various | | | | | | 6,254 | | Ongoing |
Purchase of land | | Various | | | | | | 2,500 | | Ongoing |
Buildings and improvements | | Various | | | | | | 775 | | Ongoing |
Total Property, Plant and Equipment | | | | | | | | 9,529 | | |
Other Capital Expenditure | | | | | | | | | | |
Computer software | | 05 | | | | | | 14 | | Ongoing |
Total Other Capital Expenditure | | | | | | | | 14 | | |
TOTAL FORESTRY | | | | | | | | 9,543 | | |
QUEENSLAND RURAL ADJUSTMENT AUTHORITY | | | | | | | | | | |
Property, Plant and Equipment | | | | | | | | | | |
Upgrade/replace office equipment | | 05 | | 150 | | | | 150 | | |
Total Property, Plant and Equipment | | | | | | | | 150 | | |
Other Capital Expenditure | | | | | | | | | | |
Upgrade in-house computer software | | 05 | | 1,100 | | 900 | | 200 | | |
Total Other Capital Expenditure | | | | | | | | 200 | | |
TOTAL QUEENSLAND RURAL ADJUSTMENT AUTHORITY | | | | | | | | 350 | | |
TOTAL OF PRIMARY INDUSTRIES AND FISHERIES | | | | | | | | 34,248 | | |
| * | Funded fully or in part under the Smart State Building Fund |
| | | | |
| 98 | | Capital Statement 2004-05 | | |
PUBLIC WORKS
Capital expenditure for the Department of Public Works, including commercialised business units (CBUs) in 2004-05 is $226.2 million. Capital expenditure by the department, excluding CBUs is $31.6 million.
Program Highlights
| | • | QFleet will purchase motor vehicles to the value of $172.8 million. The vehicles will be leased to clients to facilitate the delivery of Government services across Queensland. The vehicle purchases and their maintenance provide support for local Queensland firms. |
| | • | $8.5 million is allocated in 2004-05 for the refurbishment of Stage 1 of the Cairns Convention Centre. The refurbishment includes a technological upgrade consistent with the expectations of national and international event organisers. |
| | • | $4 million is allocated in 2004-05 for the Mackay Multi-Purpose Centre that is being developed in collaboration with the Mackay City Council and its Mackay City Central Project. It is anticipated that private sector proposals will be invited in 2004-05 for the provision of the Multi-Purpose Centre and associated facilities, as part of the redevelopment of the adjacent CBD. Funding is based on a project of up to $38 million in value. |
| | • | Funds are provided to acquire an additional 18 dwelling units for Government employee housing in rural and remote locations to support the delivery of Government services in these centres. Funding of $4.6 million, partly funded under the Smart State Building Fund, is provided for this initiative in 2004-05. |
| | • | $2.8 million is provided in 2004-05 for the construction of a new costume and scenery workshop at the Queensland Theatre Company site, South Brisbane. |
| | • | The department will continue to refurbish and upgrade existing office accommodation. Capital expenditure of $1.2 million is provided in 2004-05 to address discrimination and workplace health and safety issues. |
| | • | Expenditure of $1 million, funded under the Smart State Building Fund, has been allocated in 2004-05 to refurbish the historic Thomas Dixon Building at West End to provide the Queensland Ballet with upgraded rehearsal and change room facilities and improved public facilities. This includes the provision of a lift to enable access to the upper level for people with a disability. |
| | • | Additional works at the Roma Street Parkland in 2004-05 will improve the facilities and further enhance their amenity and accessibility. |
| | | | |
| | | Capital Statement 2004-05 | | 99 |
Public Works
| | | | | | | | | | |
Project
| | Statistical
Division
| | Total
Estimated Cost
| | Expenditure
to 30-06-04
| | Budget
2004-05
| | Post 2004-05
|
| | | | | $’000 | | $’000 | | $’000 | | $’000 |
DEPARTMENT OF PUBLIC WORKS | | | | | | | | | | |
Property, Plant and Equipment | | | | | | | | | | |
Brisbane, 33 Charlotte Street office building | | 05 | | 68,562 | | 68,234 | | 328 | | |
Brisbane - Queensland Theatre Company new workshop | | 05 | | 3,000 | | 200 | | 2,800 | | |
Brisbane - Thomas Dixon Building refurbishment* | | 05 | | 1,000 | | | | 1,000 | | |
Brisbane - 111 George Street office building upgrade fire systems | | 05 | | 1,890 | | 956 | | 934 | | |
Murgon Courthouse refurbishment | | 15 | | 600 | | | | 600 | | |
Mackay, office building install lift | | 40 | | 300 | | | | 300 | | |
Cairns - Convention Centre stage 1 refurbishment | | 50 | | 8,500 | | | | 8,500 | | |
Anti-discrimination program | | Various | | | | 558 | | 300 | | Ongoing |
Carpet replacement program | | Various | | | | 1,180 | | 800 | | Ongoing |
Workplace health and safety | | Various | | | | 431 | | 900 | | Ongoing |
Minor works | | Various | | | | | | 1,368 | | Ongoing |
Government Employee housing* | | Various | | | | | | 4,552 | | Ongoing |
Major buildings and infrastructure | | | | | | | | | | |
Brisbane, Roma Street Parkland | | 05 | | 68,500 | | 67,114 | | 1,386 | | |
Mackay Multi-Purpose Centre | | 40 | | 38,000 | | 600 | | 4,000 | | 33,400 |
Rockhampton Riverbank Project | | 30 | | 9,500 | | | | 800 | | 8,700 |
Other plant and equipment | | 05 | | | | | | 2,378 | | Ongoing |
Total Property, Plant and Equipment | | | | | | | | 30,946 | | |
Other Capital Expenditure | | | | | | | | | | |
Queensland Government Electronic Marketplace | | 05 | | 2,580 | | 1,800 | | 240 | | 540 |
Electronic service delivery | | 05 | | | | | | 390 | | Ongoing |
Total Other Capital Expenditure | | | | | | | | 630 | | |
TOTAL DEPARTMENT OF PUBLIC WORKS (1) | | | | | | | | 31,576 | | |
QBUILD | | | | | | | | | | |
Property, Plant and Equipment | | | | | | | | | | |
Plant and equipment | | Various | | | | | | 1,231 | | Ongoing |
Total Property, Plant and Equipment | | | | | | | | 1,231 | | |
Other Capital Expenditure | | | | | | | | | | |
Business Systems | | 05 | | | | | | 8,500 | | Ongoing |
Total Other Capital Expenditure | | | | | | | | 8,500 | | |
TOTAL QBUILD | | | | | | | | 9,731 | | |
QFLEET | | | | | | | | | | |
Property, Plant and Equipment | | | | | | | | | | |
Motor vehicles | | Various | | | | | | 172,793 | | Ongoing |
Total Property, Plant and Equipment | | | | | | | | 172,793 | | |
Other Capital Expenditure | | | | | | | | | | |
| | | | |
| 100 | | Capital Statement 2004-05 | | |
| | | | | | | | | | |
Information systems | | 05 | | 2,413 | | | | 2,413 | | Ongoing |
Total Other Capital Expenditure | | | | | | | | 2,413 | | |
TOTAL QFLEET | | | | | | | | 175,206 | | |
PROJECT SERVICES | | | | | | | | | | |
Property, Plant and Equipment | | | | | | | | | | |
Plant and equipment | | Various | | | | | | 450 | | Ongoing |
Total Property, Plant and Equipment | | | | | | | | 450 | | |
Other Capital Expenditure | | | | | | | | | | |
Business systems software | | Various | | | | | | 307 | | Ongoing |
Total Other Capital Expenditure | | | | | | | | 307 | | |
TOTAL PROJECT SERVICES | | | | | | | | 757 | | |
GOPRINT | | | | | | | | | | |
Property, Plant and Equipment | | | | | | | | | | |
Plant and equipment | | 05 | | 50 | | | | 50 | | |
Total Property, Plant and Equipment | | | | | | | | 50 | | |
TOTAL GOPRINT | | | | | | | | 50 | | |
SDS (Sales and Distribution Services) | | | | | | | | | | |
Property, Plant and Equipment | | | | | | | | | | |
Warehouse equipment | | 05 | | | | | | 355 | | |
Total Property, Plant and Equipment | | | | | | | | 355 | | |
Other Capital Expenditure | | | | | | | | | | |
Internet development | | 05 | | | | | | 495 | | Ongoing |
Total Other Capital Expenditure | | | | | | | | 495 | | |
TOTAL SDS | | | | | | | | 850 | | |
CITEC | | | | | | | | | | |
Property, Plant and Equipment | | | | | | | | | | |
Plant and equipment | | 05 | | | | | | 6,088 | | Ongoing |
Total Property, Plant and Equipment | | | | | | | | 6,088 | | |
Other Capital Expenditure | | | | | | | | | | |
Internally developed software and systems | | 05 | | | | | | 1,930 | | Ongoing |
Total Other Capital Expenditure | | | | | | | | 1,930 | | |
TOTAL CITEC | | | | | | | | 8,018 | | |
TOTAL PUBLIC WORKS | | | | | | | | 226,188 | | |
Notes
| 1. | Total 2004-05 capital works expenditure for the Department of Public Works does not include $3.9 million allocated for the continued refurbishment and upgrading of Queensland House in London to meet current health and safety regulations, and to complement the existing streetscape. The total project cost is $4.5 million. |
| * | Funded fully or in part under the Smart State Building Fund. |
| | | | |
| | | Capital Statement 2004-05 | | 101 |
QUEENSLAND AUDIT OFFICE
The capital expenditure of $0.33 million on minor works during 2004-05 is to maintain systems that support the mandated audit program and the Queensland Audit Office output of Independent Public Sector Auditing Services and Reporting to Parliament.
In particular the funds will be allocated to replace minor office equipment and computer hardware and software which form part of the ongoing replacement program. These amounts also include an initial investment in the audit methodology toolset replacement program.
Queensland Audit Office
| | | | | | | | | | |
Project
| | Statistical
Division
| | Total
Estimated
Cost
| | Expenditure
to 30-06-04
| | Budget
2004-05
| | Post 2004-05
|
| | | | | $’000 | | $’000 | | $’000 | | $’000 |
Queensland Audit Office | | | | | | | | | | |
Property, Plant and Equipment | | | | | | | | | | |
Minor works | | 05 | | | | | | 330 | | Ongoing |
Total Property, Plant and Equipment | | | | | | | | 330 | | |
TOTAL QUEENSLAND AUDIT OFFICE | | | | | | | | 330 | | |
| | | | |
| 102 | | Capital Statement 2004-05 | | |
STATE DEVELOPMENT AND INNOVATION
The projected capital expenditure of the Department of State Development and Innovation in 2004-05 is $246.2 million.
The key aims of the capital acquisition plan and asset management strategies are to support the department to provide innovation, direction and leadership in industry and small business. The plan also plays a key role in supporting the delivery of timely and efficient infrastructure and attracting productive investments and major projects.
Capital grants are targeted at organisations for the development of world class science and technology research and development facilities, and enterprises that will make a major contribution to the development of business and industries and thereby the creation of sustainable employment.
Program Highlights
| | • | $115.1 million out of a total project cost of $254.8 million towards the Burnett Water infrastructure project. |
| | • | $29.5 million for common-user infrastructure associated with the Comalco Alumina Refinery, common-user infrastructure project. Total project cost is $150 million (net of interest costs). |
| | • | $20 million in equity provided under the Smart State Building Fund towards the establishment of the Queensland Brain Institute. |
Property Services Group
Program Highlights
The Property Services Group delivers the property services component of the Industry Location Scheme. Key functions of the group include the acquisition, planning and development of land for business and industry locating or expanding to Queensland. The group’s capital acquisition plan has a total budget of $55.2 million in 2004-05.
| | • | $10 million is budgeted for the final stage of the Lytton industrial estate. |
| | • | $8 million is provided for the development of the first stage of the Caloundra regional business and industry park. |
| | • | $8 million is provided for the purchase of additional land at Coolum. |
| | • | $4.2 million is allocated to the development of the Arundel industrial park. |
| | • | $4 million is allocated for the development of the next stage of the Clinton industrial estate. |
| | • | $4 million is included for the purchase of land at Ipswich for the establishment of an industrial park for aerospace industries. |
| | • | $2 million is allocated for the acquisition of land within the Townsville State Development area. |
| | | | |
| | | Capital Statement 2004-05 | | 103 |
State Development and Innovation
| | | | | | | | | | |
Project
| | Statistical
Division
| | Total
Estimated
Cost
| | Expenditure
to 30-6-04
| | Budget
2004-05
| | Post
2004-05
|
| | | | | $’000 | | $’000 | | $’000 | | $’000 |
DEPARTMENT OF STATE DEVELOPMENT AND INNOVATION | | | | | | | | | | |
Property, Plant and Equipment | | | | | | | | | | |
STATE DEVELOPMENT AND INNOVATION | | | | | | | | | | |
Computer equipment | | Various | | | | | | 890 | | Ongoing |
Other plant and equipment | | Various | | | | | | 223 | | Ongoing |
Burnett Water infrastructure development | | 15 | | 254,801 | | 123,089 | | 115,126 | | 16,586 |
Comalco Alumina Refinery, common-user infrastructure | | 30 | | 160,994 | | 131,451 | | 29,543 | | |
Qld Brain Institute* | | 05 | | 20,000 | | | | 20,000 | | |
Targinie Valley | | 30 | | 27,260 | | 24,260 | | 1,500 | | 1,500 |
Turtle Interpretive centre | | 15 | | 3,000 | | 49 | | 2,951 | | |
Total Property, Plant and Equipment | | | | | | | | 170,233 | | |
PROPERTY SERVICES GROUP | | | | | | | | | | |
Microelectronics building | | 05 | | 1,050 | | | | 263 | | 787 |
Other plant and equipment | | Various | | | | | | 100 | | Ongoing |
Total Property Plant and Equipment | | | | | | | | 363 | | |
Total Property, Plant and Equipment | | | | | | | | 170,596 | | |
Other Capital Expenditure | | | | | | | | | | |
PROPERTY SERVICES GROUP | | | | | | | | | | |
Land Development | | | | | | | | | | |
S.E. Qld strategic land | | 05 | | 30,500 | | | | 500 | | 30,000 |
Woree business and industry park | | 50 | | 3,897 | | 197 | | 1,900 | | 1,800 |
Lytton industrial estate | | 05 | | 11,774 | | 1,774 | | 10,000 | | |
Gladstone State Development area minor works (formerly Gladstone State Development Infrastructure) | | 30 | | 4,050 | | 2,050 | | 500 | | 1,500 |
Arundel industrial park (GCTP) | | 10 | | 4,380 | | 200 | | 4,180 | | |
Clinton industrial estate-Benstead Street (formerly Red Rover Road) | | 30 | | 4,173 | | 173 | | 4,000 | | |
Bribie Island aquaculture park | | 05 | | 10,565 | | 65 | | 500 | | 10,000 |
GSDA development plan (formerly Aldoga development plan) | | 30 | | 9,939 | | 5,489 | | 250 | | 4,200 |
Charlton industrial estate | | 20 | | 7,850 | | | | 2,250 | | 5,600 |
Yandina industrial estate | | 10 | | 3,200 | | 200 | | 3,000 | | |
Caloundra regional business park | | 10 | | 12,650 | | 150 | | 8,000 | | 4,500 |
Townsville State Development area | | 45 | | 8,000 | | | | 2,000 | | 6,000 |
South Mackay industrial estate | | 40 | | 7,300 | | | | 350 | | 6,950 |
Coolum industrial estate | | 10 | | 10,250 | | | | 2,250 | | 8,000 |
Narangba industrial estate | | 05 | | 3,350 | | | | 350 | | 3,000 |
Minor works | | Various | | | | | | 500 | | Ongoing |
Sub-total Land Development | | | | | | | | 40,530 | | |
Land Purchases | | | | | | | | | | |
Aldoga services corridor | | 30 | | 1,400 | | | | 350 | | 1,050 |
Townsville State Development area | | 45 | | 6,600 | | 4,600 | | 2,000 | | |
Coolum industrial estate | | 10 | | 8,000 | | | | 8,000 | | |
Amberley aerospace park | | 10 | | 4,000 | | | | 4,000 | | |
Sub-total Land Purchases | | | | | | | | 14,350 | | |
| | | | |
| 104 | | Capital Statement 2004-05 | | |
| | | | | | | | | | |
Total Other Capital Expenditure | | | | | | | | 54,880 | | |
Capital Grants | | | | | | | | | | |
STATE DEVELOPMENT AND INNOVATION | | | | | | | | | | |
Australian Institute of Bioengineering and Nanotechnology | | 05 | | 6,667 | | | | 6,667 | | |
Australian Tropical Forest Institute | | 50 | | 2,605 | | | | 2,605 | | |
Cryo-electron Microscopy facility | | 05 | | 485 | | | | 485 | | |
Gladstone infrastructure | | 30 | | 1,500 | | | | 1,500 | | |
Institute for Health and Biomedical Innovation | | 05 | | 7,500 | | | | 7,500 | | |
Qld Parallel Supercomputing Foundation | | 05 | | 6,000 | | | | 2,000 | | 4,000 |
Total Capital Grants | | | | | | | | 20,757 | | |
TOTAL STATE DEVELOPMENT AND INNOVATION | | | | | | | | 246,233 | | |
| * | Funded under the Smart State Building Fund. |
| | | | |
| | | Capital Statement 2004-05 | | 105 |
TOURISM, FAIR TRADING AND WINE INDUSTRY DEVELOPMENT
Program Highlights
The portfolio has a total capital program of $10.9 million in 2004-05, principally relating to the:
| | • | replacement of the Reservation Management System for Tourism Queensland |
| | • | enhancement of the Occupational Licensing database for the Office of Fair Trading |
| | • | ongoing replacement of plant and equipment within the Department of Tourism, Fair Trading and Wine Industry Development. |
Improved information systems operating within the Department of Tourism, Fair Trading and Wine Industry Development and Tourism Queensland will provide more accessible and reliable information to ensure an improved client service to the people of Queensland.
| | | | |
| 106 | | Capital Statement 2004-05 | | |
Tourism, Fair Trading and Wine Industry Development
| | | | | | | | | | |
Project
| | Statistical
Division
| | Total
Estimated Cost
| | Expenditure
to 30-06-04
| | Budget
2004-05
| | Post
2004-05
|
| | | | | $’000 | | $’000 | | $’000 | | $’000 |
DEPARTMENT OF TOURISM, FAIR TRADING AND WINE INDUSTRY DEVELOPMENT | | | | | | | | | | |
Property, Plant and Equipment | | | | | | | | | | |
Plant and equipment | | 05 | | | | | | 421 | | Ongoing |
Total Property, Plant and Equipment | | | | | | | | 421 | | |
Other Capital Expenditure | | | | | | | | | | |
Computer software | | | | | | | | | | |
Occupational Licensing Database | | 05 | | 387 | | 127 | | 260 | | |
Total Other Capital Expenditure | | | | | | | | 260 | | |
TOTAL TOURISM, FAIR TRADING AND WINE INDUSTRY DEVELOPMENT | | | | | | | | 681 | | |
TOURISM QUEENSLAND | | | | | | | | | | |
Property, Plant and Equipment | | | | | | | | | | |
Computer equipment | | | | | | | | | | |
Reservations Management System | | 05 | | 7,448 | | | | 5,365 | | 2,083 |
Hardware replacements | | Various | | 1,176 | | | | 1,176 | | |
Software | | 05 | | 218 | | | | 218 | | |
Other dwellings | | | | | | | | | | |
Office equipment replacements | | Various | | 17 | | | | 17 | | |
Other plant and equipment | | | | | | | | | | |
Fitouts | | Various | | 240 | | | | 240 | | |
Total Property, Plant and Equipment | | | | | | | | 7,016 | | |
Other Capital Expenditure | | | | | | | | | | |
Finance lease asset - computer equipment | | | | | | | | | | |
Reservations management system | | 05 | | 3,228 | | | | 3,228 | | |
Total Other Capital Expenditure | | | | | | | | 3,228 | | |
TOTAL TOURISM QUEENSLAND | | | | | | | | 10,244 | | |
TOTAL TOURISM, FAIR TRADING AND WINE INDUSTRY DEVELOPMENT | | | | | | | | 10,925 | | |
| | | | |
| | | Capital Statement 2004-05 | | 107 |
TRANSPORT
Total capital outlays for the Transport portfolio in 2004-05 are estimated to be $1.093 billion. The portfolio consists of Queensland Transport, Queensland Rail and the port authorities.
Queensland Transport
Queensland Transport’s capital expenditure program for 2004-05 totals $119.8 million and predominantly comprises investment in public transport infrastructure and systems.
Program Highlights
| | • | $35.9 million towards the new Integrated Ticketing System Stage 2 |
| | • | $200 million over four years to continue the Government’s investment in the Busway network including $12 million in 2004-05 towards the Queen Street Bus Station to Roma Street extension of the Inner Northern Busway and $15 million for bus priority and infrastructure improvements |
| | • | $10 million, provided under the Smart State Building Fund, to commence construction of the bus stations at the Royal Children’s Hospital and Normanby |
| | • | $5 million towards improvements to rail intermodal facilities and corridor acquisitions |
| | • | $3.9 million towards the New Queensland drivers licence project |
| | • | $3.4 million for the completion of the upgrade to the Cultural Centre Bus Station |
| | • | $3 million, provided under the Smart State Building Fund, towards the provision of new infrastructure and upgrading of existing infrastructure in the Petrie to Kippa-Ring corridor |
| | • | $3 million, provided under the Smart State Building Fund, towards the provision of new infrastructure and upgrading of existing infrastructure along Gympie Road bus corridor |
| | • | $2 million, provided under the Smart State Building Fund, for the continuing upgrade of boating infrastructure. |
The associated activity generated by the investment program makes important contributions to the Government’s priority commitments of managing urban growth and building Queensland’s regions.
Queensland Rail
Queensland Rail is allocating $622 million for capital outlays in 2004-05.
Program Highlights
| | • | $227.9 million will be spent by Queensland Rail maintaining and upgrading track infrastructure on the coal network. This includes commencement of the construction of a new 110 kilometre spur line and upgrades to the existing Blackwater system as part of Queensland Rail’s commitment to the Xstrata Rolleston Coal project |
| | • | $35.7 million, provided under the Smart State Building Fund, for additional rollingstock and infrastructure for the Citytrain MetTrip initiative. Funding for MetTrip Stage 2 will commence in 2005-06, bringing total Government funding for MetTrip to $742.2 million |
| | • | $20 million for additional modifications to Citytrain stations and rollingstock to achieve compliance with the Disability Standards for Accessible Public Transport 2002 |
| | | | |
| 108 | | Capital Statement 2004-05 | | |
| | • | $17 million for the upgrade of the coal electric loco fleet |
| | • | $13.7 million for the acquisition of diesel electric locomotives |
| | • | $13 million for replacement of timber bridges in regional Queensland |
| | • | $11.8 million for Turnout Replacements in the Citytrain network. |
Port Authorities
The Queensland port network’s capital expenditure program for 2004-05 totals $351.1 million and comprises a range of initiatives aimed at improving the efficiency and capacity of sea and air port related infrastructure.
Program Highlights
| | • | $34.1 million for reclamation and construction of a seawall to facilitate the expansion of Fisherman Islands by the Port of Brisbane Corporation |
| | • | $34.3 million at Cairns airport for the construction of new baggage facility, implementation of 100% checked bag screening and the installation of other security equipment |
| | • | $23.7 million towards continued development of facilities at the RG Tanna Coal Terminal and Gladstone Port Central |
| | • | $58.8 million for the further expansion of the RG Tanna Coal Terminal at Gladstone. This is part of a larger project to increase the capacity of the terminal by 14 million tonnes per annum to meet expected demand. The total cost of the expansion is estimated at $167 million with several projects to commence from 2005-06 |
| | • | $6.6 million for dredging and enhancement of port infrastructure at the Ports Corporation of Queensland’s port of Weipa and a further $5.2 million for the construction of a water supply pipeline to Hay Point. |
| | | | |
| | | Capital Statement 2004-05 | | 109 |
Transport
| | | | | | | | | | |
Project
| | Statistical
Division
| | Total
Estimated
Cost
| | Expenditure
to 30-06-04
| | Budget
2004-05
| | Post 2004-05
|
| | | | | $’000 | | $’000 | | $’000 | | $’000 |
QUEENSLAND TRANSPORT | | | | | | | | | | |
Property, Plant and Equipment | | | | | | | | | | |
Public Transport Infrastructure | | | | | | | | | | |
Royal Children’s Hospital and Normanby Busway stations* | | 05 | | 12,350 | | | | 10,000 | | 2,350 |
Queen Street Bus Station to Roma Street extension to INB | | 05 | | 140,000 | | | | 12,000 | | 128,000 |
Cultural Centre Busway station upgrade | | 05 | | 15,700 | | 12,300 | | 3,400 | | |
Transport corridor acquisitions - SEQ* | | 10 | | 6,000 | | | | 2,000 | | 4,000 |
Integrated Ticketing System | | 05 | | 61,324 | | 12,375 | | 26,586 | | 22,363 |
Bus Infrastructure Rolling Program | | Various | | 60,000 | | | | 15,000 | | 45,000 |
Bus intermodal facilities* | | 05 | | 6,000 | | | | 1,000 | | 5,000 |
Rail Corridors and Intermodal facilities | | Various | | 30,500 | | | | 5,150 | | 25,350 |
Petrie to Kippa-Ring bus corridor* | | 05 | | 7,000 | | | | 3,000 | | 4,000 |
Gympie Road bus corridor* | | 05 | | 5,000 | | | | 3,000 | | 2,000 |
Normanby cycleway connection* | | 05 | | 6,000 | | | | 250 | | 5,750 |
Sub-total Public Transport Infrastructure | | | | | | | | 81,386 | | |
Maritime Infrastructure | | | | | | | | | | |
Vessel Tracking System upgrade* | | Various | | 1,000 | | | | 250 | | 750 |
VTMIS | | Various | | 749 | | | | 114 | | 635 |
VTS Centre upgrades | | Various | | 1,879 | | | | 59 | | 1,820 |
REEFREP upgrade | | 40 | | 650 | | | | 300 | | 350 |
Pollution response improvement | | Various | | 823 | | | | 300 | | 523 |
Upgrade of oil spill response Equipment* | | Various | | 396 | | | | 153 | | 243 |
Coomera River and North channel dredging* | | 10 | | 2,000 | | | | 2,000 | | |
Port Douglas boat harbour - new dredged material disposal area* | | 50 | | 3,500 | | | | 815 | | 2,685 |
Gold Coast sand bypass jetty upgrade* | | 10 | | 1,463 | | 526 | | 500 | | 437 |
Manly (William Gunn) jetty upgrade* | | 05 | | 450 | | | | 450 | | |
Pumpkin Creek boat ramp* | | 30 | | 125 | | | | 125 | | |
Jacob’s Well jetty upgrade* | | 10 | | 110 | | | | 110 | | |
Mooloolaba boat harbour dredging strategy | | 10 | | 750 | | | | 500 | | 250 |
Howard (Burrum R) new boat ramp | | 15 | | 250 | | | | 250 | | |
Minor works | | Various | | 2,957 | | 1,300 | | 1,457 | | 200 |
Sub-total Maritime Infrastructure | | | | | | | | 7,383 | | |
Corporate Property- Buildings | | | | | | | | | | |
Pinkenba VTS relocation | | 05 | | 1,285 | | 535 | | 750 | | |
Spring Hill new generator | | 05 | | 350 | | | | 350 | | |
Spring Hill CBD refurbishments | | 05 | | 250 | | | | 250 | | |
Minor works | | Various | | | | | | 611 | | Ongoing |
Sub-total Corporate Property - Buildings | | | | | | | | 1,961 | | |
| | | | |
| 110 | | Capital Statement 2004-05 | | |
| | | | | | | | | | |
Corporate Information Services Infrastructure replacement - upgrade | | 05 | | | | | | 4,773 | | Ongoing |
Sub-total Corporate Information Services | | | | | | | | 4,773 | | |
Regional Service Delivery | | | | | | | | | | |
Plant and equipment | | Various | | | | | | 494 | | Ongoing |
Sub-total Regional Service Delivery | | | | | | | | 494 | | |
Other Departmental Plant and Equipment | | | | | | | | | | |
Other plant and equipment | | Various | | | | | | 521 | | Ongoing |
Sub-total Other Departmental Plant and Equipment | | | | | | | | 521 | | |
Total Property, Plant and Equipment | | | | | | | | 96,518 | | |
Other Capital Expenditure | | | | | | | | | | |
New Queensland driver licence | | 05 | | 8,200 | | 4,277 | | 3,900 | | 23 |
Integrated Ticketing System | | 05 | | 34,584 | | 20,176 | | 9,307 | | 5,101 |
Miscellaneous Maritime Safety | | Various | | 4,952 | | | | 789 | | 4,163 |
Systems and Equipment | | | | | | | | | | |
Total Other Capital Expenditure | | | | | | | | 13,996 | | |
Capital Grants | | | | | | | | | | |
Rural and remote airstrips | | Various | | | | | | 1,000 | | Ongoing |
Public transport infrastructure | | Various | | | | | | 1,555 | | Ongoing |
Accessible buses | | Various | | | | | | 3,000 | | Ongoing |
School bus upgrade scheme | | Various | | | | | | 3,000 | | Ongoing |
Safe school travel | | Various | | | | | | 541 | | Ongoing |
Safe walking and pedalling | | Various | | | | | | 200 | | Ongoing |
Total Capital Grants | | | | | | | | 9,296 | | |
TOTAL QUEENSLAND TRANSPORT | | | | | | | | 119,810 | | |
| | | | | |
QUEENSLAND RAIL | | | | | | | | | | |
Network Access | | | | | | | | | | |
Coal wagon fleet upgrade - infrastructure | | 40 | | 24,300 | | 6,916 | | 4,530 | | 12,854 |
Rockhampton - Townsville-Cairns track upgrade | | Various | | 371,150 | | 368,150 | | 3,000 | | |
Statewide security fencing | | Various | | 15,525 | | 6,441 | | 4,598 | | 4,486 |
Re-rail Miles to Muckadilla | | Various | | 27,945 | | 24,240 | | 3,705 | | |
Timber bridge replacement - regional | | Various | | 38,299 | | 18,294 | | 13,030 | | 6,975 |
Level crossing protection | | Various | | 18,500 | | 4,464 | | 4,000 | | 10,036 |
Hail Creek - electrification | | 40 | | 15,950 | | 15,807 | | 143 | | |
Hail Creek - construction | | 40 | | 93,866 | | 86,432 | | 7,434 | | |
Coppabella Mine rail deviation | | 40 | | 20,470 | | 18,867 | | 1,603 | | |
Surat Basin track upgrade - Stage 2 | | 25 | | 15,900 | | 5,624 | | 4,973 | | 5,303 |
Townsville - Resignalling Stuart Junction | | 45 | | 11,900 | | 666 | | 11,134 | | 100 |
Moorvale construction | | 40 | | 12,000 | | 900 | | 11,100 | | |
| | | | |
| | | Capital Statement 2004-05 | | 111 |
| | | | | | | | | | |
Coal infrastructure projects | | 30 | | 272,500 | | 14,595 | | 194,800 | | 63,105 |
Goonyella System: Rail upgrade | | 40 | | 11,101 | | 2,855 | | 3,350 | | 4,896 |
Townsville - New station track infrastructure | | 45 | | 11,770 | | 11,346 | | 424 | | |
Northgate - Petrie 3rd track | | 05 | | 124,380 | | 123,993 | | 387 | | |
Caboolture Landsborough upgrade | | Various | | 11,795 | | 6,521 | | 500 | | 4,774 |
Noise amelioration - Metro | | 05 | | 19,720 | | 9,016 | | 8,000 | | 2,704 |
Turnout replacement strategy - Stage 1 & 2 | | Various | | 46,750 | | 31,009 | | 11,839 | | 3,902 |
Timber bridge elimination - Brisbane suburban area | | 05 | | 17,900 | | 9,032 | | 5,287 | | 3,581 |
Citytrain MetTrip track infrastructure upgrade* | | 05 | | 205,553 | | | | 15,620 | | 189,933 |
Citytrain MetTrip track infrastructure upgrade* | | 10 | | 28,447 | | | | 2,050 | | 26,397 |
General - Network access | | Various | | | | | | 109,268 | | Ongoing |
Total Network Access | | | | | | | | 420,775 | | |
Freight | | | | | | | | | | |
Coal fleet upgrade project - Rollingstock | | 30 | | 339,980 | | 339,880 | | 100 | | |
CFS electric loco fleet upgrade | | Various | | 88,000 | | 59,542 | | 17,000 | | 11,458 |
Additional VSA coal wagons | | Various | | 77,743 | | 77,700 | | 43 | | |
Acquisition of DELs | | 15 | | 64,000 | | 46,380 | | 13,700 | | 3,920 |
General - Freight | | Various | | | | | | 41,665 | | Ongoing |
Total Freight | | | | | | | | 72,508 | | |
Passenger | | | | | | | | | | |
Citytrain EMU re-engineering and overhaul | | 05 | | 68,800 | | 34,955 | | 8,500 | | 25,345 |
Citytrain safe stations | | 05 | | 39,454 | | 37,515 | | 1,500 | | 439 |
Cairns tilt train | | 05 | | 13,800 | | 13,697 | | 20 | | 83 |
Cairns tilt train | | 15 | | 124,200 | | 123,275 | | 180 | | 745 |
Vintage fleet upgrade | | 05 | | 1,350 | | 357 | | | | 993 |
Vintage fleet upgrade | | 45 | | 12,150 | | 3,214 | | | | 8,936 |
Citytrain disabled access compliance | | 05 | | 38,720 | | 26,965 | | 8,289 | | 3,466 |
Citytrain disabled access compliance | | 15 | | 8,105 | | 7,805 | | 300 | | |
Citytrain Disability Standards 2007 compliance | | 05 | | 100,000 | | | | 19,000 | | 81,000 |
Citytrain Disability Standards 2007 compliance | | 10 | | 6,000 | | | | 1,000 | | 5,000 |
Traveltrain accessible stations | | Various | | 10,100 | | 4,489 | | 2,500 | | 3,111 |
Citytrain MetTrip rollingstock, stations and intermodal works* | | 05 | | 166,000 | | | | 18,000 | | 148,000 |
Townsville - New station | | 45 | | 12,050 | | 11,615 | | 435 | | |
General - Passenger | | 05 | | | | | | 23,746 | | Ongoing |
Total Passenger | | | | | | | | 83,470 | | |
Across QR | | | | | | | | | | |
Motor vehicle acquisitions | | 05 | | | | | | 30,000 | | Ongoing |
Computer systems - LEAPS | | 05 | | 39,760 | | 37,562 | | 2,198 | | |
General - Across QR | | 05 | | | | | | 13,049 | | Ongoing |
Total Across QR | | | | | | | | 45,247 | | |
TOTAL QUEENSLAND RAIL | | | | | | | | 622,000 | | |
PORT AUTHORITIES | | | | | | | | | | |
| | | | |
| 112 | | Capital Statement 2004-05 | | |
| | | | | | | | | | |
PORT OF BRISBANE CORPORATION | | | | | | | | | | |
Property, Plant and Equipment | | | | | | | | | | |
Car precinct flyover | | 05 | | 5,600 | | 1,000 | | 4,600 | | |
Whimbrel Street car terminals | | 05 | | 18,500 | | 1,500 | | 6,400 | | 10,600 |
Hamilton site relocation | | 05 | | 61,750 | | 5,600 | | 7,200 | | 48,950 |
Terminals 1,2 and 3 | | 05 | | 7,700 | | | | 6,200 | | 1,500 |
Port central | | 05 | | 2,000 | | | | 2,000 | | |
Common-user terminal | | 05 | | 8,869 | | 3,000 | | 5,869 | | |
Down stream dredging | | 05 | | 20,000 | | 1,000 | | 3,500 | | 15,500 |
Upgrade of major roads | | 05 | | 16,000 | | 500 | | 3,500 | | 12,000 |
Colmslie and Hamilton precincts | | 05 | | 6,500 | | 2,000 | | 4,500 | | |
Wharf 9 | | 05 | | 28,110 | | 11,000 | | 17,110 | | |
Lessee terminals | | 05 | | 14,500 | | | | 5,000 | | 9,500 |
Expansion - Reclamation and outer bund wall | | 05 | | 84,058 | | 50,000 | | 34,058 | | |
Electrical upgrades - P&O and Patrick | | 05 | | 350 | | 250 | | 100 | | |
Reclamation and earthworks | | 05 | | 25,500 | | 4,000 | | 4,000 | | 17,500 |
PBC building and landscaping upgrades | | 05 | | 700 | | 100 | | 600 | | |
Warehouses - Fisherman Island | | 05 | | 26,200 | | 5,500 | | 3,200 | | 17,500 |
Fisherman Island wet bulk | | 05 | | 8,948 | | 1,448 | | 7,500 | | |
Whyte Island site preparation | | 05 | | 15,500 | | 1,000 | | 1,000 | | 13,500 |
Eagle Farm Estate, Site preparation and warehousing | | 05 | | 12,200 | | 7,200 | | 5,000 | | |
Boat Harbour restoration works | | 05 | | 4,050 | | 1,500 | | 2,550 | | |
Dredging equipment | | 05 | | 5,170 | | 700 | | 4,470 | | |
Whyte Island services | | 05 | | 4,500 | | | | 4,500 | | |
Minor capital works | | 05 | | 7,205 | | | | 7,205 | | |
Total Property, Plant and Equipment | | | | | | | | 140,062 | | |
| | | | | |
TOTAL PORT OF BRISBANE CORPORATION | | | | | | | | 140,062 | | |
| | | | | |
BUNDABERG PORT AUTHORITY | | | | | | | | | | |
| | | | | |
Property, Plant and Equipment | | | | | | | | | | |
Minor capital expenditure | | 15 | | 227 | | | | 227 | | |
Total Property, Plant and Equipment | | | | | | | | 227 | | |
Other Capital Expenditure | | | | | | | | | | |
Sea Scallop Project | | 15 | | 390 | | 350 | | 40 | | |
Conveyor system and sand wash | | 15 | | 400 | | | | 400 | | |
Total Other Capital Equipment | | | | | | | | 440 | | |
| | | | | |
TOTAL BUNDABERG PORT AUTHORITY | | | | | | | | 667 | | |
| | | | | |
CAIRNS PORT AUTHORITY | | | | | | | | | | |
| | | | | |
Property, Plant and Equipment | | | | | | | | | | |
Cairns Airport | | | | | | | | | | |
DTB checked bag screening | | 50 | | 2,060 | | | | 2,060 | | |
ITB baggage make-up and checked bag screening | | 50 | | 32,733 | | 490 | | 32,243 | | |
Interim terminal works design and construction documentation | | 50 | | 4,000 | | 1,171 | | 2,829 | | |
Interim terminal works - CPA project management | | 50 | | 566 | | | | 431 | | 136 |
Electrical infrastructure | | 50 | | 3,455 | | | | 2,256 | | 1,199 |
Water supply upgrade | | 50 | | 1,288 | | | | 1,288 | | |
| | | | |
| | | Capital Statement 2004-05 | | 113 |
| | | | | | | | | | |
Separate fire main | | 50 | | 2,031 | | | | 2,031 | | |
ITB bus bay covers | | 50 | | 243 | | 237 | | 6 | | |
Levee upgrades | | 50 | | 701 | | 655 | | 46 | | |
Drainage works | | 50 | | 1,842 | | 127 | | 845 | | 870 |
Apron and taxiway works | | 50 | | 10,274 | | 7,182 | | 1,454 | | 1,638 |
Future apron edge taxiway and preparation and surcharging of apron | | 50 | | 2,335 | | 211 | | 2,124 | | |
Domestic Apron - Bays 14 and 15 | | 50 | | 3,052 | | 280 | | 2,772 | | |
Land acquisition | | 50 | | 515 | | | | 515 | | |
Passenger screening equipment | | 50 | | 665 | | | | 665 | | |
Business park development | | 50 | | 1,089 | | | | 586 | | 502 |
Hawker Pacific building | | 50 | | 2,496 | | 728 | | 1,768 | | |
Retail and commercial developments | | 50 | | 15,783 | | 1,158 | | 4,051 | | 10,574 |
Minor capital works | | 50 | | 2,490 | | | | 2,490 | | |
Sub-total Cairns Airport | | | | | | | | 60,460 | | |
Cairns Seaport | | | | | | | | | | |
Rebuild Smiths Creek No.2 wharf | | 50 | | 775 | | 25 | | 750 | | |
Tingira Street works | | 50 | | 370 | | 200 | | 170 | | |
Wharf 10 fire fighting system upgrade | | 50 | | 1,596 | | 596 | | 1,000 | | |
Surebeam fruit disinfestation facility | | 50 | | 3,230 | | 230 | | 3,000 | | |
Seaport electrical outlet upgrades | | 50 | | 365 | | | | 365 | | |
Shipping channel modifications | | 50 | | 50 | | | | 50 | | |
Security fencing lighting and signage | | 50 | | 470 | | 220 | | 250 | | |
Seaport security systems and cameras | | 50 | | 544 | | 324 | | 220 | | |
Relocate of piermaster staff | | 50 | | 170 | | | | 170 | | |
Minor works | | 50 | | 280 | | | | 280 | | |
Sub-total Cairns Seaport | | | | | | | | 6,255 | | |
Cairns Cityport | | | | | | | | | | |
Precinct 12 A development | | 50 | | 6,049 | | 226 | | 1,555 | | 4,268 |
Aquatic club offsite ramp and shed | | 50 | | 175 | | | | 175 | | |
Revetments South | | 50 | | 2,687 | | 127 | | 1,260 | | 1,300 |
Demolition and site remediation | | 50 | | 2,520 | | 290 | | 1,806 | | 424 |
Wharf shed refurbishment | | 50 | | 1,718 | | 34 | | 93 | | 1,591 |
Wharf Street upgrade | | 50 | | 2,131 | | 118 | | 2,013 | | |
Street furniture/signage/ landscaping | | 50 | | 708 | | 100 | | 300 | | 308 |
Security camera for Cityport | | 50 | | 747 | | | | 402 | | 345 |
Cityport minor capital works | | 50 | | 1,254 | | 80 | | 917 | | 257 |
Sub-total Cairns Cityport | | | | | | | | 8,521 | | |
Total Property Plant and Equipment | | | | | | | | 75,236 | | |
| | | | | |
TOTAL CAIRNS PORT AUTHORITY | | | | | | | | 75,236 | | |
| | | | |
| 114 | | Capital Statement 2004-05 | | |
| | | | | | | | | | |
| | | | | |
GLADSTONE PORT AUTHORITY | | | | | | | | | | |
Property, Plant and Equipment | | | | | | | | | | |
Development Hanson Road subdivision | | 30 | | 5,308 | | | | 500 | | 4,808 |
Auckland Point structural works | | 30 | | 862 | | 70 | | 392 | | 400 |
RG Tanna Coal Terminal shiploading modifications | | 30 | | 488 | | 394 | | 94 | | |
Structural works | | 30 | | 11,719 | | 1,846 | | 7,779 | | 2,094 |
Barney Point structural works | | 30 | | 1,182 | | 282 | | 790 | | 110 |
Plant and equipment | | 30 | | 16,959 | | 4,008 | | 12,951 | | |
Building modifications | | 30 | | 2,750 | | 976 | | 1,774 | | |
Services (roads, drainage and sewage) | | 30 | | 7,994 | | 1,478 | | 5,894 | | 622 |
Land development | | 30 | | 904 | | 223 | | 681 | | |
Reclamation/earthworks | | 30 | | 2,600 | | | | 2,600 | | |
Gladstone, Berth 3 development | | 30 | | 80,000 | | 78,300 | | 1,700 | | |
Gladstone, stockpile 16 development | | 30 | | 10,720 | | 7,920 | | 2,800 | | |
Port access road | | 30 | | 4,500 | | 2,004 | | 2,496 | | |
RG Tanna Coal Terminal 3rd shiploader | | 30 | | 40,000 | | 200 | | 32,800 | | 7,000 |
RG Tanna Coal Terminal stockpile 17 | | 30 | | 25,500 | | | | 12,000 | | 13,500 |
RG Tanna Coal Terminal 3rd dump station | | 30 | | 28,000 | | | | 14,000 | | 14,000 |
RG Tanna Coal Terminal new dozer facility | | 30 | | 3,000 | | 70 | | 2,930 | | |
Total Property, Plant and Equipment | | | | | | | | 102,181 | | |
TOTAL GLADSTONE PORT AUTHORITY | | | | | | | | 102,181 | | |
| | | | | |
MACKAY PORT AUTHORITY | | | | | | | | | | |
| | | | | |
Property, Plant and Equipment | | | | | | | | | | |
Mackay Airport | | | | | | | | | | |
Taxiway widening | | 40 | | 250 | | | | 250 | | |
Public car park extension | | 40 | | 525 | | | | 525 | | |
Security system | | 40 | | 300 | | | | 300 | | |
Terminal fit-outs/upgrades | | 40 | | 125 | | | | 125 | | |
Additional advertising signs | | 40 | | 50 | | | | 50 | | |
Check bag screening equipment | | 40 | | 750 | | | | 750 | | |
Subtotal Mackay Airport | | | | | | | | 2,000 | | |
Mackay Seaport | | | | | | | | | | |
Triangle sub-division | | 40 | | 1,000 | | | | 1,000 | | |
Packaged office - Workshop development | | 40 | | 1,000 | | | | 1,000 | | |
Additions to port security system | | 40 | | 150 | | | | 150 | | |
Upgrade Harbour Road main drain culvert | | 40 | | 800 | | | | 800 | | |
Subtotal Mackay Seaport | | | | | | | | 2,950 | | |
Sundry plant and equipment | | 40 | | 1,000 | | | | 1,000 | | |
Total Property, Plant and Equipment | | | | | | | | 5,950 | | |
TOTAL MACKAY PORT AUTHORITY | | | | | | | | 5,950 | | |
| | | | | |
PORTS CORPORATION OF QUEENSLAND | | | | | | | | | | |
| | | | | |
Property, Plant and Equipment | | | | | | | | | | |
Head Office miscellaneous plant and equipment | | 05 | | 210 | | | | 210 | | |
Hay Point water pipeline | | 40 | | 8,740 | | 3,580 | | 5,160 | | |
Hay Point departure path preliminary studies only | | 40 | | 600 | | | | 600 | | |
Hay Point dredging | | 40 | | 1,500 | | | | 1,500 | | |
Louisa Creek land acquisitions | | 40 | | 10,000 | | 3,042 | | 600 | | 6,358 |
Hay Point Port development general | | 40 | | 462 | | | | 462 | | |
| | | | |
| | | Capital Statement 2004-05 | | 115 |
| | | | | | | | | | |
Abbot Point Port development | | 40 | | 1,603 | | | | 1,603 | | |
Lucinda Port development | | 45 | | 163 | | | | 163 | | |
Mourilyan Port development | | 50 | | 189 | | | | 189 | | |
Cape Flattery Port development | | 50 | | 15 | | | | 15 | | |
Weipa Lorim Point East remote release mooring hooks | | 50 | | 1,300 | | 150 | | 1,150 | | |
Weipa South channel widening | | 50 | | 5,150 | | 1,350 | | 3,800 | | |
Weipa Fendering Lorim Point East and West wharves | | 50 | | 1,500 | | 50 | | 1,450 | | |
Weipa Port development general | | 50 | | 176 | | | | 176 | | |
Thursday Island Port development | | 50 | | 296 | | | | 296 | | |
Skardon River Port development | | 50 | | 4 | | | | 4 | | |
Karumba Port development | | 55 | | 6 | | | | 6 | | |
Total Property Plant and Equipment | | | | | | | | 17,384 | | |
TOTAL PORTS CORPORATION OF QUEENSLAND | | | | | | | | 17,384 | | |
| | | | | |
ROCKHAMPTON PORT AUTHORITY | | | | | | | | | | |
Property, Plant and Equipment | | | | | | | | | | |
Minor capital works | | 30 | | 95 | | | | 95 | | |
Total Property, Plant and Equipment | | | | | | | | 95 | | |
TOTAL ROCKHAMPTON PORT AUTHORITY | | | | | | | | 95 | | |
| | | | | |
TOWNSVILLE PORT AUTHORITY | | | | | | | | | | |
Property, Plant and Equipment | | | | | | | | | | |
Construction of office complex in commercial precinct | | 45 | | 4,250 | | | | 4,250 | | |
Port security upgrade | | 45 | | 1,250 | | | | 1,250 | | |
Electrical/lighting upgrades | | 45 | | 543 | | | | 243 | | 300 |
Miscellaneous port infrastructure | | 45 | | 3,683 | | | | 2,883 | | 800 |
Miscellaneous plant and equipment | | 45 | | 941 | | | | 941 | | |
Total Property, Plant and Equipment | | | | | | | | 9,567 | | |
TOTAL TOWNSVILLE PORT AUTHORITY | | | | | | | | 9,567 | | |
TOTAL PORT AUTHORITIES | | | | | | | | 351,142 | | |
TOTAL TRANSPORT PORTFOLIO | | | | | | | | 1,092,952 | | |
| * | Funded under the Smart State Building Fund. |
| | | | |
| 116 | | Capital Statement 2004-05 | | |
TREASURY
Treasury portfolio (incorporating the Department of Treasury, its statutory authorities and the Government-owned corporation, Golden Casket Lottery Corporation) has a combined capital works program of $71.8 million in 2004-05.
The Department of Treasury has a capital expenditure program of $15.9 million in 2004-05.
Program Highlights
| | • | $8.7 million toward further implementation and development of the Information and Technology Strategic Plan (ITSP) within the Office of State Revenue. The system is designed to employ contemporary technology to provide revenue and information management and e-business capability to better service the Government and people of Queensland. |
| | • | $0.6 million toward software redevelopment within the Office of Gaming Regulation to comply with mandatory information standards, which supports the Government’s outcome of providing safe and secure communities. |
| | • | $6.4 million towards the replacement of property, plant and equipment and information technology software for the ongoing operational requirement to provide Treasury’s key infrastructure of intellectual capital and software solution needs. This supports the Government’s principle of strategic governance in providing whole-of-Government support services and policy development. |
CorpTech
CorpTech is the new technology centre of skill established under the Shared Services Initiative. CorpTech has a capital expenditure program in 2004-05 amounting to $42.6 million. This program will be directed to providing innovative whole-of-Government corporate applications and infrastructure solutions for the five large shared service providers and to the agencies within Government.
Program Highlights
| | • | $42.0 million to implement and develop the System Solution Realisation Program. The system is a broad program of work that will provide the technology to meet standardised business processes across government agencies, which supports the Government outcomes and priorities of the Aligning Services and Priorities process. |
Motor Accident Insurance Commission
Capital outlays for the Motor Accident Insurance Commission and the Nominal Defendant of $0.08 million are allocated towards the continued development of a computer system to support a viable and equitable personal injury compensation scheme in Queensland.
| | | | |
| | | Capital Statement 2004-05 | | 117 |
Golden Casket Lottery Corporation Limited
Golden Casket’s capital expenditure program for 2004-05 is $13.2 million and principally comprises expenditure on plant and equipment which will contribute to the delivery of enhanced operational functionality, including progression to a level of unattended and automated systems operations.
Treasury
| | | | | | | | | | |
Project
| | Statistical
Division
| | Total
Estimated Cost
| | Expenditure
to 30-06-04
| | Budget
2004-05
| | Post
2004-05
|
| | | | | $’000 | | $’000 | | $’000 | | $’000 |
DEPARTMENT OF TREASURY | | | | | | | | | | |
Property, Plant and Equipment | | | | | | | | | | |
Asset replacement | | 05 | | | | | | 5,580 | | Ongoing |
OSR ITSP | | 05 | | 1,025 | | | | 1,025 | | |
Other items | | 05 | | | | | | 152 | | Ongoing |
Total Property, Plant and Equipment | | | | | | | | 6,757 | | |
Other Capital Expenditure | | | | | | | | | | |
OSR ITSP | | 05 | | 33,045 | | 12,086 | | 7,638 | | 13,321 |
Other items | | 05 | | | | | | 1,467 | | Ongoing |
Total Other Capital Expenditure | | | | | | | | 9,105 | | |
TOTAL DEPARTMENT OF TREASURY | | | | | | | | 15,862 | | |
CORPTECH | | | | | | | | | | |
Property, Plant and Equipment | | | | | | | | | | |
Computer equipment | | 05 | | | | | | 499 | | Ongoing |
Total Property, Plant and Equipment | | | | | | | | 499 | | |
Other Capital Expenditure | | | | | | | | | | |
Systems Solution Realisation program | | 05 | | 51,420 | | 9,420 | | 42,000 | | Ongoing |
Other items | | 05 | | | | | | 150 | | Ongoing |
Total Other Capital Expenditure | | | | | | | | 42,150 | | |
TOTAL CORPTECH | | | | | | | | 42,649 | | |
MOTOR ACCIDENT INSURANCE ADMINISTRATION | | | | | | | | | | |
Other Capital Expenditure | | | | | | | | | | |
Motor Accident Insurance Commission | | 05 | | | | | | 75 | | Ongoing |
Total Other Capital Expenditure | | | | | | | | 75 | | |
TOTAL MOTOR ACCIDENT INSURANCE ADMINISTRATION | | | | | | | | 75 | | |
GOLDEN CASKET LOTTERY CORPORATION | | | | | | | | | | |
Property, Plant and Equipment | | | | | | | | | | |
Store syndicate enhancements | | 05 | | 1,690 | | | | 1,690 | | |
Internet lottery sales and prize payments | | 05 | | 3,456 | | | | 3,456 | | |
ISI Loyalty program | | 05 | | 802 | | | | 802 | | |
Minor works | | 05 | | 3,484 | | | | 1,939 | | 1,545 |
Asset replacement | | 05 | | 17,590 | | | | 2,284 | | 15,306 |
Other items | | 05 | | 6,382 | | | | 3,037 | | 3,345 |
Total Property, Plant and Equipment | | | | | | | | 13,208 | | |
TOTAL GOLDEN CASKET LOTTERY CORPORATION | | | | | | | | 13,208 | | |
TOTAL TREASURY | | | | | | | | 71,794 | | |
| | | | |
| 118 | | Capital Statement 2004-05 | | |
APPENDIX A
ENTITIES INCLUDED IN CAPITAL OUTLAYS - 2004-05 BUDGET
Department of Aboriginal and Torres Strait Islander Policy
Department of Child Safety
Department of Communities
Department of Corrective Services
Disability Services Queensland
Department of Education and the Arts
Corporate and Professional Services
Queensland Studies Authority
Arts Queensland
Queensland Art Gallery
Queensland Museum
Queensland Performing Arts Trust
Library Board of Queensland
Electoral Commission of Queensland
Department of Emergency Services
Department of Employment and Training
Corporate Solutions Queensland
Environmental Protection Agency
Office of the Governor
Queensland Health
Queensland Health Shared Service Provider
Queensland Institute of Medical Research
Department of Housing (including Racing)
Queensland Building Services Authority
Residential Tenancy Authority
Department of Industrial Relations
Department of Justice and Attorney-General
PartnerOne
Legal Aid Queensland
Public Trust Office
Legislative Assembly
Department of Local Government, Planning, Sport and Recreation
Major Sports Facility Authority
Gold Coast Events Corporation
Department of Main Roads
Main Roads – Commercial Operations (RoadTek)
Queensland Motorways Limited
Department of Natural Resources and Mines
CorporateLink
Gladstone Area Water Board
Mount Isa Water Board
Pioneer Valley Water Board
Sunwater
| | | | |
| | | Capital Statement 2004-05 | | 119 |
CS Energy Limited
Energex
Stanwell Corporation Limited
Tarong Energy Corporation Limited
Queensland Electricity Transmission Corporation Limited (Powerlink Queensland)
Queensland Power Trading Corporation
Ergon Energy
Offices of the Ombudsman and Information Commissioner
Department of Police
Department of Premier and Cabinet
Crime and Misconduct Commission
South Bank Corporation
Queensland Events Corporation
Commission for Children and Young People
Office of the Public Service Commissioner
Department of Primary Industries and Fisheries
Forestry
Queensland Rural Adjustment Authority
Department of Public Works
QBuild
QFleet
Project Services
GOPRINT
Sales and Distribution Services
CITEC
Queensland Audit Office
Department of State Development and Innovation
Property Services Group
Department of Tourism, Fair Trading and Wine Industry Development
Tourism Queensland
Department of Transport
Port Authorities
Bundaberg Port Authority
Cairns Port Authority
Gladstone Port Authority
Mackay Port Authority
Port of Brisbane Authority
Ports Corporation of Queensland
Rockhampton Port Authority
Townsville Port Authority
Queensland Rail
QR National (Interail)
Department of Treasury
Corptech
Motor Accident Insurance Commission
Nominal Defendant
Golden Casket Lottery Corporation
| | | | |
| 120 | | Capital Statement 2004-05 | | |