Exhibit (c)(ii)
2003-04 Report on State Finances
of the Queensland Government
year ended 30 June 2004

Contents
| | |
| | | Page
|
Message from the Treasurer | | 2 |
| |
Scope of the Report | | 3 |
| |
Outcomes Report - Uniform Presentation Framework | | |
| |
Overview and Analysis | | 4-01 |
| |
Operating Statement by Sector | | 4-08 |
| |
Balance Sheet by Sector | | 4-09 |
| |
Cash Flow Statement by Sector | | 4-10 |
| |
General Government Sector Expenses by Function | | 4-11 |
| |
General Government Sector Purchases of Non-financial Assets by Function | | 4-12 |
| |
Loan Council Allocation | | 4-12 |
| |
Certification of Outcomes Report | | 4-13 |
| |
Audited Consolidated Financial Statements | | |
| |
Overview and Analysis | | 5-01 |
| |
Statement of Financial Performance | | 5-06 |
| |
Statement of Financial Position | | 5-07 |
| |
Statement of Cash Flows | | 5-08 |
| |
Notes to the Financial Statements | | 5-09 |
| |
Certification of Consolidated Financial Statements | | 5-64 |
| |
Independent Audit Report to the Treasurer of Queensland | | 5-65 |
| |
Attachment A: Reconciliation of UPF and AAS Operating Result | | 6-01 |
| | |
Report on State Finances 2003-04 – Government of Queensland | | 1 |
Message from the Treasurer
Message from the Treasurer
As outlined in the Charter of Social and Fiscal Responsibility, the Government is committed to fiscal transparency and accountability. A key objective of this report is to facilitate a meaningful assessment of the State’s financial performance over the 2003-04 financial year and its net worth at balance date.
This report provides details of the State’s financial operations and position on both a Government Finance Statistics (Outcomes Report) and Australian Accounting Standards (Consolidated Financial Statements) basis.
Only those entities assessed as likely to impact materially on the State’s financial activities are accounted for in this report.
In endorsing this report, I place on record my appreciation of the co-operation extended to Queensland Treasury by agency personnel and of the work undertaken by Treasury staff involved in its preparation.
|
|
 |
| Terry Mackenroth |
| Treasurer |
| | |
Report on State Finances 2003-04 – Government of Queensland | | 2 |
Scope of the Report
The State Finance Report, incorporating the Outcomes Report and Consolidated Financial Statements, provides a comprehensive analysis of Government finances for the 2003-04 financial year.
These reports are prepared using differing methodologies, each giving a view of Government finances. The Consolidated Financial Statements outline the operations of the Queensland Government including valuation adjustments on assets and liabilities. The Outcomes Report removes valuation adjustments to reflect costs more appropriately related to the underlying operations of Government.
The Outcomes Report
The Outcomes Report contains financial statements that are prepared and presented on a Government Finance Statistics (GFS) basis and in accordance with the Uniform Presentation Framework (UPF) agreed to at the 1991 Premiers’ Conference. The primary objective of the UPF is to ensure that Commonwealth, State and Territory governments provide a common ‘core’ of financial information. One of the Government’s key fiscal principles is the maintenance of a General Government operating surplus as measured in Government Finance Statistics terms.
Queensland’s annual Budget is prepared in accordance with the framework and the Outcomes Report compares achieved financial results with budget forecasts.
The UPF presentation is primarily structured on a sectoral basis with a focus on the General Government and Public Non-financial Corporations sectors.
The Consolidated Financial Statements
The Consolidated Financial Statements outline the operations of the Queensland Government on an accrual basis in accordance with Australian Accounting Standard AAS31 Financial Reporting by Governments and other applicable standards. Accordingly, the statements present the operating result, financial position and cash flows of the Queensland Total State sector on a consolidated basis (which includes aggregated results for General Government, Public Non-financial Corporations and Public Financial Corporations sectors).
Financial statements for the General Government, Public Non-financial Corporations and Public Financial Corporations sectors are disclosed in the disaggregated information note to the financial statements (Note 2).
Refer Note 39 for a full list of consolidated entities.
Related Publications
This report comprises one of a number of key publications relating to the financial performance of the Queensland Public Sector including:
| | • | the annual Budget papers |
| | • | the Treasurer’s Appropriation Statement |
| | • | the annual reports of the various departments, statutory bodies, Government-owned corporations and other entities that comprise the Queensland Government. |
| | |
Report on State Finances 2003-04 – Government of Queensland | | 3 |
2003-04 Outcomes Report
Uniform Presentation Framework of the Queensland Government
year ended 30 June 2004
Overview and Analysis
Overview
| | • | A GFS operating surplus of $3,340 million for 2003-04 was recorded in the General Government sector, an improvement of $966 million over that estimated at the time of the 2004-05 Budget, due largely to higher than anticipated investment returns and taxation revenues. Expenses for the year were $258 million lower than estimated at the time of the 2004-05 Budget. |
| | • | The underlying operating result for 2003-04 in the General Government sector (adjusted for superannuation arrangements comparable with other jurisdictions) is a surplus of $2,095 million, an increase of $658 million over the estimated actual. |
| | • | A GFS cash surplus of $3,490 million was recorded for 2003-04 in the General Government sector. This is $1,241 million higher than the estimated actual of $2,249 million. |
| | • | The State’s net worth increased to $77,723 million as at 30 June 2004, an improvement of $8,357 million over the estimated actual forecast of $69,366 million. |
| | • | The Government has met all of its fiscal commitments under the Charter of Social and Fiscal Responsibility. Refer page 4-02. |
Summary of Key GFS Financial Aggregates
Outlined in the table below are the GFS aggregates, by sector. The results show outcomes for Queensland much stronger than expected at the time of publishing the 2004-05 Budget:
| | | | | | | | | | | | | | | | | | |
| | | General Government Sector
| | | Public Non-financial
Corporations Sector
| | | Non-financial Public Sector
| |
| | | Est. Actual $ million
| | | Actual $ million
| | | Est. Actual
$ million
| | | Actual $ million
| | | Est. Actual $ million
| | | Actual
$ million
| |
Revenue | | 24,506 | | | 25,214 | | | 7,741 | | | 8,130 | | | 29,660 | | | 30,681 | |
Expenses | | 22,132 | | | 21,874 | | | 7,826 | | | 8,197 | | | 27,370 | | | 27,407 | |
Net Operating Balance | | 2,374 | | | 3,340 | | | (85 | ) | | (67 | ) | | 2,290 | | | 3,274 | |
Net Lending/(Borrowing) | | 1,716 | | | 2,838 | | | (453 | ) | | (249 | ) | | 1,265 | | | 2,589 | |
Cash Surplus/(Deficit) | | 2,249 | | | 3,490 | | | (147 | ) | | 133 | | | 2,103 | | | 3,622 | |
Gross Fixed Capital Formation | | 2,123 | | | 1,976 | | | 1,564 | | | 1,413 | | | 3,685 | | | 3,389 | |
Net Worth | | 69,366 | | | 77,723 | | | 12,325 | | | 13,733 | | | 69,366 | | | 77,723 | |
Net Debt | | (14,040 | ) | | (14,851 | ) | | 11,511 | | | 10,128 | | | (2,527 | ) | | (4,723 | ) |
| | |
Outcomes Report 2003-04 – Government of Queensland | | 4-01 |
Overview and Analysis
Meeting the Government’s Fiscal Commitments
The Government has met all of its fiscal commitments under the Charter of Social and Fiscal Responsibility:
Achievement of Fiscal Principles of the Queensland Government
| | | | |
Principle
| | Achievement
| | Indicator
|
Competitive tax environment The Government will ensure that State taxes and charges remain competitive with the other states and territories. | | ü | | Taxation revenue per capita: Qld: $1,700/capita Other States: $2,047/capita |
| | |
Affordable service provision The Government will ensure that its level of service provision is sustainable by maintaining an overall General Government operating surplus, as measured in Government Finance Statistics terms. | | ü | | GFS surplus of $3,340 million |
| | |
Capital Funding Borrowings or other financial arrangements will only be undertaken for capital investments and only where these can be serviced within the operating surplus, consistent with maintaining a AAA credit rating. | | ü | | GG repayment of borrowings $343 million while GG total purchases of non-financial assets $2,415 million. AAA credit rating confirmed by Fitch, Moody’s and Standard & Poor’s (highest rating available). |
| | |
Managing financial risk The Government will ensure that the State’s financial assets cover all accruing and expected future liabilities of the General Government sector. | | ü | | GG net financial worth: $15,742 million. |
| | |
Building the State’s net worth The Government will at least maintain and seek to increase Total State net worth. | | ü | | Net worth increased by $12,829 million to $77,723 million. |
Net Operating Balance
The GFS operating result for 2003-04 in the General Government sector is a surplus of $3,340 million, an improvement of $966 million over that estimated at the time of the 2004-05 Budget. This improvement was the result of stronger than expected revenue growth and lower expenses.
Investment returns on assets held to meet future employee entitlements were 3.06% higher than expected at the time of the 2004-05 Budget (18%), contributing to an overall increase in interest income of $391 million.
Investment market volatility impacts on the Queensland Budget more in GFS terms than it does for other states. This is in part due to differences in the way Queensland’s public sector superannuation arrangements are structured. If Queensland’s superannuation arrangements were structured on the same basis as generally applies in other states, the General Government sector underlying operating result for 2003-04 would be a surplus of $2,095 million, as outlined below:
| | |
Calculation of Underlying Result
| | 2003-04
Actual
$ million
|
GFS net operating balance | | 3,340 |
Less investment earnings on defined benefit superannuation assets | | 1,995 |
Plus nominal superannuation expense | | 750 |
Underlying Balance | | 2,095 |
| | |
Outcomes Report 2003-04 – Government of Queensland | | 4-02 |
Overview and Analysis
| | | | |
Revenue
| | Est. Actual
$ million
| | Actual
$ million
|
Taxation revenue | | 6,474 | | 6,676 |
Current grants and subsidies | | 11,036 | | 10,992 |
Capital grants | | 563 | | 553 |
Sales of goods and services | | 1,984 | | 2,105 |
Interest income | | 2,332 | | 2,723 |
Other | | 2,117 | | 2,165 |
Total Revenue | | 24,506 | | 25,214 |
Revenue increased by $708 million (2.9%) over the 2003-04 estimated actual:
| | • | Taxation revenue increased by $202 million, reflecting higher payroll tax and transfer duty collections. |
| | • | Strong end of year performance of investment markets resulted in a $391 million increase in interest income relative to estimates. |
| | | | |
Expenses
| | Est. Actual
$ million
| | Actual
$ million
|
Gross operating expenses | | | | |
Employee expenses | | 10,025 | | 10,004 |
Other operating expenses | | 4,177 | | 4,245 |
Depreciation | | 1,483 | | 1,460 |
Superannuation interest expense | | 745 | | 750 |
Other interest expense | | 224 | | 211 |
Current transfers | | 4,643 | | 4,500 |
Capital transfers | | 835 | | 704 |
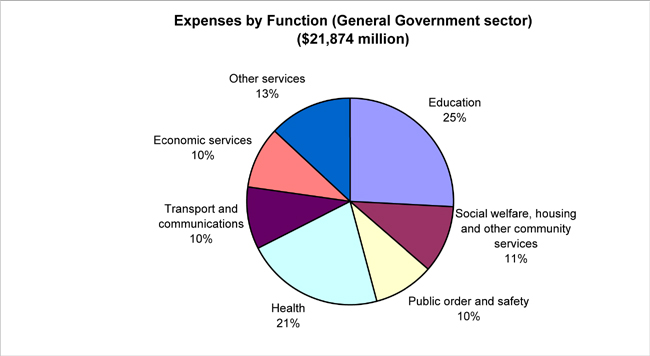
Total Expenses | | 22,132 | | 21,874 |
Total expenses are broadly in line with that forecast at the time of the 2004-05 Budget:
| | • | Current and capital transfers include grants and subsidies to the community, community service obligation payments to the Government-owned corporations and capital grants to local governments and non-government entities. Expenditure is driven largely by demand and the meeting of conditions for these programs. |
The 2003-04 estimated actual also included the extinguishment of a loan made to Australian Magnesium Corporation Limited which will now be recognised in 2004-05.
| | |
Outcomes Report 2003-04 – Government of Queensland | | 4-03 |
Overview and Analysis
General Government expenditure is focussed on the delivery of core services to the community. As indicated in the chart, education accounts for the largest share of expenses (25%), followed by health (21%) and social welfare, housing and other community services (11%).
Cash Surplus
A cash surplus of $3,490 million was recorded for the 2003-04 financial year in the General Government sector, an increase of $1,241 million over the 2003-04 estimated actual. Net cash flows from operating activities were $1,102 million higher than estimated, again reflecting improvements across a range of revenue items. Lower than estimated purchases of non-financial assets reflect the end of year carryover of some capital allocations from 2003-04 to 2004-05.
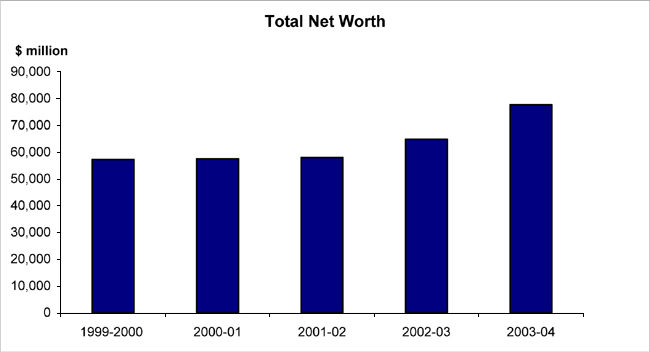
Net Worth
The State’s net worth increased to $77,723 million as at 30 June 2004. This is $8,357 million higher than the forecast of $69,366 million, and is $12,829 million higher than the net worth as at 30 June 2003. This increase reflects the large 2003-04 operating surplus, upward revaluations across a range of State assets and the flow through of improved investment returns leading to a reduction in the State’s defined benefit superannuation liability.
In 2003-04, investments in financial assets increased by $2,529 million, primarily due to the reinvestment of earnings on the State’s assets set aside to meet future employee entitlements and additional employer contributions during the year.
| | |
Outcomes Report 2003-04 – Government of Queensland | | 4-04 |
Overview and Analysis
Higher valuations of Crown land administered by the Department of Natural Resources ($1,594 million), land and dwellings controlled by the Department of Housing ($2,468 million) and roads and bridges infrastructure controlled by the Department of Main Roads ($1,313 million) contributed to the improved net worth recorded by the State.
The chart below illustrates the State’s strong net worth compared with the other states.
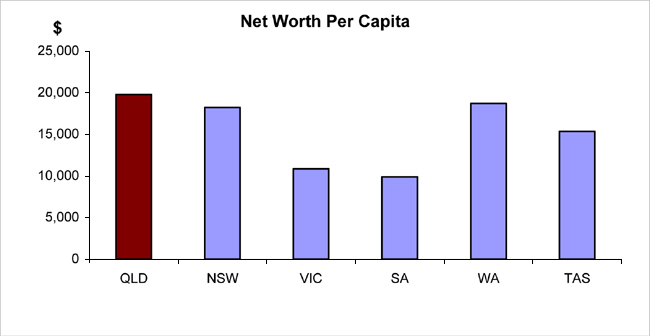
| 1. | Western Australia values land under roads as part of its overall asset base. This has been adjusted to allow comparison with other jurisdictions which do not value land under roads. |
Source: WA Outcome Results; New South Wales, Victoria, South Australia and Tasmania 2004-05 Budget Papers. Population data from Australian Government Budget Paper 3.
| | |
Outcomes Report 2003-04 – Government of Queensland | | 4-05 |
Overview and Analysis
Net Debt
Net debt is the most common measure used to judge the overall strength of a jurisdiction’s fiscal position. High levels of net debt impose a call on future revenue flows to service that debt and meeting these payments can limit government flexibility to adjust outlays.
In 2003-04 there has been a further strengthening of the General Government sector’s already strong net debt position, from an estimated negative $14,040 million to a negative $14,851 million.
Queensland’s negative net debt of $3,806 per capita (net financial assets) compares to the average net debt of $210 per capita (net financial liabilities) in the other states.
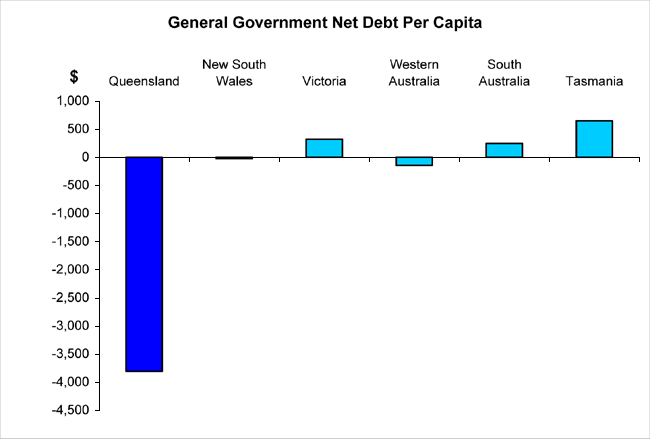
Source: WA Outcome Results; New South Wales, Victoria, South Australia and Tasmania 2004-05 Budget Papers. Population data from Australian Government Budget Paper 3.
| | |
Outcomes Report 2003-04 – Government of Queensland | | 4-06 |
Overview and Analysis
Public Non-financial Corporations (PNFC) Sector
The PNFC sector comprises bodies such as Government-owned corporations that provide goods and services that are market, non-regulatory and non-financial in nature. PNFCs are financed through sales to consumers of their goods and services and may be supplemented by explicit government payments to fund community service obligations.
| | • | The net operating result improved from an estimated deficit of $85 million to a deficit of $67 million. The deficit for the sector primarily reflects the results recorded by Enertrade and Queensland Motorways Limited, which operate in deficit in the normal course of operations. |
| | • | A cash surplus of $133 million was recorded, an improvement of $280 million on the estimated deficit. |
| | • | The net worth of the PNFC sector increased from an estimated $12,325 million to $13,733 million, reflecting market value adjustments on borrowings, and additional capital injections of $460 million to electricity entities in support of capital investment plans. |
State Financial Sector (Total State)
The Total State includes all State Government departments and statutory authorities, public non-financial corporations, public financial corporations and their controlled entities. All material inter-entity and intra-entity transactions and balances have been eliminated to the extent practicable.
| | • | A net operating surplus of $3,518 million was recorded in 2003-04, reflecting the strong performance of the General Government sector. |
| | • | A Total State cash surplus of $3,121 million was achieved in 2003-04 after allowing for purchases of non-financial assets of $4,258 million. |
| | • | In 2003-04 there has been a further strengthening of the Total State’s net debt position to negative $7,364 million. |
| | |
Outcomes Report 2003-04 – Government of Queensland | | 4-07 |
Operating Statement by Sector
Operating Statement 2003-04 ($million) - by sector (b)
| | | | | | | | | | | | | | | | | | | | | | | | | | |
| | | | | General Government
Sector
| | | Public Non-financial
Corporations Sector
| | | Non-financial Public
Sector
| | | Public Financial
Corporations
Sector Actual (a)
| | | State
Financial
Sector Actual
(a)
| |
| | | | | Est. Actual
| | | Actual
| | | Est. Actual
| | | Actual
| | | Est. Actual
| | | Actual
| | | |
| | | GFS Revenue | | | | | | | | | | | | | | | | | | | | | | | | |
| | | Taxation revenue | | 6,474 | | | 6,676 | | | — | | | — | | | 6,108 | | | 6,358 | | | — | | | 6,354 | |
| | | Current grants and subsidies | | 11,036 | | | 10,992 | | | 915 | | | 1,000 | | | 10,883 | | | 10,817 | | | — | | | 10,817 | |
| | | Capital grants | | 563 | | | 553 | | | 49 | | | 55 | | | 610 | | | 592 | | | — | | | 591 | |
| | | Sales of goods and services | | 1,984 | | | 2,105 | | | 6,362 | | | 6,625 | | | 8,171 | | | 8,622 | | | 816 | | | 9,262 | |
| | | Interest income | | 2,332 | | | 2,723 | | | 91 | | | 101 | | | 2,410 | | | 2,821 | | | 1,685 | | | 3,452 | |
| | | Other | | 2,117 | | | 2,165 | | | 324 | | | 350 | | | 1,478 | | | 1,470 | | | — | | | 1,366 | |
| | | Total Revenue | | 24,506 | | | 25,214 | | | 7,741 | | | 8,130 | | | 29,660 | | | 30,681 | | | 2,501 | | | 31,841 | |
| | | | | | | | | |
| less | | GFS Expenses | | | | | | | | | | | | | | | | | | | | | | | | |
| | | Gross operating expenses | | | | | | | | | | | | | | | | | | | | | | | | |
| | | Employee expenses | | 10,025 | | | 10,004 | | | 1,555 | | | 1,517 | | | 11,529 | | | 11,520 | | | 108 | | | 11,520 | |
| | | Other operating expenses | | 4,177 | | | 4,245 | | | 3,125 | | | 3,457 | | | 6,819 | | | 7,591 | | | 676 | | | 8,193 | |
| | | Depreciation | | 1,483 | | | 1,460 | | | 1,209 | | | 1,216 | | | 2,691 | | | 2,676 | | | 18 | | | 2,695 | |
| | | Superannuation interest expense | | 745 | | | 750 | | | — | | | — | | | 745 | | | 750 | | | — | | | 750 | |
| | | Other interest expense | | 224 | | | 211 | | | 768 | | | 742 | | | 979 | | | 952 | | | 1,344 | | | 1,246 | |
| | | Other property expenses | | — | | | — | | | 982 | | | 1,052 | | | — | | | — | | | 103 | | | — | |
| | | Current transfers | | 4,643 | | | 4,500 | | | 162 | | | 198 | | | 3,751 | | | 3,216 | | | 5 | | | 3,217 | |
| | | Capital transfers | | 835 | | | 704 | | | 25 | | | 16 | | | 856 | | | 703 | | | 2 | | | 703 | |
| | | Total Expenses | | 22,132 | | | 21,874 | | | 7,826 | | | 8,197 | | | 27,370 | | | 27,407 | | | 2,257 | | | 28,323 | |
| | | | | | | | | |
| equals | | GFS net operating balance | | 2,374 | | | 3,340 | | | (85 | ) | | (67 | ) | | 2,290 | | | 3,274 | | | 244 | | | 3,518 | |
| | | | | | | | | |
| less | | Net acquisition of non-financial assets | | | | | | | | | | | | | | | | | | | | | | | | |
| | | Purchases of non-financial assets | | 2,578 | | | 2,415 | | | 1,958 | | | 1,804 | | | 4,536 | | | 4,219 | | | 38 | | | 4,258 | |
| | | Sales of non-financial assets | | (380 | ) | | (356 | ) | | (394 | ) | | (384 | ) | | (775 | ) | | (740 | ) | | (1 | ) | | (742 | ) |
| | | less Depreciation | | 1,483 | | | 1,460 | | | 1,209 | | | 1,216 | | | 2,691 | | | 2,676 | | | 18 | | | 2,695 | |
| | | plus Change in inventories | | 18 | | | (13 | ) | | 13 | | | (15 | ) | | 31 | | | (28 | ) | | — | | | (28 | ) |
| | | plus Other movements in non-financial assets | | (75 | ) | | (83 | ) | | — | | | (7 | ) | | (76 | ) | | (90 | ) | | — | | | (90 | ) |
| | | equals Total net acquisition of non-financial assets | | 658 | | | 503 | | | 368 | | | 182 | | | 1,025 | | | 685 | | | 18 | | | 703 | |
| | | | | | | | | |
| equals | | GFS Net lending/(borrowing) (Fiscal balance) | | 1,716 | | | 2,838 | | | (453 | ) | | (249 | ) | | 1,265 | | | 2,589 | | | 226 | | | 2,814 | |
| (a) | In accordance with UPF requirements, estimates for Public Financial Corporations and State Financial sectors are not included in Budget documentation. |
| (b) | Numbers may not add due to rounding. |
| | |
Outcomes Report 2003-04 - Government of Queensland | | 4-08 |
Balance Sheet by Sector
Balance Sheet 2003-04 ($million) - by sector (b)
| | | | | | | | | | | | | | | | | | | | | | | | |
| | | General Government
Sector
| | | Public Non-financial
Corporations Sector
| | | Non-financial Public
Sector
| | | Public Financial
Corporations
Sector Actual (a)
| | | State Financial
Sector Actual (a)
| |
| | | Est. Actual
| | | Actual
| | | Est. Actual
| | | Actual
| | | Est. Actual
| | | Actual
| | | |
Assets | | | | | | | | | | | | | | | | | | | | | | | | |
Financial assets | | | | | | | | | | | | | | | | | | | | | | | | |
Cash and deposits | | 1,577 | | | 1,729 | | | 878 | | | 1,025 | | | 2,455 | | | 2,754 | | | 26 | | | 235 | |
Advances paid | | 181 | | | 173 | | | — | | | — | | | 165 | | | 157 | | | — | | | 157 | |
Investments, loans and placements | | 15,725 | | | 16,157 | | | 908 | | | 997 | | | 16,576 | | | 17,145 | | | 29,041 | | | 31,559 | |
Other non-equity assets | | 3,993 | | | 4,318 | | | 1,605 | | | 1,909 | | | 2,246 | | | 2,695 | | | 106 | | | 2,727 | |
Equity | | 13,005 | | | 14,633 | | | 58 | | | 60 | | | 771 | | | 993 | | | 2 | | | 96 | |
| | | | | | | | |
Total financial assets | | 34,481 | | | 37,010 | | | 3,449 | | | 3,992 | | | 22,213 | | | 23,745 | | | 29,175 | | | 34,773 | |
| | | | | | | | |
Non-financial assets | | 56,103 | | | 61,981 | | | 27,075 | | | 27,160 | | | 83,144 | | | 89,107 | | | 93 | | | 89,201 | |
| | | | | | | | |
Total assets | | 90,584 | | | 98,991 | | | 30,524 | | | 31,152 | | | 105,357 | | | 112,852 | | | 29,268 | | | 123,974 | |
| | | | | | | | |
Liabilities | | | | | | | | | | | | | | | | | | | | | | | | |
Deposits held | | — | | | — | | | 77 | | | 84 | | | 87 | | | 85 | | | 4,724 | | | 2,233 | |
Borrowing | | 3,443 | | | 3,208 | | | 13,220 | | | 12,066 | | | 16,582 | | | 15,248 | | | 21,702 | | | 22,353 | |
Superannuation liability | | 12,127 | | | 11,930 | | | — | | | — | | | 12,127 | | | 11,930 | | | — | | | 11,930 | |
Other employee entitlements and provisions | | 3,485 | | | 3,590 | | | 3,760 | | | 3,954 | | | 4,147 | | | 4,180 | | | 1,757 | | | 5,874 | |
Other non-equity liabilities | | 2,163 | | | 2,540 | | | 1,142 | | | 1,314 | | | 3,048 | | | 3,686 | | | 187 | | | 3,860 | |
| | | | | | | | |
Total liabilities | | 21,218 | | | 21,268 | | | 18,199 | | | 17,419 | | | 35,991 | | | 35,129 | | | 28,369 | | | 46,251 | |
| | | | | | | | |
Net Worth | | 69,366 | | | 77,723 | | | 12,325 | | | 13,733 | | | 69,366 | | | 77,723 | | | 899 | | | 77,723 | |
| | | | | | | | |
Net financial worth | | 13,263 | | | 15,742 | | | (14,750 | ) | | (13,427 | ) | | (13,778 | ) | | (11,384 | ) | | 806 | | | (11,478 | ) |
Net debt | | (14,040 | ) | | (14,851 | ) | | 11,511 | | | 10,128 | | | (2,527 | ) | | (4,723 | ) | | (2,641 | ) | | (7,364 | ) |
| (a) | In accordance with UPF requirements, estimates for Public Financial Corporations and State Financial sectors are not included in Budget documentation. |
| (b) | Numbers may not add due to rounding. |
| | |
Outcomes Report 2003-04 - Government of Queensland | | 4-09 |
Cash Flow Statement by Sector
Cash Flow Statement 2003-04 ($million) - by sector (b)
| | | | | | | | | | | | | | | | | | | | | | | | |
| | | General Government
Sector
| | | Public Non-financial
Corporations Sector
| | | Non-financial Public
Sector
| | | Public Financial
Corporations
Sector Actual (a)
| | | State Financial
Sector Actual (a)
| |
| | | Est. Actual
| | | Actual
| | | Est. Actual
| | | Actual
| | | Est. Actual
| | | Actual
| | | |
Receipts from operating activities | | | | | | | | | | | | | | | | | | | | | | | | |
Taxes received | | 6,473 | | | 6,635 | | | — | | | — | | | 6,107 | | | 6,318 | | | — | | | 6,313 | |
Grants and subsidies received | | 11,642 | | | 11,535 | | | 938 | | | 1,031 | | | 11,510 | | | 11,428 | | | — | | | 11,426 | |
Sales of goods and services | | 2,279 | | | 2,448 | | | 7,049 | | | 7,192 | | | 9,148 | | | 9,519 | | | 896 | | | 10,227 | |
Other receipts | | 4,711 | | | 5,104 | | | 810 | | | 747 | | | 4,751 | | | 5,074 | | | 1,076 | | | 5,025 | |
Total | | 25,105 | | | 25,721 | | | 8,797 | | | 8,970 | | | 31,516 | | | 32,339 | | | 1,972 | | | 32,991 | |
Payments for operating activities | | | | | | | | | | | | | | | | | | | | | | | | |
Payments for goods and services | | (14,514 | ) | | (14,305 | ) | | (4,730 | ) | | (4,696 | ) | | (19,011 | ) | | (18,885 | ) | | (225 | ) | | (18,936 | ) |
Grants and subsidies | | (5,250 | ) | | (4,954 | ) | | (151 | ) | | (129 | ) | | (4,329 | ) | | (3,985 | ) | | — | | | (3,984 | ) |
Interest | | (224 | ) | | (209 | ) | | (755 | ) | | (801 | ) | | (908 | ) | | (941 | ) | | (1,495 | ) | | (1,400 | ) |
Other payments | | (670 | ) | | (704 | ) | | (973 | ) | | (1,017 | ) | | (1,404 | ) | | (1,425 | ) | | (628 | ) | | (2,034 | ) |
Total | | (20,658 | ) | | (20,172 | ) | | (6,609 | ) | | (6,642 | ) | | (25,652 | ) | | (25,237 | ) | | (2,347 | ) | | (26,354 | ) |
| | | | | | | | |
Net cash inflows from operating activities | | 4,447 | | | 5,549 | | | 2,188 | | | 2,328 | | | 5,864 | | | 7,102 | | | (375 | ) | | 6,637 | |
| | | | | | | | |
Payments for investments in non-financial assets | | | | | | | | | | | | | | | | | | | | | | | | |
Purchases of non-financial assets | | (2,578 | ) | | (2,415 | ) | | (1,958 | ) | | (1,804 | ) | | (4,536 | ) | | (4,219 | ) | | (38 | ) | | (4,258 | ) |
Sales of non-financial assets | | 380 | | | 356 | | | 394 | | | 384 | | | 775 | | | 740 | | | 1 | | | 742 | |
Total | | (2,198 | ) | | (2,059 | ) | | (1,564 | ) | | (1,420 | ) | | (3,761 | ) | | (3,479 | ) | | (37 | ) | | (3,516 | ) |
| | | | | | | | |
Payments for investments in financial assets for policy purposes | | (135 | ) | | (632 | ) | | (1 | ) | | (6 | ) | | (1 | ) | | (30 | ) | | (2 | ) | | (31 | ) |
| | | | | | | | |
Payments for investments in financial assets for liquidity purposes | | (1,862 | ) | | (2,398 | ) | | (11 | ) | | (52 | ) | | (1,873 | ) | | (2,451 | ) | | (2,059 | ) | | (3,929 | ) |
| | | | | | | | |
Receipts from financing activities | | | | | | | | | | | | | | | | | | | | | | | | |
Borrowing (net) | | (288 | ) | | (343 | ) | | (181 | ) | | (823 | ) | | (468 | ) | | (1,108 | ) | | 1,697 | | | 27 | |
Deposits received (net) | | — | | | — | | | 5 | | | 2 | | | 5 | | | 3 | | | 524 | | | 390 | |
Distributions paid | | — | | | — | | | (771 | ) | | (774 | ) | | — | | | — | | | (69 | ) | | — | |
Other financing (net) | | — | | | — | | | 135 | | | 692 | | | — | | | 26 | | | 330 | | | 357 | |
Total | | (288 | ) | | (343 | ) | | (812 | ) | | (902 | ) | | (463 | ) | | (1,079 | ) | | 2,483 | | | 773 | |
| | | | | | | | |
Net increase/(decrease) in cash held | | (36 | ) | | 116 | | | (200 | ) | | (53 | ) | | (234 | ) | | 63 | | | 10 | | | (66 | ) |
| | | | | | | | |
Net cash from operating activities and investments in non-financial assets | | 2,249 | | | 3,490 | | | 624 | | | 907 | | | 2,103 | | | 3,622 | | | (412 | ) | | 3,121 | |
less Distributions paid | | — | | | — | | | (771 | ) | | (774 | ) | | — | | | — | | | (69 | ) | | — | |
GFS Surplus/(deficit) | | 2,249 | | | 3,490 | | | (147 | ) | | 133 | | | 2,103 | | | 3,622 | | | (481 | ) | | 3,121 | |
| (a) | In accordance with UPF requirements, estimates for Public Financial Corporations and State Financial sectors are not included in Budget documentation. |
| (b) | Numbers may not add due to rounding. |
| | |
Outcomes Report 2003-04 - Government of Queensland | | 4-10 |
General Government Sector Expenses by Function
| | |
| | | Actual
2003-2004
$ million
|
General Public Services | | 1,352 |
Other general public services | | 1,352 |
| |
Public Order and Safety | | 2,083 |
Police and fire protection services | | 1,197 |
Law courts and legal services | | 439 |
Prisons and corrective services | | 371 |
Other public order and safety | | 75 |
| |
Education | | 5,622 |
Primary and secondary education | | 4,359 |
Tertiary education | | 578 |
Pre-school education and education not | | |
definable by level | | 532 |
Transportation of students | | 127 |
Education n.e.c. | | 26 |
| |
Health | | 4,733 |
Acute care institutions | | 2,983 |
Mental health institutions | | 155 |
Nursing homes for the aged | | 132 |
Community health services | | 1,164 |
Public health services | | 155 |
Pharmaceuticals, medical aids and appliances | | 3 |
Health research | | 67 |
Health administration n.e.c. | | 74 |
| |
Social Security | | 882 |
Welfare services | | 873 |
Social security and welfare n.e.c. | | 9 |
| |
Housing and Community Amenities | | 870 |
Housing and community development | | 747 |
Water supply | | 8 |
Sanitation and protection of the | | |
environment | | 77 |
Other community amenities | | 39 |
| |
Recreation and Culture | | 566 |
Recreation facilities and services | | 384 |
Cultural facilities and services | | 182 |
| |
Fuel and Energy | | 749 |
Fuel affairs and services | | 499 |
Electricity and other energy | | 251 |
| |
Agriculture, Forestry, Fishing and Hunting | | 645 |
Agriculture | | 593 |
Forestry, fishing and hunting | | 52 |
| |
Mining, manufacturing and construction | | 92 |
Mining and mineral resources other | | |
than fuels | | 55 |
Construction | | 37 |
| |
Transport and Communications | | 2,113 |
Road transport | | 1,053 |
Water transport | | 71 |
Rail transport | | 677 |
Air transport | | 1 |
Other transport | | 282 |
Communications | | 30 |
| |
Other Economic Affairs | | 673 |
Tourism and area promotion | | 97 |
Labour and employment affairs | | 296 |
Other economic affairs | | 281 |
| |
Other Purposes | | 1,493 |
Nominal superannuation interest | | 750 |
Public debt transactions | | 166 |
General purpose inter-government | | |
transactions | | 509 |
Natural disaster relief | | 35 |
Other purposes n.e.c. | | 33 |
| | |
|
Total | | 21,874 |
| | |
|
| | |
Outcomes Report 2003-04 - Government of Queensland | | 4-11 |
General Government Purchase of Non-financial Assets by
Function & Loan Council Allocation
General Government Sector
Purchases of Non-financial Assets by Function
| | |
| | | 2003-04 Actual $ million
|
General public services | | 272 |
Public order and safety | | 234 |
Education | | 309 |
Health | | 256 |
Social security and welfare | | 15 |
Housing and community amenities | | 243 |
Recreation and culture | | 88 |
Agriculture, forestry, fishing and hunting | | 30 |
Mining, manufacturing and construction | | 4 |
Transport and communications | | 679 |
Other economic affairs | | 281 |
Other purposes | | 4 |
| |
Total | | 2,415 |
Loan Council Allocation
The Australian Loan Council requires all jurisdictions to advise the Loan Council Allocations (LCA) outcome for the
last financial year as part of the annual Outcomes Report. The LCA represents each government’s call on financial
markets for a given financial year. The LCA Outcome exceeds the upper bound of the LCA Budget estimate by
more than the two percent tolerance limit. A tolerance limit of two percent of non-financial public sector receipts
applies between the LCA Budget update and the outcome.
The LCA Outcome surplus is due largely to improvements in investment returns and higher revenue from taxation.
| | | | | | |
| | | 2003-04
Budget Estimate
$ million
| | | 2003-04
Outcome
$ million
| |
General Government sector cash deficit/(surplus)1 | | (152 | ) | | (3,490 | ) |
PNFC sector cash deficit/(surplus)1 | | 966 | | | (133 | ) |
Non-financial Public sector cash deficit/(surplus)1 | | 815 | | | (3,622 | ) |
| | |
Net cash flows from investments in financial assets for policy purposes | | — | | | 30 | |
Memorandum Items2 | | (157 | ) | | 138 | |
| | |
LOAN COUNCIL ALLOCATION | | 658 | | | (3,455 | ) |
Notes:
| 1. | Figures in brackets represent surpluses |
| 2. | Other memorandum items include operating leases and local government borrowings. |
| | |
Outcomes Report 2003-04 - Government of Queensland | | 4-12 |
Certification of Outcomes Report
Certification by the Under Treasurer and Assistant Under Treasurer
The foregoing Outcomes Report contains financial statements prepared and presented on a Government Finance Statistics (GFS) basis and is in accordance with the Uniform Presentation Framework (UPF) agreed to at the 1991 Premiers’ Conference. In addition, Queensland’s Loan Council Allocation and disclosure of General Government expenses by purpose are included.
The financial statements separately disclose outcomes for the General Government, Public Non-financial Corporations, Public Financial Corporations and State Financial sectors within Queensland. Entities excluded from this report include local governments. Queensland public sector entities consolidated for this report are listed in the Consolidated Financial Statements, taking into account intra and inter-agency eliminations.
Only those agencies considered material by virtue of their financial transactions and balances are consolidated in the report.
In our opinion, we certify that the Outcomes Report has been properly drawn up, in accordance with GFS principles and UPF requirements, to present a true and fair view of:
(i) the financial performance and cash flows of the Queensland State Government for the financial year; and
(ii) the financial position of the Government at 30 June 2004.
At date of certification of the report, we are not aware of any material circumstances that would render any particulars included in the Outcomes Report misleading or inaccurate.
| | | | |
| | |

| | | | 
|
Walter Ivessa Assistant Under Treasurer | | | | Gerard Bradley Under Treasurer |
Date 12 October 2004
| | |
Outcomes Report 2003-04 – Government of Queensland | | 4-13 |
2003-04 Consolidated Financial Statements
of the Queensland Government
year ended 30 June 2004
Consolidated Financial Statements - Overview and Analysis
The following analysis compares current year Total State performance, on an accounting basis, with last year’s audited results.
Overview
| | • | An operating surplus for the State of $4,654 million for 2003-04 was recorded, an improvement of $5,944 million from 2002-03, reflecting revenue growth arising from the continued strength in the domestic economy and the recovery in global financial markets. |
| | • | The State’s net assets position increased to $77,723 million at 30 June 2004, an improvement of $12,829 million over 2002-03. This increase reflects the large 2003-04 operating surplus, upward revaluations across a range of State assets and the flow through of improved investment returns leading to a reduction in the State’s defined benefit superannuation liability. |
Summary of Key Financial Aggregates of the Consolidated Financial Statements
The table below provides aggregate information for 2003-04 under Australian Accounting Standards principles:
| | | | | |
Total State
| | 2004 $ million
| | 2003 $ million
| |
Revenue | | | | | |
Commonwealth and other grants | | 11,426 | | 10,574 | |
Sales of goods and services | | 8,643 | | 8,300 | |
Taxes, fees and fines | | 7,119 | | 5,936 | |
Investment income | | 3,298 | | 715 | |
Royalties and other territorial income | | 723 | | 769 | |
Other | | 1,403 | | 862 | |
| | |
| |
|
|
| | | 32,612 | | 27,156 | |
| | |
| |
|
|
Expenses | | | | | |
Employee expenses | | 11,709 | | 12,050 | |
Supplies and services | | 6,508 | | 6,290 | |
Depreciation and amortisation | | 2,714 | | 2,646 | |
Grants and other contributions | | 4,083 | | 3,800 | |
Borrowing costs expense | | 1,245 | | 1,392 | |
Share of deficit of associates using equity method | | 5 | | 18 | |
Other | | 1,694 | | 2,250 | |
| | |
| |
|
|
| | | 27,958 | | 28,446 | |
| | |
| |
|
|
Net Surplus/(Deficit) | | 4,654 | | (1,290 | ) |
| | |
| |
|
|
Assets | | 124,004 | | 110,466 | |
Liabilities | | 46,281 | | 45,572 | |
| | |
| |
|
|
Net Assets | | 77,723 | | 64,894 | |
| | |
| |
|
|
| | |
State Finances Report 2003-04 – Government of Queensland | | 5-01 |
Consolidated Financial Statements - Overview and Analysis
Operating Result
The whole-of-Government operating result after tax for the year 2003-04 was a surplus of $4,654 million (2002-03, $1,290 million deficit).
The surplus for 2003-04 reflects revenue growth across a range of categories. Significant market value adjustments relating to superannuation and interest/market value shifts were also experienced during 2003-04:
| | • | this year, investment returns on assets set aside to meet future defined benefit superannuation liabilities achieved a positive rate of return of 21.06%, compared to last year’s negative return of 1.86%. As the actuarially applied long-term earnings rate for superannuation liability is 7.5%, a reduced superannuation expense was recorded by the State in 2003-04. |
| | • | net unrealised gains on financial instruments were recorded in 2003-04 reflecting the impact of higher interest rates on the market value of the State’s debt portfolio. |
| | • | taxation revenue increased as the economy and the property market continued to perform strongly. |
| | • | Commonwealth grants increased as GST collections rose. |
Revenue
Total revenue from ordinary activities for 2003-04 was $32,612 million, an increase of $5,530 million (20.4%) from 2002-03 ($27,156 million).
Changes in revenues by type are illustrated in the following chart:
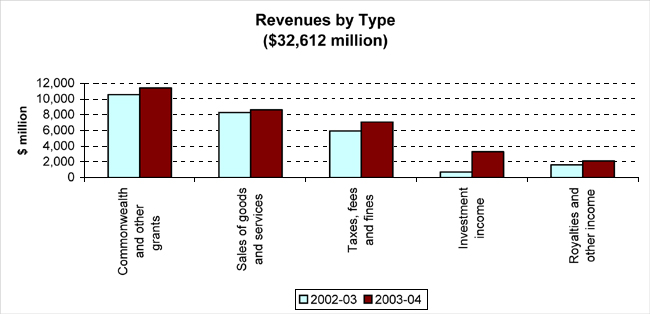
Commonwealth and other grants comprised 35.4% of total State revenue in 2003-04 and grew from $10,574 million in 2002-03 to $11,426 million in 2003-04 (an increase of $852 million). This primarily reflects growth in the GST pool commensurate with the strength of consumption expenditure in the economy, and the application of parameter adjustments.
Taxation revenue increased by $1,183 million during the year from $5,936 million in 2002-03 to $7,119 million with duty on property transfer transactions making the most significant contribution as the property market continued to perform strongly. In addition, increases in revenue from payroll tax and motor vehicle registrations were experienced during 2003-04.
Investment income increased by $2,583 million to $3,298 million in 2003-04, reflecting the improved performance of domestic and international equity markets.
| | |
State Finances Report 2003-04 – Government of Queensland | | 5-02 |
Consolidated Financial Statements - Overview and Analysis
Expenses
The State’s expenses for 2003-04 totalled $27,958 million, a decrease of $488 million (2%) from 2002-03 ($28,446 million).
Changes in expenses by type are illustrated in the following chart:
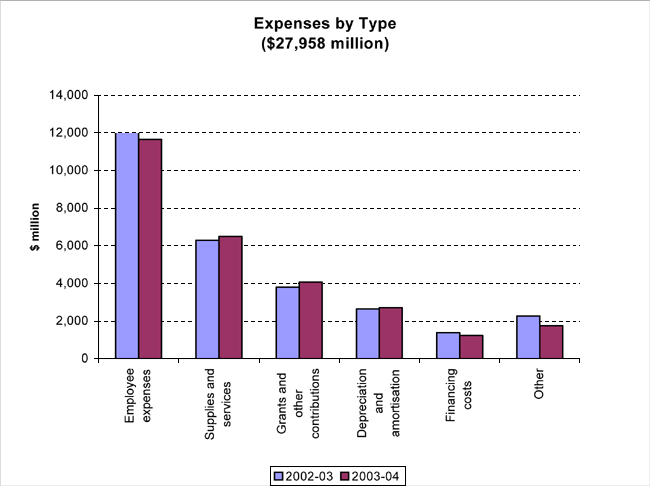
Employee expenses for 2003-04 decreased $341 million to $11,709 million compared to $12,050 million in 2002-03. This overall decrease represents the impact of the actuarial gain of $686 million on the superannuation expense component for 2003-04.
Investment income on assets set aside to meet future superannuation liabilities achieved a positive 21.06% rate of return in 2003-04, an improvement on the 2002-03 rate of negative 1.86%. As the actuarially applied long-term earning rate for superannuation liability is 7.5%, an actuarial gain for superannuation expense of $686 million was recorded by the State in 2003-04. In 2002-03, the State recorded an actuarial loss of $685 million which increased employee expenses.
Salaries, wages and associated costs were $10,481 million in 2003-04, an increase of $766 million (7.9%) over the 2002-03 figure of $9,715 million. This growth reflects higher wages as a combination of wage increases based on established enterprise bargaining agreements and additional staffing associated with service growth and enhancements in areas such as Health, Education and Police.
The decline in Other Expenses in 2003-04 reflects unrealised losses recorded in 2002-03 on the market value of debt portfolios which contributed an extra $625 million to other expenses in 2002-03. 2003-04 has seen an increase in interest rates resulting in net unrealised gains on the market value of the debt portfolio of $981 million which is reported as Other Revenue.
| | |
State Finances Report 2003-04 – Government of Queensland | | 5-03 |
Consolidated Financial Statements - Overview and Analysis
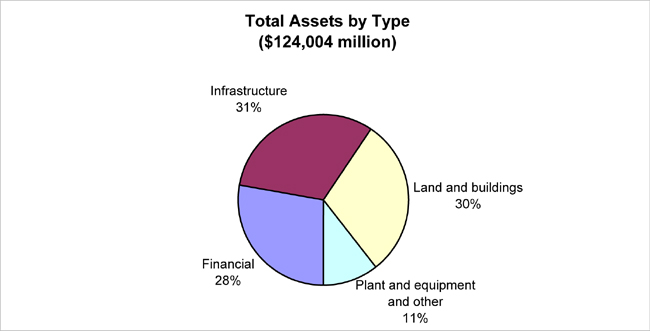
Assets
Assets controlled by the Government at 30 June 2004 totalled $124,004 million (2003, $110,466 million). The increase of $13,538 million in assets reflects:
| | • | increased holdings of financial investments, up $4,865 million. This increase primarily represents the reinvestment of earnings on the State’s assets set aside to meet future employee entitlements and standard employer contributions during 2003-04; and |
| | • | upward revaluations of land, infrastructure and plant and equipment assets under State control. This includes land administered by the Department of Natural Resources ($1,594 million), land and buildings maintained by the Departments of Housing ($2,468 million) and Education ($1,391 million) and roads/bridges infrastructure by Department of Main Roads ($1,313 million). |
The main types of assets are detailed in the following chart:
| | |
State Finances Report 2003-04 – Government of Queensland | | 5-04 |
Consolidated Financial Statements - Overview and Analysis
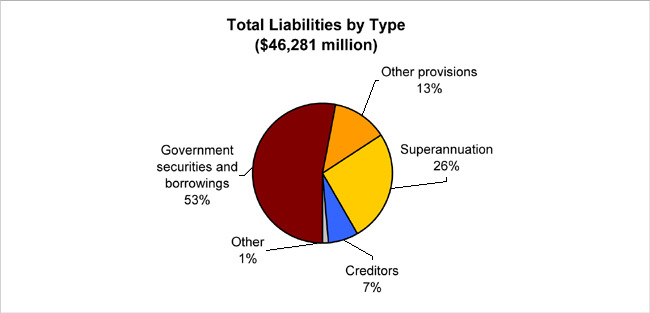
Liabilities
The total liabilities of the Queensland Government at 30 June 2004 were $46,281 million, an increase of $709 million over 2002-2003 ($45,572 million). The increase is largely due to Queensland Treasury Corporation holding a higher level of deposits from entities not consolidated (e.g. Local Government). These deposits have been invested in the financial assets above.
The components of State liabilities are illustrated in the following chart:
Maintenance of Credit Ratings
Queensland’s strong credit rating position is illustrated in the following table:
| | | | | | |
| | | Fitch Ratings
| | Moody’s Investors
Services
| | Standard & Poor’s
|
Long-term local currency rating | | AAA | | Aaa | | AAA |
Short-term rating | | F1+ | | P-1 | | A-1+ |
Long-term foreign currency rating | | AA+ | | Aaa | | AAA |
These ratings are the highest available.
Because of these strong ratings, the Queensland Treasury Corporation continues to be in a position to borrow at advantageous interest rates.
Queensland’s debt ratio (total liabilities to total assets) at 30 June 2004 was 37.3 percent (2003, 41.3 percent).
The State’s gearing ratio (borrowings to net assets) was 31.6 percent at 30 June 2004 (2003, 38.1 percent).
| | |
State Finances Report 2003-04 – Government of Queensland | | 5-05 |
2003-04 Audited Information
Consolidated Financial Statements of the Queensland Government
year ended 30 June 2004
Statement of Financial Performance
for the year ended 30 June 2004
| | | | | | | | |
| | | Notes
| | 2004
| | | 2003
| |
| | | | | $M | | | $M | |
Revenues from Ordinary Activities | | | | | | | | |
Commonwealth and other grants | | 3 | | 11,426 | | | 10,574 | |
Sales of goods and services | | 4 | | 8,643 | | | 8,300 | |
Taxes, fees and fines | | 5 | | 7,119 | | | 5,936 | |
Investment income | | 6 | | 3,298 | | | 715 | |
Royalties and other territorial income | | 7 | | 723 | | | 769 | |
Other | | 8 | | 1,403 | | | 862 | |
| | | | |
|
| |
|
|
Total Revenues from Ordinary Activities | | | | 32,612 | | | 27,156 | |
| | | | |
|
| |
|
|
Expenses from Ordinary Activities | | | | | | | | |
Employee expenses | | 9 | | 11,709 | | | 12,050 | |
Supplies and services | | | | 6,508 | | | 6,290 | |
Depreciation and amortisation | | 10 | | 2,714 | | | 2,646 | |
Grants and other contributions | | | | 4,083 | | | 3,800 | |
Borrowing costs expense | | 11 | | 1,245 | | | 1,392 | |
Share of loss of associates using the equity method | | 27 | | 5 | | | 18 | |
Other | | 12 | | 1,694 | | | 2,250 | |
| | | | |
|
| |
|
|
Total Expenses from Ordinary Activities | | | | 27,958 | | | 28,446 | |
Surplus/(Deficit) from Ordinary Activities before Income Tax Expense | | | | 4,654 | | | (1,290 | ) |
Income Tax Revenue/(Expense) relating to Ordinary Activities | | 2 | | — | | | — | |
| | | | |
|
| |
|
|
Net Surplus/(Deficit) | | | | 4,654 | | | (1,290 | ) |
| | | | |
|
| |
|
|
Asset revaluation reserve increments | | 25 | | 8,126 | | | 8,616 | |
Net amount of valuation adjustments recognised as a direct adjustment to equity in accordance with a standard | | 25 | | 87 | | | (526 | ) |
Changes in scope of consolidation | | 25 | | (28 | ) | | 1 | |
Other movements | | 25 | | (10 | ) | | — | |
| | | | |
|
| |
|
|
Total revenues, expenses and valuation adjustments attributable to members of the parent entity and recognised directly in equity | | | | 8,175 | | | 8,091 | |
| | | | |
|
| |
|
|
Total changes in equity other than those resulting from transactions with owners as owners | | | | 12,829 | | | 6,801 | |
| | | | |
|
| |
|
|
This Consolidated Statement of Financial Performance should be read in conjunction with the accompanying notes. Note 2 provides disaggregated information in relation to the components of the net surplus/(deficit).
| | |
Audited Consolidate Financial Statements 2003-04 - Government of Queensland | | 5-06 |
Statement of Financial Position
as at 30 June 2004
| | | | | | |
| | | Notes
| | 2004
| | 2003
|
| | | | | $M | | $M |
Assets | | | | | | |
Current Assets | | | | | | |
Cash assets | | 13 | | 235 | | 300 |
Receivables | | 14 | | 2,881 | | 2,497 |
Other financial assets | | 15 | | 7,424 | | 6,444 |
Inventories | | 16 | | 439 | | 563 |
Other | | 19 | | 433 | | 465 |
| | | | |
| |
|
Total Current Assets | | | | 11,412 | | 10,269 |
| | | | |
| |
|
Non-Current Assets | | | | | | |
Receivables | | 14 | | 4,021 | | 4,272 |
Investments accounted for using the equity method | | 27 | | 96 | | 84 |
Other financial assets | | 15 | | 19,650 | | 15,841 |
Inventories | | 16 | | 251 | | 155 |
Property, plant and equipment | | 17 | | 86,627 | | 77,890 |
Intangibles | | 18 | | 720 | | 670 |
Other | | 19 | | 1,227 | | 1,285 |
| | | | |
| |
|
Total Non-Current Assets | | | | 112,592 | | 100,197 |
| | | | |
| |
|
Total Assets | | | | 124,004 | | 110,466 |
| | | | |
| |
|
Liabilities | | | | | | |
Current Liabilities | | | | | | |
Payables | | 21 | | 2,948 | | 2,454 |
Interest-bearing liabilities | | 22 | | 7,391 | | 4,998 |
Provisions | | 23 | | 2,150 | | 2,399 |
Other | | 24 | | 401 | | 400 |
| | | | |
| |
|
Total Current Liabilities | | | | 12,890 | | 10,251 |
| | | | |
| |
|
Non-Current Liabilities | | | | | | |
Payables | | 21 | | 315 | | 246 |
Interest-bearing liabilities | | 22 | | 17,196 | | 19,726 |
Provisions | | 23 | | 15,659 | | 15,159 |
Other | | 24 | | 221 | | 190 |
| | | | |
| |
|
Total Non-Current Liabilities | | | | 33,391 | | 35,321 |
| | | | |
| |
|
Total Liabilities | | | | 46,281 | | 45,572 |
| | | | |
| |
|
Net Assets | | | | 77,723 | | 64,894 |
| | | | |
| |
|
Equity | | | | | | |
Accumulated surplus | | 25 | | 45,459 | | 40,844 |
Reserves | | 25 | | 32,264 | | 24,050 |
| | | | |
| |
|
Total Equity | | | | 77,723 | | 64,894 |
| | | | |
| |
|
This Consolidated Statement of Financial Position should be read in conjunction with the accompanying notes. Note 2 provides disaggregated information in relation to components of net assets.
| | |
Audited Consolidated Financial Statements 2003-04 - Government of Queensland | | 5-07 |
Statement of Cash Flows
for the year ended 30 June 2004
| | | | | | | | |
| | | Notes
| | 2004
| | | 2003
| |
| | | | | $M | | | $M | |
Cash Flows from Operating Activities | | | | | | | | |
Receipts | | | | | | | | |
Grants and subsidies received | | | | 11,428 | | | 10,556 | |
Sales of goods and services | | | | 8,786 | | | 8,238 | |
Taxes, fees and fines | | | | 7,048 | | | 5,897 | |
Interest received | | | | 2,799 | | | (68 | ) |
Royalties and other territorial receipts | | | | 699 | | | 795 | |
Dividends received | | | | 40 | | | 16 | |
GST input tax credits received | | | | 1,174 | | | 1,127 | |
Other | | | | 364 | | | 297 | |
Payments | | | | | | | | |
Employee expenses | | | | (11,548 | ) | | (10,297 | ) |
Supplies and services | | | | (7,378 | ) | | (7,160 | ) |
Grants and subsidies paid | | | | (4,088 | ) | | (3,781 | ) |
Borrowing costs paid | | | | (941 | ) | | (990 | ) |
GST remitted to the ATO | | | | (890 | ) | | (853 | ) |
Other | | | | (391 | ) | | (326 | ) |
| | | | |
|
| |
|
|
Net Cash from Operating Activities | | 26(a) | | 7,102 | | | 3,451 | |
| | | | |
|
| |
|
|
Cash Flows from Investing Activities | | | | | | | | |
Receipts | | | | | | | | |
Proceeds from sale of property, plant and equipment | | | | 740 | | | 778 | |
Proceeds from sale of investments | | | | 1,441 | | | 805 | |
Payments | | | | | | | | |
Acquisition of property, plant and equipment | | | | (4,219 | ) | | (4,308 | ) |
Acquisition of investments | | | | (3,846 | ) | | (729 | ) |
| | | | |
|
| |
|
|
Net Cash from Investing Activities | | | | (5,884 | ) | | (3,454 | ) |
| | | | |
|
| |
|
|
Cash Flows from Financing Activities | | | | | | | | |
Receipts | | | | | | | | |
Proceeds from borrowings | | | | 865 | | | 2,035 | |
Other | | | | 2 | | | 2 | |
Payments | | | | | | | | |
Repayment of borrowings | | | | (2,022 | ) | | (1,254 | ) |
| | | | |
|
| |
|
|
Net Cash from Financing Activities | | | | (1,155 | ) | | 783 | |
| | | | |
|
| |
|
|
Net Cash Flows from Public Financial Corporations (PFC) | | 26(b) | | 10 | | | 2 | |
| | | | |
|
| |
|
|
Net Increase/(Decrease) in Cash | | | | 73 | | | 782 | |
Net Increase/(Decrease) in non-eliminated Cash Balances with PFC | | | | (138 | ) | | (590 | ) |
Cash at the Beginning of the Financial Year | | | | 300 | | | 108 | |
| | | | |
|
| |
|
|
Cash Held at End of Year | | | | 235 | | | 300 | |
| | | | |
|
| |
|
|
This Consolidated Statement of Cash Flows should be read in conjunction with the accompanying notes.
| | |
Audited Consolidated Financial Statements 2003-04 - Government of Queensland | | 5-08 |
Notes to the Financial Statements
| 1. | Significant Accounting Policies |
The following summary presents the significant accounting policies that have been adopted in preparing and presenting the consolidated financial statements of the Government of Queensland.
These general purpose consolidated financial statements have been prepared in accordance with relevant Australian Accounting Standards, principally Australian Accounting Standard AAS 31 Financial Reporting by Governments and other authoritative pronouncements.
| (b) | The Government Reporting Entity |
In accordance with Australian Accounting Standard AAS 24 Consolidated Financial Reports, these consolidated financial statements include the values of all material assets, liabilities, equities, revenues and expenses controlled by the Government of Queensland.
Only those agencies considered material by virtue of the size of their financial transactions and/or resources managed are consolidated for the purposes of this report.
Where control of an entity is obtained during the financial year, its results are included in the Consolidated Statement of Financial Performance from the date control commences. Where control of an entity ceases during a financial year, its results are included for that part of the year during which control existed.
The Queensland Government economic entity includes all State Government departments, Public Non-financial Corporations, Public Financial Corporations and their controlled entities. Refer Note 39 for a full list of entities included in each sector.
In the process of reporting the Government of Queensland as a single economic entity, all material inter-entity and intra-entity transactions and balances have been eliminated to the extent practicable.
| | |
Audited Consolidated Financial Statements 2003-04 - Government of Queensland | | 5-09 |
Notes to the Financial Statements
| 1. | Significant Accounting Policies continued |
Assets, liabilities, revenues and expenses that are attributable reliably to each sector of the Government of Queensland economic entity are disclosed in Note 2. For disclosure purposes, transactions and balances between sectors have not been eliminated, but those between entities within each sector have been eliminated. The financial impact of inter-sector transactions and balances is disclosed in Note 2, under the heading of Consolidation Adjustments.
A brief description of each broad sector of the Government’s activities, determined in accordance with the Government Financial Statistics Standards, Australian Bureau of Statistics, follows:
General Government Sector
The primary function of General Government sector agencies is to provide public services that:
| | • | are non-trading in nature and that are for the collective benefit of the community; |
| | • | are largely financed by way of taxes, fees and other compulsory charges; and |
| | • | involve the transfer or redistribution of income. |
Public Non-financial Corporations Sector
The primary function of enterprises in the Public Non-financial Corporations sector is to provide goods and services that:
| | • | are trading, non-regulatory or non-financial in nature; and |
| | • | are financed by way of sales of goods and services to consumers. |
Public Financial Corporations Sector
The Public Financial Corporations sector comprises publicly owned institutions which provide financial services usually on a commercial basis.
Functions they perform may include:
| | • | accepting on-call, term or savings deposits; |
| | • | investment fund management; |
| | • | having the authority to incur liabilities and acquire financial assets in the market on their own account; or |
| | • | providing insurance services. |
A listing of the entities comprising each sector is provided in Note 39.
The reporting period of the consolidated entity is the year ended 30 June 2004.
These consolidated financial statements have been prepared in accordance with the Financial Administration and Audit Act 1977, applicable Australian Accounting Standards and Concepts, Urgent Issues Group Consensus Views and other authoritative pronouncements.
The statements have been prepared on an accrual basis that recognises the financial effects of transactions and events when they occur.
| | |
Audited Consolidated Financial Statements 2003-04 - Government of Queensland | | 5-10 |
Notes to the Financial Statements
| 1. | Significant Accounting Policies continued |
The consolidated financial statements adopt the following valuation methodologies:
| | • | superannuation, WorkCover, motor vehicle accident liabilities, Queensland Government Insurance Scheme and the Queensland Government Long Service Leave Central Scheme are based on actuarial valuations; |
| | • | investments held by Public Financial Corporations are recorded at market value; |
| | • | borrowings are recorded at market value; |
| | • | land, buildings, infrastructure, heritage and cultural assets are valued at fair value in accordance with AASB 1041 Revaluation of Non-Current Assets, other classes of assets are valued at cost or recoverable value as appropriate; and |
| | • | some inventories are valued at recoverable value. |
Historical cost accounting principles are otherwise employed.
Unless otherwise stated, the accounting policies adopted for the reporting period are consistent with those of the previous reporting period.
All amounts in the consolidated financial statements have been rounded to the nearest $1 million, unless otherwise indicated. Accordingly, numbers may not add due to rounding.
| (h) | Comparative Information |
Where applicable, comparatives have been restated to agree with changes in presentation in the financial statement for the current reporting period.
Commonwealth and other grants are normally recognised as revenue when the recipient entity obtains control over the grant, usually upon receipt. Where the grant is of a reciprocal nature, revenue is recognised as and when the obligation is fulfilled. When revenue, including grants, has been received in advance for services or work still to be completed at balance date, this revenue is considered to be unearned and is reported in other liabilities. Refer Note 24.
Assets received at below fair value, including those received free of charge and that can be measured reliably are recognised at their fair value as revenue when control over the assets is obtained, normally either on receipt of the assets or on notification that the assets have been secured.
Contributions of services are recognised only if the services would have been purchased if they had not been donated and their fair value can be reliably measured. Where this is the case, an equal amount is recognised as a revenue and an expense.
Non-repayable developer or customer contributions are recognised as revenue and as assets in accordance with Urgent Issues Group Abstract 17 Developer and Customer Contributions in Price Regulated Industries.
| | |
Audited Consolidated Financial Statements 2003-04 - Government of Queensland | | 5-11 |
Notes to the Financial Statements
| 1. | Significant Accounting Policies continued |
To the extent practicable, revenues from the sales of goods and services (including gas and electricity), fines and regulatory fees are recognised when the transaction or event, giving rise to the revenue, occurs.
State taxation is recognised as revenue upon the earlier of receipt by the responsible agency of a taxpayer’s self-assessment or, at the time the taxpayer’s obligation to pay arises pursuant to the issue of an assessment. The main types of taxation and fee revenue raised by the State Government are:
| | • | transfer and other duties; |
| | • | various gaming and lottery taxes. |
Investment income includes interest, dividends and other income earned during the financial year. Interest is recognised on an accrual basis and dividends when declared. Net realised gains from the sale of investments and unrealised gains from the revaluation of certain investments also form part of investment income.
Net increments in the market values of self-generating and regenerating assets (SGARAs) are recognised as revenues.
Borrowing costs are recognised as expenses in the period in which they are incurred.
General Provisions
A provision for onerous contracts is recognised when the expected benefits to be derived from a contract are less than the unavoidable costs of meeting the obligations under that contract, and only after any impairments to assets dedicated to that contract have been recognised.
The provision is recognised based on the excess of the estimated cash flows to meet the unavoidable costs under the contract over the estimated cash flows to be received in relation to the contract, having regard to the risks of the activities relating to the contract. The net estimated cash flows are discounted using market yields at balance date on national government guaranteed bonds with terms to maturity and currency that match, as closely as possible, the expected future payments, where the effect of discounting is material.
Power Purchase Agreement Provisions
A provision for onerous contracts has been realised in relation to a number of long-term power purchase agreements (PPAs) when the unavoidable costs of meeting the ongoing obligations under these agreements exceed the expected benefits to be received. Some of these PPAs have remaining terms which extend past the next ten years. Current conditions within the electricity market mean a number of the long-term power purchase agreements are considered to be onerous contracts.
The provision for onerous contracts reflects the least net cost of exiting these onerous PPAs which is the lower of the cost of fulfilling the agreements or the compensation payable as defined in these agreements for early termination.
| | |
Audited Consolidated Financial Statements 2003-04 - Government of Queensland | | 5-12 |
Notes to the Financial Statements
| 1. | Significant Accounting Policies continued |
Expected losses incurred on fulfilling the onerous PPAs are calculated as the net present value of the difference between the contracted purchase price for electricity and the estimated revenue to be derived from these agreements and anticipated hedge contracts. The extent of the future losses from the power purchase agreements will depend on future wholesale pool prices as well as the need for the State to meet its network support obligations. The future level of Queensland wholesale pool prices remains significantly uncertain. The critical determinants of future pool prices will be the bidding behaviour of participants in the National Electricity Market, load growth, network reliability and the introduction of new generation capacity.
The discount rate used of 9.4% (2003, 9.4%) reflects the current market assessments of the time value of money and the risks specific to these obligations.
Australian Magnesium Operations Pty Ltd
In October 2001, the State entered into a State Mezzanine Loan Agreement with Australian Magnesium Operations Pty Ltd (AMO) and Australian Magnesium Corporations Limited (AMC). The loan is for an advance up to $100 million to support payments to holders of Distribution Entitled Security (DES) who took up investments in AMC’s Stanwell Magnesium Project.
On 24 March 2004, Government stakeholders agreed to release their rights as secured creditors of AMC and withdraw from the Stanwell Magnesium Project. The deed of transfer was dated 6 July 2004.
A provision for onerous contracts exists in relation to the final payment to support payments to DES holders in November 2004.
Trade debtors are recognised at the nominal amount due, less any provision for doubtful debts.
Settlement by finance lease debtors is within the terms of the lease, ranging from 2 to 99 years. Title is passed to the purchaser on full repayment. Refer Note 14.
For the purposes of this report, investments held to fund the State’s liability for employee superannuation benefits and those held by Public Financial Corporations are recorded at market value. Other investments are recognised at cost.
Inventories are carried at the lower of cost, net realisable or net market value. For most agencies, cost is determined on either a first-in-first-out or average cost basis and includes expenditure incurred in acquiring the inventories and bringing them to their existing condition and location.
Net realisable value is the amount that could be expected to be received from the disposal of an asset in an orderly market, after deducting costs expected to be incurred in realising the proceeds of such a disposal.
Net market value is the amount that could be expected to be received in an active and liquid market, after deducting the costs expected to be incurred in realising the proceeds of the disposal.
| | |
Audited Consolidated Financial Statements 2003-04 - Government of Queensland | | 5-13 |
Notes to the Financial Statements
| 1. | Significant Accounting Policies continued |
| (o) | Property, Plant and Equipment |
Acquisition
Items of property, plant and equipment with a cost or other value greater than the asset recognition threshold of the agency are initially recorded at cost. Entity recognition thresholds for 2003-04 do not exceed $10,000 (unchanged from the previous year). Items with a cost or other value below each entity’s recognition threshold are expensed in the year of acquisition.
Assets acquired at no cost, or for nominal consideration, that can be measured reliably are recognised initially as assets and revenues at their fair value at the date of acquisition.
Recording and Valuation
Land, buildings, infrastructure, heritage and cultural assets are valued in accordance with AASB 1041 Revaluation of Non-Current Assets and Queensland Treasury’s Non-Current Asset Accounting Guidelines for the Queensland Public Sector. Reference should be made to individual agency reports for valuation methodologies and names and qualifications of relevant valuers, where appropriate.
All other non-current assets, principally plant and equipment and intangibles, are measured at cost.
Non-current physical assets measured at fair value are comprehensively revalued once every 5 years or as appropriate, with interim valuations using relevant indices being otherwise performed on an annual basis. Only those assets, the total values of which are material, compared to the value of the class of assets to which they belong, are comprehensively revalued.
In relation to the Queensland electricity and gas supply industry, power generation as well as electricity and gas transmission supply systems are valued at depreciated optimised replacement value or cost. This approach provides values based on the optimum set of replacement assets necessary to achieve the same service potential with no inappropriate surplus capacity.
Self-generating and regenerating assets (SGARAs) are recognised at net market value, which is the amount that could be expected to be received from the disposal of the asset in an active and liquid market, after deducting costs expected to be incurred in realising the proceeds of such a disposal. Where no active and liquid market is available, the net present value methodology has been adopted under the provisions of AAS 35 Self Generating and Regenerating Assets.
Non-reciprocal transfers of assets and liabilities between wholly-owned Queensland public sector entities, are accounted for as adjustments to contributed equity in accordance with UIG Abstract 38 Contributions by Owners Made to Wholly-owned Public Sector Entities.
Assets not Recognised
The following assets are not recognised in the Consolidated Statement of Financial Position:
Quarry Resources
The value of quarry resources held by the Department of Natural Resources, Mines and Energy and by the Department of Primary Industries and Fisheries is not included in the financial statements as it is not practical to determine reliably the quantum of the resources available for extraction. Revenue from the sale of quarry materials is recognised as extractions are made.
| | |
Audited Consolidated Financial Statements 2003-04 - Government of Queensland | | 5-14 |
Notes to the Financial Statements
| 1. | Significant Accounting Policies continued |
Native Forests
Under the provisions of the Forestry Act 1959, the Department of Primary Industries and Fisheries has a right to harvest forest products from certain forest areas through its Forestry Business Group. The current cash flows associated with these native forests are considered immaterial at this point and therefore, the value of the access rights has not been recognised in the Consolidated Statement of Financial Position. Seed orchards and nursery seedlings are not recognised on the grounds of materiality.
The value of plantation growing timber, managed by the Department of Primary Industries and Fisheries, Forestry Business Group, is recognised in the Consolidated Statement of Financial Position. Refer Note 19.
Land under Roads
Land under roads controlled by the departments of Main Roads and Natural Resources, Mines and Energy, is expensed as road construction occurs. The state does not value the area of land under gazetted roads.
Department of Natural Resources, Mines and Energy (DNR)
Under the Transport Infrastructure Act 1994, railway corridor land was rendered State land under the control of DNR, which for reporting purposes recorded the land at nil value. This land is on-leased to QR via Queensland Transport at no cost.
User Funded Assets
Certain wharf facilities, bulk sugar terminals, bulk molasses terminals, bulk grain terminals and grain loading facilities have been constructed on land controlled by Queensland port corporations. As the users of the assets have either fully or partially funded these facilities, they are not included in the Consolidated Statement of Financial Position, as they are either not considered to be controlled by the corporations, or no income will flow from the facilities.
Heritage Assets
Certain heritage assets, including artefacts, memorabilia and other historical objects held by agencies, have not been valued or included in the Consolidated Statement of Financial Position because of the unique nature of the items and the difficulty in determining a reliable value.
Library Collections
A number of entities expense the purchase of library acquisitions as they are incurred. Effective 1 July 2003 the Library Board of Queensland has changed their accounting policy to expense library collections that were previously capitalised. This has resulted in a write off of net assets of $18 million and a reduction in depreciation expense for 2003-04 of $2 million.
Intangibles
A number of public sector agencies have been unable to determine a reliable value for intangible items including internally developed software, intellectual property and trade names. Consequently, the value of these assets is excluded from these financial statements.
Water Licenses
The Mount Isa Water Board holds an interim resource allocation license. However, the Board has not been able to reliably measure the value of this asset and therefore, it has not been brought to account.
| | |
Audited Consolidated Financial Statements 2003-04 - Government of Queensland | | 5-15 |
Notes to the Financial Statements
| 1. | Significant Accounting Policies continued |
Depreciation and Amortisation
Land is not depreciated.
Other assets are normally depreciated or amortised on a straight-line basis from their date of acquisition (or in respect of internally constructed assets, from the time the asset is completed and held ready for use), and based on their estimated useful lives to the agency.
Where assets have separately identifiable components that are subject to regular replacement, these components are assigned useful lives distinct from the asset to which they relate and are depreciated accordingly.
In 2003-04, the Department of Housing revised its methodology for determining remaining useful lives of rental dwellings and other buildings. In prior years, the depreciation charge for buildings had been based on an estimated total useful life of 50 years. The new methodology, applied from the beginning of the financial year, involves the annual determination of remaining useful life estimates for building on the basis of comprehensive data maintained regarding the current condition of individual buildings. This has resulted in a reduction in depreciation charge for the year of $67 million.
Leasehold improvements are amortised over the estimated useful lives of the improvements or the unexpired period of the lease, whichever is shorter.
The following provides an indication of the estimated useful lives to agencies of the different asset classes:
| | |
| | | Useful Life
|
Asset Class | | |
Buildings | | 5 - 100 years |
Plant and equipment | | 2 - 50 years |
Infrastructure assets | | Up to 200 years |
Computer equipment | | 2 - 5 years |
Heritage and cultural assets | | 7 - 80 years |
| |
Intangibles | | |
Computer software | | 3 - 5 years |
Other intangibles (including goodwill, intellectual property, licences) | | 2 - 20 years |
Agency rights and obligations under finance leases, which are leases that effectively transfer most of the risks and benefits relating to ownership of the leased items to the lessee are recognised initially as assets and liabilities equal to the present value of the minimum lease payments. The assets are disclosed as leased plant and equipment and are amortised over the period during which the agency is expected to benefit from the use of the asset. Minimum lease payments are allocated between interest and reduction of the lease liability, according to the interest rate implicit in the lease.
For operating leases, where the lessor retains substantially all of the risks and benefits relating to ownership of the leased items, lease payments are expensed over the term of the lease.
Further disclosure on lease commitments is contained in Note 31.
| | |
Audited Consolidated Financial Statements 2003-04 - Government of Queensland | | 5-16 |
Notes to the Financial Statements
| 1. | Significant Accounting Policies continued |
Wages, Salaries, Annual Leave and Sick Leave
Liabilities for wages, salaries and annual leave are accrued at year-end. For most agencies, sick leave is non-vesting and is expensed as incurred. Liabilities have been calculated based on wage and salary rates at the date they are expected to be paid and include related on-costs.
Long Service Leave
A levy of 1.5% of salary and wages costs is paid by participating agencies (predominantly Government departments) into the Long Service Leave Central Scheme introduced in 1999-2000. Amounts paid to employees for long service leave are then claimed from the scheme as a reimbursement.
In 2003-04 the State Actuary undertook a full actuarial valuation of the Long Service Leave Central Scheme as at 30 June 2003. This valuation has been updated for the experience of the scheme as at 30 June 2004.
The method used incorporates consideration of expected future wage and salary levels, experience of employee departure and periods of service. The assumed rate of salary inflation and discount rate are based on Commonwealth Government bond yields at the reporting date and the expected long term gap between salary inflation and investment return.
Entities that do not participate in the Long Service Leave Central Scheme (predominantly Public Non-financial Corporations) determine their liability for long service leave based on the present value of estimated future cash outflows to be made.
Superannuation
A superannuation liability is recognised in the Consolidated Statement of Financial Position in respect of the various employees’ accrued superannuation benefits and represents the difference between the net market value of plan assets and the estimated accrued superannuation benefits at year-end. The liability is assessed annually by the State Actuary and a full actuarial review is undertaken every three years. Refer Notes 23 and 37.
Employees in the electricity industry contribute to a fund independent of the State Government. The superannuation fund is fully funded and no superannuation assets and liabilities are recognised in the consolidated accounts in respect of this fund. A full actuarial review of this scheme was undertaken in 2002-03. Refer Note 37.
Investments
Investments include marketable securities, money market deposits, floating rate notes, fixed interest deposits and letters of credit.
Investments held to fund the State’s liability for employee entitlements and General Government insurance liabilities and those held by Public Financial Corporations are recorded at market value. Other investments are recognised at cost.
This reflects the reporting treatment by these financial institutions. Unrealised gains or losses arising from this valuation policy are brought to account in the Consolidated Statement of Financial Performance.
| | |
Audited Consolidated Financial Statements 2003-04 - Government of Queensland | | 5-17 |
Notes to the Financial Statements
| 1. | Significant Accounting Policies continued |
Borrowings
Generally, borrowings are recorded at market value. These borrowings include:
| | • | public, domestic and overseas borrowings termed ‘Government Securities’ principally raised by the Queensland Treasury Corporation; and |
| | • | direct borrowings by individual Government entities. |
State debt to the Commonwealth represents loans made by the Commonwealth under Loan Council agreements.
Derivatives
Derivatives used to hedge financial assets or financial liabilities are recorded at market value, where they can be reliably measured. Gains or losses on derivatives are accounted for on the same basis as the underlying physical exposures. Accordingly, realised and unrealised gains and losses on derivatives are included in the Consolidated Statement of Financial Performance as are gains and losses arising from the related physical exposures. The market values of all derivatives measured are recorded as financial assets or financial liabilities in the Consolidated Statement of Financial Position.
Foreign currency transactions are translated initially into Australian dollars at the rate of exchange applying at the date of the transaction. Amounts payable and receivable in foreign currencies at balance date are translated to Australian currency at rates of exchange current at 30 June 2004.
Exchange differences relating to amounts payable and receivable in foreign currencies are brought to account as exchange gains or losses in the Consolidated Statement of Financial Performance in the financial year in which the exchange rates change.
In relation to borrowings covered by swaps denominated in foreign currencies, both the loan and the underlying swap are valued at the relevant swap yield existing at year-end. Where transactions involve forward foreign exchange, the amount payable or receivable under the forward exchange contract is adjusted to reflect forward rates of exchange applicable at year-end. Exchange gains or losses are brought to account in the Consolidated Statement of Financial Performance.
| (t) | Related Party Transactions |
A number of related party transactions which are at arm’s length and under normal commercial terms, have been disclosed in the financial statements of some of the agencies included in these consolidated financial statements. These transactions mainly relate to Government-owned corporations. Reference should be made to individual agency reports for further particulars of these transactions.
‘Cash’ includes cash on hand and at bank and deposits at call which are readily convertible to cash on hand and are subject to an insignificant risk of changes in value, net of outstanding bank overdrafts.
The Government is exempt from Commonwealth taxation except for Fringe Benefits Tax and Goods and Services Tax (GST).
| | |
Audited Consolidated Financial Statements 2003-04 - Government of Queensland | | 5-18 |
Notes to the Financial Statements
| 1. | Significant Accounting Policies continued |
Revenues, expenses and assets are recognised net of GST, except where the amount of GST incurred is not recoverable from the Australian Taxation Office (ATO). In these circumstances the GST is recognised as part of the acquisition cost of the asset or as part of the item of expense.
Receivables and payables are stated with the amount of GST included. The amounts of GST receivable from, or payable to, the ATO are included as a current asset or liability in the Consolidated Statement of Financial Position.
Cash flows are included in the Consolidated Statement of Cash Flows on a gross basis. The GST components of cash flows arising from investing and financing activities which are recoverable from, or payable to, the ATO are classified as operating cash flows.
| (w) | Public Private Partnerships (PPPs) |
There is currently no Australian Accounting Standard specifically addressing accounting for private sector financed infrastructure assets. The following policies have been adopted pending the development of an accounting standard.
Agreements Equally Proportionately Unperformed arising from PPPs are not recognised as assets or liabilities because there is significant uncertainty as to whether the definitions and recognition criteria in Statement of Accounting Concepts SAC 4 Definition and Recognition of Elements of Financial Statements would be satisfied. Instead, the payments under these agreements are expensed systematically over the term of the agreements. Further, the commitments for future payments under these agreements are disclosed as commitments in the notes to the consolidated financial statements.
| (x) | Adoption of International Financial Reporting Standards |
The Financial Reporting Council has determined that all entities preparing general purpose financial statements will apply the Australian Equivalents to International Financial Reporting Standards (IFRS) for reporting periods beginning on or after 1 January 2005.
Queensland Treasury has established a project team to ensure the smooth convergence of Australian Accounting Standards with IFRS for Queensland Government agencies. This is being achieved through identifying impacts on whole-of-Government policy and financial results, supporting stakeholders during transition (through the provision of training and facilitation of workshops and avenues for discussion) and monitoring agency preparedness to implement successfully on time.
The proposed harmonisation of Generally Accepted Accounting Principles (GAAP) and Government Finance Statistics (GFS) may result in additional changes to reporting requirements that will further impact on the future presentation of financial information.
To date, the following have been identified as key areas of difference in accounting policies which will arise from the adoption of Australian equivalents to IFRS:
Inventories
The valuation of inventories held for distribution will change from the lower of cost and net realisable value as stated in Note 1(f) to the lower of cost and current replacement cost under AASB 102 Inventories. This may lead to an increase in the valuation shown for inventories.
Fair Value of Non-current Assets
“For profit” entities (mainly non General Government entities) will have to revalue non-current assets on an individual asset basis, not a class of assets basis. This may result in changes to the overall value of assets.
| | |
Audited Consolidated Financial Statements 2003-04 - Government of Queensland | | 5-19 |
Notes to the Financial Statements
| 1. | Significant Accounting Policies continued |
Impairment of Assets
An annual impairment test will be required on all non-current physical and intangible assets using discounted cash flows. This may result in a write-down of the value of plant and equipment and intangible assets.
Investment Properties
Investment properties must be valued at either fair value or depreciated cost. Under the fair value model changes in fair value are recognised in the profit or loss. This differs from the current treatment which allows offset against asset revaluation reserves if available. In addition, buildings and or land subject to a finance lease will be considered to be investment properties.
Employee Benefits
(i) Superannuation
AASB119 Employee Benefits requires the immediate recognition of changes in employee defined benefit liabilities in the profit and loss, including actuarial gains and losses. Defined benefit surpluses or deficits are recorded in the Statement of Financial Performance.
Defined benefit schemes operated by the Electricity Supply Industry (previously disclosed as a note to the accounts) will under IFRS be subject to an annual assessment by an actuary, with resulting gains and losses brought to account in the Statement of Financial Performance.
The State Public Sector Superannuation Fund (see Note 37) is currently assessed annually by the State Actuary, so no impact is expected from the new IFRS requirements.
AASB119 also requires the discounting of benefit obligations through the “Projected Unit Credit” method using yield rates on government bonds at reporting date. In determining benefit obligations for the State Public Sector, the Actuary applies the “Entry Age Normal” funding method using a long term investment return rate to discount benefit obligations.
As the long term investment rate of 7.5% is higher than the market yield on government bond rates at 30 June 2004, it is anticipated the State’s superannuation liabilities will increase resulting in a reduction in net worth. The effect of a change in the discounting method on benefit obligations has not yet been quantified.
In addition, the change in discounting method from the “Entry Age Normal” funding method currently utilised by the State Actuary to the “Projected Unit Credit” prescribed by AASB119, will result in a change in benefit obligations. This effect of this change has not been quantified at this stage.
(ii) Long Service Leave
Application of AASB119 to the State’s long service leave provisions will result in a change in the discounting method from the “Entry Age Normal” funding model to the “Projected Unit Credit” method with market yields at reporting date on government bonds. The effect of this change has not been quantified at this stage.
Provisions
Restoration and rehabilitation provisions must be included in the cost of the associated asset, rather than separately recorded.
Financial Instruments
All financial assets and liabilities, including derivatives, will be recognised on the Statement of Financial Position at inception. Gains or losses from these instruments will be recognised on the Statement of Financial Performance, unless the stringent hedging tests can be met. Gains or losses on hedges are reflected on the Statement of Financial Performance.
| | |
Audited Consolidated Financial Statements 2003-04 - Government of Queensland | | 5-20 |
Notes to the Financial Statements
| 1. | Significant Accounting Policies continued |
Intangible Assets
Internally generated brands are specifically excluded from being recognised on the Statement of Financial Position. This will result in Golden Casket having to make an adjustment of approximately $2 million against opening retained earnings.
General Insurance Contracts
Outstanding claims liabilities of insurance providers will be required to be valued at a level of sufficiency at least 75% and discounted using a risk-free rate similar to that required by prudential standards.
The dollar values of most of the above changes cannot be reliably estimated at the date of this report.
| | |
Audited Consolidated Financial Statements 2003-04 - Government of Queensland | | 5-21 |
Notes to the Financial Statements
| 2. | Disaggregated Information |
Revenues and Expenses for the Year Ended 30 June 2004
| | | | | | | | | | | | | | | | | | | | | | | | | | | |
| | | General Government #
| | | Public Non-financial
Corporations #
| | | Public
Financial
Corporations #
| | Consolidation
Adjustments
| | | Consolidated
| |
| | | 2004
| | 2003
| | | 2004
| | | 2003
| | | 2004
| | | 2003
| | 2004
| | | 2003
| | | 2004
| | 2003
| |
| | | $M | | $M | | | $M | | | $M | | | $M | | | $M | | $M | | | $M | | | $M | | $M | |
Revenues | | | | | | | | | | | | | | | | | | | | | | | | | | | |
Commonwealth and other grants | | 11,564 | | 10,726 | | | 1,055 | | | 1,006 | | | — | | | — | | (1,193 | ) | | (1,158 | ) | | 11,426 | | 10,574 | |
Sales of goods and services | | 1,486 | | 1,425 | | | 6,624 | | | 6,323 | | | 816 | | | 750 | | (283 | ) | | (198 | ) | | 8,643 | | 8,300 | |
Taxes, fees and fines | | 7,373 | | 6,188 | | | — | | | — | | | — | | | — | | (254 | ) | | (252 | ) | | 7,119 | | 5,936 | |
Investment income | | 3,945 | | 1,053 | | | 104 | | | 86 | | | 937 | | | 2,315 | | (1,688 | ) | | (2,739 | ) | | 3,298 | | 715 | |
Royalties and territorial revenue | | 674 | | 724 | | | 48 | | | 45 | | | — | | | — | | 1 | | | — | | | 723 | | 769 | |
Other | | 174 | | 336 | | | 307 | | | 506 | | | 943 | | | 2 | | (21 | ) | | 18 | | | 1,403 | | 862 | |
| | |
| |
|
| |
|
| |
|
| |
|
| |
| |
|
| |
|
| |
| |
|
|
Total Revenues | | 25,216 | | 20,452 | | | 8,138 | | | 7,966 | | | 2,696 | | | 3,067 | | (3,438 | ) | | (4,329 | ) | | 32,612 | | 27,156 | |
| | |
| |
|
| |
|
| |
|
| |
|
| |
| |
|
| |
|
| |
| |
|
|
Expenses | | | | | | | | | | | | | | | | | | | | | | | | | | | |
Employee expenses | | 10,181 | | 10,671 | | | 1,594 | | | 1,467 | | | 114 | | | 106 | | (180 | ) | | (194 | ) | | 11,709 | | 12,050 | |
Supplies and services | | 3,658 | | 3,499 | | | 2,939 | | | 2,818 | | | 78 | | | 51 | | (167 | ) | | (78 | ) | | 6,508 | | 6,290 | |
Depreciation and amortisation | | 1,461 | | 1,461 | | | 1,235 | | | 1,175 | | | 18 | | | 10 | | — | | | — | | | 2,714 | | 2,646 | |
Grants and other contributions | | 5,075 | | 4,801 | | | 199 | | | 135 | | | 2 | | | 22 | | (1,193 | ) | | (1,158 | ) | | 4,083 | | 3,800 | |
Borrowing costs expense | | 69 | | 342 | | | 371 | | | 1,270 | | | 1,347 | | | 1,409 | | (542 | ) | | (1,629 | ) | | 1,245 | | 1,392 | |
Share of loss of equity accounted investments | | 1 | | 8 | | | 4 | | | 10 | | | — | | | — | | — | | | — | | | 5 | | 18 | |
Other | | 770 | | 666 | | | 316 | | | 342 | | | 819 | | | 1,454 | | (211 | ) | | (212 | ) | | 1,694 | | 2,250 | |
| | |
| |
|
| |
|
| |
|
| |
|
| |
| |
|
| |
|
| |
| |
|
|
Total Expenses | | 21,215 | | 21,448 | | | 6,658 | | | 7,217 | | | 2,378 | | | 3,052 | | (2,293 | ) | | (3,271 | ) | | 27,958 | | 28,446 | |
| | |
| |
|
| |
|
| |
|
| |
|
| |
| |
|
| |
|
| |
| |
|
|
Operating Surplus/(Deficit) before | | | | | | | | | | | | | | | | | | | | | | | | | | | |
Income Tax Expense | | 4,001 | | (996 | ) | | 1,480 | | | 749 | | | 318 | | | 15 | | (1,145 | ) | | (1,058 | ) | | 4,654 | | (1,290 | ) |
| | |
| |
|
| |
|
| |
|
| |
|
| |
| |
|
| |
|
| |
| |
|
|
Income tax credit/(expense) | | — | | — | | | (362 | ) | | (240 | ) | | (93 | ) | | 8 | | 455 | | | 232 | | | — | | — | |
| | |
| |
|
| |
|
| |
|
| |
|
| |
| |
|
| |
|
| |
| |
|
|
Net Surplus/(Deficit) | | 4,001 | | (996 | ) | | 1,118 | | | 509 | | | 225 | | | 23 | | (690 | ) | | (826 | ) | | 4,654 | | (1,290 | ) |
| | |
| |
|
| |
|
| |
|
| |
|
| |
| |
|
| |
|
| |
| |
|
|
| # | See Note 1(c) for explanation of sectors. |
| | |
Audited Consolidated Financial Statements 2003-04 - Government of Queensland | | 5-22 |
Notes to the Financial Statements
| 2. | Disaggregated Information continued |
Assets and Liabilities as at 30 June 2004
| | | | | | | | | | | | | | | | | | | | | | |
| | | General Government #
| | Public Non-financial
Corporations #
| | Public Financial
Corporations #
| | Consolidation
Adjustments
| | | Consolidated
|
| | | 2004
| | 2003
| | 2004
| | 2003
| | 2004
| | 2003
| | 2004
| | | 2003
| | | 2004
| | 2003
|
| | | $M | | $M | | $M | | $M | | $M | | $M | | $M | | | $M | | | $M | | $M |
Assets | | | | | | | | | | | | | | | | | | | | | | |
Current Assets | | | | | | | | | | | | | | | | | | | | | | |
Cash assets | | 1,729 | | 1,613 | | 1,025 | | 1,078 | | 26 | | 16 | | (2,545 | ) | | (2,407 | ) | | 235 | | 300 |
Receivables | | 2,539 | | 2,244 | | 1,157 | | 1,085 | | 66 | | 69 | | (881 | ) | | (901 | ) | | 2,881 | | 2,497 |
Other financial assets | | 1,243 | | 1,142 | | 17 | | 17 | | 6,193 | | 5,314 | | (29 | ) | | (29 | ) | | 7,424 | | 6,444 |
Inventories | | 134 | | 165 | | 305 | | 398 | | — | | — | | — | | | — | | | 439 | | 563 |
Current tax assets | | 72 | | 49 | | — | | 1 | | — | | — | | (72 | ) | | (50 | ) | | — | | — |
Other | | 280 | | 368 | | 157 | | 99 | | 11 | | 2 | | (15 | ) | | (4 | ) | | 433 | | 465 |
| | |
| |
| |
| |
| |
| |
| |
|
| |
|
| |
| |
|
Total Current Assets | | 5,997 | | 5,581 | | 2,661 | | 2,678 | | 6,296 | | 5,401 | | (3,542 | ) | | (3,391 | ) | | 11,412 | | 10,269 |
| | |
| |
| |
| |
| |
| |
| |
|
| |
|
| |
| |
|
Non-Current Assets | | | | | | | | | | | | | | | | | | | | | | |
Receivables | | 427 | | 508 | | 475 | | 497 | | 17,741 | | 19,671 | | (14,622 | ) | | (16,404 | ) | | 4,021 | | 4,272 |
Investments accounted for using the equity method | | 34 | | 29 | | 60 | | 54 | | 2 | | 1 | | — | | | — | | | 96 | | 84 |
Other financial assets | | 28,632 | | 24,415 | | 510 | | 364 | | 5,107 | | 3,809 | | (14,599 | ) | | (12,747 | ) | | 19,650 | | 15,841 |
Inventories | | 169 | | 151 | | 82 | | 4 | | — | | — | | — | | | — | | | 251 | | 155 |
Property, plant and equipment | | 61,158 | | 53,134 | | 25,434 | | 24,733 | | 68 | | 57 | | (33 | ) | | (34 | ) | | 86,627 | | 77,890 |
Deferred tax assets | | 2,099 | | 1,834 | | 505 | | 496 | | 36 | | 109 | | (2,640 | ) | | (2,439 | ) | | — | | — |
Intangibles | | 512 | | 456 | | 183 | | 189 | | 25 | | 24 | | — | | | 1 | | | 720 | | 670 |
Other | | 9 | | 11 | | 1,219 | | 1,274 | | — | | — | | (1 | ) | | — | | | 1,227 | | 1,285 |
| | |
| |
| |
| |
| |
| |
| |
|
| |
|
| |
| |
|
Total Non-Current Assets | | 93,040 | | 80,538 | | 28,468 | | 27,611 | | 22,979 | | 23,671 | | (31,895 | ) | | (31,623 | ) | | 112,592 | | 100,197 |
| | |
| |
| |
| |
| |
| |
| |
|
| |
|
| |
| |
|
Total Assets | | 99,037 | | 86,119 | | 31,129 | | 30,289 | | 29,275 | | 29,072 | | (35,437 | ) | | (35,014 | ) | | 124,004 | | 110,466 |
| | |
| |
| |
| |
| |
| |
| |
|
| |
|
| |
| |
|
| # | See Note 1(c) for explanation of sectors. |
| | |
Audited Consolidated Financial Statements 2003-04 - Government of Queensland | | 5-23 |
Notes to the Financial Statements
| 2. | Disaggregated Information continued |
Assets and Liabilities continued
| | | | | | | | | | | | | | | | | | | | | | |
| | | General
Government #
| | Public Non-financial
Corporations #
| | Public Financial
Corporations #
| | Consolidation
Adjustments
| | | Consolidated
|
| | | 2004
| | 2003
| | 2004
| | 2003
| | 2004
| | 2003
| | 2004
| | | 2003
| | | 2004
| | 2003
|
| | | $M | | $M | | $M | | $M | | $M | | $M | | $M | | | $M | | | $M | | $M |
Liabilities | | | | | | | | | | | | | | | | | | | | | | |
Current Liabilities | | | | | | | | | | | | | | | | | | | | | | |
Payables | | 1,910 | | 1,540 | | 1,025 | | 866 | | 193 | | 206 | | (180 | ) | | (158 | ) | | 2,948 | | 2,454 |
Interest bearing liabilities | | 238 | | 267 | | 236 | | 425 | | 9,917 | | 7,386 | | (3,000 | ) | | (3,080 | ) | | 7,391 | | 4,998 |
Current tax liabilities | | — | | 1 | | 63 | | 27 | | 6 | | 17 | | (69 | ) | | (45 | ) | | — | | — |
Provisions | | 1,287 | | 1,647 | | 1,002 | | 998 | | 574 | | 502 | | (713 | ) | | (748 | ) | | 2,150 | | 2,399 |
Other | | 301 | | 305 | | 105 | | 99 | | — | | — | | (5 | ) | | (4 | ) | | 401 | | 400 |
| | |
| |
| |
| |
| |
| |
| |
|
| |
|
| |
| |
|
Total Current Liabilities | | 3,736 | | 3,760 | | 2,431 | | 2,415 | | 10,690 | | 8,111 | | (3,967 | ) | | (4,035 | ) | | 12,890 | | 10,251 |
| | |
| �� |
| |
| |
| |
| |
| |
|
| |
|
| |
| |
|
Non-Current Liabilities | | | | | | | | | | | | | | | | | | | | | | |
Payables | | 262 | | 223 | | 54 | | 23 | | — | | — | | (1 | ) | | — | | | 315 | | 246 |
Interest bearing liabilities | | 2,971 | | 3,423 | | 11,914 | | 13,033 | | 16,509 | | 19,030 | | (14,198 | ) | | (15,760 | ) | | 17,196 | | 19,726 |
Deferred tax liabilities | | 540 | | 603 | | 2,089 | | 1,826 | | 10 | | 8 | | (2,639 | ) | | (2,437 | ) | | — | | — |
Provisions | | 13,692 | | 13,101 | | 800 | | 818 | | 1,167 | | 1,239 | | — | | | 1 | | | 15,659 | | 15,159 |
Other | | 113 | | 115 | | 108 | | 78 | | — | | — | | — | | | (3 | ) | | 221 | | 190 |
| | |
| |
| |
| |
| |
| |
| |
|
| |
|
| |
| |
|
Total Non-Current Liabilities | | 17,578 | | 17,465 | | 14,965 | | 15,778 | | 17,686 | | 20,277 | | (16,838 | ) | | (18,199 | ) | | 33,391 | | 35,321 |
| | |
| |
| |
| |
| |
| |
| |
|
| |
|
| |
| |
|
Total Liabilities | | 21,314 | | 21,225 | | 17,396 | | 18,193 | | 28,376 | | 28,388 | | (20,805 | ) | | (22,234 | ) | | 46,281 | | 45,572 |
| | |
| |
| |
| |
| |
| |
| |
|
| |
|
| |
| |
|
Net Assets | | 77,723 | | 64,894 | | 13,733 | | 12,096 | | 899 | | 684 | | (14,632 | ) | | (12,780 | ) | | 77,723 | | 64,894 |
| | |
| |
| |
| |
| |
| |
| |
|
| |
|
| |
| |
|
| # | See Note 1(c) for explanation of sectors. |
| | |
Audited Consolidated Financial Statements 2003-04 - Government of Queensland | | 5-24 |
Notes to the Financial Statements
| | | | |
| | | 2004
| | 2003
|
| | | $M | | $M |
3. Commonwealth and Other Grants | | | | |
| | |
Commonwealth | | | | |
General purpose payments | | | | |
GST revenue grants | | 6,515 | | 5,890 |
Budget balancing assistance | | — | | 38 |
National competition policy payments | | 88 | | 139 |
Specific purpose payments | | | | |
Health | | 1,765 | | 1,711 |
Education | | 1,297 | | 1,146 |
Other agencies | | 1,297 | | 1,258 |
| | |
| |
|
| | | 10,962 | | 10,182 |
Other | | 464 | | 392 |
| | |
| |
|
| | | 11,426 | | 10,574 |
| | |
| |
|
4. Sales of Goods and Services | | | | |
| | |
Goods | | 3,795 | | 3,547 |
Services | | 4,543 | | 4,459 |
Rental | | 305 | | 294 |
| | |
| |
|
| | | 8,643 | | 8,300 |
| | |
| |
|
| | |
Cost of sales in relation to goods is $900 million (2003, $920 million). | | | | |
| | |
5. Taxes, Fees and Fines | | | | |
| | |
Taxes | | | | |
Stamp duty | | | | |
Transfer duty | | 1,863 | | 1,382 |
Vehicle registration | | 271 | | 234 |
Insurance | | 315 | | 286 |
Mortgages | | 251 | | 183 |
Other duties | | 132 | | 97 |
| | |
| |
|
| | | 2,832 | | 2,182 |
Payroll tax | | 1,409 | | 1,262 |
Land tax | | 303 | | 271 |
Debits tax | | 191 | | 191 |
Various gaming taxes and other levies | | 914 | | 738 |
Fees | | | | |
Vehicle registration | | 702 | | 646 |
Transport and other licences and permits | | 588 | | 502 |
Fines | | 180 | | 144 |
| | |
| |
|
| | | 7,119 | | 5,936 |
| | |
| |
|
6. Investment Income | | | | |
| | |
Interest | | 3,289 | | 706 |
Dividends | | 1 | | 2 |
Other | | 8 | | 7 |
| | |
| |
|
| | | 3,298 | | 715 |
| | |
| |
|
| | |
Note interest income on assets set aside to meet employee entitlement liabilities totalled $2,450 million (2003, $240 million loss). | | | | |
| | |
Audited Consolidated Financial Statements 2003-04 - Government of Queensland | | 5-25 |
Notes to the Financial Statements
| | | | |
| | | 2004
| | 2003
|
| | | $M | | $M |
7. Royalties and Other Territorial Revenue | | | | |
| | |
Royalties | | 633 | | 687 |
Other territorial revenue | | 90 | | 82 |
| | |
| |
|
| | | 723 | | 769 |
| | |
| |
|
| | |
8. Other Operating Revenue | | | | |
| | |
Net gain on disposal of non-current assets | | 17 | | — |
Assets assumed | | 13 | | 9 |
Increment on revaluation of: | | | | |
Self generating and regenerating assets | | 3 | | 340 |
Property, plant and equipment | | 79 | | 71 |
Market value increment on financial assets and liabilities | | 981 | | — |
Other | | 310 | | 442 |
| | |
| |
|
| | | 1,403 | | 862 |
| | |
| |
|
| | |
9. Employee Expenses | | | | |
| | |
Salaries, wages and associated costs | | 10,481 | | 9,715 |
Superannuation | | 1,228 | | 2,335 |
| | |
| |
|
| | | 11,709 | | 12,050 |
| | |
| |
|
|
Note the superannuation expense includes a decrease in the liability following a review by the State Actuary of $686 million (2003, $685 million increase). |
| | |
10. Depreciation and Amortisation | | | | |
| | |
Depreciation and amortisation expenses for the financial year were charged in respect of: | | | | |
Buildings | | 505 | | 513 |
Plant and equipment | | 591 | | 654 |
Infrastructure | | 1,357 | | 1,233 |
Heritage and cultural assets | | 1 | | 1 |
Leased plant and equipment | | 140 | | 146 |
Software development | | 100 | | 80 |
Other intangible assets | | 20 | | 19 |
| | |
| |
|
| | | 2,714 | | 2,646 |
| | |
| |
|
| | |
11. Borrowing Costs Expense | | | | |
| | |
Interest | | 1,236 | | 1,373 |
Other | | 9 | | 19 |
| | |
| |
|
| | | 1,245 | | 1,392 |
| | |
| |
|
| | |
Audited Consolidated Financial Statements 2003-04 - Government of Queensland | | 5-26 |
Notes to the Financial Statements
| | | | | | |
| | | 2004
| | | 2003
| |
| | | $M | | | $M | |
12. Other Operating Expense | | | | | | |
| | |
WorkCover Queensland and other claims | | 647 | | | 600 | |
Decommissioned infrastructure assets | | 147 | | | 109 | |
Operating lease rentals | | 62 | | | 58 | |
Assets transferred to non-State entities | | 114 | | | — | |
Bad and doubtful debts | | 50 | | | 61 | |
Land under roads | | 11 | | | 12 | |
Net loss on sale: | | | | | | |
Investments | | 202 | | | 228 | |
Non-current assets | | 1 | | | 14 | |
Market value decrement on financial assets and liabilities | | — | | | 625 | |
Other | | 460 | | | 543 | |
| | |
|
| |
|
|
| | | 1,694 | | | 2,250 | |
| | |
|
| |
|
|
Audit fees of $10.9 million (2003 $10.2 million) charged by the Queensland Audit Office to entities included in these financial statements have been eliminated on consolidation. | |
| | |
13. Cash Assets | | | | | | |
| | |
Cash | | 1,704 | | | 1,611 | |
Deposits at call | | 76 | | | 126 | |
Treasury Investment Suspense Account | | (1,545 | ) | | (1,437 | ) |
| | |
|
| |
|
|
| | | 235 | | | 300 | |
| | |
|
| |
|
|
Agencies forming part of the Public Accounts report all monies on hand as cash. This does not include the Queensland Treasury Corporation (QTC) money market deposits of $1,377 million (2003, $1,099 million). Refer Note 15. All material cash balances held by those agencies are managed and invested by Queensland Treasury daily to maximise returns in accordance with agreed risk profiles on a whole-of-Government basis. | |
| | |
14. Receivables | | | | | | |
| | |
Current | | | | | | |
Trade receivables | | 1,271 | | | 1,187 | |
Interest receivables | | 64 | | | 49 | |
Investment receivables | | 585 | | | 582 | |
Loans and advances | | 180 | | | 113 | |
GST input tax credits receivables | | 211 | | | 161 | |
Finance leases | | 10 | | | 10 | |
Other | | 880 | | | 658 | |
| | |
|
| |
|
|
| | | 3,201 | | | 2,760 | |
Less: Provision for doubtful debts | | 320 | | | 263 | |
| | |
|
| |
|
|
| | | 2,881 | | | 2,497 | |
| | |
|
| |
|
|
| | |
Audited Consolidated Financial Statements 2003-04 - Government of Queensland | | 5-27 |
Notes to the Financial Statements
| | | | | | |
| | | 2004
| | | 2003
| |
| | | $M | | | $M | |
14. Receivables continued | | | | | | |
| | |
Non-Current | | | | | | |
Trade receivables | | 100 | | | 62 | |
Loans and advances | | 564 | | | 640 | |
Onlendings | | 3,144 | | | 3,350 | |
Finance leases | | 215 | | | 222 | |
Other | | 20 | | | 18 | |
| | |
|
| |
|
|
| | | 4,043 | | | 4,292 | |
Less: Provision for doubtful debts | | 22 | | | 20 | |
| | |
|
| |
|
|
| | | 4,021 | | | 4,272 | |
| | |
|
| |
|
|
Finance Lease Receivables due: | | | | | | |
Not later than 1 year | | 16 | | | 16 | |
Later than 1 year but not later than 5 years | | 57 | | | 56 | |
Later than 5 years | | 338 | | | 352 | |
Less: Future finance revenue | | (186 | ) | | (192 | ) |
| | |
|
| |
|
|
| | | 225 | | | 232 | |
| | |
|
| |
|
|
Minimum Operating Lease Payments Receivable: | | | | | | |
Operating leases not recognised in the financial statements: | | | | | | |
Not later than 1 year | | 11 | | | 13 | |
Later than 1 year but not later than 5 years | | 27 | | | 37 | |
Later than 5 years | | 113 | | | 104 | |
| | |
|
| |
|
|
| | | 151 | | | 154 | |
| | |
|
| |
|
|
| | |
15. Other Financial Assets | | | | | | |
| | |
Current | | | | | | |
Money market deposits | | 1,377 | | | 1,099 | |
Floating rate notes | | 1,649 | | | 951 | |
Securities and bonds | | 2,640 | | | 2,744 | |
Investments managed by Queensland Investment Corporation | | 1,711 | | | 1,530 | |
Other | | 47 | | | 120 | |
| | |
|
| |
|
|
| | | 7,424 | | | 6,444 | |
| | |
|
| |
|
|
Non-Current | | | | | | |
Securities and bonds | | 3,206 | | | 2,109 | |
Investments managed by Queensland Investment Corporation | | 15,444 | | | 13,052 | |
Shares | | 392 | | | 148 | |
Other | | 608 | | | 532 | |
| | |
|
| |
|
|
| | | 19,650 | | | 15,841 | |
| | |
|
| |
|
|
Refer Note 36 for further disclosure on financial instruments. | | | | | | |
| | |
Audited Consolidated Financial Statements 2003-04 - Government of Queensland | | 5-28 |
Notes to the Financial Statements
| | | | | |
| | | 2004
| | | 2003
|
| | | $M | | | $M |
16. Inventories | | | | | |
| | |
Current | | | | | |
Raw materials and stores | | 214 | | | 296 |
Work in progress | | 28 | | | 24 |
Finished goods | | 117 | | | 112 |
Land held for resale | | 51 | | | 108 |
Other | | 34 | | | 23 |
Write down/provision for obsolescence | | (5 | ) | | — |
| | |
|
| |
|
| | | 439 | | | 563 |
| | |
|
| |
|
Non-Current | | | | | |
Work in progress | | 83 | | | 5 |
Land held for resale | | 168 | | | 150 |
| | |
|
| |
|
| | | 251 | | | 155 |
| | |
|
| |
|
| | |
Audited Consolidated Financial Statements 2003-04 - Government of Queensland | | 5-29 |
Notes to the Financial Statements
| 17. | Property, Plant and Equipment |
| | | | | | | | | | | | | | | | | | |
| | | Cost
| | Valuation
| | Accumulated Depreciation
| | | Written Down Value
|
| | | 2004
| | 2003
| | 2004
| | 2003
| | 2004
| | | 2003
| | | 2004
| | 2003
|
| | | $M | | $M | | $M | | $M | | $M | | | $M | | | $M | | $M |
Land | | 44 | | 98 | | 21,509 | | 15,986 | | — | | | — | | | 21,553 | | 16,084 |
Buildings | | 80 | | 317 | | 22,432 | | 20,181 | | (6,751 | ) | | (5,539 | ) | | 15,761 | | 14,959 |
Infrastructure | | 5,532 | | 3,902 | | 51,904 | | 48,681 | | (18,184 | ) | | (16,723 | ) | | 39,252 | | 35,860 |
Plant and equipment | | 6,042 | | 6,755 | | 969 | | 1,923 | | (3,028 | ) | | (3,118 | ) | | 3,983 | | 5,560 |
Leased plant and equipment | | 1,803 | | 2,040 | | 2,435 | | 2,204 | | (1,539 | ) | | (1,421 | ) | | 2,699 | | 2,823 |
Heritage and cultural assets | | 15 | | 15 | | 889 | | 866 | | (307 | ) | | (304 | ) | | 597 | | 577 |
Capital works in progress | | 2,782 | | 2,027 | | — | | — | | — | | | — | | | 2,782 | | 2,027 |
| | |
| |
| |
| |
| |
|
| |
|
| |
| |
|
| | | 16,298 | | 15,154 | | 100,138 | | 89,841 | | (29,809 | ) | | (27,105 | ) | | 86,627 | | 77,890 |
| | |
| |
| |
| |
| |
|
| |
|
| |
| |
|
Reconciliations
Reconciliations of the carrying amount for each class of property, plant and equipment are set out below:
| | | | | | | | | | | | | | | | | | | | | | | | |
| | | Land
| | | Buildings
| | | Infrastructure
| | | Plant and Equipment
| |
| | | 2004
| | | 2003
| | | 2004
| | | 2003
| | | 2004
| | | 2003
| | | 2004
| | | 2003
| |
| | | $M | | | $M | | | $M | | | $M | | | $M | | | $M | | | $M | | | $M | |
Carrying amount at beginning of year | | 16,084 | | | 13,062 | | | 14,959 | | | 13,721 | | | 35,860 | | | 30,283 | | | 5,560 | | | 4,690 | |
Additions | | 86 | | | 107 | | | 221 | | | 208 | | | 982 | | | 1,024 | | | 654 | | | 1,396 | |
Disposals | | (184 | ) | | (149 | ) | | (86 | ) | | (148 | ) | | (446 | ) | | (126 | ) | | (270 | ) | | (200 | ) |
Revaluations | | 5,420 | | | 3,091 | | | 916 | | | 1,288 | | | 1,750 | | | 4,354 | | | 14 | | | (14 | ) |
Recoverable write-downs | | (1 | ) | | — | | | — | | | — | | | — | | | — | | | (12 | ) | | (22 | ) |
Depreciation and amortisation | | — | | | — | | | (505 | ) | | (514 | ) | | (1,357 | ) | | (1,233 | ) | | (591 | ) | | (654 | ) |
Net asset transfers | | 148 | | | (27 | ) | | 256 | | | 404 | | | 2,463 | | | 1,558 | | | (1,372 | ) | | 364 | |
| | |
|
| |
|
| |
|
| |
|
| |
|
| |
|
| |
|
| |
|
|
Carrying amount at end of year | | 21,553 | | | 16,084 | | | 15,761 | | | 14,959 | | | 39,252 | | | 35,860 | | | 3,983 | | | 5,560 | |
| | |
|
| |
|
| |
|
| |
|
| |
|
| |
|
| |
|
| |
|
|
| | |
Audited Consolidated Financial Statements 2003-04 - Government of Queensland | | 5-30 |
Notes to the Financial Statements
| 17. | Property, Plant and Equipment continued |
| | | | | | | | | | | | | | | | | | | | | | | | |
| | | Leased Plant and
Equipment
| | | Heritage and Cultural
Assets *
| | | Capital Works in
Progress
| | | Total
| |
| | | 2004
| | | 2003
| | | 2004
| | | 2003
| | | 2004
| | | 2003
| | | 2004
| | | 2003
| |
| | | $M | | | $M | | | $M | | | $M | | | $M | | | $M | | | $M | | | $M | |
Carrying amount at beginning of year | | 2,823 | | | 2,949 | | | 577 | | | 568 | | | 2,027 | | | 3,066 | | | 77,890 | | | 68,339 | |
Additions | | — | | | 1 | | | 4 | | | 2 | | | 2,263 | | | 1,607 | | | 4,210 | | | 4,345 | |
Disposals | | (1 | ) | | (13 | ) | | — | | | — | | | (2 | ) | | (321 | ) | | (989 | ) | | (957 | ) |
Revaluations | | 3 | | | — | | | 20 | | | 15 | | | — | | | — | | | 8,123 | | | 8,734 | |
Recoverable write-downs | | — | | | (1 | ) | | — | | | — | | | — | | | — | | | (13 | ) | | (23 | ) |
Depreciation and amortisation | | (140 | ) | | (146 | ) | | (1 | ) | | (1 | ) | | — | | | — | | | (2,594 | ) | | (2,548 | ) |
Net asset transfers | | 14 | | | 33 | | | (3 | ) | | (7 | ) | | (1,506 | ) | | (2,325 | ) | | — | | | — | |
| | |
|
| |
|
| |
|
| |
|
| |
|
| |
|
| |
|
| |
|
|
Carrying amount at end of year | | 2,699 | | | 2,823 | | | 597 | | | 577 | | | 2,782 | | | 2,027 | | | 86,627 | | | 77,890 | |
| | |
|
| |
|
| |
|
| |
|
| |
|
| |
|
| |
|
| |
|
|
| * | Heritage and cultural assets includes $178 million (2003, $172 million) relating to assets held by the Queensland Museum. This collection has not been subject to a regular stocktake by management at the Queensland Museum. Accordingly, the Auditor General provided a qualified opinion on Queensland Museum’s financial statements. The Auditor General was unable to express an opinion on the reported value of the collections disclosed in the financial statements. |
Property, Plant and Equipment Subject to Operating Leases
Of the property, plant and equipment listed above the following are subject to operating leases, which also include relevant licences and permits. Revenue from leased assets is disclosed in the Consolidated Statement of Financial Performance in ‘Other’ revenue on the basis set out in Note 1.
| | | | | | | | | |
| | | Cost or
Valuation | | Accumulated
Depreciation | | | Written
Down Value
|
| | | 2004
| | 2004
| | | 2004
| | 2003
|
| | | $M | | $M | | | $M | | $M |
Land | | 292 | | — | | | 292 | | 207 |
Buildings | | 198 | | (43 | ) | | 155 | | 148 |
Plant and equipment | | 50 | | (14 | ) | | 36 | | 18 |
| | |
| |
|
| |
| |
|
| | | 540 | | (57 | ) | | 483 | | 373 |
| | |
| |
|
| |
| |
|
| | |
Audited Consolidated Financial Statements 2003-04 - Government of Queensland | | 5-31 |
Notes to the Financial Statements
| | | | | | | | | | | | | | | | | | |
| | | Cost
| | Valuation
| | Accumulated
Depreciation
| | | Written Down Value
|
| | | 2004
| | 2003
| | 2004
| | 2003
| | 2004
| | | 2003
| | | 2004
| | 2003
|
| | | $M | | $M | | $M | | $M | | $M | | | $M | | | $M | | $M |
Software development | | 993 | | 824 | | 21 | | 21 | | (465 | ) | | (372 | ) | | 549 | | 473 |
Other | | 128 | | 139 | | 152 | | 151 | | (109 | ) | | (93 | ) | | 171 | | 197 |
| | |
| |
| |
| |
| |
|
| |
|
| |
| |
|
| | | 1,121 | | 963 | | 173 | | 172 | | (574 | ) | | (465 | ) | | 720 | | 670 |
| | |
| |
| |
| |
| |
|
| |
|
| |
| |
|
| | |
Audited Consolidated Financial Statements 2003-04 - Government of Queensland | | 5-32 |
Notes to the Financial Statements
| | | | | |
| | | 2004
| | | 2003
|
| | | $M | | | $M |
19. Other Assets | | | | | |
| | |
Current | | | | | |
Prepayments | | 213 | | | 193 |
Other | | 220 | | | 272 |
| | |
|
| |
|
| | | 433 | | | 465 |
| | |
|
| |
|
Non-Current | | | | | |
Self-generating and regenerating assets: | | | | | |
Plantation growing timber | | 1,163 | | | 1,245 |
Prepayments | | 27 | | | 29 |
Other | | 37 | | | 11 |
| | |
|
| |
|
| | | 1,227 | | | 1,285 |
| | |
|
| |
|
| | |
20. Restricted Assets | | | | | |
|
A number of assets included in the consolidated financial statements are classified as restricted assets because their use is wholly or partially restricted by externally imposed requirements. These assets include: |
| | |
Grants and donations to further medical research in specified areas | | 25 | | | 24 |
Cash and property, plant and equipment to be used for specific purposes | | 40 | | | 36 |
Intra regional settlements residue held pursuant to national electricity markets arrangements | | 110 | | | 104 |
| | |
|
| |
|
| | | 175 | | | 164 |
| | |
|
| |
|
| | |
21. Payables | | | | | |
| | |
Current | | | | | |
Trade creditors | | 1,634 | | | 1,229 |
Employee benefits | | 788 | | | 701 |
Grants and other contributions | | 58 | | | 57 |
Cross border lease deferred income | | 154 | | | 160 |
Interest | | 4 | | | 1 |
GST payable | | 131 | | | 106 |
Other | | 179 | | | 200 |
| | |
|
| |
|
| | | 2,948 | | | 2,454 |
| | |
|
| |
|
Non-Current | | | | | |
Other | | 315 | | | 246 |
| | |
|
| |
|
| | | 315 | | | 246 |
| | |
|
| |
|
| | |
22. Interest-Bearing Liabilities | | | | | |
| | |
Current | | | | | |
Deposits, loans and advances | | 2,178 | | | 1,776 |
State/Commonwealth debt | | 82 | | | 196 |
Treasury notes | | 30 | | | 1,042 |
Floating rate notes | | 101 | | | 505 |
Bonds and promissory notes | | 5,027 | | | 1,230 |
Derivatives | | (32 | ) | | 231 |
Finance leases (refer Note 31) | | 1 | | | 1 |
Other | | 4 | | | 17 |
| | |
|
| |
|
| | | 7,391 | | | 4,998 |
| | |
|
| |
|
| | |
Audited Consolidated Financial Statements 2003-04 - Government of Queensland | | 5-33 |
Notes to the Financial Statements
| | | | | |
22. Interest-Bearing Liabilities continued | | | | | |
| | | 2004
| | 2003
| |
| | | $M | | $M | |
Non-Current | | | | | |
Deposits, loans and advances | | 55 | | 67 | |
State/Commonwealth Debt | | 487 | | 500 | |
Securities - Domestic and Overseas | | 16,486 | | 19,197 | |
Derivatives | | 16 | | (174 | ) |
Finance leases (refer Note 31) | | 107 | | 107 | |
Other loans | | 45 | | 29 | |
| | |
| |
|
|
| | | 17,196 | | 19,726 | |
| | |
| |
|
|
| | |
23. Provisions | | | | | |
| | |
Current | | | | | |
Employee benefits (refer Note 37): | | | | | |
Annual leave | | 802 | | 760 | |
Superannuation | | 171 | | 533 | |
Judges’ pensions | | 8 | | 6 | |
Long service leave | | 218 | | 194 | |
Other benefits | | 60 | | 85 | |
Outstanding claims: | | | | | |
HIH/FAI | | 53 | | 73 | |
Workers’ compensation | | 538 | | 435 | |
Other | | 127 | | 124 | |
Onerous contracts - PPAs (refer Note 1(k))* | | 21 | | 31 | |
Onerous contracts - AMO (refer Note 1(k)) | | 21 | | 41 | |
Queensland Government Insurance Fund | | 56 | | 57 | |
Other | | 75 | | 60 | |
| | |
| |
|
|
| | | 2,150 | | 2,399 | |
| | |
| |
|
|
Non-Current | | | | | |
Employee benefits (refer Note 37): | | | | | |
Superannuation | | 11,495 | | 10,997 | |
Judges’ pensions | | 256 | | 234 | |
Long service leave | | 1,577 | | 1,412 | |
Other benefits | | 127 | | 120 | |
Outstanding claims | | | | | |
HIH/FAI | | 90 | | 143 | |
Workers’ compensation | | 1,159 | | 1,231 | |
Other | | 223 | | 217 | |
Onerous contracts - PPAs (refer Note 1(k))* | | 304 | | 364 | |
Onerous contracts - AMO (refer Note 1(k)) | | — | | 20 | |
Queensland Government Insurance Fund | | 336 | | 366 | |
Other | | 92 | | 55 | |
| | |
| |
|
|
| | | 15,659 | | 15,159 | |
| | |
| |
|
|
The liability for outstanding claims is measured as the present value of expected future payments, the majority of which are actuarially assessed. The liability for workers’ compensation includes a 15% prudential margin.
The Queensland Government Insurance Fund (QGIF) is a centrally managed self-insurance scheme mainly covering property and medical and other liability claims for whole-of-Government. An actuarial assessment of the scheme was undertaken as at 30 June 2004.
| * | The uncertainty associated with the estimation of the level of future wholesale electricity prices is detailed in Note 1 (k) and this was also highlighted by the Auditor-General as an emphasis of matter in the independent audit report relating to Queensland Power Trading Corporation’s financial statements. |
| | |
Audited Consolidated Financial Statements 2003-04 - Government of Queensland | | 5-34 |
Notes to the Financial Statements
Movements in Provisions (excluding employee benefits):
| | | | | | | | | | | | | | | |
| | | Onerous
Contracts
| | | Outstanding
Claims
| | | QGIF
| | | Other
Provisions
| | | Total
| |
| | | $M | | | $M | | | $M | | | $M | | | $M | |
Carrying amount at beginning of year | | 456 | | | 2,223 | | | 423 | | | 115 | | | 3,217 | |
Additional provisions recognised | | — | | | 39 | | | 82 | | | 59 | | | 180 | |
Reductions in provisions and payments | | (40 | ) | | (72 | ) | | (23 | ) | | (14 | ) | | (149 | ) |
Change from remeasurement | | (70 | ) | | — | | | (90 | ) | | 7 | | | (153 | ) |
| | |
|
| |
|
| |
|
| |
|
| |
|
|
Carrying amount at end of year | | 346 | | | 2,190 | | | 392 | | | 167 | | | 3,095 | |
| | |
|
| |
|
| |
|
| |
|
| |
|
|
| | | | | |
| | | | | | | | | | | | 2004
| | | 2003
| |
| | | | | | | | | | | | $M | | | $M | |
24. Other Liabilities | | | | | | | | | | | | | | | |
| | | | | |
Current | | | | | | | | | | | | | | | |
Unearned revenue | | | | | | | | | | | 344 | | | 322 | |
Other | | | | | | | | | | | 57 | | | 78 | |
| | | | | | | | | | | |
|
| |
|
|
| | | | | | | | | | | | 401 | | | 400 | |
| | | | | | | | | | | |
|
| |
|
|
Non-Current | | | | | | | | | | | | | | | |
Unearned revenue | | | | | | | | | | | 171 | | | 183 | |
Other | | | | | | | | | | | 50 | | | 7 | |
| | | | | | | | | | | |
|
| |
|
|
| | | | | | | | | | | | 221 | | | 190 | |
| | | | | | | | | | | |
|
| |
|
|
| | |
Audited Consolidated Financial Statements 2003-04 - Government of Queensland | | 5-35 |
Notes to the Financial Statements
| 25. | Reconciliation of Changes in Net Assets (Equity) |
| | | | | | | | | | | | | | | | | | | | | | | |
| | | Accumulated | | | Asset Revaluation | | | Other | | | |
| | | Surplus
| | | Reserve
| | | Reserves
| | Total
| |
| | | 2004
| | | 2003
| | | 2004
| | | 2003
| | | 2004
| | | 2003
| | 2004
| | | 2003
| |
| | | $M | | | $M | | | $M | | | $M | | | $M | | | $M | | $M | | | $M | |
Balance at the beginning of the financial year | | 40,844 | | | 42,773 | | | 23,321 | | | 14,812 | | | 729 | | | 508 | | 64,894 | | | 58,093 | |
Net assets of entities not previously consolidated | | 13 | | | 1 | | | (13 | ) | | — | | | | | | — | | — | | | 1 | |
Net assets of entities no longer consolidated | | (65 | ) | | — | | | 38 | | | — | | | (1 | ) | | — | | (28 | ) | | — | |
Adjustment on initial application of | | | | | | | | | | | | | | | | | | | | | | | |
accounting standards | | 87 | | | (526 | ) | | — | | | — | | | — | | | — | | 87 | | | (526 | ) |
Operating surplus/(deficit) | | 4,654 | | | (1,290 | ) | | — | | | — | | | — | | | — | | 4,654 | | | (1,290 | ) |
Revaluation of non-current assets* | | — | | | — | | | 8,126 | | | 8,616 | | | — | | | — | | 8,126 | | | 8,616 | |
Transfer to/(from) reserves | | (64 | ) | | (114 | ) | | (71 | ) | | (107 | ) | | 135 | | | 221 | | — | | | — | |
Other movements | | (10 | ) | | — | | | — | | | — | | | — | | | — | | (10 | ) | | — | |
| | |
|
| |
|
| |
|
| |
|
| |
|
| |
| |
|
| |
|
|
Balance at the End of the Financial Year | | 45,459 | | | 40,844 | | | 31,401 | | | 23,321 | | | 863 | | | 729 | | 77,723 | | | 64,894 | |
| | |
|
| |
|
| |
|
| |
|
| |
|
| |
| |
|
| |
|
|
| * | The revaluation of non-current assets includes Housing $2,468 million (2003, $1,424 million), Natural Resources $1,603 million (2003, $1,684 million), Education $1,391 million (2003, $559 million), Main Roads $1,313 million (2003, $3,266 million), Port of Brisbane Authority $307 million (2003, $33M), Environmental Protection Agency $149 million (2003, $794 million), Employment and Training $110 million (2003, $21 million), Health $47 million (2003, $160 million) and the electricity sector $143 million (2003, $140 million). |
| | |
Audited Consolidated Financial Statements 2003-04 - Government of Queensland | | 5-36 |
Notes to the Financial Statements
| | | | | | |
| | | 2004
| | | 2003
| |
| | | $M | | | $M | |
26. Cash Flows | | | | | | |
| | |
(a) Reconciliation of Net Surplus/(Deficit) to Net Cash Flows from Operating Activities | | | | | | |
Net Surplus/(Deficit) | | 4,654 | | | (1,290 | ) |
Non-Cash Movements: | | | | | | |
Depreciation and amortisation | | 2,714 | | | 2,646 | |
Net (gain)/loss on disposal/revaluation of non-current assets | | (2 | ) | | 757 | |
Bad debt provision | | 23 | | | 30 | |
Equity accounting loss | | 5 | | | 18 | |
Unrealised net (gain)/loss on borrowings | | (1,233 | ) | | 226 | |
Other | | 2 | | | (4 | ) |
(Increase)/decrease in receivables | | (418 | ) | | 25 | |
(Increase)/decrease in inventories | | 28 | | | (60 | ) |
(Increase)/decrease in prepayment and other assets | | 31 | | | (360 | ) |
Increase in creditors | | 553 | | | 202 | |
Increase in provisions | | 250 | | | 1,824 | |
Increase/(decrease) in other liabilities | | 32 | | | (67 | ) |
| | |
|
| |
|
|
Total Non-Cash Movements | | 1,985 | | | 5,237 | |
| | |
|
| |
|
|
Cash Flows from Operating Activities | | 6,639 | | | 3,947 | |
| | |
|
| |
|
|
Being: Cash flows of non-financial institutions as per: | | | | | | |
Consolidated Statement of Cash Flows | | 7,102 | | | 3,451 | |
Dividends from Public Financial Corporations | | (40 | ) | | (10 | ) |
Interest capitalised | | (18 | ) | | (20 | ) |
Cash flows of Public Financial Corporations Refer Note 26(b) | | (405 | ) | | 526 | |
| | |
|
| |
|
|
| | | 6,639 | | | 3,947 | |
| | |
|
| |
|
|
| | |
(b) Cash Flows from Public Financial Corporations | | | | | | |
Cash Flows from Operating Activities | | | | | | |
Sale of goods and services | | 896 | | | 764 | |
Interest received | | 1,062 | | | 2,239 | |
Other receipts | | 14 | | | 8 | |
Employee expenses | | (110 | ) | | (106 | ) |
Supplies and services | | (101 | ) | | (25 | ) |
Grants and subsidies paid | | — | | | (22 | ) |
Borrowing costs paid | | (1,495 | ) | | (1,651 | ) |
Other payments | | (671 | ) | | (681 | ) |
| | |
|
| |
|
|
Net Cash from Operating Activities | | (405 | ) | | 526 | |
| | |
|
| |
|
|
Cash Flows from Investing Activities | | | | | | |
Proceeds from sale of investments | | 32,999 | | | 35,904 | |
Purchase of property, plant and equipment | | (38 | ) | | (49 | ) |
Purchase of investments | | (33,244 | ) | | (36,524 | ) |
| | |
|
| |
|
|
Net Cash from Investing Activities | | (283 | ) | | (669 | ) |
| | |
|
| |
|
|
Cash Flows from Financing Activities | | | | | | |
Proceeds from issue of Government securities | | 46,309 | | | 31,810 | |
Redemption of Government securities | | (45,571 | ) | | (31,655 | ) |
Dividends paid | | (40 | ) | | (10 | ) |
| | |
|
| |
|
|
Net Cash from Financing Activities | | 698 | | | 145 | |
| | |
|
| |
|
|
Net Cash Flows from Public Financial Corporations | | 10 | | | 2 | |
| | |
|
| |
|
|
| | |
Audited Consolidated Financial Statements 2003-04 - Government of Queensland | | 5-37 |
Notes to the Financial Statements
| (c) | Cash Flows Presented on a Net Basis |
Cash flows arising from the following activities are presented on a net basis in the Statement of Cash Flows:
| | • | loan advances to and redemptions from borrowing authorities; |
| | • | receipt and withdrawal of client deposits; and |
| | • | money market and other deposits. |
| 27. | Investments Accounted for using the Equity Method |
Investments in the following unlisted associated and joint venture entities are recognised at amounts in excess of $1 million in the accounts of the relevant public sector entity:
| | | | | | | | | | |
Name of Entity
| | Principal Activity
| | Ownership
Interest
| | Equity Accounted
Amount
|
| | | | | 2004
| | 2003
| | 2004
| | 2003
|
| | | | | % | | % | | $M | | $M |
Dumaresq-Barwon Border Rivers Commission | | Water management(i) | | 50 | | 50 | | 29 | | 28 |
Ceramic Fuel Cells Pty Ltd | | Development fuel cell technology(ii) | | 34 | | 27 | | 12 | | 15 |
ElectraNet Pty Ltd | | Electricity transmission services(iii) | | 41 | | 40 | | 48 | | 39 |
QInvest Limited | | Dealer in securities and financial planning advice(iv) | | 50 | | 50 | | 2 | | 2 |
Little Stanley Street Retail Joint Venture | | Retail component of the Little Stanley Street development(v) | | 65 | | 65 | | 5 | | — |
| | | | | | | | |
| |
|
| | | | | | | | | 96 | | 84 |
| | | | | | | | |
| |
|
| (i) | Dumaresq-Barwon Border Rivers Commission is a joint authority constituted by an agreement between the Queensland and New South Wales governments. Each government holds a 50% interest in the joint commission. |
| (ii) | ENERGEX Limited acquired an additional 6.9% interest in Ceramic Fuel Cells Pty Ltd during the year and now holds 33.5% interest in the company. Ceramic Fuel Cells Pty Ltd aims to commercialise fuel cell technology. |
| (iii) | Powerlink Queensland acquired an additional 0.86% interest in ElectraNet Pty Ltd (trading as ElectraNet SA) during the year and now holds 41.11% interest in the company. ElectraNet Pty Ltd provides electricity transmission services in South Australia. |
| (iv) | Queensland Investment Corporation has a 50% interest in QInvest Limited being a licensed dealer in securities, providing financial planning advice and acting as responsible entity for the QInvest Investment Access Fund. |
| (v) | South Bank Corporation has a 65% interest in Little Stanley Street Retail Joint Venture entity, being the retail component of the Little Stanley Street development. This interest was not material in prior periods. |
| | |
Audited Consolidated Financial Statements 2003-04 - Government of Queensland | | 5-38 |
Notes to the Financial Statements
| 27. | Investments Accounted for using the Equity Method continued |
| | | | | | |
| | | 2004
| | | 2003
| |
| | | $ M | | | $ M | |
Movements in Carrying Amount of Equity Accounted Investments: | | | | | | |
Carrying amount at beginning of the financial year | | 84 | | | 78 | |
Share of net profit/(loss) | | (5 | ) | | (18 | ) |
Revaluation of assets | | 6 | | | 28 | |
Increase in holdings | | 11 | | | 2 | |
Disposals/write-downs | | — | | | (4 | ) |
Adjustment against accumulated surplus/(loss) | | — | | | (2 | ) |
| | |
|
| |
|
|
Carrying amount at end of the financial year | | 96 | | | 84 | |
| | |
|
| |
|
|
| | |
Share of Accumulated Surplus/(Loss) and Reserves Attributable to Equity Accounted Investments: | | | | | | |
| | |
Accumulated Surplus/(Loss) | | | | | | |
Balance at beginning of the financial year | | (29 | ) | | (9 | ) |
Share of profit/(loss) accounted for using the equity method | | (5 | ) | | (18 | ) |
Adjustments against accumulated surplus/(loss) | | (2 | ) | | (2 | ) |
| | |
|
| |
|
|
Balance at end of the financial year | | (36 | ) | | (29 | ) |
| | |
|
| |
|
|
| | |
Asset Revaluation Reserve | | | | | | |
Balance at beginning of the financial year | | 83 | | | 55 | |
Share of asset revaluations during the year | | 6 | | | 28 | |
| | |
|
| |
|
|
Balance at end of the financial year | | 89 | | | 83 | |
| | |
|
| |
|
|
| | |
Share of Contingent Liabilities and Commitments of Equity Accounted Investments: | | | | | | |
Obligations and guarantee | | 30 | | | 3 | |
Capital and lease commitments | | 13 | | | 8 | |
| | |
|
| |
|
|
| | | 43 | | | 11 | |
| | |
|
| |
|
|
| 28. | Investments in Entities that are not Controlled or Associated |
Investments held by the Government that are not in respect of controlled or associated entities with a carrying amount greater than $1 million follow:
| | | | | | | | | | |
Name of Entity
| | Principal Activity
| | Ownership Interest
| | Carrying Amount
|
| �� | | 2004
| | 2003
| | 2004
| | 2003 $
|
| | | | | % | | % | | $M | | $M |
Unlisted | | | | | | | | | | |
South East Queensland Water Corporation Pty Ltd | | Bulk water storage | | 20 | | 20 | | 39 | | 39 |
Brisbane Airport Corporation Limited (i) | | Airport management | | — | | 37.6 | | — | | 270 |
BAC Holdings Pty Ltd (i) | | Airport management | | 37.86 | | — | | 361 | | — |
| | | | | | | | |
| |
|
| | | | | | | | | 400 | | 309 |
| | | | | | | | |
| |
|
| | |
Audited Consolidated Financial Statements 2003-04 - Government of Queensland | | 5-39 |
Notes to the Financial Statements
| 28. | Investments in Entities that are not Controlled or Associated continued |
| (i) | Brisbane Airport Corporation Limited (BACL) restructured on 30 June 2004 by establishing a holding company structure above BACL. The ultimate holding company, BAC Holdings Pty Limited (BACH), acquired the shares of BACL by issuing ordinary shares, redeemable preference shares and short term interest free shareholder loans to existing shareholders. This had the effect of revaluing the previous shareholding by $88 million and replacing shareholder loan borrowings with redeemable preference shares. |
The nature of the investment in BACH, including distribution of voting rights, dividend entitlements and board representation, is such that the corporation is neither a subsidiary nor an associate.
| 29. | Interest in Joint Ventures |
Queensland Power Trading Corporation (Enertrade)
Enertrade, as the parent entity, holds 100% (2003, 100%) interest in the Queensland Gas Pipeline Joint Venture whose principal activity is the construction and operation of a gas pipeline between Moranbah and Townsville. The pipeline is still under construction and accordingly, no operating costs have yet been incurred. Included in the Consolidated Statement of Financial Position are a total of $9 million cash, receivables and other current assets as well as $115 million (2003, $5 million) capital works in progress.
Capital commitments relating to the North Queensland Gas Pipeline Joint Venture are disclosed in Note 31.
CS Energy Ltd
Callide Energy Pty Ltd and IG Power (Callide) Ltd each hold a 50% interest in the Callide Power Project Joint Venture whose principal activity is the generation of electricity.
CS Energy Ltd has participating interests in gas development joint ventures with Queensland GAS Company Limited (50%) and Australian CBM Pty Ltd (5%).
The value of the joint venture assets included in the Consolidated Statement of Financial Position at 30 June 2004 was $392 million (2003, $376 million).
Department of Housing
The Department of Housing has a joint venture operation with Queensland University of Technology to develop the Kelvin Grove Urban Village. Each party to the joint venture owns and develops its own land but contributes to the cost of shared infrastructure and other project common works.
The land and development costs included in the Consolidated Statement of Financial Position at 30 June 2004 is $35 million (2003, $20 million).
QR
QR has interests in a number of joint ventures for transport related works. Further details of these ventures are set out in the annual report of QR.
The Council of the Queensland Institute of Medical Research (QIMR)
QIMR has contractual arrangements with a number of incorporated and unincorporated joint ventures. Details of the joint venture partners can be obtained from the annual report of QIMR.
| | |
Audited Consolidated Financial Statements 2003-04 - Government of Queensland | | 5-40 |
Notes to the Financial Statements
| 29. | Interest in Joint Ventures continued |
Tarong Energy Corporation Limited
Tarong Energy Corporation Limited holds a 19% (2003, 19%) interest in the Private Forestry Plantation Joint Venture. The principal activity is the commercial production of timber from plantations.
On 6 August 2003, TN Power Pty Ltd and TM Energy (Australia) Pty Ltd each acquired a 50% interest in the TN Power unincorporated Joint Venture whose principle activity is the generation of electricity.
The value of the joint venture assets included in the Consolidated Statement of Financial Position at 30 June 2004 was $300 million (2003, $1 million).
South Bank Corporation
South Bank Corporation has a 65% interest in the Little Stanley Street Retail Joint Venture entity. Refer to Note 27 for further details.
Other
Joint ventures that contribute less than $2 million in net assets and/or net revenues to the Consolidated Statements of Financial Position or Performance include:
| | • | The Department of Primary Industries and Fisheries has various joint ventures relating to forestry and seed plantations. |
| | • | The Department of Natural Resources, Mines and Energy is a party to a spatial mapping venture composed of the public sector mapping agencies of the Commonwealth, states and territories. |
| | • | The Department of Health has a 50% interest in a joint venture operation with the University of Queensland for the operation of a magnetic resonance imaging facility. |
| | • | The Department of Main Roads (RoadTek) has approximately 20% interest in the Golding-RoadTek Joint Venture. The purpose of the venture operation is the construction of bridgeworks and roadworks for the Gladstone Port Access Road Project. |
| 30. | Public Private Partnerships |
Queensland Health
Queensland Health has entered into a number of contractual arrangements with private sector entities for the construction and operation of public infrastructure facilities for a period of time on departmental land. After an agreed period of between 15 and 25 years, title to these facilities will pass to Queensland Health. Arrangements in operation as at 30 June 2004 are:
| | • | Butterfield Street car park (commenced January 1998); |
| | • | Bramston Terrace car park (commenced November 1998); |
| | • | Central Energy facility (commenced February 1999); |
| | • | Noosa Hospital and Specialist Centre (commenced September 1999); |
| | • | The Prince Charles Hospital car park (commenced November 2000); and |
| | • | Townsville Hospital Support Facilities Building and Walkway (commenced April 2002). |
To date, no rights or obligations relating to these facilities have been recognised by Queensland Health, other than those associated with land rental and the provision of various services under the agreements.
| | |
Audited Consolidated Financial Statements 2003-04 - Government of Queensland | | 5-41 |
Notes to the Financial Statements
| 30. | Public Private Partnerships continued |
Queensland Health also has entered into a number of contractual arrangements (termed collocation agreements) with private sector entities for the construction and operation of private health facilities for a period of time on departmental land. After an agreed period of 25 years, title to the facilities will pass to Queensland Health. The department does not control the facilities associated with these arrangements and accordingly, the facilities are not recognised as assets.
Collocation arrangements in operation as at 30 June 2004 are:
| | • | Caboolture Private Hospital (commenced September 1997); |
| | • | Logan Private Hospital (commenced February 1998); |
| | • | Redlands Private Hospital (commenced August 1999); and |
| | • | Holy Spirit Northside Private Hospital (commenced July 2001). |
Department of Transport
The Brisbane Airport Rail Link (BARL) is a public rail transport system developed by Airtrain Citylink Limited (Airtrain) to link Brisbane Airport to the existing QR network.
In 1998, the State Government entered into an agreement with Airtrain whereby Airtrain was required to acquire the land required for the BARL, and design, construct, maintain and operate the BARL for a concession period of 35 years. At the end of this period, the agreement provides for Airtrain to transfer the BARL to the Government at no cost to the State.
Further information may be obtained from the individual financial reports of the relevant agencies.
| 31. | Expenditure Commitments |
Other than obligations under finance leases, where substantially all the risks and benefits incidental to ownership of the leased assets are transferred to the lessee, the following commitments have not been recognised as liabilities in the Consolidated Statement of Financial Position.
As at 30 June 2004, State Government entities had entered into the following capital and non-capital expenditure commitments, lease commitments and grant and subsidy commitments with non-public sector entities:
| | | | |
| | | 2004
| | 2003
|
| | | $M | | $M |
Capital Expenditure Commitments | | | | |
Not later than 1 year | | 1,593 | | 1,126 |
Later than 1 year but not later than 5 years | | 1,519 | | 448 |
Later than 5 years | | 21 | | 176 |
| | |
| |
|
| | | 3,133 | | 1,750 |
| | |
| |
|
| | |
Audited Consolidated Financial Statements 2003-04 - Government of Queensland | | 5-42 |
Notes to the Financial Statements
| 31. | Expenditure Commitments continued |
| | | | | | |
| | | 2004
| | | 2003
| |
| | | $M | | | $M | |
Non-Capital Expenditure Commitments | | | | | | |
| | |
Power Purchase Agreements (PPAs) | | | | | | |
Not later than 1 year | | 194 | | | 189 | |
Later than 1 year but not later than 5 years | | 870 | | | 915 | |
Later than 5 years | | 2,184 | | | 2,512 | |
| | |
|
| |
|
|
| | | 3,248 | | | 3,616 | |
| | |
|
| |
|
|
Queensland Power Trading Corporation’s commitments include ‘take or pay’ and minimum take commitments as well as an estimate of the impact of escalation over the remaining terms of the commitment. | |
| | |
Other Agreements | | | | | | |
| | |
Not later than 1 year | | 546 | | | 468 | |
Later than 1 year but not later than 5 years | | 1,396 | | | 468 | |
Later than 5 years | | 1,533 | | | 323 | |
| | |
|
| |
|
|
| | | 3,475 | * | | 1,259 | |
| | |
|
| |
|
|
* includes commitments for the TransLink initiative totalling $2,583 million. | | | | | | |
| | |
Operating Lease Commitments | | | | | | |
Not later than 1 year | | 164 | | | 185 | |
Later than 1 year but not later than 5 years | | 300 | | | 360 | |
Later than 5 years | | 128 | | | 131 | |
| | |
|
| |
|
|
| | | 592 | | | 676 | |
| | |
|
| |
|
|
Finance Lease Commitments | | | | | | |
| | |
Not later than 1 year | | 7 | | | 7 | |
Later than 1 year but not later than 5 years | | 24 | | | 22 | |
Later than 5 years | | 150 | | | 153 | |
| | |
|
| |
|
|
Total minimum lease payments | | 181 | | | 182 | |
Future finance charges | | (73 | ) | | (74 | ) |
| | |
|
| |
|
|
Total lease liabilities | | 108 | | | 108 | |
| | |
|
| |
|
|
Current lease liabilities (refer Note 22) | | 1 | | | 1 | |
Non-current lease liabilities (refer Note 22) | | 107 | | | 107 | |
| | |
|
| |
|
|
| | | 108 | | | 108 | |
| | |
|
| |
|
|
Grant and Subsidy Commitments | | | | | | |
| | |
Not later than 1 year | | 1,003 | | | 879 | |
Later than 1 year but not later than 5 years | | 433 | | | 511 | |
Later than 5 years | | 13 | | | 26 | |
| | |
|
| |
|
|
| | | 1,449 | | | 1,416 | |
| | |
|
| |
|
|
| | |
Audited Consolidated Fianancial Statements 2003-04 - Government of Queensland | | 5-43 |
Notes to the Financial Statements
| 32. | Cash and Other Assets Held in Trust |
| | | | |
| | | 2004
| | 2003
|
| | | $M | | $M |
Various monies were held in trust by State Government agencies at 30 June 2004 and are not included as assets/liabilities in the Consolidated Statement of Financial Position. A summary follows of entities holding assets in trust: | | | | |
| | |
Queensland Investment Corporation | | 15,828 | | 12,606 |
Public Trustee | | 1,341 | | 1,139 |
Treasury Department | | 17 | | 17 |
Other | | 105 | | 77 |
| | |
| |
|
| | | 17,291 | | 13,839 |
| | |
| |
|
| 33. | Contingent Assets and Liabilities |
Contingent assets and liabilities represent items that are not recognised in the Consolidated Statement of Financial Position because at balance date it is not probable the Government would receive or sacrifice future economic benefits in respect of these items. Below are details of the more significant contingent assets and liabilities from a whole-of-Government perspective. Reference should be made to individual agency financial reports for additional information.
Contingent Liabilities – Quantifiable
| | | | |
| | | 2004
| | 2003
|
| | | $ M | | $ M |
Nature of Contingency | | | | |
Guarantees and indemnities | | 5,468 | | 5,938 |
QTC – stock loans | | 1,243 | | 641 |
Other | | 28 | | 41 |
| | |
| |
|
| | | 6,739 | | 6,620 |
| | |
| |
|
Guarantees
These mainly comprise guarantees by the State including in respect of borrowings by local governments from the Queensland Treasury Corporation of $2,699 million (2003, $2,867 million) and in respect of insurance policies issued by Suncorp Life and Suncorp-Metway Limited of $2,162 million (2003, $2,292 million). Guarantees of $321 million (2003, $399 million) were also provided by the Queensland Treasury Corporation relating to the trading activities in the national electricity market of subsidiaries of Ergon Energy Corporation Limited, ENERGEX Limited and Enertrade, which are Queensland Government-owned corporations.
Queensland Treasury Corporation (QTC) - Stock Loans
In support of an active trading and pricing market for QTC stock, the Corporation lends stock to various financial institutions on the basis that such loans form part of QTC’s total exposure to the institution concerned.
The Corporation’s stock lending policy ensures that all such transactions are covered by appropriate credit arrangements such as credit limits, cash securities or lodgement of collateral securities. In the event that the financial institutions holding QTC stock default on their repayment obligations, QTC would be required to enter the market and borrow further amounts to cover the default. The risk of this eventuality is considered to be low.
| | |
Audited Consolidated Financial Statements 2003-04 - Government of Queensland | | 5-44 |
Notes to the Financial Statements
| 33. | Contingent Assets and Liabilities continued |
Other
As at 30 June 2004, there are 42 cases filed with the courts relating to revenue collected by the Office of State Revenue. An estimate of the liability should the outcomes of the above mentioned cases prove unfavourable for the State is $18 million (2003, $29 million).
Thiess Pty Ltd has submitted four claims in respect of payments under a contract to design and construct the Capricornia Correctional Centre. These claims amount to approximately $10 million (2003, $10 million).
Contingent Liabilities - Not Quantifiable
Legal Proceedings and Disputes
A number of legal actions have been brought against the State Government and its agencies. Notification also has been received of a number of other cases that are not yet subject to Court action but which may result in subsequent litigation.
Due to the wide variety and nature of the claims and the uncertainty of any potential liability, no value has been attributed to these actions/claims.
Native Title
A number of native title claims that affect the Queensland Government have been filed with the National Native Title Tribunal under the Native Title Act 1993 (Commonwealth). The Native Title Act provides for payment of compensation to native titleholders for a variety of acts that may affect native title.
It is possible that the Government may face future litigation and liability in respect of these and other claims. However, given the subjectivity of the issue, it is inappropriate to attempt to determine the likely success of such claims or to quantify any potential liability.
Securities, Warranties and Guarantees
The State has provided a number of securities, warranties and guarantees in the normal course of business. The amount of any future claims against these securities, warranties and guarantees cannot be reliably estimated.
WorkCover
The WorkCover Queensland Act 1996 provides that the State Government guarantees every WorkCover policy or other insurance contract with WorkCover Queensland, a statutory body. Given the nature of this contingency, it is not possible to estimate the liability, if any, due under this heading.
Queensland Investment Corporation
The Queensland Investment Corporation, in its capacity as trustee is potentially liable for the unsettled liabilities of a number of trusts that it administers. However, under the respective trust deeds the Corporation is entitled to be indemnified out of the assets of the trusts for any losses or outgoings that may be sustained in its role as trustee.
The directors have assessed the recoverable amounts of the assets of the trusts and concluded that currently they have excess assets over liabilities.
| | |
Audited Consolidated Financial Statements 2003-04 - Government of Queensland | | 5-45 |
Notes to the Financial Statements
| 33. | Contingent Assets and Liabilities continued |
Cross Border Lease Transactions
The Queensland Treasury Corporation has assumed responsibility for a significant portion of the transaction risk relating to a number of cross border lease transactions and in certain situations could be liable to make additional payments under the transactions. However, external advice and history to date indicate that there is remote likelihood of these events occurring.
In addition, the Corporation has provided certain guarantees and indemnities to various participants in the cross border lease transactions. Unless exceptional and extreme circumstances arise, it is unlikely that the Corporation will be required to make a significant payment under these guarantees and indemnities.
Tarong North Power Station
The Queensland Treasury Corporation has provided a guarantee of certain payment obligations and an irrevocable put option for an additional 50% of the power station exercisable by the option holder under certain circumstances to support the 50% sale of Tarong North Power Station by the Tarong Electricity Corporation Limited.
‘Take or Pay’ Agreements
In order to ensure a reliable source of natural gas supply for current and future customers, ENERGEX Retail Pty Ltd has long term supply agreements with producers containing ‘take or pay’ conditions.
Contaminated Land
The State Government controls certain areas of land that are affected by pollutants. The agencies involved will be obliged to restore these assets to a safe and useable condition in the event that their use changes, for example, when the land is sold. Given its nature, it is not possible to provide an estimate of the potential liability of this exposure.
Financial Assurance Liability Gap for Mining Projects
Financial assurances are required when mining projects are undertaken to cover the rehabilitation liability should a mining leaseholder fail to undertake rehabilitation, or for remediation of disturbed land or to secure compliance with the licence. The current financial assurance system provides for a discount based on past environmental performance. This has resulted in a gap in the financial assurances held by the State and the potential liability should a miner default.
The contingent liability would only be recognised as an actual liability in the event that the miner defaults on the conditions of the licence and the State holds insufficient financial assurance to cover the rehabilitation that the State considers necessary. Since January 2001, it has not been necessary to call upon the financial assurances held to undertake rehabilitation. It is therefore not considered practical to estimate the potential financial effect of these contingent liabilities.
In the event of default it is likely the Government would attempt to pursue legal action to obtain a Court Order requiring miners, companies and/or directors to carry out rehabilitation as required under the provisions of the licence. Where such action is not successful, the State may perform the work using financial authority funds held and attempt to instigate litigation in an effort to recover any additional costs of the rehabilitation. It is recognised that the State would face potentially significant obstacles recovering monies from persons who are insolvent.
| | |
Audited Consolidated Financial Statements 2003-04 - Government of Queensland | | 5-46 |
Notes to the Financial Statements
| 33. | Contingent Assets and Liabilities continued |
Rehabilitation of Abandoned Mine Sites
The State has a responsibility to rehabilitate abandoned mine sites. At reporting date it is not possible to determine the extent or timing of any potential financial effect that this responsibility may have.
Cost of Greenhouse Gas Emission Permits
The Kyoto Protocol to the Framework Convention on Climate Change includes a provision for trading in greenhouse gas emissions between national jurisdictions that have ratified the protocol. The Commonwealth Government has decided not to ratify the protocol and is not considering the introduction of a domestic emissions trading scheme. State and Territory governments have established a working group to develop a multi-jurisdictional emission trading scheme in Australia.
Currently it is expected that a domestic emission trading scheme will not be introduced before 2008 as it will take several years to agree on design issues, develop the legislative framework and establish the institutional structure.
A requirement to hold permits to cover greenhouse gas emissions may impact on the operations of a number of Government-owned corporations, principally the electricity generation corporations, QR and DPI Forestry. DPI Forestry may earn credits for carbon dioxide offsets. However, the direct impact of an emission trading scheme will depend on the industries covered and the types of offsets available.
Right of Recovery and Payments of Claims Costs of FAI General Insurance Company Limited
On 17 September 2004 the Supreme Court of Queensland decided an application made by the Nominal Defendant for declarations as to the proper construction of the provisions of section 33(2), 38(4), 58 and 59 of the Motor Accident Insurance Act 1994 in so far as they relate to the winding up of FAI General Insurance Company Limited (FAI).
The purpose of the application was to determine the respective rights of the Nominal Defendant and the Liquidators of FAI in relation to:
| | • | Recovery of shared claim costs from other contributing Compulsory Third Party (CTP) insurers in the Queensland Scheme in circumstances where FAI was the claims manager and made payments of claims prior to its insolvency on 15 March 2001. Recoveries of $7 million were received by the Nominal Defendant during the financial year. |
| | • | The entitlement of other CTP insurers in the Queensland Scheme who acted as claims managers prior to 15 March 2001 and made payments on claims in circumstances where FAI was to be the contributing insurer and where the Nominal Defendant subsequently made the payments. In this regard, the Nominal Defendant receives the right to recover amounts paid to other CTP insurers. It is anticipated that any amounts receivable would be determined by an independent third party. |
The Court found that since the Nominal Defendant assumed the rights and obligations of FAI as licensed insurer, it is entitled to all rights to recover contributions and debts that FAI would have been entitled to but for its insolvency.
| | |
Audited Consolidated Financial Statements 2003-04 - Government of Queensland | | 5-47 |
Notes to the Financial Statements
| 33. | Contingent Assets and Liabilities continued |
Obligations on Termination of the Bulk Supply Agreement with a Contestable Customer
On 1 June 2004, the Bulk Supply Agreement between Ergon Energy Pty Ltd and a contestable customer was terminated and replaced with a Power Purchase Agreement with an alternate energy supplier. Because of delays in finalisation of these arrangements, the contestable customer and Ergon Energy Pty Ltd agreed to perform a comparison of payments under the Bulk Supply Agreement and the Power Purchase Agreement from July 1998. It has been further agreed that Ergon Energy Pty Ltd will pay the contestable customer the net effect of the comparison as though the Power Purchase Agreement had been in force from July 1998.
At the end of the reporting period, Ergon Energy Pty Ltd and the contestable customer were still undertaking the required reconciliation to determine the amount payable.
Contingent Assets – Quantifiable
Guarantees
The Department of Natural Resources and Mines holds bank guarantees of $763 million (2003, $663 million), which represents the maximum value the department is potentially entitled to under the conditions of current mining leases.
WorkCover Queensland holds bank guarantees on behalf of self-insurers totalling $364 million (2003, $330 million).
The Department of State Development holds bank guarantees in relation to the Queensland Investment Incentive Scheme (QIIS) grants provided to public sector proponents totalling $51 million (2003, $37 million).
QR holds bank guarantees and insurance company guarantees of $79 million (2003, $45 million).
The Department of Main Roads holds securities in the form of performance guarantees amounting to $33 million (2003, $27 million).
ENERGEX Limited holds bank guarantees totalling $32 million from customers relating to the supply of electricity and the construction of capital assets (2003, $23 million).
The Department of Health holds bank guarantees and undertakings from third parties totalling $3 million (2003, $3 million).
Queensland Treasury (on behalf of the State of Queensland) holds a bank guarantee of $1 million under a contract between the State of Queensland and Landacq Limited for the purchase of commercial land. This guarantee was returned to Landacq Ltd in July 2004.
Construction Industry Skills Centre Pty Ltd
A non-recoverable loan of $11 million paid to Construction Industry Skills Centre Pty Ltd is repayable to the State Government if the company and related trust are wound up. A mortgage agreement over the company’s property at Salisbury has been entered into, to reflect the contingent asset.
| | |
Audited Consolidated Financial Statements 2003-04 - Government of Queensland | | 5-48 |
Notes to the Financial Statements
| 33. | Contingent Assets and Liabilities continued |
Long Term Community Housing Programme and Crisis Accommodation Program
The State’s long term community housing and crisis accommodation programs, aim to provide grants to assist communities to provide locally managed long-term affordable rental housing for low income earners whose housing needs can not be met by other housing options. Legal title to dwellings funded under this program is in the name of the respective local governments or other associations. Should a local government or other association sell such a property or use it for another purpose, the Government becomes legally entitled to the payment of compensation.
At 30 June 2004, the Government is not aware of any circumstances or information that would lead it to believe that any such assets will crystallise in the future and consequently an aggregate value cannot be readily quantified.
Right of Recovery and Payments of Claims Costs of FAI General Insurance Company Limited
The Nominal Defendant is, under certain circumstances, entitled to recover amounts paid to Compulsory Third Party (CTP) insurers where FAI General Insurance Company Limited (FAI) was to be a contributing insurer and where the Nominal Defendant, subsequently to the liquidation of FAI, made the claims payments.
Further details are provided under the heading of Contingent Liabilities.
| 34. | Post Balance Date Events |
Mt Millar Wind Farm
On 4 May 2004, Tarong Energy Corporation Limited signed an Engineer, Procure and Construct (EPC) contract for the construction of the Mt Millar Wind Farm Project. The contract was signed with conditions precedent allowing for the termination of the Project with minimal financial impact prior to the satisfaction of these conditions. The conditions have now been satisfied and the Notice of Commencement for the Project was given on 15 July 2004. The financial effect to the State of the contract, which will be brought to account in the 2004-05 and 2005-06 financial years, will be estimated payments of $119 million for the construction of wind powered generation assets.
The financial effect of the above transaction has not been brought to account in the financial statements for the year ended 30 June 2004.
Sparq Solutions Pty Ltd and Quest Asset Holdings Pty Ltd
ENERGEX Limited in partnership with Ergon Energy Corporation Limited, established Sparq Solutions Pty Ltd and Quest Asset Holdings Pty Ltd in July 2004. Sparq Solutions Pty Ltd is to provide Information Technology and Telecommunications operations, with ENERGEX Limited owning 55%. Quest Asset Holdings Pty Ltd will own all of the jointly developed Information Technology and Telecommunications assets with both ENERGEX Limited and Ergon Energy Corporation Limited owning 50% jointly.
Cairns Port Authority Development Lease
On 28 July 2004, Cairns Port Authority entered into a development lease with an external party who will undertake a development on land within the Cityport precinct. In accordance with the revenue recognition criteria outlined in AASB 1004 Revenue, a sale will be recognised in the year ended 30 June 2005, with the land being recognised as a current asset at 30 June 2004.
Cairns Port Authority will receive lease payments for the term of the development lease which is expected to expire on 27 January 2006 or date of project completion, whichever comes first. On completion of the project and payment of the consideration for the sale of the land, title will be transferred to the developer.
| | |
Audited Consolidated Financial Statements 2003-04 - Government of Queensland | | 5-49 |
Notes to the Financial Statements
| 35. | Defeased Cross Border Leases |
In prior years, the State has entered into a number of cross border leases in conjunction with Queensland Treasury Corporation. In accordance with AAS 17 Leases, the leases are treated as finance leases, the leased assets being amortised over the estimated useful lives of the assets. The entities which have entered into this type of arrangement are detailed below:
The Stanwell power station is subject to cross border leases that were entered into in 1995. There is no lease liability as future lease payments were prepaid at the commencement of the lease.
In the 2000-01 financial year, the Queensland Electricity Transmission Corporation Limited, trading as Powerlink Queensland, entered into a structured financing arrangement involving the sale and subsequent lease-back of certain assets. The arrangement, which is a USA cross border lease, represents the sale/lease-back of Powerlink Queensland’s regulated transmission assets.
In the past, QR has entered into a series of structured financing arrangements involving the sale and subsequent lease-back of assets.
QR accounts for cross border leases on a basis that reflects the substance of the transactions, being to record a leased asset and to only recognise in the accounts the resulting changes in cash flows.
Where it is necessary under the cross border lease provisions to substitute existing owned assets for damaged or disposed leased assets and there is a difference between the value of the owned asset and the acquisition cost of the now leased asset (the appraised value), QR nets this amount off in the Statement of Financial Performance to ensure the leased asset is recorded at fair value.
| 36. | Additional Financial Instruments Disclosure |
Derivative Financial Instruments
The State and certain of its controlled entities enter into derivative financial instruments in the normal course of business in order to hedge exposures to movements in interest rates, foreign currency exchange rates and commodity prices. They may be used to hedge exposure to fluctuations in anticipated commitments, putting in place either long term floating rate funding or long term fixed rate funding.
Interest Rate Risk
A number of agencies enter into interest rate swaps, forward rate agreements and futures contracts to assist in the management of interest rate risk.
In most instances, interest rate swaps are utilised to swap medium to long term fixed rate borrowings into floating rate borrowings at rates that are lower than those available if short term borrowings were utilised.
Forward rate agreements are used to lock in a guaranteed return on known cash flows, as and when they fall due, or to manage the duration of a particular pool or fund.
Futures contracts are used primarily for the same purpose as forward rate agreements. These contracts have little credit risk, as the counterparties are organised exchanges.
The Government’s exposure at 30 June 2004 to interest rate risk and the effective interest rates of financial assets and financial liabilities are shown in the following table. All assets and liabilities are shown by maturity or contractual repricing dates. Assets and liabilities are shown at their carrying value. Derivatives are shown at notional amounts. Notional principal amounts of derivatives represent the contract or face value of these derivatives.
The weighted average effective interest rate was the rate effective at 30 June 2004.
| | |
Audited Consolidated Financial Statements 2003-04 - Government of Queensland | | 5-50 |
Notes to the Financial Statements
| 36. | Additional Financial Instruments Disclosure continued |
As at 30 June 2004 Contractual Repricing/Maturity Date
| | | | | | | | | | | | | | | | | | | |
| | | Floating
Interest
Rate
| | | 1 Year
or Less
| | | 1 to 5
Years
| | | Over 5
Years
| | | Non-
Interest
Bearing
| | Total
| | | Weighted
Average
Rate
|
| | | $M | | | $M | | | $M | | | $M | | | $M | | $M | | | % |
Financial Assets | | | | | | | | | | | | | | | | | | | |
Cash | | 235 | | | — | | | — | | | — | | | — | | 235 | | | # |
Receivables | | — | | | — | | | — | | | — | | | 6,892 | | 6,892 | | | # |
Commercial Loans | | — | | | 2 | | | 8 | | | — | | | — | | 10 | | | 10.09 |
Deposits | | 1,372 | | | — | | | — | | | — | | | — | | 1,372 | | | 5.36 |
Floating rate notes | | 1,639 | | | — | | | — | | | — | | | — | | 1,639 | | | 5.77 |
Securities | | 2,583 | | | 38 | | | 221 | | | 2,856 | | | — | | 5,698 | | | 5.75 |
QIC investments* | | 1,492 | | | — | | | — | | | — | | | 15,663 | | 17,155 | | | 5.83 |
Shares | | — | | | — | | | — | | | — | | | 392 | | 392 | | | # |
Other | | 23 | | | 21 | | | 250 | | | 25 | | | 366 | | 685 | | | # |
| | |
|
| |
|
| |
|
| |
|
| |
| |
|
| | |
Total Financial Assets | | 7,343 | | | 61 | | | 479 | | | 2,881 | | | 23,313 | | 34,077 | | | |
| | |
|
| |
|
| |
|
| |
|
| |
| |
|
| | |
Financial Liabilities | | | | | | | | | | | | | | | | | | | |
Australia | | | | | | | | | | | | | | | | | | | |
Payables | | — | | | — | | | — | | | — | | | 3,264 | | 3,264 | | | # |
Deposits | | 2,234 | | | — | | | — | | | — | | | — | | 2,234 | | | # |
State/Commonwealth debt | | 68 | | | 14 | | | 58 | | | 428 | | | — | | 567 | | | 4.67 |
Treasury notes | | 30 | | | — | | | — | | | — | | | — | | 30 | | | 5.33 |
Floating rate notes | | 100 | | | — | | | — | | | — | | | — | | 100 | | | 5.40 |
Bonds | | 37 | | | 2,457 | | | 3,326 | | | 5,983 | | | — | | 11,804 | | | 5.80 |
Derivatives | | 5,030 | | | (2,607 | ) | | (2,750 | ) | | 225 | | | | | (103 | ) | | # |
Finance leases | | 96 | | | 1 | | | 1 | | | 8 | | | 2 | | 108 | | | 5.57 |
Other | | — | | | — | | | — | | | 5 | | | 43 | | 48 | | | # |
Overseas | | | | | | | | | | | | | | | | | | | |
Commercial paper | | 513 | | | — | | | — | | | — | | | — | | 513 | | | 2.29 |
Bonds | | — | | | 2,001 | | | 1,808 | | | 3,958 | | | — | | 7,766 | | | 5.76 |
Medium term notes | | — | | | 20 | | | 624 | | | 102 | | | — | | 746 | | | 5.88 |
Other | | 134 | | | — | | | — | | | — | | | — | | 134 | | | 0.04 |
| | |
|
| |
|
| |
|
| |
|
| |
| |
|
| | |
Total Financial Liabilities | | 8,242 | | | 1,885 | | | 3,068 | | | 10,708 | | | 3,309 | | 27,213 | | | |
| | |
|
| |
|
| |
|
| |
|
| |
| |
|
| | |
Net Financial Assets | | (899 | ) | | (1,824 | ) | | (2,589 | ) | | (7,828 | ) | | 20,004 | | 6,864 | | | |
| | |
|
| |
|
| |
|
| |
|
| |
| |
|
| | |
As at 30 June 2004, QIC investments are allocated over the following categories:
| | |
| | | $M |
Cash | | 705 |
Australian fixed interest | | 1,485 |
Australian equities | | 6,205 |
International equities | | 5,849 |
International fixed interest | | 21 |
Property | | 2,890 |
| | |
|
| | | 17,155 |
| | |
|
| | |
Audited Consolidated Financial Statements 2003-04 - Government of Queensland | | 5-51 |
Notes to the Financial Statements
| 36. | Additional Financial Instruments Disclosure continued |
As at 30 June 2003 Contractual Repricing/Maturity Date
| | | | | | | | | | | | | | | | | | |
| | | Floating
Interest
Rate
| | | 1 Year
or Less
| | | 1 to 5
Years
| | | Over 5
Years
| | | Non-
Interest
Bearing
| | Total
| | Weighted
Average
Rate
|
| | | $M | | | $M | | | $M | | | $M | | | $M | | $M | | % |
Financial Assets | | | | | | | | | | | | | | | | | | |
Cash | | 300 | | | — | | | — | | | — | | | — | | 300 | | # |
Receivables | | — | | | — | | | — | | | — | | | 6,769 | | 6,769 | | # |
Deposits | | — | | | 1,115 | | | — | | | — | | | — | | 1,115 | | 4.81 |
Floating rate notes | | — | | | 899 | | | — | | | — | | | — | | 899 | | 5.15 |
Securities | | — | | | 2,754 | | | 501 | | | 1,380 | | | — | | 4,634 | | 4.87 |
QIC investments* | | 3,164 | | | — | | | — | | | — | | | 11,418 | | 14,582 | | 4.49 |
Shares | | — | | | — | | | — | | | — | | | 148 | | 148 | | # |
Overseas notes | | — | | | 48 | | | — | | | — | | | — | | 48 | | 1.47 |
Other | | 84 | | | — | | | 125 | | | — | | | 415 | | 625 | | # |
| | |
|
| |
|
| |
|
| |
|
| |
| |
| | |
Total Financial Assets | | 3,549 | | | 4,816 | | | 626 | | | 1,380 | | | 18,751 | | 29,121 | | |
| | |
|
| |
|
| |
|
| |
|
| |
| |
| | |
Financial Liabilities | | | | | | | | | | | | | | | | | | |
Australia | | | | | | | | | | | | | | | | | | |
Payables | | — | | | — | | | — | | | — | | | 2,701 | | 2,701 | | # |
Deposits | | 1,843 | | | — | | | — | | | — | | | — | | 1,843 | | 4.86 |
State/Commonwealth debt | | 181 | | | 3 | | | 11 | | | 500 | | | 1 | | 696 | | 4.58 |
Treasury notes | | 1,045 | | | — | | | — | | | — | | | — | | 1,045 | | 4.72 |
Floating rate notes | | 500 | | | — | | | — | | | — | | | — | | 500 | | 4.74 |
Bonds | | 25 | | | 96 | | | 6,326 | | | 5,930 | | | — | | 12,376 | | 4.87 |
Derivatives | | 1,772 | | | (1,541 | ) | | (894 | ) | | 675 | | | — | | 12 | | # |
Finance leases | | 96 | | | 1 | | | 1 | | | 8 | | | 3 | | 108 | | 5.11 |
Other | | — | | | 18 | | | 22 | | | 5 | | | — | | 45 | | # |
Overseas | | | | | | | | | | | | | | | | | | |
Commercial paper | | 654 | | | 327 | | | — | | | — | | | — | | 981 | | 1.78 |
Bonds | | — | | | — | | | 2,445 | | | 2,428 | | | — | | 4,873 | | 4.85 |
Medium term notes | | — | | | 133 | | | 408 | | | 145 | | | — | | 686 | | 4.01 |
Other | | — | | | 100 | | | 125 | | | — | | | — | | 225 | | 0.09 |
| | |
|
| |
|
| |
|
| |
|
| |
| |
| | |
Total Financial Liabilities | | 6,117 | | | (865 | ) | | 8,444 | | | 9,691 | | | 2,704 | | 26,091 | | |
| | |
|
| |
|
| |
|
| |
|
| |
| |
| | |
Net Financial Assets | | (2,568 | ) | | 5,681 | | | (7,818 | ) | | (8,311 | ) | | 16,046 | | 3,030 | | |
| | |
|
| |
|
| |
|
| |
|
| |
| |
| | |
As at 30 June 2003, QIC investments are allocated over the following categories:
| | |
| | | $M |
Cash | | 802 |
Australian fixed interest | | 931 |
Australian equities | | 5,260 |
International equities | | 4,933 |
International fixed interest | | 13 |
Property | | 2,644 |
| | |
|
| | | 14,582 |
| | |
|
| | |
Audited Consolidated Financial Statements 2003-04 - Government of Queensland | | 5-52 |
Notes to the Financial Statements
| 36. | Additional Financial Instruments Disclosure continued |
Foreign Exchange Risk
To effectively manage the exposure of foreign currency borrowings and offshore investments to fluctuations in exchange rates, both forward exchange contracts and cross currency swaps are used. Offshore borrowings are required to provide access to additional sources of funding and to diversify risk exposure.
The following table summarises the hedging effect that cross currency swaps and forward exchange contracts have had on foreign currency borrowings and offshore investments based on the face value of derivatives, borrowings and offshore investments:
| | | | | | | | | | | | | | | | | | | | | | | | | | | | |
Currency
| | Borrowings
| | | Offshore
Investments
| | Swaps
| | | Forwards
| | | Net Exposure
| |
| | | 2004
| | | 2003
| | | 2004
| | 2003
| | 2004
| | | 2003
| | | 2004
| | | 2003
| | | 2004
| | | 2003
| |
| | | $M | | | $M | | | $M | | $M | | $M | | | $M | | | $M | | | $M | | | $M | | | $M | |
USD | | (254 | ) | | (658 | ) | | — | | 48 | | 12 | | | (40 | ) | | 5,150 | | | 534 | | | 4,908 | | | (116 | ) |
YEN | | (134 | ) | | (358 | ) | | — | | — | | 134 | | | 357 | | | 647 | | | (56 | ) | | 647 | | | (56 | ) |
CHF | | — | | | — | | | — | | — | | — | | | — | | | 313 | | | 12 | | | 313 | | | 12 | |
HKD | | — | | | (53 | ) | | — | | — | | — | | | — | | | 98 | | | 26 | | | 98 | | | (27 | ) |
GBP | | (65 | ) | | — | | | — | | — | | — | | | — | | | 983 | | | 39 | | | 918 | | | 39 | |
EUR | | (168 | ) | | (128 | ) | | — | | — | | 5 | | | (2 | ) | | 1,523 | | | 237 | | | 1,360 | | | 106 | |
NZD | | (23 | ) | | (9 | ) | | — | | — | | 23 | | | — | | | — | | | 9 | | | — | | | — | |
AUD | | (8,515 | ) | | (5,559 | ) | | — | | — | | (178 | ) | | (348 | ) | | (9,014 | ) | | (749 | ) | | (17,707 | ) | | (6,657 | ) |
Other | | — | | | — | | | — | | — | | — | | | — | | | 331 | | | (74 | ) | | 331 | | | (74 | ) |
Liquidity Risk
Liquidity risk arises from the possibility that individual agencies may be unable to settle a transaction on the due date. A range of funding facilities exists to manage this situation.
| | |
Audited Consolidated Financial Statements 2003-04 - Government of Queensland | | 5-53 |
Notes to the Financial Statements
| 36. | Additional Financial Instruments Disclosure continued |
Net Fair Value of Financial Instruments
The net fair value of financial assets and liabilities is determined as follows:
| | • | cash, deposits, receivables and payables approximate fair value; and |
| | • | the net fair value of other monetary financial assets and liabilities is based on market prices, or has been determined by discounting expected future cash flows by the current interest rate for financial assets and liabilities with similar risk profiles. |
The carrying amounts and estimated fair values of recognised financial instruments are as follows:
| | | | | | | | | | |
| | | 2004
| | | 2003
|
| | | Carrying
Amount
| | | Net Fair
Value
| | | Carrying
Amount
| | Net Fair
Value
|
| | | $M | | | $M | | | $M | | $M |
Financial Assets | | | | | | | | | | |
Cash | | 235 | | | 235 | | | 300 | | 300 |
Receivables | | 6,902 | | | 6,902 | | | 6,769 | | 6,769 |
Deposits | | 1,377 | | | 1,377 | | | 1,099 | | 1,099 |
Floating rate notes | | 1,649 | | | 1,649 | | | 951 | | 951 |
Securities | | 5,815 | | | 5,819 | | | 4,853 | | 4,862 |
QIC investments | | 17,155 | | | 17,155 | | | 14,582 | | 14,582 |
Shares | | 392 | | | 392 | | | 148 | | 149 |
Other | | 686 | | | 686 | | | 652 | | 652 |
| | |
|
| |
|
| |
| |
|
| | | 34,211 | | | 34,215 | | | 29,355 | | 29,365 |
| | |
|
| |
|
| |
| |
|
Financial Liabilities | | | | | | | | | | |
Payables | | 3,263 | | | 3,264 | | | 2,700 | | 2,700 |
Deposits | | 2,233 | | | 2,234 | | | 1,843 | | 1,843 |
State/Commonwealth debt | | 569 | | | 493 | | | 696 | | 655 |
Treasury notes | | 30 | | | 30 | | | 1,042 | | 1,042 |
Floating rate notes | | 101 | | | 101 | | | 505 | | 505 |
Bonds | | 12,084 | | | 12,084 | | | 13,279 | | 13,280 |
Overseas | | 9,429 | | | 9,429 | | | 7,148 | | 7,147 |
Derivatives | | (16 | ) | | (16 | ) | | 57 | | 57 |
Other | | 157 | | | 157 | | | 154 | | 155 |
| | |
|
| |
|
| |
| |
|
| | | 27,850 | | | 27,777 | | | 27,424 | | 27,383 |
| | |
|
| |
|
| |
| |
|
Credit Exposure
Credit risk exposure represents the potential loss that would be recognised if all counterparties failed to perform as contracted.
Financial Instruments - On-Balance Sheet
The State’s credit risk on recognised financial assets, excluding investments, is the carrying amount of these assets in the Consolidated Statement of Financial Position. The market value at balance date is the credit exposure for investments.
Financial Instruments - Off-Balance Sheet
The credit exposure for derivative contracts is calculated utilising the ‘value at risk methodology’ which takes into account the current market value, duration, term to maturity and interest rate and/or exchange rate volatility.
| | |
Audited Consolidated Financial Statements 2003-04 - Government of Queensland | | 5-54 |
Notes to the Financial Statements
| 36. | Additional Financial Instruments Disclosure continued |
Credit risk exposures that are related to derivative financial instruments follow:
| | | | |
| | | 2004
| | 2003
|
| | | $M | | $M |
Derivative Exposure | | | | |
Interest rate swaps | | 502 | | 360 |
Forward rate agreements | | 4 | | 1 |
Forward exchange contracts | | 127 | | 87 |
Cross currency swaps | | 24 | | 71 |
Credit derivatives | | 82 | | — |
The Government limits exposure to individual counterparties by determining maximum credit exposure limits based on the counterparty’s rating and size of its balance sheet. Counterparty exposure by rating is as follows:
| | | | |
| | | Credit Exposure
|
Rating
| | 2004
| | 2003
|
| | | % | | % |
AAA | | 57 | | 62 |
AA+ | | 4 | | 3 |
AA | | 4 | | 6 |
AA- | | 21 | | 15 |
A+ | | 9 | | 10 |
A | | 4 | | 2 |
A- | | 1 | | 2 |
| | | | |
| | | 2004
| | 2003
|
| | | $M | | $M |
Employee Entitlement Liabilities: | | | | |
Superannuation benefits: | | | | |
State Public sector - defined contribution | | 1,821 | | 1,785 |
State Public sector - defined benefit | | 9,777 | | 9,682 |
Parliamentary - defined benefit | | 68 | | 63 |
Judges’ pensions | | 264 | | 240 |
Employee annual leave | | 852 | | 807 |
Employee long service leave | | 1,795 | | 1,606 |
Other employee benefits | | 137 | | 158 |
| | |
| |
|
| | | 14,714 | | 14,341 |
| | |
| |
|
Superannuation Liability
State Public sector superannuation liabilities include both defined benefit and defined contribution schemes which comprise the State Public Sector Superannuation Fund. State Government budget dependent agencies, together with a number of statutory bodies, excluding principally the Queensland electricity supply industry, are required to make employer contributions to the State Public Sector Superannuation Fund.
The State is also responsible for ‘employer’ superannuation contributions to the Parliamentary Contributory Superannuation Fund and for the pension liability of the Judiciary.
| | |
Audited Consolidated Financial Statements 2003-04 - Government of Queensland | | 5-55 |
Notes to the Financial Statements
| 37. | Employee Benefits continued |
The estimate of superannuation liabilities of the State is based on calculations carried out by the State Actuary. Actuarial calculations are based on membership data as at 30 June 2004. Forecast demographic assumptions are outlined in the formal actuarial valuation report issued by the State Actuary for the respective schemes. (The QSuper report is as at 30 June 2001 and the Parliamentary report is as at 30 June 2002).
The forecast economic assumptions are as per the following table:
| | | | | | |
| | | QSuper
| | | Parliamentary
| |
Defined Benefit Superannuation | | | | | | |
Investment return rate | | 7.5 | % | | 7.0 | % |
Salary growth rate | | 4.0 | % | | 4.0 | % |
CPI growth rate | | 2.5 | % | | 2.5 | % |
Defined contribution superannuation liabilities represent former defined benefit members who have elected to leave the scheme. The liability grows by investment earnings and additional entrants transferring from the defined benefit scheme. The weighted average rate of return on investments achieved in 2003-04 was 17.09% (2002-03, negative 2.45%).
| | | | | | | | | | |
| | | Vested
Benefits
| | Present
Value
Accrued
Benefits
| | Net
Market
Value
of Plan
Assets
| | Net
Liability
Accrued
Benefits
| | Net
Liability
Accrued
Benefits
|
Fund
| | 30 June 2004
| | 30 June 2004
| | 30 June 2004
| | 30 June 2004
| | 30 June 2003
|
| | | | | |
| | | $M | | $M | | $M | | $M | | $M |
State Public Sector Superannuation Fund | | 25,980 | | 24,334 | | 12,736 | | 11,598 | | 11,467 |
Parliamentary Contributory Superannuation Fund | | 99 | | 102 | | 34 | | 68 | | 63 |
| | |
| |
| |
| |
| |
|
| | | 26,079 | | 24,436 | | 12,770 | | 11,666 | | 11,530 |
| | |
| |
| |
| |
| |
|
The accrued benefits amount of $24,436 million is the State Actuary’s estimate of accrued superannuation liabilities payable from the respective funds as at 30 June 2004. Because of the variables involved in these calculations, the net liability of the Government at this date may vary from this amount in future actuarial valuations of the schemes. Vested benefits represent benefits to which a member retains a right under the fund irrespective of whether or not the member remains in employment. Present value of accrued benefits represents the actuarial value of all benefits that are expected to become payable in the future in respect of contributions made or periods of service completed prior to the valuation date, allowing for future salary increases.
Excluding Judges’ pensions, the net liability of the State Government for accrued superannuation benefits is $11,666 million. This amount is determined by deducting the net market value of the respective plan assets at 30 June 2004 from the estimated accrued superannuation liabilities payable at that date, as detailed in the above table. When the pensions of the Judiciary are added, actuarially assessed at $264 million (2003, $240 million), the total superannuation and pension liability is estimated to be $11,930 million (2003, $11,770 million).
The number of full time equivalent employees at 30 June 2004 relating to the consolidated entities listed in Note 39 totalled 189,416 (2003, 185,473).
| | |
Audited Consolidated Financial Statements 2003-04 - Government of Queensland | | 5-56 |
Notes to the Financial Statements
| 37. | Employee Benefits continued |
Electricity Supply Industry Superannuation Commitments
Queensland electricity entities contribute to an industry multiple employer superannuation fund, the Electricity Supply Industry Superannuation (Qld) Limited (ESI Super). Members, after serving a qualifying period, are entitled to benefits from this scheme on retirement, resignation, retrenchment, disability or death.
The defined benefit account of this fund provides defined lump sum benefits based on years of service and final average salary. Employee contributions to the fund are based on various percentages of their gross salaries.
The most recent actuarial assessment of the fund, as at 1 July 2002, was carried out by Mr Ralph Collins F.I.A.A. of Sunsuper Financial Services Pty Ltd on 14 January 2003. The actuary concluded that all liabilities of the fund which may be expected to arise in the normal course of events in the three years to 30 June 2005, and the vested benefits at that date in respect of current members, could be adequately met by:
(a) the assets of the fund at valuation date
(b) contributions by the employer at the recommended rate
(c) contributions by the members in accordance with the Trust Deed
(d) investment earnings on the above.
Forecast demographic assumptions are outlined in the formal actuarial valuation report, issued at 1 July 2002. The defined benefit superannuation forecast economic assumptions are as follows:
| | | |
Investment return rate | | 7.0 | % |
Salary growth rate | | 5.0 | % |
| | | | | | | | | | | | |
| | | Vested
Benefits
| | Accrued
Benefits
| | Net Market
Value of
Assets
| | Net Liability
Accrued
Benefits
| | | Net Liability
Accrued
Benefits
| |
| | | 1 July
2002
| | 1 July
2002
| | 1 July
2002
| | 1 July
2002
| | | 1 July
1999 #
| |
| | | $M | | $M | | $M | | $M* | | | $M* | |
ESI Super | | 653 | | 655 | | 795 | | (140 | ) | | (301 | ) |
| # | Date of previous actuarial assessment, as at 1 July 1999. |
| * | The economic entities within the electricity supply industry have no entitlement to this excess. |
Due to the excess of plan assets held over accrued benefits, no liability has been recorded in the Statement of Financial Position of each of the respective electricity entities. Likewise, the assets of the fund are held in trust on behalf of the fund members and no assets have been recorded in the Statement of Financial Position.
| | |
Audited Consolidated Financial Statements 2003-04 - Government of Queensland | | 5-57 |
Notes to the Financial Statements
| 38. | Acquisition of Controlled Entities in 2003-04 |
No material controlled entities have been acquired during the year.
Public sector entities are considered material for the purposes of this report if they meet either of the following criteria:
| | • | net operating result in excess of $2 million (2003, $1 million); or |
| | • | net assets in excess of $15 million (2003, $10 million). |
However in addition to material entities, the State consolidates some entities which are not material in terms of the operating position or net asset position criteria if they are either a department, or if they are funded for the delivery of outputs.
When financial results are available in respect of non-material entities they are reviewed with the aim of including any newly material entities in the following year’s consolidated financial statements.
Newly created entities that are expected to meet the materiality criteria on the basis of their initial budget estimates are included in the consolidated financial statements from the time of their establishment.
The following controlled entities of the Government have been included in the consolidated financial statements for the year ended 30 June 2004. The list has been classified by activity sectors as outlined in Note 1(c).
Entities denoted with an asterisk are consolidated with the accounts of the preceding entity.
General Government
Anti-Discrimination Commission
Board of the Queensland Museum
Bureau of Sugar Experiment Stations (transferred to private sector on 01/09/03)
Commission for Children and Young People
Crime and Misconduct Commission
Dalby Agricultural College Board
Department of Aboriginal and Torres Strait Islander Policy
Department of Child Safety
Department of Communities
Department of Corrective Services
* Queensland Community Corrections Board
* Regional Community Corrections Boards
Department of Education and the Arts
* Australian Music Examinations Board
* Corporate Administration Agency
* Corporate and Professional Services
Department of Emergency Services
* World Firefighters Games Brisbane 2002 (in voluntary liquidation on 22/04/04)
Department of Employment and Training
* Corporate Solutions Queensland
Department of Families (abolished 12/02/04)
Department of Health
* Queensland Health Shared Service Provider
Department of Housing (includes Racing)
Department of Industrial Relations
Department of Innovation and Information Economy, Sport and Recreation Queensland (abolished 12/02/04)
Department of Justice and Attorney-General
* PartnerOne
| | |
Report on State Finances 2003-04 – Government of Queensland | | 5-58 |
Notes to the Financial Statements
| 39. | Controlled Entities continued |
Department of Local Government, Planning, Sport and Recreation
Department of Main Roads
* RoadTek
Department of Natural Resources, Mines and Energy
* SIMTARSTECH Pty Ltd
* CorporateLink
Department of Police
Department of the Premier and Cabinet
* Queensland Events Corporation Pty Ltd
Department of Primary Industries and Fisheries
* Veterinary Surgeons Board of Queensland
Department of Public Works
* CITEC
* GoPrint
* Project Services
* Q-Build
* Q-Fleet
* Sales and Distribution Services
Department of State Development and Innovation
* Burnett Water Pty Ltd
* Property Services Group
Department of Tourism, Fair Trading and Wine Industry Development
Department of Transport
Disability Services Queensland
Environmental Protection Agency
Electoral Commission of Queensland
Emerald Agricultural College Board
Legal Aid Queensland
Legislative Assembly
Library Board of Queensland
Longreach Pastoral College Board
Motor Accident Insurance Commission
Nominal Defendant
Office of the Governor
Office of the Ombudsman and Office of Information Commissioner
Office of the Public Service Commissioner
Prostitution Licensing Authority
Queensland Art Gallery Board of Trustees
Queensland Audit Office
Queensland Building Services Authority
Queensland Performing Arts Trust
Queensland Rural Adjustment Authority
Queensland Studies Authority
Queensland Theatre Company (deconsolidated 01/07/03)
Residential Tenancies Authority
SGH Limited
South Bank Corporation
The Australian College of Tropical Agriculture
The Council of the Queensland Institute of Medical Research
The Public Trustee of Queensland
The Royal Children’s Hospital Foundation (deconsolidated 01/07/03)
The Trustees of Parklands Gold Coast
| | |
| Audited Consolidated Financial Statements 2003-04 - Government of Queensland | | 5-59 |
Notes to the Financial Statements
| 39. | Controlled Entities continued |
Tourism Queensland
Treasury Department
* CorpTech
* Queensland Treasury Holdings Pty Ltd
* Nickel Resources North Queensland Pty Ltd (in voluntary liquidation on 20/01/04)
Workers’ Compensation Regulatory Authority (QComp)
Public Non-financial Corporations
2001 Goodwill Games Brisbane Ltd (wound up on 30/06/04)
Brisbane Market Corporation Ltd (deconsolidated 01/07/03)
Bundaberg Port Authority
Cairns Port Authority
CS Energy Ltd
* Aberdare Collieries Pty Ltd
* Callide Energy Pty Ltd
* CEPA (Kogan Creek) Holding Pty Ltd
* CEPA (Kogan Creek) Leasing I Pty Ltd
* CEPA (Kogan Creek) Leasing II Pty Ltd
* CEPA (Kogan Creek) Leasing III Pty Ltd
* CEPA (Kogan Creek) Leasing IV Pty Ltd
* CS Energy Kogan Creek Pty Ltd
* CS Energy Mica Creek Pty Ltd
* CS Kogan (Australia) Pty Ltd
* CS North West Pty Ltd
* Delta Solutions Pty Ltd
* Kogan Creek Power Pty Ltd
* SE CSE Pty Ltd
* Swanbank Energy Pty Ltd
DBCT Holdings Pty Ltd
DPI Forestry (controlled entity of Department of Primary Industries and Fisheries)
ENERGEX Ltd
* Allgas Energy Pty Ltd
* Allgas Pipelines Holdings Pty Ltd
* Allgas Pipelines Operations Ltd
* Allgas Pipelines Pty Ltd
* Allgas Toowoomba Pty Ltd
* Beak Industries Pty Ltd
* ENERGEX Retail Pty Ltd
* Energy Holdings Ltd
* Energy Impact Pty Ltd
* Metering Dynamics Pty Ltd (formerly Allgas Network Holdings Pty Ltd)
* Queensland Energy Services Team Pty Ltd
* Queensland Gas Industries Pty Ltd
* Service Essentials Pty Ltd
* Varnsdorf Pty Ltd
* VH Energy Holdings Pty Ltd
* VH Finance Pty Ltd
* VH Operations Pty Ltd
| | |
Audited Consolidated Financial Statements 2003-04 - Government of Queensland | | 5-60 |
Notes to the Financial Statements
| 39. | Controlled Entities continued |
Ergon Energy Corporation Ltd
* EA North Queensland Pty Ltd
* Ergon Energy (Victoria) Pty Ltd
* Ergon Energy Gas Pty Ltd
* Ergon Energy Pty Ltd
* Ergon Energy Telecommunications Pty Ltd
* Ergon Energy Utility Services Pty Ltd
* Northern Electricity Retail Corporation Pty Ltd
* Vantage Plus Utilities Trust
Gladstone Area Water Board
Gladstone Port Authority (re-named as Central Queensland Ports Authority 01/07/04)
Gold Coast Events Co Pty Ltd (controlled entity of Department of Local Government, Planning, Sport & Recreation)
Golden Casket Lottery Corporation Ltd
* Bounty Ltd
* Bounty Systems Pty Ltd
* Clubline Systems Pty Ltd
* Infolink Systems Pty Ltd
* Interactive Gold Pty Ltd
Mackay Port Authority
Major Sports Facilities Authority
Mount Isa Water Board
Pioneer Valley Water Board (deconsolidated 01/07/03)
Port of Brisbane Corporation
* Gateway Investments Corporation Pty Ltd
Ports Corporation of Queensland
* Port Pilots Queensland Pty Ltd
Powerlink Queensland
* Harold Street Holdings Pty Ltd
* Powerlink Transmission Services Pty Ltd
Queensland Motorways Limited (controlled entity of Department of Main Roads)
* Logan Motorway Company Ltd
* Port Motorway Ltd
* Queensland Motorways Management Pty Ltd
* The Gateway Bridge Company Ltd
Queensland Power Trading Corporation (Enertrade)
* Enertrade (NQ) Pipeline No 1 Pty Ltd
* Enertrade (NQ) Pipeline No 2 Pty Ltd
* Enertrade Pipeline Management Pty Ltd
* The Green Energy Corporation Pty Ltd
QR
*Heritage Train Company Pty Ltd
*Interail Australia Pty Ltd (formerly QR National Pty Ltd)
*On Track Insurance Pty Ltd
Rockhampton Port Authority (dissolved 01/07/04)
Stanwell Corporation Ltd
SunWater
* Eungella Water Pipeline Pty Ltd
* North West Queensland Water Pipeline Pty Ltd
| | |
Audited Consolidated Financial Statements 2003-04 - Government of Queensland | | 5-61 |
Notes to the Financial Statements
| 39. | Controlled Entities continued |
Tarong Energy Corporation Ltd
* Mt. Millar Windfarm Pty Ltd
* Starfish Hill Wind Farm Pty Ltd
* Tarong Renewable Energy Pty Ltd
* Terra Gas Trader Pty Ltd
* TN Power Pty Ltd
Townsville Port Authority
Trustees of Albion Park Paceway (deconsolidated 01/07/03)
Public Financial Corporations
Queensland Investment Corporation
* Balfour Pty Ltd
* Bowmint Pty Ltd
* Canberra Centre Investments Pty Ltd
* Eastland Property Holdings Ltd
* Financial Markets Services Group Pty Ltd
* Grand Central Toowoomba Ltd
* Lifestyle Portal Pty Ltd
* Pacific Echo Pty Ltd
* QIC Epping Road Pty Ltd
* QIC Helensvale Pty Ltd
* QIC Hi Yield Pty Ltd
* QIC Logan Hyperdome Pty Ltd
* QIC Office Pty Ltd
* QIC Properties Pty Ltd
* QIC Property Funds Pty Ltd
* QIC Property Management Pty Ltd
* QIC Real Estate Funds Pty Ltd
* QIC Real Estate Pty Ltd
* QIC Retail (No 2) Pty Ltd
* QIC Retail Pty Ltd
* QIC Ringwood Pty Ltd
* QIC Robina Pty Ltd
* QIC Toowoomba Pty Ltd
* QIC Westpoint Pty Ltd
* Queensland BioCapital Funds Pty Ltd
* Watergardens Brimbank Pty Ltd
* Watergardens Pty Ltd
Queensland Treasury Corporation
* Sunshine Locos Pty Ltd
WorkCover Queensland
| | |
Audited Consolidated Financial Statements 2003-04 - Government of Queensland | | 5-62 |
Notes to the Financial Statements
| 40. | Entities Not Consolidated |
Queensland’s public universities and certain professional, occupational and primary producer marketing boards have not been included in the consolidated financial statements because they are not considered to be controlled by the State Government. Employee superannuation funds are similarly excluded.
Local governments are a separate sphere of government and their financial activities do not form part of these consolidated financial statements.
Latest available audited data was collected from 126 agencies (116 in 2003) that are controlled by the State Government but are not considered material for whole-of-Government reporting purposes and are excluded from these financial statements. Aggregated financial information of these entities follows:
| | | | |
| | | 2004
| | 2003
|
| | | $M | | $M |
Revenues | | 127 | | 114 |
Expenses | | 116 | | 102 |
| | |
| |
|
Operating Result | | 11 | | 12 |
| | |
| |
|
Assets | | 209 | | 115 |
Liabilities | | 53 | | 26 |
| | |
| |
|
Net Assets | | 156 | | 89 |
| | |
| |
|
| | |
Audited Consolidated Financial Statements 2003-04 - Government of Queensland | | 5-63 |
Certificate of Consolidated Financial Statements
Consolidated Financial Statements
2003-04
Certification by the Treasurer, Under Treasurer and Assistant Under Treasurer
The foregoing consolidated financial statements have been prepared pursuant to section 38B(1) of the Financial Administration and Audit Act 1977, and other prescribed requirements.
In our opinion and in terms of section 38B(3) of the Financial Administration and Audit Act 1977, we certify that the consolidated financial statements have been properly drawn up, under the prescribed requirements, to present a true and fair view of:
(i) the financial performance and cash flows of the Queensland State Government for the financial year; and
(ii) the financial position of the Government at 30 June 2004.
At date of certification of the statements, we are not aware of any material circumstances that would render any particulars included in the consolidated financial statements misleading or inaccurate.
| | | | |
 | |  | |  |
Walter Ivessa | | Gerard Bradley | | Terry Mackenroth |
Assistant Under Treasurer | | Under Treasurer | | Treasurer of Queensland |
Date 4 October 2004
| | |
Audited Consolidated Financial Statements 2003-04 - Government of Queensland | | 5-64 |
Independent Audit Report
To the Treasurer of Queensland
Matters relating to the electronic presentation of the audited consolidated financial statements
The audit report relates to the consolidated financial statements of the Government of Queensland for the financial year ended 30 June 2004 included on Treasury Department’s web site. The Under Treasurer is responsible for the integrity of Treasury Department’s web site. The audit report refers only to the consolidated financial statements identified below and does not include a review of the integrity of this web site or provide an opinion on any other information which may have been hyperlinked to/from the consolidated financial statements. If users of the consolidated financial statements are concerned with the inherent risks arising from electronic data communications they are advised to refer to the hard copy of the audited consolidated financial statements, available from Treasury Department, to confirm the information included in the audited consolidated financial statements presented on this web site.
These matters also relate to the presentation of the audited consolidated financial statements in other electronic media including CD Rom.
Scope
The consolidated financial statements
The financial statements include the consolidated financial statements of the Government of Queensland and the entities it controlled at the year’s end or from time to time during the year. The financial statements consist of the Statement of Financial Performance, Statement of Financial Position, Statement of Cash Flows, Notes to the Consolidated Financial Statements and certificates given by the Treasurer, Under Treasurer and the most senior officer of Treasury Department responsible for preparing the consolidated financial statements for the year ended 30 June 2004.
Responsibility for preparation of statements
Treasury Department, on behalf of the Treasurer, is responsible for the preparation and true and fair presentation of the consolidated financial statements, the maintenance of adequate accounting records and internal controls that are designed to prevent and detect fraud and error, and for the accounting policies and accounting estimates inherent in the consolidated financial statements.
Audit approach
As required by law, an independent audit was conducted in accordance with QAO Auditing Standards to enable me to provide an independent opinion whether in all material respects the consolidated financial statements present fairly, in accordance with the prescribed requirements, including any mandatory financial reporting requirements as approved by the Treasurer for application in Queensland.
Audit procedures included -
| | • | examining information on a test/sample basis to provide evidence supporting the amounts and disclosures in the consolidated financial statements, |
| | • | assessing the appropriateness of the accounting policies and disclosures used and the reasonableness of significant accounting estimates made by the Accountable Officer, |
| | • | obtaining written confirmation regarding the material representations made in conjunction with the audit, and |
| | • | reviewing the overall presentation of information in the consolidated financial statements. |
| | |
Audited Consolidated Financial Statements 2003-04 - Government of Queensland | | 5-65 |
Independence
The Financial Administration and Audit Act 1977 promotes the independence of the Auditor-General and QAO authorised auditors.
The Auditor-General is the auditor of all public sector entities and can only be removed by Parliament.
The Auditor-General may conduct an audit in any way considered appropriate and is not subject to direction by any person about the way in which powers are to be exercised.
The Auditor-General has for the purposes of conducting an audit, access to all documents and property and can report to Parliament matters which in the Auditor-General’s opinion are significant.
Audit Opinion
In accordance with section 38B of the Financial Administration and Audit Act 1977 -
(a) I have received all the information and explanations which I have required; and
(b) in my opinion -
| | (i) | the prescribed requirements in respect of the establishment and keeping of accounts have been complied with in all material respects; and |
| | (ii) | the consolidated financial statements have been properly drawn up to present a true and fair view, in accordance with the prescribed accounting standards, of the financial operations and cash flows of the Government of Queensland for the financial year 1 July 2003 to 30 June 2004 and of the financial position at the end of that year. |
| | | | |
L J SCANLAN, FCPA Auditor-General of Queensland | |  | | Queensland Audit Office Brisbane |
| | | | |
| | |
Audited Consolidated Financial Statements 2003-04 - Government of Queensland | | 5-66 |
Reconciliation of UPF to AAS
of the Queensland Government
year ended 30 June 2004
ATTACHMENT A: Reconciliation of UPF Net Operating Balance to AAS
Net Surplus/(Deficit)
Comparison of GFS Operating Result to Accounting Statement of Financial Performance
The GFS Outcomes Report and Consolidated Financial Statements focus on different aspects of Government finances. The Consolidated Financial Statements outline the operations of the Queensland Government including valuation adjustments. The Outcomes Report removes valuation adjustments to reflect costs more appropriately related to the underlying operations of Government.
The Government’s key fiscal principles include the maintenance of a General Government surplus in GFS terms.
Apart from reflecting the accepted uniform reporting basis for the Commonwealth and State Governments, targeting an operating result in GFS terms recognises that valuation adjustments can be quite significant from year to year and are more appropriately considered in the context of overall balance sheet management.
The table below provides a comparison of the GFS Net operating balance to the AAS Net surplus/(deficit) by sector/segment:
| | | | | | | | | | | | |
| | | General
Government
Sector
| | | Public Non-
Financial
Corporations
Sector
| | | Public Financial
Corporations
Sector
| | | Total State
Sector
| |
| | | 2003-04
$ million
| | | 2003-04
$ million
| | | 2003-04
$ million
| | | 2003-04
$ million
| |
GFS Net operating balance | | 3,340 | | | (67 | ) | | 244 | | | 3,518 | |
Less remeasurement/valuation adjustments | | | | | | | | | | | | |
Bad Debts and Amortisation | | (38 | ) | | (28 | ) | | (2 | ) | | (69 | ) |
Market Value adjustments investments/loans | | 203 | | | 436 | | | (25 | ) | | 613 | |
Revaluations of Provisions | | 663 | | | 70 | | | — | | | 733 | |
Gains/Loss on Assets sold/written off | | (166 | ) | | 18 | | | (1 | ) | | (148 | ) |
Prior year adjustments | | (1 | ) | | 8 | | | — | | | 7 | |
Plus presentation differences | | | | | | | | | | | | |
Dividends returned to owners | | — | | | 681 | | | 9 | | | — | |
AAS Net surplus/(deficit) | | 4,001 | | | 1,118 | | | 225 | | | 4,654 | |
| | |
State Finances Report 2003-04 - Government of Queensland | | 6-01 |