EXHIBIT (c)(i)
Consolidated Financial Statements of the Registrant
1
2
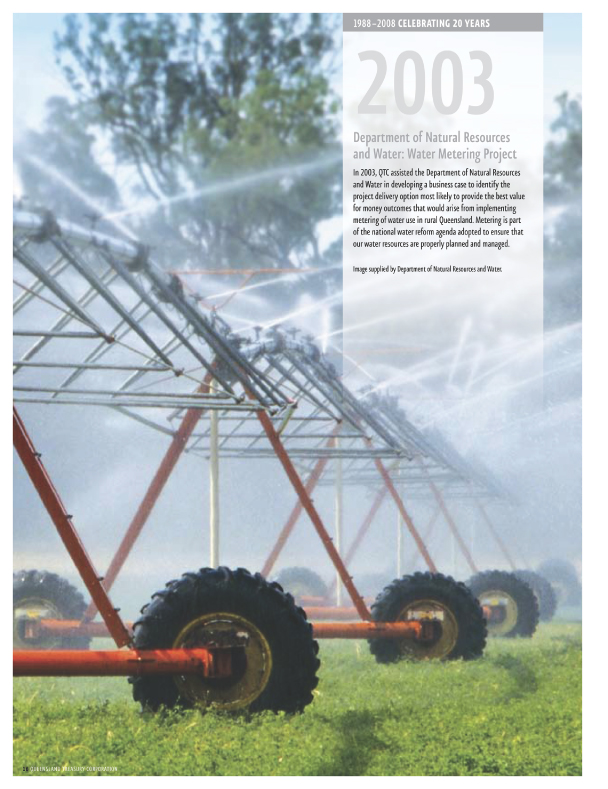
In 2008, Queensland Treasury Corporation (QTC) celebrates its twentieth year of operations.
With its inaugural Chairman, Sir Leo Hielscher AC, and Chief Executive, Stephen Rochester, at the helm, QTC has navigated Queensland through the challenges of the financial markets, and maintained its course providing low cost funding and independent financial and risk management advice to ten State Treasurers and their respective governments.
QTC determines its own worth by the value it has created for its customers and for the State. Over the past twenty years, QTC has maintained its AAA credit rating and generated more than $1.7 billion in savings for customers in the raising of their capital requirements alone. While total savings are not completely quantifiable, they are estimated to be much greater. Today, QTC employs 160 people and has more than $43 billion of debt on issue.
This is the story of QTC’s journey so far.
Autonomous and accountable
Created to provide a range of independent financial services to the Government and its public sector entities, QTC was established on 1 July 1988. It brought together the financial operations of its predecessor, the Queensland Government Development Authority, the Investment Branch of the Queensland Treasury department, and the debt of the Brisbane City Council and the Queensland Electricity Commission.
QTC was formed as a separate entity (a ‘corporation sole’), reporting to the Treasurer and Queensland Parliament via the Under Treasurer, with responsibility for implementing the Government’s fiscal policy through the services it provides.
In 1991, QTC became an autonomous and accountable central financing authority, when responsibility for the State’s wholesale and medium-to long-term investments was transferred to the Queensland Investment Corporation. In August 1991, Sir Leo Hielscher AC was appointed Chairman and the QTC Capital Markets Board was established.
QTC is unique in the Australian government marketplace, with an operating model designed to provide the services of a corporate treasury (ie, debt funding, short-to medium-term investments, and financial and risk management advice), not to maximise profits for itself. While QTC is required to operate profitably, its objective is to maximise value for the State and its entities. QTC makes it more efficient and less risky for the State and its public sector bodies to benefit from the considerable advantages associated with operating in global wholesale debt and investment markets, without having to access those markets themselves. It acts in the interests of Queensland and its public sector customers, aiming to provide truly professional advice.
QTC’s customers are the departments, Government-owned corporations, statutory authorities and local governments of Queensland.
3

Extracting economies of scale
In the initial years, QTC focused on consolidating the State’s debt, taking on the role as Queensland’s single debt issuer, rationalising the number of approaches to the debt markets and eliminating competition between the various issuing local and semi-government authorities. The economies of scale generated by this consolidation, together with QTC’s commitment to open and transparent communication with the markets, translated into well sought after, liquid debt products that have ultimately provided customers with the lowest cost of funds.
In its early days, QTC achieved many firsts. It was the first to establish a global transferable note (TRN) program, specifically targeted at offshore investors, and to issue global bonds at yields below those achievable in the domestic market. Concurrently, it established multi currency medium-term note programs in Europe and the United States to supplement the Global TRN Program and, in 1992, became the lowest priced Australian semi-government issuer, a position it still holds today.
Similarly, QTC’s Cash Fund, which was established to assist customers with the management of their short-term cash balances, has consistently out performed the UBS Bank Bill Index (ie, the industry benchmark for comparing cash funds) and delivered competitive returns for customers’ short-to medium-term investments.
QTC continues to evolve in response to the demands of the changing financial markets and the dynamic environment in which its customers operate.
Expanding economies of scope
Building on its success in delivering value to customers from its debt funding economies of scale, QTC broadened its capabilities and established an independent corporate advisory service in 1994. Introducing these complementary services allowed QTC to achieve economies of scope in the provision of quality, independent financial and risk management advice.
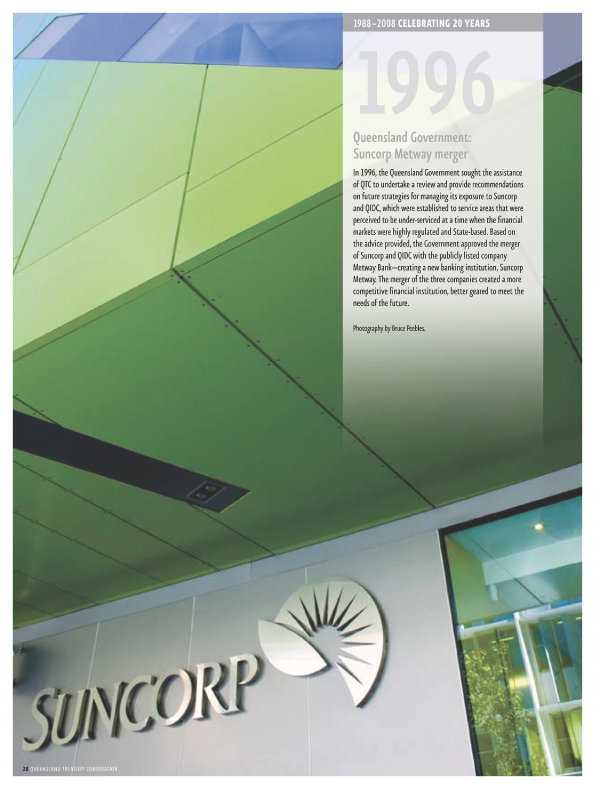
Customer demand for these advisory services has grown enormously, and QTC now offers a full range of services including financial and risk management advice, financial modelling and credit analysis.
QTC has advised, in some capacity, on most of the State’s key infrastructure projects. It played a lead role in negotiating the merger of Suncorp, the Queensland Industry and Development Corporation, and Metway Bank, joining public and private corporations and bringing them into public ownership.
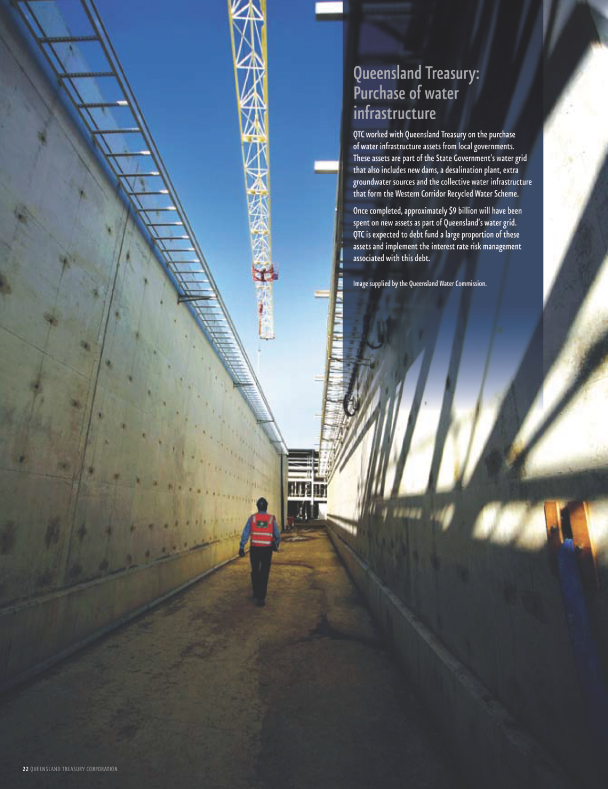
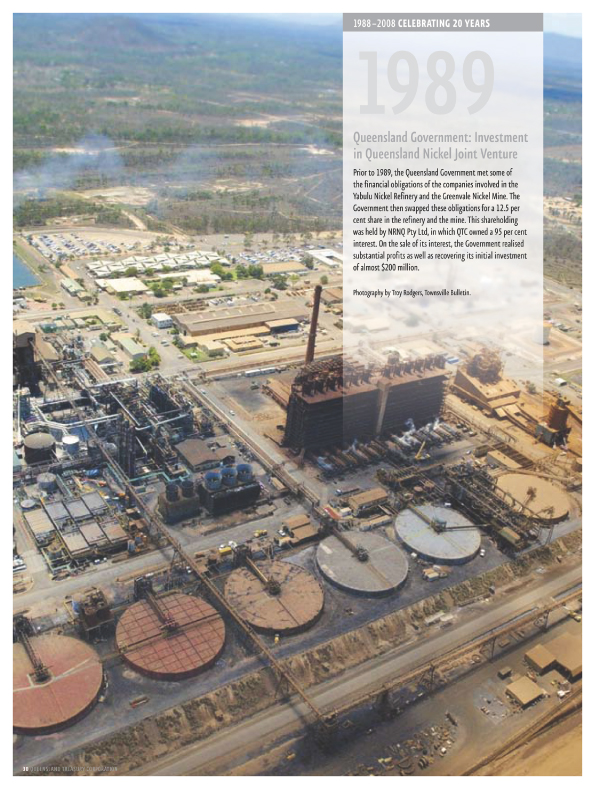
It has also advised on the sale of some of Queensland’s major assets, including Dalrymple Bay Coal Terminal and the State’s retail electricity assets, and also on the recent acquisition by the State Government of the previously local government-owned water assets.

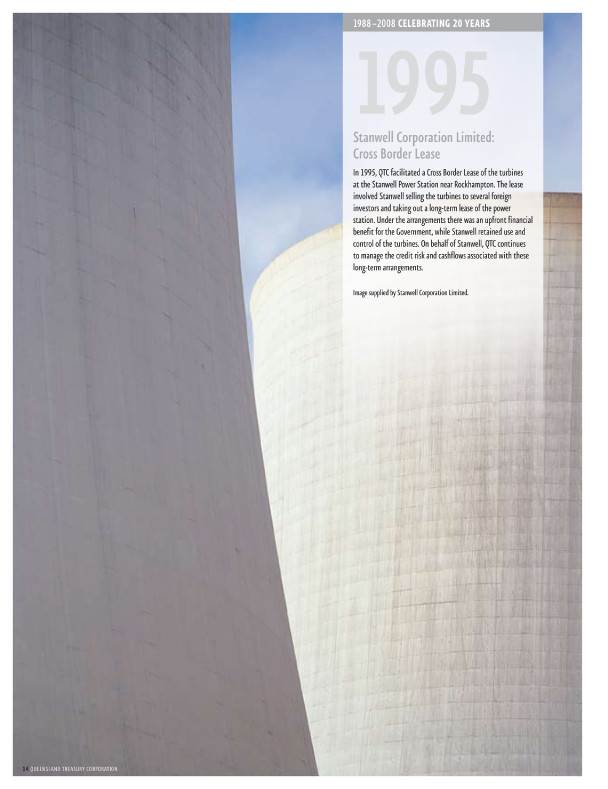
In 1995, QTC arranged a cross border lease for Stanwell Corporation Limited’s turbines, with a transaction size of $1.365 billion. It was, at the time, the largest cross border lease ever undertaken, and generated a benefit to the State of $94 million. The success of this project led to other cross border lease arrangements for major assets, including power lines and rolling stock.
In its role as the State’s provider of corporate treasury services, QTC has strived to provide valuable and independent insight and analysis into crucial areas of financial risk for the State.
4

In particular, QTC has taken a long-standing position on the criticality of managing risk when procuring infrastructure. Neither for nor against public private partnerships, QTC has been championing the crucial issue of risk management and its evaluation in these major deals since the late 1990s. Addressing these issues in major projects is even more relevant today with the Government’s commitment to its significant infrastructure program.
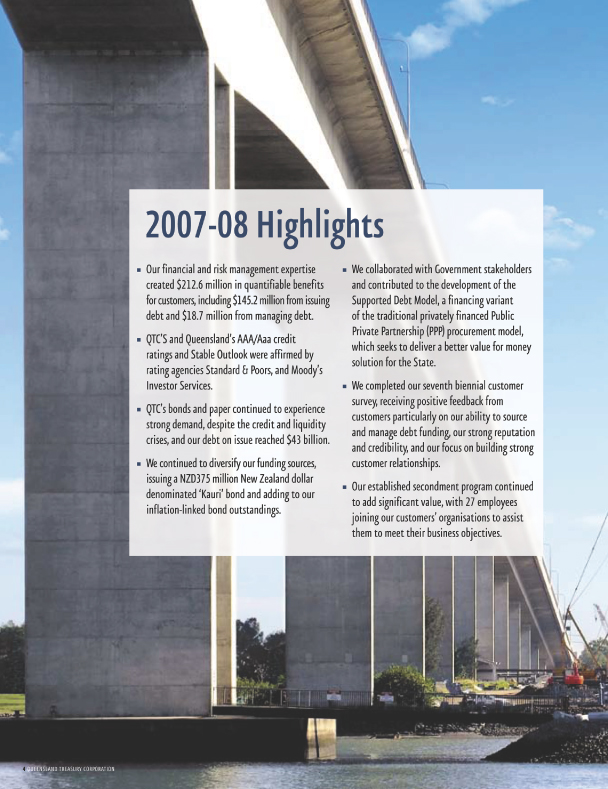
In 2007, QTC collaborated with Government stakeholders and contributed to the development of the Supported Debt Model. This model is a financing variant of the traditional privately-financed public private partnership model, and provides governments with a viable and responsible option to use public private partnerships to achieve their infrastructure objectives, despite the increasingly challenging market environment.
Similarly, to provide targeted support to the procurement of local government infrastructure development, QTC joined with the Local Government Association of Queensland in 2005 to establish LG Infrastructure Services Pty Ltd. LG Infrastructure Services provides assistance to local government in evaluating and delivering infrastructure projects in a cost effective and efficient manner. This joint venture was the first of its kind in Australia, and has achieved considerable success in its work with Queensland’s local governments.


Focusing on customers
In 1996, having achieved significant economies of scale and scope for customers, QTC reconsidered its strategic approach and embraced a customer loyalty operating model.
Recognising QTC’s ongoing success and viability was contingent on its ability to add real value to customers’ businesses, QTC set about developing a comprehensive understanding of customers, their businesses, challenges and future directions. This understanding, which is an evolving journey, is used to develop and deliver customised financial and risk management solutions for customers.
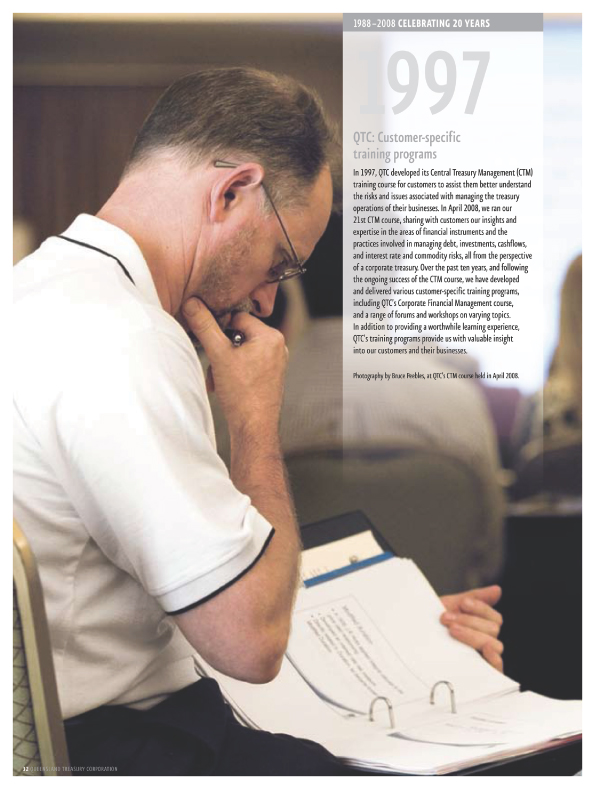
In 1997, QTC established its Central Treasury Management course to assist customers’ understanding of the concepts, financial instruments and practices involved in managing debt and interest rate risk. In 2002, QTC hosted its first Corporate Financial Management course, to assist customers in considering the key issues in financial management including determining capital structure, estimating cost of capital, evaluating projects and assessing risks, and establishing a framework for interest rate risk management. To encourage participation and reinforce learnings, QTC developed simulated models for both of these courses.

With greater understanding of its customers’ requirements, QTC has customised its lending products, establishing client specific debt pools for larger borrowers to give them complete flexibility and increased capacity to manage the risks inherent in their debt portfolios.
To provide more targeted support on customers’ major projects, QTC established a secondment program in 2002, and has now placed QTC employees in more than 100 key strategic and operational roles within customers’ businesses since that time.
In one of its most significant projects to date, QTC completed a major review of the financial sustainability of 109 of Queensland’s local governments in July 2007. The review provided valuable information that the Local Government Reform Commission used to assist it in determining the boundaries for the historic amalgamation that reduced existing local governments from 156 to 72.
QTC has had many achievements in its first 20 years of operations, funding vital infrastructure for the State’s development on terms and conditions second only to those achievable by the Commonwealth Government of Australia, and providing advice on key projects that have added real value to the lives of everyday Queenslanders.
By maintaining its relationships with the financial markets, understanding its customers’ needs and staying true to its corporate treasury services provider role, QTC intends to continue this success for many years to come.
5
6
7
Queensland Treasury Corporation
Queensland Treasury Corporation is the Queensland Government’s central financing authority and corporate treasury services provider, with responsibility to:
| | • | | source and manage the debt funding to finance Queensland’s infrastructure requirements in the most cost-effective manner |
| | • | | provide financial and risk management advice and services to the Queensland Government and its Queensland public sector customers, and |
| | • | | invest the State’s short- to medium-term cash surpluses, maximising returns to customers through a conservative risk management framework. |
QTC does not formulate Government policy, but works within the policy frameworks developed by the Government and Queensland Treasury. QTC’s role is not to take direct equity in projects, however, it may, at the direction of the Government, invest equity in special purpose vehicles established to achieve a specific outcome for the State.
Debt funding and management
QTC borrows funds in the domestic and international markets in a manner that minimises the State’s, and QTC’s, liquidity and refinancing risk. We then lend these funds to our customers, or use them to manage our customers’ debt or to refinance maturing debt.
With responsibility for all of the State’s debt raisings, QTC is able to capture significant economies of scale and scope in the issuance, management and administration of debt.
These economies, together with our AAA credit rating, result in a low cost of debt for Queensland’s public sector.
Financial advisory and risk management services
QTC works closely with its public sector customers to assist in managing their risk in financial transactions and achieve the best financial solutions for their organisations and for Queensland. In assisting customers, QTC does not provide advice that is contrary to the interests of the State.
We encourage our customers and Queensland Treasury, our major stakeholder, to use our organisation as an extension of their resources, by:
| | • | | providing them with low cost access to professional skills and resources to ensure that their financial risks are identified and managed on a consistent basis |
| | • | | acting as a central store of knowledge and expertise on financial structures and transactions, and the risks and benefits they encompass |
| | • | | providing Queensland Treasury with advice on matters of financial and commercial policy and risk relating to the State and its entities, and |
| | • | | working as a conduit between the Government and the private sector, using our economies of scale and scope to ensure that the best possible solutions are obtained. |
Short- to medium-term investments
QTC uses its financial markets expertise, developed through strong relationships with the domestic and international markets, together with its understanding of debt management and the management of financial risk, to provide customers with investment solutions that achieve a high return within a conservative risk environment.
8
Customers can choose from an overnight facility, a managed short-term fund, or fixed-term facilities. Alternatively, we can assist them to source appropriate solutions from the marketplace.
Vision
Efficient and effective financial risk management practices across our customers and the State.
Mission
To provide corporate treasury services to our customers and the State, by striving to understand our customers’ current and future needs and delivering solutions to meet those needs.
Values
Open communication, respect for the individual, integrity and honesty in all our dealings, good corporate citizenship, strong commitment, and valuable contributions.
9
10
11
Five-year Business Summary
| | | | | | | | | | | | | |
| | | Financial Year
2003–04 | | Financial Year
2004–05 | | | Financial Year
2005–06 | | Financial Year
2006–07 | | | Financial Year
2007–08 | |
Financial | | | | | | | | | | | | | |
| | | | | |
OPERATING ($000) | | | | | | | | | | | | | |
Interest from onlendings | | 371,737 | | 1,442,995 | | | 572,306 | | 768,624 | | | 1,489,666 | |
Management fees | | 22,144 | | 22,993 | | | 22,698 | | 24,820 | | | 31,504 | |
Interest on borrowings | | 468,243 | | 1,849,012 | | | 857,281 | | 1,144,884 | | | 2,077,211 | |
Interest as deposits | | 239,933 | | 262,307 | | | 302,987 | | 316,880 | | | 471,014 | |
Operating (loss)/surplus before payment in lieu of income tax | | 35,830 | | 57,735 | | | 62,310 | | 59,589 | | | (65,024 | ) |
Payment in lieu of income tax | | 12,553 | | 11,647 | | | 12,741 | | 13,740 | | | 15,681 | |
Operating (loss)/surplus after payment in lieu of income tax | | 23,277 | | 46,088 | | | 49,569 | | 45,849 | | | (80,705 | ) |
| | | | | |
BALANCE SHEET ($000) | | | | | | | | | | | | | |
Total assets | | 26,809,429 | | 30,345,228 | | | 33,492,178 | | 40,612,318 | | | 49,915,436 | |
Total liabilities | | 26,577,586 | | 30,067,297 | | | 33,164,678 | | 40,238,969 | | | 49,622,792 | |
Net assets | | 231,843 | | 277,931 | | | 327,500 | | 373,349 | | | 292,644 | |
| | | | | |
Customer | | | | | | | | | | | | | |
| | | | | |
SAVINGS FOR CUSTOMERS ($m) | | | | | | | | | | | | | |
Savings due to portfolio management | | 54.6 | | (9.1 | ) | | 46.5 | | (13.1 | ) | | 18.7 | |
Savings due to borrowing margin | | 63.1 | | 55.8 | | | 74.4 | | 82.1 | | | 145.2 | |
Total savings for customers | | 117.7 | | 46.7 | | | 120.9 | | 69.0 | | | 163.9 | |
Cumulative savings for customers | | 1,298.8 | | 1,345.5 | | | 1,466.4 | | 1,535.4 | | | 1,699.3 | |
| | | | | |
LOANS TO CUSTOMERS | | | | | | | | | | | | | |
Loans ($000) | | 17,714,737 | | 18,905,621 | | | 19,831,582 | | 24,268,854 | | | 32,911,506 | |
Number of onlending customers | | 308 | | 292 | | | 321 | | 313 | | | 280 | * |
Outperformance of benchmark
(% pa semi-annual) | | | | | | | | | | | | | |
Floating Rate Debt Pool | | 0.18 | | 0.16 | | | 0.19 | | 0.21 | | | 0.20 | |
3 Year Debt Pool | | 0.22 | | (0.02 | ) | | 0.27 | | 0.00 | | | 0.08 | |
6 Year Debt Pool | | 0.28 | | (0.07 | ) | | 0.23 | | (0.06 | ) | | 0.05 | |
9 Year Debt Pool | | 0.28 | | (0.14 | ) | | 0.20 | | (0.18 | ) | | (0.05 | ) |
12 Year Debt Pool | | 0.34 | | (0.13 | ) | | 0.24 | | (0.22 | ) | | (0.04 | ) |
15 Year Debt Pool | | 0.36 | | (0.15 | ) | | 0.23 | | (0.12 | ) | | 0.01 | |
| | | | | |
MANAGED FUNDS | | | | | | | | | | | | | |
Deposits ($000) | | 4,476,280 | | 5,220,644 | | | 5,329,329 | | 7,698,426 | | | 8,251,872 | |
Number of depositors | | 258 | | 270 | | | 253 | | 254 | | | 214 | |
Outperformance of benchmark
(% pa semi-annual) | | | | | | | | | | | | | |
Cash Fund | | 0.18 | | 0.17 | | | 0.16 | | 0.17 | | | 0.22 | |
12
| | | | | | | | | | |
| | | Financial Year
2003–04 | | Financial Year
2004–05 | | Financial Year
2005–06 | | Financial Year
2006–07 | | Financial Year
2007–08 |
| | | | | |
Financial Markets | | | | | | | | | | |
Debt outstanding** ($000) | | 21,702,155 | | 24,582,052 | | 27,519,577 | | 32,074,526 | | 40,728,150 |
QTC bond rates (% at 30 June) | | | | | | | | | | |
July 2009 | | 5.87 | | 5.31 | | 5.99 | | 6.68 | | 7.40 |
May 2010 | | — | | 5.34 | | 6.00 | | 6.72 | | 7.39 |
June 2011 | | 5.98 | | 5.35 | | 6.01 | | 6.74 | | 7.31 |
April 2012 | | — | | — | | — | | — | | 7.26 |
August 2013 | | 6.07 | | 5.36 | | 6.00 | | 6.69 | | 7.17 |
October 2015 | | 6.12 | | 5.37 | | 6.02 | | 6.66 | | 7.04 |
September 2017 | | — | | — | | — | | 6.64 | | 7.00 |
June 2021 | | 6.18 | | 5.40 | | 6.02 | | 6.58 | | 6.94 |
QTC Capital-Indexed Bond rates
(% at 30 June) | | | | | | | | | | |
August 2030 | | — | | — | | 2.51 | | 2.79 | | 2.32 |
Basis point margin over Commonwealth bonds | | 19.3 | | 22.5 | | 21.8 | | 33.1 | | 56.9 |
Basis point margin under NSW TCorp bonds | | 3.1 | | 2.5 | | 3.9 | | 1.8 | | 0.9 |
QTC global and domestic bonds on issue at face value ($000) | | 20,496,653 | | 22,186,715 | | 26,903,063 | | 33,000,416 | | 41,833,356 |
| | | | | |
Corporate | | | | | | | | | | |
Number of employees | | 130 | | 122 | | 132 | | 148 | | 160 |
Administration expenses ($000) | | 28,403 | | 30,021 | | 30,249 | | 32,958 | | 33,398 |
| * | The number of customers reduced from the previous year due to the amalgamation of local governments in March 2008. |
| ** | QTC holds its own stock and these holdings have been excluded from the debt outstanding figures. |
13
14
Chairman’s and Chief Executive’s report
In a year characterised by turmoil within the global financial markets caused by the fall-out from the credit and liquidity crises, Queensland Treasury Corporation completed its largest ever funding program of $13.8 billion, which included partial funding of next year’s program.
Despite the challenges faced in financial markets, QTC’s management of portfolios and borrowing margins alone achieved savings for customers of $163.9 million, bringing cumulative savings since inception to approximately $1.7 billion.
The significant widening of interest rate spreads in the financial markets, as a result of the global credit and liquidity crises, resulted in QTC recording its first-ever accounting loss before tax of $65 million for 2007–08, although QTC’s underlying operations continued to be profitable. It is important to note that this loss is modest in the context of QTC’s strong financial position, and is due to unrealised mark-to-market accounting losses of $116 million. These losses have no impact on QTC’s liquidity and are expected to be fully reversed in future years as financial instruments, affected by the movement in market spreads, mature. In the normal course of its business, QTC will hold these financial instruments to maturity and the accounting loss now recorded will unwind, as their face value is realised and the term to maturity shortens.
Fundamental transformation in the financial markets landscape
The global financial markets landscape was fundamentally transformed in 2007–08, primarily as a result of the United States’ sub-prime mortgage crisis, which began in August 2007. The major effects of this crisis continue to be large-scale downgrades of mortgage-backed securities, and acute illiquidity in debt securitisation and commercial paper markets, which has led to a sharp increase in the cost of funds for all borrowers. This phenomenon spread rapidly to other credit markets, effectively creating market failure in some market segments and challenging the capital adequacy of many major US and European banks. The desire for liquidity, along with increasing counterparty risk concerns, also created unprecedented pressure within global inter-bank money markets.
This has created an environment of greater market risk and volatility, along with a higher cost of funds (relative to Commonwealth Government issues) for QTC, which we expect to continue for the foreseeable future.
For QTC, adjusting to this transformation within the financial markets, which effectively saw the markets move from a ‘traded’ to a ‘brokered’ model, was made easier given the strong, long-term relationships we maintain with the members of our financial markets distribution group and, through them, our investors.
While the effects of this crisis have been wide-reaching in other jurisdictions, the Queensland Government’s established investment guidelines have ensured that no Government-owned corporations, statutory authorities or local governments have had exposure to the sub-prime mortgage market, or have invested in collateralised debt obligations. The guidelines for local governments were developed by QTC, Queensland Treasury and the Department of Local Government, Sport and Recreation to guide local governments in their investments, and have proven effective.
In addition, QTC had no exposure to the sub-prime market or to collateralised debt obligations.
Queensland economy: exceeding the national average for the twelfth consecutive year
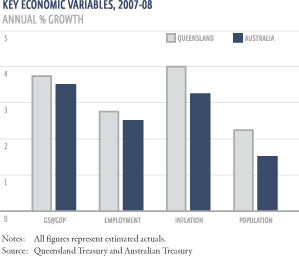
Amid the global financial markets turmoil, the Queensland economy is estimated by Treasury to have grown by 3.75 per cent in 2007–08, against expectations of national average economic growth of 3.50 per cent over the same period. Such an outcome would mean Queensland’s annual economic growth outpaced that of the nation for the twelfth consecutive year.
15
Looking ahead, annual Queensland economic growth is forecast to rise to 4.25 per cent in 2008–09, in contrast to an anticipated easing in national economic growth to 2.75 per cent. Indeed, the Queensland economy is the only State economy expected to record an increase in annual growth in 2008–09 over 2007–08, according to each of the latest state treasury department estimates. This acceleration in growth is expected to be underpinned by a significant strengthening in exports and business investment growth, due to high commodity prices, partially offset by an easing in consumer-demand growth, due to higher mortgage interest rates.
Notwithstanding this backdrop of solid economic growth, financial conditions have been tightened considerably in Australia, due to the Reserve Bank of Australia’s monetary policy actions. This has had a positive impact on inflation, but the consequential negative effect on consumption and investments has reduced somewhat the economic growth expectations of the State.
Significant funding task ahead
QTC now has more than $43 billion of debt on issue, a significant increase on the $34 billion, as at 30 June 2007. In the recent announcement of Queensland’s State Budget for 2008–09, Treasurer Andrew Fraser forecast a strong rise in Queensland Government investment in infrastructure, with more than $17 billion allocated for capital works in the coming year. Total capital expenditure in the State, including local authorities, is expected to be more than $20 billion, with the debt portion of $12.4 billion to be funded by QTC.
It is estimated that QTC’s funding task for the financial year 2008–09 will be $16.3 billion, with $6.7 billion required to refinance maturing debt (particularly the maturity of the July 2009 Benchmark Bond) and the balance required to fund new capital works expenditure of the Queensland public sector. It is anticipated that our AUD benchmark bonds will once again provide the bulk of the funding for next year, as relatively high domestic interest rates and a strong Australian dollar continue to encourage investor support both domestically and internationally. QTC will also continue to seek issuance in other markets, through its diverse range of funding facilities, as the complexities of the current credit and liquidity crises give rise to a more challenging operating environment.
Innovative financing solutions for infrastructure
In pursuit of the best value for money outcomes for the State’s expanding infrastructure development program, QTC responded to the Government’s request for innovative financing solutions and, in collaboration with Government stakeholders, contributed to the development of the Supported Debt Model (SDM).
The SDM is a financing variant of the traditional privately-financed public private partnership (PPP) model, and seeks to deliver a better value for money solution for the State. Under a SDM, a state government’s borrowing authority (in Queensland, QTC) provides the notionally risk free level of senior debt for a project upon completion of the construction phase and for the term of the lower risk operational phase. The amount of senior debt would vary depending on the risk profile of a specific project.
Initially developed for the South East Queensland Schools project, the SDM is a potential alternative financing option for the State’s other major social infrastructure projects. Its use in Queensland will be considered on a case-by-case basis under the Government’s Value for Money Framework.
With the significant widening of credit margins, and the resulting hike in the cost of funds, the SDM provides governments with a viable and responsible option to use PPPs to achieve their infrastructure objectives, despite the increasingly adverse market environment.
16
Support for local government
During the year, QTC fulfilled an integral role in the significant reform of Queensland’s local governments. In July 2007, the State Government announced that it would reduce existing local governments from 156 to 72 to create stronger councils to better manage the changing demographics, including population growth, and the demands of industry and other interest groups. QTC’s Chairman was appointed to the Local Government Reform Commission, and two senior employees were seconded to the project to assist with data analysis.
During this challenging time for the industry, QTC worked closely with local government customers, providing financial and risk management advice to assist them with their financial sustainability prior to and during the reform process.
Since its establishment in 2005, LG Infrastructure Services—QTC’s joint initiative with the Local Government Association of Queensland to support Queensland’s local governments to achieve their infrastructure developments—has provided advice and services to more than 60 local governments throughout the State, representing more than 80% of local governments in Queensland. In 2007–08, LG Infrastructure Services will return a dividend to its shareholders and begin repayment of the Treasury grant provided for its establishment in 2005.
17

Transfer of State’s long-term financial assets to QTC
On 1 July 2008, the Government transferred to QTC approximately $21 billion of the State’s long-term financial assets, which are held to meet future superannuation and other long-term obligations of the State. In return for this transfer, QTC entered into a financial arrangement to provide a fixed rate note to the General Government sector, at a rate initially set at 7.5% per annum, which is the actuarially assessed long-term average rate of return for a managed diversified portfolio of investments. The purpose of the transfer is to reduce the volatility in the State Budget as a result of the fluctuation in returns from the investment of these assets.
QTC will incur accounting profits or losses in the future, due to the volatility in investment returns in the market, although the return on the assets is expected to match the long-term average of 7.5% per annum.
As the transfer has no effect on cashflow, there will be no impact, positive or negative, on QTC’s capacity to meet its financial obligations. The liability for superannuation has not been transferred to QTC, and remains with the Government. With no impact from a whole-of-Government perspective, rating agencies Moody’s and Standard & Poor’s have confirmed that this transfer will not affect the State’s, or QTC’s, AAA credit rating or Stable Outlook.
Looking ahead
In the year that we celebrate our twentieth year of operations, and following the significant changes of the past year to the world’s financial environment, it will be more important than ever for us to continue to attract the support of the world’s financial institutions for QTC’s debt issuance, and the other support services they provide. It will also be important for us to continue to understand our customers and their evolving financial and risk management needs, given the dynamic environments in which they operate.
Following sound results from our biennial customer survey, which was completed in July 2007, we will be reinvigorating our organisation-wide customer loyalty program and updating our strategic plan. Development will continue on our customer lending and administration system, which is one of the most significant corporate projects QTC has undertaken and is expected to be completed in 2009–10.
With the State’s commitment to achieving major infrastructure development, we will focus our efforts on adding real value to those projects, either as advisors or as secondees within our customers’ project teams, and to supporting our customers in the achievement of their business goals.
It is the demonstrable expertise, professionalism and enthusiasm of our employees that has ensured QTC’s success over time, and we thank each and every one of our staff for their valued input. In the year to come, QTC will again focus on attracting and retaining the high calibre of people we are so fortunate to employ.
On a final note, we gratefully acknowledge the guidance and wisdom of our Board, and thank them for their ongoing support. Our sincere thanks also to David Coe, who resigned from the Board in February 2008, for his valuable contribution.

18

19
Customer report
As the world’s financial markets struggled through 2007–08, QTC was able to clearly demonstrate the bottom-line value it adds to the Queensland public sector, managing the State’s borrowing program to ensure customers had access to the funds they required at a competitive rate.
Our financial and risk management expertise created $212.6 million in quantifiable benefits for customers, including $145.2 million from issuing debt and $18.7 million from managing debt. We saved our customers $27.5 million from managing their liquidity and refinancing risk, and $5.8 million from structuring transactions. Our financial advisory services and strategic interest rate risk management advice generated customer savings of around $15.4 million.
QTC’s corporate commitment to achieving the best financial outcomes for our customers and the State was progressed through our involvement in a significant number of key Government projects, including the proposed Queensland Children’s Hospital and North Bank developments, the establishment of the SEQ Water entities, the water infrastructure purchased from local governments, the proposed sale of the airports, and the evaluation of carbon emissions across Government.
After completing the review of local government financial sustainability in June 2007, we received a rating of 6 out of 7 in our biennial customer survey for adding real value to local governments through our understanding of their businesses and presenting material that could be easily understood. We also provided support to the Government in implementing the reform of the local government boundaries, and to our local government customers during the reform process. See page 18 for further details on the assistance QTC provided to the State’s local government reform process.
In collaboration with Government stakeholders, we contributed to the development of the Supported Debt Model—a financing variant of the traditional privately financed Public Private Partnership procurement model—to assist the State in its pursuit of innovative financing solutions for its expanding infrastructure development program. See page 12 for further details on the Supported Debt Model.
As LG Infrastructure Services completed its third successful year of operations, it broadened its reach into the local government industry and has now worked with more than 80 per cent of the State’s local governments and regional local government collaboration groups. See page 40 for further details on the LG Infrastructure Services initiative.
Funding the State
In the year under review, largely as a result of the demise of the US sub-prime mortgage market, the global financial markets’ environment was particularly challenging with global liquidity tightening to almost unprecedented levels. This led to greater uncertainty in funding markets, particularly those relating to asset-backed securities, which in turn led to a significant widening of market credit spreads. QTC was positively impacted by the changed market conditions in that it experienced the benefit of investors seeking high credit quality assets. However, there were also some less positive influences and, as a result, QTC was constantly adapting its issuance strategies to best suit the changing market circumstances.
During this period, QTC pursued a number of funding strategies to achieve the best possible outcomes for our customers and the State. Some of these strategies and initiatives included:
| | • | | issuing debt on demand from our investors, rather than through our normal tender process, in order to better manage our cost of funds |
| | • | | increasing the supply of inflation-linked bonds on issue, providing suitable funding for customer projects which have long asset lives and revenue linked to inflation |
20
| | • | | identifying offsetting cashflows of customers and managing the timing of market transactions to minimise transaction costs |
| | • | | issuing a new benchmark bond to mature in 2012 to further minimise interest rate risk for some of our customers, including Powerlink |
| | • | | raising funds in advance of requirements to deliver interest cost certainty for customers involved in the delivery of significant infrastructure projects, and |
| | • | | extending our borrowing horizon for terms longer than previously contemplated, by issuing a new bond maturing in 2033 to meet discreet investor requirements. |
21
22
Greater involvement in customer projects
Our established secondment program continued to add significant value to our customers’ businesses through the placement and contributions of 27 of our employees into their organisations. In addition to the value provided to customers on their projects and teams, QTC benefited from an increased understanding of the issues effecting our customers and the specific industries they work in, and our employees benefited from the unique development opportunities of working on some of the most significant projects in the State.
In the past year, our employees have worked as secondees on some of the State’s most important projects which have delivered, or have the potential to deliver, significant economic value to customers and the State. These projects included the reform of local government boundaries, the Government’s purchase of the SEQ local governments’ bulk water and water treatment assets, the sale of the Government’s gas assets, and the proposed sale of the Cairns and Mackay airports and the Government’s remaining shareholding in the Brisbane airport.
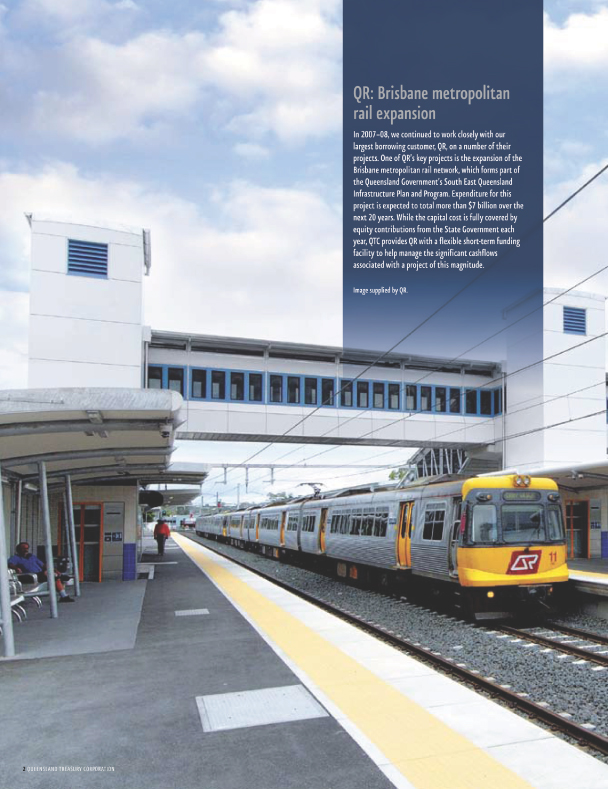
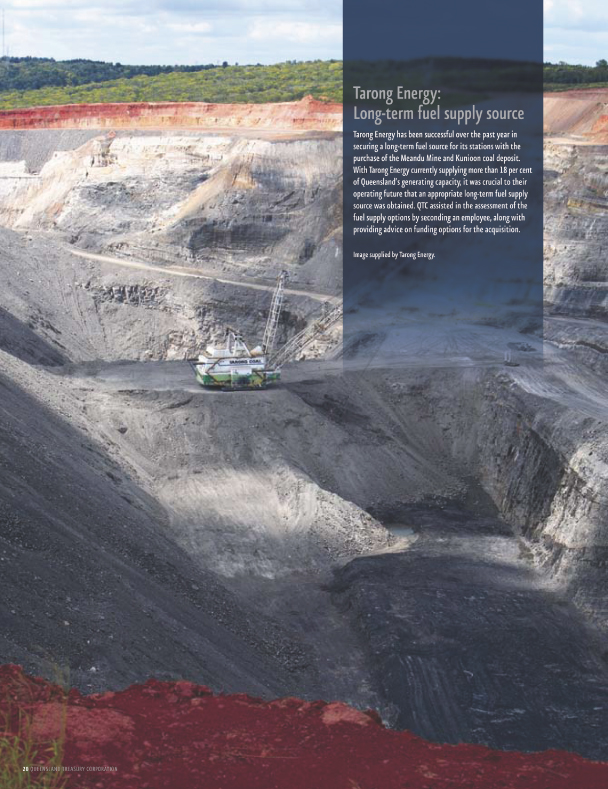
We also placed secondees into the Office of Government Owned Corporations, the Department of Main Roads, the Department of Infrastructure and Planning, Queensland Health, Tarong Energy Corporation, Ergon Energy Corporation Ltd, and QR Limited to assist with their major projects.
More and varied customer assignments
As implementation and delivery of the State’s major infrastructure program gathered momentum, we identified opportunities and promoted innovative solutions to help minimise costs and ensure an appropriate level of project risk transfer between the Government and private sector. It was a year characterised by increased demand for debt funding for infrastructure, as well as increased demand for advisory assistance in areas including business case and financial model reviews, and debt and capital structuring arrangements.
FINANCIAL MODELLING
Our financial modelling capability continued to expand. In recognition of the expertise of our team, several customers sought multiple financial model build services during the year, including Ergon Energy Corporation Ltd, QR Limited, Queensland Treasury and LG Infrastructure Services. In particular, we
| | • | | developed financial models including the financial model for QR Limited access network |
| | • | | tailored forecasting models for several local governments including Gold Coast City Council, Gold Coast Water, Logan City Council; as well as for QR Limited and QFleet |
| | • | | developed a benchmark model for Government to assist in assessing the North Bank development proposal |
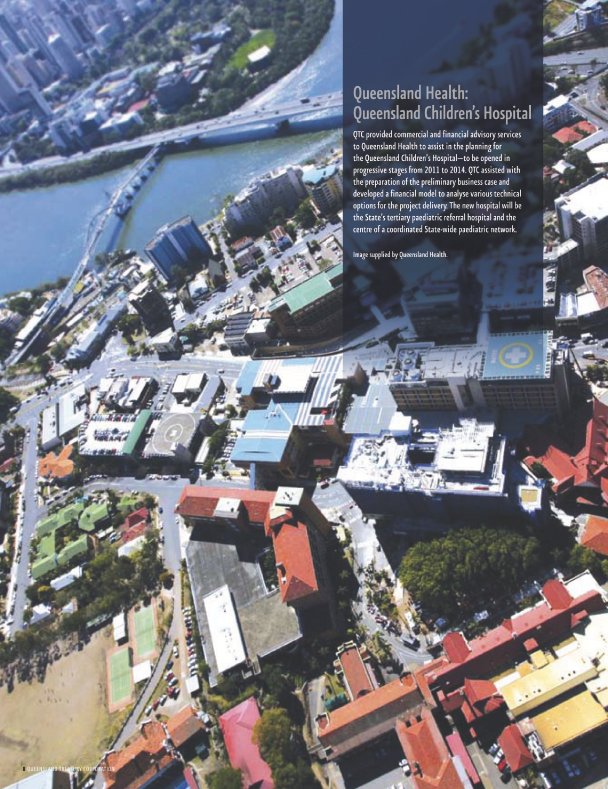
| | • | | developed a financial model to assist Queensland Health in evaluating the capital and operating costs of the various delivery options for the Queensland Children’s Hospital, and |
| | • | | reviewed the financial models of Powerlink Queensland, Ports Corporation of Queensland, Ergon Energy, Port of Brisbane Corporation and QFleet. |
REVIEWING CREDIT AND FINANCIAL SUSTAINABILITY REVIEWS
To assist the Government in its approval process for the Government-owned corporations’ (GOC) annual borrowings, we completed annual credit reviews of each corporation to determine their individual capacities to service their existing and proposed new debt. We provided Treasury with specific recommendations based on the finding of these reviews. We also completed credit analyses on a project-by-project basis for our GOC customers, and reviewed the capital structure on behalf of various borrowing customers.
Our Government department customers also sought our assistance to complete financial and commercial viability assessments, including the Department of Education, Training and the Arts’ ‘Solar for Schools’ program, and the Department of Public Works’ development of the Roma Street Parklands. We also worked with Brisbane City Council (BCC) to perform an annual assessment of their borrowing capacity, and have since been requested by BCC to undertake their credit reviews on a semi-annual basis.
23
24
RISK MANAGEMENT
We provided cash management advice around the optimal management of the Government’s cash balances and debt in light of the current market environment, ensuring sound debt management practices were in place to reduce the vulnerability of the State to economic and financial shocks over the short-, medium- and long-term.
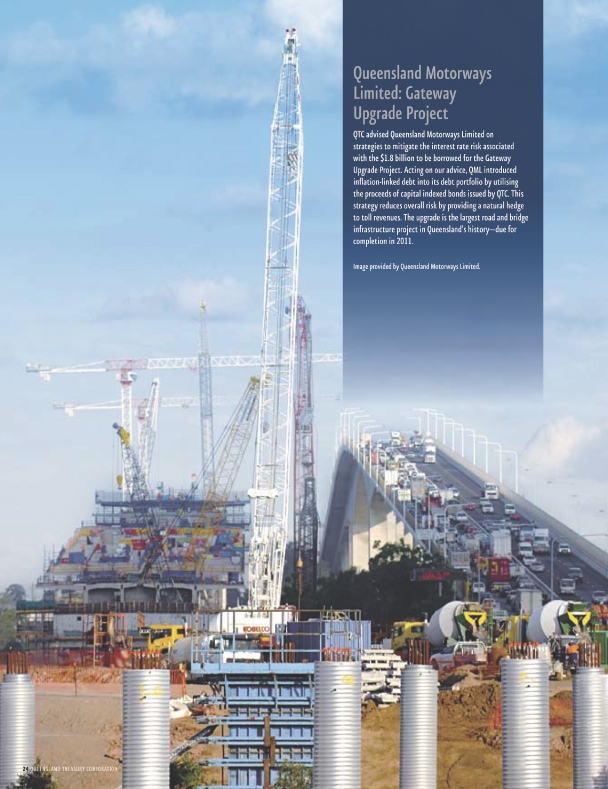
We also advised on interest rate risk management and funding strategies for most of the State’s major projects, including the Gateway Bridge duplication, Hale Street Bridge, Airport Link, the State’s various water companies and SEQ Schools, and developed a commodity and foreign exchange risk management framework for Energex Ltd, Ergon Energy Corporation Ltd, and CS Energy.
In consultation with Queensland Treasury, the Department of the Premier and Cabinet and the Office of Climate Change, we led the initial development of a whole-of-Government program for identifying, quantifying and understanding the potential risks and costs for our customers associated with the proposed introduction of the Carbon Pollution Reduction Scheme in 2010.
SUPPORTING INFRASTRUCTURE DEVELOPMENT
During the year, we contributed to various procurement phases on many of the State’s major projects, including Queensland Children’s Hospital (master planning and business case), North Bank (planning and evaluation of preferred private sector proponent’s proposal), SEQ Schools (planning, Supported Debt Model development, and financial advice), Carbon Pollution Reduction Scheme (planning and pilot review), Solar for Schools (planning and feasibility), and the Sunshine Coast Hospital (Supported Debt Model feasibility).
We are also working with the Department of Infrastructure and Planning to develop Contract Management Guidelines for inclusion in the State’s Value for Money Framework, based on the assistance we provided in 2007 to the Southbank Institute of Technology in the development of a long-term contract administration manual.
Seeking customer feedback
QTC engaged an independent consultant to conduct our seventh biennial customer survey in 2007, seeking feedback from a cross-section of our customer base. Overall, customer feedback was generally very positive, particularly in relation to our responsiveness to issues our customers consider important. The customer survey, and anecdotal feedback on projects, indicated that our customers recognise our understanding of Government and engagement with our customers. Specifically, our stakeholders identified our core expertise of sourcing and managing the debt funding to finance the State, our strong reputation and credibility, and our focus on building strong relationships with our customers, as key examples of our high level of performance. The feedback provided by our customers and stakeholders through the surveys and post-assignment evaluations has now been incorporated into our annual planning processes to guide our provision of services in 2008–09.
One of the key areas for development that came through the survey was the need for customer training. To assist our customers with their training needs, we ran our Central Treasury Management in April 2008 and Cost of Capital courses in July and August 2007. We have also focused on leveraging the diverse range of expertise available from the banks in our Distribution Group to host forums on climate change and the hedging of financial risk, including foreign exchange and commodity price risk, and various economic events during the year.
25
26
27
28
Investor report
Solid domestic and foreign investor demand for all lines of Queensland Treasury Corporation’s (QTC) AUD benchmark bonds and commercial paper continued during 2007–08, as investors sought high credit quality, liquid assets in the uncertain global market environment.
As a result of investor ‘flight-to-quality’ following the market’s credit and liquidity crises, QTC was able to source funds from an even broader range of investors seeking secure, AAA rated, government-guaranteed bonds. We completed our borrowing program some months prior to year end, with actual borrowings for 2007–08 totalling $13.8 billion.
Relationships with members of our Distribution Group of bankers were further strengthened, as we faced the challenges of 2007–08 together. Our commitment to ensuring openness and transparency in these relationships assisted our Distribution Group members to consistently make markets in QTC bonds at competitive prices. As a result, we were able to enhance liquidity by issuing more bonds than we had initially intended. With investor interest in semi-government bonds continuing to grow, we also increased the size of our Distribution Group, with the addition of JP Morgan Australia Limited. At the end of June 2008, our Distribution Group included 12 of the world’s leading financial institutions, providing our investors with even greater depth in terms of their ability to transact QTC bonds.
The global credit and liquidity crises led to a sharp widening of all credit spreads, and the spread of QTC bonds to the Commonwealth Government curve (like the spreads of the other Australian semi-government issuers) was not immune. At one point during the year, we witnessed semi-government versus Commonwealth Government spreads trading at margins of more than 80 basis points, the largest margin in more than a decade. This move in spreads was accentuated by the prevailing ‘scarcity’ premium built into Commonwealth Government securities and reflected the high degree of uncertainty in the financial markets at the time.
In May 2008, the Commonwealth Government announced three key structural changes to the Australian government bond markets. The first involved its intention to make all semi-government debt issued onshore eligible for exemption from Interest Withholding Tax. This is in-line with the existing exemption available for semi-government debt issued offshore. QTC sees this as very positive for the semi-government bond market, broadening the global investor base and enhancing the overall depth and liquidity of our market.
The Government’s second announcement involved its intention to increase the issuance of Commonwealth Government securities by up to $25 billion over the next four years. With $5 billion of this additional issuance already confirmed for 2008–09, we believe this initiative will further strengthen Australia’s financial markets.
The third announcement of structural change to the Australian Government bond markets involved the widening of the investment mandate of the Australian Office of Financial Management, to enable it to invest the proceeds from the increased Commonwealth Government securities issuance in the most appropriate manner. Importantly, this will include investment in semi-government bonds. We believe the aggregate impact of these structural changes will be positive for the semi-government bond market, and anticipate it will lead to increased demand for QTC bonds from both onshore and offshore investors.
Investor highlights
| | • | | QTC’s debt on issue reached more than $43 billion, at 30 June 2008. |
| | • | | QTC’s bonds and paper continued to experience strong demand, despite the credit and liquidity crises. |
| | • | | QTC’s AAA/Aaa ratings and Stable Outlook were affirmed by both Standard and Poor’s and Moody’s. |
| | • | | QTC executives visited investors in Canada, China, France, Hong Kong, Japan, New Zealand, Qatar, Singapore, United Arab Emirates, United Kingdom and the United States of America. They were supported by the State’s Treasurer and Under Treasurer on certain visits. |
29
| | • | | QTC continued to diversify its funding sources, issuing a NZD375 million New Zealand dollar denominated ‘Kauri’ bond, and adding to its inflation-linked bond outstandings. |
QTC’s credit rating
| | | | | | |
LOCAL CURRENCY | | LONG-TERM | | SHORT-TERM | | OUTLOOK |
Moody’s | | Aaa | | P1 | | Stable |
Standard & Poor’s | | AAA | | A-1+ | | Stable |
| | | |
FOREIGN CURRENCY | | LONG-TERM | | SHORT-TERM | | OUTLOOK |
Moody’s | | Aaa | | P1 | | Stable |
Standard & Poor’s | | AAA | | A-1+ | | Stable |
30
31
Review of 2007–08 funding activity
QTC increased the size of its debt issuance program in order to meet the growing borrowing requirement for Queensland’s spend on infrastructure projects. Actual borrowings for 2007–08 totalled $13.8 billion, compared to $5.9 billion in 2006–07.
Solid domestic and foreign investor demand saw the issuance of QTC’s AUD benchmark bonds provide the majority of required funding, contributing more than $11 billion in 2007–08. QTC’s diversified funding facilities, including commercial paper and medium-term notes, also enabled debt issuance denominated in foreign currencies despite the uncertain and volatile credit and liquidity conditions prevailing in global markets. As is QTC’s policy, all foreign currency proceeds were swapped into Australian dollars.
Funding related activities for QTC in 2007–08 included:
| | • | | Refinancing the maturity of QTC’s 14 September 2007 benchmark bond, with a total of $3.2 billion outstanding as at 30 June 2007. |
| | • | | In September 2007, QTC became the first Australian government entity to issue a bond in the New Zealand dollar denominated ‘Kauri’ format. The ten-year deal, issued under our Euro medium-term note program, was for a total size of NZD375 million, with a coupon of 7.125% and a maturity date of 18 September 2017. The issue was well received by global investors and added further diversification to QTC’s funding base. |
| | • | | In November 2007, the amount on issue of QTC’s 2.75%, 20 August 2030 Capital Indexed Bond was increased by AUD275 million, taking total issuance to AUD543 million. Investor demand for this inflation-linked bond was strong, with total investor interest significantly greater than the amount allotted. |
| | • | | In March 2008, a new long-dated QTC domestic preferred bond line maturing in 2033 was established through an initial issue of AUD500 million. |
| | • | | In May 2008, QTC launched a new AUD domestic benchmark bond with a coupon of 6.5% and a maturity date of 16 April 2012. The issue was very well supported by the market, with the volume on issue building to almost $2 billion in the first week. |
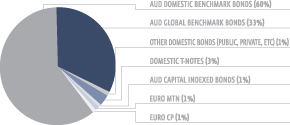
The following table details the change in net issuance in QTC’s principal funding sources over the year:
| | | | | | |
FUNDING FACILITY | | 30 JUNE 07 | | 30 JUNE 08 | | NET CHANGE |
| | | AUD | | AUD | | AUD |
Domestic | | | | | | |
Benchmark Bonds | | 20,468 | | 26,275 | | 5,807 |
| | | |
Global | | | | | | |
Benchmark Bonds | | 11,659 | | 14,380 | | 2,721 |
Capital Indexed Bonds | | 268 | | 543 | | 275 |
Other Domestic Bonds | | 598 | | 596 | | -2 |
Euro MTN | | 159 | | 399 | | 240 |
CP | | 602 | | 1,452 | | 850 |
| | | | | | |
TOTAL | | 33,754 | | 43,645 | | 9,891 |
| | | | | | |
Funding facilities at 30 June 2008
A$ BENCHMARK BONDS—DOMESTIC AND GLOBAL
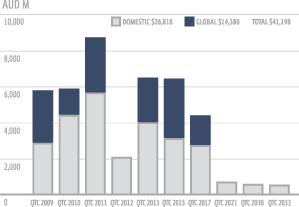
QTC currently offers investors domestic and global benchmark bonds maturing in 2009, 2010, 2011, 2012*, 2013, 2015 and 2017, and preferred domestic bond lines maturing in 2021 and 2033.
32
In addition, QTC also has an inflation-linked capital indexed bond maturing in 2030 issued under the AUD domestic bond facility.
The QTC benchmark bonds are our core source of funds, comprising in excess of 90% of total borrowings as at 30 June 2008.
DOMESTIC AND GLOBAL QTC BONDS ON ISSUE, AS AT 30 JUNE 2008
33
34
Funding Facilities details, as at 30 June 2008
| | | | | | | | | | | | |
FACILITY | | SIZE $M | | GOVERNING LAW | | MATURITIES | | CURRENCIES | | ISSUE
AUD M | | PLACEMENT |
Domestic AUD Bond | | Unlimited | | Queensland | | 7 benchmark lines: 2009 to 2017 | | AUD | | 25,110 | | By tap or tender through Distribution Group |
| | | | | | 2 preferred lines: 2021 and 2033 | | AUD | | 1,166 | | Reverse enquiry through Distribution Group |
| | | | | | Capital Indexed Bond: 2030 | | AUD | | 543 | | By tap or tender through Distribution Group |
Global AUD Bond | | 18,000 | | New York and Queensland | | 6 benchmark lines: 2009 to 2017 (transferable to domestic bonds) | | AUD | | 14,380 | | Continuously offered through Distribution Group |
Treasury Notes, Commercial Paper and Medium-Term Notes
The QTC treasury note (T-Note) facility is a domestic electronic issuance facility and is our chief source of short-term domestic AUD funds. QTC’s main offshore programs are the multicurrency commercial paper (CP) and medium-term note (MTN) facilities in both the Euro and US markets.
| | | | | | | | | | | | |
FACILITY | | SIZE $M | | GOVERNING LAW | | MATURITIES | | CURRENCIES | | ISSUE
AUD M | | PLACEMENT |
Domestic T-Note | | Unlimited | | Queensland | | 7 to 365 days | | AUD | | 1,000 | | By tap through Dealer Panel |
Euro CP | | USD 3,000 | | English and Queensland | | 7 to 365 days | | Multicurrency | | 401 | | Continuously offered through Dealer Panel |
US CP | | USD 1,500 | | New York and Queensland | | 1 to 270 days | | Multicurrency | | 52 | | Continuously offered through Dealer Panel |
Multicurrency Euro MTN | | USD 3,000 | | English and Queensland | | Subject to market regulations | | Multicurrency | | 398 | | Reverse enquiry through Dealer Panel |
Multicurrency US MTN | | USD 500 | | New York and Queensland | | 9 months to 30 years | | Multicurrency | | 0 | | Reverse enquiry through Dealer Panel |
QTC’s funding facilities are supplemented with public issues and private placements.
35
36
All funding facilities
PERCENTAGE OUTSTANDINGS UNDER QTC’S FUNDING FACILITIES, AS AT 30 JUNE 2008
Borrowing program
QTC announces its borrowing requirement annually in June to provide a funding estimate for the following year, after the release of the Queensland Government budget. A half-year review, and update of the borrowing requirement, is provided in January.
QTC’S INDICATIVE BORROWING PROGRAM FOR 2008–09 FINANCIAL YEAR
| | | | | | |
BORROWING DETAILS | | 2008–09 | | | 2007–08
(REVISED*) | |
| | | AUD M | | | AUD M | |
REFINANCING OF MATURING DEBT: | | | | | | |
| | |
AUD benchmark bonds | | 0 | | | 3,173 | |
AUD non-benchmark bonds | | 69 | | | 101 | |
Medium-term notes (MTNs) | | 0 | | | 52 | |
Commercial paper1 | | 1,457 | | | 613 | |
| | | | | | |
TOTAL MATURING DEBT | | 1,526 | | | 3,939 | |
| | | | | | |
ADJUSTMENTS: | | | | | | |
| | |
Prefunding of Sep 2007 | | | | | | |
Benchmark Bond maturity | | — | | | (1,500 | ) |
Prefunding of Jul 2009 | | | | | | |
Benchmark Bond maturity | | 5,741 | | | — | |
Principal repayments from QTC customers | | (600 | ) | | (600 | ) |
| | | | | | |
TOTAL REFINANCING | | 6,667 | | | 1,839 | |
| | | | | | |
NEW BORROWING: | | | | | | |
| | |
Capital works and asset procurement | | 12,365 | | | 10,772 | |
Funding in advance of customer borrowings | | (2,700 | ) | | (3,219 | ) |
| | | | | | |
TOTAL NEW BORROWING | | 9,665 | | | 7,553 | |
| | | | | | |
TOTAL BORROWING PROGRAM2 | | 16,332 | | | 9,392 | ** |
| | | | | | |
37
The 2008–09 borrowing estimate of $16,332 million is expected to be funded as follows:
| | | | | | |
| | | EXPECTED RAISINGS 2008–09 |
FUNDING SOURCE | | RANGE | | LOW | | HIGH |
| | | % | | AUD M | | AUD M |
TERM RAISINGS: | | | | | | |
AUD bonds3 | | 60–70 | | 9,800 | | 11,430 |
MTNs and other currency loans | | 5–15 | | 820 | | 2,450 |
| | | |
COMMERCIAL PAPER RAISINGS: | | | | | | |
T-Notes, ECP, USCP | | 20–30 | | 3,270 | | 4,900 |
Notes:
| 1. | Estimated commercial paper outstanding as at 30 June. |
| 2. | Funding activity may vary depending upon actual customer requirements, the State’s fiscal position and financial market conditions. |
| 3. | Includes AUD domestic and global benchmark bonds, capital indexed bonds and other term issuance. |
| * | Based on the State’s Mid Year Fiscal and Economic Review released on 14 December 2007. |
| ** | Actual borrowing totalled AUD13,828 million to meet increased liquidity and customer requirements. |
38
39
Economic and Fiscal report
Queensland’s economic outlook
ECONOMIC GROWTH
| | • | | Growth in the Queensland economy is forecast to accelerate slightly to 4 1/4 per cent in 2008–09, in contrast to an anticipated easing in national growth to 2 3/4 per cent. A significant strengthening in exports growth, combined with stronger growth in business investment, is anticipated to more than offset an easing in growth in consumer demand, facilitating some rebalancing in the composition of economic growth. |
| | • | | Growth in private consumption is forecast to ease to 4 1/2 per cent in 2008–09. A fall in dwelling investment in 2007–08 is forecast to slow growth in housing-related spending in 2008–09, while more moderate asset price growth should ease growth in wealth related spending. However, ongoing growth in wages and employment is forecast to support growth in incomes. |
| | • | | Growth in business investment is forecast to strengthen slightly to 9 1/4 per cent in 2008–09. Growth in investment in other buildings and structures is forecast to accelerate, led by mining and major commercial development projects. |
CONTRIBUTIONS TO GROWTH IN QUEENSLAND’S GROSS STATE PRODUCT
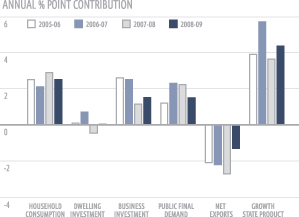
| Notes: | Contributions for 2007–08 represent estimated actuals while contributions for 2008–09 represent forecasts. |
| Source: | Queensland Treasury |
TRADE SECTOR
| | • | | Capacity expansions and a return to normal seasonal and operating conditions are forecast to see exports growth improve substantially in 2008–09, to a four-year high of 4 1/4 per cent. |
| | • | | In contrast, an easing in growth in private consumption and machinery and equipment investment is forecast to moderate growth in total imports to 6 3/4 per cent in 2008–09. As a result, net exports are forecast to detract only 1 1/4 percentage points from overall growth in 2008–09. |
INFLATION
| | • | | Inflation is forecast to ease to 3 1/2 per cent in 2008–09. This reflects a return to normal seasonal conditions, which should ease domestic food price growth, as well as an assumed stabilisation in global credit conditions, which is expected to dampen growth in the cost of financial services. However, the tight labour market, high capacity utilisation and growth in rents will limit downward pressure on inflation over the year. |
40
EMPLOYMENT
| | • | | Jobs growth is forecast to moderate marginally, to 2 1/2 per cent in 2008–09. While supported by non-dwelling construction and the rise in the terms of trade, jobs growth is anticipated to ease slightly, in line with forecast slower growth in consumer spending. However, jobs growth is forecast to match labour force growth, leaving the year-average unemployment rate at a generational low of 3 3/4 per cent. |
2007–08 ECONOMIC HIGHLIGHTS
| | • | | The Queensland economy is estimated to have expanded by 3 3/4 per cent in 2007–08 and exceed growth nationally for the twelfth successive year. |
| | • | | Reflecting strong growth in consumer incomes and house prices, household consumption growth is estimated to have strengthened to 5 1/4 per cent in 2007–08. |
| | • | | Limited spare capacity in the economy is estimated to have driven further growth in private and public investment, albeit at more modest rates than in recent years. |
| | • | | Jobs growth is expected to have surpassed labour force growth, reducing the State’s unemployment rate for the sixth consecutive year, to 3 3/4 per cent in 2007–08, the lowest year-average rate in 34 years. |
| | • | | Employment is estimated to have risen by 2 3/4 per cent, or 55,000 persons, in 2007–08, supported by higher levels of business and consumer spending over the year. |
41
42
Queensland’s fiscal environment
2008–09 BUDGETED RESULT
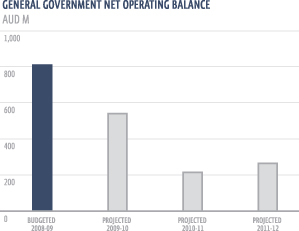
| | • | | On an accrual basis, the Queensland State Budget provides for a General Government operating surplus of $809 million in 2008–09. The General Government forward estimates project continuing surpluses over the State Budget forecast horizon, consistent with the fiscal principles outlined in the Charter of Social and Fiscal Responsibility. |
| | • | | The 2007–08 Budget also provides for cash deficits in the General Government sector across the forward estimates as a result of the State’s significant planned capital expansion. |
2007–08 ESTIMATED ACTUAL RESULT
| | • | | The estimated headline operating deficit of $995 million in 2007–08 reflects the subdued performance of investment markets, which has impacted on the returns the State receives on the substantial funds set aside to meet future liabilities. |
| | • | | Investment market volatility impacts more on the Queensland Budget than it does for other states. This is due to differences in the way Queensland’s public sector superannuation arrangements are structured and the size of Queensland’s investments compared to other States. If Queensland’s superannuation arrangements were structured on the same basis as that which generally applies in other states, the General Government sector underlying operating result for 2007–08 would be a surplus of $272 million. |
43
KEY FINANCIAL AGGREGATES (UNIFORM PRESENTATION FRAMEWORK BASIS)
| | | | | | | | | | | | | | | |
| | | 2007–08
EST. ACTUAL | | | 2008–09
BUDGET | | | 2009–10
PROJECTED | | | 2010–11
PROJECTED | | | 2011–12
PROJECTED | |
| | | AUD M | | | AUD M | | | AUD M | | | AUD M | | | AUD M | |
GENERAL GOVERNMENT SECTOR | | | | | | | | | | | | | | | |
Revenue | | 32,276 | | | 36,582 | | | 37,240 | | | 38,638 | | | 40,385 | |
Expenses | | 33,271 | | | 35,772 | | | 36,700 | | | 38,422 | | | 40,120 | |
Net operating balance | | (995 | ) | | 809 | | | 540 | | | 215 | | | 265 | |
Cash surplus/(deficit) | | (3,547 | ) | | (1,970 | ) | | (2,654 | ) | | (2,669 | ) | | (2,059 | ) |
Capital purchases | | 5,223 | | | 6,651 | | | 6,693 | | | 6,590 | | | 5,824 | |
Net worth | | 123,095 | | | 128,563 | | | 132,708 | | | 136,490 | | | 140,243 | |
44
45
| | • | | The Queensland Government has decided to remove investment return volatility from the General Government net operating balance through transferring certain Consolidated Fund assets held to meet long-term liabilities such as superannuation to QTC. The outcome of this will mean that in future years, like other states, there will be no difference between the underlying and headline surplus. |
Balance Sheet
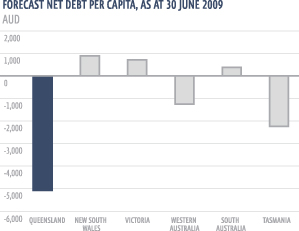
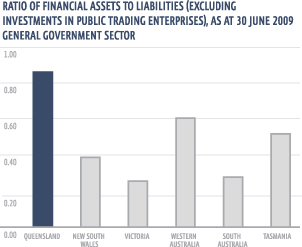
| | • | | Queensland continues to maintain a strong balance sheet compared with the other states. At 30 June 2009, Queensland’s estimated net debt in the General Government sector is negative, implying a strong net asset position. Queensland’s negative net debt of $5,082 per capita compares to the average net debt of $401 per capita in the other states. |
| | • | | The State’s net financial asset position remains sound. Based on current projections, the General Government sector will continue to meet the commitment in the Government’s Charter to ensure that financial assets cover all accruing and expected future liabilities in all years through to 30 June 2012. |
| | • | | Queensland has consistently pursued sound long-term fiscal policies such as the full funding of employee superannuation entitlements. The strong balance sheet and high levels of liquidity in the General Government sector clearly demonstrate the success of these policies. |
46
Competitive Tax Environment
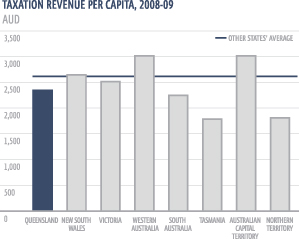
| | • | | One of the Queensland Government’s key fiscal objectives is to maintain a competitive tax environment while raising sufficient revenue to meet the infrastructure and government service delivery needs of the people of Queensland. |
| | • | | In 2008–09, state tax collections per capita in Queensland are expected to be $2,342, which compares to an estimated average state tax collection of $2,585 per capita for the other states and territories. Queensland’s per capita taxation for 2008–09 is 9.4 per cent lower than the average tax per capita of the other states and territories. |
47
Corporate report
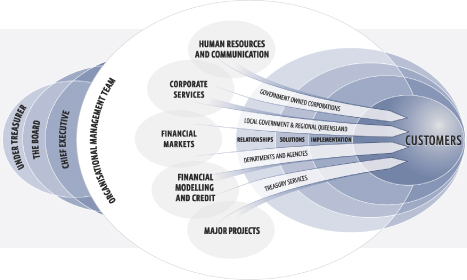
QTC is structured to reflect our overarching, value-delivering strategy of customer loyalty, recognising that we achieve our corporate goals through the efforts of our people and teamwork.
Our teams work in an integrated and collaborative way to implement the three core processes of our customer loyalty operating model—developing and maintaining relationships, designing and developing customer-specific solutions, and delivering tailored solutions that meet our customers’ needs.
The diagram on page 35 demonstrates that, through these core processes and supporting teams, our customer teams work directly with customers to optimise outcomes and appropriately manage risk for the benefit of their organisation and for the State.
Our people
Since its introduction in 1994, QTC’s customer loyalty model has underpinned our strategic direction and culture. The ongoing development and implementation of our customer focus across all areas of our business is paramount to the success of our people and the organisation and, moreover, the value created for customers.
In 2008, QTC decided to revisit and reinvigorate its customer loyalty operating model. Following targeted training for all employees, we identified a number of strategic insights and are now implementing a strategic review of our customer loyalty model. As part of the review, QTC is working closely with customers to identify their priorities for the future, and we will use this information to develop and deliver the best possible products and services to our customers.
Our corporate resourcing strategy and structure will underpin the success of this strategic review. While the labour market has remained competitive, QTC has maintained its establishment number for permanent employees at 170, and vacancies have generally been filled within required timeframes. Equally important has been our focus on further improving our retention rate and we have focused on a number of initiatives to further this objective, including:
| | • | | reviewing the way performance is rewarded, and implementing changes to our reward structure to improve the employee value proposition |
| | • | | developing engagement strategies |
| | • | | promoting new positions within the organisation |
| | • | | providing access to coaching and talent management |
| | • | | providing rotational assignments or secondments |
| | • | | providing leadership training for existing and potential leaders |
| | • | | improving interviewing and selection techniques, and |
| | • | | enhancing staff development, career development and training programs. |
Looking ahead, we will continue to focus on our learning and development program, and will review our performance management processes and systems to ensure they continue to support our people in the achievement of QTC’s corporate objectives.
Risk management
For some years now, QTC has managed its risks within an enterprise-wide risk management framework. The framework supports the achievement of QTC’s corporate strategies and objectives by providing assurance that QTC’s risks are being appropriately and effectively identified and managed, using a consistent and well understood approach for evaluating and reporting risks.
48
As part of the framework, QTC periodically identifies its key or significant risks, which are reported to the Risk Management Team and the Risk Management Committee, and risks are added or removed from time-to-time. For instance, the risks related to developing a new IT system to manage its loans to and deposits of customers, as well as other transactions, have been identified as a significant risk category for QTC and are being managed within the risk framework. The rigorous management of this project’s risks gives QTC the confidence to embrace the opportunity to undertake this significant project to obtain a system tailored to QTC’s lending and investment administration needs.
During the year, QTC reviewed the risk management framework, including a review of QTC’s highest risks and improvement of team planning processes. In addition, teams reviewed their risks and how these relate to QTC’s significant risks. Teams then developed a map of the independent assurance activities surrounding each significant risk and a map of the accountabilities for each significant risk.
QTC’s audit and compliance processes ensure that our business processes are appropriate and effective. Under our compliance program, based on Australian Standard 3806, compliance is an integral part of our operating procedures, and is the responsibility of all employees. Despite the secondment of a number of senior staff during the year, no issues of significant non-compliance were identified in internal or external audits during the year.
49
Operational risks associated with the processing and administration of financial markets and customer transactions (loans, investments and leases) were managed prudently during the year. QTC managed 99,836 transactions during the year, with only 46 errors attributable to our organisation. The cost of settlement, leasing and cash flow management errors was $165,916.76, compared to $31,345 for 2006–07. The dollar value of transactions increased by $36 billion to $900 billion.
Critical system availability was 99.95%, with a total downtime of 40 minutes across all critical systems.
Information management
The Onlending and Investment Administration (OLIA) project has dominated QTC’s information management resources for the year, as it is the largest and most significant internal project that QTC has ever undertaken. The significant risks of the project have been effectively managed and, where necessary, decisive action was taken to keep the management of the project and development of the system on track. We are now in the process of determining the optimal solution to implement the design phase to complete the project.
In addition to the OLIA Project, the year saw significant progress made to several strategic information initiatives:
| • | | A pilot business intelligence project was completed, improving data management and reporting practices associated with our customers’ debt pool position and performance reporting. |
| • | | Customer information was centralised, with an emphasis on improving the classification of historical information to support planned initiatives and improve information accessibility through QTC’s intranet. |
| • | | A number of significant systems upgrades were completed to ensure the currency of business systems, and to offset risk and improve organisational efficiency. |
| • | | Additional intellectual property (eg, formulae) is now centrally controlled, ensuring the integrity of critical calculations. |
| • | | The Citi settlements system (CitiDirect) was successfully implemented, following the appointment of Citi as QTC’s futures clearing provider. |
| • | | The Financial Case Management system was upgraded, as was the Gold Coast City Council’s treasury management system—Capix. |
Carbon Pollution Reduction
In line with the Queensland Government’s new standard for Government departments and Government-owned corporations to measure and report their greenhouse gas emissions, QTC compiled its inventory of greenhouse gas emissions for the year.
QTC’s total greenhouse gas emissions for 2007–08 was 1,559 tonnes of carbon dioxide equivalent (CO2-e). Emissions from electricity use comprised 1,156 tonnes or 74 percent of the total. The calculation of a comprehensive and accurate emissions inventory is an important first step in managing our greenhouse gas emissions and reducing energy consumption and costs. With an accurate measure of emissions, QTC has identified areas for better energy efficiency and emission reductions that will allow us to track and measure performance in subsequent years.
| | | | |
EMISSION SOURCE | | PERCENTAGE
OF TOTAL | | TONNES
OF CO2-e |
Electricity consumption | | 74.2 | | 1,156 |
Air travell | | 11.1 | | 175 |
Motor vehicles | | | | |
(cabs, hire cars, work cars) | | 1.5 | | 23 |
Staff commuting | | 12.2 | | 192 |
Air-conditioning gases | | 0.5 | | 6 |
Waste disposal | | 0.5 | | 7 |
| | | | |
TOTAL | | 100 | | 1,559 |
| | | | |
In addition, QTC’s role and expertise in this area has evolved, and we are now assisting our customers to estimate and manage their greenhouse gas emissions and providing guidance and technical advice on energy efficiency and carbon trading. This is part of a service to assist our customers identify and prepare for the introduction of the Australian Carbon Pollution Reduction Scheme in 2010 and its likely impacts on their organisations.
50
QTC Board
The composition of our Board equips QTC with diverse corporate, financial, commercial, economic and legal skills. The Board guides our commitment to achieving high standards of corporate governance, accountability, compliance and financial and ethical behaviour, which is critical for maintaining our strong market reputation and the confidence of our customers and stakeholders.
At 30 June, there was a board vacancy due to the resignation of David Coe in February 2008.

Sir Leo Hielscher AC
BCOMM, D UNIV GRIFFITH (HON), AAUQ, AASA, FAIM, FCPA, FFTP (HON)
CHAIRMAN
APPOINTED IN 1988. TENURE TO 30 JUNE 2010.
BOARD COMMITTEES
CHAIRMAN, HUMAN RESOURCES COMMITTEE
MEMBER, RISK MANAGEMENT COMMITTEE
Sir Leo Hielscher AC has more than fifty years’ experience in the areas of Government, the banking and finance industry, domestic and global financial markets, superannuation industry and as an independent company director.
He was the Under Treasurer of Queensland for 14 years ( 1974–1988) before his appointment as Chairman of the Queensland Treasury Corporation (Advisory Board) in 1988. In 1991, the Advisory Board became the Queensland Treasury Corporation Board and Sir Leo was appointed as its inaugural Chairman. Sir Leo is also Chairman of Austsafe Ltd, the Independent Superannuation Preservation Fund, and a Director of the American Australian Association Ltd. As a company director, Sir Leo has considerable experience at board level and has been associated with a number of public and private sector boards.
Sir Leo was awarded an Eisenhower Fellowship in 1973, a Knight Bachelor in 1987, an Honorary Doctorate of Griffith University in 1993, and a Companion in the Order of Australia (AC) in the General Division in 2004. He was honoured as a ‘Queensland Great’ by the Queensland Government in 2007.

Tim Spencer
BSC (ECON) (HONS)
DEPUTY CHAIRMAN
APPOINTED IN JULY 2007. TENURE TO 30 JUNE 2011.
BOARD COMMITTEES
MEMBER, RISK MANAGEMENT COMMITTEE
MEMBER, ACCOUNTS AND AUDIT COMMITTEE
MEMBER, HUMAN RESOURCES COMMITTEE
Tim Spencer is the Deputy Under Treasurer of the Queensland Treasury Department, a position he has held since 2001. In this role, he has worked extensively with Queensland’s Government-owned corporations, various commercial and major infrastructure projects, asset sales and structure, and market reforms.
Mr Spencer has previously held other senior management and executive positions in the public sector in Queensland, South Australia and the Australian Capital Territory, where his responsibilities have spanned economic policy research and development, establishment of market arrangements and the long-term leases of electricity assets, restructuring of government- owned electricity businesses, investment and borrowing activities, and the implementation of National Competition Policy. He is also a Director of Queensland Motorways Ltd.

Gillian Brown
LLB (HONS), GRAD DIP APPLIED FINANCE AND INVESTMENT, SIA
APPOINTED IN JULY 2004. TENURE TO 30 JUNE 2011.
Board committees
CHAIRMAN, RISK MANAGEMENT COMMITTEE
Gillian Brown has more than 18 years’ experience as a specialist finance lawyer and has gained extensive corporate, financing and major project experience.
She is national Chairman of Minter Ellison Lawyers and a partner of the firm in Queensland (admitted as partner 1994), heading the finance practice. Ms Brown’s principal areas of practice include corporate finance, investment and financial services, financial markets, project and infrastructure finance, and property finance.
Ms Brown has advised government bodies on a number of project and transactional arrangements and has an indepth knowledge of the mechanics of government and its objectives. Ms Brown is also a Director of Dalrymple Bay Coal Terminal Holdings Pty Ltd, and a committee member of the Law Council of Australia.
51

David Coe
BA (HONS), LLB
APPOINTED IN JULY 2004. RESIGNED ON 18 FEBRUARY 2008.
BOARD COMMITTEES
MEMBER, RISK MANAGEMENT COMMITTEE
David Coe was Executive Chairman of Allco Finance Group Limited, and a former partner of law firm Mallesons Stephen Jacques where he specialised in international financing and leasing. He has a diverse blend of specialist legal, corporate and finance knowledge, and extensive experience as a company director of a number of public and private companies.
Mr Coe resigned from the Board on 18 February 2008.

Marian Micalizzi
BBUS, FCA
APPOINTED IN JULY 2000. TENURE TO 30 JUNE 2010.
BOARD COMMITTEES
MEMBER, ACCOUNTS AND AUDIT COMMITTEE
MEMBER, RISK MANAGEMENT COMMITTEE
Marian Micalizzi is a chartered accountant with more than 20 years’ experience, a company director and a consultant in both the public and private sector. Ms Micalizzi is a former partner of PricewaterhouseCoopers (until 2000) having been admitted as a partner of its predecessor firm in 1986.
Ms Micalizzi brings considerable expertise and knowledge of specialist corporate financial and advisory services, financial institutions’ regulation and prudential supervision, and valuation related assessments.
She is also a director of Queensland Investment Corporation, Opera Queensland, Australian Reinsurance Pool Corporation; a member of Corporations and Markets Advisory Committee, The Takeovers Panel, the Independent Investment Committee of Queensland Development Fund, the Queensland Government’s Public Service Commission, and the Sunsuper Audit Committee; and, a Councillor of the Australian Institute of Company Directors (Qld Div).

Bill Shields
B ECON (HONS), M EC
APPOINTED IN JULY 2004. TENURE TO 30 JUNE 2011.
BOARD COMMITTEES
CHAIRMAN, ACCOUNTS AND AUDIT COMMITTEE
MEMBER, RISK MANAGEMENT COMMITTEE
Bill Shields has considerable experience in the banking and finance industry, as well as government policy advice, specialising in economics.
His career responsibilities have included economic and financial market research in Australia and overseas, and the provision of analytical and strategic advice on the Australian financial system and monetary policy, Australia’s exchange rate arrangements, and international financial developments.
Mr Shields was previously Chief Economist and Executive Director of Macquarie Bank Limited (1987–2001), and has also held positions with the Reserve Bank of Australia (1983–1985), the International Monetary Fund (1973–75 and 1977–83), and the Commonwealth Treasury. Mr Shields is a Visiting Professor of Macquarie Graduate School of Management at Macquarie University; a Director of M-co International Limited (and Chair of their Audit and Compliance Committee); and, a Director of the Energy Market Company PTE.

Shauna Tomkins
BSC, MBA
APPOINTED IN JULY 2000. TENURE TO 30 JUNE 2010.
BOARD COMMITTEES
MEMBER, RISK MANAGEMENT COMMITTEE
MEMBER, HUMAN RESOURCES COMMITTEE
Shauna Tomkins is a principal of Promontory Financial Group Australasia and works internationally in the development and implementation of regulatory frameworks for prudential supervision and corporate regulation of deposit-taking, funds management, insurance and lending institutions.
Ms Tomkins has a thorough understanding of Australia’s financial system, risk management analysis, prudential supervision, and corporate and structured finance.
She also has a strong background in long-term policy and strategic management and planning, and has an in-depth understanding of government objectives and processes. Ms Tomkins is a member of the Advisory Committee to Queensland’s Motor Accident Insurance Commission.
52
Corporate governance
QTC was established by the Queensland Treasury Corporation Act 1988 (QTC Act), as a Corporation Sole (ie, a corporation that consists solely of a nominated office holder). The Under Treasurer of Queensland is QTC’s nominated office holder. QTC is accountable to the Treasurer of Queensland, through the Under Treasurer.
QTC has delegated its powers to the Queensland Treasury Corporation Capital Markets Board. QTC and the Board have agreed the terms and administrative arrangements that govern the exercise or performance of those powers and the reports by the Board to QTC. After year end, an additional Board is being established to be responsible for the superannuation assets that were transferred to QTC from 1 July 2008. As a result, appropriate adjustments will be made to the powers that have been delegated to the Board.
Board composition
The Board comprises seven directors who are appointed by the Governor-in-Council, pursuant to section 10(2) of the QTC Act, with consideration given to each person’s qualifications, experience, skills, strategic ability, and commitment to contribute to QTC’s performance and achievement of its corporate objectives. QTC’s Chairman is a non-executive director and the Board is entirely constituted of non-executive directors. The QTC Board has a current vacancy due to the resignation of David Coe in February 2008.
Board responsibilities
The Board operates in accordance with its charter, which sets out its commitment to various corporate governance principles and standards, the roles and responsibilities of the Board and its members, and the conduct of meetings. Within this scope, the roles and functions of the Board include:
| | • | | overseeing QTC’s operations, including its control and accountability systems |
| | • | | developing and monitoring QTC’s strategic and corporate plans, operational policy and yearly budget |
| | • | | monitoring and measuring financial and operational performance |
| | • | | monitoring and measuring organisational and staff performance |
| | • | | monitoring key risks and risk management processes, and |
| | • | | ensuring that QTC’s compliance is appropriate for an organisation of its type. |
Board committees
The Board has established three committees, each with its own terms of reference, to assist it to oversee and govern various QTC activities:
Accounts and Audit Committee, with responsibility for:
| | • | | the adequacy and effectiveness of internal controls, including for prevention of fraud integrity of financial statements, and |
Risk Management Committee, with responsibility for:
| | • | | the adequacy and implementation of QTC’s enterprise-wide risk management policy, framework and plans for the management of QTC’s significant corporate risks |
| | • | | QTC’s organisation-wide risk profile and exposure to significant risks, and |
| | • | | the adequacy of risk management policies in relation to QTC’s significant risks. |
Human Resources Committee, with responsibility for:
| | • | | the appropriateness of any new or amended human resources policy |
53
| | • | | the framework for, and review of, employee remuneration and performance, and |
| | • | | employment terms and conditions. |
Attendance at Board meetings
The following table details the Board Directors’ attendance at Board and committee meetings during the year:
| | | | | | | | |
| | | BOARD
MEETINGS | | RISK MANAGEMENT
COMMITTEE | | ACCOUNTS AND AUDIT
COMMITTEE | | HUMAN RESOURCES
COMMITTEE |
MEETINGS HELD | | 11 | | 6 | | 5 | | 3 |
| | | | |
Sir Leo Hielscher | | 11 | | 6 | | — | | 3 |
Tim Spencer | | 11 | | 6 | | 5 | | 3 |
Gillian Brown | | 9 | | 5 | | — | | — |
David Coe* | | 3 | | 1 | | — | | — |
Marian Micalizzi | | 10 | | 6 | | 5 | | — |
Bill Shields | | 11 | | 6 | | 5 | | — |
Shauna Tomkins | | 10 | | 6 | | — | | 3 |
| * | David Coe resigned 18/2/08 |
Commitment to corporate governance
The QTC Board and organisational management team endorse and are committed to achieving high standards of corporate governance, accountability, compliance and ethical behaviour. The Board guides this commitment, which is critical for maintaining QTC’s strong market reputation, as well as the ability to achieve success as Queensland’s corporate treasury services provider. QTC has benchmarked its corporate governance practices, so far as they are relevant and appropriate to QTC, against the Australian Stock Exchange’s Corporate Governance Principles and Recommendations (which are not mandatory for QTC), and the Australian Standard 8000/2003–Good Governance Principles. QTC’s corporate governance practices are continually reviewed and updated, as part of a rolling system of appraisal, to reflect industry guidelines and standards. QTC also maintains a commitment to a continuous disclosure regime with its key stakeholders, a code of conduct that applies to all staff and includes procedures about disclosing conflicts of interest and a compliance program that drives a compliance culture consistent with QTC’s approved mandate and legal and ethical obligations.
Auditors
In accordance with the provisions of the Financial Administration and Audit Act 1977, the Queensland Audit Office is the external auditor for QTC. The Queensland Audit Office has the responsibility for providing Queensland’s Parliament with assurances as to the adequacy of QTC’s discharge of its financial and administrative obligations. KPMG is QTC’s current internal auditor.
Ethical standards
QTC’s corporate governance policies and practices ensure that QTC acts ethically, within appropriate law, policy and convention, and addresses the systems and processes necessary for the proper direction and management of QTC’s business and affairs. QTC is committed to observing high standards of integrity and fair dealing in the conduct of its business and to acting with due care, diligence and skill. QTC’s compliance policy requires that QTC and all employees comply with the letter and the spirit of all relevant laws and regulations, industry standards, relevant government policies, and QTC’s own policies and procedures.
Further information
The information in this Annual Report is only a summary of QTC’s corporate governance practices. More detailed compliance disclosures are contained in Appendix C of this report, and more comprehensive information is available on QTC’s website at www.qtc.com.au.
54
55
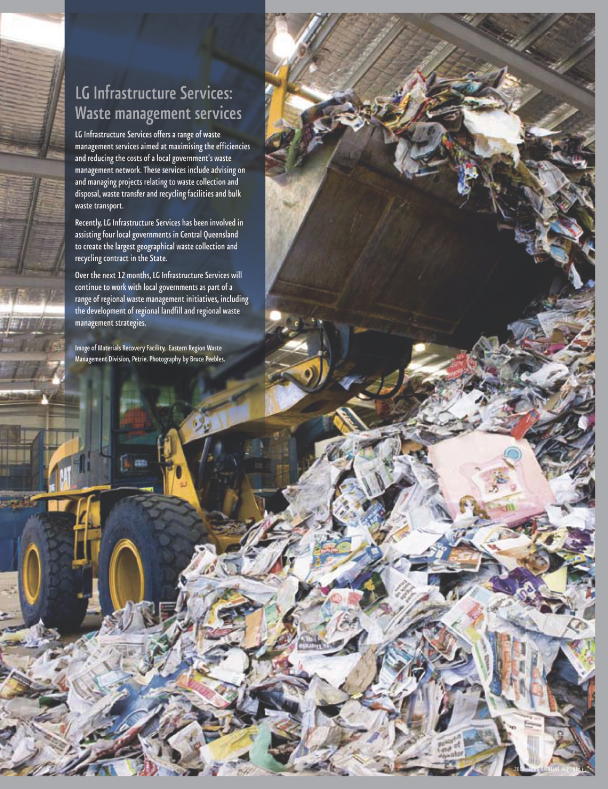
56
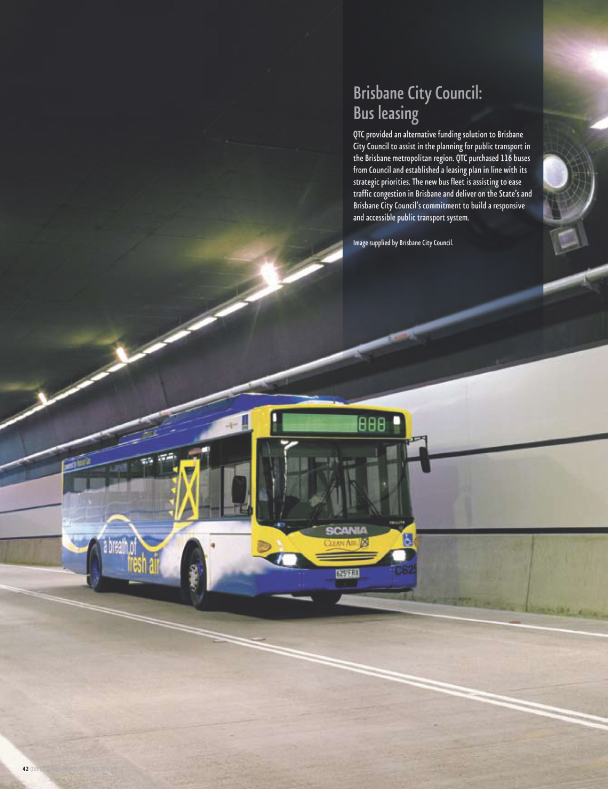
57
58
Income Statement
For the year ended 30 June 2008
| | | | | | | | |
| | | NOTE | | 2008 | | | 2007 | |
| | | | | $000 | | | $000 | |
Income | | | | | | | | |
REVENUE | | | | | | | | |
Interest income | | 3 | | 2,468,362 | | | 1,513,438 | |
Fees—management | | 4 | | 31,504 | | | 24,820 | |
—professional | | | | 402 | | | 252 | |
—other | | | | 444 | | | 402 | |
Amortisation of cross border lease deferred income | | | | 8,597 | | | 8,709 | |
Operating lease revenue | | | | 7,070 | | | 6,699 | |
Other revenue | | | | — | | | 7 | |
| | | |
Gains | | | | | | | | |
| | | |
Gain on sale of property, plant and equipment | | | | — | | | 14 | |
| | | | | | | | |
TOTAL INCOME | | | | 2,516,379 | | | 1,554,341 | |
| | | | | | | | |
| | | |
EXPENSES | | | | | | | | |
Interest expense | | 3 | | 2,548,225 | | | 1,461,764 | |
Administration expenses | | 5 | | 33,398 | | | 32,958 | |
Provisions—cooperative housing societies | | 10 | | 33 | | | 25 | |
Loss on sale of property, plant and equipment | | | | 1 | | | — | |
| | | | | | | | |
TOTAL EXPENSES | | | | 2,581,657 | | | 1,494,747 | |
| | | | | | | | |
Share of profit/(loss) from investments accounted for using the equity method | | 30 | | 254 | | | (5 | ) |
| | | | | | | | |
OPERATING (LOSS)/SURPLUS BEFORE PAYMENT IN LIEU OF INCOME TAX | | | | (65,024 | ) | | 59,589 | |
| | | | | | | | |
Payment in lieu of income tax | | 6 | | 15,681 | | | 13,740 | |
| | | | | | | | |
OPERATING (LOSS)/SURPLUS AFTER PAYMENT IN LIEU OF INCOME TAX | | | | (80,705 | ) | | 45,849 | |
| | | | | | | | |
The accompanying notes form part of these financial statements.
59
Balance Sheet
As at 30 June 2008
| | | | | | |
| | | NOTE | | 2008 | | 2007 |
| | | | | $000 | | $000 |
Assets | | | | | | |
Cash assets | | | | 1,372 | | 99 |
Receivables | | 7 | | 7,486 | | 2,493 |
Prepayments | | | | 234 | | 376 |
Financial assets at fair value through profit or loss | | 8 | | 16,694,123 | | 16,200,405 |
Derivative financial assets | | 9 | | 224 414 | | 112 851 |
Onlendings | | 10 | | 32,911,506 | | 24,268,854 |
Property, plant and equipment | | 11 | | 71,661 | | 25,485 |
Investments accounted for using the equity method | | 30 | | 434 | | 180 |
Intangible assets | | 12 | | 2 839 | | 491 |
Deferred income tax assets | | 6 | | 1 367 | | 1 084 |
| | | | | | |
TOTAL ASSETS | | | | 49,915,436 | | 40,612,318 |
| | | | | | |
Liabilities | | | | | | |
Payables | | 13 | | 152,838 | | 180,578 |
Tax liabilities | | 6 | | 15,964 | | 13,485 |
Derivative financial liabilities | | 14 | | 473,968 | | 271,954 |
Financial liabilities at fair value through profit or loss | | 15 | | 48,980,022 | | 39,772,952 |
| | | | | | |
TOTAL LIABILITIES | | | | 49,622,792 | | 40,238,969 |
| | | | | | |
NET ASSETS | | | | 292,644 | | 373,349 |
| | | | | | |
Equity | | | | | | |
Reserves | | 16 | | 126,582 | | 83,711 |
Retained surplus | | | | 166,062 | | 289,638 |
| | | | | | |
TOTAL EQUITY | | | | 292,644 | | 373,349 |
| | | | | | |
The accompanying notes form part of these financial statements.
60
Statement of Changes in Equity
For the year ended 30 June 2008
| | | | | | | | | | | | | | |
| | | NOTE | | GENERAL
RESERVE | | CREDIT RISK
RESERVE | | BASIS RISK
RESERVE | | RETAINED
SURPLUS | | | TOTAL
EQUITY | |
| | | | | $000 | | $000 | | $000 | | $000 | | | $000 | |
Balance at 1 July 2006 | | | | 39,082 | | 21,321 | | 14,000 | | 253,097 | | | 327,500 | |
Operating surplus from continuing operations | | | | — | | — | | — | | 45,849 | | | 45,849 | |
Transfer from/(to) retained surplus | | 16 | | — | | 6,808 | | 2,500 | | (9,308 | ) | | — | |
| | | | | | | | | | | | | | |
BALANCE AT 30 JUNE 2007 | | | | 39,082 | | 28,129 | | 16,500 | | 289,638 | | | 373,349 | |
| | | | | | | | | | | | | | |
Balance at 1 July 2007 | | | | 39,082 | | 28,129 | | 16,500 | | 289,638 | | | 373,349 | |
Operating surplus from continuing operations | | | | — | | — | | — | | (80,705 | ) | | (80,705 | ) |
Transfer from/(to) retained surplus | | 16 | | — | | 5,871 | | 37,000 | | (42,871 | ) | | — | |
| | | | | | | | | | | | | | |
BALANCE AT 30 JUNE 2008 | | | | 39,082 | | 34,000 | | 53,500 | | 166,062 | | | 292,644 | |
| | | | | | | | | | | | | | |
The accompanying notes form part of these financial statements.
61
Cash Flow Statement
For the year ended 30 June 2008
| | | | | | | | |
| | | NOTE | | 2008 | | | 2007 | |
| | | | | $000 | | | $000 | |
Cash Flows from Operating Activities | | | | | | | | |
Interest received from onlendings | | | | 1,526,337 | | | 821,797 | |
Interest received from investments | | | | 1,120,794 | | | 929,686 | |
Interest received from operating leases | | | | 7,069 | | | 6,913 | |
Fees received—management | | | | 31,384 | | | 24,892 | |
Fees received—professional | | | | 450 | | | 29 | |
Fees received—other | | | | 349 | | | 386 | |
Payments for Cross Border Lease arrangements | | | | — | | | (515 | ) |
GST paid to suppliers | | | | (5,723 | ) | | (2,838 | ) |
GST refunds from ATO | | | | 1,391 | | | 2,706 | |
GST paid to ATO | | | | (4,503 | ) | | (1,583 | ) |
GST received from customers | | | | 2,432 | | | 3,878 | |
Interest paid on interest-bearing liabilities | | | | (2,652,076 | ) | | (1,895,786 | ) |
Interest paid on deposits | | | | (468,882 | ) | | (317,171 | ) |
Administration expenses paid | | | | (26,000 | ) | | (23,459 | ) |
Payment in lieu of income tax | | | | (13,485 | ) | | (13,163 | ) |
| | | | | | | | |
NET CASH USED IN OPERATING ACTIVITIES | | 17 | | (480,463 | ) | | (464,228 | ) |
| | | | | | | | |
Cash Flows from Investing Activities | | | | | | | | |
Proceeds from sale of investments | | | | 61,356,059 | | | 70,634,600 | |
Payments for investments | | | | (62,010,897 | ) | | (73,398,550 | ) |
Net onlendings | | | | (8,679,356 | ) | | (4,490,472 | ) |
Payments for property, plant and equipment | | | | (51,896 | ) | | (1,049 | ) |
Payments for intangibles | | | | (2,601 | ) | | (392 | ) |
Proceeds from sale of property, plant and equipment | | | | — | | | 681 | |
| | | | | | | | |
NET CASH USED IN INVESTING ACTIVITIES | | | | (9,388,691 | ) | | (7,255,182 | ) |
| | | | | | | | |
Cash Flows from Financing Activities | | | | | | | | |
Proceeds from interest-bearing liabilities | | | | 35,956,790 | | | 17,193,811 | |
Repayment of interest-bearing liabilities | | | | (26,663,683 | ) | | (11,497,590 | ) |
Net deposits | | | | 577,320 | | | 2,023,164 | |
| | | | | | | | |
NET CASH PROVIDED BY FINANCING ACTIVITIES | | | | 9,870,427 | | | 7,719,385 | |
| | | | | | | | |
NET INCREASE/(DECREASE) IN CASH HELD | | | | 1,273 | | | (25 | ) |
Cash at 1 July | | | | 99 | | | 124 | |
| | | | | | | | |
CASH AT 30 JUNE | | | | 1,372 | | | 99 | |
| | | | | | | | |
The accompanying notes form part of these financial statements.
62
Notes to and Forming Part of the Financial Statements
For the year ended 30 June 2008
Contents
| | | | |
NOTE | | | | PAGE |
| 1. | | General Information | | 64 |
| 2. | | Summary of Significant Accounting Policies | | 64 |
| 3. | | Interest Income and Interest Expense | | 71 |
| 4. | | Management Fees | | 73 |
| 5. | | Administration Expenses | | 73 |
| 6. | | Payment in Lieu of Income Tax | | 74 |
| 7. | | Receivables | | 74 |
| 8. | | Financial Assets at Fair Value through Profit or Loss | | 75 |
| 9. | | Derivative Financial Assets | | 75 |
| 10. | | Onlendings | | 76 |
| 11. | | Property, Plant and Equipment | | 77 |
| 12. | | Intangible Assets | | 78 |
| 13. | | Payables | | 78 |
| 14. | | Derivative Financial Liabilities | | 79 |
| 15. | | Financial Liabilities at Fair Value through Profit or Loss | | 79 |
| 16. | | Reserves | | 81 |
| 17. | | Notes to the Cash Flow Statement | | 82 |
| 18. | | Financial Risk Management | | 83 |
| 19. | | Concentrations of Borrowings and Deposits | | 89 |
| 20. | | Contingent Liabilities | | 89 |
| 21. | | Operating Leases | | 90 |
| 22. | | Forward Starting Fixed Rate Loan Commitments | | 91 |
| 23. | | Stock Lending | | 91 |
| 24. | | Segment Information | | 91 |
| 25. | | Funding Facilities | | 92 |
| 26. | | Related Party Transactions | | 92 |
| 27. | | Key Management Personnel | | 94 |
| 28. | | Remuneration of Officers | | 95 |
| 29. | | Auditors Remuneration | | 95 |
| 30. | | Investments in Associates | | 96 |
| 31. | | Investments in Companies | | 97 |
| 32. | | Dividends | | 97 |
| 33. | | Events subsequent to Balance Date | | 97 |
63
Notes to and Forming Part of the Financial Statements
For the year ended 30 June 2008—(Continued)
1. General Information
Queensland Treasury Corporation (QTC) is constituted under the Queensland Treasury Corporation Act 1988 (the Act), with the Under Treasurer designated as the Corporation Sole under section 5 (2) of the Act.
QTC is the State’s central financing authority and corporate treasury services provider, with responsibility for providing debt funding, liability management, cash management and financial risk management advice to public sector customers. These services are undertaken on a cost recovery basis with QTC lending at an interest rate based on its cost of funds and with the benefits/costs of liability and asset management being passed on to its customers being Queensland public sector entities.
The majority of QTC’s profits are generated as a result of interest earned from the investment of QTC’s equity.
QTC ensures that in undertaking its activities it has adequate capital to manage its risks.
2. Summary of Significant Accounting Policies
(A) BASIS OF PREPARATION
These general purpose financial statements for the year ended 30 June 2008 have been prepared in accordance with the requirements of the Financial Management Standard 1997 issued pursuant to the Financial Administration and Audit Act 1997 and Australian Accounting Standards (including Australian Interpretations) adopted by the Australian Accounting Standards Board.
The financial report complies with Australian Accounting Standards and International Financial Reporting Standards (IFRS). QTC is designated as a not-for-profit entity, however, the Corporation has elected to comply with the requirements of International Financial Reporting Standards (IFRS) as if it was a for-profit entity.
EARLY ADOPTION OF STANDARDS
Certain new accounting standards and interpretations have been published that are not mandatory for the 30 June 2008 reporting period. QTC’s assessment on the impact of these new standards is set out below:
| | • | | Revised AASB 101 Presentation of Financial Statements introduces a financial statement, the “statement of comprehensive income”. The revised standard will not affect any of the amounts recognised in the financial statements. QTC intends to apply the revised standard from 1 July 2009. |
| | • | | AASB 8 Operating Segments and AASB 2007-3 Amendments to Australian Accounting Standards arising from AASB 8. AASB 8 will result in a management approach to reporting on segment performance. The revised standard will not affect any of the amounts recognised in the financial statements but will add additional disclosure to reflect our key segments. QTC intends to early adopt this standard from 1 July 2008. |
HISTORICAL COST CONVENTION
The financial statements have been prepared using the historical cost convention and do not take into account changing money values or current valuations of non current assets unless otherwise indicated.
FUNCTIONAL AND PRESENTATION CURRENCY
These financial statements are presented in Australian dollars, which is QTC’s functional currency.
64
Notes to and Forming Part of the Financial Statements
For the year ended 30 June 2008—(Continued)
CLASSIFICATION OF ASSETS AND LIABILITIES
Assets and liabilities are disclosed by nature and in an order that generally reflects their relative liquidity.
(B) INVESTMENT IN JOINT VENTURE ENTITY
QTC’s investment in Local Government Infrastructure Services Pty Ltd is accounted for using the equity method in the financial statements. Under the equity method, the share of the profits or losses of the joint venture is recognised in the Income Statement, and the share of movement in equity is recognised in the Balance Sheet. Investments in joint venture entities are carried at the equity accounted amount.
(C) INVESTMENTS IN OTHER COMPANIES
Investments in other companies are accounted for at cost (refer note 31). The principal activity of Queensland Treasury Holdings Pty Ltd (QTH) is to act as a corporate vehicle through which the Queensland Government invests in assets of strategic importance to the State.
Queensland Treasury holds a 60% beneficial interest in QTH. The remaining 40% is held by QTC for and on behalf of the Under Treasurer as Corporation Sole of QTC.
QTC does not have significant influence over the financial and operating policies of QTH and therefore does not apply the equity method of accounting to the investment.
(D) FOREIGN CURRENCY
Foreign currency transactions are initially translated into Australian dollars at the rate of exchange applying at the date of the transaction. At balance date, amounts payable to and by QTC in foreign currencies have been valued using current exchange rates after taking into account interest rates and accrued interest.
Exchange gains/losses are brought to account in the Income Statement.
(E) CASH
Cash assets include only those funds held at bank and do not include money market deposits.
(F) FINANCIAL ASSETS AND FINANCIAL LIABILITIES
RECOGNITION AND DERECOGNITION
Financial assets and financial liabilities are recognised in the Balance Sheet when QTC becomes party to the contractual provisions of the financial instrument.
A financial asset is derecognised when the contractual rights to the cash flows from the financial assets expire or are transferred and no longer controlled by QTC.
A financial liability is removed from the Balance Sheet when the obligation specified in the contract is discharged, cancelled or expires.
MEASUREMENT
Financial assets and liabilities at fair value through profit or loss are measured at fair value by reference to quoted market prices when available. If quoted market prices are not available, then fair values are estimated on the basis of pricing models, or other recognised valuation techniques.
65
Notes to and Forming Part of the Financial Statements
For the year ended 30 June 2008—(Continued)
Fair value is the amount for which an asset could be exchanged, or liability settled between knowledgeable, willing parties in an arm’s length transaction.
QTC uses mid market rates as a basis for establishing fair values of quoted financial instruments with offsetting risk positions. In general, the risk characteristics of funds borrowed together with the financial derivatives used to manage interest rate and foreign currency risks closely match those of funds onlent. In all other cases, the bid-offer spread is applied where material.
CLASSIFICATION
Financial instruments on initial recognition are classified into the following categories:
| | • | | Derivative financial instruments |
| | • | | Financial assets at fair value through profit or loss, and |
| | • | | Financial liabilities at fair value through profit or loss. |
QTC’s accounting policies for significant financial assets and financial liabilities are listed below.
ONLENDINGS
Onlendings, with the exception of loans to cooperative housing societies, are included in the Balance Sheet at their redemption value which is the market value. Loans to cooperative housing societies are based on the balance of each housing society’s loans to its members adjusted where necessary for a specific provision for impairment (refer note 2 (r)).
DERIVATIVE FINANCIAL INSTRUMENTS
QTC uses derivative financial instruments to hedge its exposure to interest rate, foreign currency and credit risks as part of asset and liability management activities. In addition they may be used to deliver long term floating rate or long term fixed rate exposure. In accordance with its treasury policy, QTC does not hold or issue derivative financial instruments for speculative purposes.
All derivatives are carried as assets when fair value is positive and as liabilities when fair value is negative.
FINANCIAL ASSETS AT FAIR VALUE THROUGH PROFIT OR LOSS
Financial assets at fair value through profit or loss consist of all other investments including money market deposits, discount securities, semi-government bonds and floating rate notes. Unrealised gains and losses are brought to account in the Income Statement.
FINANCIAL LIABILITIES AT FAIR VALUE THROUGH PROFIT OR LOSS
Financial liabilities at fair value through profit or loss include interest-bearing liabilities and deposits. Unrealised gains and losses are brought to account in the Income Statement.
INTEREST-BEARING LIABILITIES
Interest-bearing liabilities mainly consist of Australian and overseas bonds. Australian bonds include QTC’s domestic, capital indexed and public bonds. Overseas bonds include global bonds and Eurobonds. Global bonds are Australian dollar denominated bonds issued overseas.
66
Notes to and Forming Part of the Financial Statements
For the year ended 30 June 2008—(Continued)
DEPOSITS
Deposits are accepted to either the Working Capital Facility (11AM Fund) or the Cash Fund for portfolio management. Income derived from the investment of these deposits accrues to depositors daily. The amount shown in the Balance Sheet represents the market value of deposits held at balance date.
Securities which are sold under agreements to repurchase at an agreed price remain as an investment while the obligation to repurchase is disclosed as a deposit.
(G) SETTLEMENT DATE ACCOUNTING
Purchases and sales of financial assets and liabilities at fair value through profit or loss are recognised on settlement date. QTC accounts for any change in the fair value of the asset to be received during the period between the trade date and settlement date in the same way as it accounts for the acquired asset.
(H) LEASE ARRANGEMENTS
Leases in which a significant portion of the risks and rewards of ownership are retained by the lessor are classified as operating leases (refer note 21). Operating leases, in which QTC is the lessee, are expensed on a straight line basis over the term of the lease.
(I) INTEREST INCOME AND INTEREST EXPENSE
The recognition of investment income and borrowing costs includes net realised gains/losses from the sale of investments (interest income) and the preredemption of borrowings (interest expense) together with the net unrealised gains/losses arising from holding investments and certain onlendings (interest income) and net unrealised gains/losses from borrowings (interest expense). These unrealised gains/losses are a result of revaluing to market daily.
The majority of onlendings are provided to customers on a pooled basis. Interest costs are allocated to customers based on the daily movement in the market value of the pool.
(J) FEE INCOME
Management and professional fee income represents income earned from the management of QTC’s onlendings and deposits and is recognised on an accrual basis when the service has been provided. Asset and liability management fee income integral to the yield of an originated financial instrument is recognised proportionately over the period the product is provided.
(K) PROFITS/LOSSES
Unless otherwise determined by the Governor in Council, the Queensland Treasury Corporation Act 1988 requires that all profits shall accrue to the benefit of Consolidated Fund and all losses shall be the responsibility of Consolidated Fund.
(L) CROSS BORDER LEASES—INCOME RECOGNITION
The portion of the cross border lease income received which is regarded as an advisory fee for the transaction is recognised on receipt. The balance of income received is deferred and amortised over the term of each lease.
67
Notes to and Forming Part of the Financial Statements
For the year ended 30 June 2008—(Continued)
(M) LEASE INCOME
Lease income from operating leases where QTC is the lessor is recognised as income on a straight line basis over the lease term.
(N) PROPERTY, PLANT AND EQUIPMENT
Property, plant and equipment are included at cost from the date of acquisition. Items of property, plant and equipment with a cost or other value equal to or in excess of the following thresholds are recognised for financial reporting purposes in the year of acquisition:
| | | |
ASSET CLASS | | THRESHOLD |
Information technology equipment | | $ | 5,000 |
Furniture, fittings and office equipment | | $ | 5,000 |
Plant and machinery | | $ | 5,000 |
Items with a lesser value are expensed in the year of acquisition.
Depreciation is calculated on a straight line basis over the estimated useful life of the assets.
Depreciation rates for each class of asset are as follows:
| | | |
ASSET CLASS | | DEPRECIATION RATE | |
Information technology equipment | | 6-40 | % |
Furniture, fittings and office equipment | | 8-33 | % |
Plant and machinery | | 10-30 | % |
The assets’ residual values, useful lives and depreciation methods are reviewed and adjusted, if appropriate, at each financial year end.
DERECOGNITION
An item of property, plant and equipment is derecognised upon disposal or when no further future economic benefits are expected from its use. Any gain or loss arising on derecognition of the asset (calculated as the difference between the net disposal proceeds and the carrying amount of the asset) is included in the Income Statement in the year the asset is derecognised.
IMPAIRMENT
The carrying amounts of QTC’s assets are reviewed at each balance sheet date to determine whether there is any indication of impairment. If any such indication exists, the asset’s recoverable amount is estimated. An assessment of impairment has been made and no adjustment was required.
(O) INTANGIBLE ASSETS
SOFTWARE
Acquired computer software licences are capitalised on the basis of the costs incurred to acquire and bring to use the specific software. These costs are amortised over their estimated useful lives between two to five years.
68
Notes to and Forming Part of the Financial Statements
For the year ended 30 June 2008—(Continued)
Costs associated with the development of computer software for projects exceeding a threshold of $100,000 are recognised as intangible assets if the product is technically and commercially feasible and it is likely to generate future economic benefits exceeding costs beyond one year. The expenditure capitalised comprises all directly attributable costs including some labour costs. All other costs associated with the development of software are expensed as incurred.
Computer software development costs recognised as assets are amortised on a straight-line basis over the period of expected benefit, which is usually five years.
(P) PAYMENT IN LIEU OF INCOME TAX
QTC is exempt from the payment of income tax under section 50-25 of the Income Tax Assessment Act 1997 (as amended).
QTC makes a payment in lieu of income tax to the Queensland Government’s Consolidated Fund. The calculation of the income tax liability is based on the income of certain activities controlled by QTC.
In calculating the payment in lieu of income tax expense, tax effect accounting principles are adopted for income received and expenses paid in relation to the management and administration of customers’ borrowings and deposits as well as for advisory services and structured finance transactions. For all other QTC operations on which a payment in lieu of income tax is made, tax effect accounting principles are not applied.
QTC’s controlled and jointly controlled entities are defined as State and Territory bodies under section 24AO of the Income Tax Assessment Act 1936 and as a consequence, are exempt from Commonwealth tax under section 24AM of this Act.
Deferred income tax is provided in full, using the liability method, on all temporary differences arising between the tax bases of assets and liabilities and their carrying amounts in the financial statements.
Deferred income tax liabilities are recognised for all taxable temporary differences arising from prepayments of expenditure of QTC. Deferred income tax assets are recognised for deductible temporary differences arising from accruals of expenditure, employee benefits and depreciation charged on property, plant and equipment.
Deferred tax assets are recognised where it is probable that future taxable income will be available against which the temporary differences can be utilised.
(Q) EMPLOYEE BENEFITS
WAGES, SALARIES, ANNUAL LEAVE, LONG SERVICE LEAVE AND SICK LEAVE
Wages, salaries, annual and long service leave due but unpaid at reporting date are recognised in other creditors at the remuneration rates expected to apply at the time of settlement and include related on-costs such as payroll tax, worker’s compensation premiums and employer superannuation contributions.
For unpaid entitlements expected to be paid within 12 months, the liabilities are recognised at their undiscounted values. For those entitlements not expected to be paid within 12 months, the liabilities are recognised at their present value, calculated using Commonwealth Government bond yields of similar maturity.
69
Notes to and Forming Part of the Financial Statements
For the year ended 30 June 2008—(Continued)
Prior history indicates that on average, sick leave taken each reporting period is less than the entitlement accrued. This is expected to continue in future periods. Accordingly, it is unlikely that existing accumulated entitlements will be used by employees and no liability for unused sick leave entitlements is recognised.
As sick leave is non-vesting, an expense is recognised for this leave as it is taken.
RETIREMENT BENEFITS
Contributions made by QTC to employee contributory superannuation funds (to provide benefits for employees and their dependants on retirement, disability or death) are charged to the Income Statement. QTC is not responsible for any shortfalls.
(R) PROVISIONS FOR IMPAIRED LOANS
Over the period 1996 to 2000, QTC, at the direction of the Queensland Government, acquired loans provided by financial institutions to a number of cooperative housing societies at a cost equivalent to book value. At the time of acquisition, there were a number of non performing loans. Specific provisions have been made where full recovery of principal and interest is considered doubtful based on the net realisable value of the underlying security. Such loans are treated as impaired assets and categorised as non-accrual loans as set out and explained in note 10.
(S) ROUNDING
Amounts have been rounded to the nearest thousand dollars except for note 25 which is rounded to the nearest million dollars and notes 27, 28 and 29 which are in whole dollars.
(T) COMPARATIVE FIGURES
Where necessary, comparative figures have been adjusted to conform with changes in presentation in the current year.
(U) JUDGMENTS AND ASSUMPTIONS
QTC has made no judgements or assumptions which may cause a material adjustment to the carrying amounts of assets and liabilities within the next reporting period.
70
Notes to and Forming Part of the Financial Statements
For the year ended 30 June 2008—(Continued)
3. Interest Income and Interest Expense
| | | | | | | | | | | | |
| | | FOR THE YEAR ENDED 30 JUNE 2008 | |
| | | INTEREST | | | NET UNREALISED
GAIN/LOSS | | | NET REALISED
GAIN/LOSS | | | TOTAL
INTEREST | |
| | | $000 | | | $000 | | | $000 | | | $000 | |
INTEREST INCOME | | | | | | | | | | | | |
| | | | |
AUSTRALIA | | | | | | | | | | | | |
Money market deposits | | 43,670 | | | 3 | | | — | | | 43,673 | |
Discount securities | | 608,905 | | | 803 | | | 78 | | | 609,786 | |
Commonwealth and semi-government securities | | 208,237 | | | (17,850 | ) | | (54,220 | ) | | 136,167 | |
Floating rate notes | | 266,161 | | | (80,835 | ) | | 10 | | | 185,336 | |
Other investments | | 47,666 | | | (9,140 | ) | | — | | | 38,526 | |
Forward rate agreements | | — | | | (26,440 | ) | | — | | | (26,440 | ) |
Onlendings* | | 1,515,421 | | | (25,755 | ) | | — | | | 1,489,666 | |
| | | | |
OVERSEAS | | | | | | | | | | | | |
Credit default swaps | | 945 | | | (9,299 | ) | | 2 | | | (8,352 | ) |
| | | | | | | | | | | | |
| | 2,691,005 | | | (168,513 | ) | | (54,130 | ) | | 2,468,362 | |
| | | | | | | | | | | | |
INTEREST EXPENSE | | | | | | | | | | | | |
| | | | |
AUSTRALIA | | | | | | | | | | | | |
Deposits | | 471,077 | | | (63 | ) | | — | | | 471,014 | |
Treasury notes | | 120,210 | | | 88 | | | — | | | 120,298 | |
Bonds | | 1,303,820 | | | 134,484 | | | (374,528 | ) | | 1,063,776 | |
Credit foncier loans | | 111 | | | (31 | ) | | — | | | 80 | |
Interest rate swaps | | 88,230 | | | 69,936 | | | — | | | 158,166 | |
Futures | | — | | | (6,025 | ) | | 24,961 | | | 18,936 | |
| | | | |
OVERSEAS | | | | | | | | | | | | |
Commercial paper | | 44,311 | | | (98,152 | ) | | — | | | (53,841 | ) |
Bonds | | 775,127 | | | (46,351 | ) | | (114,576 | ) | | 614,200 | |
Medium term notes | | 25,869 | | | 2,578 | | | (367 | ) | | 28,080 | |
Cross currency swaps | | 16,979 | | | (19,795 | ) | | — | | | (2,816 | ) |
Forward exchange contracts | | (7 | ) | | 3,465 | | | 123,062 | | | 126,520 | |
| | | | |
OTHER | | | | | | | | | | | | |
Registration and issue costs | | 2,343 | | | — | | | — | | | 2,343 | |
Commissions on futures | | 1,469 | | | — | | | — | | | 1,469 | |
| | | | | | | | | | | | |
| | 2,849,539 | | | 40,134 | | | (341,448 | ) | | 2,548,225 | |
| | | | | | | | | | | | |
| * | The majority of onlendings are provided to customers on a pooled fund basis. Interest costs are allocated to customers based on the daily movement in the market value of the pooled fund. Except for fixed rate loans, the interest from onlendings figure includes unrealised gains and losses which reflects the amount charged to customers. In periods of rising interest rates, the market value of the funding pool will fall leading to lower interest income from onlendings. Although interest rates rose during the year ended 30 June 2008, this was offset by a similar rise in interest rates during 2006-07. The main factor which led to higher interest income in 2007-08 was the large increase in client onlending balances over the period. |
71
Notes to and Forming Part of the Financial Statements
For the year ended 30 June 2008—(Continued)
| | | | | | | | | | | |
| | | FOR THE YEAR ENDED 30 JUNE 2007 | |
| | | INTEREST | | NET UNREALISED
GAIN/LOSS | | | NET REALISED
GAIN/LOSS | | | TOTAL
INTEREST | |
| | | $000 | | $000 | | | $000 | | | $000 | |
INTEREST INCOME | | | | | | | | | | | |
| | | | |
AUSTRALIA | | | | | | | | | | | |
Money market deposits | | 59,230 | | 8 | | | — | | | 59,238 | |
Discount securities | | 487,748 | | 397 | | | (135 | ) | | 488,010 | |
Commonwealth and semi-government securities | | 117,767 | | (16,810 | ) | | (50,225 | ) | | 50,732 | |
Floating rate notes | | 175,709 | | 189 | | | 1,110 | | | 177,008 | |
Other investments | | 59,031 | | (4,980 | ) | | (91 | ) | | 53,960 | |
Forward rate agreements | | — | | (84,698 | ) | | — | | | (84,698 | ) |
Onlendings | | 821,624 | | (53,000 | ) | | — | | | 768,624 | |
| | | | |
OVERSEAS | | | | | | | | | | | |
Credit default swaps | | 772 | | (201 | ) | | (7 | ) | | 564 | |
| | | | | | | | | | | |
| | 1,721,881 | | (159,095 | ) | | (49,348 | ) | | 1,513,438 | |
| | | | | | | | | | | |
INTEREST EXPENSE | | | | | | | | | | | |
| | | | |
AUSTRALIA | | | | | | | | | | | |
Deposits | | 316,578 | | 302 | | | — | | | 316,880 | |
Treasury notes | | 28,166 | | 41 | | | — | | | 28,207 | |
Bonds | | 977,446 | | (317,257 | ) | | (114,790 | ) | | 545,399 | |
Credit foncier loans | | 229 | | (776 | ) | | — | | | (547 | ) |
Interest rate swaps | | 55,557 | | 77,170 | | | — | | | 132,727 | |
Forward rate agreements | | — | | (449 | ) | | 783 | | | 334 | |
Futures | | — | | (1,089 | ) | | 20,246 | | | 19,157 | |
| | | | |
OVERSEAS | | | | | | | | | | | |
Commercial paper | | 17,020 | | (36,993 | ) | | (147 | ) | | (20,120 | ) |
Bonds | | 663,886 | | (145,957 | ) | | (138,886 | ) | | 379,043 | |
Medium term notes | | 15,923 | | 553 | | | (495 | ) | | 15,981 | |
Forward exchange contracts | | 12 | | 7,206 | | | 33,607 | | | 40,825 | |
| | | | |
OTHER | | | | | | | | | | | |
Registration and issue costs | | 2,194 | | — | | | — | | | 2,194 | |
Commissions on futures | | 1,684 | | — | | | — | | | 1,684 | |
| | | | | | | | | | | |
| | 2,078,695 | | (417,249 | ) | | (199,682 | ) | | 1,461,764 | |
| | | | | | | | | | | |
72
Notes to and Forming Part of the Financial Statements
For the year ended 30 June 2008—(Continued)
4. Management Fees
Management fees represent income earned from the management of QTC’s onlendings and deposits. A further amount of $11.717 million (2007 $8.060 million), derived from interest rate margins on certain managed funds and pools, has been included under interest income.
5. Administration Expenses
| | | | |
| | | 2008 | | 2007 |
| | | $000 | | $000 |
Salaries and related costs | | 13,820 | | 14,567 |
Superannuation contributions | | 1,930 | | 1,711 |
Consultants’ fees (i) | | 3,390 | | 3,423 |
Outsourced services (ii) | | 1,317 | | 1,135 |
Depreciation on property, plant and equipment | | 5,718 | | 6,156 |
Amortisation on intangibles | | 253 | | 211 |
Computer and maintenance charges | | 1,331 | | 1,345 |
Property charges | | 1,593 | | 1,321 |
External audit fees | | 329 | | 295 |
Internal audit fees | | 459 | | 366 |
Staff training and development | | 343 | | 261 |
Investor and market relations program | | 756 | | 439 |
Telephone, postage, printing and stationery | | 504 | | 411 |
Other administration expenses | | 1,655 | | 1,317 |
| | | | |
| | 33,398 | | 32,958 |
| | | | |
(i) CONSULTANTS’ FEES | | | | |
Legal costs professional/technical | | 821 | | 1,073 |
Information technology | | 606 | | 93 |
Contractors/secondments | | 1,260 | | 1,459 |
Finance/accounting | | 302 | | 473 |
Human resource management | | 139 | | 61 |
Communications | | 72 | | 108 |
Other | | 190 | | 156 |
| | | | |
| | 3,390 | | 3,423 |
| | | | |
(ii) OUTSOURCED SERVICES | | | | |
Information services | | 537 | | 533 |
Registry charges | | 222 | | 123 |
Economic services | | 99 | | 126 |
Domestic and international clearing charges | | 242 | | 219 |
Bank charges | | 176 | | 84 |
Other | | 41 | | 50 |
| | | | |
| | 1,317 | | 1,135 |
| | | | |
73
Notes to and Forming Part of the Financial Statements
For the year ended 30 June 2008—(Continued)
6. Payment in Lieu of Income Tax
| | | | | | |
| | | 2008 | | | 2007 | |
| | | $000 | | | $000 | |
INCOME TAX EXPENSE | | | | | | |
Current tax | | 15,942 | | | 13,485 | |
Deferred tax | | (261 | ) | | 255 | |
| | | | | | |
| | 15,681 | | | 13,740 | |
| | | | | | |
Deferred income tax (revenue)/expense included in income tax expense comprises: | | | | | | |
(Increase)/decrease in deferred tax assets | | (283 | ) | | 602 | |
Increase/(decrease) in deferred tax liabilities | | 22 | | | (347 | ) |
| | | | | | |
| | (261 | ) | | 255 | |
| | | | | | |
NUMERICAL RECONCILIATION OF INCOME TAX EXPENSE TO PRIMA FACIE TAX PAYABLE | | | | | | |
Operating (loss)/surplus from continuing operations before income tax expense | | (65,024 | ) | | 59,589 | |
| | |
Add back | | | | | | |
Operating loss/(surplus) from non taxable pools | | 117,436 | | | (13,834 | ) |
| | | | | | |
Operating profit from taxable pools | | 52,412 | | | 45,755 | |
| | | | | | |
Tax at the Australian tax rate of 30% on taxable pools | | 15,723 | | | 13,727 | |
| | |
Tax effect of amounts which are not (taxable)/deductible in calculating taxable income: | | | | | | |
Share of net profit of jointly controlled entities | | (76 | ) | | 2 | |
Other | | 34 | | | 11 | |
| | | | | | |
INCOME TAX EXPENSE | | 15,681 | | | 13,740 | |
| | | | | | |
Deferred income tax at 30 June relates to the following: | | | | | | |
| | |
DEFERRED TAX ASSETS | | | | | | |
Accruals | | 239 | | | 48 | |
Employee benefits | | 1,128 | | | 1,036 | |
| | | | | | |
| | 1,367 | | | 1,084 | |
| | | | | | |
DEFERRED TAX LIABILITY | | | | | | |
Property, plant and equipment | | 22 | | | — | |
| | | | | | |
| | 22 | | | — | |
| | | | | | |
Current tax liability | | 15,942 | | | 13,485 | |
Deferred tax liability | | 22 | | | — | |
| | | | | | |
TAX LIABILITIES | | 15,964 | | | 13,485 | |
| | | | | | |
7 . Receivables
| | | | |
| | | 2008 | | 2007 |
| | | $000 | | $000 |
GST receivable | | 4,288 | | — |
Operating leases | | 1,216 | | 1,216 |
Sundry debtors | | 1,982 | | 1,277 |
| | | | |
| | 7,486 | | 2,493 |
| | | | |
74
Notes to and Forming Part of the Financial Statements
For the year ended 30 June 2008—(Continued)
8. Financial Assets at Fair Value through Profit or Loss
| | | | |
| | | 2008 | | 2007 |
| | | $000 | | $000 |
AUSTRALIA | | | | |
Money market deposits | | 841,179 | | 749,202 |
Discount securities | | 7,576,312 | | 9,136,761 |
Commonwealth and semi-government securities(1) | | 3,842,084 | | 2,429,777 |
Floating rate notes | | 3,872,355 | | 2,980,401 |
Other investments | | 562,193 | | 904,264 |
| | | | |
| | 16,694,123 | | 16,200,405 |
| | | | |
The total includes investments made to manage:
| | • | | deposits of $8 251.872 million (2007 $7 698.426 million) |
| | • | | surpluses and reserves of $292.644 million (2007 $373.349 million) |
| | • | | cross border lease deferred income of cross $118.328 million (2007 $126.925 million) |
The remaining investments are used to facilitate management of liquidity and interest rate risk or result from QTC borrowing in advance of requirements.
Note:
| (1) | QTC maintains holdings of its own stocks. These holdings have been excluded from Financial Assets and Financial Liabilities at Fair Value through Profit or Loss (refer note 15). |
9. Derivative Financial Assets
| | | | |
| | | 2008 | | 2007 |
| | | $000 | | $000 |
AUSTRALIA | | | | |
Interest rate swaps | | 63,435 | | 82,697 |
Forward rate agreements | | 160,556 | | 28,200 |
| | |
OVERSEAS | | | | |
Forward exchange contracts | | 423 | | 1,088 |
Credit default swaps | | — | | 866 |
| | | | |
| | 224,414 | | 112,851 |
| | | | |
75
Notes to and Forming Part of the Financial Statements
For the year ended 30 June 2008—(Continued)
10. Onlendings
| | | | | | | | |
| | | | | 2008 | | | 2007 | |
| | | | | $000 | | | $000 | |
Government departments and agencies | | | | 6,163,949 | | | 2,994,540 | |
Government owned corporations | | | | 16,970,788 | | | 15,143,495 | |
Local government | | | | 3,038,545 | | | 2,932,106 | |
QTC related entities(1) | | | | 294,130 | | | 333,012 | |
Statutory bodies | | | | 793,672 | | | 828,340 | |
Tollway companies | | | | 1,799,454 | | | 1,249,534 | |
Queensland water entities | | | | 3,836,291 | | | 770,117 | |
Other bodies | | | | 11,408 | | | 12,914 | |
Cooperative housing society loans | | | | 3,457 | | | 4,951 | |
Provisions for impaired loans | | (i) | | (188 | ) | | (155 | ) |
| | | | | | | | |
| | | | 32,911,506 | | | 24,268,854 | |
| | | | | | | | |
Note:
| (1) | Included in the above figure is an onlending to DBCT Holdings Pty Ltd to fund the purchase and lease of operating rights to the Dalrymple Bay Coal Terminal (refer note 15 and note 31). The onlending is offset by a deposit of $294 million ( 2007 $333 million) held by QTC on behalf of the lessee of the terminal (refer note 15). |
(i) ASSET QUALITY
| | | | |
| | | 2008 | | 2007 |
| | | $000 | | $000 |
MOVEMENT IN PROVISIONS FOR IMPAIRED LOANS | | | | |
Balance at 1 July | | 155 | | 130 |
Charge against profit | | 33 | | 25 |
| | | | |
BALANCE AT 30 JUNE | | 188 | | 155 |
| | | | |
Impaired assets consist of non-accrual loans and restructured loans in respect of cooperative housing societies.
Non-accrual loans are loans for which there is reasonable doubt about the recovery of principal and interest and therefore provisions for impairment are recognised. Restructured loans consist of loans where the original contractual terms have been modified as a concession to the borrowers and revised terms are not comparable with those for new loans of similar risk. There were no restructured loans at 30 June 2008.
Past due loans are loans where principal and or interest are in arrears but full recovery of principal and interest is expected.
76
Notes to and Forming Part of the Financial Statements
For the year ended 30 June 2008—(Continued)
The following table provides an analysis of QTC’s impaired assets.
| | | | |
| | | 2008 | | 2007 |
| | | $000 | | $000 |
NON-ACCRUAL LOANS | | | | |
With specific provisions | | 463 | | 520 |
Less specific provisions for impaired loans | | 188 | | 155 |
| | | | |
NET NON-ACCRUAL LOANS | | 275 | | 365 |
| | | | |
PAST DUE LOANS | | | | |
Not more than one month | | 1,040 | | 1,080 |
More than one month and not more than three months | | 536 | | 628 |
More than three months and not more than six months | | 737 | | 1,009 |
| | | | |
TOTAL PAST DUE LOANS | | 2,313 | | 2,717 |
| | | | |
11. Property, Plant and Equipment
| | | | |
| | | 2008 | | 2007 |
| | | $000 | | $000 |
Gross property, plant and equipment | | 97,860 | | 46,482 |
Less accumulated depreciation | | 26,199 | | 20,997 |
| | | | |
NET PROPERTY, PLANT AND EQUIPMENT | | 71,661 | | 25,485 |
| | | | |
REPRESENTED BY: | | | | |
Information technology equipment | | 3,204 | | 3,559 |
Less accumulated depreciation | | 2,690 | | 2,800 |
| | | | |
| | 514 | | 759 |
| | | | |
Furniture, fittings and office equipment | | 27,900 | | 27,705 |
Less accumulated depreciation | | 17,354 | | 13,970 |
| | | | |
| | 10,546 | | 13,735 |
| | | | |
Plant and machinery(1) | | 66,756 | | 15,218 |
Less accumulated depreciation | | 6,155 | | 4,227 |
| | | | |
| | 60,601 | | 10,991 |
| | | | |
| | 71,661 | | 25,485 |
| | | | |
Note:
| (1) | Plant and machinery consists mainly of buses and yellow goods which QTC leases to public sector entities under a whole of government lease facility. |
77
Notes to and Forming Part of the Financial Statements
For the year ended 30 June 2008—(Continued)
Reconciliations of the carrying amounts for each class of property, plant and equipment are set out below:
| | | | | | | | | | | | |
DESCRIPTION | | INFORMATION
TECHNOLOGY
EQUIPMENT | | | FURNITURE,
FITTINGS
AND OFFICE
EQUIPMENT | | | PLANT AND
MACHINERY | | | TOTAL | |
| | | $000 | | | $000 | | | $000 | | | $000 | |
Carrying amount at 1 July 2006 | | 1,689 | | | 18,010 | | | 11,560 | | | 31,259 | |
Acquisitions | | 180 | | | 120 | | | 749 | | | 1,049 | |
Disposals | | (372 | ) | | (295 | ) | | — | | | (667 | ) |
Depreciation | | (738 | ) | | (4,100 | ) | | (1,318 | ) | | (6,156 | ) |
| | | | | | | | | | | | |
CARRYING AMOUNT AT 30 JUNE 2007 | | 759 | | | 13,735 | | | 10,991 | | | 25,485 | |
| | | | | | | | | | | | |
Carrying amount at 1 July 2007 | | 759 | | | 13,735 | | | 10,991 | | | 25,485 | |
Acquisitions | | 14 | | | 344 | | | 51,538 | | | 51,896 | |
Disposals | | — | | | (2 | ) | | — | | | (2 | ) |
Depreciation | | (259 | ) | | (3,531 | ) | | (1,928 | ) | | (5,718 | ) |
| | | | | | | | | | | | |
CARRYING AMOUNT AT 30 JUNE 2008 | | 514 | | | 10,546 | | | 60,601 | | | 71,661 | |
| | | | | | | | | | | | |
12. Intangible Assets
| | | | | | |
| | | 2008 | | | 2007 | |
| | | $000 | | | $000 | |
Software, at cost | | 5,169 | | | 2,683 | |
Less accumulated amortisation | | 2,330 | | | 2,192 | |
| | | | | | |
NET INTANGIBLE ASSETS | | 2,839 | | | 491 | |
| | | | | | |
Carrying amount at 1 July | | 491 | | | 310 | |
Acquisitions(1) | | 2,601 | | | 392 | |
Amortisation | | (253 | ) | | (211 | ) |
| | | | | | |
CARRYING AMOUNT AT 30 JUNE | | 2,839 | | | 491 | |
| | | | | | |
Note:
| (1) | Includes 2.496 million of internally developed software not yet commissioned. |
13. Payables
| | | | |
| | | 2008 | | 2007 |
| | | $000 | | $000 |
Cross border lease deferred income | | 118,328 | | 126,925 |
Whole of Government Debt Pool net position | | 22,855 | | 41,703 |
Administration expenses | | 6,662 | | 5,401 |
Employee benefits | | 3,760 | | 3,455 |
Unearned revenue | | 917 | | 711 |
Other creditors | | 316 | | 269 |
GST payable | | — | | 2,114 |
| | | | |
| | 152,838 | | 180,578 |
| | | | |
78
Notes to and Forming Part of the Financial Statements
For the year ended 30 June 2008—(Continued)
14. Derivative Financial Liabilities
| | | | |
| | | 2008 | | 2007 |
| | | $000 | | $000 |
AUSTRALIA | | | | |
Interest rate swaps | | 229,432 | | 154,861 |
Forward rate agreements | | 209,734 | | 105,699 |
| | |
OVERSEAS | | | | |
Foreign exchange swaps | | 13,695 | | 10,895 |
Credit default swaps | | 8,932 | | 499 |
Cross currency swaps | | 12,175 | | — |
| | | | |
| | 473,968 | | 271,954 |
| | | | |
15. Financial Liabilities at Fair Value through Profit or Loss
| | | | |
| | | 2008 | | 2007 |
| | | $000 | | $000 |
Deposits | | | | |
Government owned corporations | | 1,232,256 | | 2,541,681 |
Local governments | | 1,766,211 | | 1,502,845 |
Statutory bodies | | 3,343,142 | | 2,409,191 |
Government departments and agencies | | 134,286 | | 102,977 |
Tollway companies | | 157,812 | | 31,511 |
Queensland water entities | | 140,238 | | 104,296 |
QTC related entities | | 47,081 | | 53,152 |
Other depositors(1) | | 383,897 | | 420,300 |
| | | | |
| | 7,204,923 | | 7,165,953 |
Stock lending | | — | | 279,241 |
Repurchase agreements | | 1,046,949 | | 253,232 |
| | | | |
TOTAL DEPOSITS | | 8,251,872 | | 7,698,426 |
| | | | |
Note:
| (1) | Includes a security deposit of $294 million (2007 $333 million) held on behalf of the lessee of the Dalrymple Bay Coal Terminal. |
INTEREST-BEARING LIABILITIES
| | | | |
AUSTRALIA | | | | |
Treasury notes | | 998,023 | | 374,782 |
Bonds | | 24,865,403 | | 19,777,369 |
Credit foncier loans | | 1,480 | | 1,908 |
| | | | |
| | 25,864,906 | | 20,154,059 |
| | | | |
OVERSEAS | | | | |
Commercial paper(1) | | 446,599 | | 219,400 |
Bonds(2) | | 14,003,465 | | 11,533,429 |
Medium term notes(3) | | 413,180 | | 167,638 |
| | | | |
| | 14,863,244 | | 11,920,467 |
| | | | |
TOTAL INTEREST-BEARING LIABILITIES | | 40,728,150 | | 32,074,526 |
| | | | |
TOTAL FINANCIAL LIABILITIES AT FAIR VALUE THROUGH PROFIT OR LOSS | | 48,980,022 | | 39,772,952 |
| | | | |
79
Notes to and Forming Part of the Financial Statements
For the year ended 30 June 2008—(Continued)
Notes:
| (1) | Includes $214.0 million (2007 $7.665 million) of commercial paper borrowed in the Euro Australian dollar commercial paper markets. |
| (2) | Consists of global bonds which are borrowed in the United States domestic and Euro bond markets in Australian dollars. |
| (3) | Consists of borrowings in the Euro medium term note markets in Australian dollars. |
Derivatives are used to hedge offshore borrowings resulting in no net exposure to any foreign currency. Details of QTC’s exposure to foreign currencies and the derivatives used to hedge this exposure are disclosed in note 18 (a)(i).
QTC borrowings are guaranteed by the Queensland Government under the Queensland Treasury Corporation Act 1988.
The difference between the carrying amount of financial liabilities and the amount contractually required to be paid at maturity to the holder of the obligation is set out in the following table.
| | | | | | | |
| | | 2008 | |
| | | FAIR VALUE | | REPAYMENT
AT MATURITY | | DIFFERENCE | |
| | | $000 | | $000 | | $000 | |
INTEREST-BEARING LIABILITIES | | | | | | | |
| | | |
AUSTRALIA | | | | | | | |
Treasury notes | | 998,023 | | 1,000,000 | | (1,977 | ) |
Bonds | | 24,865,403 | | 25,563,613 | | (698,210 | ) |
Credit foncier loans | | 1,480 | | 1,362 | | 118 | |
| | | | | | | |
| | 25,864,906 | �� | 26,564,975 | | (700,069 | ) |
| | | | | | | |
OVERSEAS | | | | | | | |
Commercial paper | | 446,599 | | 452,147 | | (5,548 | ) |
Bonds | | 14,003,465 | | 14,380,162 | | (376,697 | ) |
Medium-term notes | | 413,180 | | 398,898 | | 14,282 | |
| | | | | | | |
| | 14,863,244 | | 15,231,207 | | (367,963 | ) |
| | | | | | | |
| | 40,728,150 | | 41,796,182 | | (1,068,032 | ) |
| | | | | | | |
| | | |
| | | 2007 | |
| | | FAIR VALUE | | REPAYMENT
AT MATURITY | | DIFFERENCE | |
| | | $000 | | $000 | | $000 | |
INTEREST-BEARING LIABILITIES | | | | | | | |
| | | |
AUSTRALIA | | | | | | | |
Treasury notes | | 374,782 | | 380,000 | | (5,218 | ) |
Bonds | | 19,777,369 | | 20,072,804 | | (295,435 | ) |
Credit foncier Loans | | 1,908 | | 1,738 | | 170 | |
| | | | | | | |
| | 20,154,059 | | 20,454,542 | | (300,483 | ) |
| | | | | | | |
OVERSEAS | | | | | | | |
Commercial paper | | 219,400 | | 222,267 | | (2,867 | ) |
Bonds | | 11,533,429 | | 11,659,063 | | (125,634 | ) |
Medium-term notes | | 167,638 | | 158,900 | | 8,738 | |
| | | | | | | |
| | 11,920,467 | | 12,040,230 | | (119,763 | ) |
| | | | | | | |
| | 32,074,526 | | 32,494,772 | | (420,246 | ) |
| | | | | | | |
80
Notes to and Forming Part of the Financial Statements
For the year ended 30 June 2008—(Continued)
16. Reserves
| | | | |
| | | 2008 | | 2007 |
| | | $000 | | $000 |
GENERAL RESERVE | | | | |
Balance at 1 July | | 39,082 | | 39,082 |
| | | | |
BALANCE AT 30 JUNE | | 39,082 | | 39,082 |
| | | | |
CREDIT RISK RESERVE(1) | | | | |
Balance at 1 July | | 28,129 | | 21,321 |
Transfer from retained surplus | | 5,871 | | 6,808 |
| | | | |
BALANCE AT 30 JUNE | | 34,000 | | 28,129 |
| | | | |
Basis Risk RESERVE(2) | | | | |
Balance at 1 July | | 16,500 | | 14,000 |
Transfer from retained surplus | | 37,000 | | 2,500 |
BALANCE AT 30 JUNE | | 53,500 | | 16,500 |
| | | | |
TOTAL | | 126,582 | | 83,711 |
| | | | |
Notes:
| (1) | To reduce the impact of a credit failure on it retained earnings, funds are set aside to a Credit Risk Reserve. The Reserve will be utilised if a credit default by a counterparty results in a shortfall in the balance of investments. |
| (2) | The Basis Risk Reserve has been created to provide for losses that may occur as a result of basis risk where QTC has borrowed in excess of its loans to customers. The excess borrowings are needed to enable QTC to manage its customer debt portfolios and liquidity, and are hedged through the purchase of highly liquid assets. Gains/losses may occur due to interest yields on the asset hedges not moving in exactly the same manner as the interest yields on borrowings. Basis risk has been measured using the value at risk methodology. QTC is confident, at the 99% level, that the reserve of $53.500 million is adequate to cover the accumulated losses as a result of basis risk |
| | • | | on surplus fixed rate funding over a 10 business day period, and |
| | • | | on surplus floating rate funding over a 20 business day period. |
The remaining reserves are maintained for general purposes.
81
Notes to and Forming Part of the Financial Statements
For the year ended 30 June 2008—(Continued)
17. Notes to the Cash Flow Statement
(A) RECONCILIATION OF OPERATING (LOSS)/SURPLUS AFTER PAYMENT IN LIEU OF INCOME TAX TO NET CASH USED IN OPERATING ACTIVITIES
| | | | | | |
| | | 2008 | | | 2007 | |
| | | $000 | | | $000 | |
OPERATING (LOSS)/SURPLUS AFTER PAYMENT IN LIEU OF INCOME TAX | | (80,705 | ) | | 45,849 | |
| | |
NON-CASH FLOWS IN OPERATING SURPLUS | | | | | | |
Interest-bearing liabilities—net unrealised loss/(gain) | | 46,015 | | | (417,535 | ) |
Interest-bearing liabilities—net unrealised exchange loss | | 117,552 | | | 36,951 | |
Onlendings net unrealised loss | | 36,854 | | | 53,381 | |
Financial assets at fair value through profit or loss—net unrealised loss | | 87,027 | | | 85,296 | |
Financial assets at fair value through profit or loss—net unrealised exchange loss/(gain) | | 699 | | | (49 | ) |
Deposits—net unrealised loss/(gain) | | 195 | | | (286 | ) |
Depreciation of property, plant and equipment | | 5,718 | | | 6,155 | |
Net loss/(gain) on sale of property, plant and equipment | | 1 | | | (14 | ) |
Amortisation of intangibles | | 253 | | | 211 | |
Doubtful debts expense cooperative housing societies | | 33 | | | 25 | |
Share of (profit)/loss from investments accounted for using the equity method | | (254 | ) | | 5 | |
| | |
CHANGES IN ASSETS AND LIABILITIES | | | | | | |
(Increase)/decrease in financial assets at fair value through profit or loss—net accrued interest | | (47,435 | ) | | 47,744 | |
Decrease in financial assets at fair value through profit or loss—net discount/premium | | 101,807 | | | 51,741 | |
(Increase)/decrease in deferred tax asset | | (283 | ) | | 602 | |
Increase in onlendings—net accrued interest | | (183 | ) | | (205 | ) |
Increase in receivables | | (4,992 | ) | | (215 | ) |
Decrease/(increase) in prepayments | | 142 | | | (93 | ) |
Increase in interest-bearing liabilities—net accrued interest | | 98,138 | | | 54,230 | |
Decrease in interest-bearing liabilities—net discount/premium | | (817,720 | ) | | (410,466 | ) |
Increase/(decrease) in deposits net accrued interest | | 1,936 | | | (4 | ) |
Decrease in payables | | (27,740 | ) | | (17,527 | ) |
Increase/(decrease) in deferred tax liability | | 22 | | | (347 | ) |
Increase in income tax equivalent payable | | 2,457 | | | 323 | |
| | | | | | |
NET CASH USED IN OPERATING ACTIVITIES | | (480,463 | ) | | (464,228 | ) |
| | | | | | |
(B) CASH FLOWS PRESENTED ON A NET BASIS
Cash flows arising from the following activities are presented on a net basis in the Cash Flow Statement:
| | • | | loan advances to and redemptions from customers |
| | • | | receipt and withdrawal of customer deposits, and |
| | • | | money market and other deposits. |
82
Notes to and Forming Part of the Financial Statements
For the year ended 30 June 2008—(Continued)
18. Financial Risk Management
QTC’s activities expose it to a variety of financial risks; market risk (including currency risk, interest rate risk and price risk), credit risk and liquidity risk. QTC’s overall financial risk management program focuses on managing volatility and seeks to minimise potential adverse effects of financial risks on the financial performance of QTC and its customers. To assist in managing financial risk, QTC uses derivative financial instruments such as foreign exchange contracts, interest rate swaps and futures contracts to manage certain risk exposures.
All financial risk management activities are conducted within Board approved policies. The Board approves written policies for overall risk management, as well as specific areas such as mitigating foreign exchange, interest rate and credit risks, the use of derivative financial instruments and investing excess liquidity.
Robust systems are in place for managing financial risk, and compliance with financial risk policies is monitored closely. The financial risk management process, including daily measuring and monitoring of market risk exposure and daily measuring of actual performance against benchmark performance, as well as the Counterparty Credit Limit Framework and Approvals Process, is performed by teams separate from the teams transacting and is subject to review by the Risk Management Team (comprising senior management) and the Risk Management Committee. The Risk Management Committee comprises the entire QTC Board. Members of QTC’s Risk Management Team are invited to attend Risk Management Committee meetings as required.
All breaches of financial risk management policy together with the corrective action proposed or taken are required to be immediately reported to the Chief Executive and then to the next Risk Management Committee.
(A) MARKET RISK
QTC uses a Board approved value-at-risk (VAR) framework to manage QTC’s exposure to market risk. The VAR risk measure estimates the potential loss over a given holding period at a 99% confidence level. QTC uses the historical simulation approach to calculate VAR using 18 months of market data. Depending on the liquidity of the underlying financial instruments, either a 10 day or 20 day holding period is used. QTC is continuing to develop its scenario analysis capabilities to complement VAR.
(i) FOREIGN EXCHANGE RISK
QTC has facilities that allow for borrowing in foreign currencies. As QTC’s customers have no foreign currency funding requirements, all foreign currency borrowings are either hedged to Australian dollars to ensure no currency risk or utilised to invest in a foreign currency financial asset, effectively eliminating any foreign currency exposure. As such, QTC is not impacted by changes in foreign exchange rates.
At times, QTC’s Cash Fund invests in foreign currency assets. These investments are always hedged through the use derivatives to achieve an Australian dollar exposure.
QTC enters into both forward exchange contracts and cross currency swaps to manage the exposure of foreign currency borrowings and offshore investments to fluctuations in exchange rates.
83
Notes to and Forming Part of the Financial Statements
For the year ended 30 June 2008—(Continued)
The following table summarises the hedging effect that cross currency swaps and forward exchange contracts have had on face value offshore borrowings and investments stated in Australian dollars.
| | | | | | | | | | | | | | | | | | | | | |
| | | BORROWINGS | | | OFFSHORE
INVESTMENTS | | FORWARD
EXCHANGE
CONTRACTS | | | NET EXPOSURE |
| | | 2008 | | | 2007 | | | 2008 | | 2007 | | 2008 | | | 2007 | | | 2008 | | | 2007 |
| | | $000 | | | $000 | | | $000 | | $000 | | $000 | | | $000 | | | $000 | | | $000 |
USD | | (155,465 | ) | | (140,033 | ) | | 2,655 | | 2,643 | | 152,810 | | | 137,390 | | | — | | | ��� |
EUR | | — | | | (22,152 | ) | | — | | — | | — | | | 22,152 | | | — | | | — |
GBP | | (41,118 | ) | | — | | | — | | — | | 41,118 | | | — | | | — | | | — |
HKD | | — | | | (32,369 | ) | | — | | — | | — | | | 32,369 | | | — | | | — |
NZD | | (296,898 | ) | | — | | | — | | — | | 296,898 | | | — | | | — | | | — |
SGD | | — | | | (19,962 | ) | | — | | — | | — | | | 19,962 | | | — | | | — |
AUD | | (14,716,096 | ) | | (11,810,213 | ) | | — | | — | | (535,821 | ) | | (180,872 | ) | | (15,251,917 | ) | | 11,991,085 |
(ii) INTEREST RATE RISK
As the State’s corporate treasury, QTC undertakes portfolio management activities on behalf of customers and raises funding in advance of requirements. QTC borrows in advance of requirements to ensure Queensland public sector entities have ready access to funding when required and also to reduce the risk associated with refinancing maturing loans. In addition, QTC holds surplus funds to assist with the management of customer portfolios. These activities expose QTC to interest rate risk including basis risk which is managed within a value-at-risk framework.
Given the increase in market volatility over the year, there has been a significant increase in the reported value-at-risk which at 30 June was as follows:
| | | | | | |
| | | 2008 | | 2007 |
Interest rate risk VAR | | $ | 58m | | $ | 18m |
The above VAR calculation does not include the mark to market impact of changes in credit spreads on the value of assets held in the QTC Cash Fund. At 30 June 2008, QTC had an exposure of approximately $800,000 per basis point to changes in credit spreads.
In managing the interest rate risk on behalf of customers, the onlending portfolios are managed against a duration benchmark. Duration is a direct measure of the interest rate sensitivity of a financial instrument and quantifies the change in value of a financial instrument due to interest rate movements. To manage the risk of non-parallel yield curve movements, QTC allocates portfolio cash flows to a series of time periods and calculates the duration for each of these time periods against the benchmark duration for each of these periods. The same process is also used for QTC’s Cash Fund. All costs or benefits of managing customer portfolios are passed on to the customer meaning that QTC is effectively immunised from interest rate risk with respect to these portfolios.
QTC enters into interest rate swaps, forward rate agreements and futures contracts to assist in the management of interest rate risk for QTC and its customers.
In most instances, interest rate swaps are utilised to change the interest rate profiles of medium to long term fixed rate borrowings to floating rate borrowings at rates that are generally lower than those available to QTC if short-term borrowings were utilised. This also results in a source of medium to long term floating rate funding.
84
Notes to and Forming Part of the Financial Statements
For the year ended 30 June 2008—(Continued)
At times, floating to fixed swaps are undertaken to generate a fixed rate term funding profile. Under interest rate swaps, QTC agrees with other parties to exchange at specified intervals the difference between fixed rate and floating rate interest amounts calculated by reference to an agreed notional principal amount.
Where interest rate swaps are used to generate floating rate funding or where floating rate funding is used to fund floating rate investments, QTC is exposed to basis risk. This risk gives rise to a mark to market exposure to movements between the Swap curve (effectively the rate at which interest rate swaps are valued and the rate off which floating rate investments are valued) and the QTC curve (the rate at which QTC debt is valued). The swap risk is inherent in QTC’s approach to raising floating rate funds.
As a consequence of the widening of the Swap curve relative to the QTC curve over 2007-08, QTC has recorded unrealised mark to market accounting losses of $28 million related to floating rate funding. However it is unlikely that these losses will be realised due to the high credit quality of QTC’s counterparties. In addition QTC is likely to hold these swap positions and other investments until maturity such that any mark to market losses are expected to be reversed over the life of the funding strategy.
(B) LIQUIDITY RISK
QTC maintains its domestic and global benchmark bonds as its core medium and long-term funding facilities and its Euro-commercial paper facility and domestic treasury note facility as its core short-term funding facilities. In addition, QTC has in place a US commercial paper facility and a Euro medium-term note facility. These facilities ensure that QTC is readily able to access the domestic and international financial markets. QTC’s extensive range of funding facilities is detailed in note 25.
In addition, QTC borrows in advance of requirements:
| | • | | to reduce the risk of refinancing maturing loans, and |
| | • | | to ensure Queensland public sector entities have ready access to funding when required. |
QTC also maintains sufficient liquidity to manage the duration of its debt portfolios.
The ongoing global liquidity and credit crises experienced over 2007-08 meant that funds were not always available in the maturity profile preferred by QTC. While some difficulties were experienced, QTC was able to access attractively priced short, medium and long term funding due to the ‘flight to quality’ that occurs under these market stress situations. Given the severity and duration of the market disruptions, QTC implemented the following changes to improve liquidity:
| | • | | Increasing 11am cash holdings from $300 million to a minimum of $500 million or 20 working days’ cash requirements (whichever is the higher) to fund unexpected cash outflows |
| | • | | Increasing the time horizon for funding all known and anticipated cash flows (such as debt service payments and new borrowings) from 6 months to 12 months ahead of schedule based on declining levels of coverage (ie, sum of digits), and |
| | • | | Accessing the private placement market for long term funding when favourable opportunities arise. |
The table on the following page sets out the contractual cashflows relating to assets and liabilities held by QTC at balance date.
With the exception of deposits and payables, the maturity analysis for liabilities has been calculated based on the contractual cash flows relating to the repayment of the principal (face value) and interest amounts over the contractual terms.
85
Notes to and Forming Part of the Financial Statements
For the year ended 30 June 2008—(Continued)
Deposits on account of the Cash Fund and Working Capital Facility (11AM Fund) are repayable at call while deposits held as security for stock lending and repurchase agreements are repayable when the security is lodged with QTC.
With the exception of cash and receivables, the maturity analysis for assets has been calculated based on the contractual cash flows relating to the repayment of the principal (face value) and interest amounts over the contractual terms.
In relation to customer onlendings, certain loans are interest only with no fixed repayment date for the principal component (ie, loans are made based on the quality of the customer’s business and its financial strength). For the purposes of completing the maturity analysis, the principal component of these loans has been included in the over 5 year time band with no interest payment assumed in this time band.
CONTRACTUAL MATURITY AS AT 30 JUNE 2008
| | | | | | | | | | | | | | | | | | | | | |
| | | 0 TO 3
MONTHS | | | 3 TO 6
MONTHS | | | 6 TO 12
MONTHS | | | 1 TO 5
YEARS | | | OVER 5
YEARS | | | TOTAL | | | FAIR VALUE | |
| | | $000 | | | $000 | | | $000 | | | $000 | | | $000 | | | $000 | | | $000 | |
| FINANCIAL ASSETS | | | | | | | | | | | | | | | | | | | | | |
Cash | | 1,372 | | | — | | | — | | | — | | | — | | | 1,372 | | | 1,372 | |
Receivables | | 7,485 | | | — | | | — | | | — | | | — | | | 7,485 | | | 7,485 | |
Onlendings# | | 1,437,756 | | | 1,434,154 | | | 2,874,801 | | | 9,701,101 | | | 39,342,047 | | | 54,789,859 | | | 32,911,694 | |
| Financial assets at fair value | | 13,250,610 | | | 83,934 | | | 259,384 | | | 2,797,913 | | | 1,555,999 | | | 17,947,840 | | | 16,694,143 | |
| | | | | | | | | | | | | | | | | | | | | |
| TOTAL MONETARY ASSETS | | 14,697,223 | | | 1,518,088 | | | 3,134,185 | | | 12,499,014 | | | 40,898,046 | | | 72,746,556 | | | 49,614,694 | |
| | | | | | | | | | | | | | | | | | | | | |
| FINANCIAL LIABILITIES | | | | | | | | | | | | | | | | | | | | | |
Payables | | (152,838 | ) | | (15,964 | ) | | — | | | — | | | — | | | (168,802 | ) | | (168,802 | ) |
Deposits | | (8,111,972 | ) | | (22,628 | ) | | (127,062 | ) | | | | | | | | (8,261,662 | ) | | (8,251,872 | ) |
| Interest bearing liabilities—Australia | | (1,330,129 | ) | | (470,134 | ) | | (777,719 | ) | | (18,666,347 | ) | | (13,537,955 | ) | | (34,782,284 | ) | | (25,864,906 | ) |
| Interest-bearing liabilities—overseas | | (559,606 | ) | | (252,732 | ) | | (525,489 | ) | | (9,643,579 | ) | | (8,561,787 | ) | | (19,543,193 | ) | | (14,863,244 | ) |
| | | | | | | | | | | | | | | | | | | | | |
| TOTAL MONETARY LIABILITIES | | (10,154,545 | ) | | (761,458 | ) | | (1,430,270 | ) | | (28,309,926 | ) | | (22,099,742 | ) | | (62,755,941 | ) | | (49,148,824 | ) |
| | | | | | | | | | | | | | | | | | | | | |
DERIVATIVES | | (493,387 | ) | | (606,079 | ) | | (165,199 | ) | | 2,059,685 | | | 1,373,351 | | | 2,168,371 | | | (249,553 | ) |
| | | | | | | | | | | | | | | | | | | | | |
NET MONETARY ASSETS/(LIABILITIES) | | 4,049,291 | | | 150,551 | | | 1,538,716 | | | (13,751,227 | ) | | 20,171,655 | | | 12,158,986 | | | 216,317 | |
| | | | | | | | | | | | | | | | | | | | | |
CUMULATIVE | | 4,049,291 | | | 4,199,842 | | | 5,738,558 | | | (8,012,669 | ) | | 12,158,986 | | | — | | | | |
| | | | | | | | | | | | | | | | | | | | | |
| # | QTC’s onlendings to Government Owned Corporation customers are based on the quality of the business and financial strength of the customer. Funds are therefore onlent on the basis of these businesses being going concerns and continuing to meet key credit metrics criteria such as debt to capital and interest coverage ratios. Accordingly, a significant portion of the onlendings portfolio has a loan maturity profile which is greater than 5 years. However, the interest rate risk of these loans is managed based on the customer’s business risk such that the funding is structured on the underlying business profile. This results in QTC’s liability maturity profile being shorter than the asset maturity profile. Though not exposing QTC to interest rate risk, this approach does require QTC to undertake periodic refinancing of its liabilities. |
��
86
Notes to and Forming Part of the Financial Statements
For the year ended 30 June 2008—(Continued)
CONTRACTUAL MATURITY AS AT 30 JUNE 2007
| | | | | | | | | | | | | | | | | | | | | |
| | | 0 TO 3
MONTHS | | | 3 TO 6
MONTHS | | | 6 TO 12
MONTHS | | | 1 TO 5
YEARS | | | OVER 5
YEARS | | | TOTAL | | | FAIR VALUE | |
| | | $000 | | | $000 | | | $000 | | | $000 | | | $000 | | | $000 | | | $000 | |
| FINANCIAL ASSETS | | | | | | | | | | | | | | | | | | | | | |
| Cash | | 99 | | | — | | | — | | | — | | | — | | | 99 | | | 99 | |
| Receivables | | 2,493 | | | — | | | — | | | — | | | — | | | 2,493 | | | 2,493 | |
| Onlendings | | 642,302 | | | 598,743 | | | 1,213,406 | | | 8,592,537 | | | 29,320,901 | | | 40,367,889 | | | 24,269,009 | |
| Financial assets at fair value | | 13,216,706 | | | 432,585 | | | 285,765 | | | 2,010,909 | | | 1,200,308 | | | 17,146,272 | | | 16,200,405 | |
| | | | | | | | | | | | | | | | | | | | | |
| TOTAL MONETARY ASSETS | | 13,861,600 | | | 1,031,328 | | | 1,499,171 | | | 10,603,446 | | | 30,521,209 | | | 57,516,753 | | | 40,472,006 | |
| | | | | | | | | | | | | | | | | | | | | |
| FINANCIAL LIABILITIES | | | | | | | | | | | | | | | | | | | | | |
| Payables | | (180,578 | ) | | (13,485 | ) | | — | | | — | | | — | | | (194,063 | ) | | (194,063 | ) |
| Deposits | | (7,457,475 | ) | | (15,185 | ) | | (85,609 | ) | | (159,416 | ) | | — | | | (7,717,685 | ) | | (7,698,426 | ) |
| Interest bearing liabilities—Australia | | (1,939,557 | ) | | (319,691 | ) | | (699,210 | ) | | (14,352,661 | ) | | (9,160,054 | ) | | (26,471,173 | ) | | (20,154,059 | ) |
| Interest-bearing liabilities—overseas | | (1,617,935 | ) | | (321,403 | ) | | (363,841 | ) | | (6,994,823 | ) | | (6,377,134 | ) | | (15,675,136 | ) | | (11,920,468 | ) |
| | | | | | | | | | | | | | | | | | | | | |
TOTAL MONETARY LIABILITIES | | (11,195,546 | ) | | (669,765 | ) | | (1,148,660 | ) | | (21,506,899 | ) | | (15,537,188 | ) | | (50,058,057 | ) | | (39,967,014 | ) |
| | | | | | | | | | | | | | | | | | | | | |
| DERIVATIVES | | (163,515 | ) | | (717,341 | ) | | (445,939 | ) | | 1,703,459 | | | 2,021,194 | | | 2,397,858 | | | (159,103 | ) |
| | | | | | | | | | | | | | | | | | | | | |
NET MONETARY ASSETS/(LIABILITIES) | | 2,502,539 | | | (355,778 | ) | | (95,428 | ) | | (9,199,994 | ) | | 17,005,215 | | | 9,856,554 | | | 345,889 | |
| | | | | | | | | | | | | | | | | | | | | |
CUMULATIVE | | 2,502,539 | | | 2,146,761 | | | 2,051,333 | | | (7,148,661 | ) | | 9,856,554 | | | | | | | |
| | | | | | | | | | | | | | | | | | | | | |
(C) CREDIT RISK
(i) FINANCIAL MARKETS COUNTERPARTIES
QTC is exposed to credit risk. Credit risk is regularly assessed, measured and managed in strict accordance with QTC’s Credit Risk policies. Exposure to credit risk is managed through regular analysis of the ability of credit counterparties to meet payment obligations. Counterparty credit limits are changed based on changes in the capacity of the counterparty to meet its obligation.
Credit exposure is QTC’s estimate of its potential loss at balance date in relation to investments and derivative contracts in the event of non-performance by all counterparties. The credit exposure is calculated based on the market value of the exposure together with the value at risk which takes into account the current market value, duration, term to maturity and interest rate and/or exchange rate volatility.
The following table represents QTC’s exposure to credit risk at 30 June:
| | | | |
| | | CREDIT EXPOSURE |
| | | 2008 | | 2007 |
| | | $000 | | $000 |
Financial assets at fair value through profit or loss | | 21,407,615 | | 21,004,539 |
| | |
DERIVATIVES | | | | |
Interest rate swaps | | 733,359 | | 454,733 |
Cross currency swaps | | 66,277 | | — |
Foreign exchange contracts | | 40,547 | | 15,052 |
Credit default swaps | | 357,539 | | 367,352 |
87
Notes to and Forming Part of the Financial Statements
For the year ended 30 June 2008—(Continued)
QTC has a significant concentration of credit risk within the finance and investment industry. This is unavoidable given the size of QTC’s investment portfolio and the requirement to invest with counterparties rated A- or better and to invest in highly liquid securities.
QTC adopts a conservative approach to the management of credit risk with a strong bias to high quality counterparties. QTC maintains a ratings-based approach in determining maximum credit exposures to counterparties. The country of domicile, the size of the balance sheet of the counterparty, the size of its fund raising programs and the asset composition and quality of the underlying security are also taken into account when determining limits.
With the liquidity and credit crises having a significant financial impact on global banks/financial institutions and with continued volatility being experienced in financial markets, QTC continues to closely monitor its counterparty exposures. Enhanced monitoring processes, along with ‘tightening’ credit limits and approvals continues to be applied by QTC. Actions arising from these process enhancements and tightening of limits has resulted in the withdrawal of limits for securitisation programs where assets underlying those securitisation programs have been identified as inconsistent with QTC credit policy.
Counterparty exposure by rating for all investments and derivative contracts is listed below.
| | | | | | |
| | | | | CREDIT EXPOSURE |
| | | RATING | | 2008 | | 2007 |
| | | | | % | | % |
Long Term Rating | | AAA | | 41 | | 39 |
| | AA+ | | 3 | | 2 |
| | AA | | 15 | | 34 |
| | AA- | | 16 | | 10 |
| | A+ | | 15 | | 4 |
| | A | | 3 | | 3 |
| | A- | | 1 | | — |
Short-Term Rating | | A-1+ | | 6 | | 6 |
| | A-1 | | — | | 2 |
While QTC’s capital is not subject to regulatory oversight, QTC utilises a capital adequacy approach based on Basel II: International Convergence of Capital Measurements and Capital Standards to calculate and advise the Board of the amount of capital required to cover its credit risk.
IMPACT OF GLOBAL CREDIT CRISIS ON OPERATING RESULTS
QTC invests funds on behalf of its customers which are held in the QTC Cash Fund. Due to the significant widening of credit spreads over 2007-08, the value of the assets held in the Cash Fund were written down by $88 million due to unrealised mark to market accounting losses.
It has not been QTC’s practice to pass on credit margin changes, either positive or negative, as a result of credit spread movements in the returns to Cash Fund participants.
QTC does not expect any losses to be realised as the credit quality of its investments remains very high (ie, A- or above). In addition, as QTC generally holds the Cash Fund assets to maturity, it is expected that the unrealised losses will be reversed in future financial years.
88
Notes to and Forming Part of the Financial Statements
For the year ended 30 June 2008—(Continued)
(II) ONLENDING COUNTERPARTIES
Counterparties for onlendings with the exception of very small exposures to Suncorp-Metway Limited, cooperative housing societies and primary producer cooperatives are principally Queensland Government sector entities and in some cases an explicit Government guarantee exists. There is a specific Queensland Government guarantee in place for the Suncorp-Metway Limited loans. As a consequence, these exposures are not included in QTC’s total credit exposure.
19. Concentrations of Borrowings and Deposits
There are no material concentrations of borrowings as these funds are raised from diversified sources through various facilities disclosed under funding facilities in note 25. Managed fund depositors are principally Queensland Government sector entities. These deposits are invested in either QTC’s Cash Fund or Working Capital Facility (11AM Fund) which have a large core of liquid investments. QTC maintains regular contact with these depositors and therefore has a good knowledge of their forecast liquidity requirements.
Deposits for Stock Lending and Repurchase Agreements are invested in the Working Capital Facility (11AM Fund) which can be liquidated daily at no cost.
20. Contingent Liabilities
The following contingent liabilities existed at balance date:
| | • | | A total of $124 million (2007 $1 186 million) of Queensland Treasury Corporation inscribed stock was lent to various financial institutions. QTC lends stock on the basis that there is a simultaneous commitment by the other party to return the stock on an agreed date. These loans are made to support the liquidity of QTC bonds in the financial markets and form part of QTC’s total exposure to these financial institutions. The likelihood of a loss being incurred through default by a counterparty is remote due to the high credit quality of the counterparty and the short term nature of stock lending (refer note 23). |
| | • | | With regard to certain cross border lease transactions, QTC has assumed responsibility for a significant portion of the transaction risk. If certain events occur, QTC could be liable to make additional payments under the transactions. However external advice and history to date indicate the likelihood of these events occurring is remote. In addition, QTC has provided certain guarantees and indemnities to various participants in the cross border lease transactions. Expert external advisors consider that, unless exceptional and extreme circumstances arise, QTC will not be required to make a significant payment under these guarantees and indemnities. |
| | • | | To facilitate the merger of the former State owned financial institutions, Suncorp and QIDC with Metway Bank Ltd, QTC provided guarantees relating to certain obligations of the Queensland Government and Suncorp General Insurance Ltd. These guarantees are supported by counter indemnities from the Treasurer on behalf of the State of Queensland. |
| | • | | QTC has provided guarantees relating to the trading activities of Ergon Energy and CS Energy, Queensland Government owned corporations, or their subsidiaries, in the National Electricity Market to the value of $255 million (2007 $204 million) which are supported by counter indemnities from these Queensland Government owned corporations. |
| | • | | QTC has provided guarantees to the value of $143 million 2007 ( $88 million) to support the commercial activities of various Queensland public sector entities. In each case, a counter indemnity has been obtained by QTC from the appropriate public sector entity. |
89
Notes to and Forming Part of the Financial Statements
For the year ended 30 June 2008—(Continued)
| | • | | To provide support in relation to the sale by Tarong Energy Corporation Ltd of a 50% share in the Tarong North Power Station, QTC provided a guarantee of certain payment obligations of Tarong Energy Corporation Ltd under the transaction together with providing an irrevocable put option for 50% of the power station exercisable by the option holder under certain circumstances. This guarantee and put option are supported by an indemnity from Tarong Energy Corporation Ltd and an indemnity from the Treasurer for and on behalf of the State of Queensland. |
21. Operating Leases
QTC AS LESSEE
QTC has entered into a commercial lease for the tenancy of 61 Mary Street, Brisbane for an initial term of ten years from 1 January 2003 to 31 December 2012, with an option to renew the lease after that date. Lease payments are increased to reflect market rentals.
QTC has entered into various motor vehicle lease agreements expiring within one to three years.
The future minimum rentals payable under non-cancellable operating leases as at 30 June are as follows:
| | | | |
| | | 2008 | | 2007 |
| | | $000 | | $000 |
PAYABLE | | | | |
Not longer than 1 year | | 1,687 | | 1,134 |
Longer than 1 year but not longer than 5 years | | 5,776 | | 4,135 |
Longer than 5 years | | — | | 507 |
| | | | |
| | 7,463 | | 5,776 |
| | | | |
QTC AS LESSOR
QTC has entered into operating leases as lessor under a whole of government lease facility which include buses, information technology equipment, yellow goods and furniture and fittings.
These non-cancellable leases have remaining terms of between 1 and 10 years.
Future minimum rentals receivable under non-cancellable operating leases as at 30 June are as follows:
| | | | |
| | | 2008 | | 2007 |
| | | $000 | | $000 |
RECEIVABLE | | | | |
Not longer than 1 year | | 14,518 | | 6,698 |
Longer than 1 year but not longer than 5 years | | 39,249 | | 13,177 |
Longer than 5 years | | 22,025 | | 307 |
| | | | |
| | 75,792 | | 20,182 |
| | | | |
90
Notes to and Forming Part of the Financial Statements
For the year ended 30 June 2008—(Continued)
22. Forward Starting Fixed Rate Loan Commitments
QTC has entered into fixed rate loan agreements with certain customers to lock in interest rates on all or part of future borrowing requirements. QTC’s future borrowing commitments and the period in which funds are to be onlent are as follows.
| | | | |
| | | 2008 | | 2007 |
| | | $000 | | $000 |
Not longer than 1 year | | 1,378,263 | | 1,697,845 |
Longer than 1 year but not longer than 5 years | | 524,264 | | 1,902,527 |
| | | | |
| | 1,902,527 | | 3,600,372 |
| | | | |
23. Stock Lending
In support of an active trading and pricing market for QTC stock, QTC lends stock to various financial institutions. QTC’s stock lending policy ensures that all such transactions are covered by appropriate credit arrangements, credit limits, cash securities or the lodgement of collateral securities.
Stock lent which forms part of QTC’s exposure to a financial institution is reported as a contingent liability (refer note 20). In situations where the financial institution does not have an approved exposure or the limit of the exposure has been reached, the financial institution must either pledge stock which has a market value 10% greater than QTC stock lent, or deposit cash equivalent to the market value of QTC stock lent.
At 30 June 2008, there was no stock lent (2007 nil) in return for pledged stock while there was no QTC stock lent with cash held as security 2007 ( $284 million). Cash held was nil (2007 $279 million).
24. Segment Information
QTC operates predominantly in the finance and investment industry through liability and funds management activities domestically and offshore. Liability management activities relate to the borrowing of funds principally to finance the capital works programs of the State and the management of these borrowings so as to achieve the lowest cost to borrowers. The funds management activities of QTC relate to the investment of the short-term surpluses of public sector entities in order to achieve the highest possible return for a given level of risk.
QTC operates in Queensland, Australia.
91
Notes to and Forming Part of the Financial Statements
For the year ended 30 June 2008—(Continued)
25. Funding Facilities
| | | | | | | | | | |
FACILITY | | CURRENCY | | LIMIT | | FACE VALUE
ON ISSUE
2008 | | FACE VALUE
ON ISSUE
2007 |
| | | | | | | $M | | $M |
ONSHORE FACILITIES | | | | | | | | | | |
Domestic Benchmark Bonds | | AUD | | Unlimited | | AUD | 26,275 | | AUD | 20,468 |
Capital Indexed Bond | | AUD | | Unlimited | | AUD | 583 | | AUD | 278 |
Treasury Note | | AUD | | Unlimited | | AUD | 1,000 | | AUD | 380 |
| | | | |
OFFSHORE FACILITIES | | | | | | | | | | |
Global Benchmark Bonds | | AUD | | AUD 18,000 | | AUD | 14,380 | | AUD | 11,659 |
Euro Commercial Paper | | Multicurrency | | USD 3,000 | | USD | 386 | | USD | 189 |
US Commercial Paper | | Multicurrency | | USD 1,500 | | USD | 50 | | | — |
Euro Medium-Term Note | | Multicurrency | | USD 3,000 | | USD | 384 | | USD | 135 |
US Medium-Term Note | | Multicurrency | | USD 500 | | | — | | | — |
26. Related Party Transactions
A related party is one that controls, or is controlled by, or under common control with the entity. QTC has assessed that all State of Queensland controlled entities meet the definition of a related party under AASB124 related Party Disclosures. Local governments and public universities are not state controlled and are therefore not included as part of these disclosures.
(A) ULTIMATE CONTROLLING ENTITY
The immediate controlling entity and ultimate controlling entity during the year was the Under Treasurer of Queensland as the Corporation Sole of QTC.
(B) KEY MANAGEMENT PERSONNEL
Disclosures relating to key management personnel are set out in note 27.
(C) INVESTMENTS IN ASSOCIATES AND OTHER COMPANIES
Details of investments in associates and other companies are set out in note 30 and 31.
(D) TRANSACTIONS WITH RELATED PARTIES
Transactions undertaken with related parties during the year include the provision of lending, investment, advisory, banking and company secretarial services. These transactions were in the normal course of business and on commercial terms and conditions. They exclude certain advisory and other services provided to Queensland Treasury, its associated companies and other related parties at no charge.
92
Notes to and Forming Part of the Financial Statements
For the year ended 30 June 2008—(Continued)
The following revenue was earned and expenses paid as a consequence of transactions with related parties:
| | | | |
| | | 2008 | | 2007 |
| | | $000 | | $000 |
SALE OF GOODS AND SERVICES | | | | |
Revenue—fees charged (Queensland Treasury) | | 1,230 | | 12 |
Revenue—fees charged (associated companies) | | 191 | | 177 |
Revenue—fees charged (other State of Queensland controlled entities) | | 28,508 | | 22,620 |
Interest on onlendings (Queensland Treasury) | | 173,440 | | 13,233 |
Interest on onlendings (associated companies) | | 15,326 | | 17,182 |
Interest on onlendings (other State of Queensland controlled entities) | | 1,195,017 | | 658,379 |
| | |
PURCHASE OF GOODS AND SERVICES | | | | |
Income tax equivalent amount (Queensland Treasury) | | 15,942 | | 13,485 |
Directors fees (Queensland Treasury) | | 40 | | 45 |
Payment of services (Queensland Treasury) | | 114 | | 39 |
Payment of services (other State of Queensland controlled entities) | | 2,384 | | 1,969 |
Interest on deposits (Queensland Treasury) | | 43 | | 38 |
Interest on deposits (associated companies) | | 24,316 | | 20,751 |
Interest on deposits (other State of Queensland controlled entities) | | 314,835 | | 166,127 |
| | |
OTHER TRANSACTIONS | | | | |
Recovery of staff secondments (Queensland Treasury) | | 1,682 | | 938 |
Recovery of staff secondments (associated companies) | | 2,280 | | 1,254 |
Recovery of staff secondments (other State of Queensland controlled entities) | | 288 | | 2,202 |
(E) OUTSTANDING BALANCES
The following balances are outstanding at reporting date in relation to transactions with related parties:
| | | | |
| | | 2008 | | 2007 |
| | | $000 | | $000 |
ASSETS | | | | |
Onlendings (Queensland Treasury) | | 4,169,024 | | 972,166 |
Onlendings (associated companies) | | 294,130 | | 333,012 |
Onlendings (other State of Queensland controlled entities) | | 25,220,116 | | 19,831,724 |
Other receivables (Queensland Treasury) | | 418 | | 369 |
Other receivables (associated companies) | | 682 | | 67 |
Other receivables (other State of Queensland controlled entities) | | 2,130 | | 1,413 |
| | | | |
LIABILITIES | | | | |
Deposits (Queensland Treasury) | | 534 | | 2,048 |
Deposits (associated companies) | | 345,983 | | 536,224 |
Deposits (other State of Queensland controlled entities) | | 4,665,122 | | 4,781,410 |
Payables (Queensland Treasury) | | 39,243 | | 54,689 |
Payables (other State of Queensland controlled entities) | | 55 | | 37 |
| | |
FACILITIES PROVIDED (UNDRAWN BALANCES) | | | | |
Working Capital Facility (Queensland Treasury) | | 1,689,856 | | 777,829 |
Working Capital Facility (associated companies) | | 1,000 | | 1,000 |
Working Capital Facility (other State of Queensland controlled entities) | | 827,668 | | 336,630 |
93
Notes to and Forming Part of the Financial Statements
For the year ended 30 June 2008—(Continued)
No provisions for doubtful debts have been raised in relation to any outstanding balances, and no expenses recognised in respect of bad or doubtful debts due from related parties.
Contributions to superannuation funds on behalf of employees are disclosed in Note 5.
27. Key Management Personnel
Key management personnel are defined as those persons having authority and responsibility for planning, directing and controlling the activities of QTC, being members of the Board and the Executive Management Team.
(A) COMPENSATION
(i) DISCLOSURE BY CATEGORY
| | | | |
| | | 2008 | | 2007 |
| | | $ | | $ |
DIRECTORS | | | | |
Short-term employment benefits(1) | | 327,565 | | 302,210 |
Post-employment benefits(2) | | 11,714 | | 11,125 |
| | | | |
TOTAL | | 339,279 | | 313,335 |
| | | | |
EXECUTIVE OFFICERS | | | | |
Short-term employment benefits(1) | | 2,107,219 | | 1,983,732 |
Post-employment benefits(2) | | 126,072 | | 114,926 |
| | | | |
TOTAL | | 2,233,291 | | 2,098,658 |
| | | | |
Notes:
| (1) | Directors’ short-term benefits include board members fees, and in relation to the Chairman, also includes reimbursement of telephone expenses and the provision of a car park. Executive officers’ short-term benefits include wages, annual leave, long service leave, bonuses and non-monetary benefits such as car parks and motor vehicle benefits. |
| (2) | Post-employment benefits include superannuation. |
(ii) DIRECTORS
Details of the nature and amount of each major element of the remuneration of the Directors are as follows:
| | | | | | | | | | | | |
| | | SHORT-TERM
EMPLOYMENT
BENEFITS | | POST
EMPLOYMENT
BENEFITS | | TOTAL |
| | | 2008 | | 2007 | | 2008 | | 2007 | | 2008 | | 2007 |
| | | $ | | $ | | $ | | $ | | $ | | $ |
Sir Leo Hielscher—Chairman | | 110,553 | | 102,599 | | — | | — | | 110,553 | | 102,599 |
Tim Spencer—Deputy Chairman(1)( 2) | | 45,109 | | — | | — | | — | | 45,109 | | — |
Gerard Bradley(2) | | — | | 40,366 | | — | | — | | — | | 40,366 |
Gillian Brown | | 34,044 | | 28,405 | | 3,064 | | 2,556 | | 37,108 | | 30,961 |
David Coe(3) | | 21,845 | | 28,405 | | 1,966 | | 2,556 | | 23,811 | | 30,961 |
Marian Micalizzi | | 37,130 | | 34,043 | | 3,342 | | 3,064 | | 40,472 | | 37,107 |
Bill Shields | | 41,754 | | 35,625 | | — | | — | | 41,754 | | 35,625 |
Shauna Tomkins | | 37,130 | | 32,767 | | 3,342 | | 2,949 | | 40,472 | | 35,716 |
Notes:
| (1) | Tim Spencer, the Deputy Under Treasurer, replaced Gerard Bradley as the Deputy Chairman effective 1 July 2007. |
| (2) | Remuneration is paid to Queensland Treasury and remitted to the Consolidated Fund. |
| (3) | Resigned 18 February 2008. |
94
Notes to and Forming Part of the Financial Statements
For the year ended 30 June 2008—(Continued)
(iii) EXECUTIVE OFFICERS
Executive Officers are those officers who are members of the Executive Management Team involved in the strategic direction, general management or control of the business at an organisational level.
Details of the nature and amount of each major element of the remuneration of the Executive Officers are as follows:
| | | | | | | | | | | | |
| | | SHORT-TERM
EMPLOYMENT
BENEFITS | | POST
EMPLOYMENT
BENEFITS | | TOTAL |
| | | 2008 | | 2007 | | 2008 | | 2007 | | 2008 | | 2007 |
| | | $ | | $ | | $ | | $ | | $ | | $ |
Chief Executive | | 488,852 | | 458,756 | | 42,254 | | 41,669 | | 531,106 | | 500,425 |
General Manager | | 335,971 | | 318,542 | | 22,163 | | 20,765 | | 358,134 | | 339,307 |
General Manager | | 248,821 | | 238,986 | | 29,344 | | 22,016 | | 278,165 | | 261,002 |
General Manager | | 210,667 | | 177,992 | | 18,678 | | 17,390 | | 229,345 | | 195,382 |
General Manager | | 201,104 | | 188,702 | | 13,633 | | 13,086 | | 214,737 | | 201,788 |
Short-term benefits include wages, annual leave, long service leave and other non-monetary benefits, but exclude any at-risk performance payments (bonuses) for which they may be eligible.
(B) OTHER TRANSACTIONS
There were no loans to/from key management personnel during the financial year.
28. Remuneration of Officers
AGGREGATE AT-RISK PERFORMANCE INCENTIVE REMUNERATION
| | | | |
| | | YEAR OF ASSESSMENT |
| | | 2008 | | 2007 |
| | | $ | | $ |
Aggregate at-risk performance incentive paid or payable | | 2,766,105 | | 2,943,677 |
Aggregate remuneration of employees to whom a performance incentive is payable | | 16,263,362 | | 15,784,098 |
Number of employees to whom a performance incentive is payable | | 150 | | 144 |
29. Auditors Remuneration
The external auditors (Queensland Audit Office) do not provide any consulting services to QTC. Details of amounts payable to the Auditors of QTC are shown below.
| | | | |
| | | 2008 | | 2007 |
| | | $ | | $ |
AUDIT SERVICES | | | | |
Audit of QTC | | 329,451 | | 294,529 |
95
Notes to and Forming Part of the Financial Statements
For the year ended 30 June 2008—(Continued)
30. Investments in Associates
| | | | | | | | | | | | | | |
ENTITY | | PRINCIPAL ACTIVITIES | | ORDINARY
SHARE
OWNERSHIP
INTEREST | | | INVESTMENT
CARRYING
AMOUNT | |
| | | | | 2008 | | | 2007 | | | 2008 | | | 2007 | |
Local Government Infrastructure Services Pty Ltd | | Provides assistance to Queensland local governments in relation to infrastructure procurement | | 50 | % | | 50 | % | | 50 | % | | 50 | % |
RESULTS OF JOINT VENTURE ENTITY
Summarised financial information of jointly controlled entity:
| | | | | |
| | | 30 June
2008 | | 30 June
2007 | |
| | | $000 | | $000 | |
INCOME STATEMENT | | | | | |
Revenues | | 35,550 | | 28,472 | |
Expenses | | 35,042 | | 28,485 | |
| | | | | |
PROFIT BEFORE INCOME TAX EXPENSE | | 508 | | (13 | ) |
Income tax expense | | — | | — | |
| | | | | |
NET PROFIT/(LOSS) | | 508 | | (13 | ) |
| | | | | |
BALANCE SHEET | | | | | |
Current assets | | 26,379 | | 41,545 | |
| | | | | |
TOTAL ASSETS | | 26,379 | | 41,545 | |
| | | | | |
Current liabilities | | 24,305 | | 32,635 | |
Non-current liabilities | | 1,206 | | 8,550 | |
| | | | | |
TOTAL LIABILITIES | | 25,511 | | 41,185 | |
| | | | | |
NET ASSETS | | 868 | | 360 | |
| | | | | |
QTC’s share of the joint venture entity’s result and retained profits, including movements in the carrying amount of the investment consists of:
| | | | | |
| | | 30 June
2008 | | 30 June
2007 | |
| | | $000 | | $000 | |
SHARE OF POST-ACQUISITION RETAINED PROFITS | | | | | |
Share of retained profits at 1 July | | 80 | | 85 | |
Share of net result | | 254 | | (5 | ) |
| | | | | |
Share of retained profits at 30 June | | 334 | | 80 | |
| | | | | |
MOVEMENTS IN CARRYING AMOUNT OF INVESTMENT | | | | | |
Carrying amount at 1 July | | 180 | | 185 | |
Share of net result | | 254 | | (5 | ) |
| | | | | |
Carrying amount at 30 June | | 434 | | 180 | |
| | | | | |
96
Notes to and Forming Part of the Financial Statements
For the year ended 30 June 2008—(Continued)
31. Investments in Companies
Investments in the following companies are held at cost:
| | | | | | | | | | |
NAME | | PRINCIPAL ACTIVITIES | | BENEFICIAL
INTEREST
2008 | | VOTING
RIGHTS
2008 | | BENEFICIAL
INTEREST
2007 | | VOTING
RIGHTS
2007 |
| | | | | % | | % | | % | | % |
Queensland Treasury Holdings Pty Ltd(1) | | Holding company for a number of subsidiaries and investments | | 40 | | 24 | | 40 | | 24 |
Queensland Lottery Corporation Pty Ltd(2) | | Holds the lottery licence and trade marks on behalf of the State of Queensland | | 40 | | 24 | | 40 | | 24 |
DBCT Holdings Pty Ltd(2) | | Owns & leases bulk coal port facilities in North Queensland | | 20 | | 12 | | 20 | | 12 |
South East Queensland Water Corporation Limited(2)(3) | | Owns & operates bulk water storage facility in South East Queensland | | — | | — | | 8 | | 4.8 |
City North Infrastructure Pty Ltd(2) | | Manages the procurement of the Airport Link and Northern Busway Project | | 10 | | 6 | | 10 | | 6 |
Sunshine Locos Pty Ltd(4) | | Dormant | | 100 | | 100 | | 100 | | 100 |
Notes:
| (1) | QTH holds an interest in Queensland Motorways Limited; 2 of a total 147 960 shares. |
| (2) | Beneficial interest and voting rights in the Company are held indirectly through QTC’s holdings in Queensland Treasury Holdings Pty Ltd. |
| (3) | QTH transferred its shares in South East Queensland Water Corporation Ltd to Queensland Bulk Water Supply Authority on 1 February 2008. |
| (4) | While a controlled entity of QTC, Sunshine Locos Pty Ltd has not been consolidated into these statements due to its immaterial and dormant status. |
32. Dividends
QTC is required to pay dividends to the Queensland Government as the Treasurer shall determine from time to time. At 30 June 2008, no dividend (2007: nil) has been provided for in the accounts of QTC.
33. Events Subsequent To Balance Date
On 1 July 2008, the Queensland Government transferred to QTC some of the State’s financial assets held to meet future superannuation and other long term obligations of the State. The market value of the assets transferred was $20.8 billion. In return for this transfer, QTC entered into a financial arrangement with the Treasurer under which QTC is providing a Fixed Rate Note to the General Government sector at a rate initially set at 7.5% per annum which is the actuarially assessed long term average rate of return for a managed diversified portfolio of investments.
The purpose of the transfer is to reduce the volatility in the State Budget as a result of the fluctuation in returns from the investment of these assets. QTC will incur accounting profits or losses in the future due to this investment volatility, although the return on the assets is expected to match the long-term average of 7.5% per annum.
97
Notes to and Forming Part of the Financial Statements
For the year ended 30 June 2008—(Continued)
The transfer will have no impact on QTC’s capacity to meet its obligations as there is no cashflow effect from the transfer of these assets.
There are no other matters or circumstances which have arisen since the end of the financial year that have significantly affected or may significantly affect the operations of QTC, the results of those operations or the state of affairs of QTC in future years.
98
Certificate of the Queensland Treasury Corporation
The foregoing general purpose financial statements have been prepared pursuant to the provisions of the Financial Administration and Audit Act 1977 and other prescribed requirements.
We certify that in our opinion:
| | (i) | the prescribed requirements for establishing and keeping the accounts have been complied with in all material respects, and |
| | (ii) | the foregoing annual financial statements have been drawn up so as to present a true and fair view, in accordance with prescribed accounting standards, of the transactions of the Queensland Treasury Corporation for the period 1 July 2007 to 30 June 2008 and of the financial position as at the close of that year. |
Brisbane
26 August 2008
99
Independent Auditor’s Report
to Queensland Treasury Corporation
Matters Relating to the Electronic Presentation of the Audited Financial Report
The audit report relates to the financial report of Queensland Treasury Corporation for the financial year ended 30 June 2008 included on Queensland Treasury Corporation’s web site. The corporation sole is responsible for the integrity of the Queensland Treasury Corporation’s web site. We have not been engaged to report on the integrity of the Queensland Treasury Corporation’s web site. The audit report refers only to the statements named below. It does not provide an opinion on any other information which may have been hyperlinked to/from these statements. If users of the financial report are concerned with the inherent risks arising from electronic data communications they are advised to refer to the hard copy of the audited financial report, available from Queensland Treasury Corporation, to confirm the information included in the audited financial report presented on this web site.
These matters also relate to the presentation of the audited financial report in other electronic media including CD Rom.
Report on the Financial Report
I have audited the accompanying financial report of Queensland Treasury Corporation which comprises the balance sheet as at 30 June 2008, and the income statement, statement of changes in equity and cash flow statement for the year ended on that date, a summary of significant accounting policies, other explanatory notes and certificates given by the Under Treasurer—Queensland Treasury as the corporation sole and Chief Executive.
THE CORPORATION SOLE’S RESPONSIBILITY FOR THE FINANCIAL REPORT
The corporation sole is responsible for the preparation and fair presentation of the financial report in accordance with prescribed accounting requirements identified in the Financial Administration and Audit Act 1977 and the Financial Management Standard 1997, including compliance with applicable Australian Accounting Standards (including the Australian Accounting Interpretations). This responsibility includes establishing and maintaining internal controls relevant to the preparation and fair presentation of the financial report that is free from material misstatement, whether due to fraud or error; selecting and applying appropriate accounting policies; and making accounting estimates that are reasonable in the circumstances.
AUDITOR’S RESPONSIBILITY
My responsibility is to express an opinion on the financial report based on the audit. The audit was conducted in accordance with Auditor-general of Queensland Auditing Standards, which incorporate the Australian Auditing Standards. These Auditing Standards require compliance with relevant ethical requirements relating to audit engagements and that the audit is planned and performed to obtain reasonable assurance whether the financial report is free from material misstatement.
An audit involves performing procedures to obtain audit evidence about the amounts and disclosures in the financial report. The procedures selected depend on the auditor’s judgement, including the assessment of risks of material misstatement in the financial report, whether due to fraud or error. In making those risk assessments, the auditor considers internal control relevant to the entity’s preparation and fair presentation of the financial report in order to design audit procedures that are appropriate in the circumstances, but not for the purpose of expressing an opinion on the effectiveness of the entity’s internal control, other than in expressing an opinion on compliance with prescribed requirements. An audit also includes evaluating the appropriateness of accounting policies and the reasonableness of accounting estimates made by the Corporation, as well as evaluating the overall presentation of the financial report including any mandatory financial reporting requirements as approved by the Treasurer for application in Queensland.
I believe that the audit evidence obtained is sufficient and appropriate to provide a basis for my audit opinion.
100
INDEPENDENCE
The Financial Administration and Audit Act 1977 promotes the independence of the Auditor General and QAO authorised auditors. The Auditor-General is the auditor of all Queensland public sector entities and can only be removed by Parliament.
The Auditor-General may conduct an audit in any way considered appropriate and is not subject to direction by any person about the way in which audit powers are to be exercised. The Auditor-General has for the purposes of conducting an audit, access to all documents and property and can report to Parliament matters which in the Auditor-General’s opinion are significant.
AUDITOR’S OPINION
In accordance with s.46G of the Financial Administration and Audit Act 1977—
| (a) | I have received all the information and explanations which I have required; and |
| | (i) | the prescribed requirements in respect of the establishment and keeping of accounts have been complied with in all material respects; and |
| | (ii) | the financial report has been drawn up so as to present a true and fair view, in accordance with the prescribed accounting standards of the transactions of the Queensland Treasury Corporation for the financial year 1 July 2007 to 30 June 2008 and of the financial position as at the end of that year. |
101
Appendix A: Loans to customers
| | | | | | | | |
LOANS TO CUSTOMERS | | TOTAL DEBT
OUTSTANDING
(MARKET
VALUE)
30 JUNE 2007 | | TOTAL DEBT
OUTSTANDING
(MARKET
VALUE)
30 JUNE 2008 | | AVERAGE
EXPECTED
TERM
(YRS)*
30 JUNE 2007 | | AVERAGE
EXPECTED
TERM
(YRS)*
30 JUNE 2008 |
| | | A$000 | | A$000 | | | | |
BODIES WITHIN THE PUBLIC ACCOUNTS | | | | | | | | |
Arts Queensland | | 13,997 | | 15,017 | | N/A | | N/A |
CITEC | | 2,051 | | 6,406 | | N/A | | 5.22 |
Department of Corrective Services | | — | | 319 | | — | | 1.21 |
Department of Education, Training and the Arts | | 74,240 | | 56,252 | | 4.79 | | 4.14 |
Department of Emergency Services | | 3,379 | | 2,480 | | 3.13 | | 2.13 |
Department of Justice and Attorney General | | 86,330 | | 70,487 | | 4.96 | | 3.96 |
Department of Local Government Planning Sport and Recreation | | 3,683 | | 15,080 | | N/A | | N/A |
Department of Main Roads | | 986,575 | | 1,014,980 | | N/A | | N/A |
Department of Public Works—Administrative Services | | 151,363 | | 119,793 | | 5.43 | | 4.75 |
Department of Public Works—GoPrint | | 2,189 | | 2,162 | | N/A | | N/A |
Department of Public Works—QBuild | | — | | 7,292 | | — | | 4.43 |
Department of Public Works—QFleet | | 286,135 | | 256,605 | | N/A | | N/A |
Department of State Development | | 147,073 | | 134,853 | | 7.35 | | 6.50 |
Department of the Premier and Cabinet | | 27,294 | | 16,810 | | N/A | | 7.81 |
Forestry Plantations Queensland | | 76,503 | | 75,577 | | 5.32 | | N/A |
Monte Carlo Caravan Park Pty Ltd | | 493 | | 324 | | 2.75 | | 1.75 |
Queensland Ambulance Service | | 2,205 | | 1,173 | | 2.04 | | 1.04 |
Queensland Audit Office | | 50 | | 507 | | 0.21 | | 2.46 |
Queensland Fire and Rescue Authority | | 4,228 | | 3,939 | | 7.22 | | 6.21 |
Queensland Health | | 86,325 | | 123,061 | | N/A | | 9.96 |
Queensland Transport | | 61,722 | | 65,778 | | 6.84 | | 6.64 |
Queensland Treasury | | 972,166 | | 4,169,024 | | N/A | | N/A |
Queensland Treasury Racing | | — | | 186 | | — | | 5.50 |
Sales and Distribution Services | | 6,539 | | 5,844 | | N/A | | N/A |
| | | | | | | | |
TOTAL | | 2,994 540 | | 6,163,949 | | | | |
| | | | | | | | |
COOPERATIVE HOUSING SOCIETIES | | | | | | | | |
Cooperative Housing Societies | | 4,951 | | 3,457 | | N/A | | N/A |
| | | | | | | | |
TOTAL | | 4,951 | | 3,457 | | | | |
| | | | | | | | |
GOVERNMENT OWNED CORPORATIONS | | | | | | | | |
Cairns Port Authority | | 104,827 | | 159,711 | | N/A | | N/A |
Gladstone Ports Corporation | | 341,009 | | 447,208 | | N/A | | N/A |
CS Energy Ltd | | 1,080,621 | | 1,055,633 | | N/A | | N/A |
ENERGEX Limited | | 3,183,355 | | 3,255,581 | | N/A | | N/A |
Ergon Energy Corporation Limited | | 2,479,336 | | 2,974,040 | | N/A | | N/A |
Eungella Water Pipeline Pty Ltd | | 34,369 | | 32,667 | | N/A | | 14.87 |
Gateway Investments Corporation Pty Ltd | | 314,711 | | — | | N/A | | — |
Port of Brisbane Corporation | | 283,026 | | 577,293 | | N/A | | N/A |
Ports Corporation of Queensland | | 107,786 | | 141,529 | | N/A | | N/A |
Queensland Electricity Transmission Corporation Ltd (Powerlink) | | 1,953,763 | | 2,427,411 | | N/A | | N/A |
Queensland Rail | | 4,550,007 | | 5,164,131 | | N/A | | N/A |
Stanwell Corporation Limited | | 113,834 | | 127,151 | | N/A | | N/A |
SunWater | | 231,458 | | 223,659 | | N/A | | N/A |
Tarong Energy Corporation Limited | | 354,539 | | 376,389 | | 25.49 | | N/A |
Townsville Port Authority | | 10,854 | | 8,385 | | 4.03 | | 3.04 |
| | | | | | | | |
TOTAL | | 15,143,495 | | 16,970,788 | | | | |
| | | | | | | | |
102
| | | | | | | | |
LOANS TO CUSTOMERS | | TOTAL DEBT
OUTSTANDING
(MARKET
VALUE)
30 JUNE 2007 | | TOTAL DEBT
OUTSTANDING
(MARKET
VALUE)
30 JUNE 2008 | | AVERAGE
EXPECTED
TERM
(YRS)*
30 JUNE 2007 | | AVERAGE
EXPECTED
TERM
(YRS)*
30 JUNE 2008 |
| | | A$000 | | A$000 | | | | |
LOCAL GOVERNMENTS | | | | | | | | |
Aramac Shire Council | | 30 | | — | | 3.42 | | — |
Atherton Shire Council | | 746 | | — | | 3.75 | | — |
Balonne Shire Council | | 3,008 | | 2,568 | | 9.42 | | 9.04 |
Banana Shire Council | | 1,614 | | 1,078 | | 5.51 | | 5.93 |
Barcaldine Regional Council | | — | | 1,829 | | — | | 15.26 |
Barcaldine Shire Council | | 1,947 | | — | | 15.79 | | — |
Barcoo Shire Council | | 314 | | 107 | | 3.35 | | 6.87 |
Bauhinia Shire Council | | 281 | | — | | 10.59 | | — |
Beaudesert Shire Council | | 11,821 | | — | | 7.88 | | — |
Blackall Shire Council | | 972 | | — | | 7.68 | | — |
Blackall Tambo Regional Council | | — | | 740 | | — | | 7.18 |
Boonah Shire Council | | 3,887 | | — | | 13.02 | | — |
Bowen Shire Council | | 6,756 | | — | | 4.89 | | — |
Brisbane City Council | | 866,765 | | 699,389 | | 13.96 | | 13.99 |
Bulloo Shire Council | | 1,923 | | 1,546 | | 8.59 | | 8.57 |
Bundaberg City Council | | 19,544 | | — | | 5.93 | | — |
Bundaberg Regional Council | | — | | 47,492 | | — | | 11.18 |
Bungil Shire Council | | 2,472 | | — | | 8.12 | | — |
Burdekin Shire Council | | 11,304 | | 8,908 | | 6.17 | | 5.69 |
Burnett Shire Council | | 12,632 | | — | | 13.08 | | — |
Caboolture Shire Council | | 16,401 | | — | | 6.72 | | — |
Cairns City Council | | 61,495 | | — | | 7.23 | | — |
Cairns Regional Council | | — | | 54,538 | | — | | 9.77 |
Calliope Shire Council | | 9,843 | | — | | 16.84 | | — |
Caloundra City Council | | 98,393 | | — | | 11.39 | | — |
Caloundra/Maroochy Water Supply Board | | 32,567 | | — | | 16.81 | | — |
Cambooya Shire Council | | 70 | | — | | 1.30 | | — |
Cardwell Shire Council | | 8,779 | | — | | 13.65 | | — |
Carpentaria Shire Council | | 2,210 | | 1,836 | | 7.86 | | 7.35 |
Cassowary Coast Regional Council | | — | | 20,529 | | — | | N/A |
Central Highlands Regional Council | | — | | 15,458 | | — | | 14.99 |
Chinchilla Shire Council | | 2,407 | | — | | 11.86 | | — |
Charters Towers Regional Council | | — | | 724 | | — | | 5.32 |
Cherbourg Aboriginal Council | | 238 | | 88 | | 1.52 | | 0.51 |
Clifton Shire Council | | 208 | | — | | 11.28 | | — |
Cloncurry Shire Council | | 2,875 | | 4,433 | | 4.34 | | 8.85 |
Cook Shire Council | | 3,454 | | 3,279 | | 17.02 | | 16.33 |
Cooloola Shire Council | | 4,543 | | — | | 6.20 | | — |
Crow’s Nest Shire Council | | 5,982 | | — | | 11.49 | | — |
Dalby Town Council | | 1,460 | | — | | 14.89 | | — |
Dalby Regional Council | | — | | 3,815 | | — | | 12.21 |
Dalby Wambo Library Board | | 19 | | — | | 3.00 | | — |
Dalby Wambo Salesyard Board | | 215 | | — | | 16.42 | | — |
Dalrymple Shire Council | | 899 | | — | | 6.00 | | — |
Diamantina Shire Council | | 1,085 | | 992 | | 11.09 | | 10.24 |
Douglas Shire Council | | 4,329 | | — | | 2.86 | | — |
103
| | | | | | | | |
LOANS TO CUSTOMERS | | TOTAL DEBT
OUTSTANDING
(MARKET
VALUE)
30 JUNE 2007 | | TOTAL DEBT
OUTSTANDING
(MARKET
VALUE)
30 JUNE 2008 | | AVERAGE
EXPECTED
TERM
(YRS)*
30 JUNE 2007 | | AVERAGE
EXPECTED
TERM
(YRS)*
30 JUNE 2008 |
| | | A$000 | | A$000 | | | | |
Duaringa Shire Council | | 1,056 | | — | | 4.13 | | — |
Eacham Shire Council | | 1,930 | | — | | 8.79 | | — |
Emerald Shire Council | | 11,700 | | — | | 16.03 | | — |
Emerald/Peak Downs Saleyards Board | | 166 | | — | | 6.06 | | — |
Esk Shire Council | | 2,601 | | — | | 4.01 | | — |
Etheridge Shire Council | | 503 | | 468 | | 13.46 | | 12.59 |
Fitzroy Shire Council | | 1,711 | | — | | 9.43 | | — |
Fraser Coast Regional Council | | — | | 96,205 | | — | | 13.97 |
Gatton Shire Council | | 3,172 | | — | | 5.54 | | — |
Gayndah Shire Council | | 261 | | — | | 7.44 | | — |
Gladstone Calliope Aerodrome Board | | 504 | | — | | 2.61 | | — |
Gladstone City Council | | 19,869 | | — | | 11.77 | | — |
Gladstone Regional Council | | — | | 36,324 | | — | | 14.17 |
Gold Coast City Council | | 628,871 | | 679,547 | | N/A | | N/A |
Goondiwindi Town Council | | 1,372 | | — | | 3.73 | | — |
Goondiwindi Regional Council | | — | | 803 | | — | | 4.17 |
Gympie Regional Council | | — | | 4,447 | | — | | 8.02 |
Herberton Shire Council | | 62 | | — | | 0.89 | | — |
Hervey Bay City Council | | 72,653 | | — | | 13.83 | | — |
Hope Vale Aboriginal Council | | 874 | | 839 | | 19.97 | | 19.46 |
Inglewood Shire Council | | 77 | | — | | 4.71 | | — |
Ipswich City Council | | 92,012 | | 117,701 | | N/A | | N/A |
Isis Shire Council | | 8,855 | | — | | 17.12 | | — |
Jericho Shire Council | | 29 | | — | | 0.32 | | — |
Johnstone Shire Council | | 13,370 | | — | | N/A | | — |
Jondaryan Shire Council | | 5,619 | | — | | 14.21 | | — |
Kilcoy Shire Council | | 872 | | — | | 15.83 | | — |
Kingaroy Shire Council | | 5,734 | | — | | 12.60 | | — |
Kolan Shire Council | | 1,545 | | — | | 11.32 | | — |
Laidley Shire Council | | 4,995 | | — | | 12.96 | | — |
Livingstone Shire Council | | 30,858 | | — | | 12.33 | | — |
Local Government Association of Queensland | | — | | 715 | | — | | N/A |
Lockyer Valley Regional Council | | — | | 1,266 | | — | | 5.31 |
Logan City Council | | 75,539 | | 101,446 | | 9.65 | | N/A |
Longreach Regional Council | | — | | 1,108 | | — | | 16.89 |
Longreach Shire Council | | 1,287 | | — | | 15.98 | | — |
Mackay City Council | | 55,238 | | — | | 12.66 | | — |
Mackay Regional Council | | — | | 98,797 | | — | | 15.14 |
Mareeba Shire Council | | 7,256 | | — | | 7.02 | | — |
Maroochy Shire Council | | 141,953 | | — | | 5.02 | | — |
Maryborough City Council | | 14,775 | | — | | 12.95 | | — |
McKinlay Shire Council | | 604 | | 547 | | 10.11 | | 9.22 |
Mirani Shire Council | | 2,692 | | — | | 12.04 | | — |
104
| | | | | | | | |
LOANS TO CUSTOMERS | | TOTAL DEBT
OUTSTANDING
(MARKET
VALUE)
30 JUNE 2007 | | TOTAL DEBT
OUTSTANDING
(MARKET
VALUE)
30 JUNE 2008 | | AVERAGE
EXPECTED
TERM
(YRS)*
30 JUNE 2007 | | AVERAGE
EXPECTED
TERM
(YRS)*
30 JUNE 2008 |
| | | A$000 | | A$000 | | | | |
Miriam Vale Shire Council | | 3,039 | | — | | 12.28 | | — |
Monto Shire Council | | 895 | | — | | 11.25 | | — |
Moreton Bay Regional Council | | — | | 216,830 | | — | | N/A |
Mount Morgan Shire Council | | 1,248 | | — | | 16.75 | | — |
Mount Isa City Council | | 2,943 | | 3,951 | | 2.95 | | 5.76 |
Mundubbera Shire Council | | 500 | | — | | 9.92 | | — |
Murgon Shire Council | | 28 | | — | | 0.82 | | — |
Murweh Shire Council | | 2,491 | | 2,679 | | 11.84 | | 11.46 |
Nanango Shire Council | | 1,278 | | — | | 14.82 | | — |
Noosa Shire Council | | 49,750 | | — | | 11.35 | | — |
North Burnett Regional Council | | — | | 1,371 | | — | | 10.13 |
Paroo Shire Council | | 2,453 | | 2,247 | | 17.63 | | 17.70 |
Pine Rivers Shire Council | | 60,947 | | — | | 6.97 | | — |
Pittsworth Shire Council | | 976 | | — | | N/A | | — |
Redcliffe City Council | | 16,801 | | — | | 6.56 | | — |
Redland Shire Council | | 129,369 | | 123,838 | | 10.77 | | 11.11 |
Richmond Shire Council | | 14 | | — | �� | 1.84 | | — |
Rockhampton City Council | | 51,301 | | — | | 11.27 | | — |
Rockhampton District Saleyards Board | | 1,781 | | — | | 15.16 | | — |
Rockhampton Regional Council | | — | | 97,968 | | — | | 11.86 |
Roma Regional Council | | — | | 10,556 | | — | | 12.93 |
Roma Town Council | | 8,290 | | — | | 14.95 | | — |
Roma-Bungil Showgrounds and Saleyards Board | | 334 | | — | | 4.33 | | — |
Rosalie Shire Council | | 5,732 | | — | | 15.30 | | — |
Sarina Shire Council | | 5,390 | | — | | 3.40 | | — |
Scenic Rim Regional Council | | — | | 10,160 | | — | | N/A |
Seisa Island Council | | 451 | | — | | 4.06 | | — |
South Burnett Regional Council | | — | | 14,360 | | — | | N/A |
Southern Downs Regional Council | | — | | 17,613 | | — | | 14.84 |
Stanthorpe Shire Council | | 2,939 | | — | | 17.13 | | — |
Sunshine Coast Regional Council | | — | | 201,166 | | — | | 7.19 |
Tablelands Regional Council | | — | | 7,760 | | — | | 7.03 |
Tiaro Shire Council | | 1,390 | | — | | 18.39 | | — |
Toowoomba Regional Council | | 66,826 | | 83,728 | | 13.89 | | N/A |
Torres Shire Council | | 2,043 | | 1,837 | | 8.83 | | 7.84 |
Townsville City Council | | 64,370 | | 207,140 | | 15.75 | | 14.88 |
Torres Strait Island Regional Council | | — | | 604 | | — | | 13.12 |
Warwick Shire Council | | 11,226 | | — | | 13.43 | | — |
Whitsunday Regional Council | | — | | 21,674 | | — | | 10.67 |
Whitsunday Shire Council | | 19,392 | | — | | 12.36 | | — |
Winton Shire Council | | 2,190 | | 3,501 | | 17.26 | | 18.16 |
Wondai Shire Council | | 1,616 | | — | | 7.51 | | — |
| | | | | | | | |
TOTAL | | 2,932,106 | | 3,038,545 | | | | |
| | | | | | | | |
105
| | | | | | | | |
LOANS TO CUSTOMERS | | TOTAL DEBT
OUTSTANDING
(MARKET
VALUE)
30 JUNE 2007 | | TOTAL DEBT
OUTSTANDING
(MARKET
VALUE)
30 JUNE 2008 | | AVERAGE
EXPECTED
TERM
(YRS)*
30 JUNE 2007 | | AVERAGE
EXPECTED
TERM
(YRS)*
30 JUNE 2008 |
| | | A$000 | | A$000 | | | | |
STATUTORY BODIES | | | | | | | | |
DRAINAGE BOARDS | | | | | | | | |
East Deeral Drainage Board | | 26 | | 18 | | 3.02 | | 2.01 |
Eugun Bore Water Authority | | 239 | | 199 | | 5.44 | | 4.43 |
Matthews Road Drainage Board | | 14 | | 9 | | 2.57 | | 1.56 |
| | | | |
GRAMMAR SCHOOLS | | | | | | | | |
Brisbane Girls’ Grammar School | | 23,808 | | 21,673 | | 12.18 | | 11.42 |
Brisbane Grammar School | | 10,526 | | 9,459 | | 4.27 | | 5.20 |
Ipswich Girls Grammar School | | 1,385 | | 5,305 | | 8.48 | | N/A |
Ipswich Grammar School | | 3,422 | | 2,962 | | 6.69 | | 5.70 |
Rockhampton Girls Grammar School | | 4,020 | | 3,882 | | 19.47 | | 18.47 |
Rockhampton Grammar School | | 3,657 | | 10,872 | | 9.80 | | 16.43 |
Toowoomba Grammar School | | 1,284 | | 775 | | 2.67 | | 1.67 |
Townsville Grammar School | | 10,562 | | 9,585 | | 12.71 | | 12.24 |
| | | | |
RIVER IMPROVEMENT TRUSTS | | | | | | | | |
Pioneer River Improvement Trust | | 551 | | 471 | | 6.25 | | 5.25 |
| | | | |
UNIVERSITIES | | | | | | | | |
Griffith University | | 71,356 | | 61,189 | | 7.13 | | 5.84 |
James Cook University | | 25,391 | | 24,913 | | 15.62 | | 14.97 |
Sunshine Coast University | | 26,175 | | 23,925 | | 13.75 | | 13.14 |
| | | | |
WATER BOARDS | | | | | | | | |
Avondale Water Board | | 605 | | 525 | | 6.72 | | 5.72 |
Fernlee Water Authority | | 75 | | 120 | | 14.10 | | 13.48 |
Gladstone Area Water Board | | 106,784 | | 134,732 | | N/A | | 25.21 |
Glamorgan Vale Water Board | | 106 | | 85 | | 8.18 | | 8.08 |
Kelsey Creek Water Board | | 1,474 | | 1,308 | | 7.87 | | 6.87 |
Merlwood Water Board | | 30 | | — | | 0.81 | | — |
Mount Isa Water Board | | — | | 4,003 | | — | | 9.92 |
North Burdekin Water Board | | 349 | | — | | 1.07 | | — |
Pioneer Valley Water Board | | 4,348 | | 3,816 | | 7.53 | | 6.56 |
Riversdale Murray Valley Water Management Board | | 910 | | 525 | | 10.45 | | 5.19 |
Six Mile Creek Water Board | | 45 | | 25 | | 2.10 | | 1.10 |
| | | | |
WATER SUPPLY BOARDS | | | | | | | | |
Bollon South Water Authority | | 803 | | 746 | | 12.47 | | 11.47 |
Bollon West Water Authority | | 981 | | 924 | | 14.18 | | 13.33 |
Ingie Water Authority | | 453 | | 424 | | 13.57 | | 12.58 |
Townsville Thuringowa Water Supply Board | | 112,103 | | — | | 16.10 | | — |
| | | | |
OTHER STATUTORY BODIES | | | | | | | | |
Australian Agricultural Colleges Corporation | | 2,704 | | 1,348 | | 2.61 | | 2.15 |
Island Coordinating Council | | 671 | | — | | 13.42 | | — |
Stadiums Queensland | | 369,290 | | 424,034 | | N/A | | 8.81 |
Mt Gravatt Showgrounds Trust | | 43 | | 83 | | 2.68 | | 6.62 |
106
| | | | | | | | |
LOANS TO CUSTOMERS | | TOTAL DEBT
OUTSTANDING
(MARKET
VALUE)
30 JUNE 2007 | | TOTAL DEBT
OUTSTANDING
(MARKET
VALUE)
30 JUNE 2008 | | AVERAGE
EXPECTED
TERM
(YRS)*
30 JUNE 2007 | | AVERAGE
EXPECTED
TERM
(YRS)*
30 JUNE 2008 |
| | | A$000 | | A$000 | | | | |
National Trust of Queensland | | 906 | | 967 | | N/A | | 4.82 |
Queensland Rural Adjustments Authority | | 4,777 | | 8,503 | | 4.53 | | 5.11 |
Queensland Racing | | — | | 2,151 | | — | | 5.71 |
Queensland Studies Authority | | 1,961 | | 1,198 | | 3.87 | | 2.25 |
South Bank Corporation | | 36,235 | | 32,781 | | N/A | | N/A |
State Library of Queensland | | 272 | | 137 | | 1.91 | | 0.91 |
| | | | | | | | |
TOTAL | | 828,340 | | 793,672 | | | | |
| | | | | | | | |
QUEENSLAND WATER ENTITIES | | | | | | | | |
Queensland Bulk Water Supply Authority | | — | | 537,248 | | — | | N/A |
Queensland Bulk Water Transport Authority | | — | | 3,731 | | — | | N/A |
QLD Water Infrastructure Pty Ltd | | 294,308 | | 604,707 | | N/A | | N/A |
SEQ Water Facility | | 191,957 | | 185,251 | | N/A | | N/A |
SEQ Water Grid Manager | | — | | 1,801 | | — | | N/A |
SEQ (Gold Coast) Desalination Company Pty | | — | | 280,814 | | — | | N/A |
Southern Regional Water Pipeline Company Pty Ltd | | — | | 930,286 | | — | | N/A |
Western Corridor Recycled Water Pty Ltd | | 283,852 | | 1,292,453 | | N/A | | N/A |
| | | | | | | | |
TOTAL | | 770,117 | | 3,836,291 | | | | |
| | | | | | | | |
SUNCORP-METWAY LTD | | | | | | | | |
Suncorp Metway Facility | | 2,804 | | 2,192 | | 8.14 | | 7.78 |
| | | | | | | | |
TOTAL | | 2,804 | | 2,192 | | | | |
| | | | | | | | |
TOLLWAY COMPANY | | | | | | | | |
Queensland Motorways Limited | | 1,249,534 | | 1,799,454 | | N/A | | N/A |
| | | | | | | | |
TOTAL | | 1,249,534 | | 1,799,454 | | | | |
| | | | | | | | |
QTC RELATED ENTITIES | | | | | | | | |
DBCT Holdings Pty Ltd | | 333,012 | | 294,130 | | N/A | | N/A |
| | | | | | | | |
TOTAL | | 333,012 | | 294,130 | | | | |
| | | | | | | | |
OTHER BODIES | | | | | | | | |
Aviation Australia Pty Ltd | | 2,725 | | 2,546 | | 13.46 | | 12.49 |
Department of Education and the Arts—State Schools | | 149 | | 68 | | 1.81 | | 0.89 |
Parents and Citizens Associations | | 7,236 | | 6,602 | | 6.25 | | 5.75 |
| | | | | | | | |
TOTAL | | 10,111 | | 9,216 | | | | |
| | | | | | | | |
GRAND TOTAL | | 24,269,009 | | 32,911,694 | | | | |
| | | | | | | | |
Total Debt Outstanding includes Fixed Rate Loans, Operating Leases and Debenture Assets held by QTC (previously recorded as Investments).
The balance of customers’ offset deposits held in various pools is offset against customers’ debt outstanding.
Working Capital Accounts and unsettled Operating Leases are not included.
| | |
* Average Expected Term | | —only includes standard principal and interest accounts |
| | — ignores temporary funding and debt offset facility |
| | — is not applicable for any non-standard principal and interest accounts |
107
Appendix B: Partners in Financial Markets
30 June 2008
Actual dealer entities may vary depending on the facility and location of the dealer.
| | |
DOMESTIC AND GLOBAL A $ BOND FACILITY DISTRIBUTION GROUP |
| |
AUSTRALIA AND NEW ZEALAND BANKING GROUP LTD | | TELEPHONE |
Domestic (Australia) | | +61 2 9227 1110 |
Global (London) | | +44 207 378 2378 |
| |
ABN AMRO BANK NV | | TELEPHONE |
Domestic (Australia) | | +61 2 8259 2200 |
Global (London) | | +44 207 678 3887 |
| |
CITIGROUP GLOBAL MARKETS AUSTRALIA LTD | | TELEPHONE |
Domestic (Australia) | | +61 2 8225 6046 |
Global (London) | | +44 207 986 9521 |
| |
COMMONWEALTH BANK OF AUSTRALIA | | TELEPHONE |
Domestic (Australia) | | +61 2 9235 0122 |
Global (London) | | +44 207 329 6444 |
| |
DEUTSCHE CAPITAL MARKETS AUSTRALIA1 | | TELEPHONE |
Domestic (Australia) | | +61 2 8258 1444 |
Global (London) | | +44 207 547 1931 |
| |
JP MORGAN | | TELEPHONE |
Domestic (Australia) | | +61 2 9220 1358 |
Global (London) | | +44 207 777 9667 |
| |
MACQUARIE BANK LTD | | TELEPHONE |
Domestic (Australia) | | +61 2 8232 3333 |
Global (London) | | +44 207 065 2100 |
| |
NATIONAL AUSTRALIA BANK LTD | | TELEPHONE |
Domestic (Australia) | | +61 2 9295 1166 |
Global (London) | | +44 207 796 4761 |
| |
ROYAL BANK Of CANADA | | TELEPHONE |
Domestic (Australia) | | +61 2 9033 3222 |
Global (London) | | +44 207 029 7008 |
| |
TORONTO DOMINION BANK | | TELEPHONE |
Domestic (Australia) | | +61 2 9619 8866 |
Global (London) | | +44 207 628 4334 |
| |
UBS AG2 | | TELEPHONE |
Domestic (Australia) | | +61 2 9324 2222 |
Global (London) | | +44 207 567 4750 |
108
| | |
WESTPAC BANKING CORPORATION | | TELEPHONE |
Domestic (Australia) | | +61 2 8204 2740 |
Global (London) | | +44 207 621 7620 |
| |
QTC TREASURY NOTE FACILITY DEALER PANEL | | |
| |
PANEL MEMBERS | | TELEPHONE |
Australia and New Zealand Banking Group Ltd | | +61 2 9226 6707 |
Commonwealth Bank of Australia Ltd (Sydney) | | +61 2 9235 0122 |
Deutsche Bank AG (Sydney) | | +61 2 9258 1444 |
Macquarie Bank Ltd (Sydney) | | +61 2 8232 3333 |
National Australia Bank Ltd (Sydney) | | +61 2 9295 1133 |
Westpac Banking Corporation Ltd (Sydney) | | +61 2 8204 2740 |
| |
MULTICURRENCY US COMMERCIAL PAPER FACILITY DEALER PANEL | | |
| |
PANEL MEMBERS | | TELEPHONE |
Citigroup Global Markets Inc (New York) | | +1 212 723 6252 |
Credit Suisse (New York) | | +1 212 325 3358 |
Deutsche Bank Securities (New York) | | +1 212 250 7179 |
| |
MULTICURRENCY EURO COMMERCIAL PAPER FACILITY DEALER PANEL | | |
| |
PANEL MEMBERS | | TELEPHONE |
Barclays Bank Plc (London) | | +44 207 773 9764 |
Citigroup International Plc (Hong Kong)3 | | +852 2501 2689 |
Deutsche Bank AG (Singapore) | | +65 6 883 0808 |
National Australia Bank Limited (Hong Kong and London) | | +852 2526 5891 |
RBC Capital Markets (London) | | +44 207 248 3306 |
UBS Ltd (London) | | +44 207 567 2324 |
| |
MULTICURRENCY EURO MEDIUM-TERM NOTE FACILITY DEALER PANEL4 | | |
| |
PANEL MEMBERS | | TELEPHONE |
Includes all Domestic and Global A$ Bond Facility | | |
Distribution Group5, and | | |
Nomura International Plc (London) | | +44 207 521 2000 |
| |
MULTICURRENCY US MEDIUM-TERM NOTE FACILITY DEALER PANEL4 | | |
| |
PANEL MEMBERS | | TELEPHONE |
ABN AMRO Incorporated (London) | | +44 207 588 4079 |
Citigroup (New York) | | +1 212 723 6175 |
Deutsche Bank Securities Inc (New York)6 | | +1 212 469 7500 |
RBC Capital Markets (New York) | | +1 212 858 7380 |
Notes:
| 1 | Lead Manager – United States |
| 4 | Reverse inquiry also permitted |
| 5 | Lead Arranger – UBS Ltd (London) |
109
ISSUING AND PAYING AGENTS FOR QTC
| | | | | | | |
| | | CONTACT | | TELEPHONE | | | FACSIMILE |
AUD TREASURY NOTES | | | | | | | |
Austraclear Services Ltd Sydney | | Help Desk | | 1300 362 257 | | | +61 2 9256 0456 |
| | | |
AUD DOMESTIC BONDS | | | | +61 3 9415 5000 | | | |
Computershare Investor Services Ltd | | Markings/Transfers | | (ext 6044 | ) | | +61 3 9473 2594 |
| | | |
AUD GLOBAL BONDS | | | | +1 615 835 2729 | | | +1 615 835 2727 |
Deutsche Bank Trust Company Americas | | Client Services | | +1 615 835 2728 | | | +1 615 835 2730 |
| | | |
EURO COMMERCIAL PAPER | | | | +44 207 547 7608 | | | |
Deutsche Bank AG, London | | Client Services | | +44 207 547 3747 | | | +44 207 547 3665 |
| | | |
US COMMERCIAL PAPER | | | | | | | |
Deutsche Bank Trust Company Americas | | Client Services | | +1 908 608 3153 | | | +1 732 578 4635 |
| | | |
EURO MEDIUM-TERM NOTES | | | | +44 207 547 7608 | | | |
Deutsche Bank AG, London | | Client Services | | +44 207 547 3747 | | | +44 207 547 3665 |
| | | |
US MEDIUM-TERM NOTES | | | | | | | |
Deutsche Bank Trust Company Americas | | Client Services | | +1 908 608 3153 | | | +1 732 578 4635 |
110
Appendix C: Statutory Disclosure Statements
Overseas travel
QTC raises funds in offshore financial markets and, from time to time, Board directors and officers visit these markets to transact business on behalf of QTC. All overseas travell is undertaken in accordance with the Government’s Overseas Travell Guidelines, endorsed by Queensland Cabinet.
In the year under review, international travell included:
| | | | | | |
OFFICER | | COUNTRY/S VISITED | | PERIOD | | PURPOSE OF VISIT |
| Chairman, Assistant Under Treasurer, General Manager, Financial Markets | | New Zealand | | 1-3 August 2007 | | Participated in a series of meetings with New Zealand based institutional investors to discuss a potential QTC Kauri Bond Issue. Opportunity to raise competitively priced funds in the New Zealand denominated Kauri Bond market. |
| | | |
Portfolio Manager | | Hong Kong, Europe and United States | | 23 September— 7 October 2007 | | Participated in Deutsche Bank’s Annual International Investor Mission, which involved meetings with offshore central banks, policy authorities and leading international financial market figures, providing opportunities to develop a greater understanding and awareness of major factors (political, economic, credit and market) affecting investment fundamentals and world financial markets. |
| | | |
| Chairman, Assistant Under Treasurer, Chief Executive, General Manager, Financial Markets | | Canada, United Kingdom and Middle East | | 29 October 2007— 11 November 2007 | | Held meetings with investors and discussed potential QTC Maple Bond (CAD denominated) issue. First visit to Middle East to source new investor base for QTC Bonds. |
| | | |
| Senior Manager, Client Solutions, Portfolio Manager | | Japan | | 4-9 November 2007 | | Participated in Daiwa Securities SMBC Co Capital Markets Seminar, which included representation from all of Australia’s semi-government authorities, and sovereign bond issuers from Australia and other jurisdictions. |
| | | |
| General Manager, Financial Markets, Senior Portfolio Manager | | Singapore, United Kingdom, Europe and United States | | 26 January 2008—11 February 2008 | | Attended Citi Asia Pacific Fixed Income Investor Conference and conducted annual QTC Global Fixed Interest Distribution Group Offshore Performance Reviews. |
| | | |
| Treasurer, Chairman, Chief Executive, Senior Advisor, General Manager, Financial Markets | | Japan, China, Hong Kong and Singapore | | 2-8 March 2008 | | Undertook a series of meetings with Asian central banks and prime financial institutions to discuss QTC securities and market QTC A$ Global Bonds. |
| | | |
| Senior Portfolio Manager | | New Zealand | | 6-8 March 2008 | | Participated in the Westpac/KangaNews Summit, which provided an ideal forum for QTC to network with New Zealand investors and international issuers representing not only Triple-A borrowers but also financial institutions and corporations. |
111
| | | | | | |
OFFICER | | COUNTRY/S VISITED | | PERIOD | | PURPOSE OF VISIT |
| General Manager, Financial Markets | | Japan | | 3-6 April 2008 | | Co-hosted Premier’s Reception in Tokyo with prominent/ key clients and conducted meetings with various financial institutions that are either current or potential investors in QTC’s Bonds. |
| | | |
| Senior Portfolio Manager, Portfolio Manager | | Japan, Hong Kong and Singapore | | 10-24 April | | Conducted Euro Commercial Paper Dealer Panel review and attended Nomura Central Bankers Seminar. |
| | | |
| Chairman and Chief Executive | | United States | | 12-17 June 2008 | | Co-hosted function with American Australian Association, Deutsche Bank for the Premier and conducted meetings with high level personnel from Deutsche Bank in New York. |
Public Sector Ethics Act Implementation Statement
QTC provides the following information pursuant to obligations under section 23 of the Public Sector ethics Act 1994 (Qld) to report on action taken to comply with certain sections of the Act. QTC employees are required to comply with QTC’s Code of Conduct for employees (which sets out the ethics principles and obligations under the Public Sector ethics Act) as well the Code of Conduct established by the Australian Financial Markets Association, of which QTC is a member. Both codes are available electronically to employees through QTC’s in-house information management system. Copies of these codes can be inspected by contacting QTC’s Human Resources Team (see page 88 for contact details). Training is provided for new employees on ethical obligations as part of QTC’s induction process.
Public Records Act Implementation Statement
During the year, QTC also progressed its compliance with the provisions of the Public records Act 2002 and the implementation of Information Standard 40: Recordkeeping. The focus for QTC has been on the management of its hard copy records (since QTC has an existing electronic in-house information management system). QTC expects to complete the project (with respect to hard copy records) by the end of 2008 and anticipates achieving additional business benefit, through the efficient and effective management of corporate records.
Whistleblowers Protection Act 1994
Section 30(1) of the Whistleblowers Protection Act 1994 requires QTC to disclose, in its Annual Report, statistical information for the report period in respect of each type of information received about the number of disclosures received and the number of disclosures substantially verified. During the year under review, QTC has not received, nor had to substantially verify, any disclosures.
112
Appendix D: Corporate Directory
Queensland Treasury Corporation
LEVEL 14, 61 MARY STREET, BRISBANE QUEENSLAND AUSTRALIA GPO BOX 1096, BRISBANE QUEENSLAND AUSTRALIA 4001
TELEPHONE: +61 7 3842 4600
FACSIMILE: +61 7 3221 4122
INTERNET: www.qtc.com.au
Queensland Treasury Corporation’s annual and half-yearly reports are available on QTC’s website: www.qtc.com.au. If you would like a report posted to you, please call 61 7 3842 4600. If you would like to comment on our Annual Report, please visit our website and complete the feedback form, which can be downloaded from the home page.
| | |
EXECUTIVE | | |
| |
TELEPHONE: +61 7 3842 4611 | | FACSIMILE: +61 7 3210 0262 |
| |
TEAMS | | |
FINANCIAL MARKETS | | |
TELEPHONE: +61 7 3842 4789 | | FACSIMILE: +61 7 3221 2410 |
| |
MARKET SUPPORT (SETTLEMENTS) | | |
TELEPHONE: +61 7 3842 4644 | | FACSIMILE: +61 7 3221 2486 |
| |
STOCK REGISTRY SERVICES (COMPUTERSHARE) | | |
TELEPHONE: 1800 777 166 | | FACSIMILE: +61 3 9473 2531 |
| |
GOVERNMENT DEPARTMENTS AND AGENCIES | | |
TELEPHONE: +61 7 3842 4715 | | FACSIMILE: +61 7 3211 3629 |
| |
GOVERNMENT OWNED CORPORATIONS | | |
TELEPHONE: +61 7 3842 4715 | | FACSIMILE: +61 7 3211 3629 |
| |
LOCAL GOVERNMENT AND REGIONAL QUEENSLAND | | |
TELEPHONE: +61 7 3842 4715 | | FACSIMILE: +61 7 3842 4958 |
| |
TREASURY SERVICES | | |
TELEPHONE: +61 7 3842 4715 | | FACSIMILE: +61 7 3211 3629 |
| |
MAJOR PROJECTS | | |
TELEPHONE: +61 7 3842 4715 | | FACSIMILE: +61 7 3211 3629 |
| |
CUSTOMER SUPPORT (TRANSACTIONS) | | |
TELEPHONE: +61 7 3842 4650 | | FACSIMILE: +61 7 3221 2486 |
| |
LEASING | | |
TELEPHONE: +61 7 3842 4648 | | FACSIMILE: +61 7 3842 4927 |
| |
LG INFRASTRUCTURE SERVICES | | |
TELEPHONE: +61 7 3842 4700 | | — |
| |
ADMINISTRATION | | |
TELEPHONE: +61 7 3842 4705 | | FACSIMILE: +61 7 3221 4122 |
| |
CORPORATE ACCOUNTING | | |
TELEPHONE: +61 7 3842 4630 | | FACSIMILE: +61 7 3221 4122 |
113
| | |
TEAMS | | |
CORPORATE COMMUNICATION | | |
TELEPHONE: +61 7 3842 4685 | | FACSIMILE: +61 7 3211 3629 |
| |
HUMAN RESOURCES | | |
TELEPHONE: +61 7 3842 4612 | | FACSIMILE: +61 7 3210 2358 |
| |
INFORMATION TECHNOLOGY | | |
TELEPHONE: +61 7 3842 4641 | | FACSIMILE: +61 7 3210 1198 |
| |
LEGAL AND COMPLIANCE | | |
TELEPHONE: +61 7 3842 4739 | | FACSIMILE: +61 7 3236 9031 |
114


115