Exhibit (c)(iv)

STATE BUDGET
2008-09
MAJOR ECONOMIC STATEMENT
Mid Year Fiscal and Economic Review
TABLE OF CONTENTS
| | | | |
Overview | | 6 |
| | |
1 | | Economic Outlook | | 8 |
| | |
| | Overview | | 8 |
| | Global Economic Conditions | | 9 |
| | Queensland Economic Outlook | | 13 |
| | |
2 | | Fiscal Outlook | | 19 |
| | |
| | General Government Sector | | 19 |
| | Public Non-Financial Corporations Sector | | 31 |
| | |
3 | | Policy Measures | | 33 |
| | |
| | Fiscal Developments | | 33 |
| | Public Sector Efficiency Target | | 34 |
| | Taxation Measures | | 34 |
| | Closure of the Defined Benefit Scheme | | 37 |
| | Policy Measures | | 38 |
| | Adjustments to the Capital Program | | 39 |
| | Government-Owned Corporation Reform | | 40 |
| | Private Sector Provision of Infrastructure | | 42 |
| | Reducing the Regulatory Burden on Queensland Business | | 45 |
| | |
4 | | Uniform Presentation Framework and Loan Council Allocation | | 46 |
| | |
| | Uniform Presentation Framework Financial Information | | 46 |
| | Loan Council Allocation | | 55 |
| |
Appendix | | 56 |
OVERVIEW
ECONOMIC
| | • | | Reflecting a deterioration in global financial and economic conditions, as well as the lagged effect of prior monetary tightening, Gross State Product in Queensland is expected to expand by 3% in 2008-09, compared with 4 1/4% forecast in the State Budget. |
| | • | | However, economic growth in Queensland is expected to exceed that nationally for the thirteenth consecutive year in 2008-09, reflecting strong population growth and the positive impact of a lower Australian dollar on export earnings. |
| | • | | Employment is still expected to grow by 2 1/4 % in 2008-09, in year-average terms, lower than the 2 1/2% forecast at Budget time. |
| | • | | The year-average unemployment rate is expected to rise to 4 1/4%, rather than be unchanged at 3 3/4% in 2008-09, but will remain lower than that nationally. |
FISCAL
| | • | | The 2008-09 General Government net operating balance is expected to be a surplus of $54 million, compared with the Budget estimate of $809 million. |
| | • | | Taxation revenue estimates have reduced $884 million since the 2008-09 Budget, primarily due to a significant slowing in property market activity. |
| | • | | The General Government sector is forecast to incur a deficit in the net operating balance in 2009-10 ($124 million) and in 2010-11 ($85 million) before returning to surplus in 2011-12 ($92 million). |
| | • | | Cash deficits are projected in the General Government sector for each year across the forward estimates as a result of the State’s significant planned capital expansion. |
| | • | | The State’s net worth is forecast to increase to $160.386 billion in 2008-09, $31.823 billion higher than anticipated at Budget. |
POLICY MEASURES
| | • | | A further public sector efficiency target of $100 million per annum will be introduced from 2009-10 rising to $200 million per annum from 2010-11. |
| | • | | Motor vehicle registration fees will increase from 1 July 2009. |
| | • | | The abolition of transfer duty on core business assets will be rescheduled to 1 July 2012, consistent with the timeframe provided in the Intergovernmental Agreement. |
| | • | | The tax rate on gaming machine win on casino gaming machines will increase by 10% from 1 July 2009. |
| | • | | From 1 July 2009 a surcharge of 0.5% will be applied where the aggregate value of all land (for land tax purposes) exceeds $5 million. |
| | • | | The Government has allocated additional funding to a range of emergent issues including the Townsville Youth Detention Centre and Surgery Connect. |
| | • | | In order to maintain the State’s overall debt profile, the Government has deferred the Queensland Police Academy by two years. |
| | • | | The expenditure profile for Traveston Crossing Dam has changed, with environmental mitigation to occur before commencement of construction. |
| | • | | GOC reform will continue with GOCs required to improve their performance and review their asset holdings to identify surplus, non-performing and non-core assets for sale. |
6
FEATURES
| | • | | Reflecting a deterioration in global financial and economic conditions, as well as the lagged effect of prior monetary tightening, Gross State Product in Queensland is expected to expand by 3% in 2008-09, compared with 4 1/4% forecast in the State Budget. |
| | • | | However, economic growth in Queensland is expected to exceed that nationally for the thirteenth consecutive year in 2008-09. |
| | • | | Consumer spending is anticipated to grow at a slower rate than forecast at Budget time, reflecting the impact of a sharp decline in equity prices and prevailing negative sentiment. |
| | • | | Housing investment is anticipated to decline in 2008-09, compared with the marginal recovery forecast at Budget time, following higher lending rates in the first half of 2008 as well as lower levels of confidence. |
| | • | | The level of business investment is expected to remain high in 2008-09, reflecting a large amount of work already in the pipeline. |
| | • | | With the global economic downturn affecting major markets for Queensland’s mineral and tourism exports, overall growth in the volume of exports is expected to be weaker than the 4 1/4% forecast at Budget time. |
| | • | | While an easing in domestic demand growth is forecast to slow job creation in 2008-09, employment is still estimated to grow in year-average terms by 2 1/4% in 2008-09, slightly lower than the 2 1/2% forecast at Budget time. |
| | • | | As a result of slowing jobs growth and higher labour force participation, the year-average unemployment rate is expected to rise to 4 1/4% in 2008-09, but remain below that nationally. |
OVERVIEW
Key risks identified in the 2008-09 State Budget on 3 June 2008 have now eventuated. On the external front, the deepening in the global financial crisis has seen advanced economies fall into recession, while emerging Asia has become increasingly affected. As a result, growth in Queensland’s major trading partners in 2009 is now expected to slow to its lowest rate since the Asian financial crisis. Further, a sharp fall in commodity and equity prices has dampened corporate profits and household wealth.
Domestically, the Reserve Bank of Australia (RBA) has sharply cut official interest rates since September. However, the previous monetary tightening cycle and higher funding costs caused financial institutions to raise lending rates up until July. This has seen another risk identified at Budget time eventuate, with past monetary tightening having a greater than expected impact on activity in early 2008-09. A repricing of risk has also seen corporate yield spreads widen further since September, indicating businesses face more limited access to funding and at a higher cost.
As a result of these factors, economic growth in Queensland in 2008-09 is now forecast to grow below that originally anticipated in the State Budget. However, growth in Queensland is expected to remain above that nationally, reflecting strong population growth and the positive impact of a lower A$ on export returns. Section 2 highlights changes to global conditions over the past six months as well as key risks to the outlook, while Section 3 presents revised forecasts for economic growth and other major parameters for Queensland.
8
GLOBAL ECONOMIC CONDITIONS
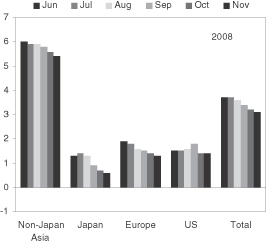
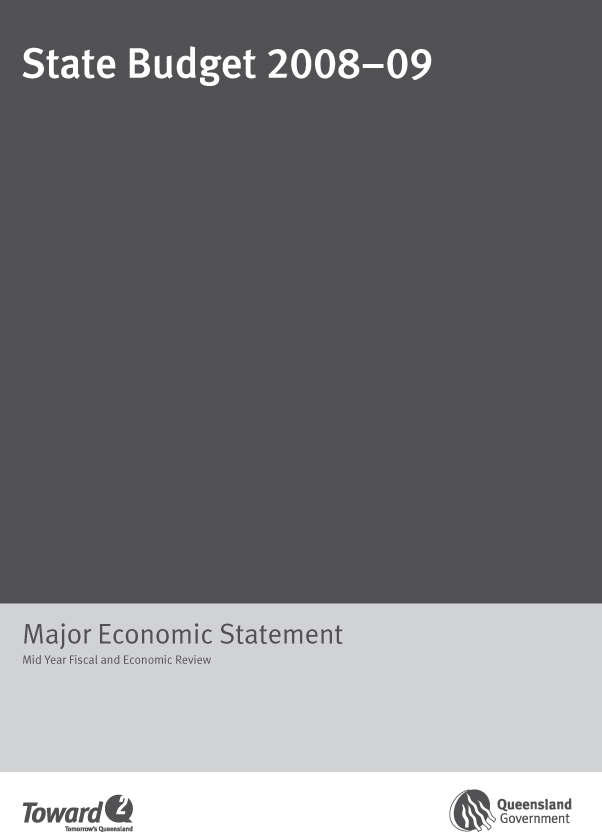
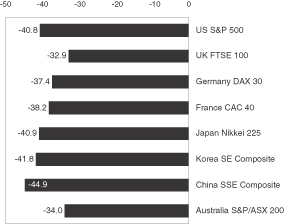
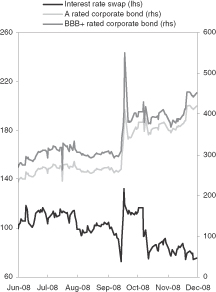
The global financial crisis has escalated since the release of the 2008-09 State Budget in June. High profile banking and corporate failures in the US and Europe during September shook investor confidence, resulting in a decline in equity prices and a surge in interbank interest rates worldwide. While liquidity conditions in the interbank market have improved somewhat following interventions by central banks, equity prices have continued to fall as the impact of the crisis on global economic growth has been gradually revealed (see Chart 1.1a).
Chart 1.1
Percent decline in equity and metal prices since early June
| | |
(a) Equity prices | | (b) US$ Metal prices |
| |
| |  |
Source: Datastream and Reuters
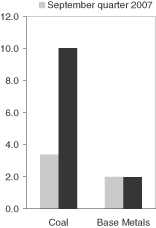
Extreme risk aversion and the prospect of a global economic recession have also seen mineral and energy prices retreat sharply. Most notably, the US$ prices of crude oil, thermal coal and natural gas—major fuel sources for electricity generation—have declined 61.4%, 48.1% and 46.6% respectively since early June. Metal prices have also fallen over the same period (see Chart 1.1b), with the fall in steel prices also reflected in expectations of lower contract prices for iron ore and coking coal—major inputs to steel production—beyond 2008-09.
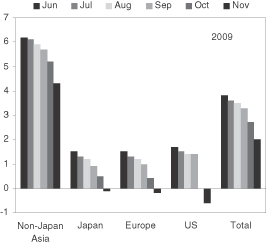
With countries starting to report economic performance for the first quarter of 2008-09 from mid October, the impact of the crisis on the global economy is only now being gradually revealed. So far seven1 out of the top 25 destinations for Queensland’s merchandise exports have fallen into recession and another four 2 are widely expected to follow later this year. This has resulted in downgrades to forecasts for world economic growth over the past five months. Most significantly, Queensland’s major trading partner economic growth is now forecast to slow to 2.0% in 2009 (see Chart 1.2). This would represent the lowest rate of growth since 1998—the year after the Asian financial crisis.
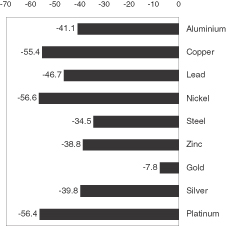
In an attempt to ease liquidity conditions and stimulate the economy, major central banks around the world have cut policy interest rates aggressively in recent months (see Chart 1.3a). The RBA cut the target cash rate by
1 | Japan (ranked 1st), the US (6th), New Zealand (9th), Italy (17th), Singapore (20th), Germany (21st) and Hong Kong (24th). |
2 | The UK (ranked 7th), Netherlands (8th), Spain (12th) and France (19th). |
9
300 basis points between September and December 2008 to 4.25%, the lowest level in six and a half years. This, along with the Bank of England, represents the largest absolute decline in official interest rates by any central bank of an advanced economy over the last six months, partly reflecting the relatively higher starting point for Australia’s cash rate.
Chart 1.2
Queensland’s major trading partner GDP growth forecasts since June*
(annual percentage change)
| * | Non-Japan Asia includes New Zealand. Europe includes United Kingdom |
Source: Queensland Treasury and Consensus Economics
Monetary easing, combined with other financial rescue plans announced by governments, has so far been successful in alleviating stress in the interbank market. In Australia, this has been reflected in a narrowing in the yield spread between 3-year interest rate swaps and Commonwealth Treasury bonds back to levels seen prior to mid September. In contrast, credit conditions in the corporate sector have continued to tighten, with corporate bond yields deviating further from Commonwealth Treasury bond yields (see Chart 1.3b).
10
Chart 1.3
Global interest rate cuts and Australian yield spreads since early June
(basis points)
| | |
(a) Cuts in policy rates | | (b) Yield spreads against 3-Year Commonwealth Treasury bonds |
| |
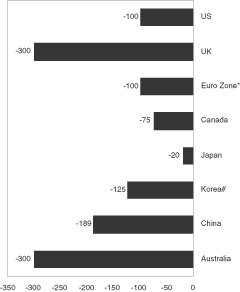 | |  |
| * | since July 2008; # since August 2008 |
Source: CBASpectrum and Reuters
Some governments have also announced massive fiscal stimulus packages to counter the crisis-induced economic downturn. The European Commission approved a 200 billion Euro (A$396 billion) EU-wide fiscal stimulus package on 26 November, China announced a 4 trillion Yuan (A$909 billion) spending package on 9 November, Germany approved a 50 billion Euro (A$99 billion) stimulus plan four days earlier and South Korea unveiled a 14 trillion Won (A$15 billion) package on 3 November. The Australian Government led international efforts by announcing an A$10.4 billion Economic Security Strategy in mid October, with almost A$9 billion to be delivered in December 2008.
While the impact of fiscal and monetary stimuli will take time to affect the economy, some shocks from the crisis will be more immediately counterbalanced by the depreciation of the A$. Aggressive monetary easing, together with significant unwinding of yen carrying trades, has seen the A$ depreciate 37.9% against the Japanese yen since early June. The A$ has also fallen against the US$ and other currencies closely linked to the US$ (see Chart 1.4).
The depreciation of the A$ will benefit the Australian and Queensland economies through various channels. First, given most of the State’s overseas exports are denominated in US$ terms, the depreciation of the A$, if not unwound in the remainder of 2008-09, could provide up to $10 billion in additional earnings to exporting businesses than would have otherwise been the case. Secondly, the depreciation will improve the competitiveness of import-competing and export industries. In particular, with spending in Australia much cheaper for foreign visitors and students, the lower A$ may help moderate the effect of the global downturn on the tourism-related and education industries. Thirdly, given that the size of foreign assets denominated in foreign currency is larger than that of foreign liabilities, and given Australian firms undertake more extensive hedging of foreign currency liabilities than foreign currency assets, the RBA has estimated that a 10% depreciation in the A$ leads to a reduction in net foreign liabilities of almost 3% of GDP. Fourth, by lowering the foreign price of domestic assets, a lower A$ may also support investment in Australia.
11
Chart 1.4
Depreciation of Australian dollar exchange rates since early June
(% change)
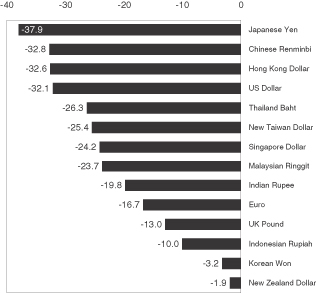
Source: Datastream
Risks to external conditions
Revised forecasts for economic growth in Queensland are based on a number of external assumptions. These include growth in the State’s major trading partners of around 2% in 2009 and an A$ exchange rate largely unchanged from its current level. Recent cuts to the official cash rate have also been incorporated. However, key risks to the external environment have the potential to influence the economic outlook.
With four of the Group of Seven (G7) countries in recession and the remaining three expected to follow, the financial crisis could deepen further if the downturn in world growth results in widespread corporate failures. The US government has committed almost US$6 trillion to support the financial sector, as write-downs and credit losses by financial institutions globally rose from US$330 billion in June 2008 to $440 billion by mid October. However, the extent of losses may escalate if recession in industrialised economies leads to failures of major corporations with a large presence in financial markets. The risk of this negative cycle was highlighted by the near bankruptcy of General Motors, the world’s largest automaker and fourth largest US corporation. The steepening US housing downturn also saw Fannie Mae, Freddie Mac and Citigroup seek further capital injections from the US government.
With all G7 countries expected to enter recession, the outlook for Asia may soften further. Despite announcements of large fiscal stimulus packages, Asian growth prospects have been marked down. Consensus Economics downgraded growth for 2009 in China, India, Korea, Singapore and Taiwan from 9.4%, 8.1%, 4.9%, 5.5% and 4.8% in June 2008, to 8.1%, 6.6%, 2.8%, 1.2% and 2.5% in November. A sharper downturn in Asia would adversely affect the State’s exports, given Asia accounts for the five largest merchandise export markets (Japan, Korea, India, China and Taiwan), four of the five largest education export markets (China, India, Korea and Japan) and almost 30% of nights spent in Queensland by overseas tourists. Crucially, a further slowing in emerging Asia will affect the State’s mineral exports, due to the region’s rising importance as a source of resource demand.
12
A global economic recession may also cause a sharper than expected moderation in demand for, and prices of, energy and mineral commodities. While world prices for crude oil have fallen to four-year lows and base metals prices have also reached multi-year lows, historically high coal prices have been locked in by contracts covering the first three quarters of 2008-09. Given prices were negotiated before the deterioration in the global economy, any correction in coal prices, and therefore coal export earnings beyond 2008-09, is likely to be significant.
Apart from exports, the global financial crisis may affect Australia, and therefore Queensland, through financial linkages with countries hit by the crisis. For instance, the UK and the US, the epicentre of the crisis, constitute 56% ($246.7 billion) of Australia’s portfolio investment abroad and 55% ($551.7 billion) of foreign portfolio investment in Australia. Any further deterioration in financial conditions is likely to disrupt domestic financial markets through investment losses in, and fund withdrawals from, these crisis-affected countries.
A key feature of the current financial crisis has been the prolonged decline in global equity prices, in contrast to the sharp fall and relatively swift recovery observed in European and Asian equity markets after the October 1987 stock market crash and burst of the IT bubble in 2000. If households perceive the current deterioration in wealth as less transitory than in past episodes, consumer spending may be pared back more than currently expected.
QUEENSLAND ECONOMIC OUTLOOK
The deterioration in global financial conditions and world growth prospects, as well as the lagged effect of the prior monetary tightening cycle, has softened the outlook for economic growth in Queensland. Household and business spending, as well as exports, are expected to grow below that forecast in the State Budget. Partly offsetting this, imports are expected to grow at a slower pace, reflecting the depreciation in the A$ and lower growth in domestic demand. On balance, Gross State Product (GSP) in Queensland is now expected to expand by 3% in 2008-09, compared with 4 1/4% forecast in the State Budget (see Table 1.1).
Table 1.1
Major Queensland and National Economic Parameters1
| | | | | | | | |
| | | Outcome
2007-08 | | Budget Forecast
2008-09 | | Revised Forecast
2008-09 | | National Forecast
2008-09 |
Gross state/national product2,3 | | 5.1 | | 4 1/4 | | 3 | | 2 |
Employment | | 2.8 | | 2 1/2 | | 2 1/4 | | 1 1/4 |
Unemployment rate4 | | 3.7 | | 3 3/4 | | 4 1/4 | | 5 |
Inflation5 | | 4.1 | | 3 1/2 | | 4 1/4 | | 3 1/2 |
Wage Cost Index | | 4.5 | | 4 1/2 | | 4 1/4 | | 4 1/4 |
Population | | 2.3 | | 2 1/4 | | 2 1/4 | | 1 1/2 |
Notes:
| 1. | Figures not quoted as a fraction are an actual outcome. All figures and growth rates are in year-average terms. |
| 2. | The 2007-08 outcome for economic growth represents a preliminary estimate based on the June quarter 2008 Queensland State Accounts (QSA). Subsequent releases of the QSA may contain revisions to 2007-08 growth. |
| 3. | Chain volume measure, 2005-06 reference year. |
| 4. | Queensland unemployment rate is a year-average forecast for 2008-09; national unemployment rate is a forecast for June quarter 2009. |
| 5. | 2008-09 inflation forecast is in year-average terms for Queensland but in through-the-year to June quarter 2009 for nationally. |
13
Despite a further deterioration in external conditions since Australian Treasury’s Mid Year Economic and Fiscal Outlook (MYEFO) in early November, economic growth in Queensland is expected to exceed the 2% forecast for that nationally. This partly reflects stronger population growth and the cushioning effect of a lower A$ on export earnings in Queensland. Chart 1.5 illustrates how 2008-09 would represent the thirteenth consecutive year that economic growth in Queensland exceeds that nationally. This period includes past economic shocks, such as the Asian financial crisis in 1997-98 as well as the introduction of the GST and collapse of the IT bubble in the US in 2000-01.
Chart 1.5
Economic growth in Queensland and Australia
(year-average, annual percentage change)
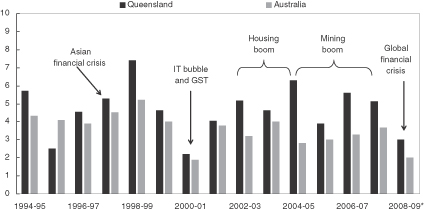
Source: Queensland State Accounts, Queensland Treasury, ABS 5204.0, Australian Treasury
Consumption
Consumer spending is anticipated to grow at a slower rate than that forecast at Budget time. This mainly reflects a sharp decline in equity prices and a moderate fall in house prices, which have lowered household wealth (see Chart 1.6a). A fall in housing activity since Budget is also anticipated to weigh on housing-related spending. These factors had already contributed to an easing in consumption in early 2008-09, with annual growth in the volume of retail trade (40% of total spending) easing to 1.9% in September quarter 2008 and motor vehicle sales declining by 15.5% in annual terms in the four months to October 2008.
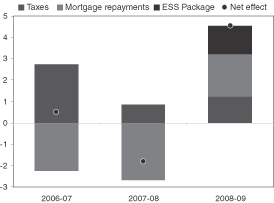
However, recent expansionary monetary and fiscal policies are expected to soften the easing in spending growth. Significant reductions in official interest rates since September 2008 and income payments to pensioners and families in December from the Commonwealth’s Economic Security Strategy (ESS) are estimated to add around 3 1/4% to disposable incomes (see Chart 1.6b). Given lower levels of consumer confidence, a larger than normal share of this additional income may be used to reduce debt instead of being consumed. Nevertheless, this would still represent a relative improvement in the financial position of households.
14
Chart 1.6
Consumer spending, wealth and disposable incomes, Queensland
| | |
(a) Retail spending and wealth (annual percentage change) | | (b) Policy changes and household disposable incomes (percentage point contribution) |
| |
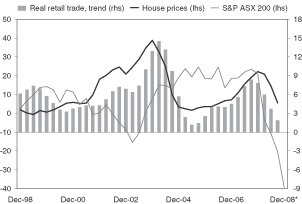 | |  |
Source: Datastream, ABS 6416.0 and 8502.0, Queensland Treasury estimates
Dwelling investment
Housing investment is now anticipated to decline moderately in 2008-09, compared with the marginal recovery originally forecast. While official interest rates were assumed to remain unchanged at Budget time, higher bank funding costs caused lending rates to rise further in July. This exacerbated the fall in dwelling demand already underway, following a 100 basis point rise in the cash rate between August 2007 and March 2008. Preceding the RBA’s aggressive monetary easing, private dwelling approvals had fallen 22.2% over the year to September quarter 2008. Further, more limited access to funding has caused some larger scale residential projects to be postponed.
Housing construction will benefit from recent interest rates cuts, the extension of the First Home Owner Grant (FHOG) and reductions to stamp duty provided by the State Government. However, construction lags, as well as low levels of consumer and business confidence, suggest the recovery in construction activity will be delayed until the second half of 2009.
Business investment
After doubling over the five years to 2007-08, the level of business investment is expected to remain near historic highs in 2008-09, but is unlikely to grow further as initially forecast in the State Budget. The latest ABS State Details indicated that non-dwelling construction in September quarter 2008 was 20.8% higher than a year ago, while machinery and equipment investment grew by 10.3% over the same period. Reflecting a large amount of work already in the pipeline, engineering construction should remain at high levels throughout the financial year.
However, the current easing in domestic and global demand, as well as more restricted access to credit, will reduce commencements of new investment projects. While the mining sector is generally less leveraged than other sectors, the sharp fall in commodity prices over the past six months has resulted in a scaling back of some capital programs and the postponement of selected projects. In the second half of 2008-09, machinery and equipment spending (the largest component of investment) will be adversely affected by the decline in the A$, which has made imported capital items more expensive.
15
Trade sector
With the slowdown in global economic growth spreading to major markets for Queensland’s mineral and tourism exports, overall growth in exports is expected to be weaker than the 4 1/4% forecast at Budget time. Exports of selected base metals in the first quarter of 2008-09 have grown at a slower pace than anticipated, while some major metal producers have announced cuts to production. In addition, while a lower A$ has made Australia a cheaper destination for visitors, tourism exports are forecast to be lower than anticipated at Budget time, with the economies comprising Queensland’s main sources of overseas arrivals, such as New Zealand, Japan, Germany, the UK and the US, in recession.
A faster than anticipated recovery from flooding as well as significant capacity expansions have seen coal exports expand at a stronger pace than initially expected so far in 2008-09. Coal railings in the first five months of 2008-09 have been almost 10% higher than the same period in 2007-08. While China recently announced a stimulus package to speed up key infrastructure projects, steel producers have announced cuts to production in other major export markets, including Japan, South Korea, Taiwan and Europe. This is likely to dampen growth in coal export volumes in the latter part of 2008-09.
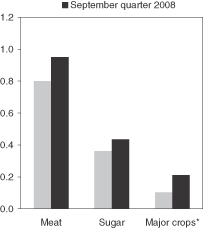
Chart 1.7
A$ Value of selected commodity exports
($ Billion)
| * | Includes cotton, wheat and sorghum |
Source: Queensland Treasury, ABS unpublished trade data
It should be noted that the depreciation in the A$ has acted to boost A$ export returns in the coal industry, compounded by a doubling and tripling in US$ contract prices for thermal and hard coking coal for the Japanese fiscal year from April 2008 to March 2009. The lower A$ has also boosted export returns in the rural sector and has so far largely offset the decline in US$ mineral prices (see Chart 1.7). Overall, export incomes are expected to grow at a faster rate than anticipated at Budget time, which will support economic activity.
Slower than anticipated growth in domestic demand will also translate into slower growth in imports compared with that forecast in the State Budget. More moderate growth in consumer and business spending will lower growth in imported consumer durables and capital goods, while the depreciation in the A$ should reduce the attractiveness of imported items relative to domestic goods. The adverse wealth effect from a fall in equity prices and the depreciation in the A$ will also make overseas travel less attractive in the second half of 2008-09.
16
Labour market
An easing in domestic demand growth is forecast to slow overall jobs growth in 2008-09. In particular, slower job creation in the more labour intensive construction and retail sectors is expected to more than offset a recovery in rural employment. Partly reflecting strong annual growth in the first four months of the financial year, employment in year-average terms is still estimated to rise 2 1/4% in 2008-09, slightly lower than the 2 1/2% forecast at Budget time. However, the participation rate continued to rise in the first four months of 2008-09, partly reflecting the lagged effect of a tight labour market in 2007-08. The recent easing in labour demand is likely to reverse this trend, as marginally attached workers, such as school, tertiary and older aged persons, exit the labour force. However, the year-average participation rate is still likely to be higher than forecast at Budget time. As a result of slowing jobs growth and higher participation, the year-average unemployment rate is expected to rise to 4 1/4%, rather than be unchanged at 3 3/4% in 2008-09.
Reflecting an easing in labour market conditions, the Wage Price Index (a measure of labour costs) is forecast to rise 4 1/4%, slightly lower than the 4 1/2% originally anticipated. However, as discussed, growth in disposable incomes is expected to be higher than this in 2008-09, reflecting lower interest rates, tax cuts and the Commonwealth’s fiscal stimulus.
Consumer price inflation
Despite an easing in economic growth and the labour market, the Brisbane Consumer Price Index (CPI) in year-average terms is now expected to rise 4 1/4% in 2008-09, compared with 3 1/2% originally forecast. This partly reflects changes in external conditions since Budget time. In particular, the impact of the credit crisis on the spread between lending and deposit rates is expected to cause the finance and insurance component of the CPI to contribute more to inflation than initially anticipated. Further, the depreciation in the A$ may slow the pace of moderation in growth in import prices, such as petrol prices, although more subdued domestic demand will limit the extent of pass-through to consumer prices more generally.
These factors, along with other transitory influences, helped push the CPI 5.6% higher over the year to September quarter 2008. This high starting point has also led to an upward revision to the year-average inflation forecast for 2008-09. However, an easing in domestic demand, lower world oil prices and better weather conditions are expected to see inflation ease in through-the-year terms to June quarter 2009.
17
FEATURES
| | • | | The 2008-09 General Government net operating balance is expected to be a surplus of $54 million, compared with the Budget estimate of a $809 million surplus. The downward revision in the operating position is primarily due to lower than expected taxation and GST revenue and actuarial revisions to superannuation and long service leave. |
| | • | | Taxation revenue estimates have reduced $884 million since the 2008-09 Budget, primarily due to a significant slowing in property market activity. |
| | • | | Coal royalties are expected to be $3.649 billion in 2008-09, $436 million higher than the Budget estimate, with the depreciation of the Australian dollar more than offsetting anticipated declines in contract coal prices and lower than expected volumes. |
| | • | | The General Government sector is forecast to incur a deficit in the net operating balance in 2009-10 ($124 million) and in 2010-11 ($85 million) before returning to surplus in 2011-12 ($92 million). |
| | • | | Cash deficits are projected in the General Government sector for each year across the forward estimates as a result of the State’s significant planned capital expansion. |
| | • | | The State’s net worth is forecast to increase to $160.386 billion in 2008-09, $31.823 billion higher than anticipated at Budget time mostly as a result of a comprehensive revaluation of road infrastructure assets. |
GENERAL GOVERNMENT SECTOR
Table 2.1
General Government—key financial aggregates
| | | | | | | | | | | | | | | |
| | | 2008-09
Budget | | | 2008-09
Revised | | | 2009-10
Projection | | | 2010-11
Projection | | | 2011-12
Projection | |
| | | $ million | | | $ million | | | $ million | | | $ million | | | $ million | |
Revenue | | 36,582 | | | 37,063 | | | 37,348 | | | 38,762 | | | 40,896 | |
Expenses | | 35,772 | | | 37,009 | | | 37,472 | | | 38,847 | | | 40,804 | |
Net operating balance | | 809 | | | 54 | | | (124 | ) | | (85 | ) | | 92 | |
Cash surplus/(deficit) | | (1,970 | ) | | (3,013 | ) | | (3,286 | ) | | (2,007 | ) | | (1,782 | ) |
Capital purchases | | 6,651 | | | 7,094 | | | 6,903 | | | 5,956 | | | 5,424 | |
Net borrowing | | 2,915 | | | 3,424 | | | 4,920 | | | 3,473 | | | 3,295 | |
Net worth | | 128,563 | | | 160,386 | | | 163,664 | | | 167,229 | | | 171,355 | |
Net debt | | (21,928 | ) | | (19,316 | ) | | (15,467 | ) | | (13,165 | ) | | (10,965 | ) |
2008-09 Revised Forecast
There has been a significant deterioration in external conditions compared to those assumed at the 2008-09 Budget. Corporate failures in the US and Europe have led to an extreme tightening in credit conditions and a widespread global financial crisis resulting in higher funding costs, substantial falls in equity markets, and weaker business and consumer confidence. Owing to the extent and severity of these factors, a significant downturn in world economic growth is now expected relative to Budget, with negative implications for the Queensland and national economies. In Queensland, slowing economic and employment growth has led to significant revisions in taxation revenue and a deterioration in the forecast net operating balance. Other jurisdictions around the globe are also forecasting substantially worse operating positions with many forecasting deficits.
19
Table 2.2
General Government sector—2008-09 key financial aggregates1
| | | | | | |
| | | 2008-09
Budget | | | 2008-09
Revised | |
| | | $ million | | | $ million | |
Revenue | | 36,582 | | | 37,063 | |
Expenses | | 35,772 | | | 37,009 | |
Net operating balance | | 809 | | | 54 | |
Cash surplus/(deficit) | | (1,970 | ) | | (3,013 | ) |
Capital purchases | | 6,651 | | | 7,094 | |
Net borrowing | | 2,915 | | | 3,424 | |
Net worth | | 128,563 | | | 160,386 | |
Net debt | | (21,928 | ) | | (19,316 | ) |
Note:
| 1. | Numbers may not add due to rounding. |
Operating balance
The General Government sector is expected to record an operating surplus of $54 million in 2008-09 compared to the $809 million surplus anticipated at the time of the Budget. This downward revision is primarily driven by lower than expected taxation revenue, particularly transfer duty, and actuarial revisions to superannuation and long service leave, partially offset by increased royalty revenue driven by the depreciation of the Australian dollar.
Table 2.3 provides a reconciliation of the current net operating balances for 2008-09 to the Major Economic Statement estimates.
Table 2.3
Reconciliation of 2008-09 Budget and Major Economic Statement net operating balances1
| | | |
| | | 2008-09 | |
| | | $ million | |
2008-09 Budget net operating balance | | 809 | |
| |
Expenditure policy decisions2 | | (167 | ) |
Other significant variations: | | | |
Taxes, royalties and revisions to net flows from PNFC sector entities | | (388 | ) |
Impact of revisions to Australian Government funding3 | | 157 | |
Other parameter adjustments4 | | (357 | ) |
| |
Major Economic Statement net operating balance | | 54 | |
Notes:
| 1. | Denotes impact on net operating balance. |
| 2. | Includes additional funding for health and a range of other initiatives outlined in Chapter 3. |
| 3. | Includes revised estimates of GST revenue included in the 2008-09 Australian Government Mid Year Economic and Fiscal Outlook as well as the impact of revenue and expenditure associated with COAG initiatives. |
| 4. | Refers to adjustments of a non-policy nature such as actuarial adjustments to superannuation and long service leave and changes to borrowing costs. |
20
Expenses
Expenses in 2008-09 are expected to be higher than the Budget estimate, largely due to:
| | • | | an increased level of service provision in the areas of health, disability services, housing and education arising from the recent COAG negotiations. This expense is offset by revenue from the Australian Government |
| | • | | actuarial revisions to superannuation and long service leave provisions and the flow through of poorer than anticipated investment returns in 2007-08 (investment returns were -2.2% in 2007-08 compared to 2% expected at Budget time) |
| | • | | increased payments to first home buyers as a result of the Australian Government’s First Home Owner Boost which is also offset by revenue from the Australian Government |
| | • | | additional funding for Natural Disaster Relief in response to the likely costs of the recent storm events in south east Queensland. |
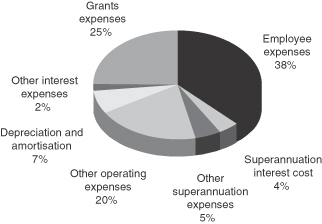
Chart 2.1 indicates that the largest expense category in the General Government sector is employee and superannuation expenses (47%), reflecting the direct service provision nature of Government activities, followed by grant expenses (25%) that include community service obligation payments to Government-owned corporations and the fuel subsidy and First Home Owner Grant schemes.
Chart 2.1
Expenses by operating statement category, 2008-09
21
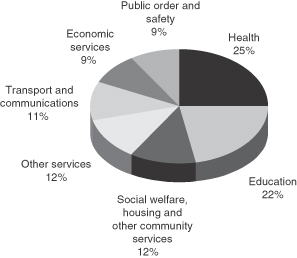
General Government expenditure is focused on the delivery of core services to the community. As shown in Chart 2.2, Education and Health account for the largest share of expenses.
Chart 2.2
Expenses by purpose, 2008-09
The Government has also allocated additional funding to a range of emergent issues including the Townsville Youth Detention Centre and Surgery Connect. Further details can be found in Chapter 3.
Revenue
General Government revenue in 2008-09 is estimated to be $37.063 billion, which is $481 million higher than the 2008-09 Budget estimate. Major variances include:
| | • | | increased funding from the Australian Government arising out of the recent COAG negotiations, which partially accounts for the increase in expenses |
| | • | | an increase in the coal royalty estimate associated with the depreciation in the Australian dollar |
| | • | | downward revisions across a range of taxation revenues but particularly transfer duty which reflects a sharp slowdown in property market activity |
| | • | | a reduction in the size of the GST pool, reflecting weaker levels of consumption nationally, resulting in a $241 million reduction in Queensland’s share of GST revenue. |
22
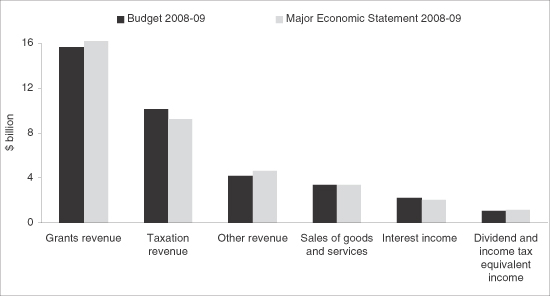
Chart 2.3 compares 2008-09 revenue estimates from the 2008-09 Budget to the Major Economic Statement. The overall result primarily reflects the reduction in taxation revenue and the increased Commonwealth grant and royalty revenue (royalty revenue is incorporated in ‘other revenue’).
Chart 2.3
Revenue by operating statement category
Budget and Major Economic Statement 2008-09
23
Table 2.4 outlines changes in taxation and royalty estimates since the 2008-09 Budget.
Table 2.4
Taxation and royalty revenue1
| | | | |
| | | 2008-09
Budget | | 2008-09
Revised |
| | | $ million | | $ million |
Payroll tax | | 2,702 | | 2,766 |
| | |
Duties | | | | |
Transfer | | 3,141 | | 2,250 |
Vehicle registration | | 518 | | 465 |
Insurance2 | | 403 | | 386 |
Other duties3 | | 29 | | 46 |
Total duties | | 4,091 | | 3,147 |
| | |
Gambling taxes and levies | | | | |
Gaming machine tax | | 578 | | 553 |
Health Services Levy | | 47 | | 41 |
Lotteries taxes | | 210 | | 221 |
Wagering taxes | | 38 | | 39 |
Casino taxes and levies4 | | 61 | | 61 |
Keno tax | | 17 | | 17 |
Total gambling taxes and levies | | 950 | | 931 |
| | |
Other taxes | | | | |
Land tax | | 797 | | 797 |
Motor vehicle registration | | 991 | | 1,003 |
Fire levy | | 279 | | 281 |
Community Ambulance Cover | | 133 | | 136 |
Guarantee fees | | 98 | | 98 |
Other taxes | | 65 | | 65 |
| | |
Total taxation revenue | | 10,106 | | 9,222 |
| | |
Royalties | | | | |
Coal | | 3,213 | | 3,649 |
Other royalties and land rents | | 432 | | 383 |
Total royalties | | 3,644 | | 4,032 |
Notes:
| 1. | Numbers may not add due to rounding. |
| 2. | Includes duty on accident insurance premiums. |
| 3. | Includes mortgage duty and duty on life insurance. |
| 4. | Includes community benefit levies. |
24
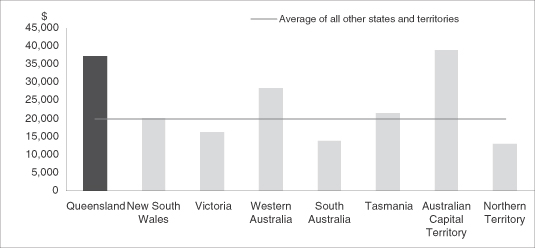
As Table 2.5 shows, taxation per capita in Queensland is lower than the average taxation per capita in the other states. However, the gap has narrowed in recent years as strong economic growth in Queensland has resulted in significant increases in employment, leading to growth in payroll tax, and property values and volumes compared with other jurisdictions.
Other measures of competitiveness, such as taxation effort and taxation as a share of gross state product (GSP), provide a comparative view of the level of taxation imposed on the Queensland economy and confirm that Queensland’s taxes are competitive with other states.
Table 2.5
Queensland’s tax competitiveness
| | | | | | | | | | | | | | | | | | |
| | | QLD | | NSW | | VIC | | WA | | SA | | TAS4 | | ACT | | NT4 | | Avg5 |
Taxation per capita1 ($) | | 2,132 | | 2,545 | | 2,416 | | 2,884 | | 2,247 | | 1,787 | | 3,028 | | 1,820 | | 2,499 |
Taxation effort2 (%) | | 84.6 | | 104.0 | | 103.0 | | 102.7 | | 112.6 | | 95.5 | | 105.9 | | 101.6 | | 100.0 |
Taxation % of GSP3 (%) | | 4.46 | | 5.16 | | 4.80 | | 3.85 | | 4.87 | | 3.77 | | 4.31 | | 2.53 | | 4.71 |
Notes:
| 1. | 2008-09 data. Sources: QLD, VIC, NT Mid Year Reviews, NSW Mini-Budget, WA Pre-election Financial Projections Statement, SA, TAS, ACT State Budgets. |
| 2. | 2006-07 data. Source: Commonwealth Grants Commission: 2008 Update. |
| | Revenue raising effort ratios, assessed by the Commonwealth Grants Commission, isolate policy impacts from revenue capacity impacts and are an indicator of the extent to which the governments burden their revenue bases. Queensland’s tax revenue raising effort is well below the Australian policy standard (equal to 100%). |
| 3. | 2007-08 data. Sources: State Outcome Reports, except SA (State Budget) and ABS 5220.0. |
| 4. | Low taxation per capita primarily reflects the lower revenue raising capacity of those jurisdictions. |
| 5. | Weighted average of states and territories, excluding Queensland. |
Cash surplus/(deficit)
Consistent with running a large capital program, the General Government sector is estimated to record a cash deficit of $3.013 billion in 2008-09.
At the time of the 2008-09 Budget, a cash deficit of $1.97 billion was expected in 2008-09 for the General Government sector. The larger than expected cash deficit is predominantly the result of the cash impact of the reduction in the net operating balance from $809 million to $54 million and higher capital purchases arising from some planned capital spending previously scheduled to occur in 2007-08, now scheduled for 2008-09 and the outyears.
Capital purchases
Purchases of non-financial assets (i.e. capital expenditure) are expected to rise to $7.094 billion in 2008-09, $443 million higher than Budget. Increased capital expenditure is mostly in the areas of transport, roads and police and primarily reflects some planned capital spending previously scheduled for 2007-08, now occurring in 2008-09 and the outyears.
Net borrowing
Net borrowings of $3.424 billion are expected in 2008-09, an increase of $509 million over the Budget estimate largely due to the increase in capital spending, driven by some planned capital spending previously scheduled for 2007-08, now occurring in 2008-09 and the outyears and a lower operating surplus. Less than half of General Government purchases of non-financial assets will be funded from borrowings in 2008-09 with the remainder financed through cash flow.
25
Net worth
Net worth, or equity, of the State is the amount by which the State’s assets exceed its liabilities. This is the value of the investment held on behalf of the people of Queensland by public sector entities.
Net worth is projected to increase from the 2007-08 actual by $5.208 billion to $160.386 billion at 30 June 2009. This is $31.823 billion higher than anticipated at the time of the 2008-09 Budget. The primary driver of this increase is the comprehensive revaluation of road infrastructure assets by the Department of Main Roads, as reflected in the 2007-08 audited actuals for the State.
Net debt
In 2008-09, net debt in the General Government sector is estimated to be negative $19.316 billion compared to the Budget estimate of negative $21.928 billion. This change in net debt primarily reflects the flow through of lower than forecast investment returns and higher borrowings due to a reduced surplus in 2008-09.
Queensland’s negative net debt of $4,465 per capita, compares to the weighted average net debt of $402 per capita in the other states. This indicates the strength of Queensland’s fiscal position relative to the other states.
Table 2.6
Projected net debt per capita at 30 June 2009
| | | | | | | | | | | | | | | |
| | | QLD | | | NSW | | VIC | | WA | | | SA | | TAS | |
Net debt per capita ($) | | (4,465 | ) | | 884 | | 760 | | (1,395 | ) | | 379 | | (2,247 | ) |
Source: Mid Year Reviews for Qld, Vic and NT, State Budgets for NSW, SA, Tas, ACT, Pre-election Financial Projections Statement for WA. Population data is consistent with the Australian Government’s Mid Year Economic and Fiscal Outlook.
Revised Forward Estimate Projections
Operating balance
The General Government sector is forecast to record operating deficits in 2009-10 and 2010-11 before returning to surplus in 2011-12. The net operating balances across each of the forward estimate years are lower than anticipated at the time of the 2008-09 Budget. This is primarily due to lower than expected taxation and GST revenue and actuarial revisions to superannuation and long service leave.
Table 2.7
General Government net operating balance
| | | | | | | | | | | | |
| | | 2008-09
Budget | | 2008-09
Revised | | 2009-10
Projection | | | 2010-11
Projection | | | 2011-12
Projection |
| | | $ million | | $ million | | $ million | | | $ million | | | $ million |
Net operating balance | | 809 | | 54 | | (124 | ) | | (85 | ) | | 92 |
The deterioration in the net operating balance in 2009-10 and 2010-11, compared with the surplus in 2008-09, reflects a moderation in royalty revenues, growth in recurrent expenditure in support of the capital program, slower growth in GST receipts particularly as a result of Queensland becoming a net donor state and the distribution of funding from the Australian Government for COAG initiatives compared with when the expense is incurred.
The return to surplus in 2011-12 primarily reflects the implementation of a number of remedial measures implemented by Government to bring the budget back to surplus (refer Chapter 3) and the distribution of COAG funding from the Australian Government compared with the corresponding expense.
26
Revenue
Table 2.8
General Government revenue1
| | | | | | | | | | |
| | | 2008-09
Budget | | 2008-09
Revised | | 2009-10
Projection | | 2010-11
Projection | | 2011-12
Projection |
| | | $ million | | $ million | | $ million | | $ million | | $ million |
Revenue | | | | | | | | | | |
Taxation revenue | | 10,106 | | 9,222 | | 10,189 | | 11,065 | | 11,854 |
Grants revenue | | | | | | | | | | |
Current grants | | 14,631 | | 15,196 | | 14,896 | | 15,362 | | 16,108 |
Capital grants | | 1,056 | | 1,399 | | 1,355 | | 1,192 | | 1,178 |
Sales of goods and services | | 3,385 | | 3,405 | | 3,452 | | 3,553 | | 3,626 |
Interest income | | 2,199 | | 2,073 | | 2,130 | | 2,206 | | 2,282 |
Dividend and income tax equivalent income | | | | | | | | | | |
Dividends | | 841 | | 897 | | 1,138 | | 1,310 | | 1,853 |
Income tax equivalent income | | 210 | | 273 | | 474 | | 541 | | 717 |
Other revenue | | | | | | | | | | |
Royalties and land rents | | 3,644 | | 4,032 | | 3,233 | | 3,056 | | 2,796 |
Other | | 509 | | 565 | | 480 | | 479 | | 481 |
| | | | | |
Total Revenue | | 36,582 | | 37,063 | | 37,348 | | 38,762 | | 40,896 |
Note:
| 1. | Numbers may not add due to rounding. |
Modest revenue growth is anticipated across the forward estimates, with an expected moderation in royalty revenue, as a result of lower contract coal prices, and slower growth in GST receipts. This is partially offset by growth in taxation revenue and dividends and tax equivalent payments from Government-owned corporations.
The tighter fiscal conditions brought about by a downturn in the global economy has required the Government to raise additional revenue to enable it to continue to fund services to the community. In summary, these changes include:
| | • | | increases in motor vehicle registration fees from 1 July 2009 |
| | • | | a rescheduling of the abolition of transfer duty on core business assets. Full abolition will now occur on 1 July 2012, within the timeframes nominated in the Intergovernmental Agreement |
| | • | | removal of the effective discount applied to gaming machines in casinos, from 1 July 2009 |
| | • | | from 1 July 2009, a 0.5% land tax surcharge on the value of properties in excess of $5 million. |
Further detail on these measures can be found in Chapter 3.
27
Expenses
Table 2.9
General Government sector expenses1
| | | | | | | | | | |
| | | 2008-09
Budget | | 2008-09
Revised | | 2009-10
Projection | | 2010-11
Projection | | 2011-12
Projection |
| | | $ million | | $ million | | $ million | | $ million | | $ million |
Expenses | | | | | | | | | | |
Employee expenses | | 13,896 | | 13,997 | | 15,142 | | 15,867 | | 16,802 |
Superannuation interest cost | | 1,219 | | 1,333 | | 1,407 | | 1,477 | | 1,542 |
Other superannuation expenses | | 1,959 | | 1,991 | | 2,015 | | 2,041 | | 2,054 |
Other operating expenses | | 6,782 | | 7,397 | | 7,207 | | 7,360 | | 7,666 |
Depreciation and amortisation | | 2,665 | | 2,610 | | 2,701 | | 2,748 | | 2,878 |
Other interest expenses | | 539 | | 564 | | 802 | | 1,058 | | 1,260 |
Grants expenses | | 8,713 | | 9,117 | | 8,197 | | 8,296 | | 8,603 |
| | | | | |
Total Expenses | | 35,772 | | 37,009 | | 37,472 | | 38,847 | | 40,804 |
Note:
| 1. | Numbers may not add due to rounding. |
General Government expenses are forecast to grow at a modest rate over the forward estimates, with expenditure increases primarily related to service enhancements in key service delivery areas including for COAG reforms, recurrent expenditure in support of the capital program and moderate increases in wages.
Cash surplus/(deficit)
Cash deficits are forecast across the forward estimates reflecting the significant planned capital expansion.
The Government will continue to have cash invested with Queensland Treasury Corporation which has been quarantined for use on Queensland Future Growth Fund projects.
Capital purchases and borrowing
Table 2.10
Capital purchases and net borrowing
| | | | | | | | | | |
| | | 2008-09
Budget | | 2008-09
Revised | | 2009-10
Projection | | 2010-11
Projection | | 2011-12
Projection |
| | | $ million | | $ million | | $ million | | $ million | | $ million |
Capital purchases | | 6,651 | | 7,094 | | 6,903 | | 5,956 | | 5,424 |
Net borrowing | | 2,915 | | 3,424 | | 4,920 | | 3,473 | | 3,295 |
Over the period 2008-09 to 2011-12, purchases of non-financial assets in the General Government sector of $25.377 billion are planned. This is $381 million lower than was anticipated at the time of the 2008-09 Budget as a result of the Government’s reprioritisation of the capital program. This is discussed in more detail in Chapter 3.
Over 2008-09 and the forward estimates, General Government net borrowings of $15.112 billion are planned in support of the Government’s significant capital program. This is $227 million less than forecast at Budget time as a result of the reprioritisation of the capital program outlined in Chapter 3.
Of this borrowing, $1.941 billion is to fund net equity injections to Queensland’s Public Non-financial Corporations sector entities to support expansion of the State’s ports, water, energy and rail infrastructure.
28
Net worth
The Charter of Social and Fiscal Responsibility specifically requires the Government to maintain and seek to increase total State net worth.
The net worth, or equity, of the State is the amount by which the State’s assets exceed its liabilities (which is equivalent to General Government net worth). This is the value of the investment held on behalf of the people of Queensland by public sector instrumentalities.
Changes in the State’s net worth occur for a number of reasons including:
| | • | | operating surpluses (deficits) that increase (decrease) the Government’s equity |
| | • | | revaluation of assets and liabilities are required by accounting standards. Some financial liabilities are revalued on a regular basis, for example the Government’s accruing liabilities for employee superannuation and long service leave are determined by actuarial assessments |
| | • | | movements in the net worth of the State’s investments in the Public Non-financial Corporations and Public Financial Corporations sectors |
| | • | | gains or losses on disposal of assets. Government agencies routinely buy and sell assets. Where the selling price of an asset is greater (less) than its value in an agency’s accounts, the resultant profit (loss) affects net worth. |
Net worth is forecast to grow to $171.355 billion by the end of 2011-12, $16.177 billion higher than the 30 June 2008 actual.
Chart 2.4
Interjurisdictional comparison of projected per capita net worth at 30 June 2009
Note:
| 1. | Western Australia values land under roads as part of its overall asset base. This has been adjusted to allow comparison with other jurisdictions which do not value land under roads. |
Source: Mid Year Reviews for Qld, Vic and NT, State Budgets for NSW, SA, Tas, ACT, Pre-election Financial Projections Statement for WA. Population data is consistent with the Australian Government’s Mid Year Economic and Fiscal Outlook.
29
Net debt
Net debt is the sum of advances received and borrowings less cash and deposits, advances paid and investments, loans and placements. The extent of accumulated net debt is used to judge the overall strength of a jurisdiction’s fiscal position. High levels of net debt impose a call on future revenue flows to service that debt and meeting those payments can limit government flexibility to adjust outlays. Excessive net debt can call into question the ability of government to service that debt. Net debt is expected to increase over the forward estimates primarily reflecting the increase in borrowing to support the State’s capital program. However, net debt is expected to remain negative across each of the forward estimate years.
Fiscal strategy
The Charter of Fiscal and Social Responsibility outlines the Government’s fiscal principles. The Government is expecting to meet all of these fiscal commitments in 2008-09. Current forecasts indicate operating surpluses will not be achieved in 2009-10 and 2010-11, but the operating position is expected to return to surplus in 2011-12.
Box 2.1
The fiscal principles of the Queensland Government—2008-09
| | | | |
Principle | | Achievement | | Indicator |
Competitive tax environment The Government will ensure that State taxes and charges remain competitive with the other states and territories in order to maintain a competitive tax environment for business development and jobs growth. | | ü | | Taxation revenue per capita:
Queensland: $2,132 Average of other states and territories: $2,499 |
| | |
Affordable service provision The Government will ensure that its level of service provision is sustainable by maintaining an overall General Government operating surplus, as measured in Government Finance Statistics terms. | | ü | | GFS operating surplus: $54 million |
| | |
Sustainable borrowings for capital investment Borrowings or other financial arrangements will only be undertaken for capital investments and only where these can be serviced within the operating surplus, consistent with maintaining a AAA credit rating. | | ü | | General Government borrowings: $3.424 billion General Government total purchases of non-financial assets: $7.094 billion GFS operating surplus: $54 million AAA credit rating confirmed by Moody’s and Standard and Poor’s (highest rating available) |
| | |
Prudent management of financial risk The Government will ensure that the State’s financial assets cover all accruing and expected future liabilities of the General Government sector. | | ü | | General Government net financial worth: $12.567 billion |
| | |
Building the State’s net worth The Government will maintain and seek to increase total State net worth. | | ü | | Net worth to increase to $160.386 billion |
30
PUBLIC NON-FINANCIAL CORPORATIONS SECTOR
The Public Non-financial Corporations (PNFC) sector is projected to have a net operating surplus of $622 million in 2008-09, an increase of $18 million from the Budget estimate.
Across the PNFC sector, earnings before interest and tax (EBIT) is now forecast to increase from $3.667 billion in 2008-09 to $5.293 billion in 2011-12. This increase is due to improvements in forecast commercial outcomes across the sector, including QR Limited, port authorities and energy GOCs.
Dividends from PNFC sector entities are anticipated to increase from $831 million in 2008-09 at the time of the Budget to $889 million—an increase of $58 million. They are forecast to increase to $1.627 billion by 2011-12 (compared to an estimate of $1.349 billion in the 2008-09 Budget).
Current tax equivalent payments (TEPs) also increase from $192 million in 2008-09 at the time of the Budget to $257 million. Across the outyears, current TEPs are forecast to increase to $686 million, reflecting an underlying improvement in profitability and also some GOCs exhausting their deferred income tax expense provisions, in particular ports and QR Limited.
Capital spending in the PNFC sector has been revised downwards over the outyears to $18.822 billion, $601 million less than was anticipated at the time of the 2008-09 Budget. This decrease is primarily due to the deferral of Traveston Crossing Dam.
Net borrowing across the outyears is expected to be $8.962 billion, $1.136 billion less than was anticipated at Budget time. This decrease is primarily due to the reduction in capital spending across the forward estimates as a result of the deferral of the Traveston Crossing Dam.
A cash deficit of $8.569 billion is expected in 2008-09, a deterioration of $101 million over the Budget estimate primarily due to increased estimated capital spending in 2008-09.
The net worth of the sector is expected to increase by $2.027 billion over the 2008-09 Budget forecast to $20.834 billion. This increase is primarily due to the annual revaluation of assets.
31
FEATURES
| | • | | Slower economic growth and lower revenue have necessitated a number of remedial measures to return the Budget to a more robust footing across the forward estimates. |
| | • | | A further public sector efficiency target of $100 million per annum from 2009-10 rising to $200 million per annum from 2010-11 will be introduced. |
| | • | | Motor vehicle registration fees will increase from 1 July 2009. |
| | • | | The abolition of transfer duty on core business assets will be deferred until 1 July 2012. |
| | • | | The tax rate on gaming machine win on casino gaming machines will increase by 10% from 1 July 2009, to 20% at the Breakwater Island and Reef casinos and 30% at the Jupiters and Treasury casinos. |
| | • | | From 1 July 2009, a 0.5% surcharge will apply to the value of land (for land tax purposes) in excess of $5 million. |
| | • | | The Government recently announced the closure of QSuper’s defined benefit account to new members. |
| | • | | The Government has also allocated additional funding to a range of emergent issues including the Townsville Youth Detention Centre and Surgery Connect. |
| | • | | In order to maintain the State’s overall debt profile, the Government has deferred the Queensland Police Academy by two years. |
| | • | | The expenditure profile for Traveston Crossing Dam has changed, with environmental mitigation to occur before commencement of construction. |
| | • | | GOC reform will continue with GOCs required to improve their performance and review their asset holdings to identify surplus, non-performing and non-core assets for sale. |
| | • | | Government is pursuing opportunities to encourage private sector investment in and ownership of economic infrastructure including in the Wiggins Island Coal Terminal, Australia Trade Coast Precinct Road Network, new electricity generation, the North West Minerals Province and Surat Basin Railway. |
| | • | | Increased provision has been made for the Workers Assistance Program and for financial counselling services in the community. |
FISCAL DEVELOPMENTS
Since the 2008-09 Budget was delivered in early June 2008, governments around the world have suffered reductions in their revenue as credit markets tightened and economic growth slowed. Many governments are now forecasting net operating deficits, including jurisdictions in the US and Canada. The Australian Government is also flagging a possible deficit.
As outlined in Chapter 2, slower economic activity in Queensland, particularly in the housing market, has led to substantial downward revisions in taxation revenue which has flowed through to lower net operating balances with deficits forecast in some years.
The Government has implemented measures to reduce spending and increase revenue in order to improve the State’s fiscal position. These measures include:
| | • | | the implementation of a public sector efficiency measure of $100 million per annum from 2009-10 rising to $200 million from 2010-11 |
| | • | | a series of revenue measures |
33
| | • | | adjustments to the capital program while seeking to maintain the worth of the program |
| | • | | a program of reform of Government-owned corporations |
| | • | | private sector involvement in public infrastructure. |
The deterioration in global financial conditions and world growth prospects is also likely to have an impact on employment growth and unemployment. As outlined in Chapter 1, slowing jobs growth and higher labour force participation are expected to increase the State’s unemployment rate to 4 1/4% in 2008-09. However, the Government’s range of labour market assistance programs will offer timely and tangible support to individuals, communities and industries adversely impacted by a changed employment outlook.
PUBLIC SECTOR EFFICIENCY TARGET
A further public sector efficiency target of $100 million per annum from 2009-10 rising to $200 million per annum from 2010-11 will be introduced. This is in addition to the $60 million in 2008-09 and $80 million per annum from 2009-10 announced in the 2008-09 Budget. These savings will be achieved by reducing corporate overheads and reducing publication, marketing and communication costs. The decision on agency specific targets will be made as part of the 2009-10 Budget, with the overriding objective of ensuring front line staff and functions are unaffected.
This savings target builds on other recent efficiency reforms of Government such as improvements in procurement, the ongoing consolidation of ICT across Government, the amalgamation of the former Service Delivery Performance Commission and the Office of the Public Service Commissioner, the moves to create the Civil and Administrative Tribunal which will replace around 26 different tribunals, formation of the Expenditure Review Committee of Cabinet, a review of all Government boards and statutory bodies and a whole-of-Government productivity dividend and review of corporate services with funding redirected to frontline services.
TAXATION MEASURES
The tighter fiscal conditions brought about by a downturn in the global economy have required the Government to raise additional revenue to enable it to continue to fund services to the community and maintain the capital program which will support 119,000 jobs in 2008-09.
Motor vehicle registration
Motor vehicle registration fees will increase from 1 July 2009. Based on the 2008-09 cost of registering a 4 cylinder vehicle, this would increase the registration renewal by around 6.5%. Table 3.1 demonstrates the impact of this increase on selected vehicles based on the 2008-09 cost of registering a vehicle.
Table 3.1
Increases in Registration Fees for Selected Vehicles
| | | | | | |
Vehicle | | Cylinders | | Current MV
Registration Charge1 | | Revised MV Registration
Charge1,2 |
| | | | | $ | | $ |
Toyota Yaris | | 4 | | 556.80 | | 592.80 |
Toyota Corolla | | 4 | | 556.80 | | 592.80 |
Toyota Camry | | 4 | | 556.80 | | 592.80 |
Nissan Navara | | 4 | | 556.80 | | 592.80 |
Commodore/Falcon | | 6 | | 674.15 | | 741.35 |
Holden Statesman | | 8 | | 808.60 | | 902.65 |
Notes:
| 1. | Based on the lowest Compulsory Third Party (CTP) Premium available. |
| 2. | Based on 2008-09 cost of registering a motor vehicle. Actual 2009-10 registration fee will vary from the amount above given changes in CTP and adjustments for CPI etc. |
34
Queensland motorists currently pay a total of approximately $1 billion in motor vehicle registration fees each year.
In 2008-09, the Queensland Government will spend more than $3.2 billion (including Commonwealth sourced funding of $638 million) on the State’s road program to support around 19,000 jobs.
There are major challenges in delivering a roads program of this scale in the current fiscal environment. The increase in motor vehicle registration fees will provide an additional $194 million in 2009-10 and will assist the Government to continue to roll out its roads program, which will be to the benefit of all Queenslanders.
Delay in abolition of transfer duty on core business assets
The Intergovernmental Agreement (IGA), agreed by the Australian Government and all state and territory governments in 1999, required the abolition and review of a number of state taxes.
Following the review of duties listed in the IGA, a timetable for the abolition of the majority of these duties was announced in the 2005-06 Budget.
To date, the Government has completed all of the duty abolitions listed in this table in accordance with the timeframe agreed under the schedule. The Government brought forward the abolition of mortgage duty to 1 July 2008, six months ahead of schedule, as part of the measures in the 2008-09 Budget to provide assistance to home buyers and businesses.
It was intended to halve duty on the transfer of core business assets from 1 January 2010, with full abolition from 1 January 2011. In light of the tighter fiscal conditions, the abolition of this duty will now be deferred until 1 July 2012, in accordance with the timeframe included in the IGA.
The cost of abolition of the nine taxes listed in the IGA has already risen from $290 million in 2005-06 to $840 million in 2008-09 and will rise to almost $1.4 billion by 2012-13.
In light of falling revenues, this adjustment to the timetable is considered necessary.
35
Table 3.2 presents the full schedule of tax abolitions under the IGA.
Table 3.2
Abolition of state taxes under the IGA
| | | | | | |
Tax | | Description | | Abolition | | Full year
cost1 |
| | | | | | | $ million |
Marketable securities duty (quoted) | | Payable on the transfer of marketable securities listed on the Australian Stock Exchange or another recognised stock exchange. | | ü
July 2001 | | 35 |
| | | |
Credit card duty2 | | Payable on credit card transactions. | | ü
August 2004 | | 20 |
| | | |
Debits tax | | Payable on debits to accounts with cheque drawing facility. | | ü
July 2005 | | 190 |
| | | |
Lease duty | | Payable on the lease of land or premises in Queensland. Residential leases exempted. | | ü
January 2006 | | 27 |
| | | |
Credit business duty | | Payable on the amount of credit provided under a loan, a discount transaction or a credit arrangement. | | ü
January 2006 | | 19 |
| | | |
Hire duty | | Payable on the hiring charges of the hire of goods. | | ü
January 2007 | | 19 |
| | | |
Marketable securities duty (unquoted) | | Payable on the transfer of marketable securities not listed on the Australian Stock Exchange or another recognised stock exchange. | | ü
January 2007 | | 17 |
| | | |
Mortgage duty | | Payable on entering into a mortgage over property in Queensland. | | ü
July 2008
six months ahead
of schedule | | 439 |
| | | |
Duty on transfer of core business assets | | Payable on the transfer of non-realty business assets. | | 1 July 2012 | | 259 |
Notes:
| 1. | Estimated revenue foregone in financial year following full abolition. |
| 2. | Credit card duty was abolished prior to its review under the IGA. |
Casino gaming machines
In order to reduce the disparity that exists between the tax rates applicable to gaming machines in casinos and those applicable to large clubs and hotels, the tax rate on gaming machine win on casino gaming machines will increase by 10% from 1 July 2009, to 20% at the Breakwater Island (Jupiters Townsville) and Reef (Cairns) casinos and 30% at the Conrad Jupiters (Gold Coast) and Conrad International Treasury (Brisbane) casinos. At the same time, the concessional tax rate applicable to premium play at the Breakwater Island and Reef casinos will be removed.
This measure will provide an additional $36 million in 2009-10.
36
Land tax
From 1 July 2009, a 0.5% surcharge will apply where the aggregate value of all land (for land tax purposes) exceeds $5 million. The surcharge will apply only to the portion of the value exceeding $5 million.
As a result of this adjustment, land tax schedules for resident individuals and companies, trustees and absentees will be as outlined in Table 3.3 and 3.4. This change will impact around 1,800 companies, trusts and absentees and around 130 resident individual taxpayers.
Table 3.3
Land tax schedules for 2009-10—resident individuals1
| | |
Unimproved Land Value | | Rate |
$600,000 - $999,999 | | $500 + rate of 1.00% |
$1,000,000 - $2,999,999 | | $4,500 + rate of 1.65% |
$3,000,000 - $4,999,999 | | $37,500 + rate of 1.25% |
$5,000,000 and above | | $62,500 + 1.75% |
Note:
Table 3.4
Land tax schedules for 2009-10—companies, trustees and absentees1
| | |
Unimproved Land Value | | Rate |
$350,000 - $2,249,999 | | $1,450 + rate of 1.70% |
$2,250,000 - $4,999,999 | | $33,750 + 1.50% |
$5,000,000 and above | | $75,000 + 2.00% |
Note:
This measure will provide an additional $93 million in 2009-10.
CLOSURE OF THE DEFINED BENEFIT SCHEME
The Government recently announced the closure of QSuper’s defined benefit account to new members, effective from the date of announcement.
Before the closure of the Scheme, Queensland was the only Government in Australia that still had a broad based, open defined benefit scheme. Other states and the Commonwealth all stopped offering defined benefit schemes over the past 15 years.
This action was taken to protect the current entitlements of existing defined benefit members and to ensure that the Scheme’s liabilities are not exposed to risks that flow from the collapse in global equities markets.
37
POLICY MEASURES
The Government has made a number of policy measures to meet emergent cost pressures and service needs, including:
| | • | | an additional $50 million is provided over two years ($30 million in 2008-09 and $20 million in 2009-10) for the Surgery Connect program which provides elective surgery to long wait patients through the private sector. |
| | • | | $3 million in output funding over two years ($1 million in 2008-09 and $2 million in 2009-10) is provided to extend the capacity of Lifeline to respond to the financial counselling needs of individuals and families impacted by the decline in economic conditions. |
| | • | | an additional $9.9 million is provided over five years to increase foster carer payments in line with recent consumer price index increases. |
| | • | | the Home WaterWise Rebate Scheme was established in July 2006 to assist in cutting the amount of water used by residents. The Scheme was announced to run until 30 June 2009 with an allocation of $29 million. The Scheme has been very successful in achieving its objectives and will cease to operate after 31 December 2008. Over $350 million will have been spent on the scheme by the time it closes. |
| | • | | funding of $18.3 million to ENERGEX and Ergon Energy Corporation to initiate a range of energy conservation and demand management measures designed to reduce peak electricity demand in Queensland. Implementing these measures from 2008 to 2020 may significantly reduce greenhouse gas emissions as well as electricity infrastructure costs. |
| | • | | an additional $5 million is provided to Ergon Energy Corporation to undertake a trial of an energy conservation program in Queensland’s isolated communities. The trial will investigate ways to reduce the cost of supplying energy to these communities as well as reducing greenhouse gas emissions and electricity bills. |
| | • | | additional funding of $2.8 million is provided in 2008-09 for the Taxi Subsidy Scheme. The Scheme provides affordable travel for people with severe disabilities who are unable to use other forms of public passenger transport. |
| | • | | $5 million is allocated over 2008-09 and 2009-10 for government employee housing in the Woorabinda and Aurukun communities. |
| | • | | additional funding to implement a new financial assistance scheme for victims of crime. The new scheme will receive funding of $29 million a year, an increase of more than $7 million on the budget for the old scheme. The Government has also set aside an additional $10 million in 2008-09 to clear the backlog in compensation claims. Under the new scheme, victims of crime will have access to faster, more effective financial assistance as well as coordinated support services. |
| | • | | from the recent increase in the State’s penalty unit for fines, the Government is providing additional funding to a range of policing and road safety initiatives. This includes $83.7 million over four years for an additional 106 traffic police and associated speed management initiatives; $70.6 million over four years for improvements to black spots on the State’s roads; and $4.8 million over four years for motorcycle safety and awareness. |
| | • | | additional funding of $3.7 million over three years is provided to continue and expand the homelessness court. The homelessness court aims to keep homeless people who have committed relatively minor offences out of the legal justice system. |
| | • | | an injection of $20 million will be provided from the State Schools of Tomorrow initiative to maintain and upgrade teacher housing across the State. |
| | • | | funding of up to $320 million over six years is provided for infrastructure for the delivery of universal access to early childhood education. |
38
| | • | | the annual provision for the Workers Assistance Program will be increased from $5 million to $10 million. This program assists workers displaced as a result of large scale retrenchments with the transition to alternative employment. |
| | • | | up to $20 million will be applied to assist apprentices and trainees impacted by the economic downturn to complete their training. Government will work with industry partners on actions including placement in alternative training and employment or temporary pool employment while apprentices and trainees continue technical training. |
| | • | | $25 million will be earmarked from the $100 million allocation to the previously announced Sustainable Resources Communities initiative for employment intensive community infrastructure projects in mining communities. |
| | • | | the Government is progressing with the implementation of its $60 million program to provide solar panels to all schools. This initiative will reduce the State’s ecological footprint and educate our young people about the benefits of solar and other environmentally friendly technology. |
ADJUSTMENTS TO THE CAPITAL PROGRAM
As outlined in Chapter 2, purchases of non-financial assets (i.e. capital purchases) in 2008-09 in the General Government sector are estimated to be $7.094 billion.
The Government remains committed to the delivery of the State’s capital program with all projects currently funded and underway still proceeding. However, the fiscal position and other issues have necessitated some changes to the capital program.
Traveston Crossing Dam
The Government has been advised by the Coordinator General that a series of environmental mitigation measures are required prior to commencing construction of the dam. The recommendations of the Coordinator General are designed to protect vulnerable species and minimise the impact on flora and fauna.
The Government remains committed to the Traveston Crossing Dam project but it is expected that developing and proving the effectiveness of the measures will result in a delay in construction of at least several years, including roadworks around the Dam.
Police Academy
The development of the new $450 million Police Academy at Wacol will be deferred for two years with completion scheduled for 2014.
Cleveland Youth Detention Centre
$170.6 million in capital funding is provided over five years to expand and refurbish the existing Cleveland Youth Detention Centre in Townsville, including provision of an additional 48 beds.
39
Improved Debt Position
The net effect of these changes will mean State debt is estimated to be lower by 2011-12 than forecast at the time of the 2008-09 Budget, as outlined in Chart 3.1.
Chart 3.1
Gross Debt, Non-financial Public Sector 2006-07 to 2011-121
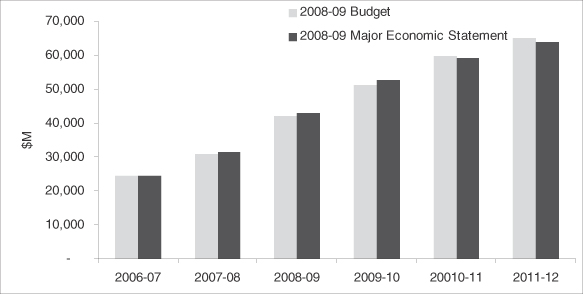
Note:
| 1. | Gross Debt is defined as borrowings, deposits help and advances received. |
GOVERNMENT-OWNED CORPORATION REFORM
The Government has been working with its 15 Government-owned corporations (GOCs) and Forestry Plantations Queensland (FPQ) to improve their efficiency, effectiveness and accountability. The aim has been to provide GOCs with appropriate organisational structures and incentive frameworks to allow them to operate to their full commercial potential.
While GOC reforms in recent years have resulted in steady progress in improving returns to the taxpayer (including to around an average 8% Return on Assets by 2011-12), the Government is committed to further improve these returns to levels akin to those expected by investors in private sector companies.
At the same time, Government expects the GOCs to continue to improve their efficiency and productivity, to ensure their continued strength and sustainability into the future, protecting and growing jobs and bringing greater benefit to the Queensland economy.
Operational efficiencies savings targets
The Government will work with the GOCs to progressively increase their contribution to General Government revenue through dividends and tax equivalent payments to achieve an additional $100 million per annum by 2011-12. This will need to be achieved through the identification of operational efficiencies and productivity measures that would enhance financial performance without detracting from the quality and reliability of customer services. Each GOC Board will be asked to provide shareholding Ministers their proposed implementation plan to contribute to this target.
40
Rate of return targets and investment hurdle rates
In the current financial and economic environment, the Government believes it is commercially prudent for the GOCs to refocus their efforts on achieving commercial returns and increase the minimum hurdle rates of return used in the assessment of new investments, consistent with the re-pricing of risk in financial markets.
Capital expenditure reviews
Each GOC is to review its capital expenditure plan and identify opportunities for optimising capital investments in light of more subdued economic activity, while ensuring the continued delivery of essential infrastructure.
Surplus and non core assets
All GOCs will review their asset holdings and identify surplus, non-performing and non-core assets. These assets will be assessed for their potential to be monetised.
Capital structure reviews
Government is currently reviewing the capital structure of the GOCs to determine the most appropriate debt and equity positions of each GOC. Some GOCs are likely to require significant equity injections in the next five to ten years to meet their financial obligations while retaining an investment grade credit rating (BBB- or better) on a stand-alone basis. The review will ensure the capital structure across the GOC sector is appropriate and will assist in meeting the equity requirements of growing GOCs.
Addressing the challenges facing the GOC Generators
The Government will undertake a shareholder review of the structure and preparedness of the GOC Generators to meet the new challenges facing these businesses particularly in respect of the impending new Carbon Pollution Reduction Scheme and competition from large vertically integrated retailers.
The review will consider the GOC Generators’ position as the dominant provider of electricity, particularly coal-fired base load capacity, in the Queensland market with a view to reducing the share of the aggregate capacity the State owns or operates in Queensland from 65% in 2010 to around 50%. Of the 65% of aggregate capacity owned or operated by the State in 2010, approximately 83% will be coal-fired generation. This is higher than the proportion of total coal-fired generation in the Queensland market, which will be 66% in 2010. The target of 50% will be progressively achieved primarily as a result of new capacity requirements being met by the private sector, expected to consist largely of gas-fired generation.
Consistent with this policy intent, the Government has endorsed a set of high level strategic principles which identify a number of factors the Government considers that the GOC Generators should pay particular attention to. This includes project risks, financial structuring arrangements and the impact of any proposed arrangements from a whole-of-Government portfolio perspective.
Enhancement of current reforms underway
There are a number of other major operational reforms currently underway by the GOCs which could also further improve financial performance and service delivery outcomes. The Government is keen to further pursue these.
QR Regional Freight Reforms
QR’s regional freight business is undergoing reform to arrest its financial losses and to more effectively meet the needs of Queensland’s regional communities. Initial reforms included ARG (a QR subsidiary) assuming above rail responsibility for the Mount Isa line, review of freight services on that line and implementation of a new freight rate schedule.
41
Energex/Ergon Joint Workings
Continuation of the close cooperation between Energex and Ergon is expected to deliver increased annual savings in the areas of asset management, strategic sourcing, procurement and logistics and works management.
Port Review Implementation
The Government recently completed a review of the Queensland port network structure. The new five port corporation structure will enhance the regional control of Queensland’s port operations, providing capacity and leadership. In addition, the new structure will provide flexibility in managing demand and provide for better asset utilisation and profitability. It will also strengthen the future of the ports by enabling them to focus on building growth and exports.
SunWater—Rural Water Price Paths
The Government remains committed to the commercial reform of rural water supply arrangements and will continue the reform process by establishing a pricing policy for the period beyond 30 June 2011 that accommodates these changes. The new pricing policy will maintain a sustainable irrigation industry while optimising the efficient delivery of services. It will seek to ensure a continued reduction in the number of non-viable irrigation schemes and the level of the community service obligation subsidy payments to SunWater necessary to support these schemes.
Forestry Plantations Queensland Corporatisation
The Government will investigate the merits of Forestry Plantations Queensland (FPQ) undergoing a corporate restructure into a GOC. The Government considers that the transition of FPQ to a GOC would enable rationalisation of the corporate structure of the business and provide an opportunity to enhance its commercial operations.
Investigation of transitioning FPQ to a GOC provides an opportunity to consider whether the business can be better positioned to operate on a fully commercial basis and enhance its capacity to meet market expectations.
Implementation and Reporting
The chairs of the GOCs have been advised of the reforms and have been asked to develop, with their boards, a detailed implementation plan for all aspects of the GOCs reform package for consideration by shareholding Ministers with the intent being that the agreed plans would be reflected in the GOCs’ Statements of Corporate Intent and Corporate Plans for 2009-10.
PRIVATE SECTOR PROVISION OF INFRASTRUCTURE
Through the South East Queensland Infrastructure Plan and Program (SEQIPP), Government is committed to a significant social infrastructure delivery program that includes public transport, hospitals, schools, and other community services. Government is committed to delivery of this infrastructure to maintain and improve Queensland’s social wellbeing.
To enable the delivery of this social infrastructure program, Government is pursuing opportunities to encourage private sector investment in, and ownership of, economic infrastructure. Historically, the development of economic infrastructure in sectors such as coal mining, energy production, and road transport has largely been reliant on funding from the State to satisfy capacity expansion requirements. Moving forward, the Queensland Government will be increasingly looking to encourage private sector investment opportunities which deliver, in a timely and efficient manner, infrastructure which satisfies the demand requirements of both existing and future infrastructure users.
42
Wiggins Island Coal Terminal
The global demand for Queensland coal has also created expansion pressures at the Port of Gladstone, necessitating acceleration of the development of the new Wiggins Island Coal Terminal.
Construction of Wiggins Island would see the Port of Gladstone become one of the world’s largest coal export ports. Wiggins Island will initially provide 25 million tonnes per annum (mtpa) of additional port capacity, at a cost of approximately $1.4 billion. However, upon completion of all stages of Wiggins Island in 2021, the combined coal export capacity at the Port of Gladstone would be approximately 140 mtpa.
Given the compressed delivery timetable at Wiggins Island, and the potential for co-location and integration of coal handling operations at the proximately located RG Tanna and Wiggins Island coal terminals, Government has decided that an industry group is likely to be in the best position to manage the timing and magnitude of capacity expansions at Wiggins Island. The industry group comprises a consortium of coal companies acting through an industry owned and financed special purpose vehicle. This model is strongly supported by industry.
Consequently, the Queensland Government has endorsed the industry consortium, Wiggins Island Coal Export Terminal Pty Ltd, as Preferred Proponent and is in the process of developing and agreeing detailed documentation.
Surat Basin Railway
The Surat Basin Railway is potentially a key piece of rail infrastructure that would facilitate development of the significant coal reserves in the Surat Basin by providing a direct rail connection between these coal reserves and the Port of Gladstone. The Surat Basin Railway would connect the existing rail line west of Toowoomba (i.e. the Western line) with the Moura line and the broader Queensland coal network.
A consortium of companies including several large coal miners, Queensland Rail, and Australian Transport and Energy Corridor, are developing a detailed feasibility study for submission to the Queensland Government, following which Government will decide whether the development rights for the railway should be conferred on the consortium. The consortium is working to a program that would result in commencement of railway operations by 2012. This date coincides with the anticipated operational commencement date of Xstrata’s Wandoan coal mine, which will be a key customer for the Surat Basin Railway consortium.
Development of the Surat Basin Railway will generate additional traffic on the existing Moura and Western rail lines, eventually leading to a requirement for capacity upgrades on these sections of the railway.
Australia Trade Coast Precinct road network
Significant population growth in Queensland’s south-east corner is driving accelerated development in the region, particularly within the Australia Trade Coast precinct. Demands on the road network that supports this important industrial and port precinct is increasing, and there is now a requirement to plan for expanding the capacity of these roads, particularly the Gateway, Logan, and Port of Brisbane Motorways, all of which are owned, on behalf of the State, by Queensland Motorways Limited (QML).
Current cost estimates for these expansion projects are:
| | • | | Gateway Motorway North/South Upgrades—$4 billion |
| | • | | Logan Motorway Upgrade—$500 million |
| | • | | Port of Brisbane Motorway duplication—$930 million. |
While current market conditions are unlikely to support a competitive tendering process for such a large investment in road infrastructure at this time, the State will investigate options to facilitate future private sector investment in the delivery of upgrades to these key pieces of road infrastructure.
43
New electricity generation
In addition to new generation capacity already committed in Queensland over the coming years (approximately 1,400 MW), it is anticipated that additional capacity will be required by 2013-14 to meet the forecast demand growth largely associated with recent strong population growth and investment in Queensland. Given this increasing demand, an opportunity exists for the private sector to invest in new generation capacity in Queensland.
Over the last 12-24 months, the private sector has demonstrated a strong commitment to the development of new peak electricity generation plant, the output from which is mostly either tied to a vertically integrated retailer or has already been contracted directly to a retailer operating in the Queensland market.
The State, working with its GOC generators, will investigate private sector involvement in various generation options. These investigations will focus on how private sector investment into new generation may be successfully structured.
North West Queensland Minerals Province
The North West Queensland Minerals Province (NWQMP), centred on the Mount Isa-Cloncurry region, has extensive lead, zinc, silver, copper and gold resources and plays a key part in Queensland’s strong export industry base. The province is highly prospective and exhibits significant growth potential.
The Queensland Government has implemented a number of initiatives to facilitate further expansion of the NWQMP, including active promotion of the region as a desirable exploration destination, and funding of the $49 million ‘Smart Exploration and Smart Mining—Future Prosperity’ programs.
Private investment is also being facilitated through petroleum and geothermal tender requests to identify and develop additional sources of energy in the NWQMP. The Government is also committed to the Northern Economic Triangle (NET) strategy aimed at fostering sustainable economic, social and community growth through the emergence of Mount Isa, Townsville and Bowen as a triangle of mineral processing and industrial development. The North West Energy Forum has also been established to identify the region’s combined long term power needs.
Government recognises the importance of competitively priced energy to the region. Powerlink Queensland’s upgrade of the Central to North Queensland transmission line as part of the three stage upgrade to North Queensland will benefit the region through significantly reduced power loss factors.
In January 2008, IsaLink Pty Ltd announced plans to investigate the construction of a high voltage direct current transmission line to link Mount Isa to the national electricity grid in Central Queensland. The proposed transmission line could double the lifespan of some of the mines in Central Queensland and fuel further growth. IsaLink Pty Ltd will be undertaking a detailed environmental impact assessment.
While it is important to continue to show strong support for and facilitate existing private sector led projects, it is also necessary that Government and industry explore new ways to work together with the aim of seeing greater progress on the energy issue. Therefore, the Government, in concert with the Queensland Resources Council, will undertake a joint Government and Industry review to provide options on how commercial solutions might be structured to address the energy supply issues in the region.
This review will be similar to the successful Goonyella Coal Chain Capacity Review, conducted by Mr Stephen O’Donnell in 2007, where recommendations were made to deliver gains in system capacity, and support longer term planning to maximise the effectiveness of the coal chain from mine to port. Mr Rod Sims, of Port Jackson Partners Limited, has been appointed by the Government and the Queensland Resources Council to conduct the review.
Although the Government will endeavour to facilitate any project, the solution to energy requirements both in the North Queensland and NWQMP regions should be provided by the private sector.
44
REDUCING THE REGULATORY BURDEN ON QUEENSLAND BUSINESS
Ongoing regulatory reform is an important initiative of the Queensland Government. This is now occurring on two main fronts to reduce the regulatory burden on the Queensland business sector and reduce barriers to trade and commerce between Queensland and the rest of the country.
Firstly, the Government has recently agreed to participate with other jurisdictions in a national agenda of business regulation and competition reform through a new COAG agreement.
This ambitious COAG reform agenda will contribute to reducing costs incurred by business in complying with unnecessary and inconsistent regulation across jurisdictions and includes 27 priority areas for reform. Proposed key initiatives include developing a national trade licensing system for a range of economically important trades, a national system for registering business names that will provide a one-stop online shop for businesses to interact with government, and a national Standard Business Reporting system which will save business time and money in streamlining their government reporting obligations.
Secondly, a central plank in the Government’s reform agenda is reducing the existing stock of regulation through a phased program of reviews by all Queensland Government agencies of the regulations they administer to deliver productivity benefits to business, community and government.
To achieve a reduction in the burden of government regulation—especially on the business sector—the Government is committing to an initial target of reducing the compliance burden to business and the administrative burden to government by $150 million per annum by the end of 2012-13. This timeframe aligns with the key implementation dates for the COAG reforms.
45
| 4 | UNIFORM PRESENTATION FRAMEWORK AND LOAN COUNCIL ALLOCATION |
UNIFORM PRESENTATION FRAMEWORK FINANCIAL INFORMATION
Table 9.1
General Government Sector Operating Statement1
| | | | | | | | | | | | | | | | | |
| | | | | 2008-09
Budget2 | | | 2008-09
Revised | | | 2009-10
Projection | | | 2010-11
Projection | | | 2011-12
Projection | |
| | | | | $ million | | | $ million | | | $ million | | | $ million | | | $ million | |
| | Revenue from Transactions | | | | | | | | | | | | | | | |
| | Taxation revenue | | 10,106 | | | 9,222 | | | 10,189 | | | 11,065 | | | 11,854 | |
| | Grants revenue | | 15,687 | | | 16,596 | | | 16,250 | | | 16,553 | | | 17,286 | |
| | Sales of goods and services | | 3,385 | | | 3,405 | | | 3,452 | | | 3,553 | | | 3,626 | |
| | Interest income | | 2,199 | | | 2,073 | | | 2,130 | | | 2,206 | | | 2,282 | |
| | Dividend and income tax equivalent income | | 1,051 | | | 1,170 | | | 1,613 | | | 1,851 | | | 2,570 | |
| | Other revenue | | 4,154 | | | 4,597 | | | 3,713 | | | 3,534 | | | 3,278 | |
| | Total Revenue from Transactions | | 36,582 | | | 37,063 | | | 37,348 | | | 38,762 | | | 40,896 | |
| | | | | | |
Less | | Expenses from Transactions | | | | | | | | | | | | | | | |
| | Employee expenses | | 13,896 | | | 13,997 | | | 15,142 | | | 15,867 | | | 16,802 | |
| | Superannuation expenses | | | | | | | | | | | | | | | |
| | Superannuation interest cost | | 1,219 | | | 1,333 | | | 1,407 | | | 1,477 | | | 1,542 | |
| | Other superannuation expenses | | 1,959 | | | 1,991 | | | 2,015 | | | 2,041 | | | 2,054 | |
| | Other operating expenses | | 6,782 | | | 7,397 | | | 7,207 | | | 7,360 | | | 7,666 | |
| | Depreciation and amortisation | | 2,665 | | | 2,610 | | | 2,701 | | | 2,748 | | | 2,878 | |
| | Other interest expenses | | 539 | | | 564 | | | 802 | | | 1,058 | | | 1,260 | |
| | Grants expenses | | 8,713 | | | 9,117 | | | 8,197 | | | 8,296 | | | 8,603 | |
| | Total Expenses from Transactions | | 35,772 | | | 37,009 | | | 37,472 | | | 38,847 | | | 40,804 | |
| | | | | | |
Equals | | Net Operating Balance | | 809 | | | 54 | | | (124 | ) | | (85 | ) | | 92 | |
| | | | | | |
Plus | | Other economic flows—included in operating result | | 579 | | | 826 | | | 60 | | | 96 | | | 104 | |
| | | | | | |
Equals | | Operating Result | | 1,388 | | | 880 | | | (64 | ) | | 11 | | | 196 | |
| | | | | | |
Plus | | Other economic flows—other movements in equity | | 4,080 | | | 4,328 | | | 3,341 | | | 3,554 | | | 3,931 | |
| | | | | | |
Equals | | Comprehensive Result—Total Change In Net Worth | | 5,468 | | | 5,208 | | | 3,277 | | | 3,565 | | | 4,126 | |
| | | | | | |
| | KEY FISCAL AGGREGATES | | | | | | | | | | | | | | | |
| | Net Operating Balance | | 809 | | | 54 | | | (124 | ) | | (85 | ) | | 92 | |
| | | | | | |
Less | | Net Acquisition of Non-financial Assets | | | | | | | | | | | | | | | |
| | Purchases of non-financial assets | | 6,651 | | | 7,094 | | | 6,903 | | | 5,956 | | | 5,424 | |
| | Less Sales of non-financial assets | | 340 | | | 371 | | | 320 | | | 337 | | | 254 | |
| | Less Depreciation | | 2,665 | | | 2,610 | | | 2,701 | | | 2,748 | | | 2,878 | |
| | Plus Change in inventories | | 97 | | | 53 | | | 77 | | | 27 | | | 54 | |
| | Plus Other movements in non-financial assets | | 200 | | | 48 | | | 50 | | | 50 | | | 50 | |
| | Equals Total Net Acquisition of Non-financial Assets | | 3,944 | | | 4,214 | | | 4,009 | | | 2,949 | | | 2,396 | |
| | | | | | |
Equals | | Net Lending / (Borrowing) | | (3,134 | ) | | (4,161 | ) | | (4,133 | ) | | (3,033 | ) | | (2,305 | ) |
Notes:
| 1. | Numbers may not add due to rounding. |
| 2. | Numbers have been restated where subsequent changes in classification have occurred. |
46
Table 9.2
Public Non-financial Corporations Sector Operating Statement1
| | | | | | | | | | | | | | | | | |
| | | | | 2008-09
Budget2 | | | 2008-09
Revised | | | 2009-10
Projection | | | 2010-11
Projection | | | 2011-12
Projection | |
| | | | | $ million | | | $ million | | | $ million | | | $ million | | | $ million | |
| | Revenue from Transactions | | | | | | | | | | | | | | | |
| | Grants revenue | | 1,905 | | | 1,970 | | | 1,555 | | | 1,767 | | | 1,805 | |
| | Sales of goods and services | | 8,308 | | | 8,602 | | | 9,405 | | | 10,360 | | | 11,730 | |
| | Interest income | | 96 | | | 97 | | | 87 | | | 89 | | | 86 | |
| | Dividend and income tax equivalent income | | — | | | 3 | | | — | | | — | | | — | |
| | Other revenue | | 251 | | | 349 | | | 581 | | | 430 | | | 382 | |
| | Total Revenue from Transactions | | 10,561 | | | 11,021 | | | 11,627 | | | 12,645 | | | 14,004 | |
| | | | | | |
Less | | Expenses from Transactions | | | | | | | | | | | | | | | |
| | Employee expenses | | 2,569 | | | 2,373 | | | 2,480 | | | 2,629 | | | 2,826 | |
| | Superannuation expenses | | | | | | | | | | | | | | | |
| | Other superannuation expenses | | 70 | | | 71 | | | 91 | | | 97 | | | 103 | |
| | Other operating expenses | | 3,088 | | | 3,858 | | | 3,394 | | | 3,279 | | | 3,303 | |
| | Depreciation and amortisation | | 1,897 | | | 1,871 | | | 2,131 | | | 2,367 | | | 2,644 | |
| | Other interest expenses | | 2,136 | | | 1,959 | | | 2,428 | | | 2,905 | | | 3,080 | |
| | Grants expenses | | 3 | | | 6 | | | 7 | | | 7 | | | 7 | |
| | Other property expenses | | 194 | | | 260 | | | 459 | | | 521 | | | 690 | |
| | Total Expenses from Transactions | | 9,956 | | | 10,399 | | | 10,989 | | | 11,806 | | | 12,655 | |
| | | | | | |
Equals | | Net Operating Balance | | 604 | | | 622 | | | 638 | | | 840 | | | 1,349 | |
| | | | | | |
Plus | | Other economic flows—included in operating result | | 429 | | | 554 | | | (27 | ) | | (44 | ) | | (29 | ) |
| | | | | | |
Equals | | Operating Result | | 1,034 | | | 1,175 | | | 611 | | | 795 | | | 1,320 | |
| | | | | | |
Plus | | Other economic flows—other movements in equity | | (365 | ) | | (330 | ) | | 54 | | | (251 | ) | | (341 | ) |
| | | | | | |
Equals | | Comprehensive Result—Total Change In Net Worth | | 668 | | | 846 | | | 665 | | | 545 | | | 980 | |
| | | | | | |
| | KEY FISCAL AGGREGATES | | | | | | | | | | | | | | | |
| | Net Operating Balance | | 604 | | | 622 | | | 638 | | | 840 | | | 1,349 | |
| | | | | | |
Less | | Net Acquisition of Non-financial Assets | | | | | | | | | | | | | | | |
| | Purchases of non-financial assets | | 9,985 | | | 10,001 | | | 7,779 | | | 5,891 | | | 5,152 | |
| | Less Sales of non-financial assets | | 92 | | | 149 | | | 96 | | | 55 | | | 261 | |
| | Less Depreciation | | 1,897 | | | 1,871 | | | 2,131 | | | 2,367 | | | 2,644 | |
| | Plus Change in inventories | | 24 | | | 17 | | | (30 | ) | | 44 | | | (50 | ) |
| | Plus Other movements in non-financial assets | | 23 | | | 23 | | | 26 | | | 28 | | | 31 | |
| | Equals Total Net Acquisition of Non-financial Assets | | 8,045 | | | 8,021 | | | 5,548 | | | 3,542 | | | 2,226 | |
| | | | | | |
Equals | | Net Lending / (Borrowing) | | (7,441 | ) | | (7,399 | ) | | (4,910 | ) | | (2,702 | ) | | (877 | ) |
Notes:
| 1. | Numbers may not add due to rounding. |
| 2. | Numbers have been restated where subsequent changes in classification have occurred. |
47
Table 9.3
Non-financial Public Sector Operating Statement1
| | | | | | | | | | | | | | | | | |
| | | | | 2008-09
Budget2 | | | 2008-09
Revised | | | 2009-10
Projection | | | 2010-11
Projection | | | 2011-12
Projection | |
| | | | | $ million | | | $ million | | | $ million | | | $ million | | | $ million | |
| | Revenue from Transactions | | | | | | | | | | | | | | | |
| | Taxation revenue | | 9,921 | | | 9,036 | | | 9,963 | | | 10,732 | | | 11,486 | |
| | Grants revenue | | 15,755 | | | 16,678 | | | 16,316 | | | 16,624 | | | 17,357 | |
| | Sales of goods and services | | 11,494 | | | 11,808 | | | 12,650 | | | 13,694 | | | 15,137 | |
| | Interest income | | 2,295 | | | 2,170 | | | 2,217 | | | 2,294 | | | 2,368 | |
| | Dividend and income tax equivalent income | | 28 | | | 28 | | | 31 | | | 41 | | | 257 | |
| | Other revenue | | 4,398 | | | 4,939 | | | 4,287 | | | 3,957 | | | 3,653 | |
| | Total Revenue from Transactions | | 43,890 | | | 44,659 | | | 45,464 | | | 47,342 | | | 50,258 | |
| | | | | | |
Less | | Expenses from Transactions | | | | | | | | | | | | | | | |
| | Employee expenses | | 16,373 | | | 16,290 | | | 17,518 | | | 18,384 | | | 19,511 | |
| | Superannuation expenses | | | | | | | | | | | | | | | |
| | Superannuation interest cost | | 1,219 | | | 1,333 | | | 1,407 | | | 1,477 | | | 1,542 | |
| | Other superannuation expenses | | 2,029 | | | 2,062 | | | 2,106 | | | 2,139 | | | 2,157 | |
| | Other operating expenses | | 9,658 | | | 11,031 | | | 10,367 | | | 10,392 | | | 10,719 | |
| | Depreciation and amortisation | | 4,561 | | | 4,481 | | | 4,832 | | | 5,114 | | | 5,522 | |
| | Other interest expenses | | 2,579 | | | 2,428 | | | 3,122 | | | 3,755 | | | 4,104 | |
| | Grants expenses | | 6,889 | | | 7,247 | | | 6,725 | | | 6,619 | | | 6,889 | |
| | Total Expenses from Transactions | | 43,307 | | | 44,872 | | | 46,078 | | | 47,880 | | | 50,444 | |
| | | | | | |
Equals | | Net Operating Balance | | 583 | | | (213 | ) | | (613 | ) | | (538 | ) | | (186 | ) |
| | | | | | |
Plus | | Other economic flows—included in operating result | | 625 | | | 732 | | | 33 | | | 51 | | | 75 | |
| | | | | | |
Equals | | Operating Result | | 1,207 | | | 519 | | | (580 | ) | | (487 | ) | | (111 | ) |
| | | | | | |
Plus | | Other economic flows—other movements in equity | | 4,261 | | | 4,689 | | | 3,858 | | | 4,052 | | | 4,238 | |
| | | | | | |
Equals | | Comprehensive Result—Total Change In Net Worth | | 5,469 | | | 5,208 | | | 3,277 | | | 3,565 | | | 4,126 | |
| | | | | | |
| | KEY FISCAL AGGREGATES | | | | | | | | | | | | | | | |
| | Net Operating Balance | | 583 | | | (213 | ) | | (613 | ) | | (538 | ) | | (186 | ) |
| | | | | | |
Less | | Net Acquisition of Non-financial Assets | | | | | | | | | | | | | | | |
| | Purchases of non-financial assets | | 16,637 | | | 17,095 | | | 14,681 | | | 11,848 | | | 10,576 | |
| | Less Sales of non-financial assets | | 432 | | | 519 | | | 415 | | | 393 | | | 516 | |
| | Less Depreciation | | 4,561 | | | 4,481 | | | 4,832 | | | 5,114 | | | 5,522 | |
| | Plus Change in inventories | | 121 | | | 69 | | | 47 | | | 72 | | | 4 | |
| | Plus Other movements in non-financial assets | | 224 | | | 71 | | | 76 | | | 78 | | | 81 | |
| | Equals Total Net Acquisition of Non-financial Assets | | 11,989 | | | 12,235 | | | 9,557 | | | 6,490 | | | 4,623 | |
| | | | | | |
Equals | | Net Lending / (Borrowing) | | (11,406 | ) | | (12,448 | ) | | (10,170 | ) | | (7,029 | ) | | (4,809 | ) |
Notes:
| 1. | Numbers may not add due to rounding. |
| 2. | Numbers have been restated where subsequent changes in classification have occurred. |
48
Table 9.4
General Government Sector Balance Sheet1
| | | | | | | | | | | | | | | |
| | | 2008-09
Budget2 | | | 2008-09
Revised | | | 2009-10
Projection | | | 2010-11
Projection | | | 2011-12
Projection | |
| | | $ million | | | $ million | | | $ million | | | $ million | | | $ million | |
Assets | | | | | | | | | | | | | | | |
Financial Assets | | | | | | | | | | | | | | | |
Cash and deposits | | 2,204 | | | 2,062 | | | 1,888 | | | 1,615 | | | 1,291 | |
Advances paid | | 816 | | | 619 | | | 697 | | | 760 | | | 798 | |
Investments, loans and placements | | 28,218 | | | 26,999 | | | 28,227 | | | 29,624 | | | 31,003 | |
Receivables | | 2,864 | | | 3,357 | | | 3,717 | | | 3,804 | | | 4,248 | |
Equity | | | | | | | | | | | | | | | |
Investments in other public sector entities | | 20,669 | | | 22,364 | | | 23,029 | | | 23,573 | | | 24,553 | |
Investments—other | | 39 | | | 39 | | | 39 | | | 39 | | | 39 | |
Total Financial Assets | | 54,811 | | | 55,439 | | | 57,596 | | | 59,415 | | | 61,932 | |
| | | | | |
Non-financial Assets | | | | | | | | | | | | | | | |
Land and other fixed assets | | 107,569 | | | 141,659 | | | 148,585 | | | 154,532 | | | 159,961 | |
Other non-financial assets | | 5,829 | | | 6,160 | | | 6,633 | | | 7,341 | | | 8,235 | |
Total Non-financial Assets | | 113,399 | | | 147,819 | | | 155,218 | | | 161,873 | | | 168,196 | |
| | | | | |
Total Assets | | 168,209 | | | 203,258 | | | 212,814 | | | 221,288 | | | 230,128 | |
| | | | | |
Liabilities | | | | | | | | | | | | | | | |
Advances received | | 530 | | | 505 | | | 493 | | | 470 | | | 456 | |
Borrowing | | 8,781 | | | 9,859 | | | 14,851 | | | 18,364 | | | 21,670 | |
Superannuation liability | | 21,874 | | | 23,147 | | | 24,297 | | | 25,372 | | | 26,356 | |
Other employee benefits | | 3,665 | | | 4,047 | | | 4,134 | | | 4,337 | | | 4,540 | |
Payables | | 2,388 | | | 2,377 | | | 2,437 | | | 2,498 | | | 2,576 | |
Other liabilities | | 2,408 | | | 2,937 | | | 2,938 | | | 3,019 | | | 3,175 | |
Total Liabilities | | 39,646 | | | 42,872 | | | 49,151 | | | 54,060 | | | 58,773 | |
| | | | | |
Net Worth | | 128,563 | | | 160,386 | | | 163,664 | | | 167,229 | | | 171,355 | |
Net Financial Worth | | 15,164 | | | 12,567 | | | 8,446 | | | 5,355 | | | 3,159 | |
Net Financial Liabilities | | 5,504 | | | 9,797 | | | 14,583 | | | 18,218 | | | 21,394 | |
Net Debt | | (21,928 | ) | | (19,316 | ) | | (15,467 | ) | | (13,165 | ) | | (10,965 | ) |
Notes:
| 1. | Numbers may not add due to rounding. |
| 2. | Numbers have been restated where subsequent changes in classification have occurred. |
49
Table 9.5
Public Non-financial Corporations Sector Balance Sheet1
| | | | | | | | | | | | | | | |
| | | 2008-09
Budget2 | | | 2008-09
Revised | | | 2009-10
Projection | | | 2010-11
Projection | | | 2011-12
Projection | |
| | | $ million | | | $ million | | | $ million | | | $ million | | | $ million | |
Assets | | | | | | | | | | | | | | | |
Financial Assets | | | | | | | | | | | | | | | |
Cash and deposits | | 1,461 | | | 1,215 | | | 1,104 | | | 984 | | | 1,204 | |
Advances paid | | 253 | | | 309 | | | 282 | | | 259 | | | 233 | |
Investments, loans and placements | | 321 | | | 450 | | | 448 | | | 455 | | | 462 | |
Receivables | | 1,547 | | | 1,711 | | | 1,802 | | | 1,824 | | | 1,850 | |
Equity | | | | | | | | | | | | | | | |
Investments—other | | 80 | | | 78 | | | 90 | | | 96 | | | 102 | |
Total Financial Assets | | 3,662 | | | 3,763 | | | 3,727 | | | 3,618 | | | 3,851 | |
| | | | | |
Non-financial Assets | | | | | | | | | | | | | | | |
Land and other fixed assets | | 55,707 | | | 58,154 | | | 64,194 | | | 68,509 | | | 71,714 | |
Other non-financial assets | | 2,087 | | | 2,252 | | | 2,303 | | | 2,316 | | | 2,409 | |
Total Non-financial Assets | | 57,794 | | | 60,406 | | | 66,497 | | | 70,825 | | | 74,122 | |
| | | | | |
Total Assets | | 61,456 | | | 64,169 | | | 70,224 | | | 74,443 | | | 77,973 | |
| | | | | |
Liabilities | | | | | | | | | | | | | | | |
Deposits held | | 58 | | | 21 | | | 21 | | | 21 | | | 21 | |
Borrowing | | 32,823 | | | 32,630 | | | 37,367 | | | 40,346 | | | 41,588 | |
Superannuation liability | | (278 | ) | | (54 | ) | | (54 | ) | | (54 | ) | | (54 | ) |
Other employee benefits | | 729 | | | 788 | | | 798 | | | 811 | | | 824 | |
Payables | | 2,234 | | | 2,596 | | | 2,776 | | | 2,757 | | | 3,153 | |
Other liabilities | | 7,082 | | | 7,354 | | | 7,817 | | | 8,518 | | | 9,417 | |
Total Liabilities | | 42,649 | | | 43,335 | | | 48,726 | | | 52,400 | | | 54,951 | |
| | | | | |
Net Worth | | 18,807 | | | 20,834 | | | 21,498 | | | 22,043 | | | 23,023 | |
Net Financial Worth | | (38,987 | ) | | (39,572 | ) | | (44,999 | ) | | (48,782 | ) | | (51,100 | ) |
Net Debt | | 30,847 | | | 30,677 | | | 35,554 | | | 38,669 | | | 39,711 | |
Notes:
| 1. | Numbers may not add due to rounding. |
| 2. | Numbers have been restated where subsequent changes in classification have occurred. |
50
Table 9.6
Non-financial Public Sector Balance Sheet1
| | | | | | | | | | | | | | | |
| | | 2008-09
Budget2 | | | 2008-09
Revised | | | 2009-10
Projection | | | 2010-11
Projection | | | 2011-12
Projection | |
| | | $ million | | | $ million | | | $ million | | | $ million | | | $ million | |
Assets | | | | | | | | | | | | | | | |
Financial Assets | | | | | | | | | | | | | | | |
Cash and deposits | | 3,665 | | | 3,277 | | | 2,992 | | | 2,599 | | | 2,495 | |
Advances paid | | 1,051 | | | 912 | | | 963 | | | 1,003 | | | 1,015 | |
Investments, loans and placements | | 28,539 | | | 27,449 | | | 28,676 | | | 30,078 | | | 31,464 | |
Receivables | | 3,260 | | | 3,864 | | | 4,014 | | | 4,075 | | | 4,145 | |
Equity | | | | | | | | | | | | | | | |
Investments in other public sector entities | | 1,896 | | | 1,564 | | | 1,564 | | | 1,564 | | | 1,564 | |
Investments—other | | 119 | | | 116 | | | 129 | | | 135 | | | 141 | |
Total Financial Assets | | 38,532 | | | 37,183 | | | 38,338 | | | 39,455 | | | 40,824 | |
| | | | | |
Non-financial Assets | | | | | | | | | | | | | | | |
Land and other fixed assets | | 163,242 | | | 199,778 | | | 212,744 | | | 223,007 | | | 231,640 | |
Other non-financial assets | | 1,275 | | | 1,276 | | | 1,402 | | | 1,375 | | | 1,357 | |
Total Non-financial Assets | | 164,517 | | | 201,054 | | | 214,146 | | | 224,382 | | | 232,997 | |
| | | | | |
Total Assets | | 203,049 | | | 238,237 | | | 252,485 | | | 263,837 | | | 273,822 | |
| | | | | |
Liabilities | | | | | | | | | | | | | | | |
Deposits held | | 58 | | | 25 | | | 25 | | | 25 | | | 25 | |
Advances received | | 530 | | | 501 | | | 489 | | | 466 | | | 452 | |
Borrowing | | 41,587 | | | 42,473 | | | 52,203 | | | 58,694 | | | 63,242 | |
Superannuation liability | | 21,595 | | | 23,094 | | | 24,244 | | | 25,318 | | | 26,303 | |
Other employee benefits | | 4,394 | | | 4,835 | | | 4,932 | | | 5,148 | | | 5,364 | |
Payables | | 3,486 | | | 3,787 | | | 3,725 | | | 3,719 | | | 3,792 | |
Other liabilities | | 2,836 | | | 3,137 | | | 3,203 | | | 3,237 | | | 3,287 | |
Total Liabilities | | 74,486 | | | 77,851 | | | 88,821 | | | 96,608 | | | 102,466 | |
| | | | | |
Net Worth | | 128,563 | | | 160,386 | | | 163,664 | | | 167,229 | | | 171,355 | |
Net Financial Worth | | (35,954 | ) | | (40,668 | ) | | (50,483 | ) | | (57,153 | ) | | (61,642 | ) |
Net Financial Liabilities | | 37,850 | | | 42,233 | | | 52,047 | | | 58,717 | | | 63,206 | |
Net Debt | | 8,919 | | | 11,361 | | | 20,086 | | | 25,505 | | | 28,746 | |
Notes:
| 1. | Numbers may not add due to rounding. |
| 2. | Numbers have been restated where subsequent changes in classification have occurred. |
51
Table 9.7
General Government Sector Cash Flow Statement1
| | | | | | | | | | | | | | | |
| | | 2008-09
Budget2 | | | 2008-09
Revised | | | 2009-10
Projection | | | 2010-11
Projection | | | 2011-12
Projection | |
| | | $ million | | | $ million | | | $ million | | | $ million | | | $ million | |
Cash Receipts from Operating Activities | | | | | | | | | | | | | | | |
Taxes received | | 10,105 | | | 9,221 | | | 10,188 | | | 11,064 | | | 11,853 | |
Grants and subsidies received | | 15,526 | | | 16,394 | | | 16,257 | | | 16,560 | | | 17,292 | |
Sales of goods and services | | 3,749 | | | 3,833 | | | 3,808 | | | 3,899 | | | 3,973 | |
Interest receipts | | 2,197 | | | 2,072 | | | 2,128 | | | 2,185 | | | 2,260 | |
Dividends and income tax equivalents | | 1,012 | | | 1,180 | | | 1,153 | | | 1,466 | | | 1,752 | |
Other receipts | | 4,707 | | | 5,033 | | | 4,226 | | | 4,072 | | | 3,825 | |
Total Operating Receipts | | 37,297 | | | 37,734 | | | 37,760 | | | 39,246 | | | 40,954 | |
| | | | | |
Cash Payments for Operating Activities | | | | | | | | | | | | | | | |
Payments for employees | | (15,674 | ) | | (15,651 | ) | | (17,148 | ) | | (17,871 | ) | | (18,969 | ) |
Payments for goods and services | | (7,246 | ) | | (7,807 | ) | | (7,632 | ) | | (7,725 | ) | | (8,046 | ) |
Grants and subsidies | | (8,757 | ) | | (9,157 | ) | | (8,193 | ) | | (8,294 | ) | | (8,601 | ) |
Interest paid | | (540 | ) | | (561 | ) | | (801 | ) | | (1,058 | ) | | (1,259 | ) |
Other payments | | (739 | ) | | (847 | ) | | (689 | ) | | (687 | ) | | (692 | ) |
Total Operating Payments | | (32,955 | ) | | (34,024 | ) | | (34,463 | ) | | (35,635 | ) | | (37,567 | ) |
| | | | | |
Net Cash Inflows from Operating Activities | | 4,341 | | | 3,710 | | | 3,297 | | | 3,612 | | | 3,388 | |
| | | | | |
Cash Flows from Investments in Non-Financial Assets | | | | | | | | | | | | | | | |
Purchases of non-financial assets | | (6,651 | ) | | (7,094 | ) | | (6,903 | ) | | (5,956 | ) | | (5,424 | ) |
Sales of non-financial assets | | 340 | | | 371 | | | 320 | | | 337 | | | 254 | |
Net Cash Flows from Investments in Non-financial Assets | | (6,311 | ) | | (6,723 | ) | | (6,583 | ) | | (5,619 | ) | | (5,170 | ) |
| | | | | |
Net Cash Flows from Investments in Financial Assets for Policy Purposes | | (389 | ) | | (313 | ) | | (659 | ) | | (416 | ) | | (553 | ) |
| | | | | |
Net Cash Flows from Investments in Financial Assets for Liquidity Purposes | | (1,086 | ) | | (1,149 | ) | | (1,136 | ) | | (1,297 | ) | | (1,268 | ) |
| | | | | |
Receipts from Financing Activities | | | | | | | | | | | | | | | |
Advances received (net) | | (18 | ) | | (4 | ) | | (14 | ) | | (26 | ) | | (17 | ) |
Borrowing (net) | | 2,915 | | | 3,424 | | | 4,920 | | | 3,473 | | | 3,295 | |
Other financing (net) | | — | | | (1 | ) | | — | | | — | | | — | |
Net Cash Flows from Financing Activities | | 2,897 | | | 3,419 | | | 4,906 | | | 3,447 | | | 3,279 | |
| | | | | |
Net Increase/(Decrease) in Cash held | | (548 | ) | | (1,056 | ) | | (174 | ) | | (274 | ) | | (324 | ) |
| | | | | |
Net cash from operating activities | | 4,341 | | | 3,710 | | | 3,297 | | | 3,612 | | | 3,388 | |
Net cash flows from investments in non-financial assets | | (6,311 | ) | | (6,723 | ) | | (6,583 | ) | | (5,619 | ) | | (5,170 | ) |
Surplus/(Deficit) | | (1,970 | ) | | (3,013 | ) | | (3,286 | ) | | (2,007 | ) | | (1,782 | ) |
| | | | | |
Derivation of ABS GFS Cash Surplus/Deficit | | | | | | | | | | | | | | | |
Cash surplus/(deficit) | | (1,970 | ) | | (3,013 | ) | | (3,286 | ) | | (2,007 | ) | | (1,782 | ) |
Acquisitions under finance leases and similar arrangements | | (152 | ) | | — | | | — | | | — | | | — | |
ABS GFS Cash Surplus/(Deficit) Including Finance Leases and Similar Arrangements | | (2,122 | ) | | (3,013 | ) | | (3,286 | ) | | (2,007 | ) | | (1,782 | ) |
Notes:
| 1. | Numbers may not add due to rounding. |
| 2. | Numbers have been restated where subsequent changes in classification have occurred. |
52
Table 9.8
Public Non-financial Corporations Sector Cash Flow Statement1
| | | | | | | | | | | | | | | |
| | | 2008-09
Budget2 | | | 2008-09
Revised | | | 2009-10
Projection | | | 2010-11
Projection | | | 2011-12
Projection | |
| | | $ million | | | $ million | | | $ million | | | $ million | | | $ million | |
Cash Receipts from Operating Activities | | | | | | | | | | | | | | | |
Grants and subsidies received | | 1,904 | | | 1,963 | | | 1,555 | | | 1,766 | | | 1,805 | |
Sales of goods and services | | 8,647 | | | 9,138 | | | 9,997 | | | 11,165 | | | 12,443 | |
Interest receipts | | 93 | | | 95 | | | 84 | | | 86 | | | 83 | |
Dividends and income tax equivalents | | — | | | 3 | | | — | | | — | | | — | |
Other receipts | | 702 | | | 934 | | | 1,148 | | | 1,030 | | | 1,026 | |
Total Operating Receipts | | 11,346 | | | 12,134 | | | 12,784 | | | 14,046 | | | 15,357 | |
| | | | | |
Cash Payments for Operating Activities | | | | | | | | | | | | | | | |
Payments for employees | | (2,625 | ) | | (2,417 | ) | | (2,561 | ) | | (2,714 | ) | | (2,916 | ) |
Payments for goods and services | | (3,944 | ) | | (4,856 | ) | | (3,980 | ) | | (3,886 | ) | | (3,740 | ) |
Grants and subsidies | | — | | | (4 | ) | | (4 | ) | | (4 | ) | | (4 | ) |
Interest paid | | (1,759 | ) | | (1,679 | ) | | (2,269 | ) | | (2,789 | ) | | (3,041 | ) |
Other payments | | (731 | ) | | (973 | ) | | (1,042 | ) | | (1,151 | ) | | (1,094 | ) |
Total Operating Payments | | (9,059 | ) | | (9,928 | ) | | (9,855 | ) | | (10,543 | ) | | (10,795 | ) |
| | | | | |
Net Cash Inflows from Operating Activities | | 2,286 | | | 2,206 | | | 2,929 | | | 3,503 | | | 4,561 | |
| | | | | |
Cash Flows from Investments in Non-Financial Assets | | | | | | | | | | | | | | | |
Purchases of non-financial assets | | (9,985 | ) | | (10,001 | ) | | (7,779 | ) | | (5,891 | ) | | (5,152 | ) |
Sales of non-financial assets | | 92 | | | 149 | | | 96 | | | 55 | | | 261 | |
Net Cash Flows from Investments in Non-financial Assets | | (9,894 | ) | | (9,852 | ) | | (7,683 | ) | | (5,836 | ) | | (4,890 | ) |
| | | | | |
Net Cash Flows from Investments in Financial Assets for Policy Purposes | | (324 | ) | | (523 | ) | | 180 | | | — | | | (6 | ) |
| | | | | |
Net Cash Flows from Investments in Financial Assets for Liquidity Purposes | | — | | | (28 | ) | | (29 | ) | | (20 | ) | | (19 | ) |
| | | | | |
Receipts from Financing Activities | | | | | | | | | | | | | | | |
Borrowing (net) | | 8,007 | | | 8,214 | | | 4,706 | | | 2,943 | | | 1,313 | |
Dividends paid | | (861 | ) | | (923 | ) | | (863 | ) | | (1,127 | ) | | (1,293 | ) |
Deposits received (net) | | 1 | | | 21 | | | — | | | — | | | — | |
Other financing (net) | | 388 | | | 188 | | | 649 | | | 417 | | | 554 | |
Net Cash Flows from Financing Activities | | 7,535 | | | 7,501 | | | 4,492 | | | 2,233 | | | 574 | |
| | | | | |
Net Increase/(Decrease) in Cash held | | (396 | ) | | (697 | ) | | (111 | ) | | (120 | ) | | 220 | |
| | | | | |
Net cash from operating activities | | 2,286 | | | 2,206 | | | 2,929 | | | 3,503 | | | 4,561 | |
Net cash flows from investments in non-financial assets | | (9,894 | ) | | (9,852 | ) | | (7,683 | ) | | (5,836 | ) | | (4,890 | ) |
Dividends paid | | (861 | ) | | (923 | ) | | (863 | ) | | (1,127 | ) | | (1,293 | ) |
Surplus/(Deficit) | | (8,468 | ) | | (8,569 | ) | | (5,617 | ) | | (3,460 | ) | | (1,622 | ) |
| | | | | |
Derivation of ABS GFS Cash Surplus/Deficit | | | | | | | | | | | | | | | |
Cash surplus/(deficit) | | (8,468 | ) | | (8,569 | ) | | (5,617 | ) | | (3,460 | ) | | (1,622 | ) |
ABS GFS Cash Surplus/(Deficit) Including Finance Leases and Similar Arrangements | | (8,468 | ) | | (8,569 | ) | | (5,617 | ) | | (3,460 | ) | | (1,622 | ) |
Notes:
| 1. | Numbers may not add due to rounding. |
| 2. | Numbers have been restated where subsequent changes in classification have occurred. |
53
Table 9.9
Non-financial Public Sector Cash Flow Statement1
| | | | | | | | | | | | | | | |
| | | 2008-09
Budget2 | | | 2008-09
Revised | | | 2009-10
Projection | | | 2010-11
Projection | | | 2011-12
Projection | |
| | | $ million | | | $ million | | | $ million | | | $ million | | | $ million | |
Cash Receipts from Operating Activities | | | | | | | | | | | | | | | |
Taxes received | | 9,920 | | | 9,035 | | | 9,962 | | | 10,731 | | | 11,484 | |
Grants and subsidies received | | 15,592 | | | 16,470 | | | 16,322 | | | 16,629 | | | 17,363 | |
Sales of goods and services | | 12,197 | | | 12,772 | | | 13,599 | | | 14,846 | | | 16,196 | |
Interest receipts | | 2,290 | | | 2,167 | | | 2,212 | | | 2,271 | | | 2,343 | |
Dividends and income tax equivalents | | 20 | | | 20 | | | 25 | | | 30 | | | 241 | |
Other receipts | | 5,402 | | | 5,960 | | | 5,367 | | | 5,095 | | | 4,844 | |
Total Operating Receipts | | 45,421 | | | 46,424 | | | 47,487 | | | 49,602 | | | 52,471 | |
| | | | | |
Cash Payments for Operating Activities | | | | | | | | | | | | | | | |
Payments for employees | | (18,207 | ) | | (17,989 | ) | | (19,605 | ) | | (20,473 | ) | | (21,768 | ) |
Payments for goods and services | | (11,003 | ) | | (12,474 | ) | | (11,413 | ) | | (11,401 | ) | | (11,575 | ) |
Grants and subsidies | | (6,930 | ) | | (7,284 | ) | | (6,719 | ) | | (6,614 | ) | | (6,884 | ) |
Interest paid | | (2,203 | ) | | (2,145 | ) | | (2,962 | ) | | (3,639 | ) | | (4,064 | ) |
Other payments | | (1,311 | ) | | (1,539 | ) | | (1,427 | ) | | (1,489 | ) | | (1,526 | ) |
Total Operating Payments | | (39,654 | ) | | (41,431 | ) | | (42,126 | ) | | (43,615 | ) | | (45,816 | ) |
| | | | | |
Net Cash Inflows from Operating Activities | | 5,767 | | | 4,993 | | | 5,361 | | | 5,987 | | | 6,655 | |
| | | | | |
Cash Flows from Investments in Non-Financial Assets | | | | | | | | | | | | | | | |
Purchases of non-financial assets | | (16,637 | ) | | (17,095 | ) | | (14,681 | ) | | (11,848 | ) | | (10,576 | ) |
Sales of non-financial assets | | 432 | | | 519 | | | 415 | | | 393 | | | 516 | |
Net Cash Flows from Investments in Non-financial Assets | | (16,205 | ) | | (16,576 | ) | | (14,266 | ) | | (11,455 | ) | | (10,060 | ) |
| | | | | |
Net Cash Flows from Investments in Financial Assets for Policy Purposes | | (324 | ) | | (523 | ) | | 180 | �� | | — | | | (6 | ) |
| | | | | |
Net Cash Flows from Investments in Financial Assets for Liquidity Purposes | | (1,085 | ) | | (1,177 | ) | | (1,164 | ) | | (1,317 | ) | | (1,287 | ) |
| | | | | |
Receipts from Financing Activities | | | | | | | | | | | | | | | |
Advances received (net) | | (18 | ) | | (4 | ) | | (14 | ) | | (26 | ) | | (17 | ) |
Borrowing (net) | | 10,922 | | | 11,638 | | | 9,626 | | | 6,416 | | | 4,609 | |
Deposits received (net) | | 1 | | | 21 | | | — | | | — | | | — | |
Other financing (net) | | (1 | ) | | (125 | ) | | (9 | ) | | 1 | | | 1 | |
Net Cash Flows from Financing Activities | | 10,904 | | | 11,530 | | | 9,603 | | | 6,391 | | | 4,593 | |
| | | | | |
Net Increase/(Decrease) in Cash held | | (943 | ) | | (1,753 | ) | | (286 | ) | | (395 | ) | | (106 | ) |
| | | | | |
Net cash from operating activities | | 5,767 | | | 4,993 | | | 5,361 | | | 5,987 | | | 6,655 | |
Net cash flows from investments in non-financial assets | | (16,205 | ) | | (16,576 | ) | | (14,266 | ) | | (11,455 | ) | | (10,060 | ) |
Surplus/(Deficit) | | (10,438 | ) | | (11,582 | ) | | (8,904 | ) | | (5,468 | ) | | (3,405 | ) |
| | | | | |
Derivation of ABS GFS Cash Surplus/Deficit | | | | | | | | | | | | | | | |
Cash surplus/(deficit) | | (10,438 | ) | | (11,582 | ) | | (8,904 | ) | | (5,468 | ) | | (3,405 | ) |
Acquisitions under finance leases and similar arrangements | | (152 | ) | | — | | | — | | | — | | | — | |
ABS GFS Cash Surplus/(Deficit) Including Finance Leases and Similar Arrangements | | (10,590 | ) | | (11,582 | ) | | (8,904 | ) | | (5,468 | ) | | (3,405 | ) |
Notes:
| 1. | Numbers may not add due to rounding. |
| 2. | Numbers have been restated where subsequent changes in classification have occurred. |
54
LOAN COUNCIL ALLOCATION
Loan Council Allocation1
| | | | | | | | |
| | | | | 2008-09
Budget | | | 2008-09
Revised | |
| | | | | $ million | | | $ million | |
| | General Government sector cash deficit/(surplus)2 | | 1,970 | | | 3,013 | |
| | PNFC sector cash deficit/(surplus)2 | | 8,468 | | | 8,569 | |
| | | |
| | Non Financial Public Sector cash deficit/(surplus)2 | | 10,438 | | | 11,582 | |
| | Acquisitions under finance leases and similar arrangements3 | | (152 | ) | | — | |
| | | |
Equals | | ABS GFS cash deficit/(surplus) | | 10,590 | | | 11,582 | |
Less | | Net cash flows from investments in financial assets for policy purposes | | (324 | ) | | (523 | ) |
Plus | | Memorandum Items4 | | 506 | | | 186 | |
| | | |
| | Loan Council Allocation | | 11,420 | | | 12,291 | |
Notes:
| 1. | Numbers may not add due to rounding. |
| 2. | Figures in brackets represent surpluses. |
| 3. | Finance leases are shown with a negative sign as they are deducted in compiling the ABS GFS cash deficit/surplus. |
| 4. | Memorandum items include operating leases and local government borrowings. |
55
APPENDIX—SENSITIVITY OF REVENUE ESTIMATES
The rate of growth in tax revenues is dependent on a range of factors that are linked to the rate of growth in economic activity in the State. Some taxes are closely related to activity in specific sectors of the economy, whilst others are broadly related to the general rate of economic growth, employment, inflation and wages. A change in the level of economic activity, resulting from economic growth differing from forecast levels, would impact upon a broad range of taxation receipts.
Other revenue items are influenced by external variables such as the exchange rate, and global commodity prices.
Exchange rate and commodity prices and volumes—royalties estimates
Estimates of mining royalties are sensitive to movements in the Australian dollar-US dollar exchange rate and commodity prices and volumes.
Contracts for the supply of commodities are generally written in US dollars. Accordingly, a change in the exchange rate impacts on the Australian dollar price of commodities and therefore expected royalties collections.
A one cent variation in the Australian dollar-US dollar exchange rate would lead to a change in royalty revenue of approximately $29 million in the second half of 2008-09.
Also impacting on royalty estimates are volume effects. A large component of Queensland’s royalty collections is derived from coal. A 1% variation in export coking and thermal coal volumes in the second half of 2008-09 would lead to a change in royalty revenue of approximately $16 million.
The 2008-09 assumptions for export coal prices are based on existing contract prices until 1 April 2009, while price assumptions for the June quarter 2009 are broadly consistent with current spot prices. A 1% variation in the price of export coal achieved in June quarter 2009 would lead to a change in royalty revenue of approximately $9 million.
Property values and volumes—transfer duty estimates
Until recently, high levels of activity in the property market had resulted in strong growth in revenue collections through transfer duty receipts. The level of transfer duty receipts flowing from property market activity has a number of elements. The key elements are the value and volume of properties changing hands.
For the remainder of 2008-09, a gradual recovery in property market activity is expected, as a result of substantial reductions in the Reserve Bank of Australia’s cash rate, the Australian Government’s First Home Owners Boost and the Queensland Government’s increased transfer duty exemption for first home buyers. The underlying assumption is for stable property prices and a gradual recovery in volumes, relative to recent months, although volumes are expected to remain well below the level experienced in 2007-08.
A 1% variation in the average value of property transactions would change transfer duty collections by approximately $14 million in the second half of 2008-09.
A 1% variation in the volume of transactions would change transfer duty revenues by approximately $12 million in 2008-09.
Wages and employment growth—payroll tax collections
Wages and employment growth have a direct impact on payroll tax collections. The Major Economic Statement assumptions are for an increase in the Wage Cost Index of 4 1/4% and employment growth of 2 1/4% in 2008-09.
56
A one percentage point variation in wages growth would change payroll tax collections by approximately $28 million across 2008-09. Similarly, a one percentage point variation in employment growth would change payroll tax collections by $28 million.
Parameters influencing Australian Government GST payments to Queensland
Estimates of Australian Government GST revenue grants to states and territories are dependent on total GST revenue collected, which tends to be closely correlated with the general level of economic activity. The Australian Government has provided estimates of total GST collections in its Mid Year Economic and Fiscal Outlook. Queensland continues to bear the risks of fluctuations in GST revenues and the other components of the package, such as the First Home Owner Grant Scheme, administrative costs associated with the GST and taxes foregone.
The Australian Government’s estimate of GST revenue in 2008-09 is based on its forecast of consumption subject to GST growing by 3 1/2%. As with all other tax estimates, there is a risk of lower collections than estimated by the Australian Government if economic growth and consumption is weaker than expected.
Relative to other states, Queensland has been assessed as having an increasing capacity to raise revenue from transfer duty and mining revenue in recent years. As a result, Queensland’s share of GST funding (relativity) has declined and is expected to be below a population share for the first time in 2008-09. As Queensland continues to raise relatively more revenue because of relatively strong resource and property sectors, it is expected that Queensland’s relativity and therefore share of GST funding will decline further.
Due to the complexities associated with the GST base, the information provided in the Australian Government Budget Papers is not sufficient to prepare indicative forecasts of the sensitivity of GST estimates to key economic variables.
57