EXHIBIT (c)(i)
Consolidated Financial Statements of the Registrant
QUEENSLAND TREASURY CORPORATION
ANNUAL REPORT 2009 – 2010
AUDAX AT FIDELIS
QUEENSLAND TREASURY CORPORATION
QUEENSLAND TREASURY CORPORATION
ANNUAL REPORT 2009 – 2010
Contents
Queensland Treasury Corporation Overview 1
Five-year Business Summary 2
Chairman’s and Chief Executive’s Report 4
Customer Report 7
Investor Report 10
Corporate Report 17
A message from Sir Leo 19
Queensland Treasury Corporation Board 20
Corporate Governance 24
Economic and Fiscal Report 26
Financial Statements 31
Appendices 78
Vision
Efficient and effective financial risk management practices across our customers and the State.
Mission
To provide corporate treasury services to our customers and the State, by striving to understand our customers’ current and future needs, and delivering solutions to meet those needs.
Values
Open communication
Respect for the individual
Integrity and honesty in all our dealings
Good corporate citizenship
Strong commitment and valuable contributions
Queensland Treasury Corporation
Queensland Treasury Corporation is the Queensland Government’s central financing authority and corporate treasury services provider, with responsibility for:
| • | | sourcing and managing the debt funding to finance Queensland’s infrastructure requirements in the most cost-effective manner |
| • | | providing financial and risk management advice to the Queensland Government and its Queensland public sector customers on financial risk issues, and |
| • | | investing the State’s short- to medium-term cash surpluses, to maximise returns to customers through a conservative risk management framework. |
QTC does not formulate policy, but works within the policy frameworks developed by the Government and Queensland Treasury. QTC’s role is not to take direct equity in projects, however, it may, at the direction of the Government, invest equity in special purpose vehicles established to achieve a specific outcome for the State.
Debt funding and management
QTC borrows funds in the domestic and international markets in a manner that minimises the State’s, and QTC’s, liquidity and refinancing risk. We then lend these funds to our customers, or use them to manage our customers’ debt or to refinance maturing debt. With responsibility for all of the State’s debt raising, QTC is able to capture significant economies of scale and scope in the issuance, management and administration of debt.
Financial advisory and risk management services
QTC works closely with its public sector customers to assist in managing their risk in financial transactions and achieve the best financial solutions for their organisations and for Queensland. In assisting customers, QTC does not provide advice that is contrary to the interests of the State. We encourage our customers and Queensland Treasury, our major stakeholder, to use our organisation as an extension of their resources, by:
| • | | providing them with low cost access to professional skills and resources to ensure that their financial risks are identified and managed on a consistent basis |
| • | | acting as a central store of knowledge and expertise on financial structures and transactions, and the risks and benefits they encompass |
| • | | providing Queensland Treasury with advice on matters of financial and commercial policy and risk relating to the State and its entities |
| • | | working as a conduit between the Government and the private sector, and |
| • | | using our economies of scale and scope to ensure that the best possible solutions are obtained. |
Short- to medium-term investments
QTC uses its financial markets expertise, developed through strong relationships with the domestic and international markets, together with its understanding of debt management and the management of financial risk, to provide customers with investment solutions that achieve a high return within a conservative risk environment. Customers can choose from an overnight facility, a managed short-term fund or fixed-term facilities. Alternatively, we can assist them to source appropriate solutions from the marketplace.
QUEENSLAND TREASURY CORPORATION ANNUAL REPORT 2009–2010 1
Five-year Business Summary
| | | | | | | | | | | | | | | | | | | | |
| | | FINANCIAL YEAR
2005–06 | | | FINANCIAL YEAR
2006–07 | | | FINANCIAL YEAR
2007–08 | | | FINANCIAL YEAR
2008–09 | | | FINANCIAL YEAR
2009–10 | |
| | | | | |
Financial | | | | | | | | | | | | | | | | | | | | |
CAPITAL MARKETS OPERATIONS | | | | | | | | | | | | | | | | | | | | |
Operating Statement ($000) | | | | | | | | | | | | | | | | | | | | |
Interest from onlendings | | | 572 306 | | | | 768 624 | | | | 1 489 666 | | | | 3 614 201 | | | | 4 062 092 | |
Management fees | | | 22 698 | | | | 24 820 | | | | 31 504 | | | | 41 380 | | | | 50 142 | |
Interest on borrowings | | | 857 281 | | | | 1 144 884 | | | | 2 077 211 | | | | 4 431 033 | | | | 4 901 512 | |
Interest on deposits | | | 302 987 | | | | 316 880 | | | | 471 014 | | | | 394 238 | | | | 195 413 | |
Profit/(loss) before income tax | | | 62 310 | | | | 59 589 | | | | (65 024 | ) | | | 53 430 | | | | 243 510 | |
Income tax expense | | | 12 741 | | | | 13 740 | | | | 15 681 | | | | 10 227 | | | | 34 074 | |
| | | | | |
Profit /(loss) for the year | | | 49 569 | | | | 45 849 | | | | (80 705 | ) | | | 43 203 | | | | 209 436 | |
| | | | | |
BALANCE SHEET ($000) | | | | | | | | | | | | | | | | | | | | |
Total assets | | | 33 492 178 | | | | 40 612 318 | | | | 49 915 436 | | | | 71 517 525 | | | | 74 385 172 | |
Total liabilities | | | 33 164 678 | | | | 40 238 969 | | | | 49 622 792 | | | | 71 181 678 | | | | 73 839 889 | |
| | | | | |
Net assets | | | 327 500 | | | | 373 349 | | | | 292 644 | | | | 335 847 | | | | 545 283 | |
| | | | | |
Customer | | | | | | | | | | | | | | | | | | | | |
SAVINGS FOR CUSTOMERS ($M) | | | | | | | | | | | | | | | | | | | | |
Savings due to portfolio management | | | 46.5 | | | | (13.1 | ) | | | 18.7 | | | | 6.2 | | | | (18.8 | ) |
Savings due to borrowing margin | | | 74.4 | | | | 82.1 | | | | 145.2 | | | | 256.7 | | | | 395.2 | |
Total savings for customers | | | 120.9 | | | | 69.0 | | | | 163.9 | | | | 262.9 | | | | 376.4 | |
Cumulative savings for customers | | | 1 466.4 | | | | 1 535.4 | | | | 1 699.3 | | | | 1 962.2 | | | | 2 338.6 | |
| | | | | |
LOANS TO CUSTOMERS | | | | | | | | | | | | | | | | | | | | |
Loans ($000) | | | 19 831 582 | | | | 24 268 854 | | | | 32 911 506 | | | | 44 407 516 | | | | 55 113 222 | |
Number of onlending customers | | | 321 | | | | 313 | | | | 280 | | | | 243 | | | | 275 | |
Outperformance of benchmark (% pa semi-annual) | | | | | | | | | | | | | | | | | | | | |
Floating Rate Debt Pool | | | 0.19 | | | | 0.21 | | | | 0.20 | | | | 0.21 | | | | 0.21 | |
3 Year Debt Pool | | | 0.27 | | | | 0.00 | | | | 0.08 | | | | 0.07 | | | | (0.07 | ) |
6 Year Debt Pool | | | 0.23 | | | | (0.06 | ) | | | 0.05 | | | | 0.04 | | | | (0.08 | ) |
9 Year Debt Pool | | | 0.20 | | | | (0.18 | ) | | | (0.05 | ) | | | 0.01 | | | | (0.07 | ) |
12 Year Debt Pool | | | 0.24 | | | | (0.22 | ) | | | (0.04 | ) | | | 0.07 | | | | (0.08 | ) |
15 Year Debt Pool | | | 0.23 | | | | (0.12 | ) | | | 0.01 | | | | 0.16 | | | | (0.05 | ) |
QUEENSLAND TREASURY CORPORATION ANNUAL REPORT 2009–2010 2
| | | | | | | | | | | | | | | | | | | | |
| | | FINANCIAL YEAR
2005–06 | | | FINANCIAL YEAR
2006–07 | | | FINANCIAL YEAR
2007–08 | | | FINANCIAL YEAR
2008–09 | | | FINANCIAL YEAR
2009–10 | |
| | | | | |
MANAGED FUNDS | | | | | | | | | | | | | | | | | | | | |
Deposits ($000) | | | 5 329 329 | | | | 7 698 426 | | | | 8 251 872 | | | | 7 793 010 | | | | 4 660 960 | |
Number of depositors | | | 253 | | | | 254 | | | | 214 | | | | 214 | | | | 207 | |
Outperformance of benchmark (% pa semi-annual) | | | | | | | | | | | | | | | | | | | | |
Cash Fund | | | 0.16 | | | | 0.17 | | | | 0.22 | | | | 0.04 | | | | 0.36 | |
| | | | | |
Financial Markets | | | | | | | | | | | | | | | | | | | | |
Debt outstanding* ($000) | | | 27 519 577 | | | | 32 074 526 | | | | 40 728 150 | | | | 62 624 234 | | | | 68 885 406 | |
QTC bond rates (%) | | | | | | | | | | | | | | | | | | | | |
September 2007 | | | 6.00 | | | | 6.37 | | | | — | | | | — | | | | — | |
July 2009 | | | 5.99 | | | | 6.68 | | | | 7.40 | | | | 3.13 | | | | — | |
May 2010 | | | 6.00 | | | | 6.72 | | | | 7.39 | | | | 3.38 | | | | — | |
June 2011 | | | 6.01 | | | | 6.74 | | | | 7.31 | | | | 4.32 | | | | 4.60 | |
April 2012 | | | — | | | | — | | | | 7.26 | | | | 4.95 | | | | 4.67 | |
August 2013 | | | 6.00 | | | | 6.69 | | | | 7.17 | | | | 5.54 | | | | 4.86 | |
November 2014 | | | — | | | | — | | | | — | | | | — | | | | 5.26 | |
October 2015 | | | 6.02 | | | | 6.66 | | | | 7.04 | | | | 5.86 | | | | 5.17 | |
April 2016 | | | — | | | | — | | | | — | | | | — | | | | 5.49 | |
September 2017 | | | — | | | | 6.64 | | | | 7.00 | | | | 6.11 | | | | 5.36 | |
June 2019 | | | — | | | | — | | | | — | | | | 6.29 | | | | 5.48 | |
February 2020 | | | — | | | | — | | | | — | | | | — | | | | 5.77 | |
June 2021 | | | 6.02 | | | | 6.58 | | | | 6.94 | | | | 6.34 | | | | 5.59 | |
March 2033 | | | — | | | | — | | | | — | | | | 6.37 | | | | 5.79 | |
QTC Capital-Indexed Bond rates (% at 30 June) | | | | | | | | | | | | | | | | | | | | |
August 2030 | | | 2.51 | | | | 2.79 | | | | 2.32 | | | | 3.67 | | | | 3.39 | |
Average basis point margin of 1st tier semi-government bonds to + | | | | | | | | | | | | | | | | | | | | |
Commonwealth bonds # | | | 22 | | | | 32 | | | | 56 | | | | 50 | | | | 41 | |
Swap # | | | (23 | ) | | | (21 | ) | | | (52 | ) | | | 19 | | | | 11 | |
AAA credit (non-govt) # | | | (31 | ) | | | (30 | ) | | | (144 | ) | | | (218 | ) | | | (114 | ) |
QTC global and domestic bonds on issue at face value ($000) | | | 26 903 063 | | | | 33 000 416 | | | | 41 833 356 | | | | 56 394 453 | | | | 61 424 032 | |
| | | | | |
Corporate | | | | | | | | | | | | | | | | | | | | |
Number of employees | | | 132 | | | | 148 | | | | 160 | | | | 180 | | | | 176 | |
Administration expenses ($000) | | | 24 034 | | | | 27 604 | | | | 28 453 | | | | 39 156 | | | | 34 519 | |
| * | QTC holds its own stock and these holdings have been excluded from the debt outstanding figures. |
| # | Data sourced from CBA Spectrum (Australian dollar denominated). |
| + | 1st tier semi-government bonds includes QTC, NSWTC and TCV (Composite Fair Value Curve), average is across 1-10 years. |
QUEENSLAND TREASURY CORPORATION ANNUAL REPORT 2009–2010 3
Chairman’s and Chief Executive’s Report
| | | | |
WE ALSO ACHIEVED QUANTIFIABLE SAVINGS FOR CUSTOMERS AND THE STATE OF $376.4 MILLION (2008–09: $263 MILLION), PRINCIPALLY RELATED TO OUR ABILITY TO ADD VALUE THROUGH THE MANAGEMENT OF BORROWING MARGINS. 
Alex Beavers Chairman (Acting) 
Stephen Rochester Chief Executive | | In a year characterised by moderate global growth and improvements in general market liquidity that was supported by high levels of monetary and fiscal stimulus, Queensland Treasury Corporation successfully raised more than $20 billion—the State’s largest-ever funding program. For the year ending 30 June, we achieved an accounting profit from our capital markets operations of $209.4 million (2008–09: $43.2 million profit). Separate from our capital markets’ operations, the long term assets operations recorded a profit of $586.8 million, partially reversing the significant losses recorded last year ($4.6 billion loss) following poor performance in the equity, property and credit markets. The long term assets segment comprises the investments that fund the State’s superannuation and other long-term obligations that were transferred to QTC by the State Government under an administrative arrangement. In return, QTC issued the State with a fixed-rate note that provides the State with a fixed rate of return, while QTC bears the impact of fluctuations in the value and returns on the asset portfolio. These assets continue to be managed by Queensland Investment Corporation. The accumulated losses incurred by the long term assets segment to date have no impact on QTC’s capacity to meet its obligations, as there is no cash flow effect for QTC. In addition, under the Queensland Treasury Corporation Act 1988, any QTC losses are the responsibility of the Consolidated Fund of the Queensland Government. We also achieved quantifiable savings for customers and the State of $376.4 million (2008–09: $263 million), principally related to our ability to add value through the management of borrowing margins. | | Funding Queensland’s borrowing program On 16 June 2009—and following its announcement the previous day of the $18 billion AUD requirement for the 2010–11 Borrowing Program—Queensland took the significant decision to accept the Australian Government’s offer of a guarantee for its existing AUD benchmark bond lines with maturities between 12 months and 15 years. This decision followed an extended period of severe market turmoil, fierce competition for term funding from commercial institutions that had already secured a guarantee from the Australian Government, and feedback from members of our AUD Global Fixed Interest Distribution Group, as well as major investors. In January 2010, in recognition of the time-limited nature of the Australian Government guarantee offer, we implemented a strategy to begin rebuilding QTC’s yield curve of bonds with the exclusive guarantee of the State Government of Queensland, and issued $4 billion AUD benchmark bonds maturing in 2014. At the time, this transaction was reported to be the largest-ever AUD domestic syndicated benchmark bond line launch by a semi-government authority. At 30 June 2010, more than 70% of QTC’s State Government Guaranteed AUD benchmark bonds were also guaranteed by the Australian Government, and we had pre-funded approximately $6 billion of our 2010–11 borrowing program of $18 billion. Looking ahead, we will take advantage of continued, strong investor demand to build QTC’s yield curve of State Government-guaranteed benchmark bond lines. This will provide investors with a viable alternative of well-established, liquid benchmark bonds that complement our existing Australian Government-guaranteed benchmark maturities, and help minimise the risk of any disruption to investors from the pending withdrawal of the Australian Government guarantee on 31 December 2010. |
QUEENSLAND TREASURY CORPORATION ANNUAL REPORT 2009–2010 4
Infrastructure funding
Significantly, with improvements in the global markets over the past year, we are observing an increasing array of ‘innovative’ financing arrangements being proposed for infrastructure funding.
QTC’s primary role and function is to provide low-cost, least-risk funding for the Queensland Government. In fulfilling this core role, we are concerned that these innovative funding proposals are obscuring the real issue, which is the Government’s capacity to pay for services, rather than the capacity to finance infrastructure services.
Robust debate is essential to delivering optimal outcomes and QTC has been recognised in the past for challenging assumptions and arguing that every dollar lost through less-than-optimal risk-sharing, procurement and financing decisions ultimately reduces the amount of money available to provide services to the community. In the past six months, we have been particularly interested in the debate generated by two Queensland academics (supported by QTC) that challenges the methodology around determining discount rates and introduces the concept of a negative beta for projects owned by the private sector that require government payments (www.business.uq.edu.au/ display/teach/ppp).
We recognise that government should be able to choose to pay more for infrastructure delivery, as long as the amount of risk that is transferred to the private sector is commensurate with the increased cost.
However, we also believe that debate around the sources of funding—particularly the use of or access to superannuation funds—is diverting valuable discussion regarding the capacity of government and the broader community to pay for infrastructure when compared to the benefits generated from that infrastructure. The use of alternative funding sources does not remove the need for the community, either directly or as taxpayers, to pay for infrastructure.
There are numerous complexities within a project’s decisions around investment, procurement, financing and whole-of-life management, but none is more crucial than determining what infrastructure is to be provided and the government’s capacity to pay for that infrastructure over its life.
Looking ahead, we see an opportunity for increased levels of Commonwealth support for essential state-run infrastructure projects to match the greater share of economic benefit captured by the Commonwealth. We also welcome future debate that better assesses what infrastructure and services are provided, given the community’s infinite demand for such services, its capacity to pay for such services, and the way in which those services are financed (including the sharing of costs and better attribution of benefits between the Commonwealth and the states).
Global financial markets environment
The first half of the financial year was characterised by a sense of optimism, as the financial markets’ appetite for risk returned as governments’ stimulus programs and inventory re-stocking led to a sharp improvement in economic activity. The global economic recovery, however, unfolded at varying paces, with developing countries, particularly those in Asia, expanding, but major advanced economies, such as the United States and the Euro Area, recording growth at a slower rate. The weakened economic prospects for countries in the Euro Area were compounded in the latter part of the financial year by the emergence of a sovereign debt crisis, which has become widespread and, as a result, volatility in markets increased and credit spreads again widened.
While the end of the financial year saw these concerns ease, a degree of uncertainty remains about future economic and financial conditions. The unprecedented pre- and post-GFC accumulation of debt by the public sector globally is now seen as unsustainable and, as a result, we now expect a protracted period of debt reduction. During this period, private sector demand for credit and bank supply of credit are both expected to be subdued, which will constrain consumption and, therefore, investment by the private sector.
Public sector spending is also likely to be lower, as budget deficits are cut and debt is repaid. Economic growth is likely to be structurally lower, with a subdued and uneven pace in the global recovery and periods of increased financial market volatility to be expected.
QUEENSLAND TREASURY CORPORATION ANNUAL REPORT 2009–2010 5
Chairman’s and Chief Executive’s Report (CONTINUED)
Australian economy
Australia emerged relatively unscathed from the GFC, mostly due to its healthy banking sector, its relatively strong and growing trade relations with China and Asia, the policy responses of its fiscal and monetary authorities, and its flexible exchange rate. In the view of the Reserve Bank of Australia, the outlook improved sufficiently to allow the emergency monetary policy settings implemented at the height of the crisis to be unwound.
Over the medium term, the prospects for the Australian economy are bright, given our integration with the rapidly-growing Asian region. The continued industrialisation and urbanisation processes underway in these countries will support investment in Australia’s resources sector, as demand for commodities remains high. This will ultimately flow through to higher incomes and employment in the broader economy, but will pose challenges in the form of higher inflation, interest rates and value for the Australian dollar.
We anticipate housing and business investment (outside of the mining sector) is likely to remain somewhat subdued, as demand for and supply of bank credit remains weak while the private sector focuses on reducing the amount of debt on its balance sheet.
Looking ahead
This year saw the progression of two of the largest organisation-wide initiatives QTC has ever undertaken. The design and transition to our new customer-centric operating model and structure and the ongoing development of our online environment for customer transactions are both major investments in improving the service we deliver to customers.
Over the next 12 months, we are confident our new structure, with its multi-functional teams and additional depth of management expertise, will enable QTC to be more responsive to our customers’ needs in what has become a more complex and difficult marketplace. Similarly, the new customer transaction system that will be delivered in 2011 will provide customers with significant autonomy with routine financial management transactions, and generate efficiencies for QTC that will enable us to focus more resources on high-priority, value-adding advisory work.
Both projects have required, and will continue to require, significant commitment and effort from QTC’s employees. Our people have stepped up to the task, collectively and individually making all of QTC’s and its customers’ achievements a reality. We recognise the importance of a quality workforce, and thank each and every employee for their contribution over the past 12 months.
We would also like to thank QTC’s Board of Directors, whose sound counsel continues to guide us through the most challenging period in our history.
On a final note, and on behalf QTC’s Board, employees, customers, and our financial markets partners, we would like to acknowledge the profound contribution of QTC’s recently retired Chairman, Sir Leo Hielscher AC. His wisdom, expertise, guidance, warmth, wit and good humour has helped create and grow this organisation, and we are truly appreciative of his Chairmanship over the past 22 years. And, given his appointment as QTC’s honorary Foundation Chairman, we now look forward to benefiting from Sir Leo’s counsel in the years to come.
We are confident that QTC is well placed to continue its delivery of quality results for both our customers and the State.

ALEX BEAVERS
Chairman (Acting)

STEPHEN ROCHESTER
Chief Executive
QUEENSLAND TREASURY CORPORATION ANNUAL REPORT 2009–2010 6
Customer Report
| | | | |
| CUSTOMERS ARE NOW BENEFITING FROM IMPROVED ACCESS TO THE QTC SERVICES THEY NEED, AS WELL AS QTC’S NEWLY REFOCUSED DELIVERY OF TARGETED, CUSTOMER-SPECIFIC ADVISORY SERVICES. | | QTC delivered strong customer outcomes in 2009–10, despite continuing constraints in the financial markets. Through our financial and risk management advisory services we helped Queensland’s Government departments, local governments, and other Government Owned Corporations and entities, to deliver better outcomes and better manage their financial risks. New groups formed to enhance service provision Midway through the financial year, we restructured our organisation to better align our capabilities to meet our customers’ needs. By matching our service structure more closely to our customers’ needs profile, we expect to achieve a closer level of collaboration with our customers, which will result in better strategic financial and risk management for both our customers and the State. Our new structure divides our customer service functions into four new areas: Financial Solutions Group, Business Solutions Group, Strategic Partnering Group, and Treasury Department Group. Customers are now benefiting from improved access to the QTC services they need, as well as QTC’s newly refocused delivery of targeted, customer-specific advisory services. Increased benefits through improved advice Throughout the year, QTC worked closely with customers to identify funding options that would deliver the most significant customer benefits from a cost and debt management perspective. In addition, we assisted our customers to better understand and manage the financial risks associated with a number of large projects. These customer benefits principally related to our ability to access cost-effective debt funding from the wholesale funding markets, which is then used to fund our customers (with an approximate 0.10% margin added to cover our costs). | | Throughout the year, we took advantage of opportunities to match demand from customers for borrowings and duration lengthening, and to allocate debt issuance directly to customers, saving them additional transactional and hedging costs, and optimising the whole-of-State cost of funding. Other notable initiatives that helped achieve customer and State benefits for 2009–10 included: • Refinancing approximately $8 billion of existing debt for both ENERGEX and Ergon (regulated energy businesses) together with $1.7 billion (Ergon) and $2.0 billion (ENERGEX) of future years’ borrowings. This has ensured these customers will be able to fund their existing businesses at a favourable cost in accordance with their risk management objectives. • Completing a business analysis for the South-East Queensland (SEQ) bulk water entities of their cash flow management process to identify models, tools and systems that will improve short-term cash flow forecasting and debt management arrangements across the SEQ Water Grid. • Negotiating new QTC commercial loan and inter-creditor agreements and pricing for SEQ retail-distribution water entities, as well as undertaking credit and capital structure reviews and ongoing treasury management for local government shareholder loans to the water entities. • Developing a tailored leasing solution for Brisbane City Council’s (BCC) Willawong Bus Depot, achieving significant savings over private sector options. • Advising Queensland Health on the financial aspects of the Queensland Children’s Hospital Project. |
QUEENSLAND TREASURY CORPORATION ANNUAL REPORT 2009–2010 7
Customer Report (CONTINUED)
Delivered stronger risk management
Given the volatility within the markets, the economy and their own industries, our customers require regular reviews of their significant financial risks, and the development and implementation of robust strategies to help protect them.
In 2009–10, QTC continued to closely monitor the aftermath of the global financial crisis and kept customers informed of relevant emerging changes. During the year, we achieved significant progress in strengthening risk management practices for specific customers and customer groups.
Among our initiatives, we:
| • | | reviewed the credit quality of all of the major service providers to government, to ensure they have the financial capacity to deliver the contracted projects and/or services |
| • | | developed an alternative methodology for determining the regulated cost of debt for use in the pricing of bulk water. The alternative greatly reduces risk for the bulk water entities, consumers and the State, compared to the current regulatory approach |
| • | | conducted capital structure reviews of all Government Owned Corporations (GOCs) to ensure that they are adequately capitalised |
| • | | provided financial and risk management advice on the State’s ongoing investment in the QR passenger service, and |
| • | | completed credit reviews for the seven largest local governments and all GOCs for use by those organisations and the Government to improve understanding of the risks to their businesses. |
Offered innovative infrastructure procurement outcomes
In support of the Government’s considerable capital program, we developed tailored procurement solutions for Queensland Treasury, the Department of Education and Training, and Queensland Health by offering funding alternatives that lowered the cost of funding and delivered low-risk outcomes. We assisted customers and stakeholders to improve the evaluation of potential delivery models on projects including the proposed Gold Coast Rapid Transit, Sunshine Coast Hospital, and Queensland Children’s Hospital.
Enhanced local government outcomes
During 2009–10, QTC developed a water pricing model, with significant input and support from Townsville Regional Council, and assistance from the regional councils of Mackay, Toowoomba and Rockhampton, and the Queensland Competition Authority. The new water pricing model models all aspects of a local government’s water operations, including sewerage, and provides outputs for use in the local government’s capital works plan, income statements, balance sheets and cash flow statements.
This robust, user-friendly model can be used by all local governments, facilitating compliance with competition policy principles and enabling local governments to better understand their water businesses.
We also assisted Toowoomba Regional Council to better understand the pricing scenarios for water supply, which led to major changes to the pricing of water to Toowoomba residents and helped the Council in its negotiations with the State Government to gain access to water from the SEQ Water Grid.
In South-East Queensland, we provided advice around capital structure for the three new SEQ local government-owned water entities, which are now providing water distribution and retail water services to local residents. Subsequently, we undertook credit reviews and entered into commercial loan agreements with these entities. In addition to providing interest rate risk advice, we are also providing ongoing corporate treasury services to these new businesses.
In addition to the credit reviews mentioned earlier, we also undertook financial sustainability reviews for local governments, statutory bodies and grammar schools, to assist their understanding of their financial risks and propose strategies to manage those risks. These credit and sustainability reviews are seen as increasingly important by the local governments that have to manage their businesses in an increasingly complex environment with increasing demands around the range and quality of services they offer. Within this context, credit and sustainability reviews provide an external review of the affordability of initiatives, as well as insight into the local government’s key risks and/or issues.
QUEENSLAND TREASURY CORPORATION ANNUAL REPORT 2009–2010 8
Local Government Infrastructure Services
Local Government Infrastructure Services Pty Ltd (LGIS)—a joint initiative between QTC and the Local Government Association of Queensland—provides Queensland’s local governments with a range of support services to meet their infrastructure project needs. As part of QTC’s organisational restructure process, LGIS also adjusted its corporate strategy to ensure closer alignment with QTC and refocused its business on the emerging and priority needs of Queensland’s local government, particularly around managing the procurement and delivery of infrastructure.
WATER, WASTE AND WASTEWATER INITIATIVES
During the year, LGIS led a number of important initiatives to support water, waste and wastewater infrastructure. These included working with local government representatives to generate support for alternative waste technology projects, develop innovative regional waste strategies, and optimise funding for the delivery of wastewater treatment and reticulation infrastructure.
An important aspect of this work has been to ensure efficiency in delivery and use of water and energy through the South East Queensland Pressure and Leakage Management Project (generating total savings of up to 60 megalitres of water per day). The Cloncurry WaterWise Project has helped this small remote community with limited access to water save almost 47 megalitres per annum and reduce their energy demand by 509 MWh per annum (equivalent to 584 tonnes of CO2 per annum).
STATE ENERGY DEMAND MANAGEMENT
LGIS is 18 months into the delivery of the ClimateSmart Home Service, a $60 million State Government-funded project to retrofit 260,000 Queensland homes with energy-efficient devices. At the end of the 2009–10 year, the program had completed more than 170,000 retrofits, with customer satisfaction ratings of 96%. The success of the initiative has led to its adoption by local governments in the United Kingdom and Canada.
CORPORATE ADVISORY SUPPORT
LGIS also generated significant benefits to its local government customers by completing a significant number of individual financial advisory and support assignments, developing business cases, undertaking financial analysis and guiding procurement projects.
Improved understanding through training and support
QTC believes increasing customer financial and risk management knowledge is complementary to providing value-adding solutions, and offers a range of training opportunities to support customers’ business objectives.
Our courses include an industry-specific approach and education tailored to customers’ particular needs.
During the year, QTC’s training initiatives included:
| • | | whole-of-Government cash forecasting courses to build and strengthen this key Government finance skill |
| • | | water forums, bringing key stakeholders together to discuss the financing, operational and policy issues affecting the SEQ bulk water entities |
| • | | interactive workshops for a variety of different customer groups to increase awareness and build understanding of topics such as local government finances, financial sustainability, financial modelling, and cost of capital principles, and |
| • | | the delivery of our interactive Corporate Treasury Management course (run over three days) to build customers’ understanding of interest rate risk, and cash and liquidity management. |
Encouraged greater collaboration and satisfaction
QTC continues to focus on enhancing customer relationships and building strong partnerships. While informal feedback is indicating our new organisational structure is already increasing satisfaction, it is too early to determine a quantifiable measure of this. Over the past six months, we have been pleased with the ongoing indications of developing, healthy and proactive partnerships, demonstrated through the frequent requests for secondments of QTC staff to contribute to our customers’ businesses and projects. These secondments have ranged from key individuals for short-term expert placements, to teams of staff, particularly our financial modellers, for extended periods.
In addition, the regular, spontaneous requests for specialist financial consultancy services, such as tailored procurement advice and support, and complex financial modelling for project capital and operating costs, have demonstrated that QTC continues to deliver customer-valued advice and support.
QUEENSLAND TREASURY CORPORATION ANNUAL REPORT 2009–2010 9
Investor Report
| | | | |
| AT 30 JUNE 2010, MORE THAN 70% OF QTC’S STATE GOVERNMENT GUARANTEED AUD BENCHMARK BONDS WERE ALSO GUARANTEED BY THE AUSTRALIAN GOVERNMENT. THESE BONDS ARE GUARANTEED BY THE SOVEREIGN UNTIL MATURITY AND RATED AAA/ Aaa BY STANDARD & POOR’S AND MOODY’S RESPECTIVELY. | | The 2009–10 financial year was an exceptional one for Queensland and QTC, as it was the first time ever QTC’s benchmark bonds carried the guarantee of both the Australian and Queensland governments. Solid commitment to investors As the issuer of the largest semi-government bond lines in the Australian market—with average line outstandings in Australian Government Guaranteed bonds of AUD6.7 billion, and AUD4.5 billion in State Government Guaranteed bonds at 30 June 2010—QTC acknowledges and supports investors’ requirements for access to large, liquid bond lines with competitive two-way pricing available at all times. QTC has been able to consistently deliver optimal outcomes through its regular issuance activity and the support of its well-established distribution group of global bank intermediaries. In February 2010, as conditions generally improved in global financial markets, the Australian Government announced that it would no longer offer to guarantee new state government borrowings after 31 December 2010. Following that announcement, we have focused our funding strategy on transitioning from issuing AUD benchmark bonds covered by both the Australian Government Guarantee and the State’s own Government Guarantee, to issuing bonds exclusively guaranteed by the State Government of Queensland (consistent with the proven funding arrangements which existed prior to the onset of the global financial crisis). | | While QTC’s ultimate objective is to secure term funding without the assistance of the Australian Government Guarantee, we are also very mindful of our investors’ requirements, particularly their need for investments in bond lines that have a reasonable volume on issue. With Queensland’s ongoing long-term capital works program to fund, we are committed to maintaining reasonable outstandings as far as possible in all benchmark bond lines on issue, whether they be guaranteed by the Australian Government or not. FUTURE FUNDING STRATEGY QTC plans to continue to establish new State Government Guaranteed benchmark bond lines, adding to the existing State Government Guaranteed 2014, 2016 and 2020 benchmarks, to fill maturity gaps out to 10 years and longer. These State Government Guaranteed benchmark bond lines will complement existing Australian Government Guaranteed benchmark maturities, and will be achieved through primary issuance, as well as consolidation switches from Australian Government Guaranteed lines. As we establish new State Government Guaranteed benchmark bond lines, we will build these lines to meet customer borrowing requirements through the usual tap, tender and switch processes. The timing of the establishment of additional State Government Guaranteed benchmark bond lines will depend on investor demand, QTC customer requirements, and market conditions. |
QUEENSLAND TREASURY CORPORATION ANNUAL REPORT 2009–2010 10
Year in review
On 16 June 2009, Queensland accepted the Australian Government’s offer of a guarantee to apply to its existing Australian dollar denominated benchmark bond lines with maturities ranging between 12 months and 15 years, and formally took up the guarantee in September.
Queensland implemented this significant decision following an extended period of severe market turmoil resulting from the global financial crisis, strong competition for term funding from commercial institutions that had previously secured a guarantee from the Australian Government, and feedback from its major investors and members of QTC’s Distribution Group.
Following the take-up of the Australian Government Guarantee, selected AUD benchmark bonds now also carry the full guarantee of the Australian (and Queensland) Government.
A SUCCESSFUL BORROWING PROGRAM
Despite the uncertain market environment and the impending changes to the availability of the Australian Government Guarantee, QTC successfully completed its largest-ever annual Borrowing Program of more than $20 billion in
2009–10.
QTC’s ability to attract funds from a broad base of investors located domestically and offshore can be largely attributed to its key funding principles:
QTC consistently maintains a balanced debt maturity profile supported by adequate liquid reserves. All reserve funds are invested within tight credit constraints approved by QTC’s Board.
| 2. | Prudent risk management |
QTC’s overall financial risk management program focuses on managing volatility and seeks to minimise the potential adverse effects of financial risks on the financial performance of QTC and its customers. All financial risk management activities are conducted within conservative, Board- approved policies, and robust systems are in place for managing and monitoring financial risks.
As the State’s provider of corporate treasury services, QTC borrows in advance of its customers’ requirements to ensure Queensland’s public sector entities have ready access to funding when required and also to reduce the risk associated with refinancing maturing debt.
QTC currently uses a value-at-risk framework to manage its exposure to market risk. All foreign currency borrowings are fully hedged.
In recognition of the importance of ensuring the market has the necessary information to efficiently price QTC’s bonds, meetings are conducted regularly with both current and potential investors and market intermediaries around the world. We value feedback on our investors’ funding preferences and QTC’s overall funding activities and use this information to help determine future funding decisions.
| 4. | Committed to our long-term investor and market intermediary relationships |
QTC’s annual roadshow program and other forms of investor contact demonstrate a continued commitment to a long-term relationship with investors and market intermediaries. The program is structured to ensure:
| | • | | regular updates regarding QTC’s capital market operations and Queensland’s fiscal/economic position are provided to the market in order to achieve strong, ongoing acceptance of QTC securities domestically and across the globe, and |
| | • | | investors are provided with the opportunity to discuss Government policy first hand with senior Queensland representatives, to gain a better understanding of Queensland’s fiscal and economic outlook and QTC’s philosophy towards debt issuance and liability management. |
QUEENSLAND TREASURY CORPORATION ANNUAL REPORT 2009–2010 11
Investor Report (CONTINUED)
RE-ESTABLISHING OUR STATE GOVERNMENT GUARANTEED YIELD CURVE
In January 2010, QTC issued AUD4 billion of benchmark bonds maturing in 2014, and guaranteed exclusively by the Queensland State Government. This transaction was reported to be the largest AUD domestic syndicated benchmark bond issue ever undertaken by a semi-government authority.
In response to this strong investor demand for Queensland term credit, we continued to reconstruct a yield curve comprising exclusively State Government Guaranteed bonds to sit alongside QTC’s established Australian Government Guaranteed curve, launching two significant new issues maturing in 2020 and 2016 respectively.
LIQUIDITY AND TURNOVER
In our pursuit of a global approach to funding the State’s requirements, and to assist in the global distribution, pricing support and liquidity of QTC Bonds, QTC has appointed the following 12 leading global banks to its Distribution Group:
| • | | Commonwealth Bank of Australia |
| • | | National Australia Bank Limited |
| • | | Westpac Banking Corporation |
As QTC raises all of its wholesale funds via these market intermediaries, it views its relationship with each individual distribution group member as a mutually-beneficial partnership. QTC’s distribution group members are selected based on their commitment to the Australian fixed interest securities market and their distribution capabilities in various global markets. QTC is committed to ensuring that its distribution group members are fully updated on the State’s fiscal and economic circumstances, so that they have all necessary information required to assist investors in their investment choices.
In 2009–10, QTC’s investor roadshow activities included:
| • | | Budget and Borrowing Program Update, Sydney and Melbourne, August 2009 |
| • | | Worldwide Investor Roadshow, Japan, Europe, UK and US, September–October 2009 |
| • | | QTC/CBA Central Bank and Investor Conference, Queensland, October 2009 |
| • | | Asian Central Bank Roadshow, Taiwan and Korea, November 2009 |
| • | | Investor Roadshow, New Zealand, January 2010 |
| • | | Investor Roadshow, Middle East, February–March 2010 |
| • | | Investor Lunch with Queensland Premier, New York, May 2010 |
| • | | Budget and Borrowing Program Update, Sydney and Melbourne, June 2010 |
| • | | Budget and Borrowing Program Update, Tokyo, June 2010 |
QTC has a long-standing commitment to ensuring regular interaction with its investors, through its annual roadshow program. We believe our willingness to meet and discuss all facets of our business with our investors is integral to our ability to maintain a leading position in the Australian semi-government sector.
QUEENSLAND TREASURY CORPORATION ANNUAL REPORT 2009–2010 12
QTC’s principal source of funding is through its AUD benchmark bond program’s domestic and global tranches, which are exempt from Australian Interest Withholding Tax. The domestic AUD benchmark bonds are issued on a tap, tender, reverse enquiry and syndication basis. The AUD denominated global benchmark bonds are offered on a reverse enquiry basis and are transferable, solely at the investor’s discretion, into equivalent domestic benchmark bond lines.
During 2009–10, QTC had up to ten domestic benchmark bond lines on issue, maturing from 2011 to 2021. Minimum target outstandings for each of these lines is AUD2 billion per line, while the average line size is in excess of AUD6 billion. The Australian Government Guarantee applies to all existing AUD domestic benchmark bonds on issue as at 18 September 2009 and maturing within 12 and 180 months. In addition, a domestic preferred bond line maturing in 2033 and a capital-indexed bond maturing in 2030 are also outstanding.
QTC has a diverse range of borrowing facilities. The AUD benchmark bond facility generates the majority of term funding (85%–95%) providing for large liquid individual lines. The balance of the funding requirement is sourced through a diverse range of facilities including commercial paper, Euro and US medium-term note (Uridashi, Samurai, Kauri, Eurobond, etc) and private placement. All facilities are regularly updated as required so that investor demand can be met where possible when opportunities arise.
Turnover in global benchmark bonds has generally declined since domestic benchmark bonds became eligible for exemption from Australian Interest Withholding Tax in December 2008 as the majority of investors have now switched to the equivalent benchmark bonds issued under the domestic program.
FURTHER HIGHLIGHTS
On 15 June 2010, QTC announced its Borrowing Program requirement of AUD18 billion for the 2010–11 financial year.
During the year, the following AUD benchmark bond lines were launched:
| | | | | | |
| ISSUE DATE | | MATURITY DATE | | AMOUNT ISSUED | |
| | |
21 January 2010 | | 21 November 2014 | | AUD | 4.0 billion | |
23 February 2010 | | 21 February 2020 | | AUD | 2.5 billion | |
21 April 2010 | | 21 April 2016 | | AUD | 3 billion | |
| • | | QTC’s debt on issue reached more than AUD65 billion during 2009–10, and we maintained our position as the issuer of the largest Australian semi-government bond lines in both the Australian domestic and international markets. |
| • | | QTC hosted its second annual conference for central banks and investors, as well as its biennial conference for its distribution group during the year. |
QUEENSLAND TREASURY CORPORATION ANNUAL REPORT 2009–2010 13
Investor Report (CONTINUED)
STRONG INTER-GOVERNMENTAL FISCAL RELATIONSHIPS
The Australian Government and the Australian state governments have a close and long- standing fiscal relationship, with around 50% of Queensland’s revenue derived from grants from the Australian Government. Based on current government policy, it is expected that this percentage is likely to increase going forward.
QTC’S CREDIT RATING
| | | | |
| RATING ASSIGNED BY | | S&P/MOODY’S | |
| |
QTC’s Australian Government Guaranteed bonds | | | AAA /Aaa | |
Long-term AUD and foreign currency | | | AA+ / Aa1 (stable) | |
Short-term AUD and foreign currency | | | A-1+ / P1 (stable) | |
QTC OUTSTANDING DEBT (AT FACE VALUE)
| | | | | | | | | | | | |
| FUNDING FACILITY | | 30 JUNE 09 | | | 30 JUNE 10 | | | NET CHANGE | |
| | | |
Domestic Benchmark Bonds | | | 48 589 | | | | 56 983 | | | | 8 394 | |
Global Benchmark Bonds | | | 7 073 | | | | 3 688 | | | | 3 384 | |
Capital Indexed Bonds** | | | 734 | | | | 752 | | | | 18 | |
Other Domestic Bonds | | | 603 | | | | 588 | | | | (15 | ) |
Euro MTN | | | 1 012 | | | | 828 | | | | (184 | ) |
US MTN | | | 453 | | | | 0 | | | | (453 | ) |
US CP | | | 1 152 | | | | 900 | | | | 901 | |
Euro CP | | | 1 312 | | | | 1 969 | | | | 660 | |
CP | | | 2 249 | | | | 1 103 | | | | (1 146 | ) |
TOTAL | | | 63 177 | | | | 66 811 | | | | 3 638 | |
| ** | includes capital indexation |
Funding facilities at 30 June 2010
QTC maintains a diverse range of funding facilities.
DOMESTIC AND GLOBAL AUD DENOMINATED BONDS
QTC currently offers investors domestic and global benchmark bonds with maturities ranging from 2011 to 2021.
In addition, QTC also has an inflation-linked capital indexed bond maturing in 2030 issued under the AUD domestic bond facility.
The QTC benchmark bonds are our core source of funds, comprising in excess of 90% of total borrowings as at 30 June 2010.
AUD BONDS, OUTSTANDINGS BY MATURITY, AS AT 30 JUNE 2010
QUEENSLAND TREASURY CORPORATION ANNUAL REPORT 2009–2010 14
AUD BOND FACILITIES DETAILS, AS AT 30 JUNE 2010
| | | | | | | | | | | | | | | | |
| FACILITY | | SIZE $M | | | GOVERNING LAW | | MATURITIES | | CURRENCIES | | AMOUNT ON
ISSUE AUD M | | | PLACEMENT |
| | | | | | |
Domestic AUD Bond | | | Unlimited | | | Queensland | | 10 benchmark lines: 2011–2021 | | AUD | | | 56 376 | | | By tap or tender through Distribution Group |
| | | | | | | | Preferred line 2033 | | AUD | | | 607 | | | Reverse enquiry through Distribution Group |
| | | | | | | | Capital Indexed Bond 2030 | | AUD | | | 663 | | | By tap or tender through Distribution Group |
Global AUD Bond | | AUD | 20 000 | | | New York and Queensland | | 4 benchmark lines: 2011–2017 (transferable to domestic bonds) | | AUD | | | 3 688 | | | Continuously offered through Distribution Group |
TREASURY NOTES, COMMERCIAL PAPER AND MEDIUM-TERM NOTES FACILITIES
The QTC treasury note (T-Note) facility is a domestic electronic issuance facility and is our chief source of short-term domestic AUD funds. QTC’s main offshore programs are the multi-currency commercial paper (CP) and medium-term note (MTN) facilities in the Euro and US markets.
| | | | | | | | | | | | | | | | |
| FACILITY | | SIZE $M | | | GOVERNING LAW | | MATURITIES | | CURRENCIES | | AMOUNT ON
ISSUE AUD M | | | PLACEMENT |
| | | | | | |
Domestic T-Note | | | Unlimited | | | Queensland | | 7–365 days | | AUD | | | 1 103 | | | By tap through Dealer Panel |
Euro CP | | USD | 10 000 | | | English and Queensland | | 7–365 days | | Multi-currency | | | 1 969 | | | Continuously offered through Dealer Panel |
US CP | | USD | 5 000 | | | New York and Queensland | | 1–270 days | | Multi-currency | | | 900 | | | Continuously offered through Dealer Panel |
Multi-currency Euro MTN | | USD | 10 000 | | | English and Queensland | | Subject to market regulations | | Multi-currency | | | 909 | | | Reverse enquiry through Dealer Panel |
Multi-currency US MTN | | USD | 10 000 | | | New York and Queensland | | 9 months–30 years | | Multi-currency | | | 0 | | | Reverse enquiry through Dealer Panel |
These funding facilities are supplemented with public issues and private placements.
QUEENSLAND TREASURY CORPORATION ANNUAL REPORT 2009–2010 15
Investor Report (CONTINUED)
All funding facilities
PERCENTAGE OUTSTANDING UNDER QTC’S FUNDING FACILITIES, AS AT 30 JUNE 2010
Borrowing Program
QTC announces its estimated annual borrowing requirement following the release of the Queensland State Government Budget in May each year. A half-year review and update of the borrowing requirement is provided in January.
QTC’S INDICATIVE BORROWING PROGRAM FOR 2010–11 FINANCIAL YEAR
| | | | | | | | |
| BORROWING DETAILS | | 2010–11 A$M | | | 2009–10
(REVISED*) A$M | |
| | |
REFINANCING OF MATURING DEBT: | | | | | | | | |
AUD benchmark bonds | | | 8 763 | | | | 11 601 | |
AUD non-benchmark bonds | | | 405 | | | | 58 | |
Medium-term notes (MTNs) | | | 0 | | | | 487 | |
Commercial paper1 | | | 2 237 | | | | 4 714 | |
TOTAL MATURING DEBT | | | 11 405 | | | | 16 860 | |
ADJUSTMENTS: | | | | | | | | |
Prefunding of benchmark bond maturities | | | 0 | | | | (4 380 | ) |
Principal repayments from QTC customers | | | (600 | ) | | | (600 | ) |
TOTAL REFINANCING | | | 10 805 | | | | 11 880 | |
NEW BORROWING: | | | | | | | | |
Capital works and asset procurement | | | 12 947 | | | | 12 985 | |
Funding in advance of customer borrowings | | | (5 674 | ) | | | (5 066 | ) |
TOTAL NEW BORROWING | | | 7 273 | | | | 7 919 | |
TOTAL BORROWING PROGRAM2 | | | 18 078 | | | | 19 799 | |
| 1. | Estimated commercial paper outstanding as at 30 June. |
| 2. | Funding activity may vary depending upon actual customer requirements, the State’s fiscal position and financial market conditions. |
| * | Based on the State Budget 2009–10 Mid-Year Economic and Fiscal Update released on 4 December 2009. |
The 2010–11 borrowing estimate is expected to be funded as follows:
| | | | | | | | | | | | |
| FUNDING SOURCE | | EXPECTED RAISINGS 2010–11 | |
| | | RANGE % | | | LOW A$M | | | HIGH A$M | |
| | | |
TERM RAISINGS: | | | | | | | | | | | | |
AUD bonds3 | | | 60–70 | | | | 10 850 | | | | 12 650 | |
MTNs & other currency loans | | | 10–20 | | | | 1 810 | | | | 3 620 | |
COMMERCIAL PAPER RAISINGS: | | | | | | | | | | | | |
T-Notes, ECP, USCP | | | 15–20 | | | | 2 710 | | | | 3 620 | �� |
| 3. | Includes AUD domestic and global benchmark bonds, capital indexed bonds and other term issuance. |
QUEENSLAND TREASURY CORPORATION ANNUAL REPORT 2009–2010 16
Corporate Report
| | | | |
| THE NEW MODEL AND STRUCTURE WAS DEVELOPED TO ENABLE QTC TO MORE EFFECTIVELY MEET CUSTOMERS’ CURRENT AND EMERGING NEEDS AND MORE PROACTIVELY RESPOND TO EMERGING MARKET OPPORTUNITIES. | | For more than a decade, QTC has been committed to aligning its corporate strategy around customer-focused principles. As part of this commitment, we have regularly surveyed our customers and stakeholders seeking feedback on our performance. This regular and ongoing feedback has been instrumental in our organisation’s development and, in the last financial year, identified some significant opportunities for QTC to re-energise its customer focus and range of services given the changing economic environment. Realigning for the future In response to customer, stakeholder and employee feedback and the transformational changes occurring within the global financial markets, QTC’s Board approved a new operating model and organisational structure for QTC at the beginning of 2009–10. The new model and structure was developed to enable QTC to more effectively meet customers’ current and emerging needs and more proactively respond to emerging market opportunities. Over the past year, considerable resources have been dedicated to the design and implementation of QTC’s new operating model and the transitioning of teams and customers into the new structure. While QTC’s mandate and strategic direction has remained unchanged, the organisational realignment around four customer-focused, multi-disciplinary teams has fundamentally changed the way we work both within QTC and with our customers, bringing together teams comprising a range of disciplines and encouraging greater interaction and collaboration within and across teams. Although organisational restructures can be challenging, QTC’s employees rose to the challenge admirably, embracing the new operating model and responding impressively to the additional workload associated with the changes to the structure and the related systems, processes and policies. To support the transition, a series of training sessions on applying the new operating model and working within the new structure was held for all employees, and many also participated in intensive customer orientations and cross-skilling development activities. To support the organisation-wide move to a highly customer-centric structure, we also strengthened the senior management team and the depth of senior expertise within the business with the creation of four new general manager roles. | | Supporting our people With the new operating model and organisational structure now in place, continual effort is being applied to supporting and reinforcing the change, developing our people and the skills base of the organisation to maximise the contribution of our people and ensure that we have sufficient talent and capability to meet the increasing diversity of both our and our customers’ current and future needs. The new operating model will continue to promote employee development and learning by offering greater opportunities to acquire new skills and broaden their professional capabilities. In early 2010, teams began their customer business planning, in support of the submission of QTC’s Strategic Plan to the Board in March. Over the past few months, teams have reviewed, revalidated and expanded their customer plans, using the prioritisation model within the new operating model. The development of QTC’s 2010–2014 Strategic Plan is on schedule to be presented to the Board in September 2010. Over the coming year, our focus will be on building and sustaining our organisational capability: • through a continual focus on promoting opportunities to grow and transition our people, and further developing their skills and expertise to a higher level • by ensuring our new operating model and performance framework are aligned to manage and motivate staff and support our commitment to staff engagement and performance • by strengthening our leadership capability to support our people and drive our strategic journey, and • by reviewing succession strategies. It was particularly reassuring that, despite all of the changes in our internal and external operating environments over the past 12 months, our employees remained committed to QTC and its vision. |
QUEENSLAND TREASURY CORPORATION ANNUAL REPORT 2009–2010 17
Corporate Report (CONTINUED)

| | | | |
| SNAPSHOT | | | |
Establishment | | | 193 | |
Staff turnover | |
| 13.5
(industry turnover 13 | %
%) |
Full-time | | | 86 | % |
Part-time | | | 14 | % |
Graduates | | | 3 | |
Average tenure* | | | 6.19 years | |
| * | employees as at 30/06/10 |
Risk management
QTC manages its risks within an enterprise-wide risk management framework (EwRM). The framework supports the achievement of QTC’s corporate strategies and objectives by providing assurance that QTC’s risks are being appropriately and effectively identified and managed, using a consistent and well-understood approach for evaluating and reporting risks.
As part of the framework, QTC periodically identifies its key or significant risks, which are reported to a management team (Risk Management Team) and then to a Board committee (Risk Management Committee) and risks are added or removed from time-to-time. The understanding of and commitment to EwRM across the organisation has continued to grow and become a part of QTC’s culture.
In recognition of the strategic importance of EwRM, and to obtain its full benefits, the new role of General Manager Risk was created. The General Manager Risk is responsible for embedding QTC’s risk management policy and program in its business processes, so that there is a consistent approach toward risk mitigation across the organisation, and increased staff understanding of EwRM and what it means in managing their day-to-day work.
Information technology
QTC is implementing its largest and most significant upgrade to its technology since the introduction of the client services system more than a decade ago.
The outcomes of this project will provide customers with a new online environment where they can access products and services, use forecasting and calculating tools, and manage many of their routine transactions with QTC. As well as giving customers the convenience and flexibility of managing their finances whenever they choose, the new system will reduce manual and phone transactions, providing QTC with efficiencies that will allow it to focus more resources on strategic financial and risk management advice and support.
Work began on the design of the new system in 2009 and has continued throughout the 2009–10 financial year. Within QTC, it involves integrating previously separate systems and tools, as well as a total upgrade of our website. Progress during the year included the delivery of the base system (with some QTC modifications) from the provider, Temenos, completion of the Future Cash Flows module, and the establishment of a customer reference group.
The new system is now scheduled to be launched in 2011.
QUEENSLAND TREASURY CORPORATION ANNUAL REPORT 2009–2010 18
A message from Sir Leo
| | | | |
| IMPRESSIVELY, SINCE ITS INCEPTION IN 1988, QTC HAS NOT ONLY FUNDED THE QUEENSLAND PUBLIC SECTOR CAPITAL WORKS PROGRAMS BUT, IN DOING SO, HAS ALSO SAVED THE STATE MORE THAN $2.3 BILLION. | | I have been honoured to have held the Chairmanship of this unique and highly successful organisation for the past 22 years. This role has been a clear highlight of my 60 plus years of serving the Queensland Government and, understandably, my retirement on 30 June 2010 came with a degree of personal sadness. I am particularly proud of the remarkable economic advancements and world-class infrastructure this State has achieved, many with the integral support of QTC. It is the development of this infrastructure that has enabled Queensland to tap into the benefits of globalisation, and ensured the Queensland economy has outperformed both Australia’s and its other states’ economies over the past 20 years. Since its inception in 1988, QTC has developed an excellent reputation in the domestic and international financial marketplace, which has been crucial to its success in funding Queensland’s development. Our customers, the Queensland public sector, have benefited from some of the lowest cost of funds available, made possible through QTC’s unique economies of scale and scope, and the opportunity we have had to seek out the best deals available. Impressively, since its inception in 1988, QTC has not only funded the Queensland public sector capital works programs but, in doing so, has also saved the State more than $2.3 billion. I have no doubt that QTC’s funding and advisory products and services, together with its continued focus on achieving quality customer outcomes, ensure that it will continue to perform to the highest standard. | | The organisation’s knowledge, flexibility and foresight have been vital as we have successfully negotiated changing economic landscapes, particularly the recent global financial crisis and its aftermath. This year was marked by yet another milestone in QTC’s history, with the raising and managing of the State’s largest borrowing program ($20 billion) on record. While this brings a whole new set of challenges, I am confident QTC will continue to adapt and to find innovative solutions in the new environments ahead. I am delighted that Stephen Rochester has been appointed as my successor to the Chairmanship of QTC*. Having worked closely with Stephen over the past 31 years in making QTC what it is today, I know he will bring incomparable understanding and vision to his stewardship role. I thank the many people on both the QTC Board and among the staff who have supported me over the years and I look forward to a continuing association with this organisation that is such an important pillar in Queensland’s successful economic growth. 
SIR LEO HIELSCHER AC Foundation Chairman * Stephen Rochester has been appointed QTC Chairman from 1 September 2010. QTC Deputy Chairman, Alex Beavers, is fulfilling the role of QTC Chairman for the months of July and August 2010. |

Sir Leo Hielscher AC Foundation Chairman | | | | |
QUEENSLAND TREASURY CORPORATION ANNUAL REPORT 2009–2010 19
Queensland Treasury Corporation Board 2009–2010
| | | | | | |

Sir Leo Hielscher AC B COMM, D UNIV GRIFFITH (HON), AAUQ, AASA, FAIM, FCPA, FFTP (HON) Chairman Appointed 1988 Retired 30 June 2010 Appointed Foundation Chairman 1 July 2010 Board Committees Chairman, Human Resources Committee Member, Risk Management Committee Sir Leo Hielscher AC has more than 68 years’ experience in the areas of Government, the banking and finance industry, domestic and global financial markets, the superannuation industry and as an independent company director. He was the Under Treasurer of Queensland for 14 years (1974–1988) before his appointment as Chairman of the Queensland Treasury Corporation (Advisory Board) in 1988. In 1991, the Advisory Board became the Queensland Treasury Corporation Board and Sir Leo was appointed as its inaugural Chairman. Sir Leo is also Chairman of Austsafe Ltd, the Independent Superannuation Preservation Fund, and a Director of the American Australian Association Ltd. As a company director, Sir Leo has considerable experience at board level and has been associated with a number of public and private sector boards. | | 
Tim Spencer B SC (ECON) (HONS) Deputy Chairman Appointed 1 July 2007 Resigned 31 August 2009 Board Committees Member, Risk Management Committee Member, Accounts and Audit Committee Member, Human Resources Committee In January 2001, Tim Spencer joined Queensland Treasury as Deputy Under Treasurer. Prior to that, Mr Spencer was the South Australian Department of Treasury and Finance’s Executive Director of the Electricity Reform and Sale Unit. He has also held senior positions in the Australian and Australian Capital Territory governments. | | 
Alexander Beavers B COMM, DIP EC Deputy Chairman Appointed 1 September 2009 Tenure 30 June 2011 Board Committees Member, Risk Management Committee Member, Accounts and Audit Committee Member, Human Resource Committee Alex Beavers was appointed Queensland’s Deputy Under Treasurer in June 2009. Prior to this appointment, he was Deputy Director-General, Policy, in the Department of the Premier and Cabinet, with responsibility for leading the Government’s policy coordination processes and managing policy advice preparation for the Premier. Mr Beavers has also previously held the role of Assistant Under Treasurer with responsibility for Queensland’s fiscal strategy and taxation policy, as well as other roles within Queensland Treasury over the past 15 years. | | 
Gillian Brown LLB (HONS), GRAD DIP APPLIED FINANCE AND INVESTMENT, SIA Appointed 1 July 2004 Tenure 30 June 2011 Board Committees Chairman, Risk Management Committee Gillian Brown has more than 20 years’ experience as a specialist finance lawyer and has gained extensive corporate, financing and major project experience. She is a partner of Minter Ellison Lawyers in Queensland, heading the finance practice, and is a past Chairman of that firm. Ms Brown’s principal areas of practice include corporate finance, investment and financial services, financial markets, project and infrastructure finance, and property finance. Ms Brown has advised government bodies on a number of project and transactional arrangements and has an in depth knowledge of the mechanics of government and its objectives. Ms Brown is a director of Dalrymple Bay Coal Terminal Holdings Pty Ltd, and the Australian Rail Track Corporation Limited (from 30 June 2010), and a committee member of the Law Council of Australia. |
QUEENSLAND TREASURY CORPORATION ANNUAL REPORT 2009–2010 20
| | | | | | |
Sir Leo was awarded an Eisenhower Fellowship in 1973, a Knight Bachelor in 1987, an Honorary Doctorate of Griffith University in 1993, and a Companion in the Order of Australia (AC) in the General Division in 2004. He was honoured as a ‘Queensland Great’ by the Queensland Government in 2007. | | The Queensland Treasury Corporation Capital Markets Board guides QTC’s commitment to achieving high standards of corporate governance, accountability, compliance and financial and ethical behaviour, which is critical for maintaining our strong market reputation and the confidence of our customers and stakeholders. The composition of our Board equips QTC with diverse corporate, financial, commercial, economic and legal skills. |
QUEENSLAND TREASURY CORPORATION ANNUAL REPORT 2009–2010 21
| | | | | | |

John Dawson AM B ARTS, GRAD AMP(UNI HAWAII), FAICD Appointed 1 September 2008 Tenure 30 June 2011 Board Committees Member, Risk Management Committee Member, Accounts and Audit Committee John Dawson AM has more than 36 years’ experience in the banking and finance industry, including having held the position of Chief Executive Officer for the Bank of Queensland (1996–2001) and senior positions with the National Australia Bank, National Australia Group (United Kingdom) and Australia–Japan International Finance. Throughout his career, he has played an integral role in steering the strategic direction of various banks in Australia, Asia and the UK and, between 2001 and 2007, was the Queensland Government’s Agent General for Queensland and Commissioner for Europe, Russia and Africa. | | 
Marian Micalizzi B BUS, FCA Appointed 1 July 2000 Tenure 30 June 2014 Board Committees Member, Accounts and Audit Committee Member, Risk Management Committee Marian Micalizzi is a chartered accountant with more than 20 years’ experience, a company director and a consultant in both the public and private sectors. Ms Micalizzi is a former partner of PricewaterhouseCoopers, with considerable expertise and knowledge of specialist corporate financial and advisory services, financial institutions’ regulation and prudential supervision, and valuation-related assessments. She is also a director of Opera Queensland, Australian Reinsurance Pool Corporation; a member of Corporations and Markets Advisory Committee, the Independent Investment Committee of Queensland Development Fund, the Queensland Government’s Public Service Commission, and the Sunsuper Audit Committee. | | 
Bill Shields B ECON (HONS), M EC Appointed 1 July 2004 Tenure 30 June 2011 Board Committees Chairman, Accounts and Audit Committee Member, Risk Management Committee Bill Shields has considerable experience in the banking and finance industry, as well as government policy advice, specialising in economics. His career responsibilities have included economic and financial market research in Australia and overseas, and the provision of analytical and strategic advice on the Australian financial system and monetary policy, Australia’s exchange rate arrangements and international financial developments, as well as oversight of energy markets in Australia, New Zealand and Singapore. | | 
Shauna Tomkins B SC, MBA Appointed 1 July 2000 Tenure 30 June 2014 Board Committees Member, Risk Management Committee Member, Human Resources Committee Shauna Tomkins is a principal of Promontory Financial Group Australasia and works internationally in the development and implementation of regulatory frameworks for prudential supervision and corporate regulation of deposit-taking, funds management, insurance and lending institutions. Ms Tomkins has a thorough understanding of Australia’s financial system, risk management analysis, prudential supervision, and corporate and structured finance. She has specific expertise in long-term policy and strategic management and planning, and has an in-depth understanding of government objectives and processes. Ms Tomkins is a member of the Advisory Committee to Queensland’s Motor Accident Insurance Commission. |
QUEENSLAND TREASURY CORPORATION ANNUAL REPORT 2009–2010 22
| | | | | | |
Mr Dawson has previously held a range of board positions including chairman of the Australian Bankers Association Executive Committee, the Australian Banking Ombudsman Scheme and the Queensland Government’s Red Tape Reduction Task Force; directorships with the Clydesdale, Yorkshire, Northern and National Irish Banks, the Brisbane Institute, and the Britain–Australia Society; membership of the Bank of Hawaii International; and has also been a member of the Premier of Queensland’s Business Advisory Group, the Advisory Board to the QUT School of Business, and the UK Australia Leadership Forum 2003. | | | | Mr Shields was previously Chief Economist and Executive Director of Macquarie Bank Limited (1987–2001), and also held positions with the Reserve Bank of Australia (1983–1985), the International Monetary Fund (1973–1975 and 1977–1983), and the Australian Government’s Treasury. He was a Visiting Professor of the Macquarie Graduate School of Management at Macquarie University from 2001–09, and is currently a Director of the Sydney Anglican Schools Corporation; and a Director of the Australian College of Theology (and Chair of its Audit & Risk Management Committee). | | |
QUEENSLAND TREASURY CORPORATION ANNUAL REPORT 2009–2010 23
Corporate Governance
Queensland Treasury Corporation was established by the Queensland Treasury Corporation Act 1988 (QTC Act) as a corporation sole (ie, a corporation that consists solely of a nominated office holder). The Under Treasurer of Queensland is QTC’s nominated office holder.
QTC has delegated its powers to two boards, the Queensland Treasury Corporation Capital Markets Board (the Board), which was established in 1991 and manages all of QTC’s affairs other than those relating to certain superannuation and other long term assets, and the Long Term Asset Advisory Board, which was established in July 2008 and advises in relation to certain superannuation and other long-term assets that were transferred to QTC from Queensland Treasury on 1 July 2008.
QTC and the Board have agreed the terms and administrative arrangements that govern the exercise or performance of those powers and the reports by the Board to QTC.
Board composition
The Board comprises seven directors who are appointed by the Governor-in-Council, pursuant to section 10(2) of the QTC Act, with consideration given to each person’s qualifications, experience, skills, strategic ability, and commitment to contribute to QTC’s performance and achievement of its corporate objectives. QTC’s Chairman is a non-executive director, and the Board is entirely constituted of non-executive directors.
Board responsibilities
The Board operates in accordance with its charter, which sets out its commitment to various corporate governance principles and standards, the roles and responsibilities of the Board and its members, and the conduct of meetings. Within this scope, the roles and functions of the Board include:
| • | | overseeing QTC’s operations, including its control and accountability systems |
| • | | developing and monitoring QTC’s strategic and corporate plans, operational policy and yearly budget |
| • | | monitoring and measuring financial and operational performance |
| • | | monitoring and measuring organisational and staff performance, and |
| • | | monitoring key risks and risk management processes, and ensuring that QTC’s compliance is appropriate for an organisation of its type. |
Board committees
The Board has established three committees, each with its own terms of reference, to assist it to oversee and govern various QTC activities:
ACCOUNTS AND AUDIT COMMITTEE
The Accounts and Audit Committee has responsibility for the adequacy and effectiveness of internal controls, including for prevention of fraud, integrity of financial statements, and audit effectiveness.
The achievements of the Accounts and Audit Committee during the year included recommending the adoption of the half year and annual financial statements, review of external and internal audit reports, as well as reviewing progress in implementing recommendations from those reports, and review of the Queensland Audit Office’s Client Service Plan and the Internal Audit Plan.
As required by the Audit Committee Guidelines: Improving Accountability and Performance issued by Queensland Treasury, it is advised that the Accounts and Audit Committee has observed its terms of reference and has had due regard to the Audit Committee Guidelines.
RISK MANAGEMENT COMMITTEE
The Risk Management Committee has responsibility for:
| • | | the adequacy and implementation of QTC’s enterprise-wide risk management policy, framework and plans for the management of QTC’s significant corporate risks, and |
| • | | QTC’s organisation-wide risk profile and exposure to significant risks. |
The achievements of the Risk Management Committee during the year included monitoring the efficient and effective implementation and management of enterprise-wide risk management at QTC, and reviewing and approving changes to the QTC’s significant risks, including changes to risk assessment and controls.
The Risk Management Committee has observed its terms of reference.
HUMAN RESOURCES COMMITTEE
The Human Resources Committee has responsibility for:
| • | | the appropriateness of any new or amended human resources policy |
| • | | the framework for, and review of, employee remuneration and performance, and |
| • | | employment terms and conditions. |
The Human Resources Committee has observed its terms of reference.
QUEENSLAND TREASURY CORPORATION ANNUAL REPORT 2009–2010 24
| | | | | | | | | | | | | | | | |
| | | BOARD MEETINGS | | | RISK MANAGEMENT
COMMITTEE | | | ACCOUNTS AND AUDIT
COMMITTEE | | | HUMAN RESOURCES
COMMITTEE | |
MEETINGS HELD | | | 11 | | | | 6 | | | | 5 | | | | 3 | |
Sir Leo Hielscher AC | | | 10 | | | | 5 | | | | — | | | | 3 | |
Tim Spencer# | | | 1 | | | | 1 | | | | 2 | | | | — | |
Alex Beavers* | | | 8 | | | | 4 | | | | 3 | | | | 2 | |
Gillian Brown | | | 11 | | | | 6 | | | | — | | | | — | |
John Dawson AM | | | 11 | | | | 6 | | | | 3 | | | | — | |
Marian Micalizzi | | | 11 | | | | 6 | | | | 5 | | | | — | |
Bill Shields | | | 10 | | | | 5 | | | | 5 | | | | — | |
Shauna Tomkins | | | 11 | | | | 6 | | | | — | | | | 3 | |
| # | Tim Spencer resigned on 31 August 2009. |
| * | Alex Beavers was appointed on 1 September 2009. |
Commitment to corporate governance
The Board and organisational management team endorse and are committed to achieving high standards of corporate governance, accountability, compliance and ethical behaviour. The Board guides this commitment, which is critical for maintaining QTC’s strong market reputation, as well as the ability to achieve success as Queensland’s corporate treasury services provider.
QTC has benchmarked its corporate governance practices, so far as they are relevant and appropriate to QTC, against the Australian Stock Exchange’s Corporate Governance Principles and Recommendations (which are not mandatory for QTC), and the Australian Standard 8000–2003 Good Governance Principles. QTC’s corporate governance practices are continually reviewed and updated, as part of a rolling system of appraisal, to reflect industry guidelines and standards. QTC also maintains a commitment to a continuous disclosure regime with its key stakeholders, a code of conduct that applies to all staff and includes procedures about disclosing conflicts of interest and a compliance program that drives a compliance culture consistent with QTC’s approved mandate and legal and ethical obligations.
Auditors
In accordance with the provisions of the Auditor-General Act 2009, the Queensland Audit Office is the external auditor for QTC. The Queensland Audit Office has the responsibility for providing Queensland’s Parliament with assurances as to the adequacy of QTC’s discharge of its financial and administrative obligations.
QTC has an established internal audit function, which it undertakes by outsourcing the internal audits. QTC’s current internal auditor is KPMG.
Long Term Asset Advisory Board
The Long Term Asset Advisory Board was established in July 2008, following the transfer of certain superannuation and other long-term assets (Long Term Assets) in July 2008 from Treasury to QTC (for reasons relating to market volatility).
The members of LTAAB are:
| | |
| NAME | | POSITION |
| |
Under Treasurer | | Chairperson |
Chief Executive of QSuper | | Member |
The State Actuary | | Member |
Assistant Under Treasurer | | Member |
Assistant Under Treasurer | | Member |
Deputy Under Treasurer | | Member |
The Long Term Asset Advisory Board has power delegated from QTC to:
| • | | manage the sufficiency of the funding of the long term assets |
| • | | set investment objectives and strategies for the long term assets |
| • | | set the appropriate investment structure for the long term assets, and |
| • | | monitor investment performance of the long term assets. |
QUEENSLAND TREASURY CORPORATION ANNUAL REPORT 2009–2010 25
Economic and Fiscal Report
| | | | |
| PUBLIC FINAL DEMAND WAS ESTIMATED TO GROW 6 1/4% IN 2009–10, REFLECTING INCREASING INFRASTRUCTURE INVESTMENT AS WELL AS GOVERNMENT SPENDING IN VITAL SERVICES. | | Queensland’s economic outlook 2009–10 ECONOMIC HIGHLIGHTS • At the time of the State Budget, economic growth in Queensland was estimated to have strengthened to 3% in 2009–10, largely due to a recovery in the trade sector and public sector stimulus. • Household consumption growth was estimated to have remained subdued, at 2% in 2009–10, reflecting the passing of federal stimulus payments in 2008–09 and weaker growth in employment and wages. • Business investment was estimated to have fallen by 16 1/2% in 2009–10, as tight credit conditions weighed on commercial property and a subdued recovery in business confidence limited machinery and equipment investment. • In contrast, export growth was estimated to have reached 6 3/4% in 2009–10, reflecting emerging Asia’s increased demand for coal imports and a turnaround in interstate tourism due to improving national conditions. • Public final demand was estimated to grow 6 1/4% in 2009–10, reflecting increasing infrastructure investment as well as government spending in vital services. • Labour force growth outpaced jobs growth in 2009–10. As a result, the State’s unemployment rate increased from 4.4% in 2008–09 to 5.7%. | | KEY ECONOMIC VARIABLES 2009–10 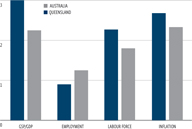
Notes: GSP/GDP figures are estimated actuals, all others actuals. Source: Queensland Treasury, Australian Treasury and ABS 6202.0 and 6401.0. |
QUEENSLAND TREASURY CORPORATION ANNUAL REPORT 2009–2010 26
ECONOMIC OUTLOOK
| • | | The Queensland economy is forecast to grow by 3 3/4% in 2010–11, driven by exports growth and some recovery in investment. Growth is forecast to reach its long-run average rate of 4 1/2% in 2011–12, led by more broad-based growth in business investment and stronger consumption growth. |
| • | | Household consumption growth is forecast to strengthen to 3 1/2% in 2010–11 and 4% in 2011–12, initially driven by some recovery in household wealth over the past year, while a rebound in dwelling investment and stronger jobs growth will support consumer spending over the long term. However, consumers will remain cautious as higher interest rates are expected to limit growth in household disposable incomes. |
| • | | Dwelling investment is forecast to rise 6 3/4% in 2010–11, with strong population growth to support underlying demand for housing. Growth is forecast to reach 13 1/2% in 2011–12, as better access to finance and improved consumer confidence support medium- to high-density construction and renovations respectively. |
| • | | Business investment is forecast to grow 9 1/2% in 2010–11, as a recovery in business confidence underpins machinery and equipment investment and resource sector activity gathers momentum. Growth is expected to accelerate to 17 3/4% in 2011–12, as access to finance improves and higher household demand and employment encourage retail and commercial office property construction. |
| • | | Exports are forecast to grow by 5 1/4% in 2010–11 and 5 1/2% in 2011–12. Strong growth reflects increasing demand from Asia for the State’s coal and base metals, as well as a recovery in agricultural sector production. |
CONTRIBUTIONS TO GROWTH IN QUEENSLAND’S GROSS STATE PRODUCT
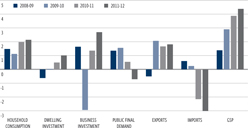
Notes:
Contributions for 2009–10 represent estimated actuals; contributions for 2010–11 and 2011–12 are forecasts.
Source: Queensland Treasury.
INFLATION
| • | | Inflation is forecast to be 3% in 2010–11 and 2011–12. Despite forecast improvements in labour conditions and a recovery in construction activity, inflation is expected to remain below its average of 3 1/4%, as modest growth in consumer demand subdues price growth for discretionary goods and services. |
EMPLOYMENT
| • | | Employment is expected to grow by 2 3/4% in 2010–11 and 3 1/4% in 2011–12, exceeding labour force growth in both years. As a result, the year-average unemployment rate is expected to fall to 5 1/4% in 2011–12, after peaking at 5.7% in 2009–10. |
QUEENSLAND TREASURY CORPORATION ANNUAL REPORT 2009–2010 27
Economic and Fiscal Report (CONTINUED)
Queensland’s fiscal environment
2010–11 BUDGETED RESULT
KEY FINANCIAL AGGREGATES UNIFORM PRESENTATION BASIS
| | | | | | | | | | | | | | | | | | | | | | | | |
| | | 2008–09 ACTUAL2
$ MILLION | | | 2009–10 EST. ACT.
$ MILLION | | | 2010–11 BUDGET
$ MILLION | | | 2011–12 PROJECTION
$ MILLION | | | 2012–13 PROJECTION
$ MILLION | | | 2013–14 PROJECTION
$ MILLION | |
|
GENERAL GOVERNMENT SECTOR – KEY FINANCIAL AGGREGATES1 | |
Revenue | | | 37 008 | | | | 39 689 | | | | 40 606 | | | | 41 938 | | | | 43 453 | | | | 45 298 | |
Expenses | | | 36 974 | | | | 39 976 | | | | 42 352 | | | | 43 380 | | | | 44 935 | | | | 46 693 | |
Net operating balance | | | 35 | | | | (287 | ) | | | (1 745 | ) | | | (1 442 | ) | | | (1 482 | ) | | | (1 395 | ) |
Cash surplus/(deficit) | | | (2 839 | ) | | | (5 254 | ) | | | (6 396 | ) | | | (4 648 | ) | | | (2 906 | ) | | | (1 507 | ) |
Capital purchases | | | 6 960 | | | | 8 626 | | | | 8 335 | | | | 7 490 | | | | 5 751 | | | | 4 628 | |
Net borrowing | | | 3 728 | | | | 5 182 | | | | 7 629 | | | | 6 733 | | | | 4 657 | | | | 3 191 | |
Gross borrowing | | | 10 278 | | | | 15 524 | | | | 23 250 | | | | 30 080 | | | | 34 756 | | | | 37 967 | |
Net worth | | | 184 619 | | | | 187 607 | | | | 188 564 | | | | 190 119 | | | | 192 017 | | | | 194 326 | |
Net debt | | | (19 281 | ) | | | (13 206 | ) | | | (6 743 | ) | | | (1 294 | ) | | | 2 095 | | | | 3 707 | |
Notes:
| 1. | Numbers may not add due to rounding. |
| 2. | Reflects published actuals. |
Queensland’s medium-term fiscal outlook has improved since the publication of the 2009–10 Budget. This reflects upward revisions to economic growth, both domestically and internationally, largely as a result of substantial monetary and fiscal stimulus, which reduced the severity and duration of the economic downturn. However, economic growth was below trend in 2008–09 and is expected to also be below trend in 2009–10 and 2010–11. As a result, economic activity has not returned to the same trajectory as prior to the global financial crisis, nor have Queensland’s revenues.
FORECAST OPERATING POSITION AT THE 2009–10 BUDGET, 2009–10 MID-YEAR FISCAL AND ECONOMIC REVIEW AND THE 2010–11 BUDGET
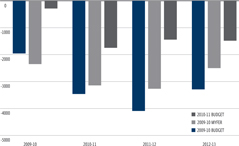
QUEENSLAND TREASURY CORPORATION ANNUAL REPORT 2009–2010 28
Although the State’s fiscal and economic outlook has improved in the past 12 months, there is still a significant degree of uncertainty in regard to the strength and speed of recovery.
The Government is committed to the infrastructure assets reform and sale program announced in June 2009. The program of asset sales will play an important role in funding the Government’s infrastructure program, reducing State debt and encouraging private provision of infrastructure. The impact of asset sales has not been factored into the Budget estimates, other than the sale of Forestry Plantations Queensland, which has now occurred.
The State Budget projects a whole-of-State capital program of $17.1 billion in 2010–11, which is forecast to support 106,000 full-time jobs. This will both boost productivity and support employment, with the size of the capital program decreasing over the forward estimates as private sector investment grows.
2009–10 ESTIMATED ACTUAL RESULT
The operating balance expected for 2009–10 is a deficit of $287 million compared to a deficit of $2.351 billion forecast in the Mid Year Fiscal and Economic Review (MYFER). The improvement in the forecast net operating balance since the MYFER primarily reflects increased Australian Government payments, including the bring-forward of funding for transport projects. There have also been upward revisions to royalty and GST revenue.
PATH BACK TO SURPLUS
Returning the Budget to surplus is a central element of the Government’s revised fiscal principles. A number of key initiatives established in the 2009–10 Budget, such as the 2.5% limit on public sector wage increases and the abolition of the Queensland Fuel Subsidy Scheme, underpin the projected return to surplus.
The fiscal principle relating to the General Government net operating balance requires the Government to achieve a General Government net operating surplus as soon as possible, but no later than 2015–16. The chart below indicates the Government is now on track to achieve this goal by tracking solidly into surplus in 2015–16.
Queensland projects the operating deficit to peak in 2010–11, associated with the withdrawal of Australian Government stimulus payments, before improving across the forward estimates.
GENERAL GOVERNMENT SECTOR NET OPERATING BALANCE, 2005–06 TO 2016–17 AS AT 2010–11 STATE BUDGET
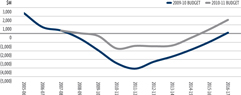
QUEENSLAND TREASURY CORPORATION ANNUAL REPORT 2009–2010 29
Economic and Fiscal Report (CONTINUED)
BALANCE SHEET
Queensland’s balance sheet is expected to remain strong in 2010–11 with State net worth projected to rise by $957 million through the year to $188.6 billion.
The following chart shows the State’s strong net worth, which is 65.5% greater than the average per capita net worth of the other states.
INTER-JURISDICTIONAL COMPARISON OF PROJECTED PER CAPITA NET WORTH AT 30 JUNE 2011
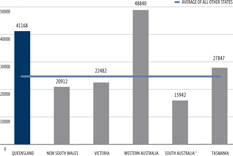
Note:
| 1. | All States, with the exception of SA, value land under roads as part of their overall asset base. NSW does not include land under roads acquired pre 1 July 2008. |
Source: State Budget Papers for Qld, NSW, Vic and WA. Mid-year review for SA. Population data from Australian Government Budget Paper No.3, 2010–11.
Queensland’s level of liquidity continues to be in excess of the other states as illustrated in the following chart.
PROJECTED RATIO OF FINANCIAL ASSETS TO LIABILITIES (EXCLUDING INVESTMENTS IN PUBLIC ENTERPRISES) AT 30 JUNE 2011 GENERAL GOVERNMENT SECTOR
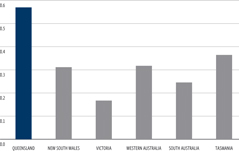
Sources: State Budget Papers for Qld, Vic, WA, NSW and Tas. Mid-year review for SA.
QUEENSLAND TREASURY CORPORATION ANNUAL REPORT 2009–2010 30
Financial Statements FOR THE YEAR ENDED 30 JUNE 2010
| | | | |
| Contents | | | | |
Statement of Comprehensive Income | | | 32 | |
Balance Sheet | | | 33 | |
Statement of Changes in Equity | | | 34 | |
Statement of Cash Flows | | | 35 | |
Notes to and Forming Part of the Financial Statements | | | 36 | |
Certificate of the Queensland Treasury Corporation | | | 74 | |
Independent Auditor’s Report | | | 75 | |
Management Report | | | 77 | |
QUEENSLAND TREASURY CORPORATION ANNUAL REPORT 2009–2010 31
Statement of Comprehensive Income FOR THE YEAR ENDED 30 JUNE 2010
| | | | | | | | | | | | |
| | | NOTE | | | 2010
$000 | | | 2009
$000 | |
Capital markets operations | | | | | | | | | | | | |
NET INTEREST INCOME | | | | | | | | | | | | |
Interest income | | | 4 | | | | 5 278 630 | | | | 4 859 824 | |
Interest expense | | | 4 | | | | (5 096 925 | ) | | | (4 825 271 | ) |
| | | | | | | | | | | | |
| | | | | | | 181 705 | | | | 34 553 | |
| | | | | | | | | | | | |
OTHER INCOME | | | | | | | | | | | | |
Fees – management | | | 6 | | | | 50 142 | | | | 41 380 | |
Fees – professional | | | | | | | 666 | | | | 545 | |
Fees – other | | | | | | | 480 | | | | 498 | |
Amortisation of cross border lease deferred income | | | | | | | 38 151 | | | | 8 597 | |
Lease income | | | | | | | 20 905 | | | | 17 555 | |
Gain on sale of property, plant and equipment | | | | | | | — | | | | 1 312 | |
| | | | | | | | | | | | |
| | | | | | | 110 344 | | | | 69 887 | |
| | | | | | | | | | | | |
EXPENSES | | | | | | | | | | | | |
Administration expenses | | | 7 | | | | (34 519 | ) | | | (39 156 | ) |
Depreciation on leased assets | | | | | | | (14 152 | ) | | | (11 932 | ) |
Loss on sale of property, plant and equipment | | | | | | | (70 | ) | | | — | |
Provisions – cooperative housing societies | | | | | | | (8 | ) | | | (42 | ) |
| | | | | | | | | | | | |
| | | | | | | (48 749 | ) | | | (51 130 | ) |
| | | | | | | | | | | | |
Share of associate’s net profit | | | | | | | 210 | | | | 120 | |
| | | | | | | | | | | | |
Profit from capital markets operations before income tax | | | | | | | 243 510 | | | | 53 430 | |
| | | | | | | | | | | | |
Income tax expense | | | 8 | | | | (34 074 | ) | | | (10 227 | ) |
| | | | | | | | | | | | |
Profit from capital markets operations after income tax | | | | | | | 209 436 | | | | 43 203 | |
| | | | | | | | | | | | |
| | | |
Long term assets | | | | | | | | | | | | |
NET RETURN FROM INVESTMENTS IN LONG TERM ASSETS | | | | | | | | | | | | |
Net change in fair value of unit trusts | | | 5 | | | | 2 290 696 | | | | (3 032 408 | ) |
Interest on fixed rate note | | | | | | | (1 637 219 | ) | | | (1 558 543 | ) |
Management fees - QIC | | | | | | | (66 641 | ) | | | (47 520 | ) |
| | | | | | | | | | | | |
Profit/(loss) from long term assets | | | | | | | 586 836 | | | | (4 638 471 | ) |
| | | | | | | | | | | | |
Total net profit/(loss) for the period after tax | | | | | | | 796 272 | | | | (4 595 268 | ) |
| | | | | | | | | | | | |
Total comprehensive income attributable to the owners | | | | | | | 796 272 | | | | (4 595 268 | ) |
| | | | | | | | | | | | |
TOTAL COMPREHENSIVE INCOME DERIVED FROM: | | | | | | | | | | | | |
Capital markets operations | | | 3 | | | | 209 436 | | | | 43 203 | |
Long term assets | | | 3 | | | | 586 836 | | | | (4 638 471 | ) |
| | | | | | | | | | | | |
Total comprehensive income | | | | | | | 796 272 | | | | (4 595 268 | ) |
| | | | | | | | | | | | |
The notes on pages 34 to 68 are an integral part of these financial statements.
| | |
| Note: | | Throughout these financial statements the capital markets operations and the long term assets operations have been disclosed separately to distinguish between QTC’s main central treasury management role and its additional responsibilities following the transfer of the State’s superannuation and other long-term assets on 1 July 2008 (refer notes 1 and 3). |
QUEENSLAND TREASURY CORPORATION ANNUAL REPORT 2009–2010 32
Balance Sheet AS AT 30 JUNE 2010
| | | | | | | | | | | | |
| | | NOTE | | | 2010
$000 | | | 2009
$000 | |
Assets | | | | | | | | | | | | |
CAPITAL MARKETS OPERATIONS | | | | | | | | | | | | |
Cash | | | | | | | — | | | | 814 | |
Receivables | | | 9 | | | | 12 506 | | | | 10 672 | |
Financial assets at fair value through profit or loss | | | 10 | | | | 18 694 006 | | | | 26 474 512 | |
Derivative financial assets | | | 11 | | | | 367 707 | | | | 493 249 | |
Onlendings | | | 12 | | | | 55 113 222 | | | | 44 407 516 | |
Property, plant and equipment | | | 13 | | | | 185 101 | | | | 125 252 | |
Investments accounted for using the equity method | | | 31 | | | | 672 | | | | 492 | |
Intangible assets | | | 14 | | | | 9 762 | | | | 2 761 | |
Deferred income tax assets | | | 8 | | | | 2 196 | | | | 2 257 | |
| | | | | | | | | | | | |
| | | | | | | 74 385 172 | | | | 71 517 525 | |
| | | | | | | | | | | | |
LONG TERM ASSETS | | | | | | | | | | | | |
Financial assets at fair value through profit or loss | | | 10 | | | | 19 201 500 | | | | 17 470 034 | |
| | | | | | | | | | | | |
| | | | | | | 19 201 500 | | | | 17 470 034 | |
| | | | | | | | | | | | |
Total Assets | | | | | | | 93 586 672 | | | | 88 987 559 | |
| | | | | | | | | | | | |
| | | |
Liabilities | | | | | | | | | | | | |
CAPITAL MARKETS OPERATIONS | | | | | | | | | | | | |
Bank overdraft | | | | | | | 1 167 | | | | — | |
Payables | | | 15 | | | | 176 974 | | | | 208 322 | |
Tax liabilities | | | 8 | | | | 34 036 | | | | 11 139 | |
Derivative financial liabilities | | | 16 | | | | 81 346 | | | | 544 973 | |
Financial liabilities at fair value through profit or loss | | | | | | | | | | | | |
- Interest-bearing liabilities | | | 17 | | | | 68 885 406 | | | | 62 624 234 | |
- Customer deposits | | | 17 | | | | 4 660 960 | | | | 7 793 010 | |
| | | | | | | | | | | | |
| | | | | | | 73 839 889 | | | | 71 181 678 | |
| | | | | | | | | | | | |
LONG TERM ASSETS | | | | | | | | | | | | |
Financial liabilities at amortised cost | | | 18 | | | | 23 253 135 | | | | 22 108 505 | |
| | | | | | | | | | | | |
| | | | | | | 23 253 135 | | | | 22 108 505 | |
| | | | | | | | | | | | |
Total Liabilities | | | | | | | 97 093 024 | | | | 93 290 183 | |
| | | | | | | | | | | | |
Net Assets | | | | | | | (3 506 352 | ) | | | (4 302 624 | ) |
| | | | | | | | | | | | |
| | | |
Equity | | | | | | | | | | | | |
CAPITAL MARKETS OPERATIONS | | | | | | | | | | | | |
Reserves | | | 19 | | | | 195 863 | | | | 189 914 | |
Retained surplus | | | | | | | 349 420 | | | | 145 933 | |
| | | | | | | | | | | | |
| | | | | | | 545 283 | | | | 335 847 | |
| | | | | | | | | | | | |
LONG TERM ASSETS | | | | | | | | | | | | |
Retained deficit | | | | | | | (4 051 635 | ) | | | (4 638 471 | ) |
| | | | | | | | | | | | |
| | | | | | | (4 051 635 | ) | | | (4 638 471 | ) |
| | | | | | | | | | | | |
Total Equity | | | | | | | (3 506 352 | ) | | | (4 302 624 | ) |
| | | | | | | | | | | | |
The notes on pages 34 to 68 are an integral part of these financial statements.
QUEENSLAND TREASURY CORPORATION ANNUAL REPORT 2009–2010 33
Statement of Changes in Equity FOR THE YEAR ENDED 30 JUNE 2010
| | | | | | | | | | | | | | | | | | | | | | | | | | | | |
| | | | | | CAPITAL MARKETS OPERATIONS | | | LONG TERM ASSETS | | | TOTAL | |
| | | NOTE | | | GENERAL
RESERVE
$000 | | | CREDIT RISK
RESERVE
$000 | | | BASIS RISK
RESERVE
$000 | | | RETAINED
SURPLUS
$000 | | | RETAINED
SURPLUS
$000 | | | EQUITY
$000 | |
| | | | | | | |
Balance at 1 July 2008 | | | | | | | 39 082 | | | | 34 000 | | | | 53 500 | | | | 166 062 | | | | — | | | | 292 644 | |
Profit/(loss) for the year | | | | | | | — | | | | — | | | | — | | | | 43 203 | | | | (4 638 471 | ) | | | (4 595 268 | ) |
Transfer from/(to) retained surplus | | | 19 | | | | — | | | | 92 332 | | | | (29 000 | ) | | | (63 332 | ) | | | — | | | | — | |
| | | | | | | | | | | | | | | | | | | | | | | | | | | | |
Balance at 30 June 2009 | | | | | | | 39 082 | | | | 126 332 | | | | 24 500 | | | | 145 933 | | | | (4 638 471 | ) | | | (4 302 624 | ) |
| | | | | | | | | | | | | | | | | | | | | | | | | | | | |
Balance at 1 July 2009 | | | | | | | 39 082 | | | | 126 332 | | | | 24 500 | | | | 145 933 | | | | (4 638 471 | ) | | | (4 302 624 | ) |
Profit for the year | | | | | | | — | | | | — | | | | — | | | | 209 436 | | | | 586 836 | | | | 796 272 | |
Transfer (to)/from retained surplus | | | 19 | | | | (39 082 | ) | | | 7 031 | | | | 38 000 | | | | (5 949 | ) | | | — | | | | — | |
| | | | | | | | | | | | | | | | | | | | | | | | | | | | |
Balance at 30 June 2010 | | | | | | | — | | | | 133 363 | | | | 62 500 | | | | 349 420 | | | | (4 051 635 | ) | | | (3 506 352 | ) |
The notes on pages 34 to 68 are an integral part of these financial statements.
QUEENSLAND TREASURY CORPORATION ANNUAL REPORT 2009–2010 34
Statement of Cash Flows FOR THE YEAR ENDED 30 JUNE 2010
| | | | | | | | | | | | |
| | | NOTE | | | 2010
$000 | | | 2009
$000 | |
| | | |
Capital markets operations | | | | | | | | | | | | |
CASH FLOWS FROM OPERATING ACTIVITIES | | | | | | | | | | | | |
Interest received from onlendings | | | | | | | 3 988 915 | | | | 3 509 921 | |
Interest received from investments | | | | | | | 1 054 382 | | | | 974 054 | |
Interest received from operating leases | | | | | | | 21 802 | | | | 18 655 | |
Fees received - management | | | | | | | 50 245 | | | | 41 373 | |
Fees received - professional | | | | | | | 774 | | | | 767 | |
Fees received - other | | | | | | | 342 | | | | 591 | |
GST paid to suppliers | | | | | | | (9 831 | ) | | | (12 458 | ) |
GST refunds from ATO | | | | | | | 8 088 | | | | 8 038 | |
GST paid to ATO | | | | | | | (3 892 | ) | | | (6 382 | ) |
GST received from customers | | | | | | | 3 058 | | | | 7 310 | |
Interest paid on interest-bearing liabilities | | | | | | | (3 651 142 | ) | | | (2 236 357 | ) |
Interest paid on deposits | | | | | | | (160 341 | ) | | | (395 893 | ) |
Administration expenses paid | | | | | | | (32 748 | ) | | | (26 753 | ) |
Income tax paid | | | | | | | (11 116 | ) | | | (15 942 | ) |
| | | | | | | | | | | | |
Net cash provided by operating activities | | | 20 | | | | 1 258 536 | | | | 1 866 924 | |
| | | | | | | | | | | | |
CASH FLOWS FROM INVESTING ACTIVITIES | | | | | | | | | | | | |
Proceeds from sale of investments | | | | | | | 60 774 293 | | | | 63 763 166 | |
Payments for investments | | | | | | | (53 005 888 | ) | | | (73 276 552 | ) |
Net onlendings | | | | | | | (10 530 339 | ) | | | (11 873 026 | ) |
Payments for property, plant and equipment | | | | | | | (74 639 | ) | | | (81 198 | ) |
Payments for intangibles | | | | | | | (7 118 | ) | | | (2 124 | ) |
Proceeds from sale of property, plant and equipment | | | | | | | 45 | | | | 16 425 | |
Dividend received | | | | | | | 30 | | | | 63 | |
| | | | | | | | | | | | |
Net cash used in investing activities | | | | | | | (2 843 616 | ) | | | (21 453 246 | ) |
| | | | | | | | | | | | |
CASH FLOWS FROM FINANCING ACTIVITIES | | | | | | | | | | | | |
Proceeds from interest-bearing liabilities | | | | | | | 52 041 349 | | | | 53 945 626 | |
Repayment of interest-bearing liabilities | | | | | | | (47 194 597 | ) | | | (34 378 943 | ) |
Net deposits | | | | | | | (3 263 653 | ) | | | 19 081 | |
| | | | | | | | | | | | |
Net cash provided by financing activities | | | | | | | 1 583 099 | | | | 19 585 764 | |
| | | | | | | | | | | | |
Net decrease in cash held | | | | | | | (1 981 | ) | | | (558 | ) |
Cash at 1 July | | | | | | | 814 | | | | 1 372 | |
| | | | | | | | | | | | |
Net cash at 30 June | | | | | | | (1 167 | ) | | | 814 | |
| | | | | | | | | | | | |
LONG TERM ASSETS
No external cashflow is generated from the long term assets (refer notes 1 and 3).
The notes on pages 34 to 68 are an integral part of these financial statements.
QUEENSLAND TREASURY CORPORATION ANNUAL REPORT 2009–2010 35
Notes to and Forming Part of the Financial Statements
FOR THE YEAR ENDED 30 JUNE 2010
Contents
| | | | | | |
NOTE | | PAGE | |
1. | | General information | | | 36 | |
2. | | Summary of significant accounting policies | | | 36 | |
3. | | Segment reporting | | | 43 | |
4. | | Interest income and interest expense from capital markets operations | | | 45 | |
5. | | Net change in fair value of unit trusts | | | 47 | |
6. | | Fee revenue | | | 47 | |
7. | | Administration expenses | | | 47 | |
8. | | Income tax expense | | | 48 | |
9. | | Receivables | | | 49 | |
10. | | Financial assets at fair value through profit or loss | | | 49 | |
11. | | Derivative financial assets | | | 50 | |
12. | | Onlendings | | | 51 | |
13. | | Property, plant and equipment | | | 52 | |
14. | | Intangible assets | | | 52 | |
15. | | Payables | | | 53 | |
16. | | Derivative financial liabilities | | | 53 | |
17. | | Financial liabilities at fair value through profit or loss | | | 53 | |
18. | | Financial liabilities at amortised cost | | | 55 | |
19. | | Reserves | | | 56 | |
20. | | Notes to the Statement of Cash Flows | | | 57 | |
21. | | Financial risk management | | | 58 | |
22. | | Fair value hierarchy | | | 65 | |
23. | | Concentrations of borrowings and deposits | | | 67 | |
24. | | Contingent liabilities | | | 67 | |
25. | | Leases | | | 68 | |
26. | | Forward starting fixed rate loan commitments | | | 69 | |
27. | | Funding facilities | | | 69 | |
28. | | Related party transactions | | | 69 | |
29. | | Key management personnel | | | 70 | |
30. | | Remuneration of officers | | | 71 | |
31. | | Auditor’s remuneration | | | 71 | |
32. | | Investments in joint venture entity | | | 72 | |
33. | | Investments in companies | | | 73 | |
34. | | Dividends | | | 73 | |
35. | | Events subsequent to balance date | | | 73 | |
1. General information
Queensland Treasury Corporation (QTC) is constituted under the Queensland Treasury Corporation Act 1988 (the Act), with the Under Treasurer designated as the Corporation Sole under section 5 (2) of the Act.
QTC is the State’s central financing authority and corporate treasury services provider, with responsibility for providing debt funding, liability management, cash management and financial risk management advice to public sector customers. These services, which form part of QTC’s Capital Markets Operations segment, are undertaken on a cost-recovery basis with QTC lending at an interest rate based on its cost of funds and with the benefits/costs of liability and asset management being passed on to its customers being Queensland public sector entities.
The majority of QTC’s profits from its Capital Markets Operations are generated as a result of interest earned from the investment of QTC’s equity. QTC ensures that in undertaking its capital markets activities it has adequate capital to manage its risks.
QTC holds a portfolio of assets which were transferred to QTC by the State Government under an administrative arrangement. These assets are the investments of QTC’s Long Term Assets segment and were accumulated to fund superannuation and other long-term obligations of the State such as insurance and long service leave. In return, QTC issued to the State a fixed rate note which has resulted in the State receiving a fixed rate of return on the note, while QTC bears the impact of fluctuations in the value and returns on the asset portfolio (refer notes 3 & 5).
The Long Term Asset Advisory Board is responsible for the oversight of the Long Term Assets which do not form part of QTC’s day-to-day Capital Markets Operations. The Long Term Assets are held in unit trusts managed by Queensland Investment Corporation (QIC).
2. Summary of significant accounting policies
(A) BASIS OF PREPARATION
These general purpose financial statements for the year ended 30 June 2010 have been prepared in accordance with the requirements of the Financial Accountability Act 2009 and Australian Accounting Standards and Interpretations, adopted by the Australian Accounting Standards Board.
QUEENSLAND TREASURY CORPORATION ANNUAL REPORT 2009–2010 36
2. Summary of significant accounting policiesCONTINUED
(A) BASIS OF PREPARATION CONTINUED
COMPLIANCE WITH INTERNATIONAL FINANCIAL REPORTING STANDARDS
The financial statements of QTC also comply with International Financial Reporting Standards as issued by the International Accounting Standards Board. QTC is designated as a not-for-profit entity, however, the Corporation has elected to comply with the requirements of International Financial Reporting Standards (IFRS) as if it is a for-profit entity.
EARLY ADOPTION OF STANDARDS
QTC elected to early adopt the exemptions applying to government related entities applicable to AASB 124: Related Party Disclosures (revised December 2009) from 1 July 2009. The Standard is mandatory for annual reporting periods beginning on or after 1 January 2011 however early application of either the whole standard or a partial exemption for government related entities is permitted. The amendments remove the requirement for government related entities to disclose details of all transactions with the government and other government related entities and clarifies and simplifies the definition of a related party (refer note 28).
NEW ACCOUNTING STANDARDS
A number of new and amended accounting standards are mandatory from 1 July 2009. When the adoption of the standard or interpretation is deemed to have an impact on the financial statements or the performance of the Corporation, its impact is described below:
AASB 101 Presentation of Financial Statements
The revised standard separates owner and non-owner changes in equity. The statement of changes in equity includes only details of transactions with owners, with non-owner changes in equity presented in a reconciliation of each component of equity and included in the new statement of comprehensive income. The statement of comprehensive income presents all items of recognised income and expense, either in one statement or in two linked statements. The Corporation has elected to present one statement.
AASB 7 Financial Instruments : Disclosures
The amended standard requires additional disclosures in relation to fair value measurement and liquidity risk. Fair value measurements related to all financial instruments recognised and measured at fair value are to be disclosed by the source of inputs using a three level fair value hierarchy. In addition, a reconciliation between beginning and ending balances for level 3 fair value measurements is now required, as well as significant transfers between levels in the fair value hierarchy. The new disclosures in relation to liquidity risk are set out in
note 21(b) while the fair value measurement disclosures are presented in note 22.
Annual Improvements Project
In May 2008 and April 2009 the AASB issued amendments to its standards as part of the Annual Improvement Project, primarily with a view to remove inconsistencies and clarify wording. The adoption of these amendments resulted in a change in the way employee benefits are recognised with leave liabilities being recognised fully when there is a present obligation at balance date. Previously, employee benefits were recognised based on when they were expected to be settled. While this amendment changed the calculation of employee benefits recognised at balance date, there was no material impact on the financial statements (refer note 2(u)).
STANDARDS AND INTERPRETATIONS NOT YET ADOPTED
Certain new accounting standards and interpretations have been published that are not mandatory for the current reporting period. The Corporation’s assessment on the impact of these new standards is set out below:
| • | | AASB 9 Financial Instruments, AASB 2009-11 Amendment to Australian Accounting Standards arising from AASB 9 specify new recognition and measurement requirements for financial assets within the scope of AASB 139. The amendments require financial assets to be measured at fair value through profit or loss unless they meet the criteria for amortised cost measurement. Management does not expect the amendment will have a significant impact on the financial statements as all financial assets are currently valued at fair value through profit or loss. |
| • | | AASB 2009-5 Further Amendments to Australian Accounting Standards arising from the Annual Improvement Project effective for periods beginning on or after 1 January 2010 amends terminology in a number of standards which is not expected to impact the financial statements. |
| • | | AASB 7 Financial Instruments : Disclosures amends a number of quantitative disclosures relating to credit risk and collateral held. The overall amendment is intended to simplify the disclosures required particularly around collateral held. |
Other than as noted above, the adoption of various Australian Accounting Standards and Interpretations on issue but not yet effective is not expected to impact the financial performance of the Corporation. However, the pronouncements may result in changes to information currently disclosed in the financial statements.
QUEENSLAND TREASURY CORPORATION ANNUAL REPORT 2009–2010 37
Notes to and Forming Part of the Financial Statements
FOR THE YEAR ENDED 30 JUNE 2010
(A) BASIS OF PREPARATION CONTINUED
HISTORICAL COST CONVENTION
The financial statements are prepared on the basis of fair value measurement of assets and liabilities except where otherwise stated.
FUNCTIONAL AND PRESENTATION CURRENCY
These financial statements are presented in Australian dollars, which is QTC’s functional currency.
CLASSIFICATION OF ASSETS AND LIABILITIES
The balance sheet is presented on a liquidity basis. Assets and liabilities are presented in decreasing order of liquidity and are not distinguished between current and non current.
(B) INVESTMENT IN JOINT VENTURE ENTITY
QTC’s investment in Local Government Infrastructure Services Pty Ltd is accounted for using the equity method in the financial statements. Under the equity method, the share of the profits or losses of the joint venture is recognised in the income statement, and the share of movement in equity is recognised in the balance sheet. Investments in joint venture entities are carried at the equity accounted amount.
(C) INVESTMENTS IN OTHER COMPANIES
Investments in other companies are accounted for at cost (refer note 33). The principal activity of Queensland Treasury Holdings Pty Ltd (QTH) is to act as a corporate vehicle through which the Queensland Government undertakes activities of strategic importance to the State.
Queensland Treasury holds a 60% beneficial interest in QTH. The remaining 40% is held by QTC for and on behalf of the Under Treasurer as Corporation Sole of QTC.
QTC does not have significant influence over the financial and operating policies of QTH and therefore does not apply the equity method of accounting to the investment.
(D) FOREIGN CURRENCY
Foreign currency transactions are initially translated into Australian dollars at the rate of exchange applying at the date of the transaction. At balance date, amounts payable to and by QTC in foreign currencies have been valued using current exchange rates after taking into account interest rates and accrued interest.
Exchange gains/losses are brought to account in the income statement.
(E) CASH
Cash assets include only those funds held at bank and do not include money market deposits.
(F) FINANCIAL ASSETS AND FINANCIAL LIABILITIES
RECOGNITION AND DERECOGNITION
Financial assets and financial liabilities are recognised in the balance sheet when QTC becomes party to the contractual provisions of the financial instrument.
A financial asset is derecognised when the contractual rights to the cash flows from the financial assets expire or are transferred and no longer controlled by QTC.
A financial liability is removed from the balance sheet when the obligation specified in the contract is discharged, cancelled or expires.
MEASUREMENT
Financial assets and liabilities at fair value through profit or loss are measured at fair value by reference to quoted market prices when available. If quoted market prices are not available, then fair values are estimated on the basis of pricing models or other recognised valuation techniques.
Fair value is the amount for which an asset could be exchanged or liability settled between knowledgeable, willing parties in an arm’s length transaction.
QTC uses mid market rates as the basis for establishing fair values of quoted financial instruments with offsetting risk positions. In general, the risk characteristics of funds borrowed together with the financial derivatives used to manage interest rate and foreign currency risks closely match those of funds onlent. In all other cases, the bid-offer spread is applied where material.
Financial liabilities at amortised cost are measured using the effective interest method. The effective interest method is a method of calculating the amortised cost of a financial instrument and allocating the interest income or interest expense over the relevant period. In this way, interest is recognised in the income statement in the period in which it accrues.
QUEENSLAND TREASURY CORPORATION ANNUAL REPORT 2009–2010 38
2. Summary of significant accounting policiesCONTINUED
(F) FINANCIAL ASSETS AND FINANCIAL LIABILITIES CONTINUED
CLASSIFICATION
Financial instruments on initial recognition are classified into the following categories:
| • | | Derivative financial instruments |
| • | | Financial assets at fair value through profit or loss |
| • | | Financial liabilities at fair value through profit or loss, and |
| • | | Financial liabilities at amortised cost. |
QTC’s accounting policies for significant financial assets and financial liabilities are listed below.
ONLENDINGS
Onlendings, with the exception of loans to cooperative housing societies, are included in the balance sheet at market or fair value which is the redemption value. Loans to cooperative housing societies are based on the balance of each housing society’s loans to its members adjusted where necessary for a specific provision for impairment (refer note 2 (v)).
DERIVATIVE FINANCIAL INSTRUMENTS
QTC uses derivative financial instruments to hedge its exposure to interest rate, foreign currency and credit risks as part of asset and liability management activities. In addition they may be used to deliver long term floating rate or long term fixed rate exposure. In accordance with its treasury policy, QTC does not hold or issue derivative financial instruments for speculative purposes.
All derivatives are carried as assets when fair value is positive and as liabilities when fair value is negative.
FINANCIAL ASSETS AT FAIR VALUE THROUGH PROFIT OR LOSS
Financial assets at fair value through profit or loss include financial assets held for Capital Markets Operations and investments held in unit trusts (Long Term Assets).
| • | | Financial assets – Capital Markets Operations |
Financial assets – Capital Markets Operations, consist of investments in money market deposits, discount securities, semi-government bonds and floating rate notes. Unrealised gains and losses are brought to account in the income statement.
| • | | Investments in unit trusts – Long Term Assets |
Investments in unit trusts consist of investments held and managed by QIC and include Australian equities, international equities and other diversified products (refer note 10). These investments are measured at market value based on the hard close unit price quoted by QIC adjusted for fees outstanding on the account and net of any GST recoverable.
FINANCIAL LIABILITIES AT FAIR VALUE THROUGH PROFIT OR LOSS
Financial liabilities at fair value through profit or loss include interest-bearing liabilities and deposits. Unrealised gains and losses are brought to account in the income statement.
| • | | Interest-bearing liabilities |
Interest-bearing liabilities mainly consist of Australian and overseas bonds. Australian bonds include QTC’s domestic, capital indexed and public bonds. Overseas bonds include global bonds and Eurobonds. Global bonds are Australian dollar denominated bonds issued overseas.
Customer deposits are accepted to either the Working Capital Facility (11AM Fund) or the Cash Fund. Income derived from the investment of these deposits accrues to depositors daily. The amount shown in the balance sheet represents the market value of deposits held at balance date.
Collateral held and securities which are sold under agreements to repurchase are disclosed as deposits.
FINANCIAL LIABILITIES AT AMORTISED COST
Financial liabilities at amortised cost consist of a fixed rate note issued to the State Government in exchange for a portfolio of assets (Long Term Assets). The fixed rate note was initially recognised at par value, which equated to the fair value of the financial assets acquired. Deposits and withdrawals can be made from the note based on changes in the State Government’s long-term liabilities. The note is long-term in nature and has a term of 50 years. Interest on the fixed rate note is capitalised monthly and the rate is reviewed annually, consistent with the triennial actuarial assessment of the State’s defined benefit liability.
QUEENSLAND TREASURY CORPORATION ANNUAL REPORT 2009–2010 39
Notes to and Forming Part of the Financial Statements
FOR THE YEAR ENDED 30 JUNE 2010
2. Summary of significant accounting policiesCONTINUED
(G) COLLATERAL
QTC enters into a range of transactions with counterparties which require the lodgement of collateral subject to agreed market thresholds. Where these thresholds are exceeded, QTC may be required to either pledge assets to, or be entitled to receive pledged assets from, the counterparty to secure these transactions. The assets pledged or received are primarily in the form of cash.
(H) SETTLEMENT DATE ACCOUNTING
Purchases and sales of financial assets and liabilities at fair value through profit or loss are recognised on settlement date. QTC accounts for any change in the fair value of the asset to be received or the liability issued during the period between the trade date and settlement date in the same way as it accounts for the acquired asset or liability.
(I) OFFSETTING FINANCIAL INSTRUMENTS
QTC offsets financial assets and liabilities where there is a legally enforceable right to set off, and there is an intention to settle on a net basis or to realise the asset and settle the liability simultaneously.
(J) REPURCHASE AGREEMENTS
Securities sold under agreements to repurchase at an agreed price are retained within the financial assets at fair value through profit or loss category while the obligation to repurchase is disclosed as a deposit.
(K) LEASE ARRANGEMENTS
Leases in which a significant portion of the risks and rewards of ownership are retained by the lessor are classified as operating leases (refer note 25). Operating leases, in which QTC is the lessee, are expensed on a straight line basis over the term of the lease.
(L) LEASE INCOME
Lease income from operating leases where QTC is the lessor is recognised as income on a straight line basis over the lease term.
(M) CROSS BORDER LEASES - INCOME RECOGNITION
The portion of the cross border lease income received which is regarded as an advisory fee for the transaction is recognised on receipt. The balance of income received is deferred and amortised over the term of each lease.
(N) INTEREST INCOME AND INTEREST EXPENSE
The recognition of investment income and borrowing costs includes net realised gains/ losses from the sale of investments (interest income) and the preredemption of borrowings (interest expense) together with the net unrealised gains/losses arising from holding investments and certain onlendings (interest income) and net unrealised gains/losses from borrowings (interest expense). These unrealised gains/losses are a result of revaluing to market daily.
The majority of onlendings are provided to customers on a pooled basis. Interest costs are allocated to customers based on the daily movement in the market value of the pool.
(O) FEE INCOME
Management and professional fee income represent income earned from the management of QTC’s onlendings and deposits, and is recognised on an accrual basis when the service has been provided. Asset and liability management fee income integral to the yield of an originated financial instrument is recognised proportionately over the period the product is provided.
(P) NET CHANGE IN FAIR VALUE OF INVESTMENTS IN UNIT TRUSTS
Changes in the net market value of investments are recognised in the period in which they occur. The net market value is based on the closing unit redemption price and includes both realised and unrealised movements, net of allowances for costs expected to be incurred in realising these investments.
Distributions are reinvested into the trusts.
(Q) PROFITS/LOSSES
Unless otherwise determined by the Governor in Council, the Queensland Treasury Corporation Act 1988 requires that all profits shall accrue to the benefit of the State Consolidated Fund and all losses shall be the responsibility of the State Consolidated Fund.
QUEENSLAND TREASURY CORPORATION ANNUAL REPORT 2009–2010 40
2. Summary of significant accounting policiesCONTINUED
(R) PROPERTY, PLANT AND EQUIPMENT
Property, plant and equipment are measured at cost less accumulated depreciation and accumulated impairment losses. Cost includes expenditure that is directly attributable to the acquisition of the asset.
Depreciation is calculated on a straight line basis over the estimated useful life of the assets. Where depreciation relates to plant and equipment held to generate lease revenue, depreciation expenditure has been classified separately in the statement of comprehensive income as depreciation on leased assets.
Depreciation rates for each class of asset are as follows:
| | | | |
ASSET CLASS | | DEPRECIATION RATE | |
Information technology equipment | | | 6 – 40 | % |
Furniture, fittings and office equipment | | | 8 – 33 | % |
Plant and machinery | | | 10 – 30 | % |
The assets’ residual values, useful lives and depreciation methods are reviewed and adjusted, if appropriate, at each financial year end.
DERECOGNITION
An item of property, plant and equipment is derecognised upon disposal or when no further future economic benefits are expected from its use. Any gain or loss arising on derecognition of the asset (calculated as the difference between the net disposal proceeds and the carrying amount of the asset) is included in the income statement in the year the asset is derecognised.
IMPAIRMENT
The carrying amounts of QTC’s assets are reviewed at each balance sheet date to determine whether there is any indication of impairment. If any such indication exists, the asset’s recoverable amount is estimated. An impairment loss is recognised if the carrying amount of an asset or its cash-generating unit exceeds its recoverable amount. The recoverable amount is assessed as the greater of its value in use and its fair value less costs to sell.
(S) INTANGIBLE ASSETS
SOFTWARE
Acquired computer software licences are capitalised on the basis of the costs incurred to acquire and bring to use the specific software. These costs are amortised over their estimated useful lives which are between two and five years.
Costs associated with the development of internally generated software are capitalised only when the designated project is technically and commercially feasible and is expected to generate future economic benefits to QTC. The expenditure capitalised comprises all directly attributable costs including some labour costs. All other costs associated with the development of software are expensed as incurred.
Subsequent costs are added to the initial costs of the asset only when they specifically meet the capitalisation criteria.
Computer software development costs recognised as assets are amortised on a straight-line basis over the period of expected benefit, which is usually five years.
(T) INCOME TAX
QTC is exempt from the payment of income tax under section 50-25 of the Income Tax Assessment Act 1997 (as amended).
QTC makes a payment in lieu of income tax to the Queensland Government’s Consolidated Fund. The calculation of the income tax liability is based on the income of certain activities controlled by QTC’s Capital Markets Operations. No income tax is payable on the Long Term Assets.
In calculating the payment in lieu of income tax expense, tax effect accounting principles are adopted for income received and expenses paid in relation to the management and administration of customers’ borrowings and deposits as well as for advisory services and structured finance transactions. For all other QTC operations on which a payment in lieu of income tax is made, tax effect accounting principles are not applied.
QTC’s controlled and jointly controlled entities are defined as State and Territory bodies under section 24AO of the Income Tax Assessment Act 1936 and as a consequence, are exempt from Commonwealth tax under section 24AM of this Act.
Deferred income tax is provided in full, using the liability method, on all temporary differences arising between the tax bases of assets and liabilities and their carrying amounts in the financial statements.
Deferred income tax liabilities are recognised for all taxable temporary differences arising from prepayments of expenditure of QTC. Deferred income tax assets are recognised for deductible temporary differences arising from accruals of expenditure, employee benefits and depreciation charged on property, plant and equipment.
Deferred tax assets are recognised where it is probable that future taxable income will be available against which the temporary differences can be utilised.
QUEENSLAND TREASURY CORPORATION ANNUAL REPORT 2009–2010 41
Notes to and Forming Part of the Financial Statements
FOR THE YEAR ENDED 30 JUNE 2010
2. Summary of significant accounting policiesCONTINUED
(U) EMPLOYEE BENEFITS
Employee benefit obligations such as annual leave and long service leave entitlements are measured on an undiscounted basis where the amounts are due to be settled at balance date.
A liability is recognised for short-term bonuses based on the amount expected to be paid where there is a present or constructive obligation to pay this amount as a result of past services provided by the employee and the obligation can be estimated reliably.
Wages, salaries, annual and long service leave due but unpaid at reporting date are recognised in other creditors and include related on-costs such as payroll tax, worker’s compensation premiums and employer superannuation contributions. As sick leave is non-vesting, this is recognised as and when this leave is taken.
Contributions made by QTC to employee contributory superannuation funds (to provide benefits for employees and their dependants on retirement, disability or death) are charged to the income statement.
QTC is not responsible for any shortfalls.
(V) PROVISIONS FOR IMPAIRED LOANS
Over the period 1996 to 2000, QTC, at the direction of the Queensland Government, acquired loans provided by financial institutions to a number of cooperative housing societies at a cost equivalent to book value. At the time of acquisition, there were a number of non-performing loans. Specific provisions have been made where full recovery of principal and interest is considered doubtful based on the net realisable value of the underlying security. Such loans are treated as impaired assets and categorised as non-accrual loans as set out and explained in note 12.
(W) ROUNDING
Amounts have been rounded to the nearest thousand dollars except for note 27 which is rounded to the nearest million dollars and notes 29, 30 and 31 which are in whole dollars.
(X) COMPARATIVE FIGURES
Where necessary, comparative figures have been adjusted to conform with changes in presentation in the current year.
(Y) JUDGEMENTS AND ASSUMPTIONS
QTC has made no judgements or assumptions which may cause a material adjustment to the carrying amounts of assets and liabilities within the next reporting period.
(Z) OPERATING RESULT
The operating profit after tax for the year ended 30 June 2010 for the Capital Markets Operations segment was $209.436 million. QTC made an operating profit after tax of $586.836 million for the Long Term Assets segment.
The result on the Long Term Assets segment partially reversed the significant losses recorded in the previous year due to the poor performance of the equity, property and credit markets.
The accumulated losses have no impact on QTC’s capacity to meet its obligations as there is no cash flow effect for QTC (refer note 20). In addition, under the Queensland Treasury Corporation Act 1988, any losses of the Corporation shall be the responsibility of the Consolidated Fund of the Queensland Government.
QUEENSLAND TREASURY CORPORATION ANNUAL REPORT 2009–2010 42
3. Segment reporting
An operating segment is identified where QTC engages in a business activity where separate financial information is evaluated regularly by the chief operating decision makers in deciding how to allocate resources.
Revenue and expenses directly associated with each business segment are included to determine their result. The accounting policies for each operating segment are applied consistently.
The results from QTC’s operating segments are shown below:
| | | | | | | | | | | | | | | | | | | | | | | | |
| SEGMENT REVENUE AND EXPENSES | | FOR THE YEAR ENDED 30 JUNE 2010 | | | FOR THE YEAR ENDED 30 JUNE 2009 | |
| | | CAPITAL MARKETS OPERATIONS $000 | | | LONG TERM ASSETS $000 | | | TOTAL
$000 | | | CAPITAL MARKETS OPERATIONS $000 | | | LONG TERM ASSETS $000 | | | TOTAL
$000 | |
| | | | | | |
Segment income | | | | | | | | | | | | | | | | | | | | | | | | |
Interest income | | | 5 278 630 | | | | — | | | | 5 278 630 | | | | 4 859 824 | | | | — | | | | 4 859 824 | |
Net change in fair value of unit trusts | | | — | | | | 2 290 696 | | | | 2 290 696 | | | | — | | | | (3 032 408 | ) | | | (3 032 408 | ) |
Other income | | | 110 344 | | | | — | | | | 110 344 | | | | 69 887 | | | | — | | | | 69 887 | |
| | | | | | | | | | | | | | | | | | | | | | | | |
Total income | | | 5 388 974 | | | | 2 290 696 | | | | 7 679 670 | | | | 4 929 711 | | | | (3 032 408 | ) | | | 1 897 303 | |
| | | | | | | | | | | | | | | | | | | | | | | | |
Segment expenses | | | | | | | | | | | | | | | | | | | | | | | | |
Interest expense | | | 5 096 925 | | | | 1 637 219 | | | | 6 734 144 | | | | 4 825 271 | | | | 1 558 543 | | | | 6 383 814 | |
Depreciation and amortisation | | | 14 789 | | | | — | | | | 14 789 | | | | 12 660 | | | | — | | | | 12 660 | |
Management fees - QIC | | | — | | | | 66 641 | | | | 66 641 | | | | — | | | | 47 520 | | | | 47 520 | |
Other expenses | | | 33 960 | | | | — | | | | 33 960 | | | | 38 470 | | | | — | | | | 38 470 | |
| | | | | | | | | | | | | | | | | | | | | | | | |
Total expenses | | | 5 145 674 | | | | 1 703 860 | | | | 6 849 534 | | | | 4 876 401 | | | | 1 606 063 | | | | 6 482 464 | |
| | | | | | | | | | | | | | | | | | | | | | | | |
Share of associate’s net profit | | | 210 | | | | — | | | | 210 | | | | 120 | | | | — | | | | 120 | |
| | | | | | | | | | | | | | | | | | | | | | | | |
Profit/(loss) before income tax | | | 243 510 | | | | 586 836 | | | | 830 346 | | | | 53 430 | | | | (4 638 471 | ) | | | (4 585 041 | ) |
| | | | | | | | | | | | | | | | | | | | | | | | |
Income tax expense | | | 34 074 | | | | — | | | | 34 074 | | | | 10 227 | | | | — | | | | 10 227 | |
| | | | | | | | | | | | | | | | | | | | | | | | |
Profit/(loss) for the year | | | 209 436 | | | | 586 836 | | | | 796 272 | | | | 43 203 | | | | (4 638 471 | ) | | | (4 595 268 | ) |
| | | | | | | | | | | | | | | | | | | | | | | | |
QUEENSLAND TREASURY CORPORATION ANNUAL REPORT 2009–2010 43
Notes to and Forming Part of the Financial Statements
FOR THE YEAR ENDED 30 JUNE 2010
3. Segment reportingCONTINUED
| | | | | | | | | | | | | | | | | | | | | | | | |
| SEGMENT ASSETS AND LIABILITIES | | 30 JUNE 2010 | | | 30 JUNE 2009 | |
| | | CAPITAL MARKETS
OPERATIONS
$000 | | | LONG TERM
ASSETS
$000 | | | TOTAL
$000 | | | CAPITAL MARKETS
OPERATIONS
$000 | | | LONG TERM
ASSETS
$000 | | | TOTAL
$000 | |
Segment assets | | | | | | | | | | | | | | | | | | | | | | | | |
Onlendings | | | 55 113 222 | | | | — | | | | 55 113 222 | | | | 44 407 516 | | | | — | | | | 44 407 516 | |
Financial assets at fair value through profit or loss | | | 18 694 006 | | | | 19 201 500 | | | | 37 895 506 | | | | 26 474 512 | | | | 17 470 034 | | | | 43 944 546 | |
Other assets | | | 577 944 | | | | — | | | | 577 944 | | | | 635 497 | | | | — | | | | 635 497 | |
| | | | | | | | | | | | | | | | | | | | | | | | |
Total assets | | | 74 385 172 | | | | 19 201 500 | | | | 93 586 672 | | | | 71 517 525 | | | | 17 470 034 | | | | 88 987 559 | |
| | | | | | | | | | | | | | | | | | | | | | | | |
Segment liabilities | | | | | | | | | | | | | | | | | | | | | | | | |
Financial liabilities at fair value through profit or loss | | | 73 546 366 | | | | — | | | | 73 546 366 | | | | 70 417 244 | | | | — | | | | 70 417 244 | |
Financial liabilities at amortised cost | | | — | | | | 23 253 135 | | | | 23 253 135 | | | | — | | | | 22 108 505 | | | | 22 108 505 | |
Other liabilities | | | 293 523 | | | | — | | | | 293 523 | | | | 764 434 | | | | — | | | | 764 434 | |
| | | | | | | | | | | | | | | | | | | | | | | | |
Total liabilities | | | 73 839 889 | | | | 23 253 135 | | | | 97 093 024 | | | | 71 181 678 | | | | 22 108 505 | | | | 93 290 183 | |
| | | | | | | | | | | | | | | | | | | | | | | | |
Net assets | | | 545 283 | | | | (4 051 635 | ) | | | (3 506 352 | ) | | | 335 847 | | | | (4 638 471 | ) | | | (4 302 624 | ) |
| | | | | | | | | | | | | | | | | | | | | | | | |
| | |
| SEGMENT EQUITY | | 30 JUNE 2010 | | | 30 JUNE 2009 | |
| | | CAPITAL MARKETS
OPERATIONS
$000 | | | LONG TERM
ASSETS
$000 | | | TOTAL
$000 | | | CAPITAL MARKETS
OPERATIONS
$000 | | | LONG TERM
ASSETS
$000 | | | TOTAL
$000 | |
Equity 1 July | | | 335 847 | | | | (4 638 471 | ) | | | (4 302 624 | ) | | | 292 644 | | | | — | | | | 292 644 | |
Profit/(loss) after tax | | | 209 436 | | | | 586 836 | | | | 796 272 | | | | 43 203 | | | | (4 638 471 | ) | | | (4 595 268 | ) |
| | | | | | | | | | | | | | | | | | | | | | | | |
Equity 30 June | | | 545 283 | | | | (4 051 635 | ) | | | (3 506 352 | ) | | | 335 847 | | | | (4 638 471 | ) | | | (4 302 624 | ) |
| | | | | | | | | | | | | | | | | | | | | | | | |
QUEENSLAND TREASURY CORPORATION ANNUAL REPORT 2009–2010 44
4. Interest income and interest expense from capital markets operations
| | | | | | | | | | | | | | | | |
| | | FOR THE YEAR ENDED 30 JUNE 2010 | |
| | | INTEREST
$000 | | | NET UNREALISED
GAIN/LOSS
$000 | | | NET REALISED
GAIN/LOSS
$000 | | | TOTAL
INTEREST
$000 | |
| | | | |
Interest income | | | | | | | | | | | | | | | | |
Domestic | | | | | | | | | | | | | | | | |
Money market deposits | | | 58 170 | | | | (5 | ) | | | — | | | | 58 165 | |
Discount securities | | | 232 118 | | | | 136 | | | | (441 | ) | | | 231 813 | |
Commonwealth and semi-government securities | | | 304 375 | | | | 92 379 | | | | 57 050 | | | | 453 804 | |
Floating rate notes | | | 156 552 | | | | 106 363 | | | | 993 | | | | 263 908 | |
Other investments | | | 99 669 | | | | 13 687 | | | | (423 | ) | | | 112 933 | |
Forward rate agreements | | | — | | | | 75 075 | | | | — | | | | 75 075 | |
Onlendings * | | | 3 997 493 | | | | 64 599 | | | | — | | | | 4 062 092 | |
Offshore | | | | | | | | | | | | | | | | |
Medium-term notes | | | 1 999 | | | | (7 789 | ) | | | — | | | | (5 790 | ) |
Cross currency swaps | | | 6 552 | | | | (792 | ) | | | — | | | | 5 760 | |
Credit default swaps | | | 805 | | | | 20 065 | | | | — | | | | 20 870 | |
| | | | | | | | | | | | | | | | |
| | | 4 857 733 | | | | 363 718 | | | | 57 179 | | | | 5 278 630 | |
| | | | | | | | | | | | | | | | |
Interest expense | | | | | | | | | | | | | | | | |
Domestic | | | | | | | | | | | | | | | | |
Deposits | | | 196 743 | | | | (1 330 | ) | | | — | | | | 195 413 | |
Treasury notes | | | 18 761 | | | | 190 | | | | 3 | | | | 18 954 | |
Bonds | | | 2 943 633 | | | | 1 097 828 | | | | 392 636 | | | | 4 434 097 | |
Credit foncier loans | | | (4 230 | ) | | | (55 | ) | | | — | | | | (4 285 | ) |
Interest rate swaps | | | (95 153 | ) | | | 52 738 | | | | — | | | | (42 415 | ) |
Forward rate agreements | | | 1 481 | | | | (360 | ) | | | 27 | | | | 1 148 | |
Futures | | | — | | | | 2 156 | | | | (24 551 | ) | | | (22 395 | ) |
Offshore | | | | | | | | | | | | | | | | |
Commercial paper | | | 6 119 | | | | (107 670 | ) | | | — | | | | (101 551 | ) |
Bonds | | | 375 130 | | | | (163 604 | ) | | | 93 212 | | | | 304 738 | |
Medium-term notes | | | 52 343 | | | | 45 410 | | | | (471 | ) | | | 97 282 | |
Cross currency swaps | | | 55 105 | | | | (60 780 | ) | | | — | | | | (5 675 | ) |
Forward exchange contracts | | | 1 | | | | (325 361 | ) | | | 455 323 | | | | 129 963 | |
Other | | | | | | | | | | | | | | | | |
Registration and issue costs | | | 15 316 | | | | — | | | | — | | | | 15 316 | |
Commissions on futures | | | 2 145 | | | | — | | | | — | | | | 2 145 | |
Commonwealth Government | | | | | | | | | | | | | | | | |
Guarantee Fee | | | 74 190 | | | | — | | | | — | | | | 74 190 | |
| | | | | | | | | | | | | | | | |
| | | 3 641 584 | | | | 539 162 | | | | 916 179 | | | | 5 096 925 | |
| | | | | | | | | | | | | | | | |
| * | The majority of onlendings are provided to customers on a pooled fund basis. Interest costs are allocated to customers based on the daily movement in the market value of the pooled fund. Except for fixed rate loans, the interest from onlendings figure also reflects the daily movements in the market value of the pooled funds. |
QUEENSLAND TREASURY CORPORATION ANNUAL REPORT 2009–2010 45
Notes to and Forming Part of the Financial Statements
FOR THE YEAR ENDED 30 JUNE 2010
4. Interest income and interest expense from capital markets operationsCONTINUED
| | | | | | | | | | | | | | | | |
| | | FOR THE YEAR ENDED 30 JUNE 2009 | |
| | | INTEREST
$000 | | | NET UNREALISED
GAIN/LOSS
$000 | | | NET REALISED
GAIN/LOSS
$000 | | | TOTAL
INTEREST
$000 | |
| | | | |
Interest income | | | | | | | | | | | | | | | | |
Domestic | | | | | | | | | | | | | | | | |
Money market deposits | | | 53 643 | | | | — | | | | — | | | | 53 643 | |
Discount securities | | | 454 107 | | | | (627 | ) | | | 3 206 | | | | 456 686 | |
Commonwealth and semi-government securities | | | 289 627 | | | | 83 086 | | | | 54 817 | | | | 427 530 | |
Floating rate notes | | | 263 109 | | | | (55 597 | ) | | | (12 588 | ) | | | 194 924 | |
Other investments | | | 41 140 | | | | 17 122 | | | | (8 115 | ) | | | 50 147 | |
Forward rate agreements | | | — | | | | 76 549 | | | | — | | | | 76 549 | |
Onlendings | | | 3 511 951 | | | | 102 250 | | | | — | | | | 3 614 201 | |
Offshore | | | | | | | | | | | | | | | | |
Medium-term notes | | | 1 665 | | | | (12 822 | ) | | | — | | | | (11 157 | ) |
Cross currency swaps | | | 2 635 | | | | 11 153 | | | | — | | | | 13 788 | |
Credit default swaps | | | 986 | | | | (17 473 | ) | | | — | | | | (16 487 | ) |
| | | | | | | | | | | | | | | | |
| | | 4 618 863 | | | | 203 641 | | | | 37 320 | | | | 4 859 824 | |
| | | | | | | | | | | | | | | | |
Interest expense | | | | | | | | | | | | | | | | |
Domestic | | | | | | | | | | | | | | | | |
Deposits | | | 390 234 | | | | 4 004 | | | | — | | | | 394 238 | |
Treasury notes | | | 93 389 | | | | (250 | ) | | | 1 871 | | | | 95 010 | |
Bonds | | | 1 963 041 | | | | 640 894 | | | | 354 512 | | | | 2 958 447 | |
Credit foncier loans | | | 87 | | | | 45 | | | | — | | | | 132 | |
Interest rate swaps | | | (196 498 | ) | | | (327 592 | ) | | | — | | | | (524 090 | ) |
Forward rate agreements | | | 465 | | | | — | | | | (145 | ) | | | 320 | |
Futures | | | — | | | | 12 958 | | | | 45 598 | | | | 58 556 | |
Offshore | | | | | | | | | | | | | | | | |
Commercial paper | | | 54 770 | | | | 96 890 | | | | (160 | ) | | | 151 500 | |
Bonds | | | 628 297 | | | | 630 862 | | | | 396 939 | | | | 1 656 098 | |
Medium-term notes | | | 52 138 | | | | 61 356 | | | | 413 | | | | 113 907 | |
Cross currency swaps | | | 37 137 | | | | (110 945 | ) | | | — | | | | (73 808 | ) |
Forward exchange contracts | | | 18 | | | | 300 628 | | | | (316 844 | ) | | | (16 198 | ) |
Other | | | | | | | | | | | | | | | | |
Registration and issue costs | | | 9 550 | | | | — | | | | — | | | | 9 550 | |
Commissions on futures | | | 1 609 | | | | — | | | | — | | | | 1 609 | |
| | | | | | | | | | | | | | | | |
| | | 3 034 237 | | | | 1 308 850 | | | | 482 184 | | | | 4 825 271 | |
| | | | | | | | | | | | | | | | |
QUEENSLAND TREASURY CORPORATION ANNUAL REPORT 2009–2010 46
5. Net change in fair value of unit trusts
Changes in the fair value of the unit trusts are as follows:
| | | | | | | | |
ACCOUNT | | 2010
$000 | | | 2009
$000 | |
QIC Investment Trust No.2 | | | 1 944 563 | | | | (2 673 901 | ) |
QIC Property Fund | | | 118 905 | | | | (171 054 | ) |
QIC Strategic Fund No.2 | | | 84 459 | | | | (58 365 | ) |
QIC Strategic Fund No.3 | | | 7 218 | | | | — | |
QIC Diversified Infrastructure Fund No.2 | | | 54 769 | | | | 31 081 | |
QIC Private Equity Fund No.2 | | | 26 712 | | | | (36 959 | ) |
QIC Private Equity Fund No.3 | | | 4 853 | | | | — | |
QIC International Property Fund | | | 14 572 | | | | (175 812 | ) |
QIC International Property Development Trust | | | (171 | ) | | | (119 | ) |
QIC Treasury Infrastructure Trust | | | 53 180 | | | | 68 830 | |
Queensland BioCapital Fund No.1 | | | (8 739 | ) | | | (8 008 | ) |
Queensland BioCapital Fund No.2 | | | (9 625 | ) | | | (8 101 | ) |
| | | | | | | | |
| | | 2 290 696 | | | | (3 032 408 | ) |
| | | | | | | | |
6. Fee revenue
Management fees represent income earned from the management of QTC’s onlendings and deposits. A further amount of $8.609 million (2009 $12.676 million), derived from fees on certain managed funds and pools is included under interest income.
7. Administration expenses
| | | | | | | | |
Salaries and related costs | | | 18 265 | | | | 17 119 | |
Superannuation contributions | | | 2 521 | | | | 2 467 | |
Consultants’ fees (i) | | | 3 341 | | | | 5 120 | |
Outsourced services (ii) | | | 1 281 | | | | 1 577 | |
Depreciation on property, plant and equipment | | | 501 | | | | 562 | |
Amortisation on intangibles | | | 136 | | | | 166 | |
Impairment on intangibles | | | — | | | | 2 037 | |
Computer and maintenance charges | | | 1 573 | | | | 1 666 | |
Property charges | | | 2 422 | | | | 2 289 | |
External audit fees | | | 447 | | | | 402 | |
Internal audit fees | | | 334 | | | | 475 | |
Staff training and development | | | 231 | | | | 275 | |
Investor and market relations program | | | 1 062 | | | | 814 | |
Telephone, postage, printing and stationery | | | 606 | | | | 860 | |
Other administration expenses | | | 1 799 | | | | 3 327 | |
| | | | | | | | |
| | | 34 519 | | | | 39 156 | |
| | | | | | | | |
QUEENSLAND TREASURY CORPORATION ANNUAL REPORT 2009–2010 47
Notes to and Forming Part of the Financial Statements
FOR THE YEAR ENDED 30 JUNE 2010
7. Administration expensesCONTINUED
| | | | | | | | |
| | | 2010
$000 | | | 2009
$000 | |
(i) CONSULTANTS’ FEES | | | | | | | | |
Legal costs professional/technical | | | 939 | | | | 1 652 | |
Information technology | | | 97 | | | | 418 | |
Contractors/secondments | | | 983 | | | | 1 123 | |
Finance/accounting | | | 318 | | | | 1 030 | |
Human resource management | | | 196 | | | | 214 | |
Communications | | | 198 | | | | 226 | |
Other | | | 610 | | | | 457 | |
| | | | | | | | |
| | | 3 341 | | | | 5 120 | |
| | | | | | | | |
(ii) OUTSOURCED SERVICES | | | | | | | | |
Information services | | | 691 | | | | 703 | |
Registry charges | | | 158 | | | | 217 | |
Economic services | | | — | | | | 106 | |
Domestic and international clearing charges | | | 282 | | | | 294 | |
Bank charges | | | 104 | | | | 205 | |
Other | | | 46 | | | | 52 | |
| | | | | | | | |
| | | 1 281 | | | | 1 577 | |
| | | | | | | | |
8. Income tax expense
| | | | | | | | |
Current tax | | | 34 004 | | | | 11 116 | |
Deferred tax | | | 70 | | | | (889 | ) |
| | | | | | | | |
Income tax expense | | | 34 074 | | | | 10 227 | |
| | | | | | | | |
Deferred income tax included in income tax expense comprises: | | | | | | | | |
Decrease/ (increase) in deferred tax assets | | | 61 | | | | (890 | ) |
Increase in deferred tax liabilities | | | 9 | | | | 1 | |
| | | | | | | | |
| | | 70 | | | | (889 | ) |
| | | | | | | | |
Numerical reconciliation between income tax expense and pre-tax accounting profit | | | | | | | | |
Profit/ (loss) for the year | | | 830 346 | | | | (4 585 041 | ) |
Less: profit/(loss) from non taxable pools | | | | | | | | |
Capital markets operations | | | 129 874 | | | | 19 377 | |
Long term assets | | | 586 836 | | | | (4 638 471 | ) |
| | | | | | | | |
Operating profit from taxable pools | | | 113 636 | | | | 34 053 | |
| | | | | | | | |
Tax at the Australian tax rate of 30% on taxable pools | | | 34 091 | | | | 10 215 | |
Effect of non-deductible expenses | | | | | | | | |
Share of net profit of jointly controlled entities | | | (63 | ) | | | (36 | ) |
Other | | | 46 | | | | 48 | |
| | | | | | | | |
Income tax expense | | | 34 074 | | | | 10 227 | |
| | | | | | | | |
QUEENSLAND TREASURY CORPORATION ANNUAL REPORT 2009–2010 48
8. Income tax expenseCONTINUED
| | | | | | | | |
| | | 2010
$000 | | | 2009
$000 | |
Deferred income tax at 30 June relates to the following: | | | | | | | | |
Deferred tax assets | | | | | | | | |
Accruals | | | 832 | | | | 685 | |
Employee benefits | | | 1 364 | | | | 1 572 | |
| | | | | | | | |
| | | 2 196 | | | | 2 257 | |
| | | | | | | | |
Deferred tax liability | | | | | | | | |
Property, plant and equipment | | | 32 | | | | 23 | |
| | | | | | | | |
Current tax liability | | | 34 004 | | | | 11 116 | |
Deferred tax liability | | | 32 | | | | 23 | |
| | | | | | | | |
Tax liabilities | | | 34 036 | | | | 11 139 | |
| | | | | | | | |
9. Receivables
| | | | | | | | |
GST receivable | | | 5 932 | | | | 7 780 | |
Sundry debtors | | | 5 252 | | | | 1 778 | |
Prepayments | | | 1 181 | | | | 998 | |
Operating lease receivables | | | 141 | | | | 116 | |
| | | | | | | | |
| | | 12 506 | | | | 10 672 | |
| | | | | | | | |
10. Financial assets at fair value through profit or loss
CAPITAL MARKETS OPERATIONS
| | | | | | | | |
Money market deposits | | | 946 297 | | | | 2 850 686 | |
Discount securities | | | 6 389 776 | | | | 12 033 545 | |
Commonwealth and state securities (1) | | | 4 791 447 | | | | 5 820 281 | |
Floating rate notes | | | 4 110 010 | | | | 4 408 159 | |
Other investments | | | 2 456 476 | | | | 1 361 841 | |
| | | | | | | | |
| | | 18 694 006 | | | | 26 474 512 | |
| | | | | | | | |
| (1) | QTC maintains holdings of its own stocks. These holdings have been excluded from financial assets and financial liabilities at fair value through profit or loss (refer note 17). |
The total includes investments made to manage:
| • | | deposits of $4 660.960 million (2009 $7 793.010 million) |
| • | | surpluses and reserves of $545.283 million (2009 $335.847 million) |
| • | | cross border lease deferred income of $71.580 million (2009 $109.731 million) |
The remaining investments are used to facilitate management of liquidity and interest rate risk or result from QTC borrowing in advance of requirements to manage financing/refinancing risk.
QUEENSLAND TREASURY CORPORATION ANNUAL REPORT 2009–2010 49
Notes to and Forming Part of the Financial Statements
FOR THE YEAR ENDED 30 JUNE 2010
10. Financial assets at fair value through profit or lossCONTINUED
| | | | | | | | |
| | | 2010
$000 | | | 2009
$000 | |
LONG TERM ASSETS | | | | | | | | |
Investments in unit trusts - QIC: | | | | | | | | |
QIC Investment Trust No.2 | | | 14 777 113 | | | | 13 346 492 | |
QIC Property Fund | | | 1 558 993 | | | | 1 643 578 | |
QIC Strategic Fund No.2 | | | 906 712 | | | | 617 285 | |
QIC Strategic Fund No.3 | | | 108 888 | | | | — | |
QIC Diversified Infrastructure Fund No.2 | | | 1 052 987 | | | | 830 923 | |
QIC Private Equity Fund No.2 | | | 455 763 | | | | 327 059 | |
QIC Private Equity Fund No.3 | | | 37 553 | | | | — | |
QIC International Property Fund | | | 269 887 | | | | 191 542 | |
QIC International Property Development Trust | | | 525 | | | | 526 | |
QIC Treasury Infrastructure Trust | | | 92 | | | | 466 783 | |
Queensland BioCapital Fund No.1 | | | 16 744 | | | | 22 722 | |
Queensland BioCapital Fund No.2 | | | 16 243 | | | | 23 124 | |
| | | | | | | | |
| | | 19 201 500 | | | | 17 470 034 | |
| | | | | | | | |
The underlying assets of the trusts consist of the following asset classes: | | | | | | | | |
| | |
Growth assets | | | | | | | | |
Australian equities | | | 3 421 707 | | | | 2 943 701 | |
International equities | | | 3 506 194 | | | | 2 919 243 | |
Diversified alternatives | | | 1 342 185 | | | | 971 334 | |
Unlisted assets | | | | | | | | |
Infrastructure | | | 1 236 577 | | | | 845 550 | |
Private equity | | | 478 117 | | | | 321 449 | |
Real estate | | | 2 215 853 | | | | 2 285 080 | |
Defensive assets | | | | | | | | |
Fixed interest | | | 1 939 352 | | | | 6 002 703 | |
Cash | | | 5 061 515 | | | | 1 180 974 | |
| | | | | | | | |
| | | 19 201 500 | | | | 17 470 034 | |
| | | | | | | | |
The Long Term Asset investments consist of units in unlisted trusts held with QIC.
11. Derivative financial assets
| | | | | | | | |
Interest rate swaps | | | 125 436 | | | | 250 946 | |
Cross currency swaps | | | 117 659 | | | | 86 333 | |
Forward rate agreements | | | 73 448 | | | | 155 337 | |
Foreign exchange contracts | | | 51 164 | | | | 633 | |
| | | | | | | | |
| | | 367 707 | | | | 493 249 | |
| | | | | | | | |
QUEENSLAND TREASURY CORPORATION ANNUAL REPORT 2009–2010 50
12. Onlendings
| | | | | | | | |
| | | 2010
$000 | | | 2009
$000 | |
Government departments and agencies | | | 15 229 408 | | | | 9 713 198 | |
Government owned corporations | | | 23 638 321 | | | | 20 902 441 | |
Local governments | | | 4 034 291 | | | | 2 402 268 | |
Queensland water entities | | | 8 127 364 | | | | 7 848 605 | |
Tollway companies | | | 2 899 052 | | | | 2 370 069 | |
Statutory bodies | | | 885 674 | | | | 898 307 | |
QTC related entities (1) | | | 231 554 | | | | 259 103 | |
Other bodies | | | 66 117 | | | | 11 469 | |
Cooperative housing society loans | | | 1 679 | | | | 2 286 | |
Provisions for impaired loans (i) | | | (238 | ) | | | (230 | ) |
| | | | | | | | |
| | | 55 113 222 | | | | 44 407 516 | |
| | | | | | | | |
| (1) | Included in the above figure is an onlending to DBCT Holdings Pty Ltd to fund the purchase and lease of operating rights to the Dalrymple Bay Coal Terminal (refer note 17 and note 33). |
The onlending is offset by a deposit of $233 million (2009 $259 million) held by QTC on behalf of the lessee of the terminal (refer note 17).
(i) ASSET QUALITY
Movement in provisions for impaired loans
| | | | | | | | |
Balance at 1 July | | | 230 | | | | 188 | |
Charge against profit | | | 8 | | | | 42 | |
| | | | | | | | |
Balance at 30 June | | | 238 | | | | 230 | |
| | | | | | | | |
Impaired assets consist of non-accrual loans and restructured loans in respect of cooperative housing societies. Non-accrual loans are loans for which there is reasonable doubt about the recovery of principal and interest and therefore provisions for impairment are recognised. Restructured loans consist of loans where the original contractual terms have been modified as a concession to the borrowers and revised terms are not comparable with those for new loans of similar risk. There were no restructured loans at 30 June 2010. Past due loans are loans where principal and or interest are in arrears but full recovery of principal and interest is expected.
The following table provides an analysis of QTC’s impaired assets.
| | | | | | | | |
| Non-accrual loans | | | | | | | | |
With specific provisions | | | 512 | | | | 570 | |
Less specific provisions for impaired loans | | | (238 | ) | | | (230 | ) |
| | | | | | | | |
Net non-accrual loans | | | 274 | | | | 340 | |
| | | | | | | | |
| | | | | | | | |
| Past due loans | | | | | | | | |
Not more than one month | | | 783 | | | | 376 | |
More than one month and not more than three months | | | 38 | | | | 41 | |
More than three months and not more than six months | | | 81 | | | | 564 | |
More than six months and not more than one year | | | 806 | | | | 355 | |
| | | | | | | | |
Total past due loans | | | 1 708 | | | | 1 336 | |
| | | | | | | | |
QUEENSLAND TREASURY CORPORATION ANNUAL REPORT 2009–2010 51
Notes to and Forming Part of the Financial Statements
FOR THE YEAR ENDED 30 JUNE 2010
13. Property, plant and equipment
Reconciliations of the carrying amounts for each class of property, plant and equipment are set out below:
| | | | | | | | | | | | | | | | |
DESCRIPTION | | INFORMATION
TECHNOLOGY
EQUIPMENT
$000 | | | FURNITURE,
FITTINGS AND
OFFICE EQUIPMENT
$000 | | | PLANT AND
MACHINERY (1)
$000 | | | TOTAL
$000 | |
| | | | |
Gross carrying amount | | | | | | | | | | | | | | | | |
Balance at 1 July 2008 | | | 3 204 | | | | 27 900 | | | | 66 756 | | | | 97 860 | |
Acquisitions | | | 448 | | | | 814 | | | | 79 936 | | | | 81 198 | |
Disposals | | | (714 | ) | | | (24 570 | ) | | | (14 284 | ) | | | (39 568 | ) |
| | | | | | | | | | | | | | | | |
Balance at 30 June 2009 | | | 2 938 | | | | 4 144 | | | | 132 408 | | | | 139 490 | |
| | | | | | | | | | | | | | | | |
Balance at 1 July 2009 | | | 2 938 | | | | 4 144 | | | | 132 408 | | | | 139 490 | |
Acquisitions | | | 122 | | | | 10 | | | | 74 487 | | | | 74 619 | |
Disposals | | | (113 | ) | | | (100 | ) | | | (184 | ) | | | (397 | ) |
| | | | | | | | | | | | | | | | |
Balance at 30 June 2010 | | | 2 947 | | | | 4 054 | | | | 206 711 | | | | 213 712 | |
| | | | | | | | | | | | | | | | |
Accumulated depreciation | | | | | | | | | | | | | | | | |
Balance at 1 July 2008 | | | 2 690 | | | | 17 354 | | | | 6 155 | | | | 26 199 | |
Disposals | | | (582 | ) | | | (17 408 | ) | | | (6 465 | ) | | | (24 455 | ) |
Depreciation expense | | | 195 | | | | 3 015 | | | | 9 284 | | | | 12 494 | |
| | | | | | | | | | | | | | | | |
Balance at 30 June 2009 | | | 2 303 | | | | 2 961 | | | | 8 974 | | | | 14 238 | |
| | | | | | | | | | | | | | | | |
Balance at 1 July 2009 | | | 2 303 | | | | 2 961 | | | | 8 974 | | | | 14 238 | |
Disposals | | | (89 | ) | | | (100 | ) | | | (91 | ) | | | (280 | ) |
Depreciation expense | | | 190 | | | | 359 | | | | 14 104 | | | | 14 653 | |
| | | | | | | | | | | | | | | | |
Balance at 30 June 2010 | | | 2 404 | | | | 3 220 | | | | 22 987 | | | | 28 611 | |
| | | | | | | | | | | | | | | | |
Net book value 30 June 2009 | | | 635 | | | | 1 183 | | | | 123 434 | | | | 125 252 | |
| | | | | | | | | | | | | | | | |
Net book value 30 June 2010 | | | 543 | | | | 834 | | | | 183 724 | | | | 185 101 | |
| | | | | | | | | | | | | | | | |
| (1) | Plant and machinery consists mainly of buses and ferries which QTC leases to public sector entities under a whole of government lease facility. |
14. Intangible assets
| | | | | | | | |
| | | 2010
$000 | | | 2009
$000 | |
| | |
Gross carrying amount | | | | | | | | |
Balance at 1 July | | | 5 204 | | | | 5 169 | |
Acquisitions (1) | | | 7 137 | | | | 2 125 | |
Disposals and writeoff | | | — | | | | (2 090 | ) |
| | | | | | | | |
Balance at 30 June | | | 12 341 | | | | 5 204 | |
| | | | | | | | |
Accumulated depreciation and impairment | | | | | | | | |
Balance at 1 July | | | 2 443 | | | | 2 330 | |
Disposals | | | — | | | | (53 | ) |
Amortisation expense | | | 136 | | | | 166 | |
| | | | | | | | |
Balance at 30 June | | | 2 579 | | | | 2 443 | |
| | | | | | | | |
Net book value 30 June | | | 9 762 | | | | 2 761 | |
| | | | | | | | |
| (1) | Includes $7.118 million of internally developed software not yet commissioned. |
QUEENSLAND TREASURY CORPORATION ANNUAL REPORT 2009–2010 52
15. Payables
| | | | | | | | |
| | | 2010
$000 | | | 2009
$000 | |
Cross border lease deferred income | | | 71 581 | | | | 109 731 | |
Whole-of-Government Debt Pool net position | | | 82 794 | | | | 76 428 | |
Administration expenses | | | 16 280 | | | | 16 129 | |
Employee benefits | | | 4 544 | | | | 4 102 | |
Unearned revenue | | | 1 044 | | | | 1 117 | |
Other creditors | | | 731 | | | | 815 | |
| | | | | | | | |
| | | 176 974 | | | | 208 322 | |
| | | | | | | | |
16. Derivative financial liabilities
| | | | | | | | |
Interest rate swaps | | | 24 288 | | | | 27 827 | |
Forward rate agreements | | | 1 915 | | | | 157 642 | |
Foreign exchange contracts | | | 35 386 | | | | 310 216 | |
Credit default swaps | | | 6 343 | | | | 26 409 | |
Cross currency swaps | | | 13 414 | | | | 22 879 | |
| | | | | | | | |
| | | 81 346 | | | | 544 973 | |
| | | | | | | | |
17. Financial liabilities at fair value through profit or loss
INTEREST BEARING LIABILITIES – CAPITAL MARKETS OPERATIONS
| | | | | | | | |
Domestic | | | | | | | | |
Treasury notes | | | 1 089 162 | | | | 2 241 181 | |
Bonds | | | 60 128 721 | | | | 49 102 736 | |
Credit foncier loans | | | 774 | | | | 1 112 | |
| | | 61 218 657 | | | | 51 345 029 | |
Offshore | | | | | | | | |
Commercial paper | | | 2 863 057 | | | | 2 462 683 | |
Bonds (1) | | | 3 846 619 | | | | 7 275 732 | |
Medium-term notes | | | 957 073 | | | | 1 540 790 | |
| | | | | | | | |
| | | 7 666 749 | | | | 11 279 205 | |
| | | | | | | | |
Total interest bearing liabilities | | | 68 885 406 | | | | 62 624 234 | |
| | | | | | | | |
| (1) | Consists of AUD denominated global bonds which are borrowed in the United States and Euro markets. |
Derivatives are used to hedge offshore borrowings resulting in no net exposure to any foreign currency. Details of QTC’s exposure to foreign currencies and the derivatives used to hedge this exposure are disclosed in note 21 (A)(i).
QTC borrowings are guaranteed by the Queensland Government under the Queensland Treasury Corporation Act 1988.
QUEENSLAND TREASURY CORPORATION ANNUAL REPORT 2009–2010 53
Notes to and Forming Part of the Financial Statements
FOR THE YEAR ENDED 30 JUNE 2010
17. Financial liabilities at fair value through profit or lossCONTINUED
The difference between the carrying amount of financial liabilities and the amount contractually required to be paid at maturity to the holder of the obligation is set out in the following table.
| | | | | | | | | | | | |
| | | FAIR VALUE
$000 | | | 2010
REPAYMENT
AT MATURITY
$000 | | | DIFFERENCE
$000 | |
| | | |
INTEREST BEARING LIABILITIES – CAPITAL MARKETS OPERATIONS | | | | | | | | | | | | |
Domestic | | | | | | | | | | | | |
Treasury notes | | | 1 089 162 | | | | 1 103 000 | | | | (13 838 | ) |
Bonds | | | 60 128 721 | | | | 57 703 282 | | | | 2 425 439 | |
Credit foncier loans | | | 774 | | | | 729 | | | | 45 | |
| | | | | | | | | | | | |
| | | 61 218 657 | | | | 58 807 011 | | | | 2 411 646 | |
| | | | | | | | | | | | |
Offshore | | | | | | | | | | | | |
Commercial paper | | | 2 863 057 | | | | 2 869 331 | | | | (6 274 | ) |
Bonds | | | 3 846 619 | | | | 3 688 927 | | | | 157 692 | |
Medium-term notes | | | 957 073 | | | | 827 557 | | | | 129 516 | |
| | | | | | | | | | | | |
| | | 7 666 749 | | | | 7 385 815 | | | | 280 934 | |
| | | | | | | | | | | | |
| | | 68 885 406 | | | | 66 192 826 | | | | 2 692 580 | |
| | | | | | | | | | | | |
| | | | | | | | | | | | |
| | | FAIR VALUE
$000 | | | 2009
REPAYMENT
AT MATURITY
$000 | | | DIFFERENCE
$000 | |
| | | |
INTEREST BEARING LIABILITIES – CAPITAL MARKETS OPERATIONS | | | | | | | | | | | | |
Domestic | | | | | | | | | | | | |
Treasury notes | | | 2 241 181 | | | | 2 249 000 | | | | (7 819 | ) |
Bonds | | | 49 102 736 | | | | 48 004 532 | | | | 1 098 204 | |
Credit foncier loans | | | 1 112 | | | | 1 041 | | | | 71 | |
| | | | | | | | | | | | |
| | | 51 345 029 | | | | 50 254 573 | | | | 1 090 456 | |
| | | | | | | | | | | | |
Offshore | | | | | | | | | | | | |
Commercial paper | | | 2 462 683 | | | | 2 464 246 | | | | (1 563 | ) |
Bonds | | | 7 275 732 | | | | 7 075 848 | | | | 199 884 | |
Medium-term notes | | | 1 540 790 | | | | 1 430 548 | | | | 110 242 | |
| | | | | | | | | | | | |
| | | 11 279 205 | | | | 10 970 642 | | | | 308 563 | |
| | | | | | | | | | | | |
| | | 62 624 234 | | | | 61 225 215 | | | | 1 399 019 | |
| | | | | | | | | | | | |
QUEENSLAND TREASURY CORPORATION ANNUAL REPORT 2009–2010 54
17. Financial liabilities at fair value through profit or lossCONTINUED
| | | | | | | | |
| | | 2010
$000 | | | 2009
$000 | |
CUSTOMER DEPOSITS – CAPITAL MARKETS OPERATIONS | | | | | | | | |
Government Owned Corporations | | | 1 144 008 | | | | 1 428 142 | |
Local governments | | | 1 528 975 | | | | 2 413 819 | |
Statutory bodies | | | 972 588 | | | | 2 656 292 | |
Government departments and agencies | | | 85 777 | | | | 253 432 | |
Tollway companies | | | 11 004 | | | | 106 517 | |
Queensland water entities | | | 118 608 | | | | 251 046 | |
QTC related entities | | | 34 507 | | | | 48 197 | |
Other depositors (1) | | | 383 194 | | | | 368 348 | |
| | | | | | | | |
| | | 4 278 661 | | | | 7 525 793 | |
| | |
Collateral | | | 30 872 | | | | 4 833 | |
Repurchase agreements | | | 351 427 | | | | 262 384 | |
| | | | | | | | |
Total deposits | | | 4 660 960 | | | | 7 793 010 | |
| | | | | | | | |
| (1) | Includes a security deposit of $233 million (2009 $259 million) held on behalf of the lessee of the Dalrymple Bay Coal Terminal. |
18. Financial liabilities at amortised cost
FIXED RATE NOTE – LONG TERM ASSETS
| | | | | | | | |
State Government | | | 23 253 135 | | | | 22 108 505 | |
| | | | | | | | |
| | | 23 253 135 | | | | 22 108 505 | |
| | | | | | | | |
The Board considers that the carrying value of financial liabilities recorded at amortised cost in the financial statements approximates their fair value.
QUEENSLAND TREASURY CORPORATION ANNUAL REPORT 2009–2010 55
Notes to and Forming Part of the Financial Statements
FOR THE YEAR ENDED 30 JUNE 2010
19. Reserves
| | | | | | | | |
| | | 2010
$000 | | | 2009
$000 | |
GENERAL RESERVE | | | | | | | | |
Balance at 1 July | | | 39 082 | | | | 39 082 | |
Transfer to retained surplus | | | (39 082 | ) | | | — | |
| | | | | | | | |
Balance at 30 June | | | — | | | | 39 082 | |
| | | | | | | | |
CREDIT RISK RESERVE (1) | | | | | | | | |
Balance at 1 July | | | 126 332 | | | | 34 000 | |
Transfer from retained surplus | | | 7 031 | | | | 92 332 | |
| | | | | | | | |
Balance at 30 June | | | 133 363 | | | | 126 332 | |
| | | | | | | | |
BASIS RISK RESERVE (2) | | | | | | | | |
Balance at 1 July | | | 24 500 | | | | 53 500 | |
Transfer from/(to) retained surplus | | | 38 000 | | | | (29 000 | ) |
| | | | | | | | |
Balance at 30 June | | | 62 500 | | | | 24 500 | |
| | | | | | | | |
Total | | | 195 863 | | | | 189 914 | |
| | | | | | | | |
| (1) | As the State’s corporate treasury, QTC undertakes portfolio management activities on behalf of customers and raises debt funding in advance of requirements thereby ensuring Queensland public sector entities have ready access to funding when required and also to reduce the risk associated with refinancing maturing loans. These activities expose QTC to credit risk due to the growth in counterparty exposures. |
In addition to its portfolio management activities, QTC also invests funds on behalf of its customers through the QTC Cash Fund. QTC’s Cash Fund is capital guaranteed. To reduce the impact of a credit failure on its retained earnings, QTC sets aside a certain portion of its fees earned from the Cash Fund to the Credit Risk Reserve together with interest accumulated on the reserves. The Credit Risk Reserve will be utilised if a credit event results in there being a shortfall between the guaranteed capital and the investments of the Cash Fund.
| (2) | The Basis Risk Reserve has been created to provide for losses that may occur as a result of basis risk where QTC has borrowed funds in excess of its loans to customers. The excess borrowings are needed to enable QTC to manage its customer debt portfolios and liquidity, and are hedged through the purchase of liquid assets. Gains/losses may result due to interest yields on the asset hedges not moving in exactly the same manner as the interest yields on borrowings. Basis risk is measured using the value at risk methodology. At the 99% confidence level, the accumulated losses as a result of basis risk on surplus fixed rate funding over a 10 business day period will be no greater than the value of the reserve for surplus fixed rate funding. Further at 99% confidence, the accumulated losses as a result of basis risk on surplus floating rate funding over a 20 business day period, will be no greater than the value of the reserve for surplus floating rate funding. |
QUEENSLAND TREASURY CORPORATION ANNUAL REPORT 2009–2010 56
20. Notes to the statement of cash flows
(A) RECONCILIATION OF PROFIT AFTER TAX TO NET CASH PROVIDED BY OPERATING ACTIVITIES - CAPITAL MARKETS OPERATIONS
| | | | | | | | |
| | | 2010
$000 | | | 2009
$000 | |
| | |
Profit for the year | | | 209 436 | | | | 43 203 | |
| | |
Non-cash flows in operating surplus | | | | | | | | |
Interest-bearing liabilities - net unrealised loss | | | 709 803 | | | | 1 136 719 | |
Interest-bearing liabilities - net unrealised exchange (gain)/loss | | | (169 311 | ) | | | 30 655 | |
Deposits - net unrealised (gain)/loss | | | (1 330 | ) | | | 2 470 | |
Onlendings net unrealised gain | | | (64 599 | ) | | | (104 040 | ) |
Financial assets at fair value through profit or loss - net unrealised gain | | | (298 536 | ) | | | (64 476 | ) |
Financial assets at fair value through profit or loss - net unrealised exchange gain | | | (583 | ) | | | (1 904 | ) |
Depreciation of property, plant and equipment | | | 14 653 | | | | 12 494 | |
Amortisation of intangibles | | | 136 | | | | 166 | |
Net loss/ (gain) on sale of property, plant and equipment | | | 70 | | | | (1 312 | ) |
Impairment of intangibles | | | — | | | | 2 037 | |
Doubtful debts expense cooperative housing societies | | | 7 | | | | 42 | |
Share of profit from investments accounted for using the equity method | | | (210 | ) | | | (120 | ) |
| | |
Changes in assets and liabilities | | | | | | | | |
Decrease/(increase) in financial assets at fair value through profit or loss - net accrued interest | | | 21 938 | | | | (25 200 | ) |
Decrease/(increase) in financial assets at fair value through profit or loss - net discount/premium | | | 115 948 | | | | (179 989 | ) |
Decrease/(increase) in deferred tax asset | | | 61 | | | | (890 | ) |
Increase in onlendings - net accrued interest | | | (8 579 | ) | | | (240 | ) |
Increase in receivables | | | (1 651 | ) | | | (2 189 | ) |
Increase in prepayments | | | (183 | ) | | | (763 | ) |
Increase in interest-bearing liabilities - net accrued interest | | | 182 055 | | | | 95 636 | |
Increase in interest-bearing liabilities - net discount/premium | | | 552 839 | | | | 878 090 | |
Increase/(decrease) in deposits net accrued interest | | | 5 023 | | | | (4 123 | ) |
(Decrease)/increase in payables | | | (31 348 | ) | | | 55 484 | |
Increase in deferred tax liability | | | 9 | | | | 1 | |
Increase/(decrease) in income tax payable | | | 22 888 | | | | (4 826 | ) |
| | | | | | | | |
Net cash provided by operating activities | | | 1 258 536 | | | | 1 866 924 | |
| | | | | | | | |
(B) CASH FLOWS PRESENTED ON A NET BASIS
Cash flows arising from the following activities are presented on a net basis in the statement of cash flows:
| • | | loan advances to and redemptions from customers |
| • | | receipt and withdrawal of customer deposits, and |
| • | | money market and other deposits. |
(C) LONG TERM ASSETS
No external cashflow is generated from the Long Term Assets as deposits and withdrawals from the fixed rate note result in a corresponding change to the investments held. Interest on the fixed rate note is capitalised. Earnings, market movement and fees on the investment are recognised in the valuation of the investment (refer notes 2 (F) and 3).
QUEENSLAND TREASURY CORPORATION ANNUAL REPORT 2009–2010 57
Notes to and Forming Part of the Financial Statements
FOR THE YEAR ENDED 30 JUNE 2010
21. Financial risk management
CAPITAL MARKETS OPERATIONS
QTC’s activities expose it to a variety of financial risks; market risk (including currency, interest rate and price risks), credit risk and liquidity risk. QTC’s financial risk management program focuses on minimising financial risk exposures and managing volatility, and seeks to mitigate potential adverse effects of financial risks on the financial performance of QTC and its customers. To assist in managing financial risk, QTC uses derivative financial instruments such as foreign exchange contracts, interest rate swaps and futures contracts to manage certain risk exposures.
All financial risk management activities are conducted within Board approved policies. The Board approves policies for overall risk management, as well as specifically for managing foreign exchange, interest rate and credit risks, the use of derivative financial instruments and managing and investing liquid funds. Robust systems are in place for managing financial risk, and compliance with financial risk policies is monitored closely. The financial risk management process, including daily measuring and monitoring of market risk exposure and daily measuring of actual performance against benchmark performance, as well as the Counterparty Credit Limit Framework and Approvals Process, is performed by teams separate from the teams transacting and is subject to review by the Risk Management Team (comprising senior management) and the Risk Management Committee of the Board. All breaches of the Financial Risk Management Policy together with the corrective action proposed or taken are required to be immediately reported to the Chief Executive and then to the next Risk Management Committee meeting.
(A) MARKET RISK
QTC borrows in advance of requirements to ensure Queensland public sector entities have ready access to funding when required and also to reduce the risk associated with refinancing maturing loans. In addition, QTC may hold surplus funds to assist with the management of customer portfolios. These surplus funds are invested in high credit quality, highly liquid financial investments. As a consequence, QTC is subject to market risk.
QTC uses a Board approved Value-at-Risk (VaR) framework to manage QTC’s exposure to market risk. The VaR risk measure estimates the potential mark-to-market loss over a given holding period at a 99% confidence level. QTC uses the historical simulation approach to calculate VaR using 18 months of market data. Depending on the liquidity of the underlying financial instruments, either a 10 day or 20 day holding period is used. QTC has developed scenario analysis capabilities to complement VaR.
(i) Foreign exchange risk
QTC has funding facilities that allow for borrowing in foreign currencies. As QTC’s customers have no foreign currency funding requirements, all foreign currency borrowings are either hedged to Australian dollars to ensure no currency risk or invested in financial assets denominated in that currency, effectively eliminating any foreign currency exposure. Therefore QTC is not impacted by changes in foreign exchange rates.
At times, QTC’s Cash Fund invests in foreign currency assets. These investments are always hedged through the use of derivatives to achieve a net Australian dollar exposure. QTC enters into both forward exchange contracts and cross currency swaps to hedge the exposure of foreign currency borrowings and offshore investments from fluctuations in exchange rates. The following table summarises the hedging effect that cross currency swaps and forward exchange contracts have had on face value offshore borrowings and investments stated in Australian dollars.
| | | | | | | | | | | | | | | | | | | | | | | | | | | | | | | | |
| | | BORROWINGS | | | OFFSHORE
INVESTMENTS | | | FORWARD EXCHANGE
CONTRACTS | | | NET
EXPOSURE | |
| | | 2010
$000 | | | 2009
$000 | | | 2010
$000 | | | 2009
$000 | | | 2010
$000 | | | 2009
$000 | | | 2010
$000 | | | 2009
$000 | |
| | | | | | | | |
USD | | | (2 233 756 | ) | | | (2 554 448 | ) | | | 25 847 | | | | 2 246 | | | | 2 207 888 | | | | 2 552 202 | | | | (21 | ) | | | — | |
EUR | | | — | | | | (234 684 | ) | | | — | | | | — | | | | — | | | | 234 684 | | | | — | | | | — | |
GBP | | | (44 026 | ) | | | (51 393 | ) | | | — | | | | — | | | | 44 026 | | | | 51 393 | | | | — | | | | — | |
NZD | | | (629 690 | ) | | | (703 973 | ) | | | — | | | | — | | | | 629 690 | | | | 703 973 | | | | — | | | | — | |
SGD | | | (12 548 | ) | | | (39 884 | ) | | | — | | | | — | | | | 12 548 | | | | 39 884 | | | | — | | | | — | |
YEN | | | (197 867 | ) | | | (193 449 | ) | | | — | | | | — | | | | 197 867 | | | | 193 449 | | | | — | | | | — | |
QUEENSLAND TREASURY CORPORATION ANNUAL REPORT 2009–2010 58
21. Financial risk managementCONTINUED
(A) MARKET RISK CONTINUED
(ii) Interest rate risk
In managing interest rate risk on behalf of customers, the onlending portfolios are managed against duration benchmarks. Duration is a direct measure of the interest rate sensitivity of a financial instrument or a portfolio of financial instruments and quantifies the change in value of a financial instrument or portfolio due to interest rate movements. To manage the risk of non-parallel yield curve movements, QTC manages portfolio cash flows in a series of time periods with the duration for each of these periods measured against the equivalent benchmark duration. The same process is also used for QTC’s Cash Fund. All costs or benefits of managing customer debt portfolios are passed on to the customer meaning that QTC is effectively immunised from interest rate risk with respect to these portfolios.
QTC enters into interest rate swaps, forward rate agreements and futures contracts to assist in the management of interest rate risk for QTC and its customers. In most instances, interest rate swaps are utilised to change the interest rate exposure of medium- to long-term fixed rate borrowings into floating rate borrowings to achieve cost effective floating rate funding and to minimise refinancing risk when compared to floating rate debt. At times, floating to fixed swaps are undertaken to generate a fixed rate term funding profile. An interest rate swap agreement results in QTC agreeing with the other party to the agreement to exchange at specified intervals the difference between fixed rate and floating rate interest amounts calculated by reference to the agreed notional principal amount.
Where interest rate swaps are used to manage funding, QTC is exposed to basis risk. This risk gives rise to a mark-to-market exposure due to movements between the Swap curve (effectively the interest rate curve used to value interest rate swaps and floating rate investments) and the QTC curve (the interest rate curve used to value QTC debt). The swap risk is inherent in QTC’s approach to raising floating rate funding.
VaR impact
With the increase in market volatility since the middle of calendar year 2007, together with increased levels of liquidity held to fund QTC’s customers and the retirement of QTC’s borrowings, there has been a significant increase in the reported Value-at-Risk over the last three years which at 30 June was as follows:
| | | | | | | | |
| | | 2010 | | | 2009 | |
Interest rate risk VaR | | $ | 95m | | | $ | 62m | |
The above VaR calculation does not include the potential mark-to-market impact of changes in credit spreads on the value of assets held in the QTC Cash Fund. At 30 June 2010, QTC had an exposure of approximately $759,000 per basis point to changes in credit spreads of assets held in the QTC Cash Fund.
Impact on operating result
Surplus funding
As previously stated, QTC holds surplus funds which have been generated through the issuance of debt and which have been hedged through the purchase of high credit quality and highly liquid financial assets. Due to the nature of these hedging instruments (eg, futures and other RBA repo eligible securities such as semi-government bonds), there are residual risk positions resulting in realised and unrealised accounting gains for the year of $29.2 million.
Floating rate funding
In relation to swap basis risk created by the liability swapping of term debt to generate floating rate funding, the QTC interest rate curve traded below the swap interest rate curve for the majority of 2009-10, resulting in mark-to-market accounting losses of $12.0 million. As these interest rate swaps are utilised to provide medium to long-term floating rate funding, it is likely that QTC will hold the majority of these transactions until maturity such that unrealised mark-to-market losses may be reversed over the life of the funding strategy.
Cash Fund
QTC invests funds on behalf of its customers which are held in the QTC Cash Fund. As credit spreads narrowed over 2009-10, the value of the assets held in the Cash Fund increased by $112.2 million due to unrealised mark-to-market accounting gains. It has been QTC’s practice to hold these assets to maturity and therefore not pass on credit margin changes, either positive or negative, as a result of credit spread movements in the returns to Cash Fund participants.
QUEENSLAND TREASURY CORPORATION ANNUAL REPORT 2009–2010 59
Notes to and Forming Part of the Financial Statements
FOR THE YEAR ENDED 30 JUNE 2010
21. Financial risk managementCONTINUED
(ii) Interest rate risk continued
(B) LIQUIDITY AND FINANCING RISKS
QTC maintains its domestic and global benchmark bond facilities as its core medium to long-term funding facilities and its domestic treasury note facility, euro-commercial paper facility and US commercial paper facility as its core short-term funding facilities. In addition, QTC has in place Euro and US medium term note facilities to take advantage of funding opportunities in offshore markets.
These facilities ensure that QTC is readily able to access the domestic and international financial markets. QTC’s extensive range of funding facilities is detailed in note 27.
The ongoing global liquidity and credit crises has meant that the maturity dates of funds raised by QTC continued to be driven, to a large extent, by investor preferences rather than by QTC. By utilising syndicated book build issuance to complement its usual tender and tap processes, QTC was able to access attractively priced short-, medium- and long-term funding to meet customer borrowing needs.
On 7 February 2010, the Australian Government announced that it will close its offer of a Guarantee to new State issuance after 31 December 2010. QTC consequently commenced the implementation of its exit strategy from the Commonwealth Government guarantee over the second half of 2009-10. QTC has successfully launched three new Queensland Government guaranteed Australian dollar benchmark bond lines maturing in 2014, 2016 and 2020 and raising $12,731 million.
In total QTC raised $20,583 million in 2009-10 (final borrowing requirement $20,341 million) resulting in additional funding of $242 million to be applied towards next year’s borrowing program.
To ensure liquidity is accessible as required, QTC holds a minimum of $500 million or 20 working days’ cash requirements (whichever is the higher) in 11 AM cash to fund unexpected cash outflows. In addition, the majority of QTC surplus holdings are in high credit quality and highly liquid financial investments.
The table on the next page sets out the contractual cashflows relating to assets and liabilities held by QTC at balance date.
With the exception of deposits and payables, the maturity analysis for liabilities has been calculated based on the contractual cash flows relating to the repayment of the principal (face value) and interest amounts over the contractual terms.
Deposits on account of the Cash Fund and Working Capital Facility (11AM Fund) are repayable at call while deposits held as security for stock lending and repurchase agreements are repayable when the security is lodged with QTC.
With the exception of cash and receivables, the maturity analysis for assets has been calculated based on the contractual cash flows relating to the repayment of the principal (face value) and interest amounts over the contractual terms.
In relation to customer onlendings, certain loans are interest only with no fixed repayment date for the principal component (ie, loans are made based on the quality of the customer’s business and its financial strength). For the purposes of completing the maturity analysis, the principal component of these loans has been included in the over 5 year time band with no interest payment assumed in this time band.
QUEENSLAND TREASURY CORPORATION ANNUAL REPORT 2009–2010 60
21. Financial risk managementCONTINUED
(B) LIQUIDITY AND FINANCING RISKS CONTINUED
| | | | | | | | | | | | | | | | | | | | | | | | | | | | |
CONTRACTUAL MATURITY AS AT 30 JUNE 2010 | | 0 TO 3
MONTHS
$000 | | | 3 TO 6
MONTHS
$000 | | | 6 TO 12
MONTHS
$000 | | | 1 TO 5
YEARS
$000 | | | OVER 5
YEARS
$000 | | | TOTAL
$000 | | | FAIR VALUE
$000 | |
| | | | | | | |
FINANCIAL ASSETS | | | | | | | | | | | | | | | | | | | | | | | | | | | | |
Receivables | | | 12 506 | | | | — | | | | — | | | | — | | | | — | | | | 12 506 | | | | 12 506 | |
Onlendings # | | | 1 730 386 | | | | 1 413 984 | | | | 2 888 063 | | | | 16 037 242 | | | | 54 648 693 | | | | 76 718 368 | | | | 55 113 222 | |
Money market deposits | | | 946 303 | | | | — | | | | — | | | | — | | | | — | | | | 946 303 | | | | 946 297 | |
Discount securities | | | 5 797 570 | | | | 650 000 | | | | — | | | | — | | | | — | | | | 6 447 570 | | | | 6 389 776 | |
Commonwealth and
semi-government securities | | | 91 118 | | | | 85 025 | | | | 228 204 | | | | 2 381 525 | | | | 3 603 421 | | | | 6 389 293 | | | | 4 791 447 | |
Floating rate notes | | | 341 442 | | | | 226 106 | | | | 910 649 | | | | 2 827 535 | | | | 566 264 | | | | 4 871 996 | | | | 4 110 010 | |
Other investments | | | 562 637 | | | | 888 091 | | | | 118 444 | | | | 1 108 348 | | | | — | | | | 2 677 520 | | | | 2 456 476 | |
| | | | | | | | | | | | | | | | | | | | | | | | | | | | |
Total monetary assets | | | 9 481 962 | | | | 3 263 206 | | | | 4 145 360 | | | | 22 354 650 | | | | 58 818 378 | | | | 98 063 556 | | | | 73 819 734 | |
| | | | | | | | | | | | | | | | | | | | | | | | | | | | |
FINANCIAL LIABILITIES | | | | | | | | | | | | | | | | | | | | | | | | | | | | |
Bank overdraft | | | (1 167 | ) | | | — | | | | — | | | | — | | | | — | | | | (1 167 | ) | | | (1 167 | ) |
Payables/tax liability | | | (176 974 | ) | | | (34 004 | ) | | | — | | | | (32 | ) | | | — | | | | (211 010 | ) | | | (211 010 | ) |
Deposits | | | (4 641 502 | ) | | | (20 480 | ) | | | — | | | | — | | | | — | | | | (4 661 982 | ) | | | (4 660 960 | ) |
Treasury notes | | | (953 000 | ) | | | (150 000 | ) | | | — | | | | — | | | | — | | | | (1 103 000 | ) | | | (1 089 162 | ) |
Domestic bonds | | | (509 958 | ) | | | (1 144 776 | ) | | | (9 403 210 | ) | | | (28 205 244 | ) | | | (38 145 959 | ) | | | (77 409 147 | ) | | | (60 128 721 | ) |
Credit foncier loans | | | (81 | ) | | | (77 | ) | | | (139 | ) | | | (534 | ) | | | — | | | | (831 | ) | | | (774 | ) |
Commercial paper | | | (2 110 915 | ) | | | (758 416 | ) | | | — | | | | — | | | | — | | | | (2 869 331 | ) | | | (2 863 057 | ) |
Global bonds | | | (43 851 | ) | | | (66 817 | ) | | | (1 148 436 | ) | | | (1 338 099 | ) | | | (2 019 181 | ) | | | (4 616 384 | ) | | | (3 846 619 | ) |
Medium-term notes | | | (25 327 | ) | | | — | | | | (24 721 | ) | | | (223 592 | ) | | | (1 070 100 | ) | | | (1 343 740 | ) | | | (957 073 | ) |
| | | | | | | | | | | | | | | | | | | | | | | | | | | | |
Total monetary liabilities | | | (8 462 775 | ) | | | (2 174 570 | ) | | | (10 576 506 | ) | | | (29 767 501 | ) | | | (41 235 240 | ) | | | (92 216 592 | ) | | | (73 758 543 | ) |
| | | | | | | | | | | | | | | | | | | | | | | | | | | | |
DERIVATIVES | | | | | | | | | | | | | | | | | | | | | | | | | | | | |
Interest rate swaps | | | (28 763 | ) | | | 126 561 | | | | 283 414 | | | | 237 970 | | | | (16 471 | ) | | | 602 711 | | | | 101 148 | |
Cross currency swaps | | | (588 512 | ) | | | (29 118 | ) | | | 19 108 | | | | 152 701 | | | | 562 333 | | | | 116 512 | | | | 104 245 | |
Forward rate agreements | | | — | | | | (41 457 | ) | | | 80 298 | | | | (9 203 | ) | | | (39 499 | ) | | | (9 861 | ) | | | 71 533 | |
Foreign exchange contracts | | | 38 162 | | | | (42 884 | ) | | | 34 | | | | 54 | | | | — | | | | (4 634 | ) | | | 15 778 | |
Credit default swaps | | | 207 | | | | (790 | ) | | | (1 581 | ) | | | (2 929 | ) | | | — | | | | (5 093 | ) | | | (6 343 | ) |
| | | | | | | | | | | | | | | | | | | | | | | | | | | | |
Net derivatives | | | (578 906 | ) | | | 12 312 | | | | 381 273 | | | | 378 593 | | | | 506 363 | | | | 699 635 | | | | 286 361 | |
| | | | | | | | | | | | | | | | | | | | | | | | | | | | |
Net monetary assets/(liabilities) | | | 440 281 | | | | 1 100 948 | | | | (6 049 873 | ) | | | (7 034 258 | ) | | | 18 089 501 | | | | 6 546 599 | | | | 347 552 | |
| | | | | | | | | | | | | | | | | | | | | | | | | | | | |
Cumulative | | | 440 281 | | | | 1 541 229 | | | | (4 508 644 | ) | | | (11 542 902 | ) | | | 6 546 599 | | | | — | | | | — | |
| | | | | | | | | | | | | | | | | | | | | | | | | | | | |
| # | QTC’s onlendings to Government owned corporation customers are based on the quality of the business and financial strength of the customer. Funds are therefore onlent on the basis of these businesses being going concerns and continuing to meet key credit metrics criteria such as debt to capital and interest coverage ratios. Accordingly, a significant portion of the onlendings portfolio has a loan maturity profile which is greater than five years with the interest rate risk of these loans being managed based on the customer’s business risk such that the funding is structured on the underlying business profile. This results in QTC’s liability maturity profile being shorter than the asset maturity profile. Though not exposing QTC to interest rate risk, this approach does require QTC to undertake periodic refinancing of its liabilities. |
QUEENSLAND TREASURY CORPORATION ANNUAL REPORT 2009–2010 61
Notes to and Forming Part of the Financial Statements
FOR THE YEAR ENDED 30 JUNE 2010
21. Financial risk managementCONTINUED
(B) LIQUIDITY AND FINANCING RISKS CONTINUED
| | | | | | | | | | | | | | | | | | | | | | | | | | | | |
CONTRACTUAL MATURITY AS AT 30 JUNE 2009 | | 0 TO 3
MONTHS
$000 | | | 3 TO 6
MONTHS
$000 | | | 6 TO 12
MONTHS
$000 | | | 1 TO 5
YEARS
$000 | | | OVER 5
YEARS
$000 | | | TOTAL
$000 | | | FAIR VALUE
$000 | |
| | | | | | | |
FINANCIAL ASSETS | | | | | | | | | | | | | | | | | | | | | | | | | | | | |
Cash | | | 814 | | | | — | | | | — | | | | — | | | | — | | | | 814 | | | | 814 | |
Receivables | | | 10 672 | | | | — | | | | — | | | | — | | | | — | | | | 10 672 | | | | 10 672 | |
Onlendings | | | 708 860 | | | | 713 141 | | | | 1 213 723 | | | | 9 593 876 | | | | 48 436 389 | | | | 60 665 989 | | | | 44 407 746 | |
Money market deposits | | | 2 850 934 | | | | — | | | | — | | | | — | | | | — | | | | 2 850 934 | | | | 2 850 686 | |
Discount securities | | | 12 009 070 | | | | 50 000 | | | | — | | | | — | | | | — | | | | 12 059 070 | | | | 12 033 545 | |
Commonwealth and semi-government securities | | | 112 455 | | | | 138 473 | | | | 170 437 | | | | 3 909 793 | | | | 3 026 282 | | | | 7 357 440 | | | | 5 820 281 | |
Floating rate notes | | | 1 282 034 | | | | 94 313 | | | | 405 707 | | | | 2 611 720 | | | | 162 259 | | | | 4 556 033 | | | | 4 408 159 | |
Other investments | | | 451 302 | | | | 74 229 | | | | 294 248 | | | | 611 085 | | | | — | | | | 1 430 864 | | | | 1 361 841 | |
| | | | | | | | | | | | | | | | | | | | | | | | | | | | |
Total monetary assets | | | 17 426 141 | | | | 1 070 156 | | | | 2 084 115 | | | | 16 726 474 | | | | 51 624 930 | | | | 88 931 816 | | | | 70 893 744 | |
| | | | | | | | | | | | | | | | | | | | | | | | | | | | |
FINANCIAL LIABILITIES | | | | | | | | | | | | | | | | | | | | | | | | | | | | |
Payables/tax Liability | | | (208 322 | ) | | | (11 116 | ) | | | — | | | | (23 | ) | | | — | | | | (219 461 | ) | | | (219 461 | ) |
Deposits | | | (7 777 098 | ) | | | (20 189 | ) | | | — | | | | — | | | | — | | | | (7 797 287 | ) | | | (7 793 010 | ) |
Treasury notes | | | (2 214 000 | ) | | | (35 000 | ) | | | — | | | | — | | | | — | | | | (2 249 000 | ) | | | (2 241 181 | ) |
Domestic bonds | | | (3 522 862 | ) | | | (937 015 | ) | | | (7 970 083 | ) | | | (27 240 863 | ) | | | (22 907 772 | ) | | | (62 578 595 | ) | | | (49 102 736 | ) |
Credit foncier loans | | | (97 | ) | | | (101 | ) | | | (185 | ) | | | (822 | ) | | | (10 | ) | | | (1 215 | ) | | | (1 112 | ) |
Commercial paper | | | (2 388 571 | ) | | | (67 676 | ) | | | (8 000 | ) | | | — | | | | — | | | | (2 464 247 | ) | | | (2 462 683 | ) |
Global bonds | | | (1 480 263 | ) | | | (106 600 | ) | | | (491 919 | ) | | | (3 713 889 | ) | | | (2 732 418 | ) | | | (8 525 089 | ) | | | (7 275 732 | ) |
Medium-term notes | | | (498 017 | ) | | | (5 306 | ) | | | (47 385 | ) | | | (282 338 | ) | | | (1 201 136 | ) | | | (2 034 182 | ) | | | (1 540 790 | ) |
| | | | | | | | | | | | | | | | | | | | | | | | | | | | |
Total monetary liabilities | | | (18 089 230 | ) | | | (1 183 003 | ) | | | (8 517 572 | ) | | | (31 237 935 | ) | | | (26 841 336 | ) | | | (85 869 076 | ) | | | (70 636 705 | ) |
| | | | | | | | | | | | | | | | | | | | | | | | | | | | |
DERIVATIVES | | | | | | | | | | | | | | | | | | | | | | | | | | | | |
Interest rate swaps | | | 54 634 | | | | 76 077 | | | | 74 891 | | | | 226 117 | | | | (13 544 | ) | | | 418 175 | | | | 223 119 | |
Cross currency swaps | | | (648 550 | ) | | | (5 415 | ) | | | (9 805 | ) | | | 146 304 | | | | 685 978 | | | | 168 512 | | | | 63 454 | |
Forward rate agreements | | | (35 623 | ) | | | (158 045 | ) | | | 2 146 | | | | 67 955 | | | | 201 527 | | | | 77 960 | | | | (2 305 | ) |
Foreign exchange contracts | | | (310 981 | ) | | | (6 506 | ) | | | 33 | | | | 66 | | | | — | | | | (317 388 | ) | | | (309 583 | ) |
Credit default swaps | | | 218 | | | | (2 630 | ) | | | (5 259 | ) | | | (15 053 | ) | | | — | | | | (22 724 | ) | | | (26 409 | ) |
| | | | | | | | | | | | | | | | | | | | | | | | | | | | |
Net derivatives | | | (940 302 | ) | | | (96 519 | ) | | | 62 006 | | | | 425 389 | | | | 873 961 | | | | 324 535 | | | | (51 724 | ) |
| | | | | | | | | | | | | | | | | | | | | | | | | | | | |
Net monetary assets/(liabilities) | | | (1 603 391 | ) | | | (209 366 | ) | | | (6 371 451 | ) | | | (14 086 072 | ) | | | 25 657 555 | | | | 3 387 275 | | | | (205 315 | ) |
| | | | | | | | | | | | | | | | | | | | | | | | | | | | |
Cumulative | | | (1 603 391 | ) | | | (1 812 757 | ) | | | (8 184 208 | ) | | | (22 270 280 | ) | | | 3 387 275 | | | | — | | | | — | |
| | | | | | | | | | | | | | | | | | | | | | | | | | | | |
QUEENSLAND TREASURY CORPORATION ANNUAL REPORT 2009–2010 62
21. Financial risk managementCONTINUED
(C) CREDIT RISK
(i) Financial markets counterparties
QTC is exposed to credit risk. Credit risk is regularly assessed, measured and managed in strict accordance with QTC’s Credit Risk Policy. Exposure to credit risk is managed through regular analysis of the ability of credit counterparties to meet payment obligations. Counterparty credit limits are changed based on QTC’s view of the capacity of the counterparty to meet its obligation.
Credit exposure is QTC’s estimate of its potential loss at balance date in relation to investments and derivative contracts in the event of non-performance by all counterparties. The credit exposure is calculated based on the market value of the exposure together with the value at risk which takes into account the current market value, duration, term to maturity and interest rate and/or exchange rate volatility. The following table represents QTC’s exposure to credit risk at 30 June:
| | | | | | | | |
| | | CREDIT EXPOSURE | |
| | | 2010
$000 | | | 2009
$000 | |
| | |
Investments | | | 22 093 116 | | | | 31 415 361 | |
| | |
Derivatives | | | | | | | | |
Interest rate swaps | | | 423 652 | | | | 620 184 | |
Cross currency swaps | | | 192 343 | | | | 383 169 | |
Foreign exchange contracts | | | 143 916 | | | | 159 537 | |
Forward rate agreements | | | 686 | | | | — | |
Credit default swaps | | | 333 353 | | | | 361 615 | |
QTC adopts a conservative approach to the management of credit risk with a strong bias to high credit quality counterparties. QTC maintains a ratings based approach in determining maximum credit exposures to counterparties which is supplemented by QTC’s credit group performing its assessment of QTC’s large counterparties and special purpose issuers. The country of domicile, the counterparty’s credit metrics, the size of its fund raising programs and the asset composition and quality of the underlying security are also significant considerations when determining limits.
QTC has a significant concentration of credit risk within the banking sector and in particular, the domestic banking sector. This is unavoidable given the size of QTC’s investment portfolio and the requirement to invest with counterparties rated A- or better (81% of exposures are AA or better) and to invest in highly liquid securities.
With the global financial crisis having a significant financial impact on global banks/financial institutions and with continued volatility being experienced in financial markets, QTC continues to closely monitor its counterparty exposures. QTC also utilises collateral arrangements to limit its derivatives’ credit exposure.
Counterparty exposure by rating for all investments and derivative contracts is listed below:
| | | | | | | | | | | | |
| | | | | | CREDIT EXPOSURE | |
| | | RATING | | | 2010
% | | | 2009
% | |
| | | |
Long term rating | | | AAA | | | | 40 | | | | 32 | |
| | | AA+ | | | | 1 | | | | 1 | |
| | | AA | | | | 40 | | | | 44 | |
| | | AA- | | | | 7 | | | | 6 | |
| | | A+ | | | | 7 | | | | 8 | |
| | | A | | | | 4 | | | | 5 | |
| | | A- | | | | — | | | | 1 | |
Short term rating | | | A-1+ | | | | 1 | | | | 3 | |
There is some minor exposure to downgraded counterparties rated below A- totalling $85 million, including an investment in Lehman Bros which is currently valued at $5.0 million based on the expected recovery. In addition, there are also two approved exceptions being BBB+ counterparties, with one having a limit and total exposure of $50 million (maximum term of 90 days) and the other having an exposure of $30 million (limit is withdrawn) and remaining term of 1.4 years.
QUEENSLAND TREASURY CORPORATION ANNUAL REPORT 2009–2010 63
Notes to and Forming Part of the Financial Statements
FOR THE YEAR ENDED 30 JUNE 2010
21. Financial risk managementCONTINUED
(C) CREDIT RISK CONTINUED
While QTC’s capital is not subject to regulatory oversight, QTC utilises a capital adequacy approach based on Basel II: International Convergence of Capital Measurements and Capital Standards to calculate and advise the Board of the amount of capital required to cover its risks including credit risk.
(ii) Onlending counterparties
Counterparties for onlendings, with the exception of small exposures to Suncorp-Metway Limited, cooperative housing societies and primary producer cooperatives, are Queensland Government sector entities and in some cases an explicit Government guarantee exists. There is a specific Queensland Government guarantee in place for the Suncorp-Metway Limited loans. As a consequence, these exposures are not included in QTC’s total credit exposure.
LONG TERM ASSETS
The Long Term Assets are invested in unlisted unit trusts held with QIC. The trusts hold investments in a variety of financial instruments including derivatives, which expose these assets to credit risk, liquidity risk and market risk due to changes in interest rates, foreign exchange rates, property and equity prices. However, as these investments are long term in nature, market fluctuations are expected to even out over the term of the investment.
The Long Term Asset Advisory Board (LTAAB) determines the investment objectives, risk profiles and strategy for the Long Term Assets. It is responsible for formulating a strategic asset allocation to achieve the objectives of the investments in line with the required risk profile. Risk management policies are established to identify and analyse the risks and to set appropriate risk limits and controls, as well as to monitor risks and adherence against these limits.
QSuper Limited and QIC provide assistance to the LTAAB in discharging its responsibilities.
QIC’s role includes recommending to the LTAAB, investment product objectives, risk profiles and strategic asset allocations to achieve objectives within the targets and risk controls set. As the lead investment manager, QIC is responsible for implementing the investment strategy.
QSuper Limited provides a secretariat service which includes regular reports and advice on the performance of the investments. It provides independent oversight of the investment advice and services provided by QIC and regularly monitors and arranges periodic strategic reviews of QIC’s activities and performance.
The LTAAB is responsible for setting the interest rate applicable on the fixed rate note liability of QTC, based on the long term average rate of return assumed in the triennial actuarial assessment of the State’s defined benefit liability. The rate is currently set at 7.5% per annum.
(A) MARKET RISK
The Long Term Assets expose QTC to market risk, including interest rate risk, foreign currency risk, property and equity price risk, resulting from its investments in unit trusts.
Market risk is mitigated through a diversified portfolio of investments in unit trusts held with QIC in accordance with the investment strategy approved by the LTAAB (refer note 10). The investment strategy targets a widely diversified portfolio across a broad range of asset classes.
QIC adheres to prudential controls contained in the Investment Management Agreement. Under this agreement, derivative products are not permitted to be used for speculative purposes but are used as hedging instruments against existing positions or for efficient trading and asset allocation purposes to assist in achieving the overall investment returns and volatility objectives of the portfolio.
QUEENSLAND TREASURY CORPORATION ANNUAL REPORT 2009–2010 64
21. Financial risk managementCONTINUED
(A) MARKET RISK CONTINUED
(i) Sensitivity analysis
The market risk of the Long Term Assets comprises the risk that the unit price of the funds in which the assets are invested will change during the next reporting period (effectively price risk). A sensitivity analysis for the key types of market risk that apply to the investments of the funds has been undertaken by QIC. QIC has provided a range of reasonably possible changes in key risk variables including the ASX 200, the MSCI World ex Australia Index, the RBA official cash rate and a large number of currencies.
Based on this assessment, a reasonably possible change in profit and equity on investments held at 30 June is as follows:
| | | | | | | | | | | | | | | | | | | | | | | | | | | | | | | | |
| | | 2010
PRICE RISK | | | 2010
PROFIT/EQUITY | | | 2009
PRICE RISK | | | 2009
PROFIT/EQUITY | |
| | | LOW
% | | | HIGH
% | | | DECREASE
$000 | | | INCREASE
$000 | | | LOW
% | | | HIGH
% | | | DECREASE
$000 | | | INCREASE
$000 | |
| | | | | | | | |
Investments in unit trusts - QIC: | | | | | | | | | | | | | | | | | | | | | | | | | | | | | | | | |
QIC Investment Trust No.2 | | | -14 | % | | | 13 | % | | | (2 068 796 | ) | | | 1 921 025 | | | | -29 | % | | | 29 | % | | | (3 870 483 | ) | | | 3 870 483 | |
QIC Property Fund | | | -4 | % | | | 4 | % | | | (62 360 | ) | | | 62 360 | | | | -8 | % | | | 0 | % | | | (131 486 | ) | | | — | |
QIC Strategic Fund No.2 | | | -11 | % | | | 11 | % | | | (99 738 | ) | | | 99 738 | | | | -11 | % | | | 26 | % | | | (67 901 | ) | | | 160 494 | |
QIC Strategic Fund No.3 | | | -12 | % | | | 13 | % | | | (13 067 | ) | | | 14 155 | | | | — | | | | — | | | | — | | | | — | |
QIC Diversified Infrastructure Fund No.2 | | | -15 | % | | | 15 | % | | | (157 948 | ) | | | 157 948 | | | | -14 | % | | | 29 | % | | | (116 329 | ) | | | 240 968 | |
QIC Private Equity Fund No.2 | | | -18 | % | | | 20 | % | | | (82 037 | ) | | | 91 153 | | | | -14 | % | | | 30 | % | | | (45 788 | ) | | | 98 118 | |
QIC Private Equity Fund No.3 | | | -19 | % | | | 21 | % | | | (7 135 | ) | | | 7 886 | | | | — | | | | — | | | | — | | | | — | |
QIC International Property Fund | | | -12 | % | | | 15 | % | | | (32 386 | ) | | | 40 483 | | | | -13 | % | | | 16 | % | | | (24 900 | ) | | | 30 647 | |
QIC International Property Development Trust | | | -8 | % | | | 8 | % | | | (42 | ) | | | 42 | | | | -6 | % | | | 7 | % | | | (32 | ) | | | 36 | |
QIC Treasury Infrastructure Trust | | | -10 | % | | | 10 | % | | | (9 | ) | | | 9 | | | | -9 | % | | | 22 | % | | | (42 010 | ) | | | 102 692 | |
Queensland BioCapital Fund No.1 | | | -3 | % | | | 4 | % | | | (502 | ) | | | 670 | | | | -1 | % | | | 1 | % | | | (227 | ) | | | 227 | |
Queensland BioCapital Fund No.2 | | | -4 | % | | | 4 | % | | | (650 | ) | | | 650 | | | | -1 | % | | | 1 | % | | | (231 | ) | | | 231 | |
(B) LIQUIDITY RISK
No external cashflows are generated from the Long Term Assets as deposits and withdrawals from the fixed rate note result in a corresponding change in the investment held and do not expose QTC to liquidity risk arising from these daily movements. Interest on the fixed rate note and distributions and fees on the Long Term Assets are capitalised.
The fixed rate note provided to the State Government in exchange for the Long Term Assets has a term of 50 years. Due to the long term nature of this arrangement, no liquidity risk has been identified.
22. Fair value hierarchy
Financial instruments measured at fair value have been classified in accordance with the hierarchy described in AASB 7 Financial Instruments: Disclosures. The three level fair value hierarchy reflects the significance of the inputs used to determine the valuation of these instruments. All financial instruments are valued by reference to either quoted market prices or observable inputs with no significant adjustments applied to instruments held and therefore no financial instruments are classified under Level 3.
Level 1 fair value measurements are those derived directly from quoted market prices (unadjusted) in active markets for identical assets and liabilities. Financial instruments under this category consist primarily of short-term and tradeable bank deposits and Commonwealth and semi-government bonds where an active market has been established.
Level 2 fair value measurements include instruments valued using quoted market prices in active markets for similar instruments or quoted prices for identical or similar instruments in markets that are considered less than active or other valuation techniques where all significant inputs are directly or indirectly observable from market data. Financial instruments under this category include non-actively traded corporate and semi-government bonds (including the QTC 2033 bond and the Capital Indexed bond), certain money market securities (commercial paper and promissory notes) and all derivatives. QTC’s onlendings and customer deposits are included under this category.
QUEENSLAND TREASURY CORPORATION ANNUAL REPORT 2009–2010 65
Notes to and Forming Part of the Financial Statements
FOR THE YEAR ENDED 30 JUNE 2010
22. Fair value hierarchyCONTINUED
Level 3 fair value measurements are those derived from unobservable inputs or observable inputs to which significant adjustments have been applied.
The principal inputs to determine the valuation of financial instruments are discussed below:
| • | | Interest rates—these are principally benchmark interest rates such as interbank rates and quoted interest rates in the swap, bond and futures markets. QTC applies mid-market rates for establishing fair values of financial instruments. |
| • | | Counterparty credit spreads—adjustments are made to market prices for changes in the credit worthiness of the counterparty. Interest rate and foreign currency swaps—there are observable markets for both spot and forward contracts. |
| • | | Cross currency swaps—these instruments are typically held to maturity and valued using the original trading margin to the swap curve. |
| • | | Net Asset Value (NAV)—Units in trust funds are valued by QIC using fair value methodologies. The NAV is based on the hard close unit price at balance date. |
There were no transfers between Level 1 and Level 2 or out of Level 3 during the year ended 30 June 2010.
| | | | | | | | | | | | | | | | |
AS AT 30 JUNE 2010 | | QUOTED
MARKET PRICES
(LEVEL 1)
$000 | | | OBSERVABLE
MARKET INPUTS
(LEVEL 2)
$000 | | | UNOBSERVABLE
MARKET INPUTS
(LEVEL 3)
$000 | | | TOTAL
$000 | |
| | | | |
CAPITAL MARKETS OPERATIONS | | | | | | | | | | | | | | | | |
Financial assets | | | | | | | | | | | | | | | | |
Onlendings | | | — | | | | 55 113 222 | | | | — | | | | 55 113 222 | |
Money market deposits | | | 946 297 | | | | — | | | | — | | | | 946 297 | |
Discount securities | | | 6 179 090 | | | | 210 686 | | | | — | | | | 6 389 776 | |
Commonwealth and state securities | | | 4 791 447 | | | | — | | | | — | | | | 4 791 447 | |
Floating rate notes | | | 4 107 838 | | | | 2 172 | | | | — | | | | 4 110 010 | |
Other investments | | | 66 002 | | | | 2 390 474 | | | | — | | | | 2 456 476 | |
| | | | | | | | | | | | | | | | |
| | | 16 090 674 | | | | 57 716 554 | | | | — | | | | 73 807 228 | |
| | | | | | | | | | | | | | | | |
Derivative financial assets | | | | | | | | | | | | | | | | |
Interest rate swaps | | | — | | | | 125 436 | | | | — | | | | 125 436 | |
Cross currency swaps | | | — | | | | 117 659 | | | | — | | | | 117 659 | |
Forward rate agreements | | | — | | | | 73 448 | | | | — | | | | 73 448 | |
Foreign exchange contracts | | | — | | | | 51 164 | | | | — | | | | 51 164 | |
| | | | | | | | | | | | | | | | |
| | | — | | | | 367 707 | | | | — | | | | 367 707 | |
| | | | | | | | | | | | | | | | |
Total financial assets | | | 16 090 674 | | | | 58 084 261 | | | | — | | | | 74 174 935 | |
| | | | | | | | | | | | | | | | |
Financial liabilities | | | | | | | | | | | | | | | | |
Bank overdraft | | | 1 167 | | | | — | | | | — | | | | 1 167 | |
Treasury notes | | | — | | | | 1 089 162 | | | | — | | | | 1 089 162 | |
Commercial paper | | | — | | | | 2 863 057 | | | | — | | | | 2 863 057 | |
Domestic bonds | | | 58 190 039 | | | | 1 938 682 | | | | — | | | | 60 128 721 | |
Offshore bonds | | | 3 846 619 | | | | — | | | | — | | | | 3 846 619 | |
Credit foncier loans | | | — | | | | 774 | | | | — | | | | 774 | |
Medium-term notes | | | — | | | | 957 073 | | | | — | | | | 957 073 | |
Customer deposits | | | — | | | | 4 278 661 | | | | — | | | | 4 278 661 | |
Collateral | | | 30 872 | | | | — | | | | — | | | | 30 872 | |
Repurchase agreements | | | — | | | | 351 427 | | | | — | | | | 351 427 | |
| | | | | | | | | | | | | | | | |
| | | 62 068 697 | | | | 11 478 836 | | | | — | | | | 73 547 533 | |
| | | | | | | | | | | | | | | | |
QUEENSLAND TREASURY CORPORATION ANNUAL REPORT 2009–2010 66
22. Fair value hierarchyCONTINUED
| | | | | | | | | | | | | | | | |
AS AT 30 JUNE 2010 | | QUOTED
MARKET PRICES
(LEVEL 1)
$000 | | | OBSERVABLE
MARKET INPUTS
(LEVEL 2)
$000 | | | UNOBSERVABLE
MARKET INPUTS
(LEVEL 3)
$000 | | | TOTAL
$000 | |
| | | | |
CAPITAL MARKETS OPERATIONS - CONTINUED | | | | | | | | | | | | | | | | |
Derivative financial liabilities | | | | | | | | | | | | | | | | |
Interest rate swaps | | | — | | | | 24 288 | | | | — | | | | 24 288 | |
Cross currency swaps | | | — | | | | 13 414 | | | | — | | | | 13 414 | |
Forward rate agreements | | | — | | | | 1 915 | | | | — | | | | 1 915 | |
Credit default swaps | | | — | | | | 6 343 | | | | — | | | | 6 343 | |
Foreign exchange contracts | | | — | | | | 35 386 | | | | — | | | | 35 386 | |
| | | | | | | | | | | | | | | | |
| | | — | | | | 81 346 | | | | — | | | | 81 346 | |
| | | | | | | | | | | | | | | | |
Total financial liabilities | | | 62 068 697 | | | | 11 560 182 | | | | — | | | | 73 628 879 | |
| | | | | | | | | | | | | | | | |
LONG TERM ASSETS | | | | | | | | | | | | | | | | |
Financial assets | | | | | | | | | | | | | | | | |
Investments in unit trusts - QIC | | | — | | | | 19 201 500 | | | | — | | | | 19 201 500 | |
| | | | | | | | | | | | | | | | |
| | | — | | | | 19 201 500 | | | | — | | | | 19 201 500 | |
| | | | | | | | | | | | | | | | |
23. Concentrations of borrowings and deposits
There are no material concentrations of borrowings as these funds are raised from diversified sources through various facilities disclosed under funding facilities in note 27. Managed fund depositors are principally Queensland Government sector entities. These deposits are invested in either QTC’s Cash Fund or Working Capital Facility (11AM Fund) which have a large core of liquid investments. QTC maintains regular contact with these depositors and therefore has a good knowledge of their forecast liquidity requirements.
Deposits for stock lending and repurchase agreements are invested in the Working Capital Facility (11AM Fund) which can be liquidated daily at no cost.
24. Contingent liabilities
The following contingent liabilities existed at balance date:
| • | | With regard to certain cross border lease transactions, QTC has assumed responsibility for a significant portion of the transaction risk. If certain events occur, QTC could be liable to make additional payments under the transactions. However external advice and history to date indicate the likelihood of these events occurring is remote. In addition, QTC has provided certain guarantees and indemnities to various participants in the cross border lease transactions. Expert external advisors consider, that unless exceptional and extreme circumstances arise, QTC will not be required to make a significant payment under these guarantees and indemnities. |
| • | | To facilitate the merger of the former State owned financial institutions, Suncorp and QIDC with Metway Bank Ltd, QTC provided guarantees relating to certain obligations of the Queensland Government and Suncorp General Insurance Ltd. These guarantees are supported by counter indemnities from the Treasurer on behalf of the State of Queensland. |
| • | | QTC has provided guarantees relating to the trading activities of Ergon Energy, a Queensland Government Owned Corporation, to the value of $120 million (2009 $320 million) which are supported by a counter indemnity. |
| • | | QTC has provided guarantees to the value of $192 million (2009 $216 million) to support the commercial activities of various Queensland public sector entities. In each case, a counter indemnity has been obtained by QTC from the appropriate public sector entity. |
| • | | QTC lends stock on the basis that there is a simultaneous commitment by the other party to return the stock on an agreed date. These loans are made to support the liquidity of QTC bonds in the financial markets and form part of QTC’s total exposure to these financial institutions. The likelihood of a loss being incurred through default by a counterparty is remote due to the high credit quality of the counterparty and the short term nature of stock lending. At 30 June 2010, no Queensland Treasury Corporation inscribed stock was lent to other financial institutions (2009 Nil). |
QUEENSLAND TREASURY CORPORATION ANNUAL REPORT 2009–2010 67
Notes to and Forming Part of the Financial Statements
FOR THE YEAR ENDED 30 JUNE 2010
25. Leases
LEASE COMMITMENTS - QTC AS LESSEE
QTC has entered into the following commercial leases:
| • | | various motor vehicle lease agreements expiring within one to three years |
| • | | 61 Mary Street, Brisbane, for an initial term of ten years from 1 January 2003 to 31 December 2012, with an option to renew the lease after that date. Lease payments are increased to reflect market rentals, and |
| • | | 120 Edward Street, Brisbane, for an initial term of four years from November 2009 to November 2012, with an option to renew the lease after that date. Lease payments are increased to reflect CPI adjustments. |
The future minimum rentals payable under non-cancellable operating leases as at 30 June are as follows:
| | | | | | | | |
| | | 2010
$000 | | | 2009
$000 | |
| | |
Leases payable | | | | | | | | |
Not longer than 1 year | | | 2 296 | | | | 2 401 | |
Longer than 1 year but not longer than 5 years | | | 3 366 | | | | 5 923 | |
| | | 5 662 | | | | 8 324 | |
LEASING ARRANGEMENTS - QTC AS LESSOR
QTC has entered into operating leases as lessor under the whole of government lease facility which include buses, ferries and information technology equipment. These non-cancellable leases have remaining terms of between 1 and 10 years.
Future minimum rentals receivable under non-cancellable operating leases as at 30 June are as follows:
| | | | | | | | |
Leases receivable | | | | | | | | |
Not longer than 1 year | | | 34 760 | | | | 20 222 | |
Longer than 1 year but not longer than 5 years | | | 136 438 | | | | 79 959 | |
Longer than 5 years | | | 59 534 | | | | 41 019 | |
| | | 230 732 | | | | 141 200 | |
QTC entered into a financial arrangement with a customer comprising a headlease and sublease. Under the headlease, QTC made an upfront payment for the rights and limited obligations to a parcel of land for a term of 25 years ending 25 June 2034. Under the sublease, QTC acts as lessor and receives payments over the term.
Finance charges include interest and fees associated with the leases.
The lease is non-cancellable. Details of the minimum rental receivable under the finance lease are as follows:
| | | | | | | | |
Lease receivable | | | | | | | | |
Not longer than 1 year | | | 2 924 | | | | 2 825 | |
Longer than 1 year but not longer than 5 years | | | 16 227 | | | | 15 678 | |
Longer than 5 years | | | 88 051 | | | | 91 523 | |
| | | | | | | | |
| | | 107 202 | | | | 110 026 | |
Less amounts representing finance charges | | | (62 329 | ) | | | (65 626 | ) |
| | | | | | | | |
| | | 44 873 | | | | 44 400 | |
| | | | | | | | |
QUEENSLAND TREASURY CORPORATION ANNUAL REPORT 2009–2010 68
26. Forward starting fixed-rate loan commitments
QTC has entered into fixed-rate loan agreements with certain customers to lock in interest rates on all or part of future borrowing requirements.
QTC’s future borrowing commitments and the period in which funds are to be onlent are as follows:
| | | | | | | | |
| | | 2010
$000 | | | 2009
$000 | |
Not longer than 1 year | | | 1 713 735 | | | | 293 765 | |
Longer than 1 year but not longer than 5 years | | | 2 947 027 | | | | 230 500 | |
| | | | | | | | |
| | | 4 660 762 | | | | 524 265 | |
| | | | | | | | |
27. Funding facilities
| | | | | | | | | | | | | | | | |
FACILITY | | CURRENCY | | | LIMIT
$M | | | FACE VALUE
ON ISSUE
2010
$M | | | FACE VALUE
ON ISSUE 2009
$M | |
| | | | |
Onshore facilities | | | | | | | | | | | | | | | | |
Domestic Benchmark Bonds | | | AUD | | | | Unlimited | | | AUD | 56 983 | | | AUD | 48 585 | |
Capital Indexed Bond | | | AUD | | | | Unlimited | | | AUD | 752 | | | AUD | 734 | |
Treasury Note | | | AUD | | | | Unlimited | | | AUD | 1 103 | | | AUD | 2 249 | |
Other | | | AUD | | | | N/A | | | AUD | 588 | | | AUD | 603 | |
| | | | |
Offshore facilities | | | | | | | | | | | | | | | | |
Global Benchmark Bonds | | | AUD | | | AUD | 20 000 | | | AUD | 3 688 | | | AUD | 7 076 | |
Euro Commercial Paper | | | Multicurrency | | | USD | 10 000 | | | USD | 1 686 | | | USD | 1 066 | |
US Commercial Paper | | | Multicurrency | | | USD | 5 000 | | | USD | 770 | | | USD | 936 | |
Euro Medium-Term Note | | | Multicurrency | | | USD | 10 000 | | | USD | 702 | | | USD | 809 | |
US Medium-Term Note | | | Multicurrency | | | USD | 10 000 | | | | — | | | USD | 350 | |
28. Related party transactions
A related party is one that controls, or is controlled by, or under common control with the entity. QTC has assessed that all State of Queensland controlled entities meet the definition of a related party under AASB 124 Related Party Disclosures.
(A) ULTIMATE CONTROLLING ENTITY
The immediate controlling entity and ultimate controlling entity during the year was the Under Treasurer of Queensland as the Corporation Sole of QTC.
(B) KEY MANAGEMENT PERSONNEL
Disclosures relating to key management personnel are set out in note 29.
(C) INVESTMENTS IN ASSOCIATES AND OTHER COMPANIES
Details of investments in associates and other companies are set out in notes 32 and 33.
(D) TRANSACTIONS WITH RELATED PARTIES
Transactions undertaken with related parties during the year include the provision of lending, investment, advisory, banking and company secretarial services. These transactions were in the normal course of business and on commercial terms and conditions. They exclude certain advisory and other services provided to Queensland Treasury, its associated companies and other related parties at no charge.
QTC may from time-to-time indirectly hold a small amount of investments in QTC Bonds via its investments in unit trusts managed by QIC. QTC does not have direct legal ownership of these assets and therefore no adjustment has been made in the financial statements.
QUEENSLAND TREASURY CORPORATION ANNUAL REPORT 2009–2010 69
Notes to and Forming Part of the Financial Statements
FOR THE YEAR ENDED 30 JUNE 2010
No provisions for doubtful debts have been raised in relation to any outstanding balances, and no expenses recognised in respect of bad or doubtful debts due from related parties.
Contributions to superannuation funds on behalf of employees are disclosed in note 7.
29. Key management personnel
Key management personnel are defined as those persons having authority and responsibility for planning, directing and controlling the activities of QTC, being members of the Board and the Executive Management Team.
(A) COMPENSATION
(i) DISCLOSURE BY CATEGORY
| | | | | | | | |
| | | 2010
$ | | | 2009
$ | |
| | |
CAPITAL MARKETS OPERATIONS | | | | | | | | |
Directors | | | | | | | | |
Short-term employment benefits (1) | | | 370 479 | | | | 354 955 | |
Post-employment benefits (2) | | | 14 280 | | | | 13 023 | |
| | | | | | | | |
Total | | | 384 759 | | | | 367 978 | |
| | | | | | | | |
Executive officers | | | | | | | | |
Short-term employment benefits (1) | | | 2 937 530 | | | | 2 201 239 | |
Post-employment benefits (2) | | | 183 680 | | | | 157 336 | |
| | | | | | | | |
Total | | | 3 121 210 | | | | 2 358 575 | |
| | | | | | | | |
| (1) | Directors’ short-term benefits include board members fees, and in relation to the Chairman, also includes reimbursement of telephone expenses and the provision of a car park. Executive officers’ short-term benefits include wages, annual leave, long service leave, bonuses and non-monetary benefits such as car parks and motor vehicle benefits. |
| (2) | Post-employment benefits include superannuation contributions made by the Corporation. |
(ii) DIRECTORS
Details of the nature and amount of each major element of the remuneration of the Directors are as follows:
| | | | | | | | | | | | | | | | | | | | | | | | |
| | | SHORT-TERM EMPLOYMENT BENEFITS | | | POST-EMPLOYMENT BENEFITS | | | TOTAL | |
| | | 2010
$ | | | 2009
$ | | | 2010
$ | | | 2009
$ | | | 2010
$ | | | 2009
$ | |
| | | | | | |
Sir Leo Hielscher – Chairman (1) | | | 118 018 | | | | 117 726 | | | | — | | | | — | | | | 118 018 | | | | 117 726 | |
Alex Beavers – Deputy Chairman (2) | | | 40 504 | | | | — | | | | — | | | | — | | | | 40 504 | | | | — | |
Tim Spencer (3) | | | 7 834 | | | | 47 974 | | | | — | | | | — | | | | 7 834 | | | | 47 974 | |
Gillian Brown | | | 37 232 | | | | 36 325 | | | | 3 351 | | | | 3 269 | | | | 40 583 | | | | 39 594 | |
John Dawson (4) | | | 40 211 | | | | 29 138 | | | | 3 620 | | | | 2 622 | | | | 43 830 | | | | 31 760 | |
Marian Micalizzi | | | 40 609 | | | | 39 620 | | | | 3 655 | | | | 3 566 | | | | 44 264 | | | | 43 186 | |
Bill Shields | | | 44 741 | | | | 44 552 | | | | — | | | | — | | | | 44 741 | | | | 44 552 | |
Shauna Tomkins | | | 40 609 | | | | 39 620 | | | | 3 655 | | | | 3 566 | | | | 44 264 | | | | 43 186 | |
| (1) | Resigned 30 June 2010. |
| (2) | Appointed 1 September 2009 as Deputy Chairman. Remuneration is paid to Queensland Treasury and remitted to the Consolidated Fund. |
| (3) | Resigned 31 August 2009. Remuneration is paid to Queensland Treasury and remitted to the Consolidated Fund. |
| (4) | Appointed 1 September 2008. |
No remuneration is payable to the Directors of the Long Term Asset Advisory Board.
QUEENSLAND TREASURY CORPORATION ANNUAL REPORT 2009–2010 70
29. Key management personnelCONTINUED
(iii) EXECUTIVE OFFICERS
Executive Officers are those officers who are members of the Executive Management Team involved in the strategic direction, general management and control of the business at an organisational level.
Short-term benefits include wages, annual leave, long service leave and other non-monetary benefits, but exclude any at-risk performance payments (bonuses) for which they may be eligible. Post-employment benefits include superannuation payments made on behalf of the employee.
Details of the nature and amount of each major element of the remuneration of the Executive Officers are as follows:
| | | | | | | | | | | | | | | | | | | | | | | | |
| | | SHORT-TERM EMPLOYMENT BENEFITS | | | POST-EMPLOYMENT BENEFITS | | | TOTAL | |
| | | 2010
$ | | | 2009
$ | | | 2010
$ | | | 2009
$ | | | 2010
$ | | | 2009
$ | |
Chief Executive | | | 563 484 | | | | 510 517 | | | | 33 810 | | | | 49 784 | | | | 597 294 | | | | 560 301 | |
General Manager | | | 372 411 | | | | 345 333 | | | | 32 700 | | | | 30 322 | | | | 405 111 | | | | 375 654 | |
General Manager | | | 284 573 | | | | 264 219 | | | | 34 584 | | | | 32 022 | | | | 319 157 | | | | 296 242 | |
General Manager | | | 238 706 | | | | 217 758 | | | | 28 307 | | | | 26 210 | | | | 267 013 | | | | 243 969 | |
General Manager | | | — | | | | 216 578 | | | | — | | | | 18 998 | | | | — | | | | 235 574 | |
General Manager* | | | 145 986 | | | | — | | | | 11 890 | | | | — | | | | 157 876 | | | | — | |
General Manager* | | | 114 827 | | | | — | | | | 9 668 | | | | — | | | | 124 495 | | | | — | |
General Manager* | | | 114 823 | | | | — | | | | 9 668 | | | | — | | | | 124 491 | | | | — | |
General Manager* | | | 111 288 | | | | — | | | | 9 772 | | | | — | | | | 121 060 | | | | — | |
General Manager* | | | 77 763 | | | | — | | | | 7 368 | | | | — | | | | 85 131 | | | | — | |
General Manager* | | | 63 469 | | | | — | | | | 5 913 | | | | — | | | | 69 382 | | | | — | |
| * | Remuneration paid relates only to the period from appointment as General Manager. |
(B) OTHER TRANSACTIONS
There were no loans to/from key management personnel during the financial year.
30. Remuneration of officers
AGGREGATE AT-RISK PERFORMANCE INCENTIVE REMUNERATION
| | | | | | | | |
| | | YEAR OF ASSESSMENT | |
| | | 2010
$ | | | 2009
$ | |
Aggregate at-risk performance incentive paid or payable | | | 3 555 780 | | | | 3 297 767 | |
Aggregate remuneration of employees to whom a performance incentive is payable | | | 20 942 789 | | | | 19 794 684 | |
Number of employees to whom a performance incentive is payable | | | 160 | | | | 179 | |
31. Auditor’s remuneration
The external auditor (Queensland Audit Office) does not provide any consulting services to QTC.
Details of amounts paid or payable to the auditor of QTC (GST exclusive) are shown below.
| | | | | | | | |
| | | 2010
$ | | | 2009
$ | |
AUDIT SERVICES | | | | | | | | |
Audit of QTC | | | 360 000 | | | | 374 840 | |
QUEENSLAND TREASURY CORPORATION ANNUAL REPORT 2009–2010 71
Notes to and Forming Part of the Financial Statements
FOR THE YEAR ENDED 30 JUNE 2010
32. Investment in joint venture entity
| | | | | | | | | | | | | | | | | | |
| ENTITY | | PRINCIPAL ACTIVITIES | | ORDINARY SHARE
OWNERSHIP INTEREST | | | INVESTMENT
CARRYING AMOUNT | |
| | | | | 2010 | | | 2009 | | | 2010 | | | 2009 | |
Local Government Infrastructure Services Pty Ltd | | Provides assistance to Queensland local governments in relation to infrastructure procurement | | | 50 | % | | | 50 | % | | | 50 | % | | | 50 | % |
RESULTS OF JOINT VENTURE ENTITY
Summarised financial information of jointly controlled entity:
| | | | | | | | |
| | | 2010
$000 | | | 2009
$000 | |
Income statement | | | | | | | | |
Revenues | | | 44 318 | | | | 30 270 | |
Expenses | | | 43 899 | | | | 30 030 | |
Profit before income tax expense | | | 419 | | | | 240 | |
Income tax expense | | | — | | | | — | |
Net profit | | | 419 | | | | 240 | |
Balance sheet | | | | | | | | |
Current assets | | | 14 793 | | | | 26 683 | |
Total assets | | | 14 793 | | | | 26 683 | |
Current liabilities | | | 13 385 | | | | 25 380 | |
Non-current liabilities | | | 170 | | | | 380 | |
Total liabilities | | | 13 555 | | | | 25 760 | |
Net assets | | | 1 238 | | | | 923 | |
|
| QTC’s share of the joint venture entity’s results and retained profits, including movements in the carrying amount of the investment consists of: | |
| | |
Share of post-acquisition retained profits | | | | | | | | |
Share of retained profits at 1 July | | | 392 | | | | 334 | |
Share of net result | | | 210 | | | | 120 | |
Dividend received | | | (30 | ) | | | (62 | ) |
Share of retained profits at 30 June | | | 572 | | | | 392 | |
Movements in carrying amount of investment | | | | | | | | |
Carrying amount at 1 July | | | 492 | | | | 434 | |
Dividends received | | | (30 | ) | | | (62 | ) |
Share of net result | | | 210 | | | | 120 | |
Carrying amount at 30 June | | | 672 | | | | 492 | |
QUEENSLAND TREASURY CORPORATION ANNUAL REPORT 2009–2010 72
33. Investments in companies
Investments in the following companies are held at cost:
| | | | | | | | | | | | | | | | | | |
| NAME | | PRINCIPAL ACTIVITIES | | BENEFICIAL
INTEREST
2010
% | | | VOTING
RIGHTS
2010
% | | | BENEFICIAL
INTEREST
2009
% | | | VOTING
RIGHTS
2009
% | |
| | | | | |
Queensland Treasury Holdings Pty Ltd (QTH) (1) | | Holding company for a number of subsidiaries and investments | | | 40 | | | | 24 | | | | 40 | | | | 24 | |
Queensland Lottery Corporation Pty Ltd (2) | | Holds the lottery licence and trade marks on behalf of the State of Queensland | | | 40 | | | | 24 | | | | 40 | | | | 24 | |
DBCT Holdings Pty Ltd (2) | | Owns and leases bulk coal port facilities in North Queensland | | | 20 | | | | 12 | | | | 20 | | | | 12 | |
Queensland Airport Holdings (Mackay) Pty Ltd (2) | | Owns the land for Mackay airport which it has leased under a 99 year lease arrangement | | | 40 | | | | 24 | | | | 40 | | | | 24 | |
Queensland Airport Holdings (Cairns) Pty Ltd (2) | | Owns the land for Cairns airport which it has leased under a 99 year lease arrangement | | | 40 | | | | 24 | | | | 40 | | | | 24 | |
Network Infrastructure Company Pty Ltd (2) (3) | | Established to hold infrastructure assets | | | 40 | | | | 24 | | | | — | | | | — | |
City North Infrastructure Pty Ltd (2) | | Manages the procurement of the Airport Link and Northern Busway projects | | | 13.3 | | | | 8 | | | | 13.3 | | | | 8 | |
Sunshine Locos Pty Ltd (4) | | Dormant | | | 50 | | | | 50 | | | | 50 | | | | 50 | |
| (1) | QTH holds an interest in Queensland Motorways Limited; 2 of a total 187 523 shares (2009 2 of 177 466). |
| (2) | Beneficial interest and voting rights in the Company are held indirectly through QTC’s holdings in Queensland Treasury Holdings Pty Ltd. |
| (3) | Incorporated on 15 June 2010. |
| (4) | While a controlled entity of QTC, Sunshine Locos Pty Ltd has not been consolidated into these statements due to its immaterial and dormant status. |
34. Dividends
QTC is required to pay dividends to the Queensland Government as the Treasurer determines from time-to-time. At 30 June 2010, no dividend (2009: nil) has been provided for in the accounts of QTC.
35. Events subsequent to balance date
There are no other matters or circumstances which have arisen since the end of the financial year that have significantly affected or may significantly affect the operations of QTC, the results of those operations or the state of affairs of QTC in future years.
QUEENSLAND TREASURY CORPORATION ANNUAL REPORT 2009–2010 73
Certificate of the Queensland Treasury Corporation
The foregoing general purpose financial statements have been prepared in accordance with the Financial Accountability Act 2009 and other prescribed requirements.
The Directors draw attention to note 2 (A) to the financial statements, which includes a statement of compliance with International Financial Reporting Standards.
We certify that in our opinion:
| (i) | the prescribed requirements for establishing and keeping the accounts have been complied with in all material respects |
| (ii) | the foregoing annual financial statements have been drawn up so as to present a true and fair view of Queensland Treasury Corporation’s assets and liabilities, financial position and financial performance for the year ended 30 June 2010, and |
| (iii) | the management report includes a fair review of the information required under article 3(2)(c) of the Law of January 11, 2009 on transparency requirements for issuers of securities on the Luxembourg Stock Exchange. |
Signed in accordance with a resolution of the Directors.
| | |
 | |  |
| |
| G P BRADLEY | | S R ROCHESTER |
| Corporation Sole | | Chief Executive |
| Queensland Treasury Corporation | | |
| |
| Brisbane | | |
| 18 August 2010 | | |
QUEENSLAND TREASURY CORPORATION ANNUAL REPORT 2009–2010 74
Independent Auditor’s Report TO QUEENSLAND TREASURY CORPORATION
Report on the Financial Report
I have audited the accompanying financial report of Queensland Treasury Corporation which comprises the balance sheet as at 30 June 2010, and the statement of comprehensive income, statement of changes in equity and statement of cash flows for the year ended on that date, a summary of significant accounting policies, other explanatory notes and certificates given by the Under Treasurer – Queensland Treasury as the Corporation Sole and Chief Executive.
THE CORPORATION SOLE’S RESPONSIBILITY FOR THE FINANCIAL REPORT
The Corporation Sole is responsible for the preparation and fair presentation of the financial report in accordance with prescribed accounting requirements identified in the Financial Accountability Act 2009 and the Financial and Performance Management Standard 2009, including compliance with Australian Accounting Standards (including the Australian Accounting
Interpretations). This responsibility includes establishing and maintaining internal controls relevant to the preparation and fair presentation of the financial report that is free from material misstatement, whether due to fraud or error; selecting and applying appropriate accounting policies; and making accounting estimates that are reasonable in the circumstances. In Note 2(A), the Corporation Sole also states, in accordance with Accounting Standard AASB 101 Presentation of Financial Statements, that compliance with Australian equivalents to International Financial Reporting Standards ensures that the financial report, comprising the financial statements and notes, complies with International Financial Reporting Standards.
AUDITOR’S RESPONSIBILITY
My responsibility is to express an opinion on the financial report based on the audit. The audit was conducted in accordance with the Auditor-General of Queensland Auditing Standards, which incorporate the Australian Auditing Standards. These auditing standards require compliance with relevant ethical requirements relating to audit engagements and that the audit is planned and performed to obtain reasonable assurance whether the financial report is free from material misstatement.
An audit involves performing procedures to obtain audit evidence about the amounts and disclosures in the financial report. The procedures selected depend on the auditor’s judgement, including the assessment of risks of material misstatement in the financial report, whether due to fraud or error. In making those risk assessments, the auditor considers internal control relevant to the entity’s preparation and fair presentation of the financial report in order to design audit procedures that are appropriate in the circumstances, but not for the purpose of expressing an opinion on the effectiveness of the entity’s internal control, other than in expressing an opinion on compliance with prescribed requirements. An audit also includes evaluating the appropriateness of accounting policies and the reasonableness of accounting estimates made by the Corporation, as well as evaluating the overall presentation of the financial report including any mandatory financial reporting requirements as approved by the Treasurer for application in Queensland.
I believe that the audit evidence obtained is sufficient and appropriate to provide a basis for my audit opinion.
INDEPENDENCE
The Auditor-General Act 2009 promotes the independence of the Auditor-General and all authorised auditors. The Auditor-General is the auditor of all Queensland public sector entities and can only be removed by Parliament.
The Auditor-General may conduct an audit in any way considered appropriate and is not subject to direction by any person about the way in which audit powers are to be exercised. The Auditor-General has for the purposes of conducting an audit, access to all documents and property and can report to Parliament matters which in the Auditor-General’s opinion are significant.
AUDITOR’S OPINION
In accordance with s.40 of the Auditor-General Act 2009 –
| (a) | I have received all the information and explanations which I have required; and |
QUEENSLAND TREASURY CORPORATION ANNUAL REPORT 2009–2010 75
Independent Auditor’s Report TO QUEENSLAND TREASURY CORPORATION (CONTINUED)
| (i) | the prescribed requirements in respect of the establishment and keeping of accounts have been complied with in all material respects; and |
| (ii) | the financial report has been drawn up so as to present a true and fair view, in accordance with the prescribed accounting standards of the transactions of the Queensland Treasury Corporation for the financial year 1 July 2009 to 30 June 2010 and of the financial position as at the end of that year; and |
| (iii) | the financial report also complies with International Financial Reporting Standards as disclosed in Note 2(A). |
| | |
 | |  |
| |
| G G POOLE FCPA | | |
| Auditor-General of Queensland | | Queensland Audit Office |
| | Brisbane |
QUEENSLAND TREASURY CORPORATION ANNUAL REPORT 2009–2010 76
Management Report FOR THE YEAR ENDED 30 JUNE 2010
Review of Operations
QTC made an operating profit after tax for the year ended 30 June 2010 of A$796.272 million consisting of the following operating segment results:
CAPITAL MARKET OPERATIONS
During the period from 1 July 2009 to 30 June 2010, QTC continued in its ordinary course of business as the State of Queensland’s central financing authority and corporate treasury services provider. The operating profit after tax for the year ended 30 June 2010 for the Capital Markets Operations segment was A$209.436 million.
LONG TERM ASSETS
QTC holds a portfolio of assets which were transferred to QTC by the State Government under an administrative arrangement. These assets are the investments of QTC’s Long Term Assets segment and were accumulated to fund superannuation and other long-term obligations of the State such as insurance and long service leave. In return, QTC issued to the State a fixed rate note which has resulted in the State receiving a fixed rate of return on the note, while QTC bears the impact of fluctuations in the value and returns on the asset portfolio.
QTC made an operating profit after tax of A$586.836 million for the Long Term Assets segment. The result partially reversed the significant losses recorded in the previous year due to the poor performance of the equity, property and credit markets.
The accumulated losses incurred by the Long Term Assets segment to date have no impact on QTC’s capacity to meet its obligations as there is no cash flow effect for QTC. In addition, under the Queensland Treasury Corporation Act 1988, any losses of the Corporation shall be the responsibility of the Consolidated Fund of the Queensland Government.
Principal risks and uncertainties
The 2009-10 financial year saw improvements in market liquidity and moderate global growth which were boosted by high levels of monetary and fiscal stimulus. In Australia, the economic downturn was much less severe than expected. Looking ahead, we remain cautious about the sustainability of economic conditions as global economies focus on unwinding stimulatory policies and reducing their deficits.
| | |
 | |  |
| |
| G P BRADLEY | | S R ROCHESTER |
| Corporation Sole | | Chief Executive |
| Queensland Treasury Corporation | | |
| |
| Brisbane | | |
| 18 August 2010 | | |
QUEENSLAND TREASURY CORPORATION ANNUAL REPORT 2009–2010 77
APPENDIX A: Loans to Customers
| | | | | | | | | | | | | | | | |
| | | TOTAL DEBT
OUTSTANDING
(MARKET VALUE) | | | TOTAL DEBT
OUTSTANDING
(MARKET VALUE) | | | AVERAGE
EXPECTED TERM | | | AVERAGE
EXPECTED TERM | |
| | | 30 JUNE 2009 | | | 30 JUNE 2010 | | | 30 JUNE 2009 | | | 30 JUNE 2010 | |
| LOANS TO CUSTOMERS | | $000 | | | $000 | | | (YRS)* | | | (YRS)* | |
BODIES WITHIN THE PUBLIC ACCOUNTS | | | | | | | | | | | | | | | | |
CITEC | | | 18 518 | | | | 31 042 | | | | 5.81 | | | | N/A | |
Department of Community Safety – Emergency Services | | | 1 571 | | | | 539 | | | | 1.13 | | | | 0.13 | |
Department of Community Safety – Corrective Services | | | 67 | | | | 54 | | | | 0.21 | | | | 2.71 | |
Department of Employment, Economic Development and Innovation – Office of Racing | | | 3 207 | | | | 2 638 | | | | 4.91 | | | | 3.91 | |
Department of Employment, Economic Development and Innovation – Tourism Regional Development and Industry | | | 135 058 | | | | 128 469 | | | | 5.53 | | | | 4.57 | |
Department of Justice and Attorney-General | | | 57 242 | | | | 38 917 | | | | 2.96 | | | | 1.96 | |
Department of Premier and Cabinet – Arts Queensland | | | 16 897 | | | | 15 198 | | | | N/A | | | | N/A | |
Department of Public Works – Administrative Services | | | 95 817 | | | | 79 638 | | | | 4.14 | | | | 4.01 | |
Department of the Premier and Cabinet | | | 16 946 | | | | 16 313 | | | | 6.80 | | | | 5.80 | |
Department of Transport and Main Roads – Main Roads | | | 1 077 315 | | | | 1 031 320 | | | | 7.35 | | | | 6.52 | |
Department of Transport and Main Roads – Queensland Transport | | | 83 569 | | | | 76 964 | | | | 6.92 | | | | 6.28 | |
Forestry Plantations Queensland | | | 79 282 | | | | 80 112 | | | | N/A | | | | N/A | |
Monte Carlo Caravan Park Pty Ltd | | | 154 | | | | — | | | | 0.76 | | | | — | |
QBuild | | | 9 744 | | | | 25 082 | | | | 3.39 | | | | 2.42 | |
QFleet | | | 258 559 | | | | 244 456 | | | | N/A | | | | N/A | |
Queensland Fire and Rescue Authority | | | 3 934 | | | | 3 721 | | | | 5.21 | | | | 4.21 | |
Queensland Ambulance Service | | | 80 | | | | — | | | | 0.13 | | | | — | |
Queensland Audit Office | | | 325 | | | | 110 | | | | 1.46 | | | | 0.46 | |
Queensland Health | | | 122 875 | | | | 117 965 | | | | 8.96 | | | | 7.96 | |
Queensland Treasury | | | 7 693 099 | | | | 13 282 874 | | | | N/A | | | | N/A | |
Sales and Distribution Services | | | 4 113 | | | | 2 945 | | | | N/A | | | | N/A | |
Translink Transport Authority | | | — | | | | 4 846 | | | | — | | | | 9.89 | |
Urban Land Development Authority | | | 34 825 | | | | 46 204 | | | | 5.77 | | | | N/A | |
| | | | | | | | | | | | | | | | |
TOTAL | | | 9 713 198 | | | | 15 229 408 | | | | | | | | | |
| | | | | | | | | | | | | | | | |
COOPERATIVE HOUSING SOCIETIES | | | | | | | | | | | | | | | | |
Cooperative Housing Societies | | | 2 286 | | | | 1 679 | | | | N/A | | | | N/A | |
| | | | | | | | | | | | | | | | |
TOTAL | | | 2 286 | | | | 1 679 | | | | | | | | | |
| | | | | | | | | | | | | | | | |
GOVERNMENT OWNED CORPORATIONS | | | | | | | | | | | | | | | | |
CS Energy Ltd | | | 851 365 | | | | 862 497 | | | | N/A | | | | N/A | |
ENERGEX Ltd | | | 3 889 263 | | | | 4 207 280 | | | | N/A | | | | N/A | |
Ergon Energy Corporation Limited | | | 3 807 095 | | | | 4 130 523 | | | | N/A | | | | N/A | |
Eungella Water Pipeline Pty Ltd | | | 32 896 | | | | 33 047 | | | | 13.74 | | | | 13.37 | |
Gladstone Ports Corporation | | | 558 335 | | | | 611 961 | | | | N/A | | | | N/A | |
Port of Brisbane Corporation | | | 671 994 | | | | 764 571 | | | | N/A | | | | N/A | |
Port of Townsville Limited | | | 6 084 | | | | 11 367 | | | | N/A | | | | 14.14 | |
Ports Corporation of Queensland Limited | | | 492 209 | | | | 795 317 | | | | N/A | | | | N/A | |
Powerlink | | | 3 097 789 | | | | 3 433 076 | | | | N/A | | | | N/A | |
QR Limited | | | 6 565 769 | | | | 4 379 640 | | | | N/A | | | | N/A | |
Queensland Rail Limited | | | — | | | | 3 069 717 | | | | N/A | | | | N/A | |
Stanwell Corporation Limited | | | 258 822 | | | | 655 365 | | | | N/A | | | | N/A | |
QUEENSLAND TREASURY CORPORATION ANNUAL REPORT 2009–2010 78
| | | | | | | | | | | | | | | | |
| | | TOTAL DEBT
OUTSTANDING
(MARKET VALUE) | | | TOTAL DEBT
OUTSTANDING
(MARKET VALUE) | | | AVERAGE
EXPECTED TERM | | | AVERAGE
EXPECTED TERM | |
| | | 30 JUNE 2009 | | | 30 JUNE 2010 | | | 30 JUNE 2009 | | | 30 JUNE 2010 | |
| LOANS TO CUSTOMERS | | $000 | | | $000 | | | (YRS)* | | | (YRS)* | |
SunWater | | | 220 181 | | | | 225 781 | | | | N/A | | | | N/A | |
Tarong Energy Corporation Limited | | | 450 640 | | | | 458 179 | | | | N/A | | | | N/A | |
| | | | | | | | | | | | | | | | |
TOTAL | | | 20 902 441 | | | | 23 638 321 | | | | | | | | | |
| | | | | | | | | | | | | | | | |
LOCAL GOVERNMENTS | | | | | | | | | | | | | | | | |
Balonne Shire Council | | | 2 257 | | | | 1 877 | | | | 8.94 | | | | 9.53 | |
Banana Shire Council | | | 8 123 | | | | 14 824 | | | | N/A | | | | 16.18 | |
Barcaldine Regional Council | | | 1 784 | | | | 1 701 | | | | 14.44 | | | | 14.51 | |
Barcoo Shire Council | | | 99 | | | | 86 | | | | 5.82 | | | | 4.90 | |
Blackall Tambo Regional Council | | | 599 | | | | 415 | | | | 7.22 | | | | 8.65 | |
Brisbane City Council | | | 389 531 | | | | 995 138 | | | | 13.94 | | | | 13.94 | |
Bulloo Shire Council | | | 1 453 | | | | 1 325 | | | | 7.73 | | | | 6.83 | |
Bundaberg Regional Council | | | 45 796 | | | | 61 030 | | | | 10.87 | | | | N/A | |
Burdekin Shire Council | | | 7 261 | | | | 7 516 | | | | 5.24 | | | | 5.87 | |
Cairns Regional Council | | | 103 041 | | | | 106 816 | | | | 16.48 | | | | 17.13 | |
Carpentaria Shire Council | | | 1 565 | | | | 4 265 | | | | 7.03 | | | | 16.08 | |
Cassowary Coast Regional Council | | | 20 622 | | | | 20 639 | | | | N/A | | | | N/A | |
Central Highlands Regional Council | | | 15 035 | | | | 14 363 | | | | 17.26 | | | | N/A | |
Charters Towers Regional Council | | | 576 | | | | 419 | | | | 4.86 | | | | 4.70 | |
Cloncurry Shire Council | | | 3 880 | | | | 4 541 | | | | 8.54 | | | | 12.64 | |
Cook Shire Council | | | 4 560 | | | | 4 553 | | | | 14.78 | | | | 14.30 | |
Diamantina Shire Council | | | 1 956 | | | | 1 780 | | | | 8.09 | | | | 7.34 | |
Etheridge Shire Council | | | 3 575 | | | | 3 231 | | | | 7.53 | | | | 6.69 | |
Fraser Coast Regional Council | | | 114 162 | | | | 120 511 | | | | 13.03 | | | | N/A | |
Gladstone Regional Council | | | 48 969 | | | | 113 473 | | | | 15.11 | | | | 17.52 | |
Gold Coast City Council | | | 260 660 | | | | 616 570 | | | | N/A | | | | N/A | |
Goondiwindi Regional Council | | | 432 | | | | 2 011 | | | | 5.74 | | | | 16.97 | |
Gympie Regional Council | | | 13 889 | | | | 29 411 | | | | 16.53 | | | | 18.57 | |
Hope Vale Aboriginal Council | | | 855 | | | | 867 | | | | 18.08 | | | | 17.60 | |
Ipswich City Council | | | 189 035 | | | | 304 180 | | | | N/A | | | | N/A | |
Isaac Regional Council | | | — | | | | 7 725 | | | | N/A | | | | 18.74 | |
Local Government Association of Queensland | | | 1 347 | | | | 1 751 | | | | N/A | | | | N/A | |
Lockyer Valley Regional Council | | | 664 | | | | 556 | | | | 6.85 | | | | 6.47 | |
Logan City Council | | | 77 947 | | | | 112 974 | | | | N/A | | | | N/A | |
Longreach Regional Council | | | 1 122 | | | | 3 472 | | | | 15.66 | | | | 18.23 | |
Mackay Regional Council | | | 115 099 | | | | 112 347 | | | | 15.48 | | | | 15.34 | |
Maranoa Regional Council | | | 9 942 | | | | 13 396 | | | | 12.43 | | | | 11.76 | |
McKinlay Shire Council | | | 524 | | | | 485 | | | | 8.27 | | | | 7.49 | |
Moreton Bay Regional Council | | | 269 464 | | | | 347 966 | | | | N/A | | | | N/A | |
Mount Isa City Council | | | 10 173 | | | | 14 187 | | | | 15.52 | | | | 17.92 | |
Murweh Shire Council | | | 3 614 | | | | 4 308 | | | | 8.97 | | | | 7.78 | |
North Burnett Regional Council | | | 1 296 | | | | 1 181 | | | | 9.34 | | | | 8.91 | |
Paroo Shire Council | | | 2 267 | | | | 2 289 | | | | 16.48 | | | | 15.99 | |
Redland City Council | | | 42 245 | | | | 46 289 | | | | 13.32 | | | | 12.54 | |
Richmond Shire Council | | | 2 322 | | | | 2 195 | | | | 9.47 | | | | 8.63 | |
Rockhampton Regional Council | | | 126 327 | | | | 158 820 | | | | 11.56 | | | | 10.35 | |
Scenic Rim Regional Council | | | 1 831 | | | | 3 643 | | | | 9.96 | | | | 4.71 | |
South Burnett Regional Council | | | 14 195 | | | | 11 053 | | | | N/A | | | | 13.55 | |
QUEENSLAND TREASURY CORPORATION ANNUAL REPORT 2009–2010 79
APPENDIX A: Loans to Customers (CONTINUED)
| | | | | | | | | | | | | | | | |
| | | TOTAL DEBT
OUTSTANDING
(MARKET VALUE) | | | TOTAL DEBT
OUTSTANDING
(MARKET VALUE) | | | AVERAGE
EXPECTED TERM | | | AVERAGE
EXPECTED TERM | |
| | | 30 JUNE 2009 | | | 30 JUNE 2010 | | | 30 JUNE 2009 | | | 30 JUNE 2010 | |
| LOANS TO CUSTOMERS | | $000 | | | $000 | | | (YRS)* | | | (YRS)* | |
Southern Downs Regional Council | | | 19 738 | | | | 19 769 | | | | 14.48 | | | | 14.17 | |
Sunshine Coast Regional Council | | | 112 160 | | | | 197 085 | | | | 10.48 | | | | N/A | |
Tablelands Regional Council | | | 7 216 | | | | 5 416 | | | | 9.80 | | | | 11.51 | |
Toowoomba Regional Council | | | 102 153 | | | | 99 963 | | | | N/A | | | | N/A | |
Torres Shire Council | | | 1 743 | | | | 2 560 | | | | 6.85 | | | | 11.75 | |
Torres Strait Island Regional Council | | | 603 | | | | 593 | | | | 12.21 | | | | 11.56 | |
Townsville City Council | | | 205 042 | | | | 387 396 | | | | 13.84 | | | | 16.30 | |
Western Downs Regional Council | | | 3 781 | | | | 13 666 | | | | 11.17 | | | | 16.01 | |
Whitsunday Regional Council | | | 26 183 | | | | 28 078 | | | | 13.25 | | | | 15.48 | |
Winton Shire Council | | | 3 556 | | | | 3 586 | | | | 16.87 | | | | 16.39 | |
| | | | | | | | | | | | | | | | |
TOTAL | | | 2 402 268 | | | | 4 034 291 | | | | | | | | | |
| | | | | | | | | | | | | | | | |
STATUTORY BODIES | | | | | | | | | | | | | | | | |
DRAINAGE BOARDS | | | | | | | | | | | | | | | | |
East Deeral Drainage Board | | | 10 | | | | 1 | | | | 1.05 | | | | 0.08 | |
Eugun Bore Water Authority | | | 165 | | | | 121 | | | | 3.38 | | | | 2.41 | |
Matthews Road Drainage Board | | | 4 | | | | — | | | | 0.58 | | | | — | |
GRAMMAR SCHOOLS | | | | | | | | | | | | | | | | |
Brisbane Girls Grammar School | | | 25 103 | | | | 24 131 | | | | 12.08 | | | | 11.49 | |
Brisbane Grammar School | | | 12 193 | | | | 27 127 | | | | 11.25 | | | | 16.35 | |
Ipswich Girls’ Grammar School | | | 20 580 | | | | 22 920 | | | | N/A | | | | N/A | |
Ipswich Grammar School | | | 2 649 | | | | 2 138 | | | | 4.68 | | | | 3.69 | |
Rockhampton Girls Grammar School | | | 4 176 | | | | 4 392 | | | | 17.32 | | | | 16.37 | |
Rockhampton Grammar School | | | 10 862 | | | | 10 678 | | | | 15.37 | | | | 15.08 | |
Toowoomba Grammar School | | | 253 | | | | 7 038 | | | | 0.56 | | | | 13.32 | |
Townsville Grammar School | | | 12 437 | | | | 17 862 | | | | 12.35 | | | | 13.19 | |
RIVER IMPROVEMENT TRUSTS | | | | | | | | | | | | | | | | |
Pioneer River Improvement Trust | | | 415 | | | | 327 | | | | 4.28 | | | | 3.32 | |
UNIVERSITIES | | | | | | | | | | | | | | | | |
Griffith University | | | 103 378 | | | | 90 152 | | | | 7.07 | | | | 6.45 | |
James Cook University | | | 25 104 | | | | 24 909 | | | | 13.88 | | | | 13.30 | |
Sunshine Coast University | | | 21 335 | | | | 19 664 | | | | 10.99 | | | | 10.58 | |
WATER BOARDS | | | | | | | | | | | | | | | | |
Avondale Water Board | | | 470 | | | | 383 | | | | 4.71 | | | | 3.73 | |
Fernlee Water Authority | | | 952 | | | | 967 | | | | 19.32 | | | | 18.87 | |
Gladstone Area Water Board | | | 137 587 | | | | 140 900 | | | | 21.53 | | | | 11.93 | |
Glamorgan Vale Water Board | | | 68 | | | | 47 | | | | 8.70 | | | | 11.26 | |
Grevillea Water Board | | | — | | | | 173 | | | | — | | | | 14.83 | |
Kelsey Creek Water Board | | | 1 211 | | | | 1 050 | | | | 5.83 | | | | 4.91 | |
Mount Isa Water Board | | | 3 903 | | | | 3 664 | | | | 8.85 | | | | 8.03 | |
Pioneer Valley Water Board | | | 3 523 | | | | 2 972 | | | | 5.68 | | | | 4.80 | |
Riversdale Murray Valley Water Management Board | | | 463 | | | | 364 | | | | 4.21 | | | | 3.22 | |
Six Mile Creek Water Board | | | 3 | | | | — | | | | 0.11 | | | | — | |
QUEENSLAND TREASURY CORPORATION ANNUAL REPORT 2009–2010 80
| | | | | | | | | | | | | | | | |
| | | TOTAL DEBT
OUTSTANDING
(MARKET VALUE) | | | TOTAL DEBT
OUTSTANDING
(MARKET VALUE) | | | AVERAGE
EXPECTED TERM | | | AVERAGE
EXPECTED TERM | |
| | | 30 JUNE 2009 | | | 30 JUNE 2010 | | | 30 JUNE 2009 | | | 30 JUNE 2010 | |
| LOANS TO CUSTOMERS | | $000 | | | $000 | | | (YRS)* | | | (YRS)* | |
WATER SUPPLY BOARDS | | | | | | | | | | | | | | | | |
Bollon South Water Authority | | | 741 | | | | 708 | | | | 10.47 | | | | 9.47 | |
Bollon West Water Authority | | | 955 | | | | 1 681 | | | | 12.36 | | | | 11.73 | |
Ingie Water Authority | | | 424 | | | | 411 | | | | 11.57 | | | | 10.61 | |
OTHER STATUTORY BODIES | | | | | | | | | | | | | | | | |
Australian Agricultural Colleges Corporation | | | 739 | | | | 164 | | | | 1.48 | | | | 1.12 | |
Stadiums Queensland | | | 467 519 | | | | 444 686 | | | | 8.06 | | | | N/A | |
Mt Gravatt Showgrounds Trust | | | 66 | | | | 49 | | | | 6.67 | | | | 7.20 | |
National Trust of Queensland | | | 1 128 | | | | 857 | | | | 3.69 | | | | 2.71 | |
Queensland Rural Adjustments Authority | | | 7 234 | | | | 5 466 | | | | 4.20 | | | | 3.41 | |
Queensland Studies Authority | | | 730 | | | | — | | | | 1.27 | | | | — | |
South Bank Corporation | | | 31 927 | | | | 29 673 | | | | N/A | | | | N/A | |
| | | | | | | | | | | | | | | | |
TOTAL | | | 898 307 | | | | 885 674 | | | | | | | | | |
| | | | | | | | | | | | | | | | |
QUEENSLAND WATER ENTITIES | | | | | | | | | | | | | | | | |
Queensland Bulk Water Supply Authority | | | 2 168 001 | | | | 2 384 301 | | | | N/A | | | | N/A | |
Queensland Bulk Water Transport Authority | | | 1 785 151 | | | | 1 889 885 | | | | N/A | | | | N/A | |
Queensland Manufactured Water Authority | | | 236 222 | | | | 2 638 785 | | | | N/A | | | | N/A | |
Queensland Water Infrastructure Pty Ltd | | | 765 736 | | | | 268 444 | | | | N/A | | | | N/A | |
SEQ Distribution Entity (Interim) Pty Ltd | | | 13 416 | | | | 25 340 | | | | N/A | | | | N/A | |
SEQ Water Grid Manager | | | 292 773 | | | | 666 795 | | | | N/A | | | | N/A | |
South East Queensland (Gold Coast) Desalination Company Pty Ltd | | | 547 259 | | | | — | | | | N/A | | | | — | |
Southern Regional Water Pipeline Company Pty Ltd | | | 143 073 | | | | 253 814 | | | | N/A | | | | N/A | |
Western Corridor Recycled Water Pty Ltd | | | 1 896 975 | | | | — | | | | N/A | | | | — | |
| | | | | | | | | | | | | | | | |
TOTAL | | | 7 848 605 | | | | 8 127 364 | | | | | | | | | |
| | | | | | | | | | | | | | | | |
SUNCORP-METWAY LTD | | | | | | | | | | | | | | | | |
Suncorp Metway Facility | | | 1 908 | | | | 1 488 | | | | 8.19 | | | | 8.18 | |
| | | | | | | | | | | | | | | | |
TOTAL | | | 1 908 | | | | 1 488 | | | | | | | | | |
| | | | | | | | | | | | | | | | |
TOLLWAY COMPANY | | | | | | | | | | | | | | | | |
Queensland Motorways Limited | | | 2 370 069 | | | | 2 899 052 | | | | N/A | | | | N/A | |
| | | | | | | | | | | | | | | | |
TOTAL | | | 2 370 069 | | | | 2 899 052 | | | | | | | | | |
| | | | | | | | | | | | | | | | |
QTC RELATED ENTITIES | | | | | | | | | | | | | | | | |
DBCT Holdings Pty Ltd | | | 259 103 | | | | 231 554 | | | | N/A | | | | N/A | |
| | | | | | | | | | | | | | | | |
TOTAL | | | 259 103 | | | | 231 554 | | | | | | | | | |
| | | | | | | | | | | | | | | | |
OTHER BODIES | | | | | | | | | | | | | | | | |
Aviation Australia Pty Ltd | | | 2 546 | | | | 2 493 | | | | 11.48 | | | | 10.84 | |
Aspire Schools Financing Services | | | — | | | | 55 842 | | | | — | | | | 28.52 | |
Department of Education and the Arts – State Schools | | | 24 | | | | 21 | | | | 6.13 | | | | 5.13 | |
Parents and Citizens Associations | | | 6 990 | | | | 6 273 | | | | 6.08 | | | | 5.71 | |
| | | | | | | | | | | | | | | | |
TOTAL | | | 9 561 | | | | 64 629 | | | | | | | | | |
| | | | | | | | | | | | | | | | |
GRAND TOTAL | | | 44 407 746 | | | | 55 113 460 | | | | | | | | | |
| | | | | | | | | | | | | | | | |
The balance of customers’ offset deposits held in various pools is offset against customers’ debt outstanding.
| | |
| * Average Expected Term | | – only includes standard principal and interest accounts |
| | – ignores temporary funding and debt offset facility |
| | – is not applicable for any non-standard principal and interest accounts |
QUEENSLAND TREASURY CORPORATION ANNUAL REPORT 2009–2010 81
APPENDIX B: Partners in Financial Markets 30 JUNE 2010
Actual dealer entities may vary depending on the facility and location of the dealer.
| | |
DOMESTIC AND GLOBAL A$ BOND FACILITY DISTRIBUTION GROUP | | |
AUSTRALIA AND NEW ZEALAND BANKING GROUP LTD | | TELEPHONE |
Domestic (Australia) | | +61 2 9227 1872 |
Global (London) | | +44 203 229 2070 |
| |
CITIGROUP GLOBAL MARKETS AUSTRALIA LTD | | TELEPHONE |
Domestic (Australia) | | +61 2 8225 6450 |
Global (London) | | +44 207 986 9521 |
| |
COMMONWEALTH BANK OF AUSTRALIA | | TELEPHONE |
Domestic (Australia) | | +61 2 9378 5000 |
Global (London) | | +44 207 329 6444 |
| |
DEUTSCHE CAPITAL MARKETS AUSTRALIA1 | | TELEPHONE |
Domestic (Australia) | | +61 2 8258 1444 |
Global (London) | | 1800 125 606 |
| |
JP MORGAN | | TELEPHONE |
Domestic (Australia) | | +61 2 9220 1358 |
Global (London) | | +44 207 777 9667 |
| |
NATIONAL AUSTRALIA BANK LTD | | TELEPHONE |
Domestic (Australia) | | +61 2 9295 1166 |
Global (London) | | +44 207 796 4761 |
| |
NOMURA SECURITIES | | TELEPHONE |
Domestic (Australia) | | +61 2 8062 8899 |
Global (London) | | +44 207 103 3443 |
| |
ROYAL BANK OF CANADA | | TELEPHONE |
Domestic (Australia) | | +61 2 9033 3222 |
Global (London) | | +44 207 029 0093 |
| |
THE ROYAL BANK OF SCOTLAND | | TELEPHONE |
Domestic (Australia) | | +61 2 8259 2200 |
Global (London) | | +44 790 066 8871 |
| |
TORONTO DOMINION BANK | | TELEPHONE |
Domestic (Singapore) | | 1800 646 497 |
Global (London) | | +44 207 628 4334 |
| |
UBS AG2 | | TELEPHONE |
Domestic (Australia) | | +61 2 9324 2222 |
Global (London) | | +44 207 567 4750 |
| |
WESTPAC BANKING CORPORATION | | TELEPHONE |
Domestic (Australia) | | +61 2 8204 2711 |
Global (London) | | +44 207 7621 7620 |
| | |
QTC TREASURY NOTE FACILITY DEALER PANEL | | |
PANEL MEMBERS | | TELEPHONE |
Australia and New Zealand Banking Group Ltd | | +61 2 9227 1772 |
Commonwealth Bank of Australia Ltd (Sydney) | | +61 2 9117 0020 |
Deutsche Bank AG (Sydney) | | +61 2 8258 2688 |
National Australia Bank Ltd (Sydney) | | +61 2 9295 1133 |
Westpac Banking Corporation Ltd (Sydney) | | +61 2 8204 2744 |
| |
MULTI-CURRENCY US COMMERCIAL PAPER FACILITY DEALER PANEL | | |
| |
PANEL MEMBERS | | TELEPHONE |
Citigroup Global Markets Inc (New York) | | +1 212 723 6252 |
Credit Suisse (New York) | | +1 917 304 8531 |
Deutsche Bank Securities (New York) | | +1 212 250 5159 |
| |
MULTI-CURRENCY EURO COMMERCIAL PAPER FACILITY DEALER PANEL | | |
| |
PANEL MEMBERS | | TELEPHONE |
Barclays Bank Plc (London) | | +44 207 773 9764 |
Citigroup International Plc (Hong Kong)3 | | +852 2501 2689 |
Deutsche Bank AG (Singapore) | | +65 6883 1698 |
National Australia Bank Limited (Hong Kong and London) | | +852 9182 1165 |
RBC Capital Markets (Sydney) | | +61 2 9033 3300 |
UBS Ltd (London) | | +44 207 329 0203 |
| |
MULTI-CURRENCY EURO MEDIUM-TERM NOTE FACILITY DEALER PANEL4 | | |
| |
PANEL MEMBERS | | TELEPHONE |
Includes all Domestic and Global A$ Bond Facility Distribution Group5 | | |
QUEENSLAND TREASURY CORPORATION ANNUAL REPORT 2009–2010 82
| | |
| |
MULTI-CURRENCY US MEDIUM-TERM NOTE FACILITY DEALER PANEL4 | | |
PANEL MEMBERS | | TELEPHONE |
Australia and New Zealand Banking Group Limited | | +1 212 8019 160 |
Citigroup (New York) | | +1 212 723 6175 |
Commonwealth Bank of Australia | | +44 207 329 6444 |
Daiwa Securities America | | +1 212 612 7000 |
Daiwa Securities SMBC Europe | | +61 3 9916 1388 |
Deutsche Bank Securities Inc (New York)6 | | +1 212 469 7500 |
JP Morgan | | +1 212 834 4533 |
RBC Capital Markets (New York) | | +1 212 858 7380 |
RBS Greenwich Capital | | +44 207 085 0000 |
TD Securities | | +1 212 827 7325 |
UBS Investment Bank | | +44 207 567 3782 |
| 1 | Lead Manager – United States |
| 4 | Reverse inquiry also permitted |
| 5 | Lead Arranger – UBS Ltd (London) |
| | | | | | | | | | | | | | |
ISSUING AND PAYING AGENTS |
| | | | |
| | | CONTACT | | | TELEPHONE | | | FACSIMILE | | | EMAIL |
AUD TREASURY NOTES | | | | | | | | | | | | | | |
Austraclear Services Ltd Sydney | | | Help Desk | | | | 1300 362 257 | | | | +61 2 9256 0456 | | | SFE.Registry@asx.com.au |
| | | | |
| AUD DOMESTIC BONDS | | | | | | | | | | | | | | |
Link Market Services Ltd | | | Markings / Transfers | | | | +61 2 8280 7868 | | | | +61 2 9287 0315 | | | qtcregistry@linkmarketservices.com.au |
| | | | |
| AUD GLOBAL BONDS | | | | | | | | | | | | | | |
Deutsche Bank Trust Company
Americas | | | Client Services | | | | +1 615 835 3202 | | | | +1 615 866 3887 | | | transfer.operations@db.com |
| | | | |
| EURO COMMERCIAL PAPER | | | | | | | | | | | | | | |
Deutsche Bank AG, London | | | Client Services | | | | +44 207 547 3553 | | | | +44 207 547 6149 | | | TSS-GDS.ROW@db.com |
| | | | | | | +44 207 547 6528 | | | | | | | |
| | | | |
| US COMMERCIAL PAPER | | | | | | | | | | | | | | |
Deutsche Bank Trust Company
Americas | | | Client Services | | | | +1 866 770 0355 | | | | +1 732 578 2455 | | | mmi.operations@db.com |
| | | | |
EURO MEDIUM-TERM
NOTES | | | | | | | | | | | | | | |
Deutsche Bank AG, London | | | Client Services | | | | +44 207 547 3553 | | | | +44 207 547 6149 | | | TSS-GDS.ROW@db.com |
| | | | | | | +44 207 547 6528 | | | | | | | |
| | | | |
| US MEDIUM-TERM NOTES | | | | | | | | | | | | | | |
Deutsche Bank Trust Company
Americas | | | Client Services | | | | +1 866 797 2808 | | | | +1 212 461 4450 | | | mtn.operations@db.com |
QUEENSLAND TREASURY CORPORATION ANNUAL REPORT 2009–2010 83
APPENDIX C: Statutory and Mandatory Disclosure Statements
Internal Audit
QTC has an established internal audit function, which it currently outsources to KPMG.
The role of internal audit is to support QTC’s corporate governance framework by providing the Board (through the Accounts and Audit Committee) with:
| • | | assurance that QTC has effective, adequate and efficient internal controls in place to support the achievement of its objectives, including the management of risk, and |
| • | | advice with respect to QTC’s internal controls and business processes. |
Internal audit is responsible for:
AUDIT PLANNING
| (a) | developing an annual audit plan, based on the assessment of financial and business risks and aligned with QTC’s strategic goals and objectives |
| (b) | consulting with QTC’s management team in relation to development of that plan |
| (c) | submitting the plan to the QTC Accounts and Audit Committee for review and approval, and |
| (d) | developing and implementing an audit program based on the plan, which is flexible enough to meet QTC’s changing business needs and coordinates the necessary resources to implement the plan and any additional special requests. |
ASSURANCE REPORTS
| (a) | providing regular audit reports and periodic program management reports to the management team, and the QTC Accounts and Audit Committee. |
COMPETENCE AND STANDARDS
| (a) | developing and maintaining an appropriately-skilled and professional audit team with sufficient knowledge, skills and experience to implement the plan. |
PROCESS IMPROVEMENT
| (a) | working constructively with QTC’s management team to challenge and improve established and proposed practices and to put forward ideas for process improvement. |
ADVICE
| (a) | providing advice with respect to internal controls and business practices. |
In the year under review, KPMG completed its internal audits in accordance with the approved annual audit plan. The timing of
some audits, however, differed from the original plan, due to project and resourcing issues.
Public Records Act Implementation
During the year, QTC progressed its compliance with the provisions of the Public Records Act 2002 and the implementation of Information Standard 40: Recordkeeping, and Information Standard 31: Retention and Disposal of Public Records. QTC is finalising the development of its Information Management Manual and, with State Archives, is developing a QTC-specific Retention and Disposal Schedule. We have maintained our focus on the effective management of our hard-copy records and expect to complete this work by the end of 2010, thereby generating additional business benefit through the efficient and effective management of all corporate records. Looking forward, QTC will review its existing electronic document management system in the next financial year, with a view to upgrading or replacing this system.
Public Sector Ethics Act Implementation
QTC provides the following information pursuant to obligations under section 23 of the Public Sector Ethics Act 1994 (Qld) to report on action taken to comply with certain sections of the Act. QTC employees are required to comply with QTC’s Code of Conduct for employees (which sets out the ethics principles and obligations under the Public Sector Ethics Act) as well the Code of Conduct established by the Australian Financial Markets Association, of which QTC is a member. Both codes are available electronically to employees through QTC’s in-house information management system. Copies of these codes can be inspected by contacting QTC’s People and Performance Group (see Corporate Directory for contact details). Training for employees on ethical obligations is provided as part of QTC’s employee induction process and on an ongoing basis.
QTC’s corporate governance policies and practices ensure that QTC acts ethically, within appropriate law, policy and convention, and addresses the systems and processes necessary for the proper direction and management of its business and affairs. QTC is committed to observing high standards of integrity and fair-dealing in the conduct of its business and to acting with due care, diligence and skill.
QTC’s compliance policy requires that QTC and all employees comply with the letter and the spirit of all relevant laws and regulations, industry standards, and relevant government policies, as well as QTC’s own policies and procedures.
Remuneration: Board and Committees
For the Capital Markets Advisory Board for the year ending 30 June 2010, the total remuneration payments made to the
QUEENSLAND TREASURY CORPORATION ANNUAL REPORT 2009–2010 84
members was $384,759 and the total on-costs (including travel, accommodation, and hiring of motor vehicles for the members) was $25,649.
For the Long Term Asset Advisory Board for the year ending 30 June 2010, no payments were made to members in relation to remuneration or on-costs (including travel, accommodation, and hiring of motor vehicles for the members).
Whistleblowers Protection Act 1994
Section 30(1) of the Whistleblowers Protection Act 1994 requires QTC to disclose, in its Annual Report, statistical information for the reporting period in respect of the number of disclosures received and the number of disclosures substantially verified. During the year under review, QTC has not received, nor had to substantially verify, any disclosures.
Overseas travel
QTC raises funds in offshore financial markets and, from time-to-time, Board directors and QTC officers visit these markets to transact business on behalf of QTC. All overseas travel is approved by the Treasurer. In the year under review, international travel included:
| | | | | | | | |
| OFFICER TRAVELLING | | DESTINATION & DATES | | REASON FOR TRAVEL | | COST | |
Senior Economist | | Hong Kong, Europe, United Kingdom, United States 2–10 September | | Participated in Deutsche Bank’s Annual International Investor Mission. | | $ | 26 522 | |
Team Leader, QA | | Hong Kong 20–26 September | | Participated in Citi’s Annual Fixed Income Asia Pacific Conference. | | $ | 7 890 | |
Team Leader, Local Government; CEO, LGIS | | United Kingdom 13–18 September | | Led Queensland local government representatives in a UK trade delegation on alternative waste technologies (LGIS & QTC). | | $ | 24 627 | |
Chairman; Under Treasurer; Chief Executive; General Manager, Financial Markets* | | United States, United Kingdom, Europe, Asia 20 September–3 October | | Conducted meetings with QTC’s Global AUD Fixed Interest Distribution Group and existing and potential investors to promote Queensland’s fiscal and economic management and strengths, and QTC’s A$ Global Bonds and other funding facilities. | | $ | 111 186 | |
General Manager, Financial Markets; Portfolio Manager | | Asia 1–11 November | | Presented to the Nomura Conference. Attended the Daiwa Conference. Conducted ECP review meetings with QTC’s Global AUD Fixed Interest Distribution Group and investors. | | $ | 23 609 | |
Deputy Under Treasurer; General Manager, Funding and Markets* | | New Zealand 28–29 January | | Conducted a series of meetings with investors and members of QTC’s Global AUD Fixed Interest Distribution Group. | | $ | 6 583 | |
General Manager, Funding and Markets; Portfolio Manager | | Asia 2–5 February | | Conducted a series of meetings with investors and members of QTC’s Global AUD Fixed Interest Distribution Group. Attended Citi’s Asia Pacific Investor Conference. | | $ | 20 110 | |
Chairman; General Manager, Funding and Markets | | Middle East 27 February–5 March | | Undertook a series of meetings with potential investors in the Middle East. | | $ | 39 680 | |
| | | |
Portfolio Manager | | United Kingdom 15–19 March | | Participated in the BNP Paribas Fixed Income Asia Central Bank Training seminar. | | $ | 13 784 | |
General Counsel | | United States, United Kingdom, Sweden 10–20 March | | Conducted meetings regarding Queensland Rail Cross Border Leases. | | $ | 17 134 | |
General Manager, Funding and Markets; Portfolio Manager | | United Kingdom, United States 19 March–1 April | | Conducted meetings with investors and review meetings with QTC’s Global AUD Fixed Interest Distribution Group. | | $ | 23 195 | |
Director, Funding and Markets; Portfolio Manager | | Asia 8–23 April | | Conducted offshore dealer panel (Euro CP) reviews and attended the Nomura Conference. | | | $26 693 | |
Director, Funding and Markets | | United States 4–8 May | | Conducted meetings with QTC’s Global AUD Fixed Interest Distribution Group and attended investor function with Queensland’s Premier. | | | $14 922 | |
QUEENSLAND TREASURY CORPORATION ANNUAL REPORT 2009–2010 85
APPENDIX C: Statutory and Mandatory Disclosure Statements (CONTINUED)
| | | | | | | | |
| OFFICER TRAVELLING | | DESTINATION & DATES | | REASON FOR TRAVEL | | COST | |
General Manager, Funding and Markets | | Hong Kong 26–28 May | | Presented at the Euromoney Conference. | | $ | 9 780 | |
Director, Funding and Markets | | Switzerland 12–19 June | | Participated in the UBS Sovereign Conference. | | $ | 12 163 | |
Chairman; Deputy Under Treasurer; General Manager, Funding and Markets | | Japan 20–25 June | | Conducted a series of meetings with Japanese market participants to update on the Queensland Budget and the impact of the withdrawal of the Australian Government Guarantee. | | $ | 45 479 | |
| * | QTC’s General Manager, Financial Markets position title changed to General Manager, Funding and Markets in December 2009. |
QUEENSLAND TREASURY CORPORATION ANNUAL REPORT 2009–2010 86
APPENDIX D: Corporate Directory and Glossary
Queensland Treasury Corporation
| | |
| Level 14, 61 Mary Street | | Telephone: +61 7 3842 4600 |
| Brisbane Queensland Australia | | Facsimile: +61 7 3221 4122 |
| |
| GPO Box 1096 | | Internet: www.qtc.com.au |
Brisbane Queensland Australia 4001 |
Queensland Treasury Corporation’s annual reports [ISSN 1837-1256 (print); ISSN 1837-1264 (online)] are available on QTC’s website: www.qtc.com.au. If you would like a report posted to you, please call QTC’s Communication and Marketing Group on +61 7 3842 4945.
QTC is committed to providing accessible services to Queensland residents from culturally and linguistically diverse backgrounds. If you have difficulty understanding QTC’s Annual Report, please contact QTC’s Communication and Marketing Group on 07 3842 4945 and we will arrange for an interpreter to assist you.
If you would like to comment on our Annual Report, please complete the feedback form that can be downloaded from the Annual Reports page on our website (www.qtc.com.au).
Glossary
AUSTRALIAN GOVERNMENT GUARANTEE: On 12 October 2008, the Australian Government announced guarantee arrangements for deposits and wholesale funding of eligible authorised deposit-taking institutions (ADIs). The arrangements were designed to promote financial system stability in Australia, and ensure that Australian institutions were not placed at a disadvantage compared to their international competitors that could access similar government guarantees on bank debt. In February 2010, following improvement in market conditions, the Australian Government announced it would no longer offer to guarantee new state government borrowings issued after 31 December 2010.
BASIS POINT: One hundredth of one per cent (0.01%).
BOND: A financial instrument whereby the borrower agrees to pay the investor a rate of interest for a fixed period of time. A typical bond will involve regular interest payments and a return of principal at maturity.
CP (COMMERCIAL PAPER): A short-term money-market instrument issued at a discount with the full face value repaid at maturity. CP can be issued in various currencies with a term to maturity of less than one year.
CREDIT RATING: Measures a borrower’s creditworthiness and provides an international framework for comparing the credit quality of issuers and rated debt securities. Rating agencies allocate three kinds of ratings: issuer credit ratings, long-term debt and short-term debt. Issuer credit ratings are among the most widely watched. They measure the creditworthiness of the borrower including its capacity and willingness to meet financial obligations. QTC has a strong rating from two rating agencies—Standard & Poor’s, and Moody’s.
DISTRIBUTION GROUP: A group of financial intermediaries who market and make prices in QTC’s debt instruments.
GLOBAL FINANCIAL CRISIS: The global financial crisis refers to a series of events following the rapid increases in default rates on US sub-prime mortgages over 2007-08. Funding and liquidity problems in the world’s major financial centres morphed into concerns about solvency over the first half of 2008-09, peaking in September 2008. Since March 2009, however, markets have become more optimistic even as the normalisation in financial-markets functioning still appears some way off.
QUEENSLAND TREASURY CORPORATION ANNUAL REPORT 2009–2010 87
GOC: Government Owned Corporation.
ISSUE PRICE: The price at which a new security is issued in the primary market. LIQUID: Markets or instruments are described as being liquid, and having depth, if there are enough buyers and sellers to absorb sudden shifts in supply and demand without price distortions.
MARKET VALUE: The price at which an instrument can be purchased or sold in the current market.
MTN (MEDIUM-TERM NOTE): A financial debt instrument that can be structured to meet an investor’s requirements in regard to interest rate basis, currency and maturity. MTNs usually have maturities between 9 months and 30 years.
PUBLIC PRIVATE PARTNERSHIP: A public private partnership (PPP) is a risk-sharing relationship between the public and private sectors to deliver public infrastructure and related non-core services.
QTC: Queensland Treasury Corporation.
RBA: Reserve Bank of Australia.
T-NOTE (TREASURY NOTE): A short-term money market instrument issued at a discount with the full face value repaid at maturity. T-Notes are issued in Australian dollars with a term to maturity of less than one year.
| | |
EXECUTIVE | | |
Telephone: +61 7 3842 4611 | | Facsimile: +61 7 3210 0262 |
GROUPS | | |
BUSINESS SOLUTIONS GROUP | | |
Telephone: +61 7 3842 4743 | | Facsimile: +61 7 3210 1198 |
FINANCIAL SOLUTIONS GROUP | | |
| |
Telephone: +61 7 3842 4715 | | Facsimile: +61 7 3211 3629 |
| | |
STRATEGIC PARTNERING GROUP | | |
Telephone: +61 7 3842 4901 | | Facsimile: +61 7 3211 4122 |
TREASURY DEPARTMENT GROUP | | |
Telephone: +61 7 3842 4798 | | Facsimile: +61 7 3211 3629 |
CUSTOMER AND MARKET SOLUTIONS DELIVERY | | |
Telephone: +61 7 3842 4644 | | Facsimile: +61 7 3221 2486 |
STOCK REGISTRY (LINK MARKET SERVICES LTD) | | |
Telephone: 1800 777 166 | | Facsimile: +61 2 9287 0315 |
FUNDING AND MARKETS GROUP | | |
Telephone: +61 7 3842 4789 | | Facsimile: +61 7 3221 2410 |
RISK GROUP | | |
Telephone: +61 7 3842 4704 | | Facsimile: +61 7 3236 9031 |
OPERATIONS GROUP | | |
Telephone: +61 7 3842 4641 | | Facsimile: +61 7 3221 4122 |
STRATEGY GROUP | | |
Telephone: +61 7 3842 4725 | | Facsimile: +61 7 3221 2410 |
COMMUNICATION AND MARKETING GROUP | | |
Telephone: +61 7 3842 4714 | | Facsimile: +61 7 3211 3629 |
PEOPLE AND PERFORMANCE GROUP | | |
Telephone: +61 7 3842 4761 | | Facsimile: +61 7 3210 2358 |
QUEENSLAND TREASURY CORPORATION
Level 14, 61 Mary Street Brisbane Queensland Australia
GPO Box 1096 Brisbane Queensland Australia 4001
Telephone: +61 7 3842 4600 Facsimile: +61 7 3221 4122
www.qtc.com.au