EXHIBIT (c)(iii)
Budget Papers of the Co-registrant for 2010-11

State Budget 2010—11
Budget Speech Budget Paper No. 1
Queensland Government
2010–11 State Budget Papers
1. Budget Speech
2. Budget Strategy and Outlook
3. Capital Statement
4. Budget Measures
5. Service Delivery Statements
Budget Highlights
This suite of Budget Papers is similar to that published in 2009–10.
The Budget Papers are available online at www.budget.qld.gov.au. They can be purchased through the Queensland Government Bookshop – individually or as a set – by phoning 1800 801 123 or at www.bookshop.qld.gov.au
© Crown copyright
All rights reserved
Queensland Government 2010
Excerpts from this publication may be reproduced, with appropriate
acknowledgement, as permitted under the Copyright Act.
Budget Speech
Budget Paper No.1
ISSN 1445-4890 (Print)
ISSN 1445-4904 (Online)
APPROPRIATION BILL 2010
(Second Reading Speech, 8 June 2010)
TREASURER
The Honourable Andrew Fraser MP
Treasurer and Minister for Employment
and Economic Development
APPROPRIATION BILL 2010
(Second Reading Speech, 8 June 2010)
TREASURER
The Honourable Andrew Fraser MP
Treasurer and Minister for Employment
and Economic Development
Mr Speaker.
Twelve months ago, this Government took the decision to fight for jobs, above all else.
We made some tough choices. About what to do, what not to do anymore, and what’s in the long-term interests of Queensland.
In this State Budget we report back and recommit ourselves to our true task, providing Queenslanders with a chance at the dignity of work.
It’s what we have always believed in. It’s what we said we would do. And it’s what we are delivering.
This is Labor’s first commitment and our calling.
It guides us and drives us, just like our determination to offer a quality education system for all children and to provide state-of-the art hospitals for the care of our sick.
The fair go... the advancement of all, regardless of where you line up at the start.
And in a world still riven with uncertainty, it is these fundamental beliefs that drive the Bligh Labor Government, and underpin the 2010-11 State Budget.
As global markets continue to shudder, we stand steadfast and determined.
For we know that our task today in 2010 remains as pressing as it was in 2009.
We must build, nurture and drive our economic recovery.
We must prepare for the future.
We must keep our shoulder to the wheel.
It is our desire to protect the lifestyle and livelihood of Queensland families that fuels our determination to deliver on our reforms.
The 2010-11 State Budget shows the architecture of our reforms, and the genesis of the Queensland recovery.
1
Mr Speaker,
The Budget I hand down today shows that the Bligh Labor Government’s economic strategy is delivering.
This Budget delivers lower deficits, lower debt, higher growth and more jobs.
It provides for more essential services, and the investment in the infrastructure our growing state needs.
Our strategy is fuelling growth in the economy, and delivering on Labor’s promise to create more jobs, sooner.
It is a strategy that applies a strong fiscal discipline, while lending a helping hand to Queenslanders who need it most.
It is a strategy that sees the balance sheet strengthened, as we build a stronger, more robust economy.
And it is a strategy not yet fulfilled, as we strive to build tomorrow’s Queensland.
THE ECONOMY: BUILDING A RECOVERY AND GENERATING JOBS
At last year’s Budget we forecast the Queensland economy would contract in 2009-10. This mirrored the forecast for the Australian economy by the Commonwealth Treasury.
As the first sustainable signs of recovery began to build this forecast was upgraded at the Mid-Year Review to positive, albeit marginal, growth of 1%.
The Budget today confirms the recovery underway, with estimated growth for 2009-10 now 3%. While this growth remains below trend, it does outpace the national estimate of 2%.
Central to this result has been our investment in our building program and the strength of our export sector.
Our building program represented almost 7% of the state’s economy in 2009-10 and supported the jobs of some 120,000 Queenslanders.
Most importantly we have delivered jobs growth for this financial year, where previously job losses were forecast.
Our determination to elevate the jobs of Queenslanders above all else has delivered where it matters: avoiding the heights of expected unemployment and reducing the impact on Queensland families from the devastation of job loss.
As we oversee the recovery now underway we look forward to accelerating jobs growth of 2 3/4% for the 2010-11 financial year.
This forecast is expected to outpace population growth and thus begin to drive unemployment down.
2
Our determination to deliver a net new 100,000 jobs by March 2012 has never wavered.
Central to that promise is our commitment to building.
Building means jobs, which is why in 2010-11 we will invest $17.1 billion in infrastructure.
It is an investment in jobs, it is an investment in local economies, and it is an investment in the future, as we cater for the demands of our growing population.
Mr Speaker,
The recovery underway has delivered additional revenues. At the delivery of the last Budget we adopted new fiscal rules to guide our recovery.
The rules were tough, and deliberately so. As the charter report within the Budget Papers details, we are delivering improved results. Expenditure constraint through the last financial year has helped deliver a materially better result.
We have met the zero net real per capita growth discipline for this financial year. Despite the high cost of natural disasters we are determined to meet it again in 2010-11.
The revenue wipeout still stands at more than $7 billion dollars as we rebuild. Transfer duty receipts from property still aren’t expected to recover to their 2007-08 level until 2013-14.
The task has not been easy, but we are seeing the results.
The forecast deficit for 2009-10 has been reduced to $287 million, or 0.1% of gross state product, down from the Mid-Year review forecast of $2.3 billion.
The deficit position across the forward estimates has been significantly reduced, with the deficit halved in 2010-11 to $1.74 billion from the $3.46 billion forecast last Budget.
Previously deficits totalling to $11.3 billion to 2012-13 were forecast. The job of repairing our position is well and truly underway, with that figure reduced by $6.3 billion.
Last year’s forecast for a return to surplus has been brought forward. We are now on track to deliver a solid surplus in 2015-16, in accordance with our charter.
With continued discipline we can see a return sooner. It will require all our resolve, something we have in spades.
Last year an efficiency dividend was introduced across the government and harvested upfront. This has required agencies to look at expenditure and make savings in their operations.
This Budget continues this dividend and increases it by $57 million as we continue our drive to direct funds to the front-line, where they are needed most.
3
HELPING QUEENSLAND HOUSEHOLDS
Last year we asked a lot of Queenslanders.
Tough decisions were required. And while a recovery is underway, we recognise that many are still doing it tough.
Inflation and rising interest rates are putting household budgets under pressure.
Our drive for greater budget discipline has not dampened our efforts to provide relief for Queenslanders where we can.
Our Compulsory Third Party Insurance scheme has operated well. CTP today is still lower than it was in 2003.
However in recent times insurers were all filing at the ceiling set by the Motor Accident Insurance Commission - reducing price competition.
In March I announced a review, to ensure the scheme was operating to benefit motorists given rising costs.
Today I announce that the CTP ceiling will be reduced by $24 from 1 October.
The review will ensure that motorists don’t bear the costs of commissions paid to other parties, including motor dealers, and will also bring forward the abolition of a levy surcharge put in place after the collapse of HIH.
This relief will apply across the board, including to pensioners who will continue to enjoy a full 50% discount on their registration: a concession that this year is worth $90 million.
We are determined to give Queensland families some relief – and this measure will help households and assist in keeping our CTP regime competitive and consumer focused.
Rising electricity prices in particular make it tough for some of our most vulnerable Queenslanders.
Lending a helping hand to those in need is fundamental to our core beliefs.
The Budget I deliver today will increase the electricity rebate for pensioners and seniors from $190 to $216 per household at a cost of $50.4 million over the next four years.
The Budget also delivers a new $6.7 million subsidy program to assist those vulnerable Queenslanders whose medical condition requires the extra use of air-conditioners, such as sufferers of multiple sclerosis.
A helping hand to those that need it most - as is our calling.
The Budget includes a $1.6 billion budget in the disabilities portfolio, including an extra $72 million over four years to provide additional support to those with a disability and their families, including two new autism services in Mackay and Bundaberg.
4
$28 million from these funds will go towards helping those with spinal cord injuries while $21 million is provided for young people transitioning out of school.
A major new $45 million four year program is being introduced in three pilot sites to provide secondary services in our child protection system. Along with the allocation of $12 million for additional frontline workers, this allocation will boost the system that supports those who most need our care and protection.
Mr Speaker,
In recent times the government has extended a land tax exemption to aged care facilities. Today I announce a new exemption to providers of supported accommodation for people with high care needs - services which house some of our most vulnerable Queenslanders.
I also announce a new tax exemption measure to assist Queenslanders with a disability, by excluding homes purchased through a disability trust from stamp duty.
Individually, these measures are modest, but they target assistance to some of our most deserving Queenslanders.
In total, this Budget provides around $1.3 billion worth of concessions to Queenslanders in need.
The protection and expansion of these concessions is a direct result of the reform program we have implemented.
It’s the dividend for the community, from the economic strategy we put in place.
A SUSTAINABLE FUTURE BY DOING THE BRIGHT THING
The future of our environment and our sustainability are central to our government’s policy agenda.
Queensland has enormous potential to develop solar energy and secure not only the environmental dividend, but support new industries of the future and the green jobs possible.
The Budget adds to our commitment to the solar industry through new measures, including:
| • | | our new $60 million Solar Hot Water Scheme which provides a subsidy of up to $1000 to assist Queenslanders cut their power bills, and reduce the costs on our environment |
| • | | $5.8 million Solar Kindy Program to install solar power at kindergartens |
| • | | $35 million for the solar boost project at Kogan Creek. |
Renewable energy reduces our call upon the resources of the planet, and so too can a concerted effort to recycle waste and reduce landfill.
5
The Government will introduce a new waste reform strategy to reduce waste and improve recycling levels. A commercial waste levy will apply from 1 July 2011 across 34 council areas along with a commitment to provide:
| • | | $159 million over four years to assist business and the community to reduce waste and implement the strategy |
| • | | $120 million over four years to assist local governments introduce waste reduction infrastructure and programs. |
All other mainland states of Australia have introduced a levy and we are in danger of becoming the dumping ground for other states without acting.
Unlike other states, funds from the levy will not benefit the budget bottom line. Every last cent will be put towards waste programs and environmental initiatives.
As a government we have committed to increasing our protected estate by 50% by 2020.
The Budget also funds programs to support the acquisition of National Park estate and habitat for koalas at a total of $80 million over the next four years.
This Budget provides the down payment on expanding the estate and dedicates future proceeds from the levy to protect more of our environment through programs such as the acquisition of further national parks.
Our natural heritage is vital to the nation’s heritage.
It’s vital also to industries like agriculture and investment in our biosecurity and our biodiversity are investments not only in our environment but in our economy.
The Budget also makes new investments in Hendra research and fire ant eradication to protect and preserve our biosecurity - so vital to our state and indeed to the nation.
INVESTING IN THE FUTURE: GIVING YOUNG QUEENSLANDERS A FLYING START
Mr Speaker, education is the cornerstone of our society, and the key to our future prosperity.
It is a core belief, and central to our strategy as a Government.
Our investment in education and training in this Budget will climb by almost $300 million this year.
This includes funding for up to 316 new teachers and teacher aides, as we deliver on our election commitments.
We will open five new schools for the 2011 school year, as this Budget funds the construction of new schools to meet our future growth.
6
Giving young Queenslanders a flying start through our commitment to build 240 kindergarten services is central to our investment in education.
We will bring forward the construction of an additional 40 kindies to be opened by 2012, bringing total new services to be opened by then to 108.
By taking the tough decisions we can make the investments that really matter – into schools and kindies to prepare young Queenslanders for their future.
We have listened to employers, and are working to avoid a repeat of the terrible skill shortages in growth sectors.
As the recovery builds, so does the need to get more Queenslanders to take up a trade, to get more Queenslanders to upskill, to get more Queenslanders contributing to the growth of our economy.
The Government will overhaul the skills system in this state through the creation of a new Skills Commission to drive investment in the skills the economy demands, particularly for industries like LNG.
We will also maintain the nation’s lowest payroll tax rate, and today I also announce an extension of our 125% payroll tax rebate for apprentices and trainees, as we support those businesses that are investing in skills for the future.
We are also co-investing with industry in a $10 million program to train thousands of workers needed for the new Coal Seam Gas and Liquefied Natural Gas industries.
Investment in innovation, along with new industries, remains central to our economic agenda. A new two-year, $2.5 million innovation vouchers program will provide Queensland firms with the opportunity to access assistance to develop their business.
Our economic reform agenda remains firmly committed to investing in innovation and skills and developing new industries for the future, to deliver the jobs of the future.
INVESTING IN HEALTH AND HOSPITALS
Five years ago our health budget was $5.35 billion.
It is hard to imagine that the budget could ever reach $10 billion – but this year the Queensland Health budget stands at $9.99 billion.
It has been, and remains, the single biggest budget allocation, and a key priority for this Government.
This year we will add another 1,200 doctors, nurses and health professionals to the front-line workforce.
Our record health building program, delivering 22 new and redeveloped hospitals across the state, continues with an allocation of $1.6 billion this year.
7
New hospitals in Mackay and the Gold Coast are under construction, redevelopments in Cairns, Townsville, Rockhampton and Bundaberg are underway.
This Budget provides funds of $137.7 million for new capacity and new services on the Sunshine Coast over the next four years, as well as locking in the funds for the new Sunshine Coast University Hospital due to open, as we committed last year, by 2016.
Our investment in health across the state also sees the Budget commit $374 million for new regional cancer services across the state, as we partner with the Australian Government to invest in our health system.
In this Budget I also announce a new initiative to assist Queenslanders who suffer from chronic pain, with a new four-year, $39 million initiative to provide four new persistent pain clinics.
Mr Speaker,
Queensland led the way in testing newborns for hearing loss, with universal screening now available.
For families who discover their newborn child suffers from hearing loss, the prospect of a cochlear implant can represent hope.
Cochlear has recently announced its intention to expand its facility and production here in Queensland and today I can announce new funding to provide more implants for more children and more funding for the Hear and Say Centre.
We will invest an additional $16.5 million to double the number of cochlear implants and expand children’s hearing services over the next four years.
It is through investment in research that the Cochlear implant has helped change lives.
We have committed more than $3.6 billion over the last decade to drive innovation and research, and we continue our commitment with an additional $31 million for medical research in this Budget.
The challenge of an ageing population and increasing medical technology costs requires us to undertake long-term reform to our health system.
This year the federal government’s specific health funding allocation to Queensland is $2.7 billion. The balance of this $10 billion commitment is met by the state from GST and other state revenue.
Queensland has signed up to the new health funding arrangements which dedicates a proportion of the GST to be locked in and the Commonwealth to fund the majority of growth.
8
Dedicating the GST towards this task reflects the current reality. And doing so harnesses the Commonwealth finally recognising its obligation to be the dominant funder of health into the future.
Given the Commonwealth collects 80% of all tax revenue in this nation it should and must be the dominant funder of health.
This Budget also delivers through the funds we negotiated as part of the health reform deal before the GST lock-in, including:
| • | | $150 million for emergency departments |
| • | | $160 million for elective surgery |
| • | | $327 million for sub-acute care. |
Funding health has to be the first priority of government. It is the first priority of the Bligh Government and this Budget demonstrates our priority and the choices we have made.
BUILDING FOR GROWTH, FOR TOMORROW’S QUEENSLAND
One vital statistic which has not been subject to the volatility of recent years has been our sustained population growth.
The forecast once again is that another 100,000 Queenslanders will call our state home through the next financial year.
That means we need to cater for that growth. And we are determined to guide the growth for the benefit of all of Queensland.
A growing population requires a commitment to building infrastructure and providing new services.
The Budget delivers the frontline services needed – 203 extra police, 316 new teachers and teacher aides, 1200 doctors, nurses and allied health professionals.
We are also delivering a $17.1 billion building program as we build Queensland’s future, and re-build our economic strength.
Our building program is delivering the support our economy needs today – and the infrastructure needed for tomorrow.
We need to target a building program that matches both economic imperatives and fiscal requirements. We should not yet step back.
This Budget sees new projects funded, and others on the drawing board brought onto the books, and ready to commence.
9
Projects like the $450 million Police Academy will go to the market in 2010-11, to ensure a pipeline of projects is delivered to help sustain our vital construction industry while private investment remains constrained by credit conditions.
As the massive $1.8 billion Gateway Bridge duplication and upgrade project heads towards the finish line, the Government has committed to the $240 million Gateway Upgrade South extension, which will deliver 6 lanes non-stop between Nudgee and Nerang.
The Port of Brisbane Motorway upgrade will also commence this financial year, with a funding commitment of $330 million allocated.
We will complete the $315 million Ted Smout Bridge to Redcliffe, the $148 million Forgan Smith Bridge in Mackay and construction on the $190 million Port Access Road in Townsville will continue.
One of the defining characteristics of the Queensland economy is its regionalised nature.
No two are the same, and across the board we are committed to providing the infrastructure our communities deserve.
There is no doubt that the Cairns region has done it tougher than many in recent times. That’s why we put in place a $116 million stimulus plan last year.
Today I announce our commitment to financially supporting the construction of a new Cairns cultural precinct.
The Budget sees $42.5 million allocated in land and funds towards this project, which has been proposed as a partnership between the Cairns Regional Council and the federal government.
We are committed to this project – for the long-term benefit of the Cairns economy.
The Budget includes our commitment to the $96 million new marine precinct in Townsville while funds are also allocated towards the Mackay Showgrounds and towards the next stage of the Rockhampton Riverbank Redevelopment.
Regional growth is also supported through a commitment to fund new access for the development of the industrial precinct at Gracemere, while funds are allocated to support airport upgrades in key regional centres such as Roma, Toowoomba and Bundaberg.
We will also fund key roadworks in regional Queensland, including an investment of $4.6 million in the Carnarvon Highway between Injune and Rolleston.
Our housing market is showing the first signs of recovery and we have led the way in abolishing mortgage duty and stamp duty for first home buyers of homes up to $500,000.
We have targeted the first home owner grant to homes under $750,000 to ensure it goes to those who need the assistance.
10
This Budget also includes a new Regional First Home Owner Boost, an extra $4,000 on top of the existing state funded $7,000 First Home Owner Grant.
This boost brings to $11,000 the assistance provided by the state for those building new homes outside the south east corner.
The regions of Queensland helped build the Queensland of today.
We are a government that remains committed to the whole of Queensland, and this is a Budget that continues to deliver for regional Queensland.
CONCLUSION
Mr Speaker,
The Budget I present today is Queensland’s 150th Budget.
A century and a half ago the first Budget of Queensland catered for six hospitals and two schools. The total health and education budget allocations comprised about 3% of the expenditure.
Today I present a Budget for a Queensland with 184 hospitals and health facilities and 1250 schools, which sees nearly half of the entire budget allocated on health and education.
Today I present a Budget for a very different Queensland.
The modern Queensland reveals the change and dynamism that has been at the core of our development and our prosperity.
It’s not accidental, it’s required leadership throughout our 150 years.
That much hasn’t changed.
Now remains the hour for this Labor Government to lead from the front, like Labor Governments have proudly done throughout our nation’s history.
With the courage to change. With the capacity to endure.
And with our eyes firmly on the future….
… firmly on the future of working class kids getting the best start in life because we invested in kindies, in prep, and in reducing class sizes – not in dedicated coal track for coal companies who pay for their own in other states.
… firmly on the future of kids born profoundly deaf getting access to a cochlear implant to change their whole world and make everything possible again – not the future of a commercial timber business milling pine for woodchip.
11
... firmly on the future jobs for the next generation of Queenslanders as we invest in the State’s new industries and new technology to create the jobs of tomorrow and provide the ultimate dignity for the individual – work.
Mr Speaker,
We have made our choices. This Budget again reflects them. They are the choices of a Labor Government in the best traditions.
We are a proud government, determined to continue the legacy of Labor in building a modern Queensland.
We are a proud government – proud of our commitment to jobs and to the workers of Queensland.
Through the tumult of the last two years, we have put the dignity of work as the guiding light for our policies.
We put job protection and job generation front and centre, and put in place a strategy to deliver.
We are delivering: this Budget delivers on our commitments. On building an economic recovery and delivering a strong economy.
On generating jobs.
On building infrastructure for the future.
On sustainable growth for all of Queensland.
On funding the front-line services.
On working to provide assistance to Queensland families and a helping hand to those most in need.
And on preparing this great state for a future it can capture, not just a reprise of its history.
To endure and prosper always require change.
We are a government determined to change Queensland... for the future... for a better future.
I commend the Bills to the House.
12
This page has been left blank
By authority: S. C. Albury, Acting Government Printer, Queensland 2010
State Budget 2010–11
Budget Speech
Budget Paper No.1
www.budget.qld.gov.au

Queensland
Government
State Budget 2010-11
Budget Speech
Budget Paper No.1
www.budget.qld.gov.au

State Budget 2010–11
Budget Strategy and Outlook
Budget Paper No.2
Queensland Government
2010–11 State Budget Papers
1. Budget Speech
2. Budget Strategy and Outlook
3. Capital Statement
4. Budget Measures
5. Service Delivery Statements
Budget Highlights
This suite of Budget Papers is similar to that published in 2009–10.
The Budget Papers are available online at www.budget.qld.gov.au. They can be purchased through the Queensland Government Bookshop – individually or as a set – by phoning 1800 801 123 or at www.bookshop.qld.gov.au
© Crown copyright
All rights reserved
Queensland Government 2010
Excerpts from this publication may be reproduced, with appropriate acknowledgement, as permitted under the Copyright Act.
Budget Strategy and Outlook
Budget Paper No.2
ISSN 1445-4890 (Print)
ISSN 1445-4904 (Online)

STATE BUDGET
2010-11
BUDGET STRATEGY AND
OUTLOOK
Budget Paper No. 2
TABLE OF CONTENTS
| | | | | | |
| 1 | | Fiscal Strategy, Performance and Outlook | | | 1 | |
| | |
| | Fiscal Strategy | | | 3 | |
| | Path Back to Surplus | | | 6 | |
| | Fiscal Principles | | | 7 | |
| | Summary of Key Financial Aggregates | | | 12 | |
| | Budget Outcomes 2009-10 | | | 13 | |
| | Budget 2010-11 and Outyear Projections | | | 16 | |
| | Reconciliation of Net Operating Balance | | | 19 | |
| | |
| 2 | | Economic Performance and Outlook | | | 21 | |
| | |
| | External Environment | | | 22 | |
| | The Queensland Economy | | | 26 | |
| | |
| 3 | | Economic Strategy for a Growing and Ageing Population | | | 43 | |
| | |
| | Queensland’s Demographic Challenges | | | 44 | |
| | Long Term Economic Strategy | | | 51 | |
| | |
| 4 | | Revenue | | | 63 | |
| | |
| | Introduction | | | 64 | |
| | Changes in Revenue since the 2009-10 Budget | | | 66 | |
| | Revenue by Operating Statement Category | | | 68 | |
| | Taxation Revenue | | | 70 | |
| | Queensland’s Competitive Tax Status | | | 78 | |
| | Grants Revenue | | | 80 | |
| | Sales of Goods and Services | | | 83 | |
| | Interest Income | | | 85 | |
| | Dividend and Income Tax Equivalent Income | | | 85 | |
| | Other Revenue | | | 86 | |
| | | | | | |
| 5 | | Expenses | | | 89 | |
| | |
| | Introduction | | | 89 | |
| | Expenses by Operating Statement Category | | | 92 | |
| | Details of Expenses | | | 93 | |
| | Operating Expenses by Purpose | | | 97 | |
| | Departmental Expenses | | | 101 | |
| | |
| 6 | | Balance Sheet and Cash Flows | | | 105 | |
| | |
| | Introduction | | | 105 | |
| | Balance Sheet | | | 106 | |
| | Cash Flows | | | 112 | |
| | Reconciliation of Operating Cash Flows to the Operating Statement | | | 120 | |
| | |
| 7 | | Intergovernmental Financial Relations | | | 121 | |
| | |
| | Federal Financial Arrangements | | | 122 | |
| | Australian Government Payments for Specific Purposes | | | 125 | |
| | GST Revenue Payments | | | 131 | |
| | Other Commonwealth Payments | | | 138 | |
| | Health Reforms | | | 138 | |
| | Review of Australia’s Tax System | | | 141 | |
| | State-Local Government Financial Relations | | | 143 | |
| | |
| 8 | | Public Non-financial Corporations Sector | | | 145 | |
| | |
| | Prior Year Key Performance Indicators | | | 146 | |
| | Net Flows to Government | | | 152 | |
| | Asset Sales Program | | | 154 | |
| | Capital Structure Review | | | 156 | |
| | GOC Reporting Reforms | | | 157 | |
| | Implementation of GOC Reforms | | | 158 | |
| | Energy Sector | | | 161 | |
| | Transport Sector | | | 163 | |
| | Water Sector | | | 168 | |
| | | | | | |
| 9 | | Uniform Presentation Framework | | | 171 | |
| | |
| | Introduction | | | 171 | |
| | General Government Sector | | | 171 | |
| | Public Non-Financial Corporations Sector | | | 172 | |
| | Uniform Presentation Framework Financial Information | | | 174 | |
| | Reconciliation of Net Operating Balance to Accounting Operating Result | | | 184 | |
| | General Government Time Series | | | 185 | |
| | Other General Government UPF Data | | | 186 | |
| | Contingent Liabilities | | | 192 | |
| | Background and Interpretation of Uniform Presentation Framework | | | 193 | |
| | Sector Classification | | | 195 | |
| | Reporting Entities | | | 196 | |
| |
| Appendix A – Tax Expenditure Statement | | | 199 | |
| |
| Appendix B – Concessions Statements | | | 207 | |
| |
| Appendix C – Statement of Risks and Sensitivity Analysis | | | 215 | |
| 1 | FISCAL STRATEGY, PERFORMANCE AND OUTLOOK |
FEATURES
| • | | The forecast General Government net operating balance is expected to be a deficit of $287 million in 2009-10 compared to a forecast deficit of $2.351 billion at the time of the Mid Year Fiscal and Economic Review in December 2009 and $1.954 billion at the time of the 2009-10 Budget. |
| • | | The improvement in the forecast net operating balance across the forward estimates since the Mid Year Fiscal and Economic Review primarily reflects an improvement in global economic conditions and the resulting revisions to royalty and GST revenue. |
| • | | The improvement in the 2009-10 net operating balance is also due to the bring forward of Australian Government payments for transport projects, such as the Ipswich Motorway, with funding brought forward primarily from 2010-11. Australian Government funding for Gold Coast Rapid Transit, which had previously been considered to be an equity contribution, will now be received as a grant in 2009-10. |
| • | | Despite an improved revenue outlook, the General Government sector is forecast to incur a net operating deficit in 2010-11 ($1.745 billion), associated with the withdrawal of Australian Government stimulus payments. Improvements in the operating position are expected across each of the forward estimate years, with a return to surplus now projected in 2015-16. |
| • | | Cash deficits in the General Government sector are projected for each year across the forward estimates, reflecting the State’s significant capital program. |
| • | | The State’s 2010-11 capital program is an estimated $17.1 billion, a 1.2% decrease on 2009-10 estimated outlays. The capital outlays of Public Non-financial Corporations (commercial) sector entities constitute approximately 41% of total outlays in 2010-11. |
| | | | |
| | Budget Strategy and Outlook 2010-11 | | 1 |
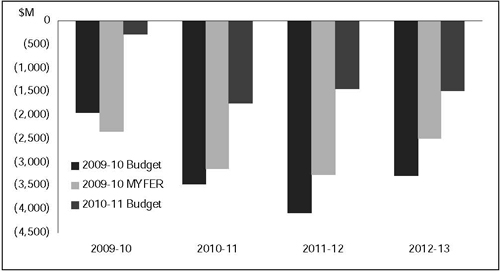
The operating balance expected for 2009-10 is a deficit of $287 million compared to a forecast deficit of $2.351 billion anticipated in the Mid Year Fiscal and Economic Review (MYFER). As identified in Table 1.1 below, the forecast General Government sector operating balances have improved across the forward estimates, with the forecast deficits more than halved from the 2009-10 Budget forecasts.
Table 1.1
General Government sector – revisions to net operating balance forecasts1
| | | | | | | | | | | | | | | | | | | | | | | | |
| | | 2008-09
$ million | | | 2009-10
$ million | | | 2010-11
$ million | | | 2011-12
$ million | | | 2012-13
$ million | | | 2013-14
$ million | |
2009-10 Budget | | | (574 | ) | | | (1,954 | ) | | | (3,459 | ) | | | (4,090 | ) | | | (3,290 | ) | | | n/a | |
2009-10 MYFER | | | 35 | | | | (2,351 | ) | | | (3,142 | ) | | | (3,264 | ) | | | (2,499 | ) | | | n/a | |
2010-11 Budget | | | 35 | | | | (287 | ) | | | (1,745 | ) | | | (1,442 | ) | | | (1,482 | ) | | | (1,395 | ) |
Chart 1.1 shows the forecast operating position at the 2009-10 Budget, 2009-10 MYFER and the 2010-11 Budget.
Chart 1.1
Revisions to net operating balance forecasts
| | | | |
| 2 | | Budget Strategy and Outlook 2010-11 | | |
FISCAL STRATEGY
While providing additional funding for high priority service needs, the 2010-11 Budget is firmly focussed on consolidating Queensland's financial position as the economy recovers. In particular, the 2010-11 Budget delivers a significant reduction in the State’s forecast borrowing levels, relative to MYFER projections, with projected borrowings to be further reduced on the completion of the asset sales program. This is critical in the current environment as international financial markets increasingly focus on the capacity of governments to meet their borrowing obligations.
The 2009-10 Budget introduced a number of structural budget reforms aimed at improving Queensland’s fiscal position to ensure the long term sustainability of the State’s finances. The total value of these initiatives, excluding asset sales, was estimated at around $5.4 billion over four years.
The Government also adopted a new fiscal strategy, setting out how it will restore Queensland’s traditionally strong financial position, while maintaining services and continuing to deliver its commitments to the community.
In building on the strong foundations established in the 2009-10 Budget, the 2010-11 Budget:
| • | | is consistent with the fiscal principles the Government committed to in the 2009-10 Budget, in particular prioritising funding to ensure that own-purpose expenditure grows at a slower rate than inflation and population growth, with own-purpose expenditure growth in 2009-10 of 3.74% being substantially below the real per capita constraint of 5% |
| • | | requires agencies to drive further efficiencies to support front line service delivery, such that the aggregate annual efficiency dividend from 2012-13 will reach about $400 million each year |
| • | | maintains a large capital program in 2010-11, to both boost productivity and support jobs as the economy gradually strengthens, but allows for a significant reduction in the size of the capital program across the forward estimates as private sector investment grows |
| • | | applies the majority of the forecast improvement in revenues, associated with a stronger economic outlook, to reducing deficits and borrowings. |
Queensland’s medium-term fiscal outlook has improved since the publication of the 2009-10 Budget. This reflects upward revisions to economic growth, both domestically and internationally, largely as a result of substantial monetary and fiscal stimulus, which reduced the severity and duration of the economic downturn. However, economic growth was below trend in 2008-09 and is expected to also be below trend in 2009-10 and 2010-11. As a result, economic activity has not returned to the same trajectory as prior to the global financial crisis, nor have Queensland’s revenues.
| | | | |
| | Budget Strategy and Outlook 2010-11 | | 3 |
While revenue is forecast to grow at a moderate rate across the forward estimates, the State’s key revenue streams of taxation, royalties and GST revenue continue to be impacted by the legacy of the global financial crisis. These revenues are expected to be $7.6 billion less than forecast in the 2008-09 Budget, contributing to the State’s ongoing operating deficits and borrowing requirements. Revenue forecasts are discussed in greater detail in Chapter 4.
Although the State’s fiscal and economic outlook has improved in the past 12 months, there is still a significant degree of uncertainty in regard to the strength and speed of recovery.
Within this context, the Government is committed to the infrastructure assets reform and sale program announced in June 2009, to protect the State’s capacity to deliver additional infrastructure in core government service delivery areas such as health, education and roads.
The asset sales package is designed to encourage the private sector to play a more active role in providing and funding the key economic infrastructure which is essential in promoting economic growth.
The sale program will deliver an estimated $15 billion in sale proceeds, and result in more than $10 billion in required capital investment being avoided. As is usual practice, the impact of the asset sales has not been factored into the Budget estimates, other than the sale of Forestry Plantations Queensland, the transaction for which has now been formally agreed.
Financial considerations of asset sales
The 2010-11 Budget focuses on supporting the continued delivery of key public infrastructure such as schools, hospitals and public transport, and the delivery of public services through these facilities.
The following chart shows the overall favourable impact the expected sale proceeds will have on one of the key credit rating ratios (net financial liabilities to revenue), after accounting for forgone revenue. Chart 1.2 indicates that, in the absence of asset sales, the ratio is expected to rise to above 130% in 2013-14. However, taking the asset sales program into account results in the projected ratio reaching 110% across the period. Ratings agencies have indicated that the 100-110% range is one of the criteria required for a reassessment of the State’s credit rating, along with a demonstration of a solid surplus operating position.
| | | | |
| 4 | | Budget Strategy and Outlook 2010-11 | | |
Chart 1.2
Net financial liabilities to revenue ratio, before and after asset sales
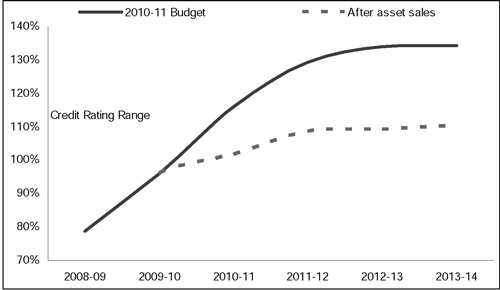
The program of asset sales will play an important role in funding the Government’s infrastructure program, reducing State debt and encouraging private sector provision of infrastructure. The sales are designed to realise value, reduce risk and obviate the need to further fund the significant ongoing capital requirements of these businesses, where the private sector can fund those requirements.
This will improve the strength of the State’s balance sheet and demonstrate to ratings agencies and financial markets the Government’s commitment to return the State to a solid fiscal position.
Further detail about the restructuring and disposal processes is provided in Chapter 8.
The 2009-10 Budget included a commitment from the Queensland Government to reduce the capital program to levels below $10 billion per year from 2013-14, and to identify further policy measures to improve productivity and reduce expenditure.
The 2010-11 Budget delivers on this commitment with:
| • | | the Non-financial Public Sector capital program forecast to trend down over the forward estimates to be $9.6 billion by 2013-14 |
| • | | further efficiency measures |
| • | | expenditure offset by savings and revenue measures where appropriate. |
| | | | |
| | Budget Strategy and Outlook 2010-11 | | 5 |
PATH BACK TO SURPLUS
Returning the Budget to surplus is a central element of the Government’s revised fiscal principles. A number of key initiatives established in the 2009-10 Budget, such as the 2.5% limit on public sector wage increases and the abolition of the Queensland Fuel Subsidy Scheme, underpin the projected return to surplus. However, a return to surplus depends on economic growth in the State as well as the policy decisions of Government.
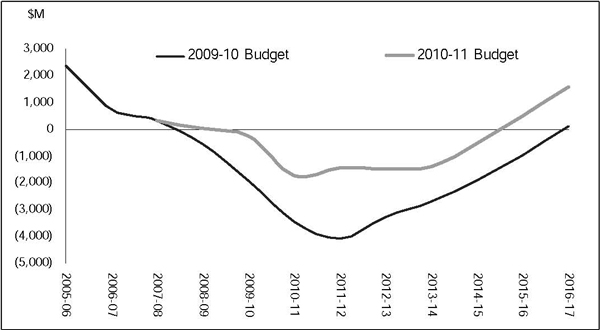
The fiscal principle relating to the General Government net operating balance requires the Government to achieve a General Government net operating surplus as soon as possible, but no later than 2015-16. Chart 1.3 below indicates the Government is now on track to achieve this goal by tracking solidly into surplus in 2015-16.
However, there remains a high degree of uncertainty about the pace and path of recovery. Queensland’s assumptions are for the operating deficit to peak in 2010-11, associated with the withdrawal of Australian Government stimulus payments, before improving across the forward estimates.
Chart 1.3
General Government Sector Net Operating Balance, 2005-06 to 2016-17
| | | | |
| 6 | | Budget Strategy and Outlook 2010-11 | | |
FISCAL PRINCIPLES
The Charter of Fiscal Responsibility outlines the Government’s fiscal principles and is an integral part of the Government’s commitment to the community. The fiscal principles were revised for the 2009-10 Budget and identified how the Government will restore Queensland’s traditionally strong financial position, while maintaining services and continuing to deliver its commitments to the community.
The fiscal principles of the Queensland Government are broadly based around three themes: fiscal sustainability; a competitive tax regime; and managing the State’s balance sheet.
The fiscal principles establish the basis for sustainability of the Government’s policies. They require services provided by Government be funded from tax and other revenue sources over the long term. The principles are supported by an accrual budgeting framework, which recognises future liabilities of the State and highlights the full cost of sustaining the Government’s operations on an ongoing basis.
The fiscal principles recognise the importance of a strong financial position for the State. A state government, because of its more limited tax base, does not have the same capacity as a national government to cushion economic and financial shocks. At the same time, state governments have a responsibility to provide continuity of services, such as health, police and education.
The Treasurer must report regularly to the Legislative Assembly on progress the Government has made against the outcomes stated in the Charter. This report will be tabled and published each year in the Budget papers, MYFER and Report on State Finances.
Fiscal sustainability
Governments must balance the cost of their activities with the revenues raised by taxation, royalties and income from business activities. It is not sustainable for governments to borrow to fund recurrent expenses, as the resultant interest costs and repayment of debt will be borne by future taxpayers, at the expense of other government services or through higher taxes.
However, capital investment benefits users and society more generally over the life of the asset. It can therefore be appropriate to borrow to fund capital investment, so that the costs of the investment are paid over the same time frame as the benefits are realised.
Principle
In the General Government sector, meet all operating expenses from operating revenue (where operating revenue is defined as total revenue from transactions and operating expenses are defined as total expenses from transactions less depreciation).
| | | | |
| | Budget Strategy and Outlook 2010-11 | | 7 |
In the current financial environment, with markets concerned about sovereign debt, fiscal discipline is critical. Until it achieves an operating surplus, growth in state own-purpose expenses (that is, excluding Commonwealth related expenses) will be limited to inflation and population growth.
Principle
Growth in own-purpose expenses in the General Government sector to not exceed real per capita growth.
Own-purpose expenditure growth of 3.74% is expected in 2009-10, substantially below the real per capita limit of 5%, reflecting the achievement of a number of measures introduced in the 2009-10 Budget, including public sector efficiency measures and the abolition of the Queensland Fuel Subsidy Scheme.
In 2010-11, own-purpose expenditure growth of 5.97% is anticipated, which is above the real per capita constraint of 5.25%. However, the estimated rate of growth in own-purpose expenses in 2010-11 is being impacted by anticipated spending to undertake reparation work associated with wide-scale flooding which occurred throughout Queensland in February and March 2010 and also one-off costs associated with the assets sale program. If spending associated with these events were excluded from the calculation, own-purpose expenditure in 2010-11 would be estimated to increase at a rate consistent with the real per capita constraint.
Over the period 2009-10 to 2013-14, own-purpose expenditure growth is expected to average 4.1%, compared with an expected real per capita limit of 5.1%. Further details on expenses projections are contained in Chapter 5.
Principle
Achieve a General Government net operating surplus as soon as possible, but no later than 2015-16.
This approach to expenses growth, together with allowing improvements in revenue forecasts to flow through to the bottom line, is aimed at achieving a net operating surplus in the General Government sector by 2015-16 and, depending on the strength of the recovery, possibly sooner.
| | | | |
| 8 | | Budget Strategy and Outlook 2010-11 | | |
Competitive tax regime
One of the Queensland Government’s key fiscal objectives is to maintain a competitive tax environment. While the Government will raise sufficient revenue to meet the service and infrastructure needs of the people of Queensland, it is important that business has a low cost environment, to promote economic development and jobs growth.
The competitiveness of a State’s tax system is usually assessed by using one of the following measures:
| • | | taxation revenue on a per capita basis |
| • | | taxation effort as assessed by the Commonwealth Grants Commission |
| • | | taxation revenue expressed as a percentage of gross state product (GSP). |
Queensland’s competitive tax position is confirmed on all three measures:
| • | | per capita tax collections in Queensland in 2010-11 are estimated at $2,225, compared with an estimated $2,643 for the average of the other states |
| • | | Commonwealth Grants Commission data indicate that Queensland’s taxation effort ratio was 86.9% of the standard for all states in 2008-09 |
| • | | Queensland’s tax collections were 3.64% of GSP in 2008-09, compared to 4.14% for the average of the other states. |
The 2010-11 Budget includes payroll tax and land tax measures. Details of these changes and other revenue items are provided in Chapter 4.
Principle
Maintain a competitive tax environment for business.
Managing the State’s balance sheet
The provision of adequate levels of infrastructure is an ongoing challenge for a state such as Queensland that continues to experience higher levels of economic and population growth than the national average over the long term. In meeting this challenge, the Government funds capital expenditure well above the average of the other states and territories, in per capita terms.
| | | | |
| | Budget Strategy and Outlook 2010-11 | | 9 |
As discussed above, given the current operating position Queensland funds its capital program substantially through borrowing, recognising the interest, operating and depreciation costs on the operating statement. While the balance sheet of the Queensland Government remains strong, the increased borrowing is expected to lead to an increase in the ratio of net financial liabilities1 to revenue, which is a measure used within financial markets to assess financial sustainability.
This ratio is expected to be 116% at the end of the 2010-11 financial year, which is lower than the forecast at the time of the MYFER. In the absence of asset sales, the ratio is projected to increase to above 130% by 2013-14. However, after completion of the asset sales program, it is expected to reach 110% by 2013-14. The 100-110% range has been identified by Standard and Poor’s as one of the trigger points for reassessment of the State’s credit rating.
Principle
Stabilise net financial liabilities as a proportion of revenue in the Non-financial Public sector.
Queensland has a long history of setting aside funds to accumulate financial assets sufficient to meet future liabilities, the largest being for future employee entitlements, in particular superannuation. Queensland is therefore better placed than other state governments to meet future accruing liabilities, as most other jurisdictions have substantial unfunded superannuation liabilities.
The State’s policy of setting aside funds to meet future liabilities and reinvesting all earnings provides the capacity to manage cycles in investment markets without affecting the Government’s ability to fund services to the community.
The most recent actuarial review, released in June 2008, found that accruing superannuation liabilities were fully funded. The State Actuary reviews the scheme every three years. Further information on balance sheet aggregates can be found in Chapter 6.
Principle
Target full funding of long-term liabilities such as superannuation in accordance with actuarial advice.
Table 1.2 provides an overview of the Government’s progress in meeting the fiscal principles.
| 1 | Net financial liabilities in this context is the term used by Standard & Poor’s ratings agency and differs from that used in the Uniform Presentation Framework tables in Chapter 9. |
| | | | |
| 10 | | Budget Strategy and Outlook 2010-11 | | |
Table 1.2
The fiscal principles of the Queensland Government
| | | | | | | | | | | | |
Principle | | Indicator | |
Fiscal sustainability | | | | | | | | | | | | |
| | | |
| | | | | | Operating
Revenue
($ million) | | | Operating expenses
less depreciation
($ million) | |
In the General Government sector, meet all operating expenses from operating revenue (where operating revenue is defined as total revenue from transactions and operating expenses are defined as total expenses from transactions less depreciation) | | | 2009-10 | | | | 39,689 | | | | 37,497 | |
| | | 2010-11 | | | | 40,606 | | | | 39,530 | |
| | | 2011-12 | | | | 41,938 | | | | 40,165 | |
| | | 2012-13 | | | | 43,453 | | | | 41,528 | |
| | | 2013-14 | | | | 45,298 | | | | 43,048 | |
| | | |
| | | Growth in: | | | Own purpose
expense | | | Inflation plus
population | |
| Growth in own-purpose expenses in the General Government sector to not exceed real per capita growth | | | 2009-10 | | | | 3.74 | % | | | 5.00 | % |
| | | 2010-11 | | | | 5.97 | % | | | 5.25 | % |
| | | 2011-12 | | | | 3.13 | % | | | 5.25 | % |
| | | 2012-13 | | | | 3.46 | % | | | 5.00 | % |
| | | 2013-14 | | | | 3.99 | % | | | 5.00 | % |
| | | Average | | | | 4.06 | % | | | 5.10 | % |
| |
| | | Net operating balance ($ million) | |
| Achieve a General Government net operating surplus as soon as possible, but no later than 2015-16 | | | 2009-10 | | | | (287) | |
| | | 2010-11 | | | | (1,745) | |
| | | 2011-12 | | | | (1,442) | |
| | | 2012-13 | | | | (1,482) | |
| | | 2013-14 | | | | (1,395) | |
Competitive tax regime | | | | | | | | | | | | |
| |
| | | Taxation revenue per capita, 2010-11 | |
| Maintain a competitive tax environment for business | | | Queensland: | | | | | | | $ | 2,225 | |
| |
| Average of other states
and territories: |
| | $ | 2,643 | |
Managing the State’s balance sheet | | | | | | | | | | | | |
| |
| | | Net Financial Liabilities/Revenue Non-financial Public Sector | |
| | | |
| | | | | | Before asset sales | | | After asset sales | |
| Stabilise net financial liabilities as a proportion of revenue in the Non-financial Public Sector | | | 2009-10 | | | | 96 | % | | | 96 | % |
| | | 2010-11 | | | | 116 | % | | | 102 | % |
| | | 2011-12 | | | | 129 | % | | | 109 | % |
| | | 2012-13 | | | | 134 | % | | | 109 | % |
| | | 2013-14 | | | | 134 | % | | | 110 | % |
| Target full funding of long-term liabilities such as superannuation in accordance with actuarial advice | |
| As at last actuarial review (released June
2008), accruing superannuation liabilities
were fully funded. The State Actuary
reviews the scheme every three years. |
|
| | | | |
| | Budget Strategy and Outlook 2010-11 | | 11 |
SUMMARY OF KEY FINANCIAL AGGREGATES
Table 1.3 provides aggregate actual outcome information for 2008-09, estimated actual outcome information for 2009-10, forecasts for 2010-11 and projections for the outyears.
Table 1.3
General Government sector – key financial aggregates1
| | | | | | | | | | | | | | | | | | | | | | | | |
| | | 2008-09
Actual2
$ million | | | 2009-10
Est. Act.
$ million | | | 2010-11
Budget
$ million | | | 2011-12
Projection
$ million | | | 2012-13
Projection
$ million | | | 2013-14
Projection
$ million | |
Revenue | | | 37,008 | | | | 39,689 | | | | 40,606 | | | | 41,938 | | | | 43,453 | | | | 45,298 | |
Expenses | | | 36,974 | | | | 39,976 | | | | 42,352 | | | | 43,380 | | | | 44,935 | | | | 46,693 | |
Net operating balance | | | 35 | | | | (287 | ) | | | (1,745 | ) | | | (1,442 | ) | | | (1,482 | ) | | | (1,395 | ) |
Cash surplus/(deficit) | | | (2,839 | ) | | | (5,254 | ) | | | (6,396 | ) | | | (4,648 | ) | | | (2,906 | ) | | | (1,507 | ) |
Capital purchases | | | 6,960 | | | | 8,626 | | | | 8,335 | | | | 7,490 | | | | 5,751 | | | | 4,628 | |
Net borrowing | | | 3,728 | | | | 5,182 | | | | 7,629 | | | | 6,733 | | | | 4,657 | | | | 3,191 | |
Gross borrowing | | | 10,278 | | | | 15,524 | | | | 23,250 | | | | 30,080 | | | | 34,756 | | | | 37,967 | |
Net worth | | | 184,619 | | | | 187,607 | | | | 188,564 | | | | 190,119 | | | | 192,017 | | | | 194,326 | |
Net debt | | | (19,281 | ) | | | (13,206 | ) | | | (6,743 | ) | | | (1,294 | ) | | | 2,095 | | | | 3,707 | |
Notes:
| 1. | Numbers may not add due to rounding. |
| 2. | Reflects published actuals. |
| | | | |
| 12 | | Budget Strategy and Outlook 2010-11 | | |
BUDGET OUTCOMES 2009-10
Key financial aggregates
Table 1.4
General Government sector – key financial aggregates1
| | | | | | | | | | | | |
| | | 2009-10
Budget $
million | | | 2009-10
MYFER
$ million | | | 2009-10
Est. Act.
$ million | |
Revenue | | | 37,192 | | | | 37,286 | | | | 39,689 | |
Expenses | | | 39,146 | | | | 39,637 | | | | 39,976 | |
Net operating balance | | | (1,954 | ) | | | (2,351 | ) | | | (287 | ) |
Cash surplus/(deficit) | | | (6,838 | ) | | | (7,363 | ) | | | (5,254 | ) |
Capital purchases | | | 9,270 | | | | 9,108 | | | | 8,626 | |
Net borrowing | | | 7,954 | | | | 6,722 | | | | 5,182 | |
Gross borrowing | | | 18,775 | | | | 17,063 | | | | 15,524 | |
Net worth | | | 151,144 | | | | 185,476 | | | | 187,607 | |
Net debt | | | (10,672 | ) | | | (11,566 | ) | | | (13,206 | ) |
Note:
| 1. | Numbers may not add due to rounding. |
Operating balance
The operating balance expected for 2009-10 is a deficit of $287 million compared to a deficit of $2.351 billion forecast in the MYFER. The improvement in the forecast net operating balance since the MYFER primarily reflects increased Australian Government payments, including funding for transport projects, such as the Ipswich Motorway, which has been brought forward, primarily from 2010-11. Australian Government funding for Gold Coast Rapid Transit, which had previously been considered to be an equity contribution, will now be received as a grant in 2009-10. There have also been upward revisions to royalty and GST revenue.
Expenses are also estimated to increase from the MYFER forecast primarily reflecting increased expenses associated with natural disaster recovery and relief and the provision of funding for the Townsville Marine Precinct, partly offset by lower depreciation expenses.
Further details on revenue and expenses projections are contained in Chapters 4 and 5 respectively.
Table 1.6 provides a reconciliation of the estimated net operating balance for 2009-10 to the MYFER forecast.
| | | | |
| | Budget Strategy and Outlook 2010-11 | | 13 |
Cash surplus/(deficit)
The General Government sector is now expected to record a lower cash deficit in 2009-10 of $5.254 billion compared to a $7.363 billion deficit forecast in the MYFER. The smaller than expected cash deficit is predominantly the result of the cash impact of the improvement in the net operating balance in 2009-10 and lower than anticipated capital purchases.
Capital purchases
General Government purchases of non-financial assets (that is, capital expenditure) in 2009-10 are estimated to be $8.626 billion. This is $482 million less than forecast in the MYFER due to changes in timing of cashflows for capital projects and delays associated with poor weather conditions.
The total capital program for 2009-10, including capital grants, is expected to be $17.307 billion, $893 million lower than expected at the time of the 2009-10 Budget. For further details see Budget Paper 3 – Capital Statement.
Borrowing
Net borrowings (additional borrowings each year as itemised in the Cash Flow Statement) of $5.182 billion are expected in 2009-10, $1.54 billion less than forecast in the MYFER and $2.772 billion less than forecast in the 2009-10 Budget, associated with the reduction in the cash deficit.
Similarly, gross borrowings (the stock of borrowings outstanding as stated in the Balance Sheet) of $15.524 billion are estimated at 30 June 2010, $1.539 billion less than the MYFER estimate, reflecting the improvement in the 2009-10 net cash balance since that time.
Net worth
The net worth, or equity, of the State is the amount by which the State’s assets exceed its liabilities. This is the value of the investment held on behalf of the people of Queensland by public sector entities.
The net worth of the General Government sector at 30 June 2010 is estimated at $187.6 billion. This is $36.5 billion higher than the forecast in the 2009-10 Budget, primarily due to the value of land under roads being included in the net worth calculation in June 2009 for the first time, in accordance with accounting standard AASB 1051 Land Under Roads.
| | | | |
| 14 | | Budget Strategy and Outlook 2010-11 | | |
Net worth is $2.988 billion higher than the 30 June 2009 audited actual and $2.131 billion higher than the net worth forecast at the time of the MYFER due to market value fluctuations, including those relating to investment returns on superannuation and other long term assets now held by Queensland Treasury Corporation.
Net debt
Net debt is the sum of advances received and borrowings less cash and deposits, advances paid and investments, loans and placements.
Net debt in the General Government sector at 30 June 2010 is estimated to be negative $13.206 billion, compared to negative $11.566 billion forecast at the time of the MYFER. The stronger position reflects the impact of lower borrowings.
| | | | |
| | Budget Strategy and Outlook 2010-11 | | 15 |
BUDGET 2010-11 AND OUTYEAR PROJECTIONS
Key financial aggregates
Table 1.5
General Government sector – key financial aggregates1
| | | | | | | | | | | | | | | | |
| | | 2010-11
Budget $
million | | | 2011-12
Projection
$ million | | | 2012-13
Projection
$ million | | | 2013-14
Projection
$ million | |
Revenue | | | 40,606 | | | | 41,938 | | | | 43,453 | | | | 45,298 | |
Expenses | | | 42,352 | | | | 43,380 | | | | 44,935 | | | | 46,693 | |
Net operating balance | | | (1,745 | ) | | | (1,442 | ) | | | (1,482 | ) | | | (1,395 | ) |
Cash surplus/(deficit) | | | (6,396 | ) | | | (4,648 | ) | | | (2,906 | ) | | | (1,507 | ) |
Capital purchases | | | 8,335 | | | | 7,490 | | | | 5,751 | | | | 4,628 | |
Net borrowing | | | 7,629 | | | | 6,733 | | | | 4,657 | | | | 3,191 | |
Gross borrowing | | | 23,250 | | | | 30,080 | | | | 34,756 | | | | 37,967 | |
Net worth | | | 188,564 | | | | 190,119 | | | | 192,017 | | | | 194,326 | |
Net debt | | | (6,743 | ) | | | (1,294 | ) | | | 2,095 | | | | 3,707 | |
Note:
| 1. | Numbers may not add due to rounding. |
Operating balance
Significant upward revisions to royalty and GST revenues have resulted in a substantial improvement in the fiscal position since the MYFER. However, the General Government sector is still expected to record an operating deficit of $1.745 billion in 2010-11, with net operating deficits anticipated each year across the forward estimate years.
The improvement in the net operating balance reflects an improvement in the Australian Government’s estimates of GST collections and a stronger outlook for coal prices and tonnages. There is a modest improvement anticipated in taxation revenue.
The increase in expenditure relative to 2009-10 mainly relates to service enhancements in key service delivery areas including Australian Government partnerships, increases in wages, reflecting enterprise bargaining agreements and increased frontline service delivery staff, as well as higher levels of depreciation and interest expenses.
Further details on revenue and expenditure projections are contained in Chapters 4 and 5 respectively.
| | | | |
| 16 | | Budget Strategy and Outlook 2010-11 | | |
Cash surplus/(deficit)
A cash deficit of $6.396 billion is expected in 2010-11 for the General Government sector, reducing to $1.507 billion by 2013-14. The cash deficits reflect the Government’s significant planned capital program, with cash deficits forecast to decrease across the forward estimates, consistent with the planned reduction in the size of the capital program over time.
The reduction in the 2010-11 cash deficit since the MYFER primarily reflects the improved net operating balance and the receipt of proceeds from the sale of Forestry Plantations Queensland.
Capital purchases
Total General Government capital purchases of $8.335 billion are budgeted for 2010-11, $546 million lower than forecast in the MYFER. Budget Paper 3 – Capital Statement provides details of budgeted 2010-11 capital outlays, by portfolio.
Over the period 2010-11 to 2013-14, purchases of non-financial assets (capital purchases) in the General Government sector of $26.204 billion are planned.
Borrowing
Net borrowings of $7.629 billion are budgeted for 2010-11, a decrease of $2.319 billion compared to the MYFER estimate, mainly as a result of the improvement in the operating position and the receipt of proceeds from the sale of Forestry Plantations Queensland.
The reduction in the amount of borrowings required in 2010-11 leads to a decrease in borrowing costs of $129 million to $1.242 billion, compared to the MYFER forecast.
Gross borrowings of $23.25 billion are expected in the General Government sector at 30 June 2010, $3.803 billion less than forecast in the MYFER.
Total General Government borrowings in 2012-13 are expected to be $4.478 billion lower than forecast in the 2009-10 Budget and $3.518 billion lower than forecast in the MYFER. The comparable figures for the Non-financial Public Sector are a reduction in forecast borrowings of $6.548 billion relative to the 2009-10 Budget forecast and a $5.8 billion reduction compared with the MYFER forecast.
Over the Budget and forward estimates period, total General Government borrowings and advances of $22.154 billion are planned, with gross borrowings projected to increase to $37.967 billion and borrowing costs to $2.341 billion in 2013-14. However, these projections do not take into account the proceeds that will be realised from the remainder of the asset sales program, which will substantially reduce the borrowing requirements of the General Government and Public Non-financial Corporations Sectors (see Chart 1.2).
| | | | |
| | Budget Strategy and Outlook 2010-11 | | 17 |
Net worth
State net worth is forecast to be $188.6 billion at 30 June 2011, with moderate increases in net worth expected each year, reaching $194.3 billion by the end of 2013-14.
Net debt
Net debt in the General Government sector at 30 June 2011 is estimated to be negative $6.743 billion compared to the MYFER estimate of negative $2.964 billion. This improvement in the net debt position primarily reflects the General Government sector’s lower borrowing requirements as a result of improvements in the net operating balance. Net debt is expected to increase over the forward estimates to be $3.707 billion in 2013-14 reflecting planned increases in borrowings, although this projection does not factor in the proceeds of the asset sales program, other than Forestry Plantations Queensland.
More information on the State’s net worth, assets and liabilities is provided in Chapter 6.
| | | | |
| 18 | | Budget Strategy and Outlook 2010-11 | | |
RECONCILIATION OF NET OPERATING BALANCE
Table 1.6 provides a reconciliation of the current General Government sector net operating balances for 2009-10 and 2010-11 to the MYFER forecasts.
Table 1.6
Reconciliation of 2009-10 and 2010-11 net operating balance to MYFER1
| | | | | | | | |
| | | 2009-10
Est. Act.
$ million | | | 2010-11
Budget
$ million | |
2009-10 MYFER net operating balance | | | (2,351 | ) | | | (3,142 | ) |
Expenditure policy decisions2 | | | (215 | ) | | | (440 | ) |
Asset sales transaction costs | | | (18 | ) | | | (121 | ) |
Taxation revenue revisions | | | 79 | | | | 91 | |
Royalty revenue revisions | | | 405 | | | | 1,323 | |
GST revenue revisions | | | 403 | | | | 831 | |
Other significant variations impacting on operating balance | | | | | | | | |
Other Australian Government funding revisions3 | | | 1,362 | | | | (87 | ) |
Natural disaster relief expenditure | | | (237 | ) | | | (473 | ) |
Net flows from PNFC sector entities4 | | | (23 | ) | | | (172 | ) |
Actuarial revisions5 | | | 29 | | | | 26 | |
Other parameter adjustments6 | | | 279 | | | | 419 | |
2010-11 Budget | | | (287 | ) | | | (1,745 | ) |
Notes:
| 1. | Denotes impact on net operating balance. Numbers may not add due to rounding. |
| 2. | Reflects expenditure policy decisions taken since the MYFER, net of revenue offsets, the additional efficiency dividend and Australian Government funding where appropriate. Budget Paper 4 – Budget Measures outlines in detail the policy decisions taken since the 2009-10 Budget. |
| 3. | Represents the net impact of funding provided by the Australian Government primarily for Specific Purpose Payments, National Partnership Payments and the Nation Building and Jobs Plan. The bring forward of funding for the Ipswich Motorway results in an increase in Australian Government funding in 2009-10 and a reduction in 2010-11. |
| 4. | Represents revisions to dividend receipts from and community service obligation payments to Public Non-financial Corporations. |
| 5. | Represents actuarial revisions to superannuation and long service leave provisions and revisions to superannuation expense as a result of positive investment returns. |
| 6. | Refers to adjustments of a non-policy nature, primarily associated with reductions in depreciation and interest expenses. |
| | | | |
| | Budget Strategy and Outlook 2010-11 | | 19 |
| 2 | ECONOMIC PERFORMANCE AND OUTLOOK |
FEATURES
| • | | The global economy resumed growing in the second half of 2009, after experiencing the most severe and synchronised recession since the Great Depression. While advanced economies are expected to exhibit a modest recovery, the outlook is supported by strong prospects in non-Japan Asia. |
| • | | While the global financial crisis slowed growth in Queensland’s gross state product (GSP) to 1.4% in 2008-09, its weakest rate since 1990-91, economic growth is estimated to improve to 3% in 2009-10, with resilient demand from China boosting coal exports, and public stimulus helping to offset a decline in business investment. |
| • | | Economic growth is forecast to strengthen further, to 3 3/4% in 2010-11, reflecting ongoing investment in the resources sector. Dwelling investment is anticipated to pick up, in response to rising house prices. However, elevated household debt levels and rising interest rates are expected to result in below average growth in private consumption and overall economic activity. |
| • | | Growth in the State economy is forecast to accelerate to its long-run average of 4 1/2% in 2011-12, as improved credit conditions underpin a recovery in commercial and medium-to-high density residential construction, and investment activity related to major resource projects gathers momentum. |
| • | | Weaker private sector demand is estimated to slow jobs growth to 3/4% in 2009-10 and increase the year-average unemployment rate to 5 3/4%. However, reflecting the flexibility of the labour market, this would represent a peak below previous downturns and an unemployment rate below the historic average of around 7%. |
| • | | In line with stronger economic growth, jobs growth is forecast to accelerate to 2 3/4% in 2010-11 and 3 1/4% in 2011-12, reducing the year-average unemployment rate to 5 1/4% by 2011-12. |
| • | | However, significant risks to the global economic outlook remain. In particular, concerns over sovereign debt in Europe have highlighted the fragility of sentiment and heightened financial market volatility. |
This chapter presents the economic context within which the 2010-11 State Budget has been prepared. It overviews developments in Queensland’s external environment, including the recovery in global economic activity following the financial crisis, and the national outlook. This chapter summarises the economic performance of, and outlook for, Queensland over 2009-10 to 2013-14. It provides estimates for 2009-10 and forecasts for 2010-11 and 2011-12 for detailed sectors of the economy and presents projections for key economic variables to 2013-14. The chapter also outlines key risks to economic growth over the forecast period.
| | | | |
| | Budget Strategy and Outlook 2010-11 | | 21 |
EXTERNAL ENVIRONMENT
International conditions
The world economy resumed growing in the second half of 2009, after experiencing the most severe and synchronised contraction since the Great Depression. An unprecedented degree of expansionary monetary and fiscal stimulus, improvements across equity and corporate debt markets and a turnaround in the inventory cycle in many countries have supported the recovery so far. However, there is a marked difference in the pace of recovery across regions, with the emerging economies forecast to continue to outperform advanced economies.
After contracting by an estimated 1 1/4% in 2009, Queensland’s major trading partner economies are forecast to grow by 4 1/4% in 2010 and 3 3/4% in 2011, before returning to long-run growth of 4% per annum between 2012 and 2014 (see Table 2.1). However, this would represent growth slightly below the 4 1/2% per annum averaged between 2004 and 2007. While non-Japan Asia is forecast to grow at a strong pace of 6 3/4% in 2010 and 6% in 2011, growth in advanced economies, particularly Europe, is expected to be subdued.
Emerging Asia was less affected by the global financial crisis than advanced economies, partly because their financial markets were less exposed to the deterioration in mortgage backed securities and other derivatives. Also, relatively stronger fiscal positions in some economies enabled governments to respond to weaker economic conditions with large fiscal stimulus. Domestic demand in China and India, the largest emerging economies in Asia, and Queensland’s second and third largest merchandise export markets, remained robust through the crisis. These factors resulted in estimated growth of 2 1/2% in non-Japan Asia in 2009. Most economies in this region had returned to pre-crisis peaks in activity by the end of 2009 and are now expanding at or near pre-crisis rates.
Table 2.1
Queensland major trading partner GDP outlook
(annual % change)
| | | | | | | | | | | | | | | | | | | | | | | | |
| | | Est. Act
2009 | | | Forecasts | |
| | | 2010 | | | 2011 | | | 2012 | | | 2013 | | | 2014 | |
World¹ | | | 1/2 | | | | 4 1/4 | | | | 4 1/4 | | | | 4 1/2 | | | | 4 1/2 | | | | 4 1/2 | |
Major trading partners² | | | -1 1/4 | | | | 4 1/4 | | | | 3 3/4 | | | | 4 | | | | 4 | | | | 4 | |
Non-Japan Asia | | | 2 1/2 | | | | 6 3/4 | | | | 6 | | | | 6 | | | | 6 | | | | 6 | |
Japan | | | -5 1/4 | | | | 2 1/2 | | | | 1 3/4 | | | | 2 | | | | 1 3/4 | | | | 1 3/4 | |
Europe | | | -4 | | | | 1 1/4 | | | | 1 3/4 | | | | 2 | | | | 2 | | | | 2 | |
US | | | -2 1/2 | | | | 3 1/4 | | | | 3 | | | | 2 1/2 | | | | 2 1/2 | | | | 2 1/2 | |
Notes:
| 1. | Sourced from the April 2010 IMF World Economic Outlook database. World GDP comprises 183 countries, weighted by purchasing-power-parity GDP. |
| 2. | Queensland’s major trading partner output comprises 31 countries, weighted by their share of merchandise exports in the three years to 2007-08. |
Sources: International Monetary Fund, Consensus Economics and Queensland Treasury.
| | | | |
| 22 | | Budget Strategy and Outlook 2010-11 | | |
The outlook for emerging Asia remains strong (see Chart 2.1). In the near term, household consumption is expected to be supported by high asset values, buoyant sentiment and employment growth, while improving rates of capacity utilisation should boost capital investment. Against this backdrop, and with inflation pressures building somewhat, the monetary authorities of China and India began unwinding monetary policy support in early 2010. Nevertheless, these measures should sustain longer term growth prospects. Furthermore, ongoing urbanisation and industrialisation in China and India are expected to increase their demand for imports and therefore support growth in other non-Japan Asian economies, including Australia and Queensland.
In contrast, the recovery in capital investment in advanced economies continues to be suppressed by excess capacity, while ongoing bank deleveraging and risk aversion have constrained financing and elevated credit costs. Private capital investment in December quarter 2009 was more than 20% below pre-crisis levels in the US, Japan and the UK and 15% below the pre-crisis peak in the Eurozone. Meanwhile, impaired household balance sheets, and relatively subdued growth in household incomes due to soft labour market conditions, are expected to remain a drag on consumer spending in coming years. Over eight million jobs have been shed in the US, around four million in the Eurozone, around one and a half million in Japan and one million in the UK.
Chart 2.1
Economic outlook for major trading partners, 2010 - 2014
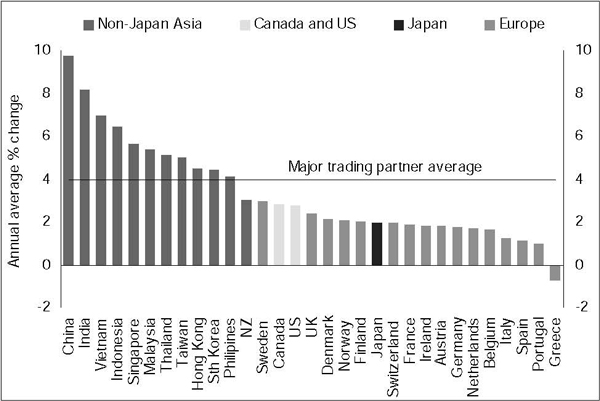
Sources: International Monetary Fund, Consensus Economics and Queensland Treasury.
| | | | |
| | Budget Strategy and Outlook 2010-11 | | 23 |
The recovery in Japan and Europe is expected to be particularly slow, with the pre-crisis peak in output of these two economies not forecast to be reached until 2012. In Japan, Queensland’s largest market for overseas merchandise exports, economic growth has been constrained by a strong Yen exchange rate, which has stymied the recovery of Japan’s export sector and contributed to renewed deflation.
Importantly, the sovereign debt crisis in Europe has clouded the outlook for advanced economies. The earlier stage of the global financial crisis prompted governments to boost economic activity by expanding fiscal policy. However, the resulting increase in expenditure and decrease in revenue has compounded existing structural deficits and elevated debt levels of many economies. Financial markets have thus shifted concerns from private sector debt toward public sector debt. Consequently, risk premiums on government debt have risen significantly in countries perceived to have unsustainable debt paths, particularly across Europe. In May 2010, the 10-year bond yield premium on government debt relative to German 10-year Bunds touched multi-decade highs in Greece, Spain, Ireland and Portugal (see Chart 2.2).
Austerity programs aimed at lowering public debt have become a greater priority for many advanced economy governments. The US Congressional Budget Office forecasts persistent US budget deficits over the period to 2020. A shift to tighter fiscal policy would act to subdue growth in advanced economies and is another factor that will see this group underperform relative to emerging economies over the forecast period.
Chart 2.2
10-year bond yield premiums in Europe¹
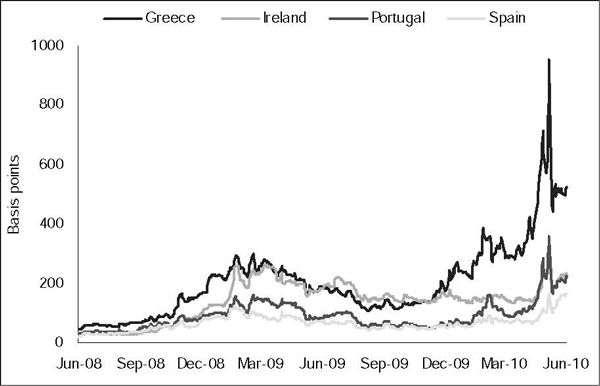
Note:
| 1. | Measured by 10-year government bond yields for the relevant economy less 10-year government bond yields of Germany. |
Sources: DataStream and Queensland Treasury.
| | | | |
| 24 | | Budget Strategy and Outlook 2010-11 | | |
Australian economy
The Australian economy slowed significantly during the global downturn, but performed better than most other advanced economies as a result of strong commodity demand from China and substantial domestic fiscal and monetary policy stimulus. Australian Treasury estimates gross domestic product (GDP) growth of 2% in 2009-10 and forecasts it strengthening to 3 1/4% in 2010-11 and 4% in 2011-12. Faster economic growth is forecast to be driven by stronger private final demand, which will more than offset the phasing-out of fiscal stimulus.
Rising global resource demand is anticipated to see Australia’s terms of trade surge in 2010-11 (see Chart 2.3), providing a significant boost to domestic incomes. According to Australian Government Budget papers, Australian Treasury expects that this will result in resource investment which, combined with improved business confidence and credit conditions, is expected to drive a recovery in business investment over the next two years. Growth in household consumption is also forecast to improve, as household wealth recovers much of its earlier losses, and is supported by improved labour market conditions and consumer confidence. Dwelling investment growth is forecast to strengthen, driven by solid population growth, rising incomes and low vacancy rates, but tempered by higher mortgage interest rates.
Chart 2.3
Contributions to gross domestic product1,2, and the terms of trade2 , Australia
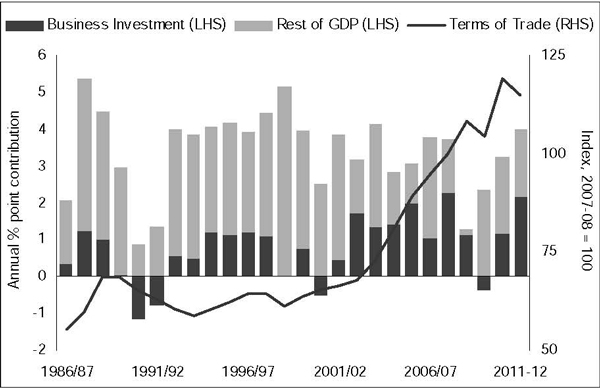
Notes:
| 1. | Chain Volume Measure (CVM), 2007-08 reference year. |
| 2. | 2009-10 is an estimated actual, 2010-11 and 2011-12 are forecasts. |
Sources: ABS 5206.0 and Australian Government 2010-11 Budget.
| | | | |
| | Budget Strategy and Outlook 2010-11 | | 25 |
While exports growth is expected to strengthen in 2010-11 and 2011-12, stronger domestic demand will drive faster imports growth, resulting in net exports detracting from overall economic growth in both years.
Employment is forecast to increase 2 1/4% over the year to June quarter 2011, reducing the unemployment rate from 5 1/4% in June quarter 2010 to 5% in June quarter 2011. Solid jobs growth and a stable participation rate in 2011-12 are expected to result in the unemployment rate edging down to 4 3/4% by June quarter 2012.
With the economy expected to return to potential by 2011-12, Australian Treasury has assumed that growth in real GDP will return to its trend rate of 3% for the 2012-13 to 2013-14 projection period.
THE QUEENSLAND ECONOMY
External assumptions
Forecasts for economic growth in Queensland are based on a number of assumptions about the national economy, trading partners and financial markets.
| • | | After contracting by an estimated 1 1/4% in 2009, Queensland’s major trading partner economies are assumed to grow by 4 1/4% in 2010, reflecting stronger growth in non-Japan Asia. However, with the recovery in advanced economies expected to be sluggish, major trading partners are assumed to grow 3 3/4% in 2011 and 4% in 2012. |
| • | | Monetary policy is expected to tighten slightly, with futures markets pricing in at least one further rise in the official interest rate by late-2011. |
| • | | The Australian dollar (A$) recovered through 2009, as the commodity price outlook improved, but eased sharply in May 2010 as concerns over European sovereign debt increased. The A$ is assumed to average around US88c during 2009-10, then depreciate slightly over the forecast period. |
| • | | After recovering steadily since March 2009, oil prices are expected to average around US$75 per barrel, as world economic growth returns to around its long run rate over the forecast period. |
| • | | Floods and cyclones in early 2010 have been factored into estimates of commodity and tourism exports in 2009-10 and 2010-11. Seasonal conditions are assumed to return towards normal from 2010-11 onwards. |
| • | | National forecasts and projections, as outlined in the Australian Budget delivered on 11 May 2010, have been adopted as the basis for national economic performance. |
Risks and opportunities associated with some of these assumptions are discussed later in this chapter.
| | | | |
| 26 | | Budget Strategy and Outlook 2010-11 | | |
Summary of economic outlook
Growth in Queensland’s GSP slowed to 1.4% in 2008-09, its lowest rate since 1990-91, reflecting the impact of the global financial crisis on consumer and investor confidence, household wealth and export demand. Growth is estimated to strengthen to 3% in 2009-10, largely due to resilient demand from Asia boosting coal exports and public sector stimulus, with private demand contracting. Although risks to the outlook remain, overall economic growth is forecast to improve to 3 3/4% in 2010-11, benefitting from further investment in the resources sector. However, this would still represent below average growth, reflecting the household sector’s ongoing adjustment to higher interest rates. Growth in the State economy is forecast to accelerate to 4 1/2% in 2011-12, as improved credit conditions support a more broad-based recovery in dwelling and business investment (see Chart 2.4).
Chart 2.4
Growth in gross state/domestic product1
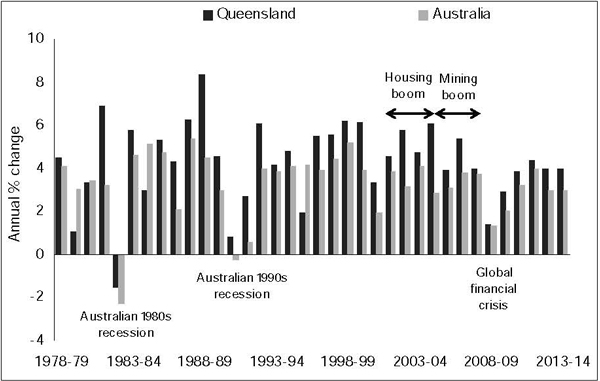
Note:
| 1. | CVM, 2007-08 reference year. 2009-10 is an estimated actual, 2010-11 and 2011-12 are forecasts, 2012-13 and 2013-14 are projections. |
Sources: ABS 5206.0, Australian Government 2010-11 Budget and Queensland Treasury.
Queensland’s economic growth is estimated to strengthen in 2009-10, largely due to a recovery in the trade sector and public sector stimulus (see Chart 2.5). Export growth is estimated to reach 6 3/4%, reflecting China’s increased demand for coal imports and a turnaround in interstate tourism due to improving national conditions. Strong growth in public final demand is estimated to contribute 1 1/2 percentage points to overall economic growth in 2009-10, partly due to the State’s own significant capital works program as well as federal infrastructure initiatives.
| | | | |
| | Budget Strategy and Outlook 2010-11 | | 27 |
Growth in these sectors is estimated to more than offset a decline in private demand in 2009-10. Business investment is expected to fall by 16 1/2%, as tight credit conditions weigh on commercial property and a subdued recovery in business confidence limits machinery and equipment investment. Household consumption growth is estimated to slow to a rate slightly weaker than population growth, in response to previous falls in dwelling investment and weaker growth in employment and wages.
A recovery in private demand is forecast to strengthen economic growth to 3 3/4% in 2010-11. Business investment is forecast to rise 9 1/2%, reflecting further investment in the resource sector, while dwelling investment is anticipated to pick up, in response to rising house prices. Exports growth is expected to remain strong in 2010-11, with a broad-based global recovery seeing further growth in coal exports and a rebound in other mineral exports. Improved growing conditions are anticipated to benefit rural exports. With contract prices for coal and base metal prices improving, export incomes are forecast to recover in 2010-11. Private consumption growth is forecast to improve in line with stronger jobs growth and a recovery in asset prices. However, elevated household debt levels and rising interest rates are expected to weigh on disposable income growth, leaving growth in consumption and overall economic activity below average in 2010-11.
Chart 2.5
Contributions to growth in Queensland’s gross state product1
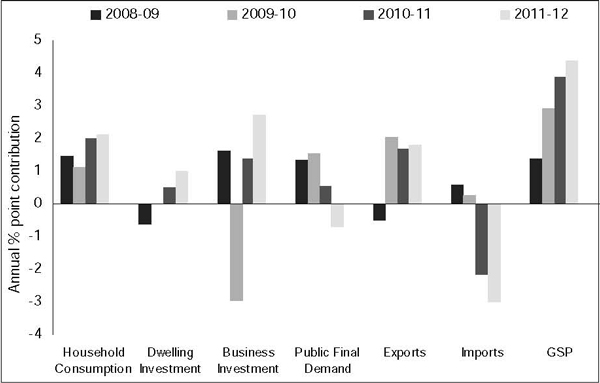
Note:
| 1. | CVM, 2007-08 reference year. 2009-10 is an estimate and 2010-11 and 2011-12 are forecasts. |
Source: Queensland Treasury.
| | | | |
| 28 | | Budget Strategy and Outlook 2010-11 | | |
After a four-year period of below average growth, economic growth is forecast to accelerate to its long-run rate of 4 1/2% in 2011-12. Improved labour market conditions should strengthen growth in consumer spending. Stronger household demand, along with better credit conditions, should see commercial construction in office property and retail space recover, while mining investment should benefit further from the development of the liquefied natural gas (LNG) sector by this time. In line with an acceleration in private investment, public investment is scheduled to be scaled back, as federal fiscal stimulus is withdrawn and the State’s capital program is unwound from the record levels that supported the economy during the recent slowdown.
Economic growth is projected to average 4% in 2012-13 and 2013-14 (see Table 2.2), with broad-based growth in investment activity largely offsetting some further fiscal consolidation. Following a period of household balance sheet adjustment to higher interest rates, consumer spending growth is projected to return toward its long-run rate. Capacity expansions in the domestic resources sector, combined with solid major trading partner growth, should also bolster exports growth over the projection period.
Reflecting weak private sector demand, jobs growth is estimated to slow to 3/4% in 2009-10, a rate below labour force growth. As a result, the year-average unemployment rate is estimated to rise to 5 3/4% this financial year, with the trend monthly unemployment rate peaking at 6.0% in October 2009. However, this year-average result would represent a peak well below previous downturns and an unemployment rate still below the historic average. In line with stronger economic growth, jobs growth is forecast to accelerate to 2 3/4% in 2010-11 and 3 1/4% in 2011-12, reducing the year-average unemployment rate to 5 1/4% by 2011-12.
| | | | |
| | Budget Strategy and Outlook 2010-11 | | 29 |
Table 2.2
Economic forecasts/projections1
(annual % change)
| | | | | | | | | | | | | | | | | | | | | | | | |
| | | Outcome | | | Est. Act. | | | Forecasts | | | Projections | |
| | | 2008-09 | | | 2009-10 | | | 2010-11 | | | 2011-12 | | | 2012-13 | | | 2013-14 | |
Queensland | | | | | | | | | | | | | | | | | | | | | | | | |
Gross state product2 | | | 1.4 | | | | 3 | | | | 3 3/4 | | | | 4 1/2 | | | | 4 | | | | 4 | |
Employment | | | 2.2 | | | | 3/4 | | | | 2 3/4 | | | | 3 1/4 | | | | 2 3/4 | | | | 2 3/4 | |
Unemployment rate | | | 4.4 | | | | 5 3/4 | | | | 5 1/2 | | | | 5 1/4 | | | | 5 | | | | 5 | |
Inflation | | | 3.7 | | | | 2 3/4 | | | | 3 | | | | 3 | | | | 2 3/4 | | | | 2 3/4 | |
Wage Price Index | | | 4.2 | | | | 3 1/4 | | | | 3 1/2 | | | | 3 3/4 | | | | na | | | | na | |
Population | | | 2.8 | | | | 2 1/4 | | | | 2 1/4 | | | | 2 1/4 | | | | 2 1/4 | | | | 2 1/4 | |
Australia | | | | | | | | | | | | | | | | | | | | | | | | |
Gross domestic product2 | | | 1.3 | | | | 2 | | | | 3 1/4 | | | | 4 | | | | 3 | | | | 3 | |
Employment3 | | | 0.1 | | | | 2 1/2 | | | | 2 1/4 | | | | 2 | | | | 1 1/2 | | | | 1 3/4 | |
Unemployment rate4 | | | 5.7 | | | | 5 1/4 | | | | 5 | | | | 4 3/4 | | | | 5 | | | | 5 | |
Inflation5 | | | 1.5 | | | | 3 1/4 | | | | 2 1/2 | | | | 2 1/2 | | | | 2 1/2 | | | | 2 1/2 | |
Wage Price Index3 | | | 3.8 | | | | 2 3/4 | | | | 3 3/4 | | | | 4 | | | | na | | | | na | |
Population6 | | | 2.2 | | | | 2 | | | | 1 3/4 | | | | 1 1/2 | | | | 1 1/2 | | | | 1 1/2 | |
Notes:
| 1. | Decimal point figures indicate an actual outcome. na - indicates not available. |
| 2. | CVM, 2007-08 reference year. |
| 3. | Seasonally adjusted growth through-the-year to the June quarter. |
| 4. | Seasonally adjusted estimate for the June quarter. |
| 5. | Through-the-year growth to the June quarter. |
| 6. | Through-the-year growth to 31 December. |
Sources: ABS 6401.0, 6345.0, 6202.0, Queensland Treasury and 2010-11 Australian Government Budget.
Household consumption
The impact of the global financial crisis on asset prices and confidence caused household consumption growth to slow to 2.7% in 2008-09. Growth in consumer spending is estimated to remain subdued at 2% in 2009-10, supported by population growth, but representing the weakest rate of growth in more than a decade (see Chart 2.6).
Modest growth in consumption in 2009-10 reflects a weakening in disposable income growth, due to slower growth in both employment and wages, as well as the passing of the boost to household incomes from federal stimulus payments in 2008-09. A decline in dwelling investment in 2008-09 also lowered spending on household furnishings and equipment, as well as some household services, in the first half of 2009-10. Higher household debt levels in an environment of rising interest rates have also affected discretionary spending, particularly on clothing and footwear and recreational and cultural activities.
| | | | |
| 30 | | Budget Strategy and Outlook 2010-11 | | |
Household consumption growth is forecast to strengthen to 3 1/2% in 2010-11 and 4% in 2011-12, but remain below average. Growth in housing related spending will be supported by some turnaround in housing activity in 2009-10, as well as a recovery in household wealth, with house prices reaching new cyclical highs and Australian equity prices recovering part of their losses since the financial crisis. While jobs growth is expected to strengthen, higher interest rates are expected to subdue growth in household disposable incomes and leave consumers relatively cautious.
Chart 2.6
Household consumption1, wages2 and house price growth3, Queensland
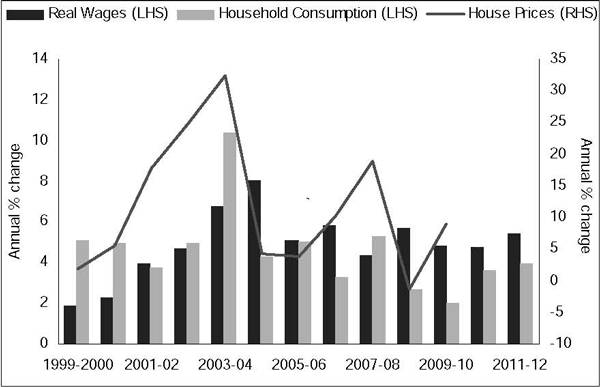
Notes:
| 1. | CVM, 2007-08 reference year. 2009-10 is an estimate, 2010-11 and 2011-12 are forecasts. |
| 2. | Employment plus wages growth, less growth in the Brisbane CPI. |
| 3. | 2009-10 based on first three quarters of the year. |
Sources: ABS 6202.0, 6302.0, 6401.0, 6416.0 and Queensland Treasury.
| | | | |
| | Budget Strategy and Outlook 2010-11 | | 31 |
Table 2.3
State and National economic forecasts1
| | | | | | | | | | | | | | | | |
| | | Outcome | | | Est. Actual | | | Forecasts | |
| | | 2008-09 | | | 2009-10 | | | 2010-11 | | | 2011-12 | |
| | | % | | | % | | | % | | | % | |
Queensland forecasts | | | | | | | | | | | | | | | | |
Domestic production2 | | | | | | | | | | | | | | | | |
Household consumption | | | 2.7 | | | | 2 | | | | 3 1/2 | | | | 4 | |
Private investment3,4 | | | 2.0 | | | | -9 1/4 | | | | 7 | | | | 15 1/2 | |
Dwellings | | | -7.6 | | | | 1/4 | | | | 6 3/4 | | | | 13 1/2 | |
Business investment4,5 | | | 10.0 | | | | -16 1/2 | | | | 9 1/2 | | | | 17 3/4 | |
Other buildings and structures4 | | | 16.6 | | | | -13 1/4 | | | | 10 3/4 | | | | 19 1/4 | |
Machinery and equipment4 | | | 4.5 | | | | -19 1/2 | | | | 8 1/4 | | | | 16 1/2 | |
Private final demand4 | | | 2.5 | | | | -1 3/4 | | | | 4 3/4 | | | | 7 3/4 | |
Public final demand4 | | | 5.6 | | | | 6 1/4 | | | | 2 | | | | -2 3/4 | |
Change in inventories6 | | | -0.9 | | | | 1/2 | | | | 0 | | | | 0 | |
Gross state expenditure7 | | | 1.2 | | | | 1/2 | | | | 4 1/4 | | | | 5 1/4 | |
Exports of goods and services | | | -1.6 | | | | 6 3/4 | | | | 5 1/4 | | | | 5 1/2 | |
Imports of goods and services | | | -1.5 | | | | - 3/4 | | | | 5 3/4 | | | | 8 | |
Net exports6 | | | 0.1 | | | | 2 1/4 | | | | - 1/2 | | | | -1 1/4 | |
Gross state product | | | 1.4 | | | | 3 | | | | 3 3/4 | | | | 4 1/2 | |
| | | | |
Other state economic measures | | | | | | | | | | | | | | | | |
Inflation | | | 3.7 | | | | 2 3/4 | | | | 3 | | | | 3 | |
Wage Price Index | | | 4.2 | | | | 3 1/4 | | | | 3 1/2 | | | | 3 3/4 | |
Employment | | | 2.2 | | | | 3/4 | | | | 2 3/4 | | | | 3 1/4 | |
Unemployment rate (%, year-average) | | | 4.4 | | | | 5 3/4 | | | | 5 1/2 | | | | 5 1/4 | |
Labour force | | | 3.0 | | | | 2 1/4 | | | | 2 1/2 | | | | 3 | |
Participation rate (%, year-average) | | | 67.6 | | | | 67 1/4 | | | | 67 1/4 | | | | 67 3/4 | |
| | | | |
National forecasts | | | | | | | | | | | | | | | | |
Domestic production2 | | | | | | | | | | | | | | | | |
Household consumption | | | 1.9 | | | | 2 3/4 | | | | 3 1/2 | | | | 4 | |
Private investment | | | na | | | | na | | | | na | | | | na | |
Dwellings | | | -1.9 | | | | 3 | | | | 7 1/2 | | | | 4 | |
Business investment4,5 | | | 6.6 | | | | -2 | | | | 7 | | | | 12 1/2 | |
Other buildings and structures4 | | | 8.5 | | | | -7 | | | | 8 | | | | 14 1/2 | |
Machinery and equipment4 | | | 4.8 | | | | - 1/2 | | | | 6 | | | | 13 | |
Private final demand4 | | | 2.3 | | | | 1 3/4 | | | | 4 1/2 | | | | 6 | |
Public final demand4 | | | 4.3 | | | | 7 1/4 | | | | 1 | | | | - 1/2 | |
Change in inventories6 | | | -0.9 | | | | 3/4 | | | | 1/2 | | | | 0 | |
Gross national expenditure7 | | | 1.8 | | | | 3 3/4 | | | | 4 1/4 | | | | 4 3/4 | |
Exports of goods and services | | | 0.1 | | | | 1 1/2 | | | | 5 | | | | 6 | |
Imports of goods and services | | | -2.8 | | | | 5 | | | | 9 | | | | 8 1/2 | |
Net exports6 | | | 0.6 | | | | - 3/4 | | | | -1 | | | | - 3/4 | |
Gross domestic product | | | 1.3 | | | | 2 | | | | 3 1/4 | | | | 4 | |
| | | | |
Other national economic measures | | | | | | | | | | | | | | | | |
Inflation8 | | | 1.5 | | | | 3 1/4 | | | | 2 1/2 | | | | 2 1/2 | |
Wage Price Index8 | | | 3.8 | | | | 2 3/4 | | | | 3 3/4 | | | | 4 | |
Employment8 | | | 0.1 | | | | 2 1/2 | | | | 2 1/4 | | | | 2 | |
Unemployment rate9 | | | 5.7 | | | | 5 1/4 | | | | 5 | | | | 4 3/4 | |
Labour force8 | | | 1.6 | | | | na | | | | na | | | | na | |
Participation rate9 | | | 65.4 | | | | 65 1/4 | | | | 65 1/2 | | | | 65 1/2 | |
Notes:
| 1. | Unless otherwise stated, all figures are annual % changes. Decimal point figures indicate an actual outcome. na - Indicates not available. |
| 2. | CVM, 2007-08 reference year. |
| 3. | Private investment includes livestock and orchards, intangible fixed assets and ownership transfer costs. |
| 4. | Adjusted for second-hand asset sales between the public and private sectors. |
| 5. | National calculations of business investment include investment in cultivated biological resources and intellectual property products, which are not included in the Queensland calculations. |
| 6. | Percentage point contribution to growth in gross state or domestic product. |
| 7. | Includes statistical discrepancy and change in inventories. |
| 8. | Seasonally adjusted growth through-the-year to the June quarter. |
| 9. | Seasonally adjusted estimate for the June quarter. |
Sources: ABS 6401.0; 6345.0; 6202.0, Queensland Treasury and 2010-11 Australian Government Budget.
| | | | |
| 32 | | Budget Strategy and Outlook 2010-11 | | |
Dwelling investment
After declining in the previous two years, dwelling investment is estimated to stabilise in 2009-10, with growth in house construction and a rebound in renovation activity in the first half of the year offset by lower medium-to-high density construction, as restricted access to finance limited developer activity.
Over the eight months to April 2009, standard variable home loan rates were reduced almost 400 basis points to a 40-year low of 5.75%. This, combined with the federal First Home Owners Boost (FHOB), encouraged new entrants into the owner occupier housing market and increased turnover among existing owner occupiers, resulting in a turnaround in house construction in the second half of 2009. A recovery in house prices, combined with improved consumer sentiment, also saw renovation activity rise over this period (see Chart 2.7). However, a wet start to 2010 is estimated to have seen house construction and renovation activity temporarily slow in the March quarter.
Total dwelling investment is forecast to rise 6 3/4% in 2010-11. House construction is forecast to grow, albeit moderately, with greater investor activity in response to higher house prices expected to offset an unwinding in the first home owner market following the withdrawal of the federal FHOB. Despite higher interest rates, growth in housing investment is forecast to accelerate to 13 1/2% in 2011-12, as better access to finance sees a recovery in medium-to-high density construction and improved consumer confidence and labour market conditions support house construction and renovation activity.
Chart 2.7
Dwelling investment by component, Queensland1
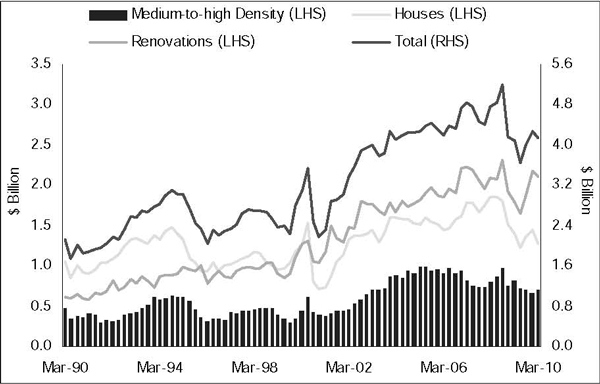
Note:
| 1. | Quarterly, seasonally adjusted, CVM, 2007-08 reference year. |
Sources: ABS 5206.0 and 8752.0.
| | | | |
| | Budget Strategy and Outlook 2010-11 | | 33 |
Business investment
The real value of business investment more than tripled over the eight years to 2008-09, to $40.6 billion. However, earlier uncertainty over the economic outlook, combined with tight credit conditions, is expected to reduce business investment by 16 1/2% in 2009-10.
Non-dwelling construction is estimated to fall 13 1/4% in 2009-10, led by non-residential construction. Restricted access to finance, rising vacancy rates and subdued jobs growth has affected commercial construction, while weak household demand has impacted the retail and wholesale sector. Engineering construction is expected to fall only modestly, supported by residual strength in mining and public-private partnership road projects. In line with weaker construction, machinery and equipment is estimated to fall 19 1/2%, with a subdued recovery in confidence tempering the effect of federal tax incentives.
However, business investment is forecast to grow 9 1/2% in 2010-11 (see Chart 2.8), reflecting further expansions in resource sector capacity in response to strong global demand. A recovery in business confidence, combined with a turnaround in non-dwelling construction, is also forecast to drive growth in machinery and equipment investment of 8 1/4%, while a relatively high A$ should also support business purchases of imported capital items. Growth in business investment is forecast to accelerate to 17 3/4% in 2011-12. Non-residential construction is expected to recover, reflecting an improved labour market, stronger growth in household demand and better access to finance, while engineering activity related to the LNG sector should be underway by this time.
Chart 2.8
Business investment1, Queensland
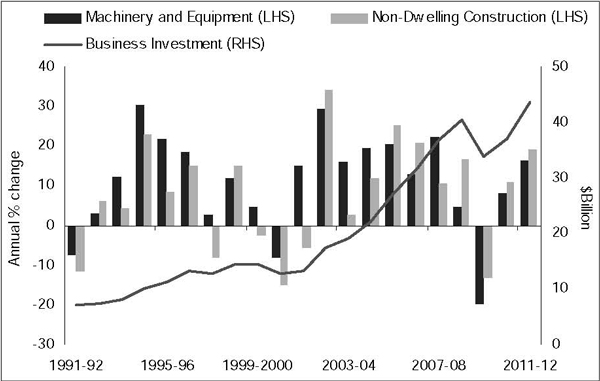
Note:
| 1. | CVM, 2007-08 reference year. 2009-10 is an estimate, 2010-11 and 2011-12 are forecasts. Adjusted for second-hand asset sales between the private and public sectors. |
Source: Queensland Treasury.
| | | | |
| 34 | | Budget Strategy and Outlook 2010-11 | | |
Public final demand
Public final demand is estimated to grow by 6 1/4% in 2009-10 and contribute 1 1/2 percentage points to economic growth. This partly reflects a large State capital works program directed at transport, health, energy and water infrastructure, as well as federal infrastructure initiatives. With the State’s capital program expected to remain at a relatively high level, public final demand is forecast to grow a further 2% in 2010-11. Public final demand is forecast to fall 2 3/4% in 2011-12, as public sector stimulus is withdrawn in response to a recovery in private demand and a return to trend rates of overall economic growth.
Net exports
Exports are expected to rebound sharply in 2009-10, with growth estimated to reach 6 3/4% and forecast to remain strong in 2010-11 and 2011-12. This buoyant outlook is mainly supported by coal and base metals, reflecting rising demand from emerging Asia and a recovery in other traditional major buyers in the region.
China’s demand for Queensland’s coal has moderated somewhat from mid-2009 highs. However, accelerating industrial production, along with drought conditions that have limited hydro-electricity generation, have supported an elevated level of coal exports to China in 2009-10. Further, lower coal contract prices and higher steel production in India, Japan and Korea have boosted metallurgical coal exports to these countries. In contrast, the volume of base metal exports is estimated to fall in 2009-10, followed by a turnaround in 2010-11, underpinned by an unwinding of financial crisis induced production cutbacks.
Agricultural exports in 2009-10 are estimated to have been adversely affected by a range of factors, with beef exports lowered by strong competition from the US in key export markets and a high A$ making Australian produce relatively more expensive. Dry weather during planting reduced wheat and sorghum production, resulting in slower growth in grain exports in 2009-10. While cotton production in the 2009-10 season is expected to fall due to pest infestation and adverse weather conditions, cotton exports are expected to rise, reflecting strong production in the previous growing season.
While the total volume of exports is estimated to rise in 2009-10, total export income is expected to fall due to lower coal contract prices in the 2009-10 Japanese Fiscal Year (JFY, April 2009 - March 2010) and a higher A$ exchange rate. Nevertheless, prices have recovered strongly since late 2009, with thermal coal spot prices rising from around US$70 per tonne in early October 2009 to above US$100 per tonne by mid-May 2010. A hard coking coal contract price for June quarter 2010 was also negotiated, at US$200 per tonne, much higher than the benchmark price of US$128 per tonne settled for the previous JFY. Hard coking coal prices are likely to remain elevated for the remainder of 2010, with floods and a cyclone disrupting Queensland’s coal exports in February and March 2010 and the recovery in global steel production expected to continue. Base metal prices have recovered, with international prices of aluminium, copper, lead, nickel and zinc all well above their levels of a year earlier. As a result, A$ commodity export earnings are expected to return to around the 2008-09 level over the next two years (see Chart 2.9).
| | | | |
| | Budget Strategy and Outlook 2010-11 | | 35 |
After declining in 2008-09, service exports are expected to resume growth in 2009-10, driven by a rebound in interstate tourism. A weaker national economy, combined with unusually wet conditions in the northern part of Queensland, caused a sharp decline in interstate tourist arrivals in 2008-09. This trend began to reverse in 2009-10, as weather conditions in popular tourism regions returned to normal and the national economy recovered. In contrast, following initial resilience in the midst of the global economic downturn in 2008-09, overseas tourism exports are expected to fall slightly in 2009-10, with the appreciation in the A$ reducing the number of tourists arrivals as well as moderating growth in their average length of stay.
Chart 2.9
Overseas commodity exports1, Queensland
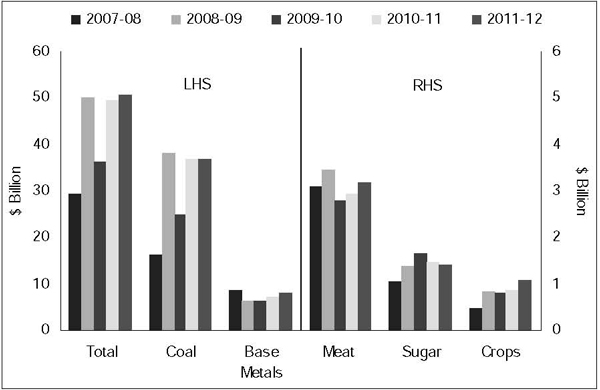
Note:
| 1. | Current prices, 2009-10 is an estimate, 2010-11 and 2011-12 are forecasts. |
Sources: ABS unpublished trade data and Queensland Treasury.
Growth in the volume of coal and base metal exports in 2010-11 and 2011-12 should be supported by the ongoing strength in emerging Asia and the continuing recovery of major industrialised economies. In particular, China’s coal imports are not expected to fully unwind, with China’s coal production likely to be disrupted by further coal industry rationalisation and recent mine accidents prompting large scale safety overhauls.
| | | | |
| 36 | | Budget Strategy and Outlook 2010-11 | | |
With a majority of Queensland’s dams and weirs replenished following heavy rainfall between late 2009 and early 2010, agricultural production is expected to recover in 2010-11 and grow further in 2011-12. This positive outlook for commodity exports, together with a continuing upward trend in services exports, should see the total volume of exports rise 5 1/4% in 2010-11 and a further 5 1/2% in 2011-12.
After declining 1.5% in 2008-09, Queensland’s total volume of imports is estimated to fall a further 3/4% in 2009-10, as a result of weak growth in household consumption and a decline in machinery and equipment investment. An anticipated turnaround in equipment investment and an acceleration in household consumption growth are expected to result in a rebound in total imports of 5 3/4% in 2010-11 and 8% in 2011-12, also supported by a relatively high A$ over this period.
Overall, strong export growth, combined with a decline in imports, is estimated to see net exports contribute 2 1/4 percentage points to overall economic growth in 2009-10. However, faster growth in imports relative to exports in 2010-11 as well as in 2011-12 is forecast to result in detractions from economic growth of 1/2 and 1 1/4 percentage points in the next two financial years respectively.
Labour market
After declining through the first half of 2009, trend employment started to recover in the second half of the year, before monthly jobs growth strengthened to around average by early 2010. As a result, year-average employment growth is estimated to slow to 3/4%, or 17,000 persons, in 2009-10, reflecting a contraction in private domestic activity. This represents the lowest year-average rate of job creation since 1991-92. In particular, employment in the labour-intensive retail and construction sectors fell by almost 28,000 persons in the first three quarters of the financial year, when compared with the same period in 2008-09. In contrast, improved growing conditions saw jobs growth in the rural sector, while growth in public final demand supported employment in government service industries.
Labour market outcomes also varied across regions and age cohorts in 2009-10. In the year to date, employment fell in the West Moreton region, while the neighbouring Sunshine and Gold Coast regions recorded jobs growth. Employment in the Far North declined, seeing this region record the sharpest increase in the unemployment rate in the year. While mature aged workers continued to record relatively robust job growth in the year, youth employment fell, reflecting relative weakness in the manufacturing, transportation, construction and hospitality industries.
In year-average terms, the labour force participation rate in Queensland is estimated to fall modestly, to 67 1/4%, in 2009-10, compared with the record high 67.6% in 2008-09. Reduced job prospects through the year saw some unemployed persons leave the labour force and also deterred potential entrants. Despite this fall, strong civilian population growth is estimated to drive labour force growth of 2 1/4% in 2009-10. With labour force growth exceeding jobs growth, the year-average unemployment rate is estimated to rise to 5 3/4% in 2009-10, but remain below the historical average (see Chart 2.10).
| | | | |
| | Budget Strategy and Outlook 2010-11 | | 37 |
In line with the recovery in domestic economic activity, employment growth is forecast to strengthen to 2 3/4% in 2010-11. Stronger growth in dwelling investment and mining related construction is forecast to stimulate job creation in the construction, transport, mining and metals processing industries, while stronger growth in household consumption should support retail employment. However, job creation is anticipated to remain slightly below average, tempered by employers’ capacity to initially increase average hours worked, after reducing them in previous years in order to retain scarce skilled workers during the slowdown.
Chart 2.10
Labour market, Queensland1
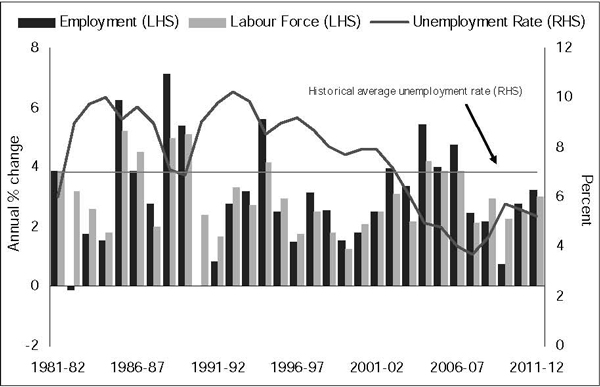
Note:
| 1. | Year-average, 2009-10 is an estimated actual, 2010-11 and 2011-12 are forecasts. |
Sources: ABS 6202.0 and Queensland Treasury.
With the improvement in job prospects expected to see the year-average participation rate stabilise in 2010-11, labour force growth is forecast to be 2 1/2% in the year, below the rate of employment growth. As a result, the year-average unemployment rate is expected to have peaked in 2009-10 and then fall to 5 1/2% in 2010-11.
Employment growth is forecast to strengthen to 3 1/4% in 2011-12, as economic growth recovers to trend. Improved job prospects are also forecast to see the State’s participation rate reach an historic high of 67 3/4% in the year. Despite this rise in participation, employment growth is forecast to outpace labour force growth in 2011-12, leading to another fall in the year-average unemployment rate, to 5 1/4%.
| | | | |
| 38 | | Budget Strategy and Outlook 2010-11 | | |
Population
Following a strong rise of 2.8% in 2008-09, Queensland’s population growth is estimated to ease to its long run rate of 2 1/4% in 2009-10 and forecast to remain at that rate in 2010-11 and 2011-12. This would translate to an increase of around 300,000 persons over the three years, or an average of around 1,900 persons per week.
After peaking in 2008-09 (see Chart 2.11), net overseas migration is expected to be slightly lower, reflecting changes to migration rules made by the Australian Government and reduced inflows from key source countries which have experienced an improvement in economic conditions. However, overseas migration is expected to remain the key driver of population growth.
Net interstate migration has trended lower since 2003-04, as Queensland’s house price gap with southern states narrowed. However, net interstate migration is expected to rise over the forecast period, as the Queensland economic recovery gains momentum. Reflecting higher interstate migration than any other state, Queensland’s population is forecast to continue to grow at a rate stronger than the national average.
Chart 2.11
Population growth, Queensland
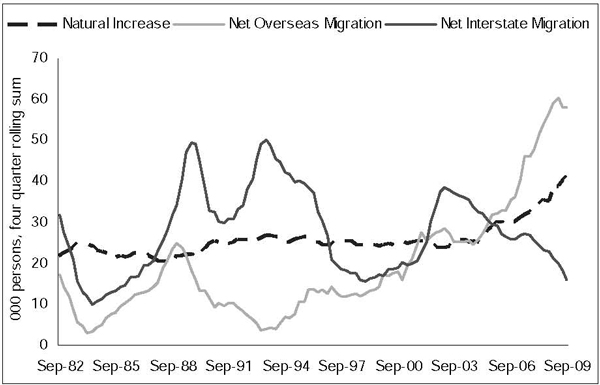
Source: ABS 3101.0.
| | | | |
| | Budget Strategy and Outlook 2010-11 | | 39 |
Wages
Reflecting a softening in labour demand, year-average growth in the Wage Price Index in Queensland is estimated to ease from 4.2% in 2008-09 to 3 1/4% in 2009-10. However, with faster growth in the domestic sector of the economy anticipated to cause labour market conditions to begin tightening again, growth in the Wage Price Index is forecast to strengthen to 3 1/2% next financial year and 3 3/4% by 2011-12.
Inflation
Inflation, as measured by growth in Brisbane’s Consumer Price Index (CPI), is estimated to ease substantially, from 3.7% in 2008-09 to 2 3/4% in 2009-10, its lowest year-average rate in five years. On the supply side, an appreciation in the A$, along with very weak price growth overseas, has moderated tradables inflation, while spare capacity in the domestic economy has subdued non-tradables inflation. On the demand side, weaker household demand and private investment have also contained price pressures.
By component, an easing in growth in housing costs was the main contributor to the easing in inflation in the first three quarters of 2009-10, reflecting slower growth in rents and housing construction costs, which offset higher utility prices. Growth in food prices also slowed, following the passing of adverse weather conditions which pushed prices higher in 2008-09. An improvement in financial market conditions led to a narrowing in the margin of lending over deposit rates and saw financial and insurance services detract from inflation in the first three quarters of the year.
Inflation is expected to remain at the upper end of the RBA’s target band, at 3%, in 2010-11 and 2011-12 (see Chart 2.12). The federal increase in tobacco excise from late April 2010 will contribute substantially to growth in the headline CPI in 2010-11, while housing costs are forecast to strengthen in line with an expected recovery in construction activity. While labour market conditions are forecast to improve in the next two years, inflation is expected to remain below its decade average of 3 1/4%, as modest growth in consumer demand subdues price growth for discretionary goods and services.
| | | | |
| 40 | | Budget Strategy and Outlook 2010-11 | | |
Chart 2.12
Headline inflation1, Brisbane
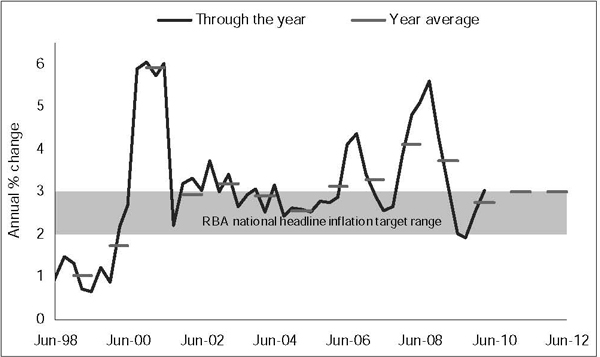
Note:
| 1. | Brisbane All Groups CPI. 2009-10 is an estimate, 2010-11 and 2011-12 are forecasts. |
Sources: ABS 6401.0 and Queensland Treasury.
Risks and opportunities
The current sovereign debt crisis in Europe highlights that the global financial crisis has yet to be fully resolved. With confidence in the global financial system ultimately anchored to the perceived solvency of governments, an escalation in the crisis, even if originating in a relatively small economy, could have large and widespread contagion affecting risk appetite, credit and investment flows as well as asset prices.
In the past, this has been demonstrated by the effect of Mexico’s Peso crisis on other South American economies in 1994 and the Asian financial crisis following the devaluation of the Thai Baht in 1997. Given the size of the European economies involved in the current crisis, any escalation would have a sizeable global effect.
Despite the global economic downturn, a surge in Chinese resource demand largely underpinned Australia’s and Queensland’s strong export performance in 2009-10. With emerging Asia expected to be the main driver of the global economic recovery, the pace and composition of China’s economic growth will affect domestic economic prospects.
| | | | |
| | Budget Strategy and Outlook 2010-11 | | 41 |
While China’s long-term growth prospects are strong, there are rising concerns that the economy has been overheating, with speculative bubbles emerging in some asset markets. Consequently, further monetary tightening may be imminent, while pressure has increased for the government to revalue its currency. A combination of monetary tightening and Chinese Yuan appreciation could slow growth in the short term, lowering demand for mineral products. A shift to meeting energy requirements through greater domestic coal production, rather than international markets, would also impact on Queensland’s coal exports.
It should be noted that some of these potential adverse effects could be cushioned by a depreciation in the A$. Flexibility in the A$ has supported the economy in the past. This includes during the Asian financial crisis and again recently, when the A$ fell more than 25% in trade weighted terms between July 2008 and February 2009 during the depth of the global financial crisis, and more than 10% against the US$ in May 2010 when the sovereign debt crisis in Europe intensified. Since a large portion of the State’s exports of goods are traded in US$ terms, a lower A$ would support export earnings. A weaker A$ would also make the State’s education and tourism exports more competitive.
Several large-scale resource projects in Queensland are in planning stages or scheduled to commence over the outlook period. Given uncertainties around external conditions, proposed changes to the taxation of the mining industry as well as a delay in emissions trading scheme implementation, the timing of these projects may differ from that currently assumed.
While forecasts have factored in some further monetary tightening, the downside risks mentioned above, if realised, may result in the current monetary stance being maintained. This may improve the outlook for Queensland’s household consumption and dwelling investment, given elevated household debt levels following the previous housing and mining booms.
| | | | |
| 42 | | Budget Strategy and Outlook 2010-11 | | |
| 3 | ECONOMIC STRATEGY FOR A GROWING AND AGEING POPULATION |
FEATURES
| • | | Queensland’s population is projected to reach as many as 7 million people by 2030-31, with 4.4 million of these in South East Queensland. The proportion of the population aged 65 and over is projected to almost double over this period. |
| • | | As a consequence, demands on the Government to provide additional services will increase strongly at the same time as Queensland’s rate of economic growth and capacity to raise revenue is reduced by an ageing population over the medium to long term. |
| • | | A long term approach is needed to boost economic growth in response to this challenge. This will require boosting the productive capacity of the Queensland economy, creating the industries of the future, managing Queensland’s population growth, and strengthening the State’s fiscal capacity. |
| • | | Strong ongoing levels of infrastructure investment are important to both increase Queensland’s productive capacity and to provide an important boost to employment as the economy continues to recover from the global financial crisis. The Queensland Government is positioning the private sector to have a greater role in the funding and operation of infrastructure where this represents value for money and enhances the services delivered to Queenslanders. |
| • | | Higher productivity is the key to making our economy more competitive, boosting household incomes and creating jobs. Policies that drive productivity growth will increase the size of our economy thereby increasing the State’s capacity to fund the additional services that are required by our strongly growing and ageing population. |
| • | | At the same time, the importance of preserving Queensland’s natural amenity and mitigating the impacts of growth on the environment were strongly highlighted at the Queensland Growth Management Summit. The Government’s response, Shaping Tomorrow’s Queensland, sets out a comprehensive agenda for managing growth in South East Queensland and encouraging greater population growth and economic development in Queensland’s regions. |
| • | | A key element of any strategy is ensuring that the allocation of Commonwealth-State spending and revenue powers support the delivery of productivity enhancing investments and services. Over time, with our rapidly growing and ageing population, this challenge is becoming greater. The recent health reforms agreed at the Council of Australian Governments are an important step. |
| | | | |
| | Budget Strategy and Outlook 2010-11 | | 43 |
The recent global recession has tested the Queensland economy. In responding to the global downturn, the Government adopted a four-point Jobs First plan:
| • | | sustaining Queensland’s record building program |
| • | | preparing for the recovery by expanding our skills base |
| • | | supporting new industries, along with our traditional strengths |
| • | | developing new job creation programs. |
The Government’s strategy has played an important role in supporting the economy and employment, in conjunction with the Australian Government’s substantial stimulus program. Although a cautious outlook is still warranted, the Queensland economy is well positioned for a return to strong, diversified economic growth coupled with strong population growth.
While job creation remains important, improving economic conditions mean that it is timely for the Government to renew its focus on the longer-term issues facing Queensland:
| • | | the twin demographic challenges of population growth and population ageing |
| • | | the need to continue growing Queensland’s productive capacity |
| • | | the need to strengthen Queensland’s fiscal capacity to better cope with future service and infrastructure demands. |
QUEENSLAND’S DEMOGRAPHIC CHALLENGES
As highlighted at the Queensland Growth Management Summit, demographic change is the source of significant challenges at the state and regional levels. Demographic challenges call for long-term policy responses which facilitate gradual adjustment and avoid the need for harsher adjustments down the track. How Queensland responds to these challenges now is critical to the wellbeing of future generations of Queenslanders.
Growth and location of the Queensland population
For the decade to 2008-09, Queensland's population grew by around 900,000, representing an average annual growth rate of 2.3% – faster than any other state or territory (see Chart 3.1).
| | | | |
| 44 | | Budget Strategy and Outlook 2010-11 | | |
Chart 3.1
Average annual population growth, States and Territories, 1998-99 to 2008-09
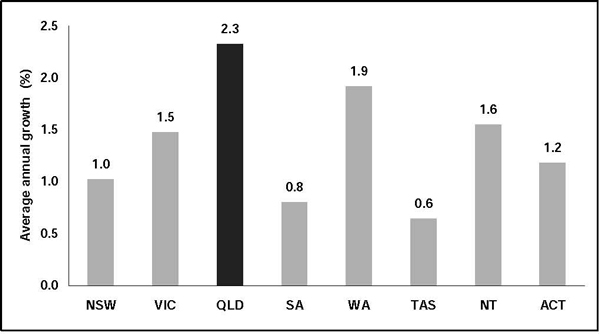
Source: ABS 3201.0 and Treasury calculations.
As recently recognised by the Commonwealth Grants Commission, strong population growth requires a correspondingly rapid expansion of public infrastructure so that the Government can increase services and accommodate greater economic activity. The pace of recent population growth imposes a significant fiscal obligation on Queensland.
Queensland’s rapid population growth is projected to continue. The current Queensland Government Population Projections suggest an increase from 4.4 million people in 2008-09 to as many as 7.0 million people (see Chart 3.2, high series) by 2030-31. Given the State Government’s limited capacity to influence aggregate population growth, enhanced planning and growth management policies are required.
| | | | |
| | Budget Strategy and Outlook 2010-11 | | 45 |
Chart 3.2
Projected Queensland population to 2030-31
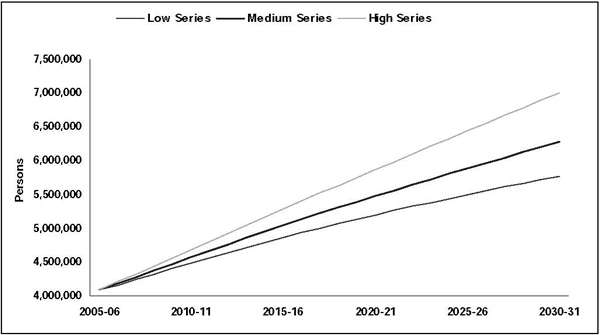
Source: Queensland Government Population Projections 2008 and ABS 3201.0.
In 2005-06, 69% of Queensland’s population, or 2.8 million people, resided in South East Queensland (see Chart 3.3). In the absence of policy change, it is projected that the South East Queensland population share will rise to around 71% by 2030-31, or around 4.4 million people.
Chart 3.3
Projected population to 2030-31, South East1 and Rest of Queensland
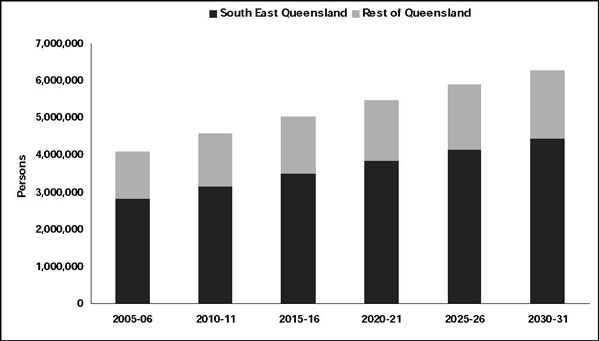
Note:
| 1. | South East Queensland Planning Region. |
Source: Queensland’s Future Population 2008 (medium series) and ABS 3201.0.
| | | | |
| 46 | | Budget Strategy and Outlook 2010-11 | | |
Since 1991, the Queensland Government has been managing growth pressures through its robust regional planning framework, as exemplified by the current South East Queensland Regional Plan and South East Queensland Infrastructure Plan and Program. The recent Queensland Growth Management Summit aimed to build on this through a wide-ranging discussion of potential improvements to Queensland’s growth management framework.
Issues raised at the Summit included:
| • | | the importance of achieving a more sustainable urban form, for example through the use of transit oriented development |
| • | | achieving population and employment growth in other regions of the State |
| • | | protection of green space and biodiversity |
| • | | infrastructure design and funding |
Overall, the Summit provided an ideal opportunity for government to engage key stakeholders, peak sector bodies and communities in discussions around Queensland’s future.
Population ageing
In common with many other societies, Queensland has an ageing population. The year 2010 is a milestone in that the first of the baby boomer generation are reaching the traditional male retirement age of 65. In the near future, the number of people reaching this age will increase significantly, with important implications for the workforce and government services. It is projected that the proportion of people aged 65 and over in Queensland will rise from around 13% currently to around 20% by 2030-31 (Queensland Government 2008, medium series).
By the late 2020s, almost half of Queensland’s population growth will be in the 65+ age group (see Chart 3.4). Growth in Queensland’s older population will occur concurrently with a projected slowing in additions from the under 65 age group. In 2008-09, Queensland had around 4.9 people aged 20 to 64 for every person aged 65 and over. By 2031, this ratio is projected to fall to around 2.8 people aged 20 to 64 for each person aged 65 and over.
| | | | |
| | Budget Strategy and Outlook 2010-11 | | 47 |
Chart 3.4
Projected additions to Queensland’s population, 2009-10 to 2030-31
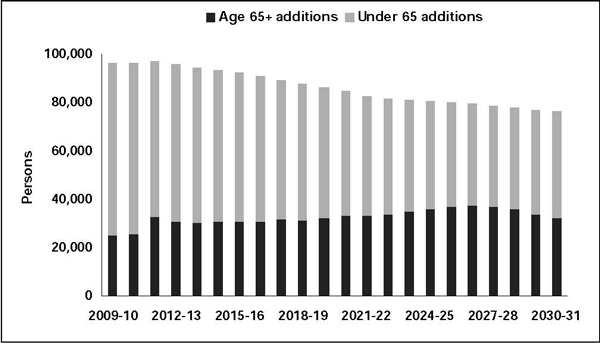
Source: Queensland Government Population Projections 2008 (medium series) and Treasury calculations.
These demographic trends are expected to flow through to Queensland’s labour force. The age groups that are projected to grow the most rapidly are those that currently have the lowest rates of labour force participation (see Chart 3.5).
Chart 3.5
Labour force participation by age group, Queensland, 1998-99 and 2008-09

Source: ABS Labour Force Statistics and Treasury calculations.
| | | | |
| 48 | | Budget Strategy and Outlook 2010-11 | | |
As a result, the overall labour force participation rate for people aged 15 and over is likely to fall. For example, the Australian Government’s Intergenerational Report 2010 projects a national decline of 2 percentage points between 2009-10 and 2029-30. If realised, this trend will detract from growth in the labour force, flowing through to slower growth in gross state product (GSP) and government revenue. It is therefore critical that governments adopt policies that create incentives for, and remove barriers to, mature age labour force participation. As shown in Chart 3.5, policy changes at state and federal levels over the past decade appear to be increasing mature age participation.
Another key challenge arising from population ageing is the rapidly escalating need for health services. For example, hospital use is strongly correlated with age (see Chart 3.6).
Chart 3.6
Average patient days by age group, Queensland hospitals, 2007-08
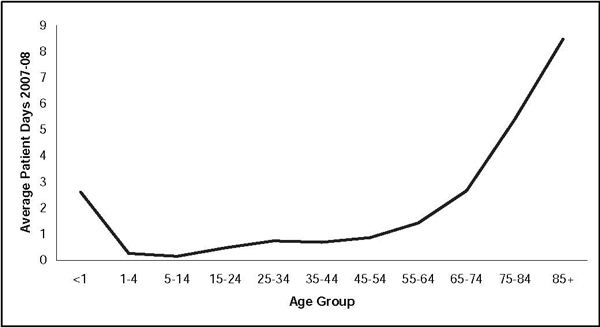
Source: Australian Institute of Health and Welfare, Australian Hospital Statistics 2007-08.
Combining the patient days age profile with projected population by age group provides an indicative view of the increasing pressure that will be faced by Queensland’s hospital system as the population ages. In the absence of changes in policy, technology and population health, patient days in Queensland hospitals would increase from around five million currently to around nine million by 2030-31 (see Chart 3.7).
| | | | |
| | Budget Strategy and Outlook 2010-11 | | 49 |
Chart 3.7
Projected Queensland population and hospital patient days, 2009-10 to 2030-31
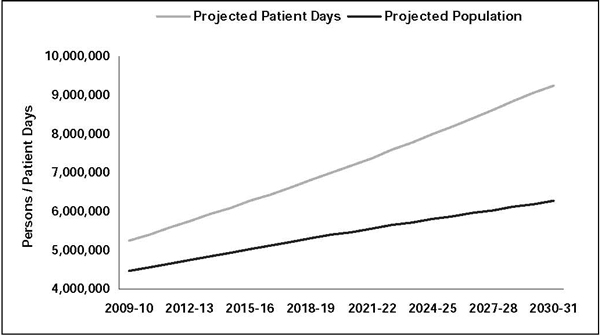
Sources: Australian Institute of Health and Welfare, Australian Hospital Statistics 2007-08, Queensland Government Population Projections 2008 (medium series) and Treasury calculations.
These trends are now well recognised at all levels of government. At the federal level, the Intergenerational Report 2010 projects an increase of pre-reform Australian Government health spending from 4.0% of gross domestic product (GDP) in 2009-10 to 7.1% in 2049-50, with demographics and new technology being the main cost drivers. In 2005, the Productivity Commission’s Economic Implications of an Ageing Australia report projected that Queensland’s own-source health expenditure would increase from 1.7% of GSP in 2002-03 to 2.7% in 2044-45.
It is therefore imperative that service provision and financing within the health system as a whole are placed on the best possible footing to respond and adapt to an ageing and growing population. As well as the adequacy of financial resources and the medical workforce, it is critical that patients are cared for in the most appropriate setting. For example, many aged care patients are currently occupying acute care hospital beds because of insufficient aged care places. In the absence of a policy response, issues such as this would only become worse as the population ages.
| | | | |
| 50 | | Budget Strategy and Outlook 2010-11 | | |
LONG TERM ECONOMIC STRATEGY
The Queensland Government’s long term economic strategy has a number of key elements:
| • | | boosting productive capacity |
| • | | creating the industries of the future (including new environmental industries) |
| • | | managing population growth |
| • | | strengthening fiscal capacity. |
Boosting productive capacity
The Queensland economy’s capacity to produce goods and services relies critically on the availability of skills and physical capital (including public infrastructure) and having a regulatory regime that provides correct incentives, allows flexibility and minimises compliance costs.
A key indicator of productive capacity is labour productivity, or real output per worker. Higher productivity is the key to making the Queensland economy more competitive, boosting household incomes and creating jobs. Productivity growth also strengthens fiscal capacity, assisting the Government to sustainably fund an increasing level of government services like health as the population ages. Put simply – the more we can produce, the more we can afford.
Labour productivity and the level of employment jointly determine economic output, measured by GSP. Chart 3.8 shows the historic contributions of employment growth and labour productivity growth to the expansion of Queensland’s economic output, compared with the rest of Australia. Over the decade to 2008-09, Queensland’s employment and labour productivity both grew faster than in the rest of Australia, with the result that real output grew much faster.
| | | | |
| | Budget Strategy and Outlook 2010-11 | | 51 |
Chart 3.8
Employed labour, labour productivity and real output, 1998-99 to 2008-09
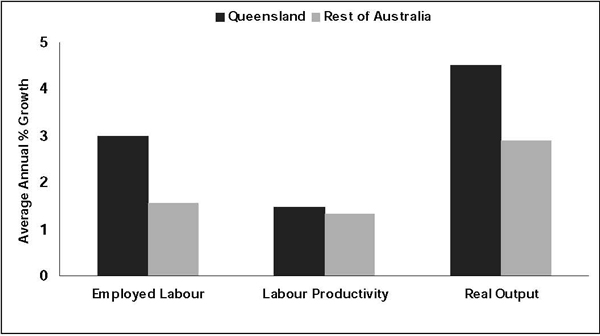
Sources: Queensland State Accounts, ABS 6202.0 and Queensland Treasury estimates.
As discussed earlier, population ageing is likely to detract from growth in employment and GSP, as large numbers of baby boomers leave the workforce. For this reason, future productive capacity will rely increasingly on productivity growth.
The Queensland Government’s strategy for increasing productive capacity is formed around the three priorities of infrastructure, human capital and regulatory efficiency.
Infrastructure
A key role of state and territory governments, in partnership with the Australian Government, is the timely provision of infrastructure to support productivity growth in both the private and public sectors. In Toward Q2: Tomorrow’s Queensland, the Government’s vision is that infrastructure provision anticipates growth. A fast-growing state like Queensland requires substantial infrastructure spending in order to anticipate population and economic growth.
For 2010-11, capital spending in Queensland’s General Government sector is estimated to be $8.335 billion, slightly down on the historical high of 2009-10. In per capita terms, it is estimated that the Queensland Government’s capital spending in the General Government sector will be around 72% above the average of the other states, at $1,820 per person (see Chart 3.9). Among the states, Queensland is expected to have the highest capital expenditure per person in 2010-11, 7.7% above next highest Western Australia.
| | | | |
| 52 | | Budget Strategy and Outlook 2010-11 | | |
Chart 3.9
General Government purchases of non-financial assets, 1992-93 to 2010-11
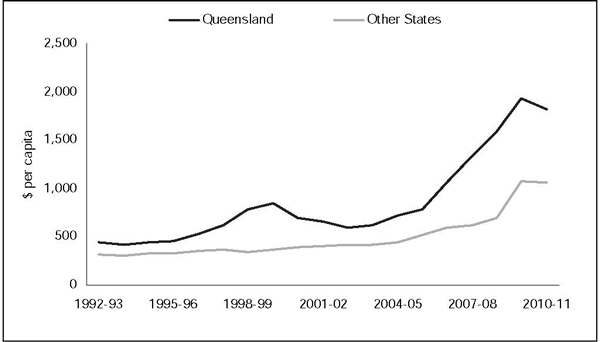
Sources: expenditure – ABS 5512.0, State Budgets (Qld, Vic, WA), and Mid Year Reviews (NSW, SA, Tas); population – ABS 3101.0 and Australian Government Budget Paper 3; and Queensland Treasury estimates.
The State’s total capital outlay in 2010-11, including outlays by the Public Non-financial Corporations sector and capital grants, is expected to be $17.1 billion. Major Queensland Government infrastructure initiatives for 2010-11 include:
| • | | roads project funding of $3.276 billion for major works on the Ipswich Motorway, Bruce Highway (Cooroy-Curra and Townsville) and Airport Drive, among others |
| • | | coal network upgrade funding of $864.2 million, including $502.2 million for the Goonyella to Abbot Point Expansion (Northern Missing Link) |
| • | | upgrades to infrastructure and rollingstock on the CityTrain network totalling $446.4 million, including $155.6 million to continue construction of the Springfield Line. |
In the face of this very large annual infrastructure task, the Queensland Government is pursuing opportunities to make infrastructure provision more effective and efficient. One way of doing this is through selectively involving the private sector, recognising the skills, capacities and resources that the private sector can bring to bear in certain areas.
For example, the Government’s Renewing Queensland Plan, announced in 2009, leverages private sector resources to allow the diversion of scarce Government resources into core priority areas such as roads and health. Additionally, public-private partnerships are being used to develop new schools, a new hospital, and major new transport infrastructure in South East Queensland.
| | | | |
| | Budget Strategy and Outlook 2010-11 | | 53 |
The increasing involvement of the private sector is allowing for the productive capacity of the economy to be enhanced at the same time as the Queensland Government’s funding of infrastructure investment gradually adjusts to more business-as-usual levels over the forward estimates.
Further details of the State’s capital program are provided in Budget Paper 3 – Capital Statement.
Human capital
The concept of human capital encompasses the skills, attitudes and capacities of people, particularly in the context of economic participation. Human capital is built up through formal and informal education and training and on-the-job experience. Higher levels of human capital drive increased creation and deployment of innovation – a fact long recognised in the Queensland Government’s Smart State Strategy.
Within Australia’s education system, the States and Territories have responsibility for early childhood education, schooling, and vocational education. The Queensland Government has a strong track record of reform in each of these areas and will continue to implement improvements to ensure that the skills of Queenslanders are on a par with anywhere in the world:
| • | | Building on the introduction of the Prep Year in Queensland – the Queensland Government is working to deliver up to 240 extra kindergarten services by 2014. In 2010-11, the Government will open 12 kindergarten services on state school sites and partner with the non-state sectors to open more services. In addition the Government will accelerate planning and delivery of 40 kindergarten services originally scheduled for 2013 and 2014, to open a total of 86 services in 2012. |
| • | | The results of the National Assessment Program – Literacy and Numeracy (NAPLAN) for 2009 showed improvement in 17 out of 20 areas. The Government is determined to keep building on these results with a continued investment in its Literacy and Numeracy Action Plan, its Science Spark program and its involvement in the Lower Socio-Economic Status School Communities National Partnership Agreement. |
| • | | Following the recent release of the Education Green Paper A Flying Start for Queensland Children, the Government is conducting an educational campaign to encourage parents to read to their children, and will train volunteers to read to children in schools, establish Teaching Centres of Excellence and conduct a review of teacher pre-service preparation. Consultation is also occurring on major policy changes such as moving Year 7 to secondary school and the establishment of a single authority to oversight education standards for all Queensland teachers and schools. All these initiatives are aimed at improving the educational outcomes of Queensland children. |
| | | | |
| 54 | | Budget Strategy and Outlook 2010-11 | | |
| • | | Continuing, in 2010-11, to fund priority training through the public provider network ($357.9 million) and to develop the skills of apprentices and trainees ($203.5 million). |
| • | | Creating a new Queensland Skills Commission (QSC), an industry-led authority to drive training investment and skills reform. The QSC will establish a partnership with industry that supports industry investment and aligns training programs with real skills and jobs. |
| • | | Extending the Payroll Tax Apprentice and Trainee program, in which businesses receive a 25% rebate on payroll tax on the wages of each apprentice and trainee employed, in addition to the existing payroll tax exemption on apprentice and trainee wages. This program has been extended to 30 June 2011. |
Regulatory efficiency
The Queensland Government is committed to maintaining a competitive regulatory environment that supports Queensland business, community and government in driving innovation, productivity and economic growth for the benefit of all Queenslanders. The Productivity Commission has estimated that achieving regulatory best practice could increase economic output by nearly 2%.
Under the Queensland Regulatory Simplification Plan 2009-2013, Government agencies are reviewing their existing stock of regulation, working with business and the community to identify unnecessary and excessive legislative requirements and opportunities to streamline administrative and procurement processes. Initiatives in place to support these working arrangements include online facilities for public review of agency simplification plans and feedback on regulatory simplification opportunities. Agencies have until 30 June 2013 to deliver a net reduction of $150 million each year in the compliance burden on business and the administrative burden to government.
An initial product of this collaborative approach with Queensland business is a report produced by the Australian Industry Group (Ai Group), with support from Queensland Government officers, to obtain a better understanding of specific regulatory compliance issues faced by business and industry.
The Government is already addressing some of the concerns raised in the report. Through the National Partnership Agreement to Deliver a Seamless National Economy, the Government is working with other jurisdictions to harmonise regulatory regimes in areas such as occupational health and safety and business online service arrangements. At the state level, Government agencies are already focused on reducing the regulatory burden on business in areas such as environmental and resource management, access to Government information and other interactions with Government.
| | | | |
| | Budget Strategy and Outlook 2010-11 | | 55 |
The Queensland Government also recently implemented an enhanced regulatory development and review system – the Regulatory Assessment Statement (RAS) system. This system is focused at preventing unnecessary and excessive regulatory burden by improving the quality of information to Queensland Government decision makers through more rigour, transparency and accountability in the assessment of regulatory proposals.
Creating the industries of the future
The diffusion of new knowledge and technology, combined with the competitive pressures arising from globalisation and the imperative to meet the challenges of climate change and environmental sustainability, is changing Queensland’s economic landscape. While this process poses challenges, it also reveals opportunities.
Since the inception of the Smart State Strategy in 1998, the Queensland Government has been committed to seeing these new opportunities exploited, including:
| • | | progressing its plan to make Queensland a biotechnology leader in the Asia-Pacific. Biotechnoloy has the potential to grow Queensland’s economy by creating new industries in biodiscovery and bioproducts, in addition to increasing the productivity and competitiveness of Queensland’s traditional industries. Estimates derived from the Queensland Life Science Industry Report 2009 suggest that the industry is exceeding earlier projections, with 3,760 private sectors jobs in 2008-09 – 260 above projected employment for 2010 and almost double the 2006-07 employment estimate. Additionally, Queensland biotechnology companies earned $1.1 billion in revenue in 2008-09, well above the projection of $600 million for 2010. |
| • | | Queensland’s emerging liquefied natural gas (LNG) industry is gaining pace, facilitated by the Government’s LNG Industry Unit. The $7.7 billion Santos-PETRONAS Gladstone Liquefied Natural Gas Project has been conditionally approved by the Queensland Coordinator-General, and is now awaiting federal environmental approval and a final investment decision by the proponents. The project is expected to generate about 5,000 construction jobs and 1,000 permanent operational jobs in the Gladstone and Roma regions. |
Additionally, the Government is driving the creation of the ‘green’ industries of the future by facilitating development of Queensland’s endowments of alternative energy sources such as solar and geothermal, and by increasing incentives for recycling and waste reduction. Key initiatives include:
| • | | the Solar Initiatives Package – additional funding of $115 million over five years for initiatives to support investment and jobs in solar energy |
| | | | |
| 56 | | Budget Strategy and Outlook 2010-11 | | |
| • | | a new industry waste reform agenda, with funding of $15.95 million in 2010-11. A key reform in this agenda is the introduction of a waste disposal levy, which will effectively place a more optimal price on the use of environmental resources for waste purposes. The waste disposal levy is expected to raise $379 million over four years, which will be directed to three funding priorities: |
| | • | | a Waste Avoidance and Resource Efficiency Fund ($159 million over four years); |
| | • | | a Local Government Sustainable Future Fund ($120 million); and |
| | • | | Toward Q2 environmental commitments ($100 million). |
Managing population growth
The pace and location of population growth will have long-term implications for Queensland’s prosperity, livability and sustainability. Improvement of Queensland’s growth management capacity has been a focus of recent Queensland Government reforms to local government and regional planning.
The outcomes of the Queensland Growth Management Summit will build on this strong foundation. The Summit produced some 1400 ideas for managing population growth in Queensland. Many of these ideas are already a part of Government policy and planning, while others will drive further research and investigation, and potentially influence future policy.
In Shaping Tomorrow’s Queensland: A Response to the Queensland Growth Management Summit, the Government has put forward an agenda of six priority areas, 22 new initiatives and 25 new supporting actions to address growth-related issues in Queensland.
These actions include:
| • | | the establishment of Growth Management Queensland – a new office within the Department of Infrastructure and Planning – to deliver a focused and coordinated approach to growth management across Queensland |
| • | | developing a Queensland Regionalisation Strategy to encourage population and jobs growth outside South East Queensland |
| • | | developing a Townsville Futures Plan to support regional growth and economic development in Townsville |
| • | | establishing an expert Infrastructure Charges Taskforce to further reform development infrastructure charging arrangements |
| | | | |
| | Budget Strategy and Outlook 2010-11 | | 57 |
| • | | reviewing the scope and powers of the Urban Land Development Authority to support delivery of regional plans, with a key priority being the development of major new satellite communities at Ripley Valley, Yarrabilba and Flagstone |
| • | | developing employment projections within all regional plans to support more jobs closer to where people live |
| • | | investigating ways to deliver affordable housing options for people on lower to middle incomes |
| • | | working with the Australian Government to develop a National Population Strategy (that is then reflected in a state policy). |
In order to provide an immediate impetus for regionalisation, the Government is boosting the First Home Owners Grant to $11,000 for new dwellings constructed outside South East Queensland.
Strengthening fiscal capacity
Over recent time, and most particularly in the 2009-10 Budget, the Queensland Government has undertaken important structural initiatives to strengthen the State’s fiscal capacity to respond to the global recession. These initiatives included savings and efficiency measures and asset sales.
While significant improvements in the Net Operating Balance are expected across the forward estimates, increasingly in the medium to long term the State’s fiscal capacity to deliver services to the community is heavily reliant on federal-state financial arrangements. In this respect, a growing imbalance in the financial powers between the levels of government has weakened the Australian states’ fiscal autonomy and revenue capacity. This has been largely the product of the erosion of state revenue bases, with the Australian Government now collecting around 80% of national taxation, with state and local governments sharing the remainder.
This long term deterioration in state fiscal autonomy has reduced the capacity of state governments to deal with policy challenges that may arise in the 21st century. While some of these challenges are already apparent and have been discussed earlier, others will undoubtedly arise. Two decades ago, the future challenges of demographic change, climate change and globalisation were visible but low on the horizon. The policy landscape two decades from today is likely to be populated not only with some of the existing policy challenges but also new unforeseen policy challenges.
A strong fiscal capacity will be invaluable for states in dealing with these existing and unforeseen challenges. This strengthening will need to be undertaken by both alleviating some of the budgetary pressures facing states and building up the Australian states’ own fiscal capacity.
| | | | |
| 58 | | Budget Strategy and Outlook 2010-11 | | |
Health and aged care reforms
The Queensland Government supports the Council of Australian Governments’ (COAG) National Health and Hospital Network (NHHN) reforms, which will see the Australian Government become the dominant funder of Queensland hospitals, fully fund GP and primary health care and fully fund community care and residential care for people aged 65 and over. These reforms will ease ageing-related fiscal pressure on the states and territories (see Chart 3.10). Additionally, the Australian Government’s greater fiscal capacity will help to ensure that provision of health services to Queenslanders can keep up with growing needs over the long term.
As shown in Chart 3.10, additional Australian Government health funding is expected to grow more rapidly than the projected Australian average share of 33% of Goods and Services Tax (GST) revenue that the States and Territories will forego. It is currently projected that this ‘top-up’ funding will add more than $5 billion annually to the States and Territories’ fiscal capacity by 2019-20 and more than $15 billion in total over the six years to 2019-20.
Chart 3.10
Projected ‘top-up’ benefits from national health and hospital reform, 2013-14 to 2019-20
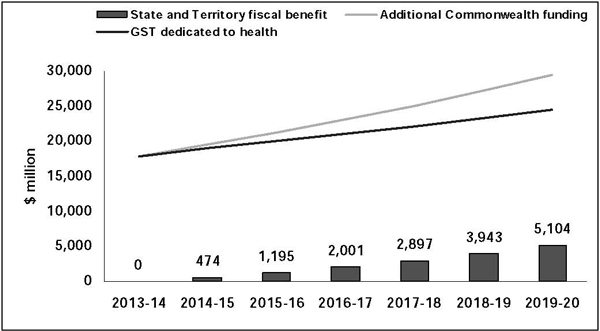
Source: Australian Government.
In Queensland’s case, the top-up funding over the period 2014-15 to 2019-20 is estimated to be $3.4 billion. In addition, national partnership payments associated with the reforms will contribute another $742 million to health care between 2009-10 and 2013-14. The flow of this funding is shown in Chart 3.11. This additional fiscal capacity will help to address the State’s long-term challenges in health care.
| | | | |
| | Budget Strategy and Outlook 2010-11 | | 59 |
Chart 3.11
Additional Australian Government health funding for Queensland from NHHN reforms
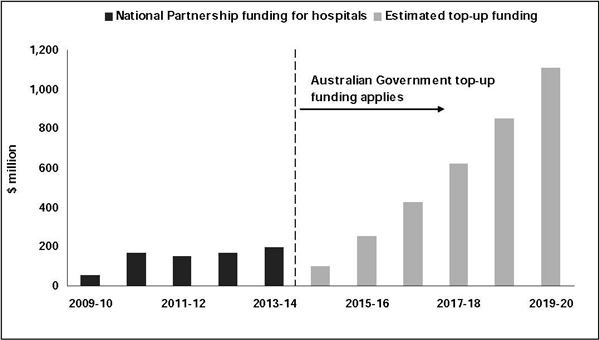
Source: Australian Government Budget Paper 3 and Australian Treasury.
Strengthening State fiscal capacity
While the additional funding arising from the recent health and hospital reforms has provided substantial fiscal benefits to Queensland and other states, it has not addressed more fundamental weaknesses in the state revenue bases.
As noted in the Australian Government’s Report on Australia’s Future Tax System, state revenue bases are relatively narrowly based and have design features that can give rise to inefficiencies. These deficiencies limit the extent to which states can draw on these revenue sources to fund services, infrastructure and transfers to meet community priorities.
Thus an important task for states in building their fiscal capacity will be the strengthening over time of their revenue bases. This will require:
| • | | improving the effectiveness of the current state revenue system through better tax design, administration and mix |
| • | | either gaining access to different bases of revenue or further refining expenditure obligations to better align with the capacities of different levels of government. |
| | | | |
| 60 | | Budget Strategy and Outlook 2010-11 | | |
While jurisdictions can achieve much individually, the task will also require states working together since state taxes exist in the context of a national economy and some improvements will only be possible through greater interstate cooperation and harmonisation. It will also require states working with the Australian Government, as the Australian Government has policy control over the majority of the nation’s broad based revenues and, as a consequence of this, a much greater fiscal capacity.
These concerted efforts will require working through current mechanisms, such as COAG and ministerial councils, as well as more direct cooperation among jurisdictions.
This strengthening of fiscal capacity will be a long term and ongoing task that will need to be supported by a recognition by Australians that a robust national economy and vibrant local communities require a strong and effective federation and therefore strong and effective state and local governments.
| | | | |
| | Budget Strategy and Outlook 2010-11 | | 61 |
FEATURES
| • | | The Australian Government Budget has brought forward grants of $922 million in 2009-10 compared with previous estimates resulting in a significantly smaller deficit than was forecast in the current financial year. If this $922 million was not provided in 2009-10, the profile of the general government net operating balance would be more consistent across the forward estimate period. |
| • | | Total General Government sector revenue is estimated to be $40.606 billion in 2010-11. The increase of $918 million (or 2.3%) on 2009-10 estimated actual revenue primarily reflects increased estimates for coal royalties due to significant price growth and continuing demand for Queensland’s coal and an increase in the amount of GST distributed to Queensland. |
| • | | Since the 2009-10 Budget, underlying estimates for taxation, royalties and Goods and Services Tax (GST) revenue have been revised up by $8.1 billion across the period 2009-10 to 2012-13. This is largely due to an increase in the GST pool to be distributed by the Australian Government across this period and an improved outlook for coal royalties. |
| • | | Although the revenue outlook is positive, estimates of these key revenues for the period 2008-09 to 2011-12 are still expected to be $7.6 billion less than predicted in the 2008-09 Budget prior to the global financial crisis. |
| • | | Despite significant upward revisions to the national GST pool, Queensland’s GST per capita is not expected to reach the peak level of 2007-08 until 2013-14. Over the period 2008-09 to 2011-12, Queensland’s share of GST payments are expected to be $2 billion lower than estimated at the 2008-09 Budget. |
| • | | A 50% cap on the annual increase in land values used for the purpose of calculating land tax liabilities will be continued for 2010-11. This measure was due to end on 30 June 2010. |
| • | | Employers will continue to benefit from a 25% payroll tax rebate on the eligible wages of apprentices and trainees in 2010-11, in addition to these wages being exempt from payroll tax. This measure was due to end on 30 June 2010. |
| • | | The Government will provide a land tax exemption for ‘Level 3’ supported accommodation facilities. The provision of the exemption aligns the land tax treatment to that applied to aged care facilities. |
| • | | In addition, the Government will provide a transfer duty exemption for property used as a principal place of residence for a person with a disability under a Special Disability Trust. |
| • | | Queensland will retain its competitive tax status, with per capita state tax estimated at $2,225 in 2010-11, compared to an average of $2,643 for the other states and territories. |
| | | | |
| | Budget Strategy and Outlook 2010-11 | | 63 |
INTRODUCTION
This chapter provides an overview of General Government sector revenue for the 2009-10 estimated actual outcome, forecasts for the 2010-11 Budget year and projections for 2011-12 to 2013-14.
Table 4.1
General Government revenue1
| | | | | | | | | | | | | | | | | | | | | | | | |
| | | 2009-10
Budget
$ million | | | 2009-10
Est. Act.
$ million | | | 2010-11
Budget
$ million | | | 2011-12
Projection
$ million | | | 2012-13
Projection
$ million | | | 2013-14
Projection
$ million | |
Revenue | | | | | | | | | | | | | | | | | | | | | | | | |
| | | | | | |
Taxation revenue | | | 9,287 | | | | 9,474 | | | | 10,192 | | | | 11,009 | | | | 11,932 | | | | 12,662 | |
Grants revenue | | | | | | | | | | | | | | | | | | | | | | | | |
Current grants | | | 15,025 | | | | 16,135 | | | | 17,245 | | | | 17,561 | | | | 17,595 | | | | 18,676 | |
Capital grants | | | 3,710 | | | | 4,240 | | | | 1,627 | | | | 1,321 | | | | 1,455 | | | | 1,059 | |
Sales of goods and services | | | 3,650 | | | | 3,928 | | | | 4,077 | | | | 4,402 | | | | 4,492 | | | | 4,710 | |
Interest income | | | 2,017 | | | | 2,230 | | | | 2,132 | | | | 2,224 | | | | 2,322 | | | | 2,411 | |
Dividend and income tax equivalent income | | | | | | | | | | | | | | | | | | | | | | | | |
Dividends | | | 884 | | | | 757 | | | | 1,058 | | | | 1,148 | | | | 1,336 | | | | 1,450 | |
Income tax equivalent income | | | 266 | | | | 248 | | | | 402 | | | | 442 | | | | 528 | | | | 585 | |
Other revenue | | | | | | | | | | | | | | | | | | | | | | | | |
Royalties and land rents | | | 1,806 | | | | 1,986 | | | | 3,243 | | | | 3,248 | | | | 3,213 | | | | 3,160 | |
Other | | | 548 | | | | 692 | | | | 631 | | | | 583 | | | | 580 | | | | 584 | |
Total Revenue | | | 37,192 | | | | 39,689 | | | | 40,606 | | | | 41,938 | | | | 43,453 | | | | 45,298 | |
Note:
| 1. | Numbers may not add due to rounding. |
The forward estimates are based on the economic projections outlined in Chapter 2 and are formulated on a no policy change basis.
General Government revenue in 2009-10 is estimated to be $39.689 billion, which is $2.496 billion (or 6.7%) more than the 2009-10 Budget estimate.
Significant variations from the 2009-10 Budget estimates include:
| • | | a $1.640 billion increase in current and capital grants including a $596 million increase in GST distributed to Queensland, a $470 million increase in recurrent specific purposes payments and national partnership payments and a $530 million increase in capital grants. A portion of these grants are related to Queensland expenditure in future years on projects including the Ipswich Motorway upgrade and the Gold Coast Rapid Transit. |
| • | | a $278 million increase in revenue from the sale of goods and services, and $213 million due to growth in interest revenue as a result of higher than expected investment returns |
| | | | |
| 64 | | Budget Strategy and Outlook 2010-11 | | |
| • | | a $187 million (or 2%) increase in taxation revenue, largely due to an increase in transfer duty as a result of strength in the property market reflecting a combination of the impact of the Australian Government’s First Home Owners Boost and low interest rates in the first half of 2009-10 |
| • | | a $180 million increase in royalty revenue associated with increased demand from China along with significant increases in the price of coal for the final quarter of 2009-10. |
General Government revenue in 2010-11 is estimated to be $40.606 billion, $918 million (or 2.3%) higher than the 2009-10 estimated actual revenue of $39.689 billion. This is largely due to further increases in revenue from royalties, current grants from the Australian Government and taxation.
| | | | |
| | Budget Strategy and Outlook 2010-11 | | 65 |
CHANGES IN REVENUE SINCE THE 2009-10 BUDGET
At the time of the 2009-10 Budget it was estimated that since the release of the 2008-09 Budget, the outlook for key revenue items – taxation, GST and royalties – had deteriorated significantly. The underlying effect of the revised revenue estimates was a $15 billion underlying reduction in revenue across the period 2008-09 to 2011-12.
Since the release of the 2009-10 Budget, there has been improvement in Queensland’s economic outlook, along with, and related to, improvement in the economic outlook nationally and globally. This improvement has lead to upward revisions to the forecasts for key revenues in 2009-10 and across the forward estimates.
However, as Chart 4.1 below shows, although 2010-11 revenue forecasts have improved significantly over 2009-10 estimates, they are still some $7.6 billion behind the 2008-09 Budget estimates of revenue which were made prior to the global financial crisis.
Chart 4.1
Revenue Estimates from Taxation, GST and royalties – 2008-09 to 2010-11 Budgets
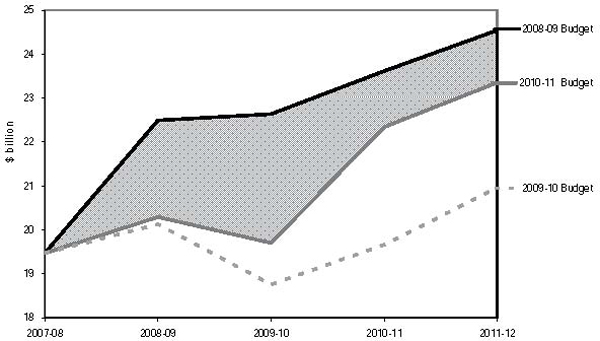
| | | | |
| 66 | | Budget Strategy and Outlook 2010-11 | | |
Taxation estimates since 2008-09
For taxation revenue in particular, Table 4.2 identifies the 2010-11 taxation revenue estimates that were prepared for the 2008-09 and 2010-11 Budgets. As shown, although there has been improvement in taxation revenue since the 2009-10 Budget, taxation revenue estimates for 2010-11 are still expected to be $1.562 billion lower than estimated at the time of the 2008-09 Budget.
Table 4.2
Taxation revenue estimates for 2010-11 - as at 2008-09 Budget and 2010-11 Budget1
| | | | | | | | | | | | |
| | | 2008-09
Budget
$ million | | | 2010-11
Budget
$ million | | | Difference | |
Payroll tax | | | 3,228 | | | | 2,888 | | | | (341 | ) |
| | | |
Duties | | | | | | | | | | | | |
Transfer | | | 3,579 | | | | 2,229 | | | | (1,350 | ) |
Vehicle registration | | | 571 | | | | 467 | | | | (104 | ) |
Insurance and other duties | | | 453 | | | | 487 | | | | 34 | |
Total duties | | | 4,603 | | | | 3,183 | | | | (1,420 | ) |
| | | |
Gambling taxes and levies | | | 1,090 | | | | 964 | | | | (126 | ) |
| | | |
Other taxes | | | | | | | | | | | | |
Land tax | | | 1,025 | | | | 1,117 | | | | 92 | |
Motor vehicle registration | | | 1,072 | | | | 1,311 | | | | 239 | |
Other Taxes | | | 734 | | | | 728 | | | | (6 | ) |
| | | |
Total taxation revenue | | | 11,753 | | | | 10,192 | | | | (1,562 | ) |
Note:
| 1. | Numbers may not add due to rounding. |
The largest impacts are on transfer duty and payroll tax with a $1.350 billion decrease in the transfer duty forecast as a result of the sharp decline in property transactions since the 2008-09 Budget. Similarly, employment growth and hours worked were restrained during 2008-09 and 2009-10 resulting in lower payroll tax forecasts for 2010-11.
These decreases have been only slightly offset by small increases in the revenue estimates for motor vehicle registrations and land tax, partly reflecting revenue measures announced in the 2008-09 Major Economic Statement.
| | | | |
| | Budget Strategy and Outlook 2010-11 | | 67 |
REVENUE BY OPERATING STATEMENT CATEGORY
Major sources of General Government revenue in 2010-11 are grants revenue (46% of revenue) and taxation revenue (25%). Chart 4.2 illustrates the composition of General Government revenue.
Chart 4.2
Revenue by operating statement category 2010-11
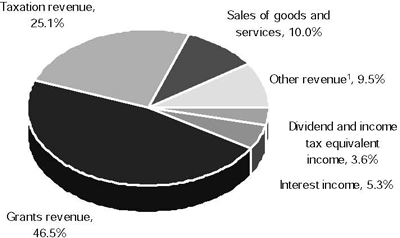
Note:
| 1. | The major component of Other revenue is royalties and land rents (8%). |
| | | | |
| 68 | | Budget Strategy and Outlook 2010-11 | | |
Chart 4.3 compares 2010-11 estimates with 2009-10 estimated actuals. The overall result primarily reflects growth in taxation and other revenue, offset by a significant decrease in grants revenue reflecting the withdrawal of the Australian Government stimulus as well as the cash flow implications of the Australian Government decision to bring forward payment timings.
Chart 4.3
Revenue by operating statement category for 2009-10 and 2010-11
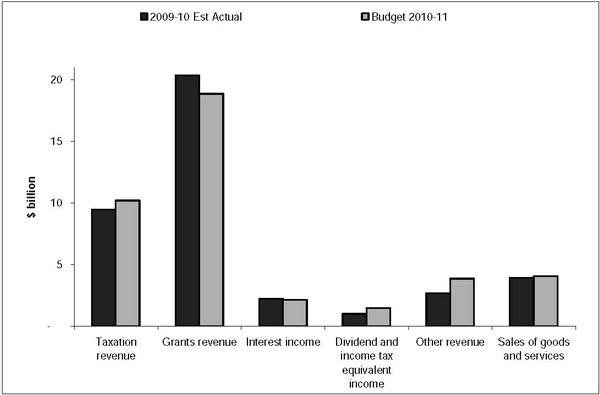
| | | | |
| | Budget Strategy and Outlook 2010-11 | | 69 |
TAXATION REVENUE
One of the Queensland Government’s key social and fiscal objectives is to maintain a competitive tax regime promoting economic development and jobs growth, whilst raising sufficient revenue to meet the service and infrastructure needs of the people of Queensland.
Total revenue from taxation is expected to increase by 7.6% in 2010-11 on 2009-10 estimated actuals. This primarily reflects improvements in the economic forecasts for Queensland since the 2009-10 Budget as the State continues to recover from the downturn.
Table 4.3
Taxation revenue1
| | | | | | | | | | | | |
| | | 2008-09
Actual
$ million | | | 2009-10
Est. Act.
$ million | | | 2010-11
Budget
$ million | |
Payroll tax | | | 2,754 | | | | 2,694 | | | | 2,888 | |
| | | |
Duties | | | | | | | | | | | | |
Transfer | | | 1,806 | | | | 1,997 | | | | 2,229 | |
Vehicle registration | | | 433 | | | | 445 | | | | 467 | |
Insurance2 | | | 425 | | | | 446 | | | | 466 | |
Other duties3 | | | 40 | | | | 26 | | | | 21 | |
Total duties | | | 2,704 | | | | 2,914 | | | | 3,183 | |
| | | |
Gambling taxes and levies | | | | | | | | | | | | |
Gaming machine tax | | | 548 | | | | 518 | | | | 536 | |
Health Services Levy | | | 40 | | | | 33 | | | | 34 | |
Lotteries taxes | | | 212 | | | | 240 | | | | 245 | |
Wagering taxes | | | 40 | | | | 40 | | | | 41 | |
Casino taxes and levies4 | | | 64 | | | | 83 | | | | 89 | |
Keno tax | | | 19 | | | | 19 | | | | 20 | |
Total gambling taxes and levies | | | 922 | | | | 933 | | | | 964 | |
| | | |
Other taxes | | | | | | | | | | | | |
Land tax | | | 838 | | | | 1,017 | | | | 1,117 | |
Motor vehicle registration | | | 1,041 | | | | 1,261 | | | | 1,311 | |
Fire levy | | | 283 | | | | 296 | | | | 312 | |
Community Ambulance Cover | | | 140 | | | | 152 | | | | 154 | |
Guarantee fees | | | 129 | | | | 138 | | | | 192 | |
Other taxes5 | | | 65 | | | | 68 | | | | 70 | |
| | | |
Total taxation revenue | | | 8,877 | | | | 9,474 | | | | 10,192 | |
Notes:
| 1. | Numbers may not add due to rounding. |
| 2. | Includes duty on accident insurance premiums. |
| 3. | Includes duty on life insurance premiums. |
| 4. | Includes community benefit levies. |
| 5. | Includes Statutory Insurance Scheme Levy and Nominal Defendant Levy. |
| | | | |
| 70 | | Budget Strategy and Outlook 2010-11 | | |
Budget initiatives
Payroll tax – apprentice and trainee rebate
Queensland currently has a highly competitive payroll tax regime with a low payroll tax of 4.75% and a relatively high $1 million exemption threshold. The 2009-10 Budget introduced a payroll tax rebate of 25% of the eligible wages of apprentices and trainees until 30 June 2010. This measure provided a benefit to more than 2,000 businesses in 2009-10.
This Budget provides for the continuation of this measure until 30 June 2011 to assist businesses that employ apprentices and trainees as they continue their recovery. This measure will save businesses approximately $8 million in 2010-11.
Land Tax – Capping of Land Values
Land tax is levied on the unimproved value of the landowner’s aggregated holdings of freehold land owned in Queensland as at midnight on 30 June each year. A 50% cap on the annual increase in land values used for the purpose of calculating land tax liabilities commenced from 1 July 2007 for a period of three years. Land tax payers are estimated to have saved approximately $100 million over the period 2008-09 to 2010-11. This Budget provides for the continuation of the 50% land value cap in 2010-11 saving land tax payers approximately $9 million.
Land tax – extended payment period
To assist in alleviating the cashflow issues associated with annual land tax liabilities, an instalment payment option for land tax liabilities will be introduced in 2010-11. From
1 July 2010, land tax payers will be able to either pay their full amount of tax 90 days after they are given their assessment, or in three equal instalments at 45, 90 and then 150 days after assessment, spreading the tax liability over a longer period. The total financing cost of this measure to Government is estimated to be $9 million in 2010-11.
Land Tax – Relief for Supported Accommodation Providers
The Government will provide a land tax exemption for ‘Level 3’ supported accommodation facilities. A Level 3 facility is defined under the Residential Services (Accreditation) Act 2002 and provides both accommodation and personal care support such as assistance with meals, hygiene and medication.
The provision of the exemption aligns the land tax treatment to that applied to aged care facilities. The estimated cost of this measure is $1 million each year across the forward estimates.
| | | | |
| | Budget Strategy and Outlook 2010-11 | | 71 |
Land Tax – Reforming Queensland’s Land Valuation System
The Government will put in place a new structure to reform the state valuation services including the appointment of an independent Valuer General to provide transparency in the assessment and issuing of valuations.
From the 2011 valuation, Queensland will adopt the ‘site value’ methodology similar to that used in other Australian States for property, except rural areas.
Transfer Duty Relief for Special Disability Trusts
The Government has introduced an exemption from transfer duty on the acquisition of property used as the principal place of residence of a person with a disability under a Special Disability Trust, with the meaning given in the Social Security Act 1991 (Cwlth) The exemption is currently provided under an administrative arrangement, pending legal amendment.
Waste Management levy
The Government will introduce an industry waste management levy in 2011-12 to encourage recycling and reduce the amount of industry waste being sent to landfills. The levy revenue is estimated at $379 million over four years. This revenue will be applied directly to implement the reforms and deliver one of the most advanced waste management and resource recovery programs in Australia to assist businesses to adopt stronger recycling practices. The balance will be dedicated to environmental initiatives. This levy will be applied to fund these new initiatives and will not be used to improve the budget operating balance.
Abolition of State Taxes
The Intergovernmental Agreement on the Reform of Commonwealth-State Financial Relations (IGA), agreed to by the Australian Government and all state and territory governments in 1999, required the abolition or review of a number of state taxes. Following a multi-jurisdictional review of duties listed in the IGA schedule, a timetable for the abolition of the majority of these duties was announced in the 2005-06 Budget. Table 4.4 outlines the taxes abolished by Queensland to date.
The cumulative savings for the period 2005-06 to 2010-11, as a result of these abolitions is estimated to exceed $3 billion.
| | | | |
| 72 | | Budget Strategy and Outlook 2010-11 | | |
Table 4.4
Abolition of state taxes under the IGA
| | | | | | |
Tax | | Description | | Abolition | | Full) year
cost1
$ million |
Marketable securities duty (quoted) | | Payable on the transfer of marketable securities listed on the Australian Stock Exchange or another recognised stock exchange. | | ü July 2001 | | 35 |
| | | |
Credit card duty2 | | Payable on credit card transactions. | | ü August 2004 | | 20 |
| | | |
Debits tax | | Payable on debits to accounts with cheque drawing facility. | | ü July 2005 | | 190 |
| | | |
Lease duty | | Payable on the lease of land or premises in Queensland. Residential leases exempted. | | ü January 2006 | | 27 |
| | | |
Credit business duty | | Payable on the amount of credit provided under a loan, a discount transaction or a credit arrangement. | | ü January 2006 | | 19 |
| | | |
Hire duty | | Payable on the hiring charges of the hire of goods. | | ü January 2007 | | 19 |
| | | |
Marketable securities duty (unquoted) | | Payable on the transfer of marketable securities not listed on the Australian Stock Exchange or another recognised stock exchange. | | ü January 2007 | | 17 |
| | | |
Mortgage duty | | Payable on entering into a mortgage over property in Queensland. | | ü July 2008 (6 months early) | | 300 |
| | | |
Duty on transfer of core business assets | | Payable on the transfer of non-realty business assets. | | 1 July 2013 | | 240 |
Notes:
| 1. | Estimated revenue foregone in financial year following full abolition. |
| 2. | Credit card duty was abolished prior to its review under the IGA. |
| | | | |
| | Budget Strategy and Outlook 2010-11 | | 73 |
2010-11 Estimates of state taxation revenue
Chart 4.4 indicates the composition of estimated state taxation revenue for 2010-11.
Chart 4.4
Taxation by tax category
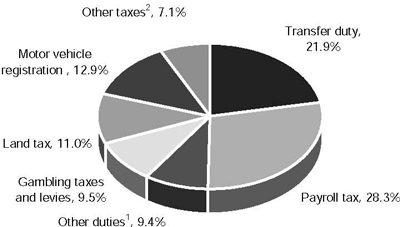
Notes:
| 1. | ‘Other duties’ includes vehicle registration duty, insurance duty and other minor duties. |
| 2. | ‘Other taxes’ includes the fire levy, community ambulance cover, guarantee fees and other minor taxes. |
The largest sources of taxation revenue are payroll tax and transfer duty, which together represent 50% of the State’s total taxation revenue in 2010-11.
Payroll tax (28.3% of total tax revenue in 2010-11) has a stable base with growth driven by the underlying strength of the state economy. In contrast, revenue growth from transfer duty (representing 21.9% of tax revenue) can vary significantly from year to year due to volatile movements of the property market, reflecting both house prices and turnover.
Other duties, including vehicle registration duty, insurance duty and other smaller duties, represent 9.4% of total tax revenue.
Gambling taxes and levies represent 9.5% of tax revenues in 2010-11. Motor vehicle registration, which is classified as a tax for budget purposes, represents 12.9% of total tax revenue.
| | | | |
| 74 | | Budget Strategy and Outlook 2010-11 | | |
Land tax represents 11% of total revenue in 2010-11. While also subject to the volatility of price movements in the property market, this impact is moderated by a relatively stable base and the effect of three-year averaging of land values for assessments.
Payroll tax
Payroll tax is chargeable at a rate of 4.75% when the total yearly Australian taxable wages of an employer, or those of a group of related employers, exceed the exemption threshold of $1 million.
The overall payroll tax rate of 4.75% is the lowest of any state and the exemption threshold of $1 million is amongst the highest thresholds in Australia. Queensland employers with total yearly Australian taxable wages between $1 million and $5 million also obtain a partial concession, with concession withdrawn at a rate of $1 in every $4 of taxable wages.
Payroll tax collections are estimated to be $2.888 billion in 2010-11, reflecting the expected improvement in employment and wages growth in 2010-11. This represents an increase of 7.2% compared to the 2009-10 estimated actual, but is still only 4.9% higher than 2008-09.
Duties
Duties are levied on a range of financial and property transactions. Overall, revenue from duties is forecast to increase by 9% in 2010-11. This growth is driven by the expected increase in transfer duty and vehicle registration duty collections.
The major duties include transfer, vehicle registration and insurance duties.
| • | | Transfer duty is charged at various rates on the transfer of real and business property. The Queensland Government offers extensive concessions for the transfer of land where the property is purchased as a first or subsequent home. |
Revenue from transfer duty is expected to increase by 12% in 2010-11, however this includes approximately $29 million of duty payable as a result of the sale of Forestry Plantations Queensland. Estimates for 2010-11 are driven by the continuing demand for owner occupied property due to population growth, along with growth in house prices.
Transfer duty collections were $2.912 billion in 2007-08 and are not anticipated to reach this level again until 2013-14.
| • | | Vehicle registration duty is charged at rates of between 2% and 4% of the dutiable value of a motor vehicle on the transfer or initial registration of the motor vehicle, with the rate depending on the number of cylinders of the vehicle. |
| | | | |
| | Budget Strategy and Outlook 2010-11 | | 75 |
Revenue from vehicle registration duty is expected to increase 5% in 2010-11, reflecting increased motor vehicle sales as the recovery from the global financial crisis continues.
| • | | Insurance duty is charged on contracts of general insurance, life insurance and accident insurance. The base rate for most general insurance products is 7.5%, with certain general insurance products such as accident insurance and temporary or term life insurance charged at the rate of 5%. Other contracts of life insurance are charged at 0.05% of the sum insured up to $2,000, and 0.01% of the balance of the sum insured. |
| • | | Revenue from insurance duty is expected to grow by 4% in 2010-11, reflecting a moderate growth in insurance premiums. |
Gambling taxes and levies
A range of gambling activities are subject to state taxes and levies. Total gambling tax and levy collections are estimated to increase by 3% in 2010-11, after weakness in gaming machine levies resulted in a drop of $30 million from 2008-09 to 2009-10.
Land tax
Land tax is levied on the unimproved value of the landowner’s aggregated holdings of freehold land owned in Queensland as at midnight on 30 June each year. The principal place of residence is deducted from this value. A 50% cap on the annual increase in land values used for the purpose of calculating land tax liabilities commenced from 1 July 2007 and continues to apply in 2010-11.
Resident individuals are generally liable for land tax if the total unimproved value of the freehold land owned by that person as at 30 June is equal to or greater than $600,000. Companies, trustees and absentees are generally liable for land tax if the total unimproved value of the freehold land owned as at 30 June is equal to or greater than $350,000. Land tax is estimated to grow by almost 10% to $1.117 billion in 2010-11.
From the 2011 valuation, for property except in rural areas, Queensland will adopt the ‘site value’ methodology similar to that used in other States.
Motor vehicle registration fees
Motor vehicle registration fees are expected to grow by 4% in 2010-11, largely reflecting increased motor vehicle registration fees, population growth and fee adjustments related to the consumer price index (CPI).
Fire levy
Fire levy revenue, which is used to fund the Queensland Fire and Rescue Authority, is expected to increase in line with the growth of the number of contributors and CPI.
| | | | |
| 76 | | Budget Strategy and Outlook 2010-11 | | |
Community Ambulance Cover
The Community Ambulance Cover Scheme was introduced in 2003-04 to replace the Ambulance Subscription Scheme and to provide a sustainable funding base for the Queensland Ambulance Service. It is collected through a payment on non-exempt electricity accounts. Growth in 2010-11 reflects CPI adjustments and growth in the number of non-exempt electricity accounts.
Guarantee fees
Guarantee fees are revenues collected by Queensland Treasury Corporation (QTC) on behalf of the State and comprise performance dividends, competitive neutrality fees and credit margin fees. These fees promote competitive neutrality between public sector agencies and those in the private sector and ensure that the benefits accruing from the financial backing and superior borrowing performance of the State (through QTC) are shared between the borrower and the State.
Other taxes
Other taxes represent revenue from taxes such as the Statutory Insurance Scheme Levy and the Nominal Defendant Levy.
Tax expenditures
Tax expenditures are reductions in tax revenue that result from the use of the tax system as a policy tool to deliver Government policy objectives. Tax expenditures are provided through a range of concessions, including tax exemptions, reduced tax rates, tax rebates, tax deductions and provisions which defer payment of a tax liability to a future period. Appendix A provides details of tax expenditure arrangements set in place by the Queensland Government.
| | | | |
| | Budget Strategy and Outlook 2010-11 | | 77 |
QUEENSLAND’S COMPETITIVE TAX STATUS
Taxation can impact on business decisions regarding investment and employment and also household investment and home ownership. Maintaining the competitiveness of Queensland’s tax system provides a competitive advantage to business and moderates the tax burden for its citizens and is therefore fundamental to the Government’s commitment to job creation and sustainable development.
Recent tax changes have sought to improve the efficiency and equity of the State’s tax system, increase consistency with other jurisdictions, strengthen the funding base of essential services and reduce or eliminate taxes to the benefit of taxpayers.
In pursuit of these objectives over recent years, the Government has:
| • | | extended a number of transfer duty exemptions and concessions for homebuyers |
| • | | extended the benefit of the payroll tax phase-out to $5 million, and harmonised payroll tax provisions and definitions with other jurisdictions |
| • | | abolished mortgage duty in advance of the scheduled timeframe |
| • | | increased vehicle registration fees |
| • | | reduced the disparity between tax rates applicable to gaming machines in casinos and those applicable in large clubs and hotels. |
Consistent with this commitment to ongoing tax reform, in this Budget the Government intends to:
| • | | implement the instalment payment option for land tax liabilities that was announced in the 2009-10 Budget, and continue the 50 % cap on annual land value increases for the purpose of calculating land tax liabilities |
| • | | continue the 25% payroll tax rebate on the eligible wages of apprentices and trainees in 2010-11, in addition to these wages being exempt from payroll tax |
| • | | introduce a land tax exemption for ‘Level 3’ supported accommodation facilities. |
One of the Queensland Government’s fiscal objectives is to maintain a competitive tax environment. Table 4.5 demonstrates that this commitment is being met, with various measures of tax competitiveness all indicating the Queensland state tax system remains amongst the most competitive in Australia.
| | | | |
| 78 | | Budget Strategy and Outlook 2010-11 | | |
Table 4.5
Queensland’s tax competitiveness
| | | | | | | | | | | | | | | | | | | | | | | | | | | | | | | | | | | | |
| | | QLD | | | NSW | | | VIC | | | WA | | | SA | | | TAS4 | | | ACT5 | | | NT4 | | | Avg6 | |
| | | | | | | | | |
Taxation per capita1 ($) | | | 2,225 | | | | 2,777 | | | | 2,581 | | | | 2,842 | | | | 2,296 | | | | 1,676 | | | | 3,166 | | | | 1,712 | | | | 2,643 | |
| | | | | | | | | |
Taxation effort2 (%) | | | 86.9 | | | | 106.1 | | | | 98.7 | | | | 100.8 | | | | 115.8 | | | | 93.1 | | | | 110.7 | | | | 91.2 | | | | 100.0 | |
| | | | | | | | | |
Taxation % of GSP3 (%) | | | 3.64 | | | | 4.44 | | | | 4.33 | | | | 3.24 | | | | 4.48 | | | | 3.47 | | | | 3.91 | | | | 2.36 | | | | 4.14 | |
Notes:
| 1. | 2010-11 data. Sources: QLD, VIC, WA, ACT and NT 2010-11 Budgets, NSW, SA and TAS based on 2009-10 MYR. |
| 2. | 2008-09 data. Source: Derived from Commonwealth Grants Commission 2010 Review – average for assessed taxes (payroll, transfer duty, land tax, insurance duty and motor taxes). Revenue raising effort ratios, assessed by the Commonwealth Grants Commission, isolate policy impacts from revenue capacity impacts and are an indicator of the extent to which the governments burden their revenue bases. Queensland’s tax revenue raising effort is well below the Australian policy standard (equal to 100%). |
| 3. | 2008-09 data. Sources: ABS 5220.0 (State Accounts – GSP) and ABS 5506 Taxation Revenue 2008-09. |
| 4. | Low taxation per capita primarily reflects the lower revenue raising capacity of those jurisdictions. |
| 5. | Includes municipal rates, which are classified by the ABS as state taxation in the ACT, but are imposed by local governments in other jurisdictions. |
| 6. | Weighted average of states and territories, excluding Queensland. |
As Table 4.5 shows, taxation per capita in Queensland is significantly lower than the average taxation per capita in the other states and territories. The gap has widened in 2010-11 and is estimated to be $418 per capita compared with $373 per capita in 2008-09.
Queensland’s tax effort, as measured by the Commonwealth Grants Commission, was more than 13% below the national average in 2008-09.
A third measure of competitiveness, taxation as a share of gross state product (GSP), also confirms that Queensland’s taxes are competitive with other states.
| | | | |
| | Budget Strategy and Outlook 2010-11 | | 79 |
GRANTS REVENUE
Grants revenue is comprised of Australian Government grants, grants from the community and industry and other miscellaneous grants. The decrease of $1.5 billion (or 7%) in 2010-11 is primarily due to a $2.6 billion reduction in capital grants from the Australian Government resulting from the winding down of the Nation Building and Jobs Plan and the bringing forward into 2009-10 of grants for expenditure in future years.
This is being partially offset by an increase of $1.1 billion in current grants, including a $724 million increase in GST and a $419 million increase in recurrent specific purposes and national partnership payments for dedicated expenditure on specified services.
Table 4.6
Grants revenue1
| | | | | | | | | | | | |
| | | 2008-09
Actual
$ million | | | 2009-10
Est. Act.
$ million | | | 2010-11
Budget
$ million | |
Current grants | | | | | | | | | | | | |
Australian Government grants | | | 14,769 | | | | 15,666 | | | | 16,811 | |
Other grants and contributions | | | 502 | | | | 469 | | | | 435 | |
Total current grants | | | 15,272 | | | | 16,135 | | | | 17,245 | |
| | | |
Capital grants | | | | | | | | | | | | |
Australian Government grants | | | 2,194 | | | | 4,189 | | | | 1,536 | |
Other grants and contributions | | | 10 | | | | 51 | | | | 91 | |
Total capital grants | | | 2,205 | | | | 4,240 | | | | 1,627 | |
| | | |
Total grants revenue | | | 17,476 | | | | 20,375 | | | | 18,872 | |
Note:
| 1. | Numbers may not add due to rounding. |
Australian Government payments
Australian Government payments to Queensland comprise:
| • | | general purpose payments, comprised of GST revenue grants and associated payments. General purpose payments are ‘untied’ and are used for both recurrent and capital purposes |
| • | | payments for specific purposes, including grants for health, schools, skills and workforce management, disabilities and housing, are used to meet Australian Government and shared policy objectives. |
Australian Government payments to Queensland in 2010-11 are expected to total $18.347 billion, a decrease of $1.508 billion (or 7.6%) compared to payments in 2009-10.
| | | | |
| 80 | | Budget Strategy and Outlook 2010-11 | | |
Table 4.7
Australian Government payments1
| | | | | | | | | | | | |
| | | 2008-09
Actual
$ million | | | 2009-10
Est. Act.
$ million | | | 2010-11
Budget
$ million | |
| | | |
GST revenue grants and associated payments | | | 7,946 | | | | 8,181 | | | | 8,906 | |
Total payments for specific purposes2 | | | 9,017 | | | | 11,673 | | | | 9,441 | |
Total Australian Government payments | | | 16,964 | | | | 19,854 | | | | 18,347 | |
Notes:
| 1. | Numbers may not add due to rounding. |
| 2. | Differences between payments for specific purposes in this chapter and Australian Government Budget estimates can arise and generally reflect the outcome of agency-to-agency discussions or the absence of state level information. |
In the 2010-11 Australian Government Budget it was announced that significant grants were to be brought forward from 2010-11 to 2009-10. This treatment has resulted in 2009-10 revenue increasing significantly with corresponding decreases in 2010-11. The grants reallocated to 2009-10 were related to expenditure in future years on previously committed allocations to large projects in Queensland such as the Ipswich Motorway upgrade.
General purpose payments
GST revenue grants and associated payments
GST revenue grants and associated payments to Queensland in 2010-11 are expected to be $8.906 billion, which represents an increase of $725 million on 2009-10 estimated actuals.
GST revenue projections are based on expected growth in economic parameters, such as household consumption and dwelling investment, which have a strong link to the GST base. The distribution of GST revenues is based on the recommendations of the Commonwealth Grants Commission in accordance with the application of horizontal fiscal equalisation principles.
Queensland’s share of GST funding (relativity) has continued to decrease following the February 2010 release of the 2010 Review of the methodology used to distribute the GST. Due to the ongoing strength of the Queensland economy in the Australian federation it is expected that Queensland’s relativity and therefore share of GST funding will decline further as the State continues to strengthen.
| | | | |
| | Budget Strategy and Outlook 2010-11 | | 81 |
Payments for specific purposes
Australian Government payments for specific purposes to Queensland in 2010-11 are estimated at $9.441 billion.
Chapter 7 provides detailed background on Federal-state financial arrangements, including an analysis of Queensland’s share of GST revenue and details of Australian Government payments to Queensland, including the impact of Council of Australian Government reforms and the Australian Government’s Nation Building and Jobs Plan.
Other grants and contributions
Other grants and contributions are funds received from other state and local government agencies, other bodies and individuals where there is no direct benefit to the provider. Contributions exclude Australian Government grants and user charges. The main sources of contributions are:
| • | | those received from private enterprise and community groups to fund research projects and community services, including the contributions of parents and citizens associations to state schools |
| • | | contributed assets and goods and services received for a nominal amount. |
Table 4.8
Other grants and contributions
| | | | | | | | | | | | |
| | | 2008-09
Actual
$ million | | | 2009-10
Est. Act.
$ million | | | 2010-11
Budget
$ million | |
| | | |
Other grants and contributions | | | 513 | | | | 520 | | | | 526 | |
Revenues will vary from year to year based on the number and size of research projects, assets transferred between the Government and the private sector and contributed assets and services.
| | | | |
| 82 | | Budget Strategy and Outlook 2010-11 | | |
SALES OF GOODS AND SERVICES
Sales of goods and services revenue comprises cost recoveries from the provision of goods or services. Revenue from this source is expected to increase by 3.8% in 2010-11.
Table 4.9
Sales of goods and services1
| | | | | | | | | | | | |
| | | 2008-09
Actual
$ million | | | 2009-10
Est. Act.
$ million | | | 2010-11
Budget
$ million | |
| | | |
Fee for service activities | | | 1,592 | | | | 1,793 | | | | 1,768 | |
| | | |
TransLink | | | 273 | | | | 290 | | | | 338 | |
| | | |
Rent revenue | | | 371 | | | | 398 | | | | 434 | |
| | | |
Sale of land inventory | | | 49 | | | | 67 | | | | 131 | |
| | | |
Hospital fees | | | 347 | | | | 423 | | | | 412 | |
| | | |
Transport and traffic fees | | | 246 | | | | 252 | | | | 272 | |
| | | |
Other sales of goods and services | | | 692 | | | | 705 | | | | 722 | |
| | | |
Total sales of goods and services | | | 3,568 | | | | 3,928 | | | | 4,077 | |
Note:
| 1. | Numbers may not add due to rounding. |
Fee for service activities
Major items of fee for service activities across the General Government sector include:
| • | | recoverable works carried out by both the Department of Transport and Main Roads and the commercialised arm of the department |
| • | | fees charged by Technical and Further Education (TAFE) colleges |
| • | | fees charged by CITEC for information and telecommunications services to the private sector. |
The Government provides concessions in the form of discounts, rebates and subsidies to improve access to and the affordability of a range of services for individuals or families, based on eligibility criteria relating to factors such as age, income and special needs or disadvantage. Appendix B provides details of the concession arrangements established by the Queensland Government.
| | | | |
| | Budget Strategy and Outlook 2010-11 | | 83 |
TransLink
Revenues arise from the arrangements associated with TransLink integrated ticketing and public transport arrangements, which commenced in July 2004. The TransLink entity collects revenues from the operation of public transport services in South East Queensland to fund public transport services in the region. These revenues are estimated at $338 million in 2010-11 reflecting a new fare structure to support increased services, increased patronage and support migration from paperless ticketing with the objective to improve cost recovery for TransLink services from 25% to 30% within five years.
Rent revenue
Rent revenue is earned on the rent or lease of Government buildings, housing, plant and equipment, motor vehicles and car parks. Major items under this category include public housing rentals and rents charged for Government buildings.
Sale of land inventory
Sale of land inventory comprises land sales undertaken by agencies, where the buying and selling of land is a core business activity of the agency, such as the Urban Land Development Authority. As such, it is distinct from property disposals undertaken by most Government agencies. The increase in 2010-11 revenue is due to accelerated development to make available more land for development.
Hospital fees
Hospital fees are collected by public hospitals for a range of hospital services. Fees include those received from private patients and other third party payers, as well as payments received from the Australian Government Department of Veterans' Affairs for the treatment of veterans.
Transport and traffic fees
This category comprises state transport fees, the Traffic Improvement Fee, drivers’ licence fees and various marine licence and registration fees.
Other sales of goods and services
Other sales of goods and services include items such as Title Registration Fees, recreational ship registrations and other licences and permits.
| | | | |
| 84 | | Budget Strategy and Outlook 2010-11 | | |
INTEREST INCOME
Interest income accounts for 5.3% of total General Government revenue in 2010-11.
Table 4.10
Interest income
| | | | | | | | | | | | |
| | | 2008-09
Actual
$ million | | | 2009-10
Est. Act.
$ million | | | 2010-11
Budget
$ million | |
| | | |
Interest income | | | 1,482 | | | | 2,230 | | | | 2,132 | |
Interest income primarily comprises interest earned on the Treasurer’s Cash Balances, Queensland Future Growth Fund balances and investments held to finance future employee entitlements, for example long service leave.
The Government has transferred the assets it held in the Consolidated Fund to meet future employee and other obligations to QTC in exchange for a debt instrument that earns the General Government sector 7.5% per annum. This transfer allows the State to reduce the volatility in interest income and hence volatility in the General Government net operating balance.
Some volatility in interest income remains, associated with the former defined benefit superannuation balances. However, movements in revenue associated with this group are matched by movements in the expense, such that there is not a significant impact on the operating balance. Further detail in relation to this issue is provided in Chapter 5. In addition, a number of statutory bodies hold investments that are subject to market movements.
DIVIDEND AND INCOME TAX EQUIVALENT INCOME
Dividend and income tax equivalent income account for 3.6% of total General Government sector revenue in 2010-11.
Table 4.11
Dividend and income tax equivalent income1
| | | | | | | | | | | | |
| | | 2008-09
Actual
$ million | | | 2009-10
Est. Act.
$ million | | | 2010-11
Budget
$ million | |
| | | |
Dividend | | | 953 | | | | 757 | | | | 1,058 | |
| | | |
Income tax equivalent income | | | 227 | | | | 248 | | | | 402 | |
| | | |
Total dividend and income tax equivalent income | | | 1,180 | | | | 1,005 | | | | 1,460 | |
Note:
| 1. | Numbers may not add due to rounding. |
| | | | |
| | Budget Strategy and Outlook 2010-11 | | 85 |
Dividends are received from the State’s equity in Public Non-financial Corporations and Public Financial Corporations, for example, the Queensland electricity supply industry, Queensland Investment Corporation, port authorities and QR Limited.
Dividends are expected to increase in 2010-11, as the performance of these entities recovers from the global financial crisis. This is discussed in more detail in Chapter 8.
Income tax equivalent income comprises payments by Government-owned corporations in lieu of state and Australian Government taxes and levies from which they are exempt. These payments arise from an agreement reached between the Australian Government and state governments in 1994 to establish a process for achieving tax uniformity and competitive neutrality between public sector and private sector trading activities.
Further detail on dividends, income tax equivalent income and other flows between the Public Non-financial Corporations Sector and the General Government sector is provided in Chapter 8.
OTHER REVENUE
Other revenue accounts for 9.5% of total General Government revenue in 2010-11, up from 6.8% in 2009-10, due to an expected increase in royalty revenue.
Table 4.12
Other revenue1
| | | | | | | | | | | | |
| | | 2008-09
Actual
$ million | | | 2009-10
Est. Act.
$ million | | | 2010-11
Budget
$ million | |
| | | |
Royalties and land rents | | | 3,471 | | | | 1,986 | | | | 3,243 | |
| | | |
Fines and forfeitures | | | 243 | | | | 317 | | | | 297 | |
| | | |
Revenue nec | | | 711 | | | | 375 | | | | 334 | |
| | | |
Total Other Revenue | | | 4,425 | | | | 2,678 | | | | 3,874 | |
Note:
| 1. | Numbers may not add due to rounding. |
Royalties and land rents
Royalty estimates
The State earns royalties from the extraction of coal, base and precious metals, bauxite, petroleum, mineral sands and other minerals and land rents from pastoral holdings, mining and petroleum tenures. Royalties return some of the proceeds of the extraction of non-renewable resources to the community.
| | | | |
| 86 | | Budget Strategy and Outlook 2010-11 | | |
Royalty and land rent revenue is expected to increase by $1.257 billion (or 63%) in 2010-11 largely due to a substantial increase in coal royalties associated with higher contract coal prices. Table 4.13 shows the impact of the coal prices shown in Chart 4.5 particularly the impact that high coal prices in 2008-09 had on royalty revenue. This relationship underlies the increase in royalty estimates for 2010-11 onwards.
Table 4.13
Royalties and land rents1
| | | | | | | | | | | | |
| | | 2008-09
Actual
$ million | | | 2009-10
Est. Act.
$ million | | | 2010-11
Budget
$ million | |
| | | |
Coal | | | 3,102 | | | | 1,619 | | | | 2,766 | |
| | | |
Other royalties2 | | | 262 | | | | 254 | | | | 362 | |
| | | |
Land rents | | | 107 | | | | 113 | | | | 114 | |
| | | |
Total royalties and land rents | | | 3,471 | | | | 1,986 | | | | 3,243 | |
Notes:
| 1. | Numbers may not add due to rounding. |
| 2. | Includes base and precious metal, petroleum and other minerals royalties. |
Chart 4.5
Contract Coal Prices, 2003 to 2011
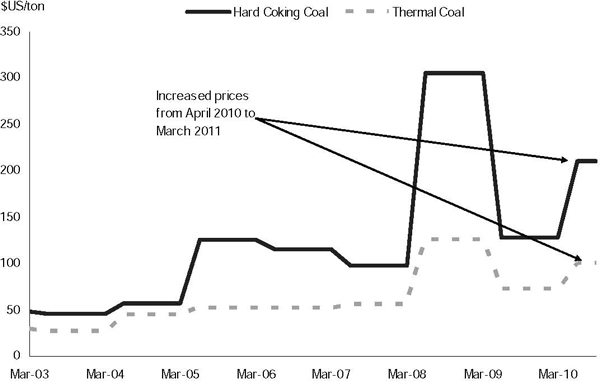
| | | | |
| | Budget Strategy and Outlook 2010-11 | | 87 |
Coal royalties make up the bulk of royalty and land rent revenue, accounting for more than 85% in 2010-11. In 2010-11, the coal royalty estimate is $2.766 billion, a 71% increase on 2009-10, largely reflecting the significant increase in coal contract prices and ongoing demand for export coal.
In March 2010, a number of coal companies negotiated significant increases in contract prices and new quarterly price arrangements. This new pricing regime introduces volatility and makes forecasting difficult but it is expected that royalty revenue will increase markedly from 2009-10 estimates.
The increase in royalty estimates is largest in 2010-11, as contract coal prices are expected to rise significantly from the 2009-10 levels. It is forecast that coal volumes will grow further as additional port capacity comes online and prices will slowly decrease from current levels resulting in a largely flat profile for royalties across the forward estimates.
In the 2008-09 Budget, new royalty arrangements for base and precious metals were announced which will take effect from 1 January 2011. The new regime will see the elimination of the 2.7% fixed rate with only a variable rate royalty system applying with the variable rates being amended to a range of 2.5% to 5%. Base and precious metals royalties are expected to increase in 2010-11 due to a combination of price and volume levels, and the new royalty arrangements.
There is a significant degree of uncertainty associated with estimates of commodity prices and Australian dollar-US dollar exchange rates, both of which have significant impacts on royalty revenue.
In May 2010, the Australian Government released the final report of the Australia's Future Tax System Review, and the government response. One of the recommendations that the Australian Government is considering implementing is a resource super profits tax (RSPT). The Australian Government is undergoing consultation with industry on this measure and therefore the estimates for mining revenue in this chapter do not make any assumptions about the possible impact of the RSPT on volumes of production.
For more information on the recommendations of the tax review, see Chapter 7.
Fines and forfeitures
The major fines included in this category are traffic and court fines. There is an expected decrease of 6% in collections of fines and forfeitures in 2010-11 due to a new revenue retention model for court fees and a decrease in construction notification fees.
Revenue not elsewhere classified
The $42 million decrease in 2010-11 primarily reflects an expected decline in asset transfers from non-Queensland Government entities.
| | | | |
| 88 | | Budget Strategy and Outlook 2010-11 | | |
FEATURES
| • | | Own-purpose expenses in the General Government sector are expected to increase by almost 6% in 2010-11. After allowing for one-off costs associated with the asset sales and anticipated spending to undertake repairs associated with the widespread flooding that occurred in February and March 2010 the estimated rate of increase in expenses is consistent with real per capita growth. |
| • | | Across the forward estimates, own-purpose expenses are estimated to increase by 4.1% on average, compared to real per capita growth of 5.1%. |
| • | | Total General Government sector expenses are expected to increase by $2.376 billion (or 5.9%) over the estimated actual for 2009-10, to $42.352 billion in 2010-11. This broader measure of expenses includes the delivery of services associated with Australian Government specific purpose payments, as well as Queensland’s own purpose expenditure. |
| • | | Consistent with the Government’s strategy for returning to surplus, new spending has been highly targeted and offset by savings where appropriate. |
| • | | The major areas of expenditure are health and education, which together constitute approximately 48.4% of General Government sector expenses. |
INTRODUCTION
This chapter provides an overview of General Government sector expenses for the estimated actual outcome for 2009-10, forecasts for the 2010-11 Budget year and projections for 2011-12 to 2013-14. The forward estimates are based on the economic projections outlined in Chapter 2 and are formulated on a no policy change basis.
General Government expenses in 2009-10 are estimated to be $39.976 billion, an increase of $830 million over the 2009-10 Budget forecast of $39.146 billion. This increase is primarily due to:
| • | | additional funding for natural disaster repair work |
| • | | repayment of Queensland Water Infrastructure debt related to the discontinuation of the Traveston Crossing Dam |
| • | | funding to Townsville Port Limited for the development of the Townsville Marine Industry Precinct to provide a dedicated facility to the local industrial and commercial industries |
| • | | additional expenditure to match increases in specific purpose payments from the Australian Government, particularly for education, and other own source revenues. |
| | | | |
| | Budget Strategy and Outlook 2010-11 | | 89 |
Table 5.1
General Government sector expenses1
| | | | | | | | | | | | | | | | | | | | | | | | |
| | | 2009-10 | | | 2009-10 | | | 2010-11 | | | 2011-12 | | | 2012-13 | | | 2013-14 | |
| | | Budget
$ million | | | Est.Act.
$ million | | | Budget
$ million | | | Projection
$ million | | | Projection
$ million | | | Projection
$ million | |
| | | | | | |
Expenses | | | | | | | | | | | | | | | | | | | | | | | | |
| | | | | | |
Employee expenses | | | 15,006 | | | | 15,395 | | | | 16,221 | | | | 17,362 | | | | 18,323 | | | | 19,059 | |
| | | | | | |
Superannuation interest cost | | | 1,468 | | | | 1,329 | | | | 1,261 | | | | 1,310 | | | | 1,355 | | | | 1,397 | |
Other superannuation expenses | | | 2,093 | | | | 2,019 | | | | 2,103 | | | | 2,200 | | | | 2,290 | | | | 2,350 | |
| | | | | | |
Other operating expenses | | | 7,776 | | | | 8,124 | | | | 8,502 | | | | 8,440 | | | | 8,545 | | | | 8,753 | |
| | | | | | |
Depreciation and amortisation | | | 2,773 | | | | 2,479 | | | | 2,822 | | | | 3,215 | | | | 3,407 | | | | 3,645 | |
| | | | | | |
Other interest expenses | | | 887 | | | | 827 | | | | 1,242 | | | | 1,705 | | | | 2,078 | | | | 2,341 | |
| | | | | | |
Grants expenses | | | 9,143 | | | | 9,802 | | | | 10,201 | | | | 9,149 | | | | 8,937 | | | | 9,147 | |
| | | | | | |
Total Expenses | | | 39,146 | | | | 39,976 | | | | 42,352 | | | | 43,380 | | | | 44,935 | | | | 46,693 | |
Note:
| 1. | Numbers may not add due to rounding. |
The General Government operating statement provides for aggregate expenses of $42.352 billion in 2010-11, representing an increase of $2.376 billion (or 5.9%) over the 2009-10 estimated actual. Factors influencing the growth in expenses include additional expenditure related to joint projects with the Australian Government and growth in service delivery to meet increased demand and the implementation of service enhancements, which are outlined in Budget Paper 4 – Budget Measures.
As outlined in Chapter 1, the Government recognises the importance of fiscal sustainability and expenditure restraint in supporting Queensland’s future economic growth, while maintaining services and continuing to deliver its commitments to the community. The Government’s fiscal principles, as detailed in Chapter 1, include a commitment to limit own-purpose expenses growth (that is, excluding Australian Government related expenses) to inflation and population growth.
Over the period 2009-10 to 2013-14, average growth in own-purpose expenses is estimated at 4.1%, compared with expected average growth of 5.1% in population and inflation.
| | | | |
| 90 | | Budget Strategy and Outlook 2010-11 | | |
The State’s capacity to restrain own-purpose expenses growth is assisted by the following policy parameters:
| • | | wages policy which limits wage increases to 2.5% per annum until the Budget returns to surplus |
| • | | public sector efficiency savings target of $337 million in 2010-11, increasing to almost $400 million from 2012-13 onwards |
| • | | agencies, other than key front line service areas, being required to absorb non-labour cost pressures |
| • | | growth in the public sector workforce being limited to front line service delivery areas and targeted policy commitments. |
Table 5.2 details the public sector efficiency savings targets by department.
Table 5.2
Departmental Efficiency Savings Targets1
| | | | | | | | | | | | |
Department | | 2010-11
Total Efficiency
Savings
$ million | | | 2011-12
Total Efficiency
Savings
$ million | | | 2012-13 and
Ongoing
Total Efficiency
Savings
$ million | |
| | | |
Communities | | | 15.32 | | | | 16.99 | | | | 17.82 | |
Community Safety | | | 9.55 | | | | 9.55 | | | | 9.55 | |
Employment, Economic Development and Innovation | | | 22.90 | | | | 26.56 | | | | 28.40 | |
Education and Training | | | 84.19 | | | | 90.86 | | | | 94.19 | |
Environment and Resource Management | | | 17.96 | | | | 21.62 | | | | 23.46 | |
Health | | | 99.45 | | | | 109.45 | | | | 114.45 | |
Infrastructure and Planning | | | 3.92 | | | | 4.92 | | | | 5.42 | |
Justice and Attorney-General | | | 9.60 | | | | 11.60 | | | | 12.60 | |
Public Service Commission | | | 0.04 | | | | 0.04 | | | | 0.04 | |
Police | | | 21.80 | | | | 24.47 | | | | 25.80 | |
Premier and Cabinet | | | 3.74 | | | | 4.74 | | | | 5.24 | |
Public Works | | | 8.40 | | | | 9.40 | | | | 9.90 | |
Transport and Main Roads | | | 36.71 | | | | 40.38 | | | | 42.21 | |
Treasury | | | 3.43 | | | | 4.43 | | | | 4.90 | |
| | | |
Total Departmental Savings | | | 337.00 | | | | 375.00 | | | | 394.00 | |
Note:
| 1. | Numbers may not add due to rounding. |
| | | | |
| | Budget Strategy and Outlook 2010-11 | | 91 |
The 2010-11 Budget includes a further round of departmental efficiency savings of $57 million in 2010-11, $95 million in 2011-12 and $114 million in 2012-13 and ongoing.
The above efficiency savings will not impact on frontline service delivery.
The Department of Health will retain their share of the latest departmental efficiency savings to fund priority health initiatives.
EXPENSES BY OPERATING STATEMENT CATEGORY
This section provides a breakdown of General Government expenses in 2010-11 by category and discusses the significant variances between the 2009-10 estimated actual and 2010-11 Budget by expense category.
The Service Delivery Statements provide details of expenditure for individual departments.
Chart 5.1 indicates that the largest expense category in the General Government sector is employee and superannuation expenses (46.2%), reflecting the direct service provision nature of Government activities, followed by grants expenses (24.1%) that include community service obligation payments to Public non-financial corporations (PNFCs), and grants to non-government schools and to first home buyers.
Chart 5.1
Expenses by operating statement category, 2010-11
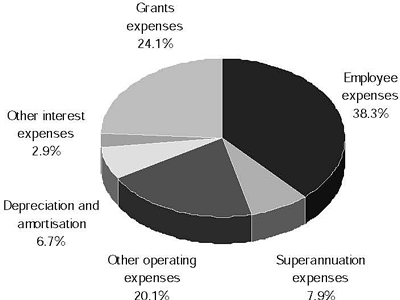
| | | | |
| 92 | | Budget Strategy and Outlook 2010-11 | | |
Chart 5.2 compares the 2009-10 estimated actual expenses for each operating statement category with the 2010-11 Budget.
Chart 5.2
Expenses by operating statement category
2009-10 and 2010-11
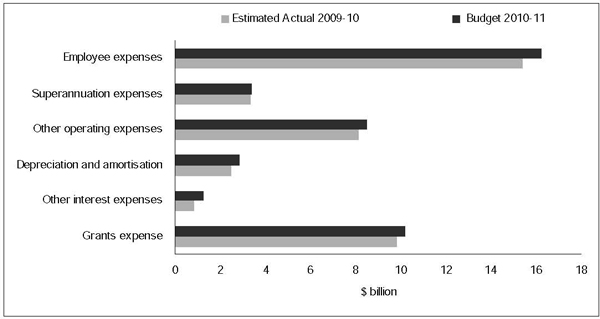
DETAILS OF EXPENSES
Employee expenses
Employee expenses include salaries and wages, annual leave and long service leave expenses.
Employee expenses are forecast to increase by $826 million or 5.4% to $16.221 billion in 2010-11. The increase reflects a combination of wage increases related to enterprise bargaining agreements (such as the Teachers EB Agreement) and other services’ growth and enhancements.
The additional staffing provided in the 2010-11 Budget is predominantly in key service delivery areas, including provision for 316 additional teachers and teacher aides to meet enrolment growth in Queensland state schools, 203 additional police positions, 75 additional ambulance officers, 24 operational firefighting personnel and 720 nurses, 300 allied health professionals and 180 doctors.
| | | | |
| | Budget Strategy and Outlook 2010-11 | | 93 |
Superannuation expenses
The superannuation interest cost comprises two components:
| • | | the imputed interest on the Government’s accruing defined benefit superannuation liabilities; and |
| • | | interest costs on former defined benefit superannuation liabilities. |
In determining the State’s defined benefit superannuation liabilities, AASB 119 Employee Benefits requires the discounting of future benefit obligations using yield rates on government bonds net of investment tax, estimated at 5.3% (6.2% at time of 2009-10 Budget). Offset against this expense is the revenue from plan assets based on long-term expected rates of return of 7.0% per annum.
Former defined benefit superannuation obligations represent the liabilities of defined benefit members who have elected to leave the defined benefit scheme. These liabilities are offset by Consolidated Fund investments and are linked to investment earnings.
In 2010-11, superannuation interest cost is estimated to decline by $68 million to $1.261 billion as earnings on former defined benefit superannuation liabilities are expected to return to the long term average rate of return of 7.5% per annum. The 2009-10 estimated actual return on these liabilities is 12%.
Other superannuation expenses represent employer superannuation contributions to accumulation superannuation and the current service cost of the State’s defined benefit obligation (or the increase in the present value of the defined benefit obligation resulting from employee service in the current period).
Other operating expenses
Other operating expenses comprise the non-labour costs of providing goods and services, repairs and maintenance, consultancies, contractors, electricity, communications and marketing.
Other operating expenses in 2010-11 are expected to be $8.502 billion, which represents an increase of $378 million (or 4.7%) on 2009-10.
The decline in other operating expenses in 2011-12 is due to the winding down of the Australian Governments’ Building the Education Revolution program, lower operating costs associated with the road capital works projects and completion of the asset sales program in 2010-11.
Depreciation and amortisation
Depreciation and amortisation expense is an estimate of the progressive consumption of the State’s assets through normal usage, wear and tear and obsolescence. Growth in this expense category primarily reflects asset revaluations and the size of the State’s capital program.
| | | | |
| 94 | | Budget Strategy and Outlook 2010-11 | | |
Other interest expense
Other interest expense includes interest paid on borrowings to acquire capital assets and infrastructure such as roads and government buildings. The growth in this expense over the forward estimates reflects growth in borrowings primarily used to fund the State’s capital program.
The General Government sector has a moderate level of debt in 2010-11 with a total debt servicing cost forecast at $1.242 billion, representing 2.9% of total expenses.
Grants expenses
Current grants include grants and subsidies to the community (such as schools, hospitals, benevolent institutions and local governments) and personal benefit payments. Funding includes support for non-government healthcare providers and organisations servicing the community in partnership with government in the family support, disability, youth and childcare sectors. Community service obligations (CSOs) are provided where PNFCs are required to provide non-commercial services or services at non-commercial prices for the benefit of the community.
Current grants are estimated to increase by $814 million in 2010-11 (see Table 5.3). Increases in CSOs to QR Limited and Ergon Energy along with higher grants to nonprofit organisations, particularly in the key service areas of disability and community services and social housing, and non-government recipients are partially offset by a decline in grants to non-government schools due to the winding down of the Australian Government’s Building the Education Revolution program.
Increased CSOs to QR Limited reflect growth in the passenger and regional freight sectors. Higher electricity CSOs are largely due to increases in transmission and distribution costs.
Capital transfers represent grants to public non-financial corporations (PNFC’s), local governments, non-profit institutions and other non-government entities, such as businesses and households (including First Home Owner Grant schemes) for capital purposes.
Capital grants are estimated to decline $415 million to $1.530 billion in 2010-11. This is due to payments to PNFC sector entities in 2009-10 and the Australian Governments’ phase out of the First Home Owners Boost scheme in 2009-10, offset in part by capital grants to non-profit organisations, predominantly in social housing.
Capital grant payments to PNFC sector entities in 2009-10 reflect repayment of Queensland Water Infrastructure debt related to the discontinuation of the Traveston Crossing Dam and funding to Townsville Port Limited for the development of the Townsville Marine Industry Precinct.
| | | | |
| | Budget Strategy and Outlook 2010-11 | | 95 |
Table 5.3 indicates the composition of grant payments by recipient.
Table 5.3
Grant expenses1
| | | | | | | | |
| | | 2009-10
Est. Act.
$ million | | | 2010-11
Budget
$ million | |
Current | | | | | | | | |
Grants to local government | | | 502 | | | | 610 | |
Grants to non-government schools 2 | | | 2,503 | | | | 2,387 | |
Grants to non-profit organisations | | | 1,501 | | | | 1,799 | |
Grants to other non-government recipients | | | 1,729 | | | | 1,900 | |
Community service obligations to PNFCs | | | 1,477 | | | | 1,839 | |
Other payments to PNFCs | | | 145 | | | | 136 | |
Total current transfers | | | 7,857 | | | | 8,671 | |
| | |
Capital | | | | | | | | |
First Home Owner Grant Scheme | | | 195 | | | | 171 | |
First Home Owners Boost Scheme | | | 187 | | | | 13 | |
Grants to local government | | | 815 | | | | 725 | |
Grants to non-profit organisations | | | 184 | | | | 269 | |
Grants to other non-government recipients | | | 137 | | | | 313 | |
Payments to PNFCs | | | 427 | | | | 38 | |
Total capital transfers | | | 1,945 | | | | 1,530 | |
| | |
Total current and capital transfers | | | 9,802 | | | | 10,201 | |
Notes:
| 1. | Numbers may not add due to rounding. |
| 2. | Increase in base funding for non-government schools is offset by the winding down of the Australian Government’s Building the Education Revolution program. |
| | | | |
| 96 | | Budget Strategy and Outlook 2010-11 | | |
OPERATING EXPENSES BY PURPOSE
Chart 5.3
General Government expenses by purpose, 2010-11
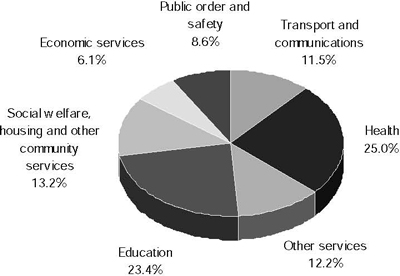
Chart 5.3 indicates the proportion of expenditure by major purpose classification for the 2010-11 Budget. Health accounts for the largest share of expenses (25%) followed by Education (23.4%).
Chart 5.4
General Government expenses by purpose
2009-10 and 2010-11
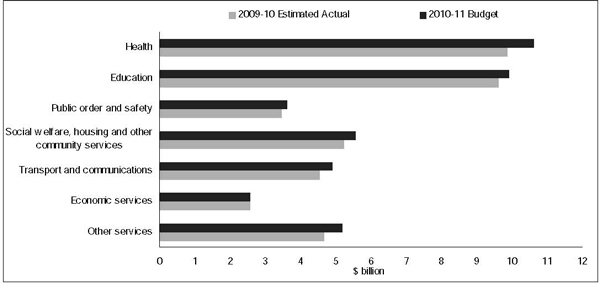
| | | | |
| | Budget Strategy and Outlook 2010-11 | | 97 |
As evidenced in Chart 5.4, expenditure increases in all key service delivery areas from 2009-10 estimated actual to 2010-11 Budget.
The Government has consistently had a clear focus on improving key service areas such as education, health, public order and safety and community services. This section provides a breakdown of General Government expenditure by purpose between the estimated actual and 2010-11 Budget. Further details of General Government expenses by function, as required under the Uniform Presentation Framework, is contained in Chapter 9, Table 9.14.
Health
In 2010-11, funding for health services within the Queensland Government will grow to $10.603 billion, an increase of 7.5% on the 2009-10 estimated actual. The health function includes expenses relating to acute hospital services, including provision of medical, surgical and obstetric services, provision of primary health care for individuals or small targeted groups providing curative, promotive, preventative and rehabilitative services, access to quality emergency medical and outpatient services, residential care services for the aged and young people with physical and intellectual disabilities and mental heath services.
In April this year, the Council of Australian Governments (COAG), excluding Western Australia, reached agreement on the establishment of a National Health and Hospitals Network. The agreement represents major reform of federal and state roles and responsibilities in the management and funding of the health care system.
In 2010-11, Queensland Health will invest additional funding into an number of key priorities:
| • | | enhancements to public hospital services including implementing the specific targets agreed with the Australian Government under the National Health and Hospitals Network (NHHN) Agreement for improved emergency department waiting times and access to elective surgery. Funding will also deliver expanded sub-acute (rehabilitation, mental health and palliative care) and multi-purpose services |
| • | | new and/or upgraded cancer centres in regional Queensland to improve outcomes for cancer patients in regional areas |
| • | | enhancements to children’s hearing services including additional cochlear implants, expanded early intervention services, enhance auditory-verbal services to be provided by the private sector and funding to support the expansion of clinical space for the Hear and Say Centre |
| • | | employ an additional 720 nurses, 300 allied health professionals and 180 doctors. |
| | | | |
| 98 | | Budget Strategy and Outlook 2010-11 | | |
Education
The State’s investment in education encompasses early childhood education and care, State and non-State education, technical and further education (TAFE) and to a lesser extent, higher education. The 2010-11 Budget for education is $9.924 billion, representing an increase of $301 million (or 3.1%), over estimated actual expenditure.
The growth in education expenditure in 2010-11 is largely attributable to wages growth from enterprise bargaining and provision for 316 additional teachers and teacher aides to meet enrolment growth in Queensland state schools.
Wages growth is partially offset by the significant wind down of the Australian Government’s Building the Education Revolution program in 2010-11. As a result, the expense component of the program is significantly lower than in 2009-10 estimated actual.
Public order and safety
Public order and safety includes funding to police, legal services and law courts, fire protection, prisons and corrective services. Expenditure growth under this function is expected to increase 4.6% to $3.621 billion in 2010-11.
The growth in the public order and safety function is partially due to the Government’s continued support for effective delivery of policing services to the Queensland community through more police officers, including 203 additional police positions, improved technology to fight crime and enhanced road safety measures.
In addition, Government has continued to address growing demand for emergency services with an additional 75 ambulance officers and 24 operational firefighting personnel.
Social welfare, housing and other community services
Services provided under the category of social welfare, housing and other community services include community, youth justice, child safety, disability and housing services. Expenditure under this function is estimated to increase 6.5% to $5.570 billion in 2010-11.
2010-11 sees continued investment in improving housing and homelessness services. Underpinning this investment are the joint programs between the Queensland and Australian Governments under the Nation Building and Jobs Plan and the National Partnership Agreements for Remote Indigenous Housing and Homelessness.
Funding for specialist disability services and home and community care services will also increase in 2010-11, including additional funding to support the needs of the frail aged, people with disabilities and their carers under the Home and Community Care Program.
| | | | |
| | Budget Strategy and Outlook 2010-11 | | 99 |
Transport and communications
The transport and communication function incorporates the State’s road network and transport systems including rail, port, freight and aviation systems. Transport and communication expenditure increases 7.4% to $4.886 billion in 2010-11.
The State Government continues to progress the implementation of the South East Queensland Infrastructure Plan and Program (SEQIPP) and the Queensland Transport and Roads Investment Program (QTRIP). For 2010-11, SEQIPP funding priorities continue to include providing for population growth and managing traffic congestion in South East Queensland. QTRIP, which incorporates initiatives, focuses on investment to improve, maintain and operate the transport and roads network across Queensland.
| | | | |
| 100 | | Budget Strategy and Outlook 2010-11 | | |
DEPARTMENTAL EXPENSES
Data presented in Tables 5.4 and 5.5 provide a summary drawn from financial statements contained in Budget Paper 5—Service Delivery Statements. Further information on the composition of expenses, outputs delivered and factors influencing the movement in expenses can also be obtained from the Service Delivery Statements.
Table 5.4
Departmental Controlled Expense 1,2
| | | | | | | | |
| | | 2009-10
Est. Actual
$’000 | | | 2010-11
Estimate
$’000 | |
| | |
Communities | | | 3,496,603 | | | | 4,185,639 | |
Community Safety | | | 1,586,541 | | | | 1,668,746 | |
Education and Training | | | 7,132,731 | | | | 7,475,163 | |
Electoral Commission of Queensland | | | 9,891 | | | | 13,686 | |
Employment, Economic Development and Innovation | | | 1,024,163 | | | | 1,053,535 | |
Environment and Resource Management | | | 996,459 | | | | 965,487 | |
Forestry Plantations Queensland Office | | | 32,905 | | | | — | |
Health | | | 9,260,404 | | | | 9,990,242 | |
Infrastructure and Planning | | | 850,624 | | | | 685,634 | |
Justice and Attorney-General | | | 478,752 | | | | 489,121 | |
Legislative Assembly | | | 75,274 | | | | 76,564 | |
Office of the Governor | | | 5,527 | | | | 5,656 | |
Office of the Ombudsman | | | 7,019 | | | | 7,069 | |
Police | | | 1,707,863 | | | | 1,816,077 | |
Premier and Cabinet | | | 231,488 | | | | 234,361 | |
Public Service Commission | | | 14,228 | | | | 12,926 | |
Public Works | | | 620,291 | | | | 643,450 | |
Queensland Audit Office | | | 41,186 | | | | 42,673 | |
The Public Trustee of Queensland | | | 67,062 | | | | 76,481 | |
Transport and Main Roads | | | 3,552,056 | | | | 3,655,789 | |
Treasury | | | 213,863 | | | | 271,001 | |
Total Expenses | | | 31,404,930 | | | | 33,369,300 | |
Notes:
| 1. | Total expenses by department does not equate to total General Government expenses in Uniform Presentation Framework (UPF) terms reported elsewhere in the Budget Papers as General Government expenses include a wider range of entities including State Government statutory authorities. In addition transactions eliminated between entities within the General Government sector (for example payroll tax payments) are excluded in the preparation of whole-of-Government UPF financial statements. |
| 2. | Explanation of variations in departmental controlled expenses can be found in the Service Delivery Statements. |
| | | | |
| | Budget Strategy and Outlook 2010-11 | | 101 |
Table 5.5
Departmental Administered Expense 1,2
| | | | | | | | |
| | | 2009-10
Est. Actual
$’000 | | | 2010-11
Estimate
$’000 | |
Communities | | | 270,240 | | | | 290,226 | |
Education and Training | | | 2,684,336 | | | | 2,624,611 | |
Employment, Economic Development and Innovation | | | 373,785 | | | | 476,204 | |
Environment and Resource Management | | | 69,364 | | | | 45,791 | |
Health | | | 24,599 | | | | 25,005 | |
Infrastructure and Planning | | | 568,600 | | | | 451,040 | |
Justice and Attorney-General | | | 215,669 | | | | 239,454 | |
Police | | | 429 | | | | 441 | |
Premier and Cabinet | | | 218,959 | | | | 193,426 | |
Public Works | | | 68,491 | | | | 43,881 | |
The Public Trustee of Queensland | | | 2,411 | | | | 786 | |
Transport and Main Roads | | | 978,391 | | | | 992,722 | |
Treasury | | | 4,426,277 | | | | 4,763,334 | |
Total Expenses | | | 9,901,551 | | | | 10,146,921 | |
Notes:
| 1. | Total expenses by department does not equate to total General Government expenses in Uniform Presentation Framework (UPF) terms reported elsewhere in the Budget Papers as General Government expenses include a wider range of entities including State Government statutory authorities. In addition transactions eliminated between entities within the General Government sector (for example payroll tax payments) are excluded in the preparation of whole-of-Government UPF financial statements. |
| 2. | Explanation of variations in departmental administered expenses can be found in the Service Delivery Statements. |
| | | | |
| 102 | | Budget Strategy and Outlook 2010-11 | | |
Table 5.6
Reconciliation of Departmental to UPF Expenses (1)
| | | | | | | | |
| | | 2009-10
Est. Actual
$ million | | | 2010-11
Estimate
$ million | |
| | |
Departmental expenditure per Service Delivery Statements - Controlled (Table 5.4) | | | 31,405 | | | | 33,369 | |
- Administered (Table 5.5) | | | 9,902 | | | | 10,147 | |
| | |
Non-UPF departmental expenses and whole-of-Government schemes(2) | | | (2,289 | ) | | | (2,697 | ) |
| | |
Other General Government entities (e.g. CBUs, SSPs, Statutory Bodies) | | | 4,906 | | | | 5,107 | |
| | |
| | | 43,923 | | | | 45,926 | |
| | |
Superannuation Interest cost | | | 1,329 | | | | 1,261 | |
| | |
Eliminations and Other whole-of-Government adjustments | | | | | | | | |
Elimination of payments to CBUs and SSPs | | | (3,353 | ) | | | (3,375 | ) |
Payroll Tax elimination | | | (505 | ) | | | (530 | ) |
Other eliminations and adjustments | | | (1,418 | ) | | | (930 | ) |
| | |
Total General Government UPF Expenses | | | 39,976 | | | | 42,352 | |
Notes:
| 1. | Numbers may not add due to rounding. |
| 2. | Certain expenses such as asset valuation changes are excluded from UPF reporting. In addition, this item removes the effect of cash payments for whole-of-Government schemes such as the State’s share of superannuation beneficiary payments reported in Treasury Administered’s expenses. Costs associated with these schemes are accrued annually. |
| | | | |
| | Budget Strategy and Outlook 2010-11 | | 103 |
| 6 | BALANCE SHEET AND CASH FLOWS |
FEATURES
| • | | Queensland’s balance sheet is expected to remain strong in 2010-11 with State net worth projected to rise by $957 million through the year to $188.6 billion. |
| • | | Total borrowings and advances are expected to increase by $7.716 billion in 2010-11, primarily as a result of increased investment in public infrastructure assets. The increase in borrowings is the major contributor to the projected $7.554 billion decrease in net financial worth of the General Government sector in 2010-11. |
| • | | The General Government sector is forecast to record a cash deficit of $6.396 billion in 2010-11, after allowing for $8.131 billion in net asset purchases. |
INTRODUCTION
The 2010-11 balance sheet shows the projected assets, liabilities and net worth of the General Government sector as at 30 June 2011. It is important for the Government to maintain a strong balance sheet to provide it with the stability, flexibility and capacity to deal with any emerging financial and economic pressures.
The assets and liabilities in the balance sheet are defined according to the Uniform Presentation Framework (UPF).
Detailed balance sheet and cashflow information for the General Government sector and the other sectors is contained in Chapter 9.
| | | | |
| | Budget Strategy and Outlook 2010-11 | | 105 |
BALANCE SHEET
Table 6.1 provides a summary of the key balance sheet measures for the General Government sector.
Table 6.1
General Government sector: summary of budgeted balance sheet1
| | | | | | | | | | | | | | | | | | | | | | | | |
| | | 2009-10
Budget 2
$ million | | | 2009-10
Est. Act.
$ million | | | 2010-11
Budget
$ million | | | 2011-12
Projection
$ million | | | 2012-13
Projection
$ million | | | 2013-14
Projection
$ million | |
| | | | | | |
Financial assets | | | 49,056 | | | | 57,319 | | | | 58,518 | | | | 60,562 | | | | 62,594 | | | | 65,128 | |
| | | | | | |
Non-financial assets | | | 156,471 | | | | 180,982 | | | | 189,493 | | | | 196,940 | | | | 202,562 | | | | 206,529 | |
| | | | | | |
Total Assets3 | | | 205,527 | | | | 238,301 | | | | 248,012 | | | | 257,502 | | | | 265,156 | | | | 271,657 | |
| | | | | | |
Borrowings and advances | | | 19,246 | | | | 15,996 | | | | 23,712 | | | | 30,532 | | | | 35,198 | | | | 38,398 | |
| | | | | | |
Superannuation liability | | | 25,303 | | | | 24,563 | | | | 25,462 | | | | 26,270 | | | | 26,986 | | | | 27,606 | |
| | | | | | |
Other provisions and liabilities | | | 9,833 | | | | 10,135 | | | | 10,274 | | | | 10,580 | | | | 10,955 | | | | 11,327 | |
| | | | | | |
Total Liabilities | | | 54,382 | | | | 50,694 | | | | 59,447 | | | | 67,383 | | | | 73,139 | | | | 77,332 | |
| | | | | | |
Net Worth | | | 151,144 | | | | 187,607 | | | | 188,564 | | | | 190,119 | | | | 192,017 | | | | 194,326 | |
| | | | | | |
Net Financial Worth | | | (5,327 | ) | | | 6,625 | | | | (929 | ) | | | (6,821 | ) | | | (10,545 | ) | | | (12,203 | ) |
| | | | | | |
Net Financial Liabilities | | | 20,999 | | | | 18,273 | | | | 25,576 | | | | 31,974 | | | | 36,235 | | | | 38,582 | |
| | | | | | |
Net Debt | | | (10,672 | ) | | | (13,206 | ) | | | (6,743 | ) | | | (1,294 | ) | | | 2,095 | | | | 3,707 | |
Notes:
| 1. | Numbers may not add due to rounding. |
| 2. | Numbers have been restated where subsequent changes in classification have occurred. |
| 3. | For UPF purposes, the State’s assets are classed as either financial or non-financial assets. |
Financial assets
The General Government sector holds the full equity of the State’s public enterprises, principally its shareholding in Government-owned corporations (GOCs) but also Public Financial Corporations like Queensland Treasury Corporation (QTC), in much the same manner as the parent or holding company in a group of companies. The estimated net investment in public enterprises ($24.648 billion at 30 June 2011) is included in the General Government sector’s financial assets.
Financial assets of $57.319 billion are forecast for 2009-10, or $8.263 billion higher than originally budgeted, reflecting an increase in investments in public sector entities. The increase in the value of the Public Non-financial Corporations sector is primarily due to the revaluation of GOC assets at 30 June 2009.
In the year to 30 June 2011, financial assets are projected to increase by $1.199 billion, attributable principally to increased investment in assets set aside to meet future employee liabilities.
| | | | |
| 106 | | Budget Strategy and Outlook 2010-11 | | |
Chart 6.1 shows projected General Government sector financial assets by category at 30 June 2011. Investments held to meet future liabilities including superannuation and long service leave comprise the major part of the State’s financial assets.
Chart 6.1
Projected General Government financial assets by category at 30 June 2011
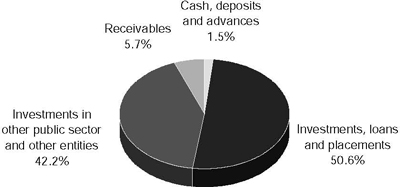
Non-financial assets
General Government non-financial assets are projected to total $189.493 billion at 30 June 2011. These assets consist primarily of land and other fixed assets of $182.735 billion, the majority of which are roads, schools, hospitals and other infrastructure used to provide services to Queenslanders. Other non-financial assets of $6.759 billion held by the State include prepayments and deferred tax assets relating to income tax equivalents collected primarily from GOCs.
Land and other fixed assets of $174.531 billion are forecast for 2009-10, $24.651 billion higher than originally budgeted. The increase is primarily due to the recognition at 30 June 2009 of land under roads in accordance with Australian accounting standard AASB 1051 Land UnderRoads.
| | | | |
| | Budget Strategy and Outlook 2010-11 | | 107 |
Changes in non-financial assets occur for a number of reasons including:
| • | | construction and purchase of assets, either to replace existing assets or provide additional capacity for the State to deliver services |
| • | | revaluations of assets required under accounting standards |
| • | | depreciation and disposals of assets. |
Non-financial assets in the year ending 30 June 2011 are expected to grow by $8.511 billion over the 2009-10 estimated actual. Of this increase, $8.131 billion represents the net acquisition of non-financial assets.
The Government has traditionally funded new infrastructure at levels well beyond that of the other states. General Government purchases of non-financial assets per capita have far exceeded the average of the other states and territories for well over a decade (see Chart 3.9 in Chapter 3).
Liabilities
The largest accruing liability in the General Government sector is currently employee entitlements (principally superannuation and long service leave) which are projected to total $29.639 billion at 30 June 2011. The other major component of liabilities is borrowings and advances received.
Total liabilities are budgeted to increase by $8.753 billion in 2010-11, largely on account of increased borrowing to support the State’s capital program and growth in the General Government superannuation liability.
State public sector superannuation liabilities include defined benefit liabilities for current employees and the balance of former scheme members (retirement, resignation, etc.) who choose to retain their funds within QSuper.
The proportion of the State’s total superannuation liability relating to former scheme members is expected to increase over the forward estimates period as these investment balances grow.
The defined benefit scheme is closed to new members. New employees join QSuper’s accumulation scheme.
Over the Budget and forward estimates period, total additional General Government net borrowings and advances of $22.154 billion are planned to fund the $26.204 billion worth of capital projects in the General Government sector and $1.991 billion worth of equity injections to the Public Non-financial Corporations sector to support expansion of the State’s water, ports, energy and rail infrastructure.
The remainder of the liabilities balance consists of payables and other liabilities such as unearned revenue and provisions.
| | | | |
| 108 | | Budget Strategy and Outlook 2010-11 | | |
The composition of the General Government sector’s liabilities is illustrated in Chart 6.2.
Chart 6.2
Projected General Government liabilities by category at 30 June 2011
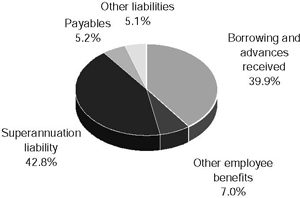
Net financial worth
The net financial worth measure is an indicator of financial strength. Net financial worth is defined as financial assets less all existing and accruing liabilities. Financial assets include cash and deposits, advances, financial investments, loans, receivables and equity in public enterprises.
The net financial worth measure is broader than the alternative measure – net debt – which measures only cash, advances and investments on the assets side and borrowings and advances on the liabilities side.
The net financial worth of the General Government sector for 2010-11 is forecast at negative $929 million. Net financial worth is expected to decrease over the forward estimates period as the sector increases borrowings to fund infrastructure assets (which are not included in the calculation of net financial worth).
| | | | |
| | Budget Strategy and Outlook 2010-11 | | 109 |
Net financial liabilities
Net financial liabilities are total liabilities less financial assets, other than equity investments in other public sector entities. This measure is broader than net debt as it includes significant liabilities, other than borrowings (for example, accrued employee liabilities such as superannuation and long service leave entitlements). The net financial liabilities of the General Government sector for 2010-11 are forecast at $25.576 billion.
Queensland’s level of liquidity continues to be in excess of the other states as illustrated in Chart 6.3.
Chart 6.3
Projected ratio of financial assets to liabilities
(excluding investments in public enterprises) at 30 June 2011
General Government sector
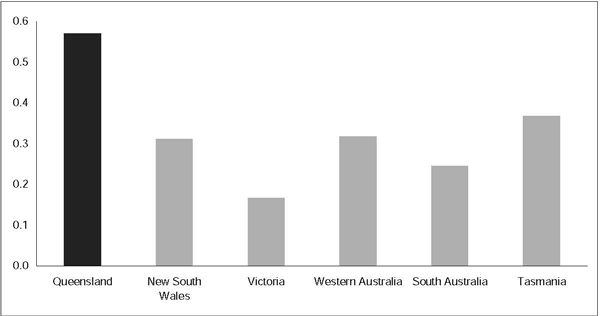
Sources: State Budget Papers for QLD, Vic and WA. Mid year review for NSW, SA and Tas.
Net worth
The net worth, or equity, of the State is the amount by which the State’s assets exceed its liabilities (which is equivalent to General Government net worth). This is the value of the investment held on behalf of the people of Queensland by public sector instrumentalities. Changes in the State’s net worth occur for a number of reasons including:
| • | | operating surpluses (deficits) that increase (decrease) the Government’s equity |
| | | | |
| 110 | | Budget Strategy and Outlook 2010-11 | | |
| • | | revaluation of assets and liabilities as required by accounting standards. Most financial liabilities are revalued on a regular basis. For example, the Government’s accruing liabilities for employee superannuation and long service leave are determined by actuarial assessments |
| • | | movements in the net worth of the State’s investments in the Public Non-financial Corporations and Public Financial Corporations sectors |
| • | | gains or losses on disposal of assets. Government agencies routinely buy and sell assets. Where the selling price of an asset is greater (less) than its value in an agency’s accounts, the resultant profit (loss) affects net worth. |
The net worth of the General Government sector in 2009-10 is forecast to be $187.607 billion. This exceeds growth forecasts in the 2009-10 Budget by $36.463 billion primarily as a result of recognising land under roads at 30 June 2009 in accordance with Australian accounting standard AASB 1051 Land Under Roads.
Net worth is forecast to grow by $957 million to $188.564 billion in 2010-11.
Chart 6.4 shows the State’s strong net worth compared with the other states. Queensland’s per capita net worth is 66.7% greater than the average per capita net worth of the other states.
Chart 6.4
Interjurisdictional comparison of projected per capita net worth at 30 June 2011
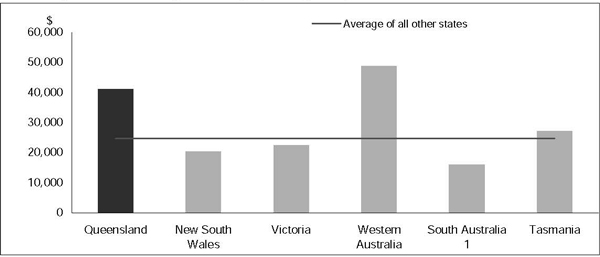
Note:
1. All States, with the exception of SA, value land under roads as part of their overall asset base.
Sources: State Budget Papers for QLD, Vic, WA, ACT and NT. Mid year review for NSW, SA and Tas. Population data from Australian Government Budget Paper No.3, 2010-11.
| | | | |
| | Budget Strategy and Outlook 2010-11 | | 111 |
Net debt
Net debt is the sum of advances received and borrowings less cash and deposits, advances paid and investments, loans and placements. The extent of accumulated net debt is used to judge the overall strength of a jurisdiction’s fiscal position. High levels of net debt impose a call on future revenue flows to service that debt and meeting these payments can limit government flexibility to adjust outlays. Excessive net debt can call into question the ability of government to service that debt.
As shown in Table 6.2, the General Government sector has negative net debt, that is, a surplus of financial assets over financial liabilities.
Queensland’s negative net debt of $1,472 per capita compares well to the weighted average net debt of $1,781 per capita in the other states.
Table 6.2
Projected net debt per capita at 30 June 2011
| | | | | | | | | | | | | | | | | | | | | | | | |
| | | QLD | | | NSW | | | VIC | | | WA | | | SA | | | TAS | |
Net debt per capita ($) | | | (1,472 | ) | | | 1,905 | | | | 2,091 | | | | 1,252 | | | | 1,732 | | | | (825 | ) |
Sources: State Budget Papers for QLD, Vic, WA. Mid year review for NSW, SA and Tas. Population data from Australian Government Budget Paper No.3, 2010-11.
CASH FLOWS
The cash flow statement provides information on the Government’s estimated cash flows from its operating, financing and investing activities.
The cash flow statement records estimated cash payments and cash receipts and hence differs from accrued revenue and expenditure recorded in the operating statement. In particular, the operating statement often records revenues and expenses that do not have an associated cash flow (for example, depreciation expense). The timing of recognition of accrued revenue or expense in the operating statement may differ from the actual cash disbursement or receipt (for example, tax equivalents). A reconciliation between the cash flows from operations and the operating statement is provided later in this chapter.
| | | | |
| 112 | | Budget Strategy and Outlook 2010-11 | | |
The cash flow statement also records cash flows associated with investing and financing activities that are otherwise reflected in the balance sheet. For example, purchases of capital equipment are recorded in the cash flow statement and impact on the balance sheet through an increase in physical assets.
The cash flow statement provides the cash surplus (deficit) measure which is comprised of the net cash flow from operating activities plus the net cash flow from investment in non-financial assets (or physical capital).
The Australian Bureau of Statistics Government Finance Statistics (GFS) surplus (deficit) is derived by including the initial increase in liability at the inception of finance leases in the cash surplus (deficit). This measure is also used to derive the Loan Council Allocation nomination, provided in Chapter 9.
A cash deficit of $6.396 billion is forecast in 2010-11 for the General Government sector, with the cash result forecast to remain in deficit in the outyears. Apart from the cash impact of recurrent operating deficits in outyears, the major factor contributing to lower cash results is the planned capital program. Total General Government capital purchases of $8.335 billion are budgeted for 2010-11.
Over the period 2010-11 to 2013-14, capital expenditure is expected to total $26.204 billion in the General Government sector. This substantial investment in capital drives the cash deficits.
Table 6.3 provides summary cash flow information for the General Government sector for 2009-10, 2010-11 and the outyears. Detailed cash flow tables are included in Chapter 9.
| | | | |
| | Budget Strategy and Outlook 2010-11 | | 113 |
Table 6.3
General Government sector: summary of budgeted cash flows1
| | | | | | | | | | | | | | | | | | | | | | | | |
| | | 2009-10
Budget2
$ million | | | 2009-10
Est. Act.
$ million | | | 2010-11
Budget
$ million | | | 2011-12
Projection
$ million | | | 20012-13
Projection
$ million | | | 2013-14
Projection
$ million | |
| | | | | | |
Cash receipts from operating activities | | | 38,341 | | | | 41,284 | | | | 41,582 | | | | 43,119 | | | | 44,490 | | | | 46,519 | |
| | | | | | |
Cash payments for operating activities | | | (36,160 | ) | | | (38,127 | ) | | | (39,847 | ) | | | (40,473 | ) | | | (41,942 | ) | | | (43,549 | ) |
| | | | | | |
Net cash inflows from operating activities | | | 2,181 | | | | 3,158 | | | | 1,735 | | | | 2,646 | | | | 2,548 | | | | 2,971 | |
| | | | | | |
Net cash flows from investing activities | | | (10,665 | ) | | | (10,716 | ) | | | (9,493 | ) | | | (9,340 | ) | | | (7,199 | ) | | | (6,148 | ) |
| | | | | | |
Receipts from financing activities | | | 7,937 | | | | 5,166 | | | | 7,615 | | | | 6,719 | | | | 4,643 | | | | 3,177 | |
| | | | | | |
Net increase/(decrease) in cash held | | | (546 | ) | | | (2,393 | ) | | | (143 | ) | | | 25 | | | | (8 | ) | | | (1 | ) |
| | | | | | |
Derivation of cash surplus (deficit) | | | | | | | | | | | | | | | | | | | | | | | | |
| | | | | | |
Net cash inflows from operating activities | | | 2,181 | | | | 3,158 | | | | 1,735 | | | | 2,646 | | | | 2,548 | | | | 2,971 | |
| | | | | | |
Net cash flows from investments in non-financial assets | | | (9,020 | ) | | | (8,411 | ) | | | (8,131 | ) | | | (7,294 | ) | | | (5,454 | ) | | | (4,478 | ) |
| | | | | | |
Equals cash surplus/(deficit) | | | (6,838 | ) | | | (5,254 | ) | | | (6,396 | ) | | | (4,648 | ) | | | (2,906 | ) | | | (1,507 | ) |
Notes:
| 1. | Numbers may not add due to rounding. |
| 2. | Numbers have been restated where subsequent changes in classification have occurred. |
| | | | |
| 114 | | Budget Strategy and Outlook 2010-11 | | |
Cash flows from operating activities
Table 6.4 provides a disaggregation of operating cash flows.
Table 6.4
General Government sector: cash flows from operating activities1
| | | | | | | | | | | | |
| | | 2009-10
Budget 2
$ million | | | 2009-10
Est. Act.
$ million | | | 2010-11
Budget
$ million | |
| | | |
Cash receipts from operating activities | | | | | | | | | | | | |
| | | |
Taxes received | | | 9,286 | | | | 9,473 | | | | 10,190 | |
Grants and subsidies received | | | 18,735 | | | | 20,380 | | | | 18,883 | |
Sales of goods and services | | | 4,050 | | | | 4,482 | | | | 4,485 | |
Interest receipts | | | 2,010 | | | | 2,231 | | | | 2,131 | |
Dividend and income tax equivalents | | | 1,042 | | | | 1,089 | | | | 1,062 | |
Other receipts | | | 3,219 | | | | 3,630 | | | | 4,832 | |
| | | |
Total operating receipts | | | 38,341 | | | | 41,284 | | | | 41,582 | |
| | | |
Cash payments for operating activities | | | | | | | | | | | | |
| | | |
Payments for employees | | | (16,975 | ) | | | (17,663 | ) | | | (18,435 | ) |
Payments for goods and services | | | (8,442 | ) | | | (9,128 | ) | | | (9,298 | ) |
Grants and subsidies | | | (9,097 | ) | | | (9,789 | ) | | | (10,135 | ) |
Interest paid | | | (883 | ) | | | (827 | ) | | | (1,240 | ) |
Other payments | | | (762 | ) | | | (720 | ) | | | (738 | ) |
| | | |
Total operating payments | | | (36,160 | ) | | | (38,127 | ) | | | (39,847 | ) |
| | | |
Net cash inflows from operating activities | | | 2,181 | | | | 3,158 | | | | 1,735 | |
Notes:
| 1. | Numbers may not add due to rounding. |
| 2. | Numbers have been restated where subsequent changes in classification have occurred. |
Cash inflows from operating activities include receipts from taxes, grants from the Australian Government, fees and charges levied on the provision of goods and services, interest receipts from investments and dividend and income tax receipts from public non-financial and financial corporations.
Taxes received by the General Government sector are forecast at $10.190 billion in 2010-11, an increase of 7.6% or $717 million on the 2009-10 estimated actual of $9.473 billion. This primarily reflects increases in transfer duty and land tax, brought about by an improved outlook for the owner-occupied property sector and payroll tax as a result of a stronger labour market outlook.
| | | | |
| | Budget Strategy and Outlook 2010-11 | | 115 |
Grants and subsidies received are forecast at $18.883 billion in 2010-11, a decrease of $1.497 billion or 7.4% on the 2009-10 estimated actual of $20.380 billion primarily as a result of decreased grant funding from the Commonwealth.
Sales of goods and services are forecast at $4.485 billion for 2010-11, an increase of less than 1% on the 2009-10 estimated actual of $4.482 billion, and includes fines and regulatory fees, user charges and rental income.
Interest receipts are expected to decrease in 2010-11 by $100 million to $2.131 billion. This reflects earnings of 7.5% on the debt instrument issued by QTC and the return to long term expected earnings on investments held on behalf of former defined benefit members and statutory bodies.
Dividends and income tax equivalents received from public non-financial and public financial corporations are expected to decrease in 2010-11 by $27 million to $1.062 billion.
Other receipts are forecast at $4.832 billion in 2010-11 an increase of 33.1% primarily as a result of increased coal and mining royalties.
Operating cash outflows represent payment for goods and services, wages and salaries, finance costs and grants and subsidies paid to households, businesses and other Government agencies. In 2010-11 the largest cash disbursement is payments for employees at $18.435 billion or 46.3% of total cash payments from operating activities.
In 2010-11, payments for goods and services are expected to increase 1.9 % to $9.298 billion primarily as a result of expanded service delivery.
Cash payments for grants and subsidies are expected to increase by $346 million in 2010-11 to $10.135 billion. This figure includes recurrent grants paid by the Australian Government through the State to non-state schools, grants paid to industry and grants to non-profit institutions. This item also includes community service obligation payments to the energy sector and QR Limited, and capital grants which are largely paid to local government authorities to fund capital works.
Interest paid is expected to increase by $413 million reflecting higher borrowings for the capital program.
Other payments mainly comprise sundry expenditure such as insurance claims and Goods and Services Tax (GST) remitted to the Australian Taxation Office.
| | | | |
| 116 | | Budget Strategy and Outlook 2010-11 | | |
Cash flows from investments
Cash flows from investments include both financial and non-financial assets. Table 6.5 provides a disaggregation of investment cash flows into the different types.
Table 6.5
General Government sector: cash flows from investing activities
| | | | | | | | | | | | |
| | | 2009-10
Budget 1
$ million | | | 2009-10
Est. Act.
$ million | | | 2010-11
Budget
$ million | |
| | | |
Cash flows from investments in non-financial assets | | | (9,020 | ) | | | (8,411 | ) | | | (8,131 | ) |
| | | |
Net cash flows from investments in financial assets for policy purposes | | | (307 | ) | | | (789 | ) | | | (1 | ) |
| | | |
Net cash flows from investments in financial assets for liquidity purposes | | | (1,338 | ) | | | (1,516 | ) | | | (1,361 | ) |
| | | |
Net cash flows from investing activities | | | (10,665 | ) | | | (10,716 | ) | | | (9,493 | ) |
Note:
| 1. | Numbers have been restated where subsequent changes in classification have occurred. |
The largest cash disbursement for the Government, outside of recurrent operations, is for investments in non-financial assets. This represents the Government’s capital works program which provides for infrastructure such as schools, hospitals, roads and bridges.
Cash outflows from investments in non-financial assets are estimated to decrease to $8.411 billion in 2009-10 from original budget estimates of $9.020 billion due to capital deferrals. Cash outflows are projected to reduce further in the outyears as capital projects finalise.
The cash expenditure on investments in non-financial assets differs from the estimates of capital works expenditure in Budget Paper 3 – Capital Statement. The estimates contained in that paper are on a gross basis and incorporate both departmental agencies and the Public Non-financial Corporations sector. In addition, Budget Paper 3 only includes capital expenditure (including capital grants) within Queensland and does not offset proceeds from asset sales.
| | | | |
| | Budget Strategy and Outlook 2010-11 | | 117 |
Apart from investing in infrastructure, governments also manage financial assets in order to finance overall expenditures. In addition, Queensland manages financial assets set aside to provide for future employee benefits (for example, superannuation and long service leave). The Government manages its financial assets through a combination of borrowing or investing funds and reducing or increasing equity in government or private sector entities. Investments in financial assets include activities relating to both policy and liquidity.
Investments in financial assets for policy purposes include net equity injections into Government and other business enterprises and the net cash flow from disposal or return of equity in Government business enterprises.
The estimated net cash outflow from investments for policy purposes in 2009-10 is higher than the forecast outflow of $307 million in the 2009-10 Budget due to additional equity injections to support various energy and water programs.
Cash outflows from investments for policy purposes in 2010-11 of $1 million reflect equity transactions by the General Government sector with public non-financial and public financial corporations partially offset by the return of proceeds on the long term lease of state-owned timber plantations. The licence and related asset and liabilities of Forestry Plantations Queensland will be sold for $603 million (including $28.6 million of stamp duty).
Net cash flows from investments in financial assets for liquidity purposes represent net investment in financial assets to cover liabilities such as superannuation, other employee entitlements and insurance.
The 2009-10 estimated net cash outflow from investments in financial assets for liquidity purposes of $1.516 million is slightly higher than the forecast outflow in the 2009-10 Budget due to the higher than forecast return on investments held for former defined benefit members and their subsequent reinvestment, as well as the liquidation of investments to make beneficiary payments.
Net cash outflows from investments in financial assets for liquidity purposes are estimated to be $1.361 billion in 2010-11 as returns on former defined benefits member assets return to the long term rate of 7.5%.
| | | | |
| 118 | | Budget Strategy and Outlook 2010-11 | | |
Cash flows from financing activities
Cash flows generated from financing activities are outlined in Table 6.6 below.
Table 6.6
General Government sector: cash flows from financing activities1
| | | | | | | | | | | | |
| | | 2009-10
Budget 2
$ million | | | 2009-10
Est. Act.
$ million | | | 2010-11
Budget
$ million | |
| | | |
Advances received (net) | | | (17 | ) | | | (16 | ) | | | (14 | ) |
| | | |
Borrowing (net) | | | 7,954 | | | | 5,182 | | | | 7,629 | |
| | | |
Net cash flows from financing activities | | | 7,937 | | | | 5,166 | | | | 7,615 | |
Note:
| 1. | Numbers may not add due to rounding. |
| 2. | Numbers have been restated where subsequent changes in classification have occurred. |
Net cash flows from financing activities include cash flows from net borrowing (increase in borrowing less redemption), net advances (gross investment in new loans less redemption of loans issued) and other financing.
In 2009-10 net cash inflows from financing activities are estimated at $5.166 billion. This mainly represents borrowings for the State’s capital program and is lower than budgeted due to the improved operating result and capital deferrals.
Net cash inflows from financing activities for 2010-11 are estimated at $7.615 billion, reflecting borrowings to partially fund the General Government’s capital program of $8.335 billion.
| | | | |
| | Budget Strategy and Outlook 2010-11 | | 119 |
RECONCILIATION OF OPERATING CASH FLOWS TO THE OPERATING STATEMENT
Table 6.7 provides a reconciliation of the cash flows from operating activities to the operating result for the General Government sector.
Table 6.7
General Government sector: reconciliation of cash flows
from operating activities to accrual operating activities 1
| | | | | | | | | | | | |
| | | 2009-10
Budget 2
$ million | | | 2009-10
Est. Act.
$ million | | | 2010-11
Budget
$ million | |
Revenue from transactions | | | 37,192 | | | | 39,689 | | | | 40,606 | |
Plus/(less) movement in tax equivalent and dividend receivables | | | (109 | ) | | | 83 | | | | (399 | ) |
Plus GST receipts | | | 1,355 | | | | 1,564 | | | | 1,568 | |
Plus/(less) movement in other receivables | | | (97 | ) | | | (51 | ) | | | (193 | ) |
Equals cash receipts from operating activities | | | 38,341 | | | | 41,284 | | | | 41,582 | |
| | | |
Expenses from transactions | | | 39,146 | | | | 39,976 | | | | 42,352 | |
(Less) non-cash items | | | | | | | | | | | | |
Depreciation and amortisation expense | | | (2,773 | ) | | | (2,479 | ) | | | (2,822 | ) |
Accrued superannuation expense | | | (2,381 | ) | | | (2,108 | ) | | | (2,099 | ) |
Accrued employee entitlements | | | (471 | ) | | | (507 | ) | | | (532 | ) |
Other accrued costs | | | (228 | ) | | | (366 | ) | | | (281 | ) |
Plus superannuation benefits paid – defined benefit | | | 381 | | | | 498 | | | | 762 | |
Plus/(less) movement in employee entitlement provisions | | | 394 | | | | 751 | | | | 300 | |
Plus/(less) GST paid | | | 1,386 | | | | 1,611 | | | | 1,615 | |
Plus/(less) movement in other provisions and payables | | | 706 | | | | 752 | | | | 551 | |
Equals cash payments for operating activities | | | 36,160 | | | | 38,127 | | | | 39,847 | |
Notes:
| 1. | Numbers may not add due to rounding. |
| 2. | Numbers have been restated where subsequent changes in classification have occurred. |
The main difference between the accrual operating statement and the cash flow relates to the timing of cash payments and receipts and their recognition in accrual terms and the inclusion of non-cash expenses and revenues. The largest difference is on the expenses (expenditure) side, with large non-cash expenses associated with depreciation and superannuation. Differences due to the timing of receipt or payment of amounts are recorded as either a receivable or payable in the balance sheet.
| | | | |
| 120 | | Budget Strategy and Outlook 2010-11 | | |
| 7 | INTERGOVERNMENTAL FINANCIAL RELATIONS |
FEATURES
| • | | Queensland, like all states, is becoming increasingly reliant on Australian Government funding, with approximately 45% of Queensland’s revenue being sourced from the Australian Government in 2010-11. |
| • | | Funding provided under Payments for Specific Purposes funds 18% of total State expenses and 35% of State capital expenditure. This includes $1.060 billion in funding for capital expenditure under the Australian Government’s economic stimulus measures. |
| • | | The Australian and State Governments have agreed to undertake a review of the funding agreements for Specific Purpose Payments to ensure that the payment structure facilitates agreed reform objectives. |
| • | | Since the last budget, GST revenue from the Australian Government to all states has been revised upwards by $17.3 billion over the period 2009-10 to 2012-13. However, this does not compensate for the $25 billion downward revisions that resulted from the global financial crisis. |
| • | | The Commonwealth Grants Commission’s 2010 Review Report on State Revenue Sharing Relativities reduced Queensland’s underlying share of GST by $19.8 million. Methodology changes, including the direct recognition of capital costs, increased Queensland’s share by $878.6 million. However, this was offset by a loss of $388.0 million from the averaging period being reduced from five to three years, and a loss of $510.4 million due to the relative strength of Queensland’s economy over the assessment years 2006-07 to 2008-09. |
| • | | Mining revenue represents 70% of the revenue based redistribution of GST amongst the States. After this redistribution is taken into account, Queensland’s net mining revenue is less than that of Victoria and New South Wales. |
| • | | In per capita terms, Queensland’s share of GST in 2010-11 will be similar to that in 2005-06, with GST per capita not expected to regain the peak of 2007-08 until 2013-14. |
| • | | The Council of Australian Governments (COAG) reached agreement on the establishment of a National Health and Hospitals Network, representing a major reform of federal and state roles and responsibilities in the management and funding of the health care system. |
| • | | The Queensland Government will provide $1.3 billion in grants to Queensland local government authorities in 2010-11. |
| | | | |
| | Budget Strategy and Outlook 2010-11 | | 121 |
FEDERAL FINANCIAL ARRANGEMENTS
Federal financial relations are characterised by a disparity between the revenue-raising capacity and the expenditure responsibilities of the Australian and state governments respectively. This mismatch is known as vertical fiscal imbalance (VFI). The Australian Government collects the major share of taxation revenues and states must rely on grants from the Australian Government to meet their expenditure requirements.
Since the introduction of the Australian Government’s national tax reforms in 2000, state dependence on Australian Government funding has increased further. Chart 7.1 shows all states’ funding sources for 1999-2000 and 2010-11. In 1999-2000 the states received 35% of their revenues from the Australian Government. This is estimated to increase to 49% in 2010-11 as a result of changes to intergovernmental fiscal arrangements. In contrast, the proportion of the states’ revenues from state taxes has declined from 40% in 1999-2000 to an estimated 29% in 2010-11.
Chart 7.1
Revenue sources, all states, 1999-2000 and 2010-111
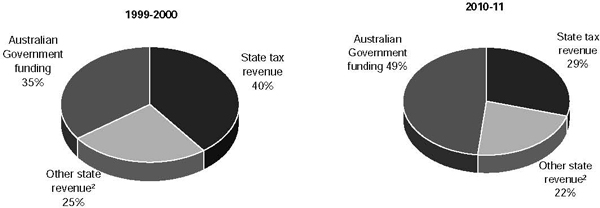
Notes:
| 1. | 2010-11 data are estimates. |
| 2. | Includes user charges, interest earnings, contributions from trading enterprises and mining revenue. |
Sources: ABS Government Finance Statistics Cat No. 5512.0 and state and Australian Government Budget Papers.
The framework for federal financial arrangements includes four categories of funding provided to the states:
| • | | National Specific Purpose Payment (SPP) funding agreements covering health, education, skills and workforce development, disability and housing |
| • | | National Partnership (NP) payments for specific purposes or reform-linked objectives |
| • | | other general revenue assistance payments. |
| | | | |
| 122 | | Budget Strategy and Outlook 2010-11 | | |
Australian Government funding to states
Table 7.1 shows that Australian Government payments to the states in 2010-11 are expected to total $94.082 billion, a decrease of $4.465 billion or 4.5% compared with 2009-10.
Table 7.1
Estimated Australian Government payments to the states, 2009-10 and 2010-111
| | | | | | | | | | | | | | | | | | | | |
| | | 2009-10
$ million | | | 2010-11
$ million | | | Change
Nominal
Terms % | | | Change
Real2
Terms % | | | Change
Real2 Per
Capita % | |
Payments for specific purposes | | | | | | | | | | | | | | | | | | | | |
National Partnership payments | | | 28,892 | | | | 19,347 | | | | | | | | | | | | | |
Specific Purpose Payments | | | 24,409 | | | | 26,098 | | | | | | | | | | | | | |
Total payments for specific purposes | | | 53,301 | | | | 45,445 | | | | -14.7 | | | | -17.4 | | | | -18.8 | |
GST revenue | | | 44,529 | | | | 47,930 | | | | 7.6 | | | | 4.2 | | | | 2.5 | |
Other general revenue3 | | | 717 | | | | 707 | | | | | | | | | | | | | |
Total payments | | | 98,547 | | | | 94,082 | | | | -4.5 | | | | -7.5 | | | | -9.1 | |
Notes:
| 1. | Numbers may not add due to rounding. |
| 2. | Deflated by the 2009-10 year average national inflation forecast of 3.25% and national population growth of 1.71%. |
| 3. | Other general revenue includes royalty sharing arrangements (eg. offshore petroleum royalty revenues), compensation for Australian Government policy decisions and ACT municipal services. |
Source: Australian Government Budget Paper No.3, 2010-11.
Total payments for specific purposes (including both SPPs and NPs) in 2010-11 are expected to be $45.445 billion, an 18.8% decrease from 2009-10 in real per capita terms. The main reason for the decline in Payments for Specific Purposes to the States is the decline in Economic Stimulus funding from $14.338 billion in 2009-10 to $6.749 billion in 2010-11.
GST revenue from the Australian Government to all states is expected to increase from $44.5 billion in 2009-10 to $47.9 billion in 2010-11, an increase of 7.6% in nominal terms. In real per capita terms, GST is expected to increase by 2.5% in 2010-11. Since the Australian Government’s 2009-10 Budget, GST estimates have been increased by $17.3 billion over the period 2009-10 to 2012-13. Although the outlook for GST revenue has improved over the last year, current estimates of the GST pool are still below the level needed to regain the downward revisions that resulted from the global financial crisis (more than $25 billion over the period 2008-09 to 2011-12).
State shares of Australian Government funding
Table 7.2 shows the expected shares of total Australian Government payments to each state for 2010-11 compared with each state’s population share. Queensland’s anticipated share of total Australian Government funding of 19.3% in 2010-11 will be less than its population share of 20.3%.
| | | | |
| | Budget Strategy and Outlook 2010-11 | | 123 |
Table 7.2
Relative shares of Australian Government payments to the states, 2010-111
| | | | | | | | | | | | |
| | | Share of
payments % | | | Share of
population % | | | Relative share2
% | |
New South Wales | | | 30.8 | | | | 32.3 | | | | 95.5 | |
Victoria | | | 23.1 | | | | 24.8 | | | | 93.0 | |
Queensland | | | 19.3 | | | | 20.3 | | | | 95.1 | |
Western Australia | | | 9.5 | | | | 10.3 | | | | 91.6 | |
South Australia | | | 8.7 | | | | 7.3 | | | | 118.9 | |
Tasmania | | | 3.1 | | | | 2.3 | | | | 136.1 | |
Australian Capital Territory | | | 1.7 | | | | 1.6 | | | | 105.9 | |
Northern Territory | | | 3.8 | | | | 1.0 | | | | 367.1 | |
Notes:
| 1. | Numbers may not add due to rounding. |
| 2. | A state’s relative share is measured as its funding share as a percentage of its population share. |
Source: Australian Government Budget Paper No. 3, 2010-11.
Queensland’s share of Australian Government funding
Table 7.3 details Queensland’s share of estimated Australian Government payments in 2010-11 as outlined in the Commonwealth Budget Papers, and the difference from its population share. Queensland expects to receive $8.906 billion of GST revenue in 2010-11, $833 million less than a per capita share. In the same year, payments for specific purposes are forecast to be $9.278 billion or 20.4% of total payments for specific purposes. In overall terms Queensland is estimated to receive $788 million less than a per capita share of Australian Government funding in 2010-11.
Table 7.3
Queensland’s share of estimated Australian Government payment, 2010-11
| | | | | | | | | | | | |
| | | Queensland’s
Share
$ million | | | Queensland’s
Share
% | | | Difference from
Population Share
$ million | |
Payments for specific purposes | | | | | | | | | | | | |
National Partnership payments | | | 4,082 | | | | 21.1 | | | | 151 | |
Specific Purpose Payments | | | 5,195 | | | | 19.9 | | | | -106 | |
Total payments for specific purposes | | | 9,278 | | | | 20.4 | | | | 44 | |
GST revenue1 | | | 8,906 | | | | 18.6 | | | | -833 | |
Total payments2 | | | 18,183 | | | | 19.3 | | | | -788 | |
Notes:
| 1. | Total GST revenue is untied in 2010-11. From 2011-12, a proportion of GST will be dedicated to health and hospital services. |
| 2. | Numbers may not add due to rounding |
Source: Australian Government Budget Paper No. 3, 2010-11.
| | | | |
| 124 | | Budget Strategy and Outlook 2010-11 | | |
Queensland’s reliance on Australian Government funding, as shown in Chart 7.2, is consistent with the national trend, with the share of total funding sourced from the Australian Government increasing from 35% in 1999-2000 to an estimated 45% in 2010-11.
Chart 7.2
Revenue sources, Queensland, 1999-2000 and 2010-11
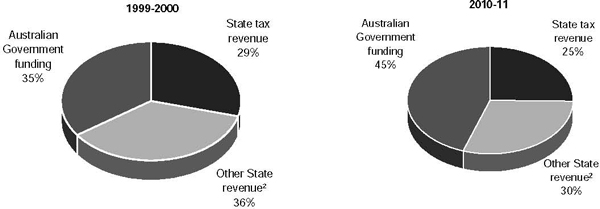
Notes:
| 1. | 2010-11 data are estimates. |
| 2. | Includes user charges, interest earnings, contributions from trading enterprises and mining revenue. |
Sources: ABS Government Finance Statistics Cat No.5512.0 and Queensland Budget estimates
AUSTRALIAN GOVERNMENT PAYMENTS FOR SPECIFIC PURPOSES
Structure of Specific Payments
The framework for Australian Government payments to the States is set out in the Intergovernmental Agreement for Federal Financial Relations (IGA). Under the IGA, Australian Government payments comprise five National Specific Purpose Payments (health, education, skills and workforce, disability services, and housing) and a range of national partnership payments, which support the delivery of specified projects, facilitate reforms or reward jurisdictions that deliver on national reforms or achieve service delivery improvements. Copies of the agreements can be found on the Federal Financial Relations web site maintained by the Australian Treasury at www.federalfinancialrelations.gov.au.
| | | | |
| | Budget Strategy and Outlook 2010-11 | | 125 |
Major funding agreements
The 2010-11 Australian Government Budget provided funding for State services and infrastructure as outlined below.
Health
Total Australian Government Payments for 2010-11 for Queensland’s health services and infrastructure will amount to $2.797 billion. This includes $169.3 million in new funding as part of the National Health and Hospital Network package. The Australian Government’s proposed changes to the Health system, including the financial impacts for Queensland are set out in Box 7.2. The major payments for the Government sector in 2010-11 are for:
| | • | | the National Healthcare SPP ($2.393 billion) |
| | • | | National Health and Hospitals Network package ($169.3 million) |
| | • | | Essential Vaccines ($71.4 million) |
| | • | | Elective Surgery waiting list reduction program ($51.5 million) |
| | • | | Health and Hospital Fund projects ($53.8 million). |
Education and training
Total Australian Government Payments for 2010-11 for Queensland’s education and training services and infrastructure will amount to $3.658 billion, comprising $3.301 billion for schools and early childhood and $357.6 million for skills and workforce development. The Australian Government Payments for Schools includes $1.744 billion for onpassing to Non-Government Schools. The major payments for the Government sector are for:
| | • | | the National Schools Agreement ($696.8 million) |
| | • | | the National Skills and Workforce Development Agreement ($261.8 million) |
| | • | | the Nation Building and Jobs Plan – Building the Education Revolution ($684.2 million) |
| | • | | the Productivity Places Program NP ($85.9 million). |
Transport infrastructure
Total Australian Government Payments for 2010-11 for Queensland’s transport and main roads infrastructure and services will amount to $562.8 million. The major payments for the Government sector are for:
| | • | | Nation Building Program ($539.7 million) |
| | • | | Black Spot Projects ($12.1 million). |
| | | | |
126 | | Budget Strategy and Outlook 2010-11 | | |
Housing
Total Australian Government Payments for 2010-11 for Queensland’s housing and homelessness services and infrastructure will amount to $654.9 million, which includes $240.2 million for the National Affordable Housing SPP, as well as other major payments for the Government sector for:
| | • | | the Nation Building and Jobs Plan – Social Housing Initiative ($302.6 million) |
| | • | | Remote Indigenous Housing ($66.7 million). |
Disability services
Total Australian Government Payments for 2010-11 for Queensland’s disability and community care services will amount to $513.9 million, which includes $201.7 million for the National Disability SPP and $308.6 million for the Home and Community Care program.
Local government
Payments to local government consist of general purpose Financial Assistance Grants and untied grants for local roads. Total Australian Government Payments for Local Government in Queensland for 2010-11 amount to $539.8 million.
Other
Other payments for specific purposes include funding for a range of programs including environment, water sustainability and natural disaster relief.
Review of Agreements under the IGA
The IGA sets out a number of objectives and design principles to assist in the development of new agreements between the States and the Australian Government. Using these principles, six National Agreements have been finalised and a significant number of National Partnerships and Implementation Plans developed. The process of developing National Partnerships is ongoing with consultation occurring between jurisdictions.
However, given the speed at which the reform process has occurred, there are concerns that a number of agreements do not always comply with the IGA’s design principles. In particular, the significant number of agreements and reporting requirements, combined with the continued use of input controls, has the potential to impede the flexibility of States to deliver outcomes efficiently and effectively.
| | | | |
| | Budget Strategy and Outlook 2010-11 | | 127 |
On 7 December 2009, the Council of Australian Governments (COAG) agreed that Heads of Treasuries would undertake a review of National Agreements, National Partnerships and Implementation Plans and provide a final report to COAG by 31 December 2010.
The review will consider whether existing agreements comply with the IGA in respect of:
| • | | clear objectives, outcomes and outputs |
| • | | clearly specified roles and responsibilities |
| • | | strategic consideration of the appropriate form for implementing a policy proposal, including options to reduce the number of agreements |
| • | | the quantity and quality of performance indicators and benchmarks, including the requirement that performance reporting contributes to public transparency |
| • | | redesigning agreements that are not consistent with the design principles set out in the IGA. |
The Heads of Treasuries review will consult with First Ministers’ departments, relevant federal, state and territory portfolio agencies, the COAG Reform Council (CRC) and others as appropriate and will identify options to improve the efficiency and effectiveness of the federal financial relations framework.
A circular on developing National Partnerships, prepared by Australian Treasury in collaboration with State Treasuries and First Ministers’ Departments, was approved by the Ministerial Council for Federal Financial Relations in April 2010 to provide guidance for federal and state portfolio agencies in developing new National Partnerships. A similar circular is proposed for the development of Implementation Plans.
Performance Reporting under the IGA
A key part of the financial reforms agreed by COAG in November 2008 was the implementation of a new performance reporting framework to provide improved transparency and accountability for Commonwealth funding arrangements. Under this framework the COAG Reform Council (CRC) plays a major role in collecting, analysing and publishing performance information.
The CRC was established by COAG to assist in driving the COAG reforms. The CRC achieves this through monitoring, assessment and reporting performance of all governments against outcomes and benchmarks set out in the National Agreements and National Partnerships. This also includes advising COAG on whether States have reached milestones required for reward payments contained in some National Partnerships.
| | | | |
| 128 | | Budget Strategy and Outlook 2010-11 | | |
The CRC released the baseline performance reports for the National Education Agreement and National Agreement for Skills and Workforce Development in 2009 and is currently preparing baseline performance reports, which are scheduled for publication in June 2010, for the following agreements:
| • | | National Healthcare Agreement |
| • | | National Disability Agreement |
| • | | National Affordable Housing Agreement |
| • | | National Indigenous Reform Agreement. |
A report on the aggregate pace of activity across the COAG reform agenda is also scheduled for publication in August 2010.
The annual reports prepared by the CRC for COAG present performance data and analyse the performance of governments, highlight good practice and performance, and reflect the contribution of governments to achieving performance benchmarks and improvements against outcomes, outputs and performance indicators.
Impact of tied Australian Government Funding on the Queensland Budget
The table below considers the impact of Australian Government tied payments to Queensland for specific purposes in 2010-11.
Australian Government funding in this table includes grants to be received in 2010-11 plus Australian Government funding carried forward from previous years, less any deferrals of funding to outyears. On this basis, Queensland expects to expend $7.508 billion of Australian Government tied funding for recurrent activities and $2.944 billion for capital expenditure.
In total, the Australian Government directly provides funding equivalent to 18% of Queensland’s recurrent expenses and 35% of capital expenditure.
| | | | |
| | Budget Strategy and Outlook 2010-11 | | 129 |
Table 7.4
Impact of Australian Government Tied payments 2010-112
| | | | | | | | | | | | |
| | | Payments
$ million | | | State Expenditure
$ million | | | % | |
Recurrent expenditure | | | | | | | | | | | | |
Health | | | 2,666.6 | | | | 10,603.2 | | | | 25 | |
Education and training | | | 3,124.2 | | | | 9,924.1 | | | | 31 | |
Social Security and Welfare | | | 548.0 | | | | 2,944.9 | | | | 19 | |
Housing and Community Amenities | | | 603.6 | | | | 1,848.3 | | | | 33 | |
Other | | | 565.8 | | | | 17,031.1 | | | | 3 | |
Total | | | 7,508.3 | | | | 42,351.7 | | | | 18 | |
| | | |
Capital Expenditure | | | | | | | | | | | | |
Education and Training | | | 838.5 | | | | 1,256.0 | | | | 67 | |
Housing and Community Amenities | | | 454.9 | | | | 667.1 | | | | 68 | |
Transport and Communications | | | 1,530.0 | | | | 3,365.9 | | | | 45 | |
Other | | | 120.6 | | | | 3,045.8 | | | | 4 | |
Total | | | 2,944.0 | | | | 8,334.7 | | | | 35 | |
Notes:
| 1. | Numbers may not add due to rounding. |
| 2. | Payments for specific purposes include SPPs and National Partnerships. |
Source: Queensland Treasury
The Australian Government provides significant funding support in the Health, Education, Disability and Housing sectors, as well as providing substantial funding support for Transport infrastructure.
The level of funding for capital expenditure in 2010-11 is higher than usual because of the inclusion of the Australian Government’s economic stimulus funding. Capital expenditure under stimulus measures is expected to be around $1.060 billion in 2010-11 but will decline substantially to around $144.2 million in 2011-12.
Policy implications of tied funding
Australian Government Funding for Specific Purposes has a significant impact on the Queensland Budget both through the services which are funded and also through the degree of influence which flows from that funding. This influence is manifested in two major respects, firstly through a high level of policy influence in the National Agreements and National Partnerships between the Australian Government and the State, and also through the National Performance Reporting Framework.
| | | | |
| 130 | | Budget Strategy and Outlook 2010-11 | | |
As noted above, the Australian Government contributes 18% of the funding for the State recurrent expenditure. However, the SPP funding agreements and National Partnerships contain agreed Australian Government/State Government objectives and outcomes for the major sectors of the Budget. These cover virtually all of the health and education sectors, as well as state housing and disability service sectors. In effect, around 57% of the State Budget is subject to some form of Australian Government control through SPP and NP project and performance agreements.
GST REVENUE PAYMENTS
Commonwealth Grants Commission
The Commonwealth Grants Commission (CGC) advises the Australian Government on the distribution of GST revenue among the states. Under its terms of reference the CGC is required to determine its recommendations on the basis of horizontal fiscal equalisation, as detailed in Box 7.1.
Box 7.1
Horizontal fiscal equalisation and distribution of GST
Commonwealth Grants Commission
The Commonwealth Grants Commission (CGC) advises the Australian Government on the distribution of GST revenue among the states and each year updates the financial, economic and demographic data that underpin its recommendations.
Horizontal Fiscal Equalisation
The Australian Government distributes GST revenue to states based on the principle of horizontal fiscal equalisation (HFE), using per capita relativities recommended by the CGC.
The principle of HFE is that state governments should receive funding from the pool of goods and services tax revenue such that, after allowing for material factors affecting revenues and expenditures, each would have the fiscal capacity to provide services and the associated infrastructure at the same standard, if each made the same effort to raise revenue from its own sources and operated at the same level of efficiency.
A distribution based on the principle of HFE recognises the different financial capacities of the states, particularly that some states have inherently greater capacity to raise revenue and that some states have inherently greater costs to meet in providing services to an Australian standard.
More information on HFE and GST distribution can be accessed through the Commonwealth Grants Commission website: www.cgc.gov.au.
2010 Review Report on State Revenue Sharing Relativities
The Commonwealth Grants Commission (the CGC) released its Report on GST Revenue Sharing Relativities – 2010 Review on 26 February 2010. The final report is the culmination of the five year review of the CGC’s assessment methodologies which will be used to distribute GST revenue, including GST dedicated to health (from 2011-12).
| | | | |
| | Budget Strategy and Outlook 2010-11 | | 131 |
For the 2010 Review, the CGC investigated ways to improve the quality of the data used in their assessments. The CGC also aimed to simplify the assessments while ensuring that the outcomes remain reliable, robust and acceptable. The Review was conducted using an iterative process in which all States had the opportunity to contribute to the outcomes.
In underlying terms, Queensland will receive $19.8 million less GST revenue in 2010-11 compared with 2009-10, due to changes to state and territory relativities detailed in the report (Table 7.5). Changes in the CGC’s methodology increased Queensland’s share of GST by $878.6 million. However, this gain was offset by a loss of $388.0 million from the averaging period being reduced from five to three years and a loss of $510.4 million due to Queensland’s economic circumstances relative to other states over the 2007-08 to 2008-09 assessment period.
Table 7.5
Components of underlying change in states share of GST revenue
2009-10 to 2010-111
| | | | | | | | | | | | | | | | | | | | | | | | | | | | | | | | |
| | | NSW
$ million | | | VIC
$ million | | | QLD
$ million | | | WA
$ million | | | SA
$ million | | | TAS
$ million | | | ACT
$ million | | | NT
$ million | |
Methodology Change | | | -701.1 | | | | -35.3 | | | | 878.6 | | | | 107.5 | | | | 21.1 | | | | -1.4 | | | | -83.8 | | | | -185.6 | |
| | | | | | | | |
3 year averaging | | | 579.0 | | | | 186.1 | | | | -388.0 | | | | -490.2 | | | | 65.2 | | | | -12.4 | | | | 13.5 | | | | 46.9 | |
| | | | | | | | |
Economic Circumstances | | | 399.5 | | | | 72.1 | | | | -510.4 | | | | -60.2 | | | | 32.2 | | | | 14.4 | | | | -9.5 | | | | 61.8 | |
| | | | | | | | |
Total Change | | | 277.3 | | | | 223.0 | | | | -19.8 | | | | -442.9 | | | | 118.4 | | | | 0.6 | | | | -79.8 | | | | -76.9 | |
Note:
| 1. | Numbers may not add due to interactions between Expenditure and SPP assessments. |
Source: Commonwealth Grant Commission Report on GST Revenue Sharing Relativities – 2010 Review Volume 1
The gain in GST from methodology changes was partly a result of Queensland’s success in arguing its case in a number of areas of the 2010 Review, including recognition of the investment required to meet the infrastructure needs from the State’s rapidly growing population. This gain was reduced by the CGC’s proposed shortening of the averaging period from five years to three years, amplifying the reduction in Queensland’s share of GST caused by the State’s strong economic performance, especially in mining royalties, relative to other states over the assessment period.
The decrease in GST for 2010-11 compares to reductions in Queensland’s share of GST revenue of $381.8 million in 2009-10 and $409.3 million in 2008-09. With the release of the 2010 Review, Queensland’s cumulative loss in GST funding since the last review in 2004 has been over $1.2 billion. Over the forward estimates period, further underlying losses are expected. Without Queensland’s gains from methodology changes, the underlying fall in Queensland’s GST allocation in 2010-11 would have been even greater than the significant losses in recent years.
| | | | |
132 | | Budget Strategy and Outlook 2010-11 | | |
Western Australia, the Northern Territory and the Australian Capital Territory have experienced significant losses from underlying changes in the 2010 Review. New South Wales and Victoria have made significant gains for the third consecutive year, with underlying increases of $277 million and $223 million respectively in 2010-11. New South Wales and Victoria continue to receive a greater per capita share of GST than Queensland.
Relationship between GST distribution and economic performance
The intended consequence of the GST assessment process is that as the relative economic strength of a state changes, so too does its assessed share of GST funding. A key feature of recent CGC Updates has been the decreasing relativities of the fast growing states of Queensland and Western Australia compared with the more established economies of New South Wales and Victoria. In each year since 2005-06, Queensland’s assessed single year GST relativity has been lower than that of both New South Wales and Victoria, which means that for the past four years, Queensland has been assessed as requiring less per capita from the GST pool than either of these fundamentally wealthy states.
The decline in Queensland’s relativity is directly related to its strong economic performance in the last few years, particularly in 2008-09, which increased the CGC’s assessment of the state’s relative capacity to raise own-source revenue. As Queensland’s economy has grown, its relative capacity to raise revenue in areas such as mining royalties, stamp duty on conveyances and land tax has increased, resulting in a relativity that is far below 1. Over the same period New South Wales’ assessed relativity has risen from 0.83 to 0.98.
The methodology changes implemented in the CGC’s 2010 Review resulted in a break in Queensland’s single year relativity series (Chart 7.3). However, the impact of methodology changes only represented a once-off boost to Queensland’s relativity, and the overall downward trend is expected to continue.
In the most recent year of the CGC’s assessment (2008-09), Queensland’s single year relativity fell dramatically, from 0.94 to 0.82 between 2007-08 and 2008-09. At the same time, the relativities of both New South Wales and Victoria were increased, further widening the gap between Queensland’s relativity and those of the two largest states. This is mainly a result of the large increase in Queensland’s coal production value in 2008-09, which greatly increased the CGC’s determination of Queensland’s capacity to raise revenue from royalties. Chart 7.3 shows Queensland’s single year relativities before and after the 2010 Review, and demonstrates the rapid fall in 2008-09.
| | | | |
| | Budget Strategy and Outlook 2010-11 | | 133 |
Chart 7.3
Single year GST relativities – larger states
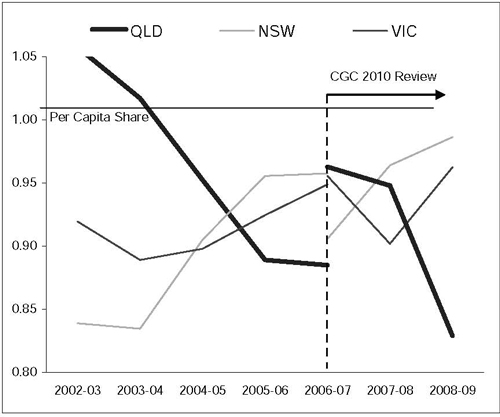
Source: Commonwealth Grants Commission 2010 Review Report on State Revenue Sharing Relativities.
In order to reduce the volatility of annual results, the CGC use an average of single year relativities over the most recent three-year period to determine states’ shares of GST. From 2010-11 onwards, GST will be distributed based on a three-year average of relativities, rather than the five-year average used in previous updates. This means that changes to Queensland’s economic circumstances will have a more pronounced and immediate impact on its GST share than in the past.
| | | | |
| 134 | | Budget Strategy and Outlook 2010-11 | | |
Box 7.2
2010 Review Issues
Although the CGC’s 2010 Review resulted in an improved methodology in many areas, Queensland remains concerned that some of the CGC’s assessments produce inappropriate outcomes. The CGC’s assessment of state capacities to raise revenue from mining royalties is particularly concerning. Mining revenue comprises around 7% of all state revenue in aggregate, yet this area represents 70% ($3.1 billion) of the GST that is redistributed based on states’ revenue raising capacities. In net per capita terms, the mining royalties raised by Queensland are more than offset by the CGC’s redistribution in the 2010 Review (see below). As a result, Victoria gains more from mining royalties than Queensland. The CGC’s methodology appears to be placing undue emphasis on mining royalties, when other revenues, such as stamp duty on conveyances and payroll tax are more important sources of state revenue.
Net Mining Revenue
| | | | | | | | | | | | | | | | | | | | | | | | | | | | | | | | | | | | |
| | | NSW | | | VIC | | | QLD | | | WA | | | SA | | | TAS | | | ACT | | | NT | | | AUST | |
| | | | | | | | | |
Mining Revenue1 ($ million) | | | 781 | | | | 43 | | | | 2,032 | | | | 2,615 | | | | 147 | | | | 36 | | | | 0 | | | | 136 | | | | 5,789 | |
| | | | | | | | | |
2010 Review GST Redistribution2 ($ million) | | | 1,123 | | | | 1,501 | | | | -973 | | | | -2,097 | | | | 292 | | | | 107 | | | | 103 | | | | -57 | | | | 3,127 | |
| | | | | | | | | |
Net Mining Revenue ($ million) | | | 1,903 | | | | 1,544 | | | | 1,059 | | | | 518 | | | | 439 | | | | 143 | | | | 103 | | | | 79 | | | | na | 4 |
| | | | | | | | | |
Net Mining Revenue3 ($ per capita) | | | 274 | | | | 294 | | | | 250 | | | | 242 | | | | 276 | | | | 289 | | | | 302 | | | | 363 | | | | na | |
Notes:
| 1. | Average Mining revenue from 2006-07 to 2008-09. |
| 2. | CGC redistribution for Mining revenue based on average assessed revenue raising capacity from 2006-07 to 2008-09. |
| 3. | Calculated using 2008-09 populations. |
| 4. | na – indicates not available. |
Sources: Queensland Treasury, Commonwealth Grant Commission Report on GST Revenue Sharing Relativities – 2010 Review
| | | | |
| | Budget Strategy and Outlook 2010-11 | | 135 |
GST revenue trends
Total GST revenue to all states increased by 8.1% between 2008-09 and 2009-10, with growth expected to decline slightly to 7.7% in 2010-11 (Chart 7.4). However, the expected average annual growth of 6.3% across the forward estimates period is still far lower than the 8.2% average annual growth experienced between the introduction of the GST and 2007-08. Currently forecast growth in the GST pool also follows a decline of 2.7% between 2007-08 and 2008-09, and large downward revisions to forward estimates of GST in the Australian Government’s 2009-10 Budget. Although the outlook for GST revenue has improved over the past year, forward estimates remain below the trend anticipated before the global financial crisis.
Chart 7.4
Comparison of GST revenue1 – Australian Government Budget 2007-08 to 2011-12
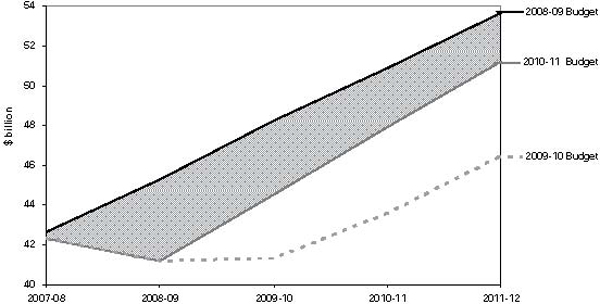
Note:
| 1. | Includes GST dedicated to health. |
Source: Australian Government Budget Paper No. 3, 2008-09, 2009-10 and 2010-11 and Queensland Treasury
Declines in Queensland’s relativity also mean that the recovery of Queensland’s GST from the effects of the global financial crisis will be slower than the Australian average. While the total GST pool has increased between 2008-09 and 2009-10, Queensland’s declining share of the pool has meant that it only received around 8% of this increase, or less than half its population share.
| | | | |
| 136 | | Budget Strategy and Outlook 2010-11 | | |
As GST shares are influenced by population growth, the declines in Queensland’s total GST share have been mitigated in recent years by relatively strong population growth, which is causing a gradual increase in Queensland’s share of the national population. However, Queensland’s population growth has resulted in a commensurate increase in demand for services, and Queensland’s ability to meet this demand, or enhance existing services, is affected by recent per capita declines in GST. In per capita terms, Queensland’s share of GST in 2010-11 will be similar to that received in 2005-06, with GST not expected to regain the levels of 2007-08 until 2013-14 (Chart 7.5).
Chart 7.5
GST1 per capita, 2003-04 to 2013-14
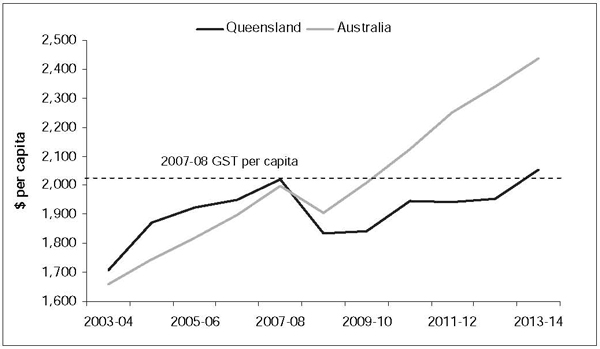
Note;
| 1. | Includes GST dedicated to health. |
Source: Australian Government Budget Paper No. 3, 2010-11 and Queensland Treasury.
| | | | |
| | Budget Strategy and Outlook 2010-11 | | 137 |
OTHER COMMONWEALTH PAYMENTS
Contingent payments
Contingent payments are a specific class of Australian Government payments which arise when the amount of funding cannot be reliably estimated. A prime example of a contingent payment is Natural Disaster Relief.
Other general revenue assistance
General revenue assistance payments arise when the Australian Government has an obligation to make a payment to a State, but the State has full control over how to allocate the money. Examples include offshore royalty revenue payments to Western Australia, and municipal services funding for the ACT. Queensland does not currently receive any general revenue assistance payments.
HEALTH REFORMS
In April this year, COAG, with the exception of Western Australia, reached agreement on the establishment of a National Health and Hospitals Network (NHHN), representing a major reform of federal and state roles and responsibilities in the management and funding of the health care system. It was agreed that:
| • | | the Australian Government will become the majority funder of Australian public hospitals, by funding 60% of the efficient price of all public hospital services delivered to public patients |
| • | | the Australian Government will have funding and policy responsibility for GP and primary health care services, and aged care services. States will work together with the Australian Government on system-wide primary health care policy and integration of service planning and delivery |
| • | | responsibility for hospital management will be devolved to new Local Hospital Networks |
| • | | Local Hospital Networks will be paid on the basis of a national efficient price for each public hospital service they provide to public patients under Local Hospital Network Service Agreements with the States |
| • | | some small regional and rural public hospitals, and other agreed services, will be block funded consistent with Community Service Obligations, reflecting the higher costs associated with delivering services in these areas |
| • | | new, higher national standards and more transparent reporting will provide Australians with more information about the national, state and local performance of the health system. |
| | | | |
| 138 | | Budget Strategy and Outlook 2010-11 | | |
It was also agreed that the Australian Government would provide $5.4 billion to states from 1 July 2010 for National Partnership reforms and investments to tackle key pressure points now and help meet the growing demands of the future. This includes:
| • | | $3.4 billion to improve access to public hospital services, including $1.62 billion to deliver 1,316 sub-acute care beds |
| • | | $436 million for primary care – to deliver integrated care for people with diabetes |
| • | | $643 million for the health workforce – to train more health professionals and make the most of the skills and dedication of our existing workforce |
| • | | $739 million to improve access in the community to high-quality aged care |
| • | | $174 million to improve our mental health system, including $115 million in new funding. |
Funding implications for Queensland
Under the NHHN package, the Australian Government will be responsible for absorbing the majority of cost growth in the health and hospital system.
These reforms will be financed through a combination of:
| • | | funding sourced from the National Healthcare Specific Purpose Payment |
| • | | an agreed amount of State GST revenue, which would then be allocated to health and hospitals reform |
| • | | additional top-up funding from the Australian Government, reflecting the Australian Government’s greater responsibility for financing growth in hospital costs. |
The agreed amount of GST revenue for each State will be retained and allocated to health and hospital services in that State. The amount of GST to be retained and allocated to health and hospitals will then be fixed from 2014-15, based on 2013-14 costs.
According to Australian Government estimates, approximately one-third of GST revenue will be dedicated nationally to state health and hospital services.
The estimate of dedicated GST for each State will vary from this national estimate. In Queensland’s case, the Australian Government estimates that 39% of the State’s GST will be dedicated to health and hospital services in 2011-12, 42% in 2012-13 and 43% in 2013-14. The Australian Government’s estimates of dedicated GST revenue for Queensland reflect a combination of the State Government’s relatively high expenditure on health and hospital services and relatively low share of GST revenue.
| | | | |
| | Budget Strategy and Outlook 2010-11 | | 139 |
The Australian Government’s estimates of dedicated GST revenue should be regarded as provisional until the details of the new arrangements, including the determination of the health and hospital activities within the scope of the reforms, are finalised. The final determination of dedicated GST revenue for Queensland will depend on these finalised arrangements, as well as the State’s actual health and hospital expenditure and share of GST revenue in that year.
The NHHN reforms will provide an increasing benefit to States as growth in health and hospital costs is expected to exceed the growth in GST. The Australian Government will absorb an estimated $15.6 billion in additional growth costs from 2014-15 to 2019-20 by ‘topping up’ payments to the states. It is estimated that Queensland’s share of this funding will be approximately $3.4 billion.
It was agreed that the NHHN will be implemented so that no state government will be worse off in respect of Commonwealth transfers in the short-term and all will be better off in the long-term. To give effect to this, the Australian Government will guarantee that the total ‘top-up’ payment during the period 2014-15 to 2019-20 will be no less than $15.6 billion. If the Australian Government’s responsibility for health system growth is not as large as the predicted $15.6 billion, states must spend the residual as additional funding for any health service that will assist in ameliorating the growth in demand for hospital services.
Chart 7.6 shows the estimated additional Australian Government funding to Queensland from the reforms, including National Partnership funding of $741.9 million from the NHHN package.
Chart 7.6
Additional Commonwealth health funding for Queensland from NHHN reforms
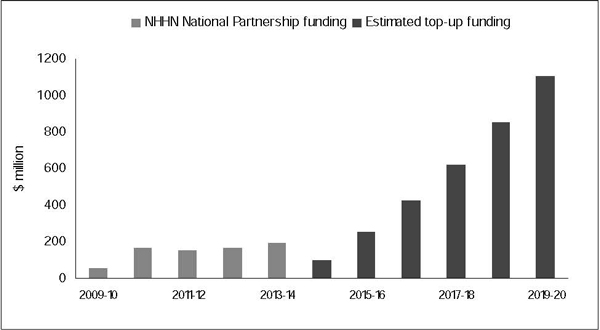
Source: Australian Government Budget Paper 3 and Australian Treasury
| | | | |
| 140 | | Budget Strategy and Outlook 2010-11 | | |
REVIEW OF AUSTRALIA’S TAX SYSTEM
On 2 May 2010, the Federal Treasurer released the final report of the Australia’s Future Tax System (AFTS) Review and the Australian Government’s response to it. The AFTS Review is likely to exert a strong influence over the national tax reform agenda for years to come.
The Australian Government’s response – Stronger Fairer Simpler: A tax plan for our future – focused on a package of measures funded by the introduction of a Resource Super Profits Tax (RSPT), which is similar but not identical to the Australian Government’s current petroleum resource rent tax (PRRT). As currently proposed, the main features of the RSPT, scheduled to commence from 1 July 2012, include:
| • | | a rate of 40% of assessable resource profits (assessable revenue less deductible expenses including an allowance for capital expenditure) |
| • | | application to all mining and petroleum projects, with the exception of PRRT projects, for which opt-in arrangements will be developed |
| • | | a refundable credit to resource entities for state royalties paid to State governments following commencement of the RSPT. The refundable credit will be available at least up to the amount of royalties imposed at the time of announcement, including scheduled increases and appropriate indexation factors |
| • | | deductibility of RSPT payments for income tax purposes. |
It is anticipated that the net revenue raised from the RSPT will be $3 billion in 2012-13 and $9 billion in 2013-14. This additional revenue will be used to fund:
| • | | a reduction in the company tax rate from the current 30% to 29% from the 2013-14 income year, then to 28% from the 2014-15 income year. The reductions are intended to assist business in funding an increase in the superannuation guarantee (SG) from 9% to 12% over time, as well as increasing the SG age limit from 70 to 75 |
| • | | a reduction in the company tax rate for small business to 28% from the 2012-13 income year |
| • | | a new infrastructure fund for states worth $700 million in 2012-13 for nation building infrastructure, particularly that related to resource industry development |
| • | | a Resource Exploration Rebate whereby companies will receive a refundable tax offset at the prevailing company tax rate for exploration expenses from 1 July 2011 |
| • | | superannuation changes, including a Government superannuation contribution for low income earners and assistance for older workers to make catch-up contributions |
| • | | 50% discount on interest income for individuals, up to $1,000 of earned interest |
| | | | |
| | Budget Strategy and Outlook 2010-11 | | 141 |
| • | | introduction of a standard deduction of $500 for work related expenses and the cost of managing tax affairs from 1 July 2012, increasing to $1,000 from 1 July 2013 |
| • | | phasing down of interest withholding tax paid by financial institutions on most interest paid by financial institutions on offshore borrowings from the 2013-14 income year. |
Notwithstanding the potential impact of the RSPT, the tax reform package effectively preserves the states’ resource royalty regimes, with state governments expected to benefit directly or indirectly from the other taxation measures. Resource rich states, such as Queensland, are expected to benefit particularly from the new state infrastructure fund and the Resource Exploration Rebate.
In relation to the RSPT, it is appropriate that the Australian people, as owners of finite mineral and petroleum resources, should receive a fair return from their extraction. At the same time it is important that the parameters of the new tax, in particular the allowance rate, are set so that current production and planned and new investment in the mining industry are not deterred. It is also critical that the Australian Government, in consultation with the industry and other stakeholders, quickly settles the major design features of the tax in order to provide investment certainty and business confidence in this vital industry.
| | | | |
| 142 | | Budget Strategy and Outlook 2010-11 | | |
STATE-LOCAL GOVERNMENT FINANCIAL RELATIONS
In 2010-11, a total of $1.335 billion in grants will be provided by the Queensland Government to Queensland’s local governments, compared to $1.318 billion in 2009-10. This includes financial assistance grants being paid by the Australian Government through the states to local government.
Table 7.6 details Queensland Government grants to local governments.
Table 7.6
Grants to local government in Queensland1
| | | | | | | | |
| | | 2009-10
Estimated
Actual
$ million | | | 2010-11
Budget
Estimate
$ million | |
Queensland Government grants | | | | | | | | |
Communities2 | | | 182 | | | | 281 | |
Community Safety | | | 8 | | | | 6 | |
Education and Training | | | 4 | | | | 2 | |
Employment, Economic Development and Innovation | | | 14 | | | | 12 | |
Environment and Resource Management | | | 8 | | | | 14 | |
Health | | | 2 | | | | 2 | |
Infrastructure and Planning3 | | | 975 | | | | 915 | |
Premier and Cabinet4 | | | 20 | | | | 21 | |
Transport and Main Roads | | | 102 | | | | 78 | |
Other | | | 3 | | | | 3 | |
Total Queensland Government grants | | | 1,318 | | | | 1,335 | |
Notes:
| 1. | For current and capital purposes to local government authorities and Aboriginal and Islander councils. Includes Australian Government grants paid through the State to local governments. |
| 2. | Includes grants for housing, disability services, child safety, sport and recreation. |
| 3. | Includes general purpose grants from the State and Australian Governments. |
| 4. | Includes grants for the arts. |
| | | | |
| | Budget Strategy and Outlook 2010-11 | | 143 |
| 8 | PUBLIC NON-FINANCIAL CORPORATIONS SECTOR |
FEATURES
| • | | Progress continues to be made to divest a number of the Government’s assets, comprising QR Limited’s above rail coal and freight business, services operations and the coal network, Port of Brisbane Corporation Limited, Abbot Point Coal Terminal and Queensland Motorways Limited. The agreement for the sale of Forestry Plantations Queensland was executed on 18 May 2010. |
| • | | The Government’s return from its ownership of businesses in the Public Non-financial Corporations sector is represented by flows to Government. In 2010-11, there will be an estimated inflow of $1.435 billion, comprising dividends of $1.05 billion and current tax equivalent payments of $385 million. |
| • | | Community service obligation payments of $1.839 billion will be paid to the sector in 2010-11, largely for public transport and electricity subsidies. These payments offset the dividends and current tax equivalent payments to obtain the net outflow from Government of $404 million. |
| • | | The Government has undertaken a review of the Government-owned corporation generators, including their structure, preparedness to meet future challenges and position as the dominant providers of electricity in Queensland. The Government will shortly consider the recommendations of the review prior to publicly announcing the outcomes. |
| • | | A number of significant projects are being planned or undertaken in the transport sector, including the Goonyella-Abbot Point Expansion rail project, the Abbot Point Coal Terminal expansions, the Wiggins Island Coal Terminal, and development of the liquefied natural gas industry in Gladstone. The private sector will play a key role in many of these projects. |
Despite the global financial crisis continuing to impact on the fiscal and economic performance of public and private sector entities, the Government will continue to undertake key infrastructure projects in the Public Non-financial Corporations (PNFC) sector to ensure the ongoing delivery of energy, transport and water services to the growing Queensland population. Key expenditure in 2010-11 includes:
| • | | QR Limited (QR) is forecast to spend $446.4 million to upgrade infrastructure and rollingstock on the Citytrain network as part of the South East Queensland Infrastructure Plan and Program (SEQIPP) and $502.2 million on the Goonyella-Abbot Point Expansion (GAPE) project |
| • | | Port of Townsville Limited (PoTL) has allocated $57.5 million for construction of the Townsville Marine Precinct (the Precinct) to provide a dedicated facility to the local industrial and commercial industries |
| | | | |
| | Budget Strategy and Outlook 2010-11 | | 145 |
| • | | North Queensland Bulk Ports Corporation Limited (NQBP) has budgeted to spend $53.5 million on the Abbot Point Coal Terminal (APCT) expansion |
| • | | Queensland Electricity Transmission Corporation Limited (Powerlink) has allocated $117 million towards the establishment of two new substations at Western Downs and Halys, construction of a transmission line between the new substations and reconfiguration of the existing Kogan Creek to Braemar transmission line and associated works |
| • | | Ergon Energy Corporation Limited (Ergon) and ENERGEX Limited (ENERGEX) are forecasting capital programs for 2010-11 of $937.7 million and $1.251 billion respectively to meet a continuing commitment to safe, reliable and secure electricity supply to customers. |
In addition, a number of projects are being considered in 2010-11, including:
| • | | further expansion of APCT with preferred developer status awarded to BHP Billiton Limited (BHP Billiton) and Hancock Coal Pty Limited (Hancock) for Terminals 2 and 3 |
| • | | PoTL is proposing to lengthen the current Berth 10A to accommodate Royal Australian Navy and cruise ships |
| • | | Gladstone Ports Corporation Limited (GPC) will continue development of the liquefied natural gas (LNG) industry port infrastructure at the Port of Gladstone |
| • | | SunWater Limited (SunWater) will continue to consider a number of proposed projects, including the Connors River and Nathan Dams and Water for Bowen. |
PRIOR YEAR KEY PERFORMANCE INDICATORS
The Government continues to own Government-owned corporations (GOCs) in order to create value through a long-term approach that encompasses efficiency, profitability, development capacity and social responsibility. The GOCs report against a number of financial and non-financial key performance indicators (KPIs), under the performance monitoring and reporting framework, which enable the Government to assess how well they are meeting shareholder expectations. The GOCs’ actual performance against a selection of KPIs is provided in Table 8.1.
| | | | |
| 146 | | Budget Strategy and Outlook 2010-11 | | |
Financial
Table 8.1
Total GOC Sector Key Financial Indicators1, 2
| | | | | | | | | | | | |
| | | 2008-09
Actual | | | 2009-10
Est. Act. | | | 2010-11
Budget | |
Earnings Before Interest and Tax ($M) | | | 3,646 | | | | 2,458 | | | | 3,171 | |
Return on Assets (%) | | | 7.3 | | | | 4.3 | | | | 5.2 | |
Return on Equity (%) | | | 5.7 | | | | 3.4 | | | | 3.1 | |
Gearing (debt/debt+equity) (%) | | | 46.9 | | | | 49.1 | | | | 50.9 | |
Notes:
| 1. | Number may not add due to rounding. |
| 2. | Exclude QIC Limited, which is a Public Financial Corporation. |
The higher Earnings Before Interest and Tax (EBIT), Return on Assets (RoA) and Return on Equity (RoE) in 2008-09 are due in part to the impact of the sales of the Cairns and Mackay airports and Port of Brisbane Corporation Limited’s (PBC) remaining shares in the Brisbane Airport Corporation Holdings (BACH). Trading results in 2009-10 have also been affected by the impact of the global financial crisis on those GOCs which participate in export supply chains, particularly in the first half of the year.
The increase in gearing in 2009-10 can largely be attributed to the impact of an equity repatriation from Stanwell following the 2009-10 Capital Structure Review and an increase in NQBP’s borrowings for the APCT expansion.
The improvement in EBIT in 2010-11 compared to 2009-10 reflects the impact of the Australian Energy Regulator’s (AER) Final Determination 2010-11 to 2014-15 on regulated revenue for ENERGEX and Ergon and QR’s growth in the coal sector following the adverse impacts of the global financial crisis. The improvement in EBIT has also contributed to the forecast increase in the RoA for the GOC sector.
The slight decrease in RoE in 2010-11 is due to a reduction in forecast net profit for the generation GOCs due to challenging market conditions. Overall though, the rates of return on assets and equity remain well below private sector equivalent levels, representing an opportunity cost to tax payers. This highlights the need for ongoing reform and operational improvement.
| | | | |
| | Budget Strategy and Outlook 2010-11 | | 147 |
Non-financial
Energy sector
Table 8.21
Prior Year Non-Financial Performance
| | | | | | | | |
| | | 2007-08
Actual | | | 2008-09
Actual | |
Ergon Energy Corporation Limited | | | | | | | | |
System Average Interruption Duration Index2 | | | | | | | | |
Urban | | | 179 | | | | 217 | |
Short Rural | | | 457 | | | | 609 | |
Long Rural | | | 1,030 | | | | 1,108 | |
System Average Interruption Frequency Index3 | | | | | | | | |
Urban | | | 1.85 | | | | 2.33 | |
Short Rural | | | 3.49 | | | | 4.93 | |
Long Rural | | | 6.40 | | | | 7.73 | |
Safety (Lost Time Injury Frequency Rate) | | | 4.30 | | | | 4.08 | |
Workforce Number | | | 4,489 | | | | 4,634 | |
| | |
ENERGEX Limited | | | | | | | | |
System Average Interruption Duration Index2 | | | | | | | | |
CBD | | | 4.00 | | | | 3.10 | |
Urban | | | 84.70 | | | | 91.20 | |
Rural | | | 242.10 | | | | 228.00 | |
System Average Interruption Frequency Index3 | | | | | | | | |
CBD | | | 0.04 | | | | 0.06 | |
Urban | | | 1.05 | | | | 1.05 | |
Rural | | | 2.71 | | | | 2.56 | |
Safety (Lost Time Injury Frequency Rate) | | | 3.62 | | | | 2.34 | |
Workforce Numbers | | | 3,733 | | | | 3,744 | |
| | |
Powerlink | | | | | | | | |
Safety (Lost Time Calculation) | | | 1.3 | | | | 0.1 | |
Grid Energy Delivered (gigawatt hours) | | | 46,083 | | | | 47,904 | |
Workforce Numbers | | | 887 | | | | 1,000 | |
| | |
CS Energy Limited | | | | | | | | |
Safety (Lost Time Injury Frequency Rate) | | | 3.3 | | | | 5.0 | |
Energy Sent Out (gigawatt hours) | | | 15,426 | | | | 16,675 | |
Workforce Numbers | | | 588 | | | | 673 | |
| | | | |
| 148 | | Budget Strategy and Outlook 2010-11 | | |
Table 8.21 (continued)
Prior Year Non-Financial Performance
| | | | | | | | |
| | | 2007-08
Actual | | | 2008-09
Actual | |
Stanwell Corporation Limited | | | | | | | | |
Safety (Lost Time Injury Frequency Rate) | | | 3.57 | | | | 9.73 | |
Energy Sent Out (gigawatt hours)4 | | | 9,785 | | | | 8,758 | |
Workforce Numbers | | | 368 | | | | 395 | |
| | |
Tarong Energy Corporation Limited | | | | | | | | |
Safety (Lost Time Injury Frequency Rate) | | | 4.4 | | | | 6.2 | |
Energy Sent Out (gigawatt hours) | | | 5,787 | | | | 8,601 | |
Workforce Numbers | | | 386 | | | | 452 | |
Notes:
| 1. | Figures have been obtained from the energy GOCs’ 2007-08 and 2008-09 Annual Reports. |
| 2. | Total minutes, on average, that customers are without electricity in a year (includes both planned and unplanned minutes off supply). |
| 3. | Average number of occasions per year each customer is interrupted. |
There are a number of points to note about the Energy sector GOCs’ prior year non-financial performance (Table 8.2).
| • | | The 2008-09 system performance for Ergon compared to 2007-08 reflects the effect of a suspension and internal review of live line work on high voltage assets to allow a rigorous internal review of operations. Live line management structures, practices and documentation were reviewed and external auditors engaged to further develop the training regime. |
| • | | System performance by ENERGEX met the requirements of Minimum Service Standards across all System Average Interruption Duration Index and System Average Interruption Frequency Index measures in 2008-09 and also for 2007-08 except for Rural Safety which was within 2% of the target. |
| • | | Energy GOCs undertake regular reviews and programs to deliver improved plant safety and a safety culture aimed at achieving further improvements in safety outcomes. |
| • | | Energy sent out by the electricity generator GOCs will vary from year to year due to a range of factors such as scheduled maintenance and overhauls, electricity market conditions and climatic conditions. Drought conditions during the 2007-08 period significantly reduced energy sent out from the Tarong power stations. This was partly offset through other generators like Stanwell. |
| • | | Growth in the energy through the electricity transmission grid (owned and operated by Powerlink) generally reflects growth experienced in total energy consumption. |
| | | | |
| | Budget Strategy and Outlook 2010-11 | | 149 |
Transport and other sectors
Table 8.31
Prior Year Non-Financial Performance
| | | | | | | | |
| | | 2007-08
Actual | | | 2008-09
Actual | |
Far North Queensland Ports Corporation Limited2 | | | | | | | | |
Safety (Lost Time Injury Frequency Rate) | | | 15.62 | | | | 117.93 | |
Number of Vessels | | | 2,799 | | | | 795 | |
Trade Volumes (million tonnes) | | | 1.191 | | | | 1.086 | |
| | |
Gladstone Ports Corporation Limited | | | | | | | | |
Safety (Lost Time Injury Frequency Rate) | | | 4.01 | | | | 4.81 | |
Number of Vessels | | | 1,417 | | | | 1,485 | |
Trade Volumes (million tonnes) | | | 76.648 | | | | 79.374 | |
| | |
North Queensland Bulk Ports Corporation Limited3 | | | | | | | | |
Safety (Lost Time Injury Frequency Rate) | | | — | | | | — | |
Number of Vessels | | | 1,754 | | | | 1,681 | |
Trade Volumes (million tonnes) | | | 118.995 | | | | 121.159 | |
| | |
Port of Brisbane Corporation Limited | | | | | | | | |
Safety (Lost Time Injury Frequency Rate) | | | 11.70 | | | | 5.00 | |
Number of Vessels | | | 2,618 | | | | 2,453 | |
Trade Volumes (million tonnes) | | | 30.215 | | | | 31.896 | |
| | |
Port of Townsville Limited | | | | | | | | |
Safety (Lost Time Injury Frequency Rate) | | | 6.10 | | | | 6.65 | |
Number of Vessels | | | 780 | | | | 718 | |
Trade Volumes (million tonnes) | | | 9.833 | | | | 9.084 | |
| | |
QR Limited | | | | | | | | |
Safety (Lost Time Injury Frequency Rate) | | | 12.10 | | | | 11.74 | |
Citytrain Customer Satisfaction (%) | | | 87 | | | | 90 | |
Citytrain On-time Running (%) | | | 91.15 | | | | 91.76 | |
Coal Tonnages (million tonnes)4 | | | 185 | | | | 185 | |
Bulk/General Freight Tonnages (million tonnes)4 | | | 63.9 | | | | 59 | |
| | | | |
| 150 | | Budget Strategy and Outlook 2010-11 | | |
Table 8.31 (continued)
Prior Year Non-Financial Performance
| | | | | | | | |
| | | 2007-08
Actual | | | 2008-09
Actual | |
SunWater Limited | | | | | | | | |
Safety (Lost Time Injury Frequency Rate) | | | 14.90 | | | | 8.70 | |
Customer Service Levels (Exceptions) | | | 54 | | | | 153 | |
Water Delivered (%) | | | 42.68 | | | | 43.27 | |
Notes:
| 1. | Figures have been obtained from the transport GOCs’ 2007-08 and 2008-09 Annual Reports. |
| 2. | Far North Queensland Ports Corporation Limited was known as Cairns Ports Limited (CPL) until 2009-10. The reported KPIs reflect CPL’s actual results. |
| 3. | NQBP comprises the former Mackay Ports Limited and Ports Corporation of Queensland Limited (PCQ), which were amalgamated in 2009-10. The reported KPIs reflect PCQ’s actual results. |
| 4. | Tonnages represent those transported by QR subsidiaries – QR Coal and QR Freight. |
There are a number of points to note about the Transport sector GOCs’ prior year non-financial performance (Table 8.3).
| • | | QR has placed significant organisational emphasis on safety issues and the Lost Time Injury Frequency Rate has continued to decline both within and since the period reported. In 2008-09, QR maintained the tonnage of coal and freight delivered, despite economic conditions impacting upon demand. |
| • | | GPC increased its total trade volumes by 3.6% in 2008-09, despite the economic challenges of the year, due largely to the sustained demand for coal from Asian countries. |
| • | | NQBP saw an increase in trade volumes of approximately 2.2 million tonnes in 2008-09 with the majority of this increase due to the increase in capacity of APCT. |
| • | | The decline in the trade volumes for PBC in 2008-09 is due to a slowing in container and motor vehicle volumes due to the global economic downturn. |
| • | | Trade volumes at PoTL also declined in 2008-09 with a slowing in cargo throughput resulting from the global economic downturn. |
| • | | The significant drop in the number of vessels passing through Far North Queensland Ports Corporation Limited (FNQP) ports in 2008-09 is due to a change in the way this indicator is measured (that is, the 2008-09 number of vessels excludes fishing shipping arrivals of approximately 1,800). |
| • | | SunWater’s 2008-09 increase in Customer Service Level Exceptions was due to unplanned events occurring in the Bundaberg region such as pipe breakages (outside the control of SunWater) as well as scheduled interruptions to allow for the treatment of aquatic weeds and algae. |
| | | | |
| | Budget Strategy and Outlook 2010-11 | | 151 |
NET FLOWS TO GOVERNMENT
The PNFC sector comprises 13 GOCs (QIC Limited is not part of the PNFC sector as it is a Public Financial Corporation) and other entities, including the State water entities, Forestry Plantations Queensland (FPQ) and Queensland Motorways Limited (QML).
The Government’s return from its ownership of PNFC sector entities is represented by the flows to Government for the financial year. These are the dividends and current tax equivalent payments (TEPs) received from PNFC sector entities. Consistent with Government Finance Statistics (GFS) requirements, only current TEPs are used to calculate net flows.
In situations when the Government seeks to have a commercial business deliver a particular non-commercial product or service to the community, the Government provides a community service obligation (CSO) payment to the business.
Dividends from the PNFC sector are a function of net profit after tax and the dividend payout ratio, which is determined by shareholding Ministers after considering the circumstances of each individual entity and the advice of the boards. The dividend payout ratios recommended by the boards do not impact on the capacity and requirement of GOCs to carry out necessary maintenance, repairs and asset replacement, as dividends are paid after providing for such costs. Total dividends to be paid to Government in 2010-11 are estimated at $1.05 billion (Table 8.4).
Table 8.4
Ordinary Dividends1
| | | | | | | | | | | | |
| | | 2008-09
Actual
$ million | | | 2009-10
Est. Act.
$ million | | | 2010-11
Budget
$ million | |
Energy Sector2 | | | 588 | | | | 466 | | | | 545 | |
| | | |
Transport Sector (rail and ports)3, 4 | | | 334 | | | | 257 | | | | 472 | |
| | | |
Other | | | 8 | | | | 17 | | | | 31 | |
| | | |
Non-GOC | | | 5 | | | | 7 | | | | 2 | |
| | | |
Total PNFC sector dividends | | | 935 | | | | 747 | | | | 1,050 | |
Notes:
| 1. | Numbers may not add due to rounding. |
| 2. | The improvement in energy sector dividends can largely be attributed to ENERGEX and Ergon and reflects the impact of the AER Final Determination 2010-11 to 2014-15 on regulation revenue. |
| 3. | In 2008-09, Far North Queensland Ports Corporation Limited, the former Mackay Ports Limited and PBC paid a special dividend totalling $608.6 million from the proceeds of the sale of the Cairns and Mackay airports and the remaining shares in BACH respectively. |
| 4. | The improvement in transport dividends can be attributed to growth in the coal sector, following the previous adverse impact of the global financial crisis. |
| | | | |
| 152 | | Budget Strategy and Outlook 2010-11 | | |
PNFC sector entities pay TEPs in lieu of the taxes they would have to pay if they were not Government-owned, with TEPs calculated as 30% of earnings before tax. Total current TEPs for 2010-11 are estimated at $385 million (Table 8.5).
Table 8.5
Current Tax Equivalent Payments1
| | | | | | | | | | | | |
| | | 2008-09
Actual
$ million | | | 2009-10
Est. Act.
$ million | | | 2010-11
Budget
$ million | |
Energy Sector2 | | | 143 | | | | 144 | | | | 101 | |
| | | |
Transport Sector (rail and ports)3 | | | 36 | | | | 80 | | | | 264 | |
| | | |
Other | | | 5 | | | | 3 | | | | 17 | |
| | | |
Non-GOC | | | — | | | | — | | | | 3 | |
| | | |
Total PNFC sector current TEPs | | | 184 | | | | 226 | | | | 385 | |
Notes:
| 1. | Numbers may not add due to rounding. |
| 2. | The reduction in TEPs for the energy sector is due to the reclassification of Stanwell’s TEPs to deferred, which are excluded under GFS reporting. |
| 3. | The significant increase in transport sector TEPs is due to QR commencing the payment of current TEPs in 2010-11. |
In 2010-11, it is estimated that the Government will pay CSOs of $1.839 billion (Table 8.6).
Table 8.6
Community Service Obligations1
| | | | | | | | | | | | |
| | | 2008-09
Actual
$ million | | | 2009-10
Est. Act.
$ million | | | 2010-11
Budget
$ million | |
Energy Sector | | | 492 | | | | 233 | | | | 349 | |
| | | |
Transport Sector (rail and ports)2 | | | 1,310 | | | | 1,234 | | | | 1,486 | |
| | | |
Other | | | 4 | | | | 1 | | | | 2 | |
| | | |
Non-GOC | | | 2 | | | | 8 | | | | 1 | |
| | | |
Total PNFC sector CSOs | | | 1,808 | | | | 1,477 | | | | 1,839 | |
Notes:
| 1. | Numbers may not add due to rounding. |
| 2. | The change in QR’s CSO payments from 2009-10 to 2010-11 is due to increases in the: |
| | • | | Passenger service CSO payments from the TransLink Transit Authority by $95.6 million; |
| | • | | Regional passenger and below rail CSO payments from the Department of Transport and Main Roads (DTMR) of $31.1 million; and |
| | • | | Government commitment for CSO payments to QR National Limited from DTMR of $125.8 million to fully offset the financial losses borne by QR due to the provision of general freight and livestock services to rural and regional communities. |
| | | | |
| | Budget Strategy and Outlook 2010-11 | | 153 |
ASSET SALES PROGRAM
The Government is undertaking a staged program of strategic asset sales to restructure the State’s asset portfolio and reform the State’s balance sheet. It is estimated the sales will deliver proceeds of as much as $15 billion and avoid over $10 billion in capital investment in these assets over the next five years. This capital investment is required for these businesses to grow and expand over the next five years. The Government’s view is that these funds should come from the private sector, allowing the Government to prioritise spending on roads, schools and hospitals.
Proceeds from the five commercial businesses to be sold, licensed or leased to the private sector were not factored into the 2009-10 Budget.
Proceeds from the 99-year lease of Forestry Plantations Queensland (FPQ) have been factored into the 2010-11 Budget. Once the sale processes for the remaining four commercial businesses are finalised, the proceeds will be incorporated into the forward estimates.
It is expected that the sale proceeds will significantly reduce the current level of indebtedness of the State. The sales will reduce the requirements on Government to further fund the significant ongoing capital requirements of these businesses and appropriately introduce more private sector funding into Queensland infrastructure.
Forestry Plantations Queensland
On 18 May 2010, the Government agreed to sell FPQ to Hancock Queensland Plantations for the sum of $603 million. The sale involved a comprehensive competitive tender process to seek a suitably experienced and capable buyer. The sale price for FPQ represents fair market value for the transfer of ownership of the business.
The sale of FPQ concludes a progressive long term process of reforming the State’s plantation management business to improve its efficiency and competitiveness. This transaction is expected to be concluded by 1 July 2010.
The Crown plantation land on which the majority of the business sits will remain in Government ownership. The sale includes around 35,000 hectares of freehold land, which is about 10% of the total estate. The licence for the sale will deliver on the Government’s commitment to the South East Queensland Forestry Agreement by ensuring that 20,000 hectares of hardwood plantations are established by 2025.
Port of Brisbane Corporation
A 99-year lease over Port of Brisbane land and infrastructure will be issued following a competitive bidding process. The competitive bidding process is scheduled to proceed through three stages (expressions of interest, indicative bids and final binding bids) with selection of qualified bidders at each stage.
Financial close is expected by the end of 2010, subject to market conditions.
| | | | |
| 154 | | Budget Strategy and Outlook 2010-11 | | |
QR Limited
QR’s commercial coal, freight and services operations will be sold as an integrated transport and logistics enterprise called QR National Limited (QR National). QR National will be floated through a share offer and planned listing on the Australian Securities Exchange (ASX) in the last quarter of 2010, subject to market conditions. The sale of QR National is expected to potentially place it in the top 50 of Australia’s largest ASX companies.
Government intends to retain 25%-40% of QR National – with the residual sold down over time, when appropriate, and no individual company, national or foreign-owned, will be able to purchase more than 15% of QR National. Eligible permanent QR employees transitioning to QR National will be provided with $1,000 of shares and an option to purchase an additional $4,000 in shares at a discounted rate to the listed share price.
The Queensland rail network, including the Central Queensland Coal Network, will continue to be regulated under Queensland’s third party access regime. This will ensure the continuation of existing competition safeguards, including those safeguards for Queensland’s coal haulage market.
QR’s passenger business and regional non-coal below rail network will be separated from QR’s corporate structure and established as a new GOC called Queensland Rail Limited by 1 July 2010.
Abbot Point Coal Terminal
A 99-year lease over APCT X50 land and infrastructure will be issued following a competitive bidding process, which will commence in the last quarter of 2010, subject to market conditions. The Government will retain ownership of the port land and associated strategic infrastructure, such as the terminal and coal unloading/loading infrastructure.
The two new terminals at APCT, which are adjacent to the X50 site, are to be developed, operated and managed by the private sector and are not part of this sale process.
Queensland Motorways Limited
The sale of QML will proceed after the completion of the $1.8 billion Gateway Upgrade Project, in order to maximise the value from completion of works and the achievement of steady state traffic. The tolling rights on the Sir Leo Hielscher Bridges and the Logan Motorway will be leased following a competitive bidding process for a franchise of up to 50 years.
It is anticipated that the sale will proceed via a three stage process, being expressions of interest followed by a two stage process to identify the preferred buyer. The process to lease the Queensland Motorways franchise will be competed in late 2011.
| | | | |
| | Budget Strategy and Outlook 2010-11 | | 155 |
CAPITAL STRUCTURE REVIEW
In 2009-10, the Queensland Treasury Corporation (QTC) reviewed the GOCs’ capital structures to ensure unregulated GOCs maintained private ratings of investment grade (BBB- or above) and regulated GOCs maintained ratings of at least BBB+.
The review identified potential equity injections and repatriations for some of the GOCs over the forward estimates period but recommended that no equity adjustments need to occur in 2010-11. The Government will continue to review the GOCs’ capital structures annually, in the context of the Budget, and may choose to make further equity adjustments reflecting changing circumstances, as a result of approval of major investment projects or changes in demand or financial outlook.
In addition to the outcomes of the reviews undertaken by QTC, the Government may provide project-specific equity injections and repatriations. It is proposed that the following equity injections and repatriations occur over the forward estimates period. (Table 8.7).
Table 8.7
Equity Injections / Repatriations1
| | | | | | | | | | | | | | | | | | | | |
| | | 2009-10
Est. Act.
$ million | | | 2010-11
Budget
$ million | | | 2011-12
Forecast
$ million | | | 2012-13
Forecast
$ million | | | 2013-14
Forecast
$ million | |
GOC | | | 593 | | | | 442 | | | | 571 | | | | 446 | | | | 428 | |
Non-GOC | | | 190 | | | | (34 | ) | | | 120 | | | | 10 | | | | 10 | |
Total PNFC sector equity injections/ repatriations | | | 783 | | | | 408 | | | | 692 | | | | 456 | | | | 438 | |
Note:
| 1. | Numbers may not add due to rounding |
Net equity movements in the GOC sector in 2009-10 include a $380 million equity repatriation from Stanwell as an outcome of the 2008-09 capital structure review, a $102.8 million dividend reinvestment into ENERGEX and equity injections of $275 million to Tarong for the acquisition of the remaining 50% of Tarong North Power Station and $502.7 million to QR for SEQIPP projects. In the non-GOC sector, the net equity movement is largely due to a $150 million injection to the Queensland Manufactured Water Authority, which has assumed ownership and operational responsibility for key Water Grid assets delivered by the State’s special-purpose vehicle construction companies.
Over the forward estimates, the majority of the GOC equity injections are forecast to be provided to QR for capital projects under SEQIPP. For the non-GOC sector, the net equity repatriation in 2010-11 is due to the sale of FPQ, offset by an equity injection to the Queensland Bulk Water Supply Authority (QBWSA) upon commissioning of the $395 million Hinze Dam Raising (Stage 3) project.
| | | | |
| 156 | | Budget Strategy and Outlook 2010-11 | | |
From 2011-12 onwards, equity injections for the non-GOC sector largely reflect contributions to the Queensland Bulk Water Supply and Transport Authorities as projects delivered under the current Grid infrastructure program are commissioned and transferred (including Wyaralong Dam and Northern Pipeline Interconnector Stage 2). The equity contributions to the authorities maintain the capital structures agreed with responsible Ministers.
GOC REPORTING REFORMS
The Government has been working with the GOCs and the Auditor-General’s office to implement a number of reporting reforms, which will improve the timeliness and transparency of information on the GOCs’ performance available to stakeholders. Reforms implemented in 2009-10 include:
| • | | biannual reporting – in addition to annual reports, GOCs are now required to prepare and publish interim reports on their performance in the first half of the financial year |
| • | | forecast reporting – GOCs must now prepare reports forecasting performance against several financial and non-financial KPIs, to be published on their websites early in the financial year |
| • | | actuals reporting – the PNFC sector chapter of Budget Paper 2 – Budget Strategy and Outlook now includes information on the aggregated performance of the GOC sector against several financial KPIs and the performance of individual GOCs against several non-financial KPIs. |
The Government will monitor the GOCs’ performance reporting framework to ensure it continues to provide stakeholders with relevant and high quality information and will undertake additional reforms in the future, should the need for them be identified.
| | | | |
| | Budget Strategy and Outlook 2010-11 | | 157 |
IMPLEMENTATION OF GOC REFORMS
The Government is continuing to work with the GOCs to improve their efficiency, effectiveness and accountability, consistent with the reforms announced as part of the 2008-09 Mid Year Fiscal and Economic Review. The purpose of the reforms is to provide the GOCs with appropriate organisational structures and incentive frameworks to allow them to operate at their full commercial potential, providing returns similar to those expected by investors in private sector companies.
Operational efficiencies and savings targets
The Government has been working with the GOCs to progressively increase their contributions to General Government revenue through dividends and current TEPs to achieve an additional $100 million each year by 2011-12. The additional $100 million each year is reflected in the forward estimates, as demonstrated by the forecast increased rate of return from 2010-11 onwards. Initiatives that are currently being implemented by the GOCs include:
| • | | SunWater is implementing its ‘Smarter, Lighter, Faster’ initiative to reduce the cost of services and improve operational efficiencies |
| • | | GPC is adjusting the timing of expenditures to create savings relating to its dredging program and deriving new operational efficiencies through installing new systems that allow, among other things, better scheduling of vessel loading and coal delivery |
| • | | PoTL is implementing long-term and sustainable strategies to increase efficiency and undertaking a review of the procurement framework, maintenance strategy and asset management |
| • | | Tarong Energy Corporation Limited (Tarong) continues to progress a procurement review program to secure reductions in project-related expenditure |
| • | | Stanwell has refined its business development focus leading to reductions in the utilisation of specialist contractors. |
Rate of return targets and investment hurdle rates
The Government’s return from its ownership of GOCs is calculated as dividends divided by average total equity. This represents an estimated rate of return of 4.14% in 2010-11. As indicated in Chart 8.1 below, it is anticipated that the rate of return will continue to improve over the forward estimates period to 5.04% by 2013-14.
| | | | |
| 158 | | Budget Strategy and Outlook 2010-11 | | |
Chart 8.1
Rate of Return1, 2, 3
annual from 2000-01 to 2013-14
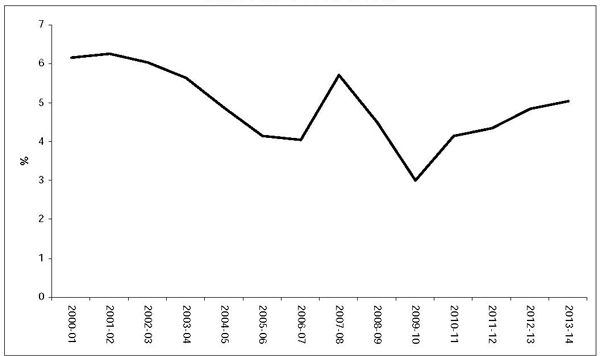
Notes:
| | 1. | Excludes QIC Limited, which is a public financial corporation. |
| | 2. | Calculated as (ordinary dividends / average total equity). |
| | 3. | Excludes dividends associated with asset sales and special dividends. |
Capital expenditure reviews
GOCs continue to review their capital expenditure plans to identify opportunities to optimise capital investments, while ensuring the continued delivery of essential infrastructure. For example, throughout 2010-11, FNQP will be undertaking a number of initiatives regarding the corporation’s capital expenditure including:
| • | | a review of the Cityport Masterplan to consider design, staging and delivery models to match community and market demands |
| • | | a land development plan for the land within the Smith’s Creek industrial site, incorporating a Cairns Port Business Park development, Smith’s Creek Marina Precinct and Marine Industry Park |
| • | | a review of the development plan for the Port of Mourilyan to inform future land development options, land acquisition requirements and the need and timing of any transport link upgrades |
| • | | reviewing and developing land development and acquisition plans for all regional ports, particularly the development planning for potential marina and commercial developments in Ports of Mourilyan and Cooktown. |
| | | | |
| | Budget Strategy and Outlook 2010-11 | | 159 |
Tarong has identified a number of capital program efficiencies over the next five years through reassessment of procurement practices, reassessment of asset condition and modifying operational procedures.
Surplus and non-core assets
The GOCs are continuing to review their asset holdings to identify surplus, non-performing and non-core assets, which will be assessed for their potential to be more effectively managed or rationalised. Several GOCs have identified surplus assets, including Stanwell and Tarong, which have identified their Curragh and Glen Wilga coal resources respectively as surplus to future fuel supplies, and have taken them to the market to realise their value.
The ongoing process for GOCs to identify and divest surplus or non-core assets is proceeding separately to the Government’s Asset Sales Program and will be managed by the relevant GOCs.
| | | | |
| 160 | | Budget Strategy and Outlook 2010-11 | | |
ENERGY SECTOR
Shareholder review of Government-owned Generators
In the December 2008 Major Economic Statement, the Government announced that it would undertake a shareholder review of the structure and preparedness of the GOC Generators to meet the new challenges facing these businesses, particularly in respect of the impending Carbon Pollution Reduction Scheme (CPRS) and competition from large vertically-integrated retailers.
The review, which commenced in 2009 and is now nearing completion, outlines the impetus for reform of the GOC Generator sector including:
| • | | the potential impact on the GOC Generator sector from the proposed CPRS |
| • | | the deregulation of the electricity market which has led to an increase in competition, particularly from vertically-integrated retailers |
| • | | a general trend of declining pool prices over the period (excluding the recent drought-related increase in 2006-07 and 2007-08), reflecting the increasingly competitive market as well as the underlying over-supply of base load generation for the then prevailing demand levels |
| • | | declining returns from a mainly ageing portfolio of predominately base load coal-fired power stations. |
Government will shortly consider the final recommendations of the review ahead of publicly announcing the outcome of the review.
North West Queensland Energy Review
The independent review of energy delivery in the North West Queensland Minerals Province (NWQ Minerals Province), announced by the Government and the Queensland Resources Council during 2008-09, was conducted by independent expert Mr Rod Sims. The final report, ‘Providing a Circuit Breaker to Meet North West Queensland’s Future Electricity Needs’, launched by the Australian and Queensland Governments in August 2009 recommended a 12-month customer-led competitive process during which proponents would negotiate with customers to confirm a long-term energy solution for the north-west and its growing resources sector.
The Queensland Government has been actively facilitating participation in the customer-led competitive process, which has seen major energy users in the NWQ Minerals Province actively engage with a number of energy supply proponents, which include both local generation and transmission link options.
| | | | |
| | Budget Strategy and Outlook 2010-11 | | 161 |
Surat Basin Transmission Network Reinforcement Plan
Powerlink is undertaking a South West Queensland Augmentation project, which will provide the foundation for an extension of the high voltage transmission network into the North West Surat Basin. To reinforce electricity supply, Powerlink plans an extension of the existing high voltage transmission network into the Surat Basin from the proposed Western Downs Substation to meet the long-term needs of existing and emerging electricity customers in the region such as proposed coal seam gas, LNG upstream facilities and coal mining projects.
Australian Energy Regulator Determination
In May 2010, the Australian Energy Regulator released the final distribution determinations for Ergon and ENERGEX, establishing the regulated revenues and allowable investments for each electricity distributor for the period from 1 July 2010 to 30 June 2015.
The determinations recognise the continued growth in electricity demand throughout Queensland, driven to a large extent by increased economic activity and continued uptake of lifestyle enhancing appliances such as air conditioners. This is reflected in the increase in capital investment with Ergon and ENERGEX forecasting significant capital expenditure in the budget period.
Demand Side Management
To meet the increase in electricity demand, in particular peak demand, and maintain a secure electricity distribution network, ENERGEX and Ergon have forecast total capital expenditure for 2010-11 at $2.189 billion.
ENERGEX and Ergon are progressing a number of initiatives aimed at shifting or reducing peak demand and increasing asset utilisation. The Government continues to support ENERGEX and Ergon to initiate a range of energy conservation and demand management measures in Queensland aimed at reducing long term increases in electricity tariffs.
| | | | |
| 162 | | Budget Strategy and Outlook 2010-11 | | |
TRANSPORT SECTOR
QR Limited
From 1 July 2010, QR will be split to form two separate businesses, QR National and Queensland Rail. QR National will be floated through a share offer while Queensland Rail will remain entirely in Government ownership as a new GOC.
Goonyella to Abbot Point Expansion project
The GAPE project consists of individual sub-projects, including:
| • | | the Northern Missing Link, which is a 69 kilometre railway between the North Goonyella and Newlands systems |
| • | | the Newlands to Abbot Point Expansion, which is a major upgrade of the Newlands line between Newlands and Abbot Point |
| • | | upgrade works for train provisioning and upgrade works into the Goonyella system. |
QR Network Pty Ltd (QR Network) is managing the project and will deliver this new infrastructure via CoalConnect, which is an alliance between QR, construction firm Leighton Contractors, designers GHD and KBR and other service areas of QR.
Project construction commenced in late April 2010 with commissioning expected to occur in early 2012.
Moura and Blackwater Rail enhancements
During April 2010, QR Network released its request for proposals to ascertain the extent, nature and timing of the potential rail infrastructure enhancements and to enter into contractual arrangements for the delivery of the required infrastructure enhancements to service Stage 1 of the Wiggins Island Coal Terminal (WICT). It is expected that project deeds for the initial project will be finalised this year.
QR Limited Passenger Rollingstock program
QR has called for expressions of interest (EOIs) from Australian and international suppliers to build up to 200 three-car train sets to cater for the expected growth in public transport use and network expansion in SEQ, as well as replace existing ageing rollingstock. Following the EOI process, three bidders with the capability and experience to meet QR’s requirements – United Group and Rotem; Downer EDI Rail—Bombardier; and Mitsubishi and CAF, were shortlisted.
The next stage in the procurement process is to issue a request for proposals (RFP) to the shortlisted bidders, seeking bids for the design, construction and maintenance (on a whole-of-life basis) of the 200 three-car train sets and the maintenance facility in which the trains will be maintained. The RFP will include a Local Industry Participation Plan and a weighting will be given to local content in the assessment process.
| | | | |
| | Budget Strategy and Outlook 2010-11 | | 163 |
QR proposes to award the contract in early 2011, with deliveries scheduled to begin in early 2013.
Surat Basin
The Surat Basin Railway (SBR) is a key piece of infrastructure, which will facilitate development of significant coal reserves in the Surat Basin by providing a rail link to the Port of Gladstone. In December 2006, the SBR Joint Venture, comprising QR, Xstrata, and the Australian Transport and Energy Corridor, was granted an exclusive mandate to develop the SBR up to financial close.
Port GOCs
Abbot Point Coal Terminal
In July 2009, the final commissioning and handover of the new second inloader at the APCT was completed. This formed the majority of the works undertaken to expand the APCT from 21 to 25 million tonnes per annum (mtpa). The offshore works, which also comprise part of the $95 million upgrade, are expected to be completed in mid-2010. NQBP is also well underway with the current expansion of the terminal which will increase capacity to 50 mtpa. The $818 million project involves major investment in three new stacker reclaimer machines, a new bund, two new coal stockpile rows and a second offshore wharf and shiploader. The onshore and offshore work will be completed in mid-2010, which will increase capacity to 30-35 mtpa. Capacity is expected to increase incrementally over the following twelve months to reach 50 mtpa by mid-2011. Budgeted expenditure in 2010-11 for the expansion is $53.5 million.
In late 2009, NQBP sought EOIs for preferred developer status for the development of two new coal terminal sites at the Port of Abbot Point. EOIs closed on 1 February 2010. On 28 April 2010, NQBP awarded preferred developer status for the terminal sites to BHP Billiton and Hancock. Both BHP Billiton and Hancock have expressed interest in working with NQBP to optimise the land area in order to build coal terminals with the capacity of 50 mtpa and 60 mtpa respectively. BHP Billiton anticipates it will commence exporting coal from its terminal in 2015-16, while Hancock anticipates exports from its terminal will commence in 2013-14.
NQBP is also considering further developments at Abbot Point. Referred to as Terminals 4-7, this development could involve additional coal export terminals with a nominal capacity of 120 mtpa. Aurecon Hatch has been engaged to undertake a study to identify the best site within the Abbot Point State Development Area.
| | | | |
| 164 | | Budget Strategy and Outlook 2010-11 | | |
Dudgeon Point
Dudgeon Point, which is located at the Port of Hay Point, has been identified as a suitable location for future industrial activity. While no specific trade has been finalised for Dudgeon Point, the site is a potential location for the export of coal from mines in the Galilee and Bowen basins.
In September 2009, NQBP called for EOIs for preferred proponent status for development at Dudgeon Point. The EOI process has now closed and NQBP is currently considering options for infrastructure development at Dudgeon Point. NQBP has allocated $1.8 million in 2010-11 to undertake a Master Plan of the Port of Hay Point, including studies into the possible future development of Dudgeon Point.
Wiggins Island Coal Terminal
Stage 1 of WICT will create an initial capacity of at least 20 mtpa with total capacity for the terminal of approximately 70 mtpa, delivered in incremental stages.
In late 2008, the WICET Group proposed a private finance proposal for the development and construction of a new coal export terminal at the Port of Gladstone owned by the WICET Group with GPC as operator.
On 11 December 2009, the State, GPC and the WICET Group executed a Framework Deed under which WICET will secure financing and relevant authority approvals for the design, construction and development of stage 1 of WICT.
A number of activities required ahead of project and financial close are provided for in the Framework Deed and have been progressed. These include a voluntary Wiggins Island Terminal Access Policy to provide open access to the terminal, which has now been finalised. Project financial close is expected in coming months, with construction of Stage 1 of WICT expected to commence shortly thereafter.
Port of Gladstone
GPC’s Western Basin Dredging and Disposal project (the Project) accommodates the long-term dredging and dredged material disposal that is required to provide safe and efficient access to the existing and proposed Gladstone Western Basin Port (Port Curtis, from Auckland Point to The Narrows) facilities over the foreseeable future. These works will be a key component to the future development within the Port of Gladstone, including the emerging LNG industry.
The Project is a State Significant project requiring an Environmental Impact Statement and has been declared a controlled action under section 75 of the Environment Protection and Biodiversity Conservation Act 1999 (Conservation Act).
| | | | |
| | Budget Strategy and Outlook 2010-11 | | 165 |
Due to the extent and staged development of potential future dredging and disposal of dredge material from within the Western Basin area, a master planning process has been adopted by the Coordinator-General to support the approvals process for the area’s staged development.
Discussions are also continuing with regards to requirements for staging facilities on the mainland, with a focus on Port Central and Curtis Island to cater for the construction of proposed LNG plants on Curtis Island.
Balaclava Island
In collaboration with the Government, GPC and local communities, Xstrata Coal Queensland (XCQ), a subsidiary of Xstrata Coal, is conducting detailed pre-feasibility studies and environmental assessments into a proposed Balaclava Island Coal Export Terminal (BICET) in Central Queensland, with development costs expected to be approximately $1 billion to $1.5 billion.
In October 2009, XCQ submitted an Initial Advice Statement to Queensland’s Coordinator-General under the State Development and Public Works Organisation Act 1971.
The development of a coal export terminal at Balaclava Island, with an export capacity of up to 35 mtpa, would avoid further congestion at existing coal terminals at the Port of Gladstone, Dalrymple Bay and Abbot Point and increase the volume of exports to global markets from Queensland's Bowen and Surat Basins.
On 7 May 2010, the Coordinator-General declared the proposed BICET a significant project, signalling the start of a robust assessment process across the whole of government.
Transfer of Port of Bundaberg
The Port of Bundaberg was transferred from PBC to GPC on 1 November 2009. GPC has commenced a strategic planning and business development process for the Port of Bundaberg to gain an appreciation of its potential and will be extending its 50 year Strategic Planning process to include the Port of Bundaberg. This process will be informed by investigations undertaken during 2010-11.
Townsville Marine Precinct
In 2009-10, the Government approved the development of the Precinct at the Port of Townsville. The Precinct will provide a dedicated marine industrial facility, while allowing for the relocation of a number of marine activities from sites upstream of the Townsville Port Access Road Bridge.
| | | | |
| 166 | | Budget Strategy and Outlook 2010-11 | | |
Early in 2010, Laing O’Rourke Pty Ltd and PoTL formed an alliance partnership for the construction of the Precinct. On 25 May 2010, the first sod was turned for stage one of the precinct. The focus of the stage one works will be to relocate the local commercial fishing fleet, marine fabrication and repair industries, marine research facilities and other key marine developments. The construction program of the Precinct remains on schedule with completion anticipated by late 2011.
Cairns Cruise Ship Facility
In 2009-10, the Government provided $11.2 million to FNQP to construct a Cruise Ship Terminal adjacent to the Cityport development in Cairns. The new terminal development will consist of the refurbishment of heritage listed Wharf Shed 3, construction of pedestrian zones, covered access to new bus and taxi bays and public space landscaping. The terminal is designed to accommodate two large cruise vessels with up to 1,800 transit passengers or operate as a home port for a vessel based in Cairns of up to 200 metres with 600 passengers.
FNQP has appointed Hutchinson Builders to construct the terminal, which is expected to be completed in August 2010 and operational by late 2010.
Brisbane Terminal expansion
PBC is budgeting $382 million over five years for new Wharves 11 and 12 and establishing associated land works at Fisherman Islands. PBC is committed to completing Wharf 11 by June 2012 and Wharf 12 by mid-2014. In 2010-11, PBC will commence construction of Wharf 11 and continue dredging the berths. The new wharves will increase the Port of Brisbane’s container-handling facility by 25% and increase the number of dedicated container wharves at the port to nine.
Queensland Motorways Limited
QML is forecast to spend $198.5 million on construction of the Gateway Upgrade South, which will upgrade the section of the Gateway Motorway between Mt Gravatt-Capalaba Road and the Pacific Motorway to six lanes. This will include:
| • | | widening the Gateway to six lanes between Miles Platting and Mt Gravatt-Capalaba Roads |
| • | | widening the bridges at Prebble Street and the Mt Gravatt-Capalaba Road interchange to three lanes in each direction |
| • | | minor localised intersection upgrades at the Mt Gravatt-Capalaba Road interchange. |
| | | | |
| | Budget Strategy and Outlook 2010-11 | | 167 |
WATER SECTOR
SunWater
Kinchant Dam Safety Upgrade
Funding of $30 million has been provided to SunWater over 2010-11 and 2011-12 for the upgrade of the Kinchant Dam Spillway with works anticipated to begin during the second half of 2010.
Regulatory Pricing
SunWater’s current rural irrigation price path ends on 30 June 2011 and the process to determine irrigation prices for the period from 1 July 2011 to 30 June 2016 are underway.
The next price path will continue the Government’s policy to transition rural irrigation prices to reflect the recovery of all of SunWater’s costs, which is an important component of the Government meeting its commitments to water reform, under the 2004 National Water Initiative.
The Government has built in significant safeguards for irrigators so the new prices will not be greater than the irrigation sector’s capacity to pay, with prices phased in over a period of up to 15 years to allow irrigators time to adjust to new arrangements. The Queensland Competition Authority will also provide technical advice and recommend prices that will give Government, irrigators and SunWater confidence in the independence of the process.
Regional Water Projects
Through 2010, SunWater will continue its capital works program and related investigations subject to their support by sound business cases underwritten by commercial contracts with customers and appropriate funding strategies agreed with by shareholding departments. Proposed projects include:
Connors River Dam
The proposed dam and 133 kilometre pipeline is located on the Connors River, near Mount Bridget. The Connors River Dam is proposed to be the primary water supply source for coal mining developments in the Galilee Basin with a storage size of 373,662 megalitres (ML).
Nathan Dam
The proposed Nathan Dam is located just upstream of Nathan Gorge on the Dawson River and will transport water via a new pipeline to mines and power stations in the Surat Basin, potentially extending as far as Dalby. The final storage size and reach of potential water distribution is dependent on the outcomes of SunWater’s business case. SunWater has recently been investigating the viability of developing a new water supply scheme that utilises associated water from the coal seam gas (CSG) industry.
| | | | |
| 168 | | Budget Strategy and Outlook 2010-11 | | |
Water for Bowen
SunWater is actively engaging with industry and undertaking studies to test the full commerciality of the proposed Water for Bowen Project, a channel and pipeline water transport system from the Burdekin River near Clare to Bowen.
The project aims to meet future industrial, agricultural and urban demand in the Bowen region and depends on substantial commitments from major industrial customers. The optimal capacity for the project, as identified by SunWater, is 60,000 ML per annum.
State Water Entities
The Queensland Government has been undertaking fundamental reform of the water supply industry in SEQ. The key elements of this reform process include:
| • | | the construction of the SEQ Water Grid, establishing interconnection of key supply and demand zones in the region and significant climate-resilient sources of supply, including desalination and recycled water |
| • | | the structural consolidation of the fragmented water supply industry in SEQ, which prior to the reform process included 25 different water service providers, including 21 bulk water assets owned by 12 different bodies with 17 water retailers. Industry reform has significantly rationalised these arrangements, and better enabled the new SEQ Water Grid Manager to coordinate efficient water distribution across the region |
| • | | significant regulatory reform intended to provide more transparent and effective frameworks for: |
| | • | | economic regulation and pricing to incentivise efficient demand outcomes; |
| | • | | planning and development regulation, promoting economic efficiency and total water cycle management; and |
| | • | | asset management regulation, promoting active, whole-of-life asset management. |
Stage One of the SEQ water reform program focussed on the bulk water industry, and in particular, the establishment of three State-owned statutory authorities to control and operate the larger bulk water assets that store, manufacture and distribute bulk water in the region (Seqwater, WaterSecure and LinkWater respectively). The SEQ Water Grid Manager was also established to manage contracts with the bulk supply and transport entities and the retailers, to manage the equitable distribution of water across the SEQ Water Grid and to allow for the sharing of costs.
Stage Two of the reforms – to be operational from 1 July 2010 – focuses on downstream water reform. The core of the Stage Two reform program involves the functional separation of water distribution and retail activities from individual SEQ councils, and the establishment of a new structural and regulatory framework to govern the delivery of retail and distribution services in SEQ. The new arrangements will create greater regional synergies in service delivery, planning and service standards, and improved economic regulation. The three new standalone businesses delivering water retail and distribution will continue to be owned by local governments.
| | | | |
| | Budget Strategy and Outlook 2010-11 | | 169 |
To meet current and future water supply needs in SEQ, the Government is continuing construction of the Water Grid, ensuring climate-resilient supply arrangements and allowing water to be regionally managed and allocated to meet demand in the areas of highest need.
In 2010-11, $202.2 million is budgeted for the Northern Pipeline Interconnector Stage 2. The pipeline will facilitate the integration of Sunshine Coast Regional Council into the SEQ Water Grid.
The Government-owned special-purpose vehicle construction company Queensland Water Infrastructure Pty Ltd is progressing with construction of the $348 million Wyalarong Dam project, which is scheduled for completion in 2011. The Dam will provide an additional 26,000 ML/pa of water when operated with the Cedar Grove Weir and the Bromelton Offstream Storage.
To establish a clear policy framework to manage and plan future water supply needs in SEQ, the Government released its draft SEQ Water Strategy in November 2009, with the final Strategy due for release in mid-2010. The Water Strategy is the adaptive plan to meet the region’s water supply requirements to 2050 and beyond. Its core objective is the delivery of a Water Supply Guarantee, supplying sufficient water to support a comfortable and sustainable lifestyle while meeting the needs of urban, industrial and rural growth and the environment. This objective will be delivered through a combination of demand management, timely investment in infrastructure and the efficient operation of the SEQ Water Grid.
The revised Water Strategy reflects a number of key policy decisions influencing the water security planning framework, including the Australian Government’s decision not to allow Traveston Crossing Dam to proceed and Government’s decision regarding the prioritisation of potential future desalination sites for SEQ. The Water Strategy indicates that additional water supplies to meet the needs of population growth and mitigate against climate change will need to be available by as early as 2017. The Water Commission is undertaking detailed planning to ensure that additional supplies can be delivered efficiently and when required. These investigations will inform a final decision on the preferred location, capacity and timing of future desalination facilities.
The Water Strategy will be reviewed every five years, ensuring it has the flexibility to adapt to SEQ’s changing water supply needs.
| | | | |
| 170 | | Budget Strategy and Outlook 2010-11 | | |
| 9 | UNIFORM PRESENTATION FRAMEWORK |
INTRODUCTION
This chapter contains detailed financial statements for the Queensland Public Sector prepared under the Uniform Presentation Framework (UPF) of reporting as required under the Australian Loan Council arrangements.
The Framework was reviewed following the release in October 2007 of the Australian Accounting Standards Board’s (AASB) accounting standard, AASB 1049 Whole of Government and General Government Sector Financial Reporting. The standard aims to harmonise Government Finance Statistics (GFS) and Generally Accepted Accounting Principles (GAAP) with the objective of improving the clarity and transparency of government financial statements.
In addition, the chapter provides:
| • | | a reconciliation of the General Government sector net operating balance to the accounting operating result |
| • | | a time series for the General Government sector using the revised UPF |
| • | | details of General Government grant revenue and expenses |
| • | | details of General Government sector dividend and income tax equivalent income |
| • | | data on General Government expenses and purchases of non-financial assets by function |
| • | | details of taxation revenue collected by the General Government sector |
| • | | the State’s revised Loan Council Budget allocation |
| • | | details of contingent liabilities |
| • | | background information on the revised UPF and disclosure differences arising from it, including the conceptual basis, sector definitions and a list of reporting entities. |
This chapter also includes a discussion of the operations of the Public Non-financial Corporations (PNFC) sector.
Under the UPF requirements, budgeted financial information for the Public Financial Corporations (PFC) sector is not included.
GENERAL GOVERNMENT SECTOR
A detailed analysis of the General Government sector is provided in Chapter 4 – Revenue, Chapter 5 – Expenses and Chapter 6 – Balance Sheet and Cash Flows.
| | | | |
| | Budget Strategy and Outlook 2010-11 | | 171 |
PUBLIC NON-FINANCIAL CORPORATIONS SECTOR
The PNFC sector, which includes the GOCs, Queensland Motorways Limited and the State water entities, is forecast to provide dividends of $1.05 billion and current TEPs of $385 million in 2010-11.
The Government is committed to ensuring that all Queenslanders are provided with essential services such as electricity and public transport at a reasonable cost, regardless of where they live. This is achieved through the provision of CSOs, which are forecast to be $1.839 billion in 2010-11.
The Government continues to invest in infrastructure projects in the PNFC sector to ensure the continued delivery of essential services and an acceptable return to Government on its investment. Net additional equity injections of $408 million has been budgeted for 2010-11, including funding provided to QR for continuing investment in rail infrastructure in South East Queensland.
PNFC operating statement
The major components of PNFC sector revenues include rail freight charges, electricity sales, electricity distribution and network charges, port charges and agriculture and bulk water delivery charges. Key drivers of the increase in total budgeted revenue in 2010-11 to $13.086 billion compared to the estimated 2009-10 total of $11.994 billion include increased coal revenue for QR, as the industry improves after the impact of the global financial crisis and the outcome of the Australian Energy Regulator’s Final Determination, announced on 6 May 2010, on Government-owned electricity distribution business revenue.
A significant source of revenue generated in the PNFC sector is received through the sale of goods and services to customer markets, which makes it highly dependent on the performance of the Queensland economy and the ability of the sector to compete in competitive markets. Across the PNFC sector, revenue from sales of goods and services is forecast to grow from $10.574 billion in 2010-11 to $13.943 billion by 2013-14. The key drivers of the forecast increase in sales of goods and services are consistent with the growth in total revenue referred to above.
PNFC sector revenues are also derived from CSO payments. CSOs are provided by the Government where PNFCs are required to provide non-commercial services or services at non-commercial prices for the benefit of the community. Major CSOs are paid to QR in respect of passenger rail travel and Ergon in respect of the electricity uniform tariff. The PNFC sector distributes dividends to the Government as shareholder. Dividends from the PNFC sector are a function of net profit after tax (NPAT) and the dividend payout ratio, which is generally based on 80% of NPAT.
| | | | |
| 172 | | Budget Strategy and Outlook 2010-11 | | |
In some cases, forecast NPAT will be adjusted to exclude any net unrealised (that is, non-cash) forecast gains, for example, from upward revaluation of non-current assets or financial instruments.
The dividend payout ratio does not affect a PNFC’s capacity to carry out necessary maintenance and repairs, as dividends are paid after all such costs are met. Shareholding Ministers consider the circumstances of individual PNFCs and advice from their boards before arriving at the final determination of dividend payments. Dividends are forecast to increase over the forward estimates period, reaching $1.422 billion by 2013-14.
The PNFC sector’s 2009-10 estimated actual Uniform Presentation Framework (UPF) net operating balance has been revised downwards from $341 million at the time of the 2009-10 Budget to $244 million. This is largely driven by an increase in depreciation expense due to asset revaluations.
PNFC balance sheet and cash flow statement
In 2010-11, PNFCs are forecast to spend $7.144 billion in capital investments and maintenance projects to ensure their future ability to effectively service their customers with total investment over the four years to 2013-14 forecast to be $22.966 billion. Capital expenditure in 2010-11 includes $446.4 million by QR to upgrade infrastructure and rollingstock on the Citytrain network, $1.035 billion by ENERGEX for the regulated electricity capital expenditure program and $90 million by the Queensland Bulk Water Supply Authority for raising the Hinze Dam (Stage 3 project). Key capital projects in each sector are discussed below.
Investment in electricity infrastructure is driven by peak demand, which continues to grow, largely as a result of Queensland’s significant population growth and increased uptake of lifestyle appliances. Key infrastructure projects in 2010-11 include $58.4 million by Stanwell for major overhauls and efficiency upgrades at Stanwell Power Station and $117 million by Powerlink towards the establishment of two new substations at Western Downs and Halys, construction of a transmission line between the substations and reconfiguration of the existing Kogan Creek to Braemar transmission line and associated substation works.
QR is budgeting for a capital program of $2.772 billion in 2010-11, including $446.4 million under the South East Queensland Infrastructure Plan and Program (SEQIPP). Key projects under SEQIPP include $155.6 million to continue construction of the Springfield Line from Darra to Richlands and Springfield and $174.4 million to continue building 64 new three car-carriage passenger trains for the Citytrain network. In addition, QR has budgeted $864.2 million for coal network track works and new and upgraded locomotives and wagons to support the haulage of coal in Queensland, including $502.2 million to continue the Goonyella to Abbot Point Expansion project.
| | | | |
| | Budget Strategy and Outlook 2010-11 | | 173 |
The port PNFCs continue to invest in capital projects in 2010-11, including $56.7 million to continue construction of berths 11 and 12 at Fishermans Island to accommodate a third stevedore at the Port of Brisbane, $40.2 million to continue capacity improvements and upgrades at the RG Tanna Coal Terminal at the Port of Gladstone, $53.5 million to complete the Abbot Point Coal Terminal X50 expansion to increase the capacity of the terminal to 50 million tonnes per annum and $57.5 million to continue construction of the Townsville Marine Precinct to provide a dedicated marine facility for the local industrial and commercial marine industries.
Financing of capital projects differs according to the circumstances of the relevant PNFC and the nature of the project. There are a number of ways in which PNFCs fund their investments, including utilising cash flows from their business, borrowings and equity injections from Government.
When reviewing the funding arrangements for capital projects, the Government considers the relevant PNFC’s financial position to ensure it can remain sufficiently well capitalised to maintain an investment grade credit rating, as determined by independent credit ratings agencies, while still being able to undertake viable capital projects.
The Public Non-financial Corporations sector is discussed in more detail in Chapter 8.
UNIFORM PRESENTATION FRAMEWORK FINANCIAL INFORMATION
The tables on the following pages present operating statements, balance sheets and cash flow statements prepared on a harmonised basis for the General Government, Public Non-financial Corporations and Non-financial Public sectors.
| | | | |
| 174 | | Budget Strategy and Outlook 2010-11 | | |
Table 9.1
General Government Sector Operating Statement 1
| | | | | | | | | | | | | | | | | | | | | | | | | | |
| | | | | 2009-10
Budget 2
$ million | | | 2009-10
Est.Actual
$ million | | | 2010-11
Budget
$ million | | | 2011-12
Projection
$ million | | | 2012-13
Projection
$ million | | | 2013-14
Projection
$ million | |
| | Revenue from Transactions | | | | | | | | | | | | | | | | | | | | | | | | |
| | Taxation revenue | | | 9,287 | | | | 9,474 | | | | 10,192 | | | | 11,009 | | | | 11,932 | | | | 12,662 | |
| | Grants revenue | | | 18,735 | | | | 20,375 | | | | 18,872 | | | | 18,882 | | | | 19,050 | | | | 19,735 | |
| | Sales of goods and services | | | 3,650 | | | | 3,928 | | | | 4,077 | | | | 4,402 | | | | 4,491 | | | | 4,710 | |
| | Interest income | | | 2,017 | | | | 2,230 | | | | 2,132 | | | | 2,224 | | | | 2,322 | | | | 2,411 | |
| | Dividend and income tax equivalent income | | | 1,150 | | | | 1,005 | | | | 1,460 | | | | 1,590 | | | | 1,865 | | | | 2,035 | |
| | Other revenue | | | 2,354 | | | | 2,678 | | | | 3,874 | | | | 3,831 | | | | 3,792 | | | | 3,744 | |
| | Total Revenue from Transactions | | | 37,192 | | | | 39,689 | | | | 40,606 | | | | 41,938 | | | | 43,453 | | | | 45,298 | |
| | | | | | | |
Less | | Expenses from Transactions | | | | | | | | | | | | | | | | | | | | | | | | |
| | Employee expenses | | | 15,006 | | | | 15,395 | | | | 16,221 | | | | 17,362 | | | | 18,323 | | | | 19,059 | |
| | Superannuation expenses | | | | | | | | | | | | | | | | | | | | | | | | |
| | Superannuation interest cost | | | 1,468 | | | | 1,329 | | | | 1,261 | | | | 1,310 | | | | 1,355 | | | | 1,397 | |
| | Other superannuation expenses | | | 2,093 | | | | 2,019 | | | | 2,103 | | | | 2,200 | | | | 2,290 | | | | 2,350 | |
| | Other operating expenses | | | 7,776 | | | | 8,124 | | | | 8,502 | | | | 8,440 | | | | 8,545 | | | | 8,753 | |
| | Depreciation and amortisation | | | 2,773 | | | | 2,479 | | | | 2,822 | | | | 3,215 | | | | 3,407 | | | | 3,645 | |
| | Other interest expenses | | | 887 | | | | 827 | | | | 1,242 | | | | 1,705 | | | | 2,078 | | | | 2,341 | |
| | Grants expenses | | | 9,143 | | | | 9,802 | | | | 10,201 | | | | 9,149 | | | | 8,937 | | | | 9,147 | |
| | Total Expenses from Transactions | | | 39,146 | | | | 39,976 | | | | 42,352 | | | | 43,380 | | | | 44,935 | | | | 46,693 | |
| | | | | | | |
Equals | | Net Operating Balance | | | (1,954 | ) | | | (287 | ) | | | (1,745 | ) | | | (1,442 | ) | | | (1,482 | ) | | | (1,395 | ) |
| | | | | | | |
Plus | | Other economic flows - included in operating result | | | 66 | | | | 54 | | | | (178 | ) | | | (34 | ) | | | (17 | ) | | | (13 | ) |
| | | | | | | |
Equals | | Operating Result | | | (1,888 | ) | | | (233 | ) | | | (1,924 | ) | | | (1,477 | ) | | | (1,499 | ) | | | (1,408 | ) |
| | | | | | | |
Plus | | Other economic flows - other movements in equity | | | 3,232 | | | | 3,221 | | | | 2,881 | | | | 3,031 | | | | 3,397 | | | | 3,717 | |
| | | | | | | |
Equals | | Comprehensive Result - Total Change In Net Worth | | | 1,344 | | | | 2,989 | | | | 957 | | | | 1,555 | | | | 1,898 | | | | 2,309 | |
| | | | | | | |
| | KEY FISCAL AGGREGATES | | | | | | | | | | | | | | | | | | | | | | | | |
| | | | | | | |
| | Net Operating Balance | | | (1,954 | ) | | | (287 | ) | | | (1,745 | ) | | | (1,442 | ) | | | (1,482 | ) | | | (1,395 | ) |
| | | | | | | |
Less | | Net Acquisition of Non-financial Assets | | | | | | | | | | | | | | | | | | | | | | | | |
| | Purchases of non-financial assets | | | 9,270 | | | | 8,626 | | | | 8,335 | | | | 7,490 | | | | 5,751 | | | | 4,628 | |
| | Less Sales of non-financial assets | | | 251 | | | | 214 | | | | 203 | | | | 196 | | | | 298 | | | | 150 | |
| | Less Depreciation | | | 2,773 | | | | 2,479 | | | | 2,822 | | | | 3,215 | | | | 3,407 | | | | 3,645 | |
| | Plus Change in inventories | | | 63 | | | | 150 | | | | 73 | | | | 14 | | | | 62 | | | | 72 | |
| | Plus Other movements in non-financial assets | | | 45 | | | | 172 | | | | 186 | | | | 182 | | | | 130 | | | | 141 | |
| | Equals Total Net Acquisition of Non-financial Assets | | | 6,354 | | | | 6,254 | | | | 5,569 | | | | 4,275 | | | | 2,240 | | | | 1,046 | |
| | | | | | | |
Equals | | Net Lending / (Borrowing) | | | (8,308 | ) | | | (6,541 | ) | | | (7,314 | ) | | | (5,717 | ) | | | (3,722 | ) | | | (2,441 | ) |
Notes:
| 1. | Numbers may not add due to rounding. |
| 2. | Numbers have been restated where subsequent changes in classification have occurred. |
| | | | |
| | Budget Strategy and Outlook 2010-11 | | 175 |
Table 9.2
Public Non-financial Corporations Sector Operating Statement 1
| | | | | | | | | | | | | | | | | | | | | | | | | | |
| | | | | 2009-10
Budget 2
$ million | | | 2009-10
Est.Actual
$ million | | | 2010-11
Budget
$ million | | | 2011-12
Projection
$ million | | | 2012-13
Projection
$ million | | | 2013-14
Projection
$ million | |
| | Revenue from Transactions | | | | | | | | | | | | | | | | | | | | | | | | |
| | Grants revenue | | | 1,858 | | | | 2,200 | | | | 2,092 | | | | 2,179 | | | | 2,219 | | | | 2,266 | |
| | Sales of goods and services | | | 8,855 | | | | 9,290 | | | | 10,574 | | | | 11,351 | | | | 12,903 | | | | 13,943 | |
| | Interest income | | | 82 | | | | 91 | | | | 98 | | | | 90 | | | | 100 | | | | 110 | |
| | Other revenue | | | 401 | | | | 413 | | | | 323 | | | | 496 | | | | 396 | | | | 514 | |
| | Total Revenue from Transactions | | | 11,196 | | | | 11,994 | | | | 13,086 | | | | 14,116 | | | | 15,618 | | | | 16,833 | |
| | | | | | | |
Less | | Expenses from Transactions | | | | | | | | | | | | | | | | | | | | | | | | |
| | Employee expenses | | | 2,310 | | | | 2,347 | | | | 2,563 | | | | 2,726 | | | | 2,756 | | | | 2,740 | |
| | Superannuation expenses | | | | | | | | | | | | | | | | | | | | | | | | |
| | Other superannuation expenses | | | 91 | | | | 189 | | | | 106 | | | | 110 | | | | 121 | | | | 117 | |
| | Other operating expenses | | | 3,773 | | | | 4,185 | | | | 4,284 | | | | 4,497 | | | | 5,103 | | | | 5,841 | |
| | Depreciation and amortisation | | | 2,211 | | | | 2,455 | | | | 2,747 | | | | 2,904 | | | | 3,079 | | | | 3,186 | |
| | Other interest expenses | | | 2,206 | | | | 2,252 | | | | 2,654 | | | | 2,931 | | | | 3,203 | | | | 3,370 | |
| | Grants expenses | | | 14 | | | | 91 | | | | 34 | | | | 14 | | | | 14 | | | | 3 | |
| | Other property expenses | | | 249 | | | | 232 | | | | 388 | | | | 427 | | | | 506 | | | | 559 | |
| | Total Expenses from Transactions | | | 10,855 | | | | 11,750 | | | | 12,776 | | | | 13,609 | | | | 14,783 | | | | 15,816 | |
| | | | | | | |
Equals | | Net Operating Balance | | | 341 | | | | 244 | | | | 311 | | | | 507 | | | | 835 | | | | 1,018 | |
| | | | | | | |
Plus | | Other economic flows - included in operating result | | | (126 | ) | | | (758 | ) | | | (109 | ) | | | (170 | ) | | | (142 | ) | | | (123 | ) |
| | | | | | | |
Equals | | Operating Result | | | 215 | | | | (514 | ) | | | 202 | | | | 337 | | | | 693 | | | | 894 | |
| | | | | | | |
Plus | | Other economic flows - other movements in equity | | | 253 | | | | 132 | | | | (453 | ) | | | 168 | | | | (157 | ) | | | (206 | ) |
| | | | | | | |
Equals | | Comprehensive Result - Total Change In Net Worth | | | 467 | | | | (383 | ) | | | (251 | ) | | | 506 | | | | 536 | | | | 688 | |
| | | | | | | |
| | KEY FISCAL AGGREGATES | | | | | | | | | | | | | | | | | | | | | | | | |
| | | | | | | |
| | Net Operating Balance | | | 341 | | | | 244 | | | | 311 | | | | 507 | | | | 835 | | | | 1,018 | |
| | | | | | | |
Less | | Net Acquisition of Non-financial Assets | | | | | | | | | | | | | | | | | | | | | | | | |
| | Purchases of non-financial assets | | | 8,002 | | | | 7,682 | | | | 7,144 | | | | 5,877 | | | | 4,964 | | | | 4,981 | |
| | Less Sales of non-financial assets | | | 35 | | | | 33 | | | | 184 | | | | 101 | | | | 177 | | | | 209 | |
| | Less Depreciation | | | 2,211 | | | | 2,455 | | | | 2,747 | | | | 2,904 | | | | 3,079 | | | | 3,186 | |
| | Plus Change in inventories | | | (8 | ) | | | (101 | ) | | | 26 | | | | 1 | | | | 10 | | | | 17 | |
| | Plus Other movements in non-financial assets | | | 25 | | | | (28 | ) | | | 40 | | | | 43 | | | | 45 | | | | 47 | |
| | Equals Total Net Acquisition of Non-financial Assets | | | 5,773 | | | | 5,065 | | | | 4,281 | | | | 2,917 | | | | 1,764 | | | | 1,651 | |
| | | | | | | |
Equals | | Net Lending / (Borrowing) | | | (5,432 | ) | | | (4,821 | ) | | | (3,970 | ) | | | (2,409 | ) | | | (929 | ) | | | (633 | ) |
Notes:
| 1. | Numbers may not add due to rounding. |
| 2. | Numbers have been restated where subsequent changes in classification have occurred. |
| | | | |
| 176 | | Budget Strategy and Outlook 2010-11 | | |
Table 9.3
Non-financial Public Sector Operating Statement 1
| | | | | | | | | | | | | | | | | | | | | | | | | | |
| | | | | 2009-10
Budget 2
$ million | | | 2009-10
Est.Actual
$ million | | | 2010-11
Budget
$ million | | | 2011-12
Projection
$ million | | | 2012-13
Projection
$ million | | | 2013-14
Projection
$ million | |
| | Revenue from Transactions | | | | | | | | | | | | | | | | | | | | | | | | |
| | Taxation revenue | | | 8,996 | | | | 9,182 | | | | 9,854 | | | | 10,637 | | | | 11,529 | | | | 12,230 | |
| | Grants revenue | | | 18,836 | | | | 20,492 | | | | 18,914 | | | | 18,949 | | | | 19,117 | | | | 19,806 | |
| | Sales of goods and services | | | 12,299 | | | | 12,876 | | | | 14,316 | | | | 15,394 | | | | 17,017 | | | | 18,249 | |
| | Interest income | | | 2,098 | | | | 2,320 | | | | 2,230 | | | | 2,314 | | | | 2,422 | | | | 2,521 | |
| | Dividend and income tax equivalent income | | | 31 | | | | 31 | | | | 25 | | | | 28 | | | | 47 | | | | 57 | |
| | Other revenue | | | 2,748 | | | | 3,088 | | | | 4,194 | | | | 4,324 | | | | 4,186 | | | | 4,255 | |
| | Total Revenue from Transactions | | | 45,007 | | | | 47,988 | | | | 49,533 | | | | 51,646 | | | | 54,319 | | | | 57,119 | |
| | | | | | | |
Less | | Expenses from Transactions | | | | | | | | | | | | | | | | | | | | | | | | |
| | Employee expenses | | | 17,212 | | | | 17,612 | | | | 18,664 | | | | 19,963 | | | | 20,943 | | | | 21,668 | |
| | Superannuation expenses | | | | | | | | | | | | | | | | | | | | | | | | |
| | Superannuation interest cost | | | 1,468 | | | | 1,329 | | | | 1,261 | | | | 1,310 | | | | 1,355 | | | | 1,397 | |
| | Other superannuation expenses | | | 2,185 | | | | 2,208 | | | | 2,209 | | | | 2,310 | | | | 2,410 | | | | 2,467 | |
| | Other operating expenses | | | 11,319 | | | | 11,934 | | | | 12,415 | | | | 12,537 | | | | 13,226 | | | | 14,142 | |
| | Depreciation and amortisation | | | 4,984 | | | | 4,934 | | | | 5,568 | | | | 6,119 | | | | 6,486 | | | | 6,831 | |
| | Other interest expenses | | | 2,916 | | | | 2,939 | | | | 3,704 | | | | 4,416 | | | | 5,046 | | | | 5,445 | |
| | Grants expenses | | | 7,409 | | | | 7,822 | | | | 8,197 | | | | 7,064 | | | | 6,813 | | | | 6,969 | |
| | Total Expenses from Transactions | | | 47,493 | | | | 48,779 | | | | 52,017 | | | | 53,719 | | | | 56,279 | | | | 58,918 | |
| | | | | | | |
Equals | | Net Operating Balance | | | (2,485 | ) | | | (791 | ) | | | (2,485 | ) | | | (2,073 | ) | | | (1,961 | ) | | | (1,799 | ) |
| | | | | | | |
Plus | | Other economic flows - included in operating result | | | (60 | ) | | | (704 | ) | | | (287 | ) | | | (205 | ) | | | (159 | ) | | | (136 | ) |
| | | | | | | |
Equals | | Operating Result | | | (2,545 | ) | | | (1,494 | ) | | | (2,772 | ) | | | (2,278 | ) | | | (2,120 | ) | | | (1,936 | ) |
| | | | | | | |
Plus | | Other economic flows - other movements in equity | | | 3,890 | | | | 4,483 | | | | 3,728 | | | | 3,832 | | | | 4,018 | | | | 4,244 | |
| | | | | | | |
Equals | | Comprehensive Result - Total Change In Net Worth | | | 1,344 | | | | 2,989 | | | | 957 | | | | 1,555 | | | | 1,898 | | | | 2,309 | |
| | | | | | | |
| | KEY FISCAL AGGREGATES | | | | | | | | | | | | | | | | | | | | | | | | |
| | | | | | | |
| | Net Operating Balance | | | (2,485 | ) | | | (791 | ) | | | (2,485 | ) | | | (2,073 | ) | | | (1,961 | ) | | | (1,799 | ) |
| | | | | | | |
Less | | Net Acquisition of Non-financial Assets | | | | | | | | | | | | | | | | | | | | | | | | |
| | Purchases of non-financial assets | | | 17,272 | | | | 16,305 | | | | 15,479 | | | | 13,367 | | | | 10,716 | | | | 9,609 | |
| | Less Sales of non-financial assets | | | 286 | | | | 247 | | | | 387 | | | | 297 | | | | 474 | | | | 359 | |
| | Less Depreciation | | | 4,984 | | | | 4,934 | | | | 5,568 | | | | 6,119 | | | | 6,486 | | | | 6,831 | |
| | Plus Change in inventories | | | 55 | | | | 49 | | | | 99 | | | | 15 | | | | 73 | | | | 90 | |
| | Plus Other movements in non-financial assets | | | 70 | | | | 143 | | | | 227 | | | | 225 | | | | 175 | | | | 188 | |
| | Equals Total Net Acquisition of Non-financial Assets | | | 12,127 | | | | 11,316 | | | | 9,850 | | | | 7,191 | | | | 4,003 | | | | 2,697 | |
| | | | | | | |
Equals | | Net Lending / (Borrowing) | | | (14,612 | ) | | | (12,107 | ) | | | (12,335 | ) | | | (9,265 | ) | | | (5,964 | ) | | | (4,496 | ) |
Notes:
| 1. | Numbers may not add due to rounding. |
| 2. | Numbers have been restated where subsequent changes in classification have occurred. |
| | | | |
| | Budget Strategy and Outlook 2010-11 | | 177 |
Table 9.4
General Government Sector Balance Sheet 1
| | | | | | | | | | | | | | | | | | | | | | | | |
| | | 2009-10
Budget 2
$ million | | | 2009-10
Est.Actual
$ million | | | 2010-11
Budget
$ million | | | 2011-12
Projection
$ million | | | 2012-13
Projection
$ million | | | 2013-14
Projection
$ million | |
Assets | | | | | | | | | | | | | | | | | | | | | | | | |
Financial Assets | | | | | | | | | | | | | | | | | | | | | | | | |
Cash and deposits | | | 1,751 | | | | 451 | | | | 308 | | | | 333 | | | | 325 | | | | 325 | |
Advances paid | | | 635 | | | | 569 | | | | 594 | | | | 621 | | | | 638 | | | | 649 | |
Investments, loans and placements | | | 27,532 | | | | 28,182 | | | | 29,553 | | | | 30,871 | | | | 32,140 | | | | 33,716 | |
Receivables | | | 3,427 | | | | 3,174 | | | | 3,357 | | | | 3,477 | | | | 3,665 | | | | 3,924 | |
Equity | | | | | | | | | | | | | | | | | | | | | | | | |
Investments in other public sector entities | | | 15,672 | | | | 24,898 | | | | 24,648 | | | | 25,154 | | | | 25,690 | | | | 26,379 | |
Investments - other | | | 38 | | | | 46 | | | | 59 | | | | 106 | | | | 136 | | | | 136 | |
Total Financial Assets | | | 49,056 | | | | 57,319 | | | | 58,518 | | | | 60,562 | | | | 62,594 | | | | 65,128 | |
| | | | | | |
Non-financial Assets | | | | | | | | | | | | | | | | | | | | | | | | |
Land and other fixed assets | | | 149,880 | | | | 174,531 | | | | 182,735 | | | | 189,837 | | | | 194,970 | | | | 198,700 | |
Other non-financial assets | | | 6,591 | | | | 6,451 | | | | 6,759 | | | | 7,103 | | | | 7,592 | | | | 7,829 | |
Total Non-financial Assets | | | 156,471 | | | | 180,982 | | | | 189,493 | | | | 196,940 | | | | 202,562 | | | | 206,529 | |
| | | | | | |
Total Assets | | | 205,527 | | | | 238,301 | | | | 248,012 | | | | 257,502 | | | | 265,156 | | | | 271,657 | |
| | | | | | |
Liabilities | | | | | | | | | | | | | | | | | | | | | | | | |
Payables | | | 2,839 | | | | 3,155 | | | | 3,085 | | | | 3,069 | | | | 3,113 | | | | 3,163 | |
Superannuation liability | | | 25,303 | | | | 24,563 | | | | 25,462 | | | | 26,270 | | | | 26,986 | | | | 27,606 | |
Other employee benefits | | | 4,071 | | | | 3,945 | | | | 4,177 | | | | 4,410 | | | | 4,634 | | | | 4,875 | |
Advances received | | | 471 | | | | 472 | | | | 462 | | | | 452 | | | | 442 | | | | 431 | |
Borrowing | | | 18,775 | | | | 15,524 | | | | 23,250 | | | | 30,080 | | | | 34,756 | | | | 37,967 | |
Other liabilities | | | 2,923 | | | | 3,035 | | | | 3,012 | | | | 3,101 | | | | 3,208 | | | | 3,289 | |
Total Liabilities | | | 54,382 | | | | 50,694 | | | | 59,447 | | | | 67,383 | | | | 73,139 | | | | 77,332 | |
| | | | | | |
Net Worth | | | 151,144 | | | | 187,607 | | | | 188,564 | | | | 190,119 | | | | 192,017 | | | | 194,326 | |
Net Financial Worth | | | (5,327 | ) | | | 6,625 | | | | (929 | ) | | | (6,821 | ) | | | (10,545 | ) | | | (12,203 | ) |
Net Financial Liabilities | | | 20,999 | | | | 18,273 | | | | 25,576 | | | | 31,974 | | | | 36,235 | | | | 38,582 | |
Net Debt | | | (10,672 | ) | | | (13,206 | ) | | | (6,743 | ) | | | (1,294 | ) | | | 2,095 | | | | 3,707 | |
Notes:
| 1. | Numbers may not add due to rounding. |
| 2. | Numbers have been restated where subsequent changes in classification have occurred. |
| | | | |
| 178 | | Budget Strategy and Outlook 2010-11 | | |
Table 9.5
Public Non-financial Corporations Sector Balance Sheet 1
| | | | | | | | | | | | | | | | | | | | | | | | |
| | | 2009-10
Budget 2
$ million | | | 2009-10
Est.Actual
$ million | | | 2010-11
Budget
$ million | | | 2011-12
Projection
$ million | | | 2012-13
Projection
$ million | | | 2013-14
Projection
$ million | |
Assets | | | | | | | | | | | | | | | | | | | | | | | | |
Financial Assets | | | | | | | | | | | | | | | | | | | | | | | | |
Cash and deposits | | | 869 | | | | 1,363 | | | | 943 | | | | 1,101 | | | | 864 | | | | 539 | |
Advances paid | | | 261 | | | | 267 | | | | 247 | | | | 217 | | | | 197 | | | | 177 | |
Investments, loans and placements | | | 466 | | | | 650 | | | | 561 | | | | 499 | | | | 485 | | | | 490 | |
Receivables | | | 1,601 | | | | 1,926 | | | | 2,032 | | | | 2,223 | | | | 2,461 | | | | 2,696 | |
Equity | | | | | | | | | | | | | | | | | | | | | | | | |
Investments - other | | | 80 | | | | 81 | | | | 99 | | | | 119 | | | | 129 | | | | 138 | |
Total Financial Assets | | | 3,277 | | | | 4,288 | | | | 3,882 | | | | 4,159 | | | | 4,137 | | | | 4,040 | |
| | | | | | |
Non-financial Assets | | | | | | | | | | | | | | | | | | | | | | | | |
Land and other fixed assets | | | 63,855 | | | | 68,514 | | | | 72,658 | | | | 76,473 | | | | 79,160 | | | | 81,887 | |
Other non-financial assets | | | 1,886 | | | | 1,513 | | | | 1,449 | | | | 1,510 | | | | 1,553 | | | | 1,554 | |
Total Non-financial Assets | | | 65,741 | | | | 70,026 | | | | 74,107 | | | | 77,984 | | | | 80,713 | | | | 83,441 | |
| | | | | | |
Total Assets | | | 69,018 | | | | 74,314 | | | | 77,989 | | | | 82,143 | | | | 84,851 | | | | 87,481 | |
| | | | | | |
Liabilities | | | | | | | | | | | | | | | | | | | | | | | | |
Payables | | | 2,167 | | | | 2,445 | | | | 2,555 | | | | 2,675 | | | | 2,838 | | | | 2,879 | |
Superannuation liability | | | (90 | ) | | | 131 | | | | 131 | | | | 131 | | | | 132 | | | | 132 | |
Other employee benefits | | | 973 | | | | 895 | | | | 958 | | | | 1,031 | | | | 1,099 | | | | 1,181 | |
Deposits held | | | 26 | | | | 20 | | | | 20 | | | | 21 | | | | 21 | | | | 22 | |
Advances received | | | 12 | | | | 12 | | | | 11 | | | | 11 | | | | 10 | | | | 9 | |
Borrowing | | | 38,949 | | | | 36,080 | | | | 39,578 | | | | 42,712 | | | | 44,216 | | | | 45,580 | |
Other liabilities | | | 7,531 | | | | 7,519 | | | | 7,773 | | | | 8,095 | | | | 8,532 | | | | 8,986 | |
Total Liabilities | | | 49,568 | | | | 47,102 | | | | 51,027 | | | | 54,675 | | | | 56,847 | | | | 58,789 | |
| | | | | | |
Net Worth | | | 19,450 | | | | 27,213 | | | | 26,962 | | | | 27,467 | | | | 28,004 | | | | 28,692 | |
Net Financial Worth | | | (46,291 | ) | | | (42,814 | ) | | | (47,145 | ) | | | (50,516 | ) | | | (52,709 | ) | | | (54,749 | ) |
Net Debt | | | 37,391 | | | | 33,831 | | | | 37,859 | | | | 40,927 | | | | 42,700 | | | | 44,405 | |
Notes:
| 1. | Numbers may not add due to rounding. |
| 2. | Numbers have been restated where subsequent changes in classification have occurred. |
| | | | |
| | Budget Strategy and Outlook 2010-11 | | 179 |
Table 9.6
Non-financial Public Sector Balance Sheet 1
| | | | | | | | | | | | | | | | | | | | | | | | |
| | | 2009-10
Budget 2
$ million | | | 2009-10
Est.Actual
$ million | | | 2010-11
Budget
$ million | | | 2011-12
Projection
$ million | | | 2012-13
Projection
$ million | | | 2013-14
Projection
$ million | |
Assets | | | | | | | | | | | | | | | | | | | | | | | | |
Financial Assets | | | | | | | | | | | | | | | | | | | | | | | | |
Cash and deposits | | | 2,621 | | | | 1,815 | | | | 1,251 | | | | 1,434 | | | | 1,189 | | | | 864 | |
Advances paid | | | 883 | | | | 823 | | | | 829 | | | | 827 | | | | 825 | | | | 817 | |
Investments, loans and placements | | | 27,998 | | | | 28,832 | | | | 30,113 | | | | 31,370 | | | | 32,625 | | | | 34,206 | |
Receivables | | | 3,750 | | | | 3,825 | | | | 3,943 | | | | 4,175 | | | | 4,465 | | | | 4,730 | |
Equity | | | | | | | | | | | | | | | | | | | | | | | | |
Investments in other public sector entities | | | (3,713 | ) | | | (2,250 | ) | | | (2,250 | ) | | | (2,250 | ) | | | (2,250 | ) | | | (2,251 | ) |
Investments - other | | | 118 | | | | 126 | | | | 158 | | | | 225 | | | | 265 | | | | 274 | |
Total Financial Assets | | | 31,657 | | | | 33,170 | | | | 34,044 | | | | 35,782 | | | | 37,118 | | | | 38,639 | |
| | | | | | |
Non-financial Assets | | | | | | | | | | | | | | | | | | | | | | | | |
Land and other fixed assets | | | 213,670 | | | | 243,010 | | | | 255,358 | | | | 266,275 | | | | 274,096 | | | | 280,552 | |
Other non-financial assets | | | 969 | | | | 803 | | | | 790 | | | | 790 | | | | 788 | | | | 783 | |
Total Non-financial Assets | | | 214,640 | | | | 243,813 | | | | 256,147 | | | | 267,066 | | | | 274,884 | | | | 281,335 | |
| | | | | | |
Total Assets | | | 246,296 | | | | 276,983 | | | | 290,191 | | | | 302,847 | | | | 312,002 | | | | 319,974 | |
| | | | | | |
Liabilities | | | | | | | | | | | | | | | | | | | | | | | | |
Payables | | | 3,746 | | | | 4,353 | | | | 4,223 | | | | 4,248 | | | | 4,318 | | | | 4,181 | |
Superannuation liability | | | 25,213 | | | | 24,694 | | | | 25,593 | | | | 26,402 | | | | 27,117 | | | | 27,738 | |
Other employee benefits | | | 5,044 | | | | 4,839 | | | | 5,135 | | | | 5,441 | | | | 5,733 | | | | 6,056 | |
Deposits held | | | 30 | | | | 20 | | | | 20 | | | | 21 | | | | 21 | | | | 22 | |
Advances received | | | 467 | | | | 472 | | | | 462 | | | | 452 | | | | 442 | | | | 431 | |
Borrowing | | | 57,723 | | | | 51,604 | | | | 62,827 | | | | 72,791 | | | | 78,971 | | | | 83,545 | |
Other liabilities | | | 2,928 | | | | 3,394 | | | | 3,367 | | | | 3,373 | | | | 3,383 | | | | 3,674 | |
Total Liabilities | | | 95,152 | | | | 89,376 | | | | 101,627 | | | | 112,728 | | | | 119,985 | | | | 125,649 | |
| | | | | | |
Net Worth | | | 151,144 | | | | 187,607 | | | | 188,564 | | | | 190,119 | | | | 192,017 | | | | 194,326 | |
Net Financial Worth | | | (63,495 | ) | | | (56,206 | ) | | | (67,583 | ) | | | (76,947 | ) | | | (82,867 | ) | | | (87,009 | ) |
Net Financial Liabilities | | | 59,782 | | | | 53,955 | | | | 65,333 | | | | 74,696 | | | | 80,616 | | | | 84,759 | |
Net Debt | | | 26,719 | | | | 20,626 | | | | 31,116 | | | | 39,633 | | | | 44,795 | | | | 48,112 | |
Notes:
| 1. | Numbers may not add due to rounding. |
| 2. | Numbers have been restated where subsequent changes in classification have occurred. |
| | | | |
| 180 | | Budget Strategy and Outlook 2010-11 | | |
Table 9.7
General Government Sector Cash Flow Statement 1
| | | | | | | | | | | | | | | | | | | | | | | | |
| | | 2009-10
Budget 2
$ million | | | 2009-10
Est.Actual
$ million | | | 2010-11
Budget
$ million | | | 2011-12
Projection
$ million | | | 2012-13
Projection
$ million | | | 2013-14
Projection
$ million | |
Cash Receipts from Operating Activities | | | | | | | | | | | | | | | | | | | | | | | | |
Taxes received | | | 9,286 | | | | 9,473 | | | | 10,190 | | | | 11,008 | | | | 11,931 | | | | 12,661 | |
Grants and subsidies received | | | 18,735 | | | | 20,380 | | | | 18,883 | | | | 18,893 | | | | 19,058 | | | | 19,743 | |
Sales of goods and services | | | 4,050 | | | | 4,482 | | | | 4,485 | | | | 4,751 | | | | 4,858 | | | | 5,082 | |
Interest receipts | | | 2,010 | | | | 2,231 | | | | 2,131 | | | | 2,221 | | | | 2,319 | | | | 2,408 | |
Dividends and income tax equivalents | | | 1,042 | | | | 1,089 | | | | 1,062 | | | | 1,520 | | | | 1,629 | | | | 1,965 | |
Other receipts | | | 3,219 | | | | 3,630 | | | | 4,832 | | | | 4,725 | | | | 4,694 | | | | 4,660 | |
Total Operating Receipts | | | 38,341 | | | | 41,284 | | | | 41,582 | | | | 43,119 | | | | 44,490 | | | | 46,519 | |
| | | | | | |
Cash Payments for Operating Activities | | | | | | | | | | | | | | | | | | | | | | | | |
Payments for employees | | | (16,975 | ) | | | (17,663 | ) | | | (18,435 | ) | | | (19,810 | ) | | | (21,028 | ) | | | (21,944 | ) |
Payments for goods and services | | | (8,442 | ) | | | (9,128 | ) | | | (9,298 | ) | | | (9,139 | ) | | | (9,279 | ) | | | (9,502 | ) |
Grants and subsidies | | | (9,097 | ) | | | (9,789 | ) | | | (10,135 | ) | | | (9,145 | ) | | | (8,889 | ) | | | (9,091 | ) |
Interest paid | | | (883 | ) | | | (827 | ) | | | (1,240 | ) | | | (1,705 | ) | | | (2,078 | ) | | | (2,342 | ) |
Other payments | | | (762 | ) | | | (720 | ) | | | (738 | ) | | | (674 | ) | | | (668 | ) | | | (670 | ) |
Total Operating Payments | | | (36,160 | ) | | | (38,127 | ) | | | (39,847 | ) | | | (40,473 | ) | | | (41,942 | ) | | | (43,549 | ) |
| | | | | | |
Net Cash Inflows from Operating Activities | | | 2,181 | | | | 3,158 | | | | 1,735 | | | | 2,646 | | | | 2,548 | | | | 2,971 | |
| | | | | | |
Cash Flows from Investments in Non-Financial Assets | | | | | | | | | | | | | | | | | | | | | | | | |
Purchases of non-financial assets | | | (9,270 | ) | | | (8,626 | ) | | | (8,335 | ) | | | (7,490 | ) | | | (5,751 | ) | | | (4,628 | ) |
Sales of non-financial assets | | | 251 | | | | 214 | | | | 203 | | | | 196 | | | | 298 | | | | 150 | |
Net Cash Flows from Investments in Non-financial Assets | | | (9,020 | ) | | | (8,411 | ) | | | (8,131 | ) | | | (7,294 | ) | | | (5,454 | ) | | | (4,478 | ) |
| | | | | | |
Net Cash Flows from Investments in Financial Assets for Policy Purposes | | | (307 | ) | | | (789 | ) | | | (1 | ) | | | (737 | ) | | | (486 | ) | | | (438 | ) |
| | | | | | |
Net Cash Flows from Investments in Financial Assets for Liquidity Purposes | | | (1,338 | ) | | | (1,516 | ) | | | (1,361 | ) | | | (1,309 | ) | | | (1,259 | ) | | | (1,232 | ) |
| | | | | | |
Receipts from Financing Activities | | | | | | | | | | | | | | | | | | | | | | | | |
Advances received (net) | | | (17 | ) | | | (16 | ) | | | (14 | ) | | | (14 | ) | | | (14 | ) | | | (14 | ) |
Borrowing (net) | | | 7,954 | | | | 5,182 | | | | 7,629 | | | | 6,733 | | | | 4,657 | | | | 3,191 | |
Net Cash Flows from Financing Activities | | | 7,937 | | | | 5,166 | | | | 7,615 | | | | 6,719 | | | | 4,643 | | | | 3,177 | |
| | | | | | |
Net Increase/(Decrease) in Cash held | | | (546 | ) | | | (2,393 | ) | | | (143 | ) | | | 25 | | | | (8 | ) | | | (1 | ) |
| | | | | | |
Net cash from operating activities | | | 2,181 | | | | 3,158 | | | | 1,735 | | | | 2,646 | | | | 2,548 | | | | 2,971 | |
Net cash flows from investments in non-financial assets | | | (9,020 | ) | | | (8,411 | ) | | | (8,131 | ) | | | (7,294 | ) | | | (5,454 | ) | | | (4,478 | ) |
Surplus/(Deficit) | | | (6,838 | ) | | | (5,254 | ) | | | (6,396 | ) | | | (4,648 | ) | | | (2,906 | ) | | | (1,507 | ) |
Derivation of ABS GFS Cash Surplus/Deficit | | | | | | | | | | | | | | | | | | | | | | | | |
Cash surplus/(deficit) | | | (6,838 | ) | | | (5,254 | ) | | | (6,396 | ) | | | (4,648 | ) | | | (2,906 | ) | | | (1,507 | ) |
Acquisitions under finance leases and similar arrangements | | | — | | | | (59 | ) | | | (71 | ) | | | (67 | ) | | | (15 | ) | | | (26 | ) |
ABS GFS Cash Surplus/(Deficit) Including Finance Leases and Similar Arrangements | | | (6,838 | ) | | | (5,313 | ) | | | (6,467 | ) | | | (4,714 | ) | | | (2,921 | ) | | | (1,533 | ) |
Notes:
| 1. | Numbers may not add due to rounding. |
| 2. | Numbers have been restated where subsequent changes in classification have occurred. |
| | | | |
| | Budget Strategy and Outlook 2010-11 | | 181 |
Table 9.8
Public Non-financial Corporations Sector Cash Flow Statement 1
| | | | | | | | | | | | | | | | | | | | | | | | |
| | | 2009-10
Budget 2
$ million | | | 2009-10
Est.Actual
$ million | | | 2010-11
Budget
$ million | | | 2011-12
Projection
$ million | | | 2012-13
Projection
$ million | | | 2013-14
Projection
$ million | |
Cash Receipts from Operating Activities | | | | | | | | | | | | | | | | | | | | | | | | |
Grants and subsidies received | | | 1,806 | | | | 2,306 | | | | 2,096 | | | | 2,170 | | | | 2,232 | | | | 2,264 | |
Sales of goods and services | | | 9,612 | | | | 9,889 | | | | 11,329 | | | | 12,083 | | | | 13,604 | | | | 14,702 | |
Interest receipts | | | 78 | | | | 91 | | | | 98 | | | | 90 | | | | 100 | | | | 110 | |
Other receipts | | | 621 | | | | 832 | | | | 664 | | | | 839 | | | | 806 | | | | 944 | |
Total Operating Receipts | | | 12,118 | | | | 13,118 | | | | 14,186 | | | | 15,183 | | | | 16,742 | | | | 18,020 | |
| | | | | | |
Cash Payments for Operating Activities | | | | | | | | | | | | | | | | | | | | | | | | |
Payments for employees | | | (2,348 | ) | | | (2,494 | ) | | | (2,605 | ) | | | (2,764 | ) | | | (2,809 | ) | | | (2,775 | ) |
Payments for goods and services | | | (4,488 | ) | | | (4,406 | ) | | | (5,016 | ) | | | (5,091 | ) | | | (5,633 | ) | | | (6,456 | ) |
Grants and subsidies | | | (12 | ) | | | (38 | ) | | | (31 | ) | | | (12 | ) | | | (12 | ) | | | — | |
Interest paid | | | (1,987 | ) | | | (2,030 | ) | | | (2,535 | ) | | | (2,877 | ) | | | (3,163 | ) | | | (3,341 | ) |
Other payments | | | (668 | ) | | | (1,100 | ) | | | (884 | ) | | | (1,247 | ) | | | (1,383 | ) | | | (1,486 | ) |
Total Operating Payments | | | (9,502 | ) | | | (10,069 | ) | | | (11,071 | ) | | | (11,990 | ) | | | (12,999 | ) | | | (14,057 | ) |
| | | | | | |
Net Cash Inflows from Operating Activities | | | 2,616 | | | | 3,050 | | | | 3,115 | | | | 3,193 | | | | 3,743 | | | | 3,962 | |
| | | | | | |
Cash Flows from Investments in Non-Financial Assets | | | | | | | | | | | | | | | | | | | | | | | | |
Purchases of non-financial assets | | | (8,002 | ) | | | (7,682 | ) | | | (7,144 | ) | | | (5,877 | ) | | | (4,964 | ) | | | (4,981 | ) |
Sales of non-financial assets | | | 35 | | | | 33 | | | | 184 | | | | 101 | | | | 177 | | | | 209 | |
Net Cash Flows from Investments in Non-financial Assets | | | (7,967 | ) | | | (7,649 | ) | | | (6,961 | ) | | | (5,776 | ) | | | (4,788 | ) | | | (4,772 | ) |
| | | | | | |
Net Cash Flows from Investments in Financial Assets for Policy Purposes | | | 188 | | | | 109 | | | | 445 | | | | (11 | ) | | | — | | | | — | |
| | | | | | |
Net Cash Flows from Investments in Financial Assets for Liquidity Purposes | | | (33 | ) | | | (118 | ) | | | 6 | | | | (5 | ) | | | (6 | ) | | | (11 | ) |
| | | | | | |
Receipts from Financing Activities | | | | | | | | | | | | | | | | | | | | | | | | |
Borrowing (net) | | | 5,335 | | | | 3,966 | | | | 3,414 | | | | 3,103 | | | | 1,480 | | | | 1,356 | |
Dividends paid | | | (819 | ) | | | (908 | ) | | | (856 | ) | | | (1,042 | ) | | | (1,131 | ) | | | (1,308 | ) |
Deposits received (net) | | | — | | | | 4 | | | | — | | | | — | | | | — | | | | — | |
Other financing (net) | | | 332 | | | | 775 | | | | 417 | | | | 695 | | | | 465 | | | | 446 | |
Net Cash Flows from Financing Activities | | | 4,849 | | | | 3,838 | | | | 2,975 | | | | 2,757 | | | | 814 | | | | 495 | |
| | | | | | |
Net Increase/(Decrease) in Cash held | | | (347 | ) | | | (772 | ) | | | (420 | ) | | | 158 | | | | (237 | ) | | | (326 | ) |
| | | | | | |
Net cash from operating activities | | | 2,616 | | | | 3,050 | | | | 3,115 | | | | 3,193 | | | | 3,743 | | | | 3,962 | |
Net cash flows from investments in non-financial assets | | | (7,967 | ) | | | (7,649 | ) | | | (6,961 | ) | | | (5,776 | ) | | | (4,788 | ) | | | (4,772 | ) |
Dividends paid | | | (819 | ) | | | (908 | ) | | | (856 | ) | | | (1,042 | ) | | | (1,131 | ) | | | (1,308 | ) |
Surplus/(Deficit) | | | (6,169 | ) | | | (5,508 | ) | | | (4,702 | ) | | | (3,625 | ) | | | (2,176 | ) | | | (2,117 | ) |
Derivation of ABS GFS Cash Surplus/Deficit | | | | | | | | | | | | | | | | | | | | | | | | |
Cash surplus/(deficit) | | | (6,169 | ) | | | (5,508 | ) | | | (4,702 | ) | | | (3,625 | ) | | | (2,176 | ) | | | (2,117 | ) |
ABS GFS Cash Surplus/(Deficit) Including Finance Leases and Similar Arrangements | | | (6,169 | ) | | | (5,508 | ) | | | (4,702 | ) | | | (3,625 | ) | | | (2,176 | ) | | | (2,117 | ) |
Notes:
| 1. | Numbers may not add due to rounding. |
| 2. | Numbers have been restated where subsequent changes in classification have occurred. |
| | | | |
| 182 | | Budget Strategy and Outlook 2010-11 | | |
Table 9.9
Non-financial Public Sector Cash Flow Statement 1
| | | | | | | | | | | | | | | | | | | | | | | | |
| | | 2009-10
Budget 2
$ million | | | 2009-10
Est.Actual
$ million | | | 2010-11
Budget
$ million | | | 2011-12
Projection
$ million | | | 2012-13
Projection
$ million | | | 2013-14
Projection
$ million | |
Cash Receipts from Operating Activities | | | | | | | | | | | | | | | | | | | | | | | | |
Taxes received | | | 8,995 | | | | 9,181 | | | | 9,853 | | | | 10,636 | | | | 11,528 | | | | 12,229 | |
Grants and subsidies received | | | 18,836 | | | | 20,577 | | | | 18,928 | | | | 18,951 | | | | 19,139 | | | | 19,812 | |
Sales of goods and services | | | 13,456 | | | | 14,021 | | | | 15,480 | | | | 16,475 | | | | 18,086 | | | | 19,380 | |
Interest receipts | | | 2,087 | | | | 2,321 | | | | 2,229 | | | | 2,311 | | | | 2,419 | | | | 2,518 | |
Dividends and income tax equivalents | | | 26 | | | | 53 | | | | 33 | | | | 26 | | | | 29 | | | | 48 | |
Other receipts | | | 3,834 | | | | 4,459 | | | | 5,493 | | | | 5,562 | | | | 5,497 | | | | 5,601 | |
Total Operating Receipts | | | 47,234 | | | | 50,612 | | | | 52,015 | | | | 53,961 | | | | 56,697 | | | | 59,589 | |
| | | | | | |
Cash Payments for Operating Activities | | | | | | | | | | | | | | | | | | | | | | | | |
Payments for employees | | | (19,218 | ) | | | (20,027 | ) | | | (20,920 | ) | | | (22,449 | ) | | | (23,701 | ) | | | (24,587 | ) |
Payments for goods and services | | | (12,739 | ) | | | (13,208 | ) | | | (13,994 | ) | | | (13,886 | ) | | | (14,549 | ) | | | (15,569 | ) |
Grants and subsidies | | | (7,411 | ) | | | (7,729 | ) | | | (8,128 | ) | | | (7,057 | ) | | | (6,762 | ) | | | (6,910 | ) |
Interest paid | | | (2,693 | ) | | | (2,717 | ) | | | (3,583 | ) | | | (4,362 | ) | | | (5,005 | ) | | | (5,416 | ) |
Other payments | | | (1,195 | ) | | | (1,636 | ) | | | (1,396 | ) | | | (1,412 | ) | | | (1,520 | ) | | | (1,482 | ) |
Total Operating Payments | | | (43,256 | ) | | | (45,317 | ) | | | (48,022 | ) | | | (49,165 | ) | | | (51,538 | ) | | | (53,964 | ) |
| | | | | | |
Net Cash Inflows from Operating Activities | | | 3,977 | | | | 5,295 | | | | 3,993 | | | | 4,796 | | | | 5,159 | | | | 5,625 | |
| | | | | | |
Cash Flows from Investments in Non-Financial Assets | | | | | | | | | | | | | | | | | | | | | | | | |
Purchases of non-financial assets | | | (17,272 | ) | | | (16,305 | ) | | | (15,479 | ) | | | (13,367 | ) | | | (10,716 | ) | | | (9,609 | ) |
Sales of non-financial assets | | | 286 | | | | 247 | | | | 387 | | | | 297 | | | | 474 | | | | 359 | |
Net Cash Flows from Investments in Non-financial Assets | | | (16,986 | ) | | | (16,058 | ) | | | (15,092 | ) | | | (13,069 | ) | | | (10,242 | ) | | | (9,250 | ) |
| | | | | | |
Net Cash Flows from Investments in Financial Assets for Policy Purposes | | | 188 | | | | 102 | | | | 851 | | | | (57 | ) | | | (30 | ) | | | — | |
| | | | | | |
Net Cash Flows from Investments in Financial Assets for Liquidity Purposes | | | (1,372 | ) | | | (1,634 | ) | | | (1,355 | ) | | | (1,314 | ) | | | (1,265 | ) | | | (1,243 | ) |
| | | | | | |
Receipts from Financing Activities | | | | | | | | | | | | | | | | | | | | | | | | |
Advances received (net) | | | (17 | ) | | | (16 | ) | | | (14 | ) | | | (14 | ) | | | (14 | ) | | | (14 | ) |
Borrowing (net) | | | 13,289 | | | | 9,148 | | | | 11,043 | | | | 9,836 | | | | 6,136 | | | | 4,548 | |
Deposits received (net) | | | — | | | | 4 | | | | — | | | | — | | | | — | | | | — | |
Other financing (net) | | | 25 | | | | (8 | ) | | | 9 | | | | 4 | | | | 9 | | | | 7 | |
Net Cash Flows from Financing Activities | | | 13,298 | | | | 9,128 | | | | 11,038 | | | | 9,826 | | | | 6,132 | | | | 4,541 | |
| | | | | | |
Net Increase/(Decrease) in Cash held | | | (895 | ) | | | (3,166 | ) | | | (565 | ) | | | 182 | | | | (246 | ) | | | (327 | ) |
| | | | | | |
Net cash from operating activities | | | 3,977 | | | | 5,295 | | | | 3,993 | | | | 4,796 | | | | 5,159 | | | | 5,625 | |
Net cash flows from investments in non-financial assets | | | (16,986 | ) | | | (16,058 | ) | | | (15,092 | ) | | | (13,069 | ) | | | (10,242 | ) | | | (9,250 | ) |
Surplus/(Deficit) | | | (13,009 | ) | | | (10,763 | ) | | | (11,099 | ) | | | (8,274 | ) | | | (5,083 | ) | | | (3,625 | ) |
Derivation of ABS GFS Cash Surplus/Deficit | | | | | | | | | | | | | | | | | | | | | | | | |
Cash surplus/(deficit) | | | (13,009 | ) | | | (10,763 | ) | | | (11,099 | ) | | | (8,274 | ) | | | (5,083 | ) | | | (3,625 | ) |
Acquisitions under finance leases and similar arrangements | | | — | | | | (59 | ) | | | (71 | ) | | | (67 | ) | | | (15 | ) | | | (26 | ) |
ABS GFS Cash Surplus/(Deficit) Including Finance Leases and Similar Arrangements | | | (13,009 | ) | | | (10,822 | ) | | | (11,170 | ) | | | (8,341 | ) | | | (5,098 | ) | | | (3,651 | ) |
Notes:
| 1. | Numbers may not add due to rounding. |
| 2. | Numbers have been restated where subsequent changes in classification have occurred. |
| | | | |
| | Budget Strategy and Outlook 2010-11 | | 183 |
RECONCILIATION OF NET OPERATING BALANCE TO ACCOUNTING OPERATING RESULT
The primary difference between the net operating balance and the accounting operating result calculated under Australian Accounting Standards (AAS) is that valuation adjustments are excluded from the net operating balance.
Data presented in Table 9.10 provides a reconciliation of the General Government sector net operating balance to the accounting operating result.
Table 9.10
Reconciliation of UPF net operating balance to accounting surplus1
| | | | | | | | | | | | |
| | | 2009-10
Budget
$ million | | | 2009-10
Est.Act.
$ million | | | 2010-11
Budget
$ million | |
| | | |
Net operating balance General Government sector (Table 9.1) | | | (1,954 | ) | | | (287 | ) | | | (1,745 | ) |
| | | |
Remeasurement/valuation adjustments | | | | | | | | | | | | |
Bad debts and amortisation | | | (42 | ) | | | (86 | ) | | | (57 | ) |
Deferred tax equivalents | | | 219 | | | | 170 | | | | 12 | |
Market value adjustments investments/loans | | | 12 | | | | 40 | | | | 12 | |
Revaluation of provisions | | | 14 | | | | 47 | | | | (13 | ) |
Decommissioned infrastructure assets and land under roads | | | (143 | ) | | | (143 | ) | | | (143 | ) |
Gain/(loss) on assets sold/written off | | | 6 | | | | 25 | | | | 12 | |
| | | |
AAS net surplus General Government sector | | | (1,888 | ) | | | (233 | ) | | | (1,924 | ) |
Note:
| 1. | Numbers may not add due to rounding. |
| | | | |
| 184 | | Budget Strategy and Outlook 2010-11 | | |
GENERAL GOVERNMENT TIME SERIES
Data presented in Table 9.11 provides a time series from 2002-03 to 2008-09 for the General Government sector on the key fiscal aggregates used by the Government to measure financial performance. These aggregates have been backcast (as far as is possible) to comply with AASB 1049 Whole of Government and General Government Sector Financial Reporting.
Table 9.11
General Government Sector1
| | | | | | | | | | | | | | | | | | | | | | | | | | | | |
| | | 2002-03
Actual
$ million | | | 2003-04
Actual
$ million | | | 2004-05
Actual
$ million | | | 2005-06
Actual
$ million | | | 2006-07
Actual
$ million | | | 2007-08
Actual
$ million | | | 2008-09
Actual
$ million | |
Revenue from Transactions | | | | | | | | | | | | | | | | | | | | | | | | | | | | |
Taxation revenue | | | 5,598 | | | | 6,676 | | | | 6,952 | | | | 7,396 | | | | 8,484 | | | | 9,546 | | | | 8,877 | |
Grant revenue | | | 10,666 | | | | 11,528 | | | | 12,755 | | | | 13,590 | | | | 14,373 | | | | 15,523 | | | | 17,476 | |
Sales of goods and services | | | 1,964 | | | | 2,105 | | | | 2,381 | | | | 2,586 | | | | 2,889 | | | | 3,341 | | | | 3,568 | |
Interest income | | | (128 | ) | | | 2,723 | | | | 2,972 | | | | 3,414 | | | | 3,348 | | | | (275 | ) | | | 1,482 | |
Dividend and income tax equivalent income | | | 1,036 | | | | 1,148 | | | | 1,028 | | | | 1,057 | | | | 863 | | | | 1,255 | | | | 1,180 | |
Other revenue | | | 1,118 | | | | 1,035 | | | | 1,473 | | | | 2,039 | | | | 2,024 | | | | 2,040 | | | | 4,425 | |
Total Revenue | | | 20,253 | | | | 25,214 | | | | 27,562 | | | | 30,084 | | | | 31,982 | | | | 31,430 | | | | 37,008 | |
| | | | | | | |
Expenses from Transactions | | | | | | | | | | | | | | | | | | | | | | | | | | | | |
Employee expenses | | | 8,431 | | | | 8,972 | | | | 9,595 | | | | 10,615 | | | | 11,731 | | | | 13,171 | | | | 14,305 | |
Superannuation expenses | | | | | | | | | | | | | | | | | | | | | | | | | | | | |
Superannuation interest costs | | | 630 | | | | 1,040 | | | | 1,009 | | | | 826 | | | | 1,154 | | | | 816 | | | | 858 | |
Other superannuation expenses | | | 892 | | | | 1,061 | | | | 1,182 | | | | 1,367 | | | | 1,513 | | | | 1,865 | | | | 2,012 | |
Other operating expenses | | | 3,794 | | | | 3,948 | | | | 4,392 | | | | 5,227 | | | | 6,109 | | | | 6,612 | | | | 7,185 | |
Depreciation and amortisation | | | 1,460 | | | | 1,460 | | | | 1,585 | | | | 1,679 | | | | 1,880 | | | | 1,850 | | | | 2,496 | |
Other interest expenses | | | 222 | | | | 213 | | | | 209 | | | | 174 | | | | 180 | | | | 346 | | | | 599 | |
Grant expenses | | | 4,813 | | | | 5,180 | | | | 5,647 | | | | 6,482 | | | | 7,558 | | | | 8,328 | | | | 9,519 | |
Total Expenses | | | 20,241 | | | | 21,874 | | | | 23,619 | | | | 26,370 | | | | 30,128 | | | | 32,989 | | | | 36,974 | |
| | | | | | | |
Net Operating Balance | | | 12 | | | | 3,340 | | | | 3,942 | | | | 3,714 | | | | 1,855 | | | | (1,559 | ) | | | 35 | |
| | | | | | | |
OTHER KEY AGGREGATES | | | | | | | | | | | | | | | | | | | | | | | | | | | | |
| | | | | | | |
Purchases of non-financial assets | | | 2,232 | | | | 2,415 | | | | 2,843 | | | | 3,186 | | | | 4,418 | | | | 5,716 | | | | 6,960 | |
| | | | | | | |
Net acquisition of non-financial assets | | | 155 | | | | 503 | | | | 1,053 | | | | 1,236 | | | | 2,067 | | | | 3,668 | | | | 4,434 | |
| | | | | | | |
Net lending / (borrowing) | | | (140 | ) | | | 2,838 | | | | 2,873 | | | | 2,478 | | | | (211 | ) | | | (5,226 | ) | | | (4,399 | ) |
| | | | | | | |
Net Worth | | | 64,894 | | | | 77,723 | | | | 96,433 | | | | 105,035 | | | | 117,831 | | | | 155,178 | | | | 184,619 | |
| | | | | | | |
Net Debt | | | (11,802 | ) | | | (14,811 | ) | | | (19,406 | ) | | | (23,202 | ) | | | (26,686 | ) | | | (22,598 | ) | | | (19,281 | ) |
| | | | | | | |
\Cash Surplus/Deficit | | | 645 | | | | 3,490 | | | | 4,640 | | | | 4,648 | | | | 2,350 | | | | (4,922 | ) | | | (2,839 | ) |
Note:
| 1. | Numbers may not add due to rounding. |
Source: Outcomes Reports for Queensland 2002-03 to 2008-09. (Numbers have been recast for recent changes to UPF presentation.)
| | | | |
| | Budget Strategy and Outlook 2010-11 | | 185 |
OTHER GENERAL GOVERNMENT UPF DATA
Data in the following table is presented in accordance with the Uniform Presentation Framework.
Grants
Data presented in Tables 9.12 (a) and 9.12 (b) provides details of General Government current and capital grant revenue and expenses.
Table 9.12(a)
General Government Sector Grant Revenue 1
| | | | | | | | |
| | | 2009-10
Est.Actual
$ million | | | 2010-11
Budget
$ million | |
| | |
Current grant revenue | | | | | | | | |
Current grants from the Commonwealth | | | | | | | | |
General purpose grants | | | 8,208 | | | | 8,932 | |
Specific purpose grants | | | 5,073 | | | | 5,538 | |
Specific purpose grants for on-passing | | | 2,385 | | | | 2,340 | |
Total current grants from the Commonwealth | | | 15,666 | | | | 16,810 | |
Other contributions and grants | | | 469 | | | | 435 | |
Total current grant revenue | | | 16,135 | | | | 17,245 | |
| | |
Capital grant revenue | | | | | | | | |
Capital grants from the Commonwealth | | | | | | | | |
General purpose grants | | | 1 | | | | 1 | |
Specific purpose grants | | | 3,999 | | | | 1,515 | |
Specific purpose grants for on-passing | | | 189 | | | | 20 | |
Total capital grants from the Commonwealth | | | 4,189 | | | | 1,536 | |
Other contributions and grants | | | 51 | | | | 91 | |
Total capital grant revenue | | | 4,240 | | | | 1,627 | |
Total grant revenue | | | 20,375 | | | | 18,872 | |
Note:
| 1. | Numbers may not add due to rounding. |
| | | | |
| 186 | | Budget Strategy and Outlook 2010-11 | | |
Table 9.12(b)
General Government Sector Grant Expense 1
| | | | | | | | |
| | | 2009-10
Est.Actual
$ million | | | 2010-11
Budget
$ million | |
| | |
Current grant expense | | | | | | | | |
Private and Not-for-profit sector | | | 3,339 | | | | 3,960 | |
Private and Not-for-profit sector on-passing | | | 2,101 | | | | 1,941 | |
Local Government | | | 218 | | | | 211 | |
Local Government on-passing | | | 285 | | | | 399 | |
Grants to other sectors of Government | | | 1,646 | | | | 1,985 | |
Other | | | 270 | | | | 174 | |
Total current grant expense | | | 7,857 | | | | 8,671 | |
| | |
Capital grant expense | | | | | | | | |
Private and Not-for-profit sector | | | 274 | | | | 529 | |
Private and Not-for-profit sector on-passing | | | 2 | | | | 7 | |
Households sector on-passing | | | 187 | | | | 13 | |
Local Government | | | 815 | | | | 725 | |
Grants to other sectors of Government | | | 427 | | | | 38 | |
Other | | | 240 | | | | 218 | |
Total capital grant expense | | | 1,945 | | | | 1,530 | |
Total grant expense | | | 9,802 | | | | 10,201 | |
Note:
| 1. | Numbers may not add due to rounding. |
Dividend and Income Tax Equivalent Income
Table 9.13 provides details of the source of dividend and income tax equivalent income in the General Government sector.
Table 9.13
General Government Sector Dividend and Income Tax Equivalent Income 1
| | | | | | | | |
| | | 2009-10
Est.Actual
$ million | | | 2010-11
Budget
$ million | |
| | |
Dividend and Income Tax Equivalent income from PNFC sector | | | 974 | | | | 1,435 | |
Dividend and Income Tax Equivalent income from PFC sector | | | 29 | | | | 22 | |
Other Dividend income | | | 2 | | | | 3 | |
Total Dividend and Income Tax Equivalent income | | | 1,005 | | | | 1,460 | |
Note:
| 1. | Numbers may not add due to rounding. |
| | | | |
| | Budget Strategy and Outlook 2010-11 | | 187 |
Expenses by function
Data presented in Table 9.14 provides details of General Government sector expenses by function.
Table 9.14
General Government Sector Expenses by Function1
| | | | | | | | | | | | | | | | | | | | | | | | |
| | | 2009-10
Budget
$ million | | | 2009-10
Est. Act.
$ million | | | 2010-11
Budget
$ million | | | 2011-12
Projection
$ million | | | 2012-13
Projection
$ million | | | 2013-14
Projection
$ million | |
| | | | | | |
General public services | | | 1,411 | | | | 1,533 | | | | 1,359 | | | | 1,279 | | | | 1,279 | | | | 1,313 | |
Public order and safety | | | 3,594 | | | | 3,463 | | | | 3,621 | | | | 3,817 | | | | 3,971 | | | | 4,096 | |
Education | | | 9,332 | | | | 9,623 | | | | 9,924 | | | | 10,035 | | | | 10,308 | | | | 10,787 | |
Health | | | 9,523 | | | | 9,860 | | | | 10,603 | | | | 11,545 | | | | 12,334 | | | | 12,774 | |
Social security and welfare | | | 2,379 | | | | 2,569 | | | | 2,945 | | | | 2,645 | | | | 2,764 | | | | 2,897 | |
Housing and community amenities | | | 2,217 | | | | 1,911 | | | | 1,848 | | | | 1,684 | | | | 1,531 | | | | 1,577 | |
Recreation and culture | | | 711 | | | | 750 | | | | 776 | | | | 779 | | | | 773 | | | | 800 | |
Fuel and energy | | | 487 | | | | 372 | | | | 448 | | | | 459 | | | | 465 | | | | 475 | |
Agriculture, forestry, fishing and hunting | | | 801 | | | | 922 | | | | 835 | | | | 845 | | | | 804 | | | | 764 | |
Mining, manufacturing and construction | | | 225 | | | | 238 | | | | 249 | | | | 255 | | | | 257 | | | | 260 | |
Transport and communications | | | 4,511 | | | | 4,550 | | | | 4,886 | | | | 5,071 | | | | 5,349 | | | | 5,552 | |
Other economic affairs | | | 798 | | | | 1,041 | | | | 1,041 | | | | 994 | | | | 971 | | | | 920 | |
Other purposes | | | 3,156 | | | | 3,144 | | | | 3,816 | | | | 3,973 | | | | 4,128 | | | | 4,477 | |
| | | | | | |
Total Expenses | | | 39,146 | | | | 39,976 | | | | 42,352 | | | | 43,380 | | | | 44,935 | | | | 46,693 | |
Note:
| 1. | Numbers may not add due to rounding. |
| | | | |
| 188 | | Budget Strategy and Outlook 2010-11 | | |
Purchases of non-financial assets by function
Data presented in Table 9.15 provides details of General Government sector purchases of non-financial assets by function.
Table 9.15
General Government Sector Purchases of Non-financial Assets by Function1
| | | | | | | | | | | | |
| | | 2009-10
Budget
$ million | | | 2009-10
Est. Act.
$ million | | | 2010-11
Budget
$ million | |
| | | |
General public services | | | 522 | | | | 447 | | | | 321 | |
Public order and safety | | | 872 | | | | 768 | | | | 739 | |
Education | | | 1,323 | | | | 1,776 | | | | 1,256 | |
Health | | | 1,218 | | | | 917 | | | | 1,516 | |
Social security and welfare | | | 223 | | | | 125 | | | | 166 | |
Housing and community amenities | | | 1,037 | | | | 646 | | | | 667 | |
Recreation and culture | | | 129 | | | | 133 | | | | 122 | |
Agriculture, forestry, fishing and hunting | | | 85 | | | | 65 | | | | 99 | |
Mining, manufacturing and construction | | | 15 | | | | 15 | | | | 15 | |
Transport and communications | | | 3,614 | | | | 3,486 | | | | 3,366 | |
Other economic affairs | | | 231 | | | | 248 | | | | 67 | |
Other purposes | | | | | | | | | | | 1 | |
| | | |
Total Purchases | | | 9,270 | | | | 8,626 | | | | 8,335 | |
Note:
| 1. | Numbers may not add due to rounding. |
| | | | |
| | Budget Strategy and Outlook 2010-11 | | 189 |
Taxes
Data presented in Table 9.16 provides details of taxation revenue collected by the General Government sector.
Table 9.16
General Government Sector Taxes 1
| | | | | | | | |
| | | 2009-10
Est.Actual
$ million | | | 2010-11
Budget
$ million | |
| | |
Taxes on employers’ payroll and labour force | | | 2,694 | | | | 2,888 | |
| | |
Taxes on property | | | | | | | | |
Land taxes | | | 1,017 | | | | 1,117 | |
Stamp duties on financial and capital transactions | | | 1,997 | | | | 2,229 | |
Other | | | 461 | | | | 524 | |
| | |
Taxes on the provision of goods and services | | | | | | | | |
Taxes on gambling | | | 933 | | | | 964 | |
Taxes on insurance | | | 514 | | | | 536 | |
| | |
Taxes on use of goods and performance of activities | | | | | | | | |
Motor vehicle taxes | | | 1,706 | | | | 1,779 | |
Other | | | 152 | | | | 154 | |
| | |
Total Taxation Revenue | | | 9,474 | | | | 10,192 | |
Note:
| 1. | Numbers may not add due to rounding. |
| | | | |
| 190 | | Budget Strategy and Outlook 2010-11 | | |
Loan Council Allocation
The Australian Loan Council requires all jurisdictions to prepare Loan Council Allocations (LCA) to provide an indication of each government’s probable call on financial markets over the forthcoming financial year.
Table 9.17 presents the State’s revised LCA Budget allocation and the Loan Council endorsed LCA for 2010-11.
Table 9.17
Loan Council Allocation 1
| | | | | | | | | | |
| | | | | 2010-11
Nomination
$ million | | | 2010-11
Budget
$ million | |
| | | |
| | General Government sector cash deficit/(surplus) 2 | | | 8,221 | | | | 6,396 | |
| | PNFC sector cash deficit/(surplus) 2 | | | 4,745 | | | | 4,702 | |
| | | |
| | Non-financial Public Sector cash deficit/(surplus) 2 | | | 12,966 | | | | 11,099 | |
| | Acquisitions under finance leases and similar arrangements | | | — | | | | (71 | ) |
| | | |
| Equals | | ABS GFS cash deficit/(surplus) | | | 12,966 | | | | 11,170 | |
| | | |
| Less | | Net cash flows from investments in financial assets for policy purposes | | | (18 | ) | | | 851 | |
| Plus | | Memorandum items 3 | | | 1,981 | | | | 1,234 | |
| | | |
| | Loan Council Allocation | | | 14,965 | | | | 11,553 | |
Notes:
| 1. | Numbers may not add due to rounding. |
| 2. | Figures in brackets represent surpluses. |
| 3. | Memorandum items include operating leases and local government borrowings. |
The State’s Budget LCA allocation is a deficit of $11.553 billion. This compares to the LCA nomination of $14.965 billion.
A tolerance limit of two per cent of Non-financial Public sector receipts applies between the LCA nomination and the Budget allocation. The Budget allocation exceeds the LCA nomination by more than this.
This is mainly due to increased Commonwealth grant revenue and royalties, capital deferrals and proceeds on the sale of Forestry Plantations Queensland.
| | | | |
| | Budget Strategy and Outlook 2010-11 | | 191 |
CONTINGENT LIABILITIES
Contingent liabilities represent items that are not included in the Budget as significant uncertainty exists as to whether the Government would sacrifice future economic benefits in respect of these items. Nevertheless, such contingencies need to be recognised and managed wherever possible in terms of their potential impact on the Government’s financial position in the future.
The State’s quantifiable and non-quantifiable contingent liabilities are detailed in the 2008-09 Report on State Finances – Whole of Government Financial Statements (Note 47).
A summary of the State’s quantifiable contingent liabilities as at 30 June 2009 is provided below.
Table 9.18
Contingent liabilities
| | | | |
| | | 2009
$ million | |
| |
Nature of contingent liability | | | | |
| |
Guarantees and indemnities | | | 5,215 | |
Other | | | 106 | |
| |
Total | | | 5,321 | |
| | | | |
| 192 | | Budget Strategy and Outlook 2010-11 | | |
BACKGROUND AND INTERPRETATION OF UNIFORM PRESENTATION FRAMEWORK
As mentioned in the introduction to this chapter, the UPF was reviewed in 2007 following the release of the Australian Accounting Standards Board’s (AASB) new accounting standard, AASB 1049 Whole of Government and General Government Sector Financial Reporting.
This new standard aims to harmonise Government Finance Statistics (GFS) and Generally Accepted Accounting Principles (GAAP) with the objective of improving the clarity and transparency of government financial statements.
Accrual GFS framework
The GFS reporting framework, developed by the Australian Bureau of Statistics (ABS), is based on international statistical standards (the International Monetary Fund Manual on Government Finance Statistics and the United Nations System of National Accounts). This allows comprehensive assessments to be made of the economic impact of government.
The accrual GFS framework is based on an integrated recording of stocks and flows. Stocks refer to a unit’s holdings of assets, liabilities and net worth at a point in time, whilst flows represent the movement in the stock of assets and liabilities between two points in time. Flows comprise two separate types, transactions and other economic flows. Transactions come about as a result of mutually agreed interactions between units or within a single unit. Other economic flows would include revaluations and destruction or discovery of assets that do not result from a transaction. In GFS operating statements, other economic flows, being outside of the control of government, are excluded and do not affect the net operating result.
Generally Accepted Accounting Principles
In addition to the GFS framework, public sector entities were required to report at year end against AAS 31 Financial Reporting by Government, which meant complying with the Accounting Standards issued by the AASB.
Harmonisation under AASB 1049
This dual reporting regime caused confusion for financial report users and the Financial Reporting Council asked the AASB to develop a framework harmonising GAAP and GFS and to issue an Australian accounting standard for a single set of government reports.
| | | | |
| | Budget Strategy and Outlook 2010-11 | | 193 |
In the development of AASB 1049, the AASB adopted the following approaches:
| • | | adoption of GAAP definition, recognition and measurement principles in almost all cases |
| • | | amending presentation requirements to encompass a comprehensive result that retains GAAP classification system but overlays it with a transactions and other economic flows classification system based on GFS |
| • | | expanding the disclosure requirements to incorporate key fiscal aggregates required by GFS. |
Revisions to the Uniform Presentation Framework
Following the introduction of AASB 1049, the Australian, state and territory governments consider that the UPF will continue to be an important framework for ensuring comparability of financial information across jurisdictions. There are a number of important areas where the UPF provides either additional information or clearer guidance on the preparation of government financial statements to that of AASB 1049. For example, the Australian, state and territory governments agree that net debt, a fiscal indicator not required by the new standard, continues to be an important indicator in transparent budget reporting and should continue to be presented on the face of the financial statements as a fiscal aggregate. Further, the UPF shall continue to apply to financial statements produced by government in budgets, mid-year budget updates and final budget outcome reports, whereas the new accounting standard applies only to outcome reports.
Therefore, rather than replacing the UPF with the new accounting standard, the framework was updated to align with AASB 1049. Australian, state and territory governments agreed that the updated framework would continue to provide a common core of comparable financial information in their budget papers and comparable data amongst jurisdictions while maintaining at least the current level of transparency.
Aligning the framework with AASB 1049 was not intended to create a UPF that complies with all the reporting requirements of AASB 1049. For example, the UPF does not include the same level of detail in relation to disclosure requirements as AASB 1049. Instead, the revised UPF allows jurisdictions to utilise the framework as the base set of statements and add additional relevant information in order to comply with AASB 1049.
| | | | |
| 194 | | Budget Strategy and Outlook 2010-11 | | |
SECTOR CLASSIFICATION
GFS data is presented by institutional sector, distinguishing between the General Government sector and the Public Non-financial Corporations (PNFC) sector.
Budget reporting focuses on the General Government sector, which provides regulatory services and goods and services of a non-market nature that are provided at less than cost or at no cost. These services are largely financed by general revenue (Australian Government grants and state taxation). This sector comprises government departments, their commercialised business units/shared service providers and certain statutory bodies.
The PNFC sector comprises bodies that provide mainly market goods and services that are of a non-regulatory and non-financial nature. PNFCs are financed through sales to consumers of their goods and services and may be supplemented by explicit government subsidy to satisfy community service obligations. In general, PNFCs are legally distinguishable from the governments that own them. Examples of PNFCs include the energy entities and QR Limited.
Together, the General Government sector and the PNFC sector comprise the Non-financial Public sector.
Further discussion of the GFS framework of reporting, including definitions of GFS terms, can be obtained from the webpage of the Australian Bureau of Statistics at www.abs.gov.au.
| | | | |
| | Budget Strategy and Outlook 2010-11 | | 195 |
REPORTING ENTITIES
The reporting entities included in the General Government and PNFC sectors for the 2010-11 Budget are provided below.
General Government
Departments
Communities
Community Safety
Education and Training
Electoral Commission of Queensland
Employment, Economic Development and Innovation
Environment and Resource Management
Forestry Plantations Queensland Office Health
Infrastructure and Planning
Justice and Attorney-General
Legislative Assembly
Office of the Governor
Office of the Ombudsman
Police
Premier and Cabinet
Public Service Commission
Public Works
Queensland Audit Office
The Public Trustee of Queensland
Transport and Main Roads
Treasury
| | | | |
| 196 | | Budget Strategy and Outlook 2010-11 | | |
Statutory Authorities
Anti-Discrimination Commission
Australian Agricultural College Corporation
Board of the Queensland Museum
City North Infrastructure Pty Ltd
Commission for Children and Young People and Child Guardian
Crime and Misconduct Commission
Gold Coast Institute of TAFE
Health Quality and Complaints Commission
Legal Aid Queensland
Library Board of Queensland
Motor Accident Insurance Commission
Nominal Defendant
Office of the Information Commissioner
Prostitution Licensing Authority
Queensland Art Gallery Board of Trustees
Queensland Building Services Authority
Queensland Events Corporation Pty Ltd
Queensland Future Growth Corporation
Queensland Performing Arts Trust
Queensland Rural Adjustment Authority (QRAA)
Queensland Studies Authority
Queensland Treasury Holdings Pty Ltd
Residential Tenancies Authority
South Bank Corporation
Southbank Institute of Technology
The Council of The Queensland Institute of
Medical Research
Tourism Queensland
Translink Transit Authority
Urban Land Development Authority
Workers’ Compensation Regulatory
Authority (Q-Comp)
Commercialised Business Units
CITEC
Goprint
Main Roads – RoadTek
Project Services
Property Services Group
QBuild
QFleet
SDS
Shared Service Providers
Corporate Administration Agency
CorpTech
Shared Service Agency
| | | | |
| | Budget Strategy and Outlook 2010-11 | | 197 |
Public Non-financial Corporations
CS Energy Ltd
DBCT Holdings Pty Ltd
ENERGEX Ltd
Ergon Energy Corporation Limited
Far North Queensland Ports Corporation Limited
Forestry Plantations Queensland
Gladstone Area Water Board
Gladstone Ports Corporation Limited
Gold Coast Events Co Pty Ltd
Mount Isa Water Board
North Queensland Bulk Ports Corporation Limited
Port of Brisbane Corporation Limited
Port of Townsville Limited
Powerlink Queensland
Qld Airport Holdings (Cairns) Pty Ltd
Qld Airport Holdings (Mackay) Pty Ltd
Queensland Bulk Water Supply Authority
Queensland Bulk Water Transport Authority
Queensland Lottery Corporation Pty Ltd
Queensland Manufactured Water Authority
Queensland Motorways Limited
QR Limited
Queensland Water Infrastructure Pty Ltd
SEQ Water Grid Manager
South East Queensland (Gold Coast) Desalination Company Pty Ltd
Southern Regional Water Pipeline Company Pty Ltd
Stadiums Queensland
Stanwell Corporation Limited
SunWater
Tarong Energy Corporation Limited
The Trustees of Parklands Gold Coast
Western Corridor Recycled Water Pty Limited
ZeroGen Pty Ltd
| | | | |
| 198 | | Budget Strategy and Outlook 2010-11 | | |
APPENDIX A – TAX EXPENDITURE STATEMENT
OVERVIEW
Governments employ a range of policy tools to achieve social and economic objectives. These include the use of direct budgetary outlays, regulatory mechanisms and taxation. This Tax Expenditure Statement (TES) details revenue foregone as a result of Government decisions relating to the provision of tax concessions. The TES is designed to improve transparency in the use of tax expenditures and increase public understanding of the fiscal process.
Tax expenditures are reductions in tax revenue that result from the use of the taxation system as a policy tool to deliver Government policy objectives. Tax expenditures are provided through a range of concessions, including:
| • | | the application of reduced tax rates to certain groups or sectors of the community |
| • | | provisions which defer payment of a tax liability to a future period. |
Labelling an exemption or concession as a tax expenditure does not necessarily imply any judgement as to its appropriateness. It merely makes the amount of the exemption or concession explicit and thereby facilitates its scrutiny as part of the annual Budget process.
Methodology
Revenue foregone approach
The method used almost exclusively by governments to quantify the value of their tax expenditures is the revenue foregone approach. This method estimates the revenue foregone through use of the concession by applying the benchmark rate of taxation to the volume of activities or assets affected by the concession. One of the deficiencies of the revenue foregone approach is that the effect on taxpayer behaviour resulting from the removal of the particular tax expenditure is not factored into the estimate. Consequently, the aggregation of costings for individual tax expenditure items presented in the TES will not necessarily provide an accurate estimate of the total level of assistance provided through tax expenditures.
| | | | |
| | Budget Strategy and Outlook 2010-11 | | 199 |
Measuring tax expenditures requires the identification of:
| • | | concessionally taxed components of the benchmark tax base such as a specific activity or class of taxpayer |
| • | | a benchmark tax rate to apply to the concessionally taxed components of the tax base. |
Defining the tax benchmark
The most important step in the preparation of a TES is the establishment of a benchmark for each tax included in the statement. The benchmark provides a basis against which each tax concession can be evaluated. The aim of the benchmark is to determine which concessions are tax expenditures as opposed to structural elements of the tax. The key features of a tax benchmark are:
| • | | any specific accounting conventions applicable to the tax |
| • | | the deductibility of compulsory payments |
| • | | any provisions to facilitate administration |
| • | | provisions relating to any fiscal obligations. |
By definition, tax expenditures are those tax concessions not included as part of the tax benchmark.
Identification of benchmark revenue bases and rates requires a degree of judgement and is not definitive. Furthermore, data limitations mean that the tax expenditures are approximations and are not exhaustive. This statement does not include estimates of revenue foregone from exemptions or concessions provided to Government agencies. Very small exemptions or concessions are also excluded.
THE TAX EXPENDITURE STATEMENT
This year’s statement includes estimates of tax expenditures in 2008-09 and 2009-10 for payroll tax, land tax, duties and gambling taxes. A summary of the major tax expenditures valued on the basis of revenue foregone is presented in Table A.1. Not all expenditures can be quantified at this time. Accordingly, the total value of tax expenditures should be considered as indicative only.
| | | | |
| 200 | | Budget Strategy and Outlook 2010-11 | | |
Table A.1
Tax expenditure summary1
| | | | | | | | |
| | | 2008-092
$ million | | | 2009-10
$ million | |
Payroll Tax | | | | | | | | |
Exemption threshold3 | | | 1,086 | | | | 1,121 | |
Deduction scheme4 | | | 216 | | | | 229 | |
Section 14 exemptions | | | | | | | | |
Local Government | | | 99 | | | | 107 | |
Education | | | 160 | | | | 168 | |
Hospitals | | | 244 | | | | 284 | |
Total Payroll Tax | | | 1,805 | | | | 1,909 | |
| | |
Land Tax | | | | | | | | |
Liability thresholds5 | | | 368 | | | | 447 | |
Graduated land tax scale | | | 172 | | | | 327 | |
Primary production deduction | | | 72 | | | | 91 | |
Section 13 exemptions not included elsewhere6 | | | 66 | | | | 90 | |
Land developers’ concession | | | 18 | | | | 22 | |
Capping of values | | | 30 | | | | 37 | |
Total Land Tax | | | 726 | | | | 1,014 | |
| | |
Duties | | | | | | | | |
Transfer duty on residential property | | | | | | | | |
Home concession | | | 313 | | | | 309 | |
First home concession | | | 289 | | | | 192 | |
First home vacant land concession | | | 9 | | | | 16 | |
Insurance duty | | | | | | | | |
Non-life insurance | | | 127 | | | | 133 | |
Workcover | | | 25 | | | | 25 | |
Health insurance | | | 173 | | | | 185 | |
Total Duties | | | 936 | | | | 860 | |
| | |
Taxes on Gambling | | | | | | | | |
Gaming machine taxes | | | 121 | | | | 120 | |
Casino taxes | | | 8 | | | | 9 | |
Total Gambling Tax | | | 129 | | | | 129 | |
Notes:
| 1. | Numbers may not add due to rounding. |
| 2. | 2008-09 estimates may have been revised since the 2009-10 Budget. |
| 3. | Exemption threshold of $1 million applies. |
| 4. | Deduction of $1 million, which reduces by $1 for every $4 above $1 million, is applicable to employers with an annual payroll between $1 million and $5 million from 1 July 2008. |
| 5. | Land tax is payable only on the value of taxable land above a threshold which depends on the ownership structure. |
| 6. | Applicable, but not limited, to religious bodies, public benevolent institutions and other exempt charitable institutions. |
| 7. | Estimates are based on the revenue foregone through the use of the levy exemption by pensioners and senior citizens. |
| | | | |
| | Budget Strategy and Outlook 2010-11 | | 201 |
DISCUSSION OF INDIVIDUAL TAXES
Payroll tax
The benchmark tax base for payroll tax is assumed to be all wages, salaries and supplements (including employer superannuation contributions) paid in Queensland, as defined in the Pay-roll Tax Act 1971. The benchmark tax rate for payroll tax is assumed to be the statutory rate applying in each financial year.
Payroll tax exemption threshold
Employers who employ in Queensland with an annual Australian payroll of $1 million or less are exempt from payroll tax. On the basis of average weekly earnings, this threshold corresponds to approximately 17 full-time equivalent employees. This exemption is designed to assist small and medium sized businesses.
Deduction scheme
Employers who employ in Queensland with Australian payrolls between $1 million and $5 million benefit from a deduction of $1 million, which reduces by $1 for every $4 by which the annual payroll exceeds $1 million. There is no deduction for employers or groups with an annual payroll in excess of $5 million.
Section 14 exemptions
A number of organisations are provided with exemptions from payroll tax under Section 14 of the Pay-roll Tax Act 1971. The activities for which estimates have been calculated are wages paid by public hospitals, non-tertiary private educational institutions and local governments (excluding commercial activities).
Land tax
The benchmark tax base is assumed to be all freehold land within Queensland, excluding residential land used as a principal place of residence and land owned by individuals with a value for that year below the threshold. The benchmark tax rate for land tax is assumed to be the top rate of land tax applicable in Queensland in each financial year.
Liability thresholds
Land tax is payable on the value of taxable land above a threshold which depends on the land’s ownership. The threshold for companies, trusts and absentees is $350,000 and for resident individuals the threshold is $600,000.
| | | | |
| 202 | | Budget Strategy and Outlook 2010-11 | | |
Residential land owned by resident individuals as their principal place of residence is excluded from the estimate. The exemption from paying below a minimum amount is not included as a tax expenditure as it is regarded as the application of an administration threshold.
Graduated land tax scale
A graduated (concessional) scale of land tax rates is applicable to land with a taxable value of less than $3 million for resident individuals and $2 million for companies, trustees and absentees.
Primary production deduction
The taxable value of land owned by a resident individual, trustee or some absentees and companies does not include all or part of their land that is used for the business of agriculture, pasturage or dairy farming.
Section 13 exemptions (not elsewhere included)
A number of land tax exemptions are granted under Section 13 of the Land Tax Act 1915 to eligible organisations. These include, but are not limited to, public benevolent institutions, religious institutions and other exempt charitable institutions, retirement villages, trade unions and showgrounds.
Land developers’ concession
From 1 July 1998, land developers have been charged land tax on 60% of the unimproved value of (undeveloped) land subdivided in the previous financial year and which remains unsold at 30 June of that year. This concession is outlined in Section 3CA of the Land Tax Act 1915.
Transfer duty concession on residential property
The benchmark tax base is assumed to be all sales of residential property within Queensland. The benchmark tax scale is assumed to be the scale that actually applied in each financial year.
Home concession
A concessional rate of duty applies to purchases of a principal place of residence. From 1 July 2008, the 1% concessional rate has been applied on dutiable values up to $350,000, rather than the normal schedule of rates between 1.5% and 3.5%. For properties valued over $350,000, the scheduled rates of transfer duty apply on the excess.
| | | | |
| | Budget Strategy and Outlook 2010-11 | | 203 |
First home concession
Where a purchaser has not previously owned a residence in Queensland or elsewhere, the purchaser of a home receives a more generous concession on duty. This concession comprises a rebate in addition to the home concession on properties (this concession may not be applicable if the purchase price is less than the full market value of the property). The size of the rebate depends on the value of the property. Since 1 September 2008, a full concession has been provided to purchases of a first principal place of residence valued up to $500,000 ($350,000 from 1 July to 31 August 2008).
First home vacant land concession
Since 1 July 2009, a first home concession has been available for the purchase of certain vacant land up to the value of $400,000 ($300,000 from 1 January 2007 to 30 June 2009), with a full concession available on certain vacant land up to the value of $250,000 ($150,000 from 1 January 2007 to 30 June 2009).
Insurance duty
The benchmark tax base is assumed to be all premiums for general insurance policies (except for life insurance). The benchmark tax scale is assumed to be the scale that actually applied in each financial year.
The rate of duty applicable to most types of general insurance is 7.5%. Concessional rates apply to some other general insurance types (5% for motor vehicle insurance other than compulsory third party (CTP), workers’ compensation and professional indemnity insurance and 10c on a premium for CTP insurance). Data limitations mean that these insurance types are categorised into non-life insurance cover and WorkCover. An exemption from duty is also provided for private health insurance.
Gambling taxes
Gaming machine tax concessions for licensed clubs
The benchmark tax base is assumed to be all gaming machines operated by licensed clubs and hotels in Queensland. The benchmark tax rate is assumed to be the highest marginal tax rate (as is applied to hotels) that actually applied in each financial year.
A concessional graduated tax rate scale applies to gaming machines operated by licensed clubs. The tax rate is calculated on the gaming machine monthly metered win and the top tax rate is only applied to the portion of gaming machine revenue where the monthly metered win exceeds $1.4 million for any licensed club.
| | | | |
| 204 | | Budget Strategy and Outlook 2010-11 | | |
Casino tax concessions
The benchmark tax base is assumed to be all casinos operating in Queensland. The benchmark tax rate is assumed to be the highest tax rate that is actually applied in each financial year.
A tax rate of 20% of gross revenue applies for standard transactions in the Brisbane and Gold Coast casinos. A concessional tax rate of 10% applies for gross revenue from standard transactions in the Cairns and Townsville casinos. From 1 July 2009, the tax rate applicable to gaming machines in casinos increased to 30% of gross revenue in Brisbane and Gold Coast casinos and 20% in the Cairns and Townsville casinos.
In addition concessional rates also apply for revenue from high rollers in all casinos. High roller revenue is taxed at 10% in the Brisbane and Gold Coast casinos and, prior to 2009-10, 8% for the Cairns and Townsville Casinos. From 1 July 2009, high roller revenue at Cairns and Townsville casinos are taxed at 10%. A GST credit is provided to casinos that approximates a reduction in the above tax rates of 9.09%.
| | | | |
| | Budget Strategy and Outlook 2010-11 | | 205 |
APPENDIX B – CONCESSIONS STATEMENT
INTRODUCTION
The Government provides concessions in the form of discounts, rebates and subsidies to improve access to and the affordability of a range of services for individuals or families based on eligibility criteria relating to factors such as age, income and special needs or disadvantage.
This statement serves to highlight the cost and nature of concessions covering both concessions which are reflected as outlays in the Budget (for example, direct subsidy payments) and revenue foregone through fees and charges which are set at a rate lower than that applying to the wider community.
Varying methods have been used to estimate the cost of concessions depending on the nature of the concession, including:
| • | | direct Budget outlay cost (for example, direct subsidy or rebate payments) |
| • | | revenue foregone (for example, concessional fees and charges) |
| • | | cost of goods and services provided. |
Table B.1 sets out the cost of concessions by agency. The total value of concessions is estimated at $1.319 billion in 2010-11.
| | | | |
| | Budget Strategy and Outlook 2010-11 | | 207 |
Table B.1
Concessions by agency1
| | | | | | | | |
Agency | | 2009-10
Est.Act.
$ million | | | 2010-11
Estimate
$ million | |
| | |
Department of Communities | | | | | | | | |
Government-managed housing rental rebate2 | | | 384.5 | | | | 395.8 | |
Electricity Rebate Scheme | | | 91.0 | | | | 106.6 | |
Electricity Life Support Scheme | | | 1.2 | | | | 1.4 | |
Medical Cooling and Heating Electricity Concession Scheme | | | | | | | 1.4 | |
Pensioner Rate Subsidy Scheme | | | 40.8 | | | | 44.0 | |
Rail Concession Scheme | | | 36.0 | | | | 36.0 | |
Reticulated Natural Gas Rebate Scheme | | | 1.7 | | | | 2.5 | |
Home Energy Emergency Assistance Scheme | | | 1.8 | | | | 2.7 | |
SEQ Pensioner Water Subsidy Scheme | | | 10.0 | | | | 16.2 | |
National Reciprocal Transport Scheme | | | 3.8 | | | | 4.0 | |
Active Recreation Centres - concessional usage rates | | | 0.2 | | | | 0.2 | |
| | |
Department of Community Safety | | | | | | | | |
Urban Fire Levy Concession | | | 5.7 | | | | 5.9 | |
Community Ambulance Cover | | | 50.0 | | | | 56.3 | |
| | |
Department of Education and Training | | | | | | | | |
Living Away from Home Allowances Scheme | | | 6.5 | | | | 6.7 | |
School transport assistance for students with disabilities | | | 34.6 | | | | 34.6 | |
Non-State School Transport Assistance Scheme | | | 4.6 | | | | 4.7 | |
TAFE concessions | | | 14.4 | | | | 14.8 | |
| | |
Department of Environment and Resource Management | | | | | | | | |
Entry and tour fee concessions | | | 0.3 | | | | 0.3 | |
Additional Irrigators Fixed Water Charges Rebate Scheme3 | | | 0.2 | | | | | |
| | |
Queensland Health | | | | | | | | |
Oral Health Scheme | | | 107.3 | | | | 111.5 | |
Spectacle Supply Scheme | | | 8.3 | | | | 8.8 | |
Medical Aids Subsidy Scheme | | | 29.6 | | | | 35.8 | |
Patient Travel Subsidy Scheme | | | 45.2 | | | | 49.7 | |
| | |
Department of Justice and Attorney-General | | | | | | | | |
Public Trustee of Queensland – rebates of fees | | | 20.9 | | | | 22.3 | |
| | |
Department of the Premier and Cabinet | | | | | | | | |
Venue hire and lease discount - Judith Wright Centre of Contemporary Art | | | 0.4 | | | | 0.4 | |
Concessional entry fees - Queensland Museum | | | 0.4 | | | | 0.4 | |
Concessional entry fees - Queensland Art Gallery | | | 0.4 | | | | 0.4 | |
Venue hire discounts - Queensland Performing Arts Trust | | | 0.4 | | | | 0.4 | |
Venue hire discounts - South Bank Corporation | | | 0.3 | | | | 0.1 | |
| | | | |
208 | | Budget Strategy and Outlook 2010-11 | | |
Table B.1 (continued)
Concessions by agency1
| | | | | | | | |
Agency | | 2009-10
Est.Act.
$ million | | | 2010-11
Estimate
$ million | |
Department of Transport and Main Roads | | | | | | | | |
Light and heavy vehicle registration concession | | | 88.5 | | | | 90.7 | |
Recreational ship registration concession | | | 1.0 | | | | 1.0 | |
School Transport Assistance Scheme | | | 135.0 | | | | 140.1 | |
TransLink Transit Authority transport concessions (SEQ) | | | 90.1 | | | | 96.5 | |
Other transport concessions incl. taxi subsidies | | | 25.0 | | | | 29.5 | |
| | |
Total | | | 1,240.1 | | | | 1,319.0 | |
Notes:
| 1. | Numbers may not add due to rounding. |
| 2. | Increases in markets rents have resulted in an increased estimated level of rental rebate for 2010-11. |
| 3. | This scheme concluded on 30 September 2009 with final payments made during 2009-10. |
Department of Communities
The Government-managed housing rental rebate targets low income families and individuals and represents the difference between the rents that would be payable in the private market and rent that is charged by Government based on the household’s income. The 2009-10 estimated rent subsidy has increased due to the decision to exclude the 2009 Commonwealth pension increase from rent calculations. In addition, market rents have continued to increase.
The Electricity Rebate Scheme provides a rebate on the cost of domestic electricity supply to the home of eligible holders of a Pensioner Concession Card, a Queensland Seniors Card or a Repatriation Health Card for All Conditions (Gold Card) who receive a War Widow or Special Rate Totally or Permanently Incapacitated (TPI) pension. The rebate will increase in 2010-11 in line with the change in the Benchmark Retail Cost Index (BRCI) as set by the Queensland Competition Authority.
The Electricity Life Support Concession Scheme is aimed at assisting seriously ill people who use home-based life support systems such as oxygen concentrators and kidney dialysis machines. The rebate will also increase in 2010-11 in line with the change in the BRCI, as set by the Queensland Competition Authority.
In 2010-11 the Government will be providing funding to establish the Medical Cooling and Heating Electricity Concession Scheme. This rebate is for eligible concession card holders, with a medical condition who have a dependence on air conditioning to regulate body temperature. The rate will be set in line with the Electricity Rebate.
The Pensioner Rate Subsidy Scheme lessens the impact of local government rates and charges on pensioners, thereby assisting them to continue to live in their own homes.
The Queensland Rail Concessions Scheme assists pensioners, veterans and seniors to reduce the cost of public transport and to maintain an active and healthy lifestyle.
| | | | |
| | Budget Strategy and Outlook 2010-11 | | 209 |
The Reticulated Natural Gas Rebate Scheme provides a rebate off the cost of reticulated natural gas supplied to the home of eligible holders of a Pensioner Concession Card, Queensland Seniors Card or Repatriation Health Card for All Conditions (Gold Card) who receive a War Widow or Special Rate TPI pension.
The Home Energy Emergency Assistance Scheme provides one-off emergency assistance to low income households experiencing a short-term financial crisis and who are unable to pay their current electricity and/or reticulated natural gas account.
To lessen the impact of increased water prices on pensioners, the Government established the South East Queensland Pensioner Water Subsidy Scheme in 2008-09. The scheme, to be phased in over three years with the increased water prices, provided an annual subsidy of $40 in 2008-09 and $70 in 2009-10 and will provide $100 from 2010-11. The Scheme applies to eligible pensioners in the SEQ Water Grid and is in addition to the Pensioner Rate Subsidy Scheme.
The National Reciprocal Transport Scheme provides visitors from interstate who hold a state or territory Seniors Card with access to public transport concessions in Queensland. The four year scheme, which commenced in 2009, is fully funded by the Australian Government.
Concessional rates are offered to school groups for the use of a number of Active Recreation Centres, such as those at Currimundi and Tallebudgera.
Department of Community Safety
Pensioners are eligible for a 20% discount on the Urban Fire Levy payable on prescribed properties of which they are the owner or part-owner.
Pensioners and senior card holders are exempt from paying the Community Ambulance Cover charge levied quarterly on electricity accounts.
Department of Education and Training
The Department of Education and Training provides a living away from home allowance to students in Years 1 to 12 in state and non-state schools whose homes are geographically isolated from local schools. The allowances offset the costs associated with boarding away from home to attend school on a daily basis and include tuition and travel costs.
The Department also offers assistance to students with disabilities to access school programs to meet their educational needs. Assistance is in the form of the provision of taxis or specialised contracted minibuses, payment of fares on regular buses or trains, or an allowance for parents who drive their children to school.
| | | | |
| 210 | | Budget Strategy and Outlook 2010-11 | | |
The Non-State School Transport Assistance Scheme assists families of students attending non-state schools outside Brisbane whose bus fare is over a weekly threshold amount. The program also assists families of students with disabilities who attend a non-state school.
Concessions on TAFE tuition fees for Government-funded training are offered to a range of concession card holders, students of Aboriginal and Torres Strait Islander descent and students who can demonstrate extreme financial hardship.
Department of Environment and Resource Management
Concessional entry and tour fees are available in specified protected areas including St Helena Island, David Fleay Wildlife Park, Mon Repos Conservation Park, Chillagoe Caves and the Ma Mu Canopy Walk.
The Additional Irrigators Fixed Water Charges Rebate Scheme made a rebate of up to $10,000 available for irrigators in eligible water supply schemes with an announced water allocation of 20% or less on 1 July 2008. The rebate scheme related to the 2008-09 financial year. Irrigators had until 30 September 2009 to lodge applications.
Queensland Health
The Oral Health Scheme provides free dental care to eligible clients and their dependants who possess a current Health Care Card, Pensioner Concession Card or Queensland or Commonwealth Seniors Card. In rural and remote areas where no private dental practitioner exists, access to dental care for the general public is provided at a concessional rate.
The Spectacle Supply Scheme assists eligible Queensland residents by providing a comprehensive range of free basic spectacles. Queensland Health administers the Scheme through the Medical Aids Subsidy Scheme.
The Medical Aids Subsidy Scheme provides access to subsidy funding assistance for the provision of a range of aids and equipment to eligible Queensland residents with permanent and stabilised conditions or disabilities. Aids and equipment are provided primarily to assist people to live at home and avoid premature or inappropriate residential care or hospitalisation. Subsidy funding assistance is provided towards communication aids, continence aids, daily living aids, medical grade footwear, mobility aids, orthoses and oxygen.
Queensland Health’s Patient Travel Subsidy Scheme provides financial assistance to patients who need to access specialist medical services which are not available within their local area. The Scheme provides a subsidy towards the cost of travel and accommodation for patients and, in some cases, an escort.
| | | | |
| | Budget Strategy and Outlook 2010-11 | | 211 |
Department of Justice and Attorney-General
The Public Trustee offers fee rebates (full or partial) for clients who, because of financial circumstances, cannot pay the full amount of fees that have been levied.
Department of the Premier and Cabinet
Discounts apply to venue rental fees charged to arts and community organisation hirers and rent reductions apply to lease amounts for resident cultural organisation tenants at the Judith Wright Centre of Contemporary Art.
Concessional ticket entry fees apply to a variety of concession card holders, students, children and families for special exhibitions at the Queensland Art Gallery and the Queensland Museum.
Queensland Performing Arts Trust offers discounts on venue rental fees charged to Government funded organisations, primarily Opera Queensland, Queensland Ballet, Queensland Orchestra and Queensland Theatre Company.
Community groups and charities are given discounts on venue rental fees at South Bank, such as the Suncorp Piazza and Cultural Forecourt.
Department of Transport and Main Roads
Motor vehicle and boat registration concessions are provided to holders of the Pensioner Concession Card, Queensland Seniors Card and to those receiving a TPI Ex-serviceperson Pension. The concession is aimed at improving the access to travel of pensioners and seniors and provides a reduced rate of registration fees.
Other motor vehicle and boat registration concessions are provided to:
| • | | primary producers to ensure the costs of basic necessities are kept to a minimum |
| • | | local governments to ensure lower costs of essential services |
| • | | charitable and community service organisations who provide assistance in the form of food, clothing and shelter to persons in distress |
| • | | people living in remote areas without access to the wider road network |
| • | | car club members with vehicles over 30 years of age who are preserving Queensland’s motoring history |
| • | | specific purpose vehicles that are used off road but need access to the road network to move between sites and to certain overseas consular positions. |
The School Transport Assistance Scheme is a program for students whose access to school is disadvantaged by distance or who are from defined low income groups. Assistance is provided towards the cost of travel on bus, rail and/or ferry with allowances for private vehicle transport.
| | | | |
| 212 | | Budget Strategy and Outlook 2010-11 | | |
Public transport concessions are provided by the Government to ensure access and mobility for Queenslanders who require assistance because of age, disability or fixed low income. Passengers entitled to receive a public transport concession include holders of a Pensioner Concession Card, Veterans’ Affairs Gold Card, Seniors Card (all states and territories), Companion Card, Vision Impairment Travel Pass, children, as well as secondary and tertiary students. The Taxi Subsidy Scheme aims to improve the mobility of persons with severe disabilities by providing a 50% concession fare up to a maximum subsidy of $25 per trip.
| | | | |
| | Budget Strategy and Outlook 2010-11 | | 213 |
APPENDIX C – STATEMENT OF RISKS AND SENSITIVITY ANALYSIS
INTRODUCTION
The Queensland Budget, like those of other states, is based in part on assumptions made about future elements of uncertainty, both internal and external to the State, which can impact directly on economic and fiscal forecasts. Operating results achieved in recent years reflect the fact that the actual fiscal result achieved depends on the direction of such variables.
This section analyses the sensitivity of the estimates to changes in the economic and other assumptions used in developing the Budget and forward estimates. This analysis is provided to enhance the level of transparency and accountability of the Government.
The forward estimates in the Budget are framed on a no policy change basis. That is, the expenditure and revenue policies in place at the time of the Budget (including those announced in the Budget) are applied consistently throughout the forward estimates period.
The following discussion provides details of some of the key assumptions and risks associated with revenue and expenditure forecasts and, where a direct link can be established, the indicative impact on forecasts resulting from a movement in those variables.
SENSITIVITY OF EXPENDITURE ESTIMATES AND EXPENDITURE RISKS
Public sector wage costs
Salaries and wages form a large proportion of General Government operating expenses. Increases in salaries and wages are negotiated through enterprise bargaining agreements.
The 2010-11 Budget and forward estimates includes funding for wage increases as per existing agreements and reflect the Government's wages policy for agreements yet to be reached.
Interest rates
The General Government sector has a moderate level of debt with a total debt servicing cost forecast at $1.242 billion in 2010-11.
The current average duration of General Government debt is around four years. The majority of General Government debt is held under fixed interest rates and therefore the impact of interest rate variations on debt servicing costs in 2010-11 would be modest.
| | | | |
| | Budget Strategy and Outlook 2010-11 | | 215 |
Actuarial estimates of superannuation and long service leave
Liabilities for superannuation and long service leave are estimated by the State Actuary with reference to, among other things, assumed rates of investment returns, salary growth and inflation. These liabilities are therefore subject to changes in these parameters. Similarly, the long service leave liabilities are subject to the risk that the actual rates of employee retention will vary from those assumed in the liability calculation.
While these impacts have been estimated and allowances made in the Budget and forward estimates to accommodate them, the actual outcome may differ from the estimates calculated for the Budget.
Demographic and demand based risks
Unforeseen changes in the size, location and composition of Queensland’s population can impact on the demand for goods and services and therefore on the cost of maintaining existing policies. This is particularly evident in the health, education, community services and criminal justice sectors.
State government expenditure is often more closely associated with socio-demographic factors, such as the number of school age children or the number of elderly residents, than with economic activity. However, such changes are unlikely to impact significantly in the short term.
For this reason, the composition, size and location of the State’s population are more significant in projecting the State’s expenditure needs across the forward estimates period than for the current or budget year.
| | | | |
| 216 | | Budget Strategy and Outlook 2010-11 | | |
SENSITIVITY OF REVENUE ESTIMATES AND REVENUE RISKS
The rate of growth in tax revenues is dependent on a range of factors that are linked to the rate of growth in economic activity in the State. Some taxes are closely related to activity in specific sectors of the economy, whilst others are broadly related to the general rate of economic growth, employment, inflation and wages. A change in the level of economic activity, resulting from economic growth differing from forecast levels, would impact upon a broad range of taxation receipts.
Other revenue items are influenced by external variables such as the exchange rate or the performance of financial markets.
Exchange rate and commodity prices and volumes – royalties estimates
Estimates of mining royalties are sensitive to movements in the Australian dollar-US dollar exchange rate and commodity prices and volumes.
Contracts for the supply of commodities are generally written in US dollars. Accordingly, a change in the exchange rate impacts on the Australian dollar price of commodities and therefore expected royalties collections.
For each one cent movement in the Australian dollar-US dollar exchange rate, the impact would be approximately $41 million in 2010-11.
Also impacting on royalty estimates are volume effects. A large component of Queensland’s royalty collections is derived from coal. A 1% variation in export coking and thermal coal volumes would lead to a change in royalty revenue of approximately $27 million.
The 2010-11 Budget assumptions for export coal prices are derived by taking into account various price forecasts made by coal companies and external forecasters. A 1% variation in the price of export coal would lead to a change in royalty revenue of approximately $35 million.
Property values and volumes – transfer duty estimates
For 2010-11, a slight recovery in the property market is forecast reflecting continuing demand for property and house price growth.
A 1% variation in either the average value of property transactions or the volume of transactions would change transfer duty collections by approximately $20 million in 2010-11.
| | | | |
| | Budget Strategy and Outlook 2010-11 | | 217 |
Wages and employment growth – payroll tax collections
Wages and employment growth have a direct impact on payroll tax collections. The Budget assumptions are for an increase in the Wage Price Index of 3 1/2% and an increase in employment of 2 3/4% in 2010-11.
A one percentage point variation in either Queensland wages growth or employment would change payroll tax collections by approximately $30 million in 2010-11.
Parameters influencing Australian Government GST payments to Queensland
Estimates of Australian Government GST revenue grants to states and territories are dependent on total GST revenue collected, which tends to be closely correlated with the general level of economic activity. The Australian Government has provided estimates of total GST collections in its Budget Papers. In 2010-11, Queensland’s Budget will bear the risks of fluctuations in GST revenues and the other components of the package, such as the First Home Owner Grant Scheme, administrative costs associated with the GST and taxes foregone.
The Australian Government’s estimate of GST revenue in 2010-11 is based on its forecast of consumption and as with all other tax estimates, there is a risk of lower collections than estimated by the Australian Government if economic growth and consumption is weaker than expected.
Relative to other states, Queensland has been assessed as having an increasing capacity to raise revenue, particularly mining revenue in recent years. As a result, Queensland’s share of GST funding (relativity) has declined and will continue to be below a population share in 2010-11.
Due to the complexities associated with the GST base, the information provided in the Australian Government Budget Papers is not sufficient to prepare indicative forecasts of the sensitivity of GST estimates to key variables.
By authority: S. C. Albury, Acting Government Printer, Queensland 2010
| | | | |
| 218 | | Budget Strategy and Outlook 2010-11 | | |
State Budget 2010–11
Budget Strategy and Outlook
Budget Paper No.2
www.budget.qld.gov.au


State Budget 2010—11
Capital Statement
Budget Paper No.3
Queensland Government
2010–11 State Budget Papers
1. Budget Speech
2. Budget Strategy and Outlook
3. Capital Statement
4. Budget Measures
5. Service Delivery Statements
Budget Highlights
This suite of Budget Papers is similar to that published in 2009–10.
The Budget Papers are available online at www.budget.qld.gov.au. They can be purchased through the Queensland Government Bookshop – individually or as a set – by phoning 1800 801 123 or at www.bookshop.qld.gov.au
© Crown copyright
All rights reserved
Queensland Government 2010
Excerpts from this publication may be reproduced, with appropriate
acknowledgement, as permitted under the Copyright Act.
Capital Statement
Budget Paper No.3
ISSN 1445-4890 (Print)
ISSN 1445-4904 (Online)

STATE BUDGET
2010-11
CAPITAL STATEMENT
Budget Paper No. 3
TABLE OF CONTENTS
| | | | | | |
1. | | Overview | | | | |
| | Introduction | | | 2 | |
| | Capital Grants to Local Government Authorities | | | 5 | |
| | Funding the State Capital Program | | | 6 | |
| | |
2. | | State Capital Program - Planning and Priorities | | | | |
| | Introduction | | | 11 | |
| �� | Capital Planning and Priorities | | | 11 | |
| | 2010-11 Highlights | | | 12 | |
| | Queensland Future Growth Fund | | | 20 | |
| | |
3. | | Capital Outlays by Entity | | | | |
| | Communities | | | 23 | |
| | Community Safety | | | 30 | |
| | Education and Training | | | 36 | |
| | Electoral Commission of Queensland | | | 54 | |
| | Employment, Economic Development and Innovation | | | 55 | |
| | Environment and Resource Management | | | 69 | |
| | Health | | | 78 | |
| | Infrastructure and Planning | | | 87 | |
| | Justice and Attorney General | | | 94 | |
| | Legislative Assembly of Queensland | | | 98 | |
| | Office of the Governor | | | 99 | |
| | Office of the Ombudsman | | | 100 | |
| | Police | | | 101 | |
| | Premier and Cabinet | | | 104 | |
| | Public Works | | | 108 | |
| | Queensland Audit Office | | | 113 | |
| | Transport and Main Roads | | | 114 | |
| | Treasury | | | 135 | |
| | | | | | |
Appendix A – Entities included in Capital Outlays 2010-11 | | | 136 | |
| |
Appendix B – Key Concepts and Coverage | | | 139 | |
| |
Appendix C – Methodology for estimating employment impacts of the Capital Works Program | | | 140 | |
KEY POINTS
| • | | Capital outlays in 2010-11 are estimated to be $17.091 billion. |
| • | | Capital outlays will support approximately 106,000 full-time jobs in Queensland. |
| • | | The Government’s ongoing commitment to regional and rural Queensland is reflected in this Budget. Over 57% of expenditure will occur outside the Brisbane Statistical Division, including $252.8 million to continue redevelopments at Cairns, Mackay, Mount Isa, Rockhampton and Townsville Hospitals, $37.6 million for completion of the duplication of the Forgan Bridge in Mackay, and $24 million to continue the redevelopment of the Cairns campus of the Tropical North Queensland Institute of TAFE. |
| • | | In 2010-11 there will be capital outlays of $7.325 billion for transport and main roads including $197 million to continue construction of the Northern Busway, $155.6 million to continue construction of the Springfield rail line, $88 million to commence the extension of the Port of Brisbane Motorway, and $20.3 million to continue construction of cycle links to enhance the cycle network in South East Queensland. |
| • | | In partnership with the Australian Government, capital outlays of $1.086 billion for housing and homelessness services including $699.8 million from the National Partnership Agreement, and $1.51 billion for education and training including $703 million from the Australian Government’s Building the Education Revolution program. |
| • | | The capital outlays of the Public Non-financial Corporations sector, including Government-owned corporations, constitute 41% of total outlays in 2010-11, including $3.131 billion in the energy sector. |
| • | | The Government will continue to invest in water infrastructure, with capital outlays of $753.8 million in 2010-11, including $202.2 million for the Northern Pipeline Interconnector, $105 million for the Wyaralong Dam, and $90 million to complete the Hinze Dam upgrade. |
| | | | |
| | Capital Statement 2010-11 | | 1 |
INTRODUCTION
This capital statement presents an overview of proposed capital outlays by the Queensland Government in 2010-11, as well as a summary of the Government’s approach to infrastructure provision. Capital outlays in 2010-11 are estimated to be $17.091 billion, net of a capital contingency reserve of $1 billion.
The Capital Program reflects the Government’s increased expenditure on health, continuing significant investment in public transport, roads, water infrastructure, education and housing and homelessness services, and progress with the South East Queensland Infrastructure Plan and Program (SEQIPP), as well as a number of other new capital investments.
Each year a major part of the Queensland Government’s capital program is undertaken through the Public Non-financial Corporations (PNFC) sector (that is, commercial entities of Government, including Government-owned corporations and other authorities such as the water bodies). For 2010-11, capital outlays of Queensland’s PNFC sector will constitute 41% of total outlays, reflecting major investments in water, electricity, rail and ports infrastructure.
Expenditure in 2010-11 is highest in the Brisbane Statistical Division – the most populated and one of the fastest growing areas of the State – planned at $7.606 billion. However, consistent with the Government’s commitment to building Queensland’s regions, over 57% of capital expenditure is expected to occur outside the Brisbane Statistical Division.
It is estimated that the State Capital Works program will support some 106,000 jobs. The employment impact of the program is estimated using methodology developed by the Office of Economic and Statistical Research.
| | | | |
| 2 | | Capital Statement 2010-11 | | |
Capital outlays by purpose in 2010-11 are shown in Chart 1.1 below. Capital outlays by State Government entity are listed in Table 1.1.
Chart 1.1
Capital Outlays by Purpose, 2010-11
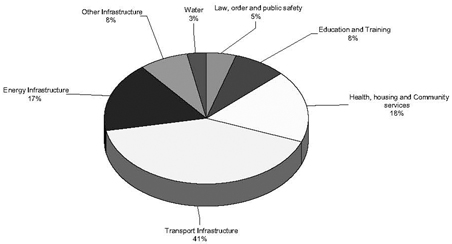
| | | | |
| | Capital Statement 2010-11 | | 3 |
| | | | | | | | |
Table 1.1 Capital Outlays by Entity1,5,6 | |
| | |
Entity | | 2009-10
Est. Act.
$’000 | | | 2010-11
Budget
$’000 | |
Communities | | | | | | | | |
Communities | | | 258,925 | | | | 405,339 | |
Housing and Homelessness Services | | | 834,725 | | | | 1,085,986 | |
Community Safety | | | 470,314 | | | | 303,479 | |
Education and Training | | | 2,153,074 | | | | 1,531,181 | |
Employment, Economic Development and Innovation | | | | | | | | |
Employment, Economic Development and Innovation | | | 251,426 | | | | 148,763 | |
Energy Generation sector | | | 710,152 | | | | 367,699 | |
Energy Transmission sector | | | 501,900 | | | | 574,000 | |
Energy Distribution sector | | | 1,907,205 | | | | 2,188,747 | |
Environment and Resource Management | | | | | | | | |
Environment and Resource Management | | | 202,762 | | | | 197,359 | |
Queensland Bulk Water Supply Authority | | | 196,286 | | | | 133,074 | |
Queensland Bulk Water Transport Authority | | | 27,263 | | | | 34,603 | |
Queensland Manufactured Water Authority | | | 137,469 | | | | 90,690 | |
Health | | | 934,116 | | | | 1,708,642 | |
Infrastructure and Planning | | | | | | | | |
Infrastructure and Planning2 | | | 989,031 | | | | 688,077 | |
Water Infrastructure Projects | | | 358,240 | | | | 315,577 | |
Justice and Attorney General | | | 155,632 | | | | 330,034 | |
Legislative Assembly of Queensland | | | 5,518 | | | | 2,587 | |
Police | | | 184,645 | | | | 217,709 | |
Premier and Cabinet | | | 110,018 | | | | 121,241 | |
Public Works | | | 418,851 | | | | 315,204 | |
Transport and Main Roads | | | | | | | | |
Transport | | | 618,066 | | | | 803,664 | |
QR Limited | | | 1,999,900 | | | | 2,772,388 | |
Port Authorities | | | 663,566 | | | | 473,250 | |
Main Roads | | | 3,508,389 | | | | 3,275,859 | |
Treasury | | | 9,345 | | | | 5,309 | |
Other Agencies3 | | | 350 | | | | 909 | |
Anticipated Capital Contingency Reserve4 | | | -300,000 | | | | -1,000,000 | |
| | | | | | | | |
Total Capital Outlays | | | 17,307,168 | | | | 17,091,370 | |
| | | | | | | | |
| | | | |
| 4 | | Capital Statement 2010-11 | | |
|
Table 1.1 Capital Outlays by Entity1,5,6 (Continued) |
|
Notes: |
1. Includes associated statutory bodies. |
2. Includes Property Services Group and Airport Link. |
3. Includes the Electoral Commission of Queensland, Office of the Governor, Office of the Ombudsman and Queensland Audit Office. |
4. Contingency recognises that individual agencies may budget to fully expend their capital works allocations, however on a whole-of-Government basis, there is likely to be under spending, resulting in a carryover of capital allocations. |
5. Capital works outside of Queensland are not included in the capital program. |
6. Numbers may not add due to rounding. |
The 2009-10 Capital Works Program budget totalled $18.2 billion. The 2009-10 estimated actual is for total expenditure of $17.3 billion, representing 95% of the original published budget. The 2009-10 estimated actual includes an underspend provision of $300 million based on Treasury’s analysis of year to date actuals.
Major movements in the 2009-10 capital program include variations in timing of social housing expenditure under the Australian Government’s Nation Building and Jobs Plan and the cessation of works associated with the Traveston Dam. In addition, the floods and heavy rainfall in the third quarter of 2009-10 reduced expenditure on water infrastructure projects and some health, roads and electricity projects in the most affected regions.
CAPITAL GRANTS TO LOCAL GOVERNMENT AUTHORITIES
As highlighted in Budget Paper 2 – Budget Strategy and Outlook, the Queensland Government provides capital grants and subsidies to local government authorities to assist with the creation or upgrading of a range of essential community infrastructure such as water supply, sewerage works, roads and drainage works.
In 2009-10, approximately 62.1% ($818.2 million) of total Queensland Government grants made to local government authorities were for capital purposes. Capital grants to local governments are expected to account for $724.9 million, or 58.1% of total Queensland Government grants in 2010-11.
Queensland Government capital grants to local government authorities are shown in Chart 1.2 below.
| | | | |
| | Capital Statement 2010-11 | | 5 |
Chart 1.2
Queensland Government Capital Grants to
Local Government Authorities, by Purpose, 2010-11
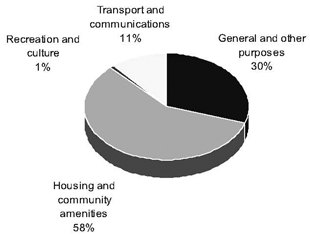
FUNDING THE STATE CAPITAL PROGRAM
The State’s capital program is implemented across both the General Government sector and the PNFC sector.
While the capital program undertaken across the PNFC sector contributes significantly towards meeting the Government’s priorities, the process through which this capital program is developed and funded is different from the General Government sector.
Entities in the PNFC sector operate as commercial business entities, generally within competitive markets, and as such progress their capital programs on the basis of needs identified within the market sectors they service. There are a number of ways in which the capital expenditure program for the PNFC sector can be funded. Their options include using cash flow from their business, borrowings, and, in certain situations, requesting a dividend reinvestment or equity injection from shareholding Ministers.
| | | | |
| 6 | | Capital Statement 2010-11 | | |
Table 1.2 outlines the major sources of funding for the State capital program.
In 2010-11, net borrowings and advances of $11.08 billion are estimated in support of the capital program, of which $7.666 billion is budgeted for the General Government sector. The expected borrowing and advances requirement of the PNFC sector 2010-11 is $3.414 billion. The major borrowers in this sector are Queensland Rail, the water bodies and Queensland Motorways Limited.
In total, borrowings and advances are projected to fund around 72% of new infrastructure in 2010-11.
After allowing for the reinvestment of earnings on investments, free cash flow of $2.696 billion is expected to be available for investment in capital in 2010-11.
| | | | | | | | |
Table 1.2 Sources of Funding for Capital1 | |
| | |
| | | 2009-10
Est. Act.
$’000 | | | 2010-11
Budget
$’000 | |
| | |
| | |
Total Capital Expenditure | | | 17,307 | | | | 17,091 | |
Less Capital Grants (Funded from Operating Revenue) | | | 1,099 | | | | 1,273 | |
Net State Capital Funding Task | | | 16,208 | | | | 15,818 | |
| | |
Funding Sources | | | | | | | | |
Cash Flows from Operating Activities | | | 5,295 | | | | 3,993 | |
Less Reinvestments2 | | | 1,634 | | | | 1,355 | |
Equals Net Cash Flow for Capital Acquisitions | | | 3,661 | | | | 2,638 | |
Asset Sales | | | 362 | | | | 1,264 | |
Borrowings and Advances | | | 9,132 | | | | 11,030 | |
Cash Balances and Other Financing Sources | | | 3,053 | | | | 886 | |
| | |
Total Funding Sources | | | 16,208 | | | | 15,818 | |
Note:
| 1. | Numbers may not add due to rounding. |
| 2. | Primarily reflects reinvestment of General Government investment earnings relating to accruing entitlements. |
| | | | |
| | Capital Statement 2010-11 | | 7 |
Table 1.3 outlines capital outlays in 2010-11 by entity for each statistical division.
| | | | | | | | | | | | | | | | | | | | | | | | | | | | |
Table 1.3 Total Capital Outlays by Entity within Statistical Division for 2010-111 | |
| | | | | | | |
Entity2 | | 05
Brisbane
$’000 | | | 07
G/Coast
$’000 | | | 09
S/Coast
$’000 | | | 12
W/Moreton
$’000 | | | 15
W/Bay
$’000 | | | 20
D/Downs
$’000 | | | 25
S/West
$’000 | |
| | | | | | | |
| | | | | | | |
Communities | | | 501,824 | | | | 230,010 | | | | 59,439 | | | | 11,826 | | | | 83,930 | | | | 59,059 | | | | 6,469 | |
Community Safety | | | 71,849 | | | | 11,853 | | | | 6,558 | | | | 81,677 | | | | 8,302 | | | | 6,796 | | | | 518 | |
Education and Training | | | 683,933 | | | | 173,649 | | | | 80,179 | | | | 25,315 | | | | 81,380 | | | | 92,367 | | | | 19,414 | |
Employment, Economic Development and Innovation | | | 1,213,908 | | | | 169,437 | | | | 152,653 | | | | 56,702 | | | | 325,323 | | | | 339,272 | | | | 22,970 | |
Environment and Resource Management | | | 127,810 | | | | 147,409 | | | | 15,991 | | | | 15,146 | | | | 3,900 | | | | 7,598 | | | | 7,322 | |
Health | | | 454,962 | | | | 696,216 | | | | 92,807 | | | | 7,537 | | | | 44,996 | | | | 23,657 | | | | 2,625 | |
Infrastructure and Planning | | | 367,075 | | | | 50,325 | | | | 246,116 | | | | 118,269 | | | | 26,103 | | | | 29,824 | | | | 2,433 | |
Justice and Attorney General | | | 311,401 | | | | 6,139 | | | | 1,213 | | | | 198 | | | | 1,323 | | | | 2,201 | | | | 113 | |
Legislative Assembly of Queensland | | | 2,587 | | | | 0 | | | | 0 | | | | 0 | | | | 0 | | | | 0 | �� | | | 0 | |
Police | | | 139,571 | | | | 13,715 | | | | 6,444 | | | | 1,287 | | | | 5,723 | | | | 3,964 | | | | 448 | |
Premier and Cabinet | | | 118,841 | | | | 0 | | | | 0 | | | | 130 | | | | 0 | | | | 2,270 | | | | 0 | |
Public Works | | | 146,311 | | | | 24,971 | | | | 48,156 | | | | 3,517 | | | | 13,177 | | | | 10,714 | | | | 1,261 | |
Transport and Main Roads | | | 3,459,325 | | | | 451,469 | | | | 178,622 | | | | 88,130 | | | | 740,818 | | | | 227,812 | | | | 43,393 | |
Treasury | | | 5,309 | | | | 0 | | | | 0 | | | | 0 | | | | 0 | | | | 0 | | | | 0 | |
Other Agencies3 | | | 0 | | | | 0 | | | | 0 | | | | 0 | | | | 0 | | | | 0 | | | | 0 | |
Anticipated Capital Contingency Reserve | | | | | | | | | | | | | | | | | | | | | | | | | | | | |
| | | | | | | | | | | | | | | | | | | | | | | | | | | | |
Funds Allocated | | | 7,605,615 | | | | 1,975,193 | | | | 888,178 | | | | 409,734 | | | | 1,334,975 | | | | 805,534 | | | | 106,966 | |
| | | | |
| 8 | | Capital Statement 2010-11 | | |
| | | | | | | | | | | | | | | | | | | | | | | | | | | | |
Table 1.3 Total Capital Outlays by Entity within Statistical Division for 2010-111 | |
| | | | | | | |
Entity2 | | 30
Fitzroy
$’000 | | | 35
C/West
$’000 | | | 40
Mackay
$’000 | | | 45
Northern
$’000 | | | 50
F/North
$’000 | | | 55
N/West
$’000 | | | Totals
$’000 | |
| | | | | | | |
| | | | | | | |
Communities | | | 68,371 | | | | 3,669 | | | | 48,462 | | | | 196,448 | | | | 191,745 | | | | 30,073 | | | | 1,491,325 | |
Community Safety | | | 4,586 | | | | 926 | | | | 5,759 | | | | 7,440 | | | | 96,247 | | | | 968 | | | | 303,479 | |
Education and Training | | | 53,433 | | | | 11,728 | | | | 74,117 | | | | 69,783 | | | | 135,360 | | | | 30,523 | | | | 1,531,181 | |
Employment, Economic Development and Innovation | | | 261,302 | | | | 50,900 | | | | 190,154 | | | | 276,843 | | | | 174,085 | | | | 45,660 | | | | 3,279,209 | |
Environment and Resource Management | | | 31,438 | | | | 2,656 | | | | 66,350 | | | | 4,833 | | | | 17,581 | | | | 7,692 | | | | 455,726 | |
Health | | | 61,728 | | | | 1,143 | | | | 93,169 | | | | 98,056 | | | | 119,522 | | | | 12,225 | | | | 1,708,642 | |
Infrastructure and Planning | | | 39,942 | | | | 1,060 | | | | 44,512 | | | | 38,486 | | | | 33,708 | | | | 5,802 | | | | 1,003,654 | |
Justice and Attorney General | | | 936 | | | | 76 | | | | 982 | | | | 1,932 | | | | 3,219 | | | | 302 | | | | 330,034 | |
Legislative Assembly of Queensland | | | 0 | | | | 0 | | | | 0 | | | | 0 | | | | 0 | | | | 0 | | | | 2,587 | |
Police | | | 7,091 | | | | 195 | | | | 3,821 | | | | 6,210 | | | | 20,708 | | | | 8,532 | | | | 217,709 | |
Premier and Cabinet | | | 0 | | | | 0 | | | | 0 | | | | 0 | | | | 0 | | | | 0 | | | | 121,241 | |
Public Works | | | 9,565 | | | | 579 | | | | 7,640 | | | | 10,437 | | | | 37,268 | | | | 1,608 | | | | 315,204 | |
Transport and Main Roads | | | 784,594 | | | | 12,429 | | | | 819,771 | | | | 226,317 | | | | 160,598 | | | | 131,884 | | | | 7,325,161 | |
Treasury | | | 0 | | | | 0 | | | | 0 | | | | 0 | | | | 0 | | | | 0 | | | | 5,309 | |
Other Agencies3 | | | 0 | | | | 0 | | | | 0 | | | | 0 | | | | 0 | | | | 0 | | | | 909 | |
Anticipated Capital Contingency Reserve | | | | | | | | | | | | | | | | | | | | | | | | | | | -1,000,000 | |
| | | | | | | | | | | | | | | | | | | | | | | | | | | | |
Funds Allocated | | | 1,322,986 | | | | 85,361 | | | | 1,354,737 | | | | 936,785 | | | | 990,041 | | | | 275,269 | | | | 17,091,370 | |
Notes:
| 1. | Numbers may not add due to rounding. |
| 2. | Includes associated statutory bodies. Capital works outside of Queensland are not included in the 2010-11 capital program. |
| 3. | Includes the Electoral Commission of Queensland, Office of the Governor, Office of the Ombudsman and Queensland Audit Office. |
| | | | |
| | Capital Statement 2010-11 | | 9 |
Chart 1.3
Queensland Statistical Divisions, 2010-11
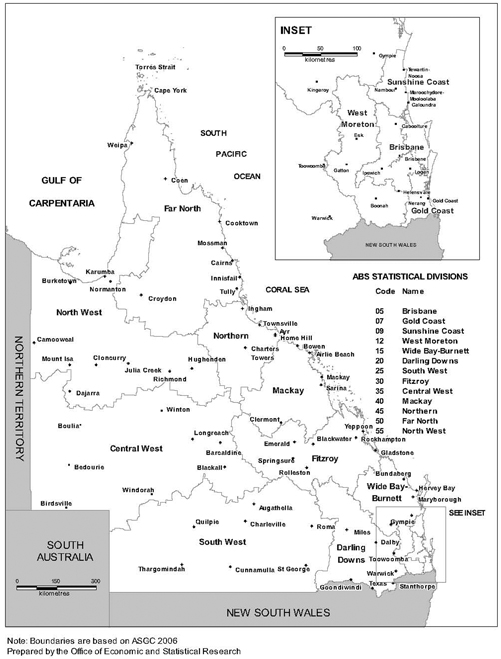
| | | | |
| 10 | | Capital Statement 2010-11 | | |
| 2. | STATE CAPITAL PROGRAM – PLANNING AND PRIORITIES |
INTRODUCTION
The Queensland Government is committed to creating the infrastructure necessary to support the economic and social development of the State. It does so:
| • | | by providing infrastructure in support of core service delivery priorities – General Government sector investment |
| • | | through investments made by commercial entities of Government, including Government-owned corporations (GOCs) – Public Non-financial Corporations (PNFC) sector investment |
| • | | where appropriate, by fostering private sector investment |
This chapter outlines key capital planning and expenditure priorities for the 2010-11 Budget.
CAPITAL PLANNING AND PRIORITIES
Capital investment decisions are primarily driven by the policy priorities of Government and factors such as demographic changes and planning requirements which impact upon service delivery requirements.
The Government has a range of mechanisms available to deliver the capital needed to support its priorities. These mechanisms include the Government directly funding and constructing infrastructure and providing capital grants to local government, the private sector and profit and not-for-profit organisations to deliver capital projects and provide services on behalf of the Government. The Government also considers opportunities for private sector involvement in public infrastructure delivery either through joint ventures or stand alone projects.
Investments made by the PNFC sector also constitute a major part of the State capital program. Entities in the PNFC sector operate on a commercial basis and, as such, their capital programs reflect needs identified within the market sector serviced by these entities.
| | | | |
| | Capital Statement 2010-11 | | 11 |
South East Queensland Infrastructure Plan and Program
The South East Queensland Infrastructure Plan and Program 2010-2031 (SEQIPP) will outline the Government’s infrastructure priorities to support the SEQ Regional Plan to 2031 and represents a long term commitment to capital works in South East Queensland.
SEQIPP is still the largest infrastructure program in the country with 383 identifiable projects supporting about one million jobs to 2031.
Five years into the SEQIPP program $20.8 billion has been invested and 160,000 jobs have been sustained.
In 2010, the Government continues investment in the largest infrastructure program in Australia, as well as looking at how it can deliver infrastructure outcomes earlier and within the context of a constrained financial environment.
2010-11 HIGHLIGHTS
The Government is committed to continuing to develop Queensland’s infrastructure base. Highlights of capital spending in 2010-11 are outlined in this section.
Health
In 2010-11, the Government continues its significant investment in health infrastructure with a $1.709 billion capital program. The focus for 2010-11 includes investment in regional cancer services, new hospitals, hospital redevelopments and expansions (including emergency department upgrades), development of community health centre infrastructure and investment in information and health technology.
Sunshine Coast University Hospital will progress at a total estimated cost of $1.973 billion, and will open with 450 beds in 2016 and expand to 738 beds by 2021. In the interim, the Government and Australian Government will provide funding to enhance clinical services at Nambour General Hospital through the development of a cardiac catheterisation laboratory, endoscopy suite and vascular surgery suite, improvements to neurosurgery services, increased access to aero medical retrieval services and purchasing of radiation oncology services from the private sector. Clinical capacity at Caloundra Department of Emergency Medicine will be increased to meet rising demand until the opening of the new Sunshine Coast University Hospital.
Other program highlights include:
| | | | |
| 12 | | Capital Statement 2010-11 | | |
| • | | $16.4 million ($179.3 million over four years) for the construction or upgrade of cancer centres throughout Queensland. The new regional cancer services will be located in Townsville (with outreach services to Mt Isa); Rockhampton, Bundaberg and Hervey Bay (with outreach services provided from the Royal Brisbane and Women’s Hospital); and Toowoomba (with outreach services provided by the Princess Alexandra Hospital). |
| • | | $257.4 million over four years (under the National Health and Hospital Network package) to implement a number of initiatives, including emergency department treatment times, elective surgery, rehabilitation, sub-acute care, mental health, palliative care and multi-purpose facilities. |
| • | | Further development of tertiary hospitals in South East Queensland ($626.1 million in 2010-11: Gold Coast University Hospital and the Queensland Children’s Hospital). |
| • | | Redevelopments of hospitals ($252.7 million in 2010-11) at Cairns, Mackay, Mount Isa, Townsville and Rockhampton continue. |
| • | | In partnership with the University of Queensland, Queensland University of Technology and the Mater Medical Research Institute $57.2 million in 2010-11 ($334 million over four years) will be invested in developing the Translational Research Institute (TRI) in the Princess Alexandra Hospital grounds. TRI will provide a high quality research environment that will focus on the translation of research outcomes to clinical trials and practice. |
Transport and Main Roads
In 2010-11, capital funding of $7.325 billion is provided for roads and other transport infrastructure including the Department of Transport and Main Roads, Airport Link, QR Limited, the ports corporations, Queensland Motorways Limited, RoadTek and the TransLink Transit Authority.
Roads
In 2010-11, capital funding of $3.276 billion is provided for roads projects. Highlights of the 2010-11 roads capital program include:
| • | | $198 million to upgrade, to six lanes, a section of the Gateway Motorway, from Mount Gravatt-Capalaba Road to Miles Platting Road, at a total estimated cost of $240 million |
| | | | |
| | Capital Statement 2010-11 | | 13 |
| • | | $88 million to commence the two lane extension of the Port of Brisbane Motorway from Lindum Road to Pritchard Street, at a total estimated cost of $332 million |
| • | | $37.6 million towards the completion of the duplication of the Forgan Bridge in Mackay, at a total estimated cost of $148 million |
| • | | $29.5 million for the Calliope Range deviation on the Dawson Highway, at a total estimated cost of $70 million. |
| • | | $550 million to continue the federally-funded Ipswich Motorway upgrade, between Dinmore to Goodna, at a total estimated cost of $1.95 billion |
| • | | $288 million, in state and federal funding, to upgrade the Bruce Highway between Cooroy and Curra (Section B – Sankeys Road to Traveston Road), at a total estimated cost of $613 million |
| • | | $48.5 million, in joint state and federal funding, to continue the widening of four lanes of the Douglas Arterial, on the Bruce Highway (Townsville Ring Road), at a total estimated cost of $110 million |
Rail and ports
In 2010-11, capital funding of $3.246 billion is invested towards the continued business as usual operation for rail and ports projects. Highlights of the 2010-11 rail and ports capital program include:
| • | | coal network – $864.2 million for coal network tracks and new and upgraded locomotives and wagons. This includes $502.2 million for the Goonyella to Abbot Point Expansion Infrastructure Works construction and $192.1 million for the continuation of the Jilalan Yard Upgrade and for new and upgraded electric and diesel locomotives and coal wagons. |
| • | | Citytrain track infrastructure upgrades – $446.4 million to upgrade infrastructure and rollingstock on the Citytrain network as part of SEQIPP. |
| • | | Port of Brisbane Corporation Limited – $56.7 million to continue construction of berths 11 and 12 to accommodate increasing trade throughput and $14.5 million for major road upgrades at Fisherman Islands. |
| • | | Far North Queensland Ports Corporation Limited – $9.3 million for the southern extension of the boardwalk and foreshore promenade in the Cairns Cityport. |
| | | | |
| 14 | | Capital Statement 2010-11 | | |
| • | | Gladstone Ports Corporation Limited - $40.2 million for upgrading works at the RG Tanna Coal Terminal and $14 million for construction of a new tug facility. |
| • | | North Queensland Bulk Ports Corporation Limited - $53.5 million to complete the Abbot Point Coal Terminal X50 expansion at a total estimated cost of $818 million which will increase the terminal capacity of the terminal to 50 million tonnes per annum. A further $39.6 million is provided to complete the renewal of coal stockpile machinery for the Abbott Point Coal Terminal. |
| • | | Port of Townsville Limited - $57.5 million for construction of the Townsville Marine Precinct project to provide a dedicated marine facility to the local industrial and commercial marine industries. |
Other Transport
The Department of Transport and Main Roads’ capital expenditure program in 2010-11, for other than roads-related transport, totals $744.3 million and predominantly comprises investment in public transport infrastructure and systems.
In the 2010-11 Budget, the Government continues to progress the implementation of SEQIPP. Some major projects in South East Queensland include:
| • | | $219 million for the Gold Coast Rapid Transit System, a light rail project from Parkwood to Broadbeach, at a total estimated cost for stage 1 of $948.7 million |
| • | | $197 million to continue construction of the Northern Busway between Enoggera Creek and Kedron, at a total estimated cost of $734.7 million |
| • | | $150 million to continue construction of a 1.05 km busway connection between South East Busway and Main Avenue with bus stations at Stones Corner and Langlands Park, at a total estimated cost of $465.8 million |
| • | | $20.3 million to continue construction of cycle links to enhance the cycle network in South East Queensland. This is made up of $9.4 million towards the construction of state-owned cycle links and $10.9 million in grants to be provided to local government. |
The TransLink Transit Authority capital expenditure program for 2010-11 totals $59.4 million, including $39.1 million towards the TransLink Station Upgrade Program, to improve existing bus stations and build additional station infrastructure.
| | | | |
| | Capital Statement 2010-11 | | 15 |
Water
South East Queensland
To meet current and future water supply needs in South East Queensland (SEQ), the Government is continuing construction of the Water Grid, ensuring climate-resilient supply arrangements and allowing water to be regionally managed and allocated to meet demand in the areas of highest need.
$202.2 million is budgeted for the Northern Pipeline Interconnector Stage 2, to be completed in 2011-12. This pipeline will extend from Landers Shute water treatment plant at Eudlo to Cooroy on the Sunshine Coast, and facilitate the integration of Sunshine Coast Regional Council into the SEQ Water Grid. As part of the project, reverse flow capacity will be installed on Stages 1 and 2 of the pipeline. Longer-term planning is for the pipeline to deliver water from future northern water sources, including possible northern desalination facilities. Alternatively, it could deliver water to the Sunshine Coast, should the next major supply be located elsewhere in SEQ.
The $348 million Wyaralong Dam project is now under construction. In 2010-11, $105 million will be spent on construction activities. The dam, which is scheduled for completion in 2011, will provide an additional 26,000 ML/pa of water when operated with the Cedar Grove Weir and the Bromelton Offstream Storage.
The Queensland Bulk Water Supply Authority is allocating $90 million in 2010-11 for the Hinze Dam Stage 3 project. This project is due for completion in 2011 and will raise the Hinze Dam wall 15 metres, giving the dam a total capacity of nearly 310,000 ML.
Energy
Electricity usage in Queensland has grown strongly during the past ten years, and this trend is expected to continue. Queensland’s annual electricity consumption over the last three years averaged approximately 48,957 GWh and is expected to grow at an annual average of 4.2% over the next three years to 2012-13.
| | | | |
| 16 | | Capital Statement 2010-11 | | |
The growth continues to be driven largely by economic activity, increasing population, and the growing use of lifestyle appliances such as plasma televisions and air-conditioners. The growth in energy consumption has been more significant in South East Queensland, due to the concentration of population and industry.
The proportion of residences with air-conditioners in Queensland has increased from around 35 per cent in 2001 to over 70 per cent, and is a key driver of peak demand. It is estimated that ENERGEX and Ergon will spend around $3 billion over the next five years on new distribution network infrastructure to meet the increased load from air-conditioners.
Investment in electricity infrastructure continues to be driven by peak demand, with in excess of 12 per cent of ENERGEX’s distribution network being utilised for only one percent of the time, equating to less than four days per annum. While demand management strategies are being explored as medium to long term responses, significant capital investment in the electricity sector is required to ensure the sector continues to meet demand.
An additional 914 megawatts of capacity was added to the state’s electricity supply by the private sector with the commissioning of liquid fuel fired generation at Mt Stuart and gas-fired plants at Darling Downs and Condamine. A further 169 megawatts of capacity will be added with the commissioning of a gas-fired plant at Yarwun.
Powerlink will invest $574 million on new transmission infrastructure and augmentation, while ENERGEX and Ergon Energy will similarly invest a total of $2.189 billion on the distribution networks to maintain reliable and secure transmission and distribution electricity networks across the state.
Altogether, a total of $3.130 billion has been budgeted to be spent in 2010-11 by the Government owned electricity corporations on plant and network overhauls, maintenance and augmentation. This will ensure that the State’s electricity assets and infrastructure continue to maintain secure and reliable supply and are well positioned to meet forecast growth in demand.
Highlights of the 2010-11 electricity capital program include:
| • | | Generation sector: the primary focus will be capital works to ensure ongoing generation plant reliability and efficiency. CS Energy will spend $50.2 million on improvements to the Callide power station for overhauls and major refurbishment work on the B station, $20 million and $24.5 million respectively on improvements to the Mica Creek and Kogan Creek power stations. Stanwell will spend $67.4 million on comprehensive maintenance works and plant upgrades of Stanwell, Barron Gorge and Kareeya power stations with a further $8.7 million investment in low nitrogen burners for the Stanwell power station. |
| | | | |
| | Capital Statement 2010-11 | | 17 |
Similarly, Tarong Energy will spend $72.4 million on maintenance and improvements at the Wivenhoe, Tarong and Tarong North power stations. An additional $38.4 million will be spent on mine fleet and equipment upgrades and refurbishments at the Meandu coal mine.
| • | | Transmission sector: Powerlink will undertake major transmission augmentation and new capital works of $574 million to reinforce electricity supply and maintain a secure and reliable transmission network across the state. |
| • | | Distribution sector: ENERGEX and Ergon energy have budgeted network and non-system capital expenditure of $1.251 billion and $937.7 million respectively for the augmentation and maintenance of the distribution network and to improve the security and reliability of electricity supply in their respective regions. |
Housing
In 2010-11, Government continues its significant investment in affordable housing infrastructure with a capital program of $1.086 billion focused on delivering additional social housing as well as improving existing dwellings to continue to meet the needs of social housing clients. This investment will assist in meeting the growing need for affordable and appropriate housing for clients, improving Queensland’s response to people who are homeless or at significant risk of homelessness and improving the condition and availability of housing in Indigenous communities.
This major investment in capital works includes funding of $90 million from the Queensland Future Growth Fund and $699.8 million from National Partnership Agreements with the Australian Government including the Nation Building and Jobs Plan, Social Housing, Homelessness and Remote Indigenous Housing.
In 2010-11, the value of the social housing portfolio is expected to reach in excess of $15.3 billion.
| | | | |
| 18 | | Capital Statement 2010-11 | | |
Education and Training
The education capital works budget in 2010-11 will total $1.240 billion (including an expensed component of $145.2 million), while the training budget will total $133.3 million (including $19.6 million expensed) and $71.4 million (including $4.3 million expensed) for early childhood education. A further $254.6 million is allocated for the South-East Queensland Schools Public Private Partnership (SEQ Schools PPP), capital grant payments to other organisations and plant and equipment purchases for the department. This infrastructure investment will also generate further employment opportunities.
A total of $135.0 million will be spent on facilities to cater for population growth areas across the state. This funding will provide two new schools at Springfield, undertake staged work at six schools, buy land and provide additional classrooms at existing schools. During the 2010-11 financial year, schools in wider Bellbird Park area (Ipswich), Collingwood Park (Ipswich) and East Coomera will be opened under the SEQ Schools PPP which will provide seven schools in total.
The Government’s State Schools of Tomorrow program will also complete its roll out with the allocation of $207 million to deliver new and upgraded facilities in schools. This includes:
| • | | $48 million to complete the relocation of Bremer State High School; |
| • | | $23 million to complete the amalgamation of three primary schools at the former Wynnum North State High School site; and |
| • | | $5 million to complete the renewal of Wynnum State High School. |
The Government’s commitment to invest $321 million to establish up to 240 new or additional kindergarten services by 2014 will provide $35.7 million in 2010-11, which will include the construction of 12 services on state sites for 2011.
Just over half of the education capital works budget will be used to build or upgrade facilities in Queensland schools as part of the Australian Government’s Building the Education Revolution program. In 2010-11, $703 million will provide for the building or upgrade of large scale school infrastructure (such as libraries, halls and science and language laboratories) as well as the renewal of existing school buildings.
| | | | |
| | Capital Statement 2010-11 | | 19 |
The Queensland Skills Plan included a six-year infrastructure program worth over $350 million. Under this plan, in 2010-11, $109.8 million will be invested in major facilities for trade and technician skills and for the redevelopment of TAFE campuses generally.
QUEENSLAND FUTURE GROWTH FUND
The Queensland Future Growth Fund (the Fund) was established in June 2006 with the net proceeds from the sale of State Government-owned energy retailers.
The Fund supports initiatives and infrastructure benefiting Queensland by:
| • | | implementing strategies to secure water supply and providing funding for water infrastructure |
| • | | providing funding for infrastructure projects that support the State’s growth, particularly in the areas of transport, housing and commercial infrastructure |
| • | | supplying funds to research and develop innovative technologies that address climate change and proactively advance the State’s environmental sustainability. |
The Queensland Future Growth Corporation was created under the Future Growth Fund Act 2006 to administer the Fund.
In 2009-10, the Fund has allocated $658.8 million toward transport and water infrastructure, clean coal technology, climate change and Smart State projects, commercial infrastructure and social housing stock.
The Fund will continue to contribute to the following key priorities with an estimated $362.6 million allocated to projects in 2010-11:
| • | | constructing water and transport infrastructure |
| • | | funding for clean coal technology that will make a proactive and positive contribution to the science and technology of reducing carbon emissions |
| • | | funding for climate change initiatives such as the Solar Hot Water Rebate Scheme, energy conservation and demand management measures to reduce peak electricity demand in Queensland and grants for a range of renewable energy projects |
| | | | |
| 20 | | Capital Statement 2010-11 | | |
| • | | contributing further towards Smart State projects, including the Innovation Building Fund. The 2010-11 allocation also provides funding towards the Life Sciences Partnership Fund – a venture capital fund between the Queensland Government, global biopharmaceutical company Eli Lilly and other strategic investors that will be based in Brisbane and help make Queensland a key biotechnology hub |
| • | | funding for priority works on the Mount Isa rail line to facilitate capacity growth and develop the North West Minerals Province |
| • | | continuing to provide funding to expand the State’s social housing stock. |
| | | | |
| | Capital Statement 2010-11 | | 21 |
Table 2.1 shows the allocation of the Fund towards various projects.
Table 2.1
Queensland Future Growth Fund projects
| | | | | | | | | | | | | | | | | | | | | | | | | | | | |
| | | Total
allocation
$’000 | | | 2006-07
Actual
$’000 | | | 2007-08
Actual
$’000 | | | 2008-09
Actual
$’000 | | | 2009-10
Budget
$’000 | | | 2009-10
Est. Act.
$’000 | | | 2010-11
Estimate
$’000 | |
Transport infrastructure | | | 500,000 | | | | — | | | | 149,300 | | | | 153,600 | | | | 135,100 | | | | 125,600 | | | | 3,700 | |
Water infrastructure | | | 1,000,000 | | | | — | | | | — | | | | 557,200 | | | | 14,800 | | | | 278,700 | | | | 73,400 | |
Clean coal technology | | | 300,000 | | | | 29,600 | | | | 22,400 | | | | 46,900 | | | | 19,000 | | | | 16,600 | | | | 4,700 | |
Climate change projects | | | 100,000 | | | | — | | | | — | | | | 3,000 | | | | 43,200 | | | | 26,200 | | | | 43,200 | |
Smart State projects | | | 128,100 | | | | — | | | | 6,800 | | | | 20,000 | | | | 23,200 | | | | 700 | | | | 80,900 | 1 |
Commercial infrastructure | | | 600,000 | | | | 400,000 | | | | — | | | | 50,000 | | | | 50,000 | | | | 71,000 | | | | 66,700 | |
Social housing stock | | | 500,000 | | | | — | | | | 85,000 | | | | 125,000 | | | | 140,000 | | | | 140,000 | | | | 90,000 | |
Total | | | 3,128,100 | | | | 429,600 | | | | 263,500 | | | | 955,700 | | | | 425,300 | | | | 658,800 | | | | 362,600 | |
Note:
| 1. | Allocation includes the forecast conversion of US$25 million to A$ relating to funding towards the Life Sciences Partnership Fund. The actual drawdown amount from the Queensland Future Growth Fund will be based on the conversion of US$ to A$ on the day of the drawdown and therefore, will differ from the forecast allocation. |
| | | | |
| 22 | | Capital Statement 2010-11 | | |
3. CAPITAL OUTLAYS BY ENTITY
COMMUNITIES
Department of Communities
Total capital outlays for the Department of Communities in 2010-11 will be $1.365 billion, including:
| • | | $1.086 billion for Housing and Homelessness Services (including $587.8 million received under the Nation Building and Jobs Plan) |
| • | | $105.6 million for Community and Youth Justice Services |
| • | | $11.8 million for Child Safety Services |
| • | | $71.5 million for Disability and Community Care Services |
| • | | $44.8 million for Sport and Recreation Services. |
Stadiums Queensland’s capital outlay will be $126.1 million.
These funds provide for integrated community services and support to vulnerable and disadvantaged Queenslanders, to help build fair, cohesive and vibrant Queensland communities.
Program Highlights
| • | | $674.9 million for the provision of Government-managed social housing to commence construction of 927 and complete 1,992 rental units, purchase 103 rental units, purchase and develop land and enhance the condition of existing social housing. |
| • | | $236.7 million for the provision of community-managed social housing to commence construction of 565 and complete 1,098 rental units, purchase 15 rental units, purchase and develop land and enhance the condition of existing social housing. |
| • | | $143.7 million in capital grants for upgrades to existing properties and new units of accommodation and replacements for the 34 Indigenous communities. |
| • | | $83 million to continue to expand the Cleveland Youth Detention Centre in Townsville to a 96-bed facility with completion scheduled in 2012-13. |
| • | | $3 million under the Sustainable Resource Communities funding initiative to purpose build the Moranbah Youth Centre, to provide a safe and suitable location for youth services, activities and program. |
| | | | |
| | Capital Statement 2010-11 | | 23 |
| • | | $2.6 million under the Sustainable Resource Communities funding initiative to replace the Chinchilla Community Centre. |
| • | | $10 million to continue the establishment and upgrade of residential care facilities to expand the range of placement options available for children and young people in the child protection system. |
| • | | $1.8 million to continue construction activities and the establishment of Safe Houses in the Indigenous communities of Palm Island, Mornington Island and Napranum to provide a safe place for Indigenous children in the statutory child protection system to remain in their communities while their longer term needs are being assessed. Planning and community consultation will continue for additional safe houses in eastern Cape York, the Torres Strait Islands and the Northern Peninsula Area. |
| • | | $9.3 million under the Disability Assistance Package funding (from a total of $18.3 million received from the Australian Government) to provide sustainable housing arrangements for people with a disability who have ageing carers. |
| • | | $11.6 million to purchase, construct and upgrade residential accommodation for non-clinical mental health services and people with a disability. |
| • | | $23 million to continue capital upgrades to infrastructure and construct purpose built accommodation, as part of a targeted response under the Positive Futures initiative for people with an intellectual and/or cognitive disability who exhibit severely challenging behaviours. |
| • | | $35.5 million to develop and improve sport and recreation infrastructure. A review of the sport and recreation funding programs resulted in consolidation of programs and in 2010-11 the new suite of programs will consist of the Sport and Recreation Active Inclusion Program, the Local Sport and Recreation Jobs Plan, the Sport and Recreation Infrastructure Program and the State Sport and Recreation Organisation Development Program. Continuing programs include the Young Athlete Assistance Program, the Disaster Recovery Program, and Indigenous Programs. All existing commitments from ceasing programs will be met. |
| • | | $3 million in 2010-11 and an additional $1.6 million in 2011-12 under the Sustainable Resource Communities funding initiative to the Western District Regional Council to refurbish the Dalby Aquatic Centre. |
| • | | $1 million in 2010-11 under the Sustainable Resource Communities funding initiative for the Central Highlands Driver facility. |
| | | | |
| 24 | | Capital Statement 2010-11 | | |
| • | | $0.63 million to be provided to the Townsville City Council to improve public amenities for the Townsville 400 V8 Supercar event. |
Stadiums Queensland
Stadiums Queensland’s 2010-11 capital program reflects the investment required to develop, enhance and maintain Queensland’s major sports facilities to a standard appropriate for the conduct of national, international and community events.
Program Highlights
| • | | Stadiums Queensland’s 2010-11 capital program budget provides $100 million towards the redevelopment of the jointly funded Gold Coast Stadium at Carrara. The State Government has partnered with the Gold Coast City Council and the AFL to deliver additional funding towards the construction, which will include a permanent covered southern stand and the installation of solar panelling, bringing the total estimated cost to $144.2 million. |
| • | | $9.8 million towards a new Olympic standard swimming pool and Olympic standard BMX track at the Sleeman Sports Complex. |
| • | | $16.3 million to upgrade, maintain and replace facilities at Stadiums Queensland’s eight venues. |
| | | | | | | | | | | | | | | | | | | | |
| Communities | |
| | | | | |
Project | | Statistical
Division | | | Total
Estimated
Cost
$’000 | | | Expenditure
to 30-06-10
$’000 | | | Budget
2010-11
$’000 | | | Post
2010-11
$’000 | |
DEPARTMENT OF COMMUNITIES | | | | | | | | | | | | | | | | | | | | |
Property, Plant and Equipment | | | | | | | | | | | | | | | | | | | | |
Housing and Homelessness Services | | | | | | | | | | | | | | | | | | | | |
Construction | | | | | | | | | | | | | | | | | | | | |
Brisbane | | | 05 | | | | | | | | | | | | 141,351 | | | | Ongoing | |
Gold Coast | | | 07 | | | | | | | | | | | | 31,291 | | | | Ongoing | |
Sunshine Coast | | | 09 | | | | | | | | | | | | 9,900 | | | | Ongoing | |
West Moreton | | | 12 | | | | | | | | | | | | 1,630 | | | | Ongoing | |
Wide Bay-Burnett | | | 15 | | | | | | | | | | | | 43,098 | | | | Ongoing | |
Darling Downs | | | 20 | | | | | | | | | | | | 17,986 | | | | Ongoing | |
Fitzroy | | | 30 | | | | | | | | | | | | 22,160 | | | | Ongoing | |
Mackay | | | 40 | | | | | | | | | | | | 16,602 | | | | Ongoing | |
Northern | | | 45 | | | | | | | | | | | | 49,664 | | | | Ongoing | |
Far North | | | 50 | | | | | | | | | | | | 48,587 | | | | Ongoing | |
North West | | | 55 | | | | | | | | | | | | 5,934 | | | | Ongoing | |
Various | | | Various | | | | | | | | | | | | 141,726 | | | | Ongoing | |
| | | | | | | | | | | | | | | | | | | | |
Sub-total Construction | | | | | | | | | | | | | | | 529,929 | | | | | |
| | | | | | | | | | | | | | | | | | | | |
| | | | |
| | Capital Statement 2010-11 | | 25 |
| | | | | | | | | | | | | | | | | | | | |
| Communities | |
| | | | | |
Project | | Statistical
Division | | | Total
Estimated
Cost
$’000 | | | Expenditure
to 30-06-10
$’000 | | | Budget
2010-11
$’000 | | | Post
2010-11
$’000 | |
Capital Works on Existing Dwellings | | | | | | | | | | | | | | | | | | | | |
Brisbane | | | 05 | | | | | | | | | | | | 47,560 | | | | Ongoing | |
Gold Coast | | | 07 | | | | | | | | | | | | 7,318 | | | | Ongoing | |
Sunshine Coast | | | 09 | | | | | | | | | | | | 4,309 | | | | Ongoing | |
West Moreton | | | 12 | | | | | | | | | | | | 493 | | | | Ongoing | |
Wide Bay-Burnett | | | 15 | | | | | | | | | | | | 6,100 | | | | Ongoing | |
Darling Downs | | | 20 | | | | | | | | | | | | 3,283 | | | | Ongoing | |
South West | | | 25 | | | | | | | | | | | | 1,001 | | | | Ongoing | |
Fitzroy | | | 30 | | | | | | | | | | | | 5,014 | | | | Ongoing | |
Central West | | | 35 | | | | | | | | | | | | 493 | | | | Ongoing | |
Mackay | | | 40 | | | | | | | | | | | | 3,360 | | | | Ongoing | |
Northern | | | 45 | | | | | | | | | | | | 5,615 | | | | Ongoing | |
Far North | | | 50 | | | | | | | | | | | | 6,235 | | | | Ongoing | |
North West | | | 55 | | | | | | | | | | | | 1,707 | | | | Ongoing | |
Various | | | Various | | | | | | | | | | | | 33,242 | | | | Ongoing | |
| | | | | | | | | | | | | | | | | | | | |
Sub-total Capital Works on Existing Dwellings | | | | | | | | | | | | | | | 125,730 | | | | | |
| | | | | | | | | | | | | | | | | | | | |
Land Purchase and Improvement of Land | | | Various | | | | | | | | | | | | 23,798 | | | | Ongoing | |
Purchase of Existing Properties | | | Various | | | | | | | | | | | | 54,000 | | | | Ongoing | |
Investment | | | Various | | | | | | | | | | | | 200 | | | | Ongoing | |
| | | | | | | | | | | | | | | | | | | | |
Sub-total Housing and Homelessness Services | | | | | | | | | | | | | | | 733,657 | | | | | |
| | | | | | | | | | | | | | | | | | | | |
Community and Youth Justice Services | | | | | | | | | | | | | | | | | | | | |
Youth Development and Youth Justice Services | | | | | | | | | | | | | | | | | | | | |
Cleveland Youth Detention Centre - Expansion | | | 45 | | | | 170,670 | | | | 37,001 | | | | 83,033 | | | | 50,636 | |
Northern Outlook | | | 50 | | | | 5,996 | | | | 3,057 | | | | 618 | | | | 2,321 | |
Other Youth Development & Youth Justice | | | Various | | | | 64,892 | | | | 49,484 | | | | 808 | | | | 14,600 | |
Multi Purpose and Neighbourhood Community Centres | | | Various | | | | 46,927 | | | | 20,062 | | | | 5,986 | | | | 20,879 | |
Other Capital Works | | | Various | | | | | | | | | | | | 5,340 | | | | Ongoing | |
| | | | | | | | | | | | | | | | | | | | |
Sub-total Community and Youth Justice Services | | | | | | | | | | | | | | | 95,785 | | | | | |
| | | | | | | | | | | | | | | | | | | | |
Child Safety Services | | | | | | | | | | | | | | | | | | | | |
Residential care facilities | | | Various | | | | 30,553 | | | | 7,855 | | | | 7,936 | | | | 14,762 | |
Therapeutic residential care facilities | | | Various | | | | 8,965 | | | | 5,923 | | | | 2,042 | | | | 1,000 | |
Services for Indigenous Communities | | | Various | | | | 24,366 | | | | 9,421 | | | | 1,859 | | | | 13,086 | |
| | | | | | | | | | | | | | | | | | | | |
Sub-total Child Safety Services | | | | | | | | | | | | | | | 11,837 | | | | | |
| | | | | | | | | | | | | | | | | | | | |
| | | | |
| 26 | | Capital Statement 2010-11 | | |
| | | | | | | | | | | | | | | | | | | | |
| Communities | |
| | | | | |
Project | | Statistical
Division | | | Total
Estimated
Cost
$’000 | | | Expenditure
to 30-06-10
$’000 | | | Budget
2010-11
$’000 | | | Post
2010-11
$’000 | |
Disability and Community Care Services | | | | | | | | | | | | | | | | | | | | |
Community Mental Health | | | Various | | | | 6,840 | | | | 3,140 | | | | 660 | | | | 3,040 | |
Younger People in Residential Aged Care | | | Various | | | | 1,800 | | | | 361 | | | | 452 | | | | 987 | |
Other Residential Accommodation | | | Various | | | | 16,745 | | | | 2,915 | | | | 10,441 | | | | 3,389 | |
Respite Services | | | Various | | | | 2,810 | | | | 896 | | | | 1,914 | | | | | |
Positive Futures Accommodation | | | Various | | | | 47,368 | | | | 10,775 | | | | 17,393 | | | | 19,200 | |
Wacol Infrastructure Redevelopment | | | 05 | | | | 13,732 | | | | 942 | | | | 5,600 | | | | 7,190 | |
Fire Safety Upgrades | | | Various | | | | 1,247 | | | | 1,128 | | | | 119 | | | | | |
Other Capital Works | | | Various | | | | | | | | | | | | 3,355 | | | | Ongoing | |
| | | | | | | | | | | | | | | | | | | | |
Sub-total Disability and Community Care Services | | | | | | | | | | | | | | | 39,934 | | | | | |
| | | | | | | | | | | | | | | | | | | | |
Sport and Recreation Services | | | | | | | | | | | | | | | | | | | | |
Recreation Program / Sports Houses | | | Various | | | | | | | | | | | | 4,677 | | | | Ongoing | |
| | | | | | | | | | | | | | | | | | | | |
Sub-total Sport and Recreation Services | | | | | | | | | | | | | | | 4,677 | | | | | |
| | | | | | | | | | | | | | | | | | | | |
Office Accommodation | | | Various | | | | | | | | | | | | 7,600 | | | | Ongoing | |
Other acquisitions of property plant and equipment | | | Various | | | | | | | | | | | | 8,600 | | | | Ongoing | |
| | | | | | | | | | | | | | | | | | | | |
Total Property, Plant and Equipment | | | | | | | | | | | | | | | 902,090 | | | | | |
| | | | | | | | | | | | | | | | | | | | |
Other Capital Expenditure | | | | | | | | | | | | | | | | | | | | |
Disability Information System (DISQIS Project/Growing Stronger) | | | Various | | | | 37,462 | | | | 26,323 | | | | 6,806 | | | | 4,333 | |
Integrated Client Management System (ICMS) | | | Various | | | | 77,167 | | | | 57,985 | | | | 11,182 | | | | 8,000 | |
Other Information Systems Development | | | Various | | | | | | | | | | | | 11,254 | | | | Ongoing | |
| | | | | | | | | | | | | | | | | | | | |
Total Other Capital Expenditure | | | | | | | | | | | | | | | 29,242 | | | | | |
| | | | | | | | | | | | | | | | | | | | |
Capital Grants | | | | | | | | | | | | | | | | | | | | |
Housing and Homelessness Services | | | | | | | | | | | | | | | | | | | | |
Brisbane | | | 05 | | | | | | | | | | | | 88,942 | | | | Ongoing | |
Gold Coast | | | 07 | | | | | | | | | | | | 37,244 | | | | Ongoing | |
Sunshine Coast | | | 09 | | | | | | | | | | | | 13,969 | | | | Ongoing | |
West Moreton | | | 12 | | | | | | | | | | | | 1,691 | | | | Ongoing | |
Wide Bay-Burnett | | | 15 | | | | | | | | | | | | 7,909 | | | | Ongoing | |
| | | | |
| | Capital Statement 2010-11 | | 27 |
| | | | | | | | | | | | | | | | | | | | |
| Communities | |
| | | | | |
Project | | Statistical
Division | | | Total
Estimated
Cost
$’000 | | | Expenditure
to 30-06-10
$’000 | | | Budget
2010-11
$’000 | | | Post
2010-11
$’000 | |
Darling Downs | | | 20 | | | | | | | | | | | | 5,394 | | | | Ongoing | |
South West | | | 25 | | | | | | | | | | | | 2,140 | | | | Ongoing | |
Fitzroy | | | 30 | | | | | | | | | | | | 18,140 | | | | Ongoing | |
Central West | | | 35 | | | | | | | | | | | | 2,073 | | | | Ongoing | |
Mackay | | | 40 | | | | | | | | | | | | 5,574 | | | | Ongoing | |
Northern | | | 45 | | | | | | | | | | | | 32,198 | | | | Ongoing | |
Far North | | | 50 | | | | | | | | | | | | 104,669 | | | | Ongoing | |
North West | | | 55 | | | | | | | | | | | | 17,997 | | | | Ongoing | |
Various | | | Various | | | | | | | | | | | | 14,389 | | | | Ongoing | |
| | | | | | | | | | | | | | | | | | | | |
Sub-total Housing and Homelessness Services | | | | | | | | | | | | | | | 352,329 | | | | | |
| | | | | | | | | | | | | | | | | | | | |
Community and Youth Justice Services | | | | | | | | | | | | | | | | | | | | |
Neighbourhood Centre | | | Various | | | | 3,975 | | | | 600 | | | | 1,425 | | | | 1,950 | |
Multi-Tenant Service Centre | | | Various | | | | 2,600 | | | | 210 | | | | 2,390 | | | | | |
Community Facilities Upgrade | | | Various | | | | 200 | | | | 190 | | | | 10 | | | | | |
Sustainable Resource Communities | | | | | | | | | | | | | | | | | | | | |
Chinchilla Youth Centre | | | 20 | | | | 2,600 | | | | | | | | 2,600 | | | | | |
Moranbah Youth Centre | | | 40 | | | | 3,000 | | | | | | | | 3,000 | | | | | |
Moura Youth Centre | | | 30 | | | | 500 | | | | 100 | | | | 400 | | | | | |
| | | | | | | | | | | | | | | | | | | | |
Sub-total Community and Youth Justice Services | | | | | | | | | | | | | | | 9,825 | | | | | |
| | | | | | | | | | | | | | | | | | | | |
Disability and Community Care Services | | | | | | | | | | | | | | | | | | | | |
All Abilities Playground | | | Various | | | | 4,600 | | | | 2,660 | | | | 1,940 | | | | | |
Younger People in Residential Aged Care | | | Various | | | | 4,596 | | | | 3,796 | | | | 800 | | | | | |
Strengthening NGOs | | | Various | | | | | | | | | | | | 4,400 | | | | Ongoing | |
Purpose Design Housing | | | Various | | | | 4,100 | | | | 278 | | | | 3,822 | | | | | |
Home and Community Care | | | Various | | | | | | | | | | | | 7,000 | | | | Ongoing | |
Disability Assistance Package | | | Various | | | | 17,110 | | | | 3,608 | | | | 9,302 | | | | 4,200 | |
Other Capital Grants | | | Various | | | | | | | | | | | | 4,263 | | | | Ongoing | |
| | | | | | | | | | | | | | | | | | | | |
Sub-total Disability and Community Care Services | | | | | | | | | | | | | | | 31,527 | | | | | |
| | | | | | | | | | | | | | | | | | | | |
Sport and Recreation Services | | | | | | | | | | | | | | | | | | | | |
Local Sport and Recreation Program | | | Various | | | | 340 | | | | | | | | 340 | | | | | |
Major Facilities Program | | | Various | | | | 22,500 | | | | | | | | 22,500 | | | | | |
Minor Facilities Program | | | Various | | | | 208 | | | | | | | | 208 | | | | | |
Qld Lifestyle Trailbikes Program | | | Various | | | | 105 | | | | 80 | | | | 25 | | | | | |
Regional Tennis Facilities Program | | | Various | | | | 8,789 | | | | 6,203 | | | | 2,586 | | | | | |
Sport and Recreation Infrastructure Program | | | Various | | | | | | | | | | | | 7,500 | | | | Ongoing | |
Sustainable Resource Communities Dalby Aquatic Centre | | | 20 | | | | 4,600 | | | | | | | | 3,000 | | | | 1,600 | |
| | | | |
| 28 | | Capital Statement 2010-11 | | |
| | | | | | | | | | | | | | | | | | | | |
| Communities | |
| | | | | |
Project | | Statistical
Division | | | Total
Estimated
Cost
$’000 | | | Expenditure
to 30-06-10
$’000 | | | Budget
2010-11
$’000 | | | Post
2010-11
$’000 | |
Central Highlands Driver Facility | | | 30 | | | | 2,000 | | | | 1,000 | | | | 1,000 | | | | | |
Townsville 400 - Capital Improvements | | | 55 | | | | 1,050 | | | | 420 | | | | 630 | | | | | |
Various Capital Grants | | | Various | | | | | | | | | | | | 2,323 | | | | Ongoing | |
| | | | | | | | | | | | | | | | | | | | |
Sub-total Sport and Recreation Services | | | | | | | | | | | | | | | 40,112 | | | | | |
| | | | | | | | | | | | | | | | | | | | |
Total Capital Grants | | | | | | | | | | | | | | | 433,793 | | | | | |
| | | | | | | | | | | | | | | | | | | | |
TOTAL DEPARTMENT OF COMMUNITIES | | | | | | | | | | | | | | | 1,365,125 | | | | | |
| | | | | | | | | | | | | | | | | | | | |
STADIUMS QUEENSLAND | | | | | | | | | | | | | | | | | | | | |
Property, Plant and Equipment | | | | | | | | | | | | | | | | | | | | |
Gold Coast Stadium | | | 07 | | | | 144,200 | | | | 39,200 | | | | 100,000 | | | | 5,000 | |
Sleeman Sport Complex | | | 05 | | | | 10,000 | | | | 250 | | | | 9,750 | | | | | |
Capital Enhancements, Maintenance and Equipment | | | Various | | | | | | | | | | | | 16,300 | | | | Ongoing | |
| | | | | | | | | | | | | | | | | | | | |
Total Property, Plant and Equipment | | | | | | | | | | | | | | | 126,050 | | | | | |
| | | | | | | | | | | | | | | | | | | | |
TOTAL STADIUMS QUEENSLAND | | | | | | | | | | | | | | | 126,050 | | | | | |
| | | | | | | | | | | | | | | | | | | | |
COMMISSION FOR CHILDREN AND YOUNG PEOPLE AND CHILD GUARDIAN | | | | | | | | | | | | | | | | | | | | |
Property, Plant and Equipment | | | | | | | | | | | | | | | | | | | | |
Asset replacement program | | | 05 | | | | | | | | | | | | 150 | | | | Ongoing | |
| | | | | | | | | | | | | | | | | | | | |
Total Property, Plant and Equipment | | | | | | | | | | | | | | | 150 | | | | | |
| | | | | | | | | | | | | | | | | | | | |
TOTAL COMMISSION FOR CHILDREN AND YOUNG PEOPLE AND CHILD GUARDIAN | | | | | | | | | | | | | | | 150 | | | | | |
| | | | | | | | | | | | | | | | | | | | |
TOTAL COMMUNITIES | | | | | | | | | | | | | | | 1,491,325 | | | | | |
| | | | | | | | | | | | | | | | | | | | |
| | | | |
| | Capital Statement 2010-11 | | 29 |
COMMUNITY SAFETY
The department’s 2010-11 capital program will invest $303.5 million in capital acquisitions and grants to ensure essential services to minimise the risk and impact of accidents, emergencies and disasters; and for an expanded correctional centre infrastructure to plan for the future. These initiatives link to the Government’s outcome of enhancing community safety.
The major features of this program include a substantial investment in: the South Queensland Correctional Precinct at Gatton; the expansion and redevelopment of Lotus Glen Correctional Centre in Far North Queensland; and the construction of the Queensland Emergency Operations Centre at Kedron to enable more effective management of large scale emergencies and disasters in Queensland.
Program Highlights
| • | | $168.6 million to continue construction of the new $485.6 million first stage of the development of the South Queensland Correctional Precinct at Gatton and the $442.8 million expansion and redevelopment of the Lotus Glen Correctional Centre. |
| • | | $20.1 million (as part of a total allocation of $71.1 million) to complete the construction of the Queensland Emergency Operations Centre at Kedron. The investment also involves upgrading and replacement of radio and information and communications technology (ICT). |
| • | | Total outlay of $51.8 million is provided for new ambulance facilities, vehicles, operational equipment, and ICT improvements, and $33.6 million is provided for fire facilities, urban and rural fire appliances, and operational equipment and ICT improvements. |
| • | | Six new ambulance stations at Ashgrove/The Gap, Coomera, Ningi, Pinjarra Hills, Springfield, and North Lakes, and 14 replacement, redeveloped or refurbished ambulance facilities will be commenced, progressed or completed during 2010-11, with $0.9 million for staff housing in the Surat and Bowen Basins. |
| • | | $18.5 million is allocated for the commissioning of 165 new or replacement ambulance vehicles to ensure the ambulance fleet continues to be maintained at the highest possible level and for additional vehicles to meet increasing community needs. |
| • | | Complete construction of a new fire and rescue station at Agnes Water and a new service through the construction of new fire stations at Ripley and Brassall to replace the existing Ipswich fire station. |
| | | | |
| 30 | | Capital Statement 2010-11 | | |
| • | | Seven replacement or redeveloped fire stations and a training facility at Dysart will be completed or commenced during 2010-11. |
| • | | $10.9 million is allocated for 23 new or replacement urban fire appliances to support service delivery, while $4.4 million is invested in 25 new or replacement rural fire appliances. |
| • | | $1.7 million is allocated to ambulance services and $1.2 million to fire and rescue services for strategic land purchases. |
| • | | $0.2 million is provided to commence design for the $7 million Spring Hill complex and ambulance station redevelopment. |
| • | | $1.2 million is provided for ongoing improvements at Queensland Combined Emergency Services Academy at Lytton. |
| • | | $12.6 million is provided for acquisitions of Queensland Corrective Services property, plant and equipment. |
| • | | A total of $6.3 million is provided for post occupancy works following the completion of four major prison infrastructure projects in Wacol and Townsville. |
| • | | A combined total of $1.2 million is provided for the upgrade and expansion of Probation and Parole services throughout the State. |
| • | | $1.1 million is allocated for the purchase of a disaster management warehouse in North Queensland to ensure rapid and reliable deployment of high volumes of essential supplies to local communities to assist in response or recovery situations. |
| • | | $3.2 million is provided for the ongoing maintenance of the Townsville based Bell 412 helicopter. |
| | | | |
| | Capital Statement 2010-11 | | 31 |
Community Safety
| | | | | | | | | | | | | | | | | | | | |
Project | | Statistical
Division | | | Total
Estimated
Cost
$’000 | | | Expenditure
to 30-06-10
$’000 | | | Budget
2010-11 $’000 | | | Post 2010-11 $’000 | |
DEPARTMENT OF COMMUNITY SAFETY | | | | | | | | | | | | | | | | | | | | |
| | | | | |
Property, Plant and Equipment | | | | | | | | | | | | | | | | | | | | |
QUEENSLAND AMBULANCE SERVICE | | | | | | | | | | | | | | | | | | | | |
Building/General Works | | | | | | | | | | | | | | | | | | | | |
Ashgrove/The Gap new station | | | 05 | | | | 2,000 | | | | 1,051 | | | | 949 | | | | | |
Biggenden replacement station | | | 15 | | | | 1,300 | | | | 200 | | | | 550 | | | | 550 | |
Chermside station refurbishment | | | 05 | | | | 2,400 | | | | 200 | | | | 2,200 | | | | | |
Coomera new station | | | 07 | | | | 2,100 | | | | | | | | 300 | | | | 1,800 | |
Gayndah replacement station | | | 15 | | | | 1,300 | | | | | | | | 300 | | | | 1,000 | |
Gladstone replacement station | | | 30 | | | | 2,400 | | | | | | | | 300 | | | | 2,100 | |
Gordonvale replacement station | | | 50 | | | | 2,000 | | | | 100 | | | | 1,900 | | | | | |
Ipswich replacement station | | | 05 | | | | 4,600 | | | | 2,334 | | | | 2,266 | | | | | |
Jimboomba replacement station | | | 05 | | | | 1,800 | | | | 200 | | | | 1,600 | | | | | |
Moranbah station refurbishment | | | 40 | | | | 700 | | | | 600 | | | | 100 | | | | | |
Ningi new station | | | 05 | | | | 2,000 | | | | | | | | 300 | | | | 1,700 | |
Normanton replacement station | | | 55 | | | | 1,600 | | | | | | | | 300 | | | | 1,300 | |
North Lakes new station | | | 05 | | | | 3,500 | | | | | | | | 500 | | | | 3,000 | |
Pinjarra Hills new station | | | 05 | | | | 2,200 | | | | | | | | 300 | | | | 1,900 | |
Ravenshoe replacement station | | | 50 | | | | 1,100 | | | | 200 | | | | 900 | | | | | |
Runaway Bay replacement station | | | 07 | | | | 1,900 | | | | 1,050 | | | | 850 | | | | | |
South Mackay station redevelopment | | | 40 | | | | 1,000 | | | | | | | | 1,000 | | | | | |
Springfield new station | | | 05 | | | | 2,249 | | | | 1,420 | | | | 829 | | | | | |
Staff housing in the Surat and Bowen Basins | | | 40 | | | | 5,800 | | | | | | | | 850 | | | | 4,950 | |
Stanthorpe replacement station | | | 20 | | | | 1,300 | | | | 500 | | | | 800 | | | | | |
Winton replacement station | | | 35 | | | | 1,600 | | | | 200 | | | | 700 | | | | 700 | |
Minor works | | | Various | | | | | | | | | | | | 3,000 | | | | Ongoing | |
Land | | | | | | | | | | | | | | | | | | | | |
Strategic land acquisitions | | | Various | | | | | | | | | | | | 1,725 | | | | Ongoing | |
Other Plant and Equipment | | | | | | | | | | | | | | | | | | | | |
Ambulance vehicle purchases | | | Various | | | | 37,800 | | | | | | | | 18,500 | | | | 19,300 | |
Operational and communications equipment | | | Various | | | | | | | | | | | | 6,105 | | | | Ongoing | |
| | | | | | | | | | | | | | | | | | | | |
Sub-total QUEENSLAND AMBULANCE SERVICE | | | | | | | | | | | | | | | 47,124 | | | | | |
| | | | | | | | | | | | | | | | | | | | |
| | | | |
| 32 | | Capital Statement 2010-11 | | |
Community Safety
| | | | | | | | | | | | | | | | | | | | |
Project | | Statistical
Division | | | Total Estimated
Cost $’000 | | | Expenditure
to 30-06-10
$’000 | | | Budget
2010-11 $’000 | | | Post 2010-11 $’000 | |
QUEENSLAND CORRECTIVE SERVICES | | | | | | | | | | | | | | | | | | | | |
Expansion and redevelopment of Lotus Glen Correctional Centre | | | 50 | | | | 442,780 | | | | 205,989 | | | | 88,384 | | | | 148,407 | |
South Queensland Correctional Precinct at Gatton, first stage | | | 12 | | | | 485,648 | | | | 266,791 | | | | 80,190 | | | | 138,667 | |
Completed prison infrastructure - post occupancy works | | | Various | | | | 6,299 | | | | | | | | 6,299 | | | | | |
Accommodation for offenders under DPSOA | | | Various | | | | 1,400 | | | | 1,000 | | | | 400 | | | | | |
Probation and Parole in Indigenous communities | | | Various | | | | 1,500 | | | | 722 | | | | 778 | | | | | |
Probation and Parole office accomodation | | | Various | | | | | | | | | | | | 450 | | | | Ongoing | |
Other acquisitions of property, plant and equipment | | | Various | | | | | | | | | | | | 12,556 | | | | Ongoing | |
| | | | | | | | | | | | | | | | | | | | |
Sub-total QUEENSLAND CORRECTIVE SERVICES | | | | | | | | | | | | | | | 189,057 | | | | | |
| | | | | | | | | | | | | | | | | | | | |
| | | | | |
QUEENSLAND FIRE AND RESCUE SERVICE | | | | | | | | | | | | | | | | | | | | |
Building/General Works | | | | | | | | | | | | | | | | | | | | |
Agnes Water new station | | | 15 | | | | 1,238 | | | | 300 | | | | 938 | | | | | |
Brassall new station | | | 05 | | | | 3,000 | | | | | | | | 800 | | | | 2,200 | |
Cherbourg replacement auxiliary station | | | 15 | | | | 900 | | | | | | | | 400 | | | | 500 | |
Clermont replacement auxiliary station | | | 40 | | | | 1,200 | | | | | | | | 200 | | | | 1,000 | |
Craignish replacement auxiliary station | | | 15 | | | | 1,400 | | | | | | | | 600 | | | | 800 | |
Dysart training props and simulations | | | 40 | | | | 350 | | | | | | | | 350 | | | | | |
Emerald replacement permanent-auxiliary station | | | 30 | | | | 2,800 | | | | | | | | 200 | | | | 2,600 | |
Noosa station redevelopment | | | 09 | | | | 1,000 | | | | | | | | 500 | | | | 500 | |
Pullenvale replacement station | | | 05 | | | | 2,980 | | | | 905 | | | | 2,075 | | | | | |
Ripley replacement station | | | 05 | | | | 3,700 | | | | | | | | 800 | | | | 2,900 | |
Toowoomba Kitchener Street replacement station | | | 20 | | | | 2,486 | | | | 1,069 | | | | 1,417 | | | | | |
Minor works | | | Various | | | | | | | | | | | | 1,354 | | | | Ongoing | |
Land | | | | | | | | | | | | | | | | | | | | |
Strategic land acquisitions | | | Various | | | | | | | | | | | | 1,220 | | | | Ongoing | |
Rural Operations land purchase | | | Various | | | | | | | | | | | | 100 | | | | Ongoing | |
| | | | |
| | Capital Statement 2010-11 | | 33 |
Community Safety
| | | | | | | | | | | | | | | | | | | | |
Project | | Statistical
Division | | | Total
Estimated
Cost
$’000 | | | Expenditure to 30-06-10
$’000 | | | Budget
2010-11
$’000 | | | Post
2010-11
$’000 | |
Other Plant and Equipment | | | Various | | | | | | | | | | | | 2,105 | | | | Ongoing | |
Operational and communications equipment | | | | | | | | | | | | | | | | | | | | |
Rural fire appliances | | | Various | | | | | | | | | | | | 4,423 | | | | Ongoing | |
Urban fire appliances | | | Various | | | | | | | | | | | | 10,903 | | | | Ongoing | |
| | | | | | | | | | | | | | | | | | | | |
Sub-total QUEENSLAND FIRE AND RESCUE SERVICE | | | | | | | | | | | | | | | 28,385 | | | | | |
| | | | | | | | | | | | | | | | | | | | |
| | | | | |
EMERGENCY MANAGEMENT QUEENSLAND | | | | | | | | | | | | | | | | | | | | |
Building/General Works | | | | | | | | | | | | | | | | | | | | |
Disaster management warehouses and caches | | | Various | | | | 2,470 | | | | 1,400 | | | | 1,070 | | | | | |
Other Plant and Equipment | | | 45 | | | | 5,941 | | | | 2,787 | | | | 3,154 | | | | | |
Bell 412 helicopter 10,000 hour inspection and overhaul | | | | | | | | | | | | | | | | | | | | |
Other plant and equipment | | | Various | | | | | | | | | | | | 1,265 | | | | Ongoing | |
| | | | | | | | | | | | | | | | | | | | |
Sub-total EMERGENCY MANAGEMENT QUEENSLAND | | | | | | | | | | | | | | | 5,489 | | | | | |
| | | | | | | | | | | | | | | | | | | | |
| | | | | |
JOINT EMERGENCY SERVICE FACILITIES | | | | | | | | | | | | | | | | | | | | |
Queensland Combined Emergency Services Academy - improvements | | | 05 | | | | | | | | | | | | 1,150 | | | | Ongoing | |
Queensland Emergency Operations Centre | | | 05 | | | | 71,085 | | | | 48,481 | | | | 20,104 | | | | 2,500 | |
Spring Hill complex and ambulance station redevelopment | | | 05 | | | | 7,032 | | | | | | | | 200 | | | | 6,832 | |
| | | | | | | | | | | | | | | | | | | | |
Sub-total JOINT EMERGENCY SERVICE FACILITIES | | | | | | | | | | | | | | | 21,454 | | | | | |
| | | | | | | | | | | | | | | | | | | | |
| | | | | |
OTHER DEPARTMENTAL | | | | | | | | | | | | | | | | | | | | |
Minor works | | | 05 | | | | | | | | | | | | 250 | | | | Ongoing | |
| | | | | | | | | | | | | | | | | | | | |
Sub-total OTHER DEPARTMENTAL | | | | | | | | | | | | | | | 250 | | | | | |
| | | | | | | | | | | | | | | | | | | | |
| | | | | |
Total Property, Plant and Equipment | | | | | | | | | | | | | | | 291,759 | | | | | |
| | | | | | | | | | | | | | | | | | | | |
| | | | | |
Other Capital Expenditure | | | | | | | | | | | | | | | | | | | | |
QUEENSLAND AMBULANCE SERVICE | | | | | | | | | | | | | | | | | | | | |
Information systems development | | | Various | | | | | | | | | | | | 4,632 | | | | Ongoing | |
QUEENSLAND CORRECTIVE SERVICES | | | | | | | | | | | | | | | | | | | | |
IOMS capital upgrade | | | 05 | | | | 14,600 | | | | 14,180 | | | | 420 | | | | | |
QUEENSLAND FIRE AND RESCUE SERVICE | | | | | | | | | | | | | | | | | | | | |
Information systems development | | | Various | | | | | | | | | | | | 5,049 | | | | Ongoing | |
| | | | |
| 34 | | Capital Statement 2010-11 | | |
Community Safety
| | | | | | | | | | | | | | | | | | | | |
Project | | Statistical
Division | | | Total Estimated
Cost
$’000 | | | Expenditure
to 30-06-10 $’000 | | | Budget
2010-11 $’000 | | | Post 2010-11 $’000 | |
OTHER DEPARTMENTAL | | | | | | | | | | | | | | | | | | | | |
Information systems development | | | Various | | | | | | | | | | | | 345 | | | | Ongoing | |
| | | | | | | | | | | | | | | | | | | | |
Total Other Capital Expenditure | | | | | | | | | | | | | | | 10,446 | | | | | |
| | | | | | | | | | | | | | | | | | | | |
| | | | | |
Capital Grants | | | | | | | | | | | | | | | | | | | | |
Rural fire brigades | | | Various | | | | | | | | | | | | 150 | | | | Ongoing | |
State Emergency Service units | | | Various | | | | | | | | | | | | 1,124 | | | | Ongoing | |
| | | | | | | | | | | | | | | | | | | | |
Total Capital Grants | | | | | | | | | | | | | | | 1,274 | | | | | |
| | | | | | | | | | | | | | | | | | | | |
| | | | | |
TOTAL DEPARTMENT OF COMMUNITY SAFETY | | | | | | | | | | | | | | | 303,479 | | | | | |
| | | | | | | | | | | | | | | | | | | | |
| | | | |
| | Capital Statement 2010-11 | | 35 |
EDUCATION AND TRAINING
Total capital expenditure for the Department of Education and Training portfolio (including the Department of Education and Training and related entities) is $1.531 billion in 2010-11.
Education
The 2010-11 budget provides a substantial investment in educational facilities with an education capital works program of $1.24 billion (including an expensed component of $145.2 million). A further $71.1 million is funded under the SEQ Schools Public Private Partnership Project which will provide a further 3 new State Schools for the commencement of the 2011 academic year.
Education’s planning for capital works meets the Government’s priorities and needs by considering population growth and shifts and consequential impacts on enrolments, changes in educational standards and delivery methods, and addressing high priority needs such as student and staff health and safety.
Program Highlights
| • | | $703 million to deliver the Australian Government Building the Education Revolution. |
| • | | $135 million to construct two new schools, relocate two schools, undertake staged work at six schools, buy land, and to provide additional classrooms at existing schools in growth areas throughout the State. |
| • | | $95 million to replace and enhance facilities at existing schools. |
| • | | $207 million to complete the State Schools of Tomorrow program. |
| • | | $11 million to acquire new employee housing and refurbish existing housing stock. |
Training
The 2010-11 capital works program provides $133.3 million (including an expensed component of $19.6 million) towards the construction and refurbishment of TAFE training facilities.
Program Highlights
| • | | $36 million for continuing the development of SkillsTech Australia major trade and technician skills campus at Acacia Ridge in Brisbane. |
| • | | $24 million to continue the redevelopment of the Cairns campus of the Tropical North Queensland Institute of TAFE. |
| | | | |
| 36 | | Capital Statement 2010-11 | | |
| • | | $13 million for the new Coomera Education Precinct of the Gold Coast Institute of TAFE. |
| • | | $10 million for the development of a major trade and technician skills campus at Mackay. |
| • | | $6 million for the redevelopment of the Bundamba campus of The Bremer Institute of TAFE. |
Early Childhood Education and Care
The 2010-11 capital works program allocates $71.4 million towards early childhood education and care (including an expensed component of $4.3 million). Funding includes the bring forward of $21.9 million to 2010-11 to support the accelerated planning and delivery of Kindergarten services. The Government will open 12 kindergarten services on state school sites and partner with the non-state school sectors to open more services.
Program Highlights
| • | | $36 million to continue construction of kindergartens. |
| • | | $19 million for the construction of child and family centres. |
| • | | $7 million to construct early years centres. |
| • | | $6 million towards early childhood education centres. |
Southbank Institute of Technology
Continuing investment in Information and Communication Technology (ICT) to ensure our students and staff have an outstanding learning and work experience respectively.
Gold Coast Institute of TAFE
ICT program includes planned equipment replacement and new strategic systems. Minor Capital Works program includes refurbishments, air conditioning, signage and fire/security upgrades.
| | | | |
| | Capital Statement 2010-11 | | 37 |
Education and Training1,2,3,4,5,6
| | | | | | | | | | | | | | | | | | |
Project | | Statistical
Division | | Total
Estimated
Cost $’000 | | | Expenditure
to 30-06-10 $’000 | | | Budget
2010-11 $’000 | | | Post
2010-11 $’000 | |
DEPARTMENT OF EDUCATION AND TRAINING KEY TO ABBREVIATIONS | | | | | | | | | | | | | | | | | | |
GLA - General Learning Area | | | | | | | | | | | | | | | | | | |
GLAB - General Learning Area Block | | | | | | | | | | | | | | | | | | |
| | | | | |
Property, Plant and Equipment | | | | | | | | | | | | | | | | | | |
EDUCATION | | | | | | | | | | | | | | | | | | |
Aitkenvale State School, GLA Renewal | | 45 | | | 570 | | | | 57 | | | | 513 | | | | | |
Aldridge State High School, Science Laboratory Renewal | | 15 | | | 1,189 | | | | 541 | | | | 648 | | | | | |
Algester State School, GLA Renewal | | 05 | | | 334 | | | | | | | | 334 | | | | | |
Allenstown State School, GLA Renewal | | 30 | | | 816 | | | | 448 | | | | 368 | | | | | |
Atherton State High School, GLA Renewal | | 50 | | | 614 | | | | 61 | | | | 553 | | | | | |
Atherton State High School, Library Renewal | | 50 | | | 713 | | | | 106 | | | | 607 | | | | | |
Atherton State High School, Science Laboratory Renewal | | 50 | | | 560 | | | | 201 | | | | 359 | | | | | |
Atherton State High School, Tropical Tablelands Trade Training Centre | | 50 | | | 6,963 | | | | 1,694 | | | | 5,269 | | | | | |
Augathella State School, Air Conditioning Replacement and Electrical Upgrade | | 25 | | | 530 | | | | 159 | | | | 371 | | | | | |
Ayr East State School, GLA Renewal | | 45 | | | 854 | | | | 85 | | | | 769 | | | | | |
Bald Hills State School, GLA Renewal | | 05 | | | 557 | | | | | | | | 557 | | | | | |
Barkly Highway State School, Air Conditioning Replacement and Electrical Upgrade | | 55 | | | 2,412 | | | | 963 | | | | 1,449 | | | | | |
Beenleigh State High School, Gold Coast Construction School Industry Trade Centre | | 07 | | | 1,615 | | | | 1,235 | | | | 380 | | | | | |
Beenleigh State High School, Library Renewal | | 07 | | | 518 | | | | 201 | | | | 317 | | | | | |
Blackwater State High School, Air Conditioning Replacement and Electrical Upgrade | | 30 | | | 2,545 | | | | 1,004 | | | | 1,541 | | | | | |
| | | | |
| 38 | | Capital Statement 2010-11 | | |
Education and Training1,2,3,4,5,6
| | | | | | | | | | | | | | | | | | |
Project | | Statistical
Division | | Total
Estimated
Cost $’000 | | | Expenditure
to 30-06-10
$’000 | | | Budget
2010-11 $’000 | | | Post
2010-11 $’000 | |
Bli Bli State School, GLA Renewal | | 09 | | | 672 | | | | 369 | | | | 303 | | | | | |
Boonah State High School, Science Laboratory Renewal | | 12 | | | 740 | | | | 370 | | | | 370 | | | | | |
Boondall State School, GLA Renewal | | 05 | | | 334 | | | | | | | | 334 | | | | | |
Boulia State School, Air Conditioning Replacement and Electrical Upgrade | | 35 | | | 699 | | | | 306 | | | | 393 | | | | | |
Bremer State High School, Relocation | | 05 | | | 49,412 | | | | 11,561 | | | | 37,851 | | | | | |
Brisbane School of Distance Education, Relocation to Coorparoo Secondary College | | 05 | | | 24,000 | | | | 12,048 | | | | 11,952 | | | | | |
Brisbane State High School, Hale Street Mitigation Works | | 05 | | | 14,400 | | | | 14,064 | | | | 336 | | | | | |
Broadbeach State School, GLA Renewal | | 07 | | | 781 | | | | 78 | | | | 703 | | | | | |
Bundaberg North State High School, Science Laboratory Renewal | | 15 | | | 872 | | | | 79 | | | | 793 | | | | | |
Bundaberg State High School, Bundaberg Region Trade Training Centre | | 15 | | | 11,029 | | | | 618 | | | | 10,411 | | | | | |
Buranda State School, Mitigation Works | | 05 | | | 3,360 | | | | 672 | | | | 2,688 | | | | | |
Burleigh Heads State School, GLA Renewal | | 07 | | | 446 | | | | 44 | | | | 402 | | | | | |
Burnett State College, Library Renewal | | 15 | | | 560 | | | | 218 | | | | 342 | | | | | |
Bwgcolman Community School, Pre-Prep Facility | | 45 | | | 1,632 | | | | | | | | 1,632 | | | | | |
Caboolture Special School, GLAB - 4 Spaces | | 05 | | | 1,900 | | | | 380 | | | | 1,520 | | | | | |
Calen District State College, GLA Renewal | | 40 | | | 511 | | | | 51 | | | | 460 | | | | | |
Calliope State School, GLA Renewal | | 30 | | | 680 | | | | 281 | | | | 399 | | | | | |
Caloundra State High School, Sunshine Coast Technical Trade Training Centre | | 09 | | | 2,614 | | | | 86 | | | | 2,528 | | | | | |
| | | | |
| | Capital Statement 2010-11 | | 39 |
Education and Training1,2,3,4,5,6
| | | | | | | | | | | | | | | | | | |
Project | | Statistical
Division | | Total Estimated
Cost $’000 | | | Expenditure
to 30-06-10
$’000 | | | Budget
2010-11 $’000 | | | Post
2010-11 $’000 | |
Capalaba State College, GLA Renewal - Stage 2 | | 05 | | | 334 | | | | 28 | | | | 306 | | | | | |
Carole Park State School, Indoor Community Facility | | 05 | | | 1,344 | | | | 192 | | | | 1,152 | | | | | |
Cavendish Road State High School, Library Renewal | | 05 | | | 517 | | | | 77 | | | | 440 | | | | | |
Cavendish Road State High School, Science Laboratory Renewal | | 05 | | | 366 | | | | 36 | | | | 330 | | | | | |
Charleville School of Distance Education, Air Conditioning Replacement and Electrical Upgrade | | 25 | | | 629 | | | | 173 | | | | 456 | | | | | |
Charleville State High School, Air Conditioning Replacement and Electrical Upgrade | | 25 | | | 3,065 | | | | 1,152 | | | | 1,913 | | | | | |
Charleville State High School, Charleville Cluster Trade Training Centre | | 25 | | | 1,853 | | | | 1,171 | | | | 682 | | | | | |
Charleville State School, Air Conditioning Replacement and Electrical Upgrade | | 25 | | | 2,385 | | | | 902 | | | | 1,483 | | | | | |
Charters Towers State High School, Science Laboratory Renewal | | 45 | | | 468 | | | | 82 | | | | 386 | | | | | |
Cleveland Education and Training Centre, Furniture and Equipment | | 45 | | | 336 | | | | | | | | 336 | | | | | |
Cleveland State School, GLA Renewal | | 05 | | | 891 | | | | 89 | | | | 802 | | | | | |
Coombabah State High School, Science Laboratory Renewal | | 07 | | | 1,283 | | | | 576 | | | | 707 | | | | | |
Coorparoo Secondary College, Science Laboratory Renewal | | 05 | | | 1,744 | | | | 87 | | | | 1,657 | | | | | |
Corinda State High School, Science Laboratory Renewal | | 05 | | | 732 | | | | 73 | | | | 659 | | | | | |
Craigslea State High School, GLA Renewal | | 05 | | | 1,337 | | | | 225 | | | | 1,112 | | | | | |
Currimundi Special School, GLAB - 2 Storey | | 09 | | | 2,470 | | | | 2,090 | | | | 380 | | | | | |
| | | | |
| 40 | | Capital Statement 2010-11 | | |
Education and Training1,2,3,4,5,6
| | | | | | | | | | | | | | | | | | |
Project | | Statistical
Division | | Total Estimated
Cost $’000 | | | Expenditure
to 30-06-10 $’000 | | | Budget
2010-11 $’000 | | | Post
2010-11 $’000 | |
Currumbin State School, GLA Renewal | | 07 | | | 557 | | | | 83 | | | | 474 | | | | | |
Dalby State High School, Science Laboratory Renewal | | 20 | | | 1,203 | | | | 188 | | | | 1,015 | | | | | |
Dalby State High School, Surat Basin Trade Training Centre | | 20 | | | 3,912 | | | | 1,082 | | | | 2,830 | | | | | |
Denison State School, Air Conditioning Replacement and Electrical Upgrade | | 30 | | | 1,440 | | | | 528 | | | | 912 | | | | | |
Dysart State High School, Library Renewal | | 40 | | | 395 | | | | 94 | | | | 301 | | | | | |
Dysart State School, Air Conditioning Replacement and Electrical Upgrade | | 40 | | | 1,848 | | | | 581 | | | | 1,267 | | | | | |
Dysart State School, GLA Renewal | | 40 | | | 341 | | | | 34 | | | | 307 | | | | | |
Edge Hill State School, GLA Renewal | | 50 | | | 615 | | | | 31 | | | | 584 | | | | | |
Emerald North State School, Air Conditioning Replacement and Electrical Upgrade | | 30 | | | 1,440 | | | | 528 | | | | 912 | | | | | |
Emerald State High School, Air Conditioning Replacement and Electrical Upgrade | | 30 | | | 1,920 | | | | 768 | | | | 1,152 | | | | | |
Emerald State High School, Science Laboratory Renewal | | 30 | | | 993 | | | | 357 | | | | 636 | | | | | |
Emerald State School, Air Conditioning Replacement and Electrical Upgrade | | 30 | | | 1,440 | | | | 528 | | | | 912 | | | | | |
Everton Park State School, GLA Renewal | | 05 | | | 557 | | | | | | | | 557 | | | | | |
Federal State School, New School by Relocation | | 09 | | | 9,884 | | | | 3,237 | | | | 6,647 | | | | | |
Ferny Hills State School, GLA Renewal | | 05 | | | 446 | | | | 89 | | | | 357 | | | | | |
Garbutt State School, GLA Renewal | | 45 | | | 427 | | | | 42 | | | | 385 | | | | | |
Glenmore State High School, GLA Renewal | | 30 | | | 374 | | | | 37 | | | | 337 | | | | | |
Goodna Special School, Additional Classroom Accommodation | | 05 | | | 3,323 | | | | 2,375 | | | | 948 | | | | | |
| | | | |
| | Capital Statement 2010-11 | | 41 |
Education and Training1,2,3,4,5,6
| | | | | | | | | | | | | | | | | | |
Project | | Statistical
Division | | Total Estimated
Cost $’000 | | | Expenditure
to 30-06-10 $’000 | | | Budget
2010-11 $’000 | | | Post
2010-11 $’000 | |
| | | | | |
Greenlands State School, Additional Amenities | | 20 | | | 720 | | | | 240 | | | | 480 | | | | | |
Gympie West State School, GLA Renewal | | 15 | | | 482 | | | | 48 | | | | 434 | | | | | |
Harristown State High School, Library Renewal | | 20 | | | 567 | | | | 184 | | | | 383 | | | | | |
Healy State School, Air Conditioning Replacement and Electrical Upgrade | | 55 | | | 1,395 | | | | 514 | | | | 881 | | | | | |
Heatley Secondary College, School Industry Trade Centre | | 45 | | | 1,672 | | | | | | | | 1,672 | | | | | |
Helensvale State School, GLA Renewal | | 07 | | | 446 | | | | 44 | | | | 402 | | | | | |
Hervey Bay State High School, Additional Amenities | | 15 | | | 838 | | | | 276 | | | | 562 | | | | | |
Hervey Bay State High School, Science Laboratory Renewal | | 15 | | | 793 | | | | 356 | | | | 437 | | | | | |
Isis District State High School, Library Renewal | | 15 | | | 560 | | | | | | | | 560 | | | | | |
Jimboomba State School, GLA Renewal | | 05 | | | 446 | | | | 44 | | | | 402 | | | | | |
Kallangur State School, GLA Renewal | | 05 | | | 1,345 | | | | 134 | | | | 1,211 | | | | | |
Kedron State High School, GLA Renewal | | 05 | | | 446 | | | | 64 | | | | 382 | | | | | |
Kelvin Grove State College, GLA Renewal | | 05 | | | 334 | | | | | | | | 334 | | | | | |
Kenmore State High School, Stage 2 Redevelopment | | 05 | | | 6,124 | | | | 672 | | | | 5,452 | | | | | |
Kilcoy State High School, GLA Renewal | | 12 | | | 448 | | | | 131 | | | | 317 | | | | | |
Kingaroy State High School, South Burnett Trade Training Centre | | 15 | | | 3,997 | | | | 3,332 | | | | 665 | | | | | |
Kingston College, Science Laboratory Renewal | | 05 | | | 814 | | | | 293 | | | | 521 | | | | | |
Kirwan State High School, GLA Renewal | | 45 | | | 961 | | | | 315 | | | | 646 | | | | | |
Kirwan State High School, North Queensland Minerals and Energy Trade Training Centre | | 45 | | | 3,100 | | | | 105 | | | | 2,995 | | | | | |
| | | | |
| 42 | | Capital Statement 2010-11 | | |
Education and Training1,2,3,4,5,6
| | | | | | | | | | | | | | | | | | |
Project | | Statistical
Division | | Total Estimated
Cost $’000 | | | Expenditure
to 30-06-10
$’000 | | | Budget
2010-11 $’000 | | | Post
2010-11 $’000 | |
| | | | | |
Kirwan State High School, Science Laboratory Renewal | | 45 | | | 1,039 | | | | 374 | | | | 665 | | | | | |
Kuluin State School, Covered Sports Facility | | 09 | | | 515 | | | | 1 | | | | 514 | | | | | |
Laidley State High School, Science Laboratory Renewal | | 12 | | | 741 | | | | 407 | | | | 334 | | | | | |
Lockyer District State High School, Lockyer District Trade Training Centre | | 12 | | | 1,423 | | | | 871 | | | | 552 | | | | | |
Lockyer District State High School, Science Laboratory Renewal | | 12 | | | 601 | | | | 259 | | | | 342 | | | | | |
Loganlea State High School, Library Renewal | | 05 | | | 541 | | | | 200 | | | | 341 | | | | | |
Longreach State High School, Air Conditioning Replacement and Electrical Upgrade | | 35 | | | 1,746 | | | | 720 | | | | 1,026 | | | | | |
Longreach State High School, Outback Tourism Trade Training Centres | | 35 | | | 2,639 | | | | 895 | | | | 1,744 | | | | | |
Longreach State School, Air Conditioning Replacement and Electrical Upgrade | | 35 | | | 2,539 | | | | 816 | | | | 1,723 | | | | | |
Mackay North State High School, Mackay Technical College Trade Training Centre | | 40 | | | 5,691 | | | | 325 | | | | 5,366 | | | | | |
Mackay North State High School, School Industry Trade Centre | | 40 | | | 1,672 | | | | 32 | | | | 1,640 | | | | | |
Mackay North State High School, Science Laboratory Renewal | | 40 | | | 896 | | | | 89 | | | | 807 | | | | | |
Mackay State High School, Science Laboratory Renewal | | 40 | | | 896 | | | | 89 | | | | 807 | | | | | |
Malanda State High School, Science Laboratory Renewal | | 50 | | | 757 | | | | 75 | | | | 682 | | | | | |
Maleny State School, GLA Renewal | | 09 | | | 336 | | | | 17 | | | | 319 | | | | | |
Mareeba State School, GLA Renewal | | 50 | | | 768 | | | | 38 | | | | 730 | | | | | |
Maroochydore State High School, Coastal Cookery Trade Training Centre | | 09 | | | 2,371 | | | | 85 | | | | 2,286 | | | | | |
| | | | |
| | Capital Statement 2010-11 | | 43 |
Education and Training1,2,3,4,5,6
| | | | | | | | | | | | | | | | | | |
Project | | Statistical
Division | | Total Estimated
Cost $’000 | | | Expenditure
to 30-06-10
$’000 | | | Budget
2010-11 $’000 | | | Post
2010-11 $’000 | |
Marshall Road State School, GLA Renewal | | 05 | | | 891 | | | | 400 | | | | 491 | | | | | |
Maryborough State High School, Maryborough Trade Training Centre | | 15 | | | 4,264 | | | | 3,646 | | | | 618 | | | | | |
Maryborough State High School, Science Laboratory Renewal | | 15 | | | 792 | | | | | | | | 671 | | | | | |
Meridan State College, Stage 4 - Planning | | 09 | | | 950 | | | | 121 | | | | 950 | | | | | |
Merrimac State High School, Library Renewal | | 07 | | | 518 | | | | 78 | | | | 440 | | | | | |
Merrimac State High School, Replacement of Covered Links | | 07 | | | 1,115 | | | | 600 | | | | 515 | | | | | |
Miami State High School, Science Laboratory Renewal | | 07 | | | 1,017 | | | | 366 | | | | 651 | | | | | |
Miles State High School, Surat Basin Resources Trade Infrastructure Project | | 20 | | | 4,320 | | | | | | | | 4,320 | | | | | |
Milton State School, Additional Accommodation | | 05 | | | 1,425 | | | | 665 | | | | 760 | | | | | |
Mitchell State School, Air Conditioning Replacement and Electrical Upgrade | | 25 | | | 1,744 | | | | 715 | | | | 1,029 | | | | | |
Monto State High School, North Burnett Trade Training Centre | | 15 | | | 1,139 | | | | 44 | | | | 1,095 | | | | | |
Morayfield State High School, Morayfield Trade Training Centre | | 05 | | | 1,295 | | | | 948 | | | | 347 | | | | | |
Mount Gravatt State High School, Science Laboratory Renewal | | 05 | | | 813 | | | | 292 | | | | 521 | | | | | |
Mudgeeraba State School, GLA Renewal | | 07 | | | 446 | | | | 44 | | | | 402 | | | | | |
Nambour State High School, Science Laboratory Renewal - Stage 1 | | 09 | | | 368 | | | | 18 | | | | 350 | | | | | |
Nambour State School, GLA Renewal | | 09 | | | 672 | | | | 67 | | | | 605 | | | | | |
Narangba State School, GLA Renewal | | 05 | | | 448 | | | | 44 | | | | 404 | | | | | |
Nerang State High School, Library Renewal | | 07 | | | 518 | | | | 78 | | | | 440 | | | | | |
| | | | |
| 44 | | Capital Statement 2010-11 | | |
Education and Training1,2,3,4,5,6
| | | | | | | | | | | | | | | | | | |
Project | | Statistical
Division | | Total Estimated
Cost $’000 | | | Expenditure
to 30-06-10
$’000 | | | Budget
2010-11 $’000 | | | Post
2010-11 $’000 | |
Noosa District State High School, Science Laboratory Renewal | | 09 | | | 818 | | | | 294 | | | | 524 | | | | | |
North Lakes State College, Stage 8 Classroom Accommodation | | 05 | | | 9,025 | | | | 513 | | | | 8,512 | | | | | |
North Rockhampton State High School, GLA Renewal | | 30 | | | 1,259 | | | | 942 | | | | 317 | | | | | |
North Rockhampton State High School, Science Laboratory Renewal | | 30 | | | 671 | | | | 20 | | | | 651 | | | | | |
Northern Peninsula Area State College, Northern Peninsula Area Trade Training Centre | | 50 | | | 1,425 | | | | 52 | | | | 1,373 | | | | | |
Oakey State High School, The Inner Downs Trade Training Centre | | 20 | | | 1,716 | | | | 834 | | | | 882 | | | | | |
Ormeau Woods State High School, Stage 2 | | 07 | | | 13,001 | | | | 2,045 | | | | 10,956 | | | | | |
Palm Beach-Currumbin State High School, Additional Accommodation | | 07 | | | 1,425 | | | | 285 | | | | 1,140 | | | | | |
Palm Beach-Currumbin State High School, Palm Beach-Currumbin Cookery and Hospitality Trade Training Centre | | 07 | | | 2,850 | | | | 100 | | | | 2,750 | | | | | |
Palm Beach-Currumbin State High School, Science Laboratory Renewal | | 07 | | | 814 | | | | 293 | | | | 521 | | | | | |
Palmwoods State School, Administration Block and Conversion of Old Administration to GLAs | | 09 | | | 2,383 | | | | 1,243 | | | | 1,140 | | | | | |
Palmwoods State School, GLA Renewal - Stage 1 | | 09 | | | 448 | | | | | | | | 448 | | | | | |
Pimlico State High School, GLA Renewal | | 45 | | | 570 | | | | 146 | | | | 424 | | | | | |
Pimlico State High School, Science Laboratory Renewal | | 45 | | | 702 | | | | 179 | | | | 523 | | | | | |
Pormpuraaw State School, Pre-Prep Facility | | 50 | | | 1,609 | | | | 48 | | | | 1,561 | | | | | |
| | | | |
| | Capital Statement 2010-11 | | 45 |
Education and Training1,2,3,4,5,6
| | | | | | | | | | | | | | | | | | |
Project | | Statistical
Division | | Total Estimated
Cost $’000 | | | Expenditure
to 30-06-10
$’000 | | | Budget
2010-11 $’000 | | | Post
2010-11 $’000 | |
Redcliffe Special School, GLA Renewal | | 05 | | | 336 | | | | 33 | | | | 303 | | | | | |
Redcliffe State High School, GLA Renewal | | 05 | | | 448 | | | | 60 | | | | 388 | | | | | |
Redcliffe State High School, Science Laboratory Renewal | | 05 | | | 552 | | | | 71 | | | | 481 | | | | | |
Redland District Special School, GLA Renewal | | 05 | | | 446 | | | | 67 | | | | 379 | | | | | |
Redlynch State College, Stage 4 - Planning | | 50 | | | 950 | | | | | | | | 950 | | | | | |
Rochedale State High School, Rochedale-Springwood Corridor Trade Training Centre | | 05 | | | 1,311 | | | | 870 | | | | 441 | | | | | |
Rockhampton State High School, Rockhampton Trade Training Centre | | 30 | | | 1,425 | | | | 960 | | | | 465 | | | | | |
Roma State College - Senior Campus, Library Renewal | | 25 | | | 566 | | | | 253 | | | | 313 | | | | | |
Sandgate District State High School, Replacement Amenities Block | | 05 | | | 937 | | | | 437 | | | | 500 | | | | | |
Sandgate State School, GLA Renewal | | 05 | | | 445 | | | | 77 | | | | 368 | | | | | |
Scarborough State School, GLA Renewal | | 05 | | | 672 | | | | 302 | | | | 370 | | | | | |
Sherwood State School, GLA Renewal | | 05 | | | 668 | | | | 43 | | | | 625 | | | | | |
Smithfield State High School, Science Laboratory Renewal | | 50 | | | 1,010 | | | | 101 | | | | 909 | | | | | |
Spinifex State College - Mount Isa - Junior Campus, Library Renewal | | 55 | | | 661 | | | | 99 | | | | 562 | | | | | |
Spinifex State College - Mount Isa - Junior Campus, Science Laboratory Renewal | | 55 | | | 702 | | | | 70 | | | | 632 | | | | | |
Spinifex State College - Mount Isa - Senior Campus, North-West Queensland Trade Training Centre | | 55 | | | 4,273 | | | | 828 | | | | 3,445 | | | | | |
Springfield Central State School, New School | | 05 | | | 15,789 | | | | 2,853 | | | | 12,936 | | | | | |
| | | | |
| 46 | | Capital Statement 2010-11 | | |
Education and Training1,2,3,4,5,6
| | | | | | | | | | | | | | | | | | |
Project | | Statistical
Division | | Total Estimated
Cost $’000 | | | Expenditure
to 30-06-10
$’000 | | | Budget
2010-11 $’000 | | | Post
2010-11 $’000 | |
Springfield State High School, New School | | 05 | | | 28,574 | | | | 3,797 | | | | 24,777 | | | | | |
St George State High School, Science Laboratory Renewal | | 25 | | | 401 | | | | 45 | | | | 356 | | | | | |
Stafford State School, GLA Renewal | | 05 | | | 669 | | | | 107 | | | | 562 | | | | | |
Stanthorpe State High School, Granite Border College Trade Training Centre | | 20 | | | 3,921 | | | | 1,440 | | | | 2,481 | | | | | |
Stretton State College, Secondary - Staqe 3 | | 05 | | | 4,750 | | | | 508 | | | | 4,242 | | | | | |
Sunnybank Hills State School, GLA Renewal | | 05 | | | 334 | | | | 33 | | | | 301 | | | | | |
Sunnybank Special School, GLA Renewal | | 05 | | | 334 | | | | 33 | | | | 301 | | | | | |
Sunnybank State School, GLA Renewal | | 05 | | | 557 | | | | 55 | | | | 502 | | | | | |
Sunset State School, Air Conditioning Replacement and Electrical Upgrade | | 55 | | | 2,946 | | | | 1,124 | | | | 1,822 | | | | | |
Tagai State College - Badu Island Campus, Pre-Prep Facility | | 50 | | | 1,753 | | | | 541 | | | | 1,212 | | | | | |
Tagai State College - Mer Campus, New School by Relocation | | 50 | | | 34,791 | | | | 2,434 | | | | 25,733 | | | | 6,624 | |
Tagai State College - Mer Campus, Pre-Prep Facility | | 50 | | | 1,728 | | | | | | | | 1,728 | | | | | |
The Gap State High School, Brisbane North-West Trade Training Centre | | 05 | | | 3,931 | | | | 1,641 | | | | 2,290 | | | | | |
The Gap State High School, Science Laboratory Renewal | | 05 | | | 813 | | | | 292 | | | | 521 | | | | | |
The Gap State School, GLA Renewal | | 05 | | | 669 | | | | 167 | | | | 502 | | | | | |
Thornlands State School, GLA Renewal | | 05 | | | 669 | | | | 67 | | | | 602 | | | | | |
Toolooa State High School, GLA Renewal | | 30 | | | 510 | | | | 25 | | | | 485 | | | | | |
Toowoomba State High School, Science Laboratory Renewal | | 20 | | | 602 | | | | 159 | | | | 443 | | | | | |
| | | | |
| | Capital Statement 2010-11 | | 47 |
Education and Training1,2,3,4,5,6
| | | | | | | | | | | | | | | | | | |
Project | | Statistical
Division | | Total Estimated
Cost $’000 | | | Expenditure
to 30-06-10
$’000 | | | Budget
2010-11 $’000 | | | Post
2010-11 $’000 | |
Townview State School, Air Conditioning Replacement and Electrical Upgrade | | 55 | | | 3,030 | | | | 1,149 | | | | 1,881 | | | | | |
Trinity Bay State High School, Science Laboratory Renewal | | 50 | | | 1,262 | | | | 487 | | | | 775 | | | | | |
Varsity College, GLAB - 3 Storey - 8 Spaces | | 07 | | | 4,283 | | | | 3,398 | | | | 885 | | | | | |
Wavell State High School, Science Laboratory Renewal | | 05 | | | 732 | | | | 402 | | | | 330 | | | | | |
Wellington Point State High School, Science Laboratory Renewal | | 05 | | | 732 | | | | 402 | | | | 330 | | | | | |
West End State School, Additional Accommodation | | 05 | | | 475 | | | | | | | | 475 | | | | | |
Western Cape College - Aurukun, Additional Amenities | | 50 | | | 1,213 | | | | 388 | | | | 825 | | | | | |
Whites Hill State College, Science Laboratory Renewal | | 05 | | | 609 | | | | 219 | | | | 390 | | | | | |
Windaroo Valley State High School, Futures with Food Trade Training Centre | | 07 | | | 3,778 | | | | 133 | | | | 3,645 | | | | | |
Wishart State School, GLA Renewal | | 05 | | | 892 | | | | 53 | | | | 839 | | | | | |
Woodridge North State School, GLA Renewal | | 05 | | | 446 | | | | | | | | 446 | | | | | |
Woodridge State High School, Science Laboratory Renewal | | 05 | | | 610 | | | | 219 | | | | 391 | | | | | |
Woodridge State School, GLA Renewal | | 05 | | | 1,004 | | | | 451 | | | | 553 | | | | | |
Woree State High School, Marine Technology Trade Training Centre | | 50 | | | 1,900 | | | | 950 | | | | 950 | | | | | |
Woree State High School, School Industry Trade Centre | | 50 | | | 2,565 | | | | 2,194 | | | | 371 | | | | | |
Wynnum North State School, Amalgamation at Former Wynnum North State High School Site | | 05 | | | 21,185 | | | | 3,329 | | | | 17,856 | | | | | |
Wynnum State High School, Renewal | | 05 | | | 16,225 | | | | 12,243 | | | | 3,982 | | | | | |
Yarrabah State School, GLA Renewal | | 50 | | | 922 | | | | 46 | | | | 876 | | | | | |
| | | | |
| 48 | | Capital Statement 2010-11 | | |
Education and Training1,2,3,4,5,6
| | | | | | | | | | | | | | | | | | |
Project | | Statistical
Division | | Total Estimated
Cost $’000 | | | Expenditure
to 30-06-10
$’000 | | | Budget
2010-11 $’000 | | | Post
2010-11 $’000 | |
| | | | | |
Yeppoon State High School, Library Renewal | | 30 | | | 632 | | | | 189 | | | | 443 | | | | | |
Yeppoon State High School, Science Laboratory Renewal | | 30 | | | 447 | | | | 133 | | | | 314 | | | | | |
Building the Education Revolution - National School Pride Program | | Various | | | | | | | | | | | 64 | | | | Ongoing | |
Building the Education Revolution - Primary Schools for the 21st Century | | Various | | | | | | | | | | | 618,336 | | | | Ongoing | |
Building the Education Revolution - Secondary Schools for the 21st Century | | Various | | | | | | | | | | | 30,932 | | | | Ongoing | |
Employee Housing | | Various | | | | | | | | | | | 9,515 | | | | Ongoing | |
Energy Efficiency Initiatives | | Various | | | | | | | | | | | 7,363 | | | | Ongoing | |
General Works | | Various | | | | | | | | | | | 61,622 | | | | Ongoing | |
Land Acquisition | | Various | | | | | | | | | | | 5,244 | | | | Ongoing | |
Minor Works | | Various | | | | | | | | | | | 26,338 | | | | Ongoing | |
SEQ Schools PPP Project | | Various | | | | | | | | | | | 71,106 | | | | Ongoing | |
Plant and equipment | | Various | | | | | | | | | | | 31,508 | | | | Ongoing | |
| | | | | | | | | | | | | | | | | | |
Sub-total EDUCATION | | | | | | | | | | | | | 1,197,243 | | | | | |
| | | | | | | | | | | | | | | | | | |
| | | | | |
TRAINING | | | | | | | | | | | | | | | | | | |
Barrier Reef Institute of TAFE, Townsville, Townsville Trade Training Centre | | 45 | | | 23,584 | | | | 23,091 | | | | 493 | | | | | |
Barrier Reef Institute of TAFE, Townsville, Townsville - Stage 2 | | 45 | | | 15,319 | | | | 893 | | | | 4,000 | | | | 10,426 | |
Central Queensland Institute of TAFE, Mackay, Mackay Trade Training Centre | | 40 | | | 26,317 | | | | 1,111 | | | | 10,000 | | | | 15,206 | |
Gold Coast Institute of TAFE, Coomera Education Precinct | | 07 | | | 24,154 | | | | 12,011 | | | | 12,143 | | | | | |
Metropolitan South Institute of TAFE, Mount Gravatt, Stage 2 - F&G Block Refurbishment | | 05 | | | 7,989 | | | | 240 | | | | 6,950 | | | | 799 | |
SkillsTech Australia - Acacia Ridge, Blocks A and B Roof Upgrade | | 05 | | | 450 | | | | | | | | 450 | | | | | |
SkillsTech Australia - Acacia Ridge, Engineering | | 05 | | | 23,700 | | | | | | | | 10,000 | | | | 13,700 | |
| | | | |
| | Capital Statement 2010-11 | | 49 |
Education and Training1,2,3,4,5,6
| | | | | | | | | | | | | | | | | | |
Project | | Statistical
Division | | Total Estimated
Cost $’000 | | | Expenditure
to 30-06-10 $’000 | | | Budget
2010-11 $’000 | | | Post
2010-11 $’000 | |
| | | | | |
SkillsTech Australia - Acacia Ridge, Light Automotive | | 05 | | | 10,445 | | | | 91 | | | | 9,900 | | | | 454 | |
SkillsTech Australia - Acacia Ridge, Relocate Carpentry from Logan | | 05 | | | 700 | | | | 340 | | | | 360 | | | | | |
SkillsTech Australia - Acacia Ridge, Resource, Canteen, and Client Services | | 05 | | | 9,800 | | | | | | | | 2,000 | | | | 7,800 | |
SkillsTech Australia - Acacia Ridge, Wet Trades Building | | 05 | | | 7,098 | | | | 348 | | | | 6,750 | | | | | |
SkillsTech Australia - North Brisbane, Refurbishment | | 05 | | | 8,272 | | | | | | | | 6,695 | | | | 1,577 | |
Sunshine Coast Institute of TAFE, Nambour, Trade Training Redevelopment | | 09 | | | 11,108 | | | | 1,570 | | | | 2,738 | | | | 6,800 | |
The Bremer Institute of TAFE, Bundamba, Redevelopment of Block C | | 05 | | | 8,133 | | | | 250 | | | | 5,000 | | | | 2,883 | |
Tropical North Queensland Institute of TAFE - Cairns, Stage 2 | | 50 | | | 25,102 | | | | 1,054 | | | | 23,089 | | | | 959 | |
General and Minor Works | | Various | | | | | | | | | | | 13,154 | | | | Ongoing | |
Information Communication and Technology | | Various | | | 3,400 | | | | | | | | 3,400 | | | | | |
| | | | | | | | | | | | | | | | | | |
Sub-total TRAINING | | | | | | | | | | | | | 117,122 | | | | | |
| | | | | | | | | | | | | | | | | | |
| | | | | |
EARLY CHILDHOOD EDUCATION AND CARE | | | | | | | | | | | | | | | | | | |
Additional Kindergartens | | Various | | | | | | | | | | | 10,000 | | | | Ongoing | |
Balaclava State School, Kindergarten | | 50 | | | 1,534 | | | | | | | | 330 | | | | 1,204 | |
Bald Hills State School, Kindergarten | | 05 | | | 1,327 | | | | | | | | 250 | | | | 1,077 | |
Beachmere State School, Kindergarten | | 05 | | | 1,300 | | | | 500 | | | | 800 | | | | | |
Bluewater State School, Kindergarten | | 45 | | | 1,534 | | | | | | | | 400 | | | | 1,134 | |
Carina State School, Kindergarten Extension | | 05 | | | 1,150 | | | | | | | | 1,150 | | | | | |
Coomera State School, Kindergarten | | 07 | | | 2,195 | | | | | | | | 790 | | | | 1,405 | |
| | | | |
| 50 | | Capital Statement 2010-11 | | |
Education and Training1,2,3,4,5,6
| | | | | | | | | | | | | | | | | | |
Project | | Statistical
Division | | Total
Estimated
Cost $’000 | | | Expenditure
to 30-06-10 $’000 | | | Budget
2010-11 $’000 | | | Post
2010-11 $’000 | |
Coomera Springs State School, Kindergarten | | 07 | | | 1,327 | | | | | | | | 250 | | | | 1,077 | |
Crestmead State School, Kindergarten | | 05 | | | 1,700 | | | | 610 | | | | 1,090 | | | | | |
Deception Bay North State School, Kindergarten | | 05 | | | 1,280 | | | | 495 | | | | 785 | | | | | |
Durack State School, Kindergarten | | 05 | | | 1,327 | | | | | | | | 400 | | | | 927 | |
Eimeo Road State School, Kindergarten | | 40 | | | 2,654 | | | | | | | | 678 | | | | 1,976 | |
Elanora State School, Kindergarten | | 07 | | | 1,327 | | | | | | | | 250 | | | | 1,077 | |
Fairview Heights State School, Kindergarten | | 20 | | | 1,341 | | | | 250 | | | | 1,091 | | | | | |
Flagstone State School, Kindergarten | | 05 | | | 2,195 | | | | | | | | 2,195 | | | | | |
Gabbinbar State School, Kindergarten | | 20 | | | 1,350 | | | | | | | | 400 | | | | 950 | |
Gaven State School, Kindergarten | | 07 | | | 1,300 | | | | 500 | | | | 800 | | | | | |
Gumdale State School, Kindergarten | | 05 | | | 1,327 | | | | | | | | 250 | | | | 1,077 | |
Kawana Waters State College, Kindergarten | | 09 | | | 1,327 | | | | | | | | 400 | | | | 927 | |
Kelso State School, Kindergarten | | 45 | | | 1,534 | | | | | | | | 276 | | | | 1,258 | |
Kin Kora State School, Kindergarten | | 30 | | | 1,506 | | | | | | | | 400 | | | | 1,106 | |
Kingston State School, Kindergarten | | 05 | | | 2,195 | | | | | | | | 540 | | | | 1,655 | |
Logan Reserve State School, Kindergarten | | 05 | | | 2,195 | | | | | | | | 790 | | | | 1,405 | |
Logan Village State School, Kindergarten | | 05 | | | 1,327 | | | | | | | | 250 | | | | 1,077 | |
Marian State School, Kindergarten | | 40 | | | 1,602 | | | | | | | | 400 | | | | 1,202 | |
Mount Gravatt East State School, Kindergarten | | 05 | | | 1,327 | | | | | | | | 250 | | | | 1,077 | |
NorfolkVillage State School, Kindergarten | | 07 | | | 1,327 | | | | | | | | 400 | | | | 927 | |
Oakleigh State School, Kindergarten | | 05 | | | 780 | | | | 400 | | | | 380 | | | | | |
Palm Beach State School, Kindergarten | | 07 | | | 2,195 | | | | | | | | 540 | | | | 1,655 | |
| | | | |
| | Capital Statement 2010-11 | | 51 |
Education and Training1,2,3,4,5,6
| | | | | | | | | | | | | | | | | | |
Project | | Statistical
Division | | Total Estimated
Cost $’000 | | | Expenditure
to 30-06-10
$’000 | | | Budget
2010-11 $’000 | | | Post
2010-11 $’000 | |
Peregian Springs State School, Kindergarten | | 09 | | | 1,327 | | | | | | | | 250 | | | | 1,077 | |
Rochedale South State School, Kindergarten | | 05 | | | 1,300 | | | | 100 | | | | 1,200 | | | | | |
Sarina State School, Kindergarten | | 40 | | | 1,602 | | | | | | | | 400 | | | | 1,202 | |
Seaforth State School, Kindergarten | | 40 | | | 1,570 | | | | 300 | | | | 1,270 | | | | | |
Seven Hills State School, Kindergarten | | 05 | | | 2,195 | | | | | | | | 790 | | | | 1,405 | |
Sunset State School, Kindergarten | | 55 | | | 1,908 | | | | 100 | | | | 1,808 | | | | | |
Taranganba State School, Kindergarten | | 30 | | | 1,602 | | | | | | | | 288 | | | | 1,314 | |
Tin Can Bay State School, Kindergarten | | 15 | | | 1,398 | | | | 500 | | | | 898 | | | | | |
Weir State School, Kindergarten | | 45 | | | 2,539 | | | | | | | | 636 | | | | 1,903 | |
Yandina State School, Kindergarten | | 09 | | | 1,327 | | | | | | | | 400 | | | | 927 | |
Early Childhood Education Centres | | Various | | | | | | | | | | | 5,932 | | | | Ongoing | |
Early Learning and Care Centres | | Various | | | | | | | | | | | 850 | | | | Ongoing | |
Early Years Centres | | Various | | | | | | | | | | | 6,920 | | | | Ongoing | |
Child and Family Centres | | Various | | | | | | | | | | | 18,126 | | | | Ongoing | |
General and Minor Works | | Various | | | | | | | | | | | 749 | | | | Ongoing | |
| | | | | | | | | | | | | | | | | | |
Sub-total EARLY CHILDHOOD EDUCATION AND CARE | | | | | | | | | | | | | 67,052 | | | | | |
| | | | | | | | | | | | | | | | | | |
| | | | | |
Total Property, Plant and Equipment | | | | | | | | | | | | | 1,381,417 | | | | | |
| | | | | | | | | | | | | | | | | | |
| | | | | |
Capital Grants | | | | | | | | | | | | | | | | | | |
EDUCATION | | | | | | | | | | | | | | | | | | |
Capital Grants | | Various | | | 137,520 | | | | | | | | 137,520 | | | | | |
| | | | | | | | | | | | | | | | | | |
Sub-total EDUCATION | | | | | | | | | | | | | 137,520 | | | | | |
| | | | | | | | | | | | | | | | | | |
| | | | | |
TRAINING | | | | | | | | | | | | | | | | | | |
Australian Agricultural College Corporation | | Various | | | | | | | | | | | 1,000 | | | | Ongoing | |
Skills Centre Program | | Various | | | | | | | | | | | 5,000 | | | | Ongoing | |
South Bank Institute of Technology | | 05 | | | 1,897 | | | | | | | | 1,897 | | | | | |
Gold Coast Institute of TAFE | | 07 | | | 3,338 | | | | | | | | 3,338 | | | | | |
| | | | | | | | | | | | | | | | | | |
Sub-total TRAINING | | | | | | | | | | | | | 11,235 | | | | | |
| | | | | | | | | | | | | | | | | | |
| | | | | |
Total Capital Grants | | | | | | | | | | | | | 148,755 | | | | | |
| | | | | | | | | | | | | | | | | | |
| | | | | |
TOTAL DEPARTMENT OF EDUCATION AND TRAINING | | | | | | | | | | | | | 1,530,172 | | | | | |
| | | | | | | | | | | | | | | | | | |
| | | | |
| 52 | | Capital Statement 2010-11 | | |
Education and Training1,2,3,4,5,6
| | | | | | | | | | | | | | | | | | | | |
Project | | Statistical
Division | | | Total Estimated
Cost $’000 | | | Expenditure
to 30-06-10
$’000 | | | Budget
2010-11 $’000 | | | Post 2010-11 $’000 | |
QUEENSLAND STUDIES AUTHORITY | | | | | | | | | | | | | | | | | | | | |
| | | | | |
Property, Plant and Equipment | | | | | | | | | | | | | | | | | | | | |
Plant and equipment | | | 05 | | | | | | | | | | | | 120 | | | | Ongoing | |
| | | | | | | | | | | | | | | | | | | | |
Total Property, Plant and Equipment | | | | | | | | | | | | | | | 120 | | | | | |
| | | | | | | | | | | | | | | | | | | | |
| | | | | |
TOTAL QUEENSLAND STUDIES AUTHORITY | | | | | | | | | | | | | | | 120 | | | | | |
| | | | | | | | | | | | | | | | | | | | |
| | | | | |
SOUTHBANK INSTITUTE OF TECHNOLOGY | | | | | | | | | | | | | | | | | | | | |
| | | | | |
Property, Plant and Equipment | | | | | | | | | | | | | | | | | | | | |
Information and Communication Technology | | | 05 | | | | | | | | | | | | 204 | | | | Ongoing | |
Other plant & equipment | | | 05 | | | | | | | | | | | | 100 | | | | Ongoing | |
| | | | | | | | | | | | | | | | | | | | |
Total Property, Plant and Equipment | | | | | | | | | | | | | | | 304 | | | | | |
| | | | | | | | | | | | | | | | | | | | |
| | | | | |
TOTAL SOUTHBANK INSTITUTE OF TECHNOLOGY | | | | | | | | | | | | | | | 304 | | | | | |
| | | | | | | | | | | | | | | | | | | | |
| | | | | |
GOLD COAST INSTITUTE OF TAFE | | | | | | | | | | | | | | | | | | | | |
| | | | | |
Property, Plant and Equipment | | | | | | | | | | | | | | | | | | | | |
Information Communication & Technology | | | 07 | | | | | | | | | | | | 330 | | | | Ongoing | |
Minor Capital Works | | | 07 | | | | | | | | | | | | 155 | | | | Ongoing | |
| | | | | | | | | | | | | | | | | | | | |
Total Property, Plant and Equipment | | | | | | | | | | | | | | | 485 | | | | | |
| | | | | | | | | | | | | | | | | | | | |
| | | | | |
Other Capital Expenditure | | | | | | | | | | | | | | | | | | | | |
Information Communication & Technology | | | 07 | | | | | | | | | | | | 100 | | | | Ongoing | |
| | | | | | | | | | | | | | | | | | | | |
Total Other Capital Expenditure | | | | | | | | | | | | | | | 100 | | | | | |
| | | | | | | | | | | | | | | | | | | | |
| | | | | |
TOTAL GOLD COAST INSTITUTE OF TAFE | | | | | | | | | | | | | | | 585 | | | | | |
| | | | | | | | | | | | | | | | | | | | |
| | | | | |
TOTAL EDUCATION AND TRAINING | | | | | | | | | | | | | | | 1,531,181 | | | | | |
| | | | | | | | | | | | | | | | | | | | |
Notes:
| 1. | Education capital grants are distributed by non-state entities throughout Queensland’s statistical divisions. |
| 2. | Project budgets listed in the table are in some cases indicative and are subject to refinement as projects are further developed. |
| 3. | Projects contained in the table have been included on the basis of projected enrolments. If projected enrolments do not eventuate, then listed projects may be deferred or stopped, or new projects added during the course of the financial year. |
| 4. | The amounts quoted in the above table reflect the estimated portion of project costs that will be capitalised. The amounts quoted in the program highlights, Service Delivery Statements and the Regional Budget Statements are the full financial costs of projects (i.e. they include some expensed items). |
| 5. | The Australian Government may also contribute funding for these projects. |
| 6. | Funds allocated to trade training centre projects are indicative and subject to Australian Government review and approval. |
| | | | |
| | Capital Statement 2010-11 | | 53 |
ELECTORAL COMMISSION OF QUEENSLAND
An amount of $0.04 million is allocated in 2010-11 towards the on-going replacement program of plant and equipment to provide for the ongoing operational requirements associated with the efficient and effective provision of electoral services for the State of Queensland.
Electoral Commission of Queensland
| | | | | | | | | | | | | | | | | | | | |
Project | | Statistical
Division | | | Total Estimated
Cost
$’000 | | | Expenditure
to 30-06-10
$’000 | | | Budget
2010-11 $’000 | | | Post
2010-11 $’000 | |
ELECTORAL COMMISSION OF QUEENSLAND | | | | | | | | | | | | | | | | | | | | |
| | | | | |
Property, Plant and Equipment | | | | | | | | | | | | | | | | | | | | |
Plant and equipment | | | 05 | | | | | | | | | | | | 40 | | | | Ongoing | |
| | | | | | | | | | | | | | | | | | | | |
Total Property, Plant and Equipment | | | | | | | | | | | | | | | 40 | | | | | |
| | | | | | | | | | | | | | | | | | | | |
| | | | | |
TOTAL ELECTORAL COMMISSION OF QUEENSLAND | | | | | | | | | | | | | | | 40 | | | | | |
| | | | | | | | | | | | | | | | | | | | |
| | | | |
| 54 | | Capital Statement 2010-11 | | |
EMPLOYMENT, ECONOMIC DEVELOPMENT AND INNOVATION
Total capital outlays for 2010-11 for the Employment, Economic Development and Innovation portfolio including statutory bodies reporting to respective Department of Employment, Economic Development and Innovation Ministers and Energy Government Owned Corporations is $3.3 billion. A significant portion of this expenditure will be spent state-wide on new energy infrastructure, systems upgrades and maintenance.
Department of Employment, Economic Development and Innovation
The capital expenditure program for the Department of Employment, Economic Development and Innovation (DEEDI) in 2010-11 is $145 million. DEEDI’s capital program supports the continuing economic development of the State’s industries, develops and reinvests in world class research facilities, and enhances service delivery through the development of new information communication technology platforms.
Program Highlights
| • | | Construction of the Health and Food Sciences Precinct at Coopers Plains and the Ecosciences Precinct at Boggo Road commenced in mid 2008. The Health and Food Sciences Precinct was completed in the first half of 2010. Construction of the Ecosciences Precinct at Boggo Road is expected to be completed in late 2010. The completion of the precincts will facilitate the co-location of research activities of DEEDI, the Department of Environment and Resource Management, Queensland Health and the Commonwealth Scientific and Industrial Research Organisation (CSIRO). |
| • | | $17.5 million has been allocated to the 2020 Beef Plan. 2020 Beef includes purchase of a new purpose-designed beef research property in North Queensland’s dry tropics, expected to carry 2000 breeders, which will be one of Australia’s peak locations for projects to advance beef breeding. 2020 Beef will also include an upgrade of the Brian Pastures property near Gayndah (owned by AgForce and leased by the department) and co-location of the department with the Australian Agricultural College Corporation at its Berrigurra property at Blackwater. |
| • | | $16 million for the Tropical Biosecurity Laboratory at James Cook University Campus, Townsville. |
| • | | $3 million has been allocated for the Darling Downs Cropping Research and Training Centre. Up to $3 million will be reinvested to create this facility which will provide training in broadscale crop production, machinery operations and undertake major field crop research. |
| | | | |
| | Capital Statement 2010-11 | | 55 |
| • | | $10.7 million over three years to enhance the efficiency of Government mining and petroleum tenure approval and regulatory processes. A modern technology platform will help streamline the project approval process. |
| • | | $2.4 million to continue work on the Mt Isa Drill Core Facility. |
| • | | The Government will establish the Racing Industry Capital Development Scheme, totalling $85 million over four years. The scheme will assist the racing industry with the provision of priority capital works. |
QRAA
QRAA’s capital budget for 2010-11 will be used for information technology software and hardware.
Australian Agricultural College Corporation
The primary focus of AACC’s 2010-11 capital program will be planning and initial implementation of the Reconnecting Agricultural Education initiative. AACC aims to increase the number of sites where it delivers training and to be recognised as the preferred training provider for rural and related industries.
CS Energy Limited
A $111.3 million capital expenditure program is planned for 2010-11. This reflects the continued commitment to the ongoing reliability and efficiency of generation plant.
Program Highlights
| • | | $50.2 million for improvements to the Callide power station including overhaul work and major refurbishment work on B station mid-life refit. |
| • | | $2.5 million for improvements to the gas-fired Swanbank power station. |
| • | | $20 million for improvements to the Mica Creek power station including overhaul work. |
| • | | $24.5 million for improvements to the Kogan Creek power station including overhaul work. |
| • | | $14.1 million for corporate and business development initiatives. |
ENERGEX Limited
The ENERGEX Group has prepared a capital program of $1.251 billion as part of its commitment to providing a safe, secure and highly reliable, cost effective electricity delivery to its customers. The capital program will match the high growth in electricity usage being driven by a strong Queensland economy and increased use of lifestyle enhancing appliances, such as air conditioners.
| | | | |
| 56 | | Capital Statement 2010-11 | | |
The regulated electricity capital expenditure program for 2010-11 is $1.035 billion. This includes $386.1 million on the sub transmission system and $648.8 million on the distribution network.
Program Highlights
Capital works planned to increase network capacity and reliability include:
| • | | $3.3 million to continue a two stage upgrade of the Beenleigh substation to increase network capacity/reliability. |
| • | | $16.6 million to complete underground cable project between Bundall and Molendinar to increase network capacity and reliability. |
| • | | $8.4 million to improve underground power supplies in Brisbane CBD. |
| • | | $9.7 million to continue the construction of a new electricity substation at Burpengary to increase network capacity and reliability. |
| • | | $23.3 million towards construction of a new electricity substation at Griffin to increase network capacity/reliability. |
| • | | $7 million towards an upgrade of capacity to the Grovely substation to increase network capacity/reliability. |
| • | | $5 million towards establishment of a substation at Springfield to increase network capacity/reliability. |
| • | | $14 million to rebuild the Woodridge substation to increase network capacity and reliability. |
| • | | $3.8 million to improve electricity supplies at Nambour substation. |
| • | | $12 million for upgrade of power supplies in the central Sunshine Coast area to increase network capacity and reliability. |
| • | | $10.5 million to install new powerlines between Caboolture and Toorbul Point to increase network capacity and reliability. |
| • | | $10.3 million towards the establishment of a new substation at Pomona to increase network capacity and reliability. |
| • | | $4.7 million to improve electricity supplies between Tin Can Bay and Rainbow Beach to increase network capacity and reliability. |
Stanwell Corporation Limited
Stanwell Corporation Limited’s expected capital expenditure for 2010-11 is $122.6 million. This relates to improving the efficiency of existing generation assets at Stanwell, Barron and Kareeya and investment in potential upstream gas opportunities.
| | | | |
| | Capital Statement 2010-11 | | 57 |
Program Highlights
| • | | $58.4 million for major overhauls and efficiency upgrades at Stanwell Power Station. |
| • | | $8.7 million in Low Nitrogen Oxide Burners at Stanwell Power Station. |
| • | | $9 million at the Kareeya and Barron Gorge Hydro Power Stations. |
| • | | $15.8 million for upgrade of information systems and infrastructure. |
| • | | $30.6 million in Business Development for investigation and development of upstream gas supplies and renewable technologies. |
Tarong Energy Corporation Limited
Tarong Energy Corporation Limited’s capital expenditure program (in Queensland) for 2010-11 is $133.8 million, which primarily relates to maintaining operations at Tarong Power Station, Tarong North Power Station, Wivenhoe Power Station and Meandu Mine.
Program Highlights
| • | | $42.9 million to replace mine fleet equipment, overhaul the dragline and for resource evaluation at the Meandu mine and the Kunioon reserve. |
| • | | $19.6 million for overhauls of units 1 and 3 at Tarong Power Station. |
| • | | $10.6 million for system improvements, enhancements and equipment refresh. |
| • | | $8.6 million for the instrumentation and control systems upgrade at Tarong Power Station. |
| • | | $7.8 million for the continued evaluation of Tarong’s Glen Wilga coal asset. |
Powerlink Queensland
Powerlink Queensland is the high voltage electricity transmission entity for Queensland. Powerlink’s budgeted capital expenditure for 2010-11 is $574 million and includes the following program highlights.
Program Highlights
| • | | $48.2 million to complete construction of a 275kV transmission line between the existing Strathmore and Ross substations. |
| • | | $21.7 million for the construction of a new substation at Bowen North and a 132kV transmission line between the new substation and the existing Strathmore Substation. |
| | | | |
| 58 | | Capital Statement 2010-11 | | |
| • | | $6.2 million for the replacement of the existing Gladstone Substation to be known as Calliope River Substation. |
| • | | $16 million towards replacement of the existing Swanbank A Substation and construction of the new substation, to be known as Blackstone Substation. |
| • | | $117 million towards establishment of two new substations at Western Downs and Halys, construction of a transmission line between the new substations, and the reconfiguration of the existing Kogan Creek to Braemar transmission line and associated substation works. |
Ergon Energy Corporation Limited
Ergon Energy Corporation Limited’s capital expenditure for 2010-11 of $937.7 million includes a significant number of major projects which are primarily related to the electricity network and its associated infrastructure, with the objective to improve the quality of supply to domestic and commercial customers.
Program Highlights
| • | | $22.4 million for the Supervisory Control and Data Acquisition System (SCADA). |
| • | | $70 million for Ubinet Project. |
| • | | $22.2 million to reinforce supply to Bowen Basin (Broadlea). |
| • | | $10.8 million to reinforce supply to Airlie Beach (Jubilee Pocket). |
| • | | $12.2 million to reinforce supply to Dalby Central. |
| • | | $20.1 million to reinforce the Bulk Supply Point (Roma). |
| • | | $8.3 million to establish the Geothermal Plant (Birdsville). |
| • | | $4.7 million to complete the reinforcement of supply to Townsville. |
| • | | $2.3 million to complete the reinforcement of supply to North Queensland. |
Tourism Queensland
Tourism Queensland’s 2010-11 capital budget will be used for information technology hardware and software upgrades.
| | | | |
| | Capital Statement 2010-11 | | 59 |
Employment, Economic Development and Innovation
| | | | | | | | | | | | | | | | | | |
Project | | Statistical
Division | | Total
Estimated
Cost $’000 | | | Expenditure
to 30-06-10
$’000 | | | Budget
2010-11 $’000 | | | Post
2010-11 $’000 | |
DEPARTMENT OF EMPLOYMENT, ECONOMIC DEVELOPMENT AND INNOVATION | |
| | | | | |
Property, Plant and Equipment | | | | | | | | | | | | | | | | | | |
Ecosciences Precinct at Boggo Road and the Health and Food Sciences Precinct at Coopers Plains | | 05 | | | 377,900 | | | | 346,353 | | | | 31,547 | | | | | |
2020 Beef Research Properties | | 45 | | | 17,500 | | | | | | | | 17,000 | | | | 500 | |
Tropical Biosecurity Laboratory - JCU Douglas Campus | | 45 | | | 16,000 | | | | 380 | | | | 2,484 | | | | 13,136 | |
Abandoned Mines | | 30 | | | 6,394 | | | | 6,059 | | | | 335 | | | | | |
Mt Isa Drill Core Facility | | 55 | | | 4,788 | | | | 2,351 | | | | 2,437 | | | | | |
Darling Downs Cropping Research and Training Centre | | 20 | | | 3,000 | | | | | | | | 3,000 | | | | | |
Bajool Reserve Road Upgrade | | 30 | | | 1,600 | | | | | | | | 1,600 | | | | | |
Relocation and refurbishment | | Various | | | | | | | | | | | 2,000 | | | | Ongoing | |
Research facilities development | | Various | | | | | | | | | | | 1,500 | | | | Ongoing | |
Vessel replacement | | Various | | | | | | | | | | | 1,500 | | | | Ongoing | |
Heavy plant and equipment | | Various | | | | | | | | | | | 1,500 | | | | Ongoing | |
Scientific Equipment | | Various | | | | | | | | | | | 3,000 | | | | Ongoing | |
Minor works | | Various | | | | | | | | | | | 1,200 | | | | Ongoing | |
Other plant and equipment | | Various | | | | | | | | | | | 13,823 | | | | Ongoing | |
| | | | | | | | | | | | | | | | | | |
Total Property, Plant and Equipment | | | | | | | | | | | | | 82,926 | | | | | |
| | | | | | | | | | | | | | | | | | |
| | | | | |
Other Capital Expenditure | | | | | | | | | | | | | | | | | | |
Streamlining Mining Tenure Approval Process | | 05 | | | 10,743 | | | | | | | | 5,857 | | | | 4,886 | |
Intangible assets | | 05 | | | | | | | | | | | 2,146 | | | | Ongoing | |
Other projects | | Various | | | | | | | | | | | 450 | | | | Ongoing | |
| | | | | | | | | | | | | | | | | | |
Total Other Capital Expenditure | | | | | | | | | | | | | 8,453 | | | | | |
| | | | | | | | | | | | | | | | | | |
| | | | | |
Capital Grants | | | | | | | | | | | | | | | | | | |
Racing Industry Capital Development Scheme | | Various | | | 85,000 | | | | | | | | 20,000 | | | | 65,000 | |
RSPCA facility | | 05 | | | 10,000 | | | | 2,866 | | | | 7,134 | | | | | |
Other capital grants | | Various | | | 39,000 | | | | 11,100 | | | | 26,400 | | | | 1,500 | |
| | | | | | | | | | | | | | | | | | |
Total Capital Grants | | | | | | | | | | | | | 53,534 | | | | | |
| | | | | | | | | | | | | | | | | | |
| | | |
TOTAL DEPARTMENT OF EMPLOYMENT, ECONOMIC DEVELOPMENT AND INNOVATION | | | | | | | | 144,913 | | | | | |
| | | | | | | | | | | | | | | | | | |
| | | | |
| 60 | | Capital Statement 2010-11 | | |
Employment, Economic Development and Innovation
| | | | | | | | | | | | | | | | | | | | |
Project | | Statistical
Division | | | Total
Estimated
Cost $’000 | | | Expenditure
to 30-06-10
$’000 | | | Budget
2010-11 $’000 | | | Post
2010-11 $’000 | |
QRAA | | | | | | | | | | | | | | | | | | | | |
| | | | | |
Property, Plant and Equipment | | | | | | | | | | | | | | | | | | | | |
Computer equipment | | | 05 | | | | | | | | | | | | 500 | | | | Ongoing | |
| | | | | | | | | | | | | | | | | | | | |
Total Property, Plant and Equipment | | | | | | | | | | | | | | | 500 | | | | | |
| | | | | | | | | | | | | | | | | | | | |
| | | | | |
TOTAL QRAA | | | | | | | | | | | | | | | 500 | | | | | |
| | | | | | | | | | | | | | | | | | | | |
| | |
AUSTRALIAN AGRICULTURAL COLLEGE CORPORATION | | | | | | | | | |
Property, Plant and Equipment | | | | | | | | | | | | | | | | | | | | |
Property plant & equipment | | | Various | | | | | | | | | | | | 3,167 | | | | Ongoing | |
| | | | | | | | | | | | | | | | | | | | |
Total Property, Plant and Equipment | | | | | | | | | | | | | | | 3,167 | | | | | |
| | | | | | | | | | | | | | | | | | | | |
| | |
TOTAL AUSTRALIAN AGRICULTURAL COLLEGE CORPORATION | | | | 3,167 | | | | | |
| | | | | | | | | | | | | | | | | | | | |
| | | | | |
CS ENERGY LIMITED | | | | | | | | | | | | | | | | | | | | |
| | | | | |
Property, Plant and Equipment | | | | | | | | | | | | | | | | | | | | |
Callide Power Station (enhancements, overhauls & refurbishment) | | | 30 | | | | | | | | | | | | 50,238 | | | | Ongoing | |
Swanbank Power Station (enhancements, overhauls & refurbishment) | | | 05 | | | | | | | | | | | | 2,518 | | | | Ongoing | |
Mica Creek Power Station (enhancements, overhauls & refurbishment) | | | 55 | | | | | | | | | | | | 19,964 | | | | Ongoing | |
Kogan Creek Power Station (enhancements & overhauls) | | | 20 | | | | | | | | | | | | 24,515 | | | | Ongoing | |
Corporate (including business development) | | | 05 | | | | | | | | | | | | 14,087 | | | | Ongoing | |
| | | | | | | | | | | | | | | | | | | | |
Total Property, Plant and Equipment | | | | | | | | | | | | | | | 111,322 | | | | | |
| | | | | | | | | | | | | | | | | | | | |
| | | | | |
TOTAL CS ENERGY LIMITED | | | | | | | | | | | | | | | 111,322 | | | | | |
| | | | | | | | | | | | | | | | | | | | |
| | | | | |
ENERGEX LIMITED | | | | | | | | | | | | | | | | | | | | |
| | | | | |
Property, Plant and Equipment | | | | | | | | | | | | | | | | | | | | |
Distribution augmentation | | | | | | | | | | | | | | | | | | | | |
Distribution Augmentation - Gold Coast Underground Cable Project -Bundall to Molendinar | | | 07 | | | | | | | | | | | | 16,626 | | | | Ongoing | |
| | | | |
| | Capital Statement 2010-11 | | 61 |
Employment, Economic Development and Innovation
| | | | | | | | | | | | | | | | | | |
Project | | Statistical
Division | | Total Estimated
Cost $’000 | | | Expenditure
to 30-06-10
$’000 | | | Budget
2010-11 $’000 | | | Post 2010-11 $’000 | |
Upgrade Beenleigh Substation | | 07 | | | | | | | | | | | 3,273 | | | | Ongoing | |
Improve Power Supply to Cades County | | 07 | | | | | | | | | | | 1,278 | | | | Ongoing | |
Other Distribution Augmentation - Gold Coast | | 07 | | | | | | | | | | | 51,591 | | | | Ongoing | |
| | | | | | | | | | | | | | | | | | |
Sub-total Distribution Augmentation - Gold Coast | | | | | | | | | | | | | 72,768 | | | | | |
| | | | | | | | | | | | | | | | | | |
| | | | | |
Distribution Augmentation - Brisbane | | | | | | | | | | | | | | | | | | |
Construct new Substation at Griffin | | 05 | | | | | | | | | | | 23,274 | | | | Ongoing | |
Construct new Substation at Burpengary | | 05 | | | | | | | | | | | 9,700 | | | | Ongoing | |
Rebuild Substation at Woodridge | | 05 | | | | | | | | | | | 13,952 | | | | Ongoing | |
Improve underground power supplies in Brisbane CBD | | 05 | | | | | | | | | | | 8,374 | | | | Ongoing | |
Upgrade capacity at Grovely Substation | | 05 | | | | | | | | | | | 7,034 | | | | Ongoing | |
Establish Substation at Springfield | | 05 | | | | | | | | | | | 5,014 | | | | Ongoing | |
Other Distribution Augmentation - Brisbane | | 05 | | | | | | | | | | | 382,776 | | | | Ongoing | |
| | | | | | | | | | | | | | | | | | |
Sub-total Distribution Augmentation - Brisbane | | | | | | | | | | | | | 450,124 | | | | | |
| | | | | | | | | | | | | | | | | | |
| | | | | |
Distribution Augmentation - Sunshine Coast | | | | | | | | | | | | | | | | | | |
Upgrade Power supply to Central Sunshine Coast | | 09 | | | | | | | | | | | 12,040 | | | | Ongoing | |
Install new powerlines between Caboolture and Toorbul Point | | 09 | | | | | | | | | | | 10,464 | | | | Ongoing | |
Upgrade Nambour Substation | | 09 | | | | | | | | | | | 3,826 | | | | Ongoing | |
Upgrade Noosaville Substation | | 09 | | | | | | | | | | | 1,431 | | | | Ongoing | |
Establish new substation at Pomona | | 09 | | | | | | | | | | | 10,324 | | | | Ongoing | |
Other Distribution Augmentation - Sunshine Coast | | 09 | | | | | | | | | | | 38,724 | | | | Ongoing | |
| | | | | | | | | | | | | | | | | | |
Sub-total Distribution Augmentation - Sunshine Coast | | | | | | | | | | | | | 76,809 | | | | | |
| | | | | | | | | | | | | | | | | | |
| | | | | |
Distribution Augmentation - Wide Bay-Burnett | | | | | | | | | | | | | | | | | | |
Improve Network Reliability -Tin Can Bay | | 15 | | | | | | | | | | | 4,692 | | | | Ongoing | |
| | | | |
| 62 | | Capital Statement 2010-11 | | |
Employment, Economic Development and Innovation
| | | | | | | | | | | | | | | | | | |
Project | | Statistical
Division | | Total Estimated
Cost $’000 | | | Expenditure
to 30-06-10
$’000 | | | Budget
2010-11 $’000 | | | Post
2010-11 $’000 | |
Other Distribution Augmentation - Wide Bay-Burnett | | 15 | | | | | | | | | | | 19,803 | | | | Ongoing | |
| | | | | | | | | | | | | | | | | | |
Sub-total Distribution Augmentation - Wide Bay-Burnett | | | | | | | | | | | | | 24,495 | | | | | |
| | | | | | | | | | | | | | | | | | |
| | | | | |
Distribution Augmentation - West Moreton | | 12 | | | | | | | | | | | 24,632 | | | | Ongoing | |
| | | | | | | | | | | | | | | | | | |
Sub-total Distribution augmentation | | | | | | | | | | | | | 648,828 | | | | | |
| | | | | | | | | | | | | | | | | | |
| | | | | |
Sub transmission program | | | | | | | | | | | | | | | | | | |
Sub Transmission - Brisbane | | 05 | | | 259,006 | | | | | | | | 259,006 | | | | | |
Sub Transmission - Gold Coast | | 07 | | | 53,631 | | | | | | | | 53,631 | | | | | |
Sub Transmission - West Moreton | | 12 | | | 22,490 | | | | | | | | 22,490 | | | | | |
Sub Transmission - Wide Bay-Burnett | | 15 | | | 5,093 | | | | | | | | 5,093 | | | | | |
Sub Transmission - Sunshine Coast | | 09 | | | 45,834 | | | | | | | | 45,834 | | | | | |
| | | | | | | | | | | | | | | | | | |
Other sub transmission works | | | | | | | | | | | | | | | | | | |
Sub-total Sub transmission program | | | | | | | | | | | | | 386,054 | | | | | |
| | | | | | | | | | | | | | | | | | |
| | | | | |
Non system | | | | | | | | | | | | | | | | | | |
Property - Buildings | | 05 | | | | | | | | | | | 104,734 | | | | Ongoing | |
Property - Buildings | | 09 | | | 5,652 | | | | | | | | 5,652 | | | | | |
Property - Land | | 05 | | | 40,500 | | | | | | | | 40,500 | | | | | |
PSG Fleet | | 05 | | | 35,257 | | | | | | | | 35,257 | | | | | |
Capital Tools & Equipment | | 05 | | | 4,400 | | | | | | | | 4,400 | | | | | |
Warehousing & Distribution | | 05 | | | 8,900 | | | | | | | | 8,900 | | | | | |
Capital ICT - Software and Hardware | | 05 | | | 10,045 | | | | | | | | 10,045 | | | | | |
Metering Dynamics | | 05 | | | 3,500 | | | | | | | | 3,500 | | | | | |
Other Generation | | 05 | | | 3,211 | | | | | | | | 3,211 | | | | | |
| | | | | | | | | | | | | | | | | | |
Sub-total Non system | | | | | | | | | | | | | 216,199 | | | | | |
| | | | | | | | | | | | | | | | | | |
| | | | | |
Total Property, Plant and Equipment | | | | | | | | | | | | | 1,251,081 | | | | | |
| | | | | | | | | | | | | | | | | | |
| | | | | |
TOTAL ENERGEX LIMITED | | | | | | | | | | | | | 1,251,081 | | | | | |
| | | | | | | | | | | | | | | | | | |
| | | | | |
STANWELL CORPORATION LIMITED | | | | | | | | | | | | | | | | | | |
| | | | | |
Property, Plant and Equipment | | | | | | | | | | | | | | | | | | |
Kareeya | | | | | | | | | | | | | | | | | | |
Kareeya Power Station Minor Works | | 50 | | | | | | | | | | | 2,680 | | | | Ongoing | |
| | | | |
| | Capital Statement 2010-11 | | 63 |
Employment, Economic Development and Innovation
| | | | | | | | | | | | | | | | | | | | |
Project | | Statistical
Division | | | Total Estimated
Cost $’000 | | | Expenditure
to 30-06-10
$’000 | | | Budget
2010-11 $’000 | | | Post
2010-11 $’000 | |
Barron Gorge | | | | | | | | | | | | | | | | | | | | |
Barron Gorge - Generator Rewinds | | | 50 | | | | 10,182 | | | | 4,681 | | | | 5,501 | | | | | |
Barron Gorge Power Station Minor Works | | | 50 | | | | | | | | | | | | 793 | | | | Ongoing | |
Stanwell Power Station | | | | | | | | | | | | | | | | | | | | |
Stanwell Power Station Unit Overhauls | | | 30 | | | | | | | | | | | | 23,798 | | | | Ongoing | |
Stanwell Power Station - LP Turbine and Generator Upgrade | | | 30 | | | | 86,735 | | | | 56,187 | | | | 21,199 | | | | 9,349 | |
Stanwell Power Station - Low Nox Burners | | | 30 | | | | 35,260 | | | | 10,851 | | | | 8,667 | | | | 15,742 | |
Stanwell Power Station Minor Works | | | 30 | | | | | | | | | | | | 13,442 | | | | Ongoing | |
Information Systems Improvements | | | Various | | | | 23,838 | | | | 7,990 | | | | 15,848 | | | | | |
Corporate and Other Business Development | | | Various | | | | | | | | | | | | 30,628 | | | | Ongoing | |
| | | | | | | | | | | | | | | | | | | | |
Total Property, Plant and Equipment | | | | | | | | | | | | | | | 122,556 | | | | | |
| | | | | | | | | | | | | | | | | | | | |
| | | | |
TOTAL STANWELL CORPORATION LIMITED | | | | | | | | | | | | 122,556 | | | | | |
| | | | | | | | | | | | | | | | | | | | |
| | | | |
TARONG ENERGY CORPORATION LIMITED | | | | | | | | | | | | | | | | | |
| | | | | |
Property, Plant and Equipment | | | | | | | | | | | | | | | | | | | | |
Tarong Coal | | | | | | | | | | | | | | | | | | | | |
Kunioon coal project | | | 15 | | | | | | | | | | | | 4,583 | | | | Ongoing | |
Meandu Mine | | | 15 | | | | | | | | | | |
| 38,357
|
| | | Ongoing | |
| | | | | | | | | | | | | | | | | | | | |
Sub-total Tarong Coal | | | | | | | | | | | | | | | 42,940 | | | | | |
| | | | | | | | | | | | | | | | | | | | |
| | | | | |
Brisbane | | | | | | | | | | | | | | | | | | | | |
Glen Wilga asset review and activities | | | 20 | | | | 25,335 | | | | 17,535 | | | | 7,800 | | | | | |
Information Services enhancements and initiatives | | | 05 | | | | | | | | | | | | 10,634 | | | | Ongoing | |
Tarong Power Station | | | | | | | | | | | | | | | | | | | | |
Engineering Studies | | | 15 | | | | | | | | | | | | 3,203 | | | | Ongoing | |
Ash Dam Works | | | 15 | | | | | | | | | | | | 7,012 | | | | Ongoing | |
| | | | |
| 64 | | Capital Statement 2010-11 | | |
Employment, Economic Development and Innovation
| | | | | | | | | | | | | | | | | | | | |
Project | | Statistical
Division | | | Total
Estimated
Cost $’000 | | | Expenditure
to 30-06-10
$’000 | | | Budget
2010-11 $’000 | | | Post
2010-11 $’000 | |
Instrumentation & Control System Upgrade | | | 15 | | | | 17,174 | | | | 8,621 | | | | 8,553 | | | | | |
Minor capital works - Tarong Power Station | | | 15 | | | | | | | | | | | | 3,341 | | | | Ongoing | |
Low nitrogen oxide burners | | | 15 | | | | 29,357 | | | | 26,060 | | | | 3,297 | | | | | |
Overhaul - Tarong Power Station | | | 15 | | | | | | | | | | | | 19,570 | | | | Ongoing | |
Other capital projects | | | 15 | | | | | | | | | | | | 19,685 | | | | Ongoing | |
| | | | | | | | | | | | | | | | | | | | |
Sub-total Tarong Power Station | | | | | | | | | | | | | | | 64,661 | | | | | |
| | | | | | | | | | | | | | | | | | | | |
| | | | | |
Wivenhoe Power Station | | | | | | | | | | | | | | | | | | | | |
Overhauls and other capital works | | | 20 | | | | | | | | | | | | 5,146 | | | | Ongoing | |
| | | | | | | | | | | | | | | | | | | | |
Sub-total Wivenhoe Power Station | | | | | | | | | | | | | | | 5,146 | | | | | |
| | | | | | | | | | | | | | | | | | | | |
| | | | | |
Tarong North Power Station | | | | | | | | | | | | | | | | | | | | |
Other capital projects | | | 15 | | | | | | | | | | | | 2,640 | | | | Ongoing | |
| | | | | | | | | | | | | | | | | | | | |
Sub-total Tarong North Power Station | | | | | | | | | | | | | | | 2,640 | | | | | |
| | | | | | | | | | | | | | | | | | | | |
| | | | | |
Total Property, Plant and Equipment | | | | | | | | | | | | | | | 133,821 | | | | | |
| | | | | | | | | | | | | | | | | | | | |
| | | |
TOTAL TARONG ENERGY CORPORATION LIMITED | | | | | | | | 133,821 | | | | | |
| | | | | | | | | | | | | | | | | | | | |
| | | | | |
POWERLINK QUEENSLAND | | | | | | | | | | | | | | | | | | | | |
| | | | | |
Property, Plant and Equipment | | | | | | | | | | | | | | | | | | | | |
Other Projects | | | Various | | | | 267,600 | | | | | | | | 267,600 | | | | | |
Yabulu South to Ingham Transmission Replacement. (Ross to Ingham) | | | 45 | | | | 121,400 | | | | 25,500 | | | | 65,200 | | | | 30,700 | |
Tarong Secondary Systems Replacement | | | 15 | | | | 24,500 | | | | 12,400 | | | | 2,300 | | | | 9,800 | |
Swanbank A 110 kV Substation Rebuild | | | 05 | | | | 34,400 | | | | 9,000 | | | | 16,000 | | | | 9,400 | |
South Pine 110kV Substation Refurbishment - Stage 1 | | | 05 | | | | 63,000 | | | | 54,500 | | | | 8,500 | | | | | |
Belmont 110kV Substation Refurbishment | | | 05 | | | | 50,300 | | | | 35,900 | | | | 9,900 | | | | 4,500 | |
Bowen Substation Establishment | | | 40 | | | | 73,000 | | | | 51,300 | | | | 21,700 | | | | | |
Bouldercombe to South Pine Earthwire Replacement | | | Various | | | | 35,400 | | | | 19,500 | | | | 5,300 | | | | 10,600 | |
South West Queensland Augmentation | | | Various | | | | 278,000 | | | | 5,200 | | | | 117,000 | | | | 155,800 | |
| | | | |
| | Capital Statement 2010-11 | | 65 |
Employment, Economic Development and Innovation
| | | | | | | | | | | | | | | | | | |
Project | | Statistical
Division | | Total
Estimated
Cost $’000 | | | Expenditure
to 30-06-10
$’000 | | | Budget
2010-11 $’000 | | | Post
2010-11 $’000 | |
North Qld Transmission Reinf. Stage 3 (Strathmore to Ross) | | 45 | | | 218,000 | | | | 169,800 | | | | 48,200 | | | | | |
Gladstone Substation Replacement | | 30 | | | 164,000 | | | | 2,600 | | | | 6,200 | | | | 155,200 | |
Halys to Blackwall 500kV Augmentation | | Various | | | 530,000 | | | | 3,000 | | | | 6,100 | | | | 520,900 | |
| | | | | | | | | | | | | | | | | | |
Total Property, Plant and Equipment | | | | | | | | | | | | | 574,000 | | | | | |
| | | | | | | | | | | | | | | | | | |
| | | | | |
TOTAL POWERLINK QUEENSLAND | | | | | | | | | | | | | 574,000 | | | | | |
| | | | | | | | | | | | | | | | | | |
| | | | | |
ERGON ENERGY CORPORATION LIMITED | | | | | | | | | | | | | | | | | | |
| | | | | |
Property, Plant and Equipment | | | | | | | | | | | | | | | | | | |
REGULATED CAPITAL EXPENDITURE | | | | | | | | | | | | | | | | | | |
Regulated Corporation Initiated Capital Works | | | | | | | | | | | | | | | | | | |
Cyclone Area Reliability Enhancement (CARE) Program - Northern | | 45 | | | | | | | | | | | 2,142 | | | | Ongoing | |
Sundry Network Initiated Capital Works (NICW) - Far North | | 50 | | | | | | | | | | | 37,621 | | |
| Ongoing
|
|
Sundry NICW - Northern | | 45 | | | | | | | | | | | 46,730 | | | | Ongoing | |
Sundry NICW - Mackay | | 40 | | | | | | | | | | | 56,622 | | | | Ongoing | |
Sundry NICW - Fitzroy | | 30 | | | | | | | | | | | 38,114 | | | | Ongoing | |
Sundry NICW-Wide Bay-Burnett | | 15 | | | | | | | | | | | 45,306 | | | | Ongoing | |
Sundry NICW - Darling Downs | | 20 | | | | | | | | | | | 81,855 | | | | Ongoing | |
Reinforce Supply to Childers | | 15 | | | 6,807 | | | | 2,911 | | | | 2,447 | | | | 1,449 | |
Reinforce Supply North Queensland | | 45 | | | 8,255 | | | | 5,991 | | | | 2,264 | | | | | |
Reinforce Supply to Central Queensland | | 40 | | | 48,332 | | | | 5,706 | | | | 22,189 | | | | 20,437 | |
Reinforce Supply South West Queensland | | 20 | | | 11,620 | | | | 423 | | | | 6,197 | | | | 5,000 | |
Reinforce Supply to Curra | | 15 | | | 18,223 | | | | 2,160 | | | | 267 | | | | 15,796 | |
Reinforce Supply to Point Vernon | | 15 | | | 9,526 | | | | 830 | | | | 3,358 | | | | 5,338 | |
Reinforce Supply to Toogoom | | 15 | | | 7,909 | | | | 2,956 | | | | 3,944 | | | | 1,009 | |
Reinforce Supply to Airlie Beach - Jubileel | | 40 | | | 24,499 | | | | 20,223 | | | | 2,671 | | | | 1,605 | |
Reinforce Supply to Airlie Beach - Jubilee2 | | 40 | | | 15,199 | | | | 2,032 | | | | 8,170 | | | | 4,997 | |
| | | | |
| 66 | | Capital Statement 2010-11 | | |
Employment, Economic Development and Innovation
| | | | | | | | | | | | | | | | | | |
Project | | Statistical
Division | | Total
Estimated
Cost $’000 | | | Expenditure
to 30-06-10
$’000 | | | Budget
2010-11 $’000 | | | Post
2010-11 $’000 | |
Reinforce Supply to Dalby Central | | 20 | | | 27,812 | | | | 9,940 | | | | 12,209 | | | | 5,663 | |
Reinforce Supply to Dalby | | 20 | | | 28,940 | | | | 25,999 | | | | 2,941 | | | | | |
Reinforce Supply to South West | | 20 | | | 10,000 | | | | 6,775 | | | | 3,225 | | | | | |
Reinforce Supply to Townsville | | 45 | | | 20,532 | | | | 15,881 | | | | 4,651 | | | | | |
Reinforce Supply to Warwick | | 20 | | | 34,268 | | | | 28,356 | | | | 5,912 | | | | | |
Reinforce Supply to Capricornia Coast | | 30 | | | 27,210 | | | | 25,499 | | | | 1,711 | | | | | |
Reinforce Supply to North Rockhampton | | 30 | | | 23,160 | | | | 21,448 | | | | 1,712 | | | | | |
Reinforce Roma Bulk Supply | | 35 | | | 42,285 | | | | 15,411 | | | | 20,145 | | | | 6,729 | |
CARE Program - Far North | | Various | | | | | | | | | | | 5,152 | | | | Ongoing | |
Supervisory Control and Data Acquisition System (SCADA) Acceleration Program | | Various | | | 31,096 | | | | 366 | | | | 22,383 | | | | 8,347 | |
Ubinet | | Various | | | 149,257 | | | | 28,942 | | | | 70,000 | | | | 50,315 | |
Zone Substations - Mobile Connections | | Various | | | 8,166 | | | | 358 | | | | 1,400 | | | | 6,408 | |
| | | | | | | | | | | | | | | | | | |
Sub-total Regulated Corporation Initiated Capital Works | | | | | | | | | | | | | 511,338 | | | | | |
| | | | | | | | | | | | | | | | | | |
| | | | | |
Regulated Customer Initiated Capital Works | | | | | | | | | | | | | | | | | | |
Sundry Customer Initiated Capital Works (CICW) - Far North | | 50 | | | | | | | | | | | 54,426 | | | | Ongoing | |
Sundry CICW - Northern | | 45 | | | | | | | | | | | 49,732 | | | | Ongoing | |
Sundry CICW - Mackay | | 40 | | | | | | | | | | | 40,324 | | | | Ongoing | |
Sundry CICW - Fitzroy | | 30 | | | | | | | | | | | 44,812 | | | | Ongoing | |
Sundry CICW-Wide Bay-Burnett | | 15 | | | | | | | | | | | 56,326 | | | | Ongoing | |
Sundry CICW - Darling Downs | | 20 | | | | | | | | | | | 49,900 | | | | Ongoing | |
Major Customer - Abbot Point | | 40 | | | 32,354 | | | | 30,207 | | | | 2,147 | | | | | |
Major Customer - Dalrymple Bay/Hay Point | | 40 | | | 60,479 | | | | 58,138 | | | | 2,341 | | | | | |
Major Customer - Kogan | | 20 | | | 23,570 | | | | 22,614 | | | | 956 | | | | | |
| | | | | | | | | | | | | | | | | | |
Sub-total Regulated Customer Initiated Capital Works | | | | | | | | | | | | | 300,964 | | | | | |
| | | | | | | | | | | | | | | | | | |
| | | | |
| | Capital Statement 2010-11 | | 67 |
Employment, Economic Development and Innovation
| | | | | | | | | | | | | | | | | | | | |
Project | | Statistical
Division | | | Total Estimated
Cost $’000 | | | Expenditure
to 30-06-10 $’000 | | | Budget
2010-11 $’000 | | | Post
2010-11 $’000 | |
Other Regulated Asset Additions | | | | | | | | | | | | | | | | | | | | |
Other Regulated Capital Works | | | Various | | | | | | | | | | | | 93,229 | | | | Ongoing | |
| | | | | | | | | | | | | | | | | | | | |
Sub-total Other Regulated Asset Additions | | | | | | | | | | | | | | | 93,229 | | | | | |
| | | | | | | | | | | | | | | | | | | | |
| | | | | |
Sub-total REGULATED CAPITAL EXPENDITURE | | | | | | | | | | | | | | | 905,531 | | | | | |
| | | | | | | | | | | | | | | | | | | | |
| | | | | |
Isolated Systems | | | | | | | | | | | | | | | | | | | | |
Powerstation - Birdsville Geothermal | | | 35 | | | | 20,979 | | | | 250 | | | | 8,319 | | | | 12,410 | |
Other Generation Capital Works | | | Various | | | | | | | | | | | | 23,491 | | | | Ongoing | |
| | | | | | | | | | | | | | | | | | | | |
Sub-total Isolated Systems | | | | | | | | | | | | | | | 31,810 | | | | | |
| | | | | | | | | | | | | | | | | | | | |
Non-Regulated Asset Additions | | | | | | | | | | | | | | | | | | | | |
Non Regulated Corporation Initiated Works | | | Various | | | | | | | | | | | | 325 | | | | Ongoing | |
| | | | | | | | | | | | | | | | | | | | |
Sub-total Non-Regulated Asset Additions | | | | | | | | | | | | | | | 325 | | | | | |
| | | | | | | | | | | | | | | | | | | | |
| | | | | |
Total Property, Plant and Equipment | | | | | | | | | | | | | | | 937,666 | | | | | |
| | | | | | | | | | | | | | | | | | | | |
| | | |
TOTAL ERGON ENERGY CORPORATION LIMITED | | | | | | | | 937,666 | | | | | |
| | | | | | | | | | | | | | | | | | | | |
| | | | | |
TOURISM QUEENSLAND | | | | | | | | | | | | | | | | | | | | |
| | | | | |
Property, Plant and Equipment | | | | | | | | | | | | | | | | | | | | |
Exchange reimplimentation | | | 05 | | | | 105 | | | | | | | | 105 | | | | | |
Server upgrade | | | 05 | | | | 78 | | | | | | | | 78 | | | | | |
| | | | | | | | | | | | | | | | | | | | |
| | | | | |
Total Property, Plant and Equipment | | | | | | | | | | | | | | | 183 | | | | | |
| | | | | | | | | | | | | | | | | | | | |
| | | | | |
TOTAL TOURISM QUEENSLAND | | | | | | | | | | | | | | | 183 | | | | | |
| | | | | | | | | | | | | | | | | | | | |
| | |
TOTAL EMPLOYMENT, ECONOMIC DEVELOPMENT AND INNOVATION | | | | 3,279,209 | | | | | |
| | | | | | | | | | | | | | | | | | | | |
| | | | |
| 68 | | Capital Statement 2010-11 | | |
ENVIRONMENT AND RESOURCE MANAGEMENT
The capital program for the Environment and Resource Management portfolio (including the department, Queensland Bulk Water Supply Authority, Queensland Bulk Water Transport Authority, Queensland Manufactured Water Authority, SEQ Water Grid Manager, Gladstone Area Water Board, Mount Isa Water Board and SunWater) for 2010-11 is $455.7 million.
Department of Environment and Resource Management
The department’s 2010-11 capital program principally supports the planning and management of the State’s water, land and vegetation resources and protection of Queensland’s natural and cultural heritage. The department’s 2010-11 capital budget is $127.5 million and demonstrates the Government’s commitment to the Towards Q2 Strong and Green Ambitions.
Program Highlights
| • | | $17.1 million for infrastructure within parks and forests as well as other building and accommodation upgrades. |
| • | | $14 million for land acquisitions and capital grants to deliver the Queensland Government’s Koala Response Strategy at a budgeted total cost of $43.5 million. The strategy aims to halt the serious decline of South East Queensland’s koala populations and has an overarching goal of increasing mature koala habitat by 2020. |
| • | | $2.1 million in 2010-11 for acquisition of national park lands towards achieving the Queensland Government’s Green Q2 target of increasing the area of national park to 7.5% of the State by 2020. |
| • | | $6.2 million to implement the new Queensland waste reform agenda to avoid waste generation and improve resource efficiency and recovery. Capital funding will be provided to build the required information technology systems and assist with the provision of infrastructure to local government. |
| • | | The program of dam spillway upgrades will continue in 2010-11 with $10 million provided for capital works statewide. |
| • | | The acquisition of land for future water infrastructure projects will continue with $48.2 million set aside in 2010-11 for strategic land purchases relating to Connors River dam. |
Gladstone Area Water Board
The Gladstone Area Water Board’s capital budget is $27.2 million for 2010-11.
| | | | |
| | Capital Statement 2010-11 | | 69 |
Program Highlights
| • | | $9.1 million to construct an off-line storage dam facility. |
| • | | $2.1 million for the planning stage of the Lower Fitzroy River Weirs. |
| • | | $1.8 million to replace the Carbon Batching and Dosing Plant at the Gladstone Water Treatment Plant to consistently produce potable water of a high quality. |
| • | | $1.6 million to construct a new embankment at Saddle Dam No. 3 at Awoonga Dam. |
| • | | $1.2 million for the transition and management stage of the Gladstone-Fitzroy Pipeline project. |
Mount Isa Water Board
The Mount Isa Water Board’s capital budget is $4.9 million for 2010-11 and includes $1.2 million for Stage 2 of the Lake Moondarra to Mount Isa Terminal Reservoir Pipeline replacement project, $0.9 million for the installation of a fluoridation plant at Mount Isa Terminal Reservoir Pump Station and $2.8 million for various infrastructure and asset upgrades.
SunWater
SunWater’s capital budget of $37.1 million for 2010-11 includes $14.5 million for the ongoing asset refurbishment program, $12 million for the Kinchant Dam spillway upgrade and $6.2 million for the Tinaroo Dam spillway upgrade.
Queensland Bulk Water Supply Authority
The Queensland Bulk Water Supply Authority’s capital budget for 2010-11 is $133.1 million. Major projects include $7.4 million for the initial planning and development of the proposed Wyaralong Water Treatment Plant, $12.9 million for the upgrade of existing dams, weirs and water treatment plants and $90 million for the Hinze Dam Stage 3 project. The project is due for completion in December 2010 and will provide a total capacity of nearly 310 megalitres, and deliver an extra 16 megalitres per day into the South East Queensland Water Grid.
Queensland Bulk Water Transport Authority
The Queensland Bulk Water Transport Authority has allocated $34.6 million in 2010-11 to the upgrade of SEQ Water Infrastructure Assets, including $32 million for enhancements to trunk mains, related pipework and pumping stations.
| | | | |
| 70 | | Capital Statement 2010-11 | | |
Queensland Manufactured Water Authority
The capital program for the Queensland Manufactured Water Authority for 2010-11 is $90.7 million, primarily to complete climate resiliant water supply projects.
SEQ Water Grid Manager
The capital program for the SEQ Water Grid Manager for 2010-11 is $0.7 million, primarily to continue the development of systems and processes to improve the efficiency of the operations of the SEQ Water Grid.
Environment and Resource Management
| | | | | | | | | | | | | | | | | | |
Project | | Statistical
Division | | Total Estimated
Cost
$’000 | | | Expenditure
to 30-06-10
$’000 | | | Budget
2010-11 $’000 | | | Post
2010-11 $’000 | |
DEPARTMENT OF ENVIRONMENT AND RESOURCE MANAGEMENT | | | | | | | | | | | | | | | | | | |
Property, Plant and Equipment | | | | | | | | | | | | | | | | | | |
Land acquisitions | | | | | | | | | | | | | | | | | | |
Connors River dam | | 40 | | | 68,216 | | | | 20,000 | | | | 48,216 | | | | | |
Koala Response Strategy | | Various | | | 3,000 | | | | | | | | 3,000 | | | | | |
Rainforest/Green land acquisitions | | 50 | | | 30,000 | | | | 26,500 | | | | 3,500 | | | | | |
National Parks (Q2 target) | | Various | | | 7,940 | | | | 5,840 | | | | 2,100 | | | | | |
Dam spillway upgrades | | 50 | | | 18,472 | | | | 10,472 | | | | 2,000 | | | | 6,000 | |
Capital Works - Parks and Forests | | | | | | | | | | | | | | | | | | |
Construction of Tewantin Ranger Base | | 09 | | | 1,666 | | | | 1,371 | | | | 295 | | | | | |
Redevelop day use area at Lake McKenzie on Fraser Island | | 15 | | | 1,039 | | | | 787 | | | | 252 | | | | | |
Redevelop car park at Joseph Banks Conservation Park | | 15 | | | 673 | | | | 113 | | | | 560 | | | | | |
Relocate workshop and compound to Bunya Mountains National Park | | 15 | | | 505 | | | | 390 | | | | 115 | | | | | |
Fencing for boundary re-alignments | | 30 | | | 504 | | | | 160 | | | | 172 | | | | 172 | |
Upgrade roads and carparks at Combo Conservation Park 1 | | 35 | | | 364 | | | | 263 | | | | 101 | | | | | |
Upgrade Jetty at Lytton Quarantine Station | | 05 | | | 356 | | | | 4 | | | | 352 | | | | | |
Upgrade communications facilities | | 50 | | | 300 | | | | 100 | | | | 200 | | | | | |
MinorWorks - Parks and Forests | | Various | | | 11,002 | | | | | | | | 11,002 | | | | | |
Building and accommodation upgrades | | Various | | | | | | | | | | | 4,085 | | | | Ongoing | |
| | | | |
| | Capital Statement 2010-11 | | 71 |
Environment and Resource Management
| | | | | | | | | | | | | | | | | | | | |
Project | | Statistical
Division | | | Total
Estimated
Cost
$’000 | | | Expenditure
to 30-06-10 $’000 | | | Budget
2010-11 $’000 | | | Post
2010-11 $’000 | |
Land development and management system | | | 05 | | | | | | | | | | | | 2,100 | | | | Ongoing | |
Plant and equipment | | | | | | | | | | | | | | | | | | | | |
Water Reform - continuity of supply | | | 05 | | | | | | | | | | | | 1,000 | | | | Ongoing | |
Other plant and equipment | | | Various | | | | | | | | | | | | 9,901 | | | | Ongoing | |
| | | | | | | | | | | | | | | | | | | | |
Total Property, Plant and Equipment | | | | | | | | | | | | | | | 88,951 | | | | | |
| | | | | | | | | | | | | | | | | | | | |
| | | | | |
Other Capital Expenditure | | | | | | | | | | | | | | | | | | | | |
Queensland Waste Reform Strategy Implementation | | | 05 | | | | 2,100 | | | | | | | | 2,100 | | | | | |
Property Valuation System upgrade | | | 05 | | | | 1,950 | | | | 1,200 | | | | 750 | | | | | |
Parks Information System enhancement | | | Various | | | | 882 | | | | 319 | | | | 563 | | | | | |
Urban Water Management Systems | | | 05 | | | | | | | | | | | | 500 | | | | Ongoing | |
Other systems development | | | 05 | | | | | | | | | | | | 4,083 | | | | Ongoing | |
| | | | | | | | | | | | | | | | | | | | |
Total Other Capital Expenditure | | | | | | | | | | | | | | | 7,996 | | | | | |
| | | | | | | | | | | | | | | | | | | | |
| | | | | |
Capital Grants | | | | | | | | | | | | | | | | | | | | |
Koala Response Strategy | | | Various | | | | 40,490 | | | | 4,690 | | | | 11,000 | | | | 24,800 | |
Dam spillway upgrades | | | Various | | | | 58,839 | | | | 27,900 | | | | 8,000 | | | | 22,939 | |
Water for the Future | | | Various | | | | 17,437 | | | | | | | | 7,426 | | | | 10,011 | |
Queensland Waste Reform Strategy Implementation | | | Various | | | | 4,100 | | | | | | | | 4,100 | | | | | |
| | | | | | | | | | | | | | | | | | | | |
Total Capital Grants | | | | | | | | | | | | | | | 30,526 | | | | | |
| | | | | | | | | | | | | | | | | | | | |
| | | | | |
TOTAL DEPARTMENT OF ENVIRONMENT AND RESOURCE MANAGEMENT | | | | | | | | | | | | | | | 127,473 | | | | | |
| | | | | | | | | | | | | | | | | | | | |
| | | | | |
GLADSTONE AREA WATER BOARD | | | | | | | | | | | | | | | | | | | | |
Property, Plant and Equipment | | | | | | | | | | | | | | | | | | | | |
Construction of an off-line Storage Dam | | | 30 | | | | 20,691 | | | | 250 | | | | 9,142 | | | | 11,299 | |
Lower Fitzroy RiverWeirs - Planning Stage | | | 30 | | | | 5,716 | | | | 2,505 | | | | 2,130 | | | | 1,081 | |
Replace Carbon Batching and Dosing Plant | | | 30 | | | | 1,879 | | | | 35 | | | | 1,844 | | | | | |
Construction of a new embankment at Saddle Dam No. 3 | | | 30 | | | | 23,949 | | | | | | | | 1,595 | | | | 22,354 | |
Rationalisation of land holdings | | | 30 | | | | 1,467 | | | | 89 | | | | 1,168 | | | | 210 | |
| | | | |
| 72 | | Capital Statement 2010-11 | | |
Environment and Resource Management
| | | | | | | | | | | | | | | | | | |
Project | | Statistical
Division | | Total Estimated
Cost
$’000 | | | Expenditure
to 30-06-10
$’000 | | | Budget
2010-11 $’000 | | | Post
2010-11 $’000 | |
Fitzroy Pipeline project - Transition and Management Stage | | 30 | | | 7,431 | | | | 2,135 | | | | 1,157 | | | | 4,139 | |
Installation of Flow Meters to Fitzsimmons Street Raw Water Reservoir | | 30 | | | 1,500 | | | | 587 | | | | 913 | | | | | |
Upgrade Water Treatment Plant Facilities | | 30 | | | 6,316 | | | | 4 | | | | 764 | | | | 5,548 | |
Various pipeline replacements | | 30 | | | 4,306 | | | | | | | | 750 | | | | 3,556 | |
Boat Creek Raw Water Network reinstatement works | | 30 | | | 975 | | | | 325 | | | | 650 | | | | | |
Roof replacement at South Gladstone Reservoir | | 30 | | | 816 | | | | 256 | | | | 560 | | | | | |
Upgrade to Building Structures around Awoonga Dam | | 30 | | | 1,096 | | | | | | | | 532 | | | | 564 | |
Lining replacement - Awoonga to Gladstone Pipeline | | 30 | | | 732 | | | | 200 | | | | 532 | | | | | |
Delivery Network upgrades | | 30 | | | 14,480 | | | | | | | | 519 | | �� | | 13,961 | |
Instal Emergency Power Supply at Gladstone Water Treatment Plant | | 30 | | | 2,086 | | | | | | | | 512 | | | | 1,574 | |
Post-Tensioning refurbishment at Mt Miller Reservoir | | 30 | | | 478 | | | | | | | | 478 | | | | | |
Roof replacement at Gladstone Water Treatment Plant | | 30 | | | 575 | | | | 100 | | | | 475 | | | | | |
Replace Polyelectrolyte Batching and Dosing Plant | | 30 | | | 685 | | | | 255 | | | | 430 | | | | | |
Golegumma TW Pipeline replacement | | 30 | | | 7,060 | | | | | | | | 425 | | | | 6,635 | |
Awoonga Dam Projects | | 30 | | | 3,172 | | | | | | | | 407 | | | | 2,765 | |
Upgrades and replacements at Awoonga Dam Recreation Area | | 30 | | | 1,088 | | | | 61 | | | | 380 | | | | 647 | |
Head Office minor works | | 30 | | | 3,267 | | | | | | | | 342 | | | | 2,925 | |
Upgrade Remote Operation of Valves at Awoonga Dam | | 30 | | | 340 | | | | | | | | 340 | | | | | |
Relocation and upgrade of Hatchery | | 30 | | | 318 | | | | | | | | 318 | | | | | |
Upgrade Intake Tower Cranes at Awoonga Dam | | 30 | | | 454 | | | | 154 | | | | 300 | | | | | |
Toolooa Reservoir Seal replacement | | 30 | | | 650 | | | | 102 | | | | 266 | | | | 282 | |
| | | | | | | | | | | | | | | | | | |
Total Property, Plant and Equipment | | | | | | | | | | | | | 26,929 | | | | | |
| | | | | | | | | | | | | | | | | | |
Other Capital Expenditure | | | | | | | | | | | | | | | | | | |
Other systems development | | 30 | | | 428 | | | | | | | | 274 | | | | 154 | |
| | | | | | | | | | | | | | | | | | |
Total Other Capital Expenditure | | | | | | | | | | | | | 274 | | | | | |
| | | | | | | | | | | | | | | | | | |
| | | | | |
TOTAL GLADSTONE AREA WATER BOARD | | | | | | | | | | | | | 27,203 | | | | | |
| | | | | | | | | | | | | | | | | | |
| | | | |
| | Capital Statement 2010-11 | | 73 |
Environment and Resource Management
| | | | | | | | | | | | | | | | | | | | |
Project | | Statistical
Division | | | Total Estimated
Cost
$’000 | | | Expenditure
to 30-06-10
$’000 | | | Budget
2010-11 $’000 | | | Post
2010-11 $’000 | |
MOUNT ISA WATER BOARD | | | | | | | | | | | | | | | | | | | | |
Property, Plant and Equipment | | | | | | | | | | | | | | | | | | | | |
Lake Moondarra to Mount Isa Terminal Reservoir Pipeline replacement- Stage 2 | | | 55 | | | | 3,720 | | | | 1,520 | | | | 1,200 | | | | 1,000 | |
Fluoridation Plant Installation at Mount Isa Terminal Reservoir Pump Station | | | 55 | | | | 1,500 | | | | 5 | | | | 900 | | | | 595 | |
Lining of Mount Isa Terminal Reservoir North and South Tanks | | | 55 | | | | 914 | | | | 64 | | | | 400 | | | | 450 | |
Mount Isa Water Board Office Building upgrade | | | 55 | | | | 403 | | | | 23 | | | | 380 | | | | | |
Repairs to Mount Isa Terminal Reservoir 50ML Tank Wall | | | 55 | | | | 300 | | | | | | | | 300 | | | | | |
Recreational Reserve Powerline upgrade | | | 55 | | | | 1,000 | | | | | | | | 250 | | | | 750 | |
Lake Julius Power Supply Pole replacement | | | 55 | | | | 442 | | | | 242 | | | | 200 | | | | | |
Water Metering Project | | | 55 | | | | 230 | | | | 80 | | | | 150 | | | | | |
Control Systems upgrade | | | 55 | | | | 281 | | | | 41 | | | | 70 | | | | 170 | |
Lake Julius Pipeline Control upgrade (F4) | | | 55 | | | | 30 | | | | | | | | 30 | | | | | |
Clear Water Lagoon Filtration System Project | | | 55 | | | | 8,000 | | | | | | | | 10 | | | | 7,990 | |
Clear Water Lagoon Treatment Plant Project | | | 55 | | | | 25,000 | | | | | | | | 10 | | | | 24,990 | |
Lake Moondarra Power Supply replacement | | | 55 | | | | 600 | | | | | | | | 15 | | | | 585 | |
Minor Capital Works | | | 55 | | | | 2,645 | | | | 272 | | | | 1,023 | | | | 1,350 | |
| | | | | | | | | | | | | | | | | | | | |
Total Property, Plant and Equipment | | | | | | | | | | | | | | | 4,938 | | | | | |
| | | | | | | | | | | | | | | | | | | | |
| | | | | |
TOTAL MOUNT ISA WATER BOARD | | | | | | | | | | | | | | | 4,938 | | | | | |
| | | | | | | | | | | | | | | | | | | | |
| | | | | |
SUNWATER | | | | | | | | | | | | | | | | | | | | |
Property, Plant and Equipment | | | | | | | | | | | | | | | | | | | | |
Upgrades | | | | | | | | | | | | | | | | | | | | |
Kinchant Dam Spillway | | | 40 | | | | 30,000 | | | | | | | | 12,000 | | | | 18,000 | |
Tinaroo Falls Dam Spillway | | | 50 | | | | 22,734 | | | | 16,116 | | | | 6,220 | | | | 398 | |
| | | | |
| 74 | | Capital Statement 2010-11 | | |
Environment and Resource Management
| | | | | | | | | | | | | | | | | | | | |
Project | | Statistical
Division | | | Total Estimated
Cost $’000 | | | Expenditure
to 30-06-10
$’000 | | | Budget
2010-11 $’000 | | | Post
2010-11 $’000 | |
Development of business cases | | | | | | | | | | | | | | | | | | | | |
Connors River Dam - Business Case | | | 40 | | | | 12,833 | | | | 10,235 | | | | 284 | | | | 2,314 | |
Nathan Dam - Business Case | | | 15 | | | | 16,395 | | | | 10,591 | | | | 219 | | | | 5,585 | |
Refurbishment and enhancement (service contracts) | | | | | | | | | | | | | | | | | | | | |
Mareeba Irrigation Distribution | | | 50 | | | | | | | | | | | | 2,956 | | | | Ongoing | |
Dawson Irrigation Distribution | | | 40 | | | | | | | | | | | | 1,510 | | | | Ongoing | |
Burdekin Irrigation Distribution | | | 45 | | | | | | | | | | | | 1,240 | | | | Ongoing | |
Macintyre Brook Water Supply | | | 20 | | | | | | | | | | | | 1,005 | | | | Ongoing | |
Emerald Irrigation Distribution | | | 30 | | | | | | | | | | | | 852 | | | | Ongoing | |
St George Water Supply | | | 25 | | | | | | | | | | | | 680 | | | | Ongoing | |
Collinsville Pipeline | | | 40 | | | | | | | | | | | | 576 | | | | Ongoing | |
Pioneer Water Supply | | | 40 | | | | | | | | | | | | 571 | | | | Ongoing | |
Burdekin Moranbah Pipeline | | | 45 | | | | | | | | | | | | 488 | | | | Ongoing | |
Barker Barambah Water Supply | | | 30 | | | | | | | | | | | | 403 | | | | Ongoing | |
Upper Condamine Water Supply | | | 25 | | | | | | | | | | | | 397 | | | | Ongoing | |
Eton Irrigation Distribution | | | 40 | | | | | | | | | | | | 355 | | | | Ongoing | |
Chinchilla Weir Water Supply | | | 20 | | | | | | | | | | | | 302 | | | | Ongoing | |
Dawson Water Supply | | | 40 | | | | | | | | | | | | 283 | | | | Ongoing | |
Lower Mary Irrigation Distribution | | | 30 | | | | | | | | | | | | 253 | | | | Ongoing | |
Other schemes (less than 250k) | | | 05 | | | | | | | | | | | | 2,654 | | | | Ongoing | |
Minor works | | | | | | | | | | | | | | | | | | | | |
Software development and hardware | | | 05 | | | | | | | | | | | | 2,192 | | | | Ongoing | |
Plant and equipment | | | 05 | | | | | | | | | | | | 1,615 | | | | Ongoing | |
| | | | | | | | | | | | | | | | | | | | |
Total Property, Plant and Equipment | | | | | | | | | | | | | | | 37,055 | | | | | |
| | | | | | | | | | | | | | | | | | | | |
| | | | | |
TOTAL SUNWATER | | | | | | | | | | | | | | | 37,055 | | | | | |
| | | | | | | | | | | | | | | | | | | | |
| | | | | |
QUEENSLAND BULK WATER SUPPLY AUTHORITY | | | | | | | | | | | | | | | | | | | | |
Property, Plant and Equipment | | | | | | | | | | | | | | | | | | | | |
Raising of the Hinze Dam | | | 07 | | | | 394,800 | | | | 289,800 | | | | 90,000 | | | | 15,000 | |
Wyaralong Water Treatment Plant | | | 07 | | | | 10,400 | | | | 3,000 | | | | 7,400 | | | | | |
Upgrade of the SCADA system | | | Various | | | | 47,401 | | | | | | | | 901 | | | | 46,500 | |
Upgrade of existing dams, weirs and water treatment plants | | | Various | | | | | | | | | | | | 12,860 | | | | Ongoing | |
Other capital works | | | Various | | | | | | | | | | | | 13,021 | | | | Ongoing | |
Other acquisitions | | | Various | | | | | | | | | | | | 3,370 | | | | Ongoing | |
Buildings projects | | | Various | | | | | | | | | | | | 1,905 | | | | Ongoing | |
| | | | | | | | | | | | | | | | | | | | |
Total Property, Plant and Equipment | | | | | | | | | | | | | | | 129,457 | | | | | |
| | | | | | | | | | | | | | | | | | | | |
| | | | |
| | Capital Statement 2010-11 | | 75 |
Environment and Resource Management
| | | | | | | | | | | | | | | | | | | | |
Project | | Statistical
Division | | | Total Estimated
Cost $’000 | | | Expenditure
to 30-06-10 $’000 | | | Budget
2010-11 $’000 | | | Post
2010-11 $’000 | |
Other Capital Expenditure | | | | | | | | | | | | | | | | | | | | |
Computer hardware and software | | | Various | | | | | | | | | | | | 3,617 | | | | Ongoing | |
| | | | | | | | | | | | | | | | | | | | |
Total Other Capital Expenditure | | | | | | | | | | | | | | | 3,617 | | | | | |
| | | | | | | | | | | | | | | | | | | | |
| | | | | |
TOTAL QUEENSLAND BULK WATER SUPPLY AUTHORITY | | | | | | | | | | | | | | | 133,074 | | | | | |
| | | | | | | | | | | | | | | | | | | | |
| | | | | |
QUEENSLAND BULK WATER TRANSPORT AUTHORITY | | | | | | | | | | | | | | | | | | | | |
Property, Plant and Equipment | | | | | | | | | | | | | | | | | | | | |
Enhancements to trunk mains, related pipework, and pumping stations | | | Various | | | | | | | | | | | | 31,963 | | | | Ongoing | |
| | | | | | | | | | | | | | | | | | | | |
Total Property, Plant and Equipment | | | | | | | | | | | | | | | 31,963 | | | | | |
| | | | | | | | | | | | | | | | | | | | |
| | | | | |
Other Capital Expenditure | | | | | | | | | | | | | | | | | | | | |
IT systems implementation | | | 05 | | | | | | | | | | | | 2,640 | | | | Ongoing | |
| | | | | | | | | | | | | | | | | | | | |
Total Other Capital Expenditure | | | | | | | | | | | | | | | 2,640 | | | | | |
| | | | | | | | | | | | | | | | | | | | |
| | | | | |
TOTAL QUEENSLAND BULK WATER TRANSPORT AUTHORITY | | | | | | | | | | | | | | | 34,603 | | | | | |
| | | | | | | | | | | | | | | | | | | | |
| | | | | |
QUEENSLAND MANUFACTURED WATER AUTHORITY | | | | | | | | | | | | | | | | | | | | |
Property, Plant and Equipment | | | | | | | | | | | | | | | | | | | | |
Western Corridor Recycled Water Project | | | 05 | | | | 2,493,000 | | | | 2,439,845 | | | | 53,155 | | | | | |
South East Queensland (Gold Coast) Desalination Plant | | | 07 | | | | 942,000 | | | | 911,237 | | | | 30,763 | | | | | |
Other capital works | | | Various | | | | 6,772 | | | | | | | | 6,772 | | | | | |
| | | | | | | | | | | | | | | | | | | | |
Total Property, Plant and Equipment | | | | | | | | | | | | | | | 90,690 | | | | | |
| | | | | | | | | | | | | | | | | | | | |
| | | | | |
TOTAL QUEENSLAND MANUFACTURED WATER AUTHORITY | | | | | | | | | | | | | | | 90,690 | | | | | |
| | | | | | | | | | | | | | | | | | | | |
| | | | | |
SEQ WATER GRID MANAGER | | | | | | | | | | | | | | | | | | | | |
Property, Plant and Equipment | | | | | | | | | | | | | | | | | | | | |
Plant and equipment | | | 05 | | | | | | | | | | | | 40 | | | | Ongoing | |
| | | | | | | | | | | | | | | | | | | | |
Total Property, Plant and Equipment | | | | | | | | | | | | | | | 40 | | | | | |
| | | | | | | | | | | | | | | | | | | | |
| | | | |
| 76 | | Capital Statement 2010-11 | | |
Environment and Resource Management
| | | | | | | | | | | | | | | | | | |
Project | | Statistical
Division | | Total
Estimated
Cost $’000 | | | Expenditure
to 30-06-10
$’000 | | | Budget
2010-11 $’000 | | | Post 2010-11 $’000 | |
Other Capital Expenditure | | | | | | | | | | | | | | | | | | |
Whole of Grid Projects | | 05 | | | | | | | | | | | 450 | | | | Ongoing | |
Website development | | 05 | | | | | | | | | | | 100 | | | | Ongoing | |
Customer Relationship Management Solution | | 05 | | | | | | | | | | | 50 | | | | Ongoing | |
Contract Management Capability | | 05 | | | | | | | | | | | 50 | | | | Ongoing | |
| | | | | | | | | | | | | | | | | | |
Total Other Capital Expenditure | | | | | | | | | | | | | 650 | | | | | |
| | | | | | | | | | | | | | | | | | |
| | | | | |
TOTAL SEQ WATER GRID MANAGER | | | | | | | | | | | | | 690 | | | | | |
| | | | | | | | | | | | | | | | | | |
| | | | | |
TOTAL ENVIRONMENT AND RESOURCE MANAGEMENT | | | | | | | | | | | | | 455,726 | | | | | |
| | | | | | | | | | | | | | | | | | |
| | | | |
| | Capital Statement 2010-11 | | 77 |
HEALTH
The total capital program for Queensland Health will see $1.634 billion invested in new capital acquisitions in 2010-11, and an additional capital investment of $75 million by the Queensland Institute of Medical Research (QIMR).
Department of Health
The Queensland Health capital works program is an important input into the delivery of health services and outputs that underpin the provision of dependable and better health care and support Government’s ambitions outlined in Toward Q2: Tomorrow’s Queensland.
In 2010-11, Queensland Health will continue its capital investment across a broad range of health care settings including community health centres, hospitals, health technology, pathology and scientific services, mental health services, residential care, staff accommodation, and information and communication technologies (ICT). This program will ensure that health infrastructure and assets support the delivery of health services and contribute to improved health outcomes for Queenslanders.
National Health and Hospitals Network
Under the Australian Government’s National Health and Hospitals Network (NHHN) reform funding package, Queensland will invest $257.4 million additional capital over four years (including $14.6 million for interim service enhancements at Nambour General Hospital) in initiatives to improve access to hospital services including emergency departments, elective surgery, multipurpose services and sub-acute care.
Regional Cancer Centres
Total capital funding of $16.4 million in 2010-11 ($179.3 million over four years, including $164.3 million from the Australian Government) will provide new or upgraded cancer centres in regional Queensland including:
| • | | enhancement to cancer services in North Queensland with 26 additional chemotherapy chairs, two additional linear accelerators and a Positron Emission Tomography scanner at Townsville and enhanced tele-oncology and chemotherapy treatment services at Mount Isa |
| • | | enhancing regional cancer services to Central Queensland through an increase in beds and day treatment spaces at Bundaberg, Hervey Bay and Rockhampton |
| • | | expanding medical oncology services in Southern Queensland by increasing the number of treatment spaces and inpatient beds at Toowoomba by 24. |
| | | | |
| 78 | | Capital Statement 2010-11 | | |
Sunshine Coast Interim Service Enhancements
To assist in managing increased service demand until the opening of the Sunshine Coast University Hospital, $11.5 million will be invested in 2010-11 ($26.1 million over two years) on the following projects:
| • | | Increased clinical capability and capacity at Caloundra Hospital emergency department to meet rising demand |
| • | | New cardiac catheterisation laboratory, endoscopy and vascular surgery suites at Nambour General Hospital, funded from the NHHN. |
Queensland Children’s Hospital
Funding of $95.5 million is provided over four years to directly fund the central energy facility and pathology laboratory following further consideration of delivery mechanisms for these facilities. In addition, $18.3 million is provided to relocate the Leukaemia Foundation of Queensland into improved and expanded premises to facilitate the development of the Queensland Children’s Hospital.
Priority Capital Program
$121.2 million over four years will be invested in a Priority Capital Program to facilitate a prioritised, state-wide program of capital works for Queensland Health, including asset refurbishment to facilitate the efficient and effective delivery of quality health services. This program will include minor refurbishment and/or renewal activities on buildings and engineering services, additional ICT infrastructure and equipment replacement.
Other Program Highlights
| • | | A total of $1.226 billion will be invested in hospital projects in 2010-11 including: |
| | • | | $636.9 million in 2010-11 to continue the planning and development of three new tertiary hospitals - the Gold Coast University Hospital, the Queensland Children’s Hospital and the Sunshine Coast University Hospital. A total investment of $5.132 billion has been committed to establish these new hospitals; |
| | • | | $4.3 million will be expended in 2010-11 ($80 million over five years from 2009-10) to ensure the new Queensland Children’s Hospital is supported by a world class academic and research centre; |
| | • | | $252.8 million will be expended in 2010-11 to continue redevelopments at Cairns, Mackay, Mount Isa, Rockhampton and Townsville Hospitals. These projects represent a total investment of $1.403 billion; |
| | | | |
| | Capital Statement 2010-11 | | 79 |
| | • | | $41.1 million in 2010-11 to continue upgrades to the emergency departments at Logan, QEII and Redland Hospitals under the $140.4 million Faster Emergency Care in our Hospitals initiative. Under this initiative, emergency departments at Caboolture, Ipswich and Toowoomba Hospitals will also be upgraded, as well as a dedicated paediatric emergency department at The Prince Charles Hospital; |
| | • | | hospital redevelopments expected to be completed and fully commissioned in 2010-11 include the Princess Alexandra Hospital emergency department upgrade, the Robina emergency department and intensive care upgrades, the Prince Charles Hospital upgrade and the Toowoomba Hospital Birthing Centre; and |
| | • | | $50 million is allocated in 2010-11 to progress projects to address health service demand management requirements throughout the State. |
| • | | $67.7 million will be invested in 2010-11 in Pathology and Scientific Services including enhancements to various forensic science locations across Queensland, expansion to the Hervey Bay pathology laboratory and development of the Translational Research Institute on the Princess Alexandra Hospital campus. A total investment of $353.5 million has been committed to establish these new facilities. |
| • | | In 2010-11 $33.2 million will be invested in community health services including the Thursday Island Chronic Disease Centre. Community Health Centres expected to be completed in 2010-11 include Cairns, Cherbourg, Gladstone and Middlemount, and Oral Health centres at various locations across Queensland. |
| • | | $4.4 million in 2010-11 towards projects to upgrade staff accommodation including $1.1 million for the Regional Accommodation Program and $1.5 million to complete the Moranbah staff accommodation funded through the Sustainable Resources Community Fund. |
| • | | In 2010-11, $57.5 million will fund provision of health technology equipment that supports the efficient delivery of safe, quality health services. |
| • | | Replacement of the residential aged care facility in Cloncurry will continue, with $1.3 million in 2010-11. |
| • | | $24.3 million will be invested in 2010-11 for enhancements to mental health services, including $23.3 million under the Queensland Plan for Mental Health (2007-17). |
| • | | $74.9 million will be invested in information and communication technology equipment to replace, upgrade and provide future capability to support the e-Health strategy and clinical information solutions. This investment incorporates telephone system, cabling, network and server replacements. |
| | | | |
| 80 | | Capital Statement 2010-11 | | |
| • | | $25.9 million will be invested in the continued state-wide roll-out of e-Health clinical and administrative support systems. Key highlights of e-Health stage one include: |
| | • | | an integrated electronic Medical Record (eMR) to allow clinicians and planners to have a single view of patient records; |
| | • | | Radiology Information Systems enabling the diagnostic images of Queenslanders living in regional and rural areas to be reviewed via tele-radiology systems; |
| | • | | mobile and fixed digital technology for breast screening to improve early detection and treatment of breast cancer for Queenslanders; |
| | • | | an Enterprise Discharge Summary to provide a reliable, comprehensive care record to patients and improve continuity of care by General Practitioners; and |
| | • | | access to patient data for all mental health clinicians across the State. |
Stage two of the e-Health program will leverage outcomes of stage one and continue the roll-out of an integrated eMR across Queensland Health through two key programs:
| | • | | Clinical Informatics Program that will deliver systems for results reporting, order entry, medications management, clinical notes and discharge summary; and |
| | • | | the eMR Viewer Program will ensure that key patient information held centrally by Queensland Health can be accessed appropriately by clinicians across the State. |
Council of the Queensland Institute of Medical Research
The QIMR capital program in 2010-11 will invest $1.1 million for the acquisition of new and/or replacement equipment including state-of-the-art scientific equipment.
In 2010-11, $73.9 million will continue the development of the Smart State Medical Research Centre. This $181.3 million project, scheduled for completion in 2012-13 is jointly funded by the Queensland and Australian Governments and Atlantic Philanthropies. Once completed, the Centre will increase current research capacity in areas such as tropical diseases, vaccine development, cancer and genetics, and will allow the development of a new Mental Health Research Division.
| | | | |
| | Capital Statement 2010-11 | | 81 |
Health
| | | | | | | | | | | | | | | | | | | | |
Project | | Statistical
Division | | | Total
Estimated
Cost $’000 | | | Expenditure
to 30-06-10
$’000 | | | Budget
2010-11 $’000 | | | Post
2010-11 $’000 | |
DEPARTMENT OF HEALTH | | | | | | | | | | | | | | | | | | | | |
Property, Plant and Equipment | | | | | | | | | | | | | | | | | | | | |
Community Health Centres (CHC) | | | | | | | | | | | | | | | | | | | | |
Caboolture Health Precinct | | | 05 | | | | 21,000 | | | | 3,173 | | | | 500 | | | | 17,327 | |
Cairns Central CHC | | | 50 | | | | 12,674 | | | | 7,097 | | | | 5,577 | | | | | |
Cherbourg Community Health | | | 15 | | | | 1,604 | | | | 10 | | | | 1,594 | | | | | |
Gladstone Community, Mental and Oral Health Consolidation | | | 30 | | | | 17,045 | | | | 14,022 | | | | 3,023 | | | | | |
Indigenous Alcohol Treatment and Rehabilitation | | | Various | | | | 6,700 | | | | 3,762 | | | | 2,938 | | | | | |
Middlemount Community Health Centre Extension | | | 40 | | | | 650 | | | | 516 | | | | 134 | | | | | |
Oral Health Queensland | | | Various | | | | 14,150 | | | | 10,469 | | | | 3,681 | | | | | |
Robina Health Precinct | | | 07 | | | | 36,310 | | | | 11,383 | | | | 7,121 | | | | 17,806 | |
Sunshine Coast Health Precinct | | | 09 | | | | 27,241 | | | | 20,765 | | | | 1,362 | | | | 5,114 | |
Thursday Island Chronic Disease Centre | | | 50 | | | | 39,015 | | | | 6,859 | | | | 3,144 | | | | 29,012 | |
Project Finalisation - CHC | | | Various | | | | 4,161 | | | | | | | | 4,161 | | | | | |
| | | | | | | | | | | | | | | | | | | | |
Sub-total Community Health Centres (CHC) | | | | | | | | | | | | | | | 33,235 | | | | | |
| | | | | | | | | | | | | | | | | | | | |
| | | | | |
Primary Health Care Centres (PHCC) | | | | | | | | | | | | | | | | | | | | |
Cape York Improved PHCC | | | 50 | | | | 1,840 | | | | 1,157 | | | | 683 | | | | | |
Hope Vale PHCC | | | 50 | | | | 11,454 | | | | 10,367 | | | | 1,087 | | | | | |
Indigenous Primary Health Care Centre of Excellence Inala | | | 05 | | | | 7,000 | | | | 136 | | | | 3,440 | | | | 3,424 | |
Mornington Island PHCC - Roof Repair | | | 55 | | | | 1,000 | | | | 200 | | | | 800 | | | | | |
Saibai Island PHCC | | | 50 | | | | 5,685 | | | | 75 | | | | 294 | | | | 5,316 | |
Project Finalisation - PHCC | | | Various | | | | 61 | | | | | | | | 61 | | | | | |
| | | | | | | | | | | | | | | | | | | | |
Sub-total Primary Health Care Centres (PHCC) | | | | | | | | | | | | | | | 6,365 | | | | | |
| | | | | | | | | | | | | | | | | | | | |
| | | | | |
Hospitals | | | | | | | | | | | | | | | | | | | | |
Area Health Services Demand Management | | | Various | | | | 297,500 | | | | 81,371 | | | | 50,000 | | | | 166,129 | |
Building Works Capital Project Management | | | Various | | | | | | | | | | | | 850 | | | | Ongoing | |
Bundaberg Hospital Expansion | | | 15 | | | | 41,886 | | | | 25,086 | | | | 11,698 | | | | 5,102 | |
Cairns Base Hospital | | | 50 | | | | 446,300 | | | | 49,940 | | | | 80,000 | | | | 316,360 | |
| | | | |
| 82 | | Capital Statement 2010-11 | | |
Health
| | | | | | | | | | | | | | | | | | |
Project | | Statistical
Division | | Total
Estimated
Cost $’000 | | | Expenditure
to 30-06-10 $’000 | | | Budget
2010-11 $’000 | | | Post 2010-11 $’000 | |
Cairns Hospital Emergency Department (Additional Bed Capacity) | | 50 | | | 11,100 | | | | 9,100 | | | | 2,000 | | | | | |
Cairns Radiation Oncology Facility | | 50 | | | 8,300 | | | | 4,300 | | | | 753 | | | | 3,247 | |
Cancer Treatment Facilities | | Various | | | 35,100 | | | | | | | | 1,002 | | | | 34,098 | |
Faster Emergency Care in our Hospitals (incl. expanded rehabilitation facilities) | | Various | | | 140,400 | | | | 6,659 | | | | 41,053 | | | | 92,688 | |
Gold Coast University Hospital | | 07 | | | 1,761,853 | | | | 285,624 | | | | 516,000 | | | | 960,229 | |
Ipswich Hospital Additional Beds | | 05 | | | 122,000 | | | | 1,503 | | | | 6,100 | | | | 114,397 | |
Mackay Base Hospital Redevelopment | | 40 | | | 408,285 | | | | 34,675 | | | | 75,000 | | | | 298,610 | |
Master Planning Studies | | Various | | | | | | | | | | | 850 | | | | Ongoing | |
Mount Isa Health Campus Redevelopment | | 55 | | | 65,190 | | | | 6,876 | | | | 6,698 | | | | 51,616 | |
National Health and Hospitals Network | | Various | | | 242,800 | | | | | | | | 10,350 | | | | 232,450 | |
Princess Alexandra Hospital Emergency Department (Additional Bed Capacity) | | 05 | | | 52,000 | | | | 35,418 | | | | 6,918 | | | | 9,664 | |
Priority Capital Program | | Various | | | 121,200 | | | | | | | | 6,850 | | | | 114,350 | |
Queensland Children’s Hospital | | 05 | | | 1,397,330 | | | | 153,519 | | | | 110,100 | | | | 1,133,711 | |
Queensland Children’s Hospital Academic and Research Centre | | 05 | | | 80,000 | | | | 250 | | | | 4,297 | | | | 75,453 | |
Regional Cancer Centres | | Various | | | 179,291 | | | | | | | | 16,350 | | | | 162,941 | |
Robina Hospital Emergency Department and Intensive Care Unit | | 07 | | | 42,232 | | | | 41,149 | | | | 1,083 | | | | | |
Robina Hospital Expansion | | 07 | | | 274,300 | | | | 95,724 | | | | 117,773 | | | | 60,803 | |
Rockhampton Hospital Expansion | | 30 | | | 149,075 | | | | 57,574 | | | | 38,000 | | | | 53,501 | |
Sunshine Coast Health Services District (Additional Bed Capacity) | | 09 | | | 191,000 | | | | 92,094 | | | | 37,961 | | | | 60,945 | |
Sunshine Coast Interim Service Enhancements | | | | | | | | | | | | | | | | | | |
Caloundra Hospital Emergency Department Expansion | | 09 | | | 11,500 | | | | | | | | 5,850 | | | | 5,650 | |
Nambour Hospital Elective1 Surgery | | 09 | | | 14,600 | | | | | | | | 5,650 | | | | 8,950 | |
Sunshine Coast University Hospital | | 09 | | | 1,972,500 | | | | 74,880 | | | | 10,864 | | | | 1,886,756 | |
The Prince Charles Hospital Upgrade | | 05 | | | 139,570 | | | | 136,132 | | | | 3,438 | | | | | |
| | | | |
| | Capital Statement 2010-11 | | 83 |
Health
| | | | | | | | | | | | | | | | | | |
Project | | Statistical
Division | | Total
Estimated
Cost
$’000 | | | Expenditure
to
30-06-10
$’000 | | | Budget
2010-11
$’000 | | | Post
2010-11
$’000 | |
Toowoomba Hospital Birthing Centre | | 20 | | | 1,000 | | | | 546 | | | | 454 | | | | | |
Townsville Hospital Expansion | | 45 | | | 334,000 | | | | 16,680 | | | | 53,085 | | | | 264,235 | |
Townsville Neo-natal Intensive Care Unit | | 45 | | | 25,000 | | | | | | | | 1,250 | | | | 23,750 | |
Project Finalisation - Hospitals | | Various | | | 3,958 | | | | | | | | 3,958 | | | | | |
| | | | | | | | | | | | | | | | | | |
Sub-total Hospitals | | | | | | | | | | | | | 1,226,235 | | | | | |
| | | | | | | | | | | | | | | | | | |
| | | | | |
Health Technology Replacement | | | | | | | | | | | | | | | | | | |
Health Technology Equipment | | Various | | | | | | | | | | | 55,000 | | | | Ongoing | |
Healthy Hearing | | Various | | | 2,825 | | | | 2,225 | | | | 200 | | | | 400 | |
Program Management | | Various | | | | | | | | | | | 1,233 | | | | Ongoing | |
Radiology Services Delivery | | Various | | | 3,907 | | | | 3,407 | | | | 500 | | | | | |
Project Finalisation - Health Technology Replacement | | Various | | | 619 | | | | | | | | 619 | | | | | |
| | | | | | | | | | | | | | | | | | |
Sub-total Health Technology Replacement | | | | | | | | | | | | | 57,552 | | | | | |
| | | | | | | | | | | | | | | | | | |
| | | | | |
Mental Health Services | | | | | | | | | | | | | | | | | | |
Queensland Mental Health Plan | | Various | | | 121,209 | | | | 18,082 | | | | 23,300 | | | | 79,827 | |
Queensland Mental Health Plan - Community | | Various | | | 11,236 | | | | 10,236 | | | | 1,000 | | | | | |
| | | | | | | | | | | | | | | | | | |
Sub-total Mental Health Services | | | | | | | | | | | | | 24,300 | | | | | |
| | | | | | | | | | | | | | | | | | |
| | | | | |
Pathology and Scientific Services | | | | | | | | | | | | | | | | | | |
Forensic Science Enhancement | | Various | | | 15,200 | | | | 3,474 | | | | 6,726 | | | | 5,000 | |
Hervey Bay Pathology Laboratory | | 15 | | | 4,270 | | | | 362 | | | | 3,759 | | | | 149 | |
Translational Research Institute2 Facilities | | 05 | | | 334,000 | | | | 17,264 | | | | 57,182 | | | | 259,554 | |
| | | | | | | | | | | | | | | | | | |
Sub-total Pathology and Scientific Services | | | | | | | | | | | | | 67,667 | | | | | |
| | | | | | | | | | | | | | | | | | |
| | | | | |
Residential Care | | | | | | | | | | | | | | | | | | |
State Government Aged Care Facilities Program | | | | | | | | | | | | | | | | | | |
Cloncurry Hospital Aged Care Annex | | 55 | | | 6,500 | | | | 160 | | | | 1,340 | | | | 5,000 | |
Nambour Residential Aged Care Facility | | 09 | | | 13,408 | | | | 12,985 | | | | 423 | | | | | |
Project Finalisation - Residential Care | | Various | | | 281 | | | | | | | | 281 | | | | | |
| | | | | | | | | | | | | | | | | | |
Sub-total Residential Care | | | | | | | | | | | | | 2,044 | | | | | |
| | | | | | | | | | | | | | | | | | |
| | | | |
| 84 | | Capital Statement 2010-11 | | |
Health
| | | | | | | | | | | | | | | | | | |
Project | | Statistical
Division | | Total Estimated
Cost $’000 | | | Expenditure
to 30-06-10
$’000 | | | Budget
2010-11 $’000 | | | Post
2010-11 $’000 | |
Staff Accommodation Program | | | | | | | | | | | | | | | | | | |
Cape York Staff Accommodation-Kowanyama | | 50 | | | 1,375 | | | | 32 | | | | 325 | | | | 1,018 | |
Housing Stock Upgrades | | Various | | | | | | | | | | | 1,000 | | | | Ongoing | |
Moranbah Health Staff Accommodation | | 40 | | | 1,600 | | | | 78 | | | | 1,522 | | | | | |
Regional Accommodation Program | | Various | | | 88,661 | | | �� | 86,632 | | | | 1,110 | | | | 919 | |
Project Finalisation - Staff Accommodation | | Various | | | 475 | | | | | | | | 475 | | | | | |
| | | | | | | | | | | | | | | | | | |
Sub-total Staff Accommodation Program | | | | | | | | | | | | | 4,432 | | | | | |
| | | | | | | | | | | | | | | | | | |
| | | | | |
Other Acquisitions of Property Plant and Equipment | | | | | | | | | | | | | | | | | | |
Capital Program Land Acquisition | | Various | | | 10,896 | | | | | | | | 10,896 | | | | | |
Emergent Works Program | | Various | | | | | | | | | | | 20,000 | | | | Ongoing | |
Minor Capital Projects and3 Acquisitions | | Various | | | | | | | | | | | 55,637 | | | | Ongoing | |
Project Finalisation - OAPPE | | Various | | | 933 | | | | | | | | 933 | | | | | |
| | | | | | | | | | | | | | | | | | |
Sub-total Other Acquisitions of Property Plant and Equipment | | | | | | | | | | | | | 87,466 | | | | | |
| | | | | | | | | | | | | | | | | | |
| | | | | |
Information Technology Equipment | | | | | | | | | | | | | | | | | | |
e-Health Clinical Systems | | Various | | | | | | | | | | | 10,157 | | | | Ongoing | |
IT Infrastructure Programs | | Various | | | | | | | | | | | 51,449 | | | | Ongoing | |
Other Health Systems | | Various | | | | | | | | | | | 13,340 | | | | Ongoing | |
| | | | | | | | | | | | | | | | | | |
Sub-total Information Technology Equipment | | | | | | | | | | | | | 74,946 | | | | | |
| | | | | | | | | | | | | | | | | | |
| | | | | |
Total Property, Plant and Equipment | | | | | | | | | | | | | 1,584,242 | | | | | |
| | | | | | | | | | | | | | | | | | |
| | | | | |
Other Capital Expenditure | | | | | | | | | | | | | | | | | | |
Information and Communication Technology4 | | | | | | | | | | | | | | | | | | |
e-Health Clinical Systems | | Various | | | | | | | | | | | 10,220 | | | | Ongoing | |
IT Contingency and Emergent Needs | | Various | | | | | | | | | | | 4,502 | | | | Ongoing | |
IT Infrastructure Programs | | Various | | | | | | | | | | | 8,585 | | | | Ongoing | |
Other Health Systems | | Various | | | | | | | | | | | 2,621 | | | | Ongoing | |
| | | | | | | | | | | | | | | | | | |
Sub-total Information and Communication Technology | | | | | | | | | | | | | 25,928 | | | | | |
| | | | | | | | | | | | | | | | | | |
| | | | | |
Inventory Movement | | Various | | | | | | | | | | | 1,521 | | | | Ongoing | |
| | | | | | | | | | | | | | | | | | |
Total Other Capital Expenditure | | | | | | | | | | | | | 27,449 | | | | | |
| | | | | | | | | | | | | | | | | | |
| | | | |
| | Capital Statement 2010-11 | | 85 |
Health
| | | | | | | | | | | | | | | | | | | | |
Project | | Statistical
Division | | | Total Estimated
Cost
$’000 | | | Expenditure
to 30-06-10 $’000 | | | Budget
2010-11 $’000 | | | Post
2010-11 $’000 | |
Capital Grants | | | | | | | | | | | | | | | | | | | | |
James Cook University Dental School Clinical Training | | | 45 | | | | 32,000 | | | | | | | | 22,000 | | | | 10,000 | |
| | | | | | | | | | | | | | | | | | | | |
Total Capital Grants | | | | | | | | | | | | | | | 22,000 | | | | | |
| | | | | | | | | | | | | | | | | | | | |
| | | | | |
TOTAL DEPARTMENT OF HEALTH | | | | | | | | | | | | | | | 1,633,691 | | | | | |
| | | | | | | | | | | | | | | | | | | | |
| | | | | |
COUNCIL OF THE QUEENSLAND INSTITUTE OF MEDICAL RESEARCH | | | | | | | | | | | | | | | | | | | | |
Property, Plant and Equipment | | | | | | | | | | | | | | | | | | | | |
Other scientific equipment | | | 05 | | | | 4,121 | | | | 3,031 | | | | 1,090 | | | | | |
Smart State Medical Research Centre* | | | 05 | | | | 181,251 | | | | 27,303 | | | | 73,861 | | | | 80,087 | |
| | | | | | | | | | | | | | | | | | | | |
Total Property, Plant and Equipment | | | | | | | | | | | | | | | 74,951 | | | | | |
| | | | | | | | | | | | | | | | | | | | |
| | | | | |
TOTAL COUNCIL OF THE QUEENSLAND RESEARCH AND INSTITUTE OF MEDICAL | | | | | | | | | | | | | | | 74,951 | | | | | |
| | | | | | | | | | | | | | | | | | | | |
| | | | | |
TOTAL HEALTH | | | | | | | | | | | | | | | 1,708,642 | | | | | |
| | | | | | | | | | | | | | | | | | | | |
Notes:
| 1. | National Health and Hospitals Network provides funding to support Sunshine Coast |
| 2. | State contribution of $100 million |
| 3. | Amount is net of $23.5 million non-capital component of project expenditure |
| 4. | Information and Communication Technology amount is net of $69.5 million non-capital |
| * | Funded fully or in part under the Smart State Building Fund |
| | | | |
| 86 | | Capital Statement 2010-11 | | |
INFRASTRUCTURE AND PLANNING
Department of Infrastructure and Planning
The department’s 2010-11 capital expenditure budget incorporating Property Services Group, Water Infrastructure Projects, Airport Link and the Urban Land Development Authority is $1.004 billion. In 2010-11 the department will deliver benefits for Queensland through planning, facilitation, delivery and coordination of strategic land use and major infrastructure projects and initiatives in collaboration with local governments and the community. The department will continue to work in partnership with the local government sector to build the sustainability of Queensland’s local government system, with an emphasis on asset management planning and improved long term financial planning.
Program Highlights
The Local Government Capital Program totals $459.9 million in 2010-11. In 2010-11 local government funding programs include:
| • | | $13.7 million to Cassowary Coast Regional Council for priority projects including the Innisfail Water Treatment Plant and the Jubilee Bridge |
| • | | $13.2 million to support the redevelopment of the Flinders Street Mall in Townsville |
| • | | $6.5 million to upgrade the Whitsunday Coast Airport complex |
| • | | $188.5 million towards the restoration of public assets under the Natural Disaster Relief Arrangements |
| • | | $110 million for the Local Government Grants and Subsidies program which includes funding for Townsville City Council for the upgrade of five wastewater treatment plants; Gladstone Regional Council for the Integrated Water and Sewerage Project and Carpentaria Shire Council for works on the Karumba Sewerage Scheme |
| • | | $59.3 million under the Indigenous Environmental Health Infrastructure Program for priority projects relating to the social housing program |
| • | | $31.3 million towards sewage treatment plant upgrades for Whitsunday Regional Council, Hinchinbrook Shire Council, Cassowary Coast Regional Council and the Tablelands Regional Council |
| • | | $19.7 million for the Fluoridation Capital Assistance Program to undertake capital works outside South East Queensland for the introduction of fluoridation |
| | | | |
| | Capital Statement 2010-11 | | 87 |
| • | | $5.3 million is being provided to enable the State to meet its obligations in acquiring the Surat Basin rail corridor |
| • | | $5.3 million to continue land acquisition in the Targinie precinct for the Aldoga Fisherman’s Landing Corridor |
| • | | $2.5 million to continue land acquisition associated with the Narangba Hardrock Haulage Corridor. |
In the 2009-10 Budget, the Government announced major reforms to the suite of local government grant programs. That included the introduction of a new scheme with revised funding criteria targetted at Councils with essential infrastructure projects that lack the financial capacity to deliver them.
The 2010-11 Budget includes funding to complete projects that were approved prior to the introduction of the changes, in line with the Government’s commitment.
Property Services Group
The Property Services Group delivers the property services component of the Industry Location Scheme. The Group’s functions include the acquisition, planning and development of land for business and industry locating to or expanding in Queensland. In 2010-11 the capital expenditure program for the Group totals $82.6 million.
Program Highlights
Industrial development and infrastructure projects are to proceed in 2010-11 including:
| • | $15.2 million for completion of Stage 1 of the Coolum Industrial Estate |
| • | $10.8 million to complete the development of the South Mackay Industrial Estate |
| • | $10.3 million for the development of the Willowbank Industrial Precinct |
| • | | $10 million towards the Gladstone State Development Area service infrastructure |
| • | $7.6 million for the Amberley Aerospace and Defence Support Centre |
| • | $6.0 million to develop the Charlton North Industrial Estate. |
The following land acquisitions are planned for 2010-11, subject to negotiations:
| • | | $6 million for the acquisition of land for future development of industrial estates in the Mackay region |
| | | | |
| 88 | | Capital Statement 2010-11 | | |
| • | | $5.5 million for the acquisition of land to extend the Abbot Point State Development Area |
| • | | $1.8 million for continued acquisition within South East Queensland for the future development of industrial estates |
| • | | $1.4 million for the acquisition of land within Far North Queensland for future industrial development. |
Water Infrastructure Projects
The Government established a number of special purpose vehicles to provide rigorous governance, management and delivery of water infrastructure projects which are progressing to the final phase of completion.
| • | | The $348 million Wyaralong Dam Project is well advanced. The Beaudesert-Boonah Road realignment is on track to open in mid-2010 and major construction is underway on the dam site. In 2010-11, $105 million has been allocated for construction works for the dam. The Wyaralong Dam will provide an additional 26,000 mega litres annually of water when operated in conjunction with the Cedar Grove Weir and Bromelton Offstream Storage. |
| • | | In 2010-11, $202.2 million has been allocated for the construction of the Northern Pipeline Interconnector Stage 2. This pipeline will be approximately 48 km and extend from Eudlo to Cooroy on the Sunshine Coast and due for completion in 2012 at a total cost of $440.4 million. |
| • | | $6.2 million has been allocated for preliminary project works on the Cedar Grove Connector which will link the Wyaralong Water Treatment Plant to the South East Queensland Water Grid. |
Airport Link
The construction of Airport Link commenced in 2008. This project is well progressed towards completion in mid 2012, including acquisition of the required land. $115.1 million has been allocated for this project in 2010-11.
| | | | |
| | Capital Statement 2010-11 | | 89 |
Urban Land Development Authority
The Urban Land Development Authority (ULDA) is constructing a multipurpose community facility in the Fitzgibbon Chase development to provide a community meeting place for residents. The Bushland Trails project involves the creation of 2.7 kilometres of trails through conservation land in Fitzgibbon.
Infrastructure and Planning
| | | | | | | | | | | | | | | | | | | | |
Project | | Statistical
Division | | | Total Estimated
Cost $’000 | | | Expenditure
to 30-06-10
$’000 | | | Budget
2010-11 $’000 | | | Post
2010-11 $’000 | |
DEPARTMENT OF INFRASTRUCTURE AND PLANNING | | | | | | | | | | | | | | | | | | | | |
Property, Plant and Equipment | | | | | | | | | | | | | | | | | | | | |
Hardrock Haulage Roads | | | 05 | | | | 23,450 | | | | 20,950 | | | | 2,500 | | | | | |
South East Queensland Regional Recreational Trails | | | Various | | | | 5,352 | | | | 2,272 | | | | 980 | | | | 2,100 | |
Surat Basin Railway Acquisition | | | 05 | | | | 5,335 | | | | | | | | 5,335 | | | | | |
Targinie Precinct | | | 30 | | | | 57,000 | | | | 51,700 | | | | 5,300 | | | | | |
Townsville State Development Area | | | 45 | | | | 6,000 | | | | 5,800 | | | | 200 | | | | | |
Whitsunday Coast Airport Upgrade | | | 40 | | | | 7,000 | | | | 520 | | | | 6,480 | | | | | |
Other property, plant and equipment | | | Various | | | | | | | | | | | | 236 | | | | Ongoing | |
| | | | | | | | | | | | | | | | | | | | |
Total Property, Plant and Equipment | | | | | | | | | | | | | | | 21,031 | | | | | |
| | | | | | | | | | | | | | | | | | | | |
| | | | | |
Other Capital Expenditure | | | | | | | | | | | | | | | | | | | | |
Callide to Gladstone LNG Land Corridor | | | 30 | | | | 5,000 | | | | 500 | | | | 4,500 | | | | | |
iProM System Development Project | | | 05 | | | | 705 | | | | 405 | | | | 300 | | | | | |
Land Acquisition Database | | | 05 | | | | 158 | | | | 108 | | | | 50 | | | | | |
Stanwell to Gladstone Infrastructure Corridor | | | 30 | | | | 600 | | | | | | | | 600 | | | | | |
| | | | | | | | | | | | | | | | | | | | |
Total Other Capital Expenditure | | | | | | | | | | | | | | | 5,450 | | | | | |
| | | | | | | | | | | | | | | | | | | | |
| | | | | |
Capital Grants | | | | | | | | | | | | | | | | | | | | |
Cassowary Coast Regional Council for Priority Projects | | | 05 | | | | 13,700 | | | | | | | | 13,700 | | | | | |
Flinders Street Mall Redevelopment - Townsville | | | 45 | | | | 18,900 | | | | 3,780 | | | | 13,230 | | | | 1,890 | |
Indigenous Environmental Health Infrastructure | | | Various | | | | | | | | | | | | 59,294 | | | | Ongoing | |
Jezzine Barracks Redevelopment -Townsville | | | 45 | | | | 10,000 | | | | 2,000 | | | | 2,000 | | | | 6,000 | |
| | | | |
| 90 | | Capital Statement 2010-11 | | |
Infrastructure and Planning
| | | | | | | | | | | | | | | | | | | | |
Project | | Statistical
Division | | | Total Estimated
Cost $’000 | | | Expenditure
to 30-06-10
$’000 | | | Budget
2010-11 $’000 | | | Post
2010-11 $’000 | |
Kuranda Skyrail and Infrastructure Levy | | | 50 | | | | | | | | | | | | 844 | | | | Ongoing | |
Natural Disaster Relief and Recovery Arrangements | | | Various | | | | | | | | | | | | 188,500 | | | | Ongoing | |
Queensland Fluoridation Assistance Program | | | Various | | | | 72,650 | | | | 7,000 | | | | 19,650 | | | | 46,000 | |
Sewage Treatment Upgrades | | | 05 | | | | 50,700 | | | | 5,000 | | | | 31,300 | | | | 14,400 | |
Smaller Communities Assistance Program | | | Various | | | | | | | | | | | | 7,468 | | | | Ongoing | |
Torres Strait Island Regional Council - Amalgamation cost funding for ICT initiatives | | | 50 | | | | 7,581 | | | | | | | | 7,581 | | | | | |
Water and Sewerage Program | | | Various | | | | | | | | | | | | 110,005 | | | | Ongoing | |
Other Program Works | | | Various | | | | | | | | | | | | 6,228 | | | | Ongoing | |
Other Water Programs | | | Various | | | | | | | | | | | | 105 | | | | Ongoing | |
| | | | | | | | | | | | | | | | | | | | |
Total Capital Grants | | | | | | | | | | | | | | | 459,905 | | | | | |
| | | | | | | | | | | | | | | | | | | | |
| | | | | |
TOTAL DEPARTMENT OF INFRASTRUCTURE AND PLANNING | | | | | | | | | | | | | | | 486,386 | | | | | |
| | | | | | | | | | | | | | | | | | | | |
| | | | | |
PROPERTY SERVICES GROUP | | | | | | | | | | | | | | | | | | | | |
Property, Plant and Equipment | | | | | | | | | | | | | | | | | | | | |
Asset replacement program | | | 05 | | | | | | | | | | | | 20 | | | | Ongoing | |
| | | | | | | | | | | | | | | | | | | | |
Total Property, Plant and Equipment | | | | | | | | | | | | | | | 20 | | | | | |
| | | | | | | | | | | | | | | | | | | | |
| | | | | |
Other Capital Expenditure | | | | | | | | | | | | | | | | | | | | |
Land Development | | | | | | | | | | | | | | | | | | | | |
Bunderberg Industrial park | | | 15 | | �� | | 350 | | | | | | | | 100 | | | | 250 | |
Abbot Point State Development Area - Service Infrastructure | | | 40 | | | | 6,500 | | | | 250 | | | | 250 | | | | 6,000 | |
Aerospace and Defence Support Centre Amberley | | | 05 | | | | 30,551 | | | | 2,850 | | | | 7,649 | | | | 20,052 | |
Bohle Industrial Estate Stage 6 | | | 45 | | | | 12,400 | | | | 9,578 | | | | 2,822 | | | | | |
Charlton North Industrial Estate | | | 20 | | | | 27,840 | | | | 1,023 | | | | 6,049 | | | | 20,768 | |
Clinton Industrial Estate - Red Rover Precinct | | | 30 | | | | 15,500 | | | | 100 | | | | 200 | | | | 15,200 | |
Coolum Industrial Estate - Stage 1 | | | 09 | | | | 36,000 | | | | 20,727 | | | | 15,186 | | | | 87 | |
Coolum Industrial Estate - Stage 2 | | | 09 | | | | 30,850 | | | | 100 | | | | 250 | | | | 30,500 | |
Willowbank Industrial Precinct (formally Ebenezer) | | | 05 | | | | 86,500 | | | | 1,243 | | | | 10,257 | | | | 75,000 | |
Gladstone State Development Area - service infrastructure | | | 30 | | | | 30,750 | | | | 750 | | | | 10,000 | | | | 20,000 | |
| | | | |
| | Capital Statement 2010-11 | | 91 |
Infrastructure and Planning
| | | | | | | | | | | | | | | | | | |
Project | | Statistical
Division | | Total Estimated
Cost $’000 | | | Expenditure
to 30-06-10
$’000 | | | Budget
2010-11 $’000 | | | Post
2010-11 $’000 | |
Mount Isa Nordale Industrial Estate | | 55 | | | 3,360 | | | | 698 | | | | 2,662 | | | | | |
Narangba Industrial Estate | | 05 | | | 2,100 | | | | 1,563 | | | | 537 | | | | | |
South Mackay Industrial Estate | | 40 | | | 14,400 | | | | 3,569 | | | | 10,831 | | | | | |
Minor works | | Various | | | | | | | | | | | 500 | | | | Ongoing | |
| | | | | | | | | | | | | | | | | | |
Sub-total Land Development | | | | | | | | | | | | | 67,293 | | | | | |
| | | | | | | | | | | | | | | | | | |
| | | | | |
Land Purchases | | | | | | | | | | | | | | | | | | |
Far North Queensland Strategic Land | | 50 | | | 8,000 | | | | | | | | 1,400 | | | | 6,600 | |
Abbot Point State Development Area | | 40 | | | 14,545 | | | | 9,000 | | | | 5,545 | | | | | |
Mackay Region Industrial Land | | 40 | | | 6,000 | | | | | | | | 6,000 | | | | | |
South East Queensland Strategic Land | | 05 | | | 16,653 | | | | 12,803 | | | | 1,850 | | | | 2,000 | |
Minor land acquisitions | | Various | | | | | | | | | | | 500 | | | | Ongoing | |
| | | | | | | | | | | | | | | | | | |
Sub-total Land Purchases | | | | | | | | | | | | | 15,295 | | | | | |
| | | | | | | | | | | | | | | | | | |
| | | | | |
Total Other Capital Expenditure | | | | | | | | | | | | | 82,588 | | | | | |
| | | | | | | | | | | | | | | | | | |
| | | | | |
TOTAL PROPERTY SERVICES GROUP | | | | | | | | | | | | | 82,608 | | | | | |
| | | | | | | | | | | | | | | | | | |
| | | | | |
WATER INFRASTRUCTURE PROJECTS | | | | | | | | | | | | | | | | | | |
Property, Plant and Equipment | | | | | | | | | | | | | | | | | | |
Cedar Grove Connector | | 12 | | | 7,000 | | | | 767 | | | | 6,233 | | | | | |
Northern Pipeline Interconnector Stage 2 | | 09 | | | 440,400 | | | | 192,824 | | | | 202,176 | | | | 45,400 | |
Toowoomba Pipeline | | 20 | | | 187,000 | | | | 184,832 | | | | 2,168 | | | | | |
Wyaralong Dam | | 12 | | | 348,000 | | | | 238,000 | | | | 105,000 | | | | 5,000 | |
| | | | | | | | | | | | | | | | | | |
Total Property, Plant and Equipment | | | | | | | | | | | | | 315,577 | | | | | |
| | | | | | | | | | | | | | | | | | |
| | | | | |
TOTAL WATER INFRASTRUCTURE PROJECTS | | | | | | | | | | | | | 315,577 | | | | | |
| | | | | | | | | | | | | | | | | | |
| | | | | |
AIRPORT LINK | | | | | | | | | | | | | | | | | | |
Property, Plant and Equipment | | | | | | | | | | | | | | | | | | |
Airport Link 1 | | 05 | | | 153,213 | | | | 33,981 | | | | 115,132 | | | | 4,100 | |
| | | | | | | | | | | | | | | | | | |
Total Property, Plant and Equipment | | | | | | | | | | | | | 115,132 | | | | | |
| | | | | | | | | | | | | | | | | | |
| | | | | |
TOTAL AIRPORT LINK | | | | | | | | | | | | | 115,132 | | | | | |
| | | | | | | | | | | | | | | | | | |
| | | | |
| 92 | | Capital Statement 2010-11 | | |
Infrastructure and Planning
| | | | | | | | | | | | | | | | | | | | |
Project | | Statistical
Division | | | Total Estimated
Cost $’000 | | | Expenditure
to 30-06-10 $’000 | | | Budget
2010-11 $’000 | | | Post
2010-11 $’000 | |
URBAN LAND DEVELOPMENT AUTHORITY | | | | | | | | | | | | | | | | | | | | |
Property, Plant and Equipment | | | | | | | | | | | | | | | | | | | | |
Asset Replacement Program | | | 05 | | | | 990 | | | | 365 | | | | 585 | | | | 40 | |
| | | | | | | | | | | | | | | | | | | | |
Total Property, Plant and Equipment | | | | | | | | | | | | | | | 585 | | | | | |
| | | | | | | | | | | | | | | | | | | | |
| | | | | |
Other Capital Expenditure | | | | | | | | | | | | | | | | | | | | |
Fitzgibbon Bushland Recreational Trails | | | 05 | | | | 883 | | | | 237 | | | | 646 | | | | | |
Fitzgibbon Community Development & Enterprise Centre | | | 05 | | | | 3,400 | | | | 680 | | | | 2,720 | | | | | |
| | | | | | | | | | | | | | | | | | | | |
Total Other Capital Expenditure | | | | | | | | | | | | | | | 3,366 | | | | | |
| | | | | | | | | | | | | | | | | | | | |
| | | | | |
TOTAL URBAN LAND DEVELOPMENT AUTHORITY | | | | | | | | | | | | | | | 3,951 | | | | | |
| | | | | | | | | | | | | | | | | | | | |
| | | | | |
TOTAL INFRASTRUCTURE AND PLANNING | | | | | | | | | | | | | | | 1,003,654 | | | | | |
| | | | | | | | | | | | | | | | | | | | |
Note:
| 1. | Total estimated cost includes land acquisition and early works, but excludes expenditure on land acquisition undertaken by the Department of Transport and Main Roads ($164 million) and the State’s contribution of $267.2 million towards the project. |
| | | | |
| | Capital Statement 2010-11 | | 93 |
JUSTICE AND ATTORNEY GENERAL
The 2010-11 capital expenditure program for the Department of Justice and Attorney-General (including Public Trust Office, Legal Aid Queensland, Crime and Misconduct Commission, Office of the Information Commissioner and Anti-Discrimination Commission Queensland) is $330 million.
Department of Justice and Attorney-General
The Department of Justice and Attorney-General capital expenditure program for 2010-11 is $317.8 million. The department’s capital program concentrates on the construction of new courthouses and new facilities, and the refurbishment and replacement of major building components for existing courthouses. It also includes the continual development and improvement of all departmental information systems and equipment.
Program Highlights
| • | | $290 million for the construction of the Brisbane Supreme Court and District Court. |
| • | | $2.6 million for the completion of an arrest court extension and new courtrooms at Southport Courthouse. This will enhance the courthouse’s capacity to deal with the increasing number of criminal and civil cases. |
| • | | $5.9 million for the continual upgrade, improvement and development of the department’s information system to ensure service delivery and operational efficiencies across the justice system. |
Public Trust Office
The 2010-11 capital expenditure program for the Public Trust Office is $7.9 million This expenditure will enable the Public Trust Office to continue to provide a wide range of efficient services to the Queensland community on a self funded basis. The Public Trustee will source the investment for these capital assets from its own funds at no cost to Government.
Program Highlights
| • | | $5.5 million will be spent on the refurbishment of existing offices throughout the state and $0.91 million on other property, plant and equipment during 2010-11. |
| • | | To ensure the Public Trust Office is maintaining optimal use of its computer hardware, a strategy has been developed to manage the upgrading of equipment on a rolling replacement strategy. The Public Trust Office is completely reliant on its computerised information systems to maintain efficient and cost effective services to its clients. The Public Trustee proposes to spend $0.56 million on computer hardware and $0.90 million on software during 2010-11. |
| | | | |
| 94 | | Capital Statement 2010-11 | | |
Legal Aid Queensland
The 2010-11 capital expenditure program for Legal Aid Queensland is $1.9 million. Legal Aid Queensland will invest $0.85 million in the replacement of office equipment and vehicles, $0.17 million in upgrading Brisbane accommodation and $0.85 million to develop an Electronic Document Records Management System.
Crime and Misconduct Commission
The 2010-11 capital expenditure program for the Crime and Misconduct Commission is $1.6 million. The Crime and Misconduct Commission will invest $0.36 million in leasehold improvements, $0.53 million in vehicle replacements and $0.74 million on computer and other equipment replacement.
Office Of the Information Commissioner
The 2010-11 capital expenditure program for the Office of the Information Commissioner in $0.76 million. Office of the Information Commissioner will invest $0.75 million on leasehold improvements and $0.01 million on computer and other equipment replacement.
Anti-Discrimination Commission
The 2010-11 capital expenditure program for the Anti-Discrimination Commission Queensland is $0.03 million. Anti-Discrimination Commission Queensland will invest $0.03 million on computer and other equipment replacement.
Justice and Attorney General
| | | | | | | | | | | | | | | | | | | | |
Project | | Statistical
Division | | | Total
Estimated
Cost $’000 | | | Expenditure
to 30-06-10 $’000 | | | Budget
2010-11 $’000 | | | Post 2010-11 $’000 | |
DEPARTMENT OF JUSTICE AND ATTORNEY-GENERAL | | | | | | | | | | | | | | | | | | | | |
Property, Plant and Equipment | | | | | | | | | | | | | | | | | | | | |
Brisbane Supreme and District Court complex | | | 05 | | | | 600,000 | | | | 164,451 | | | | 290,000 | | | | 145,549 | |
Southport, Arrest Court extension and fitout of additional courtrooms | | | 07 | | | | 4,000 | | | | 1,365 | | | | 2,635 | | | | | |
Buildings, programmed renewal | | | Various | | | | | | | | | | | | 8,489 | | | | Ongoing | |
Minor capital works | | | Various | | | | | | | | | | | | 3,296 | | | | Ongoing | |
Other acquisitions of property, plant and equipment | | | Various | | | | | | | | | | | | 6,663 | | | | Ongoing | |
| | | | | | | | | | | | | | | | | | | | |
Total Property, Plant and Equipment | | | | | | | | | | | | | | | 311,083 | | | | | |
| | | | | | | | | | | | | | | | | | | | |
| | | | |
| | Capital Statement 2010-11 | | 95 |
Justice and Attorney General
| | | | | | | | | | | | | | | | | | | | |
Project | | Statistical
Division | | | Total
Estimated
Cost $’000 | | | Expenditure
to 30-06-10 $’000 | | | Budget
2010-11 $’000 | | | Post 2010-11 $’000 | |
Other Capital Expenditure | | | | | | | | | | | | | | | | | | | | |
Queensland Wide Integrated Courts (QWIC) system enhancements | | | 05 | | | | | | | | | | | | 1,035 | | | | Ongoing | |
State Penalty Enforcement Registy (SPER) system enhancements | | | 05 | | | | | | | | | | | | 500 | | | | Ongoing | |
Minor capital works - software | | | 05 | | | | | | | | | | | | 3,020 | | | | Ongoing | |
Other capital | | | 05 | | | | | | | | | | | | 1,325 | | | | Ongoing | |
| | | | | | | | | | | | | | | | | | | | |
Total Other Capital Expenditure | | | | | | | | | | | | | | | 5,880 | | | | | |
| | | | | | | | | | | | | | | | | | | | |
| | | | | |
Capital Grants | | | | | | | | | | | | | | | | | | | | |
Legal Aid Queensland - Electronic Document Records Management System | | | Various | | | | 1,670 | | | | | | | | 845 | | | | 825 | |
| | | | | | | | | | | | | | | | | | | | |
Total Capital Grants | | | | | | | | | | | | | | | 845 | | | | | |
| | | | | | | | | | | | | | | | | | | | |
| | | | | |
TOTAL DEPARTMENT OF JUSTICE AND ATTORNEY-GENERAL | | | | | | | | | | | | | | | 317,808 | | | | | |
| | | | | | | | | | | | | | | | | | | | |
| | | | | |
PUBLIC TRUST OFFICE | | | | | | | | | | | | | | | | | | | | |
| | | | | |
Property, Plant and Equipment | | | | | | | | | | | | | | | | | | | | |
Building Improvements | | | Various | | | | | | | | | | | | 5,503 | | | | Ongoing | |
Property, plant and equipment | | | Various | | | | | | | | | | | | 907 | | | | Ongoing | |
Computer Hardware | | | 05 | | | | | | | | | | | | 560 | | | | Ongoing | |
| | | | | | | | | | | | | | | | | | | | |
Total Property, Plant and Equipment | | | | | | | | | | | | | | | 6,970 | | | | | |
| | | | | | | | | | | | | | | | | | | | |
| | | | | |
Other Capital Expenditure | | | | | | | | | | | | | | | | | | | | |
Computer software | | | 05 | | | | | | | | | | | | 900 | | | | Ongoing | |
| | | | | | | | | | | | | | | | | | | | |
Total Other Capital Expenditure | | | | | | | | | | | | | | | 900 | | | | | |
| | | | | | | | | | | | | | | | | | | | |
| | | | | |
TOTAL PUBLIC TRUST OFFICE | | | | | | | | | | | | | | | 7,870 | | | | | |
| | | | | | | | | | | | | | | | | | | | |
| | | | | |
LEGAL AID QUEENSLAND | | | | | | | | | | | | | | | | | | | | |
| | | | | |
Property, Plant and Equipment | | | | | | | | | | | | | | | | | | | | |
Vehicle replacement | | | Various | | | | | | | | | | | | 414 | | | | Ongoing | |
Office equipment | | | Various | | | | | | | | | | | | 440 | | | | Ongoing | |
Brisbane building - minor works | | | 05 | | | | | | | | | | | | 170 | | | | Ongoing | |
Leasehold improvements | | | Various | | | | | | | | | | | | 66 | | | | Ongoing | |
| | | | | | | | | | | | | | | | | | | | |
Total Property, Plant and Equipment | | | | | | | | | | | | | | | 1,090 | | | | | |
| | | | | | | | | | | | | | | | | | | | |
| | | | |
| 96 | | Capital Statement 2010-11 | | |
Justice and Attorney General
| | | | | | | | | | | | | | | | | | | | |
Project | | Statistical
Division | | | Total
Estimated
Cost $’000 | | | Expenditure
to 30-06-10 $’000 | | | Budget
2010-11 $’000 | | | Post 2010-11 $’000 | |
Other Capital Expenditure | | | | | | | | | | | | | | | | | | | | |
Electronic Document Records Management System | | | Various | | | | 1,670 | | | | | | | | 845 | | | | 825 | |
| | | | | | | | | | | | | | | | | | | | |
Total Other Capital Expenditure | | | | | | | | | | | | | | | 845 | | | | | |
| | | | | | | | | | | | | | | | | | | | |
| | | | | |
TOTAL LEGAL AID QUEENSLAND | | | | | | | | | | | | | | | 1,935 | | | | | |
| | | | | | | | | | | | | | | | | | | | |
| | | | | |
CRIME AND MISCONDUCT COMMISSION | | | | | | | | | | | | | | | | | | | | |
| | | | | |
Property, Plant and Equipment | | | | | | | | | | | | | | | | | | | | |
Leasehold Improvements | | | 05 | | | | | | | | | | | | 360 | | | | Ongoing | |
Vehicle replacements | | | 05 | | | | | | | | | | | | 525 | | | | Ongoing | |
Computer and other equipment | | | 05 | | | | | | | | | | | | 743 | | | | Ongoing | |
| | | | | | | | | | | | | | | | | | | | |
Total Property, Plant and Equipment | | | | | | | | | | | | | | | 1,628 | | | | | |
| | | | | | | | | | | | | | | | | | | | |
| | | | | |
TOTAL CRIME AND MISCONDUCT COMMISSION | | | | | | | | | | | | | | | 1,628 | | | | | |
| | | | | | | | | | | | | | | | | | | | |
| | | | | |
OFFICE OF THE INFORMATION COMMISSIONER | | | | | | | | | | | | | | | | | | | | |
| | | | | |
Property, Plant and Equipment | | | | | | | | | | | | | | | | | | | | |
Leasehold improvements | | | 05 | | | | 750 | | | | | | | | 750 | | | | | |
Property, plant and equipment | | | 05 | | | | | | | | | | | | 13 | | | | Ongoing | |
| | | | | | | | | | | | | | | | | | | | |
Total Property, Plant and Equipment | | | | | | | | | | | | | | | 763 | | | | | |
| | | | | | | | | | | | | | | | | | | | |
| | | | | |
TOTAL OFFICE OF THE INFORMATION COMMISSIONER | | | | | | | | | | | | | | | 763 | | | | | |
| | | | | | | | | | | | | | | | | | | | |
| | | | | |
ANTI-DISCRIMINATION COMMISSION | | | | | | | | | | | | | | | | | | | | |
| | | | | |
Property, Plant and Equipment | | | | | | | | | | | | | | | | | | | | |
Property, plant and equipment | | | 05 | | | | | | | | | | | | 30 | | | | Ongoing | |
| | | | | | | | | | | | | | | | | | | | |
Total Property, Plant and Equipment | | | | | | | | | | | | | | | 30 | | | | | |
| | | | | | | | | | | | | | | | | | | | |
| | | | | |
TOTAL ANTI-DISCRIMINATION COMMISSION | | | | | | | | | | | | | | | 30 | | | | | |
| | | | | | | | | | | | | | | | | | | | |
| | | | | |
TOTAL JUSTICE AND ATTORNEY GENERAL | | | | | | | | | | | | | | | 330,034 | | | | | |
| | | | | | | | | | | | | | | | | | | | |
| | | | |
| | Capital Statement 2010-11 | | 97 |
LEGISLATIVE ASSEMBLY OF QUEENSLAND
The 2010-11 capital program of $2.6 million is principally allocated to capital works projects including the ongoing Parliament House Stonework Restoration Program, replacement of the external toilet facilities on Level 7 of the Parliamentary Annexe, and the cleaning and protection of the exterior of the Parliamentary Annexe building. Funding is also directed to the replacement of Parliamentary Library database management software, and infrastructure to enhance the broadcast of Parliamentary proceedings.
Legislative Assembly of Queensland
| | | | | | | | | | | | | | | | | | | | |
Project | | Statistical
Division | | | Total
Estimated
Cost $’000 | | | Expenditure
to 30-06-10
$’000 | | | Budget
2010-11 $’000 | | | Post 2010-11 $’000 | |
LEGISLATIVE ASSEMBLY OF QUEENSLAND | | | | | | | | | | | | | | | | | | | | |
| | | | | |
Property, Plant and Equipment | | | | | | | | | | | | | | | | | | | | |
Refurbishment of Level 7 external toilet amenities | | | 05 | | | | 480 | | | | | | | | 480 | | | | | |
External Cleaning/Protection of Annexe Building | | | 05 | | | | 300 | | | | | | | | 300 | | | | | |
Parliament House Stonework1 Restoration Program | | | 05 | | | | 3,664 | | | | 3,064 | | | | 250 | | | | 350 | |
Air-conditioning - upgrade and replacement | | | 05 | | | | 1,000 | | | | 400 | | | | 200 | | | | 400 | |
Broadcast of Parliament Stage 3 | | | 05 | | | | 156 | | | | | | | | 156 | | | | | |
Minor capital works - plant and equipment | | | 05 | | | | | | | | | | | | 701 | | | | Ongoing | |
| | | | | | | | | | | | | | | | | | | | |
Total Property, Plant and Equipment | | | | | | | | | | | | | | | 2,087 | | | | | |
| | | | | | | | | | | | | | | | | | | | |
| | | | | |
Other Capital Expenditure | | | | | | | | | | | | | | | | | | | | |
Library Database Management System | | | 05 | | | | 700 | | | | | | | | 500 | | | | 200 | |
| | | | | | | | | | | | | | | | | | | | |
Total Other Capital Expenditure | | | | | | | | | | | | | | | 500 | | | | | |
| | | | | | | | | | | | | | | | | | | | |
TOTAL LEGISLATIVE ASSEMBLY OF QUEENSLAND | | | | | | | | | | | | | | | 2,587 | | | | | |
| | | | | | | | | | | | | | | | | | | | |
Note:
| 1. | The Total Estimated Cost and Post 2010-11 expenditure for the Parliament House Stonework Restoration Program are based upon the original estimates provided by the Department of Public Works at the commencement of the Program in 1993. The timelines and costs for the completion of the Program are currently being reviewed with a view to accelerating completion. |
| | | | |
| 98 | | Capital Statement 2010-11 | | |
OFFICE OF THE GOVERNOR
The Office of the Governor’s 2010-11 capital program of $0.54 million is principally allocated toward a program of renewal of the Office’s 15 year old information technology systems, including the financial management system, database and upgrade of the records management system. Funding has also been allocated to minor capital replacements. The ongoing replacement of capital items enables the Governor to undertake the full range of duties expected of the Head of State.
Office of the Governor
| | | | | | | | | | | | | | | | | | | | |
Project | | Statistical
Division | | | Total Estimated
Cost
$’000 | | | Expenditure
to 30-06-10 $’000 | | | Budget
2010-11 $’000 | | | Post 2010-11 $’000 | |
OFFICE OF THE GOVERNOR | | | | | | | | | | | | | | | | | | | | |
| | | | | |
Property, Plant and Equipment | | | | | | | | | | | | | | | | | | | | |
Asset replacement | | | 05 | | | | | | | | | | | | 40 | | | | Ongoing | |
| | | | | | | | | | | | | | | | | | | | |
| | | | | |
Total Property, Plant and Equipment | | | | | | | | | | | | | | | 40 | | | | | |
| | | | | | | | | | | | | | | | | | | | |
| | | | | |
Other Capital Expenditure | | | | | | | | | | | | | | | | | | | | |
IT systems | | | 05 | | | | 599 | | | | 100 | | | | 499 | | | | | |
| | | | | | | | | | | | | | | | | | | | |
Total Other Capital Expenditure | | | | | | | | | | | | | | | 499 | | | | | |
| | | | | | | | | | | | | | | | | | | | |
TOTAL OFFICE OF THE GOVERNOR | | | | | | | | | | | | | | | 539 | | | | | |
| | | | | | | | | | | | | | | | | | | | |
| | | | |
| | Capital Statement 2010-11 | | 99 |
OFFICE OF THE OMBUDSMAN
The Office has budgeted to spend $80,000 on plant and equipment consisting of ICT equipment, general office equipment and upgrading the complaints management software.
Office of the Ombudsman
| | | | | | | | | | | | | | | | | | | | |
Project | | Statistical
Division | | | Total
Estimated
Cost $’000 | | | Expenditure
to 30-06-10
$’000 | | | Budget
2010-11 $’000 | | | Post 2010-11 $’000 | |
OFFICE OF THE OMBUDSMAN | | | | | | | | | | | | | | | | | | | | |
| | | | | |
Property, Plant and Equipment | | | | | | | | | | | | | | | | | | | | |
Computer equipment | | | 05 | | | | | | | | | | | | 40 | | | | Ongoing | |
Office equipment | | | 05 | | | | | | | | | | | | 20 | | | | Ongoing | |
| | | | | | | | | | | | | | | | | | | | |
Total Property, Plant and Equipment | | | | | | | | | | | | | | | 60 | | | | | |
| | | | | | | | | | | | | | | | | | | | |
| | | | | |
Other Capital Expenditure | | | | | | | | | | | | | | | | | | | | |
Upgrade of Office’s Complaints Management System | | | 05 | | | | | | | | | | | | 20 | | | | Ongoing | |
| | | | | | | | | | | | | | | | | | | | |
Total Other Capital Expenditure | | | | | | | | | | | | | | | 20 | | | | | |
| | | | | | | | | | | | | | | | | | | | |
TOTAL OFFICE OF THE OMBUDSMAN | | | | | | | | | | | | | | | 80 | | | | | |
| | | | | | | | | | | | | | | | | | | | |
| | | | |
| 100 | | Capital Statement 2010-11 | | |
POLICE
The Queensland Police Service (QPS) capital program for 2010-11 is $217.7 million. This investment will fund infrastructure activities including capital works, information technology and other essential equipment. The QPS is committed to providing a safe and secure environment that supports the Government’s Toward Q2 ambitions, particularly Fair - Supporting Safe and Caring Communities.
Program Highlights
| • | | $50 million is provided for the continued development of the state of the art Queensland Police Academy at Wacol. The Academy is expected to be completed in 2014-15 and will deliver a full range of education and training programs for trainee and operational police. |
| • | | $32.2 million is provided to construct new, refurbished and upgraded facilities across the State to ensure the QPS remains well positioned now and into the future. Key projects for 2010-11 include: |
| | • | | $12.7 million for three new facilities ($9.4 million for the construction of the new Badu Island Police Station, $1.3 million for the new forensic facility at Oxley District and $2 million for the new $12 million district support facility in Townsville); |
| | • | | $11 million for the upgrade and/or refurbishment of nine facilities; and |
| | • | | $8.3 million for five replacement facilities (Mareeba Police Station and Watchhouse, Murgon Police Station and Watchhouse, Camp Hill Police Station (being built at Carina), Lockhart River Police Station and the Sunshine Coast District Water Police Facility). |
| • | | $50.2 million is provided for information and communication technology projects including Computer Aided Dispatch, Technology Refresh, Digital Integrated Traffic Camera System, new Weapons Licensing System and Telecommunications Interception. |
| • | | $60.1 million is provided for the purchase of new and upgraded operational equipment including vehicles, traffic cameras and marine vessels. |
| • | | $14.6 million has been provided for housing programs which include the Australian Government funded police housing in remote areas. |
| | | | |
| | Capital Statement 2010-11 | | 101 |
Police
| | | | | | | | | | | | | | | | | | | | |
Project | | Statistical
Division | | | Total Estimated
Cost $’000 | | | Expenditure
to 30-06-10
$’000 | | | Budget
2010-11 $’000 | | | Post
2010-11 $’000 | |
DEPARTMENT OF POLICE | | | | | | | | | | | | | | | | | | | | |
| | | | | |
Property, Plant and Equipment | | | | | | | | | | | | | | | | | | | | |
Capital Works - Major Capital | | | | | | | | | | | | | | | | | | | | |
Badu Island - new police station | | | 50 | | | | 10,000 | | | | 600 | | | | 9,400 | | | | | |
Beenleigh - police station refurbishment | | | 07 | | | | 3,450 | | | | 650 | | | | 2,800 | | | | | |
Burleigh Heads - police complex upgrade | | | 07 | | | | 2,000 | | | | 350 | | | | 1,650 | | | | | |
Calliope - police station upgrade | | | 30 | | | | 3,000 | | | | 110 | | | | 1,090 | | | | 1,800 | |
Camp Hill - police station (being built at Carina) | | | 05 | | | | 2,500 | | | | 240 | | | | 2,260 | | | | | |
Goodna - police station upgrade | | | 05 | | | | 2,100 | | | | 300 | | | | 1,500 | | | | 300 | |
Lockhart River - replacement police station | | | 50 | | | | 10,000 | | | | 600 | | | | 3,414 | | | | 5,986 | |
Mackay - old police station upgrade | | | 40 | | | | 4,000 | | | | 200 | | | | 1,000 | | | | 2,800 | |
Mareeba - replacement station / watchhouse | | | 50 | | | | 7,100 | | | | 6,659 | | | | 441 | | | | | |
Murgon - replacement police station / watchhouse | | | 15 | | | | 7,200 | | | | 6,251 | | | | 949 | | | | | |
Oxley District - forensic facility | | | 05 | | | | 3,000 | | | | 300 | | | | 1,280 | | | | 1,420 | |
Pine Rivers District - office fitout | | | 05 | | | | 4,000 | | | | 300 | | | | 950 | | | | 2,750 | |
Richlands - watchhouse refurbishment | | | 05 | | | | 1,500 | | | | 200 | | | | 1,300 | | | | | |
Sunshine Coast District - water police facility | | | 09 | | | | 1,200 | | | | | | | | 1,200 | | | | | |
Thursday Island - water police office and boat shed | | | 50 | | | | 1,610 | | | | 1,410 | | | | 200 | | | | | |
Townsville District - police facility | | | 45 | | | | 12,000 | | | | 600 | | | | 2,000 | | | | 9,400 | |
Townsville Police Academy -upgrade | | | 45 | | | | 1,000 | | | | 500 | | | | 500 | | | | | |
Other Major Capital Works | | | Various | | | | | | | | | | | | 216 | | | | Ongoing | |
| | | | | | | | | | | | | | | | | | | | |
Sub-total Capital Works - Major Capital | | | | | | | | | | | | | | | 32,150 | | | | | |
| | | | | | | | | | | | | | | | | | | | |
| | | | | |
Capital Works - Sub-Programs | | | | | | | | | | | | | | | | | | | | |
Land bank | | | Various | | | | | | | | | | | | 3,000 | | | | Ongoing | |
Minor Captial Works | | | Various | | | | | | | | | | | | 5,650 | | | | Ongoing | |
Watchhouses - CCTV program | | | Various | | | | | | | | | | | | 2,096 | | | | Ongoing | |
| | | | | | | | | | | | | | | | | | | | |
Sub-total Capital Works - Sub-Programs | | | | | | | | | | | | | | | 10,746 | | | | | |
| | | | | | | | | | | | | | | | | | | | |
| | | | |
| 102 | | Capital Statement 2010-11 | | |
Police
| | | | | | | | | | | | | | | | | | | | |
Project | | Statistical
Division | | | Total Estimated
Cost $’000 | | | Expenditure
to 30-06-10
$’000 | | | Budget
2010-11 $’000 | | | Post
2010-11 $’000 | |
Capital Works - Housing Program | | | | | | | | | | | | | | | | | | | | |
Doomadgee - new residences | | | 55 | | | | 1,800 | | | | 100 | | | | 1,700 | | | | | |
Mornington Island - new residences | | | 55 | | | | 3,800 | | | | 247 | | | | 3,553 | | | | | |
Woorabinda - new residences | | | 30 | | | | 3,600 | | | | 1,136 | | | | 2,464 | | | | | |
Policing Indigenous Communities - Kowanyama | | | 50 | | | | 3,000 | | | | 130 | | | | 2,870 | | | | | |
Sustainable Resource Communities - Mount Isa housing | | | 55 | | | | 2,700 | | | | | | | | 2,700 | | | | | |
Housing Program | | | Various | | | | | | | | | | | | 1,300 | | | | Ongoing | |
| | | | | | | | | | | | | | | | | | | | |
Sub-total Capital Works - Housing Program | | | | | | | | | | | | | | | 14,587 | | | | | |
| | | | | | | | | | | | | | | | | | | | |
| | | | | |
Other Property, Plant and Equipment | | | | | | | | | | | | | | | | | | | | |
Queensland Police Academy | | | 05 | | | | 452,000 | | | | 45,530 | | | | 49,954 | | | | 356,516 | |
Information and Communication Technology | | | 05 | | | | | | | | | | | | 20,225 | | | | Ongoing | |
Other plant and equipment (includes motor vehicles) | | | Various | | | | | | | | | | | | 60,066 | | | | Ongoing | |
| | | | | | | | | | | | | | | | | | | | |
Sub-total Other Property, Plant and Equipment | | | | | | | | | | | | | | | 130,245 | | | | | |
| | | | | | | | | | | | | | | | | | | | |
| | | | | |
Total Property, Plant and Equipment | | | | | | | | | | | | | | | 187,728 | | | | | |
| | | | | | | | | | | | | | | | | | | | |
| | | | | |
Other Capital Expenditure | | | | | | | | | | | | | | | | | | | | |
Information and Communication Technology - Intangibles | | | 05 | | | | | | | | | | | | 29,981 | | | | Ongoing | |
| | | | | | | | | | | | | | | | | | | | |
Total Other Capital Expenditure | | | | | | | | | | | | | | | 29,981 | | | | | |
| | | | | | | | | | | | | | | | | | | | |
| | | | | |
TOTAL DEPARTMENT OF POLICE | | | | | | | | | | | | | | | 217,709 | | | | | |
| | | | | | | | | | | | | | | | | | | | |
| | | | |
| | Capital Statement 2010-11 | | 103 |
PREMIER AND CABINET
The estimated 2010-11 capital expenditure for the Department of the Premier and Cabinet including all associated entities is $121 million.
Department of the Premier and Cabinet
The department’s capital budget in 2010-11 of $10.1 million provides $1.8 million for the replacement and development of office and information systems that will be applied towards the continued efficient delivery of the department’s services, as well as $1.3 million for the completion of SmartCab which will enhance and improve Cabinet processes.
Funding of $12 million is being provided over two years by the State and Australian Governments for the capital construction and fit out associated with co-locating the Queensland Symphony Orchestra with the Australian Broadcasting Corporation at South Bank.
South Bank Corporation
The 2010-11 capital works program for the South Bank Corporation is directed at enhancing the visitor experience and the ongoing operational requirements of South Bank Corporation and the Brisbane Convention and Exhibition Centre.
The Brisbane Convention and Exhibition Centre expansion is currently under construction and will result in approximately 24,000 square metres (50%) of additional floor space. Key components of the expanded facility are a 600 seat and a 400 seat tiered plenary hall, breakout rooms, foyer/exhibition space, and ground floor restaurants and retail uses. The total cost of the project will be $146 million.
Construction has commenced on the Boardwalk site. The new development is expected to be completed in early 2011 and will provide an additional 70 metres of riverfront access, increased green space, as well as a new landscape designed playground and premier dining precinct. The new precinct will include six new tenancies across a range of casual and exclusive dining options at a total cost of $16.4 million.
Construction has begun on the state and federally funded Stormwater Harvesting and Reuse Centre (SHARC). An estimated 77 mega-litres of stormwater per annum will be harvested, stored and treated (the equivalent of 30 Olympic-sized swimming pools). Once up and running, SHARC will provide up to 90% of the parkland’s estimated irrigation demands, as well as progressively supplementing water features and rest rooms when surplus is available. SHARC will also significantly reduce stormwater pollution into the Brisbane River. The total cost of the project will be $9 million.
| | | | |
| 104 | | Capital Statement 2010-11 | | |
Library Board of Queensland
The State Library’s capital expenditure for 2010-11 is $1.4 million. These funds will provide for additional General Reference and Heritage Collections, the replacement of existing equipment and some minor building enhancements.
Queensland Art Gallery
In 2010-11, the Queensland Art Gallery will invest $2.1 million to purchase works of art for the Gallery’s collection. In addition, $0.2 million will be allocated towards the ongoing replacement of property, plant and equipment.
Queensland Museum
The Queensland Museum has allocated $4.4 million in 2010-11 towards capital projects including:
| • | | $2.3 million for the completion of the National Carriage Factory at the Cobb+Co Museum in Toowoomba. The project will deliver a major heritage training, crafts and skills centre, as well as provide an interactive regional tourism experience. Total project cost is estimated to be $7.3 million, with funding sourced from the State Government, the Queensland Museum Board, sponsorships and donations. |
| • | | A $0.99 million investment in the construction of a humidity controlled storage and conservation facility for key items of the State Collection. |
| • | | A provision of $0.13 million towards the restoration of the “Hunslet” locomotive at the Workshops Rail Museum at North Ipswich. |
| • | | A $0.52 million allocation for the replacement of operational assets such as motor vehicles, exhibitions, computer network and other equipment and State collection items. |
Queensland Performing Arts Trust
In 2010-11, the Queensland Performing Arts trust will spend $0.75 million on ongoing property and equipment replacement including production assets.
| | | | |
| | Capital Statement 2010-11 | | 105 |
Premier and Cabinet
| | | | | | | | | | | | | | | | | | | | |
Project | | Statistical
Division | | | Total
Estimated
Cost $’000 | | | Expenditure
to 30-06-10
$’000 | | | Budget
2010-11 $’000 | | | Post
2010-11 $’000 | |
DEPARTMENT OF THE PREMIER AND CABINET | | | | | | | | | | | | | | | | | | | | |
Property, Plant and Equipment | | | | | | | | | | | | | | | | | | | | |
Asset replacement program | | | 05 | | | | | | | | | | | | 1,438 | | | | Ongoing | |
| | | | | | | | | | | | | | | | | | | | |
Total Property, Plant and Equipment | | | | | | | | | | | | | | | 1,438 | | | | | |
| | | | | | | | | | | | | | | | | | | | |
| | | | | |
Other Capital Expenditure | | | | | | | | | | | | | | | | | | | | |
Information systems development and replacement program | | | 05 | | | | | | | | | | | | 323 | | | | Ongoing | |
SmartCab (Queensland’s new Cabinet Information System) | | | 05 | | | | 3,411 | | | | 2,069 | | | | 1,342 | | | | | |
| | | | | | | | | | | | | | | | | | | | |
Total Other Capital Expenditure | | | | | | | | | | | | | | | 1,665 | | | | | |
| | | | | | | | | | | | | | | | | | | | |
| | | | | |
Capital Grants | | | | | | | | | | | | | | | | | | | | |
Queensland Symphony Orchestra/Australian Broadcasting Corporation
co-location project (Arts Queensland) | | | 05 | | | | 12,000 | | | | 5,000 | | | | 7,000 | | | | | |
| | | | | | | | | | | | | | | | | | | | |
| | | | | | | | | | | | | | | | | | | | |
Total Capital Grants | | | | | | | | | | | | | | | 7,000 | | | | | |
| | | | | | | | | | | | | | | | | | | | |
| | | | | |
TOTAL DEPARTMENT OF THE PREMIER AND CABINET | | | | | | | | | | | | | | | 10,103 | | | | | |
| | | | | | | | | | | | | | | | | | | | |
| | | | | |
SOUTH BANK CORPORATION | | | | | | | | | | | | | | | | | | | | |
Property, Plant and Equipment | | | | | | | | | | | | | | | | | | | | |
South Bank Precinct enhancements | | | 05 | | | | | | | | | | | | 11,413 | | | | Ongoing | |
Brisbane Convention and Exhibition Centre expansion | | | 05 | | | | 146,000 | | | | 71,500 | | | | 74,500 | | | | | |
Boardwalk redevelopment | | | 05 | | | | 16,400 | | | | 6,320 | | | | 10,080 | | | | | |
Storm Water Harvesting and Reuse Centre | | | 05 | | | | 9,000 | | | | 2,700 | | | | 6,300 | | | | | |
| | | | | | | | | | | | | | | | | | | | |
Total Property, Plant and Equipment | | | | | | | | | | | | | | | 102,293 | | | | | |
| | | | | | | | | | | | | | | | | | | | |
| | | | | |
TOTAL SOUTH BANK CORPORATION | | | | | | | | | | | | | | | 102,293 | | | | | |
| | | | | | | | | | | | | | | | | | | | |
| | | | | |
LIBRARY BOARD OF QUEENSLAND | | | | | | | | | | | | | | | | | | | | |
Property, Plant and Equipment | | | | | | | | | | | | | | | | | | | | |
Plant and equipment - general | | | 05 | | | | | | | | | | | | 200 | | | | Ongoing | |
Library collections expenditure | | | 05 | | | | | | | | | | | | 1,007 | | | | Ongoing | |
| | | | | | | | | | | | | | | | | | | | |
Total Property, Plant and Equipment | | | | | | | | | | | | | | | 1,207 | | | | | |
| | | | | | | | | | | | | | | | | | | | |
| | | | |
| 106 | | Capital Statement 2010-11 | | |
Premier and Cabinet
| | | | | | | | | | | | | | | | | | | | |
Project | | Statistical
Division | | | Total
Estimated
Cost $’000 | | | Expenditure
to 30-06-10
$’000 | | | Budget
2010-11 $’000 | | | Post
2010-11 $’000 | |
| | | | | |
Other Capital Expenditure | | | | | | | | | | | | | | | | | | | | |
Minor capital improvements | | | 05 | | | | | | | | | | | | 150 | | | | Ongoing | |
| | | | | | | | | | | | | | | | | | | | |
Total Other Capital Expenditure | | | | | | | | | | | | | | | 150 | | | | | |
| | | | | | | | | | | | | | | | | | | | |
| | | | | |
TOTAL LIBRARY BOARD OF QUEENSLAND | | | | | | | | | | | | | | | 1,357 | | | | | |
| | | | | | | | | | | | | | | | | | | | |
| | | | | |
QUEENSLAND ART GALLERY | | | | | | | | | | | | | | | | | | | | |
| | | | | |
Property, Plant and Equipment | | | | | | | | | | | | | | | | | | | | |
Property, plant and equipment | | | 05 | | | | | | | | | | | | 200 | | | | Ongoing | |
Queensland Art Gallery collection | | | 05 | | | | | | | | | | | | 2,100 | | | | Ongoing | |
| | | | | | | | | | | | | | | | | | | | |
Total Property, Plant and Equipment | | | | | | | | | | | | | | | 2,300 | | | | | |
| | | | | | | | | | | | | | | | | | | | |
TOTAL QUEENSLAND ART GALLERY | | | | | | | | | | | | | | | 2,300 | | | | | |
| | | | | | | | | | | | | | | | | | | | |
| | | | | |
QUEENSLAND MUSEUM | | | | | | | | | | | | | | | | | | | | |
| | | | | |
Property, Plant and Equipment | | | | | | | | | | | | | | | | | | | | |
National Carriage Factory | | | 20 | | | | 7,228 | | | | 4,958 | | | | 2,270 | | | | | |
Collection storage, acquisition and management | | | 05 | | | | 2,175 | | | | 1,649 | | | | 526 | | | | | |
Hendra building works | | | 05 | | | | 990 | | | | | | | | 990 | | | | | |
Restoration of the “Hunslet” Locomotive | | | 12 | | | | 130 | | | | | | | | 130 | | | | | |
Property, plant and equipment - other | | | 05 | | | | | | | | | | | | 522 | | | | Ongoing | |
| | | | | | | | | | | | | | | | | | | | |
Total Property, Plant and Equipment | | | | | | | | | | | | | | | 4,438 | | | | | |
| | | | | | | | | | | | | | | | | | | | |
| | | | | |
TOTAL QUEENSLAND MUSEUM | | | | | | | | | | | | | | | 4,438 | | | | | |
| | | | | | | | | | | | | | | | | | | | |
| | | | | |
QUEENSLAND PERFORMING ARTS TRUST | | | | | | | | | | | | | | | | | | | | |
Property, Plant and Equipment | | | | | | | | | | | | | | | | | | | | |
Property, plant and equipment | | | 05 | | | | | | | | | | | | 750 | | | | Ongoing | |
| | | | | | | | | | | | | | | | | | | | |
Total Property, Plant and Equipment | | | | | | | | | | | | | | | 750 | | | | | |
| | | | | | | | | | | | | | | | | | | | |
| | | | | |
TOTAL QUEENSLAND PERFORMING ARTS TRUST | | | | | | | | | | | | | | | 750 | | | | | |
| | | | | | | | | | | | | | | | | | | | |
| | | | | |
TOTAL PREMIER AND CABINET | | | | | | | | | | | | | | | 121,241 | | | | | |
| | | | | | | | | | | | | | | | | | | | |
| | | | |
| | Capital Statement 2010-11 | | 107 |
PUBLIC WORKS
The department’s capital expenditure program for 2010-11, including commercialised business units (CBUs), the Shared Service Agency (SSA) and CorpTech, is $315.2 million. Capital expenditure by the department, excluding CBUs, SSA and CorpTech is $114.2 million.
Department of Public Works
Program Highlights
| • | | $34 million is provided in 2010-11 to continue the construction of a new government office building in First Avenue, Maroochydore. The building will provide 8,600 square metres of net lettable area. The total project cost is estimated at $79.9 million. |
| • | | $11.9 million is allocated in 2010-11 to continue the construction of a new government office building in Hartley Street, Cairns. The building will provide 9,600 square metres of net lettable area as stage 2 of William McCormack Place. The total project cost is estimated at $79.5 million. |
| • | | $7.1 million is allocated in 2010-11 for the construction of a new government office building on Thursday Island. The building will provide 1,100 square metres of net lettable area. The total project cost is estimated at $13.5 million. |
| • | | $6.4 million is provided in 2010-11 for the completion of the site infrastructure works associated with the Boggo Road Precinct redevelopment. The redevelopment provides the infrastructure necessary for the Ecosciences Precinct and for future residential, retail, commercial and recreational facilities that will form the Boggo Road Urban Village. The old Boggo Road Gaol is retained. The total project cost is estimated at $45.5 million. |
| • | | $5.9 million is allocated in 2010-11 for the completion of a new Joint Contact Centre in Zillmere, Brisbane. The building will accommodate 417 work points for Smart Service Queensland and the Queensland Police Service. The project includes a large photovoltaic array that will generate up to 450 kilowatts of solar energy and offset the greenhouse gas emissions from energy used in the operation of the building. The total project capital cost is estimated at $47.4 million. |
| • | | $5.5 million is allocated in 2010-11 for the completion of a new government office building and learning centre in Mareeba. The total project capital cost is estimated at $6.5 million. |
| • | | $15.3 million is allocated in 2010-11 for the construction and upgrade of government employee housing in rural and remote areas. |
| | | | |
| 108 | | Capital Statement 2010-11 | | |
| • | | QFleet will purchase motor vehicles totalling $152.9 million. The vehicles will be leased to clients to facilitate the delivery of Government services across Queensland. The vehicle purchases and associated ongoing maintenance provide support for local Queensland firms. |
| • | | CITEC, the Queensland Government’s primary technology service provider delivering agency-specific information and communication technology (ICT) services, has a capital expenditure program in 2010-11 of $30.1 million. The components of the program include the progressive delivery upon the consolidation of data centres, networks and infrastructure services across the Queensland Government, the progressive delivery upon a whole-of-Government email system with identity management and authentication capability and Queensland Government digital certificate issuing capability and the acquisition of ICT infrastructure essential for the continued delivery of ICT services to client agencies. |
Public Works
| | | | | | | | | | | | | | | | | | | | |
Project | | Statistical
Division | | | Total
Estimated
Cost
$’000 | | | Expenditure
to 30-06-10
$’000 | | | Budget
2010-11 $’000 | | | Post
2010-11 $’000 | |
DEPARTMENT OF PUBLIC WORKS | | | | | | | | | | | | | | | | | | | | |
| | | | | |
Property, Plant and Equipment | | | | | | | | | | | | | | | | | | | | |
Brisbane - 111 George Street Lift Upgrade | | | 05 | | | | 5,400 | | | | 2,400 | | | | 2,500 | | | | 500 | |
Brisbane - 317 Edward Street Installation of Power Generator | | | 05 | | | | 5,000 | | | | 1,000 | | | | 4,000 | | | | | |
Brisbane - Boggo Road Precinct Redevelopment | | | 05 | | | | 45,476 | | | | 39,094 | | | | 6,382 | | | | | |
Brisbane - Energy Performance Contract - Mineral House | | | 05 | | | | 1,026 | | | | 471 | | | | 555 | | | | | |
Brisbane - Joint Contact Centre, Zillmere | | | 05 | | | | 47,413 | | | | 41,518 | | | | 5,895 | | | | | |
Brisbane - Kangaroo Point Park - Artwork | | | 05 | | | | 2,852 | | | | 2,039 | | | | 813 | | | | | |
Brisbane - Smart Service Queensland - ICT Infrastructure | | | 05 | | | | 5,985 | | | | 2,103 | | | | 3,082 | | | | 800 | |
Brisbane - SWARA Relocation | | | 05 | | | | 3,800 | | | | 3,449 | | | | 351 | | | | | |
Brisbane - Tank Street - Pedestrian/Cycle Kurilpa Bridge | | | 05 | | | | 63,300 | | | | 62,308 | | | | 992 | | | | | |
Brisbane - Yungaba Multicultural Centre Fitout | | | 05 | | | | 1,500 | | | | | | | | 500 | | | | 1,000 | |
| | | | |
| | Capital Statement 2010-11 | | 109 |
Public Works
| | | | | | | | | | | | | | | | | | | | |
Project | | Statistical
Division | | | Total
Estimated
Cost $’000 | | | Expenditure
to 30-06-10 $’000 | | | Budget
2010-11 $’000 | | | Post
2010-11 $’000 | |
Brisbane - Zillmere Precinct Site Works | | | 05 | | | | 3,000 | | | | 2,500 | | | | 500 | | | | | |
Cairns - New Office Building | | | 50 | | | | 79,500 | | | | 67,586 | | | | 11,914 | | | | | |
Government Employee Housing | | | Various | | | | | | | | | | | | 15,288 | | | | Ongoing | |
Mareeba - New Office Building | | | 50 | | | | 6,500 | | | | 481 | | | | 5,519 | | | | 500 | |
Maroochydore - New Office Building | | | 09 | | | | 79,900 | | | | 39,078 | | | | 34,000 | | | | 6,822 | |
Other Plant and Equipment | | | Various | | | | | | | | | | | | 13,253 | | | | Ongoing | |
Thursday Island Artworks | | | 50 | | | | 375 | | | | | | | | 375 | | | | | |
Thursday Island - New Office Building | | | 50 | | | | 13,500 | | | | 6,446 | | | | 7,054 | | | | | |
| | | | | | | | | | | | | | | | | | | | |
Total Property, Plant and Equipment | | | | | | | | | | | | | | | 112,973 | | | | | |
| | | | | | | | | | | | | | | | | | | | |
| | | | | |
Other Capital Expenditure | | | | | | | | | | | | | | | | | | | | |
Whole of Government ICT Initiatives | | | Various | | | | | | | | | | | | 1,264 | | | | Ongoing | |
| | | | | | | | | | | | | | | | | | | | |
Total Other Capital Expenditure | | | | | | | | | | | | | | | 1,264 | | | | | |
| | | | | | | | | | | | | | | | | | | | |
TOTAL DEPARTMENT OF PUBLIC WORKS | | | | | | | | | | | | | | | 114,237 | | | | | |
| | | | | | | | | | | | | | | | | | | | |
| | | | | |
QBUILD | | | | | | | | | | | | | | | | | | | | |
| | | | | |
Property, Plant and Equipment | | | | | | | | | | | | | | | | | | | | |
Plant and Equipment | | | Various | | | | | | | | | | | | 1,783 | | | | Ongoing | |
| | | | | | | | | | | | | | | | | | | | |
Total Property, Plant and Equipment | | | | | | | | | | | | | | | 1,783 | | | | | |
| | | | | | | | | | | | | | | | | | | | |
TOTAL QBUILD | | | | | | | | | | | | | | | 1,783 | | | | | |
| | | | | | | | | | | | | | | | | | | | |
| | | | | |
QFLEET | | | | | | | | | | | | | | | | | | | | |
| | | | | |
Property, Plant and Equipment | | | | | | | | | | | | | | | | | | | | |
Motor Vehicles | | | Various | | | | | | | | | | | | 152,881 | | | | Ongoing | |
Other Plant and Equipment | | | Various | | | | | | | | | | | | 137 | | | | Ongoing | |
| | | | | | | | | | | | | | | | | | | | |
Total Property, Plant and Equipment | | | | | | | | | | | | | | | 153,018 | | | | | |
| | | | | | | | | | | | | | | | | | | | |
| | | | | |
Other Capital Expenditure | | | | | | | | | | | | | | | | | | | | |
Information Systems | | | Various | | | | | | | | | | | | 570 | | | | Ongoing | |
| | | | | | | | | | | | | | | | | | | | |
Total Other Capital Expenditure | | | | | | | | | | | | | | | 570 | | | | | |
| | | | | | | | | | | | | | | | | | | | |
TOTAL QFLEET | | | | | | | | | | | | | | | 153,588 | | | | | |
| | | | | | | | | | | | | | | | | | | | |
| | | | |
| 110 | | Capital Statement 2010-11 | | |
Public Works
| | | | | | | | | | | | | | | | | | |
Project | | Statistical
Division | | Total
Estimated
Cost
$’000 | | | Expenditure
to 30-06-10
$’000 | | | Budget
2010-11
$’000 | | | Post
2010-11
$’000 | |
| | | | | |
PROJECT SERVICES | | | | | | | | | | | | | | | | | | |
Other Capital Expenditure | | | | | | | | | | | | | | | | | | |
| | | | | |
Implementation of Essential Finance and Business Systems | | Various | | | | | | | | | | | 11,290 | | | | Ongoing | |
| | | | | | | | | | | | | | | | | | |
| | | | | |
Total Other Capital Expenditure | | | | | | | | | | | | | 11,290 | | | | | |
| | | | | | | | | | | | | | | | | | |
| | | | | |
TOTAL PROJECT SERVICES | | | | | | | | | | | | | 11,290 | | | | | |
| | | | | | | | | | | | | | | | | | |
| | | | | |
SDS | | | | | | | | | | | | | | | | | | |
| | | | | |
Property, Plant and Equipment | | | | | | | | | | | | | | | | | | |
Warehouse Equipment | | 05 | | | | | | | | | | | 105 | | | | Ongoing | |
| | | | | | | | | | | | | | | | | | |
Total Property, Plant and Equipment | | | | | | | | | | | | | 105 | | | | | |
| | | | | | | | | | | | | | | | | | |
Other Capital Expenditure | | | | | | | | | | | | | | | | | | |
Computer Software | | 05 | | | | | | | | | | | 185 | | | | Ongoing | |
| | | | | | | | | | | | | | | | | | |
Total Other Capital Expenditure | | | | | | | | | | | | | 185 | | | | | |
| | | | | | | | | | | | | | | | | | |
| | | | | |
TOTAL SDS | | | | | | | | | | | | | 290 | | | | | |
| | | | | | | | | | | | | | | | | | |
| | | | | |
CITEC | | | | | | | | | | | | | | | | | | |
| | | | | |
Property, Plant and Equipment | | | | | | | | | | | | | | | | | | |
Information Communication Technology Consolidation | | 05 | | | 23,300 | | | | 20,019 | | | | 3,281 | | | | | |
Identity, Directory and Email Services Program | | 05 | | | 7,274 | | | | 1,395 | | | | 1,889 | | | | 3,990 | |
Plant and Equipment | | 05 | | | | | | | | | | | 15,173 | | | | Ongoing | |
| | | | | | | | | | | | | | | | | | |
Total Property, Plant and Equipment | | | | | | | | | | | | | 20,343 | | | | | |
| | | | | | | | | | | | | | | | | | |
| | | | | |
Other Capital Expenditure | | | | | | | | | | | | | | | | | | |
Identity, Directory and Email Services Program | | 05 | | | 23,667 | | | | 8,471 | | | | 4,730 | | | | 10,466 | |
Proprietary Software and Internally Developed Software and Systems | | 05 | | | | | | | | | | | 5,063 | | | | Ongoing | |
| | | | | | | | | | | | | | | | | | |
Total Other Capital Expenditure | | | | | | | | | | | | | 9,793 | | | | | |
| | | | | | | | | | | | | | | | | | |
| | | | | |
TOTAL CITEC | | | | | | | | | | | | | 30,136 | | | | | |
| | | | | | | | | | | | | | | | | | |
| | | | |
| | Capital Statement 2010-11 | | 111 |
Public Works
| | | | | | | | | | | | | | | | | | | | |
Project | | Statistical
Division | | | Total
Estimated
Cost
$’000 | | | Expenditure
to 30-06-10
$’000 | | | Budget
2010-11 $’000 | | | Post
2010-11 $’000 | |
SHARED SERVICE AGENCY | | | | | | | | | | | | | | | | | | | | |
Property, Plant and Equipment | | | | | | | | | | | | | | | | | | | | |
Asset Replacement | | | 05 | | | | | | | | | | | | 235 | | | | Ongoing | |
| | | | | | | | | | | | | | | | | | | | |
Total Property, Plant and Equipment | | | | | | | | | | | | | | | 235 | | | | | |
| | | | | | | | | | | | | | | | | | | | |
| | | | | |
TOTAL SHARED SERVICE AGENCY | | | | | | | | | | | | | | | 235 | | | | | |
| | | | | | | | | | | | | | | | | | | | |
| | | | | |
CORP TECH | | | | | | | | | | | | | | | | | | | | |
| | | | | |
Property, Plant and Equipment | | | | | | | | | | | | | | | | | | | | |
Asset Replacement | | | 05 | | | | | | | | | | | | 600 | | | | Ongoing | |
| | | | | | | | | | | | | | | | | | | | |
Total Property, Plant and Equipment | | | | | | | | | | | | | | | 600 | | | | | |
| | | | | | | | | | | | | | | | | | | | |
| | | | | |
Other Capital Expenditure | | | | | | | | | | | | | | | | | | | | |
Corporate Solutions Program of Works | | | 05 | | | | 241,918 | | | | 213,614 | | | | 3,045 | | | | 25,259 | |
| | | | | | | | | | | | | | | | | | | | |
Total Other Capital Expenditure | | | | | | | | | | | | | | | 3,045 | | | | | |
| | | | | | | | | | | | | | | | | | | | |
| | | | | |
TOTAL CORP TECH | | | | | | | | | | | | | | | 3,645 | | | | | |
| | | | | | | | | | | | | | | | | | | | |
| | | | | |
TOTAL PUBLIC WORKS | | | | | | | | | | | | | | | 315,204 | | | | | |
| | | | | | | | | | | | | | | | | | | | |
| | | | |
| 112 | | Capital Statement 2010-11 | | |
QUEENSLAND AUDIT OFFICE
Queensland Audit Office’s minor works expenditure of $0.25 million is to maintain and replace current office and IT equipment.
Queensland Audit Office
| | | | | | | | | | | | | | | | | | | | |
| | | | | |
Project | | Statistical
Division | | | Total
Estimated
Cost
$’000 | | | Expenditure
to 30-06-10
$’000 | | | Budget
2010-11 $’000 | | | Post 2010-11 $’000 | |
QUEENSLAND AUDIT OFFICE | | | | | | | | | | | | | | | | | | | | |
Property, Plant and Equipment | | | | | | | | | | | | | | | | | | | | |
Minor works | | | 05 | | | | | | | | | | | | 250 | | | | Ongoing | |
| | | | | | | | | | | | | | | | | | | | |
Total Property, Plant and Equipment | | | | | | | | | | | | | | | 250 | | | | | |
| | | | | | | | | | | | | | | | | | | | |
TOTAL QUEENSLAND AUDIT OFFICE | | | | | | | | | | | | | | | 250 | | | | | |
| | | | | | | | | | | | | | | | | | | | |
| | | | |
| | Capital Statement 2010-11 | | 113 |
TRANSPORT AND MAIN ROADS
Transport
The Queensland Government is continuing investment in the transport system through the 2010-11 capital expenditure program totalling $744.3 million. This spend predominantly comprises investment in public transport infrastructure and systems.
Program Highlights
In the 2010-11 Budget, the Queensland Government continues to progress the implementation of the South East Queensland Infrastructure Plan and Program (SEQIPP). Some major projects included in the SEQIPP initiative are:
| • | | $219 million for the Gold Coast Rapid Transit System, a light rail project from Parkwood to Broadbeach, at a total estimated cost for stage 1 of $948.7 million |
| • | | $197 million for the $734.7 million Northern Busway: Enoggera Creek to Kedron project which extends the existing busway from the Royal Brisbane Women’s Hospital to Sadlier Street, Kedron |
| • | | $150 million for the $465.8 million Eastern Busway: Buranda to Coorparoo (Stage 2A) to continue the construction of a 1.05 km busway connection between South East Busway and Main Avenue with bus stations at Stones Corner and Langlands Park. |
Other major capital projects are:
| • | | $20.3 million to continue the construction of cycle links to enhance the cycle network in south east Queensland. This is made up of $9.4 million towards the construction of state-owned cycle links and $10.9 million in grants to be provided to local governments |
| • | | $7.1 million towards the construction of new recreational boating facilities. These funds will ensure that future infrastructure demands can be met as the recreational boating population continues to grow. |
TransLink Transit Authority
TransLink’s capital expenditure program for 2010-11 totals $59.4 million, which predominantly entails investment in public transport infrastructure across South East Queensland.
Program Highlights
| • | | $39.1 million to continue the $213.1 million program for the delivery of new or upgraded bus stations and park ‘n’ ride facilities, which will improve access to the public transport system across south-east Queensland. |
| | | | |
| 114 | | Capital Statement 2010-11 | | |
This includes the construction and development of:
| • | | Maroochydore bus station - $5.2 million |
| • | | Algester Park ‘n’ Ride facility - $4 million |
| • | | Capalaba Park ‘n’ Ride facility - $3.4 million |
| • | | North Lakes bus station - $3.4 million |
| • | | Enoggera Reservior Park ‘n’ Ride facility - $3.2 million |
| • | | Klump Road Park ‘n’ Ride facility - $3.2 million. |
QR Limited
QR Limited is allocating $2.772 billion for capital outlays in 2010-11 in Queensland.
Program Highlights
$446.4 million to upgrade infrastructure and rollingstock on the Citytrain network, as part of the South East Queensland Infrastructure Plan and Program (SEQIPP) including:
| • | | $155.6 million to continue construction of the Springfield Line from Darra to Richlands and Springfield, at a total estimated cost of $1.017 billion, with completion brought forward to 2013 |
| • | | $174.4 million to continue building 64 new three car-carriage passenger trains to deliver services enhancements across the Citytrain Network |
| • | | $35 million for track duplication and station upgrades of the Keperra to Ferny Grove line, at a total estimated cost of $80 million |
| • | | $25 million to continue construction of the Corinda to Darra Line: Third Track, at a total estimated cost of $218.2 million |
| • | | $15.5 million to complete the $641.1 million project for Citytrain MetTRIP Track Infrastructure Upgrades which includes the duplication of the track between Caboolture and Beerburrum and the Salisbury to Kuraby third track |
| • | | $9.4 million to complete the Metropolitan Freight Capacity Enhancement works, at a total estimated cost of $84.3 million. |
$864.2 million for coal network track works and new and upgraded locomotives and wagons. All works are to support the haulage of coal in Queensland:
| • | | $502.2 million to continue the Goonyella to Abbot Point construction, at a total estimated cost of $830.7 million |
| | | | |
| | Capital Statement 2010-11 | | 115 |
| • | | $19.5 million to complete the Jilalan Yard on the Hay Point line at Sarina. Upgrade including new tracks and new coal wagon maintenance facilities, at a total estimated cost of $468.3 million |
| • | | $18.6 million to complete the $31.4 million upgrade works for the Columboola to Fishermans Island Rail project, including re-sleepering, formation strengthening, turnout replacement and timber bridge replacement |
| • | | $14.3 million to complete the overhaul of 12 and 16 Cylinder Locomotives for coal haulage, at a total estimated cost of $50.8 million |
| • | | $10.2 million to complete the rail duplication of the Coppabella to Ingsdon line, at a total estimated cost of $75.4 million |
| • | | $9.2 million to complete the Electric Locomotives Upgrade Program, at a total estimated cost of $172 million |
| • | | $7.6 million to continue the Coal Electric Locomotives Fleet Upgrade - Stages 1 & 2, at a total estimated cost of $111.2 million |
| • | | $6.8 million to continue the construction of the Vermont Spur and Balloon Loop to service a new mine, at a total estimated cost of $71.8 million |
| • | | $5.9 million to complete procurement of 10 New Diesel Electric Locomotives (4100 Class), at a total estimated cost of $74.5 million. |
Other major projects are:
| • | | $66.7 million to continue the infrastructure upgrades and other priority works including replacing sleepers and construction of a new passing loop on the Mt Isa Line, at a total estimated cost of $101.7 million |
| • | | $54.9 million to complete the construction of 15 new 4100 Class Diesel Locomotives for use on the Mt Isa Line, at a total estimated cost of $99 million |
| • | | $45.5 million to continue to modify and improve QR facilities and infrastructure for disabled persons, as prescribed by the Disability Discrimination Act 1992 and to modify the Electric, Suburban and Inter-Urban Multiple Unit fleets to meet disability standards for Accessible Public Transport 2007 compliance requirements, at a total estimated cost of $131.5 million. |
Port of Brisbane Corporation Limited
In 2010-11, Port of Brisbane Corporation Limited has allocated $138.3 million for the continuing development of the Port of Brisbane and predominantly comprises investments in additional berths at Fishermans Island, in order to accommodate development of commodity areas.
| | | | |
| 116 | | Capital Statement 2010-11 | | |
Program Highlights
| • | | $56.7 million to continue construction of berths 11 and 12 at Fishermans Island, to accommodate a third stevedore at the Port of Brisbane, at a total estimated cost of $272.3 million. |
| • | | $14.5 million to upgrade the major road network at Fishermans Island to accommodate increasing traffic at the port. |
| • | | $12.6 million for asset replacement, acquisitions and minor capital works including replacement of forklifts at Brisbane Multimodal Terminal. |
| • | | $6 million to construct a new port headquarters and refurbishment of the current port office for leasing to new tenants. |
Far North Queensland Ports Corporation Limited
In 2010-11, Far North Queensland Ports Corporation Limited has allocated $20.5 million towards new and continuing seaport development within its ports in Far North Queensland.
Program Highlights
| • | | $9.3 million to continue the southern extension of the boardwalk and foreshore promenade at the Cairns Cityport, at a total estimated cost of $17.3 million. |
| • | | $3 million to construct a Maritime Training College at Tingira Street, Cairns. |
| • | | $2 million to complete the construction of a Cruise Terminal Facility at the existing heritage cargo sheds at the Port of Cairns, at a total estimated cost of $11.2 million. |
Gladstone Ports Corporation Limited
In 2010-11, Gladstone Ports Corporation Limited has allocated $119 million towards the ongoing expansion of the ports at Gladstone, Bundaberg and Rockhampton.
Program Highlights
| • | | $40.2 million to continue the $95.3 million capacity improvements and upgrades at the RG Tanna Coal Terminal at the Port of Gladstone. |
| • | | $14 million to commence construction of a new tug facility at the Port of Gladstone, at a total estimated cost of $47.5 million. |
| • | | $3.1 million to continue dust suppression projects at the RG Tanna Coal Terminal, at a total estimated cost of $9.8 million. |
| | | | |
| | Capital Statement 2010-11 | | 117 |
North Queensland Bulk Ports Corporation Limited
In 2010-11, North Queensland Bulk Ports Corporation Limited has allocated $123.3 million for various port development projects.
Program Highlights
| • | | $53.5 million to complete the Abbot Point Coal Terminal X50 expansion to increase the capacity of the terminal to 50 million tonnes per annum, at a total estimated cost of $818 million. |
| • | | $39.6 million to complete the renewal of coal stockpile machinery for the Abbot Point Coal Terminal, at a total estimated cost of $68.3 million. |
| • | | $4 million to commence planning for an expansion of the Abbot Point Coal Terminal to a capacity of 230 million tonnes per annum. |
Port of Townsville Limited
Port of Townsville Limited has allocated $72.2 million for plant acquisition, infrastructure development and port improvements for the ports of Townsville and Lucinda during the 2010-11 financial year.
Program Highlights
| • | | $57.5 million to continue the construction of the Townsville Marine Precinct providing a dedicated marine facility for the local industrial and commercial marine industries, at a total estimated cost of $95.9 million. |
| • | | $2.7 million to complete the review and upgrade of the existing fire line system, at a total estimated cost of $5.4 million. |
Main Roads
The Queensland Government is committed to delivering a roads program that supports Queensland's growing population, while managing urban traffic growth and congestion. The 2010-11 infrastructure program, which amounts to $3.276 billion and which includes Queensland Motorways Limited and RoadTek, will help sustain jobs throughout the state and continue the critical infrastructure already underway.
Program Highlights
| • | | $550 million to continue the federally-funded Ipswich Motorway upgrade, between Dinmore to Goodna, at a total estimated cost of $1.950 billion. |
| • | | $288 million in state and federal funding, to upgrade the Bruce Highway between Cooroy and Curra (Section B - Sankeys Road to Traveston Road), at a total estimated cost of $613 million. |
| | | | |
| 118 | | Capital Statement 2010-11 | | |
| • | | $117 million to continue Stage 1 of the Centenary Highway duplication, from Darra to the Logan Motorway Interchange, in conjunction with the Darra to Springfield rail extensions, at a total estimated cost of $414.6 million. |
| • | | $95.9 million to continue the construction of a roundabout on Airport Drive, as part of the Airport Link Project, at a total estimated cost of $297.3 million. |
| • | | $88 million to commence the two lane extension of the Port of Brisbane Motorway from Lindum Road to Pritchard Street, at a total estimated cost of $332 million. |
| • | | $56 million in joint state and federal funding, to widen the Pacific Motorway, between Nerang and Worongary, at a total estimated cost of $158 million. |
| • | | $50 million in joint state and federal funding, to continue the upgrade of the Pacific Motorway between Springwood South and Daisy Hill, at a total estimated cost of $421.6 million. |
| • | | $48.5 million in joint state and federal funding, to continue the widening to four lanes of the Douglas Arterial, on the Bruce Highway (Townsville Ring Road), at a total estimated cost of $110 million. |
| • | | $37.6 million towards the completion of the duplication of the Forgan Bridge in Mackay, at a total estimated cost of $148 million. |
| • | | $30 million for intersection improvements between Ipswich and Withcott, on the Warrego Highway, at a total estimated cost of $40 million. |
| • | | $29.5 million for the Calliope Range deviation on the Dawson Highway, at a total estimated cost of $70 million. |
| • | | $20 million to continue the federally funded upgrade of the Bruce Highway between Innisfail and Cairns, at a total estimated cost of $150 million. |
| • | | $20 million to progress the federally funded upgrade of the Bruce Highway between Ingham and Innisfail, on the Cardwell Range, at a total estimated cost of $115 million. |
| • | | $18.6 million in federal funding to repair and strengthen a section of the Bruce Highway, in the southbound lane between Brisbane and Gympie, at a total estimated cost of $22.4 million. |
| • | | $16.8 million for improvements to intersections on the Gatton - Esk Road, between the Warrego Highway and the former Esk Shire boundary, north of Gatton, at a total estimated cost of $35 million. |
| • | | $14 million to duplicate the Gold Coast Highway from two to four lanes, between Broad Street and Robert Street, Labrador, at a total estimated cost of $107 million. |
| | | | |
| | Capital Statement 2010-11 | | 119 |
| • | | $13.7 million in federal funding to continue four-laning works on the Bruce Highway southern approaches to Mackay, at a total estimated cost of $33.3 million. |
| • | | $8.3 million in joint funding for structural rehabilitation of the Burdekin River Bridge on the Bruce Highway between Bowen and Ayr, at a total estimated cost of $43.8 million. |
| • | | $8.1 million for widening and sealing works on the New England Highway (Yarraman - Toowoomba), south of Crows Nest, at a total estimated cost of $10.9 million. |
| • | | $5 million to widen the Labrador - Carrara Road between Melia Court and Smith Street Connection Road, Parkwood, at a total estimated cost of $132 million. |
| • | | $5 million to continue construction of a new two lane sealed road on the Kennedy Developmental Road, between Hughenden and Winton, at a total estimated cost of $23 million. |
| • | | $3.9 million to commence construction of bridge and approaches, on the Aramac - Torrens Creek Road Cornish Creek, 68km north of Aramac, at a total estimated cost of $5.3 million. |
Queensland Motorways Limited
Queensland Motorways Limited capital expenditure program for the 2010-11 financial year totals $347.6 million.
Program Highlights
| • | | $76.8 million to complete the second Gateway Bridge river crossing and increase capacity on the Gateway Motorway between Mt Gravatt - Capalaba Road and Nudgee Road, at a total estimated cost of $1.75 billion. |
| • | | $198 million to upgrade, to six lanes, a section of the Gateway Motorway, from Mount Gravatt-Capalaba Road to Miles Platting Road, at a total estimated cost of $240 million. |
| | | | |
| 120 | | Capital Statement 2010-11 | | |
| | | | | | | | | | | | | | | | | | |
Transport and Main Roads | |
Project | | Statistical
Division | | Total Estimated
Cost $’000 | | | Expenditure
to 30-06-10
$’000 | | | Budget
2010-11 $’000 | | | Post
2010-11 $’000 | |
TRANSPORT | | | | | | | | | | | | | | | | | | |
| | | | | |
Property, Plant and Equipment | | | | | | | | | | | | | | | | | | |
Busways | | | | | | | | | | | | | | | | | | |
Northern Busway: Enoggera Creek to Kedron | | 05 | | | 734,700 | | | | 459,626 | | | | 197,048 | | | | 78,026 | |
Eastern Busway: Buranda to Coorparoo (Stage 2A) | | 05 | | | 465,794 | | | | 249,532 | | | | 150,000 | | | | 66,262 | |
Northern Busway: Kedron to Chermside (Concept Stage) | | 05 | | | 20,000 | | | | 9,000 | | | | 11,000 | | | | | |
| | | | | | | | | | | | | | | | | | |
Sub-total Busways | | | | | | | | | | | | | 358,048 | | | | | |
| | | | | | | | | | | | | | | | | | |
| | | | | |
Light Rail | | | | | | | | | | | | | | | | | | |
Gold Coast Rapid Transit System1 (Parkwood to Broadbeach) | | 07 | | | 948,741 | | | | 81,666 | | | | 219,000 | | | | 648,075 | |
| | | | | | | | | | | | | | | | | | |
Sub-total Light Rail | | | | | | | | | | | | | 219,000 | | | | | |
| | | | | | | | | | | | | | | | | | |
| | | | | |
Public Transport Infrastructure | | | | | | | | | | | | | | | | | | |
Transport Corridor Acquisitions: SEQ | | Various | | | | | | | | | | | 69,239 | | | | Ongoing | |
South East Queensland Cycle Network Program | | Various | | | | | | | | | | | 9,373 | | | | Ongoing | |
| | | | | | | | | | | | | | | | | | |
Sub-total Public Transport Infrastructure | | | | | | | | | | | | | 78,612 | | | | | |
| | | | | | | | | | | | | | | | | | |
| | | | | |
Maritime Infrastructure | | | | | | | | | | | | | | | | | | |
Boating Infrastructure Minor Works | | Various | | | | | | | | | | | 7,077 | | | | Ongoing | |
Marine Safety Minor Works | | Various | | | | | | | | | | | 3,563 | | | | Ongoing | |
| | | | | | | | | | | | | | | | | | |
Sub-total Maritime Infrastructure | | | | | | | | | | | | | 10,640 | | | | | |
| | | | | | | | | | | | | | | | | | |
| | | | | |
Other Property, Plant and Equipment | | | | | | | | | | | | | | | | | | |
Urban Congestion Initiatives | | 05 | | | 26,020 | | | | 12,700 | | | | 7,695 | | | | 5,625 | |
Infrastructure Replacement Upgrades | | 05 | | | | | | | | | | | 6,023 | | | | Ongoing | |
Capital Works Building Program | | Various | | | | | | | | | | | 5,127 | | | | Ongoing | |
Departmental Plant and Equipment | | Various | | | | | | | | | | | 1,591 | | | | Ongoing | |
| | | | | | | | | | | | | | | | | | |
Sub-total Other Property, Plant and Equipment | | | | | | | | | | | | | 20,436 | | | | | |
| | | | | | | | | | | | | | | | | | |
| | | | | |
Total Property, Plant and Equipment | | | | | | | | | | | | | 686,736 | | | | | |
| | | | | | | | | | | | | | | | | | |
| | | | | |
Other Capital Expenditure | | | | | | | | | | | | | | | | | | |
New Queensland Driver Licence | | 05 | | | 112,621 | | | | 89,093 | | | | 23,528 | | | | | |
| | | | | | | | | | | | | | | | | | |
| | | | | |
Total Other Capital Expenditure | | | | | | | | | | | | | 23,528 | | | | | |
| | | | | | | | | | | | | | | | | | |
| | | | |
| | Capital Statement 2010-11 | | 121 |
| | | | | | | | | | | | | | | | | | |
Transport and Main Roads | |
Project | | Statistical
Division | | Total Estimated
Cost $’000 | | | Expenditure
to 30-06-10 $’000 | | | Budget
2010-11 $’000 | | | Post
2010-11 $’000 | |
| | | | | |
Capital Grants | | | | | | | | | | | | | | | | | | |
Queensland School Bus Strategy | | Various | | | | | | | | | | | 11,551 | | | | Ongoing | |
South East Queensland Cycle Network | | Various | | | | | | | | | | | 10,913 | | | | Ongoing | |
Rural & Remote Airstrips | | Various | | | | | | | | | | | 7,600 | | | | Ongoing | |
Public Transport Infrastructure: Compliance with Disability Standards | | Various | | | | | | | | | | | 1,935 | | | | Ongoing | |
Accessible Buses | | Various | | | | | | | | | | | 1,000 | | | | Ongoing | |
Recreational Boating Infrastructure | | Various | | | | | | | | | | | 500 | | | | Ongoing | |
Safe School Travel | | Various | | | | | | | | | | | 300 | | | | Ongoing | |
Safe Walking and Pedalling | | Various | | | | | | | | | | | 200 | | | | Ongoing | |
| | | | | | | | | | | | | | | | | | |
| | | | | |
Total Capital Grants | | | | | | | | | | | | | 33,999 | | | | | |
| | | | | | | | | | | | | | | | | | |
| | | | | |
TOTAL TRANSPORT | | | | | | | | | | | | | 744,263 | | | | | |
| | | | | | | | | | | | | | | | | | |
| | | | | |
TRANSLINK TRANSIT AUTHORITY | | | | | | | | | | | | | | | | | | |
| | | | | |
Property, Plant and Equipment | | | | | | | | | | | | | | | | | | |
TransLink Station Upgrade Program | | Various | | | 213,077 | | | | 52,489 | | | | 39,061 | | | | 121,527 | |
Integrated Ticketing Equipment | | 05 | | | 22,055 | | | | 12,702 | | | | 4,984 | | | | 4,369 | |
Customer First Passenger Information System | | 05 | | | 14,161 | | | | 7,670 | | | | 6,491 | | | | | |
Pedestrian Overpass at Yeerongpilly Rail Station | | 05 | | | 6,700 | | | | 900 | | | | 5,800 | | | | | |
General Plant & Equipment | | 05 | | | | | | | | | | | 65 | | | | Ongoing | |
| | | | | | | | | | | | | | | | | | |
Total Property, Plant and Equipment | | | | | | | | | | | | | 56,401 | | | | | |
| | | | | | | | | | | | | | | | | | |
| | | | | |
Capital Grants | | | | | | | | | | | | | | | | | | |
Station and Stop Infrastructure Improvement Grant | | Various | | | | | | | | | | | 3,000 | | | | Ongoing | |
| | | | | | | | | | | | | | | | | | |
Total Capital Grants | | | | | | | | | | | | | 3,000 | | | | | |
| | | | | | | | | | | | | | | | | | |
| | | | | |
TOTAL TRANSLINK TRANSIT AUTHORITY | | | | | | | | | | | | | 59,401 | | | | | |
| | | | | | | | | | | | | | | | | | |
| | | | | |
QR LIMITED | | | | | | | | | | | | | | | | | | |
| | | | | |
Property, Plant and Equipment | | | | | | | | | | | | | | | | | | |
QR Network | | | | | | | | | | | | | | | | | | |
Goonyella to Abbott Point Expansion: Infrastructure Works | | 40 | | | 830,685 | | | | 18,685 | | | | 502,197 | | | | 309,803 | |
| | | | |
| 122 | | Capital Statement 2010-11 | | |
| | | | | | | | | | | | | | | | | | |
Transport and Main Roads | |
Project | | Statistical
Division | | Total Estimated
Cost $’000 | | | Expenditure
to 30-06-10
$’000 | | | Budget
2010-11 $’000 | | | Post
2010-11 $’000 | |
| | | | | |
Springfield Line (Richlands to Springfield) | | 05 | | | 646,000 | | | | 5,000 | | | | 51,000 | | | | 590,000 | |
Citytrain MetTRIP Track Infrastructure Upgrades (Stages 1 and 2) | | 09 | | | 641,066 | | | | 625,560 | | | | 15,506 | | | | | |
Springfield Line (Darra to Richlands) | | 05 | | | 370,944 | | | | 259,835 | | | | 104,615 | | | | 6,494 | |
Robina to Varsity Lakes | | 07 | | | 300,131 | | | | 290,643 | | | | 7,629 | | | | 1,859 | |
Corinda to Darra: Third Track | | 05 | | | 218,150 | | | | 187,465 | | | | 25,041 | | | | 5,644 | |
Dalrymple Bay Coal Terminal: 3rd Loop | | 40 | | | 118,800 | | | | 116,455 | | | | 2,345 | | | | | |
Mt Isa Line Priority Works | | 55 | | | 101,747 | | | | 21,007 | | | | 66,740 | | | | 14,000 | |
Keperra to Ferny Grove Duplication | | 05 | | | 80,000 | | | | 5,000 | | | | 35,000 | | | | 40,000 | |
Metropolitan Freight Capacity Enhancement | | 05 | | | 84,260 | | | | 74,855 | | | | 9,405 | | | | | |
Coppabella - Ingsdon Duplication | | 40 | | | 75,435 | | | | 65,262 | | | | 10,173 | | | | | |
Vermont Spur and Balloon Loop | | 40 | | | 71,750 | | | | 59,956 | | | | 6,794 | | | | 5,000 | |
Raglan Electricity Feeder Station | | 30 | | | 51,977 | | | | 5,924 | | | | 25,460 | | | | 20,593 | |
Minimum Maintenance Track - Metro | | 05 | | | 49,110 | | | | 47,756 | | | | 1,354 | | | | | |
Duaringa Electricity Feeder Station | | 30 | | | 47,428 | | | | 8,253 | | | | 13,881 | | | | 25,294 | |
Wycarbah Electricity Feeder Station | | 30 | | | 47,314 | | | | 13,707 | | | | 27,437 | | | | 6,170 | |
Bluff Electricity Feeder Station | | 30 | | | 45,459 | | | | 8,582 | | | | 15,041 | | | | 21,836 | |
Goonyella - Abbot Point Expansion: Long Lead Time Items | | 40 | | | 42,085 | | | | 41,021 | | | | 1,064 | | | | | |
Callemondah 3rd Spur | | 30 | | | 35,802 | | | | 34,802 | | | | 1,000 | | | | | |
Columboola to Fishermans Island | | Various | | | 31,363 | | | | 12,811 | | | | 18,552 | | | | | |
Electrification Capacity Upgrade | | 05 | | | 30,107 | | | | 27,127 | | | | 2,980 | | | | | |
Automatic Train Protection - Upgrade Computer system | | 30 | | | 29,950 | | | | 19,391 | | | | 8,377 | | | | 2,182 | |
St Lawrence River Bridge Replacement. | | 40 | | | 28,874 | | | | 27,374 | | | | 1,500 | | | | | |
Turnout & Crossover Refurbishment | | 05 | | | 28,500 | | | | 24,980 | | | | 3,382 | | | | 138 | |
Wiggins Island (Gladstone) Balloon Loop | | 30 | | | 23,000 | | | | 20,441 | | | | 2,559 | | | | | |
| | | | |
| | Capital Statement 2010-11 | | 123 |
| | | | | | | | | | | | | | | | | | |
Transport and Main Roads | |
Project | | Statistical
Division | | Total Estimated
Cost $’000 | | | Expenditure
to 30-06-10
$’000 | | | Budget
2010-11 $’000 | | | Post
2010-11 $’000 | |
| | | | | |
Coal System: Turnout Replacements (Stage 2) | | Various | | | 22,558 | | | | 4,230 | | | | 10,944 | | | | 7,384 | |
Electrification Infrastructure Renewal Strategy | | 05 | | | 20,900 | | | | 6,766 | | | | 2,325 | | | | 11,809 | |
Translink Ticketing: Conduit Requirements | | 05 | | | 20,750 | | | | 20,267 | | | | 483 | | | | | |
Moura Link (Preliminary Design) | | 30 | | | 19,997 | | | | 3,760 | | | | 16,237 | | | | | |
Telecommunications Infrastructure Renewal - Metro | | 05 | | | 18,730 | | | | 15,225 | | | | 3,505 | | | | | |
Central Qld Coal Formation Strengthening (Stage 2) | | Various | | | 16,130 | | | | 11,810 | | | | 4,320 | | | | | |
NCL: Aldoga to Wiggins Island Coal Export Terminal (WICET) Upgrade. | | 30 | | | 15,752 | | | | 5,955 | | | | 9,797 | | | | | |
Banana - Wooderson: Track Upgrade (Banana - Gladstone Upgrade) | | 30 | | | 14,000 | | | | 9,626 | | | | 4,374 | | | | | |
Noise Amelioration: Statewide Strategy | | 05 | | | 13,251 | | | | 10,118 | | | | 2,877 | | | | 256 | |
VPI-type Processors Replacement (Farleigh to Purono) | | Various | | | 13,246 | | | | 4,478 | | | | 3,068 | | | | 5,700 | |
Corridor Land Requirements | | 05 | | | 10,810 | | | | 6,488 | | | | 314 | | | | 4,008 | |
Universal Train Controller Disaster Recovery System Development | | Various | | | 10,388 | | | | 7,831 | | | | 1,356 | | | | 1,201 | |
North Queensland: 8 Priority Level Crossing Upgrades | | Various | | | 10,000 | | | | 9,225 | | | | 775 | | | | | |
Telecommunications Backbone Network Strategy | | Various | | | 9,783 | | | | 7,556 | | | | 946 | | | | 1,281 | |
QR Network Other - General | | Various | | | | | | | | | | | 560,234 | | | | Ongoing | |
| | | | | | | | | | | | | | | | | | |
Sub-total QR Network | | | | | | | | | | | | | 1,580,587 | | | | | |
| | | | | | | | | | | | | | | | | | |
| | | | | |
QR Freight Coal | | | | | | | | | | | | | | | | | | |
Jilalan Yard Upgrade | | 40 | | | 468,329 | | | | 448,853 | | | | 19,476 | | | | | |
Electric Locomotives Upgrade Program | | 30 | | | 172,000 | | | | 162,781 | | | | 9,219 | | | | | |
Coal Electric Locomotives Fleet Upgrade (Stages 1 & 2) | | 45 | | | 111,228 | | | | 84,967 | | | | 7,600 | | | | 18,661 | |
15 Additional Diesel Locomotives | | 15 | | | 95,250 | | | | 15,788 | | | | 79,462 | | | | | |
10 New Diesel Electric Locomotives (4100 Class) | | 15 | | | 74,500 | | | | 68,631 | | | | 5,869 | | | | | |
| | | | |
| 124 | | Capital Statement 2010-11 | | |
Transport and Main Roads
| | | | | | | | | | | | | | | | | | |
Project | | Statistical Division | | Total
Estimated
Cost
$’000 | | | Expenditure
to 30-06-10
$’000 | | | Budget
2010-11 $’000 | | | Post
2010-11 $’000 | |
370 x 106T Coal Wagons | | Various | | | 63,500 | | | | 10,000 | | | | 53,500 | | | | | |
12 & 16 Cylinder Locomotives Overhauls - Coal | | 05 | | | 50,779 | | | | 36,520 | | | | 14,259 | | | | | |
4000 Class Locomotive E Inspection Program | | 05 | | | 25,920 | | | | 21,318 | | | | 2,665 | | | | 1,937 | |
| | | | | | | | | | | | | | | | | | |
Sub-total QR Freight Coal | | | | | | | | | | | | | 192,050 | | | | | |
| | | | | | | | | | | | | | | | | | |
| | | | | |
QR Freight | | | | | | | | | | | | | | | | | | |
QR Bulk Freight | | | | | | | | | | | | | | | | | | |
15 New Diesel Locomotives (4100 Class) for Mt Isa Line | | 15 | | | 99,000 | | | | 44,088 | | | | 54,912 | | | | | |
12 & 16 Cylinder Locomotives Overhauls - Bulk Freight | | 05 | | | 12,644 | | | | 7,803 | | | | 1,991 | | | | 2,850 | |
QR Regional Freight | | | | | | | | | | | | | | | | | | |
12 &16 Cylinder Locomotives Overhauls - Regional Freight | | 05 | | | 19,364 | | | | 14,564 | | | | 1,600 | | | | 3,200 | |
QR Freight - General | | Various | | | | | | | | | | | 131,253 | | | | Ongoing | |
| | | | | | | | | | | | | | | | | | |
Sub-total QR Freight | | | | | | | | | | | | | 189,756 | | | | | |
| | | | | | | | | | | | | | | | | | |
| | | | | |
Passenger Services | | | | | | | | | | | | | | | | | | |
Citytrain Rollingstock | | 15 | | | 901,075 | | | | 63,674 | | | | 101,800 | | | | 735,601 | |
Additional Citytrain Rollingstock | | 15 | | | 281,137 | | | | 216,984 | | | | 64,153 | | | | | |
MetTRIP - Additional Citytrain Rollingstock | | 15 | | | 275,456 | | | | 267,035 | | | | 8,421 | | | | | |
Citytrain Rail Capacity Upgrades | | 05 | | | 90,000 | | | | | | | | 1,000 | | | | 89,000 | |
Citytrain Disability Standards 2007 Compliance: Infrastructure | | 05 | | | 82,879 | | | | 53,775 | | | | 29,104 | | | | | |
New Stabling Facilities | | 05 | | | 49,700 | | | | 2,154 | | | | 18,071 | | | | 29,475 | |
Citytrain Disability Standards 2007 Compliance: Rollingstock | | 05 | | | 48,594 | | | | 11,134 | | | | 16,350 | | | | 21,110 | |
SMU200 Major Overhauls1 | | 05 | | | 34,474 | | | | 25,182 | | | | 9,292 | | | | | |
Citytrain Intermodal Works | | 05 | | | 26,794 | | | | 26,163 | | | | 100 | | | | 531 | |
Citytrain Station Upgrades | | 05 | | | 15,459 | | | | 14,305 | | | | 366 | | | | 788 | |
Albion Land Bridge | | 05 | | | 15,000 | | | | 2,225 | | | | 2,775 | | | | 10,000 | |
Future Citytrain Rollingstock Design | | 05 | | | 10,037 | | | | 4,010 | | | | 4,752 | | | | 1,275 | |
Passenger Services - General | | 05 | | | | | | | | | | | 370,189 | | | | Ongoing | |
| | | | | | | | | | | | | | | | | | |
Sub-total Passenger Services | | | | | | | | | | | | | 626,373 | | | | | |
| | | | | | | | | | | | | | | | | | |
| | | | | |
Across QR | | | | | | | | | | | | | | | | | | |
Additional 5 x 4100 Class Locomotives | | 15 | | | 32,000 | | | | 2,710 | | | | 27,815 | | | | 1,475 | |
| | | | |
| | Capital Statement 2010-11 | | 125 |
Transport and Main Roads
| | | | | | | | | | | | | | | | | | |
Project | | Statistical
Division | | Total Estimated
Cost $’000 | | | Expenditure
to 30-06-10
$’000 | | | Budget
2010-11 $’000 | | | Post
2010-11 $’000 | |
Head Office Refurbishments | | 05 | | | 26,037 | | | | 24,307 | | | | 1,730 | | | | | |
Major Property Disposals | | 05 | | | 19,261 | | | | 18,490 | | | | 600 | | | | 171 | |
Across QR - General | | 05 | | | | | | | | | | | 153,477 | | | | Ongoing | |
| | | | | | | | | | | | | | | | | | |
Sub-total Across QR | | | | | | | | | | | | | 183,622 | | | | | |
| | | | | | | | | | | | | | | | | | |
| | | | | |
Total Property, Plant and Equipment | | | | | | | | | | | | | 2,772,388 | | | | | |
| | | | | | | | | | | | | | | | | | |
| | | | | |
TOTAL QR LIMITED | | | | | | | | | | | | | 2,772,388 | | | | | |
| | | | | | | | | | | | | | | | | | |
| | | | | |
PORT OF BRISBANE CORPORATION LIMITED | | | | | | | | | | | | | | | | | | |
| | | | | |
Property, Plant and Equipment | | | | | | | | | | | | | | | | | | |
Wharf & Berth 11 and 12 | | 05 | | | 272,300 | | | | 52,420 | | | | 56,700 | | | | 163,180 | |
Ground Improvement - T11, T12 and T13 | | 05 | | | 109,670 | | | | 54,850 | | | | 25,360 | | | | 29,460 | |
Outer Future Port Expansion Works (Rockwall Build Up) | | 05 | | | 15,000 | | | | | | | | 3,000 | | | | 12,000 | |
Port Drive - Truck Parking & Associated Works | | 05 | | | 3,000 | | | | | | | | 3,000 | | | | | |
Upgrades of Major Roads | | 05 | | | | | | | | | | | 14,500 | | | | Ongoing | |
Port Central - Office Construction and Upgrade | | 05 | | | | | | | | | | | 6,000 | | | | Ongoing | |
Colmslie Estate | | 05 | | | | | | | | | | | 3,750 | | | | Ongoing | |
Warehouses & Container Facilities | | 05 | | | | | | | | | | | 3,750 | | | | Ongoing | |
Portgate Property Developments | | 05 | | | | | | | | | | | 3,750 | | | | Ongoing | |
Lessee Terminals or Wharves | | 05 | | | | | | | | | | | 2,500 | | | | Ongoing | |
Port West - Filling | | 05 | | | | | | | | | | | 2,500 | | | | Ongoing | |
Port West - Infrastructure | | 05 | | | | | | | | | | | 500 | | | | Ongoing | |
Electrical & Communication Upgrades | | 05 | | | | | | | | | | | 250 | | | | Ongoing | |
Building & Landscaping Upgrades | | 05 | | | | | | | | | | | 100 | | | | Ongoing | |
Plant, Equipment and Minor Works | | 05 | | | | | | | | | | | 12,623 | | | | Ongoing | |
| | | | | | | | | | | | | | | | | | |
Total Property, Plant and Equipment | | | | | | | | | | | | | 138,283 | | | | | |
| | | | | | | | | | | | | | | | | | |
| | | | | |
TOTAL PORT OF BRISBANE CORPORATION LIMITED | | | | | | | | | | | | | 138,283 | | | | | |
| | | | | | | | | | | | | | | | | | |
| | | | | |
FAR NORTH QUEENSLAND PORTS CORPORATION LIMITED | | | | | | | | | | | | | | | | | | |
| | | | | |
Property, Plant and Equipment | | | | | | | | | | | | | | | | | | |
Cairns Cityport | | | | | | | | | | | | | | | | | | |
Foreshore Development | | 50 | | | 17,268 | | | | 2,510 | | | | 9,320 | | | | 5,438 | |
| | | | |
| 126 | | Capital Statement 2010-11 | | |
Transport and Main Roads
| | | | | | | | | | | | | | | | | | |
Project | | Statistical
Division | | Total Estimated
Cost $’000 | | | Expenditure
to 30-06-10
$’000 | | | Budget
2010-11 $’000 | | | Post
2010-11 $’000 | |
Cruise Terminal Facility | | 50 | | | 11,200 | | | | 9,201 | | | | 1,999 | | | | | |
Cityport Commercial Allowance | | 50 | | | 3,198 | | | | 1,398 | | | | 400 | | | | 1,400 | |
G Finger Design & Construction | | 50 | | | 1,500 | | | | | | | | 1,500 | | | | | |
Marina Bilge & Sullage System | | 50 | | | 350 | | | | | | | | 350 | | | | | |
H Finger Super Yacht Berths | | 50 | | | 240 | | | | | | | | 240 | | | | | |
| | | | | | | | | | | | | | | | | | |
Sub-total Cairns Cityport | | | | | | | | | | | | | 13,809 | | | | | |
| | | | | | | | | | | | | | | | | | |
| | | | | |
Cairns Seaport | | | | | | | | | | | | | | | | | | |
Tingira St Warehouse/Shops - 1st Release (Maritime Training College) | | 50 | | | 3,000 | | | | | | | | 3,000 | | | | | |
Tingira St Warehouse/Shops - 2nd1 Release (Australian Live Seafood Export) | | 50 | | | 2,000 | | | | 500 | | | | 1,500 | | | | | |
Lease Acquisitions | | 50 | | | 700 | | | | 450 | | | | 250 | | | | | |
| | | | | | | | | | | | | | | | | | |
Sub-total Cairns Seaport | | | | | | | | | | | | | 4,750 | | | | | |
| | | | | | | | | | | | | | | | | | |
| | | | | |
Far North Queensland Ports Corporation Limited Regional Ports | | | | | | | | | | | | | | | | | | |
Thursday Island Main Wharf Concrete Upgrade | | 50 | | | 1,355 | | | | | | | | 108 | | | | 1,247 | |
Development Dredge Approvals | | 50 | | | 350 | | | | | | | | 250 | | | | 100 | |
Thursday Island Engineers Wharf Carpark Upgrade | | 50 | | | 285 | | | | 130 | | | | 155 | | | | | |
Marina Commercial Allowance | | 50 | | | 250 | | | | | | | | 250 | | | | | |
Mourilyan Land Lease Acquisition | | 50 | | | 250 | | | | | | | | 250 | | | | | |
Mourilyan Commercial Fishing Facility | | 50 | | | 226 | | | | | | | | 226 | | | | | |
Horn Island Passenger Access Upgrade | | 50 | | | 130 | | | | | | | | 130 | | | | | |
| | | | | | | | | | | | | | | | | | |
Sub-total Far North Queensland Ports Corporation Limited Regional Ports | | | | | | | | | | | | | 1,369 | | | | | |
| | | | | | | | | | | | | | | | | | |
| | | | | |
Plant, Equipment and Minor Works | | 50 | | | | | | | | | | | 532 | | | | Ongoing | |
| | | | | | | | | | | | | | | | | | |
| | | | | |
Total Property, Plant and Equipment | | | | | | | | | | | | | 20,460 | | | | | |
| | | | | | | | | | | | | | | | | | |
| | | | | |
TOTAL FAR NORTH QUEENSLAND PORTS CORPORATION LIMITED | | | | | | | | | | | | | 20,460 | | | | | |
| | | | | | | | | | | | | | | | | | |
| | | | | |
GLADSTONE PORTS CORPORATION LIMITED | | | | | | | | | | | | | | | | | | |
| | | | | |
Property, Plant and Equipment | | | | | | | | | | | | | | | | | | |
RG Tanna Coal Terminal | | | | | | | | | | | | | | | | | | |
RG Tanna Coal Terminal Projects | | 30 | | | 95,262 | | | | 9,315 | | | | 40,210 | | | | 45,737 | |
| | | | |
| | Capital Statement 2010-11 | | 127 |
Transport and Main Roads
| | | | | | | | | | | | | | | | | | |
Project | | Statistical
Division | | Total Estimated
Cost $’000 | | | Expenditure
to 30-06-10
$’000 | | | Budget
2010-11 $’000 | | | Post
2010-11 $’000 | |
| | | | | |
RG Tanna Dust Suppression Projects | | 30 | | | 9,760 | | | | 1,500 | | | | 3,050 | | | | 5,210 | |
| | | | | | | | | | | | | | | | | | |
Sub-total RG Tanna Coal Terminal | | | | | | | | | | | | | 43,260 | | | | | |
| | | | | | | | | | | | | | | | | | |
| | | | | |
Tug Facility Projects | | 30 | | | 47,500 | | | | 500 | | | | 14,000 | | | | 33,000 | |
Property Projects | | 30 | | | 20,650 | | | | 5,915 | | | | 8,735 | | | | 6,000 | |
Commercial Projects | | 30 | | | 10,100 | | | | 560 | | | | 7,540 | | | | 2,000 | |
Auckland Point Projects | | 30 | | | 10,000 | | | | | | | | 5,000 | | | | 5,000 | |
Barney Point Projects | | 30 | | | 3,150 | | | | | | | | 2,650 | | | | 500 | |
Port Alma Shipping Terminal Projects | | 30 | | | 2,000 | | | | | | | | 2,000 | | | | | |
Fisherman’s Landing Projects | | 30 | | | 1,500 | | | | | | | | 1,500 | | | | | |
Engineering Services Projects | | 30 | | | 650 | | | | | | | | 650 | | | | | |
Port Services Projects | | 30 | | | | | | | | | | | 16,900 | | | | Ongoing | |
Plant, Equipment and Minor Works | | 30 | | | | | | | | | | | 16,347 | | | | Ongoing | |
Bundaberg Port Projects | | 15 | | | | | | | | | | | 412 | | | | Ongoing | |
| | | | | | | | | | | | | | | | | | |
Total Property, Plant and Equipment | | | | | | | | | | | | | 118,994 | | | | | |
| | | | | | | | | | | | | | | | | | |
| | | | | |
TOTAL GLADSTONE PORTS CORPORATION LIMITED | | | | | | | | | | | | | 118,994 | | | | | |
| | | | | | | | | | | | | | | | | | |
| | | | | |
NORTH QUEENSLAND BULK PORTS CORPORATION LIMITED | | | | | | | | | | | | | | | | | | |
| | | | | |
Property, Plant and Equipment | | | | | | | | | | | | | | | | | | |
Abbot Point Expansion X50 | | 40 | | | 818,000 | | | | 764,489 | | | | 53,511 | | | | | |
Abbot Point Expansion Refurbish Coal Stockpile Loaders | | 40 | | | 68,300 | | | | 28,671 | | | | 39,629 | | | | | |
Abbot Point Expansion X110 (Preliminary Planning) | | 40 | | | 16,000 | | | | 14,000 | | | | 2,000 | | | | | |
Louisa Creek Land Acquisitions | | 40 | | | 10,000 | | | | 8,656 | | | | 1,344 | | | | | |
Mackay Harbour Road Redevelopment | | 40 | | | 5,073 | | | | 1,503 | | | | 3,570 | | | | | |
Abbot Point Expansion X230 Masterplan | | 40 | | | 4,000 | | | | | | | | 4,000 | | | | | |
Mackay High Voltage and Low Voltage Assets | | 40 | | | 2,670 | | | | 2,245 | | | | 425 | | | | | |
Plant, Equipment and Minor Works | | Various | | | | | | | | | | | 608 | | | | Ongoing | |
Port Development | | | | | | | | | | | | | | | | | | |
Abbot Point Port Development | | 40 | | | | | | | | | | | 11,207 | | | | Ongoing | |
Hay Point Port Development | | 40 | | | | | | | | | | | 4,159 | | | | Ongoing | |
| | | | |
| 128 | | Capital Statement 2010-11 | | |
Transport and Main Roads
| | | | | | | | | | | | | | | | | | |
Project | | Statistical
Division | | Total Estimated
Cost $’000 | | | Expenditure
to 30-06-10 $’000 | | | Budget
2010-11 $’000 | | | Post
2010-11 $’000 | |
Mackay Port Development | | 40 | | | | | | | | | | | 2,805 | | | | Ongoing | |
Weipa Port Development | | 50 | | | | | | | | | | | 49 | | | | Ongoing | |
| | | | | | | | | | | | | | | | | | |
Total Property, Plant and Equipment | | | | | | | | | | | | | 123,307 | | | | | |
| | | | | | | | | | | | | | | | | | |
| | | | | |
TOTAL NORTH QUEENSLAND BULK PORTS CORPORATION LIMITED | | | | | | | | | | | | | 123,307 | | | | | |
| | | | | | | | | | | | | | | | | | |
| | | | | |
PORT OF TOWNSVILLE LIMITED | | | | | | | | | | | | | | | | | | |
| | | | | |
Property, Plant and Equipment | | | | | | | | | | | | | | | | | | |
Townsville Marine Precinct Project | | 45 | | | 95,853 | | | | 2,780 | | | | 57,512 | | | | 35,561 | |
Saltwater Fire System Review and Upgrade | | 45 | | | 5,400 | | | | 2,700 | | | | 2,700 | | | | | |
Quarry | | 45 | | | 4,775 | | | | | | | | 4,775 | | | | | |
Berth 4 Upgrade | | 45 | | | 2,078 | | | | | | | | 2,078 | | | | | |
Road Upgrades | | 45 | | | 1,048 | | | | | | | | 1,048 | | | | | |
Plant, Equipment and Minor Works | | 45 | | | | | | | | | | | 4,093 | | | | Ongoing | |
| | | | | | | | | | | | | | | | | | |
Total Property, Plant and Equipment | | | | | | | | | | | | | 72,206 | | | | | |
| | | | | | | | | | | | | | | | | | |
| | | | | |
TOTAL PORT OF TOWNSVILLE LIMITED | | | | | | | | | | | | | 72,206 | | | | | |
| | | | | | | | | | | | | | | | | | |
| | | | | |
MAIN ROADS | | | | | | | | | | | | | | | | | | |
| | | | | |
Property, Plant and Equipment | | | | | | | | | | | | | | | | | | |
Corporate Buildings | | | | | | | | | | | | | | | | | | |
Clopton Street District Office - Toowoomba | | 20 | | | 1,800 | | | | | | | | 1,800 | | | | | |
Coombabah Depot - Gold Coast | | 07 | | | 2,400 | | | | | | | | 2,400 | | | | | |
Deagon Roads and Maintenance Depot | | 05 | | | 1,200 | | | | | | | | 1,200 | | | | | |
Nundah Laboratory and Office Complex | | 05 | | | 49,500 | | | | 1,500 | | | | 30,000 | | | | 18,000 | |
Other works | | Various | | | | | | | | | | | 6,600 | | | | Ongoing | |
| | | | | | | | | | | | | | | | | | |
Sub-total Corporate Buildings | | | | | | | | | | | | | 42,000 | | | | | |
| | | | | | | | | | | | | | | | | | |
| | | | | |
National Network | | | | | | | | | | | | | | | | | | |
Bruce Highway | | | | | | | | | | | | | | | | | | |
Boundary Road and City Gates, southern approach to Mackay, intersection improvements | | 40 | | | 12,681 | | | | 4,182 | | | | 8,499 | | | | | |
| | | | |
| | Capital Statement 2010-11 | | 129 |
Transport and Main Roads
| | | | | | | | | | | | | | | | | | | | |
Project | | Statistical
Division | | | Total Estimated
Cost $’000 | | | Expenditure
to 30-06-10
$’000 | | | Budget
2010-11 $’000 | | | Post
2010-11 $’000 | |
Burdekin River Bridge, north of Home Hill, structural rehabilitation | | | 45 | | | | 43,750 | | | | 6,773 | | | | 8,291 | | | | 28,686 | |
Cardwell Range north, construct deviation to sealed standard | | | 50 | | | | 115,000 | | | | 14,500 | | | | 20,000 | | | | 80,500 | |
Cooroy - Curra (Section B): Sankeys Road to Traveston Road, Gympie, construct to new sealed 4 lane standard | | | 15 | | | | 613,000 | | | | 133,930 | | | | 288,070 | | | | 191,000 | |
Douglas Arterial (Townsville Ring Road), widen to four lanes | | | 45 | | | | 110,000 | | | | 8,450 | | | | 48,550 | | | | 53,000 | |
Innisfail - Cairns, grade separation | | | 50 | | | | 150,000 | | | | 4,000 | | | | 20,000 | | | | 126,000 | |
Brisbane - Gympie, rehabilitate pavement | | | 09 | | | | 22,350 | | | | 3,753 | | | | 18,597 | | | | | |
Temples Lane to Farrellys Lane, south of Mackay, duplicate 2 to 4 lanes | | | 40 | | | | 33,254 | | | | 4,711 | | | | 13,711 | | | | 14,832 | |
Cunningham Arterial/Highway (Ipswich Motorway) | | | | | | | | | | | | | | | | | | | | |
Dinmore - Goodna, widen to 6 lanes | | | 05 | | | | 1,950,000 | | | | 606,820 | | | | 550,000 | | | | 793,180 | |
Pacific Motorway | | | | | | | | | | | | | | | | | | | | |
Nerang - Worongary, widen 4 to 6 lanes | | | 07 | | | | 158,000 | | | | 41,795 | | | | 56,000 | | | | 60,205 | |
Springwood South - Daisy Hill (Section B: 4.07 - 7.37km), construct additional lane | | | 05 | | | | 421,626 | | | | 58,841 | | | | 50,000 | | | | 312,785 | |
Peninsula Developmental | | | | | | | | | | | | | | | | | | | | |
Carols Crossing, west of Lakeland, construct bridge and approaches | | | 50 | | | | 9,856 | | | | 4,917 | | | | 4,939 | | | | | |
Warrego Highway | | | | | | | | | | | | | | | | | | | | |
0.3 - 3.9km (Stage 2 Mitchell Township Rehabilitation), widen pavement | | | 25 | | | | 5,042 | | | | 300 | | | | 3,900 | | | | 842 | |
Other Construction | | | Various | | | | | | | | | | | | 266,462 | | | | Ongoing | |
| | | | | | | | | | | | | | | | | | | | |
Sub-total National Network | | | | | | | | | | | | | | | 1,357,019 | | | | | |
| | | | | | | | | | | | | | | | | | | | |
| | | | |
| 130 | | Capital Statement 2010-11 | | |
Transport and Main Roads
| | | | | | | | | | | | | | | | | | | | |
Project | | Statistical
Division | | | Total Estimated
Cost $’000 | | | Expenditure
to 30-06-10
$’000 | | | Budget
2010-11 $’000 | | | Post
2010-11 $’000 | |
Other State-controlled Roads | | | | | | | | | | | | | | | | | | | | |
Airport Link | | | | | | | | | | | | | | | | | | | | |
Airport Drive, construct roundabout | | | 05 | | | | 297,266 | | | | 199,463 | | | | 95,895 | | | | 1,908 | |
Aramac - Torrens Creek | | | | | | | | | | | | | | | | | | | | |
Cornish Creek, construct bridge and approach | | | 35 | | | | 5,275 | | | | 1,395 | | | | 3,880 | | | | | |
Capricorn Highway | | | | | | | | | | | | | | | | | | | | |
Gracemere - preliminary works for a crossing over the Blackwater rail line | | | 30 | | | | 10,000 | | | | | | | | 6,000 | | | | 4,000 | |
Dawson Highway | | | | | | | | | | | | | | | | | | | | |
Gladstone - Biloela, Calliope Range, construct deviation - sealed standard | | | 30 | | | | 70,000 | | | | 14,755 | | | | 29,458 | | | | 25,787 | |
Eidsvold - Theodore | | | | | | | | | | | | | | | | | | | | |
2.40 - 66.00km (various locations), Eidsvold, widen pavement | | | 15 | | | | 16,951 | | | | | | | | 10,000 | | | | 6,951 | |
Gatton - Esk | | | | | | | | | | | | | | | | | | | | |
Warrego Highway - Esk Shire boundary, north of Gatton - Kellys Road Gatton, improve intersections | | | 12 | | | | 35,000 | | | | 2,225 | | | | 16,775 | | | | 16,000 | |
Gold Coast Highway | | | | | | | | | | | | | | | | | | | | |
Helensvale - Southport, Broad Road - Robert Street, widen to 4 lanes | | | 07 | | | | 107,000 | | | | 64,000 | | | | 14,000 | | | | 29,000 | |
Gregory Developmental Road | | | | | | | | | | | | | | | | | | | | |
2.5km south of Christmas - 4km south of Charcoal Creek (160.90 - 175.40km), widen and seal shoulder | | | 45 | | | | 16,000 | | | | 500 | | | | 4,500 | | | | 11,000 | |
Kennedy Developmental Road | | | | | | | | | | | | | | | | | | | | |
25.75 - 59.02km, south of Hughenden, construct to new sealed 2 lane standard | | | 55 | | | | 23,000 | | | | 3,000 | | | | 5,000 | | | | 15,000 | |
Labrador - Carrara | | | | | | | | | | | | | | | | | | | | |
Melia Court - Smith Street connection road, widen to 6 lanes | | | 07 | | | | 132,000 | | | | 32,000 | | | | 5,000 | | | | 95,000 | |
| | | | |
| | Capital Statement 2010-11 | | 131 |
Transport and Main Roads
| | | | | | | | | | | | | | | | | | | | |
Project | | Statistical
Division | | | Total Estimated
Cost $’000 | | | Expenditure
to 30-06-10
$’000 | | | Budget
2010-11 $’000 | | | Post
2010-11 $’000 | |
| | | | | |
Mackay - Slade Point Road (Barnes Creek Road) | | | | | | | | | | | | | | | | | | | | |
Forgan Bridge over the Pioneer River, construct bridge and approaches | | | 40 | | | | 148,000 | | | | 110,427 | | | | 37,573 | | | | | |
Maryborough - Hervey Bay Road | | | | | | | | | | | | | | | | | | | | |
Torbanlea turn-off - Dundowran Road, 7km south of Pialba, duplicate 2 to 4 lanes | | | 15 | | | | 17,149 | | | | 7,849 | | | | 9,300 | | | | | |
Port of Brisbane Motorway | | | | | | | | | | | | | | | | | | | | |
Lindum Road - Pritchard Street, 2 lane motorway extension | | | 05 | | | | 332,000 | | | | 4,000 | | | | 88,000 | | | | 240,000 | |
Warrego Highway (Yarraman - Toowoomba) | | | | | | | | | | | | | | | | | | | | |
Munro Road - Pioneer Road, south of Crows Nest, widen and seal | | | 20 | | | | 10,878 | | | | 2,555 | | | | 8,073 | | | | 250 | |
Ipswich - Withcott, Ipswich, improve intersections | | | 12 | | | | 40,000 | | | | 10,000 | | | | 30,000 | | | | | |
Western Arterial (Centenary Highway) | | | | | | | | | | | | | | | | | | | | |
Springfield - Darra, duplicate to 4 lanes | |
| 05
|
| | | 414,600 | | | | 297,276 | | | | 117,024 | | |
| 300
|
|
Other Construction | | | Various | | | | | | | | | | | | 952,817 | | | | Ongoing | |
| | | | | | | | | | | | | | | | | | | | |
Sub-total Other State-controlled Roads | | | | | | | | | | | | | | | 1,433,295 | | | | | |
| | | | | | | | | | | | | | | | | | | | |
| | | | | |
Plant and Equipment | | | Various | | | | | | | | | | | | 7,500 | | | | Ongoing | |
| | | | | | | | | | | | | | | | | | | | |
| | | | | |
Total Property, Plant and Equipment | | | | | | | | | | | | | | | 2,839,814 | | | | | |
| | | | | | | | | | | | | | | | | | | | |
| | | | | |
Other Capital Expenditure | | | | | | | | | | | | | | | | | | | | |
Information technology | | | Various | | | | | | | | | | | | 6,500 | | | | Ongoing | |
| | | | | | | | | | | | | | | | | | | | |
| | | | | |
Total Other Capital Expenditure | | | | | | | | | | | | | | | 6,500 | | | | | |
| | | | | | | | | | | | | | | | | | | | |
| | | | | |
Capital Grants | | | | | | | | | | | | | | | | | | | | |
Transport Infrastructure Development Scheme - Capital Grants | | | | | | | | | | | | | | | | | | | | |
Blackall - Emmet Road (14.00 - 23.50km), west of Blackall | | | 35 | | | | 1,575 | | | | | | | | 1,000 | | | | 575 | |
Bloomfield River crossing, construct bridge and approaches | | | 50 | | | | 5,500 | | | | 100 | | | | 2,000 | | | | 3,400 | |
Charles Street (Fulham Road - Anne Street), Aitkenvale, rehabilitate pavement | | | 45 | | | | 1,181 | | | | 790 | | | | 391 | | | | | |
| | | | |
| 132 | | Capital Statement 2010-11 | | |
Transport and Main Roads
| | | | | | | | | | | | | | | | | | |
Project | | Statistical
Division | | Total Estimated
Cost $’000 | | | Expenditure
to 30-06-10
$’000 | | | Budget
2010-11 $’000 | | | Post
2010-11 $’000 | |
| | | | | |
Doomadgee Road East, south of Burketown, pave and seal | | 55 | | | 1,400 | | | | 600 | | | | 400 | | | | 400 | |
Evans Street (Plaza Parade - Maroochydore Road), construct new sealed four lane standard | | 09
| | | 1,920 | | | | | | | | 500 | | | | 1,420 | |
Innamincka Road, Innamincka, pave and seal | | 25 | | | 1,500 | | | | | | | | 500 | | | | 1,000 | |
Jubilee Bridge, Innisfail, construct new bridge | | 50
| |
| 14,000
|
| | | 6,000 | | | | 8,000 | | | | | |
Kern Brothers Drive (stage 2), Kirwan, construct additional lane | | 45 | | | 3,018 | | | | 1,906 | | | | 340 | | | | 772 | |
Pacific Motorway (Nathan - Logan Road), construct bikeway near Runcorn | | 05 | | | 16,333 | | | | 12,993 | | | | 3,340 | | | | | |
Seventeen Miles Rock Road and Oldfield Road, improve intersection | | 05 | | | 1,380 | | | | | | | | 1,380 | | | | | |
Yaraka - Emmet Road (15.00 - 23.00km), east of Yaraka, pave and seal | | 35 | | | 1,175 | | | | | | | | 1,175 | | | | | |
Other Capital Grants | | Various | | | | | | | | | | | 26,488 | | | | Ongoing | |
| | | | | | | | | | | | | | | | | | |
Sub-total Transport Infrastructure Development Scheme - Capital Grants | | | | | | | | | | | | | 45,514 | | | | | |
| | | | | | | | | | | | | | | | | | |
Federal Black Spot | | Various | | | | | | | | | | | 12,078 | | | | Ongoing | |
| | | | | | | | | | | | | | | | | | |
Total Capital Grants | | | | | | | | | | | | | 57,592 | | | | | |
| | | | | | | | | | | | | | | | | | |
| | | | | |
TOTAL MAIN ROADS | | | | | | | | | | | | | 2,903,906 | | | | | |
| | | | | | | | | | | | | | | | | | |
| | | | | |
ROADTEK | | | | | | | | | | | | | | | | | | |
| | | | | |
Property, Plant and Equipment | | | | | | | | | | | | | | | | | | |
Hire plant | | Various | | | | | | | | | | | 24,397 | | | | Ongoing | |
| | | | | | | | | | | | | | | | | | |
Total Property, Plant and Equipment | | | | | | | | | | | | | 24,397 | | | | | |
| | | | | | | | | | | | | | | | | | |
| | | | | |
TOTAL ROADTEK | | | | | | | | | | | | | 24,397 | | | | | |
| | | | | | | | | | | | | | | | | | |
| | | | | |
QUEENSLAND MOTORWAYS LIMITED | | | | | | | | | | | | | | | | | | |
| | | | | |
Property, Plant and Equipment | | | | | | | | | | | | | | | | | | |
Gateway Motorway, Gateway Upgrade South | | 05 | | | 240,000 | | | | 41,556 | | | | 198,444 | | | | | |
| | | | |
| | Capital Statement 2010-11 | | 133 |
| | | | | | | | | | | | | | | | | | | | |
| Transport and Main Roads | |
| | | | | |
Project | | Statistical
Division | | | Total Estimated
Cost $’000 | | | Expenditure
to 30-06-10 $’000 | | | Budget
2010-11 $’000 | | | Post 2010-11 $’000 | |
Gateway Motorway, Gateway Upgrade Project | | | 05 | | | | 1,749,775 | | | | 1,673,000 | | | | 76,775 | | | | | |
Other | | | 05 | | | | | | | | | | | | 30,566 | | | | Ongoing | |
Sundry roadworks | | | 05 | | | | | | | | | | | | 34,134 | | | | Ongoing | |
Toll equipment | | | 05 | | | | | | | | | | | | 7,637 | | | | Ongoing | |
| | | | | | | | | | | | | | | | | | | | |
Total Property, Plant and Equipment | | | | | | | | | | | | | | | 347,556 | | | | | |
| | | | | | | | | | | | | | | | | | | | |
| | | | | |
TOTAL QUEENSLAND MOTORWAYS LIMITED | | | | | | | | | | | | | | | 347,556 | | | | | |
| | | | | | | | | | | | | | | | | | | | |
TOTAL TRANSPORT AND MAIN ROADS | | | | | | | | | | | | | | | 7,325,161 | | | | | |
| | | | | | | | | | | | | | | | | | | | |
Note:
| 1. | Partially funded by Commonwealth and Local Government contributions. |
| | | | |
| 134 | | Capital Statement 2010-11 | | |
TREASURY
The total capital expenditure program for Queensland Treasury in 2010 -11 will be $5.3 million.
The principal components of Treasury’s capital program include:
| • | | $4.9 million to be allocated to ongoing asset replacement, primarily the replacement of existing IT assets and office equipment |
| • | | $0.4 million for the further implementation and development of the Revenue Management System within the Office of State Revenue. The system employs a contemporary technology to provide revenue and information management and e-business capability to better service the Government and people of Queensland in collecting and administering State tax revenue streams. |
Treasury
| | | | | | | | | | | | | | | | | | | | |
Project | | Statistical
Division | | | Total
Estimated
Cost
$’000 | | | Expenditure
to 30-06-10 $’000 | | | Budget
2010-11 $’000 | | | Post
2010-11 $’000 | |
TREASURY DEPARTMENT | | | | | | | | | | | | | | | | | | | | |
| | | | | |
Property, Plant and Equipment | | | | | | | | | | | | | | | | | | | | |
Asset replacement | | | 05 | | | | | | | | | | | | 4,686 | | | | Ongoing | |
OSR - Revenue Management System | | | 05 | | | | 5,116 | | | | 4,949 | | | | 167 | | | | | |
| | | | | | | | | | | | | | | | | | | | |
Total Property, Plant and Equipment | | | | | | | | | | | | | | | 4,853 | | | | | |
| | | | | | | | | | | | | | | | | | | | |
| | | | | |
Other Capital Expenditure | | | | | | | | | | | | | | | | | | | | |
Asset replacement | | | 05 | | | | | | | | | | | | 206 | | | | Ongoing | |
OSR - Revenue Management System | | | 05 | | | | 68,373 | | | | 68,123 | | | | 250 | | | | | |
| | | | | | | | | | | | | | | | | | | | |
| | | | | |
Total Other Capital Expenditure | | | | | | | | | | | | | | | 456 | | | | | |
| | | | | | | | | | | | | | | | | | | | |
TOTAL TREASURY DEPARTMENT | | | | | | | | | | | | | | | 5,309 | | | | | |
| | | | | | | | | | | | | | | | | | | | |
| | | | |
| | Capital Statement 2010-11 | | 135 |
APPENDIX A -
ENTITIES INCLUDED IN CAPITAL OUTLAYS 2010-11
Communities
Department of Communities
Stadiums Queensland
Commission for Children and Young People and Child Guardian
Community Safety
Department of Community Safety
Education and Training
Department of Education and Training
Queensland Studies Authority
Southbank Institute of Technology
Gold Coast Institute of TAFE
Electoral Commission of Queensland
Employment, Economic Development and Innovation
Department of Employment, Economic Development and Innovation
QRAA
Australian Agricultural College Corporation
CS Energy Limited
ENERGEX Limited
Stanwell Corporation Limited
Tarong Energy Corporation Limited
Powerlink Queensland
Ergon Energy Corporation Limited
Tourism Queensland
Environment and Resource Management
Department of Environment and Resource Management
Gladstone Area Water Board
Mount Isa Water Board
SunWater
Queensland Bulk Water Supply Authority
Queensland Bulk Water Transport Authority
Queensland Manufactured Water Authority
SEQ Water Grid Manager
Health
Department of Health
Council of the Queensland Institute of Medical Research
| | | | |
| 136 | | Capital Statement 2010-11 | | |
Infrastructure and Planning
Department of Infrastructure and Planning
Property Services Group
Water Infrastructure Projects
Airport Link
Urban Land Development Authority
Justice and Attorney General
Department of Justice and Attorney-General
Public Trust Office
Legal Aid Queensland
Crime and Misconduct Commission
Office of the Information Commissioner
Anti-Discrimination Commission
Legislative Assembly of Queensland
Officer of the Governor
Office of the Ombudsman
Police
Department of Police
Premier and Cabinet
Department of the Premier and Cabinet
South Bank Corporation
Library Board of Queensland
Queensland Art Gallery
Queensland Museum
Queensland Performing Arts Trust
Public Works
Department of Public Works
QBuild
QFleet
Project Services
SDS
CITEC
Shared Service Agency
Corp Tech
Queensland Audit Office
| | | | |
| | Capital Statement 2010-11 | | 137 |
Transport and Main Roads
Transport
TransLink Transit Authority
QR Limited
Port of Brisbane Corporation Limited
Far North Queensland Ports Corporation Limited
Gladstone Ports Corporation Limited
North Queensland Bulk Ports Corporation Limited
Port of Townsville Limited
Main Roads
RoadTek
Queensland Motorways Limited
Treasury
Treasury Department
| | | | |
| 138 | | Capital Statement 2010-11 | | |
APPENDIX B -
KEY CONCEPTS AND COVERAGE
COVERAGE OF THE CAPITAL STATEMENT
Under accrual output budgeting, capital is the stock of assets including property, plant and equipment, intangible assets and inventories that an agency owns and/or controls and uses in the delivery of services, as well as capital grants made to other entities. For the purpose of this Budget Paper, capital outlays refer to the gross acquisition of these assets. The following definitions are applicable throughout this document:
| • | | total capital outlays – property, plant and equipment outlays, other capital expenditure and capital grants |
| • | | property, plant and equipment outlays – property, plant and equipment outlays as per the financial statements excluding asset sales, depreciation and revaluations |
| • | | other capital expenditure – intangibles, such as software development, and self-generating and regenerating assets |
| • | | capital grants – capital grants to other entities (excluding grants to other Government departments, statutory bodies and individuals under the First Home Owners Grant scheme). |
Capital outlays include information for all bodies defined as reporting entities for the purpose of whole-of-Government financial reporting requirements, excluding Public Financial Corporations. Projects without a recorded total estimated cost are ongoing. The entities included in scope for the Capital Statement are listed in Appendix A.
The Capital Statement only provides details of projects being undertaken within Queensland.
CAPITAL CONTINGENCY
Consistent with the approach adopted in previous years, a capital contingency reserve has been included. This reserve recognises that while agencies budget to fully use their capital works allocation, circumstances such as project lead-in times, project management constraints, unexpected weather conditions and capacity constraints such as the supply of labour and materials may prevent full usage. On a whole-of-Government basis, there is likely to be underspending, resulting in a carryover of capital allocations.
| | | | |
| | Capital Statement 2010-11 | | 139 |
APPENDIX C -
METHODOLOGY FOR ESTIMATING EMPLOYMENT
IMPACTS OF THE CAPITAL WORKS PROGRAM
It is estimated that the 2010-11 capital program will support approximately 106,000 full time jobs. This estimate is developed using methodology published by the Office of Economic and Statistical Research.
The estimate relates to employment supported rather than additional employment. In certain economic circumstances, such as when the economy is weak and unemployment is high, the additional employment generated by the capital program may be commensurate with employment supported. However, when the economy is strong and capacity constraints exist, it is likely that workers employed on State capital works program projects would be able to find employment elsewhere.
The capital works program consists of purchases of new non-financial assets and selected capital transfers by the State non-financial sector.
The estimate of the level of employment supported incorporates employment in the construction industry together with employment supported in the industries that supply goods and services to the construction industry and, in turn, the industries that supply these industries. For example, it includes employment on State construction projects together with employment supported in the ready mixed concrete industry which in turn supports employment in the quarry supplying sand to the ready mixed concrete industry. Land purchases are excluded as they represent a transfer of property title and are not associated with significant employment. Plant and equipment purchases are also excluded as much of it is imported.
The estimate is limited to measuring the contribution to employment made by expenditure on the capital works program. For this reason it does not measure what might be described as induced consumption effects, such as the effects of the income spent in retail and housing industries by workers employed on State construction projects.
To estimate the full-time equivalent employment supported by this program, data from the latest available Queensland Input-Output Table were used to estimate the contribution of the State capital works program to total employment in Queensland in a specific year.
| | | | |
| 140 | | Capital Statement 2010-11 | | |
This figure is then expressed in terms of full-time equivalents per million dollars spent and applied to the program at the aggregate level.
Over time, the number of full-time equivalents supported per million dollars spent will decline as construction prices (including labour) increase. Construction prices have on average increased by 4.9 per cent per annum over the last twelve years. The estimate is therefore adjusted for these observed movements and for projected movements in construction prices.
For the 2010-11 program onwards, the Office of Economic and Statistical Research has made a further adjustment to allow for movements in labour productivity. Labour productivity in the Queensland construction industry and the industries that supply goods and services to the construction industry have, on average, improved by 1.3 per cent per annum over the last twelve years.
When these price and labour productivity changes have been accounted for, each $1 million of the construction component of the capital works program is estimated to support employment of 6.74 full-time equivalents in 2010-11.
The methodology used to determine the employment impacts of the Queensland State capital works program produces an estimate that is in the mid range of estimates produced by other state Treasuries.
| | | | |
| | Capital Statement 2010-11 | | 141 |
By authority: S. C. Albury, Acting Government Printer, Queensland 2010
2010-11 State Budget Papers
1. Budget Speech
2. Budget Strategy and Outlook
3. Capital Statement
4. Budget Measures
5. Service Delivery Statements
Budget Highlights
This suite of Budget Papers is similar to that published in 2009-10.
The Budget Papers are available online at www.budget.qld.gov.au. They can be purchased through the Queensland Government Bookshop – individually or as a set – by phoning 1800 801 123 or at www.bookshop.qld.gov.au
© Crown copyright
All rights reserved
Queensland Government 2010
Excerpts from this publication may be reproduced, with appropriate
acknowledgement, as permitted under the Copyright Act.
Capital Statement
Budget Paper No.3
ISSN 1445-4890 (Print)
ISSN 1445-4904 (Online)

Queensland Government
State Budget 2010–11
Capital Statement
Budget Paper No.3
www.budget.qld.gov.au
State Budget 2010–11
Budget Measures
Budget Paper No.4
2010–11 State Budget Papers
1. Budget Speech
2. Budget Strategy and Outlook
3. Capital Statement
4. Budget Measures
5. Service Delivery Statements
Budget Highlights
This suite of Budget Papers is similar to that published in 2009–10.
The Budget Papers are available online at www.budget.qld.gov.au. They can be purchased through the Queensland Government Bookshop – individually or as a set – by phoning 1800 801 123 or at www.bookshop.qld.gov.au
© Crown copyright
All rights reserved
Queensland Government 2010
Excerpts from this publication may be reproduced, with appropriate
acknowledgement, as permitted under the Copyright Act.
Budget Measures
Budget Paper No.4
ISSN 1445-4890 (Print)
ISSN 1445-4904 (Online)

Queensland
Government
STATE BUDGET
2010-11
BUDGET MEASURES
Budget Paper No. 4
TABLE OF CONTENTS
| | | | | | |
| 1. | | Overview | | | 1 | |
| | |
| | Introduction | | | 1 | |
| | |
| | Explanation of Scope and Terms | | | 2 | |
| | |
| | Summary Tables | | | 3 | |
| | |
| 2. | | Expense Measures | | | 15 | |
| | |
| | Department of Communities | | | 16 | |
| | |
| | Department of Community Safety | | | 20 | |
| | |
| | Department of Education and Training | | | 24 | |
| | |
| | Department of Employment, Economic Development and Innovation | | | 26 | |
| | |
| | Department of Environment and Resource Management | | | 31 | |
| | |
| | Department of Health | | | 36 | |
| | |
| | Department of Infrastructure and Planning | | | 41 | |
| | |
| | Department of Justice and Attorney-General | | | 44 | |
| | |
| | Department of Police | | | 49 | |
| | |
| | Department of Public Works | | | 51 | |
| | |
| | Department of the Premier and Cabinet | | | 53 | |
| | |
| | Department of Transport and Main Roads | | | 57 | |
| | |
| | Electoral Commission of Queensland | | | 63 | |
| | |
| | Legislative Assembly of Queensland | | | 64 | |
| | |
| | Public Service Commission | | | 65 | |
| | |
| | Treasury Department | | | 66 | |
| | | | | | |
| 3. | | Capital Measures | | | 69 | |
| | |
| | Department of Communities | | | 70 | |
| | |
| | Department of Community Safety | | | 72 | |
| | |
| | Department of Education and Training | | | 74 | |
| | |
| | Department of Employment, Economic Development and Innovation | | | 76 | |
| | |
| | Department of Environment and Resource Management | | | 78 | |
| | |
| | Department of Health | | | 81 | |
| | |
| | Department of Infrastructure and Planning | | | 85 | |
| | |
| | Department of Justice and Attorney-General | | | 88 | |
| | |
| | Department of Police | | | 90 | |
| | |
| | Department of Public Works | | | 91 | |
| | |
| | Department of the Premier and Cabinet | | | 92 | |
| | |
| | Department of Transport and Main Roads | | | 93 | |
| | |
| | Legislative Assembly of Queensland | | | 98 | |
| | | | | | |
| 4. | | Revenue Measures | | | 99 | |
| | |
| | Department of Employment, Economic Development and Innovation | | | 100 | |
| | |
| | Department of Environment and Resource Management | | | 101 | |
| | |
| | Department of Infrastructure and Planning | | | 102 | |
| | |
| | Department of Police | | | 103 | |
| | |
| | Department of Transport and Main Roads | | | 104 | |
| | |
| | Treasury Department | | | 105 | |
1. OVERVIEW
FEATURES
| | • | | This Budget Paper presents a consolidation of expense, capital and revenue measures reflecting decisions since the 2009-10 Budget. |
| | • | | The measures reflect the Government’s policy agenda, targeting improvement in key service delivery areas, assisting those in need and responding to changes in the economic climate. |
INTRODUCTION
The intention in producing this paper is to provide a consolidated view of the Government’s policy decisions with budgetary impacts made since the 2009-10 Budget. It complements other Budget Papers, in particular Budget Paper No. 2 – Budget Strategy and Outlook, Budget Paper No. 3 – Capital Statement and the Service Delivery Statements.
This paper includes only new policy decisions and does not detail the full amount of additional funding being provided to agencies to deliver services and infrastructure. For example, formula-driven changes in funding are not included.
For details on the total funding available to agencies, refer to agencies’ Service Delivery Statements.
| | | | |
| | | Budget Measures 2010-11 | | 1 |
EXPLANATION OF SCOPE AND TERMS
The following is a description of the scope and terms applied in this document.
Scope
This document includes measures with the following features:
| | • | | Sector. Only Queensland General Government sector agencies are included. Measures involving Government-owned Corporations or other Public Non-financial Corporation sector agencies are within scope if the measures are being funded directly by the General Government sector. |
| | • | | Timeframe. Measures based on decisions made since the release of the 2009-10 Budget (June 2009), including the 2010-11 Budget. |
| | • | | Type. Measures with budgetary impacts, in particular: (i) expense and capital measures with service delivery, capital enhancement, grant or subsidy impacts on the community; and (ii) revenue measures involving a significant change in revenue policy, including changes in tax rate. |
Initiatives of a technical nature or non-policy based adjustments, such as parameter based funding adjustments, are not included as they do not reflect changes in government policy. The main focus is on measures reflecting policy decisions that impact directly on the community through service delivery or other means.
| | • | | Materiality. Minor measures or measures with non-significant community impact are not included in the document. |
Funding basis
Tables in this document are presented on a net funding basis.
| | • | | Net funding refers to the impact of funding the measure has on appropriations from the Consolidated Fund or centrally held funds (such as the Queensland Future Growth Fund) to the relevant General Government agency. It does not include funding directed to the measure from existing agency resources or other sources.Where the funding is provided from sources other than the Queensland Government, this is indicated in the text. |
| | • | | Amounts refer to additional funding being provided to agencies for a particular program or project, as a result of Government decisions since the 2009-10 Budget.This may differ to other Budget papers, such as Budget Paper No. 3 – Capital Statement, that may refer to total funding. |
| | • | | Amounts included in the tables relating to revenue measures represent the impact of the measure on Government revenue (with a positive amount representing additional revenue). |
| | | | |
| 2 | | Budget Measures 2010-11 | | |
Table 1: Expense measures since the 2009-10 Budget
| | | | | | | | | | | | | | | | | | | | |
Expense measures up to and including 2009-10 MYR | | 2009-10
$’000 | | | 2010-11
$’000 | | | 2011-12
$’000 | | | 2012-13
$’000 | | | 2013-14
$’000 | |
Department of Communities | | | | | | | | | | | | | | | | | | | | |
Foodbank Queensland1 | | | — | | | | 500 | | | | 500 | | | | 500 | | | | 500 | |
| | | | | | | | | | | | | | | | | | | | |
Portfolio Total | | | — | | | | 500 | | | | 500 | | | | 500 | | | | 500 | |
| | | | | | | | | | | | | | | | | | | | |
| | | | | |
Department of Community Safety | | | | | | | | | | | | | | | | | | | | |
Emergency Alert | | | 1,437 | | | | 1,249 | | | | 1,249 | | | | 1,249 | | | | — | |
National Framework for Scaled Advice and Warnings | | | 500 | | | | — | | | | — | | | | — | | | | — | |
| | | | | | | | | | | | | | | | | | | | |
Portfolio Total | | | 1,937 | | | | 1,249 | | | | 1,249 | | | | 1,249 | | | | — | |
| | | | | | | | | | | | | | | | | | | | |
| | | | | |
Department of Employment, Economic Development and Innovation | | | | | | | | | | | | | | | | | | | | |
Jobs Assist Program | | | 3,500 | | | | 5,500 | | | | — | | | | — | | | | — | |
National Collaborative Research Infrastructure Scheme | | | 1,020 | | | | 2,040 | | | | 2,040 | | | | — | | | | — | |
Regional Development Organisations | | | 315 | | | | 315 | | | | 315 | | | | 315 | | | | 315 | |
| | | | | | | | | | | | | | | | | | | | |
Portfolio Total | | | 4,835 | | | | 7,855 | | | | 2,355 | | | | 315 | | | | 315 | |
| | | | | | | | | | | | | | | | | | | | |
| | | | | |
Department of Environment and Resource Management | | | | | | | | | | | | | | | | | | | | |
Water for the Future (Healthy Headwaters) | | | — | | | | 5,172 | | | | 9,516 | | | | 8,225 | | | | 50 | |
Change in Valuation Methodology to Site Value | | | 2,220 | | | | 2,110 | | | | 810 | | | | — | | | | — | |
New Institutional Arrangements for Category 2 Water Authorities and River Improvement Trusts | | | 250 | | | | 1,200 | | | | 250 | | | | 100 | | | | — | |
National Packaging Covenant | | | — | | | | 557 | | | | 557 | | | | 557 | | | | 557 | |
Regulation of Regrowth Vegetation | | | 2,700 | | | | 460 | | | | — | | | | — | | | | — | |
Enhanced Fire Management Program | | | 880 | | | | — | | | | — | | | | — | | | | — | |
Implementing the Koala Response Strategy1 | | | 310 | | | | — | | | | — | | | | — | | | | — | |
| | | | | | | | | | | | | | | | | | | | |
Portfolio Total | | | 6,360 | | | | 9,499 | | | | 11,133 | | | | 8,882 | | | | 607 | |
| | | | | | | | | | | | | | | | | | | | |
| | | | | |
Department of Health | | | | | | | | | | | | | | | | | | | | |
Pandemic (H1N1) Supplementary Funding | | | 6,500 | | | | — | | | | — | | | | — | | | | — | |
| | | | | | | | | | | | | | | | | | | | |
Portfolio Total | | | 6,500 | | | | — | | | | — | | | | — | | | | — | |
| | | | | | | | | | | | | | | | | | | | |
| | | | | |
Department of Infrastructure and Planning | | | | | | | | | | | | | | | | | | | | |
Yarwun Alumina Refinery | | | — | | | | 8,620 | | | | 2,900 | | | | — | | | | — | |
ClimateQ: Cleaner Greener Buildings and Climate Ready Infrastructure | | | — | | | | — | | | | — | | | | — | | | | — | |
| | | | | | | | | | | | | | | | | | | | |
Portfolio Total | | | — | | | | 8,620 | | | | 2,900 | | | | — | | | | — | |
| | | | | | | | | | | | | | | | | | | | |
| | | | | |
Department of Justice and Attorney-General | | | | | | | | | | | | | | | | | | | | |
Office of the Adult Guardian | | | 750 | | | | 4,665 | | | | 5,200 | | | | 5,200 | | | | 5,200 | |
Telecommunication Interception - Crime and Misconduct Commission | | | 605 | | | | 3,239 | | | | 3,330 | | | | 3,424 | | | | 3,424 | |
State Penalties Enforcement Registry - Wheel Clamping Trial | | | 470 | | | | 574 | | | | — | | | | — | | | | — | |
Continuation of the Murri Court1 | | | 830 | | | | — | | | | — | | | | — | | | | — | |
| | | | | | | | | | | | | | | | | | | | |
Portfolio Total | | | 2,655 | | | | 8,478 | | | | 8,530 | | | | 8,624 | | | | 8,624 | |
| | | | | | | | | | | | | | | | | | | | |
| | | | |
| | | Budget Measures 2010-11 | | 3 |
| | | | | | | | | | | | | | | | | | | | |
| | | 2009-10
$’000 | | | 2010-11
$’000 | | | 2011-12
$’000 | | | 2012-13
$’000 | | | 2013-14
$’000 | |
Department of Police | | | | | | | | | | | | | | | | | | | | |
Telecommunication Interception | | | 2,604 | | | | 7,617 | | | | 7,596 | | | | 7,925 | | | | 7,925 | |
One Punch Can Kill Campaign | | | 300 | | | | 400 | | | | — | | | | — | | | | — | |
Targeted Liquor Related Enforcement Initiative | | | 1,584 | | | | — | | | | — | | | | — | | | | — | |
| | | | | | | | | | | | | | | | | | | | |
Portfolio Total | | | 4,488 | | | | 8,017 | | | | 7,596 | | | | 7,925 | | | | 7,925 | |
| | | | | | | | | | | | | | | | | | | | |
| | | | | |
Department of the Premier and Cabinet | | | | | | | | | | | | | | | | | | | | |
Cairns Indigenous Art Fair | | | 600 | | | | 600 | | | | — | | | | — | | | | — | |
Integrity and Accountability Reforms | | | 445 | | | | — | | | | — | | | | — | | | | — | |
| | | | | | | | | | | | | | | | | | | | |
Portfolio Total | | | 1,045 | | | | 600 | | | | — | | | | — | | | | — | |
| | | | | | | | | | | | | | | | | | | | |
| | | | | |
Department of Transport and Main Roads | | | | | | | | | | | | | | | | | | | | |
Transport Service Contract (Rail Infrastructure) | | | 11,668 | | | | 20,731 | | | | 30,021 | | | | 40,494 | | | | 40,494 | |
Improve Go Card Availability | | | 1,155 | | | | 4,545 | | | | — | | | | — | | | | — | |
Regional Air and Long Distance Coach Services | | | 2,816 | | | | 2,690 | | | | 2,785 | | | | 2,882 | | | | 2,983 | |
Free Flow Tolling Costs | | | 2,093 | | | | — | | | | — | | | | — | | | | — | |
Natural Disaster Relief and Recovery Supplementation | | | 37,720 | | | | — | | | | — | | | | — | | | | — | |
Q Connect | | | 2,412 | | | | — | | | | — | | | | — | | | | — | |
Road Safety Public Education Program1 | | | 3,551 | | | | — | | | | — | | | | — | | | | — | |
| | | | | | | | | | | | | | | | | | | | |
Portfolio Total | | | 61,415 | | | | 27,966 | | | | 32,806 | | | | 43,376 | | | | 43,477 | |
| | | | | | | | | | | | | | | | | | | | |
| | | | | |
Electoral Commission of Queensland | | | | | | | | | | | | | | | | | | | | |
Joint Electoral Roll Arrangement and Funding and Disclosure Initiatives | | | 578 | | | | 632 | | | | 718 | | | | 805 | | | | 822 | |
| | | | | | | | | | | | | | | | | | | | |
Portfolio Total | | | 578 | | | | 632 | | | | 718 | | | | 805 | | | | 822 | |
| | | | | | | | | | | | | | | | | | | | |
| | | | | |
Public Service Commission | | | | | | | | | | | | | | | | | | | | |
Integrity and Accountability Reforms1 | | | 878 | | | | 754 | | | | — | | | | — | | | | — | |
| | | | | | | | | | | | | | | | | | | | |
Portfolio Total | | | 878 | | | | 754 | | | | — | | | | — | | | | — | |
| | | | | | | | | | | | | | | | | | | | |
| | | | | |
Treasury Department | | | | | | | | | | | | | | | | | | | | |
Commercial Transaction Costs1 | | | 46,000 | | | | — | | | | — | | | | — | | | | — | |
| | | | | | | | | | | | | | | | | | | | |
Portfolio Total | | | 46,000 | | | | — | | | | — | | | | — | | | | — | |
| | | | | | | | | | | | | | | | | | | | |
Total impact on Expense up to and including MYR | | | 136,691 | | | | 74,170 | | | | 67,787 | | | | 71,676 | | | | 62,270 | |
| | | | | | | | | | | | | | | | | | | | |
| | | | |
| 4 | | Budget Measures 2010-11 | | |
| | | | | | | | | | | | | | | | | | | | |
Expense measures since 2009-10 MYR | | 2009-10
$’000 | | | 2010-11
$’000 | | | 2011-12
$’000 | | | 2012-13
$’000 | | | 2013-14
$’000 | |
Department of Communities | | | | | | | | | | | | | | | | | | | | |
Electricity Rebate and Electricity Life Support Concession Scheme - Supplementation | | | — | | | | 12,600 | | | | 12,600 | | | | 12,600 | | | | 12,600 | |
Child Protection Reforms | | | — | | | | 7,500 | | | | 12,500 | | | | 12,500 | | | | 12,500 | |
Young People with a Disability Transitioning to Adulthood | | | — | | | | 4,400 | | | | 5,700 | | | | 5,700 | | | | 5,700 | |
Spinal Cord Injury Response | | | — | | | | 3,200 | | | | 8,200 | | | | 8,200 | | | | 8,200 | |
Additional Frontline Child Protection Staff | | | — | | | | 3,000 | | | | 3,000 | | | | 3,000 | | | | 3,000 | |
Families with Children with a Disability | | | — | | | | 2,900 | | | | 3,400 | | | | 3,400 | | | | 3,400 | |
Murri Court and Queensland Indigenous Alcohol Diversion Pilot Program | | | — | | | | 2,222 | | | | — | | | | — | | | | — | |
Medical Cooling and Heating Electricity Concession Scheme | | | — | | | | 1,421 | | | | 1,580 | | | | 1,759 | | | | 1,958 | |
Autism Early Intervention Initiative | | | — | | | | 1,000 | | | | 1,000 | | | | 1,000 | | | | 1,000 | |
Community Living Initiative for People with a Disability | | | — | | | | 1,000 | | | | 1,700 | | | | 1,700 | | | | 1,700 | |
Foodbank Queensland2 | | | — | | | | 250 | | | | 250 | | | | 250 | | | | 250 | |
Evolve Interagency Services | | | — | | | | — | | | | 2,000 | | | | 2,000 | | | | 2,000 | |
| | | | | | | | | | | | | | | | | | | | |
Portfolio Total | | | — | | | | 39,493 | | | | 51,930 | | | | 52,109 | | | | 52,308 | |
| | | | | | | | | | | | | | | | | | | | |
| | | | | |
Department of Community Safety | | | | | | | | | | | | | | | | | | | | |
Resourcing Queensland Fire and Rescue Service | | | — | | | | 12,521 | | | | 10,241 | | | | 10,411 | | | | 9,584 | |
Additional Ambulance Officers | | | — | | | | 3,500 | | | | 5,000 | | | | 5,000 | | | | 5,000 | |
Guarding Our Beaches - Saving Lives | | | — | | | | 2,000 | | | | 2,000 | | | | 2,000 | | | | 2,000 | |
Community Helicopter Provider for Toowoomba | | | — | | | | 1,641 | | | | 1,641 | | | | 1,641 | | | | 1,641 | |
Continuation of the Sexual Offenders Program | | | — | | | | 1,500 | | | | 1,500 | | | | 1,500 | | | | 1,500 | |
Helicopter Services - Engineers | | | — | | | | 1,020 | | | | 800 | | | | 800 | | | | 800 | |
Pre-Commissioning Work at Lotus Glen Correctional Centre | | | — | | | | 700 | | | | — | | | | — | | | | — | |
Disaster Management Training | | | — | | | | 500 | | | | — | | | | — | | | | — | |
Sustainable Resource Communities Funding - Mitchell/ Surat State Emergency Service | | | — | | | | — | | | | — | | | | — | | | | — | |
| | | | | | | | | | | | | | | | | | | | |
Portfolio Total | | | — | | | | 23,382 | | | | 21,182 | | | | 21,352 | | | | 20,525 | |
| | | | | | | | | | | | | | | | | | | | |
| | | | | |
Department of Education and Training | | | | | | | | | | | | | | | | | | | | |
Queensland College of Teachers - Pre-registration Testing | | | — | | | | 2,707 | | | | 505 | | | | — | | | | — | |
National Partnership on Pre-apprenticeship Training | | | — | | | | 2,500 | | | | — | | | | — | | | | — | |
National Partnership on the National Quality Agenda for Early Childhood Education and Care | | | — | | | | 1,016 | | | | 911 | | | | 1,594 | | | | 1,468 | |
Flying Start - Volunteering in Schools | | | — | | | | 190 | | | | 400 | | | | 400 | | | | 400 | |
Acceleration of Universal Access to Kindergarten Program | | | — | | | | — | | | | 2,350 | | | | 3,500 | | | | 1,100 | |
ClimateQ: Training | | | — | | | | — | | | | — | | | | — | | | | — | |
| | | | | | | | | | | | | | | | | | | | |
Portfolio Total | | | — | | | | 6,413 | | | | 4,166 | | | | 5,494 | | | | 2,968 | |
| | | | | | | | | | | | | | | | | | | | |
| | | | |
| | | Budget Measures 2010-11 | | 5 |
| | | | | | | | | | | | | | | | | | | | |
| | | 2009-10
$’000 | | | 2010-11
$’000 | | | 2011-12
$’000 | | | 2012-13
$’000 | | | 2013-14
$’000 | |
Department of Employment, Economic Development and Innovation | | | | | | | | | | | | | | | | | | | | |
Solar Initiatives Package | | | 25,000 | | | | 15,000 | | | | 30,000 | | | | 25,000 | | | | 20,000 | |
Streamlining Mineral and Petroleum Tenure Approvals | | | — | | | | 3,040 | | | | 3,249 | | | | 3,166 | | | | 3,071 | |
Mining Exploration Program - Greenfields 2020 | | | — | | | | 3,000 | | | | 5,000 | | | | 5,000 | | | | 5,000 | |
National Red Imported Fire Ant Eradication Program | | | — | | | | 3,000 | | | | — | | | | — | | | | — | |
Petroleum and Gas Inspectors | | | — | | | | 2,540 | | | | 4,183 | | | | 4,145 | | | | 3,769 | |
Innovation Voucher Award Program | | | — | | | | 1,000 | | | | 1,500 | | | | — | | | | — | |
Security Providers Fingerprinting | | | — | | | | 495 | | | | 233 | | | | 240 | | | | 246 | |
Hendra Virus Vaccine Research | | | — | | | | 300 | | | | — | | | | — | | | | — | |
Solar Thermal Feasibility Study | | | — | | | | — | | | | — | | | | — | | | | — | |
| | | | | | | | | | | | | | | | | | | | |
Portfolio Total | | | 25,000 | | | | 28,375 | | | | 44,165 | | | | 37,551 | | | | 32,086 | |
| | | | | | | | | | | | | | | | | | | | |
Department of Environment and Resource Management | | | | | | | | | | | | | | | | | | | | |
Queensland Waste Reform Strategy Implementation | | | — | | | | 9,750 | | | | — | | | | — | | | | — | |
Acquisition Related Programs | | | — | | | | 8,600 | | | | 14,830 | | | | 13,720 | | | | 8,250 | |
Implementing the Koala Response Strategy2 | | | — | | | | 1,500 | | | | 1,300 | | | | 1,300 | | | | 1,300 | |
Wild River Rangers | | | — | | | | 1,400 | | | | 1,400 | | | | 1,400 | | | | 1,400 | |
Cape York World Heritage Nomination | | | — | | | | 1,000 | | | | 1,900 | | | | 600 | | | | — | |
Local Government Sustainable Future Fund | | | — | | | | — | | | | 30,000 | | | | 30,000 | | | | 30,000 | |
NatureAssist Program | | | — | | | | — | | | | 1,000 | | | | 1,000 | | | | 3,200 | |
Waste Avoidance and Resource Efficiency Fund | | | — | | | | — | | | | 35,763 | | | | 35,763 | | | | 35,763 | |
| | | | | | | | | | | | | | | | | | | | |
Portfolio Total | | | — | | | | 22,250 | | | | 86,193 | | | | 83,783 | | | | 79,913 | |
| | | | | | | | | | | | | | | | | | | | |
Department of Health | | | | | | | | | | | | | | | | | | | | |
National Health and Hospitals Network - Elective Surgery | | | — | | | | 61,000 | | | | 24,100 | | | | 23,800 | | | | 24,000 | |
National Health and Hospitals Network - Emergency Departments | | | — | | | | 30,500 | | | | 20,400 | | | | 20,600 | | | | 31,000 | |
James Cook University Dental School Clinical Training | | | — | | | | 24,950 | | | | 12,950 | | | | 3,550 | | | | 3,550 | |
National Health and Hospitals Network - Sub-Acute Care | | | — | | | | 14,900 | | | | 32,400 | | | | 57,800 | | | | 93,900 | |
Regional Cancer Centres | | | — | | | | 10,390 | | | | 28,665 | | | | 70,790 | | | | 84,673 | |
Medical Research Assistance | | | — | | | | 7,800 | | | | 7,800 | | | | 7,800 | | | | 7,800 | |
Children’s Hearing Services | | | — | | | | 5,456 | | | | 3,605 | | | | 3,667 | | | | 3,741 | |
Persistent Pain Strategy | | | — | | | | 2,873 | | | | 11,904 | | | | 12,049 | | | | 12,240 | |
Mental Health Stigma Campaign | | | — | | | | 1,223 | | | | 2,476 | | | | 2,355 | | | | 2,443 | |
Sunshine Coast Service Enhancements | | | — | | | | 800 | | | | 26,600 | | | | 42,100 | | | | 42,100 | |
Yeppoon - Transfer of Old Hospital Site | | | — | | | | — | | | | — | | | | — | | | | — | |
| | | | | | | | | | | | | | | | | | | | |
Portfolio Total | | | — | | | | 159,892 | | | | 170,900 | | | | 244,511 | | | | 305,447 | |
| | | | | | | | | | | | | | | | | | | | |
Department of Infrastructure and Planning | | | | | | | | | | | | | | | | | | | | |
Council Amalgamation Costs | | | 10,720 | | | | 7,581 | | | | — | | | | — | | | | — | |
Mackay Showgrounds | | | — | | | | 5,000 | | | | — | | | | — | | | | — | |
Toowoomba Aerodrome Upgrade | | | — | | | | 4,700 | | | | — | | | | — | | | | — | |
Smart eDA | | | — | | | | 1,838 | | | | — | | | | — | | | | — | |
Surat Basin Railway Corridor | | | — | | | | 450 | | | | — | | | | — | | | | — | |
| | | | | | | | | | | | | | | | | | | | |
Portfolio Total | | | 10,720 | | | | 19,569 | | | | — | | | | — | | | | — | |
| | | | | | | | | | | | | | | | | | | | |
| | | | |
| 6 | | Budget Measures 2010-11 | | |
| | | | | | | | | | | | | | | | | | | | |
| | | 2009-10
$’000 | | | 2010-11
$’000 | | | 2011-12
$’000 | | | 2012-13
$’000 | | | 2013-14
$’000 | |
Department of Justice and Attorney-General | | | | | | | | | | | | | | | | | | | | |
Legal Aid Services Funding Assistance Package | | | — | | | | 8,975 | | | | 15,096 | | | | 17,449 | | | | 16,485 | |
Industrial Relations - Workplace Health and Safety Queensland | | | — | | | | 2,000 | | | | 2,000 | | | | 2,000 | | | | 2,000 | |
Queensland Civil and Administrative Tribunal | | | — | | | | 1,525 | | | | 1,525 | | | | 1,525 | | | | 1,525 | |
Sentencing Advisory Council | | | — | | | | 1,300 | | | | 1,800 | | | | 1,800 | | | | 1,800 | |
Continuation of the Murri Court2 | | | — | | | | 1,200 | | | | — | | | | — | | | | — | |
Crime and Misconduct Commission | | | — | | | | 1,000 | | | | 1,000 | | | | 1,000 | | | | 1,000 | |
Queensland Indigenous Alcohol Diversion Pilot Program | | | — | | | | 800 | | | | — | | | | — | | | | — | |
Establishment Costs for Electronic Document Records Management System - Legal Aid Queensland | | | — | | | | 655 | | | | 715 | | | | — | | | | — | |
Office of the Director of Public Prosecutions - Additional Professional Legal Staff | | | — | | | | 460 | | | | 460 | | | | 460 | | | | 460 | |
Industrial Relations Reforms - Funding Retention | | | | | | | (7,000 | ) | | | (7,000 | ) | | | (7,000 | ) | | | (8,500 | ) |
| | | | | | | | | | | | | | | | | | | | |
Portfolio Total | | | — | | | | 10,915 | | | | 15,596 | | | | 17,234 | | | | 14,770 | |
| | | | | | | | | | | | | | | | | | | | |
| | | | | |
Department of Police | | | | | | | | | | | | | | | | | | | | |
Weapons Licensing System | | | — | | | | 6,949 | | | | 1,567 | | | | 1,412 | | | | 1,266 | |
Security Providers Fingerprinting | | | — | | | | — | | | | — | | | | — | | | | — | |
| | | | | | | | | | | | | | | | | | | | |
Portfolio Total | | | — | | | | 6,949 | | | | 1,567 | | | | 1,412 | | | | 1,266 | |
| | | | | | | | | | | | | | | | | | | | |
| | | | | |
Department of Public Works | | | | | | | | | | | | | | | | | | | | |
ICT Investment Fund | | | — | | | | 5,000 | | | | 5,000 | | | | 5,000 | | | | — | |
Procurement Process Reform Initiative | | | — | | | | 5,000 | | | | — | | | | — | | | | — | |
Smart Service Queensland | | | — | | | | 4,840 | | | | — | | | | — | | | | — | |
QBuild Community Service Obligation | | | — | | | | 2,733 | | | | — | | | | — | | | | — | |
GovNet Core Operations | | | — | | | | 2,540 | | | | — | | | | — | | | | — | |
Rockhampton Riverbank Redevelopment - Stage II | | | — | | | | 2,500 | | | | 2,500 | | | | — | | | | — | |
| | | | | | | | | | | | | | | | | | | | |
Portfolio Total | | | — | | | | 22,613 | | | | 7,500 | | | | 5,000 | | | | — | |
| | | | | | | | | | | | | | | | | | | | |
| | | | | |
Department of the Premier and Cabinet | | | | | | | | | | | | | | | | | | | | |
2018 Gold Coast Commonwealth Games Bid | | | 2,501 | | | | 6,237 | | | | 2,102 | | | | — | | | | — | |
Major Exhibitions | | | 2,000 | | | | 3,600 | | | | 2,500 | | | | 3,000 | | | | 3,000 | |
Cairns Cultural Precinct | | | — | | | | 2,500 | | | | — | | | | — | | | | — | |
Business Events Tourism Initiative | | | — | | | | 2,000 | | | | 4,000 | | | | 4,000 | | | | 4,000 | |
Regional Arts Infrastructure | | | — | | | | 1,000 | | | | 1,000 | | | | 1,000 | | | | 1,000 | |
Securing Major Events | | | — | | | | 1,000 | | | | 1,000 | | | | 1,000 | | | | 600 | |
art+place Public Art Program | | | — | | | | 1,000 | | | | 3,000 | | | | 3,000 | | | | 3,000 | |
Reef Water Quality Protection Plan | | | — | | | | 804 | | | | 838 | | | | 870 | | | | 880 | |
Ideas Festival | | | — | | | | 600 | | | | — | | | | 600 | | | | — | |
Growth Management Summit | | | 1,320 | | | | — | | | | — | | | | — | | | | — | |
| | | | | | | | | | | | | | | | | | | | |
Portfolio Total | | | 5,821 | | | | 18,741 | | | | 14,440 | | | | 13,470 | | | | 12,480 | |
| | | | | | | | | | | | | | | | | | | | |
| | | | |
| | | Budget Measures 2010-11 | | 7 |
| | | | | | | | | | | | | | | | | | | | |
| | | 2009-10
$’000 | | | 2010-11
$’000 | | | 2011-12
$’000 | | | 2012-13
$’000 | | | 2013-14
$’000 | |
Department of Transport and Main Roads | | | | | | | | | | | | | | | | | | | | |
Enhanced Public Transport Services | | | 34,500 | | | | 103,700 | | | | 109,922 | | | | 116,517 | | | | 123,508 | |
New Queensland Driver Licence | | | 10,700 | | | | 58,900 | | | | 47,300 | | | | 48,700 | | | | 51,300 | |
Safer Roads Sooner | | | — | | | | 33,500 | | | | — | | | | — | | | | — | |
Road Safety Public Education Program2 | | | — | | | | 12,857 | | | | — | | | | — | | | | — | |
Taxi Subsidy Scheme | | | 2,299 | | | | 10,000 | | | | 10,720 | | | | 11,472 | | | | 12,258 | |
ClimateQ-Green Transport Initiatives | | | — | | | | — | | | | — | | | | — | | | | — | |
Safety Program | | | — | | | | — | | | | — | | | | — | | | | — | |
Station Renovation | | | — | | | | — | | | | — | | | | — | | | | — | |
Sustainable Resource Communities Funding - Roma Airport Upgrade | | | — | | | | — | | | | — | | | | — | | | | — | |
Townsville Marine Precinct | | | 114,909 | | | | — | | | | — | | | | — | | | | — | |
| | | | | | | | | | | | | | | | | | | | |
Portfolio Total | | | 162,408 | | | | 218,957 | | | | 167,942 | | | | 176,689 | | | | 187,066 | |
| | | | | | | | | | | | | | | | | | | | |
| | | | | |
Legislative Assembly of Queensland | | | | | | | | | | | | | | | | | | | | |
Broadcast of Parliament Stage 3 | | | — | | | | 144 | | | | 144 | | | | 144 | | | | 144 | |
| | | | | | | | | | | | | | | | | | | | |
Portfolio Total | | | — | | | | 144 | | | | 144 | | | | 144 | | | | 144 | |
| | | | | | | | | | | | | | | | | | | | |
| | | | | |
Public Service Commission | | | | | | | | | | | | | | | | | | | | |
Integrity and Accountability Reforms2 | | | — | | | | 364 | | | | 812 | | | | 844 | | | | 876 | |
State of the Service Report | | | 112 | | | | 285 | | | | 293 | | | | 304 | | | | 315 | |
| | | | | | | | | | | | | | | | | | | | |
Portfolio Total | | | 112 | | | | 649 | | | | 1,105 | | | | 1,148 | | | | 1,191 | |
| | | | | | | | | | | | | | | | | | | | |
| | | | | |
Treasury Department | | | | | | | | | | | | | | | | | | | | |
Commercial Transaction Costs2 | | | 17,999 | | | | 121,486 | | | | — | | | | — | | | | — | |
Regional First Home Owner Grant Boost | | | — | | | | 7,800 | | | | — | | | | — | | | | — | |
Business Regulation and Competition Reform | | | 4,779 | | | | 3,444 | | | | — | | | | — | | | | — | |
Queensland Competition Authority - Rural Water Regulation | | | — | | | | 3,000 | | | | — | | | | — | | | | — | |
Promoting Participation in the 2011 National Census | | | — | | | | 637 | | | | 1,983 | | | | 369 | | | | — | |
First Home Owner Grant Eligibility Cap | | | (400 | ) | | | (1,600 | ) | | | (1,672 | ) | | | (1,747 | ) | | | (1,826 | ) |
| | | | | | | | | | | | | | | | | | | | |
Portfolio Total | | | 22,378 | | | | 134,767 | | | | 311 | | | | (1,378 | ) | | | (1,826 | ) |
| | | | | | | | | | | | | | | | | | | | |
| | | | | |
Total impact on Expense since MYR | | | 226,439 | | | | 713,109 | | | | 587,141 | | | | 658,519 | | | | 708,338 | |
| | | | | | | | | | | | | | | | | | | | |
Total impact on Expense since the 2009 - 10 Budget | | | 363,130 | | | | 787,279 | | | | 654,928 | | | | 730,195 | | | | 770,608 | |
| | | | | | | | | | | | | | | | | | | | |
Less Australian Government funding | | | — | | | | 122,514 | | | | 97,338 | | | | 136,062 | | | | 173,675 | |
| | | | | | | | | | | | | | | | | | | | |
Net of Measures funded by Australian Government | | | 363,130 | | | | 664,765 | | | | 557,590 | | | | 594,133 | | | | 596,933 | |
| | | | | | | | | | | | | | | | | | | | |
Notes:
| 1. | Further funding for this initiative can be found in the Post Mid Year Review section of this table. |
| 2. | Further funding for this initiative can be found in the Mid Year Review section of this table. |
| | | | |
| 8 | | Budget Measures 2010-11 | | |
Table 2: Capital measures since the 2009-10 Budget
| | | | | | | | | | | | | | | | | | | | |
Capital measures up to and including 2009-10 MYR | | 2009-10
$’000 | | | 2010-11
$’000 | | | 2011-12
$’000 | | | 2012-13
$’000 | | | 2013-14
$’000 | |
Department of Education and Training | | | | | | | | | | | | | | | | | | | | |
Commonwealth Training Infrastructure Investment for Tomorrow1 | | | 25,310 | | | | — | | | | — | | | | — | | | | — | |
| | | | | | | | | | | | | | | | | | | | |
Portfolio Total | | | 25,310 | | | | — | | | | — | | | | — | | | | — | |
| | | | | | | | | | | | | | | | | | | | |
| | | | | |
Department of Employment, Economic Development and Innovation | | | | | | | | | | | | | | | | | | | | |
Glassing Register Information | | | 350 | | | | — | | | | — | | | | — | | | | — | |
| | | | | | | | | | | | | | | | | | | | |
Portfolio Total | | | 350 | | | | — | | | | — | | | | — | | | | — | |
| | | | | | | | | | | | | | | | | | | | |
| | | | | |
Department of Environment and Resource Management | | | | | | | | | | | | | | | | | | | | |
Change in Valuation Methodology to Site Value | | | 1,200 | | | | 750 | | | | — | | | | — | | | | — | |
Acquisition of Wongaloo (Cromarty Wetlands) | | | 300 | | | | — | | | | — | | | | — | | | | — | |
Enhanced Fire Management Program | | | 120 | | | | — | | �� | | — | | | | — | | | | — | |
Implementing the Koala Response Strategy1 | | | 4,690 | | | | — | | | | — | | | | — | | | | — | |
| | | | | | | | | | | | | | | | | | | | |
Portfolio Total | | | 6,310 | | | | 750 | | | | — | | | | — | | | | — | |
| | | | | | | | | | | | | | | | | | | | |
| | | | | |
Department of Health | | | | | | | | | | | | | | | | | | | | |
Pandemic (H1N1) Supplementary Funding | | | 3,500 | | | | — | | | | — | | | | — | | | | — | |
| | | | | | | | | | | | | | | | | | | | |
Portfolio Total | | | 3,500 | | | | — | | | | — | | | | — | | | | — | |
| | | | | | | | | | | | | | | | | | | | |
| | | | | |
Department of Infrastructure and Planning | | | | | | | | | | | | | | | | | | | | |
Sewage Treatment Plants Upgrade | | | 5,000 | | | | 31,300 | | | | 14,400 | | | | — | | | | — | |
Indigenous Environmental Health Infrastructure | | | — | | | | — | | | | — | | | | — | | | | — | |
| | | | | | | | | | | | | | | | | | | | |
Portfolio Total | | | 5,000 | | | | 31,300 | | | | 14,400 | | | | — | | | | — | |
| | | | | | | | | | | | | | | | | | | | |
| | | | | |
Department of Police | | | | | | | | | | | | | | | | | | | | |
Telecommunication Interception | | | — | | | | — | | | | — | | | | — | | | | — | |
| | | | | | | | | | | | | | | | | | | | |
Portfolio Total | | | — | | | | — | | | | — | | | | — | | | | — | |
| | | | | | | | | | | | | | | | | | | | |
| | | | | |
Department of Transport and Main Roads | | | | | | | | | | | | | | | | | | | | |
Fairfield Road Pedestrian Overpass at Yeerongpilly Station | | | 900 | | | | 5,800 | | | | — | | | | — | | | | — | |
Go Card Add-Value Vending Machines | | | — | | | | 3,300 | | | | — | | | | — | | | | — | |
Rio Tinto Yarwun Alumina Refinery Stage 2 Infrastructure Arrangement | | | 2,800 | | | | — | | | | — | | | | — | | | | — | |
| | | | | | | | | | | | | | | | | | | | |
Portfolio Total | | | 3,700 | | | | 9,100 | | | | — | | | | — | | | | — | |
| | | | | | | | | | | | | | | | | | | | |
Total impact on Capital up to and including MYR | | | 44,170 | | | | 41,150 | | | | 14,400 | | | | — | | | | — | |
| | | | | | | | | | | | | | | | | | | | |
| | | | |
| | | Budget Measures 2010-11 | | 9 |
| | | | | | | | | | | | | | | | | | | | |
Capital measures since 2009-10 MYR | | 2009-10
$’000 | | | 2010-11
$’000 | | | 2011-12
$’000 | | | 2012-13
$’000 | | | 2013-14
$’000 | |
Department of Communities | | | | | | | | | | | | | | | | | | | | |
Townsville 400 - V8 Supercars | | | 420 | | | | 630 | | | | — | | | | — | | | | — | |
Sustainable Resource Communities Funding - Chinchilla Community Centre | | | — | | | | — | | | | — | | | | — | | | | — | |
Sustainable Resource Communities Funding - Dalby Aquatic Centre | | | — | | | | — | | | | — | | | | — | | | | — | |
Sustainable Resource Communities Funding - Moranbah Youth Centre | | | — | | | | — | | | | — | | | | — | | | | — | |
| | | | | | | | | | | | | | | | | | | | |
Portfolio Total | | | 420 | | | | 630 | | | | — | | | | — | | | | — | |
| | | | | | | | | | | | | | | | | | | | |
| | | | | |
Department of Community Safety | | | | | | | | | | | | | | | | | | | | |
Helicopter Services - Major Overhaul | | | 2,787 | | | | 3,154 | | | | — | | | | — | | | | — | |
Resourcing Queensland Fire and Rescue Service | | | — | | | | 450 | | | | 2,800 | | | | 2,700 | | | | 3,600 | |
Sustainable Resource Communities Funding - Clermont/Emerald/Dysart | | | — | | | | — | | | | — | | | | — | | | | — | |
Sustainable Resource Communities Funding - Queensland Ambulance Service Staff Housing | | | — | | | | — | | | | — | | | | — | | | | — | |
| | | | | | | | | | | | | | | | | | | | |
Portfolio Total | | | 2,787 | | | | 3,604 | | | | 2,800 | | | | 2,700 | | | | 3,600 | |
| | | | | | | | | | | | | | | | | | | | |
| | | | | |
Department of Education and Training | | | | | | | | | | | | | | | | | | | | |
Acceleration of Universal Access to Kindergarten Program | | | — | | | | 21,900 | | | | 38,100 | | | | (30,000 | ) | | | (30,000 | ) |
Cairns Maritime Safety Training Facility | | | — | | | | 2,500 | | | | — | | | | — | | | | — | |
Commonwealth Training Infrastructure Investment for Tomorrow2 | | | 11,681 | | | | 1,947 | | | | — | | | | — | | | | — | |
Surat Basin Resources Trade Infrastructure Project | | | — | | | | — | | | | — | | | | — | | | | — | |
| | | | | | | | | | | | | | | | | | | | |
Portfolio Total | | | 11,681 | | | | 26,347 | | | | 38,100 | | | | (30,000 | ) | | | (30,000 | ) |
| | | | | | | | | | | | | | | | | | | | |
| | | | | |
Department of Employment, Economic Development and Innovation | | | | | | | | | | | | | | | | | | | | |
Racing Industry Capital Development Scheme | | | — | | | | 20,000 | | | | 21,000 | | | | 22,000 | | | | 22,000 | |
Streamlining Mineral and Petroleum Tenure Approvals | | | — | | | | 1,657 | | | | 2,486 | | | | 2,400 | | | | — | |
Security Providers Fingerprinting | | | — | | | | 177 | | | | — | | | | — | | | | — | |
| | | | | | | | | | | | | | | | | | | | |
Portfolio Total | | | — | | | | 21,834 | | | | 23,486 | | | | 24,400 | | | | 22,000 | |
| | | | | | | | | | | | | | | | | | | | |
| | | | | |
Department of Environment and Resource Management | | | | | | | | | | | | | | | | | | | | |
Implementing the Koala Response Strategy2 | | | — | | | | 14,000 | | | | 6,200 | | | | 6,200 | | | | 6,200 | |
Dam Safety Spillway Upgrades Program (including Kinchant Dam) | | | — | | | | 13,138 | | | | 18,000 | | | | (13,008 | ) | | | (18,130 | ) |
Water for the Future (Healthy Headwaters) | | | — | | | | 7,426 | | | | 10,011 | | | | — | | | | — | |
Queensland Waste Reform Strategy Implementation | | | — | | | | 6,200 | | | | — | | | | — | | | | — | |
National Parks | | | 5,840 | | | | 2,100 | | | | — | | | | — | | | | — | |
| | | | | | | | | | | | | | | | | | | | |
Portfolio Total | | | 5,840 | | | | 42,864 | | | | 34,211 | | | | (6,808 | ) | | | (11,930 | ) |
| | | | | | | | | | | | | | | | | | | | |
| | | | |
| | | Budget Measures 2010-11 | | 10 |
| | | | | | | | | | | | | | | | | | | | |
| | | 2009-10 | | | 2010-11 | | | 2011-12 | | | 2012-13 | | | 2013-14 | |
| | | $’000 | | | $’000 | | | $’000 | | | $’000 | | | $’000 | |
Department of Health | | | | | | | | | | | | | | | | | | | | |
Regional Cancer Centres | | | — | | | | 16,350 | | | | 32,530 | | | | 99,815 | | | | 30,596 | |
Sunshine Coast Service Enhancements | | | — | | | | 11,500 | | | | 14,600 | | | | — | | | | — | |
Priority Capital Program | | | — | | | | 6,850 | | | | 29,850 | | | | 24,500 | | | | 60,000 | |
Relocation of the Leukaemia Foundation of Queensland | | | — | | | | 5,500 | | | | 6,800 | | | | 6,000 | | | | — | |
National Health and Hospitals Network - Sub-Acute Care | | | — | | | | 4,300 | | | | 46,500 | | | | 40,700 | | | | 36,500 | |
National Health and Hospitals Network - Elective Surgery | | | — | | | | 3,050 | | | | 4,950 | | | | 5,000 | | | | — | |
National Health and Hospitals Network - Flexible Funding Pool | | | — | | | | 2,500 | | | | 9,300 | | | | 25,900 | | | | — | |
National Health and Hospitals Network - Multi-Purpose | | | — | | | | 500 | | | | 6,000 | | | | 5,000 | | | | 4,600 | |
National Health and Hospitals Network - Emergency Departments | | | — | | | | — | | | | 12,800 | | | | 30,400 | | | | 4,800 | |
| | | | | | | | | | | | | | | | | | | | |
Portfolio Total | | | — | | | | 50,550 | | | | 163,330 | | | | 237,315 | | | | 136,496 | |
| | | | | | | | | | | | | | | | | | | | |
| | | | | |
Department of Infrastructure and Planning | | | | | | | | | | | | | | | | | | | | |
Cassowary Coast Regional Council - Priority Projects | | | — | | | | 13,700 | | | | — | | | | — | | | | — | |
Surat Basin Railway Corridor | | | — | | | | 5,335 | | | | — | | | | — | | | | — | |
Whitsunday Coast Airport Upgrade | | | — | | | | 3,000 | | | | — | | | | — | | | | — | |
Bundaberg Regional Airport Upgrade | | | — | | | | — | | | | — | | | | — | | | | — | |
Toowoomba Pipeline | | | 6,405 | | | | — | | | | — | | | | — | | | | — | |
| | | | | | | | | | | | | | | | | | | | |
Portfolio Total | | | 6,405 | | | | 22,035 | | | | — | | | | — | | | | — | |
| | | | | | | | | | | | | | | | | | | | |
| | | | | |
Department of Justice and Attorney-General | | | | | | | | | | | | | | | | | | | | |
Programmed Renewal and Minor Works | | | — | | | | 3,955 | | | | — | | | | — | | | | — | |
Southport - Arrest Court Extension and Fitout of Additional Courtrooms | | | 1,365 | | | | 2,635 | | | | — | | | | — | | | | — | |
Information Technology Enhancement | | | — | | | | 1,535 | | | | 1,535 | | | | 1,535 | | | | 1,535 | |
Establishment Costs for Electronic Document Records Management System - Legal Aid Queensland | | | — | | | | 845 | | | | 825 | | | | — | | | | — | |
| | | | | | | | | | | | | | | | | | | | |
Portfolio Total | | | 1,365 | | | | 8,970 | | | | 2,360 | | | | 1,535 | | | | 1,535 | |
| | | | | | | | | | | | | | | | | | | | |
| | | | | |
Department of Police | | | | | | | | | | | | | | | | | | | | |
Security Providers Fingerprinting | | | — | | | | — | | | | — | | | | — | | | | — | |
| | | | | | | | | | | | | | | | | | | | |
Portfolio Total | | | — | | | | — | | | | — | | | | — | | | | — | |
| | | | | | | | | | | | | | | | | | | | |
| | | | | |
Department of Public Works | | | | | | | | | | | | | | | | | | | | |
GovNet Core Operations | | | — | | | | 916 | | | | — | | | | — | | | | — | |
| | | | | | | | | | | | | | | | | | | | |
Portfolio Total | | | — | | | | 916 | | | | — | | | | — | | | | — | |
| | | | | | | | | | | | | | | | | | | | |
| | | | | |
Department of the Premier and Cabinet | | | | | | | | | | | | | | | | | | | | |
Queensland Symphony Orchestra Australian Broadcasting Corporation co-location project | | | 5,000 | | | | 7,000 | | | | — | | | | — | | | | — | |
| | | | | | | | | | | | | | | | | | | | |
Portfolio Total | | | 5,000 | | | | 7,000 | | | | — | | | | — | | | | — | |
| | | | | | | | | | | | | | | | | | | | |
| | | | |
| | | Budget Measures 2010-11 | | 11 |
| | | | | | | | | | | | | | | | | | | | |
| | | 2009-10 | | | 2010-11 | | | 2011-12 | | | 2012-13 | | | 2013-14 | |
| | | $’000 | | | $’000 | | | $’000 | | | $’000 | | | $’000 | |
Department of Transport and Main Roads | | | | | | | | | | | | | | | | | | | | |
Upgrade to Port of Brisbane Motorway | | | 4,000 | | | | 88,000 | | | | 120,000 | | | | 120,000 | | | | — | |
Springfield Passenger Rail Line - Stage 2 | | | 5,000 | | | | 41,000 | | | | 244,500 | | | | 186,000 | | | | (3,420 | ) |
Rail Capacity Upgrades | | | 1,000 | | | | 39,000 | | | | 50,000 | | | | — | | | | — | |
Road and Transport Infrastructure Projects | | | 46,124 | | | | 22,521 | | | | 23,422 | | | | 24,359 | | | | 25,333 | |
New Queensland Driver Licence | | | — | | | | 18,005 | | | | 5,348 | | | | 5,772 | | | | 6,413 | |
TransLink Station Upgrade Program | | | — | | | | 10,000 | | | | 10,000 | | | | 10,000 | | | | 51,527 | |
Capricorn Highway - Gracemere Stanwell Industrial Corridor | | | — | | | | 6,000 | | | | 4,000 | | | | — | | | | — | |
Strategic Noise Barrier Program | | | — | | | | — | | | | — | | | | — | | | | — | |
Sustainable Resource Communities Funding - Road Safety Upgrades | | | — | | | | — | | | | — | | | | — | | | | — | |
Townsville Marine Precinct | | | — | | | | — | | | | 5,600 | | | | — | | | | — | |
Townsville Port Access Road Bridge | | | — | | | | — | | | | 4,000 | | | | — | | | | — | |
| | | | | | | | | | | | | | | | | | | | |
Portfolio Total | | | 56,124 | | | | 224,526 | | | | 466,870 | | | | 346,131 | | | | 79,853 | |
| | | | | | | | | | | | | | | | | | | | |
| | | | | |
Legislative Assembly of Queensland | | | | | | | | | | | | | | | | | | | | |
Broadcast of Parliament Stage 3 | | | — | | | | 156 | | | | — | | | | — | | | | — | |
| | | | | | | | | | | | | | | | | | | | |
Portfolio Total | | | — | | | | 156 | | | | — | | | | — | | | | — | |
| | | | | | | | | | | | | | | | | | | | |
| | | | | |
Total impact on Capital since MYR | | | 89,622 | | | | 409,432 | | | | 731,157 | | | | 575,273 | | | | 201,554 | |
| | | | | | | | | | | | | | | | | | | | |
Total impact on Capital since the 2009-10 Budget | | | 133,792 | | | | 450,582 | | | | 745,557 | | | | 575,273 | | | | 201,554 | |
| | | | | | | | | | | | | | | | | | | | |
Less Australian Government funding | | | 2,000 | | | | 23,700 | | | | 107,080 | | | | 206,815 | | | | 76,496 | |
| | | | | | | | | | | | | | | | | | | | |
Net of Measures funded by Australian Government | | | 131,792 | | | | 426,882 | | | | 638,477 | | | | 368,458 | | | | 125,058 | |
| | | | | | | | | | | | | | | | | | | | |
Notes:
| 1. | Further funding for this initiative can be found in the Post Mid Year Review section of this table. |
| 2. | Further funding for this initiative can be found in the Mid Year Review section of this table. |
| | | | |
| 12 | | Budget Measures 2010-11 | | |
Table 3: Revenue measures since the 2009-10 Budget
| | | | | | | | | | | | | | | | | | | | |
Revenue measures since 2009-10 MYR | | 2009-10
$’000 | | | 2010-11
$’000 | | | 2011-12
$’000 | | | 2012-13
$’000 | | | 2013-14
$’000 | |
Department of Employment, Economic Development and Innovation | | | | | | | | | | | | | | | | | | | | |
Petroleum and Gas Inspectors | | | — | | | | 3,182 | | | | 4,850 | | | | 4,812 | | | | 4,436 | |
Streamlining Mineral and Petroleum Tenure Approvals | | | — | | | | 3,040 | | | | 3,249 | | | | 3,166 | | | | 3,071 | |
Security Providers Fingerprinting | | | — | | | | 270 | | | | 540 | | | | 540 | | | | 288 | |
| | | | | | | | | | | | | | | | | | | | |
Portfolio Total | | | — | | | | 6,492 | | | | 8,639 | | | | 8,518 | | | | 7,795 | |
| | | | | | | | | | | | | | | | | | | | |
| | | | | |
Department of Environment and Resource Management | | | | | | | | | | | | | | | | | | | | |
Queensland Industry Waste Disposal Levy | | | — | | | | — | | | | 98,530 | | | | 96,120 | | | | 92,250 | |
| | | | | | | | | | | | | | | | | | | | |
Portfolio Total | | | — | | | | — | | | | 98,530 | | | | 96,120 | | | | 92,250 | |
| | | | | | | | | | | | | | | | | | | | |
Department of Infrastructure and Planning | | | | | | | | | | | | | | | | | | | | |
Smart eDA Lodgement Fees | | | — | | | | 178 | | | | 840 | | | | 1,942 | | | | 3,629 | |
| | | | | | | | | | | | | | | | | | | | |
Portfolio Total | | | — | | | | 178 | | | | 840 | | | | 1,942 | | | | 3,629 | |
| | | | | | | | | | | | | | | | | | | | |
| | | | | |
Department of Police | | | | | | | | | | | | | | | | | | | | |
Weapons Licensing Fee Increase | | | — | | | | 2,931 | | | | 3,285 | | | | 3,383 | | | | 3,485 | |
Special Service Fees | | | — | | | | 804 | | | | 828 | | | | 853 | | | | 879 | |
| | | | | | | | | | | | | | | | | | | | |
Portfolio Total | | | — | | | | 3,735 | | | | 4,113 | | | | 4,236 | | | | 4,364 | |
| | | | | | | | | | | | | | | | | | | | |
| | | | | |
Department of Transport and Main Roads | | | | | | | | | | | | | | | | | | | | |
Camera Detected Offence Program | | | — | | | | 31,219 | | | | — | | | | — | | | | — | |
New Queensland Driver Licence | | | — | | | | 15,717 | | | | 34,265 | | | | 59,790 | | | | 65,330 | |
Additional TransLink Fare Revenue | | | — | | | | — | | | | — | | | | — | | | | — | |
| | | | | | | | | | | | | | | | | | | | |
Portfolio Total | | | — | | | | 46,936 | | | | 34,265 | | | | 59,790 | | | | 65,330 | |
| | | | | | | | | | | | | | | | | | | | |
| | | | | |
Treasury Department | | | | | | | | | | | | | | | | | | | | |
Valuation Appeals - Commercial Land Settlements | | | (30,000 | ) | | | — | | | | — | | | | — | | | | — | |
Transfer Duty Exemption for Special Disability Trusts | | | — | | | | (500 | ) | | | (575 | ) | | | (660 | ) | | | (725 | ) |
Land Tax Relief for Supported Accommodation Providers | | | — | | | | (1,000 | ) | | | (1,055 | ) | | | (1,119 | ) | | | (1,186 | ) |
Payroll Tax Rebate for Apprentices and Trainees | | | — | | | | (8,000 | ) | | | — | | | | — | | | | — | |
| | | | | | | | | | | | | | | | | | | | |
Portfolio Total | | | (30,000 | ) | | | (9,500 | ) | | | (1,630 | ) | | | (1,779 | ) | | | (1,911 | ) |
| | | | | | | | | | | | | | | | | | | | |
Total impact on Revenue since MYR | | | (30,000 | ) | | | 47,841 | | | | 144,757 | | | | 168,827 | | | | 171,457 | |
| | | | | | | | | | | | | | | | | | | | |
Total impact on Revenue since the 2009-10 Budget | | | (30,000 | ) | | | 47,841 | | | | 144,757 | | | | 168,827 | | | | 171,457 | |
| | | | | | | | | | | | | | | | | | | | |
| | | | |
| | | Budget Measures 2010-11 | | 13 |
Intentionally Left Bank
| | | | |
| 14 | | Budget Measures 2010-11 | | |
2. EXPENSE MEASURES
Introduction
The following tables present the relevant portfolio expense measures relating to decisions taken since the 2009-10 Budget. This does not represent the full amount of additional funding provided to agencies since the 2009-10 Budget. For further explanation, refer to Explanation of Scope and Terms in Chapter 1.
| | | | |
| | | Budget Measures 2010-11 | | 15 |
Department of Communities
| | | | | | | | | | | | | | | | | | | | |
| | | 2009-10
$’000 | | | 2010-11
$’000 | | | 2011-12
$’000 | | | 2012-13
$’000 | | | 2013-14
$’000 | |
Electricity Rebate and Electricity Life Support Concession Scheme - Supplementation | | | — | | | | 12,600 | | | | 12,600 | | | | 12,600 | | | | 12,600 | |
The Government will provide additional funding to increase the Electricity Rebate and Electricity Life Support Concession Scheme in line with electricity prices announced by the Queensland Competition Authority.
| | | | | | | | | | | | | | | | | | | | |
| | | 2009-10
$’000 | | | 2010-11
$’000 | | | 2011-12
$’000 | | | 2012-13
$’000 | | | 2013-14
$’000 | |
Child Protection Reforms | | | — | | | | 7,500 | | | | 12,500 | | | | 12,500 | | | | 12,500 | |
The Government will provide additional funding of $45 million over four years to trial reforms to the child protection system in three sites – Logan, Beenleigh/Eagleby and the Gold Coast – focused on the development and enhancement of family support and domestic and family violence services. The department will contribute $2.5 million on an ongoing basis to this initiative. The initiative also includes funding for Queensland Health to implement a home visiting program for all families with children aged zero to three in these locations.
| | | | | | | | | | | | | | | | | | | | |
| | | 2009-10
$’000 | | | 2010-11
$’000 | | | 2011-12
$’000 | | | 2012-13
$’000 | | | 2013-14
$’000 | |
Young People with a Disability Transitioning to Adulthood | | | — | | | | 4,400 | | | | 5,700 | | | | 5,700 | | | | 5,700 | |
The Government will provide increased funding of $21.5 million over four years to support young people with a disability leaving school or the child protection system and provide them with the skills and support needed to live as independently as possible in the community.
| | | | |
| 16 | | Budget Measures 2010-11 | | |
| | | | | | | | | | | | | | | | | | | | |
| | | 2009-10
$’000 | | | 2010-11
$’000 | | | 2011-12
$’000 | | | 2012-13
$’000 | | | 2013-14
$’000 | |
Spinal Cord Injury Response | | | — | | | | 3,200 | | | | 8,200 | | | | 8,200 | | | | 8,200 | |
The Government will provide increased funding of $27.8 million over four years to assist more people in hospital, who have sustained a spinal injury, to return to their communities. The additional health, disability and accommodation supports provided under this initiative will minimise the risk of re-entry to the hospital system.
| | | | | | | | | | | | | | | | | | | | |
| | | 2009-10
$’000 | | | 2010-11
$’000 | | | 2011-12
$’000 | | | 2012-13
$’000 | | | 2013-14
$’000 | |
Additional Frontline Child Protection Staff | | | — | | | | 3,000 | | | | 3,000 | | | | 3,000 | | | | 3,000 | |
The Government will provide increased funding of $12 million over four years to recruit additional frontline child protection staff. This initiative is part of a broader program to increase frontline service capacity to better respond to the needs of children.
| | | | | | | | | | | | | | | | | | | | |
| | | 2009-10
$’000 | | | 2010-11
$’000 | | | 2011-12
$’000 | | | 2012-13
$’000 | | | 2013-14
$’000 | |
Families with Children with a Disability | | | — | | | | 2,900 | | | | 3,400 | | | | 3,400 | | | | 3,400 | |
The Government will provide increased funding of $13.1 million over four years for early intervention and support services to assist more families with children with a disability to continue to care for their child in the family home, including access to respite services.
| | | | |
| 411 | | Budget Measures 2010-11 | | |
| | | | | | | | | | | | | | | | | | | | |
| | | 2009-10
$’000 | | | 2010-11
$’000 | | | 2011-12
$’000 | | | 2012-13
$’000 | | | 2013-14
$’000 | |
Murri Court and Queensland Indigenous Alcohol Diversion Pilot Program | | | — | | | | 2,222 | | | | — | | | | — | | | | — | |
The Government will provide funding of $2.2 million in 2010-11 to continue the Queensland Indigenous Alcohol Diversion Pilot Program to provide Aboriginal and Torres Strait Islander people, charged with an alcohol-related offence, with the opportunity to access alcohol treatment services. Funding for other programs under this initiative can be found in the Department of Justice and Attorney-General section of this document.
| | | | | | | | | | | | | | | | | | | | |
| | | 2009-10
$’000 | | | 2010-11
$’000 | | | 2011-12
$’000 | | | 2012-13
$’000 | | | 2013-14
$’000 | |
Medical Cooling and Heating Electricity Concession Scheme | | | — | | | | 1,421 | | | | 1,580 | | | | 1,759 | | | | 1,958 | |
The Government will provide additional funding of $6.7 million over four years to establish a rebate to assist with the electricity costs for eligible concession card holders with a medical condition who have a dependence on air-conditioning to regulate body temperature.
| | | | | | | | | | | | | | | | | | | | |
| | | 2009-10
$’000 | | | 2010-11
$’000 | | | 2011-12
$’000 | | | 2012-13
$’000 | | | 2013-14
$’000 | |
Autism Early Intervention Initiative | | | — | | | | 1,000 | | | | 1,000 | | | | 1,000 | | | | 1,000 | |
The Government will provide increased funding of $4 million over four years to expand specialist intensive early intervention services to assist more children with Autism Spectrum Disorder to improve their social and educational development. New regional services will be established in Mackay and Bundaberg with this funding.
| | | | |
| 18 | | Budget Measures 2010-11 | | |
| | | | | | | | | | | | | | | | | | | | |
| | | 2009-10
$’000 | | | 2010-11
$’000 | | | 2011-12
$’000 | | | 2012-13
$’000 | | | 2013-14
$’000 | |
Community Living Initiative for People with a Disability | | | — | | | | 1,000 | | | | 1,700 | | | | 1,700 | | | | 1,700 | |
The Government will provide increased funding of $6.1 million over four years to expand the support available for people with a disability to live as independently as possible in the community.
| | | | | | | | | | | | | | | | | | | | |
| | | 2009-10
$’000 | | | 2010-11
$’000 | | | 2011-12
$’000 | | | 2012-13
$’000 | | | 2013-14
$’000 | |
Foodbank Queensland | | | — | | | | 750 | | | | 750 | | | | 750 | | | | 750 | |
The Government will continue to fund Foodbank Queensland ($3 million over four years from 2010-11) to provide thousands of vulnerable Queenslanders with food assistance each week, through the distribution of surplus food to 300 charitable organisations and community groups.
| | | | | | | | | | | | | | | | | | | | |
| | | 2009-10
$’000 | | | 2010-11
$’000 | | | 2011-12
$’000 | | | 2012-13
$’000 | | | 2013-14
$’000 | |
Evolve Interagency Services | | | — | | | | — | | | | 2,000 | | | | 2,000 | | | | 2,000 | |
The Government will provide increased funding of $6 million over three years from 2011-12 for intensive therapeutic health services (provided by Queensland Health) to more than 60 additional children and young people each year with complex and extreme needs in the child protection system. This funding will also be used to increase support and skill development for those providing support to children in receipt of Evolve services.
| | | | |
| | | Budget Measures 2010-11 | | 19 |
Department of Community Safety
| | | | | | | | | | | | | | | | | | | | |
| | | 2009-10
$’000 | | | 2010-11
$’000 | | | 2011-12
$’000 | | | 2012-13
$’000 | | | 2013-14
$’000 | |
Resourcing Queensland Fire and Rescue Service | | | — | | | | 12,521 | | | | 10,241 | | | | 10,411 | | | | 9,584 | |
The Queensland Fire and Rescue Service continues the delivery of quality and timely services. The Government will provide additional funding of $42.8 million over four years that will be directed towards additional operational firefighting personnel, enhanced firefighter safety and improved technology and incident response capability. The capital component of this initiative can be found in Chapter 3 Capital Measures.
| | | | | | | | | | | | | | | | | | | | |
| | | 2009-10
$’000 | | | 2010-11
$’000 | | | 2011-12
$’000 | | | 2012-13
$’000 | | | 2013-14
$’000 | |
Additional Ambulance Officers | | | — | | | | 3,500 | | | | 5,000 | | | | 5,000 | | | | 5,000 | |
The Government will provide additional funding of $18.5 million over four years for 75 additional ambulance officers in 2010-11 to continue the Queensland Ambulance Service’s commitment to quality and timely services to all Queenslanders.
| | | | | | | | | | | | | | | | | | | | |
| | | 2009-10
$’000 | | | 2010-11
$’000 | | | 2011-12
$’000 | | | 2012-13
$’000 | | | 2013-14
$’000 | |
Guarding Our Beaches - Saving Lives | | | — | | | | 2,000 | | | | 2,000 | | | | 2,000 | | | | 2,000 | |
The Government will provide increased funding of $6.8 million over four years to Surf Life Saving Queensland for the Life Saving Services Development Fund and WorkCover payments along with $1.2 million over four years to Royal Life Saving Society Queensland to provide water safety education programs to young Queenslanders.
| | | | |
| 20 | | Budget Measures 2010-11 | | |
| | | | | | | | | | | | | | | | | | | | |
| | | 2009-10
$’000 | | | 2010-11
$’000 | | | 2011-12
$’000 | | | 2012-13
$’000 | | | 2013-14
$’000 | |
Community Helicopter Provider for Toowoomba | | | — | | | | 1,641 | | | | 1,641 | | | | 1,641 | | | | 1,641 | |
The Government will provide additional funding of $6.6 million over four years to support the CareFlight helicopter based in Toowoomba to perform tasks including aeromedical, law enforcement, search and rescue, counter disaster and fire suppression and surveillance services.
| | | | | | | | | | | | | | | | | | | | |
| | | 2009-10
$’000 | | | 2010-11
$’000 | | | 2011-12
$’000 | | | 2012-13
$’000 | | | 2013-14
$’000 | |
Continuation of the Sexual Offenders Program | | | — | | | | 1,500 | | | | 1,500 | | | | 1,500 | | | | 1,500 | |
The Government will provide funding of $6 million over four years for Queensland Corrective Services for the sexual offending treatment programs.
| | | | | | | | | | | | | | | | | | | | |
| | | 2009-10
$’000 | | | 2010-11
$’000 | | | 2011-12
$’000 | | | 2012-13
$’000 | | | 2013-14
$’000 | |
Emergency Alert | | | 1,437 | | | | 1,249 | | | | 1,249 | | | | 1,249 | | | | — | |
The Government is providing funding of $5.2 million over four years to implement an Emergency Alert system within Queensland, which will include a community education and awareness campaign. Emergency Alert is a national telephone-based emergency warning system that provides voice messages to land lines and SMS messages to mobile phones to alert people to a major disaster.
| | | | |
| | | Budget Measures 2010-11 | | 21 |
| | | | | | | | | | | | | | | | | | | | |
| | | 2009-10
$’000 | | | 2010-11
$’000 | | | 2011-12
$’000 | | | 2012-13
$’000 | | | 2013-14
$’000 | |
Helicopter Services - Engineers | | | — | | | | 1,020 | | | | 800 | | | | 800 | | | | 800 | |
The Government will provide funding of $3.4 million over four years to provide additional engineering staff for the Emergency Management Queensland Helicopter Rescue program to meet the projected demand for helicopter services.
| | | | | | | | | | | | | | | | | | | | |
| | | 2009-10
$’000 | | | 2010-11
$’000 | | | 2011-12
$’000 | | | 2012-13
$’000 | | | 2013-14
$’000 | |
Pre-Commissioning Work at Lotus Glen Correctional Centre | | | — | | | | 700 | | | | — | | | | — | | | | — | |
The Government will provide funding of $0.7 million in 2010-11 for pre-commissioning work for the expansion and redevelopment of the Lotus Glen Correctional Centre.
| | | | | | | | | | | | | | | | | | | | |
| | | 2009-10
$’000 | | | 2010-11
$’000 | | | 2011-12
$’000 | | | 2012-13
$’000 | | | 2013-14
$’000 | |
Disaster Management Training | | | — | | | | 500 | | | | — | | | | — | | | | — | |
The Government will provide funding of $0.5 million in 2010-11 for disaster management training to improve the disaster management system.
| | | | | | | | | | | | | | | | | | | | |
| | | 2009-10
$’000 | | | 2010-11
$’000 | | | 2011-12
$’000 | | | 2012-13
$’000 | | | 2013-14
$’000 | |
National Framework for Scaled Advice and Warnings | | | 500 | | | | — | | | | — | | | | — | | | | — | |
The Government is providing additional funding of $0.5 million in 2009-10 for the creation and installation of the nationally revised fire danger ratings signs, in addition to a community education and bushfire awareness initiative. This will provide individuals, property owners and communities with advice to determine the potential impact of bushfires.
| | | | |
| 22 | | Budget Measures 2010-11 | | |
| | | | | | | | | | | | | | | | | | | | |
| | | 2009-10
$’000 | | | 2010-11
$’000 | | | 2011-12
$’000 | | | 2012-13
$’000 | | | 2013-14
$’000 | |
Sustainable Resource Communities Funding - Mitchell/ Surat State Emergency Service | | | — | | | | — | | | | — | | | | — | | | | — | |
As part of the Sustainable Resource Communities funding initiative, the Government will provide funding of $0.15 million in 2010-11 to construct a new State Emergency Service (SES) building in Mitchell and to provide a fit-out for the SES building in Surat.
| | | | |
| | | Budget Measures 2010-11 | | 23 |
Department of Education and Training
| | | | | | | | | | | | | | | | | | | | |
| | | 2009-10
$’000 | | | 2010-11
$’000 | | | 2011-12
$’000 | | | 2012-13
$’000 | | | 2013-14
$’000 | |
Queensland College of Teachers - Pre-registration Testing | | | — | | | | 2,707 | | | | 505 | | | | — | | | | — | |
The Government will provide funding of $3.2 million over two years to support the Queensland College of Teachers’ implementation of a key reform initiated by the Government response to the Queensland Education Performance Review conducted by Professor Geoff Masters. Under this initiative, all aspiring teachers will be required to demonstrate competency in literacy, numeracy, science and teaching techniques prior to entry to the teaching profession.
| | | | | | | | | | | | | | | | | | | | |
| | | 2009-10
$’000 | | | 2010-11
$’000 | | | 2011-12
$’000 | | | 2012-13
$’000 | | | 2013-14
$’000 | |
National Partnership on Pre-apprenticeship Training | | | — | | | | 2,500 | | | | — | | | | — | | | | — | |
The Australian Government will provide $2.5 million to help increase the number of pre-apprenticeship training opportunities that are available, which will result in an increase in the number of individuals taking up formal apprenticeship training in traditional trade occupations.
| | | | | | | | | | | | | | | | | | | | |
| | | 2009-10
$’000 | | | 2010-11
$’000 | | | 2011-12
$’000 | | | 2012-13
$’000 | | | 2013-14
$’000 | |
National Partnership on the National Quality Agenda for Early Childhood Education and Care | | | — | | | | 1,016 | | | | 911 | | | | 1,594 | | | | 1,468 | |
The Australian Government will provide $5 million over four years to deliver an integrated and unified national regulatory system for early childhood education and care and reduce the regulatory burden on service providers.
| | | | |
| 24 | | Budget Measures 2010-11 | | |
| | | | | | | | | | | | | | | | | | | | |
| | | 2009-10
$’000 | | | 2010-11
$’000 | | | 2011-12
$’000 | | | 2012-13
$’000 | | | 2013-14
$’000 | |
Flying Start - Volunteering in Schools | | | — | | | | 190 | | | | 400 | | | | 400 | | | | 400 | |
The Government will provide additional funding of $1.4 million over four years for the Queensland Ready Reader program. This program, supplemented by existing funding of $7.3 million over four years, will support the recruitment of at least 3,000 volunteers to provide reading support to Queensland primary school children.
| | | | | | | | | | | | | | | | | | | | |
| | | 2009-10
$’000 | | | 2010-11
$’000 | | | 2011-12
$’000 | | | 2012-13
$’000 | | | 2013-14
$’000 | |
Acceleration of Universal Access to Kindergarten Program | | | — | | | | — | | | | 2,350 | | | | 3,500 | | | | 1,100 | |
The Government will provide additional funding of $7 million from 2011-12 to 2013-14 to support the accelerated planning and delivery of 40 kindergarten services originally scheduled for 2013 and 2014. This will contribute to the commitment to provide up to 240 extra kindergarten services by 2014.
| | | | | | | | | | | | | | | | | | | | |
| | | 2009-10
$’000 | | | 2010-11
$’000 | | | 2011-12
$’000 | | | 2012-13
$’000 | | | 2013-14
$’000 | |
ClimateQ: Training | | | — | | | | — | | | | — | | | | — | | | | — | |
The Government is providing funding of $1.1 million over four years from the Queensland Climate Change Fund for a Low Carbon Economy training initiative ($0.6 million) and the Green Building Skills Fund ($0.5 million). Funding skills development for a Low Carbon Economy enables identification of emerging green skills and the development of training products to meet those skills, while the Green Building Skills Fund is boosting the sustainability of expertise within Queensland’s building and construction industry.
| | | | |
| | | Budget Measures 2010-11 | | 25 |
Department of Employment, Economic Development and Innovation
| | | | | | | | | | | | | | | | | | | | |
| | | 2009-10
$’000 | | | 2010-11
$’000 | | | 2011-12
$’000 | | | 2012-13
$’000 | | | 2013-14
$’000 | |
Solar Initiatives Package | | | 25,000 | | | | 15,000 | | | | 30,000 | | | | 25,000 | | | | 20,000 | |
The Government is providing additional funding of $115 million over five years for a package of targeted solar initiatives that aim to increase support for solar energy, create green jobs, drive community participation in solar programs and encourage investment in solar technologies. The initiatives include installation of solar photovoltaic (PV) systems on kindergartens, a solar hot water rebate scheme and funding to CS Energy Limited for carbon reducing technologies at the Kogan Creek Power Station.
| | | | | | | | | | | | | | | | | | | | |
| | | 2009-10
$’000 | | | 2010-11
$’000 | | | 2011-12
$’000 | | | 2012-13
$’000 | | | 2013-14
$’000 | |
Jobs Assist Program | | | 3,500 | | | | 5,500 | | | | — | | | | — | | | | — | |
The Government is providing additional funding of $9 million over two years to provide an integrated package of support for workers and businesses impacted by the global financial crisis. Support is provided to businesses within the Priority Employment areas identified by the Australian Government under the Keep Australia Working strategy or to businesses in key sectors considered to be critical or strategic to the State, region or industry or in a significant sectoral supply chain. Total funding for the program, including funding already held by the Department of Education and Training, is $10 million.
| | | | |
| 26 | | Budget Measures 2010-11 | | |
| | | | | | | | | | | | | | | | | | | | |
| | | 2009-10
$’000 | | | 2010-11
$’000 | | | 2011-12
$’000 | | | 2012-13
$’000 | | | 2013-14
$’000 | |
Streamlining Mineral and Petroleum Tenure Approvals | | | — | | | | 3,040 | | | | 3,249 | | | | 3,166 | | | | 3,071 | |
The Government will provide additional funding of $12.5 million over four years to deliver a streamlined resource tenure service delivery model through the introduction of a flexible case management model including Native Title services. This will provide a more efficient and robust service delivery model which will expedite industry project approvals.
| | | | | | | | | | | | | | | | | | | | |
| | | 2009-10
$’000 | | | 2010-11
$’000 | | | 2011-12
$’000 | | | 2012-13
$’000 | | | 2013-14
$’000 | |
Mining Exploration Program - Greenfields 2020 | | | — | | | | 3,000 | | | | 5,000 | | | | 5,000 | | | | 5,000 | |
The Government will provide additional funding of $18 million over four years to target under-explored geological terrains which have the potential to develop into major new mineral and energy resource provinces for Queensland. This will involve acquiring and interpreting new geological, geochemical and geophysical information to improve understanding of Queensland’s exploration and resource potential in order to continue to stimulate and attract exploration investment and discovery.
| | | | | | | | | | | | | | | | | | | | |
| | | 2009-10
$’000 | | | 2010-11
$’000 | | | 2011-12
$’000 | | | 2012-13
$’000 | | | 2013-14
$’000 | |
National Red Imported Fire Ant Eradication Program | | | — | | | | 3,000 | | | | — | | | | — | | | | — | |
The Government will provide an additional $3 million in 2010-11, to be matched by the Australian Government, to maintain the National Red Imported Fire Ant Eradication Program.
| | | | |
| | | Budget Measures 2010-11 | | 27 |
| | | | | | | | | | | | | | | | | | | | |
| | | 2009-10
$’000 | | | 2010-11
$’000 | | | 2011-12
$’000 | | | 2012-13
$’000 | | | 2013-14
$’000 | |
Petroleum and Gas Inspectors | | | — | | | | 2,540 | | | | 4,183 | | | | 4,145 | | | | 3,769 | |
The Government will provide additional funding of $14.6 million over four years to enhance the service delivery capacity of the Petroleum and Gas Inspectorate through the employment of additional inspectors. Funding will be offset through improving cost recovery of petroleum and gas inspectorate services.
| | | | | | | | | | | | | | | | | | | | |
| | | 2009-10
$’000 | | | 2010-11
$’000 | | | 2011-12
$’000 | | | 2012-13
$’000 | | | 2013-14
$’000 | |
National Collaborative Research Infrastructure Scheme | | | 1,020 | | | | 2,040 | | | | 2,040 | | | | — | | | | — | |
The Government is investing $5.1 million over three years to support the establishment and operation of the Queensland node of the national Public Health and Research Network and the national headquarters of the Terrestrial Ecosystem Research Network under the National Collaborative Research Infrastructure Strategy. Both of these facilities will be located at the University of Queensland, St Lucia campus.
| | | | | | | | | | | | | | | | | | | | |
| | | 2009-10
$’000 | | | 2010-11
$’000 | | | 2011-12
$’000 | | | 2012-13
$’000 | | | 2013-14
$’000 | |
Innovation Voucher Award Program | | | — | | | | 1,000 | | | | 1,500 | | | | — | | | | — | |
The Innovation Voucher Award program will provide additional funding of $2.5 million over two years to target Queensland-based small to medium enterprises to improve productivity. A pilot program will provide up to $50,000 per eligible business to build capability and sustainability through the commercialisation of research and the implementation of innovative practices. The pilot will provide businesses with redeemable vouchers to access research and expert advice.
| | | | |
| 28 | | Budget Measures 2010-11 | | |
| | | | | | | | | | | | | | | | | | | | |
| | | 2009-10
$’000 | | | 2010-11
$’000 | | | 2011-12
$’000 | | | 2012-13
$’000 | | | 2013-14
$’000 | |
Security Providers Fingerprinting | | | — | | | | 495 | | | | 233 | | | | 240 | | | | 246 | |
The Council of Australian Governments’ adoption of a national approach to the regulation of the security provider industry through the mandatory fingerprinting of industry licensees will require additional funding of $1.2 million over four years. The capital component of this initiative can be found in Chapter 3 Capital Measures.
| | | | | | | | | | | | | | | | | | | | |
| | | 2009-10
$’000 | | | 2010-11
$’000 | | | 2011-12
$’000 | | | 2012-13
$’000 | | | 2013-14
$’000 | |
Regional Development Organisations | | | 315 | | | | 315 | | | | 315 | | | | 315 | | | | 315 | |
The Government is providing financial support of $1.6 million over five years to an additional two regions (Darling Downs and Wide Bay Burnett) under the Queensland Regional Development Initiative. Projects funded include those focused on skills development and retention, employment creation opportunities and promotion of regional investment and reinvestment opportunities.
| | | | | | | | | | | | | | | | | | | | |
| | | 2009-10
$’000 | | | 2010-11
$’000 | | | 2011-12
$’000 | | | 2012-13
$’000 | | | 2013-14
$’000 | |
Hendra Virus Vaccine Research | | | — | | | | 300 | | | | — | | | | — | | | | — | |
The Government will provide an additional $0.3 million in 2010-11 to match the Australian Government’s contribution to enable the Australian Animal Health Laboratory to continue to work on an experimental Hendra virus vaccine for horses. Trials of the vaccine will need to be undertaken over the next few years to assess its effectiveness and safety.
| | | | |
| | | Budget Measures 2010-11 | | 29 |
| | | | | | | | | | | | | | | | | | | | |
| | | 2009-10
$’000 | | | 2010-11
$’000 | | | 2011-12
$’000 | | | 2012-13
$’000 | | | 2013-14
$’000 | |
Solar Thermal Feasibility Study | | | — | | | | — | | | | — | | | | — | | | | — | |
The Government has provided funding of $1 million over 2009-10 and 2010-11 through the Renewable Energy Fund to undertake a pre-feasibility study into the potential for establishing a concentrated solar thermal park in Queensland.
| | | | |
| 30 | | Budget Measures 2010-11 | | |
Department of Environment and Resource Management
| | | | | | | | | | | | | | | | | | | | |
| | | 2009-10
$’000 | | | 2010-11
$’000 | | | 2011-12
$’000 | | | 2012-13
$’000 | | | 2013-14
$’000 | |
Queensland Waste Reform Strategy Implementation | | | — | | | | 9,750 | | | | — | | | | — | | | | — | |
The Government will provide additional funding of $9.8 million in 2010-11 to implement the Queensland Waste Reform Strategy. The Queensland Waste Reform Strategy is designed to meet the contemporary challenges of waste management, by avoiding waste generation and improving resource efficiency and recovery to reduce the climate change impacts of generating waste. The capital component of this initiative can be found in Chapter 3 Capital Measures.
| | | | | | | | | | | | | | | | | | | | |
| | | 2009-10
$’000 | | | 2010-11
$’000 | | | 2011-12
$’000 | | | 2012-13
$’000 | | | 2013-14
$’000 | |
Acquisition Related Programs | | | — | | | | 8,600 | | | | 14,830 | | | | 13,720 | | | | 8,250 | |
The Government is providing additional funding of $53.8 million over five years from 2010-11 for the management and acquisition of new national park and other acquisition related programs in order to achieve Government’s Green Q2 target of increasing the area of national park to 7.5% of the State by 2020.
| | | | | | | | | | | | | | | | | | | | |
| | | 2009-10
$’000 | | | 2010-11
$’000 | | | 2011-12
$’000 | | | 2012-13
$’000 | | | 2013-14
$’000 | |
Water for the Future (Healthy Headwaters) | | | — | | | | 5,172 | | | | 9,516 | | | | 8,225 | | | | 50 | |
The Australian Government is providing funding of $23 million over four years for projects under the Water for the Future Program. The program aims to achieve improved water use efficiency and to return a share of water savings to the Australian Government for use as environmental flows. The capital component of this initiative can be found in Chapter 3 Capital Measures.
| | | | |
| | | Budget Measures 2010-11 | | 31 |
| | | | | | | | | | | | | | | | | | | | |
| | | 2009-10
$’000 | | | 2010-11
$’000 | | | 2011-12
$’000 | | | 2012-13
$’000 | | | 2013-14
$’000 | |
Change in Valuation Methodology to Site Value | | | 2,220 | | | | 2,110 | | | | 810 | | | | — | | | | — | |
The Government is providing additional funding of $5.1 million over three years to adopt and implement a site value methodology for non-rural land, consistent with other Australian jurisdictions, commencing with the 2011 valuation. This initiative is a key element in a package of valuation reforms being introduced to streamline, modernise and reposition the State Valuation Service. The capital component of this initiative can be found in Chapter 3 Capital Measures.
| | | | | | | | | | | | | | | | | | | | |
| | | 2009-10
$’000 | | | 2010-11
$’000 | | | 2011-12
$’000 | | | 2012-13
$’000 | | | 2013-14
$’000 | |
Implementing the Koala Response Strategy | | | 310 | | | | 1,500 | | | | 1,300 | | | | 1,300 | | | | 1,300 | |
The Government is providing increased funding of $0.31 million in 2009-10 and a further $6.7 million over five years from 2010-11 to continue to deliver the Queensland Government’s Koala Response Strategy. The strategy aims to halt the serious decline of South East Queensland’s koala populations and has an overarching goal of increasing mature koala habitat by 2020. The capital component of this initiative can be found in Chapter 3 Capital Measures.
| | | | | | | | | | | | | | | | | | | | |
| | | 2009-10
$’000 | | | 2010-11
$’000 | | | 2011-12
$’000 | | | 2012-13
$’000 | | | 2013-14
$’000 | |
Wild River Rangers | | | — | | | | 1,400 | | | | 1,400 | | | | 1,400 | | | | 1,400 | |
The Government is providing increased funding of $7 million over five years from 2010-11 to employ an additional 10 Wild River Rangers. The program aims to protect and promote the natural values of wild rivers, employ Indigenous rangers and to mentor and deliver accredited training. Natural resource management activities conducted by the rangers are negotiated with communities and include: weed and feral animal control, fire management, community education, fencing, erosion mitigation, rubbish removal and visitor management.
| | | | |
| 32 | | Budget Measures 2010-11 | | |
| | | | | | | | | | | | | | | | | | | | |
| | | 2009-10
$’000 | | | 2010-11
$’000 | | | 2011-12
$’000 | | | 2012-13
$’000 | | | 2013-14
$’000 | |
New Institutional Arrangements for Category 2 Water Authorities and River Improvement Trusts | | | 250 | | | | 1,200 | | | | 250 | | | | 100 | | | | — | |
The Government is providing additional funding of $1.8 million over four years to support the transfer of river improvement trusts to local governments, and the transfer of category 2 water authorities to the most appropriate institutional arrangement. These transfers are expected to reduce administration costs while maintaining local autonomy in providing water services to landholders.
| | | | | | | | | | | | | | | | | | | | |
| | | 2009-10
$’000 | | | 2010-11
$’000 | | | 2011-12
$’000 | | | 2012-13
$’000 | | | 2013-14
$’000 | |
Cape York World Heritage Nomination | | | — | | | | 1,000 | | | | 1,900 | | | | 600 | | | | — | |
The Government will provide additional funding of $3.5 million over three years commencing in 2010-11 to support the Government’s election commitment to carry out all necessary works to complete a declaration for an Area of International Conservation Significance and World Heritage nomination for Cape York Peninsula. It is envisaged that a World Heritage declaration will provide economic and employment opportunities through tourism and other community-based projects on Cape York Peninsula.
| | | | | | | | | | | | | | | | | | | | |
| | | 2009-10
$’000 | | | 2010-11
$’000 | | | 2011-12
$’000 | | | 2012-13
$’000 | | | 2013-14
$’000 | |
National Packaging Covenant | | | — | | | | 557 | | | | 557 | | | | 557 | | | | 557 | |
The Government will provide increased funding of $2.8 million over five years commencing in 2010-11 to continue the National Packaging Covenant initiative. The Covenant is designed to minimise the environmental impacts arising from the disposal of used packaging, conserve resources through better design and production processes and facilitate the re-use and recycling of used packaging materials.
| | | | |
| | | Budget Measures 2010-11 | | 33 |
| | | | | | | | | | | | | | | | | | | | |
| | | 2009-10
$’000 | | | 2010-11
$’000 | | | 2011-12
$’000 | | | 2012-13
$’000 | | | 2013-14
$’000 | |
Regulation of Regrowth Vegetation | | | 2,700 | | | | 460 | | | | — | | | | — | | | | — | |
The Government is providing increased funding of $3.2 million over two years to implement new laws to protect high value native regrowth vegetation from clearing. This includes $2 million for an industry partnership program to help landholders understand and comply with the new laws and continue to manage their properties responsibly, while contributing to the protection of Queensland’s unique biodiversity.
| | | | | | | | | | | | | | | | | | | | |
| | | 2009-10
$’000 | | | 2010-11
$’000 | | | 2011-12
$’000 | | | 2012-13
$’000 | | | 2013-14
$’000 | |
Enhanced Fire Management Program | | | 880 | | | | — | | | | — | | | | — | | | | — | |
The Government has provided increased funding of $0.88 million in 2009-10 for an enhanced fire management initiative in Queensland National Parks. This program assists in mitigating threats of wildfires to life, property and the environment. The capital component of this initiative can be found in Chapter 3 Capital Measures.
| | | | | | | | | | | | | | | | | | | | |
| | | 2009-10
$’000 | | | 2010-11
$’000 | | | 2011-12
$’000 | | | 2012-13
$’000 | | | 2013-14
$’000 | |
Local Government Sustainable Future Fund | | | — | | | | — | | | | 30,000 | | | | 30,000 | | | | 30,000 | |
The Government will provide additional funding of $120 million over four years commencing 2011-12 for a Local Government Sustainable Future Fund. Funding will be from the industry waste levy revenue. The Local Government Sustainable Future Fund will provide assistance and access by funding local governments for environmental purposes. The capital component of this initiative can be found in Chapter 3 Capital Measures and the revenue component of this initiative can be found in Chapter 4 Revenue Measures.
| | | | |
| 34 | | Budget Measures 2010-11 | | |
| | | | | | | | | | | | | | | | | | | | |
| | | 2009-10
$’000 | | | 2010-11
$’000 | | | 2011-12
$’000 | | | 2012-13
$’000 | | | 2013-14
$’000 | |
NatureAssist Program | | | — | | | | — | | | | 1,000 | | | | 1,000 | | | | 3,200 | |
The Government will provide total funding of $15 million over five years from 2011-12 including an additional $8.4 million to extend the NatureAssist program. This program offers financial incentives to landholders for conservation-focused management on the lands they manage, provided the land is secured by a legally binding nature refuge agreement.
| | | | | | | | | | | | | | | | | | | | |
| | | 2009-10
$’000 | | | 2010-11
$’000 | | | 2011-12
$’000 | | | 2012-13
$’000 | | | 2013-14
$’000 | |
Waste Avoidance and Resource Efficiency Fund | | | — | | | | — | | | | 35,763 | | | | 35,763 | | | | 35,763 | |
The Government will provide additional funding of $143 million over four years commencing in 2011-12 for a Waste Avoidance and Resource Efficiency (WARE) Fund. Funding will be from the industry waste levy revenue. The WARE Fund will be used for waste management related activities including administration, compliance and the roll out of waste management reform programs. A further $15.9 million in revenue to be received over this period has been advanced to 2010-11 to fund the Queensland Waste Reform Strategy Implementation. The capital component of this initiative can be found in Chapter 3 Capital Measures and the revenue component of this initiative can be found in Chapter 4 Revenue Measures.
| | | | |
| | | Budget Measures 2010-11 | | 35 |
Department of Health
| | | | | | | | | | | | | | | | | | | | |
| | | 2009-10
$’000 | | | 2010-11
$’000 | | | 2011-12
$’000 | | | 2012-13
$’000 | | | 2013-14
$’000 | |
National Health and Hospitals Network - Elective Surgery | | | — | | | | 61,000 | | | | 24,100 | | | | 23,800 | | | | 24,000 | |
Funding will be provided by the Australian Government to implement access targets for elective surgery so that 95% of patients waiting for surgery in categories 1 and 2 will be treated within clinically recommended times by December 2014, and category 3 patients by December 2015. The scope of services to be delivered will be determined in ongoing negotiations with the Australian Government. The capital component of this initiative can be found in Chapter 3 Capital Measures.
| | | | | | | | | | | | | | | | | | | | |
| | | 2009-10
$’000 | | | 2010-11
$’000 | | | 2011-12
$’000 | | | 2012-13
$’000 | | | 2013-14
$’000 | |
National Health and Hospitals Network - Emergency Departments | | | — | | | | 30,500 | | | | 20,400 | | | | 20,600 | | | | 31,000 | |
Funding will be provided by the Australian Government to facilitate improved emergency department waiting times and the achievement of a new National Access Target to ensure patients are admitted, deferred or discharged within four hours of presentation to an emergency department, where it is clinically appropriate to do so. The scope of services to be delivered will be determined in ongoing negotiations with the Australian Government. The capital component of this initiative can be found in Chapter 3 Capital Measures.
| | | | |
| 36 | | Budget Measures 2010-11 | | |
| | | | | | | | | | | | | | | | | | | | |
| | | 2009-10
$’000 | | | 2010-11
$’000 | | | 2011-12
$’000 | | | 2012-13
$’000 | | | 2013-14
$’000 | |
James Cook University Dental School Clinical Training | | | — | | | | 24,950 | | | | 12,950 | | | | 3,550 | | | | 3,550 | |
The Government will provide additional funding of $45 million over four years to support the establishment of the James Cook University Dental School. Funding will be provided for dental training clinics on the Cairns and Townsville campuses.
| | | | | | | | | | | | | | | | | | | | |
| | | 2009-10
$’000 | | | 2010-11
$’000 | | | 2011-12
$’000 | | | 2012-13
$’000 | | | 2013-14
$’000 | |
National Health and Hospitals Network - Sub - Acute Care | | | — | | | | 14,900 | | | | 32,400 | | | | 57,800 | | | | 93,900 | |
Funding will be provided by the Australian Government to establish new sub-acute beds in either hospital or community settings. Beds will be utilised for rehabilitation, sub-acute, mental health and/or palliative care. The scope of services to be delivered will be determined in ongoing negotiations with the Australian Government. The capital component of this initiative can be found in Chapter 3 Capital Measures.
| | | | | | | | | | |
| | | 2009-10
$’000 | | 2010-11
$’000 | | 2011-12
$’000 | | 2012-13
$’000 | | 2013-14
$’000 |
Regional Cancer Centres | | — | | 10,390 | | 28,665 | | 70,790 | | 84,673 |
The Government will provide additional funding of $194.5 million over four years to increase access to cancer services through a network of Regional Cancer Centres which will improve outcomes for rural cancer patients. The Regional Cancer Centres will be located in Townsville (with outreach services to Mount Isa), Rockhampton, Bundaberg and Hervey Bay (with outreach services from the Royal Brisbane and Women’s Hospital) and Toowoomba (with outreach services provided by the Princess Alexandra Hospital). The capital component of this initiative can be found hi Chapter 3 Capital Measures.
| | | | |
| | | Budget Measures 2010-11 | | 37 |
| | | | | | | | | | | | | | | | | | | | |
| | | 2009-10
$’000 | | | 2010-11
$’000 | | | 2011-12
$’000 | | | 2012-13
$’000 | | | 2013-14
$’000 | |
Medical Research Assistance | | | — | | | | 7,800 | | | | 7,800 | | | | 7,800 | | | | 7,800 | |
The Government will provide increased funding of $31.2 million over four years to support the Queensland Institute of Medical Research. In addition, Queensland Health will provide $1 million over four years to the Wesley Research Institute.
| | | | | | | | | | | | | | | | | | | | |
| | | 2009-10
$’000 | | | 2010-11
$’000 | | | 2011-12
$’000 | | | 2012-13
$’000 | | | 2013-14
$’000 | |
Children’s Hearing Services | | | — | | | | 5,456 | | | | 3,605 | | | | 3,667 | | | | 3,741 | |
The Government will provide increased funding of $16.5 million over four years to enhance hearing services for children by increasing the number of cochlear implants and access to follow-up therapy. Children with permanent hearing loss, complex needs and/or additional hearing disabilities will receive enhanced access to communication therapies while Indigenous children in Northern Queensland will benefit from enhanced access to therapies through a community development program. Funding will also support the provision of additional auditory-verbal therapy services by the private sector and increased funding for the Hear and Say Centre.
| | | | | | | | | | | | | | | | | | | | |
| | | 2009-10
$’000 | | | 2010-11
$’000 | | | 2011-12
$’000 | | | 2012-13
$’000 | | | 2013-14
$’000 | |
Persistent Pain Strategy | | | — | | | | 2,873 | | | | 11,904 | | | | 12,049 | | | | 12,240 | |
The Government will provide additional funding of $39.1 million over four years to implement the Statewide Persistent Pain Health Services Strategy 2010-15 with the four pilot sites to commence over two years from 2010-11 at the Gold Coast, Townsville, Princess Alexandra and Nambour General Hospitals. The roll-out of additional clinics will be subject to evaluation of the four pilot sites.
| | | | |
| 38 | | Budget Measures 2010-11 | | |
| | | | | | | | | | | | | | | | | | | | |
| | | 2009-10
$’000 | | | 2010-11
$’000 | | | 2011-12
$’000 | | | 2012-13
$’000 | | | 2013-14
$’000 | |
Mental Health Stigma Campaign | | | — | | | | 1,223 | | | | 2,476 | | | | 2,355 | | | | 2,443 | |
The Government will provide additional funding of $8.5 million over four years for a mental health social marketing campaign through state-wide mass advertising, community engagement and education activities to raise awareness of mental health issues.
| | | | | | | | | | | | | | | | | | | | |
| | | 2009-10
$’000 | | | 2010-11
$’000 | | | 2011-12
$’000 | | | 2012-13
$’000 | | | 2013-14
$’000 | |
Sunshine Coast Service Enhancements | | | — | | | | 800 | | | | 26,600 | | | | 42,100 | | | | 42,100 | |
The Government will provide additional funding of $111.6 million over four years to enhance clinical services at the Nambour General Hospital through the development of a cardiac catheterisation laboratory, endoscopy suite and vascular surgery suite, improvements to neurosurgery services, increased access to aero medical retrieval services and purchasing of radiation oncology services from the private sector. Clinical capacity at the Caloundra Hospital Department of Emergency Medicine will be increased to meet rising demand. The capital funding of this initiative can be found in Chapter 3 Capital Measures.
| | | | | | | | | | | | | | | | | | | | |
| | | 2009-10
$’000 | | | 2010-11
$’000 | | | 2011-12
$’000 | | | 2012-13
$’000 | | | 2013-14
$’000 | |
Pandemic (H1N1) Supplementary Funding | | | 6,500 | | | | — | | | | — | | | | — | | | | — | |
The Government provided additional funding of $6.5 million in 2009-10 to supplement the costs incurred in meeting the service delivery requirements imposed by Pandemic (H1N1) 2009. The capital component of this initiative can be found in Chapter 3 Capital Measures.
| | | | |
| | | Budget Measures 2010-11 | | 39 |
| | | | | | | | | | | | | | | | | | | | |
| | | 2009-10
$’000 | | | 2010-11
$’000 | | | 2011-12
$’000 | | | 2012-13
$’000 | | | 2013-14
$’000 | |
Yeppoon - Transfer of Old Hospital Site | | | — | | | | — | | | | — | | | | — | | | | — | |
The Government will transfer the old Yeppoon Hospital site to Rockhampton Regional Council at a cost of up to $2 million.
| | | | |
| 40 | | Budget Measures 2010-11 | | |
Department of Infrastructure and Planning
| | | | | | | | | | | | | | | | | | | | |
| | | 2009-10
$’000 | | | 2010-11
$’000 | | | 2011-12
$’000 | | | 2012-13
$’000 | | | 2013-14
$’000 | |
Yarwun Alumina Refinery | | | — | | | | 8,620 | | | | 2,900 | | | | — | | | | — | |
The Government will provide additional funding of $11.5 million over two years to the Gladstone Ports Corporation under the Yarwun Alumina Refinery - Stage 2 Agreement for the establishment of common user infrastructure such as port infrastructure, dredging and navigational aids at Fisherman’s Landing in Gladstone.
| | | | | | | | | | | | | | | | | | | | |
| | | 2009-10
$’000 | | | 2010-11
$’000 | | | 2011-12
$’000 | | | 2012-13
$’000 | | | 2013-14
$’000 | |
Council Amalgamation Costs | | | 10,720 | | | | 7,581 | | | | — | | | | — | | | | — | |
The Government is providing additional funding of $18.3 million over two years to assist six regional councils with the cost of amalgamating including $0.35 million for North Burnett Regional Council, $1.1 million for South Burnett Regional Council, $2.8 million for Scenic Rim Regional Council, $2.4 million for Southern Downs Regional Council, $4.1 million for Isaac Regional Council and $7.6 million for Torres Strait Island Regional Council.
| | | | | | | | | | | | | | | | | | | | |
| | | 2009-10
$’000 | | | 2010-11
$’000 | | | 2011-12
$’000 | | | 2012-13
$’000 | | | 2013-14
$’000 | |
Mackay Showgrounds | | | — | | | | 5,000 | | | | — | | | | — | | | | — | |
The Government will provide funding of $5 million in 2010-11 to the Mackay Regional Council to enhance the quality of show facilities at the existing Mackay Showgrounds.
| | | | |
| | | Budget Measures 2010-11 | | 41 |
| | | | | | | | | | | | | | | | | | | | |
| | | 2009-10
$’000 | | | 2010-11
$’000 | | | 2011-12
$’000 | | | 2012-13
$’000 | | | 2013-14
$’000 | |
| | | | | |
Toowoomba Aerodrome Upgrade | | | — | | | | 4,700 | | | | — | | | | — | | | | — | |
The Government will allocate funding of $4.7 million in 2010-11 towards an upgrade of Toowoomba Aerodrome which will include extending and upgrading the existing main runway and improving the airport layout to enable improved access for medical, emergency, Passenger and commercial aircraft.
| | | | | | | | | | | | | | | | | | | | |
| | | 2009-10
$’000 | | | 2010-11
$’000 | | | 2011-12
$’000 | | | 2012-13
$’000 | | | 2013-14
$’000 | |
| | | | | |
Smart eDA | | | — | | | | 1,838 | | | | — | | | | — | | | | — | |
The Government will provide additional funding of $1.8 million in 2010-11 for the maintenance and support of the Smart eDA system that allows the electronic preparation and lodgement of planning development, compliance assessment, plumbing and building applications.
| | | | | | | | | | | | | | | | | | | | |
| | | 2009-10
$’000 | | | 2010-11
$’000 | | | 2011-12
$’000 | | | 2012-13
$’000 | | | 2013-14
$’000 | |
| | | | | |
Surat Basin Railway Corridor | | | — | | | | 450 | | | | — | | | | — | | | | — | |
The Government has granted the Surat Basin Railway Joint Venture (SBRJV) an exclusive mandate to develop, up to financial close, a railway from Wandoan to Banana. The Government will initially fund the land acquisition costs of $0.45 million in 2010-11 (related to the rail corridor) which are to be reimbursed by SBRJV. The capital component of this initiative can be found in Chapter 3 Capital Measures.
| | | | |
| 42 | | Budget Measures 2010-11 | | |
| | | | | | | | | | | | | | | | | | | | |
| | | 2009-10
$’000 | | | 2010-11
$’000 | | | 2011-12
$’000 | | | 2012-13
$’000 | | | 2013-14
$’000 | |
ClimateQ: Cleaner Greener Buildings and Climate Ready Infrastructure | | | — | | | | — | | | | — | | | | — | | | | — | |
The Government is providing funding of $1.3 million over four years from the Queensland Climate Change Fund for improving environmental standards for new homes, offices, government buildings and infrastructure.
| | | | |
| | | Budget Measures 2010-11 | | 43 |
Department of Justice and Attorney-General
| | | | | | | | | | | | | | | | | | | | |
| | | 2009-10
$’000 | | | 2010-11
$’000 | | | 2011-12
$’000 | | | 2012-13
$’000 | | | 2013-14
$’000 | |
Legal Aid Services Funding Assistance Package | | | — | | | | 8,975 | | | | 15,096 | | | | 17,449 | | | | 16,485 | |
The Government will fund Legal Aid Queensland (LAQ) to support the provision of legal aid services to vulnerable Queenslanders and to reduce the variability associated with funding these services from interest on solicitors’ trust accounts. Total funding for LAQ is $61 million over four years which also comprises the expense and capital components of LAQ’s Electronic Document Records Management System which can be found in Chapter 2 Expense Measures and Chapter 3 Capital Measures.
| | | | | | | | | | | | | | | | | | | | |
| | | 2009-10
$’000 | | | 2010-11
$’000 | | | 2011-12
$’000 | | | 2012-13
$’000 | | | 2013-14
$’000 | |
Office of the Adult Guardian | | | 750 | | | | 4,665 | | | | 5,200 | | | | 5,200 | | | | 5,200 | |
The Government is providing additional funding to the Office of the Adult Guardian to address increased demand for restrictive practice and guardianship services. The funding will increase the capacity of services provided to vulnerable adults with impaired decision making capability.
| | | | | | | | | | | | | | | | | | | | |
| | | 2009-10
$’000 | | | 2010-11
$’000 | | | 2011-12
$’000 | | | 2012-13
$’000 | | | 2013-14
$’000 | |
Telecommunication Interception - Crime and Misconduct Commission | | | 605 | | | | 3,239 | | | | 3,330 | | | | 3,424 | | | | 3,424 | |
The Government is providing funding to implement a permanent telecommunications interception capability which will be administered by the Crime and Misconduct Commission. Further funding for this initiative can be found in the Department of Police section of this document.
| | | | |
| 44 | | Budget Measures 2010-11 | | |
| | | | | | | | | | | | | | | | | | | | |
| | | 2009-10
$’000 | | | 2010-11
$’000 | | | 2011-12
$’000 | | | 2012-13
$’000 | | | 2013-14
$’000 | |
Industrial Relations - Workplace Health and Safety Queensland | | | — | | | | 2,000 | | | | 2,000 | | | | 2,000 | | | | 2,000 | |
As part of ongoing reforms to workers’ compensation in Queensland, additional funding of $8 million over four years will be provided for implementation of an initiative to reduce the number of work-related fatalities, injuries and disease occurring in Queensland. The initiative will focus on high risk businesses and will involve advice on how to improve injury prevention and rehabilitation and return to work processes.
| | | | | | | | | | | | | | | | | | | | |
| | | 2009-10
$’000 | | | 2010-11
$’000 | | | 2011-12
$’000 | | | 2012-13
$’000 | | | 2013-14
$’000 | |
Queensland Civil and Administrative Tribunal | | | — | | | | 1,525 | | | | 1,525 | | | | 1,525 | | | | 1,525 | |
The Government will provide increased funding of $6.1 million over four years to continue to develop the Queensland Civil and Administrative Tribunal to provide more accessible, convenient and efficient tribunal services to the community.
| | | | | | | | | | | | | | | | | | | | |
| | | 2009-10
$’000 | | | 2010-11
$’000 | | | 2011-12
$’000 | | | 2012-13
$’000 | | | 2013-14
$’000 | |
Sentencing Advisory Council | | | — | | | | 1,300 | | | | 1,800 | | | | 1,800 | | | | 1,800 | |
The Government will provide additional funding of $6.7 million over four years to establish a Sentencing Advisory Council to promote consistency in sentencing, stimulate balanced public debate on sentencing issues and incorporate informed public opinion into the process thereby enhancing public confidence in the system.
| | | | |
| | | Budget Measures 2010-11 | | 45 |
| | | | | | | | | | | | | | | | | | | | |
| | | 2009-10
$’000 | | | 2010-11
$’000 | | | 2011-12
$’000 | | | 2012-13
$’000 | | | 2013-14
$’000 | |
Continuation of the Murri Court | | | 830 | | | | 1,200 | | | | — | | | | — | | | | — | |
The Government is providing funding for the continuation of the Murri Court to 30 June 2011. The Murri Court program was established to address the over-representation of Indigenous offenders in prison and juvenile detention. Funding for other programs under this initiative can be found in the Department of Communities section of this document.
| | | | | | | | | | | | | | | | | | | | |
| | | 2009-10
$’000 | | | 2010-11
$’000 | | | 2011-12
$’000 | | | 2012-13
$’000 | | | 2013-14
$’000 | |
Crime and Misconduct Commission | | | — | | | | 1,000 | | | | 1,000 | | | | 1,000 | | | | 1,000 | |
The Government will provide increased funding of $4 million over four years to support the important work of the Crime and Misconduct Commission (CMC). The funding will allow the CMC to allocate additional resources for public policy research, the forensic computing unit, complaints, training and development and to address the increased activity in proceeds of crime.
| | | | | | | | | | | | | | | | | | | | |
| | | 2009-10
$’000 | | | 2010-11
$’000 | | | 2011-12
$’000 | | | 2012-13
$’000 | | | 2013-14
$’000 | |
Queensland Indigenous Alcohol Diversion Pilot Program | | | — | | | | 800 | | | | — | | | | — | | | | — | |
The Government will provide funding for the continuation of the Queensland Indigenous Alcohol Diversion Pilot Program from 1 July 2010 to 30 June 2011. Funding for other programs under this initiative can be found in the Department of Communities section of this document.
| | | | |
| 46 | | Budget Measures 2010-11 | | |
| | | | | | | | | | | | | | | | | | | | |
| | | 2009-10
$’000 | | | 2010-11
$’000 | | | 2011-12
$’000 | | | 2012-13
$’000 | | | 2013-14
$’000 | |
Establishment Costs for Electronic Document Records Management System - Legal Aid Queensland | | | — | | | | 655 | | | | 715 | | | | — | | | | — | |
The Government will provide funding to Legal Aid Queensland for the development of an Electronic Document Records Management System. This is part of the total funding of $61 million over four years. The capital component of this initiative can be found in Chapter 3 Capital Measures and the remaining expense component of the total funding can be found in Chapter 2 Expense Measures (Legal Aid Services Funding Assistance Package).
| | | | | | | | | | | | | | | | | | | | |
| | | 2009-10
$’000 | | | 2010-11
$’000 | | | 2011-12
$’000 | | | 2012-13
$’000 | | | 2013-14
$’000 | |
State Penalties Enforcement Registry - Wheel Clamping Trial | | | 470 | | | | 574 | | | | — | | | | — | | | | — | |
The Government is providing additional funding to develop and implement new wheel clamping enforcement activities. This funding will allow the department to manage increased demand for services by the State Penalties Enforcement Registry.
| | | | | | | | | | | | | | | | | | | | |
| | | 2009-10
$’000 | | | 2010-11
$’000 | | | 2011-12
$’000 | | | 2012-13
$’000 | | | 2013-14
$’000 | |
Office of the Director of Public Prosecutions - Additional Professional Legal Staff | | | — | | | | 460 | | | | 460 | | | | 460 | | | | 460 | |
Increased funding of $1.8 million over four years will be provided from 2010-11 for additional professional legal staff in the Office of the Director of Public Prosecutions located at Ipswich, Brisbane and Cairns.
| | | | |
| | | Budget Measures 2010-11 | | 47 |
| | | | | | | | | | | | | | | | | | | | |
| | | 2009-10
$’000 | | | 2010-11
$’000 | | | 2011-12
$’000 | | | 2012-13
$’000 | | | 2013-14
$’000 | |
Industrial Relations Reforms - Funding Retention | | | — | | | | (7,000 | ) | | | (7,000 | ) | | | (7,000 | ) | | | (8,500 | ) |
This saving is generated by the Industrial Relations Reforms and is being reallocated to fund high priority initiatives including the Queensland Civil and Administrative Tribunal, the Sentencing Advisory Council and the Office of the Adult Guardian.
| | | | |
| 48 | | Budget Measures 2010-11 | | |
Department of Police
| | | | | | | | | | | | | | | | | | | | |
| | | 2009-10
$’000 | | | 2010-11
$’000 | | | 2011-12
$’000 | | | 2012-13
$’000 | | | 2013-14
$’000 | |
Telecommunication Interception | | | 2,604 | | | | 7,617 | | | | 7,596 | | | | 7,925 | | | | 7,925 | |
The Government is providing additional funding of $33.7 million over five years for a permanent Telecommunication Interception (TI) capability which will enable the Queensland Police Service (QPS) to monitor a wider variety of communication means used for criminal activity. TI is particularly effective for investigations into major illicit drug trafficking and other commodity-based criminal markets and could be a key source of information for management decisions about protracted and complex criminal investigations and tactically dangerous operations. Additional funding has also been reprioritised by the QPS internally to fund this initiative.
| | | | | | | | | | | | | | | | | | | | |
| | | 2009-10
$’000 | | | 2010-11
$’000 | | | 2011-12
$’000 | | | 2012-13
$’000 | | | 2013-14
$’000 | |
Weapons Licensing System | | | — | | | | 6,949 | | | | 1,567 | | | | 1,412 | | | | 1,266 | |
The Government will provide additional funding of $11.2 million over four years for a new Weapons Licensing System (WLS) which will support changes to QPS business processes and the new Weapons Bill 2010. The new WLS will allow the QPS to provide a greatly improved management, licensing and registration service to the licensees of Queensland and will significantly improve customer service through the introduction of on-line payments and applications processing.
| | | | |
| | | Budget Measures 2010-11 | | 49 |
| | | | | | | | | | | | | | | | | | | | |
| | | 2009-10
$’000 | | | 2010-11
$’000 | | | 2011-12
$’000 | | | 2012-13
$’000 | | | 2013-14
$’000 | |
One Punch Can Kill Campaign | | | 300 | | | | 400 | | | | — | | | | — | | | | — | |
The Government is providing increased funding of $0.7 million over two years to continue this state-wide assault reduction campaign. State-wide campaign advertising is planned to occur from September 2010 school holidays and will continue during peak periods where youth assault is more prevalent. This includes Schoolies Week, the 2010-2011 Christmas and New Year period, through to Easter 2011.
| | | | | | | | | | | | | | | | | | | | |
| | | 2009-10
$’000 | | | 2010-11
$’000 | | | 2011-12
$’000 | | | 2012-13
$’000 | | | 2013-14
$’000 | |
Security Providers Fingerprinting | | | — | | | | — | | | | — | | | | — | | | | — | |
The QPS will provide for expenditure of up to $1 million annually for a 2008 Council of Australian Governments’ agreement requiring each State and Territory to introduce mandatory fingerprinting to assist in initial and ongoing probity checking of people working in the private security industry.
| | | | | | | | | | | | | | | | | | | | |
| | | 2009-10
$’000 | | | 2010-11
$’000 | | | 2011-12
$’000 | | | 2012-13
$’000 | | | 2013-14
$’000 | |
Targeted Liquor Related Enforcement Initiative | | | 1,584 | | | | — | | | | — | | | | — | | | | — | |
The Government provided additional funding of $1.6 million to enable an increased policing presence in entertainment ‘hot spots’ across the State during the 2009-10 Christmas and New Year period. This funding provided an additional 16,000 hours of police enforcement for targeting alcohol-fuelled violence and anti-social behaviour. The blitz targeted locations such as: Brisbane CBD, Fortitude Valley, Gold Coast, Sunshine Coast, Airlie Beach, Whitsundays, Mackay, Townsville, Cairns and communities where Alcohol Management Plans are in place. The Government will consider arrangements for the 2010 Christmas and New Year period as part of the Mid Year Review and in the context of the recent Parliamentary Inquiry.
| | | | |
| 50 | | Budget Measures 2010-11 | | |
Department of Public Works
| | | | | | | | | | | | | | | | | | | | |
| | | 2009-10
$’000 | | | 2010-11
$’000 | | | 2011-12
$’000 | | | 2012-13
$’000 | | | 2013-14
$’000 | |
ICT Investment Fund | | | — | | | | 5,000 | | | | 5,000 | | | | 5,000 | | | | — | |
The Government will provide funding of $15 million over three years to establish a fund that will invest in whole-of-Government ICT initiatives that generate savings for government or establish technology platforms that provide for improved government service delivery. Areas of priority interest include network rationalisation, mobile and radio communications, desktop management and data storage management.
| | | | | | | | | | | | | | | | | | | | |
| | | 2009-10
$’000 | | | 2010-11
$’000 | | | 2011-12
$’000 | | | 2012-13
$’000 | | | 2013-14
$’000 | |
Procurement Process Reform Initiative | | | — | | | | 5,000 | | | | — | | | | — | | | | — | |
The Government will provide funding of $5 million in 2010-11 towards the commencement of a Procurement Process Reform Initiative. This initiative involves the development of a whole-of-Government e-procurement system which will facilitate the establishment of standardised key procurement functionality across Government.
| | | | | | | | | | | | | | | | | | | | |
| | | 2009-10
$’000 | | | 2010-11
$’000 | | | 2011-12
$’000 | | | 2012-13
$’000 | | | 2013-14
$’000 | |
Smart Service Queensland | | | — | | | | 4,840 | | | | — | | | | — | | | | — | |
The Government will provide additional funding of $4.8 million in 2010-11 to support the operations of Smart Service Queensland. In addition, capital funding of $0.16 million has been provided.
| | | | |
| | | Budget Measures 2010-11 | | 51 |
| | | | | | | | | | | | | | | | | | | | |
| | | 2009-10
$’000 | | | 2010-11
$’000 | | | 2011-12
$’000 | | | 2012-13
$’000 | | | 2013-14
$’000 | |
QBuild Community Service Obligation | | | — | | | | 2,733 | | | | — | | | | — | | | | — | |
The Government will provide additional funding of $2.7 million in 2010-11 to QBuild for the apprentice training program to support apprentices employed in excess of the industry standard of apprentice to tradesperson ratio.
| | | | | | | | | | | | | | | | | | | | |
| | | 2009-10
$’000 | | | 2010-11
$’000 | | | 2011-12
$’000 | | | 2012-13
$’000 | | | 2013-14
$’000 | |
GovNet Core Operations | | | — | | | | 2,540 | | | | — | | | | — | | | | — | |
The Government will provide funding of $2.5 million in 2010-11 to CITEC for the support of the core operations of GovNet which is a whole-of-Government portal for government agencies which enables service delivery to the community. The total additional funding in 2010-11 is $3.5 million, including capital funding of $0.92 million. The capital component of this initiative can be found in Chapter 3 Capital Measures.
| | | | | | | | | | | | | | | | | | | | |
| | | 2009-10
$’000 | | | 2010-11
$’000 | | | 2011-12
$’000 | | | 2012-13
$’000 | | | 2013-14
$’000 | |
Rockhampton Riverbank Redevelopment - Stage II | | | — | | | | 2,500 | | | | 2,500 | | | | — | | | | — | |
The Government will commence design works on Riverbank Stage II in Rockhampton in 2010-11. An allocation of $5 million over two years has been set aside towards a swimming facility. The design of this project will be incorporated into the Riverbank Stage II program.
| | | | |
| 52 | | Budget Measures 2010-11 | | |
Department of the Premier and Cabinet
| | | | | | | | | | | | | | | | | | | | |
| | | 2009-10
$’000 | | | 2010-11
$’000 | | | 2011-12
$’000 | | | 2012-13
$’000 | | | 2013-14
$’000 | |
2018 Gold Coast Commonwealth Games Bid | | | 2,501 | | | | 6,237 | | | | 2,102 | | | | — | | | | — | |
The Government is providing additional funding of $10.8 million over three years to develop a bid to secure the 2018 Commonwealth Games for the Gold Coast.
| | | | | | | | | | | | | | | | | | | | |
| | | 2009-10
$’000 | | | 2010-11
$’000 | | | 2011-12
$’000 | | | 2012-13
$’000 | | | 2013-14
$’000 | |
Major Exhibitions | | | 2,000 | | | | 3,600 | | | | 2,500 | | | | 3,000 | | | | 3,000 | |
The Government is providing additional funding of $14.1 million over five years to the Queensland Art Gallery to secure future major exhibitions and to deliver exhibitions at the Gallery of Modern Art. The attraction of major cultural tourism events provides economic benefits for Queensland.
| | | | | | | | | | | | | | | | | | | | |
| | | 2009-10
$’000 | | | 2010-11
$’000 | | | 2011-12
$’000 | | | 2012-13
$’000 | | | 2013-14
$’000 | |
Cairns Cultural Precinct | | | — | | | | 2,500 | | | | — | | | | — | | | | — | |
The Government will contribute $2.5 million for the detailed planning study for the Cairns Cultural Precinct as well as some $40 million worth of land as a major contribution to the project. The Government is committed to further financially supporting the development of the precinct, in partnership with the Cairns Regional Council and the Australian Government.
| | | | |
| | | Budget Measures 2010-11 | | 53 |
| | | | | | | | | | | | | | | | | | | | |
| | | 2009-10
$’000 | | | 2010-11
$’000 | | | 2011-12
$’000 | | | 2012-13
$’000 | | | 2013-14
$’000 | |
Business Events Tourism Initiative | | | — | | | | 2,000 | | | | 4,000 | | | | 4,000 | | | | 4,000 | |
The Government will provide additional funding of $14 million over four years to Queensland Events Corporation Pty Ltd for the seven Convention Bureaus in Queensland to support the new Business Events Tourism initiative.
| | | | | | | | | | | | | | | | | | | | |
| | | 2009-10
$’000 | | | 2010-11
$’000 | | | 2011-12
$’000 | | | 2012-13
$’000 | | | 2013-14
$’000 | |
Regional Arts Infrastructure | | | — | | | | 1,000 | | | | 1,000 | | | | 1,000 | | | | 1,000 | |
The Government will provide additional funding of $4 million over four years for regional arts infrastructure projects including upgrades to facilities and equipment in performing arts venues, galleries, museums and Indigenous art centres outside of South East Queensland.
| | | | | | | | | | | | | | | | | | | | |
| | | 2009-10
$’000 | | | 2010-11
$’000 | | | 2011-12
$’000 | | | 2012-13
$’000 | | | 2013-14
$’000 | |
art+place Public Art Program | | | — | | | | 1,000 | | | | 3,000 | | | | 3,000 | | | | 3,000 | |
The Government will provide additional funding of $10 million over four years for the art+place Public Art Program. This program commissions public art projects which enliven public spaces across all regions of Queensland and create jobs for Queensland artists and the associated art community.
| | | | |
| 54 | | Budget Measures 2010-11 | | |
| | | | | | | | | | | | | | | | | | | | |
| | | 2009-10
$’000 | | | 2010-11
$’000 | | | 2011-12
$’000 | | | 2012-13
$’000 | | | 2013-14
$’000 | |
Securing Major Events | | | — | | | | 1,000 | | | | 1,000 | | | | 1,000 | | | | 600 | |
The Government will provide increased funding of $3.6 million over four years to Queensland Events Corporation Pty Ltd to secure, enhance and develop major Queensland events.
| | | | | | | | | | | | | | | | | | | | |
| | | 2009-10
$’000 | | | 2010-11
$’000 | | | 2011-12
$’000 | | | 2012-13
$’000 | | | 2013-14
$’000 | |
Reef Water Quality Protection Plan | | | — | | | | 804 | | | | 838 | | | | 870 | | | | 880 | |
The Government will provide increased funding of $3.4 million over four years for the continued implementation of the Reef Water Quality Protection Plan. The objectives of the plan are to reduce pollutants such as sediments, nutrients and pesticides entering the Great Barrier Reef and to restore and conserve wetlands and riverbanks.
| | | | | | | | | | | | | | | | | | | | |
| | | 2009-10
$’000 | | | 2010-11
$’000 | | | 2011-12
$’000 | | | 2012-13
$’000 | | | 2013-14
$’000 | |
Cairns Indigenous Art Fair | | | 600 | | | | 600 | | | | — | | | | — | | | | — | |
The Government is providing increased funding of $1.2 million over two years for the 2010 and 2011 Cairns Indigenous Art Fairs. This investment will showcase leading Indigenous artists and provide new opportunities for emerging artists.
| | | | | | | | | | | | | | | | | | | | |
| | | 2009-10
$’000 | | | 2010-11
$’000 | | | 2011-12
$’000 | | | 2012-13
$’000 | | | 2013-14
$’000 | |
Ideas Festival | | | — | | | | 600 | | | | — | | | | 600 | | | | — | |
The Government will provide increased funding of $1.2 million for the delivery of the Ideas Festivals in 2011 and 2013. This public event will enable the community to engage on topical issues with expert speakers and to participate in workshops.
| | | | |
| | | Budget Measures 2010-11 | | 55 |
| | | | | | | | | | | | | | | | | | | | |
| | | 2009-10
$’000 | | | 2010-11
$’000 | | | 2011-12
$’000 | | | 2012-13
$’000 | | | 2013-14
$’000 | |
Growth Management Summit | | | 1,320 | | | | — | | | | — | | | | — | | | | — | |
The Government has provided additional funding of $1.3 million for the 2010 Growth Management Summit and the development of strategies aimed at responding to the growth challenges in South East Queensland.
| | | | | | | | | | | | | | | | | | | | |
| | | 2009-10
$’000 | | | 2010-11
$’000 | | | 2011-12
$’000 | | | 2012-13
$’000 | | | 2013-14
$’000 | |
Integrity and Accountability Reforms | | | 445 | | | | — | | | | — | | | | — | | | | — | |
The Government has provided additional funding of $0.45 million in 2009-10 to implement the State’s Integrity Policy. Implementation of the policy included the development of legislation, upgrading the Queensland Register of Lobbyists website and the introduction of a People’s Question Time.
| | | | |
| 56 | | Budget Measures 2010-11 | | |
Department of Transport and Main Roads
| | | | | | | | | | | | | | | | | | | | |
| | | 2009-10
$’000 | | | 2010-11
$’000 | | | 2011-12
$’000 | | | 2012-13
$’000 | | | 2013-14
$’000 | |
Enhanced Public Transport Services | | | 34,500 | | | | 103,700 | | | | 109,922 | | | | 116,517 | | | | 123,508 | |
The Government will allocate additional funding of $488.1 million over five years for the provision of public transport services in South East Queensland. The funding includes approved network growth for South East Queensland that incorporates committed network growth for rail and ferries, 375 buses over three years for South East Queensland and additional funding for private bus operators and depots.
| | | | | | | | | | | | | | | | | | | | |
| | | 2009-10
$’000 | | | 2010-11
$’000 | | | 2011-12
$’000 | | | 2012-13
$’000 | | | 2013-14
$’000 | |
New Queensland Driver Licence | | | 10,700 | | | | 58,900 | | | | 47,300 | | | | 48,700 | | | | 51,300 | |
The Government is allocating funding of $216.9 million over five years towards the New Queensland Driver Licence. These funds will be used for the provision of new products to replace laminated driver licences and other existing laminated products currently issued by the Department of Transport and Main Roads. The capital and revenue components of this initiative can be found in Chapter 3 Capital Measures and Chapter 4 Revenue Measures.
| | | | |
| | | Budget Measures 2010-11 | | 57 |
| | | | | | | | | | | | | | | | | | | | |
| | | 2009-10
$’000 | | | 2010-11
$’000 | | | 2011-12
$’000 | | | 2012-13
$’000 | | | 2013-14
$’000 | |
Safer Roads Sooner | | | — | | | | 33,500 | | | | — | | | | — | | | | — | |
|
| The Government will allocate funding of $33.5 million in 2010-11 from the Camera Detected Offence Program revenue to the Safer Roads Sooner (SRS) package to address black spots on the State road network. SRS targets road safety improvements at locations with a high severity accident history. It is a major component of the Government’s commitment to addressing the road toll and reducing the number of people who sustain serious injuries in road crashes. | |
| | | | | |
| | | 2009-10
$’000 | | | 2010-11
$’000 | | | 2011-12
$’000 | | | 2012-13
$’000 | | | 2013-14
$’000 | |
Transport Service Contract (Rail Infrastructure) | | | 11,668 | | | | 20,731 | | | | 30,021 | | | | 40,494 | | | | 40,494 | |
|
| The Government is allocating additional funding of $143.4 million over five years to address the requirements of the current Transport Service Contract (Rail Infrastructure) to 2012-13. The Transport Service Contract (Rail Infrastructure) framework provides the basis for delivering the Government’s rail transport outcomes for Queensland. | |
| | | | | |
| | | 2009-10
$’000 | | | 2010-11
$’000 | | | 2011-12
$’000 | | | 2012-13
$’000 | | | 2013-14
$’000 | |
Road Safety Public Education Program | | | 3,551 | | | | 12,857 | | | | — | | | | — | | | | — | |
The Government is allocating funding of $16.4 million over two years towards road safety education programs and additional processing costs associated with the Camera Detected Offences Program. The safety education and awareness programs include campaign activity for drink driving, seatbelts, ongoing regional road safety communications and motorbikes public education. The Government will undertake new and necessary behavioural campaign activity for a back to basics campaign comprising sharing the road and road rules and to develop a campaign encouraging drivers to choose safer vehicles.
| | | | |
| 58 | | Budget Measures 2010-11 | | |
| | | | | | | | | | | | | | | | | | | | |
| | | 2009-10
$’000 | | | 2010-11
$’000 | | | 2011-12
$’000 | | | 2012-13
$’000 | | | 2013-14
$’000 | |
Taxi Subsidy Scheme | | | 2,299 | | | | 10,000 | | | | 10,720 | | | | 11,472 | | | | 12,258 | |
|
| The Government is allocating additional funding of $46.7 million over five years to the Taxi Subsidy Scheme to ensure mobility for eligible Queenslanders with physical and/or intellectual impairments. This additional funding will ensure the continuity of transport services to more than 48,500 Taxi Subsidy Scheme members. Growth in the scheme continues to rise based on an ageing population, an increase in Queenslanders with mobility impairments and annual increases in the cost of taxi fares. | |
| | | | | |
| | | 2009-10
$’000 | | | 2010-11
$’000 | | | 2011-12
$’000 | | | 2012-13
$’000 | | | 2013-14
$’000 | |
Improve Go Card Availability | | | 1,155 | | | | 4,545 | | | | — | | | | — | | | | — | |
|
| The Government is allocating $5.7 million over two years to roll out approximately 400,000 Go Cards with $10 credit available upon registration as well as the roll out of up to 23 new Go Card add-value vending machines at priority busway stations and major transport interchanges. This will dramatically increase the availability of the Go Card. The capital component of this initiative can be found in Chapter 3 Capital Measures. | |
| | | | | |
| | | 2009-10
$’000 | | | 2010-11
$’000 | | | 2011-12
$’000 | | | 2012-13
$’000 | | | 2013-14
$’000 | |
Regional Air and Long Distance Coach Services | | | 2,816 | | | | 2,690 | | | | 2,785 | | | | 2,882 | | | | 2,983 | |
The Government is allocating additional funding of $14.2 million over five years to meet its commitment to support air and long distance coach services in rural and remote Queensland.
| | | | |
| | | Budget Measures 2010-11 | | 59 |
| | | | | | | | | | | | | | | | | | | | |
| | | 2009-10
$’000 | | | 2010-11
$’000 | | | 2011-12
$’000 | | | 2012-13
$’000 | | | 2013-14
$’000 | |
Natural Disaster Relief and Recovery Supplementation | | | 37,720 | | | | — | | | | — | | | | — | | | | — | |
During January to March 2009, monsoonal flooding and Tropical Cyclones Charlotte and Ellie had a significant impact in regional areas in Northern and Central Queensland. These storm and flooding events caused significant damage to the road network in regional Queensland. Natural Disaster Relief and Recovery Arrangements involve agencies sharing the costs of disaster relief and recovery activities. Given the scale of damage, the Government allocated additional funding of $37.7 million to reduce the share of costs contributed by the Department of Transport and Main Roads under the standing arrangements. Overall, Queensland is expected to spend over $700 million on Natural Disaster Relief and Recovery Arrangements in 2009-10.
| | | | | | | | | | | | | | | | | | | | |
| | | 2009-10
$’000 | | | 2010-11
$’000 | | | 2011-12
$’000 | | | 2012-13
$’000 | | | 2013-14
$’000 | |
Safety Program | | | — | | | | — | | | | — | | | | — | | | | — | |
The Government will allocate funding of $62 million over four years for essential asset maintenance and preservation works. This funding for critical safety and maintenance works will generate widespread benefits in terms of employment generation and productivity improvements. This will be funded from the existing roads and transport program.
| | | | | | | | | | | | | | | | | | | | |
| | | 2009-10
$’000 | | | 2010-11
$’000 | | | 2011-12
$’000 | | | 2012-13
$’000 | | | 2013-14
$’000 | |
ClimateQ - Green Transport Initiatives | | | — | | | | — | | | | — | | | | — | | | | — | |
The Government is allocating $5.9 million over five years as part of the Climate Q initiative. These funds will be used for a low emission bus trial, initiatives designed to ‘green’ the taxi fleet and the establishment of a vehicle offset contribution scheme.
| | | | |
| 60 | | Budget Measures 2010-11 | | |
| | | | | | | | | | | | | | | | | | | | |
| | | 2009-10
$’000 | | | 2010-11
$’000 | | | 2011-12
$’000 | | | 2012-13
$’000 | | | 2013-14
$’000 | |
Free Flow Tolling Costs | | | 2,093 | | | | — | | | | — | | | | — | | | | — | |
The Government allocated funding of $2.1 million in 2009-10 to cover increased costs for the issue of penalty infringement notices and associated enforcement action for unpaid tolls on Queensland Motorways Limited tollways following the introduction of free flow tolling in July 2009.
| | | | | | | | | | | | | | | | | | | | |
| | | 2009-10
$’000 | | | 2010-11
$’000 | | | 2011-12
$’000 | | | 2012-13
$’000 | | | 2013-14
$’000 | |
Q Connect | | | 2,412 | | | | — | | | | — | | | | — | | | | — | |
The Government allocated additional funding of $2.4 million in 2009-10 for a number of regional public transport issues including funding for additional services.
| | | | | | | | | | | | | | | | | | | | |
| | | 2009-10
$’000 | | | 2010-11
$’000 | | | 2011-12
$’000 | | | 2012-13
$’000 | | | 2013-14
$’000 | |
Station Renovation | | | — | | | | — | | | | — | | | | — | | | | — | |
The Government will allocate funding of $20 million in 2010-11 towards improving the rail station environment to improve the ambience and comfort of passengers arriving, using and departing the nominated station. Refresh works will comprise a combination of painting, minor capital improvements (e.g. LCD information screens, platform furniture, tactile and amenity upgrades), renewal and updating of way-finding signage and improved safety and security. Nominated stations are spread across the network and take account of passenger demand, asset condition and other pending capital programs on the network. This will be funded from the existing roads and transport program.
| | | | |
| | | Budget Measures 2010-11 | | 61 |
| | | | | | | | | | | | | | | | | | | | |
| | | 2009-10
$’000 | | | 2010-11
$’000 | | | 2011-12
$’000 | | | 2012-13
$’000 | | | 2013-14
$’000 | |
Sustainable Resource Communities Funding - Roma Airport Upgrade | | | — | | | | — | | | | — | | | | — | | | | — | |
The Government will allocate funding of $4.7 million in 2010-11 towards an upgrade of Roma Airport which will include the runway, terminal, car park, security fencing, access road and work to enable access by larger aircraft with further contributions to come from Council and industry.
| | | | | | | | | | | | | | | | | | | | |
| | | 2009-10
$’000 | | | 2010-11
$’000 | | | 2011-12
$’000 | | | 2012-13
$’000 | | | 2013-14
$’000 | |
Townsville Marine Precinct | | | 114,909 | | | | — | | | | — | | | | — | | | | — | |
The Government allocated funding of $114.9 million in 2009-10 for the Townsville Marine Precinct Project which will be designed to accommodate all upstream lessees in Ross River impacted by the Townsville Port Access Road. This allocation of $114.9 million is inclusive of a $34.5 million income tax expense. The net allocation of $80.4 million together with $15.5 million in Port of Townsville Limited borrowings comprise the project’s total estimated cost of $95.9 million. This initiative complements the Townsville Cruise and Military Ship Terminal, which the State is seeking to facilitate in partnership with the Australian Government and Townsville Regional Council.
| | | | |
| 62 | | Budget Measures 2010-11 | | |
Electoral Commission of Queensland
| | | | | | | | | | | | | | | | | | | | |
| | | 2009-10
$’000 | | | 2010-11
$’000 | | | 2011-12
$’000 | | | 2012-13
$’000 | | | 2013-14
$’000 | |
Joint Electoral Roll Arrangement and Funding and Disclosure Initiatives | | | 578 | | | | 632 | | | | 718 | | | | 805 | | | | 822 | |
The Government will provide additional funding of $3.6 million over five years for the Joint Electoral Roll Arrangement between the Australian Government and the State to correct an imbalance between the funding provided and the fee charged for the service by the Australian Government. The funding will also enable the Commission to employ additional resources to assist stakeholders to understand and comply with the new funding and disclosure provisions of the Electoral Act 1992.
| | | | |
| | | Budget Measures 2010-11 | | 63 |
Legislative Assembly of Queensland
| | | | | | | | | | | | | | | | | | | | |
| | | 2009-10
$’000 | | | 2010-11
$’000 | | | 2011-12
$’000 | | | 2012-13
$’000 | | | 2013-14
$’000 | |
Broadcast of Parliament Stage 3 | | | — | | | | 144 | | | | 144 | | | | 144 | | | | 144 | |
The Government will provide ongoing additional funding of $0.14 million each year to deliver the third phase of the Broadcast of Parliament initiative. Enhancements will include the capture, storage and delivery of on-demand archived audiovisual material of Parliamentary sittings over the Internet and the capture and short-term storage of broadcast quality archive material for use by Members and other stakeholders. The capital component of this initiative can be found in Chapter 3 Capital Measures.
| | | | |
| 64 | | Budget Measures 2010-11 | | |
Public Service Commission
| | | | | | | | | | | | | | | | | | | | |
| | | 2009-10
$’000 | | | 2010-11
$’000 | | | 2011-12
$’000 | | | 2012-13
$’000 | | | 2013-14
$’000 | |
Integrity and Accountability Reforms | | | 878 | | | | 1,118 | | | | 812 | | | | 844 | | | | 876 | |
The Government has provided additional ongoing funding to support the expanded role of the Integrity Commissioner and to establish an Ethical Standards Branch. Queensland’s Integrity Commissioner will have a range of new responsibilities including overseeing the new Queensland Register of Lobbyists and providing Members of Parliament with advice on potential conflicts of interest. The Ethical Services Branch will be responsible for implementing a variety of measures in the integrity reform process, including creating a single code of conduct for the public sector and co-ordinating sector wide mandatory annual training in ethical decision making.
| | | | | | | | | | | | | | | | | | | | |
| | | 2009-10
$’000 | | | 2010-11
$’000 | | | 2011-12
$’000 | | | 2012-13
$’000 | | | 2013-14
$’000 | |
State of the Service Report | | | 112 | | | | 285 | | | | 293 | | | | 304 | | | | 315 | |
The Government has provided additional ongoing funding for the production of an authoritative annual State of the Service Report to provide an ongoing assessment of the public service.
| | | | |
| | | Budget Measures 2010-11 | | 65 |
Treasury Department
| | | | | | | | | | | | | | | | | | | | |
| | | 2009-10
$’000 | | | 2010-11
$’000 | | | 2011-12
$’000 | | | 2012-13
$’000 | | | 2013-14
$’000 | |
Commercial Transaction Costs | | | 63,999 | | | | 121,486 | | | | — | | | | — | | | | — | |
Treasury is the lead agency for the Government’s infrastructure reform and asset sales program. The Government is providing funding of $185.5 million over two years for the costs of the program. These costs include services provided by commercial, legal, accounting, tax and other technical advisors. Funding in 2010-11 also includes costs associated with the Queensland Rail Initial Public Offering.
| | | | | | | | | | | | | | | | | | | | |
| | | 2009-10
$’000 | | | 2010-11
$’000 | | | 2011-12
$’000 | | | 2012-13
$’000 | | | 2013-14
$’000 | |
Regional First Home Owner Grant Boost | | | — | | | | 7,800 | | | | — | | | | — | | | | — | |
The Government will provide additional funding of $7.8 million in 2010-11 to introduce a $4,000 boost to the First Home Owner Grant for people building or buying newly constructed homes outside South East Queensland. This incentive, to apply from 1 June 2010 until 30 June 2011, is designed to encourage overseas and interstate migrants, as well as the resident population, to settle in regional areas and will assist in managing Queensland’s population growth.
| | | | | | | | | | | | | | | | | | | | |
| | | 2009-10
$’000 | | | 2010-11
$’000 | | | 2011-12
$’000 | | | 2012-13
$’000 | | | 2013-14
$’000 | |
Business Regulation and Competition Reform | | | 4,779 | | | | 3,444 | | | | — | | | | — | | | | — | |
The Government is providing additional funding of $8.2 million over two years to facilitate the implementation of the Council of Australian Governments’ business regulation and competition reform initiative across Government. The initiative forms part of the National Partnership Agreement to Deliver a Seamless Economy which aims to deliver more consistent regulation across Australia and reduce compliance costs on business and restrictions on competition. Both the Queensland and Australian Governments are working closely to establish a national licensing body, a national e-conveyancing company and national business on-line services.
| | | | |
| 66 | | Budget Measures 2010-11 | | |
| | | | | | | | | | | | | | | | | | | | |
| | | 2009-10
$’000 | | | 2010-11
$’000 | | | 2011-12
$’000 | | | 2012-13
$’000 | | | 2013-14
$’000 | |
Queensland Competition Authority - Rural Water Regulation | | | — | | | | 3,000 | | | | — | | | | — | | | | — | |
|
| The Government will provide increased funding of $3 million in 2010-11 to the Queensland Competition Authority to reflect its increasing responsibilities, including the pricing review for Sun Water. | |
| | | | | |
| | | 2009-10
$’000 | | | 2010-11
$’000 | | | 2011-12
$’000 | | | 2012-13
$’000 | | | 2013-14
$’000 | |
Promoting Participation in the 2011 National Census | | | — | | | | 637 | | | | 1,983 | | | | 369 | | | | — | |
|
| The National Census of Population and Housing, conducted every five years, is a vital source of detailed information for policy and planning at the State and National levels. The Government will provide funding of $3 million over three years to promote participation in the Census particularly in remote and Indigenous communities and for the purchase and utilisation of the Census data set. | |
| | | | | |
| | | 2009-10
$’000 | | | 2010-11
$’000 | | | 2011-12
$’000 | | | 2012-13
$’000 | | | 2013-14
$’000 | |
First Home Owner Grant Eligibility Cap | | | (400 | ) | | | (1,600 | ) | | | (1,672 | ) | | | (1,747 | ) | | | (1,826 | ) |
Eligibility for the First Home Owner Grant scheme has been restricted to homes valued at less than $750,000 for all contracts entered into from 31 March 2010. This lowering of the cap from the previous $1 million threshold provides greater targeting of the grant to first home buyers requiring assistance to enter the property market. Savings from this initiative are assisting in funding the Regional First Home Owners Grant Boost.
| | | | |
| | | Budget Measures 2010-11 | | 67 |
Intentionally Left Bank
| | | | |
| 68 | | Budget Measures 2010-11 | | |
3. CAPITAL MEASURES
Introduction
The following tables present the relevant portfolio capital measures relating to decisions taken since the 2009-10 Budget. This does not represent the full amount of additional funding provided to agencies since the 2009-10 Budget. For further explanation, refer to Explanation of Scope and Terms in Chapter 1.
| | | | |
| | | Budget Measures 2010-11 | | 69 |
Department of Communities
| | | | | | | | | | | | | | | | | | | | |
| | | 2009-10
$’000 | | | 2010-11
$’000 | | | 2011-12
$’000 | | | 2012-13
$’000 | | | 2013-14
$’000 | |
Townsville 400 - V8 Supercars | | | 420 | | | | 630 | | | | — | | | | — | | | | — | |
The Government is providing increased funding of $1.1 million over two years from 2009-10 to Townsville City Council for a pedestrian bridge and improved public amenities for the Townsville 400 V8 Supercars event.
| | | | | | | | | | | | | | | | | | | | |
| | | 2009-10
$’000 | | | 2010-11
$’000 | | | 2011-12
$’000 | | | 2012-13
$’000 | | | 2012-14
$’000 | |
Sustainable Resource Communities Funding - Chinchilla Community Centre | | | — | | | | — | | | | — | | | | — | | | | — | |
As part of the Sustainable Resource Communities funding initiative, the Government will provide funding of $2.6 million in 2010-11 to replace the Chinchilla Community Centre.
| | | | | | | | | | | | | | | | | | | | |
| | | 2009-10
$’000 | | | 2010-11
$’000 | | | 2011-12
$’000 | | | 2012-13
$’000 | | | 2013-14
$’000 | |
Sustainable Resource Communities Funding - Moranbah Youth Centre | | | — | | | | — | | | | — | | | | — | | | | — | |
As part of the Sustainable Resource Communities funding initiative, the Government will provide funding of $3 million in 2010-11 for the construction of a youth centre in Moranbah to provide a safe and suitable location for youth services, activities and programs.
| | | | |
| 70 | | Budget Measures 2010-11 | | |
| | | | | | | | | | | | | | | | | | | | |
| | | 2009-10
$’000 | | | 2010-11
$’000 | | | 2011-12
$’000 | | | 2012-13
$’000 | | | 2013-14
$’000 | |
Sustainable Resource Communities Funding - Dalby Aquatic Centre | | | — | | | | — | | | | — | | | | — | | | | — | |
As part of the Sustainable Resource Communities funding initiative, the Government will provide funding of $4.6 million over two years to the Western Downs Regional Council towards the refurbishment of the Dalby Aquatic Centre including replacement of the existing pool with a 25 metre eight lane pool, a 16 metre six lane pool and amenities.
| | | | |
| | | Budget Measures 2010-11 | | 74 |
Department of Community Safety
| | | | | | | | | | | | | | | | | | | | |
| | | 2009-10
$’000 | | | 2010-11
$’000 | | | 2011-12
$’000 | | | 2012-13
$’000 | | | 2013-14
$’000 | |
Helicopter Services - Major Overhaul | | | 2,787 | | | | 3,154 | | | | — | | | | — | | | | — | |
|
| The Government is providing additional funding of $5.9 million over two years for the ongoing maintenance of one of Emergency Management Queensland’s Bell 412 helicopters. | |
| | | | | |
| | | 2009-10
$’000 | | | 2010-11
$’000 | | | 2011-12
$’000 | | | 2012-13
$’000 | | | 2013-14
$’000 | |
Resourcing Queensland Fire and Rescue Service | | | — | | | | 450 | | | | 2,800 | | | | 2,700 | | | | 3,600 | |
|
| The Queensland Fire and Rescue Service continues the delivery of quality and timely services. The Government has approved additional funding of $9.6 million over four years that will be directed to minor works at fire and rescue stations to address workplace health and safety, replacement specialist equipment and enhanced communications and incident management technology. The expense component of this initiative can be found in Chapter 2 Expense Measures. | |
| | | | | |
| | | 2009-10
$’000 | | | 2010-11
$’000 | | | 2011-12
$’000 | | | 2012-13
$’000 | | | 2013-14
$’000 | |
Sustainable Resource Communities Funding - Clermont/Emerald/Dysart | | | — | | | | — | | | | — | | | | — | | | | — | |
As part of the Sustainable Resource Communities funding initiative, the Government will provide funding of $4.2 million over two years to construct replacement auxiliary fire stations at Clermont and Emerald and training props and simulations at the Dysart auxiliary fire station to support the Bowen Basin.
| | | | |
| 72 | | Budget Measures 2010-11 | | |
| | | | | | | | | | | | | | | | | | | | |
| | | 2009-10
$’000 | | | 2010-11
$’000 | | | 2011-12
$’000 | | | 2012-13
$’000 | | | 2013-14
$’000 | |
Sustainable Resource Communities Funding - Queensland Ambulance Service Staff Housing | | | — | | | | — | | | | — | | | | — | | | | — | |
As part of the Sustainable Resource Communities funding initiative, the Government will provide funding of $5.8 million over three years to commence planning and the purchase of staff housing for the Queensland Ambulance Service in the Surat and Bowen Basins.
| | | | |
| | | Budget Measures 2010-11 | | 73 |
Department of Education and Training
| | | | | | | | | | | | | | | | | | | | |
| | | 2009-10
$’000 | | | 2010-11
$’000 | | | 2011-12
$’000 | | | 2012-13
$’000 | | | 2013-14
$’000 | |
| Acceleration of Universal Access to Kindergarten Program | | | — | | | | 21,900 | | | | 38,100 | | | | (30,000 | ) | | | (30,000 | ) |
The Government will bring forward funding of $60 million to 2010-11 and 2011-12 to support the accelerated planning and delivery of 40 kindergarten services originally scheduled for 2013 and 2014. In 2010-11, the Government will open 12 kindergarten services on state school sites and partner with the non-state school sectors to open more services. A total of 86 services will open in 2012.
| | | | | | | | | | | | | | | | | | | | |
| | | 2009-10
$’000 | | | 2010-11
$’000 | | | 2011-12
$’000 | | | 2012-13
$’000 | | | 2013-14
$’000 | |
Cairns Maritime Safety Training Facility | | | — | | | | 2,500 | | | | — | | | | — | | | | — | |
The Government will provide additional funding of $2.5 million in 2010-11 to help grow the local Cairns marine industry by supporting marine safety training at the Great Barrier Reef International Marine College. This includes funding to purchase and maintain an inshore craft and emergency response training simulators.
| | | | | | | | | | | | | | | | | | | | |
| | | 2009-10
$’000 | | | 2010-11
$’000 | | | 2011-12
$’000 | | | 2012-13
$’000 | | | 2013-14
$’000 | |
| Commonwealth Training Infrastructure Investment for Tomorrow | | | 36,991 | | | | 1,947 | | | | — | | | | — | | | | — | |
Funding of $38.9 million is being provided under the Australian Government’s Training Infrastructure Investment for Tomorrow Program for the construction and refurbishment of training facilities at Tropical North Queensland Institute of TAFE, SkillsTech Australia Acacia Ridge Campus, Sunshine Coast Institute of TAFE, Southern Queensland Institute of TAFE and Central Queensland Institute of TAFE.
| | | | |
| 74 | | Budget Measures 2010-11 | | |
| | | | | | | | | | | | | | | | | | | | |
| | | 2009-10
$’000 | | | 2010-11
$’000 | | | 2011-12
$’000 | | | 2012-13
$’000 | | | 2013-14
$’000 | |
| Surat Basin Resources Trade Infrastructure Project | | | — | | | | — | | | | — | | | | — | | | | — | |
As part of the Sustainable Resource Communities funding initiative, the Government will provide funding of $4.5 million in 2010-11 for the establishment of a regional skills hub in the Surat Basin area of Queensland comprising the towns of Miles, Wandoan and Taroom. The project will involve the construction of a stand-alone training centre, refurbishment work to existing school-based industrial workshops and the purchase of specialised trade equipment. The main facility will comprise infrastructure and industry standard trade equipment to enable students to acquire skills in engineering and mining operations.
| | | | |
| | | Budget Measures 2010-11 | | 75 |
Department of Employment, Economic Development and Innovation
| | | | | | | | | | | | | | | | | | | | |
| | | 2009-10
$’000 | | | 2010-11
$’000 | | | 2011-12
$’000 | | | 2012-13
$’000 | | | 2013-14
$’000 | |
Racing Industry Capital Development Scheme | | | — | | | | 20,000 | | | | 21,000 | | | | 22,000 | | | | 22,000 | |
|
| The Government will establish the Racing Industry Capital Development Scheme to assist the racing industry with provision of priority capital works through funding of up to $85 million over four years. Funding will be received via a Racing Industry Development Levy equal to 50% of wagering tax collections, and disbursed following Government approval of individual projects. | |
| | | | | |
| | | 2009-10
$’000 | | | 2010-11
$’000 | | | 2011-12
$’000 | | | 2012-13
$’000 | | | 2013-14
$’000 | |
Streamlining Mineral and Petroleum Tenure Approvals | | | — | | | | 1,657 | | | | 2,486 | | | | 2,400 | | | | — | |
|
| The Government will provide additional funding of $6.5 million over three years (bringing the total capital investment to $10.7 million) to implement an integrated information management system as part of the streamlining mining and petroleum tenure approvals initiative. The system will include: electronic document management, online forms and application lodgement and an automated workflow system. | |
| | | | | |
| | | 2009-10
$’000 | | | 2010-11
$’000 | | | 2011-12
$’000 | | | 2012-13
$’000 | | | 2013-14
$’000 | |
Security Providers Fingerprinting | | | — | | | | 177 | | | | — | | | | — | | | | — | |
As part of the Council of Australian Governments’ adoption of a national approach to the regulation of the security provider industry through the mandatory fingerprinting of licensees, the Government is providing funding of $0.18 million in 2010-11. Funding will provide for a systems upgrade to allow the collection of fingerprint information including: advice to applicants that they must be fingerprinted, confirmation from the Queensland Police Service that fingerprinting has occurred and advice on any criminal history that may influence the granting of a security provider’s licence. The expense component of this initiative can be found in Chapter 2 Expense Measures.
| | | | |
| 76 | | Budget Measures 2010-11 | | |
| | | | | | | | | | | | | | | | | | | | |
| | | 2009-10
$’000 | | | 2010-11
$’000 | | | 2011-12
$’000 | | | 2012-13
$’000 | | | 2013-14
$’000 | |
Glassing Register Information | | | 350 | | | | — | | | | — | | | | — | | | | — | |
In October 2009, the Liquor Act 1992 was amended to prohibit the use of regular glass in certain licensed premises that have been determined high risk. A new information database has been developed by the Office of Liquor, Gaming and Racing to collect, collate and store associated information to enable monitoring of, and compliance with, the legislation. Database and systems changes to manage data, including incident reports relating to alcohol and licensed premises, were completed in March 2010.
| | | | |
| | | Budget Measures 2010-11 | | 77 |
Department of Environment and Resource Management
| | | | | | | | | | | | | | | | | | | | |
| | | 2009-10
$’000 | | | 2010-11
$’000 | | | 2011-12
$’000 | | | 2012-13
$’000 | | | 2013-14
$’000 | |
Implementing the Koala Response Strategy | | | 4,690 | | | | 14,000 | | | | 6,200 | | | | 6,200 | | | | 6,200 | |
|
| The Government will provide increased funding of $4.7 million in 2009-10 and a further $38.8 million over five years from 2010-11 to continue to deliver the Queensland Government’s Koala Response Strategy. The strategy aims to halt the serious decline of South East Queensland’s koala populations and has an overarching goal of increasing mature koala habitat by 2020. The expense component of this initiative can be found in Chapter 2 Expense Measures. | |
| | | | | |
| | | 2009-10
$’000 | | | 2010-11
$’000 | | | 2011-12
$’000 | | | 2012-13
$’000 | | | 2013-14
$’000 | |
Dam Safety Spillway Upgrades Program (including Kinchant Dam) | | | — | | | | 13,138 | | | | 18,000 | | | | (13,008 | ) | | | (18,130 | ) |
|
| The Government will bring forward $12 million in 2010-11 and $18 million in 2011-12 for the upgrade of Kinchant Dam spillway and $1.1 million in 2010-11 for other dam spillways projects. | |
| | | | | |
| | | 2009-10
$’000 | | | 2010-11
$’000 | | | 2011-12
$’000 | | | 2012-13
$’000 | | | 2013-14
$’000 | |
Water for the Future (Healthy Headwaters) | | | — | | | | 7,426 | | | | 10,011 | | | | — | | | | — | |
The Australian Government will provide funding of $17.4 million over two years as part of the Water for the Future Program. The program aims to achieve improved water use efficiency and to return a share of water savings to the environment. The expense component of this initiative can be found in Chapter 2 Expense Measures.
| | | | |
| 78 | | Budget Measures 2010-11 | | |
| | | | | | | | | | | | | | | | | | | | |
| | | 2009-10
$’000 | | | 2010-11
$’000 | | | 2011-12
$’000 | | | 2012-13
$’000 | | | 2013-14
$’000 | |
Queensland Waste Reform Strategy Implementation | | | — | | | | 6,200 | | | | — | | | | — | | | | — | |
The Government will provide additional funding of $6.2 million in 2010-11 to implement the Queensland Waste Reform Strategy. The Queensland Waste Reform Strategy is designed to meet the contemporary challenges of waste management by avoiding waste generation and improving resource efficiency and recovery to reduce the climate change impacts of generating waste. Capital funding will be provided to build the required information technology and assist with the provision of infrastructure to Local Government. The expense component of this initiative can be found in Chapter 2 Expense Measures.
| | | | | | | | | | | | | | | | | | | | |
| | | 2009-10
$’000 | | | 2010-11
$’000 | | | 2011-12
$’000 | | | 2012-13
$’000 | | | 2013-14
$’000 | |
National Parks | | | 5,840 | | | | 2,100 | | | | — | | | | — | | | | — | |
The Government is providing increased funding of $5.8 million in 2009-10 and $2.1 million in 2010-11 for the acquisition of national park lands in order to achieve the Government’s Green Q2 target of increasing the area of national park to 7.5% of the State by 2020. Further funding from the Australian Government is potentially available under the National Reserve System dependent on acquisitions meeting eligibility criteria.
| | | | | | | | | | | | | | | | | | | | |
| | | 2009-10
$’000 | | | 2010-11
$’000 | | | 2011-12
$’000 | | | 2012-13
$’000 | | | 2013-14
$’000 | |
Change in Valuation Methodology to Site Value | | | 1,200 | | | | 750 | | | | — | | | | — | | | | — | |
The Government is providing increased funding of $2 million over two years to upgrade and adjust the Queensland Valuation and Sales system. This system maintains data used in the annual property valuation process. The expense component of this initiative can be found in Chapter 2 Expense Measures.
| | | | |
| | | Budget Measures 2010-11 | | 79 |
| | | | | | | | | | | | | | | | | | | | |
| | | 2009-10
$’000 | | | 2010-11
$’000 | | | 2011-12
$’000 | | | 2012-13
$’000 | | | 2013-14
$’000 | |
Acquisition of Wongaloo (Cromarty Wetlands) | | | 300 | | | | — | | | | — | | | | — | | | | — | |
The Government has provided additional funding of $0.3 million in 2009-10 to assist in the acquisition of Cromarty Wetlands, locally known as Wongaloo. The intention is to add the wetlands to the adjoining Bowling Green Bay Conservation Park and Bowling Green Bay National Park aggregation.
| | | | | | | | | | | | | | | | | | | | |
| | | 2009-10
$’000 | | | 2010-11
$’000 | | | 2011-12
$’000 | | | 2012-13
$’000 | | | 2013-14
$’000 | |
Enhanced Fire Management Program | | | 120 | | | | — | | | | — | | | | — | | | | — | |
The Government has provided increased funding of $0.12 million in 2009-10 for the purchase of priority plant and equipment to implement on-ground fire management. The expense component of this initiative can be found in Chapter 2 Expense Measures.
| | | | |
| 80 | | Budget Measures 2010-11 | | |
Department of Health
| | | | | | | | | | | | | | | | | | | | |
| | | 2009-10
$’000 | | | 2010-11
$’000 | | | 2011-12
$’000 | | | 2012-13
$’000 | | | 2013-14
$’000 | |
Regional Cancer Centres | | | — | | | | 16,350 | | | | 32,530 | | | | 99,815 | | | | 30,596 | |
Total funding of $179.3 million over four years will be provided by the Government and Australian Government to increase access to cancer services through a network of Regional Cancer Centres which will improve outcomes for rural cancer patients. The Regional Cancer Centres will be located in Townsville (with outreach services to Mount Isa), Rockhampton, Bundaberg and Hervey Bay (with outreach services from the Royal Brisbane and Women’s Hospital) and Toowoomba (with outreach services provided by the Princess Alexandra Hospital). The expense component of this initiative can be found in Chapter 2 Expense Measures.
| | | | | | | | | | | | | | | | | | | | |
| | | 2009-10
$’000 | | | 2010-11
$’000 | | | 2011-12
$’000 | | | 2012-13
$’000 | | | 2013-14
$’000 | |
Sunshine Coast Service Enhancements | | | — | | | | 11,500 | | | | 14,600 | | | | — | | | | — | |
Funding of $26.1 million over two years will be provided including $14.6 million from the National Health and Hospitals Network funding package to enhance clinical services at the Nambour General Hospital through the development of a cardiac catheterisation laboratory, endoscopy suite and vascular surgery suite, improvements to neurosurgery services, increased access to aero medical retrieval services and purchasing of radiation oncology services from the private sector. Clinical capacity at the Caloundra Hospital Department of Emergency Medicine will be increased to meet rising demand. The expense component of this initiative can be found in Chapter 2 Expense Measures.
| | | | |
| | | Budget Measures 2010-11 | | 81 |
| | | | | | | | | | | | | | | | | | | | |
| | | 2009-10
$’000 | | | 2010-11
$’000 | | | 2011-12
$’000 | | | 2012-13
$’000 | | | 2013-14
$’000 | |
Priority Capital Program | | | — | | | | 6,850 | | | | 29,850 | | | | 24,500 | | | | 60,000 | |
|
| The Government will provide additional funding to facilitate a prioritised, state-wide program of capital works for Queensland Health including minor refurbishments and renewal activities on buildings and engineering services, additional information and communication technology (ICT) infrastructure and equipment replacement. | |
| | | | | |
| | | 2009-10
$’000 | | | 2010-11
$’000 | | | 2011-12
$’000 | | | 2012-13
$’000 | | | 2013-14
$’000 | |
Relocation of the Leukaemia Foundation of Queensland | | | — | | | | 5,500 | | | | 6,800 | | | | 6,000 | | | | — | |
|
| The Government will provide increased funding for the relocation and expansion of the Leukaemia Foundation of Queensland to allow for the development of the new Queensland Children’s Hospital. | |
| | | | | |
| | | 2009-10
$’000 | | | 2010-11
$’000 | | | 2011-12
$’000 | | | 2012-13
$’000 | | | 2013-14
$’000 | |
National Health and Hospitals Network - Sub-Acute Care | | | — | | | | 4,300 | | | | 46,500 | | | | 40,700 | | | | 36,500 | |
Funding will be provided by the Australian Government to establish new sub-acute beds in either hospital or community settings. Beds will be utilised for rehabilitation, sub-acute, mental health and/or palliative care. The scope of services to be delivered will be determined in ongoing negotiations with the Australian Government. The expense component of this initiative can be found in Chapter 2 Expense Measures.
| | | | |
| 82 | | Budget Measures 2010-11 | | |
| | | | | | | | | | | | | | | | | | | | |
| | | 2009-10
$’000 | | | 2010-11
$’000 | | | 2011-12
$’000 | | | 2012-13
$’000 | | | 2013-14
$’000 | |
National Health and Hospitals Network - Elective Surgery | | | — | | | | 3,050 | | | | 4,950 | | | | 5,000 | | | | — | |
The Australian Government is providing $27.6 million over four years to expand elective surgery capacity to ensure that by December 2014, 95% of patients waiting for surgery in categories 1 and 2 will be treated within clinically recommended times, and category 3 patients by December 2015. Excluded from the above table is capital funding of $14.6 million which has been allocated to the Nambour General Hospital interim service enhancements and is shown in the Sunshine Coast Interim Service Enhancements initiative which can also be found in Chapter 3 Capital Measures. The National Health and Hospitals Network - Elective Surgery expense component of this initiative can be found in Chapter 2 Expense Measures.
| | | | | | | | | | | | | | | | | | | | |
| | | 2009-10
$’000 | | | 2010-11
$’000 | | | 2011-12
$’000 | | | 2012-13
$’000 | | | 2013-14
$’000 | |
National Health and Hospitals Network - Flexible Funding Pool | | | — | | | | 2,500 | | | | 9,300 | | | | 25,900 | | | | — | |
Funding will be provided by the Australian Government to increase hospital capacity and improve services to patients through a funding pool. The funding pool will give Queensland the opportunity to rapidly respond to the capital needs in the hospital system in relation to emergency departments, elective surgery and sub-acute care. This funding will also allow for minor repairs and improvements to public hospitals to be rapidly completed.
| | | | |
| | | Budget Measures 2010-11 | | 83 |
| | | | | | | | | | | | | | | | | | | | |
| | | 2009-10
$’000 | | | 2010-11
$’000 | | | 2011-12
$’000 | | | 2012-13
$’000 | | | 2013-14
$’000 | |
National Health and Hospitals Network - Multi-Purpose | | | — | | | | 500 | | | | 6,000 | | | | 5,000 | | | | 4,600 | |
Funding will be provided by the Australian Government to establish new and/or increase the capacity of existing multi-purpose service facilities. Services provided by multi-purpose facilities include acute care, residential aged care, community health, home and community care and other health related services. The scope of services to be delivered will be determined in ongoing negotiations with the Australian Government.
| | | | | | | | | | | | | | | | | | | | |
| | | 2009-10
$’000 | | | 2010-11
$’000 | | | 2011-12
$’000 | | | 2012-13
$’000 | | | 2013-14
$’000 | |
National Health and Hospitals Network - Emergency Departments | | | — | | | | — | | | | 12,800 | | | | 30,400 | | | | 4,800 | |
Funding will be provided by the Australian Government to facilitate improved emergency department waiting times and the achievement of a new National Access Target to ensure patients are admitted, deferred or discharged within four hours of presentation to an emergency department, where it is clinically appropriate to do so. Capital funding will allow for the upgrade of public hospital emergency departments in order to meet these new targets. The scope of services to be delivered will be determined in ongoing negotiations with the Australian Government. The expense component of this initiative can be found in Chapter 2 Expense Measures.
| | | | | | | | | | | | | | | | | | | | |
| | | 2009-10
$’000 | | | 2010-11
$’000 | | | 2011-12
$’000 | | | 2012-13
$’000 | | | 2013-14
$’000 | |
Pandemic (H1N1) Supplementary Funding | | | 3,500 | | | | — | | | | — | | | | — | | | | — | |
The Government provided additional funding of $3.5 million in 2009-10 to supplement the costs incurred in meeting the service delivery requirements imposed by Pandemic (H1N1) 2009 including the purchase of an additional 55 ventilators and other complex and ancillary equipment to support the increased demand on Intensive Care Units as a result of the Pandemic. The expense component of this initiative can be found in Chapter 2 Expense Measures.
| | | | |
| 84 | | Budget Measures 2010-11 | | |
Department of Infrastructure and Planning
| | | | | | | | | | | | | | | | | | | | |
| | | 2009-10
$’000 | | | 2010-11
$’000 | | | 2011-12
$’000 | | | 2012-13
$’000 | | | 2013-14
$’000 | |
Sewage Treatment Plants Upgrade | | | 5,000 | | | | 31,300 | | | | 14,400 | | | | — | | | | — | |
|
| The Government is providing funding of $50.7 million over three years to protect the Great Barrier Reef by providing subsidies to Councils that will be used to upgrade sewage treatment plants discharging into the Reef. Subsidies have been provided to the Cassowary Coast Regional Council ($26.7 million), Whitsunday Regional Council ($15.6 million), Hinchinbrook Shire Council ($6.6 million) and Tablelands Regional Council ($1.8 million). | |
| | | | | |
| | | 2009-10
$’000 | | | 2010-11
$’000 | | | 2011-12
$’000 | | | 2012-13
$’000 | | | 2013-14
$’000 | |
Cassowary Coast Regional Council - Priority Projects | | | — | | | | 13,700 | | | | — | | | | — | | | | — | |
|
| The Government will provide funding of $13.7 million in 2010-11 to Cassowary Coast Regional Council for priority projects in its local government area, including the Innisfail water treatment plant and the Jubilee Bridge. | |
| | | | | |
| | | 2009-10
$’000 | | | 2010-11
$’000 | | | 2011-12
$’000 | | | 2012-13
$’000 | | | 2013-14
$’000 | |
Surat Basin Railway Corridor | | | — | | | | 5,335 | | | | — | | | | — | | | | — | |
The State has granted the Surat Basin Railway Joint Venture (SBRJV) an exclusive mandate to develop, up to financial close, a railway from Wandoan to Banana. The State will initially fund the land acquisition costs (related to the rail corridor) which are to be reimbursed by SBRJV. The expense component of this initiative can be found in Chapter 2 Expense Measures.
| | | | |
| | | Budget Measures 2010-11 | | 85 |
| | | | | | | | | | | | | | | | | | | | |
| | | 2009-10
$’000 | | | 2010-11
$’000 | | | 2011-12
$’000 | | | 2012-13
$’000 | | | 2013-14
$’000 | |
| Whitsunday Coast Airport Upgrade | | | — | | | | 3,000 | | | | — | | | | — | | | | — | |
The Government will provide additional funding of $3 million in 2010-11 to expand the scope of works for the Whitsunday Coast Airport Upgrade. The Government has contributed a total of $7 million towards the upgrade of the Whitsunday Coast Airport.
| | | | | | | | | | | | | | | | | | | | |
| | | 2009-10
$’000 | | | 2010-11
$’000 | | | 2011-12
$’000 | | | £012-13
$’000 | | | 2013-14
$’000 | |
| Bundaberg Regional Airport Upgrade | | | — | | | | — | | | | — | | | | — | | | | — | |
The Government will allocate funding of $2.4 million in 2010-11 towards an upgrade of the Bundaberg Regional Airport which includes an upgrade to the existing terminal, an extension of the runway and new car parking facilities.
| | | | | | | | | | | | | | | | | | | | |
| | | 2009-10
$’000 | | | 2010-11
$’000 | | | 2011-12
$’000 | | | 2012-13
$’000 | | | 2013-14
$’000 | |
Indigenous Environmental Health Infrastructure | | | — | | | | — | | | | — | | | | — | | | | — | |
The Government is providing $67.2 million over three years for the Indigenous Environmental Health Infrastructure Program, including: $57.2 million for the Indigenous State Infrastructure Program which will fund priority projects relating to the roll-out of the social housing program and provide essential environmental health infrastructure; and $10 million for emergent works in Indigenous Council areas undertaking Indigenous Environmental Health Infrastructure Programs.
| | | | |
| 86 | | Budget Measures 2010-11 | | |
| | | | | | | | | | | | | | | | | | | | |
| | | 2009-10
$’000 | | | 2010-11
$’000 | | | 2011-12
$’000 | | | 2012-13
$’000 | | | 2013-14
$’000 | |
Toowoomba Pipeline | | | 6,405 | | | | — | | | | — | | | | — | | | | — | |
The Government has provided additional funding of $6.4 million in 2009-10 to the Toowoomba Regional Council for the purchase of the Wivenhoe Dam to Cressbrook Dam water pipeline. The pipeline will ensure a consistent water supply for the Toowoomba community. Government’s total contribution to this project is $112.2 million.
| | | | |
| | | Budget Measures 2010-11 | | 87 |
Department of Justice and Attorney-General
| | | | | | | | | | | | | | | | | | | | |
| | | 2009-10
$’000 | | | 2010-11
$’000 | | | 2011-12
$’000 | | | 2012-13
$’000 | | | 2013-14
$’000 | |
Programmed Renewal and Minor Works | | | — | | | | 3,955 | | | | — | | | | — | | | | — | |
|
| The Government will provide additional funding for the refurbishment and replacement of major building components for existing courthouses. | |
| | | | | |
| | | 2009-10
$’000 | | | 2010-11
$’000 | | | 2011-12
$’000 | | | 2012-13
$’000 | | | 2013-14
$’000 | |
Southport - Arrest Court Extension and Fitout of Additional Courtrooms | | | 1,365 | | | | 2,635 | | | | — | | | | — | | | | — | |
|
| The Government is providing funding for the design, construction and fit-out of an arrest court extension and new courtrooms at Southport Courthouse. This will enhance the courthouse’s capacity to deal with the increasing number of criminal and civil cases. | |
| | | | | |
| | | 2009-10
$’000 | | | 2010-11
$’000 | | | 2011-12
$’000 | | | 2012-13
$’000 | | | 2013-14
$’000 | |
Information Technology Enhancement | | | — | | | | 1,535 | | | | 1,535 | | | | 1,535 | | | | 1,535 | |
The Government will provide increased funding of $6.1 million over four years for the on-going capital enhancements of the State Penalties Enforcement Registry system and the Queensland Wide Interlinked Courts system.
| | | | |
| 88 | | Budget Measures 2010-11 | | |
| | | | | | | | | | | | | | | | | | | | |
| | | 2009-10
$’000 | | | 2010-11
$’000 | | | 2011-12
$’000 | | | 2012-13
$’000 | | | 2013-14
$’000 | |
Establishment Costs for Electronic Document Records Management System - Legal Aid Queensland | | | — | | | | 845 | | | | 825 | | | | — | | | | — | |
The Government will provide funding to Legal Aid Queensland for the development of an Electronic Document Records Management System. This is part of the total funding of $61 million over four years. Related expense components can be found in Chapter 2 Expense Measures (Legal Aid Services Funding Assistance Package and Establishment Costs for Electronic Document Record Management System - Legal Aid Queensland).
| | | | |
| | | Budget Measures 2010-11 | | 89 |
Department of Police
| | | | | | | | | | | | | | | | | | | | |
| | | 2009-10
$’000 | | | 2010-11
$’000 | | | 2011-12
$’000 | | | 2012-13
$’000 | | | 2013-14
$’000 | |
Security Providers Fingerprinting | | | — | | | | — | | | | — | | | | — | | | | — | |
The Queensland Police Service (QPS) will provide for expenditure of up to $1.3 million for a 2008 Council of Australian Governments’ agreement requiring each State and Territory to introduce mandatory fingerprinting to assist in initial and ongoing probity checking of people working in the private security industry.
| | | | | | | | | | | | | | | | | | | | |
| | | 2009-10
$’000 | | | 2010-11
$’000 | | | 2011-12
$’000 | | | 2012-13
$’000 | | | 2013-14
$’000 | |
Telecommunication Interception | | | — | | | | — | | | | — | | | | — | | | | — | |
The QPS will provide for expenditure of up to $11 million to implement a permanent Telecommunication Interception (TI) capability which will enable the QPS to monitor a wider variety of communication means used for criminal activity. TI is particularly effective for investigations into major illicit drug trafficking and other commodity based criminal markets, and could be a key source of information for management decisions about protracted and complex criminal investigations, and tactically dangerous operations. In addition, the Government is providing $33.7 million over five years to support TI operations, details of the expense component of this initiative can be found in Chapter 2 Expense Measures.
| | | | |
| 90 | | Budget Measures 2010-11 | | |
Department of Public Works
| | | | | | | | | | | | | | | | | | | | |
| | | 2009-10
$’000 | | | 2010-11
$’000 | | | 2011-12
$’000 | | | 2012-13
$’000 | | | 2013-14
$’000 | |
GovNet Core Operations | | | — | | | | 916 | | | | — | | | | — | | | | — | |
The Government will provide funding of $0.92 million in 2010-11 to CITEC for the support of the core operations of GovNet which is a whole-of-Government portal for government agencies which enables service delivery to the community. The total additional funding in 2010-11 is $3.5 million, including services funding of $2.5 million. The expense component of this initiative can be found in Chapter 2 Expense Measures.
| | | | |
| | | Budget Measures 2010-11 | | 91 |
Department of the Premier and Cabinet
| | | | | | | | | | | | | | | | | | | | |
| | | 2009-10
$’000 | | | 2010-11
$’000 | | | 2011-12
$’000 | | | 2012-13
$’000 | | | 2013-14
$’000 | |
Queensland Symphony Orchestra Australian Broadcasting Corporation co-location project | | | 5,000 | | | | 7,000 | | | | — | | | | — | | | | — | |
Funding of $12 million is being provided over two years by the State and Australian Governments for the capital construction and fit out associated with co-locating the Queensland Symphony Orchestra with the Australian Broadcasting Corporation at South Bank.
| | | | |
| 92 | | Budget Measures 2010-11 | | |
Department of Transport and Main Roads
| | | | | | | | | | | | | | | | | | | | |
| | | 2009-10
$’000 | | | 2010-11
$’000 | | | 2011-12
$’000 | | | 2012-13
$’000 | | | 2013-14
$’000 | |
Upgrade to Port of Brisbane Motorway | | | 4,000 | | | | 88,000 | | | | 120,000 | | | | 120,000 | | | | — | |
The Government is funding the $332 million upgrade to the Port of Brisbane Motorway over four years to increase the capacity of the road to the port, as well as improving safety for heavy, port-bound vehicles and local traffic. The Port of Brisbane is a critical facility for the national economy and this extension will alleviate traffic congestion and minimise shipping delays, reducing the risk to business. This funding will support a two-lane extension of this vital freight route and boost Queensland’s growth and ongoing economic competitiveness. The expense component of this initiative can be found in Chapter 2 Expense Measures.
| | | | | | | | | | | | | | | | | | | | |
| | | 2009-10
$’000 | | | 2010-11
$’000 | | | 2011-12
$’000 | | | 2012-13
$’000 | | | 2013-14
$’000 | |
Springfield Passenger Rail Line - Stage 2 | | | 5,000 | | | | 41,000 | | | | 244,500 | | | | 186,000 | | | | (3,420 | ) |
The Government is allocating additional funding of $473.1 million over five years to bring forward the delivery of the extension of the passenger rail line from Richlands to Springfield to 2013. The project is for infrastructure works to construct a new 10km dual track from Richlands to Springfield including a new station at Springfield. In making this decision, Government is prioritising public transport over the Centenary Highway upgrade to Springfield.
| | | | |
| | | Budget Measures 2010-11 | | 93 |
| | | | | | | | | | | | | | | | | | | | |
| | | 2009-10
$’000 | | | 2010-11
$’000 | | | 2011-12
$’000 | | | 2012-13
$’000 | | | 2013-14
$’000 | |
Rail Capacity Upgrades | | | 1,000 | | | | 39,000 | | | | 50,000 | | | | — | | | | — | |
The Government is allocating funding of $90 million over three years for additional/upgraded platforms at Park Road, Kuraby, Manly and Sandgate stations. This will provide the ability to operate an improved rail timetable structure.
| | | | | | | | | | | | | | | | | | | | |
| | | 2009-10
$’000 | | | 2010-11
$’000 | | | 2011-12
$’000 | | | 2012-13
$’000 | | | 2013-14
$’000 | |
Road and Transport Infrastructure Projects | | | 46,124 | | | | 22,521 | | | | 23,422 | | | | 24,359 | | | | 25,333 | |
The Government is allocating additional funding of $141.8 million over five years to continue its investment in road and transport infrastructure projects at a time when Australia’s economy is still recovering from the impacts of the global financial crisis. This funding commitment is delivering the infrastructure needed to connect Queenslanders, while creating and sustaining jobs for Queensland’s workforce.
The Government will expend $335.8 million over four years towards the regional road network, including a particular focus on resource development areas through the transport and main roads capital program.
| | | | | | | | | | | | | | | | | | | | |
| | | 2009-10
$’000 | | | 2010-11
$’000 | | | 2011-12
$’000 | | | 2012-13
$’000 | | | 2013-14
$’000 | |
New Queensland Driver Licence | | | — | | | | 18,005 | | | | 5,348 | | | | 5,772 | | | | 6,413 | |
The Government will allocate funding of $35.5 million over four years towards the New Queensland Driver Licence. These funds will be used for the provision of new products to replace laminated driver licences and other existing laminated products currently issued by the Department of Transport and Main Roads. The expense and revenue components of this initiative can be found in Chapter 2 Expense Measures and Chapter 4 Revenue Measures.
| | | | |
| 94 | | Budget Measures 2010-11 | | |
| | | | | | | | | | | | | | | | | | | | |
| | | 2009-10
$’000 | | | 2010-11
$’000 | | | 2011-12
$’000 | | | 2012-13
$’000 | | | 2013-14
$’000 | |
| TransLink Station Upgrade Program | | | — | | | | 10,000 | | | | 10,000 | | | | 10,000 | | | | 51,527 | |
The Government will allocate additional funding of $81.5 million over four years towards the TransLink Station Upgrade Program. This program is for the delivery of new or upgraded bus stations and park ‘n’ ride facilities, which will improve access to the public transport system across South East Queensland.
| | | | | | | | | | | | | | | | | | | | |
| | | 2009-10
$’000 | | | 2010-11
$’000 | | | 2011-12
$’000 | | | 2012-13
$’000 | | | 2013-14
$’000 | |
| Capricorn Highway - Gracemere Stanwell Industrial Corridor | | | — | | | | 6,000 | | | | 4,000 | | | | — | | | | — | |
The Government is committed to this project to open up industrial development in the Rockhampton region. This allocation of $10 million will fund the detailed design and business case for the construction of the grade separation. The construction cost will be allocated based on the results of the detailed design.
| | | | | | | | | | | | | | | | | | | | |
| | | 2009-10
$’000 | | | 2010-11
$’000 | | | 2011-12
$’000 | | | 2012-13
$’000 | | | 2013-14
$’000 | |
Fairfield Road Pedestrian Overpass at Yeerongpilly Station | | | 900 | | | | 5,800 | | | | — | | | | — | | | | — | |
The Government is allocating funding of $6.7 million over two years towards the construction of a pedestrian overpass at Yeerongpilly Rail Station.
| | | | |
| | | Budget Measures 2010-11 | | 95 |
| | | | | | | | | | | | | | | | | | | | |
| | | 2009-10
$’000 | | | 2010-11
$’000 | | | 2011-12
$’000 | | | 2012-13
$’000 | | | 2013-14
$’000 | |
Go Card Add - Value Vending Machines | | | — | | | | 3,300 | | | | — | | | | — | | | | — | |
The Government will allocate additional funding of $3.3 million in 2010-11 to roll out up to 23 new Go Card add-value vending machines at priority busway stations and major transport interchanges. The expense component of this initiaitve can be found in Chapter 2 Expense Measures.
| | | | | | | | | | | | | | | | | | | | |
| | | 2009-10
$’000 | | | 2010-11
$’000 | | | 2011-12
$’000 | | | 2012-13
$’000 | | | 2013-14
$’000 | |
Strategic Noise Barrier Program | | | — | | | | — | | | | — | | | | — | | | | — | |
The Government will allocate funding of $20 million over four years for a Strategic Noise Barrier Program which will target low cost, high-benefit locations for noise barriers in South East Queensland, to reduce noise levels at these locations to acceptable limits. This will be funded from a reprioritisation of the roads and transport program.
| | | | | | | | | | | | | | | | | | | | |
| | | 2009-10
$’000 | | | 2010-11
$’000 | | | 2011-12
$’000 | | | 2012-13
$’000 | | | 2013-14
$’000 | |
Sustainable Resource Communities Funding - Road Safety Upgrades | | | — | | | | — | | | | — | | | | — | | | | — | |
The Government will allocate funding of $5.8 million over two years for road safety improvements in the Surat Basin region. This will deliver safety and community benefits by upgrading intersections at Dalby and Kogan and widening of pavements and rehabilitation of structures to improve road safety at sections of the Kogan - Condamine Road and Chinchilla - Tara Road (south of the Kogan/Condamine Road).
| | | | |
| 96 | | Budget Measures 2010-11 | | |
| | | | | | | | | | | | | | | | | | | | |
| | | 2009-10
$’000 | | | 2010-11
$’000 | | | 2011-12
$’000 | | | 2012-13
$’000 | | | 2013-14
$’000 | |
Townsville Port Access Road Bridge | | | — | | | | — | | | | 4,000 | | | | — | | | | — | |
The Government will allocate funding of $4 million in 2011-12 to facilitate the construction of the Townsville Port Access Road’s bridge to allow access to the Townsville Marine Precinct and boat ramps.
| | | | | | | | | | | | | | | | | | | | |
| | | 2009-10
$’000 | | | 2010-11
$’000 | | | 2011-12
$’000 | | | 2012-13
$’000 | | | 2013-14
$’000 | |
Rio Tinto Yarwun Alumina Refinery Stage 2 Infrastructure Arrangement | | | 2,800 | | | | — | | | | — | | | | — | | | | — | |
The Government allocated funding of $2.8 million in 2009-10 to pay for assets transferred to the State by Rio Tinto for the Yarwun Alumina Refinery expansion project at Gladstone.
| | | | | | | | | | | | | | | | | | | | |
| | | 2009-10
$’000 | | | 2010-11
$’000 | | | 2011-12
$’000 | | | 2012-13
$’000 | | | 2013-14
$’000 | |
Townsville Marine Precinct | | | — | | | | — | | | | 5,600 | | | | — | | | | — | |
The Government will allocate funding of $5.6 million in 2011-12 for acquisition of land for boat ramps as part of the Townsville Marine Precinct. The expense component of this initiative can be found in Chapter 2 Expense Measures.
| | | | |
| | | Budget Measures 2010-11 | | 97 |
Legislative Assembly of Queensland
| | | | | | | | | | | | | | | | | | | | |
| | | 2009-10
$’000 | | | 2010-11
$’000 | | | 2011-12
$’000 | | | 2012-13
$’000 | | | 2013-14
$’000 | |
Broadcast of Parliament Stage 3 | | | — | | | | 156 | | | | — | | | | — | | | | — | |
The Government will provide funding of $0.16 million in 2010-11 to deliver the third phase of the Broadcast of Parliament initiative. Enhancements will include the capture, storage and delivery of on-demand archived audiovisual material of Parliamentary sittings over the Internet, and the capture and short-term storage of broadcast quality archive material for use by Members and other stakeholders. The expense component of this initiative can be found in Chapter 2 Expense Measures.
| | | | |
| 98 | | Budget Measures 2010-11 | | |
4. REVENUE MEASURES
Introduction
The following tables present the relevant portfolio revenue measures relating to decisions taken since the 2009-10 Budget. For further explanation, refer to Explanation of Scope and Terms in Chapter 1.
| | | | |
| | | Budget Measures 2010-11 | | 99 |
Department of Employment, Economic Development and Innovation
| | | | | | | | | | | | | | | | | | | | |
| | | 2009-10
$’000 | | | 2010-11
$’000 | | | 2011-12
$’000 | | | 2012-13
$’000 | | | 2013-14
$’000 | |
| Petroleum and Gas Inspectors | | | — | | | | 3,182 | | | | 4,850 | | | | 4,812 | | | | 4,436 | |
|
| The Government will introduce cost recovery for petroleum and gas audit and inspection services, with additional estimated revenue of $17.3 million to be recovered over four years. | |
| | | | | |
| | | 2009-10
$’000 | | | 2010-11
$’000 | | | 2011-12
$’000 | | | 2012-13
$’000 | | | 2013-14
$’000 | |
Streamlining Mineral and Petroleum Tenure Approvals | | | — | | | | 3,040 | | | | 3,249 | | | | 3,166 | | | | 3,071 | |
|
| The Government, following a review of the cost to process tenure applications and dealings, will recover additional revenue estimated at $12.5 million over four years from the mineral and petroleum industries. This revenue will be reinvested back into the delivery of a streamlined resource tenure service model to improve the efficiency of the tenure approval process. | |
| | | | | |
| | | 2009-10
$’000 | | | 2010-11
$’000 | | | 2011-12
$’000 | | | 2012-13
$’000 | | | 2013-14
$’000 | |
| Security Providers Fingerprinting | | | — | | | | 270 | | | | 540 | | | | 540 | | | | 288 | |
As part of the Council of Australian Governments’ adoption of a national approach to the regulation of the security provider industry through the mandatory fingerprinting of industry licensees, the Government will collect additional revenue estimated at $1.6 million over four years relating to the mandatory fingerprinting of industry licensees. The fee is based on partial cost recovery.
| | | | |
| 100 | | Budget Measures 2010-11 | | |
Department of Environment and Resource Management
| | | | | | | | | | | | | | | | | | | | |
| | | 2009-10
$’000 | | | 2010-11
$’000 | | | 2011-12
$’000 | | | 2012-13
$’000 | | | 2013-14
$’000 | |
Queensland Industry Waste Disposal Levy | | | — | | | | — | | | | 98,530 | | | | 96,120 | | | | 92,250 | |
The proposed waste reform program includes an industry waste disposal levy. The levy is an integral component of the reform, designed to provide a price signal to drive waste avoidance and improve resource efficiency and recovery. It will apply only to waste disposed to landfill, and will not apply to municipal solid waste (domestic kerbside collections, domestic self-haul waste, and waste from local government provision of municipal services such as maintenance of parks and street bins). The levy revenue will be applied directly to implement the reforms and deliver one of the most advanced waste management and resource recovery programs in Australia to assist businesses to adopt stronger recycling practices. After meeting these needs, levy revenues would be applied to environmental initiatives. The expense component can be found in Chapter 2 Expense Measures.
| | | | |
| | | Budget Measures 2010-11 | | 101 |
Department of Infrastructure and Planning
| | | | | | | | | | | | | | | | | | | | |
| | | 2009-10
$’000 | | | 2010-11
$’000 | | | 2011-12
$’000 | | | 2012-13
$’000 | | | 2013-14
$’000 | |
Smart eDA Lodgement Fees | | | — | | | | 178 | | | | 840 | | | | 1,942 | | | | 3,629 | |
Revenue of $6.6 million over four years generated from Smart eDA lodgement fees for planning development, compliance assessment, plumbing and building applications will be applied to maintenance and support costs for Smart eDA. This electronic processing of applications allows processing to be completed more quickly.
| | | | |
| 102 | | Budget Measures 2010-11 | | |
Department of Police
| | | | | | | | | | | | | | | | | | | | |
| | | 2009-10
$’000 | | | 2010-11
$’000 | | | 2011-12
$’000 | | | 2012-13
$’000 | | | 2013-14
$’000 | |
Weapons Licensing Fee Increase | | | — | | | | 2,931 | | | | 3,285 | | | | 3,383 | | | | 3,485 | |
|
| The additional revenue generated by increasing three weapons licensing fees will be used to fund the new Weapon Licensing System (WLS). The new WLS will allow the Queensland Police Service (QPS) to provide greatly improved weapons licensing services, including online transactions. | |
| | | | | |
| | | 2009-10
$’000 | | | 2010-11
$’000 | | | 2011-12
$’000 | | | 2012-13
$’000 | | | 2013-14
$’000 | |
Special Service Fees | | | — | | | | 804 | | | | 828 | | | | 853 | | | | 879 | |
Where services are provided to an organisation or person and are not performed in the ordinary course of police business, the services are deemed to be special services. Two new Special Service fees will allow the QPS to recover costs for the use of stationary marked police vehicles (eg at roadwork sites) and to recover costs for administration and planning where requested services are cancelled by the client prior to commencement.
| | | | |
| | | Budget Measures 2010-11 | | 103 |
Department of Transport and Main Roads
| | | | | | | | | | | | | | | | | | | | |
| | | 2009-10
$’000 | | | 2010-11
$’000 | | | 2011-12
$’000 | | | 2012-13
$’000 | | | 2013-14
$’000 | |
Camera Detected Offence Program | | | — | | | | 31,219 | | | | — | | | | — | | | | — | |
|
| As part of road toll reduction efforts, the Government has increased the hours of operation for mobile speed cameras, fixed speed cameras, point to point cameras and red light cameras. All revenue from this initiative will be invested in road safety. Further funding for road safety can be found in the Safer Roads Sooner Program under Chapter 2 Expense Measures. | |
| | | | | |
| | | 2009-10
$’000 | | | 2010-11
$’000 | | | 2011-12
$’000 | | | 2012-13
$’000 | | | 2013-14
$’000 | |
New Queensland Driver Licence | | | — | | | | 15,717 | | | | 34,265 | | | | 59,790 | | | | 65,330 | |
|
| The Government has announced the final fee structure for the New Queensland Driver Licence, Heavy Vehicle Licence, Industry Authority Card, Marine Licence Indicator and the Adult Proof of Age Card. Figures represent expected increases in revenue for these products. The expense and capital components of this initiative can be found in Chapter 2 Expense Measures and Chapter 3 Capital Measures. | |
| | | | | |
| | | 2009-10
$’000 | | | 2010-11
$’000 | | | 2011-12
$’000 | | | 2012-13
$’000 | | | 2013-14
$’000 | |
Additional TransLink Fare Revenue | | | — | | | | — | | | | — | | | | — | | | | — | |
As announced on 4 January 2010, the Government has committed to a new fare structure to improve cost recovery for TransLink services from 25% to 30% within five years. To achieve an estimated increase in revenue to support increased services, increased patronage and support migration to paperless ticketing, fares were increased by 20% for Go Card and then by 15% per annum from 2011 to 2014 to bring cost recovery to 30%.
| | | | |
| 104 | | Budget Measures 2010-11 | | |
Treasury Department
| | | | | | | | | | | | | | | | | | | | |
| | | 2009-10
$’000 | | | 2010-11
$’000 | | | 2011-12
$’000 | | | 2012-13
$’000 | | | 2013-14
$’000 | |
Valuation Appeals - Commercial Land Settlements | | | (30,000 | ) | | | — | | | | — | | | | — | | | | — | |
|
| The Government has established a funding pool of $30 million to settle outstanding valuation appeals related to the outcome of the Pacific Fair valuation court decision. The State will refund the land tax differential arising from the amended valuations following negotiated settlements made by 30 June 2010 by eligible landholders. The State Government will compensate local governments for the rate refunds owing to eligible landholders arising from amended valuations due to the Pacific Fair court decision. | |
| | | | | |
| | | 2009-10
$’000 | | | 2010-11
$’000 | | | 2011-12
$’000 | | | 2012-13
$’000 | | | 2013-14
$’000 | |
Transfer Duty Exemption for Special Disability Trusts | | | — | | | | (500 | ) | | | (575 | ) | | | (660 | ) | | | (725 | ) |
|
| The Government has introduced an exemption from transfer duty on the acquisition of property used as the principal residence of a person with a disability under a Special Disability Trust, with the meaning given in the Social Security Act 1991 (Cwlth). The exemption is currently being provided under an administrative arrangement, pending legislative amendment. | |
| | | | | |
| | | 2009-10
$’000 | | | 2010-11
$’000 | | | 2011-12
$’000 | | | 2012-13
$’000 | | | 2013-14
$’000 | |
Land Tax Relief for Supported Accommodation Providers | | | — | | | | (1,000 | ) | | | (1,055 | ) | | | (1,119 | ) | | | (1,186 | ) |
The Government will provide a land tax exemption for “Level 3” supported accommodation facilities. A Level 3 facility is defined under the Residential Services (Accreditation) Act 2002 and provides both accommodation and personal care support such as assistance with meals, hygiene and medication. The provision of the exemption aligns to the land tax treatment applied to aged care facilities.
| | | | |
| | | Budget Measures 2010-11 | | 105 |
| | | | | | | | | | | | | | | | | | | | |
| | | 2009-10
$’000 | | | 2010-11
$’000 | | | 2011-12
$’000 | | | 2012-13
$’000 | | | 2013-14
$’000 | |
Payroll Tax Rebate for Apprentices and Trainees | | | — | | | | (8,000 | ) | | | — | | | | — | | | | — | |
The wages of apprentices and trainees are exempt from payroll tax. In addition to this employment incentive, the Government has decided to extend the 25% payroll tax rebate on the wages of each apprentice and trainee employed until 30 June 2011. The rebate will be offset against the tax payable on the wages of other employees.
| | | | |
| 106 | | Budget Measures 2010-11 | | |
This page has been left blank.
By authority: S. C. Albury, Acting Government Printer, Queensland 2010
State Budget 2010 – 11
Budget Measures
Budget Paper No.4
www.budget.qld.gov.au

State Budget 2010–11
Budget Measures Budget Paper No.4 www.budget.qld.gov.au