EXHIBIT (c)(iv)
Annual Economic Report of the Co-registrant
© Queensland Treasury 2010
Excerpts of this publication may be reproduced, with appropriate acknowledgement, as permitted under the Copyright Act.
2009-10 Annual Economic Report on the Queensland economy – year ended June 2010
ISSN: 1323 0646
This publication is intended only to provide a summary of the subject matter covered and without assuming a duty of care.
Although the information, including commentary, herein has been derived from sources believed to be reliable,
Queensland Treasury does not guarantee or make any representations as to its accuracy or completeness or
accept responsibility for any loss or damage occurring as a result of its use.

Annual Economic Report
2009–10
The Queensland Economy
Contents
| | | | | | |
| | |
| | Foreword | | | 2 | |
| | |
| 1 | | Overview | | | 3 | |
| | |
| 2 | | External environment | | | 5 | |
| | |
| | International conditions Australian economy | | | | |
| | |
| 3 | | Components of Queensland’s economic growth | | | 8 | |
| | |
| | Household final consumption Dwelling investment Business investment Public final demand | | | | |
| | |
| 4 | | Trade sector | | | 12 | |
| | |
| | Net exports Overseas merchandise exports | | | | |
| | |
| 5 | | Labour market | | | 15 | |
| | |
| | Employment Participation rate and the labour force Unemployment | | | | |
| | |
| 6 | | Prices and wages | | | 18 | |
| | |
| | Consumer prices Wages | | | | |
| | |
| 7 | | Resident population | | | 20 | |
Foreword
In 2009–10, the global economy started to recover from the most severe global economic downturn since the great depression. The recovery was most prevalent in Asia, where economic growth was led by the developing economies of China and India.
However, many advanced economies stuttered through 2009–10. Sovereign debt concerns dominated Europe, while the US recovery was timid, with the housing and labour markets ending the year in subdued fashion.
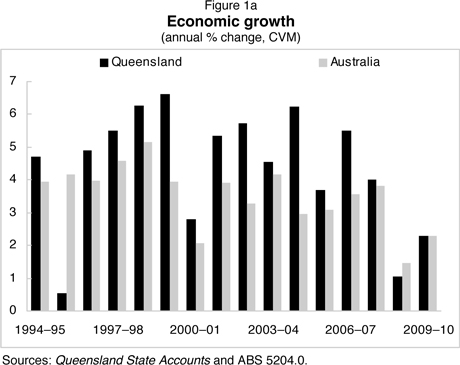
In comparison, Queensland’s economy continued to outperform most advanced economies in 2009–10, recording growth of 2.3%, improving slightly from the 1.1% experienced in 2008–09 during the worst of the global economic downturn.
Queensland’s trade sector was a key driver of growth in 2009–10. Stronger demand for coal from emerging Asia drove overall exports growth, while weaker domestic demand contributed to a fall in imports for the year.
The public sector also supported economic growth in 2009–10, driven by increased State Government spending in vital areas of service delivery, as well as Federal Government infrastructure stimulus.
In contrast, private domestic economic activity contracted in the year.
After more than tripling over the preceding eight years, business investment declined by 18.1%, reflecting excess supply in the office property market, tight credit conditions and weaker trading conditions due to subdued household demand.
Dwelling investment fell slightly, reflecting developer difficulties in accessing finance for medium-to-high density construction as well as some unwinding of first home buyer activity following the passing of the First Home Owners Boost.
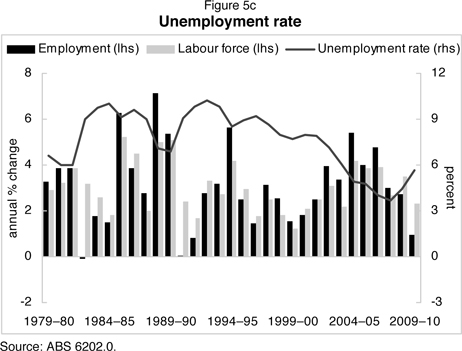
Reflecting weaker domestic activity, employment growth slowed to 0.9% in 2009–10, a rate below labour force growth. As a result, the year-average unemployment rate rose 1.3 percentage points, to 5.7%, in 2009–10.
However, the gradual improvement in economic activity later in the financial year saw the trend unemployment rate fall from a peak of 6.0% in October 2009 to 5.4% by June 2010, a rate well below the long-run average.
The Annual Economic Report is a part of the State Government’s performance accountability framework and is one of many economic resources produced by Queensland Treasury. This publication and other information on Queensland can be viewed at www.treasury.qld.gov.au.
ANDREW ERASER MP
TREASURER
MINISTER FOR EMPLOYMENT AND ECONOMIC DEVELOPMENT
| | |
2 | | Annual Economic Report 2009–10 |
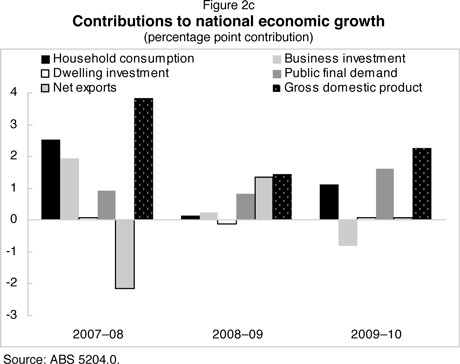
Growth in the Queensland economy improved to 2.3% in 2009–10, after easing to 1.1% in 2008–09 during the global financial crisis. The trade sector was a key driver of economic growth, with demand from emerging Asia bolstering Queensland’s commodity exports in particular. Public sector stimulus also supported economic activity. In contrast, private domestic demand contracted, with consumption growth below average and private dwelling and business investment falling in 2009–10.
Household consumption rose 1.7% in 2009–10, a rate well below the average of 4.9% per annum in the decade preceding the financial crisis. While growth in private consumption was supported by solid population growth, as well as growth in average wages per employee, six cash rate rises during 2009–10 constrained disposable income growth and discretionary spending. Softer jobs growth in 2009–10 and the conclusion of federal government stimulus payments in the prior year also affected growth in aggregate incomes.
Dwelling investment in Queensland declined 3.6% in 2009–10, the third consecutive yearly fall. Weakness in medium-to-high density dwelling construction was a key driver of the fall in new construction, with tight credit conditions and uncertainty over the global economic outlook weighing on housing investor activity. A relatively sustained period of monetary tightening, combined with the passing of federal housing stimulus, also saw a fall in owner-occupied house construction in the year.
Business investment declined 18.1% in 2009–10 and was the major factor detracting from economic growth in 2009-10. Machinery and equipment investment fell sharply, driving the fall in business investment. This reflected weak business confidence, which more than offset tax incentives and a stronger A$. Subdued domestic demand, excess supply and tight credit conditions resulted in sharp falls in non-residential construction, particularly office and retail/wholesale building. Engineering construction fell modestly, with the effects of the global downturn beginning in late 2008 more fully felt in 2009–10, as a result of the long construction lags associated with major projects.
| | |
| Annual Economic Report 2009–10 | | 3 |
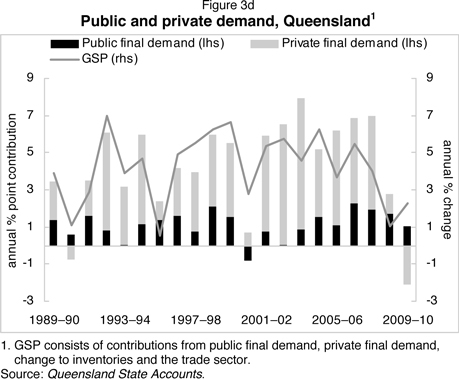
The public sector continued to support overall economic activity in 2009–10, with public final demand rising 4.1% and helping offset a contraction in private demand during the year.
The trade sector made the largest contribution to economic growth in 2009–10. Overseas goods exports rose 5.1%, as strong demand from emerging Asia supported coal export tonnages, and improved harvests in 2008–09 sustained export volumes of key agricultural commodities. However, reflecting lower coal contract prices for much of the year, as well as an appreciation of the A$, the nominal value of overseas merchandise exports fell by 23.5% in 2009–10, partly reversing the 60.1% rise in the previous year. Weak household consumption growth and a sharp fall in machinery and equipment investment contributed to a 6.1% fall in imports in 2009–10. Overall, the rise in the volume of exports and fall in imports resulted in net exports contributing 3.7 percentage points to overall economic growth.
In line with a contraction in private economic activity, employment growth in Queensland moderated to 0.9%, or 21,200 persons, in 2009–10, while average hours worked declined. After reaching a historic high of 67.7% in 2008–09, the labour force participation rate fell marginally to 67.5% in 2009–10. Despite the fall in the participation rate, the labour force in Queensland grew 2.3% in 2009–10, supported by ongoing civilian population growth. With growth in the labour force exceeding employment growth, the year-average unemployment rate in Queensland rose 1.3 percentage points, to 5.7%, in 2009–10. However, this represented a peak well below that recorded in previous downturns and below the long-run average unemployment rate of 7.0%.
Table 1a
Components of economic growth 1,2
| | | | | | | | | | | | | | | | | | | | | | | | | | | | | | | | |
| | | Queensland | | | Australia | |
| | | Annual change
(%) | | | Contribution 3
(percentage points) | | | Annual change
(%) | | | Contribution 3
(percentage points) | |
| | | 2008–09 | | | 2009–10 | | | 2008–09 | | | 2009–10 | | | 2008–09 | | | 2009–10 | | | 2008–09 | | | 2009–10 | |
Household consumption | | | 1.7 | | | | 1.7 | | | | 0.9 | | | | 0.9 | | | | 0.2 | | | | 2.1 | | | | 0.1 | | | | 1.1 | |
Private investment 4 | | | 0.6 | | | | -10.6 | | | | 0.2 | | | | -3.0 | | | | -0.4 | | | | -2.5 | | | | -0.1 | | | | -0.6 | |
Dwelling investment | | | -7.6 | | | | -3.6 | | | | -0.6 | | | | -0.3 | | | | -1.9 | | | | 1.1 | | | | -0.1 | | | | 0.1 | |
Business investment 4 | | | 7.6 | | | | -18.1 | | | | 1.2 | | | | -3.1 | | | | 1.7 | | | | -6.0 | | | | 0.2 | | | | -0.8 | |
Non-dwelling construction 4 | | | 16.6 | | | | -15.3 | | | | 1.2 | | | | -1.3 | | | | 7.7 | | | | -7.1 | | | | 0.5 | | | | -0.5 | |
Machinery and equipment 4 | | | 0.0 | | | | -20.8 | | | | 0.0 | | | | -1.8 | | | | -3.6 | | | | -4.9 | | | | -0.3 | | | | -0.3 | |
Private final demand 4 | | | 1.3 | | | | -2.6 | | | | 1.1 | | | | -2.1 | | | | 0.0 | | | | 0.7 | | | | 0.0 | | | | 0.5 | |
Public final demand 4 | | | 7.1 | | | | 4.1 | | | | 1.7 | | | | 1.0 | | | | 3.6 | | | | 7.1 | | | | 0.8 | | | | 1.6 | |
Change in inventories | | | na | | | | na | | | | -1.0 | | | | 0.6 | | | | na | | | | na | | | | -0.4 | | | | 0.2 | |
Gross state/national expenditure 5 | | | 1.7 | | | | -0.4 | | | | 1.8 | | | | -0.5 | | | | 0.2 | | | | 2.4 | | | | 0.2 | | | | 2.3 | |
Net exports | | | na | | | | na | | | | -0.2 | | | | 3.7 | | | | na | | | | na | | | | 1.4 | | | | 0.1 | |
Exports of goods and services | | | -1.7 | | | | 4.5 | | | | -0.5 | | | | 1.4 | | | | 2.6 | | | | 5.5 | | | | 0.6 | | | | 1.3 | |
Imports of goods and services | | | -1.0 | | | | -6.1 | | | | 0.4 | | | | 2.3 | | | | -3.3 | | | | 5.3 | | | | 0.8 | | | | -1.2 | |
Gross state/domestic product | | | 1.1 | | | | 2.3 | | | | 1.1 | | | | 2.3 | | | | 1.4 | | | | 2.3 | | | | 1.4 | | | | 2.3 | |
| 1. | Outcomes for overall economic growth and its components represent preliminary estimates based on the June quarter 2010 Queensland State Accounts. Subsequent releases of the Queensland State Accounts may contain revisions to 2009–10 outcomes. na – Indicates not applicable. |
| 2. | Queensland data based on chain volume measure (CVM), 2007–08 reference year; Australia based on 2008-09 CVM reference year. |
| 3. | Sum of component contributions to growth may not add to totals due to rounding. |
| 4. | For Queensland, excludes private sector net purchases of second-hand public sector assets. |
| 5. | Excludes statistical discrepancy. |
Sources: Queensland State Accounts and ABS 5204.0.
| | |
4 | | Annual Economic Report 2009–10 |
International conditions
The global economy resumed growing in the second half of 2009, after a year characterised by the sharpest contraction in global economic activity in the post-war era and unprecedented financial instability. An exceptional degree of monetary and fiscal stimuli, improvements in equity and corporate debt markets and a turnaround in the inventory cycle in many countries all supported this recovery. However, there was a marked difference in the pace of recovery across regions, with emerging economies continuing to outperform advanced economies.
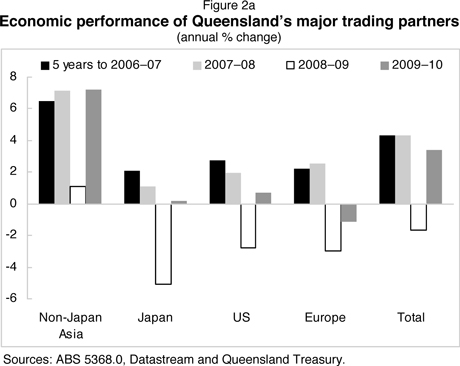
After contracting by 1.7% in 2008–09, Queensland’s major trading partner GDP recovered by 3.4% in 2009–10. This was driven by non-Japan Asia, where activity rose 7.2%, above the average growth of 6.5% in the five years ending 2006–07. Meanwhile, activity expanded a marginal 0.7% in the US, 0.2% in Japan, and contracted 1.1% in Europe (see Figure 2a).
Emerging Asia was less affected by the financial crisis than advanced economies, partly because its financial markets were less exposed to the deterioration in mortgage backed securities and other derivatives over 2008–09. Also, relatively stronger fiscal positions in some countries enabled governments to respond to weaker economic conditions with large stimulus packages. As a result, domestic demand in China and India, the largest emerging economies in Asia, remained robust in 2009–10 and led their respective monetary authorities to begin unwinding monetary policy support in early 2010. The strength of the Chinese and Indian economies also supported growth in other non-Japan Asian countries in 2009–10. Most economies in this region had returned to pre-crisis peaks in activity by the end of 2009.
In contrast, the recovery in activity across many advanced economies over 2009–10 was only modest, particularly relative to the sharp falls experienced previously. By the end of 2009–10, only seven out of the 33 full members forming the Organisation for Economic Co-operation and Development (OECD) had surpassed pre-crisis levels of activity. Capital investment was suppressed by excess production capacity resulting from the global downturn, while ongoing bank deleveraging and risk aversion continued to constrain the availability of business finance. Further, household balance sheet consolidation and relatively subdued growth in incomes due to a soft labour market remained a drag on consumer spending.
| | |
| Annual Economic Report 2009–10 | | 5 |
In Japan, Queensland’s largest trading partner, the Yen appreciated more than 7% in year-average terms against the US dollar, as risk averse investors continued to unwind Yen carry trades (whereby investors borrow Yen at low Japanese interest rates and invest in other currencies yielding higher interest rates). This weighed on the strength of the recovery by constraining exports, as well as corporate profits. As a consequence, businesses in Japan remained reluctant to invest in 2009–10, leading private non-residential investment to fall to its lowest level since 2002–03.
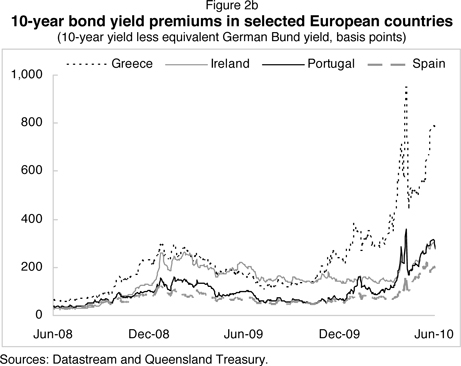
A key factor supporting the global economy over 2009–10 was aggressive fiscal expansion in many countries. However, the resulting increase in government spending, together with lower revenue due to weak economic activity, compounded existing structural deficits and elevated debt in many governments. Financial markets subsequently shifted concerns from private debt toward public debt, leading risk premiums on sovereign debt to rise significantly in countries perceived to have unsustainable fiscal paths, particularly within Europe. By the first half of 2010, the 10-year bond yield premium on government debt relative to German 10-year Bunds touched multi-decade highs in Greece, Spain, Ireland and Portugal (see Figure 2b), reflecting increased risk aversion toward the end of the financial year.
While increased risk aversion weighed on the Australian dollar (A$) late in 2009–10, the A$ still appreciated US13c against the US dollar in financial year terms, to average US88c. This was just below its level of US9Oc in 2007–08. Supporting the appreciation were higher world commodity prices, in line with improved global economic activity, as well as rising interest rate spreads on short and long-term debt between Australia and the US, particularly over the second half of 2009–10. Wider interest rate spreads largely reflected a divergence in economic outlooks and consequently, monetary policy settings, between Australia and the US. While the Reserve Bank of Australia (RBA) raised its official cash rate an aggregate 150 basis points over the year, the US Federal Reserve maintained its pledge to keep the federal funds rate exceptionally low for an extended period, and also engaged in a quantitative easing policy to lower longer-dated borrowing costs.
| | |
6 | | Annual Economic Report 2009–10 |
Australian economy
The Australian economy grew 2.3% in 2009–10, strengthening from 1.4% growth in 2008–09. Non-farm output increased 2.3% in 2009–10 (accelerating from 1.1% growth in 2008–09), while farm output fell by 1.5% (compared with 19.7% growth in 2008–09).
The fallout from the financial crisis and the nascent global recovery were key influences on the Australian economy throughout the course of 2009–10. Household consumption growth recovered to 2.1%, after recording its weakest year-average growth (0.2%) in 2008–09 since at least 1960–61. This reflected a gradual improvement in household wealth and a recovery in employment conditions throughout the year. In contrast, business investment fell 6.0% in 2009–10, after rising by 1.7% to an historic peak in 2008–09. Growth in public investment accelerated from 6.7% in 2008–09 to 24.9% in 2009–10, supporting total investment growth. After falling 1.9% in 2008–09, dwelling investment rose 1.1% in 2009–10, with the positive effects of the interest rate cuts and the First Home Owners Boost (FHOB) partly offset by continued caution amongst households and investors, and difficulties in obtaining finance for large residential projects.
On the external front, export growth strengthened from 2.6% in 2008–09 to 5.5% in 2009–10, driven by strong growth in exports of coal, metal ores and minerals and other non-rural goods. The recovery in domestic demand and an appreciating A$ drove a 5.3% increase in imports in 2009–10, following a decline of 3.3% in 2008–09. As a result, net exports contributed 0.1 percentage point to overall economic growth in 2009–10.
The number of persons employed nationally increased by 1.4% in 2009–10, below growth in the labour force for the second consecutive year. As a result, the year-average unemployment rose to 5.5% in 2009–10, from 5.0% in 2008–09. The labour force participation rate fell slightly in 2009–10, to 65.3%, from 65.6% a year earlier. Growth in the headline Consumer Price Index slowed to 2.3% in 2009–10, from 3.1% in 2008–09.
| | |
| Annual Economic Report 2009–10 | | 7 |
| 3 | Components of Queensland’s economic growth |
Household final consumption
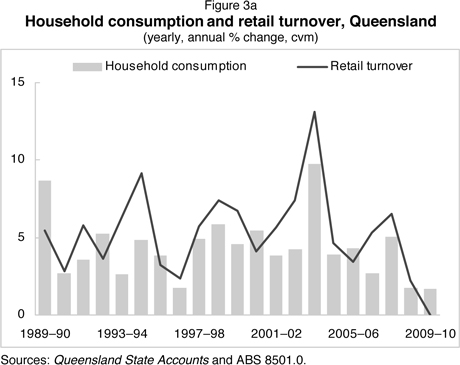
Household consumption growth, at 1.7% in 2009–10 was unchanged from growth in 2008–09, and well below average annual growth in the two decades preceding the financial crisis. Similarly, growth in consumption expenditure nationally, at 2.1% in 2009–10, was also below average.
Private consumption in Queensland was supported by solid population growth as well as higher average wages per employee. However, growth was constrained by a number of factors. Growth in disposable incomes was restrained by six separate 25 basis point rises in the official cash rate between October 2009 and May 2010, which exacerbated caution in households that had accumulated substantial debt during the housing boom earlier in the decade. The passing of federal government fiscal stimulus payments made in the prior year also weighed on spending in 2009–10. Subdued labour market conditions, reflected in the weakest year-average employment growth since the early 1990s recession, also affected both aggregate income growth and household’s propensity to consume.
Households largely focussed on essentials and reduced spending on discretionary items in 2009–10, with the retail sector particularly weak (See Figure 3a). Spending on rent and other dwelling services (up 3.4%), food (up 3.1%) and insurance and financial services (up 3.5%) were the largest contributors to growth, while spending on hospitality and recreation services declined. Benefitting from a higher A$ exchange rate, purchases of motor vehicles rose 6.1% in 2009–10, although this growth only partly offset an 18.7% fall in the previous year. A decline in dwelling investment in Queensland in recent years saw the level of spending on furnishings and household equipment remain unchanged in 2009–10, following a 7.3% fall in 2008–09
| | |
8 | | Annual Economic Report 2009–10 |
Dwelling investment
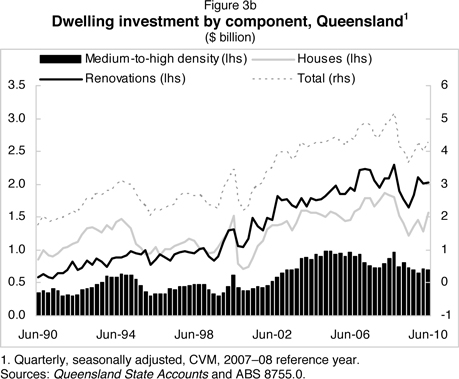
Dwelling investment in Queensland declined 3.6% in 2009–10, the third consecutive yearly fall. Partly reversing a decline over the previous two years, renovation activity rose 4.2% in the year, due to growth in house prices and a recovery in employment, particularly in the first half of the financial year. However, this was more than offset by a 10.0% fall in new and used dwelling investment in Queensland, driven largely by a fall in medium-to-high density construction.
The construction of medium-to-high density dwellings, including high rises, townhouses and units, declined 15.0% in 2009–10, with this type of activity requiring significant levels of specialised financing, the sources of which have been undermined since late 2008 when the global financial crisis intensified. The disruption to the mining boom caused by the crisis, as well as a downturn in inbound tourism, also adversely affected construction of units and apartments in regional Queensland.
With the FHOB bringing forward first home buyer activity in 2008–09, housing activity by first home buyers unwound in 2009–10. In addition, the RBA’s monetary tightening in the year saw variable mortgage rates return toward the long-run average. These factors saw finance approvals to purchase existing dwellings by owner occupiers, a measure of housing turnover, fall in 2009–10. The value of finance approvals by individuals to purchase existing dwellings for rent or resale, an indicator of investor activity, improved somewhat in 2009–10, but remained weighed down by tight credit conditions and concerns regarding the economic outlook.
Reflecting subdued housing demand by both owner occupiers and investors, house construction fell 4.4% in 2009–10. However, the financial year outcome masked some improvement in house construction through the year. In seasonally adjusted terms, the real value of house construction in June quarter 2010 was 28.4% above that of a year earlier, partly reversing a 33.9% fall over the year to June quarter 2009.
| | |
| Annual Economic Report 2009–10 | | 9 |
Business investment
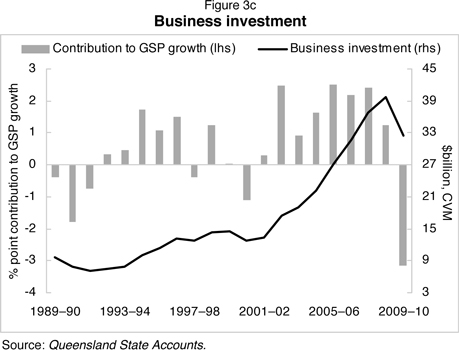
After more than tripling over the eight years to 2008–09, the real value of business investment (which consists of non-dwelling construction as well as machinery and equipment investment) fell 18.1% in 2009–10. Domestic demand in Queensland remained subdued and lending conditions remained tight in the aftermath of the global economic downturn, hindering investment, particularly commercial construction, in the year.
Non-dwelling construction (which consists of non-residential building and engineering construction) declined 15.3% in 2009–10. Driven by falls in commercial and industrial building construction, private non-residential building investment declined 23.7% in 2009–10. Additions to the supply of office space resulted in office vacancy rates remaining high, hampering the viability of new office projects. Subdued consumption growth saw construction of retail and wholesale facilities fall in the year. In contrast, construction of private education facilities was supported by the Federal Government’s Building the Education Revolution (BER) program.
Engineering construction fell 3.3% in 2009–10, the first decline since 2003–04. Engineering construction was at a historical high level in June quarter 2009, reflecting momentum from previous mining and private sector transport projects. However, with the completion of some major private sector infrastructure works in South East Queensland in early 2010, and uncertainty over the global recovery weighing on investment decisions, engineering construction weakened through the year.
In line with the fall in non-dwelling construction, machinery and equipment investment declined 20.8% in 2009–10. Overwhelming the impact of both Federal Government tax incentives and an appreciation of the A$ was weak business confidence, for which surveyed measures showed only a subdued recovery for Queensland throughout 2009–10. Business survey measures of trading conditions were particularly weak in 2009–10, in line with subdued household demand. However, capital spending recovered late in the financial year, with machinery and equipment investment rising 27.6% in seasonally adjusted terms in June quarter 2010, recovering much of the fall over the first three quarters of the financial year.
| | |
10 | | Annual Economic Report 2009–10 |
Public final demand
The public sector continued to support overall economic activity in 2009–10, with public final demand rising 4.1% and helping offset a contraction in private demand during the year (see Figure 3d). Growth in public final demand contributed 1.0 percentage point to overall economic growth in 2009–10, reflecting increases in State spending in vital service delivery areas, as well as increased infrastructure investment.
Public final demand measures investment spending by the general government sector and public trading enterprises, as well as government consumption expenditure, the latter of which is largely comprised of wages for government employees.
An increase in general government investment was the key driver of growth in public final demand, rising 19.2% in real terms in 2009–10, according to the Queensland State Accounts. Much of the increase is estimated to have been in the education sector, reflecting the Federal Government’s BER initiative. However, general government investment rose sharply in the three years prior to 2009–10, reflecting increased State government infrastructure spending in areas such as transport and health. As a result, general government investment has increased by around 90% in real terms over the past four years, helping to support Queensland’s fast rate of population growth.
An increase in State and local general government consumption expenditure of 2.3% was the second largest contributor to growth in public final demand in 2009–10, reflecting increased spending in key services such as health. However, reflecting fiscal consolidation, this rate of growth is below the average of 5.2% per annum over the previous three years.
In contrast, public enterprise investment fell by 12.1% in real terms in 2009–10, although this largely reflected the completion of several major transport and water infrastructure projects. In real terms, State and local public enterprise investment has doubled over the past six years, with significant investments in ports, rail and energy to accommodate strong global demand for Queensland’s resources.
| | |
| Annual Economic Report 2009–10 | | 11 |
Net exports
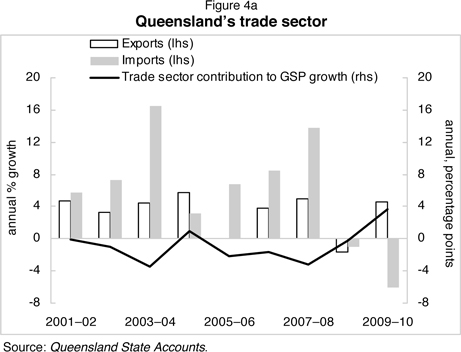
The trade sector was the key driver of economic growth in 2009-10, with net exports contributing 3.7 percentage points to overall economic growth in the year, the second largest annual contribution since the Queensland State Accounts began in 1985–86. This was driven by a strong recovery in exports, combined with a significant decline in imports.
Queensland’s total exports rose 4.5% in 2009–10, after falling 1.7% in 2008–09. Overseas goods exports rose 5.1% in the year, supported by rising coal demand from China, Japan and India. In contrast, the stronger A$ led to an 8.7% decline in overseas services exports in 2009–10.
Total interstate exports rose 10.0% in 2009–10, recovering much of the 10.4% decline recorded in the previous financial year. Interstate exports of goods grew 11.4% in the year, driven by growth in exports of machinery and transport equipment, petroleum products and related material, as well as beverages and tobacco. A return to more normal weather conditions saw growth in interstate tourism exports recover, to rise 6.5%. This followed a fall in interstate tourism exports of 15.9% in 2008–09, which was partly caused by unfavourable weather in major tourism regions.
Queensland’s total imports fell 6.1% in 2009–10, driven by a decline in interstate goods imports. In contrast, overseas goods imports rose 4.1% in the year, with a rebound in imports of consumption goods more than offsetting a fall in overseas imports of capital goods. Partially reflecting the stronger A$, overseas tourism imports increased a significant 18.3% in 2009-10, while interstate tourism imports also rose 10.2% after falling in each of the previous three years.
| | |
12 | | Annual Economic Report 2009–10 |
Overseas merchandise exports
After rising 60.1% in 2008–09, the nominal value of Queensland’s overseas merchandise exports fell 23.5% in 2009–10. A key driver of this fall in A$ export earnings was lower coal prices for much of the year. This more than offset a strong increase in coal export tonnages in 2009–10, supported by strong demand from emerging Asia. Another key factor suppressing nominal export earnings in the year was an 18.0% appreciation of the A$ against the US$, which directly reduced returns on exports denominated in US$ terms. The higher exchange rate also made A$ priced exports less competitive and therefore weighed on foreign demand for these products during the year.
Emerging Asia has continued to support Queensland’s merchandise exports since the global financial crisis and the ensuing global economic downturn, with the share of Queensland’s exports to this region increasing in recent years (see Table 4a). Specifically, the share of Queensland’s merchandise exports destined for China and India rose from an average of 12.5% in the decade to 2007–08, to 21.0% in 2008–09 and 28.1% in 2009–10.
Table 4a
Queensland's top five merchandise export destinations in 2009–10
(current prices, % of total merchandise exports)
| | | | | | | | | | | | |
| | | Ten years to 2007–08 | | | 2008–09 | | | 2009–10 | |
Japan | | | 27.0 | | | | 29.7 | | | | 22.6 | |
China | | | 6.0 | | | | 9.3 | | | | 16.0 | |
India | | | 6.5 | | | | 11.7 | | | | 12.1 | |
South Korea | | | 10.6 | | | | 11.3 | | | | 10.9 | |
Taiwan | | | 5.2 | | | | 5.7 | | | | 5.7 | |
Total | | | 55.3 | | | | 67.7 | | | | 67.3 | |
Source: ABS unpublished trade data.
Detailed commodity information relating to Queensland’s overseas merchandise exports in 2009–10 is presented in Table 4b, with the key features explained below.
| | • | | The nominal value of Queensland’s crude minerals exports fell 29.1% in 2009–10, to total $23.6 billion. Despite much higher export volumes, coal export values fell in 2009–10 due to lower coal contract prices for Japanese Fiscal Year 2009–10 (April 2009 to March 2010) following the financial crisis. Specifically, hard coking and semi-soft/PCI coking coal contract prices more than halved, while contract prices for thermal coal fell by over 40%. However, strong demand from emerging Asia saw coal contract prices recover strongly in June quarter 2010. For instance, the contract price for hard coking coal was negotiated at US$200 per tonne in June quarter 2010, compared with US$128 for the preceding four quarters. This resulted in the nominal value of coal exports increasing markedly towards the end of the year. |
| | • | | Hard coking coal export volumes rose 24.4%, to 92.1 million tonnes, in 2009–10, the highest financial year rise on record and driven mainly by rising demand from China, India and Japan. Most importantly, despite some easing in China’s demand through the year, the volume of hard coking coal exported to China in 2009–10 was almost 70% above that in 2008–09. |
| | • | | In contrast, total thermal coal export volumes fell 2.1%, to 53.0 million tonnes, in 2009–10. Exports to South Korea fell 35.0%, but this fall was offset by 62.7% and 21.7% rises in exports to China and Japan respectively. |
| | • | | In 2009–10, the nominal value of Queensland’s rural exports fell 14.8%, to total $5.4 billion. This fall was driven by a 17.7% decline in the value of meat exports and a 64.2% drop in the value of exports of feeding stuff for animals. The fall in the nominal value of meat exports (mostly beef) reflected the stronger A$ as well as increased competition from the US. Specifically, Korea relaxed restrictions on US beef imports (which were imposed after the discovery of mad cow disease in 2003), while US beef supply was boosted by a government subsidised cull of the dairy herd due to low milk prices. Reflecting strong harvests in 2008–09 that replenished stocks, export volumes of key agricultural commodities, such as wheat and cotton, continued to rise in 2009–10, despite a relatively low harvest in 2009–10. |
| | |
| Annual Economic Report 2009–10 | | 13 |
| | • | | The nominal value of processed minerals and metals exports fell 1.0% in 2009–10, to $3.6 billion. While base metal prices and export volumes were weak in the early part of 2009–10, demand improved considerably by the end of the year as global industrial production strengthened. Reflecting this, the world prices of aluminium (up 22.2%), copper (up 31.0%), nickel (up 28.7%), lead (up 3.3%) and zinc (up 15.6%) all increased over the twelve months to 30 June 2010. |
Table 4b
Overseas exports of Queensland merchandise goods
(current prices)
| | | | | | | | | | | | | | | | |
Export categories 1 | | 2008–09 | | | 2009–10 | | | Annual change | |
| | | $m | | | $m | | | $m | | | % | |
Rural 2 | | | | | | | | | | | | | | | | |
Meat | | | 3,463.3 | | | | 2,850.0 | | | | -613.4 | | | | -17.7 | |
Textile fibres | | | 424.3 | | | | 478.7 | | | | 54.4 | | | | 12.8 | |
Cereals and cereal preparations | | | 456.8 | | | | 447.0 | | | | -9.8 | | | | -2.2 | |
Vegetables and fruit | | | 343.0 | | | | 355.2 | | | | 12.2 | | | | 3.6 | |
Feeding stuff for animals | | | 509.9 | | | | 182.5 | | | | -327.4 | | | | -64.2 | |
Other rural | | | 1,140.5 | | | | 1,084.9 | | | | -55.5 | | | | -4.9 | |
Total | | | 6,337.8 | | | | 5,398.3 | | | | -939.5 | | | | -14.8 | |
Crude minerals | | | | | | | | | | | | | | | | |
Coal 3 | | | 30,308.1 | | | | 20,527.7 | | | | -9,780.4 | | | | -32.3 | |
Other crude minerals | | | 2,951.7 | | | | 3,054.9 | | | | 103.2 | | | | 3.5 | |
Total | | | 33,259.8 | | | | 23,582.6 | | | | -9,677.2 | | | | -29.1 | |
Manufactures | | | | | | | | | | | | | | | | |
Processed minerals and metals | | | | | | | | | | | | | | | | |
Non-ferrous metals | | | 3,284.0 | | | | 3,290.3 | | | | 6.3 | | | | 0.2 | |
Other processed minerals and metals | | | 305.3 | | | | 264.5 | | | | -40.8 | | | | -13.4 | |
Total | | | 3,589.3 | | | | 3,554.8 | | | | -34.5 | | | | -1.0 | |
Other manufactures | | | | | | | | | | | | | | | | |
Machinery and non-transport equipment | | | 1,208.1 | | | | 1,093.1 | | | | -115.0 | | | | -9.5 | |
Chemicals, fertilisers (excl. crude), plastics, etc. | | | 926.8 | | | | 572.0 | | | | -354.8 | | | | -38.3 | |
Transport equipment | | | 322.8 | | | | 248.7 | | | | -74.2 | | | | -23.0 | |
Leather, rubber, other materials, furniture, clothing, etc. | | | 313.9 | | | | 279.8 | | | | -34.1 | | | | -10.9 | |
Miscellaneous manufactures and beverages | | | 336.7 | | | | 346.6 | | | | 10.0 | | | | 3.0 | |
Total | | | 3,108.3 | | | | 2,540.2 | | | | -568.1 | | | | -18.3 | |
Total manufactures 4 | | | 6,697.6 | | | | 6,095.0 | | | | -602.7 | | | | -9.0 | |
Confidential and special 3 | | | 10,257.6 | | | | 8,197.7 | | | | -2,059.9 | | | | -20.1 | |
Total overseas exports of goods 5 | | | 56,552.9 | | | | 43,273.6 | | | | -13,279.3 | | | | -23.5 | |
| 1. | Based on the Standard International Trade Classification. |
| 2. | Due to ABS reclassification, raw cane sugar exports are included in the ‘confidential items’ export category rather than the ‘Rural’ export category. |
| 3. | Since February 2002 a proportion of coal exports (particularly pulverised coal injection (PCI) exports) has been classified as confidential by the ABS. Accordingly, these exports are included in the ‘confidential items’ export category, along with sugar and some processed metal exports. |
| 4. | Sum of processed minerals and metals and other manufactures. |
| 5. | The sum of individual categories may not equal total due to rounding. |
| Source: | ABS unpublished trade data. |
| | |
14 | | Annual Economic Report 2009–10 |
Employment
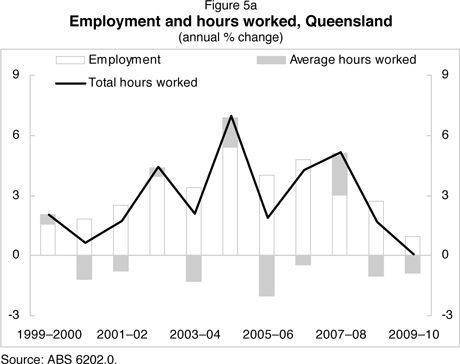
In line with a contraction in private domestic economic activity, employment growth in Queensland moderated to 0.9% in 2009–10, from 2.7% in 2008–09 (see Figure 5a). In comparison, employment in the rest of Australia rose 1.5%. The stronger national outcome was driven primarily by jobs growth in Victoria, with employment in the rest of the country (excluding Queensland and Victoria) growing at the same rate as Queensland in 2009–10.
Employers also responded to weaker economic conditions by reducing the work week, with average hours worked falling 0.9% in Queensland in 2009–10. This cushioned the moderation in employment growth in the year. However, with the rate of employment growth being offset by a similar rate of decline in the work week, total hours worked in the State remained largely unchanged in 2009–10 relative to 2008–09.
By industry group, strong jobs growth was recorded in the health care and social assistance, wholesale trade and administrative and support services industries in 2009–10 (see Table 5a). Specifically, employment growth in the health care and social assistance sector was due to job creation in hospitals and residential care services, reflecting the State Government’s continued commitment to service provision in that sector. Jobs growth in the wholesale trade industry was broad based, with the largest gain seen in machinery and equipment wholesaling, partly due to activity aimed at servicing upcoming resource sector projects.
Industries with poor employment outcomes in 2009–10 were broadly in line with the sectors of the economy under strain during the year. The largest employment falls were seen in the construction, education and training, retail trade, transport, postal and warehousing and information, media and telecommunication industries. In particular, lower business and dwelling investment drove a fall in construction employment, while below average growth in private consumption hindered retail employment.
| | |
| Annual Economic Report 2009–10 | | 15 |
Reflecting the demographic composition of employment in certain industries, jobs growth also varied considerably between different age cohorts in 2009–10. Young people (aged 15 to 19 years) recorded a decline in employment in 2009–10, driven by falls in the technicians and trades workers occupations, in line with a fall in private construction activity. In comparison, employment growth for persons aged over 55 was strong in 2009–10.
| | | | | | | | | | | | | | | | | | | | | | | | |
| Table 5a | |
| Employment by industry, Queensland | |
| | | |
Industry/Sector | | 2009–10 | | | Annual change
(‘000 persons) | | | Annual growth (%) | |
| | | ‘000
persons | | | % of total | | | 2009–10 | | | 10 year
average | | | 2009–10 | | | 10 year
average1 | |
Primary and secondary | | | 321.1 | | | | 14.2 | | | | 0.9 | | | | 2.2 | | | | 0.3 | | | | 0.7 | |
Agriculture, forestry and fishing | | | 89.5 | | | | 4.0 | | | | 8.2 | | | | -2.0 | | | | 10.1 | | | | -2.0 | |
Mining | | | 43.2 | | | | 1.9 | | | | -3.5 | | | | 2.5 | | | | -7.5 | | | | 9.0 | |
Manufacturing | | | 188.4 | | | | 8.3 | | | | -3.8 | | | | 1.8 | | | | -2.0 | | | | 1.0 | |
Services | | | 1944.3 | | | | 85.8 | | | | 13.1 | | | | 59.1 | | | | 0.7 | | | | 3.7 | |
Electricity, gas, water and waste services | | | 28.5 | | | | 1.3 | | | | 1.2 | | | | 1.5 | | | | 4.4 | | | | 7.8 | |
Construction | | | 235.7 | | | | 10.4 | | | | -11.9 | | | | 9.3 | | | | -4.8 | | | | 5.2 | |
Wholesale trade | | | 82.4 | | | | 3.6 | | | | 15.0 | | | | 0.9 | | | | 22.3 | | | | 1.2 | |
Retail trade | | | 255.1 | | | | 11.3 | | | | -8.9 | | | | 5.6 | | | | -3.4 | | | | 2.5 | |
Accommodation and food services | | | 162.4 | | | | 7.2 | | | | 1.3 | | | | 3.2 | | | | 0.8 | | | | 2.2 | |
Transport, postal and warehousing | | | 132.7 | | | | 5.9 | | | | -8.8 | | | | 4.3 | | | | -6.2 | | | | 4.0 | |
Information media and telecommunications | | | 29.4 | | | | 1.3 | | | | -6.1 | | | | -0.5 | | | | -17.2 | | | | -1.5 | |
Financial and insurance services | | | 57.7 | | | | 2.5 | | | | -3.4 | | | | 1.9 | | | | -5.6 | | | | 3.9 | |
Rental, hiring and real estate services | | | 50.8 | | | | 2.2 | | | | -2.6 | | | | 2.1 | | | | -4.9 | | | | 5.5 | |
Professional, scientific/technical services | | | 150.9 | | | | 6.7 | | | | 6.3 | | | | 5.8 | | | | 4.4 | | | | 5.0 | |
Administrative and support services | | | 78.4 | | | | 3.5 | | | | 10.7 | | | | 2.6 | | | | 15.8 | | | | 4.2 | |
Public administration and safety | | | 137.5 | | | | 6.1 | | | | 7.9 | | | | 5.1 | | | | 6.1 | | | | 4.8 | |
Education and training | | | 161.2 | | | | 7.1 | | | | -10.0 | | | | 4.8 | | | | -5.8 | | | | 3.6 | |
Health care and social assistance | | | 246.9 | | | | 10.9 | | | | 19.2 | | | | 9.3 | | | | 8.4 | | | | 4.8 | |
Arts and recreation services | | | 38.0 | | | | 1.7 | | | | 3.1 | | | | 1.2 | | | | 8.9 | | | | 3.7 | |
Other services | | | 96.7 | | | | 4.3 | | | | 0.1 | | | | 1.9 | | | | 0.1 | | | | 2.2 | |
All industries 2,3 | | | 2265.3 | | | | 100.0 | | | | 14.2 | | | | 61.3 | | | | 0.6 | | | | 3.2 | |
Notes:
| 2. | Industry estimates of employment are only available on the mid-month of each quarter, and therefore do not match aggregate estimates of employed persons derived from monthly data. |
| 3. | The sum of individual industries may not add to total due to rounding. |
Source: ABS 6291.0.55.003.
Labour market outcomes varied across regions in 2009–10, with employment falling most notably in the West Moreton and the Mackay-Fitzroy Central West regions, while Brisbane, Wide Bay-Burnett, the Sunshine and Gold Coast recorded jobs growth. Employment in the Far North also fell, seeing this region record the sharpest rise in the unemployment rate.
Participation rate and the labour force
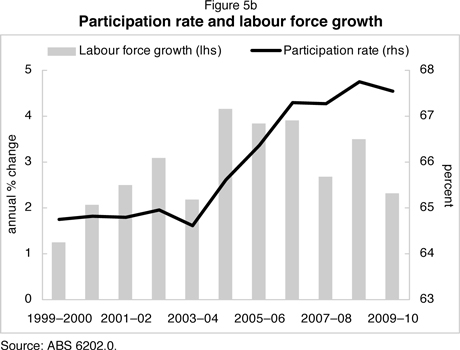
The State’s labour force participation rate fell slightly from its historic high of 67.7% in 2008–09, to 67.5% in 2009–10, as weaker economic conditions discouraged some persons from entering the labour force. However, the State’s participation rate remained well above that of the rest of Australia in the year. The only state to have a higher participation rate than Queensland in 2009–10 was Western Australia, at 68.3%.
The relatively stable participation rate in Queensland between 2008–09 and 2009–10 masked a deviation in trends across age cohorts. The participation rate of 15 to 19 year olds fell in 2009–10, from 66.5% to 62.8%, reflecting weaker job prospects for that cohort. As a result, the proportion of 15 to 19 year olds attending full time education rose to a historic high in 2009–10. In line with better job prospects, and a desire to remain in the workforce longer, the participation rates of age cohorts from 45 onwards reached historic highs in 2009–10. Despite some fall in the participation rate, the labour force (persons employed or unemployed) in Queensland grew 2.3% in 2009–10 (see Figure 5b), driven by ongoing solid civilian population growth. However, the rate of labour force growth was below previous years, which were characterised by a rising participation rate in addition to population growth.
| | |
16 | | Annual Economic Report 2009–10 |
Unemployment
With labour force growth of 2.3% outpacing jobs growth of 0.9%, the year-average unemployment rate rose 1.3 percentage points, to 5.7% in 2009–10, the second consecutive year-average increase (see Figure 5c). The year-average rate in the rest of Australia also rose in 2009–10, from 5.1% to 5.4%. In 2009–10, young persons aged 15 to 24 in Queensland’s faced the largest increases in unemployment rates, due to weaker employment outcomes for this age cohort, with other age groups generally recording much smaller rises in unemployment rates. However, Queensland’s monthly trend unemployment rate peaked at 6.0% in October 2009, and declined to 5.4% by June 2010, well below the long-run average.
| | |
| Annual Economic Report 2009–10 | | 17 |
Consumer prices
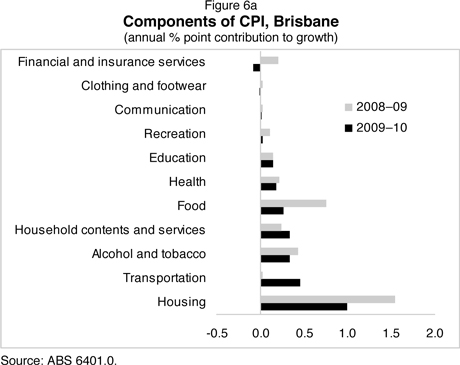
The Brisbane Consumer Price Index (CPI) increased 2.7% in 2009–10, easing from 3.7% growth in 2008–09. This was the second consecutive year in which CPI growth moderated, reflecting a continued unwinding of factors which drove strong inflation in previous years, such as higher oil prices, buoyant economic growth and domestic capacity constraints.
Similar to the preceding two years, housing was the largest contributor to inflation, accounting for over one third of the rise in the CPI. However, its contribution eased compared with 2008–09, given slower growth in rents and housing costs.
Transportation was the second largest contributor to Brisbane inflation in 2009–10. Alcohol and tobacco also contributed significantly to Brisbane’s CPI growth in 2009–10, following further federal tax increases in early 2010.
Price pressures were contained on discretionary goods and services, including household contents, recreation and clothing and footwear, due to an appreciation of the A$, along with weak price growth overseas and subdued domestic household demand.
Nationally, average consumer price inflation across the eight Australian capital cities also moderated, from 3.1% in 2008–09, to 2.3% in 2009–10. Similar to Brisbane, increases in the cost of housing and alcohol and tobacco were the major contributors to national inflation. Through the year measures of underlying inflation moderated from 4.2% and 3.6% for weighted median and trimmed mean respectively in June quarter 2009 to 2.7% for both measures in June quarter 2010, bringing inflation back within the RBA’s 2–3% target band.
| | |
18 | | Annual Economic Report 2009–10 |
Wages
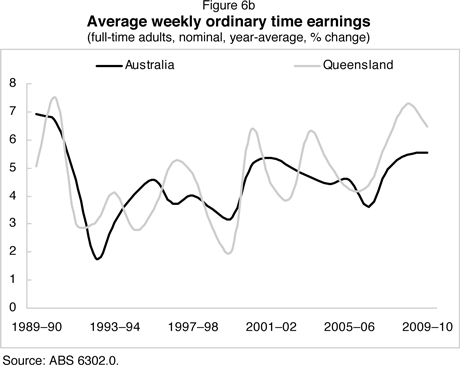
Despite slower employment growth and a rise in the unemployment rate during the first half of the year, wages growth in Queensland remained strong in 2009–10, partly reflecting the lagged impact of tight labour market conditions in prior years. Average weekly ordinary full-time earnings (AWOTE) in Queensland increased 6.5%, to $1,213 per week in 2009–10. Apart from the 7.3% growth recorded in 2008–09, this was the strongest growth since 1990–91 (see Figure 6b).
National AWOTE rose 5.6% in 2009–10, to $1,231 per week. By industry, national wage growth was strongest in construction (up 7.7%), electricity, gas, water and waste services (7.6%), administrative and support services (7.4%) and mining (7.2%), in line with relatively resilient engineering construction and resources sectors. Growth was weakest in the manufacturing (1.8%) and wholesale trade (2.2%) industries.
The Wage Price Index (WPI) measures the increase in the price of labour that is not attributable to measurable changes in the quality or quantity of work performed, and is therefore an alternative measure of labour costs. In Queensland, the WPI rose by 3.3% in 2009–10, easing from the 4.2% growth in the two previous years. The public sector WPI in Queensland rose 4.3% in 2009–10, while the private sector WPI rose 2.9%.
The Australian WPI rose 3.1% in 2009–10, easing from 4.0% in the previous year. Similar to the pattern in Queensland, the public sector WPI rose 4.2%, while the private sector WPI rose 2.8%. Industry data showed national WPI growth was strongest in electricity, gas, water and waste services (up 4.5%), education and training (4.0%), health care and social assistance (4.0%) and public administration and safety (3.9%).
| | |
| Annual Economic Report 2009–10 | | 19 |
Queensland’s resident population increased at an annual rate of 2.4% in the first three quarters of 2009–10 (latest data available). In comparison, the resident population in the rest of Australia is estimated to have risen by 1.9% over this period. Queensland’s share of the national population remained over 20% in 2009–10.
Queensland has recorded faster population growth than the average of the rest of Australia in each year since 1970–71. Queensland’s population has grown at an average annual rate of 2.3% over the past two decades, around double the 1.1% recorded in the rest of Australia.
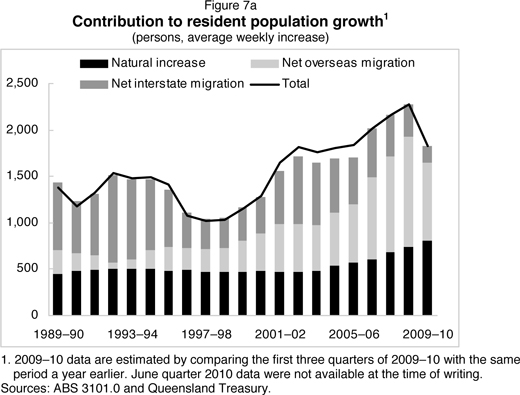
Historically, faster population growth in Queensland has been largely attributable to a higher level of net interstate migration relative to other states. While net interstate migration to Queensland remains much higher than any other State, it has generally eased since 2002–03. This partly reflects some narrowing in the house price gap between Brisbane and Sydney in particular, with New South Wales accounting for more than two-thirds of all net interstate migration to Queensland. Net interstate migration in 2009–10 is estimated to have been the lowest since 1983–84. This can be partly attributed to a period of weaker economic growth nationally, which tends to result in lower interstate migration flows across Australia.
Through the first three quarters of 2009–10, Queensland’s population rose on average by slightly more than 1,800 persons per week. Net overseas migration has been the primary driver of growth since 2005–06 (see Figure 7a), coinciding with a widening economic growth differential between Australia and countries which are the main source of overseas migrants. However, net overseas migration across major states, including Queensland, began to ease in 2009–10, partly reflecting changes to migration rules made by the Australian government.
Consistent with national trends, there has been a pick up in natural increase (births less deaths) in Queensland since 2002–03. Queensland’s natural increase reached record levels in 2009–10.
| | |
20 | | Annual Economic Report 2009–10 |