EXHIBIT (c)(iv)
Report entitled “Queensland’s 2012-13 Mid Year Fiscal and Economic Review”
Queensland Treasury and Trade
State Budget 2012-13
Mid Year Fiscal and Economic Review
STATE BUDGET 2012-13
MID YEAR FISCAL AND ECONOMIC REVIEW
CONTEXT
The 2012-13 Budget implemented significant fiscal repair in Queensland. The Government adopted a new set of fiscal principles clearly aimed at improving the sustainability of the State’s finances. These new principles are:
| | • | | Stabilise then significantly reduce debt |
| | • | | Achieve and maintain a General Government sector fiscal balance by 2014-15 |
| | • | | Maintain a competitive tax environment for business |
| | • | | Target full funding of long term liabilities such as superannuation in accordance with actuarial advice. |
These new fiscal principles and the findings and recommendations of the Independent Commission of Audit guided Government decision making during the preparation of the 2012-13 Budget. The 2012-13 Budget delivered savings measures totalling $7.8 billion over the 2012-13 to 2015-16 period, after delivering the Government’s election commitments. These savings were made by exiting activities that are not the domain of the Queensland Government, by reducing waste and inefficiency in Government activities and by implementing specifically targeted revenue measures. These fiscal principles continue to guide the fiscal decisions of the Government.
ECONOMIC OVERVIEW
The Queensland economy grew 4% in 2011-12. Growth occurred primarily on the strength of business investment in the resources sector. However, external conditions have deteriorated since the 2012-13 State Budget was released in September. The economic growth outlook for Queensland’s major trading partners has been downgraded to 2 1/2% in 2012 and 2 3/4% in 2013, compared with 3% in each of these two years at the time of the Budget. These downward revisions are consistent with the latest forecasts published by the IMF in October and Consensus Economics in November. Most noticeably, the European Union (EU) has fallen back into recession and this downturn is now expected to extend well into 2013. In the US, although there has been some positive economic data, fiscal consolidation is expected to weigh on growth in the near term.
Developments in the EU and US are impacting on Asia. Specifically, the latest economic releases indicate that the rates of growth in industrialised Asian economies, including Japan, Korea, Singapore and Taiwan, have decelerated significantly since the middle of 2012, mainly due to weaker exports. In China, annual growth in industrial production slowed to 8.9% in August 2012, before recovering slightly in the last three months. However, current growth remains well below its historical average and is unlikely to recover strongly given the current weakness in imports of intermediate goods used for industrial production. These developments in Asia have resulted in more protracted falls in coal demand and, therefore, lower coal prices. This has led to forecasts for Queensland’s coal export tonnages and their prices in both 2012-13 and 2013-14 being downgraded. Lower predicted coal prices also mean that the terms of trade are now lower than previously expected.
| | | | |
| | Mid Year Fiscal and Economic Review 2012-13 | | Page 1 |
A weaker global outlook has seen business remain cautious and survey measures of business conditions and confidence deteriorate. This has led to a significant weakening in labour market conditions in Queensland. Employment in 2012-13 is now expected to grow by only 1/4%, down from 3/4% in the Budget, and in 2013-14 growth has also been downgraded by 1/4 percentage point, to 2 1/4%. Corresponding to this weaker employment growth, the year average unemployment rate is now forecast to be 1/4 percentage point higher in both 2012-13 and 2013-14. The rate is still expected though to remain well below the twenty year average of 6.9%.
The revised forecasts of slower growth in employment, as well as lower terms of trade, will impact on household income. Consequently, household consumption and dwelling investment are now expected to be lower than at Budget. To support the construction sector the Government introduced a $15,000 First Home Owner Construction Grant from 12 September 2012 for the purchase or construction of a new home. As at the end of November, 126 grants had been paid to first home owners under this initiative. It is important to understand that this partly reflects, for contracts to build a home, applicants not being eligible to receive payment until either completion of construction or, in the case of applicants applying through a financial institution, until the first draw down of funds has occurred. Hence, it will take more than six months before the impact of the grant on encouraging activity in the construction sector can be clearly assessed, allowing for the lag between signing a contract and construction. The Government will be commencing an advertising campaign in 2013 to ensure buyers are aware of the First Home Owner Construction Grant benefits.
Forecasts for business investment, the current key driver of growth in Queensland, only factor in major projects already under construction or that have reached final investment decision. Accordingly, recent announcements of the cancellation or deferral of some “planned” or “possible” projects will have a negligible impact on the economic forecasts for business investment. Nonetheless, the weaker global and domestic outlook will result in the non-mining component of business investment being weaker than expected at Budget time in both 2012-13 and 2013-14.
As a result of the weaker global and domestic outlook, GSP growth forecasts have been downgraded by 1/4 percentage point in both 2012-13 and 2013-14 to 3 3/4% and 3 1/2% respectively.
The September quarter 2012 consumer price inflation outcomes were in line with the forecast made at Budget time. With the carbon price expected to add around 3/4 of a percentage point to the headline inflation rate in 2012-13, underlying inflation is still forecast to remain around 2% in the year. Softer domestic demand and a weaker labour market means that headline inflation is now forecast to be 2 1/2% in 2013-14, compared with 2 3/4% at Budget time.
Table 1
Economic forecasts, Queensland
(year average, original terms)
| | | | | | | | | | | | | | | | | | | | |
| Parameter | | 2011-12 | | | 2012-13 | | | 2013-14 | |
| | | Outcome | | | Budget | | | MYFER | | | Budget | | | MYFER | |
Real GSP | | | 4.0 | | | | 4 | | | | 3¾ | | | | 3¾ | | | | 3½ | |
Employment1 | | | 1.2 | | | | ¾ | | | | ¼ | | | | 2½ | | | | 2¼ | |
Unemployment rate | | | 5.5 | | | | 6 | | | | 6¼ | | | | 5¾ | | | | 6 | |
CPI2 | | | 1.9 | | | | 2¾ | | | | 2¾ | | | | 2¾ | | | | 2½ | |
Wage Price Index | | | 3.7 | | | | 3¼ | | | | 3 | | | | 3½ | | | | 3¼ | |
Population | | | 1.8 | | | | 1¾ | | | | 1¾ | | | | 1¾ | | | | 1¾ | |
Notes:
| 1. | Based on re-benchmarked ABS labour force data. |
| 2. | Inflation in 2012-13 includes a ¾ percentage point contribution from the introduction of the carbon price. |
| | | | |
| Page 2 | | Mid Year Fiscal and Economic Review 2012-13 | | |
FISCAL OUTLOOK
Table 2
General Government sector – key financial aggregates1
| | | | | | | | | | | | | | | | | | | | | | | | |
| | | 2011-12
Actual2
$ million | | | 2012-13
Budget
$ million | | | 2012-13
Est. Act
$ million | | | 2013-14
Projection
$ million | | | 2014-15
Projection
$ million | | | 2015-16
Projection
$ million | |
Revenue | | | 45,794 | | | | 42,224 | | | | 41,565 | | | | 46,980 | | | | 51,224 | | | | 52,410 | |
Expenses | | | 46,027 | | | | 48,518 | | | | 48,264 | | | | 47,764 | | | | 48,531 | | | | 50,290 | |
Net operating balance | | | (233 | ) | | | (6,294 | ) | | | (6,699 | ) | | | (783 | ) | | | 2,693 | | | | 2,121 | |
Fiscal balance | | | (5,482 | ) | | | (10,768 | ) | | | (11,213 | ) | | | (4,647 | ) | | | 534 | | | | 670 | |
Borrowing (NFPS)3 | | | 61,521 | | | | 73,717 | | | | 72,447 | | | | 79,135 | | | | 80,638 | | | | 82,536 | |
Notes:
| 1. | Numbers may not add due to rounding. |
| 2. | Reflects published actuals. |
| 3. | NFPS: Non-financial Public sector. |
Fiscal balance
The 2011-12 fiscal balance improved by $141 million from the estimated actual included in the 2012-13 Budget. This improvement reflects higher than expected revenue across a range of categories and marginally lower capital purchases.
The General Government fiscal balance expected for 2012-13 is a deficit of $11.213 billion compared to a forecast deficit of $10.768 billion at the time of the 2012-13 Budget. The forecast General Government sector fiscal balance is expected to be weaker than published in the 2012-13 Budget from 2012-13 to 2015-16.
The weaker 2012-13 fiscal balance position is primarily due to reductions in expected royalty revenue principally due to lower than forecast coal prices and volumes reflecting weaker global economic conditions. Royalties are now forecast to be $1.362 billion lower over the period 2012-13 to 2015-16 than expected at the time of the 2012-13 Budget.
The change in the fiscal balance has been driven by the impact of softer global economic conditions on revenue rather than elements within the Government’s control. The Government has continued to actively manage spending. General Government expenses are $1.117 billion lower over 2012-13 and the forward estimates than forecast in the 2012-13 Budget.
Table 3 provides a breakdown of the movements in the net operating and fiscal balances since the 2012-13 Budget.
The significant year to year improvement in the fiscal balance across the forward estimates continues to be driven by the $7.8 billion in savings measures contained in the 2012-13 Budget which remain on track to be delivered.
| | | | |
| | Mid Year Fiscal and Economic Review 2012-13 | | Page 3 |
Table 3
Reconciliation of net operating balance and fiscal balance
2012-13 Budget to 2012-13 MYFER1
| | | | | | | | | | | | | | | | |
| | | 2012-13 $ million | | | 2013-14 $ million | | | 2014-15 $ million | | | 2015-16 $ million | |
Net Operating Balance | |
2012-13 Budget net operating balance | | | (6,294 | ) | | | 17 | | | | 2,871 | | | | 2,241 | |
Taxation revisions | | | (37 | ) | | | (59 | ) | | | (52 | ) | | | (50 | ) |
Royalty revisions | | | (433 | ) | | | (528 | ) | | | (256 | ) | | | (145 | ) |
Natural disaster revisions2 | | | 9 | | | | (250 | ) | | | 242 | | | | — | |
Net flows from Public Non-financial Corporation entities3 | | | (83 | ) | | | 63 | | | | (82 | ) | | | 153 | |
Policy measures | | | (51 | ) | | | (153 | ) | | | (75 | ) | | | (130 | ) |
Other parameter adjustments4 | | | 190 | | | | 127 | | | | 45 | | | | 52 | |
2012-13 MYFER net operating balance | | | (6,699 | ) | | | (783 | ) | | | 2,693 | | | | 2,121 | |
Fiscal Balance | |
2012-13 Budget fiscal balance | | | (10,768 | ) | | | (3,752 | ) | | | 652 | | | | 747 | |
Change in net operating balance | | | (405 | ) | | | (800 | ) | | | (178 | ) | | | (120 | ) |
Natural disaster capital revisions2 | | | 323 | | | | (323 | ) | | | — | | | | — | |
Other capital movements5 | | | (363 | ) | | | 228 | | | | 59 | | | | 43 | |
2012-13 MYFER fiscal balance | | | (11,213 | ) | | | (4,647 | ) | | | 534 | | | | 670 | |
Notes:
| 1. | Numbers may not add due to rounding. Denotes impact on the operating and fiscal balances. |
| 2. | Represents movements in revenue, expense and capital for natural disaster restoration. |
| 3. | Represents revisions to dividends and tax equivalent payments from, and community service obligation payments to, PNFCs. |
| 4. | Refers to adjustments of a non-policy nature including actuarial revisions and changes to interest costs. |
| 5. | Refers to capital movements including the change in timing of capital payments including deferrals, capital payables and receivables and change in inventories. |
Australian Government payments
The Australian Government released its 2012-13 Mid Year Economic and Fiscal Outlook on 22 October 2012. The Commonwealth Government cut a net $756 million in payments for specific purposes to Queensland over the 2012-13 to 2015-16 period. This reduction is largely in the areas of health and education and will have a direct impact on service delivery.
The Commonwealth cut National Health Reform funding in 2012-13 by $103 million (compared to what was expected when the State Budget was delivered). This reflects a reduction of $63 million relating to 2012-13 and repayment of $40 million relating to 2011-12.
The reduction in health payments to Queensland includes a component relating to recast population data arising from the 2011 Census. The Australian Government’s decision to reduce health payments on the basis of the recast population data is flawed, as it is based on the outcome of the 2011 Census with an unrevised estimated resident population for 2010 based on the 2006 Census, while its own agency, the Australian Bureau of Statistics, has clearly stated that these two numbers are not comparable.
These Commonwealth funding reductions represent around 1.1 per cent of the budget to the Hospital and Health Services (HHS). The Commonwealth’s cuts reduce Queensland National Healthcare Reform funding by $63 million in 2012-13, increasing to $95 million in 2015-16 which would pay for 84,549 normal births, 15,487 hip replacements or more than 112,000 tonsillectomies.
| | | | |
| Page 4 | | Mid Year Fiscal and Economic Review 2012-13 | | |
HHS will be required to manage the Commonwealth funding cuts which may lead to lower levels of service delivery than currently planned. This will be challenging given the significant efficiency and productivity improvement savings that were factored into the 2012-13 Budget.
The majority of the cuts to education will flow directly to the non-State school sector. The remaining reduction in Commonwealth funding will directly impact service delivery in State schools.
Further, funding from the Australian Government has a significant impact on Queensland’s fiscal position when it is not matched by an expense in the same financial year. This increases the volatility of the headline estimates which then need to be adjusted to identify underlying trends.
In particular, the Australian Government provided significant natural disaster funding in advance of spending requirements which peak in 2012-13. This timing mismatch, to assist in showing a surplus in the Commonwealth’s Budget in 2012-13, has a negative impact on Queensland’s 2012-13 fiscal position.
Table 4 outlines the impact of natural disaster arrangements on Queensland’s fiscal balance.
Table 4
Impact of Natural Disaster Relief and Recovery Arrangements
funding on the fiscal balance1
| | | | | | | | | | | | | | | | |
| | | 2012-13
$ million | | | 2013-14
$ million | | | 2014-15
$ million | | | 2015-16
$ million | |
Published fiscal balance | | | (11,213 | ) | | | (4,647 | ) | | | 534 | | | | 670 | |
less Disaster revenue2,3 | | | 32 | | | | 1,241 | | | | 1,934 | | | | 308 | |
add Disaster expenditure | | | 4,167 | | | | 2,694 | | | | 527 | | | | — | |
Underlying fiscal balance | | | (7,078 | ) | | | (3,194 | ) | | | (873 | ) | | | 362 | |
Notes:
| 1. | Includes revenue and expenditure in relation to 2010-11 floods and Cyclone Yasi as well as prior events and more recent events. |
| 2. | Revenues are expected to occur in the financial year following the delivery of the works to which it relates. |
| 3. | Excludes loans provided through the State, which are not treated as revenue. |
Expenses
General Government expenses in 2012-13 are expected to be $48.264 billion, $254 million (or 0.5%) lower than the Budget estimates.
Estimates of employee expenses are slightly below the 2012-13 Budget estimates for all forecast years including 2012-13 reflecting the Government’s continued fiscal repair efforts and ongoing fiscal restraint. Employee expenses are expected to grow on average 2 1/2% per annum between 2011-12 and 2015-16, consistent with the 2012-13 Budget estimate of employee expense growth.
The Government continues to ensure that expenses growth is contained. Table 5 illustrates that 2012-13 MYFER estimates of expenses are below the 2012-13 Budget estimates in 2012-13 and for each year of the forward estimates. Between 2012-13 and 2015-16 expenses are $1.117 billion lower than the 2012-13 Budget. This is largely due to cuts in Commonwealth funding reducing the resources available for service delivery including to health and non-State schools and actuarial adjustments to superannuation and long service leave. This reduction in expenses comes despite funding being set aside for Queensland’s plan for the National Disability Insurance Scheme.
| | | | |
| | Mid Year Fiscal and Economic Review 2012-13 | | Page 5 |
Table 5
General Government Expenses
2012-13 Budget to Mid Year Fiscal and Economic Review
| | | | | | | | | | | | | | | | |
| | | 2012-13 | | | 2013-14 | | | 2014-15 | | | 2015-16 | |
| | | $ million | | | $ million | | | $ million | | | $ million | |
2012-13 Budget total expenses | | | 48,518 | | | | 47,950 | | | | 48,776 | | | | 50,722 | |
2012-13 MYFER total expenses | | | 48,264 | | | | 47,764 | | | | 48,531 | | | | 50,290 | |
Change since 2012-13 Budget | | | (254 | ) | | | (186 | ) | | | (245 | ) | | | (432 | ) |
Revenues
General Government revenues in 2012-13 are estimated to be $41.565 billion, $659 million less than the 2012-13 Budget estimate. This primarily reflects lower than forecast royalty revenue and cuts in Australian Government funding to Queensland primarily in the areas of health and education. Over the period 2012-13 to 2015-16, revenue is $2.621 billion lower than forecast in the 2012-13 Budget. Similar to 2012-13, the major contributors to the lower than forecast revenue are cuts in Australian Government funding to Queensland (of $756 million over the 2012-13 to 2015-16 period) and lower than forecast royalty revenue. The cuts in Commonwealth funding are largely offset in a fiscal sense by the pass through of lower expenditure.
Royalties are a very volatile source of revenue; the average absolute change in the hard coking coal price year to year has been US $46 per tonne over the decade to 2011-12.
The estimated premium hard coking coal price in the 2012-13 Budget was US $199 per tonne in 2012-13, below the Consensus Economics forecast (August 2012) at the time of US $218, while the hard coking contract price forecast of US $215 per tonne in 2013-14 was in line with Consensus Economics.
Budget volumes were also less than industry indicated to the Office of State Revenue prior to Budget, reflecting Treasury’s more conservative assessment of demand.
Unfortunately, the outlook for our major trading partners is now significantly weaker than anticipated at the time the Budget forecasts were prepared. As a consequence the near term outlook for the coal market is weaker.
Volumes and prices for coking coal have therefore both been revised down further. Lower coking coal prices in particular are driving the revision, with royalties estimated to be $1.362 billion lower over the period 2012-13 to 2015-16.
Royalty assumptions for 2012-13 and the forward estimates are outlined in Table 18 with taxation and royalty projections in Table 17. Table 19 includes details of how market expectations of coking coal prices have deteriorated in recent months.
| | | | |
| Page 6 | | Mid Year Fiscal and Economic Review 2012-13 | | |
Balance sheet
Non-financial Public Sector
The Non-financial Public sector (NFPS) is the consolidation of the General Government and Public Non-financial Corporations (i.e. commercial) sectors, with transactions between these sectors eliminated.
Borrowings of $72.447 billion are projected at 30 June 2013 in the NFPS, $1.27 billion less than the 2012-13 Budget estimate. By 2014-15, borrowings are expected to reach $80.638 billion, $1.111 billion less than the 2012-13 Budget estimate, and $5.688 billion less than the comparable number published in the Interim Report of the Independent Commission of Audit for 2014-15.
As outlined below, borrowings in the General Government sector are higher than forecast. This reflects the deterioration in the fiscal balance across the forward estimates due primarily to lower than expected royalty revenues. However, borrowings in the Public Non-financial Corporations sector are substantially lower than forecast at the time of the 2012-13 Budget due in particular to lower capital spending by the electricity network businesses in response to the most recent demand forecasts and reductions in capital works programs due to greater efficiency. This, combined with the adoption of amortised cost to value borrowings on the same basis as in other jurisdictions has meant that borrowings in the Non-financial Public sector are lower than forecast at the time of the 2012-13 Budget.
Chart 1
Independent Commission of Audit1, 2012-13 Budget and MYFER Borrowing
Non-financial Public Sector
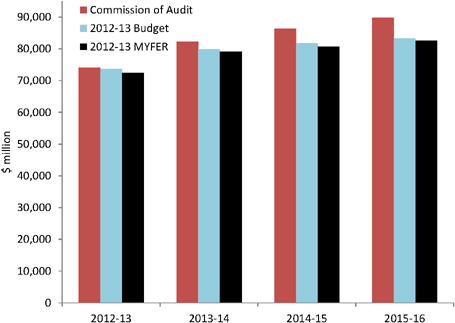
| 1. | Independent Commission of Audit borrowing numbers have been adjusted to ensure comparability in relation to the treatment of the reclassification of Queensland Treasury Holdings into the PNFC sector. |
| | | | |
| | Mid Year Fiscal and Economic Review 2012-13 | | Page 7 |
Purchases of non-financial assets (capital spending) of $12.181 billion are expected in the NFPS sector in 2012-13, $162 million less than the 2012-13 Budget estimate. This reduction is largely the outcome of reductions in Government owned corporations capital expenditure reflecting greater efficiency in capital expenditure programs and the further subdued outlook for energy demand and consumption. These reductions are partially offset by increased capital spending in the General Government sector of $29 million in 2012-13 which reflects a change in the timing of payments.
General Government Sector
Borrowings
Borrowings in the General Government sector are forecast at $41.742 billion at 30 June 2013, $433 million more than forecast in the 2012-13 Budget reflecting the deterioration in the fiscal balance in 2012-13.
By 2014-15 General Government borrowings are expected to be $47.852 billion and stabilise around this level in 2015-16 reflecting the Government’s fiscal strategy.
Achievement of the Government’s fiscal principles
The Government’s fiscal consolidation efforts have allowed it to make significant progress in achieving its fiscal principles. Table 6 outlines progress, with the principles either achieved or on track to be achieved.
| | | | |
| Page 8 | | Mid Year Fiscal and Economic Review 2012-13 | | |
Table 6
The fiscal principles of the Queensland Government
| | | | | | | | | | | | |
Principle | | Indicator | |
| | | Net Financial Liabilities to Revenue Ratio | |
| | | | | | 2012-13 Budget
per cent | | | 2012-13 MYFER
per cent1 | |
Stabilise then significantly reduce debt | | | 2011-12 | | | | 97 | | | | 105 | |
(Non-financial Public sector) | | | 2012-13 | | | | 125 | | | | 136 | |
| | | 2013-14 | | | | 121 | | | | 131 | |
| | | 2014-15 | | | | 115 | | | | 121 | |
| | | 2015-16 | | | | 112 | | | | 117 | |
| |
| | | Debt to Revenue Ratio | |
| | | | | | 2012-13 Budget
per cent | | | 2012-13 MYFER
per cent | |
| | | 2011-12 | | | | 120 | | | | 118 | |
| | | 2012-13 | | | | 150 | | | | 149 | |
| | | 2013-14 | | | | 145 | | | | 146 | |
| | | 2014-15 | | | | 139 | | | | 138 | |
| | | 2015-16 | | | | 138 | | | | 137 | |
| |
| | | General Government Fiscal Balance | |
| | | | | | 2012-13 Budget
($ million) | | | 2012-13 MYFER
($ million) | |
Achieve and maintain a General Government sector fiscal balance by 2014-15 | | | 2011-12 | | | | (5,623 | ) | | | (5,482 | ) |
| | | 2012-13 | | | | (10,768 | ) | | | (11,213 | ) |
| | | 2013-14 | | | | (3,752 | ) | | | (4,647 | ) |
| | | 2014-15 | | | | 652 | | | | 534 | |
| | | 2015-16 | | | | 747 | | | | 670 | |
| |
| | | Taxation revenue per capita, 2012-13 | |
Maintain a competitive tax environment for business | | | Queensland: | | | $ | 2,391 | |
| |
| Average of other
states and territories: |
| | $ | 2,845 | |
| Target full funding of long term liabilities such as superannuation in accordance with actuarial advice | |
| As at last actuarial review (released
June 2011), accruing superannuation
liabilities were fully funded when
the QML transaction is taken into
account. The State Actuary reviews
the scheme every three years. |
|
Note:
| 1. | If the 2012-13 Budget estimate of the superannuation liability is used (to approximate the removal of the valuation volatility) then the ratio is 94% in 2011-12; 125% in 2012-13; 124% in 2013-14; 116% in 2014-15 and 113% in 2015-16, around the same levels as the 2012-13 Budget estimates. |
| | | | |
| | Mid Year Fiscal and Economic Review 2012-13 | | Page 9 |
As outlined in Chart 2, on the whole, there has been an improvement in the State’s debt to revenue ratio relative to the 2012-13 Budget. This improvement is primarily as a result of lower borrowings in the PNFC sector and despite deterioration in the revenue outlook driven by lower than forecast royalty revenues. Queensland’s debt to revenue ratio is expected to peak at 149% in 2012-13 and decline steadily to 137% in 2015-16.
Chart 2
2011-12 MYFER1, 2012-13 Budget and MYFER
Debt to Revenue Ratio
Non-financial Public Sector
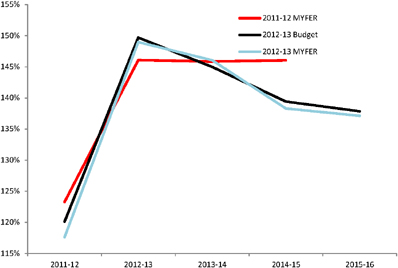
| 1. | 2011-12 MYFER as published. 2015-16 was not published in the 2011-12 MYFER. |
The debt to revenue measure is a better and more direct indicator of affordability of the State’s debt levels than the net financial liability to revenue ratio as it more accurately reflects what a state can control. The net financial liability to revenue ratio is highly influenced by matters outside of the control of the State, most particularly the Commonwealth bond rate.
Under accounting standards, a floating discount rate based on Commonwealth bond yields is used to estimate the present value of superannuation liabilities which is a key input to the net financial liability to revenue ratio.
In the current global environment, Australian Government bonds are seen as a safe haven for international investors. As such, yields have fallen to historical lows, creating significant volatility in the estimated superannuation liability. This impact will be reversed over time as bond yields recover. Queensland’s estimates of the superannuation liability are updated annually, and incorporated in the Report on State Finances and MYFER, following advice from the State Actuary.
All Australian jurisdictions are encountering significant increases in their superannuation liability as a result of this accounting standard and the historically low bond yields, with increases in New South Wales and Victoria noticeably greater than Queensland.
| | | | |
| Page 10 | | Mid Year Fiscal and Economic Review 2012-13 | | |
A consequence of the increase in the valuation of the superannuation liability is that Queensland’s net financial liability to revenue ratio has increased. This does not represent an underlying deterioration in the State’s fiscal position but is simply a consequence of a volatile valuation methodology which all Australian Treasuries are looking to change as its flaws have become apparent. Standard and Poor’s Ratings Agency, who traditionally used the measure extensively, are now placing less emphasis on it, partially influenced by the volatility created by this accounting treatment.
| | | | |
| | Mid Year Fiscal and Economic Review 2012-13 | | Page 11 |
UNIFORM PRESENTATION FRAMEWORK AND LOAN COUNCIL ALLOCATION
Uniform Presentation Framework Information
Table 7
General Government Sector Operating Statement 1
| | | | | | | | | | | | | | | | | | | | | | | | | | |
| | | | | 2011-12
Actual
$ million | | | 2012-13
Budget
$ million | | | 2012-13
Revised
$ million | | | 2013-14
Projection
$ million | | | 2014-15
Projection
$ million | | | 2015-16
Projection
$ million | |
| | Revenue from Transactions | | | | | | | | | | | | | | | | | | | | | | | | |
| | Taxation revenue | | | 10,608 | | | | 11,013 | | | | 11,011 | | | | 11,721 | | | | 12,498 | | | | 13,430 | |
| | Grants revenue | | | 22,652 | | | | 18,598 | | | | 18,427 | | | | 21,785 | | | | 23,832 | | | | 23,332 | |
| | Sales of goods and services | | | 4,996 | | | | 4,966 | | | | 4,975 | | | | 5,064 | | | | 5,248 | | | | 5,467 | |
| | Interest income | | | 2,484 | | | | 2,582 | | | | 2,559 | | | | 2,636 | | | | 2,706 | | | | 2,773 | |
| | Dividend and income tax equivalent income | | | 1,112 | | | | 1,355 | | | | 1,260 | | | | 1,714 | | | | 2,207 | | | | 2,207 | |
| | Other revenue | | | 3,942 | | | | 3,711 | | | | 3,334 | | | | 4,060 | | | | 4,732 | | | | 5,201 | |
| | Total Revenue from Transactions | | | 45,794 | | | | 42,224 | | | | 41,565 | | | | 46,980 | | | | 51,224 | | | | 52,410 | |
| | | | | | | |
Less | | Expenses from Transactions | | | | | | | | | | | | | | | | | | | | | | | | |
| | Employee expenses | | | 18,250 | | | | 18,885 | | | | 18,828 | | | | 18,473 | | | | 19,372 | | | | 20,205 | |
| | Superannuation expenses | | | | | | | | | | | | | | | | | | | | | | | | |
| | Superannuation interest cost | | | 1,216 | | | | 1,235 | | | | 789 | | | | 934 | | | | 982 | | | | 1,012 | |
| | Other superannuation expenses | | | 2,301 | | | | 2,301 | | | | 2,533 | | | | 2,501 | | | | 2,510 | | | | 2,532 | |
| | Other operating expenses | | | 8,821 | | | | 9,383 | | | | 9,438 | | | | 9,089 | | | | 9,306 | | | | 9,726 | |
| | Depreciation and amortisation | | | 2,777 | | | | 3,086 | | | | 3,067 | | | | 3,306 | | | | 3,459 | | | | 3,508 | |
| | Other interest expenses | | | 1,659 | | | | 1,916 | | | | 1,913 | | | | 2,347 | | | | 2,499 | | | | 2,537 | |
| | Grants expenses | | | 11,004 | | | | 11,713 | | | | 11,695 | | | | 11,114 | | | | 10,404 | | | | 10,769 | |
| | Total Expenses from Transactions | | | 46,027 | | | | 48,518 | | | | 48,264 | | | | 47,764 | | | | 48,531 | | | | 50,290 | |
| | | | | | | |
Equals | | Net Operating Balance | | | (233 | ) | | | (6,294 | ) | | | (6,699 | ) | | | (783 | ) | | | 2,693 | | | | 2,121 | |
| | | | | | | |
Plus | | Other economic flows - included in operating result | | | (159 | ) | | | 282 | | | | 351 | | | | 39 | | | | (173 | ) | | | (127 | ) |
| | | | | | | |
Equals | | Operating Result | | | (391 | ) | | | (6,012 | ) | | | (6,347 | ) | | | (744 | ) | | | 2,520 | | | | 1,994 | |
| | | | | | | |
Plus | | Other economic flows - other movements in equity | | | (6,830 | ) | | | 544 | | | | 1,831 | | | | 4,263 | | | | 2,794 | | | | 2,560 | |
| | | | | | | |
Equals | | Comprehensive Result - Total Change In Net Worth | | | (7,222 | ) | | | (5,468 | ) | | | (4,516 | ) | | | 3,519 | | | | 5,314 | | | | 4,555 | |
| | | | | | | |
| | KEY FISCAL AGGREGATES | | | | | | | | | | | | | | | | | | | | | | | | |
| | | | | | | |
| | Net Operating Balance | | | (233 | ) | | | (6,294 | ) | | | (6,699 | ) | | | (783 | ) | | | 2,693 | | | | 2,121 | |
| | | | | | | |
Less | | Net Acquisition of Non-financial Assets | | | | | | | | | | | | | | | | | | | | | | | | |
| | Purchases of non-financial assets | | | 7,930 | | | | 7,653 | | | | 7,682 | | | | 7,228 | | | | 5,527 | | | | 4,841 | |
| | Less Sales of non-financial assets | | | 198 | | | | 318 | | | | 317 | | | | 310 | | | | 259 | | | | 215 | |
| | Less Depreciation | | | 2,777 | | | | 3,086 | | | | 3,067 | | | | 3,306 | | | | 3,459 | | | | 3,508 | |
| | Plus Change in inventories | | | 55 | | | | (45 | ) | | | (54 | ) | | | 14 | | | | 17 | | | | 33 | |
| | Plus Other movements in non-financial assets | | | 238 | | | | 270 | | | | 270 | | | | 238 | | | | 332 | | | | 300 | |
| | Equals Total Net Acquisition of Non-financial Assets | | | 5,24 9 | | | | 4,47 5 | | | | 4 ,5 15 | | | | 3,8 64 | | | | 2,159 | | | | 1,451 | |
| | | | | | | |
Equals | | Net Lending / (Borrowing) | | | (5,482 | ) | | | (10,768 | ) | | | (11,213 | ) | | | (4,647 | ) | | | 534 | | | | 670 | |
Note:
| 1. | Numbers may not add due to rounding. |
| | | | |
| Page 12 | | Mid Year Fiscal and Economic Review 2012-13 | | |
Table 8
Public Non-financial Corporations Sector Operating Statement 1
| | | | | | | | | | | | | | | | | | | | | | | | | | |
| | | | | 2011-12
Actual
$ million | | | 2012-13
Budget
$ million | | | 2012-13
Revised
$ million | | | 2013-14
Projection
$ million | | | 2014-15
Projection
$ million | | | 2015-16
Projection
$ million | |
| | Revenue from Transactions | | | | | | | | | | | | | | | | | | | | | | | | |
| | Grants revenue | | | 2,140 | | | | 2,454 | | | | 2,425 | | | | 2,441 | | | | 2,602 | | | | 2,490 | |
| | Sales of goods and services | | | 7,348 | | | | 8,200 | | | | 8,166 | | | | 8,856 | | | | 9,235 | | | | 9,992 | |
| | Interest income | | | 157 | | | | 136 | | | | 116 | | | | 88 | | | | 75 | | | | 72 | |
| | Dividend and income tax equivalent income | | | 61 | | | | 61 | | | | 56 | | | | — | | | | — | | | | — | |
| | Other revenue | | | 415 | | | | 357 | | | | 352 | | | | 306 | | | | 327 | | | | 354 | |
| | Total Revenue from Transactions | | | 10,121 | | | | 11,209 | | | | 11,115 | | | | 11,691 | | | | 12,240 | | | | 12,907 | |
| | | | | | | |
Less | | Expenses from Transactions | | | | | | | | | | | | | | | | | | | | | | | | |
| | Employee expenses | | | 1,618 | | | | 1,763 | | | | 1,834 | | | | 1,720 | | | | 1,776 | | | | 1,819 | |
| | Superannuation expenses | | | | | | | | | | | | | | | | | | | | | | | | |
| | Superannuation interest cost | | | (22 | ) | | | — | | | | — | | | | — | | | | — | | | | — | |
| | Other superannuation expenses | | | 227 | | | | 215 | | | | 213 | | | | 213 | | | | 219 | | | | 226 | |
| | Other operating expenses | | | 3,204 | | | | 3,830 | | | | 3,748 | | | | 3,786 | | | | 3,704 | | | | 4,030 | |
| | Depreciation and amortisation | | | 2,064 | | | | 2,198 | | | | 2,182 | | | | 2,279 | | | | 2,401 | | | | 2,491 | |
| | Other interest expenses | | | 2,088 | | | | 2,210 | | | | 2,158 | | | | 2,126 | | | | 2,178 | | | | 2,227 | |
| | Grants expenses | | | 14 | | | | 22 | | | | 22 | | | | 17 | | | | 18 | | | | 18 | |
| | Other property expenses | | | 221 | | | | 352 | | | | 308 | | | | 466 | | | | 776 | | | | 734 | |
| | Total Expenses from Transactions | | | 9,414 | | | | 10,590 | | | | 10,466 | | | | 10,608 | | | | 11,071 | | | | 11,545 | |
| | | | | | | |
Equals | | Net Operating Balance | | | 707 | | | | 619 | | | | 650 | | | | 1,084 | | | | 1,169 | | | | 1,362 | |
| | | | | | | |
Plus | | Other economic flows - included in operating result | | | (560 | ) | | | (211 | ) | | | (249 | ) | | | (254 | ) | | | (30 | ) | | | (96 | ) |
| | | | | | | |
Equals | | Operating Result | | | 147 | | | | 409 | | | | 400 | | | | 829 | | | | 1,139 | | | | 1,266 | |
| | | | | | | |
Plus | | Other economic flows - other movements in equity | | | (1,455 | ) | | | (678 | ) | | | (600 | ) | | | (412 | ) | | | (562 | ) | | | (629 | ) |
| | | | | | | |
Equals | | Comprehensive Result - Total Change In Net Worth | | | (1,308 | ) | | | (269 | ) | | | (200 | ) | | | 417 | | | | 577 | | | | 637 | |
| | | | | | | |
| | KEY FISCAL AGGREGATES | | | | | | | | | | | | | | | | | | | | | | | | |
| | | | | | | |
| | Net Operating Balance | | | 707 | | | | 619 | | | | 650 | | | | 1,084 | | | | 1,169 | | | | 1,362 | |
| | | | | | | |
Less | | Net Acquisition of Non-financial Assets | | | | | | | | | | | | | | | | | | | | | | | | |
| | Purchases of non- financial assets | | | 4,009 | | | | 4,690 | | | | 4,499 | | | | 4,287 | | | | 3,950 | | | | 3,882 | |
| | Less Sales of non- financial assets | | | 361 | | | | 18 | | | | 29 | | | | 35 | | | | 14 | | | | 7 | |
| | Less Depreciation | | | 2,064 | | | | 2,198 | | | | 2,182 | | | | 2,279 | | | | 2,401 | | | | 2,491 | |
| | Plus Change in inventories | | | 13 | | | | 21 | | | | 31 | | | | (3 | ) | | | 17 | | | | 16 | |
| | Plus Other movements in non- financial assets | | | 37 | | | | (5 | ) | | | (5 | ) | | | — | | | | — | | | | — | |
| | Equals Total Net Acquisition of Non- financial Assets | | | 1,634 | | | | 2,490 | | | | 2,313 | | | | 1,969 | | | | 1,552 | | | | 1,400 | |
| | | | | | | |
Equals | | Net Lending / (Borrowing) | | | (927 | ) | | | (1,870 | ) | | | (1,664 | ) | | | (886 | ) | | | (383 | ) | | | (38 | ) |
Note:
| 1. | Numbers may not add due to rounding. |
| | | | |
| Page 13 | | Mid Year Fiscal and Economic Review 2012-13 | | |
Table 9
Non-financial Public Sector Operating Statement1
| | | | | | | | | | | | | | | | | | | | | | | | | | |
| | | | | 2011-12 | | | 2012-13 | | | 2012-13 | | | 2013-14 | | | 2014-15 | | | 2015-16 | |
| | | | | Actual | | | Budget | | | Revised | | | Projection | | | Projection | | | Projection | |
| | | | | $ million | | | $ million | | | $ million | | | $ million | | | $ million | | | $ million | |
| | Revenue from Transactions | | | | | | | | | | | | | | | | | | | | | | | | |
| | Taxation revenue | | | 10,285 | | | | 10,662 | | | | 10,672 | | | | 11,374 | | | | 12,141 | | | | 13,029 | |
| | Grants revenue | | | 22,856 | | | | 18,793 | | | | 18,621 | | | | 21,991 | | | | 24,050 | | | | 23,513 | |
| | Sales of goods and services | | | 12,062 | | | | 12,911 | | | | 12,883 | | | | 13,656 | | | | 14,193 | | | | 15,161 | |
| | Interest income | | | 2,641 | | | | 2,718 | | | | 2,675 | | | | 2,724 | | | | 2,782 | | | | 2,845 | |
| | Dividend and income tax equivalent income | | | 100 | | | | 102 | | | | 102 | | | | 73 | | | | 86 | | | | 87 | |
| | Other revenue | | | 4,356 | | | | 4,063 | | | | 3,681 | | | | 4,366 | | | | 5,059 | | | | 5,555 | |
| | Total Revenue from Transactions | | | 52,300 | | | | 49,248 | | | | 48,634 | | | | 54,184 | | | | 58,311 | | | | 60,190 | |
| | | | | | | |
Less | | Expenses from Transactions | | | | | | | | | | | | | | | | | | | | | | | | |
| | Employee expenses | | | 19,767 | | | | 20,557 | | | | 20,572 | | | | 20,103 | | | | 21,055 | | | | 21,929 | |
| | Superannuation expenses | | | | | | | | | | | | | | | | | | | | | | | | |
| | Superannuation interest cost | | | 1,195 | | | | 1,235 | | | | 789 | | | | 934 | | | | 982 | | | | 1,012 | |
| | Other superannuation expenses | | | 2,527 | | | | 2,515 | | | | 2,746 | | | | 2,715 | | | | 2,728 | | | | 2,757 | |
| | Other operating expenses | | | 11,731 | | | | 12,957 | | | | 12,926 | | | | 12,608 | | | | 12,716 | | | | 13,455 | |
| | Depreciation and amortisation | | | 4,841 | | | | 5,284 | | | | 5,249 | | | | 5,585 | | | | 5,860 | | | | 6,000 | |
| | Other interest expenses | | | 3,542 | | | | 3,875 | | | | 3,834 | | | | 4,227 | | | | 4,424 | | | | 4,470 | |
| | Grants expenses | | | 9,081 | | | | 9,470 | | | | 9,480 | | | | 8,895 | | | | 8,037 | | | | 8,478 | |
| | Total Expenses from Transactions | | | 52,685 | | | | 55,893 | | | | 55,595 | | | | 55,067 | | | | 55,802 | | | | 58,100 | |
| | | | | | | |
Equals | | Net Operating Balance | | | (384 | ) | | | (6,645 | ) | | | (6,961 | ) | | | (883 | ) | | | 2,509 | | | | 2,089 | |
| | | | | | | |
Plus | | Other economic flows-included in operating result | | | (801 | ) | | | (289 | ) | | | (250 | ) | | | (215 | ) | | | (203 | ) | | | (223 | ) |
| | | | | | | |
Equals | | Operating Result | | | (1,186 | ) | | | (6,934 | ) | | | (7,211 | ) | | | (1,098 | ) | | | 2,306 | | | | 1,866 | |
| | | | | | | |
Plus | | Other economic flows-other movements in equity | | | (6,333 | ) | | | 1,466 | | | | 2,284 | | | | 4,223 | | | | 2,662 | | | | 2,394 | |
| | | | | | | |
Equals | | Comprehensive Result-Total Change In Net Worth | | | (7,519 | ) | | | (5,468 | ) | | | (4,928 | ) | | | 3,125 | | | | 4,968 | | | | 4,260 | |
| | | | | | | |
| | KEY FISCAL AGGREGATES | | | | | | | | | | | | | | | | | | | | | | | | |
| | | | | | | |
| | Net Operating Balance | | | (384 | ) | | | (6,645 | ) | | | (6,961 | ) | | | (883 | ) | | | 2,509 | | | | 2,089 | |
| | | | | | | |
Less | | Net Acquisition of Non- financial Assets | | | | | | | | | | | | | | | | | | | | | | | | |
| | Purchases of non-financial assets | | | 11,939 | | | | 12,343 | | | | 12,181 | | | | 11,515 | | | | 9,477 | | | | 8,722 | |
| | Less Sales of non-financial assets | | | 559 | | | | 336 | | | | 347 | | | | 345 | | | | 272 | | | | 222 | |
| | Less Depreciation | | | 4,841 | | | | 5,284 | | | | 5,249 | | | | 5,585 | | | | 5,860 | | | | 6,000 | |
| | Plus Change in inventories | | | 68 | | | | (24 | ) | | | (23 | ) | | | 11 | | | | 34 | | | | 50 | |
| | Plus Other movements in non- financial assets | | | 275 | | | | 265 | | | | 265 | | | | 238 | | | | 332 | | | | 300 | |
| | Equals Total Net Acquisition of Non- financial Assets | | | 6,882 | | | | 6,965 | | | | 6,828 | | | | 5,833 | | | | 3,711 | | | | 2,851 | |
| | | | | | | |
Equals | | Net Lending / (Borrowing) | | | (7,267 | ) | | | (13,610 | ) | | | (13,788 | ) | | | (6,716 | ) | | | (1,202 | ) | | | (761 | ) |
Note:
| 1. | Numbers may not add due to rounding. |
| | | | |
| Page 14 | | Mid Year Fiscal and Economic Review 2012-13 | | |
Table 10
General Government Sector Balance Sheet1
| | | | | | | | | | | | | | | | | | | | | | | | |
| | | 2011-12 | | | 2012-13 | | | 2012-13 | | | 2013-14 | | | 2014-15 | | | 2015-16 | |
| | | Actual | | | Budget | | | Revised | | | Projection | | | Projection | | | Projection | |
| | | $ million | | | $ million | | | $ million | | | $ million | | | $ million | | | $ million | |
Assets | | | | | | | | | | | | | | | | | | | | | | | | |
Financial Assets | | | | | | | | | | | | | | | | | | | | | | | | |
Cash and deposits | | | 865 | | | | 637 | | | | 740 | | | | 740 | | | | 773 | | | | 778 | |
Advances paid | | | 687 | | | | 607 | | | | 799 | | | | 811 | | | | 833 | | | | 853 | |
Investments, loans and placements | | | 34,239 | | | | 35,185 | | | | 35,281 | | | | 36,334 | | | | 37,330 | | | | 38,275 | |
Receivables | | | 4,087 | | | | 3,988 | | | | 4,312 | | | | 4,569 | | | | 5,053 | | | | 5,053 | |
Equity | | | | | | | | | | | | | | | | | | | | | | | | |
Investments in other public sector entities | | | 21,602 | | | | 16,956 | | | | 21,814 | | | | 22,625 | | | | 23,548 | | | | 24,480 | |
Investments-other | | | 148 | | | | 151 | | | | 178 | | | | 178 | | | | 178 | | | | 178 | |
Other financial assets | | | | | | | | | | | | | | | | | | | | | | | | |
Total Financial Assets | | | 61,628 | | | | 57,523 | | | | 63,124 | | | | 65,257 | | | | 67,714 | | | | 69,617 | |
| | | | | | |
Non-Financial Assets | | | | | | | | | | | | | | | | | | | | | | | | |
Land and other fixed assets | | | 176,187 | | | | 179,169 | | | | 181,752 | | | | 187,434 | | | | 190,320 | | | | 192,527 | |
Other non-financial assets | | | 5,758 | | | | 6,151 | | | | 5,979 | | | | 6,408 | | | | 6,618 | | | | 6,901 | |
Total Non-financial Assets | | | 181,945 | | | | 185,320 | | | | 187,731 | | | | 193,842 | | | | 196,938 | | | | 199,429 | |
| | | | | | |
Total Assets | | | 243,573 | | | | 242,843 | | | | 250,856 | | | | 259,099 | | | | 264,652 | | | | 269,045 | |
| | | | | | |
Liabilities | | | | | | | | | | | | | | | | | | | | | | | | |
Payables | | | 3,888 | | | | 3,295 | | | | 3,341 | | | | 3,405 | | | | 3,524 | | | | 3,622 | |
Superannuation liability | | | 30,626 | | | | 25,721 | | | | 30,717 | | | | 29,582 | | | | 28,518 | | | | 27,628 | |
Other employee benefits | | | 5,096 | | | | 4,983 | | | | 5,238 | | | | 5,561 | | | | 5,873 | | | | 6,215 | |
Deposits held | | | 1 | | | | 19 | | | | 1 | | | | 1 | | | | 1 | | | | 1 | |
Advances received | | | 425 | | | | 220 | | | | 364 | | | | 341 | | | | 319 | | | | 298 | |
Borrowing | | | 29,513 | | | | 41,309 | | | | 41,742 | | | | 47,103 | | | | 47,852 | | | | 48,045 | |
Other liabilities | | | 3,371 | | | | 3,496 | | | | 3,315 | | | | 3,449 | | | | 3,595 | | | | 3,713 | |
Total Liabilities | | | 72,920 | | | | 79,043 | | | | 84,719 | | | | 89,443 | | | | 89,683 | | | | 89,521 | |
| | | | | | |
Net Worth | | | 170,653 | | | | 163,800 | | | | 166,137 | | | | 169,656 | | | | 174,970 | | | | 179,524 | |
| | | | | | | | | | | | | | | | | | | | | | | | |
Net Financial Worth | | | (11,292 | ) | | | (21,520 | ) | | | (21,594 | ) | | | (24,186 | ) | | | (21,969 | ) | | | (19,905 | ) |
Net Financial Liabilities | | | 32,894 | | | | 38,476 | | | | 43,408 | | | | 46,811 | | | | 45,516 | | | | 44,384 | |
Net Debt | | | (5,851 | ) | | | 5,120 | | | | 5,287 | | | | 9,560 | | | | 9,236 | | | | 8,438 | |
| | | | | | | | | | | | | | | | | | | | | | | | |
Note:
| 1. | Numbers may not add due to rounding. |
| | | | |
| | Mid Year Fiscal and Economic Review 2012-13 | | Page 15 |
Table 11
Public Non-financial Corporations Sector Balance Sheet 1
| | | | | | | | | | | | | | | | | | | | | | | | |
| | | 2011-12 | | | 2012-13 | | | 2012-13 | | | 2013-14 | | | 2014-15 | | | 2015-16 | |
| | | Actual | | | Budget | | | Revised | | | Projection | | | Projection | | | Projection | |
| | | $ million | | | $ million | | | $ million | | | $ million | | | $ million | | | $ million | |
Assets | | | | | | | | | | | | | | | | | | | | | | | | |
Financial Assets | | | | | | | | | | | | | | | | | | | | | | | | |
Cash and deposits | | | 2,401 | | | | 2,134 | | | | 1,383 | | | | 1,045 | | | | 931 | | | | 1,202 | |
Advances paid | | | 256 | | | | 166 | | | | 107 | | | | 96 | | | | 88 | | | | 33 | |
Investments, loans and placements | | | 473 | | | | 160 | | | | 233 | | | | 168 | | | | 137 | | | | 135 | |
Receivables | | | 2,097 | | | | 2,230 | | | | 2,216 | | | | 2,130 | | | | 2,084 | | | | 2,162 | |
Equity | | | | | | | | | | | | | | | | | | | | | | | | |
Investments—other | | | 2,916 | | | | 105 | | | | 5 | | | | 5 | | | | 5 | | | | 5 | |
Other financial assets | | | | | | | | | | | | | | | | | | | | | | | | |
Total Financial Assets | | | 8,143 | | | | 4,794 | | | | 3,944 | | | | 3,443 | | | | 3,244 | | | | 3,537 | |
| | | | | | |
Non-financial Assets | | | | | | | | | | | | | | | | | | | | | | | | |
Land and other fixed assets | | | 51,949 | | | | 54,996 | | | | 54,834 | | | | 57,605 | | | | 59,977 | | | | 62,250 | |
Other non - financial assets | | | 1,326 | | | | 1,203 | | | | 1,352 | | | | 1,391 | | | | 1,413 | | | | 1,394 | |
Total Non-Financial Assets | | | 53,275 | | | | 56,200 | | | | 56,185 | | | | 58,996 | | | | 61,390 | | | | 63,644 | |
| | | | | | |
Total Assets | | | 61,418 | | | | 60,994 | | | | 60,129 | | | | 62,438 | | | | 64,634 | | | | 67,180 | |
| | | | | | |
Liabilities | | | | | | | | | | | | | | | | | | | | | | | | |
Payables | | | 2,233 | | | | 2,471 | | | | 2,527 | | | | 2,647 | | | | 3,099 | | | | 3,028 | |
Superannuation liability | | | 230 | | | | (70 | ) | | | 200 | | | | 170 | | | | 140 | | | | 133 | |
Other employee benefits | | | 766 | | | | 712 | | | | 769 | | | | 778 | | | | 799 | | | | 820 | |
Deposits held | | | 22 | | | | 27 | | | | 28 | | | | 31 | | | | 34 | | | | 38 | |
Advances received | | | 11 | | | | 10 | | | | 10 | | | | 9 | | | | 8 | | | | 8 | |
Borrowing | | | 32,007 | | | | 32,409 | | | | 30,705 | | | | 32,032 | | | | 32,786 | | | | 34,491 | |
Other liabilities | | | 6,712 | | | | 6,964 | | | | 6,654 | | | | 7,117 | | | | 7,535 | | | | 7,795 | |
Total Liabilities | | | 41,982 | | | | 42,522 | | | | 40,893 | | | | 42,785 | | | | 44,403 | | | | 46,312 | |
| | | | | | |
Net Worth | | | 19,436 | | | | 18,472 | | | | 19,236 | | | | 19,654 | | | | 20,231 | | | | 20,868 | |
| | | | | | | | | | | | | | | | | | | | | | | | |
Net Financial Worth | | | (33,839 | ) | | | (37,728 | ) | | | (36,949 | ) | | | (39,342 | ) | | | (41,159 | ) | | | (42,775 | ) |
Net Debt | | | 28,911 | | | | 29,986 | | | | 29,020 | | | | 30,765 | | | | 31,674 | | | | 33,166 | |
| | | | | | | | | | | | | | | | | | | | | | | | |
Note:
| 1. | Numbers may not add due to rounding. |
| | | | |
| Page 16 | | Mid Year Fiscal and Economic Review 2012-13 | | |
Table 12
Non-financial Public Sector Balance Sheet 1
| | | | | | | | | | | | | | | | | | | | | | | | |
| | | 2011-12
Actual
$ million | | | 2012-13
Budget
$ million | | | 2012-13
Revised
$ million | | | 2013-14
Projection
$ million | | | 2014-15
Projection
$ million | | | 2015-16
Projection
$ million | |
Assets | | | | | | | | | | | | | | | | | | | | | | | | |
Financial Assets | | | | | | | | | | | | | | | | | | | | | | | | |
Cash and deposits | | | 3,267 | | | | 2,771 | | | | 2,123 | | | | 1,785 | | | | 1,704 | | | | 1,981 | |
Advances paid | | | 932 | | | | 762 | | | | 896 | | | | 898 | | | | 912 | | | | 878 | |
Investments, loans and placements | | | 34,712 | | | | 35,344 | | | | 35,514 | | | | 36,502 | | | | 37,467 | | | | 38,409 | |
Receivables | | | 4,995 | | | | 4,802 | | | | 5,026 | | | | 5,000 | | | | 5,060 | | | | 5,286 | |
Equity | | | | | | | | | | | | | | | | | | | | | | | | |
Investments in other public sector entities | | | 652 | | | | (1,419 | ) | | | 652 | | | | 652 | | | | 652 | | | | 652 | |
Investments—other | | | 3,064 | | | | 160 | | | | 183 | | | | 183 | | | | 183 | | | | 183 | |
Other financial assets | | | | | | | | | | | | | | | | | | | | | | | | |
Total Financial Assets | | | 47,621 | | | | 42,4 21 | | | | 44,394 | | | | 45,018 | | | | 45,978 | | | | 47,389 | |
| | | | | | |
Non-financial Assets | | | | | | | | | | | | | | | | | | | | | | | | |
Land and other fixed assets | | | 228,135 | | | | 234,165 | | | | 236,585 | | | | 245,038 | | | | 250,296 | | | | 254,776 | |
Other non-financial assets | | | 756 | | | | 692 | | | | 746 | | | | 741 | | | | 728 | | | | 726 | |
Total Non-financial Assets | | | 228,891 | | | | 234,857 | | | | 237,332 | | | | 245,779 | | | | 251,024 | | | | 255,502 | |
| | | | | | |
Total Assets | | | 276,512 | | | | 277,277 | | | | 281,726 | | | | 290,797 | | | | 297,002 | | | | 302,891 | |
| | | | | | |
Liabilities | | | | | | | | | | | | | | | | | | | | | | | | |
Payables | | | 4,972 | | | | 4,389 | | | | 4,407 | | | | 4,394 | | | | 4,587 | | | | 4,762 | |
Superannuation liability | | | 30,856 | | | | 25,651 | | | | 30,917 | | | | 29,752 | | | | 28,658 | | | | 27,761 | |
Other employee benefits | | | 5,862 | | | | 5,695 | | | | 6,008 | | | | 6,339 | | | | 6,673 | | | | 7,035 | |
Deposits held | | | 23 | | | | 47 | | | | 29 | | | | 32 | | | | 36 | | | | 39 | |
Advances received | | | 425 | | | | 220 | | | | 364 | | | | 341 | | | | 319 | | | | 298 | |
Borrowing | | | 61,521 | | | | 73,717 | | | | 72,447 | | | | 79,135 | | | | 80,638 | | | | 82,536 | |
Other liabilities | | | 3,714 | | | | 3,758 | | | | 3,343 | | | | 3,467 | | | | 3,786 | | | | 3,897 | |
Total Liabilitie’s | | | 107,374 | | | | 113,477 | | | | 117,515 | | | | 123,461 | | | | 124,698 | | | | 126,327 | |
| | | | | | |
Net Worth | | | 169,138 | | | | 163,800 | | | | 164,211 | | | | 167,336 | | | | 172,304 | | | | 176,564 | |
| | | | | | | | | | | | | | | | | | | | | | | | |
Net Financial Worth | | | (59,753 | ) | | | (71,056 | ) | | | (73,121 | ) | | | (78,443 | ) | | | (78,720 | ) | | | (78,938 | ) |
Net Financial Liabilities | | | 60,405 | | | | 69,638 | | | | 73,773 | | | | 79,095 | | | | 79,372 | | | | 79,590 | |
Net Debt | | | 23,059 | | | | 35,106 | | | | 34,307 | | | | 40,325 | | | | 40,910 | | | | 41,604 | |
| | | | | | | | | | | | | | | | | | | | | | | | |
Note:
| 1. | Numbers may not add due to rounding. |
| | | | |
| | Mid Year Fiscal and Economic Review 2012-13 | | Page 17 |
Table 13
General Government Sector Cash Flow Statement 1
| | | | | | | | | | | | | | | | | | | | | | | | |
| | | 2011-12 | | | 2012-13 | | | 2012-13 | | | 2013-14 | | | 2014-15 | | | 2015-16 | |
| | | Actual | | | Budget | | | Revised | | | Projection | | | Projection | | | Projection | |
| | | $ million | | | $ million | | | $ million | | | $ million | | | $ million | | | $ million | |
Cash Receipts from Operating Activities | | | | | | | | | | | | | | | | | | | | | | | | |
Taxes received | | | 10,656 | | | | 11,012 | | | | 11,010 | | | | 11,720 | | | | 12,497 | | | | 13,429 | |
Grants and subsidies received | | | 22,749 | | | | 18,628 | | | | 18,506 | | | | 21,810 | | | | 23,855 | | | | 23,354 | |
Sales of goods and services | | | 5,245 | | | | 5,484 | | | | 5,495 | | | | 5,493 | | | | 5,657 | | | | 5,877 | |
Interest receipts | | | 2,480 | | | | 2,585 | | | | 2,562 | | | | 2,637 | | | | 2,707 | | | | 2,774 | |
Dividends and income tax equivalents | | | 1,087 | | | | 1,357 | | | | 1,125 | | | | 1,515 | | | | 1,815 | | | | 2,320 | |
Other receipts | | | 5,921 | | | | 5,307 | | | | 4,924 | | | | 5,372 | | | | 6,083 | | | | 6,508 | |
Total Operating Receipts | | | 48,138 | | | | 44,672 | | | | 43,623 | | | | 48,547 | | | | 52,614 | | | | 54,262 | |
| | | | | | |
Cash Payments for Operating Activities | | | | | | | | | | | | | | | | | | | | | | | | |
Payments for employees | | | (21,289 | ) | | | (22,091 | ) | | | (21,918 | ) | | | (21,535 | ) | | | (22,666 | ) | | | (23,698 | ) |
Payments for goods and services | | | (10,687 | ) | | | (11,100 | ) | | | (11,146 | ) | | | (10,420 | ) | | | (10,611 | ) | | | (11,057 | ) |
Grants and subsidies | | | (11,063 | ) | | | (11,630 | ) | | | (11,613 | ) | | | (10,960 | ) | | | (10,328 | ) | | | (10,693 | ) |
Interest paid | | | (1,667 | ) | | | (1,905 | ) | | | (1,903 | ) | | | (2,353 | ) | | | (2,507 | ) | | | (2,545 | ) |
Other payments | | | (599 | ) | | | (988 | ) | | | (991 | ) | | | (730 | ) | | | (735 | ) | | | (746 | ) |
Total Operating Payments | | | (45,306 | ) | | | (47,714 | ) | | | (47,572 | ) | | | (45,997 | ) | | | (46,847 | ) | | | (48,739 | ) |
| | | | | | |
Net Cash Inflows from Operating Activities | | | 2,832 | | | | (3,341 | ) | | | (3,949 | ) | | | 2,550 | | | | 5,767 | | | | 5,522 | |
| | | | | | |
Cash Flows from Investments in Non-Financial Assets | | | | | | | | | | | | | | | | | | | | | | | | |
Purchases of non-financial assets | | | (7,930 | ) | | | (7,653 | ) | | | (7,682 | ) | | | (7,228 | ) | | | (5,527 | ) | | | (4,841 | ) |
Sales of non-financial assets | | | 198 | | | | 318 | | | | 317 | | | | 310 | | | | 259 | | | | 215 | |
Net Cash Flows from Investments in Non-financial Assets | | | (7,732 | ) | | | (7,335 | ) | | | (7,365 | ) | | | (6,918 | ) | | | (5,268 | ) | | | (4,625 | ) |
| | | | | | |
Net Cash Flows from Investments in Financial Assets for Policy Purposes | | | 1,260 | | | | 172 | | | | 181 | | | | (179 | ) | | | (168 | ) | | | (102 | ) |
| | | | | | |
Net Cash Flows from Investments in Financial Assets for Liquidity Purposes | | | (837 | ) | | | (954 | ) | | | (1,029 | ) | | | (1,039 | ) | | | (985 | ) | | | (923 | ) |
| | | | | | |
Receipts from Financing Activities | | | | | | | | | | | | | | | | | | | | | | | | |
Advances received (net) | | | (19 | ) | | | (50 | ) | | | (61 | ) | | | (26 | ) | | | (25 | ) | | | (24 | ) |
Borrowing (net) | | | 6,161 | | | | 11,244 | | | | 12,099 | | | | 5,614 | | | | 714 | | | | 160 | |
Net Cash Flows from Financing Activities | | | 6,142 | | | | 11,194 | | | | 12,039 | | | | 5,588 | | | | 690 | | | | 135 | |
| | | | | | |
Net Increase/(Decrease) in Cash held | | | 1,664 | | | | (263 | ) | | | (123 | ) | | | 2 | | | | 35 | | | | 8 | |
| | | | | | |
Net cash from operating activities | | | 2,832 | | | | (3,341 | ) | | | (3,949 | ) | | | 2,550 | | | | 5,767 | | | | 5,522 | |
Net cash flows from investments in non-financial assets | | | (7,732 | ) | | | (7,335 | ) | | | (7,365 | ) | | | (6,918 | ) | | | (5,268 | ) | | | (4,625 | ) |
Surplus/(Deficit) | | | (4,901 | ) | | | (10,676 | ) | | | (11,314 | ) | | | (4,368 | ) | | | 499 | | | | 897 | |
| | | | | | |
Derivation of ABS GFS Cash Surplus/Deficit | | | | | | | | | | | | | | | | | | | | | | | | |
Cash surplus/(deficit) | | | (4,901 | ) | | | (10,676 | ) | | | (11,314 | ) | | | (4,368 | ) | | | 499 | | | | 897 | |
Acquisitions under finance leases and similar arrangements | | | (95 | ) | | | (128 | ) | | | (128 | ) | | | (159 | ) | | | (152 | ) | | | (120 | ) |
ABS GFS Cash Surplus/(Deficit) Including | | | | | | | | | | | | | | | | | | | | | | | | |
Finance Leases and Similar Arrangements | | | (4,996 | ) | | | (10,804 | ) | | | (11,442 | ) | | | (4,527 | ) | | | 346 | | | | 777 | |
Note:
| 1. | Numbers may not add due to rounding. |
| | | | |
| Page 18 | | Mid Year Fiscal and Economic Review 2012-13 | | |
Table 14
Public Non-financial Corporations Sector Cash Flow Statement 1
| | | | | | | | | | | | | | | | | | | | | | | | |
| | | 2011-12
Actual
$ million | | | 2012-13
Budget
$ million | | | 2012-13
Revised
$ million | | | 2013-14
Projection
$ million | | | 2014-15
Projection
$ million | | | 2015-16
Projection
$ million | |
Cash Receipts from Operating Activities | | | | | | | | | | | | | | | | | | | | | | | | |
Grants and subsidies received | | | 2,273 | | | | 2,421 | | | | 2,399 | | | | 2,416 | | | | 2,595 | | | | 2,493 | |
Sales of goods and services | | | 7,761 | | | | 8,813 | | | | 8,263 | | | | 9,151 | | | | 9,609 | | | | 10,185 | |
Interest receipts | | | 157 | | | | 136 | | | | 116 | | | | 88 | | | | 75 | | | | 72 | |
Dividends and income tax equivalents | | | 61 | | | | 61 | | | | 56 | | | | — | | | | — | | | | — | |
Other receipts | | | 314 | | | | 213 | | | | 419 | | | | 523 | | | | 389 | | | | 430 | |
Total Operating Receipts | | | 10,566 | | | | 11,644 | | | | 11,253 | | | | 12,178 | | | | 12,668 | | | | 13,180 | |
| | | | | | |
Cash Payments for Operating Activities | | | | | | | | | | | | | | | | | | | | | | | | |
Payments for employees | | | (1,753 | ) | | | (1,930 | ) | | | (2,075 | ) | | | (1,955 | ) | | | (2,003 | ) | | | (2,031 | ) |
Payments for goods and services | | | (3,418 | ) | | | (4,034 | ) | | | (3,936 | ) | | | (3,790 | ) | | | (3,380 | ) | | | (3,935 | ) |
Grants and subsidies | | | (9 | ) | | | (14 | ) | | | (11 | ) | | | (14 | ) | | | (15 | ) | | | (16 | ) |
Interest paid | | | (1,838 | ) | | | (1,996 | ) | | | (1,952 | ) | | | (1,996 | ) | | | (2,030 | ) | | | (2,049 | ) |
Other payments | | | (935 | ) | | | (881 | ) | | | (609 | ) | | | (1,007 | ) | | | (1,016 | ) | | | (1,337 | ) |
Total Operating Payments | | | (7,954 | ) | | | (8,854 | ) | | | (8,582 | ) | | | (8,762 | ) | | | (8,444 | ) | | | (9,368 | ) |
| | | | | | |
Net Cash Inflows from Operating Activities | | | 2,613 | | | | 2,790 | | | | 2,671 | | | | 3,416 | | | | 4,224 | | | | 3,812 | |
| | | | | | |
Cash Flows from Investments in Non-Financial Assets | | | | | | | | | | | | | | | | | | | | | | | | |
Purchases of non—financial assets | | | (4,009 | ) | | | (4,690 | ) | | | (4,499 | ) | | | (4,287 | ) | | | (3,950 | ) | | | (3,882 | ) |
Sales of non—financial assets | | | 361 | | | | 18 | | | | 29 | | | | 35 | | | | 14 | | | | 7 | |
Net Cash Flows from Investments in Non - financial Assets | | | (3,648 | ) | | | (4,673 | ) | | | (4,470 | ) | | | (4,251 | ) | | | (3,936 | ) | | | (3,875 | ) |
Net Cash Flows from Investments in Financial Assets for Policy Purposes | | | (8 | ) | | | 3,04 3 | | | | 3,073 | | | | — | | | | — | | | | — | |
| | | | | | |
Net Cash Flows from Investments in Financial Assets for Liquidity Purposes | | | (27 | ) | | | — | | | | 10 | | | | — | | | | — | | | | — | |
| | | | | | |
Receipts from Financing Activities | | | | | | | | | | | | | | | | | | | | | | | | |
Advances received (net) | | | (1 | ) | | | — | | | | (1 | ) | | | (1 | ) | | | (1 | ) | | | (1 | ) |
Borrowing (net) | | | 1,354 | | | | (350 | ) | | | (1,231 | ) | | | 1,226 | | | | 617 | | | | 1,587 | |
Dividends paid | | | (753 | ) | | | (839 | ) | | | (863 | ) | | | (912 | ) | | | (1,190 | ) | | | (1,355 | ) |
Deposits received (net) | | | 2 | | | | 6 | | | | 6 | | | | 3 | | | | 3 | | | | 3 | |
Other financing (net) | | | (1,272 | ) | | | (205 | ) | | | (214 | ) | | | 180 | | | | 168 | | | | 100 | |
Net Cash Flows from Financing Activities | | | (669 | ) | | | (1,388 | ) | | | (2,303 | ) | | | 497 | | | | (402 | ) | | | 334 | |
| | | | | | |
Net Increase/(Decrease) in Cash held | | | (1,740 | ) | | | (228 | ) | | | (1,019 | ) | | | (338 | ) | | | (114 | ) | | | 272 | |
Net cash from operating activities | | | 2,613 | | | | 2,790 | | | | 2,671 | | | | 3,416 | | | | 4,224 | | | | 3,812 | |
Net cash flows from investments in non—financial assets | | | (3,648 | ) | | | (4,673 | ) | | | (4,470 | ) | | | (4,251 | ) | | | (3,936 | ) | | | (3,875 | ) |
Dividends paid | | | (753 | ) | | | (839 | ) | | | (863 | ) | | | (912 | ) | | | (1,190 | ) | | | (1,355 | ) |
Surplus/(Deficit) | | | (1,788 | ) | | | (2,721 | ) | | | (2,662 | ) | | | (1,747 | ) | | | (902 | ) | | | (1,418 | ) |
| | | | | | |
Derivation of ABS GFS Cash Surplus/Deficit | | | | | | | | | | | | | | | | | | | | | | | | |
Cash surplus/(deficit) | | | (1,788 | ) | | | (2,721 | ) | | | (2,662 | ) | | | (1,747 | ) | | | (902 | ) | | | (1,418 | ) |
ABS GFS Cash Surplus/(Deficit) Including Finance Leases and Similar Arrangements | | | (1,788 | ) | | | (2,721 | ) | | | (2,662 | ) | | | (1,747 | ) | | | (902 | ) | | | (1,418 | ) |
Note:
| 1. | Numbers may not add due to rounding. |
| | | | |
| | Mid Year Fiscal and Economic Review 2012-13 | | Page 19 |
Table 15
Non-financial Public Sector Cash Flow Statement 1
| | | | | | | | | | | | | | | | | | | | | | | | |
| | | 2011-12 | | | 2012-13 | | | 2012-13 | | | 2013-14 | | | 2014-15 | | | 2015-16 | |
| | | Actual | | | Budget | | | Revised | | | Projection | | | Projection | | | Projection | |
| | | $ million | | | $ million | | | $ million | | | $ million | | | $ million | | | $ million | |
Cash Receipts from Operating Activities | | | | | | | | | | | | | | | | | | | | | | | | |
Taxes received | | | 10,316 | | | | 10,661 | | | | 10,671 | | | | 11,373 | | | | 12,140 | | | | 13,027 | |
Grants and subsidies received | | | 22,946 | | | | 18,789 | | | | 18,673 | | | | 22,003 | | | | 24,060 | | | | 23,522 | |
Sales of goods and services | | | 12,682 | | | | 13,833 | | | | 13,292 | | | | 14,153 | | | | 14,744 | | | | 15,535 | |
Interest receipts | | | 2,637 | | | | 2,720 | | | | 2,678 | | | | 2,725 | | | | 2,782 | | | | 2,845 | |
Dividends and income tax equivalents | | | 123 | | | | 96 | | | | 93 | | | | 60 | | | | 79 | | | | 90 | |
Other receipts | | | 6,234 | | | | 5,520 | | | | 5,343 | | | | 5,896 | | | | 6,472 | | | | 6,938 | |
Total Operating Receipts | | | 54,938 | | | | 51,620 | | | | 50,750 | | | | 56,210 | | | | 60,277 | | | | 61,957 | |
| | | | | | |
Cash Payments for Operating Activities | | | | | | | | | | | | | | | | | | | | | | | | |
Payments for employees | | | (22,941 | ) | | | (23,930 | ) | | | (23,902 | ) | | | (23,400 | ) | | | (24,577 | ) | | | (25,634 | ) |
Payments for goods and services | | | (13,778 | ) | | | (14,685 | ) | | | (14,632 | ) | | | (13,734 | ) | | | (13,485 | ) | | | (14,481 | ) |
Grants and subsidies | | | (9,000 | ) | | | (9,383 | ) | | | (9,392 | ) | | | (8,752 | ) | | | (7,953 | ) | | | (8,384 | ) |
Interest paid | | | (3,305 | ) | | | (3,651 | ) | | | (3,616 | ) | | | (4,102 | ) | | | (4,283 | ) | | | (4,300 | ) |
Other payments | | | (1,222 | ) | | | (1,361 | ) | | | (1,348 | ) | | | (1,166 | ) | | | (1,177 | ) | | | (1,180 | ) |
Total Operating Payments | | | (50,246 | ) | | | (53,010 | ) | | | (52,891 | ) | | | (51,155 | ) | | | (51,475 | ) | | | (53,978 | ) |
| | | | | | |
Net Cash Inflows from Operating Activities | | | 4,692 | | | | (1,390 | ) | | | (2,141 | ) | | | 5,055 | | | | 8,801 | | | | 7,979 | |
Cash Flows from Investments in Non-Financial Assets | | | | | | | | | | | | | | | | | | | | | | | | |
Purchases of non-financial assets | | | (11,939 | ) | | | (12,343 | ) | | | (12,181 | ) | | | (11,515 | ) | | | (9,477 | ) | | | (8,722 | ) |
Sales of non-financial assets | | | 559 | | | | 336 | | | | 347 | | | | 345 | | | | 272 | | | | 222 | |
Net Cash Flows from Investments in Non-financial Assets | | | (11,380 | ) | | | (12,007 | ) | | | (11,835 | ) | | | (11,169 | ) | | | (9,204 | ) | | | (8,500 | ) |
| | | | | | |
Net Cash Flows from Investments in Financial Assets for Policy Purposes | | | (8 | ) | | | 3,009 | | | | 3,040 | | | | — | | | | — | | | | — | |
| | | | | | |
Net Cash Flows from Investments in Financial Assets for Liquidity Purposes | | | (864 | ) | | | (953 | ) | | | (1,019 | ) | | | (1,039 | ) | | | (985 | ) | | | (923 | ) |
| | | | | | |
Receipts from Financing Activities | | | | | | | | | | | | | | | | | | | | | | | | |
Advances received (net) | | | (19 | ) | | | (50 | ) | | | (61 | ) | | | (26 | ) | | | (25 | ) | | | (24 | ) |
Borrowing (net) | | | 7,514 | | | | 10,894 | | | | 10,868 | | | | 6,839 | | | | 1,330 | | | | 1,746 | |
Deposits received (net) | | | 2 | | | | 6 | | | | 6 | | | | 3 | | | | 3 | | | | 3 | |
Other financing (net) | | | (11 | ) | | | 1 | | | | 1 | | | | — | | | | — | | | | (2 | ) |
Net Cash Flows from Financing Activities | | | 7,485 | | | | 10,851 | | | | 10,814 | | | | 6,816 | | | | 1,309 | | | | 1,723 | |
| | | | | | |
Net Increase /(Decrease) in Cash held | | | (75 | ) | | | (491 | ) | | | (1,141 | ) | | | (337 | ) | | | (79 | ) | | | 279 | |
| | | | | | |
Net cash from operating activities | | | 4,692 | | | | (1,390 | ) | | | (2,141 | ) | | | 5,055 | | | | 8,801 | | | | 7,979 | |
Net cash flows from investments in non-financial assets | | | (11,380 | ) | | | (12,007 | ) | | | (11,835 | ) | | | (11,169 | ) | | | (9,204 | ) | | | (8,500 | ) |
Surplus/(Deficit) | | | (6,689 | ) | | | (13,397 | ) | | | (13,976 | ) | | | (6,114 | ) | | | (403 | ) | | | (521 | ) |
| | | | | | |
Derivation of ABS GFS Cash Surplus/Deficit | | | | | | | | | | | | | | | | | | | | | | | | |
Cash surplus/(deficit) | | | (6,689 | ) | | | (13,397 | ) | | | (13,976 | ) | | | (6,114 | ) | | | (403 | ) | | | (521 | ) |
Acquisitions under finance leases and similar arrangements | | | (95 | ) | | | (128 | ) | | | (128 | ) | | | (159 | ) | | | (152 | ) | | | (120 | ) |
ABS GFS Cash Surplus/(Deficit) Including Finance Leases and Similar Arrangements | | | (6,784 | ) | | | (13,525 | ) | | | (14,104 | ) | | | (6,274 | ) | | �� | (555 | ) | | | (641 | ) |
Note:
| 1. | Numbers may not add due to rounding. |
| | | | |
| Page 20 | | Mid Year Fiscal and Economic Review 2012-13 | | |
Loan Council Allocation
Table 16
Loan Council Allocation1
| | | | | | | | | | |
| | | | | 2012-13 | | | 2012-13 | |
| | | | | Budget | | | Revised | |
| | | | | $ million | | | $ million | |
| | General Government sector cash deficit/(surplus)2 | | | 10,676 | | | | 11,314 | |
| | PNFC sector cash deficit/(surplus)2 | | | 2,721 | | | | 2,662 | |
| | Non Financial Public Sector cash deficit/(surplus)2 | | | 13,397 | | | | 13,976 | |
| | Acquisitions under finance leases and similar arrangements3 | | | (128 | ) | | | (128 | ) |
Equals | | ABS GFS cash deficit/(surplus) | | | 13,525 | | | | 14,104 | |
Less | | Net cash flows from investments in financial assets for policy purposes | | | 3,009 | | | | 3,040 | |
Plus | | Memorandum Items4 | | | 1,642 | | | | 1,642 | |
| | Loan Council Allocation | | | 12,158 | | | | 12,706 | |
Notes:
| 1. | Numbers may not add due to rounding. |
| 2. | Figures in brackets represent surpluses. |
| 3. | Finance leases are shown with a negative sign as they are deducted in compiling the ABS GFS cash deficit/surplus. |
| 4. | Memorandum items include operating leases and local government borrowings. |
| | | | |
| | Mid Year Fiscal and Economic Review 2012-13 | | Page 21 |
TAXATION AND ROYALTY REVENUE AND ASSUMPTIONS
Table 17
Taxation and Royalty Revenue1
| | | | | | | | | | | | | | | | | | | | | | | | |
| | | 2011-12 | | | 2012-13 | | | 2012-13 | | | 2013-14 | | | 2014-15 | | | 2015-16 | |
| | | Actual | | | Budget | | | Revised | | | Projected | | | Projected | | | Projected | |
| | | $ million | | | $ million | | | $ million | | | $ million | | | $ million | | | $ million | |
Payroll tax | | | 3,462 | | | | 3,715 | | | | 3,715 | | | | 3,965 | | | | 4,260 | | | | 4,585 | |
Transfer duty | | | 2,023 | | | | 1,963 | | | | 1,968 | | | | 2,240 | | | | 2,476 | | | | 2,735 | |
Other duties | | | 1,052 | | | | 1,125 | | | | 1,149 | | | | 1,222 | | | | 1,311 | | | | 1,406 | |
Gambling taxes and levies | | | 998 | | | | 1,047 | | | | 1,064 | | | | 1,084 | | | | 1,127 | | | | 1,170 | |
Land tax | | | 1,013 | | | | 1,047 | | | | 1,012 | | | | 1,033 | | | | 1,074 | | | | 1,139 | |
Motor vehicle registration | | | 1,437 | | | | 1,459 | | | | 1,459 | | | | 1,503 | | | | 1,549 | | | | 1,626 | |
Other taxes | | | 622 | | | | 657 | | | | 644 | | | | 673 | | | | 702 | | | | 768 | |
Total taxation revenue | | | 10,608 | | | | 11,013 | | | | 11,011 | | | | 11,721 | | | | 12,498 | | | | 13,430 | |
| | | | | | |
Royalties | | | | | | | | | | | | | | | | | | | | | | | | |
Coal | | | 2,386 | | | | 2,209 | | | | 1,821 | | | | 2,517 | | | | 2,939 | | | | 3,174 | |
Other royalties | | | 409 | | | | 492 | | | | 447 | | | | 538 | | | | 770 | | | | 998 | |
Land rents | | | 149 | | | | 158 | | | | 158 | | | | 171 | | | | 181 | | | | 193 | |
Total royalties and land rents | | | 2,944 | | | | 2,859 | | | | 2,426 | | | | 3,226 | | | | 3,890 | | | | 4,364 | |
Note:
| 1. | Numbers may not add due to rounding. |
ROYALTY ASSUMPTIONS
Table 18
Royalty Assumptions
| | | | | | | | | | | | | | | | |
| | | 2012-13 | | | 2013-14 | | | 2014-15 | | | 2015-16 | |
| | | Revised | | | Projection | | | Projection | | | Projection | |
Tonnages – Crown Export Coal (Mt) | | | 164 | | | | 183 | | | | 198 | | | | 218 | |
Exchange Rate US$ per A$ | | | 1.02 | | | | 0.98 | | | | 0.93 | | | | 0.91 | |
Year Average Coal Prices | | | | | | | | | | | | | | | | |
Hard Coking | | | 180 | | | | 195 | | | | 195 | | | | 190 | |
Semi-Soft | | | 135 | | | | 145 | | | | 149 | | | | 143 | |
Thermal | | | 103 | | | | 105 | | | | 105 | | | | 105 | |
Table 19
Outlook for the Indicative Hard Coking Coal Contract Price 1
(US$/tonne)
| | | | | | | | | | | | | | | | | | | | |
| | | 2011-12 | | | 2012-13 | | | 2013-14 | | | 2014-15 | | | 2015-16 | |
2012-13 Budget | | | 260 | | | | 199 | | | | 215 | | | | 200 | | | | 190 | |
2012-13 MYFER | | | 260 | | | | 180 | | | | 195 | | | | 195 | | | | 190 | |
Consensus (Jun-12) | | | 260 | | | | 223 | | | | 220 | | | | 214 | | | | 202 | |
Consensus (Aug-12) | | | 260 | | | | 218 | | | | 214 | | | | 204 | | | | 192 | |
Consensus (Oct-12) | | | 260 | | | | 186 | | | | 191 | | | | 194 | | | | 189 | |
Sources: Energy Publishing, various media releases, Consensus Economics (various editions), Macroeconomics Team.
| 1 | Consensus Economics forecasts are quarterly frequency to September quarter 2014 (Jun-12 edition), December quarter 2014 (Aug-12 edition) and March quarter 2015 (Oct-12 edition). Longer-term, annual-frequency forecasts have been added beyond these quarters for each edition. |
| | | | |
| Page 22 | | Mid Year Fiscal and Economic Review 2012-13 | | |
State Budget 2012-13
Mid Year Fiscal and Economic Review