EXHIBIT (c)(iv)
Report entitled “State Budget 2013-14 Mid Year Fiscal and Economic Review”
Queensland Treasury and Trade
State Budget 2013-14
Mid Year Fiscal and Economic Review
AUDAX AT FIDELIS
Great state. Great opportunity.
AUDAX AT FIDELIS
Queensland Government
AUDAX AT FIDELIS
Queensland Government
STATE BUDGET 2013-14
MID YEAR FISCAL AND ECONOMIC REVIEW
BUDGET CONTEXT
The Independent Queensland Commission of Audit concluded in its Interim Report in June 2012 that:
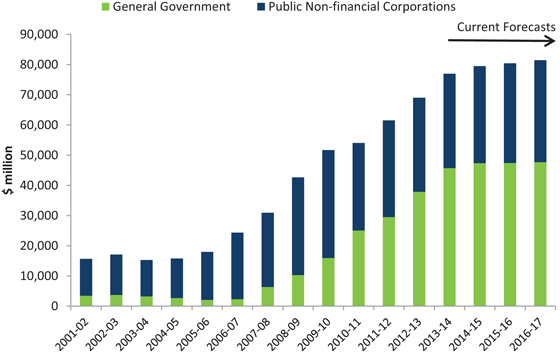
“Up until 2006-07, Queensland’s gross debt levels were low and stable. The majority of the State’s gross debt was held by Government owned corporations. Gross debt in the General Government sector was small and manageable, representing around 20 % of the State’s gross debt.”
“……the level of total Government gross debt almost tripled over the period 2005-06 to 2009-10. Gross debt is currently $64 Billion in 2011-12, and is expected to reach $92 Billion in 2015-16. On current projections, gross debt will reach $100 Billion by 2018-19.
Most of this increase has occurred in the General Government sector, where gross debt has increased more than tenfold in the last five years (to 2011-12).”
As shown in Chart 1, the key driver of the debt increases has been the accumulation of fiscal deficits of $36.7 billion between 2006-07 and 2012-13. The rapid build-up in debt is apparent in Chart 2.
Chart 1
General Government Fiscal Balance
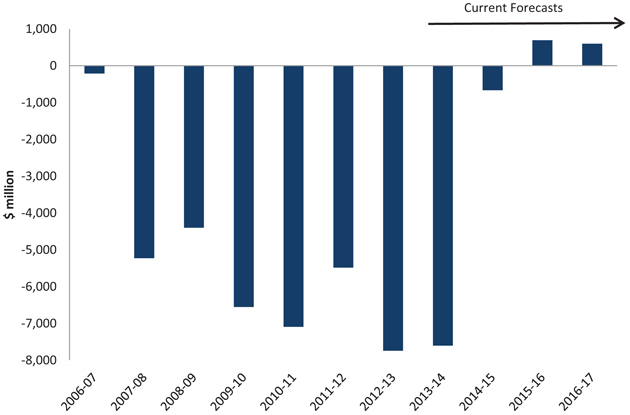
Source: Queensland Report on State Finances until 2012-13. 2013-14 onwards are Mid Year Fiscal and Economic Review (MYFER) projections.
| | | | |
| | Mid Year Economic and Fiscal Review 2013-14 | | Page 1 |
Chart 2
Growth of debt forecast to slow
Source: Queensland Report on State Finances until 2012-13. 2013-14 onwards are MYFER projections.
Although debt is forecast to grow more slowly over the forward estimates, a significant reduction in debt levels is not projected under current policy settings. Consequently, as shown in Charts 3 and 4, Queensland currently has, and will for the foreseeable future continue to have, considerably more debt than its peers.
Chart 3
Interstate Comparison of Debt to Revenue Ratios1
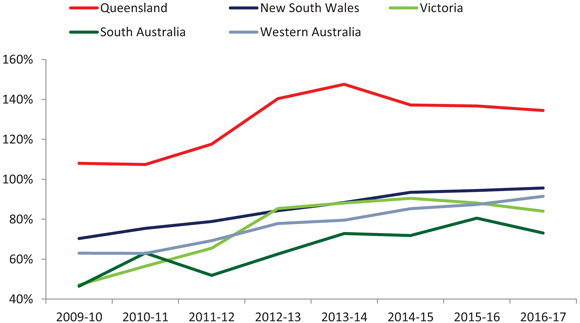
Note:
| 1. | Borrowings divided by total revenue (NFPS). |
Sources: ABS 5512.0, Report on State Finances and latest Budget Updates.
| | | | |
| Page 2 | | Mid Year Economic and Fiscal Review 2013-14 | | |
Chart 4
Borrowings per capita at 30 June 2013
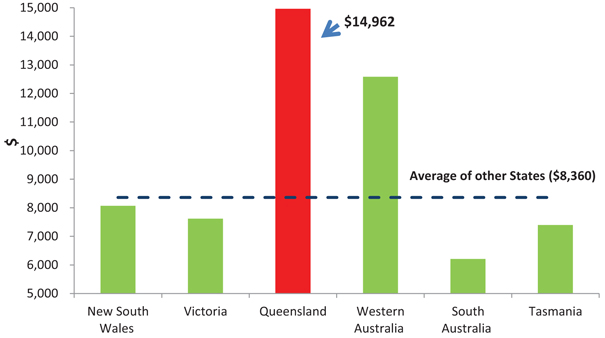
Source: State 2012-13 Final Budget Outcomes- NFPS borrowings. Population from ABS 3101.0
In response to the rapid deterioration in Queensland’s debt and deficit position, the Government implemented a new fiscal strategy and significant fiscal repair measures in the 2012-13 Budget. These measures totalled $7.8 billion over the 2012-13 to 2015-16 period ($7.5 billion since the Government came to power, including those in the 2013-14 MYFER).
The 2013-14 Budget made further progress towards fiscal repair while responding to additional challenges such as meeting the $2.5 billion rebuilding cost of ex-Tropical Cyclone Oswald, and absorbing reductions in key revenue sources of $5.4 billion in underlying terms since the Independent Commission of Audit Interim Report. The reductions in taxation, GST and royalty revenue are shown in Chart 5.
Chart 5
Reduction in Key Revenues since Commission of Audit
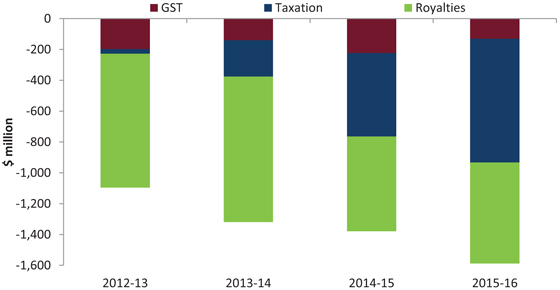
Source: Queensland Treasury and Trade.
| | | | |
| | Mid Year Economic and Fiscal Review 2013-14 | | Page 3 |
Further savings measures were announced in the 2013-14 Budget that more than offset additional spending measures.
The improvement in the 2012-13 outcome provides a lower starting point for borrowings. Hence, despite the 2013-14 MYFER projecting a small deterioration in the fiscal balance across the forward estimates, General Government borrowings remain lower than projected in the 2013-14 Budget. Non-financial Public sector (NFPS) borrowings are also slightly lower than Budget forecasts, with the difference narrowing by 2016-17.
The Government’s fiscal principles, especially achieving and maintaining a General Government sector fiscal balance, and stabilising then significantly reducing debt, have provided a clear focus and objective for policy.
Net measures since the election in March 2012 are delivering savings of around $7.5 billion in the General Government sector over the period 2012-13 to 2015-16. This has played the crucial role in Non-financial Public sector borrowings at 30 June 2016 being $9.4 billion lower than the comparable estimate in the Independent Commission of Audit’s Interim Report.
Table 1
Non-financial Public Sector – revisions to gross borrowings
| | | | | | | | | | | | | | | | | | | | |
| | | 2012-13
$ million | | | 2013-14
$ million | | | 2014-15
$ million | | | 2015-16
$ million | | | 2016-17
$ million | |
CoA Interim Report1 | | | 74,080 | | | | 82,293 | | | | 86,326 | | | | 89,838 | | | | n/a | |
2013-14 Budget | | | 69,490 | | | | 78,125 | | | | 80,147 | | | | 81,137 | | | | 81,465 | |
2013-14 MYFER2 | | | 69,031 | | | | 76,968 | | | | 79,476 | | | | 80,416 | | | | 81,454 | |
| | | | | | | | | | | | | | | | | | | | |
Reduction since CoA | | | 5,049 | | | | 5,325 | | | | 6,850 | | | | 9,422 | | | | n/a | |
| | | | | | | | | | | | | | | | | | | | |
Notes:
| 1. | Independent Commission of Audit (CoA) Interim Report borrowing numbers have been adjusted to ensure comparability with the 2013-14 Budget and MYFER. |
| 2. | 2012-13 figure is as per the 2012-13 Outcomes Report. |
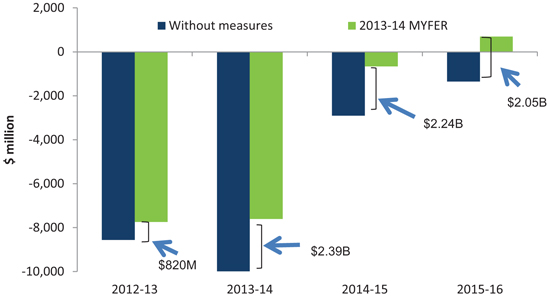
The 2013-14 MYFER consolidates fiscal repair, and demonstrates that announced measures are showing results, albeit under the burden of high levels of debt. Chart 6 shows the improvement in the General Government fiscal balance over the period 2012-13 to 2015-16 following the Government decisions.
| | | | |
| Page 4 | | Mid Year Economic and Fiscal Review 2013-14 | | |
Chart 6
$7.5 billion total improvement in Fiscal Balance with Government measures
Source: Queensland Treasury and Trade.
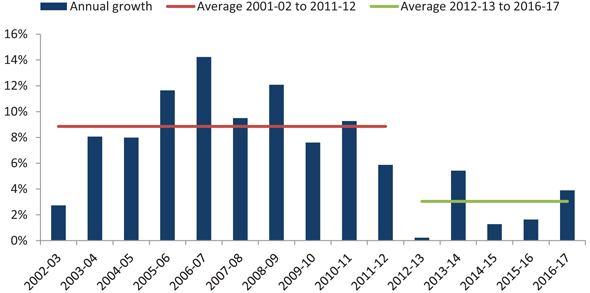
Getting spending under control is an important objective of fiscal repair, especially in an environment of subdued revenue growth. Actual expenses in the General Government sector in 2012-13 were only 0.2 % (or $101 million) more than 2011-12.
Chart 7
General Government Expense Growth1
Note:
| 1. | Yearly profile across the forward estimates is heavily influenced by the timing of disaster-related expenses. |
Source: Queensland Treasury and Trade.
This is the lowest actual rate of growth in expenses since accrual accounting commenced in 1998-99 and contrasts with average expenses growth of 8.9 % per annum in the decade to 2011-12. A fall in actual employee expenses in 2012-13 of 0.7 % (or $120 million) has made a major contribution to this outcome, and contrasts with average employee expenses growth of 8.6 % per annum in the decade to 2011-12.
| | | | |
| | Mid Year Economic and Fiscal Review 2013-14 | | Page 5 |
The Independent Commission of Audit recommended that the State divest a range of commercial activities that the Government currently operates. The Commission considered that these enterprises tie up a significant amount of capital that could be used to pay down debt, or free up funds to invest in higher priorities.
The previous Government sold a range of assets in its last term with the proceeds from asset sales exceeding $15 billion. Nevertheless, with the budget in significant structural deficit, gross borrowing in the Non-financial Public sector still increased by almost $19 billion between 30 June 2009 and 30 June 2012.
The Independent Commission’s Final Report made 155 recommendations focussed on the role and operations of Government in a modern economy. The Government accepted the majority of the recommendations in the Final Report. The report makes recommendations on a range of issues including:
| | • | | The structure of the public service |
| | • | | The sale of Government businesses |
Many of the recommendations relate to “contestability”. Contestability is not an outcome. Contestability is a process where Government tests the market to ensure it is providing the public with the best possible solution at the best possible price.
The Government is determined to transition to being the “enabler”. It recognises that the Government does not always need to be the service provider. In a modern Queensland, whom provides the services will be far less important than access to, quality and timeliness of services.
Implementing these recommendations will require new skills and capabilities in parts of the public service. The Government response represents the most significant transformation of the public sector in Queensland for four decades. It is a plan for better government services for Queenslanders by increasing productivity and enhancing service delivery.
Although expected to improve value for money in service delivery, no savings from this have been incorporated into the 2013-14 MYFER estimates.
The Government remains fully committed to seeking a mandate from the Queensland people before divesting itself of any Government business. However, the Government believes such a proposal warrants a considered and rational debate to establish its viability and to inform stakeholders of the costs and benefits of Government owning such businesses, noting these also come with significant financial risks in the context of a modern economy.
| | | | |
| Page 6 | | Mid Year Economic and Fiscal Review 2013-14 | | |
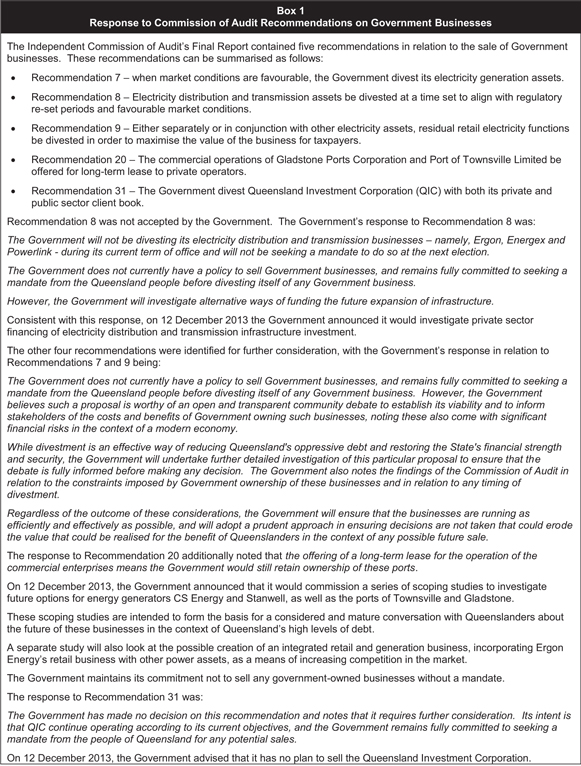
Box 1
Response to Commission of Audit Recommendations on Government Businesses
The Independent Commission of Audit’s Final Report contained five recommendations in relation to the sale of Government businesses. These recommendations can be summarised as follows:
• Recommendation 7 – when market conditions are favourable, the Government divest its electricity generation assets.
• Recommendation 8 – Electricity distribution and transmission assets be divested at a time set to align with regulatory re-set periods and favourable market conditions.
• Recommendation 9 – Either separately or in conjunction with other electricity assets, residual retail electricity functions be divested in order to maximise the value of the business for taxpayers.
• Recommendation 20 – The commercial operations of Gladstone Ports Corporation and Port of Townsville Limited be offered for long-term lease to private operators.
• Recommendation 31 – The Government divest Queensland Investment Corporation (QIC) with both its private and public sector client book.
Recommendation 8 was not accepted by the Government. The Government’s response to Recommendation 8 was:
The Government will not be divesting its electricity distribution and transmission businesses – namely, Ergon, Energex and Powerlink - during its current term of office and will not be seeking a mandate to do so at the next election.
The Government does not currently have a policy to sell Government businesses, and remains fully committed to seeking a mandate from the Queensland people before divesting itself of any Government business.
However, the Government will investigate alternative ways of funding the future expansion of infrastructure.
Consistent with this response, on 12 December 2013 the Government announced it would investigate private sector financing of electricity distribution and transmission infrastructure investment.
The other four recommendations were identified for further consideration, with the Government’s response in relation to
Recommendations 7 and 9 being:
The Government does not currently have a policy to sell Government businesses, and remains fully committed to seeking a mandate from the Queensland people before divesting itself of any Government business. However, the Government believes such a proposal is worthy of an open and transparent community debate to establish its viability and to inform stakeholders of the costs and benefits of Government owning such businesses, noting these also come with significant financial risks in the context of a modern economy.
While divestment is an effective way of reducing Queensland’s oppressive debt and restoring the State’s financial strength and security, the Government will undertake further detailed investigation of this particular proposal to ensure that the debate is fully informed before making any decision. The Government also notes the findings of the Commission of Audit in relation to the constraints imposed by Government ownership of these businesses and in relation to any timing of divestment.
Regardless of the outcome of these considerations, the Government will ensure that the businesses are running as efficiently and effectively as possible, and will adopt a prudent approach in ensuring decisions are not taken that could erode the value that could be realised for the benefit of Queenslanders in the context of any possible future sale.
The response to Recommendation 20 additionally noted that the offering of a long-term lease for the operation of the commercial enterprises means the Government would still retain ownership of these ports.
On 12 December 2013, the Government announced that it would commission a series of scoping studies to investigate future options for energy generators CS Energy and Stanwell, as well as the ports of Townsville and Gladstone.
These scoping studies are intended to form the basis for a considered and mature conversation with Queenslanders about the future of these businesses in the context of Queensland’s high levels of debt.
A separate study will also look at the possible creation of an integrated retail and generation business, incorporating Ergon
Energy’s retail business with other power assets, as a means of increasing competition in the market.
The Government maintains its commitment not to sell any government-owned businesses without a mandate.
The response to Recommendation 31 was:
The Government has made no decision on this recommendation and notes that it requires further consideration. Its intent is that QIC continue operating according to its current objectives, and the Government remains fully committed to seeking a mandate from the people of Queensland for any potential sales.
On 12 December 2013, the Government advised that it has no plan to sell the Queensland Investment Corporation.
| | | | |
| | Mid Year Economic and Fiscal Review 2013-14 | | Page 7 |
ECONOMIC OVERVIEW
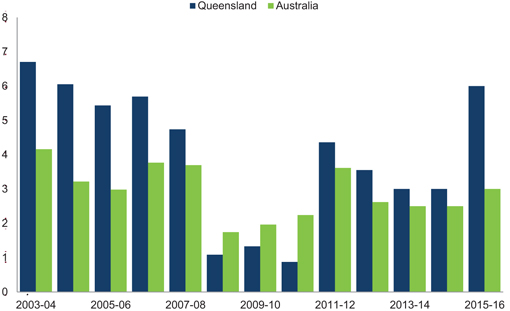
The Queensland economy grew by 3.6% in 2012-13. Growth occurred primarily on the strength of business investment in the resources sector and exports. However, the high level of debt is constraining the Government’s ability to invest in high benefit-cost-ratio projects to lift productivity and improve economic performance.
Nevertheless, this is the second consecutive year that economic growth in Queensland was higher than that nationally, and follows three years where Queensland growth was lower than the national level.
The Queensland economy is forecast to grow by 3% in both 2013-14 and 2014-15, rising to 6% in 2015-16. This compares to Commonwealth Treasury forecasts for national growth of 2 1/2% for both 2013-14 and 2014-15 in the 2013-14 Mid-Year Economic and Fiscal Outlook. Based on the latest state publications available as at 17 December 2013, Queensland is expected to have the fastest growing state economy in 2014-15, and the second fastest in 2013-14 after Western Australia.
While the recovery in dwelling investment in Queensland is expected to be stronger than forecast in the 2013-14 Budget, household consumption growth is now likely to be softer. The outlook for coal and tourism exports has improved.
Consistent with the outlook in the 2013-14 Budget, the resources sector is moving from an investment phase towards an export phase. For three years, business investment has been boosted by capital investment in liquefied natural gas projects, which is expected to total more than $60 billion. With investment expected to peak in 2013, other sectors of the economy, especially exports, will increasingly contribute to growth.
Chart 8
Real Economic Growth1, Queensland and Australia
(annual % change)
Note:
| 1. | 2011-12 reference year. 2013-14 to 2015-16 are forecasts. |
Sources: ABS 5220.0; Queensland Treasury and Trade, Australian Treasury 2013-14 Mid-Year Economic and Fiscal Outlook.
Queensland’s major trading partners’ economic growth outlook for 2013 has been downgraded from 3.5% at the time of the 2013-14 Budget, to 3.2% in November 2013. Growth for 2014 has likewise been downgraded from 4.0% to 3.7%. This compares to an average annual rate of growth of 4.5% over the decade to 2007, the year before the onset of the GFC.
| | | | |
| Page 8 | | Mid Year Economic and Fiscal Review 2013-14 | | |
As shown in Table 2, the main reason for this revision is slightly lower growth in China (Queensland’s largest trading partner) and a material softening in the outlook for India (Queensland’s fourth largest trading partner).
Table 2
Queensland’s Major Trading Partner GDP Growth Forecasts1
| | | | | | | | | | | | | | | | | | | | |
| | | 2012 | | | 2013 | | | 2014 | |
| | | Actual
% | | | Budget
% | | | MYFER
% | | | Budget
% | | | MYFER
% | |
Non-Japan Asia2 | | | 4.6 | | | | 5.3 | | | | 4.7 | | | | 5.8 | | | | 5.3 | |
China | | | 7.7 | | | | 7.9 | | | | 7.6 | | | | 7.9 | | | | 7.5 | |
India | | | 5.0 | | | | 6.1 | | | | 4.6 | | | | 6.8 | | | | 5.6 | |
Japan | | | 1.9 | | | | 1.4 | | | | 1.9 | | | | 1.5 | | | | 1.6 | |
Europe3 | | | -0.6 | | | | -0.1 | | | | -0.1 | | | | 1.1 | | | | 1.1 | |
US | | | 2.8 | | | | 1.9 | | | | 1.7 | | | | 2.7 | | | | 2.6 | |
| | | | | |
Total | | | 3.2 | | | | 3.5 | | | | 3.2 | | | | 4.0 | | | | 3.7 | |
Notes:
| 1. | Country weights have been updated since the 2013-14 Budget, now based on average export values for the five year period to June 2013. |
| 2. | Includes New Zealand. Note that forecasts for India are based on India’s fiscal year (starting April 1). |
| 3. | Includes United Kingdom. |
Sources: Queensland Treasury and Trade; IMF; Consensus Economics.
The Australian dollar (A$) has depreciated much faster than anticipated in the 2013-14 Budget. The value of the A$ is now expected to be sustained at around 91US cents over the medium term. Lower than expected commodity prices could result in a further depreciation of the currency.
Although the State’s economic growth forecast remains on track, the composition of growth has changed.
Ongoing consumer caution, along with weaker than expected income growth is likely to see household consumption grow more slowly in 2013-14 and 2014-15. Household consumption (seasonally adjusted) rose by 0.5% in September quarter 2013, down from 0.8% growth in the June quarter.
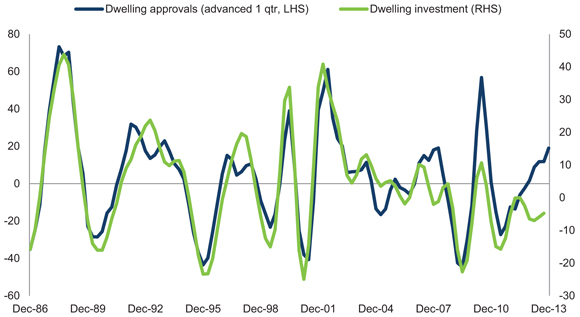
Assisted by low borrowing costs, rising rental yields and accelerating house price growth, dwelling investment is likely to grow faster than previously expected in 2013-14 and 2014-15. This marks a turnaround from the declines in investment over each of the previous six years. Some investor interest may also switch towards Queensland given house price growth in Brisbane has been weaker than that in Sydney in recent years.
While house prices in Sydney have risen 13.7% from their previous troughs, house prices in Brisbane have risen only 5.1% from the recent trough recorded in the June quarter 2012. In that respect, concerns about the re-emergence of a “housing price bubble” appear to be over-blown, given the industry is still recovering from several years of depressed prices.
Chart 9 supports the expectation that recent growth in dwelling approvals will translate into construction activity in coming quarters.
| | | | |
| | Mid Year Economic and Fiscal Review 2013-14 | | Page 9 |
Chart 9
Dwelling approvals and investment1, Queensland
(annual % change, quarterly, trend)
Note:
| 1. | CVM, reference year 2011-12. |
Sources: ABS 5206.0 and 8731.0.
Construction of the three large CSG to LNG projects will continue to support mining investment in Queensland in coming years. However, the scheduled completion of these projects means that business investment is forecast to decline over the forward estimates period. Growth in non-resources investment is anticipated to gradually strengthen from 2014-15.
Coal export volumes are forecast to be stronger than expected at the time of the 2013-14 Budget. Despite the moderation in global growth, strong demand from China saw a significant increase in Queensland coal export volumes in 2012-13. Lower coal prices forecast for 2013-14 are expected to sustain the demand from China. The limited supply of coking coal from Mongolia and the Chinese government’s decision to seek thermal coal with higher energy content will also benefit Queensland as a preferred supplier of both these types of coal to China.
However, this stronger outlook for coal exports is offset by expectations of weaker base metal exports, reflecting lower than previously expected outputs from some major metal mines.
The resources sector is moving from an investment phase towards an export phase. The ramp up in LNG production will drive a surge in overseas exports in 2015-16, contributing to economic growth of 6% in that year.
Both overseas and interstate tourism exports posted strong rebounds in 2012-13, recording 11.4% and 12.8% growth respectively. Recent arrivals data show continued momentum in overseas tourism demand, which if sustained will result in stronger than expected growth in 2013-14.
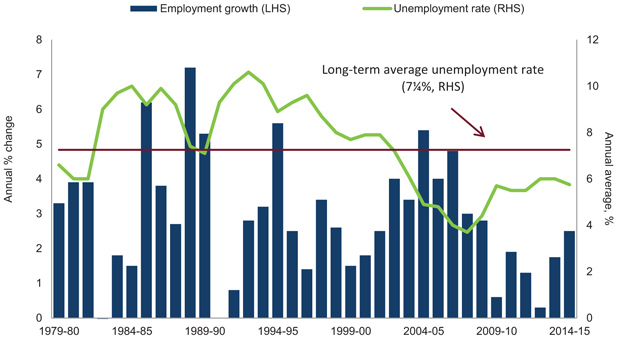
Despite the forecasts of overall economic growth remaining the same as those published in the 2013-14 State Budget, recent labour market data indicate that the pace of recovery in employment in 2013-14 has so far been weaker than previously expected.
While employment conditions are still expected to continue to improve in the remainder of the financial year, the extent of improvement is unlikely to be strong enough to achieve the Budget forecast of 2 1/4% employment growth in 2013-14. Growth is now expected to be around 1 3/4%.
| | | | |
| Page 10 | | Mid Year Economic and Fiscal Review 2013-14 | | |
However, with the participation rate averaging 65.8% in the first five months of the current financial year, the forecast year-average unemployment rate remains unchanged at 6% in 2013-14 and 5 3/4% in 2014-15.
Chart 10
Queensland labour market1
Note:
| 1. | 2013-14 and 2014-15 are forecasts. |
Sources: ABS 6202.0; Queensland Treasury and Trade.
Treasury’s forecasts for inflation and population growth remain unchanged from the 2013-14 Budget.
Table 3
Economic Forecasts, Queensland
(year average, original terms)
| | | | | | | | | | | | | | | | | | | | |
| Parameter | | 2012-13 | | | 2013-14 | | | 2014-15 | |
| | | Outcome | | | Budget | | | MYFER | | | Budget | | | MYFER | |
Real GSP | | | 3.6 | | | | 3 | | | | 3 | | | | 3 | | | | 3 | |
Employment | | | 0.3 | | | | 2¼ | | | | 1¾ | | | | 2½ | | | | 2½ | |
Unemployment rate | | | 6.0 | | | | 6 | | | | 6 | | | | 5¾ | | | | 5¾ | |
CPI1 | | | 2.0 | | | | 2½ | | | | 2½ | | | | 2½ | | | | 2½ | |
Wage Price Index | | | 3.0 | | | | 3½ | | | | 3½ | | | | 3½ | | | | 3½ | |
Population | | | 2.1 | | | | 2 | | | | 2 | | | | 2¼ | | | | 2¼ | |
Notes:
| 1. | The forecasts do not incorporate any repeal of the carbon tax which could have an impact on inflation outcomes in 2013-14 or 2014-15, depending on the timing of the repeal. |
Sources: ABS 3101.0, 5220.0, 6202.0, 6345.0, 6401.0, and Queensland Treasury and Trade.
| | | | |
| | Mid Year Economic and Fiscal Review 2013-14 | | Page 11 |
FISCAL OVERVIEW
Table 4
General Government sector – key financial aggregates1
| | | | | | | | | | | | | | | | | | | | | | | | |
| | | 2012-13
Actual
$ million | | | 2013-14
Budget
$ million | | | 2013-14
Revised
$ million | | | 2014-15
Projection
$ million | | | 2015-16
Projection
$ million | | | 2016-17
Projection
$ million | |
Revenue | | | 41,746 | | | | 44,677 | | | | 44,864 | | | | 51,164 | | | | 52,087 | | | | 53,486 | |
Expenses | | | 46,129 | | | | 48,436 | | | | 48,633 | | | | 49,255 | | | | 50,062 | | | | 52,013 | |
Net operating balance | | | (4,382 | ) | | | (3,760 | ) | | | (3,769 | ) | | | 1,910 | | | | 2,026 | | | | 1,474 | |
Fiscal balance | | | (7,741 | ) | | | (7,664 | ) | | | (7,604 | ) | | | (664 | ) | | | 696 | | | | 598 | |
Gross Borrowing (NFPS)2 | | | 69,031 | | | | 78,125 | | | | 76,968 | | | | 79,476 | | | | 80,416 | | | | 81,454 | |
Notes:
| 1. | Numbers may not add due to rounding. |
| 2. | NFPS: Non-financial Public Sector. |
Fiscal balance
The 2012-13 fiscal balance improved by $945 million from the estimated actual included in the 2013-14 Budget. This improvement reflects capital purchases being $427 million lower and expenses being $397 million lower than expected.
The General Government fiscal balance expected for 2013-14 is a deficit of $7.604 billion compared to a forecast deficit of $7.664 billion at the time of the 2013-14 Budget. While remaining on track to return to surplus in 2015-16, the forecast General Government sector fiscal balances are expected to be weaker than published in the 2013-14 Budget from 2014-15 to 2016-17.
The improved 2013-14 fiscal balance position is primarily due to higher GST and taxation revenue than forecast at Budget and revisions to natural disaster spending. Overall, tax collection estimates for 2013-14 have been revised up by $63 million, due to a stronger outlook for transfer duty (revised up largely to incorporate a significant extraordinary business transaction), partially offset by a weaker outlook for payroll tax and insurance duty.
The Government is continuing to actively manage spending with General Government expenses expected to grow by an average of 3% per annum from 2012-13 to 2016-17.
Table 5 provides a breakdown of the movements in the net operating and fiscal balances since the 2013-14 Budget.
The significant improvement in the fiscal balance across the forward estimates continues to be driven by the $7.8 billion in savings measures contained in the 2012-13 Budget. Across the forward estimates, taxation and royalty revenue have been revised down. This combined with modest new expenditure measures, including the New Generation Rollingstock contract now being included in the General Government sector, are the key reasons for the deterioration in fiscal balance from 2014-15 onwards.
| | | | |
| Page 12 | | Mid Year Economic and Fiscal Review 2013-14 | | |
Table 5
Reconciliation of net operating balance and fiscal balance
2013-14 Budget to 2013-14 MYFER1
| | | | | | | | | | | | | | | | |
| | | 2013-14
$ million | | | 2014-15
$ million | | | 2015-16
$ million | | | 2016-17
$ million | |
Net Operating Balance | |
2013-14 Budget net operating balance | | | (3,760 | ) | | | 2,091 | | | | 2,043 | | | | 1,713 | |
Taxation revisions | | | 63 | | | | (46 | ) | | | (90 | ) | | | (132 | ) |
Royalty revisions | | | (97 | ) | | | (8 | ) | | | 5 | | | | (224 | ) |
Natural disaster revisions | | | 225 | | | | (213 | ) | | | 16 | | | | — | |
Net flows from Public Non-financial Corporation entities | | | (65 | ) | | | (5 | ) | | | 18 | | | | 39 | |
Policy measures | | | (124 | ) | | | (77 | ) | | | (75 | ) | | | (133 | ) |
Other parameter adjustments | | | (11 | ) | | | 168 | | | | 109 | | | | 211 | |
2013-14 MYFER net operating balance | | | (3,769 | ) | | | 1,910 | | | | 2,026 | | | | 1,474 | |
Fiscal Balance | |
2013-14 Budget fiscal balance | | | (7,664 | ) | | | (244 | ) | | | 1,065 | | | | 1,409 | |
Change in net operating balance | | | (9 | ) | | | (181 | ) | | | (17 | ) | | | (239 | ) |
Other capital movements | | | 69 | | | | (239 | ) | | | (352 | ) | | | (572 | ) |
2013-14 MYFER fiscal balance | | | (7,604 | ) | | | (664 | ) | | | 696 | | | | 598 | |
Note:
| 1. | Numbers may not add due to rounding. Denotes impact on the operating and fiscal balances. |
Australian Government payments
Following the federal election in September 2013, the Australian Government has initiated a review of federal financial arrangements through the establishment of the National Commission of Audit and the proposed white paper processes on federalism and tax reform. Queensland will actively engage in these processes as they present an ideal opportunity to address the key challenges facing the Australian Federation to strengthen productivity and economic growth.
The Commonwealth Grants Commission is currently conducting a review of the methodology for distributing GST revenue between the states, and is due to report in February 2015. The 2015 Methodology Review aims to improve the current methodology, taking into account the recommendations of the GST Distribution Review and major changes in federal financial relations that have occurred since the last methodology review, including National Health Reform, DisabilityCare and potential impacts of national school funding reform.
There has been an upward revision to Queensland’s estimated share of GST in 2013-14 of $70 million, as a result of GST collections being higher than the Commonwealth had forecast in 2012-13.
| | | | |
| | Mid Year Economic and Fiscal Review 2013-14 | | Page 13 |
Education funding
The Australian Government recently announced additional funding for Queensland state schools of $794 million over the four years to 2016-17, including $131 million for the 2014 school year. This funding offer recognises the significant investment that the Queensland Government has already made to schooling in the State particularly through the $537 million Great Teachers = Great Results program. In addition, the offer comes without the prescriptive elements required by the previous Australian Government. The Queensland Government will continue to work with the Australian Government to finalise the funding arrangements.
NDRRA
Ex-Tropical Cyclone Oswald, and the flooding that followed, brought destruction to 57 Queensland local government areas from January to March 2013. Many of these areas were still recovering from the enormous loss and damage brought by the natural disasters of 2010 to 2012. The estimated repair and recovery costs bring total disaster spending over the 2012-13 to 2014-15 period to $8.8 billion, down from the $9.3 billion estimated in the 2013-14 Budget.
Consistent with the 2013-14 Budget, the MYFER estimates assume that the Commonwealth Government will reimburse Queensland for the $725 million for previous Natural Disaster Relief and Recovery Arrangement expenditure. Work is continuing to support receiving this funding.
The timing of revenue and expenditure in relation to natural disasters has significantly impacted Queensland’s headline fiscal balance estimate and will continue to do so. A risk remains that spending currently built into the 2013-14 estimates shown in Table 6 below, will be deferred into 2014-15, worsening the fiscal deficit in that year.
Table 6 outlines the impact of natural disaster arrangements on Queensland’s fiscal balance. The gradual improvement in the underlying fiscal balance is apparent in these figures.
Table 6
Impact of Natural Disaster Relief and Recovery Arrangements
funding on the fiscal balance1
| | | | | | | | | | | | | | | | | | | | |
| | | 2012-13
Actual
$ million | | | 2013-14
MYFER
$ million | | | 2014-15
Projection
$ million | | | 2015-16
Projection
$ million | | | 2016-17
Projection
$ million | |
Published fiscal balance | | | (7,741 | ) | | | (7,604 | ) | | | (664 | ) | | | 696 | | | | 598 | |
less Disaster revenue2,3 | | | 1 | | | | — | | | | 2,889 | | | | 1,099 | | | | — | |
add Disaster expenditure | | | 3,244 | | | | 3,936 | | | | 1,624 | | | | — | �� | | | — | |
Underlying fiscal balance | | | (4,498 | ) | | | (3,668 | ) | | | (1,929 | ) | | | (403 | ) | | | 598 | |
Notes:
| 1. | Includes revenue and expenditure in relation to 2010-11 floods and Cyclone Yasi as well as prior events and more recent events. |
| 2. | Revenues are expected to occur in the financial year following the delivery of the works to which it relates. |
| 3. | Excludes loans provided through the State, which are not treated as revenue. |
Expenses
Expenses in 2013-14 are expected to be $48.633 billion, $197 million (or 0.4%) higher than the Budget estimates.
Expenses over the period 2013-14 to 2016-17 are expected to be around $1.095 billion higher than expected at the 2013-14 Budget. This is largely due to increased education expenditure associated with the recently announced $794 million increased funding from the Australian Government.
| | | | |
| Page 14 | | Mid Year Economic and Fiscal Review 2013-14 | | |
The Government continues to ensure that expenses growth is contained. General Government expenses are forecast to grow by an average of 3% per annum from 2012-13 to 2016-17, significantly less than the 8.9% of the previous decade.
Employee expenses fell by 0.7% in 2012-13 consistent with disciplined expenditure control. Over the period 2011-12 to 2016-17 employee expenses are expected to grow by 2.7% per annum on average, very similar to the 2013-14 Budget estimate.
Revenue
General Government revenue in 2013-14 is estimated to be $44.864 billion, $187 million more than the 2013-14 Budget estimate. This primarily reflects increased GST revenue due to an underpayment in 2012-13, additional grants from the Australian Government for education and higher than expected transfer duty revenue.
Over the period 2013-14 to 2016-17, revenue is $646 million higher than forecast in the 2013-14 Budget, primarily driven by the increase in education funding from the Australian Government, which has an offsetting expense. Excluding this change, revenues over the period have been revised down by $148 million since Budget.
Royalties continue to be a very volatile source of revenue, with contract prices, the A$-US$ exchange rate, and trading partner demand being key drivers of royalty collections.
Coal export volumes have been above forecasts so far in 2013-14, with MYFER forecasts revising up slightly the already strong volume growth forecast at Budget. The depreciation of the Australian Dollar has been faster than expected, with the assumption for 2013-14 revised down from parity with the US Dollar at Budget to 93 cents at MYFER, and 91 cents in the medium term. However, this benefit has been more than offset by coal prices being weaker than forecast in 2013-14.
Reflecting a weaker price outlook, there are relatively modest downward revisions to coal royalties totalling $160 million (1.4% reduction) across the forward estimates. There has also been a decline in the royalty estimates for base and precious metals, based on a weaker price outlook and industry forecasts of production volumes reducing across the forward estimates. These reductions are most significant in 2015-16 and 2016-17.
Taxation and royalty projections for 2013-14 and the forward estimates are outlined in Table 18 with royalty assumptions in Table 19.
Balance sheet
Non-financial Public Sector
The Non-financial Public sector (NFPS) is the consolidation of the General Government and Public Non-financial Corporations (i.e. commercial) sectors, with transactions between these sectors eliminated.
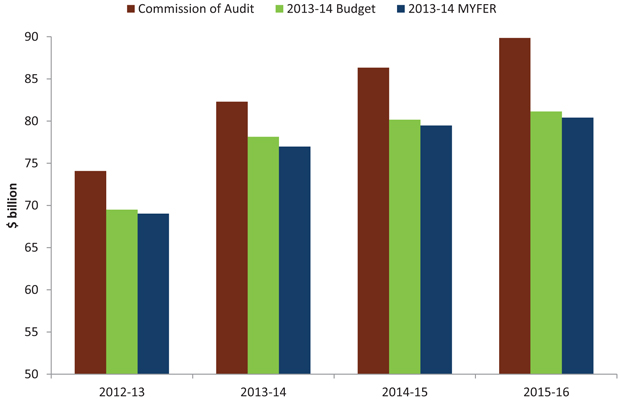
Borrowings of $76.968 billion are projected at 30 June 2014 in the NFPS, $1.157 billion less than the 2013-14 Budget estimate. By 2014-15, borrowings are expected to reach $79.476 billion, $671 million less than the 2013-14 Budget estimate, and $6.85 billion less than the comparable number published in the Interim Report of the Independent Commission of Audit for 2014-15.
| | | | |
| | Mid Year Economic and Fiscal Review 2013-14 | | Page 15 |
Chart 11
Comparison of Borrowing in Non-financial Public Sector1
Note:
| 1. | Independent Commission of Audit borrowing numbers have been adjusted to ensure comparability in relation to the treatment of the reclassification of Queensland Treasury Holdings into the PNFC sector. |
Source: Independent Commission of Audit Interim Report and Queensland Treasury and Trade.
Purchases of non-financial assets (capital spending) of $11.172 billion are expected in the NFPS sector in 2013-14, $158 million more than the 2013-14 Budget estimate. This increase is largely due to increases in capital expenditure by Sunwater on the Woleebee Creek pipeline.
General Government Sector
Borrowings
Borrowings in the General Government sector were $37.878 billion at 30 June 2013, $986 million lower than forecast in the 2013-14 Budget. General Government borrowings are forecast at $45.719 billion at 30 June 2014, $1.477 billion less than forecast in the 2013-14 Budget. By 2014-15 General Government borrowings are expected to be $47.372 billion and increase only slightly in 2015-16 and 2016-17.
| | | | |
| Page 16 | | Mid Year Economic and Fiscal Review 2013-14 | | |
Achievement of the Government’s fiscal principles
The Government’s fiscal consolidation efforts have allowed it to make significant progress in achieving its fiscal principles. Table 7 outlines the progress towards achieving the principles.
Table 7
The fiscal principles of the Queensland Government
| | | | | | | | | | | | |
Principle | | Indicator | |
| | | Debt to Revenue Ratio | |
| | | | | | 2013-14 Budget
per cent | | | 2013-14 MYFER
per cent | |
Stabilise then significantly reduce debt | | | 2012-13 | | | | 141 | | | | 140 | |
(Non-financial Public sector) | | | 2013-14 | | | | 150 | | | | 148 | |
| | | 2014-15 | | | | 138 | | | | 137 | |
| | | 2015-16 | | | | 138 | | | | 137 | |
| | | 2016-17 | | | | 134 | | | | 134 | |
| |
| | | General Government Fiscal Balance | |
| | | | | | 2013-14 Budget
($ million) | | | 2013-14 MYFER
($ million) | |
Achieve and maintain a General Government sector fiscal balance by 2014-15 | | | 2012-13 | | | | (8,686 | ) | | | (7,741 | ) |
| | | 2013-14 | | | | (7,664 | ) | | | (7,604 | ) |
| | | 2014-15 | | | | (244 | ) | | | (664 | ) |
| | | 2015-16 | | | | 1,065 | | | | 696 | |
| | | 2016-17 | | | | 1,409 | | | | 598 | |
| |
| | | Taxation revenue per capita, 2013-14 | |
Maintain a competitive tax environment for business | | | Queensland: | | | $ | 2,528 | |
| |
| Average of other
states and territories: |
| | $ | 3,014 | |
| Target full funding of long term liabilities such as superannuation in accordance with actuarial advice | |
| As at last actuarial review (released
June 2011), accruing superannuation
liabilities were fully funded when
the QML transaction is taken into
account. The State Actuary reviews
the scheme every three years. |
|
The debt to revenue ratio is expected to peak at 148% in 2013-14, slightly below the 150% peak anticipated in the 2013-14 Budget. From 2014-15, the debt to revenue ratio is expected to gradually improve as debt is projected to grow modestly and revenue continues to grow.
This profile is heavily influenced by the timing of NDRRA revenue and expenditure, which impact both the revenue and debt aspects of the ratio.
The fiscal balance projection for 2014-15 has deteriorated somewhat since the 2013-14 Budget, partly driven by revisions to the timing of NDRRA flows. Although a deficit of $664 million is currently projected, the Government maintains an objective of delivering a fiscal surplus in 2014-15. Fiscal surpluses continue to be projected in both 2015-16 and 2016-17.
| | | | |
| | Mid Year Economic and Fiscal Review 2013-14 | | Page 17 |
UNIFORM PRESENTATION FRAMEWORK AND LOAN COUNCIL ALLOCATION
Uniform Presentation Framework Information
Table 8
General Government Sector Operating Statement 1
| | | | | | | | | | | | | | | | | | | | | | |
| | | | | 2013-14
Budget
$ million | | | 2013-14
Revised
$ million | | | 2014-15
Projection
$ million | | | 2015-16
Projection
$ million | | | 2016-17
Projection
$ million | |
| | Revenue from Transactions | | | | | | | | | | | | | | | | | | | | |
| | Taxation revenue | | | 11,851 | | | | 11,914 | | | | 12,634 | | | | 13,457 | | | | 14,290 | |
| | Grants revenue | | | 20,115 | | | | 20,330 | | | | 24,378 | | | | 23,569 | | | | 23,493 | |
| | Sales of goods and services | | | 4,968 | | | | 4,930 | | | | 5,165 | | | | 5,386 | | | | 5,435 | |
| | Interest income | | | 2,396 | | | | 2,412 | | | | 2,480 | | | | 2,528 | | | | 2,587 | |
| | Dividend and income tax equivalent income | | | 1,694 | | | | 1,658 | | | | 2,166 | | | | 2,232 | | | | 2,575 | |
| | Other revenue | | | 3,652 | | | | 3,621 | | | | 4,341 | | | | 4,916 | | | | 5,106 | |
| | Total Revenue from Transactions | | | 44,677 | | | | 44,864 | | | | 51,164 | | | | 52,087 | | | | 53,486 | |
| | | | | | |
Less | | Expenses from Transactions | | | | | | | | | | | | | | | | | | | | |
| | Employee expenses | | | 18,433 | | | | 18,571 | | | | 19,187 | | | | 19,988 | | | | 20,884 | |
| | Superannuation expenses | | | | | | | | | | | | | | | | | | | | |
| | Superannuation interest cost | | | 879 | | | | 966 | | | | 964 | | | | 1,024 | | | | 1,058 | |
| | Other superannuation expenses | | | 2,407 | | | | 2,380 | | | | 2,397 | | | | 2,379 | | | | 2,399 | |
| | Other operating expenses | | | 9,669 | | | | 10,359 | | | | 10,517 | | | | 10,691 | | | | 11,201 | |
| | Depreciation and amortisation | | | 3,140 | | | | 3,144 | | | | 3,316 | | | | 3,490 | | | | 3,572 | |
| | Other interest expenses | | | 2,163 | | | | 2,138 | | | | 2,361 | | | | 2,423 | | | | 2,482 | |
| | Grants expenses | | | 11,745 | | | | 11,074 | | | | 10,513 | | | | 10,067 | | | | 10,416 | |
| | Total Expenses from Transactions | | | 48,436 | | | | 48,633 | | | | 49,255 | | | | 50,062 | | | | 52,013 | |
| | | | | | |
Equals | | Net Operating Balance | | | (3,760 | ) | | | (3,769 | ) | | | 1,910 | | | | 2,026 | | | | 1,474 | |
| | | | | | |
Plus | | Other economic flows - included in operating result | | | 459 | | | | 512 | | | | (88 | ) | | | (191 | ) | | | (219 | ) |
| | | | | | |
Equals | | Operating Result | | | (3,300 | ) | | | (3,257 | ) | | | 1,822 | | | | 1,835 | | | | 1,254 | |
| | | | | | |
Plus | | Other economic flows - other movements in equity | | | 3,858 | | | | 3,057 | | | | 3,518 | | | | 3,271 | | | | 3,130 | |
| | | | | | |
Equals | | Comprehensive Result - Total Change In Net Worth | | | 558 | | | | (199 | ) | | | 5,340 | | | | 5,106 | | | | 4,384 | |
| | | | | | |
| | KEY FISCAL AGGREGATES | | | | | | | | | | | | | | | | | | | | |
| | | | | | |
| | Net Operating Balance | | | (3,760 | ) | | | (3,769 | ) | | | 1,910 | | | | 2,026 | | | | 1,474 | |
| | | | | | |
Less | | Net Acquisition of Non-financial Assets | | | | | | | | | | | | | | | | | | | | |
| | Purchases of non-financial assets | | | 7,130 | | | | 7,119 | | | | 5,944 | | | | 4,828 | | | | 4,379 | |
| | Less Sales of non-financial assets | | | 330 | | | | 331 | | | | 233 | | | | 211 | | | | 130 | |
| | Less Depreciation | | | 3,140 | | | | 3,144 | | | | 3,316 | | | | 3,490 | | | | 3,572 | |
| | Plus Change in inventories | | | 51 | | | | (2 | ) | | | (54 | ) | | | (71 | ) | | | (63 | ) |
| | Plus Other movements in non-financial assets | | | 193 | | | | 193 | | | | 234 | | | | 273 | | | | 261 | |
| | Equals Total Net Acquisition of Non-financial Assets | | | 3,905 | | | | 3,835 | | | | 2,574 | | | | 1,330 | | | | 876 | |
| | | | | | |
Equals | | Fiscal Balance | | | (7,664 | ) | | | (7,604 | ) | | | (664 | ) | | | 696 | | | | 598 | |
Note:
| 1. | Numbers may not add due to rounding. |
| | | | |
| Page 18 | | Mid Year Economic and Fiscal Review 2013-14 | | |
Table 9
Public Non-financial Corporations Sector Operating Statement 1
| | | | | | | | | | | | | | | | | | | | | | |
| | | | | 2013-14
Budget
$ million | | | 2013-14
Revised
$ million | | | 2014-15
Projection
$ million | | | 2015-16
Projection
$ million | | | 2016-17
Projection
$ million | |
| | Revenue from Transactions | | | | | | | | | | | | | | | | | | | | |
| | Grants revenue | | | 2,408 | | | | 2,437 | | | | 2,554 | | | | 2,465 | | | | 2,563 | |
| | Sales of goods and services | | | 8,987 | | | | 8,831 | | | | 8,865 | | | | 8,992 | | | | 9,683 | |
| | Interest income | | | 85 | | | | 133 | | | | 82 | | | | 81 | | | | 70 | |
| | Dividend and income tax equivalent income | | | — | | | | 14 | | | | — | | | | — | | | | — | |
| | Other revenue | | | 284 | | | | 243 | | | | 253 | | | | 290 | | | | 317 | |
| | Total Revenue from Transactions | | | 11,765 | | | | 11,658 | | | | 11,755 | | | | 11,829 | | | | 12,633 | |
| | | | | | |
Less | | Expenses from Transactions | | | | | | | | | | | | | | | | | | | | |
| | Employee expenses | | | 1,679 | | | | 1,714 | | | | 1,683 | | | | 1,734 | | | | 1,810 | |
| | Superannuation expenses | | | | | | | | | | | | | | | | | | | | |
| | Other superannuation expenses | | | 212 | | | | 224 | | | | 216 | | | | 221 | | | | 226 | |
| | Other operating expenses | | | 3,805 | | | | 3,744 | | | | 3,286 | | | | 3,236 | | | | 3,383 | |
| | Depreciation and amortisation | | | 2,264 | | | | 2,181 | | | | 2,366 | | | | 2,465 | | | | 2,548 | |
| | Other interest expenses | | | 2,074 | | | | 2,063 | | | | 2,111 | | | | 2,027 | | | | 2,078 | |
| | Grants expenses | | | 14 | | | | 20 | | | | 15 | | | | 15 | | | | 15 | |
| | Other property expenses | | | 460 | | | | 362 | | | | 735 | | | | 805 | | | | 934 | |
| | Total Expenses from Transactions | | | 10,509 | | | | 10,309 | | | | 10,411 | | | | 10,502 | | | | 10,993 | |
| | | | | | |
Equals | | Net Operating Balance | | | 1,256 | | | | 1,349 | | | | 1,344 | | | | 1,326 | | | | 1,640 | |
| | | | | | |
Plus | | Other economic flows - included in operating result | | | (279 | ) | | | (286 | ) | | | (45 | ) | | | 39 | | | | 59 | |
| | | | | | |
Equals | | Operating Result | | | 977 | | | | 1,063 | | | | 1,299 | | | | 1,366 | | | | 1,698 | |
| | | | | | |
Plus | | Other economic flows - other movements in equity | | | (619 | ) | | | (972 | ) | | | (695 | ) | | | (693 | ) | | | (859 | ) |
| | | | | | |
Equals | | Comprehensive Result - Total Change In Net Worth | | | 358 | | | | 91 | | | | 604 | | | | 673 | | | | 839 | |
| | | | | | |
| | KEY FISCAL AGGREGATES | | | | | | | | | | | | | | | | | | | | |
| | | | | | |
| | Net Operating Balance | | | 1,256 | | | | 1,349 | | | | 1,344 | | | | 1,326 | | | | 1,640 | |
| | | | | | |
Less | | Net Acquisition of Non-financial Assets | | | | | | | | | | | | | | | | | | | | |
| | Purchases of non-financial assets | | | 3,884 | | | | 4,052 | | | | 3,804 | | | | 3,770 | | | | 3,706 | |
| | Less Sales of non-financial assets | | | 21 | | | | 17 | | | | 23 | | | | 21 | | | | 21 | |
| | Less Depreciation | | | 2,264 | | | | 2,181 | | | | 2,366 | | | | 2,465 | | | | 2,548 | |
| | Plus Change in inventories | | | 8 | | | | 46 | | | | 12 | | | | (7 | ) | | | 1 | |
| | Plus Other movements in non-financial assets | | | — | | | | (5 | ) | | | — | | | | — | | | | — | |
| | Equals Total Net Acquisition of Non-financial Assets | | | 1,608 | | | | 1,894 | | | | 1,426 | | | | 1,277 | | | | 1,138 | |
| | | | | | |
Equals | | Fiscal Balance | | | (352 | ) | | | (545 | ) | | | (82 | ) | | | 49 | | | | 502 | |
Note:
| 1. | Numbers may not add due to rounding. |
| | | | |
| | Mid Year Economic and Fiscal Review 2013-14 | | Page 19 |
Table 10
Non-financial Public Sector Operating Statement1
| | | | | | | | | | | | | | | | | | | | | | |
| | | | | 2013-14 | | | 2013-14 | | | 2014-15 | | | 2015-16 | | | 2016-17 | |
| | | | | Budget | | | Revised | | | Projection | | | Projection | | | Projection | |
| | | | | $ million | | | $ million | | | $ million | | | $ million | | | $ million | |
| | Revenue from Transactions | | | | | | | | | | | | | | | | | | | | |
| | Taxation revenue | | | 11,494 | | | | 11,585 | | | | 12,298 | | | | 13,078 | | | | 13,902 | |
| | Grants revenue | | | 20,323 | | | | 20,556 | | | | 24,615 | | | | 23,743 | | | | 23,671 | |
| | Sales of goods and services | | | 13,662 | | | | 13,510 | | | | 13,772 | | | | 14,108 | | | | 14,838 | |
| | Interest income | | | 2,481 | | | | 2,545 | | | | 2,562 | | | | 2,609 | | | | 2,657 | |
| | Dividend and income tax equivalent income | | | 33 | | | | 99 | | | | 68 | | | | 68 | | | | 80 | |
| | Other revenue | | | 3,935 | | | | 3,857 | | | | 4,595 | | | | 5,207 | | | | 5,422 | |
| | Total Revenue from Transactions | | | 51,929 | | | | 52,151 | | | | 57,910 | | | | 58,813 | | | | 60,570 | |
| | | | | | |
Less | | Expenses from Transactions | | | | | | | | | | | | | | | | | | | | |
| | Employee expenses | | | 20,022 | | | | 20,196 | | | | 20,785 | | | | 21,634 | | | | 22,604 | |
| | Superannuation expenses | | | | | | | | | | | | | | | | | | | | |
| | Superannuation interest cost | | | 879 | | | | 966 | | | | 964 | | | | 1,024 | | | | 1,058 | |
| | Other superannuation expenses | | | 2,620 | | | | 2,605 | | | | 2,613 | | | | 2,600 | | | | 2,624 | |
| | Other operating expenses | | | 13,176 | | | | 13,847 | | | | 13,538 | | | | 13,650 | | | | 14,296 | |
| | Depreciation and amortisation | | | 5,403 | | | | 5,325 | | | | 5,683 | | | | 5,954 | | | | 6,120 | |
| | Other interest expenses | | | 3,981 | | | | 3,971 | | | | 4,230 | | | | 4,170 | | | | 4,273 | |
| | Grants expenses | | | 9,559 | | | | 8,878 | | | | 8,211 | | | | 7,791 | | | | 8,046 | |
| | Total Expenses from Transactions | | | 55,640 | | | | 55,787 | | | | 56,023 | | | | 56,823 | | | | 59,021 | |
| | | | | | |
Equals | | Net Operating Balance | | | (3,711 | ) | | | (3,636 | ) | | | 1,887 | | | | 1,990 | | | | 1,549 | |
| | | | | | |
Plus | | Other economic flows-included in operating result | | | (223 | ) | | | (210 | ) | | | (133 | ) | | | (152 | ) | | | (161 | ) |
| | | | | | |
Equals | | Operating Result | | | (3,934 | ) | | | (3,846 | ) | | | 1,754 | | | | 1,838 | | | | 1,388 | |
| | | | | | |
Plus | | Other economic flows-other movements in equity | | | 4,292 | | | | 3,446 | | | | 3,489 | | | | 3,252 | | | | 3,062 | |
| | | | | | |
Equals | | Comprehensive Result-Total Change In Net Worth | | | 358 | | | | (400 | ) | | | 5,243 | | | | 5,090 | | | | 4,450 | |
| | | | | | |
| | KEY FISCAL AGGREGATES | | | | | | | | | | | | | | | | | | | | |
| | | | | | |
| | Net Operating Balance | | | (3,711 | ) | | | (3,636 | ) | | | 1,887 | | | | 1,990 | | | | 1,549 | |
| | | | | | |
Less | | Net Acquisition of Non-financial Assets | | | | | | | | | | | | | | | | | | | | |
| | Purchases of non-financial assets | | | 11,014 | | | | 11,172 | | | | 9,747 | | | | 8,598 | | | | 8,085 | |
| | Less Sales of non-financial assets | | | 350 | | | | 349 | | | | 256 | | | | 232 | | | | 151 | |
| | Less Depreciation | | | 5,403 | | | | 5,325 | | | | 5,683 | | | | 5,954 | | | | 6,120 | |
| | Plus Change in inventories | | | 59 | | | | 43 | | | | (43 | ) | | | (77 | ) | | | (62 | ) |
| | Plus Other movements in non-financial assets | | | 193 | | | | 188 | | | | 234 | | | | 273 | | | | 261 | |
| | Equals Total Net Acquisition of Non-financial Assets | | | 5,513 | | | | 5,729 | | | | 4,000 | | | | 2,607 | | | | 2,014 | |
| | | | | | |
Equals | | Fiscal Balance | | | (9,224 | ) | | | (9,365 | ) | | | (2,113 | ) | | | (617 | ) | | | (465 | ) |
Note:
| 1. | Numbers may not add due to rounding. |
| | | | |
| Page 20 | | Mid Year Economic and Fiscal Review 2013-14 | | |
Table 11
General Government Sector Balance Sheet1
| | | | | | | | | | | | | | | | | | | | |
| | | 2013-14 | | | 2013-14 | | | 2014-15 | | | 2015-16 | | | 2016-17 | |
| | | Budget | | | Revised | | | Projection | | | Projection | | | Projection | |
| | | $ million | | | $ million | | | $ million | | | $ million | | | $ million | |
Assets | | | | | | | | | | | | | | | | | | | | |
Financial Assets | | | | | | | | | | | | | | | | | | | | |
Cash and deposits | | | 877 | | | | 987 | | | | 1,058 | | | | 788 | | | | 830 | |
Advances paid | | | 1,012 | | | | 696 | | | | 735 | | | | 743 | | | | 752 | |
Investments, loans and placements | | | 34,848 | | | | 35,293 | | | | 36,212 | | | | 37,088 | | | | 37,959 | |
Receivables | | | 4,321 | | | | 4,559 | | | | 4,946 | | | | 5,021 | | | | 5,357 | |
Equity | | | | | | | | | | | | | | | | | | | | |
Investments in other public sector entities | | | 22,195 | | | | 22,578 | | | | 23,279 | | | | 23,968 | | | | 24,742 | |
Investments-other | | | 177 | | | | 167 | | | | 167 | | | | 167 | | | | 167 | |
Other financial assets | | | | | | | | | | | | | | | | | | | | |
Total Financial Assets | | | 63,429 | | | | 64,280 | | | | 66,397 | | | | 67,776 | | | | 69,806 | |
| | | | | |
Non-financial Assets | | | | | | | | | | | | | | | | | | | | |
Land and other fixed assets | | | 185,718 | | | | 187,159 | | | | 190,734 | | | | 193,157 | | | | 195,100 | |
Other non-financial assets | | | 6,586 | | | | 7,316 | | | | 7,597 | | | | 7,897 | | | | 8,201 | |
Total Non-financial Assets | | | 192,304 | | | | 194,475 | | | | 198,331 | | | | 201,053 | | | | 203,301 | |
| | | | | |
Total Assets | | | 255,733 | | | | 258,755 | | | | 264,728 | | | | 268,829 | | | | 273,107 | |
| | | | | |
Liabilities | | | | | | | | | | | | | | | | | | | | |
Payables | | | 3,227 | | | | 3,832 | | | | 3,893 | | | | 3,977 | | | | 4,013 | |
Superannuation liability | | | 27,827 | | | | 25,963 | | | | 24,502 | | | | 23,281 | | | | 22,233 | |
Other employee benefits | | | 5,939 | | | | 5,372 | | | | 5,638 | | | | 5,565 | | | | 5,797 | |
Deposits held | | | 1 | | | | — | | | | — | | | | — | | | | — | |
Advances received | | | 359 | | | | 470 | | | | 474 | | | | 446 | | | | 429 | |
Borrowing | | | 47,196 | | | | 45,719 | | | | 47,372 | | | | 47,391 | | | | 47,689 | |
Other liabilities | | | 3,518 | | | | 3,879 | | | | 3,988 | | | | 4,202 | | | | 4,595 | |
Total Liabilities | | | 88,067 | | | | 85,234 | | | | 85,868 | | | | 84,862 | | | | 84,756 | |
| | | | | |
Net Worth | | | 167,666 | | | | 173,521 | | | | 178,861 | | | | 183,967 | | | | 188,351 | |
| | | | | | | | | | | | | | | | | | | | |
Net Financial Worth | | | (24,638 | ) | | | (20,954 | ) | | | (19,470 | ) | | | (17,086 | ) | | | (14,949 | ) |
Net Financial Liabilities | | | 46,834 | | | | 43,532 | | | | 42,749 | | | | 41,054 | | | | 39,691 | |
Net Debt | | | 10,821 | | | | 9,213 | | | | 9,841 | | | | 9,218 | | | | 8,578 | |
| | | | | | | | | | | | | | | | | | | | |
Note:
| 1. | Numbers may not add due to rounding. |
| | | | |
| | Mid Year Economic and Fiscal Review 2013-14 | | Page 21 |
Table 12
Public Non-financial Corporations Sector Balance Sheet 1
| | | | | | | | | | | | | | | | | | | | |
| | | 2013-14 | | | 2013-14 | | | 2014-15 | | | 2015-16 | | | 2016-17 | |
| | | Budget | | | Revised | | | Projection | | | Projection | | | Projection | |
| | | $ million | | | $ million | | | $ million | | | $ million | | | $ million | |
Assets | | | | | | | | | | | | | | | | | | | | |
Financial Assets | | | | | | | | | | | | | | | | | | | | |
Cash and deposits | | | 1,041 | | | | 1,046 | | | | 1,012 | | | | 1,125 | | | | 1,263 | |
Advances paid | | | 92 | | | | 118 | | | | 121 | | | | 114 | | | | 108 | |
Investments, loans and placements | | | 169 | | | | 85 | | | | 83 | | | | 84 | | | | 88 | |
Receivables | | | 2,451 | | | | 2,613 | | | | 2,507 | | | | 1,958 | | | | 1,722 | |
Equity | | | | | | | | | | | | | | | | | | | | |
Investments—other | | | 5 | | | | 4 | | | | 4 | | | | 4 | | | | 4 | |
Other financial assets | | | | | | | | | | | | | | | | | | | | |
Total Financial Assets | | | 3,757 | | | | 3,865 | | | | 3,728 | | | | 3,285 | | | | 3,184 | |
| | | | | |
Non-financial Assets | | | | | | | | | | | | | | | | | | | | |
Land and other fixed assets | | | 56,950 | | | | 57,734 | | | | 60,042 | | | | 62,214 | | | | 64,304 | |
Other non-financial assets | | | 1,381 | | | | 2,236 | | | | 2,305 | | | | 2,350 | | | | 2,476 | |
Total Non-financial Assets | | | 58,331 | | | | 59,970 | | | | 62,347 | | | | 64,564 | | | | 66,780 | |
| | | | | |
Total Assets | | | 62,088 | | | | 63,834 | | | | 66,075 | | | | 67,849 | | | | 69,965 | |
| | | | | |
Liabilities | | | | | | | | | | | | | | | | | | | | |
Payables | | | 2,839 | | | | 2,568 | | | | 2,877 | | | | 2,774 | | | | 3,003 | |
Superannuation liability | | | 170 | | | | (61 | ) | | | (61 | ) | | | (61 | ) | | | (61 | ) |
Other employee benefits | | | 780 | | | | 748 | | | | 756 | | | | 777 | | | | 797 | |
Deposits held | | | 31 | | | | 25 | | | | 26 | | | | 26 | | | | 27 | |
Advances received | | | 9 | | | | 9 | | | | 8 | | | | 8 | | | | 7 | |
Borrowing | | | 30,928 | | | | 31,249 | | | | 32,104 | | | | 33,025 | | | | 33,764 | |
Other liabilities | | | 7,501 | | | | 8,081 | | | | 8,546 | | | | 8,807 | | | | 9,095 | |
Total Liabilities | | | 42,259 | | | | 42,618 | | | | 44,254 | | | | 45,355 | | | | 46,632 | |
| | | | | |
Net Worth | | | 19,829 | | | | 21,216 | | | | 21,820 | | | | 22,493 | | | | 23,332 | |
| | | | | | | | | | | | | | | | | | | | |
Net Financial Worth | | | (38,502 | ) | | | (38,754 | ) | | | (40,526 | ) | | | (42,071 | ) | | | (43,448 | ) |
Net Debt | | | 29,667 | | | | 30,035 | | | | 30,920 | | | | 31,735 | | | | 32,339 | |
| | | | | | | | | | | | | | | | | | | | |
Note:
| 1. | Numbers may not add due to rounding. |
| | | | |
| Page 22 | | Mid Year Economic and Fiscal Review 2013-14 | | |
Table 13
Non-financial Public Sector Balance Sheet 1
| | | | | | | | | | | | | | | | | | | | |
| | | 2013-14
Budget
$ million | | | 2013-14
Revised
$ million | | | 2014-15
Projection
$ million | | | 2015-16
Projection
$ million | | | 2016-17
Projection
$ million | |
Assets | | | | | | | | | | | | | | | | | | | | |
Financial Assets | | | | | | | | | | | | | | | | | | | | |
Cash and deposits | | | 1,918 | | | | 2,032 | | | | 2,071 | | | | 1,913 | | | | 2,093 | |
Advances paid | | | 1,094 | | | | 805 | | | | 848 | | | | 850 | | | | 853 | |
Investments, loans and placements | | | 35,016 | | | | 35,378 | | | | 36,295 | | | | 37,173 | | | | 38,047 | |
Receivables | | | 4,986 | | | | 5,286 | | | | 5,211 | | | | 4,787 | | | | 4,691 | |
Equity | | | | | | | | | | | | | | | | | | | | |
Investments in other public sector entities | | | 1,000 | | | | 1,173 | | | | 1,173 | | | | 1,173 | | | | 1,173 | |
Investments—other | | | 182 | | | | 171 | | | | 171 | | | | 171 | | | | 171 | |
Other financial assets | | | | | | | | | | | | | | | | | | | | |
Total Financial Assets | | | 44,196 | | | | 44,845 | | | | 45,769 | | | | 46,067 | | | | 47,028 | |
| | | | | |
Non-financial Assets | | | | | | | | | | | | | | | | | | | | |
Land and other fixed assets | | | 242,667 | | | | 244,893 | | | | 250,775 | | | | 255,370 | | | | 259,404 | |
Other non-financial assets | | | 774 | | | | 1,372 | | | | 1,375 | | | | 1,316 | | | | 1,377 | |
Total Non-financial Assets | | | 243,441 | | | | 246,265 | | | | 252,150 | | | | 256,686 | | | | 260,781 | |
| | | | | |
Total Assets | | | 287,638 | | | | 291,110 | | | | 297,919 | | | | 302,752 | | | | 307,809 | |
| | | | | |
Liabilities | | | | | | | | | | | | | | | | | | | | |
Payables | | | 4,322 | | | | 4,565 | | | | 4,580 | | | | 4,612 | | | | 4,680 | |
Superannuation liability | | | 27,997 | | | | 25,901 | | | | 24,441 | | | | 23,219 | | | | 22,172 | |
Other employee benefits | | | 6,718 | | | | 6,120 | | | | 6,395 | | | | 6,343 | | | | 6,594 | |
Deposits held | | | 33 | | | | 25 | | | | 26 | | | | 26 | | | | 27 | |
Advances received | | | 359 | | | | 470 | | | | 474 | | | | 446 | | | | 429 | |
Borrowing | | | 78,125 | | | | 76,968 | | | | 79,476 | | | | 80,416 | | | | 81,454 | |
Other liabilities | | | 3,786 | | | | 3,729 | | | | 3,955 | | | | 4,026 | | | | 4,339 | |
Total Liabilities | | | 121,339 | | | | 117,778 | | | | 119,345 | | | | 119,087 | | | | 119,694 | |
| | | | | |
Net Worth | | | 166,299 | | | | 173,332 | | | | 178,574 | | | | 183,665 | | | | 188,115 | |
| | | | | | | | | | | | | | | | | | | | |
Net Financial Worth | | | (77,143 | ) | | | (72,933 | ) | | | (73,576 | ) | | | (73,021 | ) | | | (72,666 | ) |
Net Financial Liabilities | | | 78,143 | | | | 74,106 | | | | 74,749 | | | | 74,194 | | | | 73,840 | |
Net Debt | | | 40,488 | | | | 39,248 | | | | 40,761 | | | | 40,953 | | | | 40,917 | |
| | | | | | | | | | | | | | | | | | | | |
Note:
| 1. | Numbers may not add due to rounding. |
| | | | |
| | Mid Year Economic and Fiscal Review 2013-14 | | Page 23 |
Table 14
General Government Sector Cash Flow Statement 1
| | | | | | | | | | | | | | | | | | | | |
| | | 2013-14 | | | 2013-14 | | | 2014-15 | | | 2015-16 | | | 2016-17 | |
| | | Budget | | | Revised | | | Projection | | | Projection | | | Projection | |
| | | $ million | | | $ million | | | $ million | | | $ million | | | $ million | |
Cash Receipts from Operating Activities | | | | | | | | | | | | | | | | | | | | |
Taxes received | | | 11,834 | | | | 11,898 | | | | 12,633 | | | | 13,455 | | | | 14,289 | |
Grants and subsidies received | | | 20,142 | | | | 20,370 | | | | 24,402 | | | | 23,594 | | | | 23,518 | |
Sales of goods and services | | | 5,386 | | | | 5,349 | | | | 5,432 | | | | 5,770 | | | | 5,765 | |
Interest receipts | | | 2,397 | | | | 2,412 | | | | 2,480 | | | | 2,528 | | | | 2,587 | |
Dividends and income tax equivalents | | | 1,355 | | | | 1,372 | | | | 1,746 | | | | 2,277 | | | | 2,321 | |
Other receipts | | | 4,719 | | | | 4,651 | | | | 5,070 | | | | 5,619 | | | | 5,829 | |
Total Operating Receipts | | | 45,832 | | | | 46,052 | | | | 51,764 | | | | 53,243 | | | | 54,309 | |
| | | | | |
Cash Payments for Operating Activities | | | | | | | | | | | | | | | | | | | | |
Payments for employees | | | (21,314 | ) | | | (21,393 | ) | | | (22,187 | ) | | | (23,528 | ) | | | (24,315 | ) |
Payments for goods and services | | | (11,185 | ) | | | (11,851 | ) | | | (11,417 | ) | | | (11,689 | ) | | | (12,153 | ) |
Grants and subsidies | | | (11,532 | ) | | | (10,859 | ) | | | (10,444 | ) | | | (10,003 | ) | | | (10,352 | ) |
Interest paid | | | (2,160 | ) | | | (2,135 | ) | | | (2,361 | ) | | | (2,423 | ) | | | (2,483 | ) |
Other payments | | | (309 | ) | | | (367 | ) | | | (368 | ) | | | (369 | ) | | | (182 | ) |
Total Operating Payments | | | (46,500 | ) | | | (46,606 | ) | | | (46,776 | ) | | | (48,012 | ) | | | (49,484 | ) |
| | | | | |
Net Cash Inflows from Operating Activities | | | (669 | ) | | | (553 | ) | | | 4,987 | | | | 5,230 | | | | 4,825 | |
| | | | | |
Cash Flows from Investments in Non-Financial Assets | | | | | | | | | | | | | | | | | | | | |
Purchases of non-financial assets | | | (7,130 | ) | | | (7,119 | ) | | | (5,944 | ) | | | (4,828 | ) | | | (4,379 | ) |
Sales of non-financial assets | | | 330 | | | | 331 | | | | 233 | | | | 211 | | | | 130 | |
Net Cash Flows from Investments in Non-financial Assets | | | (6,801 | ) | | | (6,788 | ) | | | (5,710 | ) | | | (4,617 | ) | | | (4,250 | ) |
| | | | | |
Net Cash Flows from Investments in Financial Assets for Policy Purposes | | | 514 | | | | 677 | | | | 87 | | | | — | | | | — | |
| | | | | |
Net Cash Flows from Investments in Financial Assets for Liquidity Purposes | | | (1,028 | ) | | | (947 | ) | | | (907 | ) | | | (865 | ) | | | (804 | ) |
| | | | | |
Receipts from Financing Activities | | | | | | | | | | | | | | | | | | | | |
Advances received (net) | | | (21 | ) | | | 3 | | | | (3 | ) | | | (35 | ) | | | (25 | ) |
Borrowing (net) | | | 7,966 | | | | 7,757 | | | | 1,618 | | | | 16 | | | | 295 | |
Net Cash Flows from Financing Activities | | | 7,946 | | | | 7,760 | | | | 1,615 | | | | (18 | ) | | | 270 | |
| | | | | |
Net Increase/(Decrease) in Cash held | | | (37 | ) | | | 149 | | | | 72 | | | | (270 | ) | | | 41 | |
| | | | | |
Net cash from operating activities | | | (669 | ) | | | (553 | ) | | | 4,987 | | | | 5,230 | | | | 4,825 | |
Net cash flows from investments in non-financial assets | | | (6,801 | ) | | | (6,788 | ) | | | (5,710 | ) | | | (4,617 | ) | | | (4,250 | ) |
Surplus/(Deficit) | | | (7,469 | ) | | | (7,342 | ) | | | (723 | ) | | | 613 | | | | 575 | |
| | | | | |
Derivation of ABS GFS Cash Surplus/Deficit | | | | | | | | | | | | | | | | | | | | |
Cash surplus/(deficit) | | | (7,469 | ) | | | (7,342 | ) | | | (723 | ) | | | 613 | | | | 575 | |
Acquisitions under finance leases and similar arrangements | | | (159 | ) | | | (131 | ) | | | (59 | ) | | | (93 | ) | | | (81 | ) |
ABS GFS Cash Surplus/(Deficit) Including | | | | | | | | | | | | | | | | | | | | |
Finance Leases and Similar Arrangements | | | (7,628 | ) | | | (7,473 | ) | | | (782 | ) | | | 521 | | | | 494 | |
Note:
| 1. | Numbers may not add due to rounding. |
| | | | |
| Page 24 | | Mid Year Economic and Fiscal Review 2013-14 | | |
Table 15
Public Non-financial Corporations Sector Cash Flow Statement 1
| | | | | | | | | | | | | | | | | | | | |
| | | 2013-14
Budget
$ million | | | 2013-14
Revised
$ million | | | 2014-15
Projection
$ million | | | 2015-16
Projection
$ million | | | 2016-17
Projection
$ million | |
Cash Receipts from Operating Activities | | | | | | | | | | | | | | | | | | | | |
Grants and subsidies received | | | 2,389 | | | | 2,484 | | | | 2,539 | | | | 2,452 | | | | 2,550 | |
Sales of goods and services | | | 9,647 | | | | 9,307 | | | | 9,704 | | | | 10,310 | | | | 10,821 | |
Interest receipts | | | 85 | | | | 133 | | | | 82 | | | | 81 | | | | 70 | |
Dividends and income tax equivalents | | | — | | | | 14 | | | | — | | | | — | | | | — | |
Other receipts | | | 434 | | | | 501 | | | | 341 | | | | 371 | | | | 358 | |
Total Operating Receipts | | | 12,555 | | | | 12,438 | | | | 12,666 | | | | 13,214 | | | | 13,799 | |
| | | | | |
Cash Payments for Operating Activities | | | | | | | | | | | | | | | | | | | | |
Payments for employees | | | (1,913 | ) | | | (1,944 | ) | | | (1,890 | ) | | | (1,934 | ) | | | (2,016 | ) |
Payments for goods and services | | | (4,207 | ) | | | (4,437 | ) | | | (3,559 | ) | | | (3,571 | ) | | | (3,804 | ) |
Grants and subsidies | | | (11 | ) | | | (10 | ) | | | (12 | ) | | | (13 | ) | | | (14 | ) |
Interest paid | | | (1,967 | ) | | | (1,948 | ) | | | (1,989 | ) | | | (1,895 | ) | | | (2,043 | ) |
Other payments | | | (697 | ) | | | (470 | ) | | | (938 | ) | | | (1,376 | ) | | | (1,491 | ) |
Total Operating Payments | | | (8,795 | ) | | | (8,808 | ) | | | (8,389 | ) | | | (8,790 | ) | | | (9,367 | ) |
| | | | | |
Net Cash Inflows from Operating Activities | | | 3,760 | | | | 3,630 | | | | 4,277 | | | | 4,424 | | | | 4,432 | |
| | | | | |
Cash Flows from Investments in Non-Financial Assets | | | | | | | | | | | | | | | | | | | | |
Purchases of non—financial assets | | | (3,884 | ) | | | (4,052 | ) | | | (3,804 | ) | | | (3,770 | ) | | | (3,706 | ) |
Sales of non—financial assets | | | 21 | | | | 17 | | | | 23 | | | | 21 | | | | 21 | |
Net Cash Flows from Investments in Non-financial Assets | | | (3,863 | ) | | | (4,035 | ) | | | (3,781 | ) | | | (3,749 | ) | | | (3,685 | ) |
Net Cash Flows from Investments in Financial Assets for Policy Purposes | | | 732 | | | | 885 | | | | — | | | | — | | | | — | |
| | | | | |
Net Cash Flows from Investments in Financial Assets for Liquidity Purposes | | | 1 | | | | — | | | | (2 | ) | | | (2 | ) | | | (2 | ) |
| | | | | |
Receipts from Financing Activities | | | | | | | | | | | | | | | | | | | | |
Advances received (net) | | | (1 | ) | | | (1 | ) | | | (1 | ) | | | (1 | ) | | | (1 | ) |
Borrowing (net) | | | 530 | | | | 329 | | | | 767 | | | | 808 | | | | 755 | |
Dividends paid | | | (994 | ) | | | (1,075 | ) | | | (1,207 | ) | | | (1,368 | ) | | | (1,360 | ) |
Deposits received (net) | | | 3 | | | | 1 | | | | 1 | | | | 1 | | | | 1 | |
Other financing (net) | | | (514 | ) | | | (676 | ) | | | (87 | ) | | | — | | | | — | |
Net Cash Flows from Financing Activities | | | (975 | ) | | | (1,421 | ) | | | (527 | ) | | | (560 | ) | | | (605 | ) |
| | | | | |
Net Increase/(Decrease) in Cash held | | | (345 | ) | | | (941 | ) | | | (33 | ) | | | 112 | | | | 139 | |
Net cash from operating activities | | | 3,760 | | | | 3,630 | | | | 4,277 | | | | 4,424 | | | | 4,432 | |
Net cash flows from investments in non—financial assets | | | (3,863 | ) | | | (4,035 | ) | | | (3,781 | ) | | | (3,749 | ) | | | (3,685 | ) |
Dividends paid | | | (994 | ) | | | (1,075 | ) | | | (1,207 | ) | | | (1,368 | ) | | | (1,360 | ) |
Surplus/(Deficit) | | | (1,097 | ) | | | (1,480 | ) | | | (711 | ) | | | (693 | ) | | | (614 | ) |
| | | | | |
Derivation of ABS GFS Cash Surplus/Deficit | | | | | | | | | | | | | | | | | | | | |
Cash surplus/(deficit) | | | (1,097 | ) | | | (1,480 | ) | | | (711 | ) | | | (693 | ) | | | (614 | ) |
ABS GFS Cash Surplus/(Deficit) Including Finance Leases and Similar Arrangements | | | (1,097 | ) | | | (1,480 | ) | | | (711 | ) | | | (693 | ) | | | (614 | ) |
Note:
| 1. | Numbers may not add due to rounding. |
| | | | |
| | Mid Year Economic and Fiscal Review 2013-14 | | Page 25 |
Table 16
Non-financial Public Sector Cash Flow Statement 1
| | | | | | | | | | | | | | | | | | | | |
| | | 2013-14
Budget
$ million | | | 2013-14
Revised
$ million | | | 2014-15
Projection
$ million | | | 2015-16
Projection
$ million | | | 2016-17
Projection
$ million | |
Cash Receipts from Operating Activities | | | | | | | | | | | | | | | | | | | | |
Taxes received | | | 11,477 | | | | 11,568 | | | | 12,297 | | | | 13,077 | | | | 13,901 | |
Grants and subsidies received | | | 20,343 | | | | 20,644 | | | | 24,624 | | | | 23,755 | | | | 23,683 | |
Sales of goods and services | | | 14,616 | | | | 14,280 | | | | 14,744 | | | | 15,681 | | | | 16,176 | |
Interest receipts | | | 2,482 | | | | 2,546 | | | | 2,562 | | | | 2,609 | | | | 2,657 | |
Dividends and income tax equivalents | | | 45 | | | | 53 | | | | 95 | | | | 68 | | | | 68 | |
Other receipts | | | 5,151 | | | | 5,150 | | | | 5,411 | | | | 5,989 | | | | 6,186 | |
Total Operating Receipts | | | 54,114 | | | | 54,241 | | | | 59,734 | | | | 61,179 | | | | 62,671 | |
| | | | | |
Cash Payments for Operating Activities | | | | | | | | | | | | | | | | | | | | |
Payments for employees | | | (23,137 | ) | | | (23,247 | ) | | | (23,992 | ) | | | (25,374 | ) | | | (26,241 | ) |
Payments for goods and services | | | (14,992 | ) | | | (15,927 | ) | | | (14,598 | ) | | | (14,876 | ) | | | (15,563 | ) |
Grants and subsidies | | | (9,355 | ) | | | (8,658 | ) | | | (8,139 | ) | | | (7,725 | ) | | | (7,980 | ) |
Interest paid | | | (3,870 | ) | | | (3,852 | ) | | | (4,108 | ) | | | (4,038 | ) | | | (4,238 | ) |
Other payments | | | (662 | ) | | | (556 | ) | | | (839 | ) | | | (879 | ) | | | (753 | ) |
Total Operating Payments | | | (52,016 | ) | | | (52,240 | ) | | | (51,676 | ) | | | (52,893 | ) | | | (54,775 | ) |
| | | | | |
Net Cash Inflows from Operating Activities | | | 2,098 | | | | 2,001 | | | | 8,058 | | | | 8,286 | | | | 7,896 | |
Cash Flows from Investments in Non-Financial Assets | | | | | | | | | | | | | | | | | | | | |
Purchases of non-financial assets | | | (11,014 | ) | | | (11,172 | ) | | | (9,747 | ) | | | (8,598 | ) | | | (8,085 | ) |
Sales of non-financial assets | | | 350 | | | | 349 | | | | 256 | | | | 232 | | | | 151 | |
Net Cash Flows from Investments in Non-financial Assets | | | (10,664 | ) | | | (10,823 | ) | | | (9,491 | ) | | | (8,366 | ) | | | (7,935 | ) |
| | | | | |
Net Cash Flows from Investments in Financial Assets for Policy Purposes | | | 732 | | | | 886 | | | | — | | | | — | | | | — | |
| | | | | |
Net Cash Flows from Investments in Financial Assets for Liquidity Purposes | | | (1,027 | ) | | | (947 | ) | | | (910 | ) | | | (867 | ) | | | (806 | ) |
| | | | | |
Receipts from Financing Activities | | | | | | | | | | | | | | | | | | | | |
Advances received (net) | | | (21 | ) | | | 3 | | | | (3 | ) | | | (35 | ) | | | (25 | ) |
Borrowing (net) | | | 8,496 | | | | 8,086 | | | | 2,384 | | | | 823 | | | | 1,049 | |
Deposits received (net) | | | 3 | | | | 1 | | | | 1 | | | | 1 | | | | 1 | |
Net Cash Flows from Financing Activities | | | 8,478 | | | | 8,090 | | | | 2,382 | | | | 789 | | | | 1,025 | |
| | | | | |
Net Increase/(Decrease) in Cash held | | | (383 | ) | | | (793 | ) | | | 38 | | | | (158 | ) | | | 180 | |
| | | | | |
Net cash from operating activities | | | 2,098 | | | | 2,001 | | | | 8,058 | | | | 8,286 | | | | 7,896 | |
Net cash flows from investments in non-financial assets | | | (10,664 | ) | | | (10,823 | ) | | | (9,491 | ) | | | (8,366 | ) | | | (7,935 | ) |
Surplus/(Deficit) | | | (8,566 | ) | | | (8,822 | ) | | | (1,434 | ) | | | (80 | ) | | | (39 | ) |
| | | | | |
Derivation of ABS GFS Cash Surplus/Deficit | | | | | | | | | | | | | | | | | | | | |
Cash surplus/(deficit) | | | (8,566 | ) | | | (8,822 | ) | | | (1,434 | ) | | | (80 | ) | | | (39 | ) |
Acquisitions under finance leases and similar arrangements | | | (159 | ) | | | (131 | ) | | | (59 | ) | | | (93 | ) | | | (81 | ) |
ABS GFS Cash Surplus/(Deficit) Including Finance Leases and Similar Arrangements | | | (8,725 | ) | | | (8,953 | ) | | | (1,493 | ) | | | (173 | ) | | | (119 | ) |
Note:
| 1. | Numbers may not add due to rounding. |
| | | | |
| Page 26 | | Mid Year Economic and Fiscal Review 2013-14 | | |
Loan Council Allocation
The Australian Loan Council requires all jurisdictions to prepare Loan Council Allocations (LCA) to provide an indication of each government’s probable call on financial markets over the forthcoming financial year.
Table 17
Loan Council Allocation1
| | | | | | | | | | |
| | | | | 2013-14 | | | 2013-14 | |
| | | | | Budget | | | Revised | |
| | | | | $ million | | | $ million | |
| | General Government sector cash deficit | | | 7,469 | | | | 7,342 | |
| | PNFC sector cash deficit | | | 1,097 | | | | 1,480 | |
| | Non Financial Public Sector cash deficit | | | 8,566 | | | | 8,822 | |
| | Acquisitions under finance leases and similar arrangements | �� | | 159 | | | | 131 | |
Equals | | ABS GFS cash deficit | | | 8,725 | | | | 8,953 | |
Less | | Net cash flows from investments in financial assets for policy purposes | | | 732 | | | | 886 | |
Plus | | Memorandum Items2 | | | 1,715 | | | | 1,619 | |
| | Loan Council Allocation | | | 9,708 | | | | 9,686 | |
Notes:
| 1. | Numbers may not add due to rounding. |
| 2. | Memorandum items include operating leases and local government borrowings. |
| | | | |
| | Mid Year Economic and Fiscal Review 2013-14 | | Page 27 |
TAXATION AND ROYALTY REVENUE AND ASSUMPTIONS
Table 18
Taxation and Royalty Revenue1
| | | | | | | | | | | | | | | | | | | | | | | | |
| | | 2012-13 | | | 2013-14 | | | 2013-14 | | | 2014-15 | | | 2015-16 | | | 2016-17 | |
| | | Actual | | | Budget | | | Revised | | | Projection | | | Projection | | | Projection | |
| | | $ million | | | $ million | | | $ million | | | $ million | | | $ million | | | $ million | |
Payroll tax | | | 3,751 | | | | 4,100 | | | | 3,976 | | | | 4,278 | | | | 4,602 | | | | 4,951 | |
Transfer duty | | | 1,887 | | | | 2,033 | | | | 2,320 | | | | 2,448 | | | | 2,643 | | | | 2,828 | |
Other duties | | | 1,164 | | | | 1,446 | | | | 1,357 | | | | 1,483 | | | | 1,577 | | | | 1,677 | |
Gambling taxes and levies | | | 1,034 | | | | 1,084 | | | | 1,074 | | | | 1,116 | | | | 1,159 | | | | 1,204 | |
Land tax | | | 990 | | | | 980 | | | | 980 | | | | 995 | | | | 1,015 | | | | 1,051 | |
Motor vehicle registration | | | 1,486 | | | | 1,503 | | | | 1,531 | | | | 1,578 | | | | 1,657 | | | | 1,740 | |
Other taxes | | | 645 | | | | 705 | | | | 676 | | | | 737 | | | | 803 | | | | 839 | |
Total taxation revenue | | | 10,957 | | | | 11,851 | | | | 11,914 | | | | 12,634 | | | | 13,457 | | | | 14,290 | |
| | | | | | |
Royalties | | | | | | | | | | | | | | | | | | | | | | | | |
Coal | | | 1,737 | | | | 2,125 | | | | 2,054 | | | | 2,632 | | | | 2,999 | | | | 3,239 | |
Petroleum and Gas | | | 59 | | | | 62 | | | | 54 | | | | 251 | | | | 482 | | | | 462 | |
Other royalties | | | 348 | | | | 417 | | | | 399 | | | | 415 | | | | 384 | | | | 355 | |
Land rents | | | 158 | | | | 178 | | | | 179 | | | | 184 | | | | 196 | | | | 195 | |
Total royalties and land rents | | | 2,302 | | | | 2,782 | | | | 2,686 | | | | 3,482 | | | | 4,061 | | | | 4,251 | |
Note:
| 1. | Numbers may not add due to rounding. |
ROYALTY ASSUMPTIONS
Table 19
Royalty Assumptions
| | | | | | | | | | | | | | | | |
| | | 2013-14 | | | 2014-15 | | | 2015-16 | | | 2016-17 | |
| | | Revised | | | Projection | | | Projection | | | Projection | |
Tonnages – Crown Export Coal1 (Mt) | | | 187 | | | | 202 | | | | 218 | | | | 235 | |
Exchange Rate US$ per A$2 | | | 0.93 | | | | 0.91 | | | | 0.91 | | | | 0.91 | |
Year Average Coal Prices3 (US$ per tonne) | | | | | | | | | | | | | | | | |
Hard coking | | | 154 | | | | 172 | | | | 179 | | | | 179 | |
Semi-soft | | | 120 | | | | 134 | | | | 139 | | | | 139 | |
Thermal | | | 94 | | | | 90 | | | | 96 | | | | 96 | |
Notes:
| 1. | Excludes coal produced for domestic consumption and coal where royalties are not paid to the government, i.e private royalties. 2013-14 estimate for domestic coal volume is approximately 24Mt and private coal is 8Mt. |
| 3. | Represent the benchmark contract price for highest quality coal type. Prices are discounted to reflect prices for lower quality coal. Hard coking coal can be sold up to $17 below benchmark and thermal $10 below. |
| | | | |
| Page 28 | | Mid Year Economic and Fiscal Review 2013-14 | | |
Table 20
Key Fiscal Aggregates, 2006-07 to 2016-17
| | | | | | | | | | | | | | | | | | | | | | | | | | | | | | | | | | | | | | | | | | | | |
| | | 2006-07
Actual
$ million | | | 2007-08
Actual
$ million | | | 2008-09
Actual
$ million | | | 2009-10
Actual
$ million | | | 2010-11
Actual
$ million | | | 2011-12
Actual
$ million | | | 2012-13
Actual
$ million | | | 2013-14
MYFER
$ million | | | 2014-15
Projection
$ million | | | 2015-16
Projection
$ million | | | 2016-17
Projection
$ million | |
General Government | | | | | | | | | | | | | | | | | | | | | | | | | | | | | | | | | | | | | | | | | | | | |
Total Revenue | | | 31,982 | | | | 31,430 | | | | 37,008 | | | | 39,729 | | | | 41,957 | | | | 45,794 | | | | 41,746 | | | | 44,864 | | | | 51,164 | | | | 52,087 | | | | 53,486 | |
Tax Revenue | | | 8,484 | | | | 9,546 | | | | 8,877 | | | | 9,375 | | | | 9,975 | | | | 10,608 | | | | 10,957 | | | | 11,914 | | | | 12,634 | | | | 13,457 | | | | 14,290 | |
Total Expenses | | | 30,128 | | | | 32,989 | | | | 36,974 | | | | 39,785 | | | | 43,473 | | | | 46,027 | | | | 46,129 | | | | 48,633 | | | | 49,255 | | | | 50,062 | | | | 52,013 | |
Employee Expenses | | | 11,731 | | | | 13,171 | | | | 14,305 | | | | 15,566 | | | | 16,820 | | | | 18,250 | | | | 18,130 | | | | 18,571 | | | | 19,187 | | | | 19,988 | | | | 20,884 | |
Net Operating Balance | | | 1,855 | | | | (1,559 | ) | | | 35 | | | | (56 | ) | | | (1,516 | ) | | | (233 | ) | | | (4,382 | ) | | | (3,769 | ) | | | 1,910 | | | | 2,026 | | | | 1,474 | |
Capital Purchases | | | 4,418 | | | | 5,716 | | | | 6,960 | | | | 8,767 | | | | 8,237 | | | | 7,930 | | | | 6,970 | | | | 7,119 | | | | 5,944 | | | | 4,828 | | | | 4,379 | |
Net Capital Purchases | | | 2,067 | | | | 3,668 | | | | 4,434 | | | | 6,494 | | | | 5,573 | | | | 5,249 | | | | 3,359 | | | | 3,835 | | | | 2,574 | | | | 1,330 | | | | 876 | |
Fiscal Balance | | | (211 | ) | | | (5,226 | ) | | | (4,399 | ) | | | (6,550 | ) | | | (7,089 | ) | | | (5,482 | ) | | | (7,741 | ) | | | (7,604 | ) | | | (664 | ) | | | 696 | | | | 598 | |
Borrowings | | | 2,266 | | | | 6,332 | | | | 10,278 | | | | 15,916 | | | | 25,090 | | | | 29,514 | | | | 37,878 | | | | 45,719 | | | | 47,372 | | | | 47,391 | | | | 47,689 | |
| | | | | | | | | | | |
Non-financial Public Sector | | | | | | | | | | | | | | | | | | | | | | | | | | | | | | | | | | | | | | | | | | | | |
Total Revenue | | | 40,892 | | | | 38,363 | | | | 43,659 | | | | 47,882 | | | | 48,984 | | | | 52,300 | | | | 49,175 | | | | 52,151 | | | | 57,910 | | | | 58,813 | | | | 60,570 | |
Capital Purchases | | | 10,635 | | | | 13,865 | | | | 15,265 | | | | 14,818 | | | | 13,344 | | | | 11,939 | | | | 10,719 | | | | 11,172 | | | | 9,747 | | | | 8,598 | | | | 8,085 | |
Borrowings | | | 24,009 | | | | 30,929 | | | | 42,646 | | | | 51,698 | | | | 52,619 | | | | 61,522 | | | | 69,031 | | | | 76,968 | | | | 79,476 | | | | 80,416 | | | | 81,454 | |
| | | | |
| | Mid Year Economic and Fiscal Review 2013-14 | | Page 29 |
Table 21
Key Fiscal Indicators, 2006-07 to 2016-17
| | | | | | | | | | | | | | | | | | | | | | | | | | | | | | | | | | | | | | | | | | | | |
| | | 2006-07
Actual
% | | | 2007-08
Actual
% | | | 2008-09
Actual
% | | | 2009-10
Actual
% | | | 2010-11
Actual
% | | | 2011-12
Actual
% | | | 2012-13
Actual
% | | | 2013-14
MYFER
% | | | 2014-15
Projection
% | | | 2015-16
Projection
% | | | 2016-17
Projection
% | |
General Government | | | | | | | | | | | | | | | | | | | | | | | | | | | | | | | | | | | | | | | | | | | | |
Revenue/GSP | | | 15.0 | | | | 13.6 | | | | 14.3 | | | | 15.8 | | | | 15.7 | | | | 16.1 | | | | 14.4 | | | | 14.6 | | | | 15.8 | | | | 14.8 | | | | 14.2 | |
Tax/GSP | | | 4.0 | | | | 4.1 | | | | 3.4 | | | | 3.7 | | | | 3.7 | | | | 3.7 | | | | 3.8 | | | | 3.9 | | | | 3.9 | | | | 3.8 | | | | 3.8 | |
Expenses/GSP | | | 14.1 | | | | 14.3 | | | | 14.3 | | | | 15.8 | | | | 16.2 | | | | 16.2 | | | | 15.9 | | | | 15.9 | | | | 15.2 | | | | 14.2 | | | | 13.8 | |
Employee Expenses/GSP | | | 5.5 | | | | 5.7 | �� | | | 5.5 | | | | 6.2 | | | | 6.3 | | | | 6.4 | | | | 6.2 | | | | 6.1 | | | | 5.9 | | | | 5.7 | | | | 5.5 | |
Net Operating Balance/GSP | | | 0.9 | | | | (0.7 | ) | | | 0.0 | | | | (0.0 | ) | | | (0.6 | ) | | | (0.1 | ) | | | (1.5 | ) | | | (1.2 | ) | | | 0.6 | | | | 0.6 | | | | 0.4 | |
Capital Purchases/GSP | | | 2.1 | | | | 2.5 | | | | 2.7 | | | | 3.5 | | | | 3.1 | | | | 2.8 | | | | 2.4 | | | | 2.3 | | | | 1.8 | | | | 1.4 | | | | 1.2 | |
Fiscal Balance/GSP | | | (0.1 | ) | | | (2.3 | ) | | | (1.7 | ) | | | (2.6 | ) | | | (2.6 | ) | | | (1.9 | ) | | | (2.7 | ) | | | (2.5 | ) | | | (0.2 | ) | | | 0.2 | | | | 0.2 | |
Borrowings/GSP | | | 1.1 | | | | 2.7 | | | | 4.0 | | | | 6.3 | | | | 9.4 | | | | 10.4 | | | | 13.1 | | | | 14.9 | | | | 14.6 | | | | 13.5 | | | | 12.7 | |
Borrowings/Revenue | | | 7.1 | | | | 20.1 | | | | 27.8 | | | | 40.1 | | | | 59.8 | | | | 64.5 | | | | 90.7 | | | | 101.9 | | | | 92.6 | | | | 91.0 | | | | 89.2 | |
| | | | | | | | | | | |
Revenue Growth | | | 6.3 | | | | (1.7 | ) | | | 17.7 | | | | 7.4 | | | | 5.6 | | | | 9.1 | | | | (8.8 | ) | | | 7.5 | | | | 14.0 | | | | 1.8 | | | | 2.7 | |
Tax Growth | | | 14.7 | | | | 12.5 | | | | (7.0 | ) | | | 5.6 | | | | 6.4 | | | | 6.3 | | | | 3.3 | | | | 8.7 | | | | 6.0 | | | | 6.5 | | | | 6.2 | |
Expenses Growth | | | 14.2 | | | | 9.5 | | | | 12.1 | | | | 7.6 | | | | 9.3 | | | | 5.9 | | | | 0.2 | | | | 5.4 | | | | 1.3 | | | | 1.6 | | | | 3.9 | |
Employee Expenses Growth | | | 10.5 | | | | 12.3 | | | | 8.6 | | | | 8.8 | | | | 8.1 | | | | 8.5 | | | | (0.7 | ) | | | 2.4 | | | | 3.3 | | | | 4.2 | | | | 4.5 | |
| | | | | | | | | | | |
Non-financial Public Sector | | | | | | | | | | | | | | | | | | | | | | | | | | | | | | | | | | | | | | | | | | | | |
Capital Purchases/GSP | | | 5.0 | | | | 6.0 | | | | 5.9 | | | | 5.9 | | | | 5.0 | | | | 4.2 | | | | 3.7 | | | | 3.6 | | | | 3.0 | | | | 2.4 | | | | 2.1 | |
Borrowings/GSP | | | 11.2 | | | | 13.4 | | | | 16.5 | | | | 20.6 | | | | 19.6 | | | | 21.6 | | | | 23.8 | | | | 25.1 | | | | 24.6 | | | | 22.9 | | | | 21.6 | |
Borrowings/Revenue | | | 58.7 | | | | 80.6 | | | | 97.7 | | | | 108.0 | | | | 107.4 | | | | 117.6 | | | | 140.4 | | | | 147.6 | | | | 137.2 | | | | 136.7 | | | | 134.5 | |
Net Financial Liabilities/Revenue | | | 27.0 | | | | 57.0 | | | | 78.8 | | | | 93.7 | | | | 83.7 | | | | 104.9 | | | | 117.8 | | | | 126.5 | | | | 114.1 | | | | 110.6 | | | | 105.6 | |
| | | | |
| Page 30 | | Mid Year Economic and Fiscal Review 2013-14 | | |