EXHIBIT (c)(i)
Consolidated Financial Statements of the Registrant
for the fiscal year ended June 30, 2015.
FORWARD-LOOKING STATEMENTS
This exhibit contains forward-looking statements. Statements that are not historical facts, including statements about the State of Queensland’s (the “State” or “Queensland”) beliefs and expectations, are forward-looking statements. These statements are based on current plans, budgets, estimates and projections and therefore you should not place undue reliance on them. The words “believe”, “may”, “will”, “should”, “estimate”, “continue”, “anticipate”, “intend”, “expect”, “forecast” and similar words are intended to identify forward-looking statements. Forward-looking statements speak only as of the date they are made, and neither the Queensland Treasury Corporation nor the State undertake any obligation to update publicly any of them in light of new information or future events.
Forward-looking statements are based on current plans, estimates and projections and, therefore, undue reliance should not be placed on them. Although the Queensland Treasury Corporation and the State believe that the beliefs and expectations reflected in such forward-looking statements are reasonable, no assurance can be given that such beliefs and expectations will prove to have been correct. Forward-looking statements involve inherent risks and uncertainties. We caution you that actual results may differ materially from those contained in any forward-looking statements.
A number of important factors could cause actual results to differ materially from those expressed in any forward-looking statement. Factors that could cause the actual outcomes to differ materially from those expressed or implied in forward-looking statements include:
| | • | | the international and Australian economies, and in particular the rates of growth (or contraction) of the State’s major trading partners; |
| | • | | the effects, both internationally and in Australia, of any further global financial crisis, any subsequent economic downturn, the ongoing economic, banking and sovereign debt crisis in Europe and any stalling of the protracted United States recovery; |
| | • | | increases or decreases in international and Australian domestic interest rates; |
| | • | | changes in the State’s domestic consumption; |
| | • | | changes in the State’s labor force participation and productivity; |
| | • | | downgrades in the credit ratings of the State and Australia; |
| | • | | changes in the rate of inflation in the State; |
| | • | | changes in environmental and other regulation; and |
| | • | | changes in the distribution of revenue from the Commonwealth of Australia Government to the State. |
AUDAX AT FIDELIS
QUEENSLAND
TREASURY
CORPORATION
ANNUAL
REPORT
2014–15
CONTENTS
| | | | |
Letter of Compliance | | | 1 | |
| |
Queensland Treasury Corporation | | | 2 | |
| |
Chairman’s and Chief Executive’s report | | | 4 | |
| |
Creating value for the State and clients | | | 6 | |
| |
Achieving sustainable access to funding | | | 10 | |
| |
Striving for organisational excellence | | | 12 | |
| |
Ensuring corporate governance | | | 14 | |
| |
Financial Statements | | | 19 | |
| |
Appendices | | | 49 | |
Front cover and spread image:
Story Bridge, Brisbane, Queensland
Officially opened on 6 July 1940, Brisbane’s iconic bridge turned 75 in 2015.
Originally designed as a way to help ease Brisbane’s increasing congestion issues, it became an example of a major Queensland infrastructure project that was undertaken with a longer-term vision in mind.
| | | | |
| QUEENSLAND TREASURY CORPORATION | | ANNUAL REPORT 2014-15 | | 1 |
| | |
| 22 September 2015 | |  |
The Honourable Curtis Pitt MP
Treasurer, Minister for Employment and Industrial Relations, and Minister for Aboriginal and Torres Strait Islander Partnerships
GPO Box 611
Brisbane QLD 4001
Dear Treasurer
I am pleased to present the Annual Report 2014–15 and financial statements for Queensland Treasury Corporation.
I certify that this Annual Report complies with:
| • | | the prescribed requirements of the Financial Accountability Act 2009 and the Financial and Performance Management Standard 2009, and |
| • | | the detailed requirements set out in the Annual Report requirements for Queensland Government agencies. |
A checklist outlining the annual reporting requirements can be found at page 56 of this annual report or accessed at www.qtc.com.au.
Sincerely
|

|
| Gerard Bradley |
| Chairman |
LEVEL 6, 123 ALBERT STREET, BRISBANE QUEENSLAND AUSTRALIA 4000
GPO BOX 1096, BRISBANE QUEENSLAND AUSTRALIA 4001
T: 07 3842 4600 • F: 07 3221 4122 • QTC.COM.AU
| | | | |
| 2 | | ANNUAL REPORT 2014-15 | | QUEENSLAND TREASURY CORPORATION |
| | |
| VISION | | MISSION |
| |
| Securing Queensland’s financial success | | To deliver optimal financial outcomes through sound funding and financial risk management |
VALUES
Client focus: We build strong partnerships with our clients to deliver simple and well-designed solutions that achieve quality outcomes for Queensland.
Team spirit: We work as one team, taking joint responsibility for achieving our vision and collaborating to achieve outstanding performance.
Excellence: We aim for excellence using flexible and agile processes to continuously improve.
Respect: We show respect by recognising contributions, welcoming ideas, acting with honesty, being inclusive and embracing diversity.
Integrity: We inspire trust and confidence in our colleagues, clients, stakeholders and investors by upholding strong professional and ethical standards.
WHAT IS QTC?
Queensland Treasury Corporation has a statutory responsibility to advance the financial position of the State, and a mandate to manage and minimise financial risk in the public sector and provide value-adding financial solutions to its public sector clients. Established under the Queensland Treasury Corporation Act 1988, QTC is a corporation sole, reporting through the Under Treasurer to the Treasurer and Queensland Parliament.
2015-19 STRATEGIC PLAN
| | |
| STRATEGIC GOALS | | PERFORMANCE INDICATORS |
| |
1 State and client value | | Value added |
| |
2 Sustainable funding | | Investor/market support |
| |
3 Organisational excellence | | Client satisfaction |
| |
| | Employee engagement |
| | | | |
| QUEENSLAND TREASURY CORPORATION | | ANNUAL REPORT 2014-15 | | 3 |
QUEENSLAND TREASURY CORPORATION
role and responsibilities
As the Queensland Government’s central financing authority, Queensland Treasury Corporation (QTC) plays a pivotal role in securing the State’s financial success.
With a focus on whole-of-State outcomes, QTC provides a range of financial services to the State and its public sector entities, including local governments. These services include debt funding and management, cash management facilities, financial risk management advisory services, and specialist public finance education.
| | |

| | DEBT FUNDING AND MANAGEMENT |
| | QTC borrows funds in the domestic and global markets in the most cost-effective manner and in a way that minimises liquidity risk and refinancing risk. QTC achieves significant economies of scale and scope by issuing, managing and administering the State’s debt funding. |
| | QTC works closely with Queensland’s public sector entities, including local governments, to assist them to effectively manage their financial transactions, minimise their financial risk and achieve the best financial solutions for their organisation and the State. |

| | CASH MANAGEMENT FACILITIES |
| | QTC assists the State’s public sector entities to make the best use of their surplus cash balances within a conservative risk management framework. It offers overnight and fixed-term facilities and a managed short-term fund. |
| | | | |

| | FINANCIAL RISK MANAGEMENT ADVISORY SERVICES |
| | QTC offers a range of financial risk management advisory services to clients, including: |
| | • | | support to ensure financial risks are identified and effectively managed |
| | • | | advice on financial and commercial considerations |
| | • | | expertise in financial transactions and structures |
| | • | | project management support to deliver key fiscal outcomes, and |
| | • | | collaboration with the financial markets and private sector institutions. |

| | SPECIALIST PUBLIC FINANCE EDUCATION |
| | QTC offers a range of education and training courses that complements its products and advisory services and allows it to share its specialist financial, commercial, treasury management and risk management expertise with clients. Courses are developed and delivered by QTC’s experienced professionals and industry experts. |
| | | | |
| 4 | | ANNUAL REPORT 2014-15 | | QUEENSLAND TREASURY CORPORATION |
REPORT
Chairman and
Chief Executive
| | | | | | |

GERARD BRADLEY CHAIRMAN | | | | 
PHILIP NOBLE CHIEF EXECUTIVE | | In 2014-15, Queensland Treasury Corporation successfully funded the State’s $7 billion term debt borrowing program, provided significant whole-of-State and client benefits, and achieved an operating profit from its capital markets operations of $41.3 million. |
2014-15 FUNDING REQUIREMENTS ACHIEVED
With strong investor demand for primary issuance, and despite some increasing volatility within the global financial markets, QTC successfully completed its $7 billion term debt borrowing program for 2014–15 in March—and by year end had raised an additional $2 billion towards the 2015–16 funding requirement. This proactive management of QTC’s borrowing program will underwrite the success of its funding activities for the coming year.
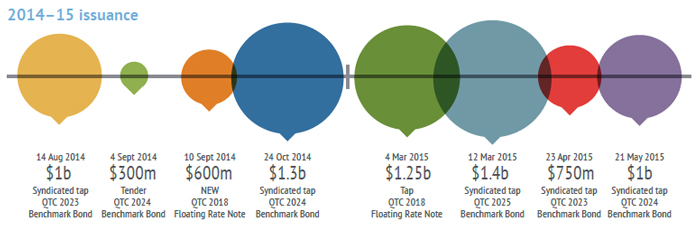
Issuance by quarter over the year included:
| • | | In the September quarter, the launch of QTC’s $600 million November 2018 Floating Rate Note via syndication, issue of $1 billion of July 2023 benchmark bonds via syndicated tap, and issue of $300 million of July 2024 benchmark bonds via tender. |
| • | | In the December quarter, the issue of $1.3 billion of July 2024 benchmark bonds via syndicated tap. |
| • | | In the March quarter, the issue of $1.25 billion of November 2018 Floating Rate Notes, and $1.4 billion of July 2025 benchmark bonds via syndicated tap. |
| • | | In the June quarter, the issue of $750 million of July 2023 benchmark bonds, and $1 billion of July 2024 benchmark bonds via syndicated tap. |
On 14 July 2015, the Queensland Government announced its 2015–16 State Budget, which was followed by QTC’s announcement of its 2015–16 borrowing program with a requirement for $6.5 billion in term debt (around $4 billion less than previously forecast).
QTC’s AUD benchmark bonds will remain its principal source of funding to meet the State’s borrowing requirements. While funding activity is subject to client requirements and market conditions, QTC will target term debt issuance to smooth its maturity profile and potentially launch new term debt maturities. Issuance in its
benchmark curve will be complemented by floating rate notes and other instruments, and a minimum of approximately $5 billion in short-term debt outstandings will be maintained.
QTC’s long-standing and highly-respected global reputation with investors and market intermediaries is essential to its ongoing ability to fund the State. In 2015–16, as in previous years, QTC’s interactions within the global debt capital markets will be exemplified by its commitment to open and transparent communication.
CREDIT RATINGS AFFIRMED
Queensland’s and QTC’s credit ratings were reaffirmed by both Standard & Poor’s and Moody’s Investors Service during the year.
On 10 October 2014, Standard & Poor’s affirmed Queensland’s and QTC’s credit rating at AA+/A-1+ with the outlook remaining stable, citing Australia’s strong institutional framework, Queensland’s strengthening economy, positive financial management and strong liquidity position.
On 3 December 2014, Moody’s Investors Service released its credit opinion for Queensland and QTC, with no change to the current Aa1/P1 credit rating and the negative outlook.
WHOLE-OF-STATE CONTRIBUTION PRIORITISED
QTC has a statutory responsibility to advance the financial position of the State, which it does through the management and minimisation of financial risk in the public sector and provision of value-adding financial solutions to its public sector clients. With its whole-of-State focus, and unique position as the Government’s independent financial advisor, QTC has a strong understanding of the financial opportunities and risks facing the State’s public sector entities.
| | | | |
| QUEENSLAND TREASURY CORPORATION | | ANNUAL REPORT 2014-15 | | 5 |
In the year under review, QTC demonstrated its agility and breadth of capabilities as it responded to the priorities and requirements of the former and current governments, as well as the broader economic landscape, and strengthened its long-term business relationships and networks across all levels of government. These strong relationships continue to enhance QTC’s ability to provide valuable insights into the trends, issues and opportunities facing the State, and advice that helps deliver the Government’s key priorities.
SIGNIFICANT CLIENT ASSIGNMENTS INCREASED
QTC has worked closely with its clients to optimise their financial outcomes.
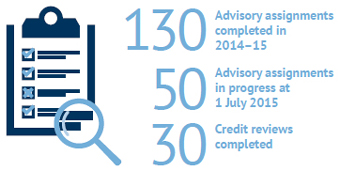
The number and scope of client advisory assignments has continued to increase, with the completion of 130 significant assignments and another 50 underway at year’s end. Assignments ranged from financial modelling to support decision-making, through to credit assessments and advice on procurement options. Highlights for the year included the provision of strategic advice to a number of clients on major debt and refinancing issues, each of which resulted in positive outcomes for the client and the State, and the development of a suite of financial tools and frameworks that support clients’ growing needs in project decision making, and financial forecasting and assessment.
OPERATING RESULTS
For the 2014–15 year, QTC recorded an operating profit after tax from its capital markets operations of $41.3 million (2013–14: $119.2 million), mainly attributable to earnings on capital, plus fair value accounting gains associated with the management of QTC’s funding task and balance sheet.
QTC borrows in advance of requirements to ensure public sector entities have ready access to funding when required, to reduce the risk associated with refinancing
maturing loans, and for liquidity management purposes. As a consequence of market changes, realised and unrealised accounting gains or losses may be recorded during the year which, depending on whether these transactions are held to maturity, may be reversed in subsequent accounting periods.
Separate from QTC’s capital markets operations, QTC’s long-term assets, which comprises the investments set aside to fund the State’s defined benefit superannuation and other long-term employee liabilities, recorded a profit of $151.3 million (2013–14: $3.1 billion). Managed by QIC, these assets were transferred to QTC by the Queensland Government under an administrative arrangement in 2008; in return, QTC issued fixed-rate notes to the State that provide a fixed rate of return. While QTC bears the fluctuations in the value and returns on the asset portfolio, there is no cash flow effect for QTC. Any losses incurred by this segment have no impact on QTC’s capital markets activities or its ability to meet its obligations.
OPERATIONAL ENHANCEMENTS ON TRACK
To ensure its capacity to meet the Government’s emerging financial needs, QTC has successfully continued its program of work to implement new technologies to enhance its financial and risk management systems and processes. This program of work is on track to deliver organisational efficiencies that will streamline processes and free-up expert resources for the front-line delivery of services.
EMPLOYEE ENGAGEMENT INCREASED
Solid results have been achieved through QTC’s well-rounded program of work to engage employees in its high performance culture. With the implementation of key initiatives to enhance leadership, learning and development, succession planning, recognition, remuneration,
diversity and health and wellbeing, the significant improvement in QTC’s employee engagement survey results was particularly pleasing. In 2014–15, employee engagement increased by nine percentage points to 71 per cent, placing QTC within Aon Hewitt’s ‘Best Employer’ range and in the top quartile of surveyed financial institutions in Australia and New Zealand.
BOARD AND MANAGEMENT STRENGTHENED
Over the last year, two highly experienced directors have joined the QTC Board, bringing their considerable expertise and insight to benefit the organisation and the State; Jim Stening was appointed on 13 November 2014, and Karen Smith-Pomeroy was appointed on 9 July 2015.
Executive management has also been bolstered, with Richard Jackson moving into an executive-level role responsible for market relations, and Grant Bush accepting QTC’s offer to lead its Funding and Markets Division (see below).
LOOKING AHEAD
With a clear focus on its three key goals —to deliver value to the State and its clients; to ensure access to sustainable funding; and to achieve organisational excellence—and its highly talented leaders and staff, QTC is well-positioned to provide tangible financial value to the State in 2015-16, and the years to come.
|

|
| G P BRADLEY |
| Chairman |
|

|
| P C NOBLE |
| Chief Executive |
| | |

GRANT BUSH EXECUTIVE GENERAL MANAGER, FUNDING AND MARKETS | | After a global selection process, Grant Bush was appointed QTC’s Executive General Manager, Funding and Markets, effective 17 August 2015. Grant has extensive experience in the fixed income markets having spent 23 years in the investment banking industry across a range of markets and disciplines. He spent the last 16 years at Deutsche Bank, most recently as their Managing Director, Co-Head of Corporate Coverage & Head of Capital Markets and Treasury Solutions. Grant has also worked with BZW (former investment banking arm of Barclays Bank PLC), and ABN AMRO. He joins QTC with proven senior management experience in broad organisational decision making, and funding and markets strategy. |
| | | | |
| 6 | | ANNUAL REPORT 2014-15 | | QUEENSLAND TREASURY CORPORATION |
CREATING
value for the State and clients
In 2014–15, QTC achieved significant financial outcomes for the State and its public sector entities through the delivery of its debt funding and management, cash management, financial risk management advisory, and specialist public finance education services.
These outcomes ranged from identifying optimal funding and refinancing solutions from a cost and debt management perspective, through to support in identifying and managing financial risks in major projects.
QTC’s enhanced service delivery model, which facilitates client access to the full range of skills and expertise that its highly skilled people offer, has been integral to the achievement of these outcomes.
INCREASED SCOPE IN ADVISORY ASSIGNMENTS
In 2014–15, QTC completed a broad range of financial advisory assignments that assisted its clients and the State to address financial risk management issues and deliver meaningful whole-of-State outcomes that contributed to the achievement of the Government’s fiscal priorities and objectives.
By year end, QTC had completed 130 major advisory assignments, and had another 50 underway, to assist its clients and the State to maximise the financial value, mitigate the financial risk, and minimise the financial costs in their projects. As client demand for its advisory services continued, QTC delivered services to address emerging challenges and opportunities, and assignments that ranged from financial modelling for decision making, through to credit assessments, procurement advice, business case development and project evaluation.
REFINANCING ADVICE PRIORITISED
In the year under review, QTC completed a number of major assignments to address clients’ debt and refinancing issues, providing advice and developing and implementing strategies that resulted in positive financial outcomes and the mitigation of associated risk implications. For example, QTC partnered with two of its largest energy clients —Ergon and Energex—to develop and implement a new approach and strategies to refinance their $13 billion of debt, in line with regulatory requirements of the Australian Energy Market Commission. This new approach significantly decreased the current and future refinancing and regulatory mismatch risk for these clients and the State.
NEW SUITE OF FINANCIAL MANAGEMENT TOOLS DELIVERED
The reach and accessibility of QTC’s financial risk management and advisory expertise was enhanced, through the development of a suite of new financial management tools for clients to use that further extended the application of some of QTC’s well-established financial frameworks and models. This included financial forecasting tools, standardised credit frameworks and project decision-making frameworks for clients from all areas of government. These best-practice financial models and tools are integral to the delivery of QTC’s advisory services across the State, providing additional support to clients in their financial and commercial decision-making.
| | | | |
| QUEENSLAND TREASURY CORPORATION | | ANNUAL REPORT 2014-15 | | 7 |
BETTER OUTCOMES FOR QUEENSLANDERS DELIVERED
As QTC delivers its range of financial risk management advisory services across the full spectrum of the Queensland public sector, a number of its assignments in the past year have been completed for clients that have a significant role in providing better outcomes for Queenslanders.
For example, QTC continued its partnership with the Department of Housing and Public Works on its community housing reform program, including the financial and commercial assessments for the first two major social housing outsourcing projects, the Logan Renewal Initiative and the Gold Coast Management Transfer Initiative.
This work was complemented by subsequent assignments for contract management education, and the financial assessment of providers and training programs for the national regulation body.
INFRASTRUCTURE PROJECT EVALUATION AND PROCUREMENT SUPPORTED
QTC maintained its commitment to the Government’s Projects Queensland office, with employees leading and participating in the evaluation and procurement of some of the State’s most important infrastructure and service delivery initiatives to achieve value-for-money outcomes, deliver projects within tight time frames, and enable an appropriate transfer of risk to the private sector.
Community housing complex, Margate. Image courtesy of the Department of Housing and Public Works
| | | | |
| 8 | | ANNUAL REPORT 2014-15 | | QUEENSLAND TREASURY CORPORATION |
DEBT MANAGEMENT
In 2014–15, QTC continued to provide clients with a lower cost of funds—through low-interest loans combined with a high level of interest rate risk protection. With responsibility for all of the State’s debt raising, QTC continues to capture significant economies of scale and scope in the issuance, management and administration of debt. Despite ongoing market volatility, QTC’s capital markets expertise ensures clients have access to borrowing products at comparatively low interest rates.
CASH MANAGEMENT
QTC offers cash management products that enable its clients to maximise the value of their surplus funds. In 2014–15, QTC’s Capital Guaranteed Cash Fund provided strong returns and outperformed its benchmark, the Bloomberg AusBond Bank Bill Index, by 0.80 percentage points.
CLIENT FEEDBACK
As part of its commitment to ensuring it has strong and professional client relationships that deliver simple and well-designed solutions and achieve quality outcomes for Queensland, QTC constantly seeks client feedback to improve its services.
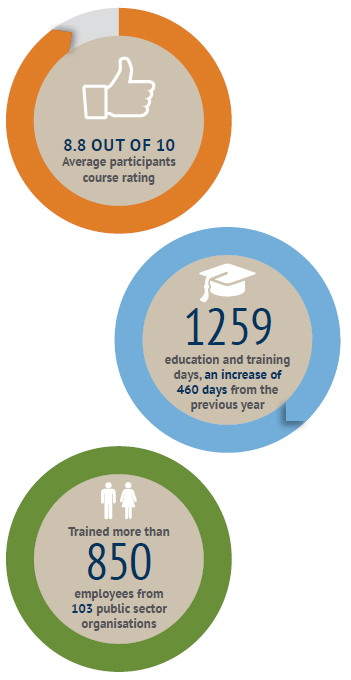
In 2014–15, QTC’s post-advisory survey results remained high, achieving a satisfaction score of 8.6 out of a possible 10. Similarly, in its annual client survey, QTC’s established goodwill with clients continued, as 74 per cent of clients who were asked to provide feedback completed the survey, providing results that indicated their sentiment score towards QTC remained strong and steady at 8.4 out of a possible 10. In addition, QTC’s client value score increased from 7.3 to 7.9 out of a possible 10.
SPECIALIST PUBLIC SECTOR FINANCE EDUCATION
QTC has prioritised the delivery of its public sector finance education this year, increasing the range and frequency of courses to provide additional, cost-effective opportunities for clients to improve their financial, risk and decision-making skills. Facilitated by QTC’s team of highly-skilled finance education experts, these courses foster an environment of continuous improvement and provide practical skills, tools and techniques to support public sector service delivery and the Government’s achievement of its fiscal objectives.
| | | | |
| QUEENSLAND TREASURY CORPORATION | | ANNUAL REPORT 2014-15 | | 9 |

| | | | |
| 10 | | ANNUAL REPORT 2014-15 | | QUEENSLAND TREASURY CORPORATION |
ACHIEVING
sustainable access to funding
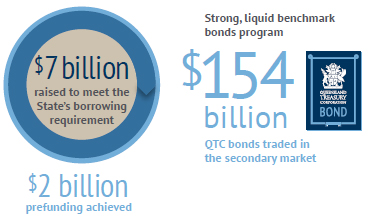
In the year under review, QTC raised $7 billion of term debt to meet the State’s funding requirements. Proactive management of its funding strategy helped minimise spread volatility and smoothed QTC’s maturity profile in a time of relative market uncertainty.
MEETING THE STATE’S FUNDING REQUIREMENTS
In 2014–15, through its high-quality execution of term debt issuance, QTC affirmed its reputation as a premium issuer with investors and the Fixed Income Distribution Group, particularly given its capacity to successfully launch and close large deals at attractive pricing levels. QTC’s activities to complete the annual borrowing program and support its bonds in the market included:
| • | | the issuance of $2.8 billion of floating rate notes at yields below its equivalent fixed-rate curve, as well as creating a smoother maturity profile—this issuance was targeted at maturity dates that avoided large refinancing periods |
| • | | the issuance of $5.5 billion of syndicated fixed rate funding on average at QTC’s fair value curve, and |
| • | | the utilisation of QTC’s balance sheet to enhance liquidity in QTC bonds (turnover in QTC bonds held on balance sheet of $2.6 billion in 2014–15). |
QTC continues to provide the market with diverse, liquid lines that have been issued using the strength of its AA+ credit rating.
Working closely with Ergon and Energex, QTC developed and implemented strategies to refinance their (combined) $13 billion of debt, in line with the Australian Energy Market Commission’s regulatory requirements
Image courtesy of Ergon Energy
| | | | |
| QUEENSLAND TREASURY CORPORATION | | ANNUAL REPORT 2014-15 | | 11 |
FUNDING PERFORMANCE
| | |
| QTC’s proactive management of the borrowing program, its client funding and balance sheet activities helped contain QTC’s spreads, and was supported by market confidence in QTC’s ability to manage its future funding programs, evident through strong investor demand for each of its public issuances. | | 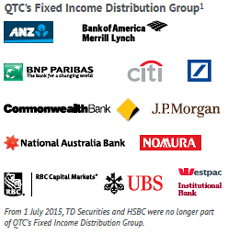 |
In 2014–15, QTC capitalised on historically low interest rates by materially lengthening the duration of the Government Debt Pool in an efficient and prompt manner, thereby providing the State with significant stability of interest cost and protection against rising interest rates for the foreseeable future. | |
Funding, debt management, refinancing, client transaction and rebalancing activities for the State provided estimated savings of $66 million during 2014–15. | |
In 2014–15, QTC’s Fixed Income Distribution Group of 14 banks, traded $154 billion of QTC’s bonds in the secondary market—demonstrating the strength of QTC’s strong, liquid benchmark bond program. | |
| | | | | | |
2015–16 TERM DEBT INDICATIVE BORROWING PROGRAM | | |  |
REQUIREMENTS | | 2015–16 BUDGET
AUD M2 | | |
New money | | | | | |
State (includes general government and government-owned corporations) | | | (1,700 | ) | |
Local Government and other clients3 | | | 700 | | |
Total new money | | | (1,000 | ) | |
Net term debt refinancing | | | 7,500 | | |
Total term debt requirement | | | 6,500 | | |
| | | | | |
FUNDING FACILITIES
| | | | | | | | | | | | |
As at 30 June 2015 | |
FACILITY | | | | SIZE
($M) | | MATURITIES | | CURRENCIES | | ON ISSUE
(AUD M) | |
| | Domestic T-Note | | Unlimited | | 7–365 days | | AUD | | | 4 900 | |
Short-term | | Euro CP | | USD10,000 | | 1–364 days | | Multi-currency | | | 115 | |
| | US CP | | USD10,000 | | 1–270 days | | USD | | | 163 | |
| | AUD Bond | | Unlimited | | 11 benchmark lines: 2015-2025 | | AUD | | | 69 713 | |
| | | | 4 AGG4 lines: 2015-2021 | | AUD | | | 7 281 | |
| | | | Preferred line: 2033 | | AUD | | | 905 | |
Long-term | | | | Capital Indexed Bond: 2030 | | AUD | | | 847 | |
| | | | Floating rate notes: 2016-2018 | | AUD | | | 7 055 | |
| | Global AUD Bond | | AUD20,000 | | 2 AGG4 lines 2015-2017 | | AUD | | | 487 | |
| | Multi-currency Euro MTN | | USD10,000 | | Various | | Multi-currency | | | 1 089 | |
| | Multi-currency US MTN | | USD10,000 | | Various | | Multi-currency | | | — | |
1 Actual dealer entities may vary depending on the facility and location of the dealer. See Appendix E for contact details.
2 Numbers are rounded to the nearest $100 million. 3 Other clients include: universities, grammar schools, retail water entities and water boards.
Note: Funding activity may vary depending upon actual client requirements, the State’s fiscal position and financial market conditions. 4 AGG – Australian Government Guaranteed
| | | | |
| 12 | | ANNUAL REPORT 2014-15 | | QUEENSLAND TREASURY CORPORATION |
STRIVING FOR
organisational excellence
QTC is committed to maintaining high organisational standards to provide an environment where corporate goals can be achieved and organisational risks are actively monitored and addressed.
CORPORATE RISK MANAGEMENT AND EFFICIENCY
QTC manages its risks within an enterprise-wide risk management framework. The framework supports the achievement of QTC’s corporate strategies and objectives by providing assurance that QTC’s risks are being appropriately and effectively identified and managed, using a consistent and well-understood approach for evaluating and reporting risks. QTC’s Chief Risk Officer is responsible for embedding QTC’s risk management policy and program.
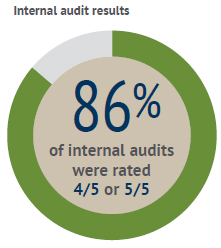
On 1 July 2014, EY (Ernst & Young) was appointed as QTC’s internal auditor. Internal audit results for the year were very positive; out of 14 audits completed, two audits were rated 5 out of 5, ten were rated 4 out of 5, and two rated 3 out of 5.
QTC has successfully implemented a framework that identifies key internal controls; control owners provide periodic assurance that the control is effective. In the year under review, all control assurances were positive. In addition, QTC’s internal auditors assessed that each control is operating effectively.
Throughout 2014–15, QTC managed its portfolio market risk exposures, including interest rate, foreign exchange and counterparty risk, within Board-approved risk parameters. It also managed its financial markets risks in line with industry best practice and Basel Committee recommendations. QTC continues to hold a portfolio of diverse, liquid financial securities to meet the State’s liquidity requirements, consistent with its internal and external policies.
OPERATIONAL EXCELLENCE
In 2014–15, initiatives to improve the efficiency and effectiveness of operations remained a major priority for the organisation, with the implementation of the organisation’s longer-term strategy to ensure sustainability in its products, processes and systems.
The first systems within this program of work were successfully implemented during the year, and included straight-through processing to fully automate market transactions and optimise efficiencies, systems for enterprise content and print management, and improved secure remote-access functionality.
Through the provision of funding for clients, QTC efficiently and accurately completed more than 78,000 transactions, with a combined turnover of $1 trillion, and an error rate of only 0.036 per cent.
HIGH PERFORMANCE WORKFORCE
QTC competes with the global financial industry to attract and retain its high calibre of employees. Pursuant to the Queensland Treasury Corporation Act 1988, QTC employees are hired on individual contracts, with employment practices aligned to the financial markets in which it operates.
QTC’s Board regularly reviews the performance-based remuneration system, which comprises fixed and variable remuneration and is benchmarked against the market median of remuneration data from similar-sized organisations in the Financial Institutions Remuneration Group (FIRG provides salary survey data for the Australian finance industry). QTC’s variable remuneration framework provides an opportunity for an annual short-term incentive for eligible employees, aligned to financial-year performance, and designed to ensure market competitiveness and reward outstanding organisational, group and individual performance. The QTC Board approves the entitlement to, and the quantum of, the annual review of fixed remuneration and variable short-term incentives.
Activities to enhance the capability and engagement of QTC’s workforce and further embed high-performance into the organisation’s culture were prioritised, with the implementation of a number of new initiatives, as well as the continuation of the targeted leadership, culture and workplace programs.
| | | | |
| QUEENSLAND TREASURY CORPORATION | | ANNUAL REPORT 2014-15 | | 13 |
New initiatives included the ‘onboarding’ program and new talent development programs, providing internship, work experience and six-week summer placement opportunities, as well as QTC’s formal learning programs.
Leadership development continues to be an area of organisational priority; in the year under review, QTC delivered five development programs, with a total of 126 participants across all programs.
With the implementation of its Diversity and Inclusion Strategy, the benefits of a culture that welcomes diversity and inclusion were embraced in the QTC workplace, helping to enrich employees’ perspective and experience, improve performance, manage risk, improve decision-making and, ultimately, achieve the organisation’s objectives. Under the strategy’s three priority streams of culture, disability and gender, ten new initiatives were implemented, including:
| • | | activities to celebrate the 26 nationalities represented in QTC’s workforce |
| • | | two new partnerships with external organisations to provide employment opportunities for people with a disability, and |
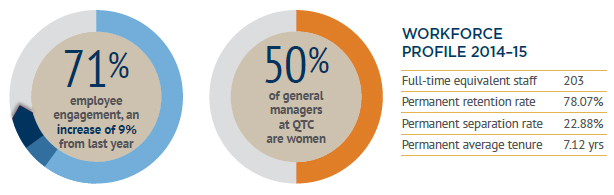
| • | | an increase in the number of women appointed to senior leadership roles (now 38 percent, up from 20 per cent in 2013–14) and general manager roles (now 50 per cent). |
Employee engagement again improved, increasing to 71 per cent, a nine percentage point improvement on the 2014 survey score (62 per cent) and a 33 percentage point improvement since the first engagement survey in 2011. Conducted by Aon Hewitt, this result places QTC within their ‘Best Employer’ range, and in the top quartile of the Australian and New Zealand Financial Services group (well above its norm of 55 per cent).
QTC continued its practice of regularly reviewing and updating its policies and procedures to comply with changes in the legislative and regulatory environment and to ensure employees have access to avenues through which to raise concerns, including an internal grievance process.

| | | | |
| 14 | | ANNUAL REPORT 2014-15 | | QUEENSLAND TREASURY CORPORATION |
ENSURING
corporate governance
QTC is committed to maintaining high standards of corporate governance to support its strong market reputation and ensure that organisational goals are met and risks are monitored and appropriately addressed. QTC’s corporate governance practices are continually reviewed and updated in line with industry guidelines and standards.
QTC AND ITS BOARDS
QTC was established by the Queensland Treasury Corporation Act 1988 (the QTC Act) as a corporation sole (ie, a corporation that consists solely of a nominated office holder). The Under Treasurer of Queensland is QTC’s nominated office holder. QTC has delegated its powers to its two boards:
| • | | the Queensland Treasury Corporation Capital Markets Board (the Board), which was established in 1991 and manages all of QTC’s operations except those relating to certain superannuation and other long-term assets, and |
| • | | the Long Term Asset Advisory Board, which was established in July 2008 and advises in relation to certain superannuation and other long-term assets that were transferred to QTC from Queensland Treasury on 1 July 2008. |
QTC’S CAPITAL MARKETS BOARD
QTC and the Capital Markets Board have agreed the terms and administrative arrangements for the exercise of the powers that have been delegated to the Board by QTC (as the corporation sole).
The Board operates in accordance with its charter, which sets out its commitment to various corporate governance principles and standards, the roles and responsibilities of the Board and its members (based on its delegated powers), and the conduct of meetings. The charter provides that the role and functions of the Board include:
| • | | overseeing QTC’s operations, including its control and accountability systems |
| • | | developing and monitoring QTC’s strategic and corporate plans, operational policy and yearly budget |
| • | | monitoring and measuring financial and operational performance |
| • | | monitoring and measuring organisational and staff performance |
| • | | monitoring key risks and risk management processes, and |
| • | | ensuring that QTC’s compliance is appropriate for an organisation of its type. |
The Board typically holds monthly meetings (except in January) and may, whenever necessary, hold additional meetings.
BOARD APPOINTMENTS
The Board comprises directors who are appointed by the Governor-in-Council, pursuant to section 10(2) of the QTC Act, with consideration given to each Board member’s qualifications, experience, skills, strategic ability and commitment to contribute to QTC’s performance and achievement of its corporate objectives. QTC’s Board is entirely constituted of non-executive directors (see page 16-17 for director’s profiles).
CONFLICT OF INTEREST
Board members are required to monitor and disclose any actual or potential conflicts of interest. Unless the Board determines otherwise, a conflicted Board member may not receive any Board papers, attend any meetings or take part in any decisions relating to declared interests.
PERFORMANCE AND REMUNERATION
To ensure continuous improvement and to enhance overall effectiveness, the Board conducts an annual assessment of its performance as a whole. Board members’ remuneration is determined by the Governor in Council (details are disclosed in QTC’s financial statements).
BOARD COMMITTEES
The Board has established three committees, each with its own terms of reference, to assist it in overseeing and governing various QTC activities.
Accounts and Audit Committee
The Accounts and Audit Committee has responsibility for the:
| • | | adequacy and effectiveness of internal controls, including for the prevention of fraud |
| • | | integrity of financial statements |
| • | | adequacy and effectiveness of compliance monitoring, and |
The Accounts and Audit Committee must have at least three members and meet at least four times a year.
| | | | |
| QUEENSLAND TREASURY CORPORATION | | ANNUAL REPORT 2014-15 | | 15 |
During the year the Accounts and Audit Committee recommended the adoption of the half year and annual financial statements, reviewed external and internal audit reports and the progress in implementing the recommendations from those reports, and reviewed the Queensland Audit Office’s Client Service Plan and QTC’s Internal Audit Plan.
As required by the Audit Committee Guidelines: Improving Accountability and Performance issued by Queensland Treasury, QTC’s Accounts and Audit Committee has observed its terms of reference and has had due regard to the Audit Committee Guidelines.
Human Resources Committee
The Human Resources Committee has responsibility for:
| • | | the appropriateness of any new or amended human resources policy |
| • | | the framework for, and review of, employee remuneration and performance, and |
| • | | employment terms and conditions. |
The Human Resources Committee must have at least three members and meet at least four times a year. The Human Resources Committee has observed its terms of reference.
Funding and Markets Committee
The core responsibilities of the Funding and Markets Committee is to assist the Board by making recommendations about the policy to enhance the performance and management of risk in the areas of funding accessibility (including liquidity), and pool performance and to support QTC’s risk appetite with a focus on effectiveness and performance.
The Committee must have at least three members and meet at least four times a year. The Funding and Markets Committee has observed its terms of reference.
| | | | | | | | | | | | | | | | |
| | | Board | | | Accounts
& Audit
Committee | | | Funding
& Markets
Committee | | | Human
Resources
Committee | |
Meetings held | | | 10 | | | | 5 | | | | 4 | | | | 4 | |
Gerard Bradley | | | 10 | | | | 2 | | | | 4 | | | | 4 | |
Warwick Agnew | | | 6 | | | | 4 | | | | — | | | | 2 | |
Alex Beavers* | | | 3 | | | | — | | | | 1 | | | | — | |
Stephen Bizzell | | | 10 | | | | 5 | | | | 4 | | | | — | |
Gillian Brown** | | | 2 | | | | — | | | | 1 | | | | — | |
Tonianne Dwyer | | | 10 | | | | — | | | | 1 | | | | 3 | |
Bill Shields | | | 9 | | | | 5 | | | | — | | | | — | |
Jim Stening | | | 7 | | | | — | | | | 2 | | | | — | |
| * | Alex Beavers resigned from the QTC Board on 13 November 2014. |
| ** | Gillian Brown resigned from the QTC Board on 20 August 2014. |
| | | | |
| 16 | | ANNUAL REPORT 2014-15 | | QUEENSLAND TREASURY CORPORATION |
QTC’S CAPITAL MARKETS BOARD
Board members are appointed by the Governor-in-Council, pursuant to section 10(2) of the Queensland Treasury Corporation Act 1988 on the recommendation of the Treasurer and in consultation with the Under Treasurer. Members are chosen on their ability and commitment to contribute to QTC’s performance and achievement of its stated objectives.
| | | | |

| | GERARD BRADLEY BCom, DipAdvAcc , FCA, FCPA, FAICD, FAIM Chair Appointed 10 May 2012 with tenure to 30 June 2016 Board Committees • Member, Human Resources Committee • Member, Funding and Markets Committee | | Prior to his appointment as the Chair of QTC’s Board, Mr Bradley was the Under Treasurer and Under Secretary of the Queensland Treasury Department, a position he held from 1998 to 2012. He was also a QTC Board member from 2000-2007. Mr Bradley has extensive experience in public sector finance gained in both the Queensland and South Australian treasury departments. He was Under Treasurer of the South Australian Department of Treasury and Finance from 1996 to 1998, and of Queensland’s Treasury Department from 1995 to 1996. Mr Bradley held various positions in Queensland Treasury from 1976 to 1995, with responsibility for the preparation and management of the State Budget and the fiscal and economic development of Queensland. He is currently a Director and Chairman of Queensland Treasury Holdings Pty Ltd and related companies, and a Director of Echo Entertainment Group Ltd. |

| | WARWICK AGNEW BEcon, MSocSc (Econ), MAppFin Appointed 13 November 2014 with tenure to 30 June 2017 Board Committees • Member, Accounts and Audit Committee • Member, Human Resources Committee | | Warwick Agnew is Queensland Treasury’s Deputy Under Treasurer, Advisory, Commercial Group, having previously held the role as the department’s Chief Operating Officer since June 2014. Throughout his 20 year career, Mr Agnew has held senior leadership positions across both public and private sector organisations including roles with Queensland Treasury and Trade, Queensland Treasury Corporation, Macquarie Capital and Transfield Services. Mr Agnew’s extensive experience has seen him undertake senior roles involving social and economic infrastructure projects, corporate finance advisory services, and operations and maintenance services at a national level. |

| | STEPHEN BIZZELL BCom, MAICD Appointed 14 February 2013 with tenure to 30 June 2017 Board Committees • Chair, Accounts and Audit Committee | | Stephen Bizzell is an experienced company director with skills in accounting, finance, risk management and commercial management. Mr Bizzell has more than 20 years’ corporate, finance and public company management experience in the resources, energy and financial services sectors with public companies in Australia and Canada. He was a co-founder and, for 12 years, executive director of coal seam gas company Arrow Energy Ltd and is Chairman of boutique corporate advisory and funds management group Bizzell Capital Partners Pty Ltd. Mr Bizzell currently holds company directorships on a number of ASX listed boards including Armour Energy Ltd, Dart Energy Ltd, Diversa Limited, Hot Rock Ltd, Laneway Resources Ltd, Renaissance Uranium Ltd, Stanmore Coal Ltd, and Titan Energy Services Ltd. |

| | TONIANNE DWYER BJuris (Hons), LLB (Hons), GAICD Appointed 14 February 2013 with tenure to 30 June 2017 Board Committees • Chair, Human Resources Committee | | Tonianne Dwyer is a lawyer by profession with a career of more than 25 years in international investment and finance in both executive management and board positions. She has held senior roles with Harnbros Bank Limited, Societe Generale and Quintain Estates & Development PLC. Ms Dwyer’s executive experience covers a broad range of sectors, including real estate investment and development, financial services, health and aged care, education, research and development, and media, including a role with the finance division of the UK Department of Health. Her operational experience includes UK, Europe and Wall Street. Ms Dwyer currently holds directorships on Metcash, DEXUS Property Group, DEXUS Wholesale Property Fund and Cardno Limited. She is also a Senator at the University of Queensland. |
| | | | |
| QUEENSLAND TREASURY CORPORATION | | ANNUAL REPORT 2014-15 | | 17 |
| | | | |

| | BILL SHIELDS BEcon (Hons), MEc, MAICD Appointed 1 July 2004 with tenure to 9 July 2017 Board Committees • Member, Funding and Markets Committee | | Bill Shields has extensive experience in the banking and finance industry, as well as government policy advice, specialising in economics. His career responsibilities have included economic and financial market research, and the provision of analytical and strategic advice on the Australian financial system and monetary policy, exchange rate arrangements and international financial developments, as well as oversight of energy markets in Australia, New Zealand and Singapore. Mr Shields was previously Chief Economist and Executive Director of Macquarie Bank Limited, and has also held positions with the Reserve Bank of Australia, the International Monetary Fund, and the Australian Treasury. He was a Visiting Professor at the Macquarie Graduate School of Management and taught at the Australian Catholic University in Brisbane. He is a director of the Sydney Anglican Schools Corporation and is Chair of its Education and Strategic Development Committee. |
| | | |
 | | KAREN SMITH-POMEROY AssocDip (Accounting), MAICD, FIPA, FFIN Appointed 9 July 2015 with tenure to 9 July 2019 Board Committees • Member, Accounts and Audit Committee • Member, Funding and Markets Committee | | Karen Smith-Pomeroy is an experienced financial services senior executive with a specialty in risk and governance. She has held senior executive roles with Suncorp Group Limited (1997-2014), including Executive Director, Suncorp Group subsidiary entities (2009-2014). She has also held positions on a number of Boards and committees including Qld Department of Local Government, Community Recovery and Resilience, CS Energy Limited and Tarong Energy Corporation Limited. Ms Smith-Pomeroy is a Non-Executive Director and Risk Committee Chair of National Affordable Housing Consortium; Audit and Risk Management Committee member of the Department of Infrastructure, Local Government and Planning; and Queensland Advisory Board member of Australian Super. |
| | |
 | | JIM STENING DipFinServ, FAICD Appointed 13 November 2014 with tenure to 30 June 2017 Board Committees • Chair, Funding and Markets Committee | | Jim Stening has more than 30 years’ experience in financial markets in the fixed income asset class, including hands-on trading and investing in Australian and global capital markets. Mr Stening has extensive experience in debt markets, business development, executive management and corporate governance across a diverse range of economic cycles. He has held senior roles at NAB, Merrill Lynch and Banco Santander in addition to his role as founder and Managing Director of FIIG Securities Limited, Australia’s largest specialist fixed income firm. Mr Stening is a Non-Executive Director of FIIG Securities Limited (and related companies) and OZFish Unlimited Limited. |
| | | | |
| 18 | | ANNUAL REPORT 2014-15 | | QUEENSLAND TREASURY CORPORATION |
LONG TERM ASSET ADVISORY BOARD
The Long Term Asset Advisory Board (LTAAB) was established in July 2008, following the transfer of certain superannuation and other long-term assets from Treasury to QTC (primarily for reasons relating to market volatility).
The LTAAB has power delegated from QTC to:
| • | | manage the sufficiency of the funding of the long-term assets |
| • | | set investment objectives and strategies for the long-term assets |
| • | | set the appropriate investment structure for the long-term assets, and |
| • | | monitor investment performance of the long-term assets. |
The LTAAB holds meetings at least four times per year and held five in the year under review.
The LTAAB members are appointed by the Governor in Council, pursuant to section 10(2) of the QTC Act.
The members of LTAAB are:
| | |
Name | | Position |
| Under Treasurer | | Chairperson |
| Chief Executive, QSuper | | Member |
| Chief Executive, QTC | | Member |
| State Actuary | | Member |
| Assistant Under Treasurer | | Member |
| Assistant Under Treasurer | | Member |
| Deputy Under Treasurer | | Member |
The LTAAB has observed its terms of reference.
AUDITORS
In accordance with the provisions of the Auditor-General Act 2009, the Queensland Audit Office is the external auditor for QTC. The Queensland Audit Office has the responsibility for providing Queensland’s Parliament with assurances as to the adequacy of QTC’s discharge of its financial and administrative obligations.
QTC has an independent internal audit function that was outsourced to Ernst and Young (EY) for the 2014–15 financial year. Internal audit reports to the Accounts and Audit Committee. Internal audit is conducted under an Internal Audit Charter that is consistent with the relevant audit and ethical standards. The role of internal audit is to support QTC’s corporate governance framework by providing the Board (through the Accounts and Audit Committee) with:
| • | | assurance that QTC has effective, efficient and economical internal controls in place to support the achievement of its objectives, including the management of risk, and |
| • | | advice with respect to QTC’s internal controls and business processes. |
Internal audit is responsible for:
| • | | developing an annual audit plan, based on the assessment of financial and business risks (based on QTC’s approved significant risks and internal workshops) aligned with QTC’s strategic goals and objectives, and approved by the Accounts and Audit Committee |
| • | | providing regular audit reports and periodic program management reports to the management team and the Accounts and Audit Committee, and |
| • | | working constructively with QTC’s management team to challenge and improve established and proposed practices and to put forward ideas for process improvement. |
In the year under review, EY completed its internal audits in accordance with the approved annual audit plan.
QTC has had due regard to Treasury’s Audit Committee guidelines, in establishing and supervising its outsourced internal audit function and, together with the Accounts and Audit Committee, in overseeing and monitoring the internal audit function.
MANAGEMENT TEAM
The responsibility for the day-to-day operation and administration of QTC is delegated by the Board to the Chief Executive and the Executive Management Team. The Chief Executive is appointed by the Board. Executives are appointed by the Chief Executive. As with the Board, all Executive Management Team appointments are made on the basis of qualifications, experience, skills, strategic ability, and commitment to contribute to QTC’s performance and achievement of its corporate objectives.
QTC’s Executive Management Team 2015–16
| | |
| Philip Noble | | Chief Executive |
| Steven Tagg | | Chief Operating Officer |
| | Executive General Manager, Corporate Services |
| Sandie Angus | | Executive General Manager, Business Services |
| Grant Bush | | Executive General Manager, Funding and Markets |
| John Frazer | | Executive General Manager, Risk Analysis |
| Rupert Haywood | | Executive General Manager, Client Services |
| | | | |
| QUEENSLAND TREASURY CORPORATION | | ANNUAL REPORT 2014-15 | | 19 |
Financial Statements
For the year ended 30 June 2015
| | | | |
Statement of comprehensive income | | | 20 | |
| |
Balance sheet | | | 21 | |
| |
Statement of changes in equity | | | 22 | |
| |
Statement of cash flows | | | 23 | |
| |
Notes to the Financial Statements | | | 24 | |
| |
– Capital Markets Operations | | | 27 | |
| |
– Long Term Assets | | | 40 | |
| |
– Other Information | | | 42 | |
| |
Certificate of the Queensland Treasury Corporation | | | 45 | |
| |
Independent Auditor’s report | | | 46 | |
| |
Management report | | | 48 | |
| | | | |
| 20 | | ANNUAL REPORT 2014-15 | | QUEENSLAND TREASURY CORPORATION |
Statement of comprehensive income
For the year ended 30 June 2015
| | | | | | | | | | | | |
| | | NOTE | | | 2015
$000 | | | 2014
$000 | |
| | | |
CAPITAL MARKETS OPERATIONS | | | | | | | | | | | | |
| | | |
Net interest income | | | | | | | | | | | | |
Interest income | | | 3 | | | | 5 633 402 | | | | 6 914 445 | |
Interest expense | | | 3 | | | | (5 593 409 | ) | | | (6 814 855 | ) |
| | | | | | | 39 993 | | | | 99 590 | |
| | | |
Other income | | | | | | | | | | | | |
Fees | | | | | | | 69 774 | | | | 67 164 | |
Lease income | | | | | | | 49 586 | | | | 49 983 | |
Amortisation of cross border lease deferred income | | | | | | | 4 324 | | | | 14 322 | |
Gain on sale of property, plant and equipment | | | | | | | 12 | | | | 1 159 | |
| | | | | | | 123 696 | | | | 132 628 | |
| | | |
Expenses | | | | | | | | | | | | |
Administration expenses | | | 4 | | | | (67 333 | ) | | | (64 095 | ) |
Depreciation on leased assets | | | | | | | (32 731 | ) | | | (33 292 | ) |
Impairment on property, plant and equipment | | | 13 | | | | (12 533 | ) | | | — | |
Other | | | | | | | (27 | ) | | | (1 146 | ) |
| | | | | | | (112 624 | ) | | | (98 533 | ) |
Profit from capital markets operations before income tax | | | | | | | 51 065 | | | | 133 685 | |
Income tax expense | | | 5 | | | | (9 785 | ) | | | (14 465 | ) |
Profit from capital markets operations after income tax | | | | | | | 41 280 | | | | 119 220 | |
| | | |
LONG TERM ASSETS | | | | | | | | | | | | |
| | | |
Net return from investments in long term assets | | | | | | | | | | | | |
Net change in fair value of unit trusts | | | | | | | 2 484 580 | | | | 5 386 325 | |
Interest on fixed rate notes | | | | | | | (2 234 064 | ) | | | (2 166 897 | ) |
Management fees | | | | | | | (99 238 | ) | | | (91 471 | ) |
Profit from Long Term Assets | | | | | | | 151 278 | | | | 3 127 957 | |
| | | | | | | | | | | | |
Total net profit for the year after tax | | | | | | | 192 558 | | | | 3 247 177 | |
| | | | | | | | | | | | |
Total comprehensive income attributable to the owner | | | | | | | 192 558 | | | | 3 247 177 | |
| | | | | | | | | | | | |
Total comprehensive income derived from: | | | | | | | | | | | | |
Capital Markets Operations | | | | | | | 41 280 | | | | 119 220 | |
Long Term Assets | | | | | | | 151 278 | | | | 3 127 957 | |
| | | | | | | | | | | | |
Total comprehensive income | | | | | | | 192 558 | | | | 3 247 177 | |
| | | | | | | | | | | | |
The notes on pages 24 to 44 are an integral part of these financial statements.
Note: Throughout these financial statements the Capital Markets Operations and the Long Term Assets operations have been disclosed separately to distinguish between QTC’s main central treasury management role and its additional responsibilities following the transfer of the State’s superannuation and other long term assets (refer note 1).
| | | | |
| QUEENSLAND TREASURY CORPORATION | | ANNUAL REPORT 2014-15 | | 21 |
Balance sheet
As at 30 June 2015
| | | | | | | | | | | | |
| | | NOTE | | | 2015
$000 | | | 2014
$000 | |
| | | |
ASSETS – CAPITAL MARKETS OPERATIONS | | | | | | | | | | | | |
Cash and cash equivalents | | | 6 | | | | 2 116 642 | | | | 2 674 962 | |
Receivables | | | | | | | 4 207 | | | | 4 384 | |
Financial assets at fair value through profit or loss | | | 7 | | | | 18 368 652 | | | | 12 024 485 | |
Derivative financial assets | | | 8 | | | | 309 914 | | | | 252 543 | |
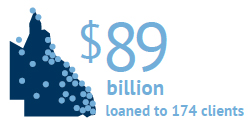
Onlendings | | | 9 | | | | 89 418 719 | | | | 85 609 405 | |
Property, plant and equipment | | | 13 | | | | 180 806 | | | | 227 558 | |
Intangible assets | | | | | | | 2 752 | | | | 2 274 | |
Deferred tax asset | | | | | | | 3 029 | | | | 3 134 | |
| | | | | | | 110 404 721 | | | | 100 798 745 | |
| | | |
ASSETS – LONG TERM ASSETS | | | | | | | | | | | | |
Financial assets at fair value through profit or loss | | | 15 | | | | 34 655 724 | | | | 33 431 249 | |
| | | | | | | 34 655 724 | | | | 33 431 249 | |
| | | | | | | | | | | | |
Total Assets | | | | | | | 145 060 445 | | | | 134 229 994 | |
| | | | | | | | | | | | |
| | | |
LIABILITIES – CAPITAL MARKETS OPERATIONS | | | | | | | | | | | | |
Payables | | | | | | | 67 094 | | | | 148 167 | |
Derivative financial liabilities | | | 8 | | | | 428 093 | | | | 344 827 | |
Financial liabilities at fair value through profit or loss | | | | | | | | | | | | |
- Interest bearing liabilities | | | 10 | | | | 101 431 958 | | | | 94 026 880 | |
- Deposits | | | 10 | | | | 7 724 892 | | | | 5 477 942 | |
Other liabilities | | | | | | | 42 151 | | | | 90 676 | |
| | | | | | | 109 694 188 | | | | 100 088 492 | |
| | | |
LIABILITIES – LONG TERM ASSETS | | | | | | | | | | | | |
Financial liabilities at amortised cost | | | | | | | 33 056 371 | | | | 31 983 174 | |
| | | | | | | 33 056 371 | | | | 31 983 174 | |
| | | | | | | | | | | | |
Total Liabilities | | | | | | | 142 750 559 | | | | 132 071 666 | |
| | | | | | | | | | | | |
| | | |
NET ASSETS | | | | | | | 2 309 886 | | | | 2 158 328 | |
| | | |
EQUITY – CAPITAL MARKETS OPERATIONS | | | | | | | | | | | | |
Retained surplus | | | | | | | 710 533 | | | | 710 253 | |
| | | | | | | 710 533 | | | | 710 253 | |
| | | |
EQUITY – LONG TERM ASSETS | | | | | | | | | | | | |
Retained surplus | | | | | | | 1 599 353 | | | | 1 448 075 | |
| | | | | | | 1 599 353 | | | | 1 448 075 | |
| | | | | | | | | | | | |
Total Equity | | | | | | | 2 309 886 | | | | 2 158 328 | |
| | | | | | | | | | | | |
The notes on pages 24 to 44 are an integral part of these financial statements.
| | | | |
| 22 | | ANNUAL REPORT 2014-15 | | QUEENSLAND TREASURY CORPORATION |
Statement of changes in equity
For the year ended 30 June 2015
| | | | | | | | | | | | | | | | |
| | | NOTE | | | CAPITAL
MARKETS
OPERATIONS | | | LONG TERM
ASSETS | | | | |
| | | | | | RETAINED
SURPLUS
$000 | | | RETAINED
SURPLUS
$000 | | | TOTAL
EQUITY
$000 | |
Balance at 1 July 2013 | | | | | | | 711 033 | | | | (1 679 882 | ) | | | (968 849 | ) |
Profit for the year | | | | | | | 119 220 | | | | 3 127 957 | | | | 3 247 177 | |
Transactions with owners in their capacity as owners: | | | | | | | | | | | | | | | | |
Dividends provided for or paid | | | 23 | | | | (120 000 | ) | | | — | | | | (120 000 | ) |
Balance at 30 June 2014 | | | | | | | 710 253 | | | | 1 448 075 | | | | 2 158 328 | |
| | | | |
Balance at 1 July 2014 | | | | | | | 710 253 | | | | 1 448 075 | | | | 2 158 328 | |
Profit for the year | | | | | | | 41 280 | | | | 151 278 | | | | 192 558 | |
Transactions with owners in their capacity as owners: | | | | | | | | | | | | | | | | |
Dividends provided for or paid | | | 23 | | | | (41 000 | ) | | | — | | | | (41 000 | ) |
Balance at 30 June 2015 | | | | | | | 710 533 | | | | 1 599 353 | | | | 2 309 886 | |
The notes on pages 24 to 44 are an integral part of these financial statements.
| | | | |
| QUEENSLAND TREASURY CORPORATION | | ANNUAL REPORT 2014-15 | | 23 |
Statement of cash flows
For the year ended 30 June 2015
| | | | | | | | | | | | |
| | | NOTE | | | 2015
$000 | | | 2014
$000 | |
| | | |
CAPITAL MARKETS OPERATIONS | | | | | | | | | | | | |
| | | |
Cash flows from operating activities | | | | | | | | | | | | |
Interest received from onlendings | | | | | | | 4 200 081 | | | | 4 181 238 | |
Interest received from investments | | | | | | | 530 259 | | | | 806 737 | |
Interest received - other | | | | | | | 49 586 | | | | 50 089 | |
Fees received | | | | | | | 69 495 | | | | 66 934 | |
GST paid to suppliers | | | | | | | (11 987 | ) | | | (9 050 | ) |
GST refunds from ATO | | | | | | | 11 996 | | | | 10 048 | |
GST paid to ATO | | | | | | | (5 898 | ) | | | (6 355 | ) |
GST received from clients | | | | | | | 10 345 | | | | 6 357 | |
Interest paid on interest-bearing liabilities | | | | | | | (4 085 107 | ) | | | (4 442 515 | ) |
Interest paid on deposits | | | | | | | (201 372 | ) | | | (172 857 | ) |
Administration expenses paid | | | | | | | (64 232 | ) | | | (60 090 | ) |
Income tax paid | | | | | | | (15 467 | ) | | | (15 635 | ) |
Net cash provided by operating activities | | | 14 | | | | 487 699 | | | | 414 901 | |
| | | |
Cash flows from investing activities | | | | | | | | | | | | |
Proceeds from sale of investments | | | | | | | 39 170 204 | | | | 36 647 908 | |
Payments for investments | | | | | | | (45 424 720 | ) | | | (30 471 584 | ) |
Net onlendings | | | | | | | (2 919 503 | ) | | | (4 212 638 | ) |
Payments for property, plant and equipment | | | | | | | (414 | ) | | | (11 245 | ) |
Payments for intangibles | | | | | | | (2 502 | ) | | | (252 | ) |
Proceeds from sale of property, plant and equipment | | | | | | | 11 | | | | 4 595 | |
Dividend received | | | | | | | — | | | | 261 | |
Net cash (used in) / provided by investing activities | | | | | | | (9 176 924 | ) | | | 1 957 045 | |
| | | |
Cash flows from financing activities | | | | | | | | | | | | |
Proceeds from interest-bearing liabilities | | | | | | | 38 076 222 | | | | 55 621 832 | |
Repayment of interest-bearing liabilities | | | | | | | (32 072 581 | ) | | | (56 386 648 | ) |
Net deposits | | | | | | | 2 247 264 | | | | (649 842 | ) |
Dividends paid | | | | | | | (120 000 | ) | | | — | |
Net cash provided by / (used in) financing activities | | | | | | | 8 130 905 | | | | (1 414 658 | ) |
| | | |
Net (decrease)/increase in cash and cash equivalents held | | | | | | | (558 320 | ) | | | 957 288 | |
Cash and cash equivalents at 1 July | | | | | | | 2 674 962 | | | | 1 717 674 | |
Cash and cash equivalents at 30 June | | | | | | | 2 116 642 | | | | 2 674 962 | |
| | | |
LONG TERM ASSETS | | | | | | | | | | | | |
No external cash flow is generated from the long term assets (refer note 1). | | | | | | | | | | | | |
The notes on pages 24 to 44 are an integral part of these financial statements.
| | | | |
| 24 | | ANNUAL REPORT 2014-15 | | QUEENSLAND TREASURY CORPORATION |
Notes to the Financial Statements
For the year ended 30 June 2015
| | | | | | |
CONTENTS | |
| 1 | | General information | | | 24 | |
| | |
| 2 | | Summary of significant accounting policies | | | 24 | |
| |
Capital Markets Operations | | | | |
| | |
| 3 | | Interest income and interest expense | | | 27 | |
| | |
| 4 | | Administration expenses | | | 28 | |
| | |
| 5 | | Income tax expense | | | 28 | |
| | |
| 6 | | Cash and cash equivalents | | | 29 | |
| | |
| 7 | | Financial assets at fair value through profit or loss | | | 29 | |
| | |
| 8 | | Derivative financial assets and derivative financial liabilities | | | 29 | |
| | |
| 9 | | Onlendings | | | 30 | |
| | |
| 10 | | Financial liabilities at fair value through profit or loss | | | 30 | |
| | |
| 11 | | Financial risk management | | | 32 | |
| | |
| 12 | | Fair value hierarchy | | | 37 | |
| | |
| 13 | | Property, plant and equipment | | | 38 | |
| | |
| 14 | | Notes to the statement of cash flows | | | 39 | |
| |
Long Term Assets | | | | |
| | |
| 15 | | Financial assets at fair value through profit or loss | | | 40 | |
| | |
| 16 | | Financial risk management | | | 40 | |
| | |
| 17 | | Fair value hierarchy | | | 41 | |
| |
Other Information | | | | |
| | |
| 18 | | Contingent liabilities | | | 42 | |
| | |
| 19 | | Related party transactions | | | 42 | |
| | |
| 20 | | Key management personnel | | | 42 | |
| | |
| 21 | | Auditor’s remuneration | | | 44 | |
| | |
| 22 | | Investments in companies | | | 44 | |
| | |
| 23 | | Dividends | | | 44 | |
| | |
| 24 | | Events subsequent to balance date | | | 44 | |
Queensland Treasury Corporation (QTC) is constituted under the Queensland Treasury Corporation Act 1988 (the Act), with the Under Treasurer designated as the Corporation Sole under section 5 (2) of the Act.
As the Queensland Government’s central financing authority, QTC plays a pivotal role in securing the State’s financial success. With a focus on whole-of-State outcomes, QTC provides a range of financial services to the State and its public sector entities, including local governments. These services include debt funding and management, cash management facilities, financial risk management advisory services, and specialist public finance education.
These services, which form part of QTC’s Capital Markets Operations segment, are undertaken on a cost-recovery basis with QTC lending at an interest rate based on its cost of funds and with the benefits/costs of liability and asset management being passed on to its clients being Queensland public sector entities. However QTC’s Capital Markets Operations can generate a profit largely reflecting the interest earned from the investment of its equity. In undertaking its Capital Markets activities, QTC maintains adequate capital to manage its risks.
QTC holds a portfolio of assets which were transferred to QTC by the State Government. These assets are the investments of QTC’s Long Term Assets segment and are held to fund superannuation and other long-term obligations of the State such as insurance and long service leave. In return, QTC has issued to the State fixed rate notes with an interest rate of 7.1 per cent (reducing to 7.0 per cent from 1 July 2015) which is the expected long term average rate of return on the portfolio. This has resulted in the State receiving a fixed rate of return on the notes, while QTC bears the impact of fluctuations in the value and returns on the asset portfolio.
The Long Term Asset Advisory Board is responsible for the oversight of the Long Term Assets which do not form part of QTC’s day-to-day Capital Markets Operations. The Long Term Assets are held in unit trusts managed by QIC Limited (QIC).
The accounting policies for each operating segment are applied consistently.
| 2 | SUMMARY OF SIGNIFICANT ACCOUNTING POLICIES |
These general purpose financial statements for the year ended 30 June 2015 have been prepared in accordance with the requirements of the Financial Accountability Act 2009 and Australian Accounting Standards adopted by the Australian Accounting Standards Board.
Compliance with International Financial Reporting Standards
QTC’s financial statements comply with International Financial Reporting Standards (IFRS) as issued by the International Accounting Standards Board. While QTC is designated as a not-for-profit entity, the Corporation has elected to comply with the requirements of IFRS as if it is a for-profit entity.
Changes in accounting policy, disclosures, standards and interpretations
The accounting policies adopted are consistent with those of the previous financial year except as follows:
| • | | Cash and cash equivalents: QTC has amended the classification of cash and cash equivalents to include money market deposits. The change has resulted in a closer alignment of cash and cash equivalents under AASB 107 Statement of Cash Flows which defines cash and cash equivalents as ‘comprising cash on hand and demand deposits including short term highly liquid investments that are readily convertible to known amounts of cash’. Comparative figures within the Balance Sheet and Statement of Cash Flows have been adjusted to reflect this change. |
New accounting standards: A number of new and amended accounting standards were mandatory from 1 July 2014. While these new and amended standards may have resulted in disclosure changes, there has been no change to the amounts recognised in these statements.
Standards and interpretations not yet adopted: Certain new accounting standards have been published that are not mandatory for the current reporting period. The Corporation’s assessment of the impact of material changes from these standards and interpretations are set out below.
Effective for annual periods beginning on or after 1 January 2017:
| • | | AASB 15 Revenue from Contracts with Customers will replace AASB 111 Construction Contracts and AASB 118 Revenue. This standard establishes principles for reporting information about the nature, amount, timing and uncertainty of revenue and cash flows arising from an entity’s contracts with customers. The introduction of this standard is not expected to change the way QTC currently recognises revenue. |
Effective for annual periods beginning on or after 1 January 2018:
| • | | AASB 9 Financial Instruments will replace AASB 139 Financial Instruments: Recognition and measurement. The new standard specifies new classification and measurement requirements for financial assets and financial liabilities within the scope of AASB 139. The amendments require financial assets to be measured at fair value through profit or loss unless they meet the criteria for amortised cost measurement. For financial liabilities, AASB 9 has largely adopted the classification and measurement criteria currently contained in AASB 139. Under the revised standard, any change in fair value attributable to an entity’s own credit risk is to be shown in other comprehensive income, not as part of profit or loss. An exemption applies to entities which have offsetting risk profiles which allows QTC to measure both financial assets and financial liabilities at fair value through profit or loss. Therefore the new standard is not expected to change the current practice of measuring changes in fair value movements of financial instruments through profit or loss. |
Other than as noted above, the adoption of various Australian Accounting Standards and Interpretations on issue but not yet effective is not expected to have a material impact on the financial statements of the Corporation. However, the pronouncements may result in minor changes to how information is currently disclosed.
| | | | |
| QUEENSLAND TREASURY CORPORATION | | ANNUAL REPORT 2014-15 | | 25 |
Basis of measurement
The financial statements are prepared on the basis of fair value measurement of assets and liabilities except where otherwise stated.
Functional and presentation currency: These financial statements are presented in Australian dollars which is QTC’s functional currency.
Classification of assets and liabilities: The balance sheet is presented on a liquidity basis. Assets and liabilities are presented in decreasing order of liquidity and are not distinguished between current and non-current.
Foreign currency transactions are initially translated into Australian dollars at the rate of exchange applying at the date of the transaction. At balance date, amounts payable to and by QTC in foreign currencies have been valued using current exchange rates after taking into account interest rates and accrued interest.
Exchange gains/losses are brought to account in the statement of comprehensive income.
| (c) | Cash and cash equivalents |
Cash and cash equivalents include cash on hand and money market deposits.
| (d) | Financial assets and financial liabilities |
Recognition and derecognition
Financial assets and financial liabilities are recognised in the balance sheet when QTC becomes party to the contractual provisions of the financial instrument which is the settlement date of the transaction.
A financial asset is derecognised when the contractual rights to the cash flows from the financial assets expire or are transferred and no longer controlled by QTC.
A financial liability is removed from the balance sheet when the obligation specified in the contract is discharged, cancelled or expires.
Measurement
Financial assets and liabilities at fair value through profit or loss are measured at fair value by reference to quoted market exit prices when available. If quoted market prices are not available, then fair values are estimated on the basis of pricing models or other recognised valuation techniques with consideration for the effect of counterparty credit.
Fair value is the amount for which an asset could be exchanged or liability settled between knowledgeable, willing parties in an arm’s length transaction.
QTC uses mid-market rates as the basis for establishing fair values of quoted financial instruments with offsetting risk positions. In general, the risk characteristics of funds borrowed, together with the financial derivatives used to manage interest rate and foreign currency risks, closely match those of funds onlent. In all other cases, the bid-offer spread is applied where material.
Financial liabilities at amortised cost are measured using the effective interest method. The effective interest method is a method of calculating the amortised cost of a financial instrument and allocating the interest income or interest expense over the relevant period. In this way, interest is recognised in the statement of comprehensive income in the period in which it accrues.
Classification–Capital Markets Operations
Financial instruments on initial recognition are classified into the following categories:
| • | | Derivative financial instruments |
| • | | Financial assets at fair value through profit or loss, and |
| • | | Financial liabilities at fair value through profit or loss |
QTC’s accounting policies for significant financial assets and financial liabilities are listed below.
Onlendings
Onlendings are included in the balance sheet at market or fair value which is the redemption value.
Derivative financial instruments
QTC uses derivative financial instruments to hedge its exposure to interest rate, foreign currency and credit risks as part of asset and liability management activities. In addition they may be used to deliver long term floating rate or long term fixed rate exposure.
All derivatives are carried as assets when fair value is positive and as liabilities when fair value is negative.
Financial assets at fair value through profit or loss
Financial assets at fair value through profit or loss include investments in discount securities, semi-government bonds and floating rate notes. Unrealised gains and losses are brought to account in the statement of comprehensive income.
Financial liabilities at fair value through profit or loss
Financial liabilities at fair value through profit or loss include interest-bearing liabilities and deposits. Unrealised gains and losses are brought to account in the statement of comprehensive income.
| • | | Interest-bearing liabilities |
Interest-bearing liabilities mainly consist of Australian and overseas bonds. Australian bonds include QTC’s domestic, capital indexed and public bonds. Overseas bonds include global bonds and Eurobonds. Global bonds are Australian dollar denominated bonds issued overseas.
Client deposits are accepted to either the Working Capital Facility (11AM Fund) or the QTC Cash Fund. Income derived from the investment of these deposits accrues to depositors daily. The amount shown in the balance sheet represents the market value of deposits held at balance date. Collateral held and securities which are sold under agreements to repurchase are disclosed as deposits.
Classification–Long Term Assets
Financial instruments on initial recognition are classified into the following categories:
| • | | Financial assets at fair value through profit or loss, and |
| • | | Financial liabilities at amortised cost. |
QTC’s accounting policies for significant financial assets and financial liabilities are listed below.
Financial assets at fair value through profit or loss: Financial assets at fair value through profit or loss include investments held in unit trusts.
| • | | Investments in unit trusts |
Investments in unit trusts consist of investments held and managed by QIC and include cash, Australian equities, international equities and other diversified products (refer note 15). These investments are measured at market value based on the hard close unit price quoted by QIC adjusted for fees outstanding on the account and net of any GST recoverable.
Financial liabilities at amortised cost: Financial liabilities at amortised cost consist of fixed rate notes issued to the State Government in exchange for a portfolio of assets. The fixed rate notes are initially recognised at par value, which equated to the fair value of the financial assets acquired. Deposits and withdrawals can be made from the notes based on changes in the State Government’s long-term liabilities. The notes have a term of 50 years. Interest on the fixed rate notes is capitalised monthly and the rate is reviewed annually.
| (e) | Interest income and interest expense |
The recognition of investment income and borrowing costs includes net realised gains/losses from the sale of investments (interest income) and the pre-redemption of borrowings (interest expense) together with the net unrealised gains/losses arising from holding investments and certain onlendings (interest income) and net unrealised gains/losses from borrowings (interest expense). These unrealised gains/losses are a result of revaluing to market daily. The majority of onlendings are provided to clients on a pooled basis. Interest costs are allocated to clients based on the daily movement in the market value of the pool.
QTC enters into a range of transactions with counterparties which require the lodgement of collateral subject to agreed market thresholds. Where these thresholds are exceeded, QTC may be required to either pledge assets to, or be entitled to receive pledged assets from, the counterparty to secure these transactions. The assets pledged or received are primarily in the form of cash.
| (g) | Offsetting financial instruments |
QTC offsets financial assets and liabilities where there is a legally enforceable right to set-off, and there is an intention to settle on a net basis or to realise the asset and settle the liability simultaneously (refer note 11).
| | | | |
| 26 | | ANNUAL REPORT 2014-15 | | QUEENSLAND TREASURY CORPORATION |
Securities sold under agreements to repurchase at an agreed price are retained within the financial assets at fair value through profit or loss category while the obligation to repurchase is disclosed as a deposit.
Lease income from operating leases where QTC is the lessor is recognised as income on a straight line basis over the lease term.
| (j) | Cross border leases - income recognition |
Income received on cross border leases is deferred and amortised over the term of the lease.
Fee income includes:
| • | | Management fee income which represents income earned from the management of QTC’s onlendings and deposits recognised on an accrual basis when the service has been provided; and |
| • | | Professional fees which are recognised to the extent that it is probable that the economic benefits will flow to QTC, regardless of when payment is expected. In determining the extent to which revenue is recognised, QTC takes into account the size and nature of the transaction and whether it is acting as principal or agent. Where QTC is assessed as acting as an agent in a transaction, having passed on all associated significant risks and rewards to the principal, QTC would offset any costs and associated recovery in the financial statements. |
Unless otherwise determined by the Governor in Council, the Queensland Treasury Corporation Act 1988 requires that all profits shall accrue to the benefit of the State Consolidated Fund and all losses shall be the responsibility of the State Consolidated Fund.
| (m) | Property, plant and equipment |
Property, plant and equipment are measured at cost less accumulated depreciation and accumulated impairment losses. Depreciation is calculated on a straight line basis over the estimated useful life of the assets.
Depreciation rates for each class of asset are as follows:
| | | | |
Asset class | | Depreciation rate | |
Information technology & office equipment | | | 6 – 40 | % |
Plant and machinery | | | 10 – 30 | % |
The assets’ residual values, useful lives and depreciation methods are reviewed and adjusted, if appropriate, at each financial year end.
Acquired computer software licences are capitalised on the basis of the costs incurred to acquire and bring to use the specific software. These costs are amortised over their estimated useful lives which are between two and five years.
Computer software development costs recognised as assets are amortised on a straight-line basis over the period of expected benefit, which is usually between three and ten years. The amount of fully depreciated software at balance date totalled $7.701 million (2014: $2.679 million).
The carrying values of non-financial assets are reviewed at each reporting date or where there is an indication of impairment. For the purpose of impairment testing, assets are grouped by the lowest level of Cash-Generating Unit (CGU) applicable with impairment losses recorded in the statement of comprehensive income.
If an indicator of possible impairment exists, the asset’s recoverable amount is determined. Any amount by which the asset’s carrying amount exceeds the recoverable amount is recorded as an impairment loss. The asset’s recoverable amount is determined as the higher of the asset’s fair value less costs of disposal or value in use.
In assessing value in use, the estimated future cash flows are discounted to their present value using a discount rate that reflects current market assessments of the time value of money and the risks specific to the CGU.
QTC is exempt from the payment of income tax under section 50-25 of the Income Tax Assessment Act 1997 (as amended).
QTC makes a payment in lieu of income tax to the Queensland Government’s Consolidated Fund. The calculation of the income tax liability is based on the income of certain activities controlled by QTC’s Capital Markets Operations. No income tax is payable on the Long Term Assets segment.
A liability is recognised for benefits accruing to employees in respect of salaries, annual leave, long service leave and short-term incentives based on the amount expected to be paid where there is a present or constructive obligation to pay this amount as a result of past service and the obligation is capable of being measured reliably. These are measured on an undiscounted basis where the amounts are expected to be paid within the next 12 months. For amounts where the payment date is expected to exceed 12 months such as long service leave, future pay increases are projected and then discounted using a high quality bond rate. As sick leave is non-vesting, this is recognised as and when this leave is taken.
Amounts have been rounded to the nearest thousand dollars except for notes 20 and 21, which are in whole dollars.
Where necessary, comparative figures have been adjusted to conform with changes in presentation in the current year.
| (t) | Judgements and assumptions |
The preparation of the financial statements requires the use of accounting estimates. The areas involving a higher degree of judgement or complexity, or areas where assumptions or estimates may be significant to the financial statements are shown below:
Fair value of financial assets and financial liabilities: Financial assets and financial liabilities at fair value through profit or loss are measured at fair value by reference to quoted market prices where available. The fair value of financial instruments that are not traded in an active market is determined by reference to market quotes for similar instruments or by use of valuation techniques. Judgement may be needed in selecting valuation methods or assumptions where an active market quote is not available.
Estimates and underlying assumptions are reviewed on an ongoing basis. Revisions to accounting estimates are recognised in the period in which the estimate is revised and in any future period affected.
| | | | |
| QUEENSLAND TREASURY CORPORATION | | ANNUAL REPORT 2014-15 | | 27 |
Notes to the Financial Statements Capital Markets Operations
For the year ended 30 June 2015
| 3 | INTEREST INCOME AND INTEREST EXPENSE |
| | | | | | | | | | | | | | | | |
| | | FOR THE YEAR ENDED 30 JUNE 2015 | |
| | | Interest
$000 | | | Net unrealised
gain/loss
$000 | | | Net realised
gain/loss
$000 | | | Total interest
$000 | |
| | | | |
Interest income | | | | | | | | | | | | | | | | |
Cash and cash equivalents | | | 17 224 | | | | — | | | | — | | | | 17 224 | |
Financial assets through profit or loss | | | 474 102 | | | | 16 376 | | | | 58 032 | | | | 548 510 | |
Derivative financial assets | | | 10 059 | | | | (76 106 | ) | | | 43 065 | | | | (22 982 | ) |
Onlendings* | | | 4 203 342 | | | | 887 308 | | | | — | | | | 5 090 650 | |
| | | | | | | | | | | | | | | | |
Total interest income | | | 4 704 727 | | | | 827 578 | | | | 101 097 | | | | 5 633 402 | |
| | | | | | | | | | | | | | | | |
| | | | |
Interest expense | | | | | | | | | | | | | | | | |
Financial liabilities through profit or loss | | | | | | | | | | | | | | | | |
- Short Term | | | 135 374 | | | | 47 632 | | | | — | | | | 183 006 | |
- Long Term | | | 3 331 528 | | | | 1 728 479 | | | | (6 903 | ) | | | 5 053 104 | |
Derivative financial liabilities | | | 212 663 | | | | (110 563 | ) | | | 24 747 | | | | 126 847 | |
Deposits | | | 200 980 | | | | 78 | | | | — | | | | 201 058 | |
Other expenses | | | 29 394 | | | | — | | | | — | | | | 29 394 | |
| | | | | | | | | | | | | | | | |
Total interest expense | | | 3 909 939 | | | | 1 665 626 | | | | 17 844 | | | | 5 593 409 | |
| | | | | | | | | | | | | | | | |
| | | | | | | | | | | | | | | | |
| | | FOR THE YEAR ENDED 30 JUNE 2014 | |
| | | Interest
$000 | | | Net unrealised
gain/loss
$000 | | | Net realised
gain/loss
$000 | | | Total interest
$000 | |
| | | | |
Interest income | | | | | | | | | | | | | | | | |
Cash and cash equivalents | | | 33 230 | | | | 2 | | | | — | | | | 33 232 | |
Financial assets through profit or loss | | | 417 154 | | | | 37 466 | | | | 14 124 | | | | 468 744 | |
Derivative financial assets | | | 11 841 | | | | (52 482 | ) | | | 76 326 | | | | 35 685 | |
Onlendings* | | | 4 175 727 | | | | 2 201 057 | | | | — | | | | 6 376 784 | |
| | | | | | | | | | | | | | | | |
Total interest income | | | 4 637 952 | | | | 2 186 043 | | | | 90 450 | | | | 6 914 445 | |
| | | | | | | | | | | | | | | | |
| | | | |
Interest expense | | | | | | | | | | | | | | | | |
Financial liabilities through profit or loss | | | | | | | | | | | | | | | | |
- Short Term | | | 64 960 | | | | (10 409 | ) | | | 57 | | | | 54 608 | |
- Long Term | | | 3 537 832 | | | | 2 015 178 | | | | 715 611 | | | | 6 268 621 | |
Deposits | | | 173 093 | | | | (147 | ) | | | — | | | | 172 946 | |
Derivative financial liabilities | | | 31 272 | | | | 206 234 | | | | 46 986 | | | | 284 492 | |
Other expenses | | | 34 188 | | | | — | | | | — | | | | 34 188 | |
| | | | | | | | | | | | | | | | |
Total interest expense | | | 3 841 345 | | | | 2 210 856 | | | | 762 654 | | | | 6 814 855 | |
| | | | | | | | | | | | | | | | |
| * | The majority of onlendings are provided to clients on a pooled fund basis. Interest costs are allocated to clients based on the daily movement in the market value of the pooled fund. In periods of falling interest rates, the market value of the funding pool will rise leading to higher interest income from onlendings. During the year ended 30 June 2015, interest rates fell, however not to the same extent as in the previous year when the fall in long term rates was greater, resulting in higher interest income in 2014. |
| | | | |
| 28 | | ANNUAL REPORT 2014-15 | | QUEENSLAND TREASURY CORPORATION |
Notes to the Financial Statements Capital Markets Operations
For the year ended 30 June 2015
| | | | | | | | |
| | | 2015
$000 | | | 2014
$000 | |
Salaries and related costs | | | 38 790 | | | | 37 352 | |
Superannuation contributions | | | 4 120 | | | | 3 649 | |
Contractors | | | 5 245 | | | | 2 280 | |
Consultants’ fees | | | 2 110 | | | | 3 676 | |
Information and registry services | | | 2 216 | | | | 2 236 | |
Depreciation on property, plant and equipment | | | 1 913 | | | | 1 904 | |
Amortisation on intangible assets | | | 2 013 | | | | 2 167 | |
Information and communication technology | | | 2 866 | | | | 2 489 | |
Property charges | | | 3 927 | | | | 3 650 | |
External audit fees | | | 384 | | | | 414 | |
Internal audit fees | | | 395 | | | | 486 | |
Staff training and development | | | 658 | | | | 649 | |
Investor and market relations program | | | 346 | | | | 450 | |
Other administration expenses | | | 2 350 | | | | 2 693 | |
| | | 67 333 | | | | 64 095 | |
| | | | | | | | |
| | | 2015
$000 | | | 2014
$000 | |
Current tax | | | 9 679 | | | | 15 467 | |
Deferred tax expense | | | 106 | | | | (1 002 | ) |
Total income tax expense recognised in the current year | | | 9 785 | | | | 14 465 | |
Deferred income tax included in income tax expense comprises: | | | | | | | | |
Decrease/(increase) in deferred tax assets | | | 106 | | | | (1 002 | ) |
| | | 106 | | | | (1 002 | ) |
| | |
Numerical reconciliation between income tax expense and pre-tax accounting profit | | | | | | | | |
Profit for the year | | | 202 343 | | | | 3 261 642 | |
Less profit from non-taxable pools: | | | | | | | | |
Capital markets operations | | | (18 471 | ) | | | (86 886 | ) |
Long term assets | | | (151 278 | ) | | | (3 127 957 | ) |
Operating profit from taxable pools | | | 32 594 | | | | 46 799 | |
Tax at the Australian tax rate of 30% on taxable pools | | | 9 778 | | | | 14 040 | |
Effect of non-deductible items: | | | | | | | | |
Loss from non-taxable entity | | | — | | | | 344 | |
Other | | | 7 | | | | 81 | |
Income tax expense | | | 9 785 | | | | 14 465 | |
| | | | |
| QUEENSLAND TREASURY CORPORATION | | ANNUAL REPORT 2014-15 | | 29 |
Notes to the Financial Statements Capital Markets Operations
For the year ended 30 June 2015
| 6 | CASH AND CASH EQUIVALENTS |
| | | | | | | | |
| | | 2015 | | | 2014 | |
| | | $000 | | | $000 | |
Cash at bank | | | 40 | | | | 546 | |
Money market deposits | | | 2 116 602 | | | | 2 674 416 | |
| | | 2 116 642 | | | | 2 674 962 | |
| 7 | FINANCIAL ASSETS AT FAIR VALUE THROUGH PROFIT OR LOSS |
| | | | | | | | |
| | | 2015 | | | 2014 | |
| | | $000 | | | $000 | |
Discount securities | | | 5 539 737 | | | | 4 738 190 | |
Commonwealth and state securities (1) | | | 1 181 253 | | | | 1 151 874 | |
Floating rate notes | | | 6 065 543 | | | | 4 105 618 | |
Term deposits | | | 4 119 685 | | | | 729 476 | |
Other investments | | | 1 462 434 | | | | 1 299 327 | |
| | | 18 368 652 | | | | 12 024 485 | |
| (1) | QTC maintains holdings of its own stocks. These holdings are netted off and therefore excluded from financial assets and financial liabilities at fair value through profit or loss. |
As at 30 June 2015, $6,321.5 million (2014: $5,083.1 million) of financial assets will mature after more than 12 months.
| 8 | DERIVATIVE FINANCIAL ASSETS AND DERIVATIVE FINANCIAL LIABILITIES |
| | | | | | | | |
| | | 2015 | | | 2014 | |
| | | $000 | | | $000 | |
| | |
Derivative financial assets | | | | | | | | |
Interest rate swaps | | | 142 098 | | | | 32 701 | |
Cross currency swaps | | | 166 545 | | | | 180 966 | |
Forward rate agreements | | | — | | | | 38 704 | |
Foreign exchange contracts | | | 1 271 | | | | 172 | |
| | | 309 914 | | | | 252 543 | |
| | |
Derivative financial liabilities | | | | | | | | |
Interest rate swaps | | | 290 445 | | | | 167 855 | |
Cross currency swaps | | | 136 298 | | | | 112 149 | |
Foreign exchange contracts | | | 1 350 | | | | 64 823 | |
| | | 428 093 | | | | 344 827 | |
Net derivatives | | | (118 179 | ) | | | (92 284 | ) |
As at 30 June 2015, $-106.6 million (2014: -$27.9 million) of these derivatives have maturity dates exceeding 12 months.
| | | | |
| 30 | | ANNUAL REPORT 2014-15 | | QUEENSLAND TREASURY CORPORATION |
Notes to the Financial Statements Capital Markets Operations
For the year ended 30 June 2015
| | | | | | | | |
| | | 2015 | | | 2014 | |
| | | $000 | | | $000 | |
Government departments and agencies | | | 44 938 644 | | | | 42 933 073 | |
Government owned corporations | | | 20 078 008 | | | | 19 053 525 | |
Local governments | | | 6 900 944 | | | | 7 478 377 | |
Statutory bodies | | | 17 044 296 | | | | 15 680 569 | |
QTC related entities | | | 148 302 | | | | 157 520 | |
Other bodies | | | 308 525 | | | | 306 341 | |
| | | 89 418 719 | | | | 85 609 405 | |
As at 30 June 2015, $88,813.2 million (2014 $84,531.6 million) of repayments are expected to be received after more than 12 months.
| 10 | FINANCIAL LIABILITIES AT FAIR VALUE THROUGH PROFIT OR LOSS |
| | | | | | | | |
| | | 2015 | | | 2014 | |
| | | $000 | | | $000 | |
| | |
Interest-bearing liabilities | | | | | | | | |
Short-term | | | | | | | | |
Treasury notes | | | 4 879 372 | | | | 2 152 166 | |
Commercial paper | | | 277 726 | | | | 2 223 522 | |
| | | 5 157 098 | | | | 4 375 688 | |
Long-term | | | | | | | | |
AUD Bonds | | | 87 283 039 | | | | 83 123 358 | |
Floating rate notes | | | 7 076 527 | | | | 4 433 159 | |
Global AUD Bonds(1) | | | 516 741 | | | | 766 982 | |
Medium-term notes | | | 1 147 701 | | | | 1 104 502 | |
Other | | | 250 852 | | | | 223 191 | |
| | | 96 274 860 | | | | 89 651 192 | |
| | | | | | | | |
Total interest-bearing liabilities | | | 101 431 958 | | | | 94 026 880 | |
| | | | | | | | |
| (1) | Consists of AUD denominated bonds which are borrowed in the United States and Euro markets. |
Derivatives are used to hedge offshore borrowings resulting in no net exposure to any foreign currency. Details of QTC’s exposure to foreign currencies and the derivatives used to hedge this exposure are disclosed in note 11(a) (i).
QTC borrowings are guaranteed by the Queensland Government under the Queensland Treasury Corporation Act 1988.
As at 30 June 2015, $81,794.9 million (2014 $78,451.9 million) of debt securities are expected to be settled after more than 12 months.
| | | | |
| QUEENSLAND TREASURY CORPORATION | | ANNUAL REPORT 2014-15 | | 31 |
Notes to the Financial Statements Capital Markets Operations
For the year ended 30 June 2015
The difference between the carrying amount of financial liabilities and the amount contractually required to be paid at maturity to the holder of the obligation is set out in the following table:
| 10 | FINANCIAL LIABILITIES AT FAIR VALUE THROUGH PROFIT OR LOSS CONTINUED |
| | | | | | | | | | | | |
| | | | | | REPAYMENT | | | | |
| | | FAIR VALUE | | | AT MATURITY | | | DIFFERENCE | |
AS AT 30 JUNE 2015 | | $000 | | | $000 | | | $000 | |
| | | |
Interest-bearing liabilities | | | | | | | | | | | | |
Short-term | | | | | | | | | | | | |
Treasury notes | | | 4 879 372 | | | | 4 900 000 | | | | (20 628 | ) |
Commercial paper | | | 277 726 | | | | 277 909 | | | | (183 | ) |
| | | 5 157 098 | | | | 5 177 909 | | | | (20 811 | ) |
Long-term | | | | | | | | | | | | |
AUD Bonds | | | 87 283 039 | | | | 77 752 097 | | | | 9 530 942 | |
Floating rate notes | | | 7 076 527 | | | | 7 055 000 | | | | 21 527 | |
Global AUD Bonds | | | 516 741 | | | | 486 682 | | | | 30 059 | |
Medium-term notes | | | 1 147 701 | | | | 1 000 288 | | | | 147 413 | |
Other | | | 250 852 | | | | 244 868 | | | | 5 984 | |
| | | 96 274 860 | | | | 86 538 935 | | | | 9 735 925 | |
| | | | | | | | | | | | |
Total interest-bearing liabilities | | | 101 431 958 | | | | 91 716 844 | | | | 9 715 114 | |
| | | | | | | | | | | | |
| | | |
| | | | | | REPAYMENT | | | | |
| | | FAIR VALUE | | | AT MATURITY | | | DIFFERENCE | |
AS AT 30 JUNE 2014 | | $000 | | | $000 | | | $000 | |
| | | |
Interest-bearing liabilities | | | | | | | | | | | | |
Short-term | | | | | | | | | | | | |
Treasury notes | | | 2 152 166 | | | | 2 164 000 | | | | (11 834 | ) |
Commercial paper | | | 2 223 522 | | | | 2 224 995 | | | | (1 473 | ) |
| | | 4 375 688 | | | | 4 388 995 | | | | (13 307 | ) |
Long-term | | | | | | | | | | | | |
AUD Bonds | | | 83 123 358 | | | | 74 954 343 | | | | 8 169 015 | |
Floating rate notes | | | 4 433 159 | | | | 4 422 000 | | | | 11 159 | |
Global AUD Bonds | | | 766 982 | | | | 702 972 | | | | 64 010 | |
Medium-term notes | | | 1 104 502 | | | | 1 008 477 | | | | 96 025 | |
Other | | | 223 191 | | | | 216 606 | | | | 6 585 | |
| | | 89 651 192 | | | | 81 304 398 | | | | 8 346 794 | |
| | | | | | | | | | | | |
Total interest-bearing liabilities | | | 94 026 880 | | | | 85 693 393 | | | | 8 333 487 | |
| | | | | | | | | | | | |
| | | | | | | | |
| | | 2015 | | | 2014 | |
| | | $000 | | | $000 | |
| | |
Client deposits | | | | | | | | |
Local governments | | | 2 748 353 | | | | 1 801 076 | |
Statutory bodies | | | 2 552 307 | | | | 1 729 109 | |
Government owned corporations | | | 1 193 117 | | | | 594 740 | |
Government departments and agencies | | | 54 897 | | | | 61 806 | |
QTC related entities | | | 64 325 | | | | 68 817 | |
Other depositors | | | 185 850 | | | | 201 170 | |
| | | 6 798 849 | | | | 4 456 718 | |
Collateral held | | | 104 502 | | | | 73 196 | |
Repurchase agreements | | | 821 541 | | | | 948 028 | |
| | | 926 043 | | | | 1 021 224 | |
| | | | | | | | |
Total deposits | | | 7 724 892 | | | | 5 477 942 | |
| | | | | | | | |
| | | | |
| 32 | | ANNUAL REPORT 2014-15 | | QUEENSLAND TREASURY CORPORATION |
Notes to the Financial Statements Capital Markets Operations
For the year ended 30 June 2015
| 11 | FINANCIAL RISK MANAGEMENT |
QTC’s activities expose it to a variety of financial risks including market risk (interest rate, basis spreads, credit spreads and foreign exchange), credit risk and liquidity risk. QTC’s financial risk management focuses on minimising financial risk exposures and managing volatility, and seeks to mitigate potential adverse effects of financial risks on the financial performance of QTC and its clients. To assist in managing financial risk, QTC uses derivative financial instruments such as foreign exchange contracts, interest rate swaps and futures contracts.
QTC ensures that in undertaking its capital markets activities it has adequate capital to manage its risks. While QTC’s capital is not subject to regulatory oversight, QTC operates under self-imposed capital requirements based on prudential statements published by APRA and utilises a capital adequacy approach based on Basel II: International Convergence of Capital Measurements and Capital Standards and applies these principles in its day to day management of capital.
Capital requirements are calculated for credit risk, market risk and operational risk with stress testing applied. Capital requirements are then applied against QTC’s Tier 1 and Tier 2 capital held. Capital usage is calculated daily with reports presented monthly to the Board.
All financial risk management activities are conducted within Board approved policies, as set out in the Financial Markets Risk Policy. New financial instruments must be approved by the QTC Board.
Robust systems are in place for managing financial risk and compliance with financial risk policies is monitored daily. The financial risk management process, including daily measurement and monitoring of market risk, liquidity risk, credit risk and portfolio performance and limit reviews, are performed by teams separate from the teams transacting and is subject to review by the Risk Management Team (comprising senior management), the Funding and Markets Committee (comprised of Board members) and the Board.
All breaches of the Financial Markets Risk Policy together with the corrective action proposed or taken are required to be immediately reported to the Chief Executive and then to the next Funding and Markets Committee meeting and the next Board meeting.
QTC’s borrowing and investment activities, including borrowing in advance of requirements to ensure Queensland public sector entities have ready access to funding when required and also to reduce the risk associated with refinancing maturing loans, exposes QTC to market risk.
As a consequence of market changes, there are residual risk positions which may result in realised and unrealised accounting gains or losses being recorded during the year. Depending on whether these transactions are held to maturity, the unrealised gains or losses may be reversed in subsequent accounting periods.
QTC’s investments on behalf of its clients are held in the QTC Cash Fund. Movement in credit spreads will impact on the value of the assets held in the Cash Fund resulting in unrealised mark-to-market accounting gains or losses. QTC generally holds these assets to maturity and therefore QTC does not pass on the mark-to-market impact of credit margin changes, either positive or negative, in the returns to Cash Fund participants.
QTC has funding facilities that allow for borrowing in foreign currencies. At times, QTC’s Cash Fund invests in foreign currency assets. QTC enters into both forward exchange contracts and cross currency swaps to hedge the exposure of foreign currency borrowings and offshore investments from fluctuations in exchange rates.
The following table summarises the hedging effect that cross currency swaps and forward exchange contracts have had on face value offshore borrowings and investments stated in Australian dollars:
| | | | | | | | | | | | | | | | | | | | | | | | | | | | | | | | |
| | | BORROWINGS | | | OFFSHORE INVESTMENTS | | | DERIVATIVE CONTRACTS | | | NET EXPOSURE | |
| | | 2015
$000 | | | 2014
$000 | | | 2015
$000 | | | 2014
$000 | | | 2015
$000 | | | 2014
$000 | | | 2015
$000 | | | 2014
$000 | |
USD | | | (227 909 | ) | | | (1 639 017 | ) | | | 338 608 | | | | 104 217 | | | | (110 699 | ) | | | 1 534 800 | | | | — | | | | — | |
NZD | | | — | | | | (737 554 | ) | | | — | | | | — | | | | — | | | | 737 554 | | | | — | | | | — | |
GBP | | | — | | | | (253 328 | ) | | | 30 667 | | | | 27 142 | | | | (30 667 | ) | | | 226 186 | | | | — | | | | — | |
YEN | | | (159 542 | ) | | | (157 320 | ) | | | — | | | | — | | | | 159 542 | | | | 157 320 | | | | — | | | | — | |
CHF | | | (153 759 | ) | | | (131 251 | ) | | | — | | | | — | | | | 153 759 | | | | 131 251 | | | | — | | | | — | |
EUR | | | — | | | | — | | | | 390 363 | | | | 58 036 | | | | (390 363 | ) | | | (58 036 | ) | | | — | | | | — | |
| | | | |
| QUEENSLAND TREASURY CORPORATION | | ANNUAL REPORT 2014-15 | | 33 |
Notes to the Financial Statements Capital Markets Operations
For the year ended 30 June 2015
| 11 | FINANCIAL RISK MANAGEMENT CONTINUED |
In managing interest rate risk on behalf of clients, the onlending portfolios are managed against duration benchmarks. Duration is a direct measure of the interest rate sensitivity of a financial instrument or a portfolio of financial instruments and quantifies the change in value of a financial instrument or portfolio due to interest rate movements. All costs or benefits of managing client debt portfolios are passed on to the client meaning that QTC is effectively immunised from interest rate risk with respect to these portfolios.
QTC’s interest rate risk, which results from borrowing in advance and investing surplus funds in high credit quality, highly liquid assets, is managed with consideration given to duration risk, yield curve risk, basis risk and Value-at-Risk (VaR). To manage the risk of non-parallel yield curve movements, QTC manages portfolio cash flows in a series of time periods so that the net interest rate risk in each time period can be measured.
QTC enters into interest rate swaps, forward rate agreements and futures contracts to assist in the management of interest rate risk.
In QTC’s Funding and Liquidity portfolios, interest rate swaps may be utilised to change the interest rate exposure of medium to long term fixed rate borrowings into that of a floating rate borrowing. Also, at times, floating to fixed swaps may be undertaken to generate a fixed rate term funding profile.
QTC is exposed to basis risk when interest rate swaps are used in the Funding and Liquidity portfolios. Basis risk represents a mark-to-market exposure due to movements between the swap curve and QTC’s yield curve.
QTC uses a Board approved Value-at-Risk (VaR) framework to manage QTC’s exposure to market risk complemented by other measures such as defined stress tests and PVBP (change in the present value for a one basis point movement). The VaR measure estimates the potential mark-to-market loss over a given holding period at a 99 per cent confidence level. QTC uses the historical simulation approach to calculate VaR using 18 months of market data with a holding period of 10 business days.
VaR impact
The VaR at 30 June, along with the minimum, maximum and average exposure over the financial year was as follows:
| | | | | | | | |
INTEREST RATE RISK VAR | | 2015
$M | | | 2014
$M | |
As at 30 June | | | 7.7 | | | | 5.5 | |
Average for the year | | | 7.9 | | | | 7.3 | |
Financial year - minimum | | | 3.6 | | | | 4.0 | |
Financial year - maximum | | | 12.2 | | | | 15.7 | |
The above VaR calculation does not include the potential mark-to-market impact of changes in credit spreads on the value of assets held in the QTC Cash Fund and the Cross Border Lease portfolio. At 30 June 2015, QTC had an exposure of approximately $0.8 million per basis point to changes in credit spreads of assets held in the QTC Cash Fund.
| (b) | Liquidity and financing risks |
QTC has a robust internal framework whereby extensive liquidity scenario analysis and forecasting is undertaken to understand assumption sensitivities to ensure there is appropriate forward looking visibility of the State’s liquidity position.
QTC debt is a Level 1 (prudentially required) asset for Australian banks under Basel III reforms with a 0% capital risk weighting. In normal and difficult market circumstances, QTC debt is likely to be in high demand. The ability to issue debt is considered a potential source of liquidity.
QTC holds appropriate liquidity (allowing for suitable haircuts of liquid assets) to meet minimum liquidity requirements as estimated today and as forecast into the future. QTC measures the minimum liquidity requirement to comfortably meet the following four scenarios simultaneously:
| • | | Going Concern – progressively pre-fund term maturities 6 months from maturity |
| • | | Market Disruption - 90 days survival horizon (severe market circumstances) |
| • | | Name Crisis – 30 days survival horizon (extreme market circumstances) |
| • | | Standard & Poor’s Liquidity Ratio – maintain a ratio greater than 80%. |
Further to this QTC holds liquid assets to support Queensland Public Sector (QPS) deposits and the State’s Long Term Assets. QTC considers these liquid assets as potential sources of liquidity in a liquidity crisis. To ensure liquidity is accessible as required, QTC holds a minimum of 5 working days’ net cash requirements in 11AM cash to fund the net cash flows from assets and liabilities on QTC’s balance sheet (included in money market deposits as per note 6).
QTC maintains its AUD benchmark bond facility as its core medium to long-term funding facility and its domestic treasury note facility, euro-commercial paper facility and US commercial paper facility as its core short-term funding facilities. In addition, QTC has in place Euro and US medium-term note facilities to take advantage of funding opportunities in offshore markets. These facilities ensure that QTC is readily able to access the domestic and international financial markets.
The following table sets out the contractual cash flows relating to financial assets and financial liabilities held by QTC at balance date.
With the exception of deposits and payables, the maturity analysis for liabilities has been calculated based on the contractual cash flows relating to the repayment of the principal (face value) and interest amounts over the contractual terms.
Deposits on account of the Cash Fund and Working Capital Facility (11AM Fund) are repayable at call while deposits held as security for stock lending and repurchase agreements are repayable when the security is lodged with QTC.
With the exception of cash and receivables, the maturity analysis for assets has been calculated based on the contractual cash flows relating to the repayment of the principal (face value) and interest amounts over the contractual terms.
In relation to client onlendings, certain loans are interest only with no fixed repayment date for the principal component (ie. loans are made based on the quality of the client’s business and its financial strength). For the purposes of completing the maturity analysis, the principal component of these loans has been included in the greater than five year time band with no interest payment assumed in this time band.
| | | | |
| 34 | | ANNUAL REPORT 2014-15 | | QUEENSLAND TREASURY CORPORATION |
Notes to the Financial Statements Capital Markets Operations
For the year ended 30 June 2015
| 11 | FINANCIAL RISK MANAGEMENT CONTINUED |
| (b) | Liquidity and financing risks continued |
| | | | | | | | | | | | | | | | | | | | | | | | | | | | |
CONTRACTUAL MATURITIES AS AT 30 JUNE 2015 | | 3 MONTHS
OR LESS $000 | | | 3 - 6
MONTHS
$000 | | | 6 - 12
MONTHS
$000 | | | 1 - 5
YEARS
$000 | | | MORE THAN
5 YEARS
$000 | | | TOTAL
$000 | | | FAIR VALUE
$000 | |
| | | | | | | |
Financial assets | | | | | | | | | | | | | | | | | | | | | | | | | | | | |
Cash and cash equivalents | | | 2 116 642 | | | | — | | | | — | | | | — | | | | — | | | | 2 116 642 | | | | 2 116 642 | |
Receivables | | | 4 207 | | | | — | | | | — | | | | — | | | | — | | | | 4 207 | | | | 4 207 | |
Onlendings# | | | 1 202 322 | | | | 1 187 468 | | | | 2 390 928 | | | | 19 015 580 | | | | 80 581 033 | | | | 104 377 331 | | | | 89 418 719 | |
Financial assets through profit or loss | | | 8 308 050 | | | | 3 359 911 | | | | 1 836 227 | | | | 6 064 168 | | | | 707 755 | | | | 20 276 111 | | | | 18 368 652 | |
| | | | | | | | | | | | | | | | | | | | | | | | | | | | |
Total | | | 11 631 221 | | | | 4 547 379 | | | | 4 227 155 | | | | 25 079 748 | | | | 81 288 788 | | | | 126 774 291 | | | | 109 908 220 | |
| | | | | | | | | | | | | | | | | | | | | | | | | | | | |
| | | | | | | |
Financial liabilities | | | | | | | | | | | | | | | | | | | | | | | | | | | | |
Payables | | | (16 416 | ) | | | (50 678 | ) | | | — | | | | — | | | | — | | | | (67 094 | ) | | | (67 094 | ) |
Deposits | | | (7 704 665 | ) | | | (20 227 | ) | | | — | | | | — | | | | — | | | | (7 724 892 | ) | | | (7 724 892 | ) |
Financial liabilities through profit or loss | | | | | | | | | | | | | | | | | | | | | | | | | | | | |
- Short-term | | | (3 152 792 | ) | | | (2 025 117 | ) | | | — | | | | — | | | | — | | | | (5 177 909 | ) | | | (5 157 098 | ) |
- Long-term | | | (1 401 078 | ) | | | (6 277 458 | ) | | | (6 987 547 | ) | | | (53 680 242 | ) | | | (41 081 337 | ) | | | (109 427 662 | ) | | | (96 274 859 | ) |
| | | | | | | | | | | | | | | | | | | | | | | | | | | | |
Total liabilities | | | (12 274 951 | ) | | | (8 373 480 | ) | | | (6 987 547 | ) | | | (53 680 242 | ) | | | (41 081 337 | ) | | | (122 397 557 | ) | | | (109 223 943 | ) |
| | | | | | | | | | | | | | | | | | | | | | | | | | | | |
| | | | | | | |
Derivatives | | | | | | | | | | | | | | | | | | | | | | | | | | | | |
Interest rate swaps | | | (23 995 | ) | | | (2 553 | ) | | | (35 278 | ) | | | (122 903 | ) | | | 12 629 | | | | (172 100 | ) | | | (148 347 | ) |
Cross currency swaps | | | (273 321 | ) | | | (42 709 | ) | | | 11 984 | | | | 348 035 | | | | (282 906 | ) | | | (238 917 | ) | | | 30 247 | |
Foreign exchange contracts | | | 584 | | | | (1 493 | ) | | | — | | | | — | | | | — | | | | (909 | ) | | | (79 | ) |
Net derivatives | | | (296 732 | ) | | | (46 755 | ) | | | (23 294 | ) | | | 225 132 | | | | (270 277 | ) | | | (411 926 | ) | | | (118 179 | ) |
Net assets/(liabilities) | | | (940 462 | ) | | | (3 872 856 | ) | | | (2 783 686 | ) | | | (28 375 362 | ) | | | 39 937 174 | | | | 3 964 808 | | | | 566 097 | |
Cumulative | | | (940 462 | ) | | | (4 813 318 | ) | | | (7 597 004 | ) | | | (35 972 366 | ) | | | 3 964 808 | | | | | | | | | |
| # | A large proportion of QTC’s onlendings are based on the quality of the business and financial strength of the client. Funds are therefore onlent on the basis of these businesses being going concerns and continuing to meet key credit metrics criteria such as debt to capital and interest coverage ratios. Accordingly, a significant portion of the onlendings portfolio has a loan maturity profile which is greater than five years with the interest rate risk of these loans being managed based on the client’s business risk such that the funding is structured on the underlying business profile. This results in QTC’s liability maturity profile being shorter than the asset maturity profile. Though not exposing QTC to interest rate risk, this approach does require QTC to undertake periodic refinancing of its liabilities. |
| | | | |
| QUEENSLAND TREASURY CORPORATION | | ANNUAL REPORT 2014-15 | | 35 |
Notes to the Financial Statements Capital Markets Operations
For the year ended 30 June 2015
| 11 | FINANCIAL RISK MANAGEMENT CONTINUED |
| (b) | Liquidity and financing risks continued |
| | | | | | | | | | | | | | | | | | | | | | | | | | | | |
CONTRACTUAL MATURITIES
AS AT 30 JUNE 2014 | | 3 MONTHS
OR LESS $000 | | | 3 - 6
MONTHS
$000 | | | 6 - 12
MONTHS
$000 | | | 1 - 5
YEARS
$000 | | | MORE THAN
5 YEARS
$000 | | | TOTAL
$000 | | | FAIR VALUE
$000 | |
| | | | | | | |
Financial assets | | | | | | | | | | | | | | | | | | | | | | | | | | | | |
Cash and cash equivalents | | | 2 674 962 | | | | — | | | | — | | | | — | | | | — | | | | 2 674 962 | | | | 2 674 962 | |
Receivables | | | 4 384 | | | | — | | | | — | | | | — | | | | — | | | | 4 384 | | | | 4 384 | |
Onlendings | | | 1 360 947 | | | | 1 338 062 | | | | 2 692 737 | | | | 19 566 983 | | | | 78 295 529 | | | | 103 254 258 | | | | 85 609 405 | |
Financial assets through profit or loss | | | 5 521 286 | | | | 844 820 | | | | 740 228 | | | | 4 723 722 | | | | 798 603 | | | | 12 628 659 | | | | 12 024 485 | |
| | | | | | | | | | | | | | | | | | | | | | | | | | | | |
Total | | | 9 561 579 | | | | 2 182 882 | | | | 3 432 965 | | | | 24 290 705 | | | | 79 094 132 | | | | 118 562 263 | | | | 100 313 236 | |
| | | | | | | | | | | | | | | | | | | | | | | | | | | | |
| | | | | | | |
Financial liabilities | | | | | | | | | | | | | | | | | | | | | | | | | | | | |
Payables | | | (132 700 | ) | | | (15 467 | ) | | | — | | | | — | | | | — | | | | (148 167 | ) | | | (148 167 | ) |
Deposits | | | (5 461 658 | ) | | | (20 273 | ) | | | — | | | | — | | | | — | | | | (5 481 931 | ) | | | (5 477 942 | ) |
Financial liabilities through profit or loss | | | | | | | | | | | | | | | | | | | | | | | | | | | | |
- Short-term | | | (3 439 640 | ) | | | (950 001 | ) | | | — | | | | — | | | | — | | | | (4 389 641 | ) | | | (4 375 688 | ) |
- Long-term | | | (1 343 257 | ) | | | (3 627 813 | ) | | | (2 058 532 | ) | | | (52 887 637 | ) | | | (45 828 330 | ) | | | (105 745 569 | ) | | | (89 651 192 | ) |
| | | | | | | | | | | | | | | | | | | | | | | | | | | | |
Total | | | (10 377 255 | ) | | | (4 613 554 | ) | | | (2 058 532 | ) | | | (52 887 637 | ) | | | (45 828 330 | ) | | | (115 765 308 | ) | | | (99 652 989 | ) |
| | | | | | | | | | | | | | | | | | | | | | | | | | | | |
| | | | | | | |
Derivatives | | | | | | | | | | | | | | | | | | | | | | | | | | | | |
Interest rate swaps | | | (9 735 | ) | | | 489 | | | | (19 570 | ) | | | (91 777 | ) | | | (19 966 | ) | | | (140 559 | ) | | | (135 154 | ) |
Cross currency swaps | | | (473 915 | ) | | | (4 268 | ) | | | (45 713 | ) | | | 693 579 | | | | (329 898 | ) | | | (160 215 | ) | | | 68 817 | |
Forward rate agreements | | | (280 000 | ) | | | (314 276 | ) | | | (72 365 | ) | | | 747 750 | | | | — | | | | 81 109 | | | | 38 704 | |
Foreign exchange contracts | | | (69 139 | ) | | | — | | | | — | | | | — | | | | — | | | | (69 139 | ) | | | (64 651 | ) |
Net derivatives | | | (832 789 | ) | | | (318 055 | ) | | | (137 648 | ) | | | 1 349 552 | | | | (349 864 | ) | | | (288 804 | ) | | | (92 284 | ) |
Net assets/(liabilities) | | | (1 648 465 | ) | | | (2 748 727 | ) | | | 1 236 785 | | | | (27 247 380 | ) | | | 32 915 938 | | | | 2 508 151 | | | | 567 963 | |
Cumulative | | | (1 648 465 | ) | | | (4 397 192 | ) | | | (3 160 407 | ) | | | (30 407 787 | ) | | | 2 508 151 | | | | | | | | | |
| (i) | Financial markets counterparties |
Credit risk is regularly assessed, measured and managed in strict accordance with QTC’s credit policy. Exposure to credit risk is managed through regular analysis of the ability of credit counterparties to meet payment obligations.
Credit exposure is QTC’s estimate of the potential loss at balance date in relation to investments and derivative contracts in the event of non-performance by all counterparties. The credit exposure for non-derivative investments is calculated based on the market value of the exposure together with the VaR while exposure to derivative contracts is based only on VaR. QTC utilises collateral arrangements to limit its derivatives’ credit exposure (refer (iv) master netting arrangements).
The following tables represent QTC’s exposure to credit risk at 30 June:
| | | | | | | | | | | | | | | | | | | | | | | | | | | | | | | | |
BY CREDIT RATING(1)
30 JUNE 2015 | | AAA
$000 | | | AA+
$000 | | | AA
$000 | | | AA-
$000 | | | A+
$000 | | | A
$000 | | | OTHER(2)
$000 | | | TOTAL
$000 | |
Cash & equivalents | | | — | | | | — | | | | — | | | | 2 116 642 | | | | — | | | | — | | | | — | | | | 2 116 642 | |
Financial assets(3) | | | 2 729 485 | | | | 579 141 | | | | 60 538 | | | | 13 718 639 | | | | 570 929 | | | | 102 201 | | | | 456 017 | | | | 18 216 950 | |
Derivatives | | | — | | | | — | | | | — | | | | 469 106 | | | | — | | | | 42 865 | | | | — | | | | 511 971 | |
Other | | | — | | | | — | | | | — | | | | 9 190 | | | | 852 968 | | | | — | | | | — | | | | 862 158 | |
| | | 2 729 485 | | | | 579 141 | | | | 60 538 | | | | 16 313 577 | | | | 1 423 897 | | | | 145 066 | | | | 456 017 | | | | 21 707 721 | |
| | | 12 | % | | | 3 | % | | | — | | | | 75 | % | | | 7 | % | | | 1 | % | | | 2 | % | | | 100 | % |
BY CREDIT RATING (1)
30 JUNE 2014 | | | | | | | | | | | | | | | | | | | | | | | | |
Cash & equivalents | | | — | | | | — | | | | — | | | | 2 574 757 | | | | — | | | | 100 205 | | | | — | | | | 2 674 962 | |
Financial assets(3) | | | 2 680 978 | | | | 593 640 | | | | 23 547 | | | | 7 551 292 | | | | 495 791 | | | | 174 430 | | | | 314 363 | | | | 11 834 041 | |
Derivatives | | | — | | | | — | | | | — | | | | 276 246 | | | | — | | | | 8 118 | | | | 8 603 | | | | 292 967 | |
Other | | | — | | | | — | | | | — | | | | 19 909 | | | | 697 059 | | | | — | | | | — | | | | 716 968 | |
| | | 2 680 978 | | | | 593 640 | | | | 23 547 | | | | 10 422 204 | | | | 1 192 850 | | | | 282 753 | | | | 322 966 | | | | 15 518 938 | |
| | | 17 | % | | | 4 | % | | | — | | | | 67 | % | | | 8 | % | | | 2 | % | | | 2 | % | | | 100 | % |
| (1) | Credit rating as per Standard & Poor’s or equivalent agency |
| (2) | Includes long term ratings of A-, or a short term rating of A-1+ & A-2 |
| (3) | Financial assets are based on unsettled face value and consist mainly of discount securities, Commonwealth & State securities, floating rate notes and term deposits |
| | | | |
| 36 | | ANNUAL REPORT 2014-15 | | QUEENSLAND TREASURY CORPORATION |
Notes to the Financial Statements Capital Markets Operations
For the year ended 30 June 2015
| 11 | FINANCIAL RISK MANAGEMENT CONTINUED |
| (i) | Financial markets counterparties continued |
QTC adopts a conservative approach to the management of credit risk with a strong bias to high credit quality counterparties. QTC maintains a ratings based approach in determining maximum credit exposures to counterparties which is supplemented by QTC’s credit risk analysis team performing its own credit assessment of QTC’s capital markets counterparties. The country of domicile, the counterparty’s credit metrics, size of its funding programs, asset composition and quality of the underlying security are key considerations when determining limits.
QTC has a significant concentration of credit risk to the banking sector and in particular, the domestic banking sector. This is difficult to avoid given the size of QTC’s investment portfolio and the requirement to invest with counterparties rated A- or better (90 per cent of exposures are AA- or better) and to invest in highly liquid securities.
| (ii) | Onlending counterparties |
Counterparties for onlendings, with the exception of some small exposures to private companies, cooperative housing societies and primary producer cooperatives, are Queensland Government sector entities with approximately 75 per cent of these onlendings having an explicit State Government guarantee. As a consequence, these exposures are not included in QTC’s total credit exposure.
| (iii) | Fair value attributable to credit risk of QTC’s liabilities |
QTC’s borrowings are guaranteed by the State Government, and in the case of certain borrowings, by the Commonwealth. As a result, credit risk is not a significant factor in the determination of fair value. Changes in fair value are mainly attributable to market fluctuations and changes in market conditions.
| (iv) | Master netting arrangements |
QTC enters into all derivative transactions under International Swaps and Derivatives Association (ISDA) Master Agreements. QTC does not currently have any master netting arrangements where a default event has occurred, and has therefore presented all derivative financial instruments on a gross basis in the statement of financial position. QTC also has Credit Support Annexes (CSAs) in place with each ISDA, under which collateral is transferred every business day. This further reduces QTC’s credit exposure.
The following table presents the financial instruments that are offset, or subject to enforceable master netting arrangements and other similar agreements but not offset. The column ‘net amount’ shows the impact on QTC’s balance sheet if all set-off rights were exercised.
| | | | | | | | | | | | | | | | |
| | | GROSS AND
NET AMOUNTS
ON THE
BALANCE
SHEET $000 | | | AMOUNTS
SUBJECT
TO MASTER
NETTING
ARRANGEMENTS
$000 | | | FINANCIAL
INSTRUMENTS
COLLATERAL
$000 | | | NET AMOUNT
$000 | |
| | | | |
2015 | | | | | | | | | | | | | | | | |
Derivative assets: | | | | | | | | | | | | | | | | |
- subject to master netting arrangements | | | 309 914 | | | | (151 521 | ) | | | — | | | | 158 393 | |
Collateral held – cash & other | | | — | | | | — | | | | (158 393 | ) | | | (158 393 | ) |
| | | 309 914 | | | | (151 521 | ) | | | (158 393 | ) | | | — | |
Derivative liabilities: | | | | | | | | | | | | | | | | |
- subject to master netting arrangements | | | (428 093 | ) | | | 151 521 | | | | — | | | | (276 572 | ) |
Collateral given | | | — | | | | — | | | | 266 036 | | | | 266 036 | |
| | | (428 093 | ) | | | 151 521 | | | | 266 036 | | | | (10 536 | ) |
Net exposure | | | (118 179 | ) | | | — | | | | 107 643 | | | | (10 536 | ) |
| | | | |
2014 | | | | | | | | | | | | | | | | |
Derivative assets: | | | | | | | | | | | | | | | | |
- subject to master netting arrangements | | | 213 839 | | | | (72 490 | ) | | | — | | | | 141 349 | |
- not subject to master netting arrangements | | | 38 704 | | | | — | | | | — | | | | 38 704 | |
Collateral held – cash & other | | | — | | | | — | | | | (141 349 | ) | | | (141 349 | ) |
| | | 252 543 | | | | (72 490 | ) | | | (141 349 | ) | | | 38 704 | |
Derivative liabilities: | | | | | | | | | | | | | | | | |
- subject to master netting arrangements | | | (344 827 | ) | | | 72 490 | | | | — | | | | (272 337 | ) |
Collateral given | | | — | | | | — | | | | 239 248 | | | | 239 248 | |
| | | (344 827 | ) | | | 72 490 | | | | 239 248 | | | | (33 089 | ) |
Net exposure | | | (92 284 | ) | | | — | | | | 97 899 | | | | 5 615 | |
| | | | |
| QUEENSLAND TREASURY CORPORATION | | ANNUAL REPORT 2014-15 | | 37 |
Notes to the Financial Statements Capital Markets Operations
For the year ended 30 June 2015
Financial instruments measured at fair value have been classified in accordance with the hierarchy described in AASB 13 Fair Value Measurement. The fair value hierarchy is categorised into three levels based on the observability of the inputs used.
Level 1 – quoted prices (unadjusted) in active markets that QTC can access at measurement date for identical assets and liabilities.
Level 2 – inputs other than quoted prices included within Level 1 that are observable for the asset or liability, either directly or indirectly.
Level 3 – inputs for the asset or liability that are not based on observable market data (unobservable inputs).
All financial instruments at fair value through profit or loss are valued by reference to either quoted market prices or observable inputs with no significant adjustments applied to instruments held and therefore no financial instruments at fair value through profit or loss are classified under Level 3.
Financial assets classified as Level 1 consist primarily of short-term and tradable bank deposits, Commonwealth and semi-government bonds and futures contracts where an active market has been established. Financial liabilities classified as Level 1 consist of QTC benchmark Bonds.
Financial assets classified as Level 2 include non-actively traded corporate and semi-government bonds, certain money market securities, floating rate notes, term deposits, QTC onlendings and all over the counter derivatives. The principal inputs in determining fair value include benchmark interest rates such as interbank rates, quoted interest rates in the swap, bond and futures markets,
trading margins to the swap curve and counterparty credit spreads for similar instruments adjusted for changes in the credit worthiness of the counterparty. A margin may be applied based on the original purchase margin where the instrument is not actively traded. QTC onlendings are priced based on the underlying liability portfolio.
Financial liabilities classified as Level 2 include commercial paper, treasury notes, medium term notes, floating rate notes, QTC Capital Index Bonds, QTC 2033 Bonds and client deposits. The principal inputs in determining fair value include benchmark interest rates such as interbank rates and quoted interest rates in the swap and bond markets. Valuations may include a fixed margin to LIBOR or swap curve. Client deposits are principally held in the QTC Cash Fund which is capital guaranteed.
Over the counter derivatives are typically valued as Level 2 and include FX forwards, FX swaps, interest rate and cross currency swaps. The principal inputs in determining fair value include quoted interest rates in the swap market, spot FX and basis curves.
QTC applies mid-market pricing as a practical and consistent expedient for fair value measurements within the bid-ask spread.
Classification of instruments into fair value hierarchy levels is reviewed semi-annually and where there has been a significant change to the valuation inputs and a transfer is deemed to occur, this is effected at the end of the relevant reporting period. There were no transfers between Level 1 and Level 2 during the year ended 30 June 2015.
| | | | | | | | | | | | |
AS AT 30 JUNE 2015 | | QUOTED PRICES
LEVEL 1
$000 | | | OBSERVABLE INPUTS
LEVEL 2
$000 | | | TOTAL
$000 | |
| | | |
Financial assets | | | | | | | | | | | | |
Cash and cash equivalents | | | 2 116 642 | | | | — | | | | 2 116 642 | |
Financial assets through profit or loss | | | 13 240 840 | | | | 5 127 812 | | | | 18 368 652 | |
Onlendings | | | — | | | | 89 418 719 | | | | 89 418 719 | |
Derivative financial assets | | | — | | | | 309 914 | | | | 309 914 | |
| | | | | | | | | | | | |
Total financial assets | | | 15 357 482 | | | | 94 856 445 | | | | 110 213 927 | |
| | | | | | | | | | | | |
| | | |
Financial liabilities | | | | | | | | | | | | |
Financial liabilities through profit or loss | | | | | | | | | | | | |
- Short term | | | — | | | | 5 157 098 | | | | 5 157 098 | |
- Long term | | | 92 701 853 | | | | 3 573 006 | | | | 96 274 859 | |
Deposits | | | — | | | | 7 724 892 | | | | 7 724 892 | |
Derivative financial liabilities | | | — | | | | 428 093 | | | | 428 093 | |
| | | | | | | | | | | | |
Total financial liabilities | | | 92 701 853 | | | | 16 883 089 | | | | 109 584 942 | |
| | | | | | | | | | | | |
| | | |
AS AT 30 JUNE 2014 | | | | | | | | | |
| | | |
Financial assets | | | | | | | | | | | | |
Cash and cash equivalents | | | 2 674 962 | | | | — | | | | 2 674 962 | |
Financial assets through profit or loss | | | 10 294 792 | | | | 1 729 693 | | | | 12 024 485 | |
Onlendings | | | — | | | | 85 609 405 | | | | 85 609 405 | |
Derivative financial assets | | | — | | | | 252 543 | | | | 252 543 | |
| | | | | | | | | | | | |
Total financial assets | | | 12 969 754 | | | | 87 591 641 | | | | 100 561 395 | |
| | | | | | | | | | | | |
Financial liabilities | | | | | | | | | | | | |
Financial liabilities through profit or loss | | | | | | | | | | | | |
- Short term | | | — | | | | 4 375 688 | | | | 4 375 688 | |
- Long term | | | 81 986 550 | | | | 7 664 642 | | | | 89 651 192 | |
Deposits | | | — | | | | 5 477 942 | | | | 5 477 942 | |
Derivative financial liabilities | | | — | | | | 344 827 | | | | 344 827 | |
| | | | | | | | | | | | |
Total financial liabilities | | | 81 986 550 | | | | 17 863 099 | | | | 99 849 649 | |
| | | | | | | | | | | | |
| | | | |
| 38 | | ANNUAL REPORT 2014-15 | | QUEENSLAND TREASURY CORPORATION |
Notes to the Financial Statements Capital Markets Operations
For the year ended 30 June 2015
| 13 | PROPERTY, PLANT AND EQUIPMENT |
Reconciliations of the carrying amounts for each class of property, plant and equipment are set out below:
| | | | | | | | | | | | |
DESCRIPTION | | INFORMATION
TECHNOLOGY AND
OFFICE EQUIPMENT
$000 | | | PLANT AND
MACHINERY (1)
$000 | | | TOTAL
$000 | |
| | | |
Year ended 30 June 2015 | | | | | | | | | | | | |
Cost at balance date | | | 10 322 | | | | 354 798 | | | | 365 120 | |
Accumulated depreciation and impairment | | | (6 404 | ) | | | (177 910 | ) | | | (184 314 | ) |
Net carrying amount | | | 3 918 | | | | 176 888 | | | | 180 806 | |
Movement | | | | | | | | | | | | |
Net carrying amount at 1 July 2014 | | | 5 406 | | | | 222 152 | | | | 227 558 | |
Additions | | | 442 | | | | — | | | | 442 | |
Disposals | | | (17 | ) | | | — | | | | (17 | ) |
Impairment expense | | | — | | | | (12 533 | ) | | | (12 533 | ) |
Depreciation expense | | | (1 913 | ) | | | (32 731 | ) | | | (34 644 | ) |
Net carrying amount at 30 June 2015 | | | 3 918 | | | | 176 888 | | | | 180 806 | |
| | | |
Year ended 30 June 2014 | | | | | | | | | | | | |
Cost at balance date | | | 10 046 | | | | 354 798 | | | | 364 844 | |
Accumulated depreciation | | | (4 640 | ) | | | (132 646 | ) | | | (137 286 | ) |
Net carrying amount | | | 5 406 | | | | 222 152 | | | | 227 558 | |
Movement | | | | | | | | | | | | |
Net carrying amount at 1 July 2013 | | | 6 891 | | | | 258 634 | | | | 265 525 | |
Additions | | | 419 | | | | 245 | | | | 664 | |
Disposals | | | — | | | | (3 435 | ) | | | (3 435 | ) |
Depreciation expense | | | (1 904 | ) | | | (33 292 | ) | | | (35 196 | ) |
Net carrying amount at 30 June 2014 | | | 5 406 | | | | 222 152 | | | | 227 558 | |
| (1) | Plant and machinery consists mainly of buses and ferries which QTC leases to public sector entities under a whole of government operating lease facility. The leases are non-cancellable and have remaining terms of between 1 and 10 years. During the year the residual values on plant and machinery were revised resulting in an impairment loss of $12.5 million being recognised in the statement of comprehensive income. |
| | | | |
| QUEENSLAND TREASURY CORPORATION | | ANNUAL REPORT 2014-15 | | 39 |
Notes to the Financial Statements Capital Markets Operations
For the year ended 30 June 2015
| 14 | NOTES TO THE STATEMENT OF CASH FLOWS |
Reconciliation of profit after tax to net cash provided by operating activities
| | | | | | | | |
DESCRIPTION | | 2015
$000 | | | 2014
$000 | |
Profit for the year | | | 41 280 | | | | 119 220 | |
| | |
Non-cash flows in operating surplus | | | | | | | | |
Interest-bearing liabilities - net unrealised loss | | | 1 564 506 | | | | 2 123 944 | |
Interest-bearing liabilities - net unrealised exchange loss | | | 115 955 | | | | 87 063 | |
Deposits - net unrealised loss/(gain) | | | 77 | | | | (147 | ) |
Onlendings net unrealised gain | | | (887 308 | ) | | | (2 201 057 | ) |
Financial assets at fair value through profit or loss - net unrealised loss | | | 67 442 | | | | 17 880 | |
Financial assets at fair value through profit or loss - net unrealised exchange gain | | | (7 711 | ) | | | (2 865 | ) |
Depreciation and amortisation | | | 36 657 | | | | 37 364 | |
Impairment on property, plant and equipment | | | 12 533 | | | | — | |
Net gain on sale of property, plant and equipment | | | (11 | ) | | | (1 159 | ) |
Doubtful debts - cooperative housing societies | | | 27 | | | | — | |
Net loss from investment accounted for using the equity method | | | — | | | | 1 146 | |
| | |
Changes in assets and liabilities | | | | | | | | |
(Increase)/decrease in financial assets at fair value through profit or loss - net accrued interest | | | (14 992 | ) | | | 26 254 | |
(Increase)/decrease in financial assets at fair value through profit or loss - net discount/premium | | | (57 233 | ) | | | 227 806 | |
Decrease/(increase) in deferred tax asset | | | 105 | | | | (1 002 | ) |
(Increase)/decrease in onlendings - net accrued interest | | | (3 261 | ) | | | 5 512 | |
Decrease in receivables | | | 4 554 | | | | 1 678 | |
Increase in interest-bearing liabilities - net accrued interest | | | 74 428 | | | | 64 173 | |
Increase/(decrease) in interest-bearing liabilities - net discount/premium | | | (403 904 | ) | | | (51 571 | ) |
(Increase)/decrease in deposits - net accrued interest | | | (391 | ) | | | 236 | |
Decrease in payables and other liabilities | | | (55 054 | ) | | | (39 574 | ) |
Net cash provided by operating activities | | | 487 699 | | | | 414 901 | |
| | | | |
| 40 | | ANNUAL REPORT 2014-15 | | QUEENSLAND TREASURY CORPORATION |
Notes to the Financial Statements Long Term Assets
For the year ended 30 June 2015
| 15 | FINANCIAL ASSETS AT FAIR VALUE THROUGH PROFIT OR LOSS |
| | | | | | | | |
| | | 2015
$000 | | | 2014
$000 | |
Investments in unit trusts and other holdings - QIC: | | | | | | | | |
| | |
Movement during the year: | | | | | | | | |
Opening balance | | | 33 431 249 | | | | 29 767 721 | |
Net withdrawals | | | (1 260 105 | ) | | | (1 722 797 | ) |
Net change in fair value of unit trusts | | | 2 484 580 | | | | 5 386 325 | |
Closing balance | | | 34 655 724 | | | | 33 431 249 | |
| | |
Comprised of the following asset classes: | | | | | | | | |
| | |
Defensive assets | | | | | | | | |
Cash | | | 6 276 207 | | | | 4 991 320 | |
Fixed interest | | | 7 624 976 | | | | 5 296 539 | |
| | |
Growth assets | | | | | | | | |
Equities | | | 4 733 483 | | | | 4 967 124 | |
Diversified alternatives | | | 8 094 333 | | | | 6 134 448 | |
Unlisted assets | | | | | | | | |
Infrastructure | | | 2 790 404 | | | | 8 199 928 | |
Private equities | | | 2 874 846 | | | | 1 903 027 | |
Real estate | | | 2 261 475 | | | | 1 938 863 | |
| | | 34 655 724 | | | | 33 431 249 | |
| 16 | FINANCIAL RISK MANAGEMENT |
The Long Term Assets are invested in unlisted unit trusts held with QIC. The trusts hold investments in a variety of financial instruments including derivatives, which expose these assets to credit risk, liquidity risk and market risk due to changes in interest rates, foreign exchange rates, property and equity prices. However, as these investments are long term in nature, market fluctuations are expected to even out over the term of the investment.
The Long Term Asset Advisory Board (LTAAB) determines the investment objectives, risk profiles and strategy for the Long Term Assets within the framework provided by the Government. It is responsible for formulating a strategic asset allocation to achieve the objectives of the investments in line with the required risk profile. Risk management policies are established to identify and analyse the risks and to set appropriate risk limits and controls, as well as to monitor risks and adherence against these limits.
QIC provides assistance to the LTAAB in discharging its responsibilities. QIC’s role includes recommending to the LTAAB, investment product objectives, risk profiles and strategic asset allocations to achieve objectives within the targets and risk controls set. As the lead investment manager, QIC is responsible for implementing the investment strategy. In addition, independent oversight of the investment advice and services provided by QIC, including periodic strategic reviews of QIC’s activities and performance, is provided by an external consultant.
The LTAAB is responsible for setting the interest rate applicable on the fixed rate note liability of QTC. Since July 2012, LTAAB has been reducing risk in the Asset Portfolio. The revised asset classes feature reduced weights to listed equities, offset by increased weights to alternatives, global fixed interest and cash. The result was a reduction in expected return and volatility. In light of this strategy, the expected rate of return on the portfolio on which the interest rate on the fixed rate notes is set was revised from 7.5 per cent to 7.1 per cent on 1 July 2013 (reducing to 7.0 per cent effective 1 July 2015).
The Long Term Assets expose QTC to market risk, including interest rate risk, foreign currency risk, property and equity price risk, resulting from its investments in unit trusts.
Market risk is mitigated through a diversified portfolio of investments in unit trusts held with QIC in accordance with the investment strategy approved by the LTAAB (refer note 15). The investment strategy targets a widely diversified portfolio across a broad range of asset classes.
QIC adheres to prudential controls contained in the Investment Management Agreement. Under this agreement, derivative products are not permitted to be used for speculative purposes but are used as hedging instruments against existing positions or for efficient trading and asset allocation purposes to assist in achieving the overall investment returns and volatility objectives of the portfolio.
| | | | |
| QUEENSLAND TREASURY CORPORATION | | ANNUAL REPORT 2014-15 | | 41 |
Notes to the Financial Statements Long Term Assets
For the year ended 30 June 2015
| 16 | FINANCIAL RISK MANAGEMENT CONTINUED |
Sensitivity analysis
The market risk of the Long Term Assets comprises the risk that the unit price of the funds in which the assets are invested will change during the next reporting period (effectively price risk). A sensitivity analysis for the key types of market risk that apply to the investments of the funds has been undertaken by QIC. QIC has provided a range of reasonably possible changes in key risk variables including the ASX 200, the MSCI World ex Australia Equities Index, the RBA official cash rate, the Bank of England official cash rate and real estate capitalisation rates for both Australia and the United Kingdom. The foreign currency exposure of QTC’s total investment portfolio is 100% hedged. For this reason sensitivity to foreign exchange rate movements has not been calculated at the asset class level.
Based on these changes to key risk variables and applying a range of valuation methodologies, a reasonably possible change in profit and equity on applicable investments held at 30 June is as follows:
| | | | | | | | | | | | | | | | | | | | | | | | | | | | | | | | |
| | | 2015 CHANGE | | | 2015 PROFIT/EQUITY | | | 2014 CHANGE | | | 2014 PROFIT/EQUITY | |
| | | Low | | | High | | | Decrease | | | Increase | | | Low | | | High | | | Decrease | | | Increase | |
Cash and fixed interest(1) | | | -2 | % | | | 2 | % | | | (293 856 | ) | | | 293 936 | | | | -3 | % | | | 3 | % | | | (275 384 | ) | | | 275 432 | |
Equities | | | -10 | % | | | 10 | % | | | (473 621 | ) | | | 473 621 | | | | -10 | % | | | 10 | % | | | (496 795 | ) | | | 496 795 | |
Diversified alternatives(2) | | | -9 | % | | | 9 | % | | | (720 976 | ) | | | 720 976 | | | | -10 | % | | | 10 | % | | | (599 625 | ) | | | 599 625 | |
Infrastructure | | | -10 | % | | | 10 | % | | | (280 718 | ) | | | 280 718 | | | | -10 | % | | | 10 | % | | | (821 357 | ) | | | 821 357 | |
Private equities | | | -10 | % | | | 10 | % | | | (287 557 | ) | | | 287 557 | | | | -10 | % | | | 10 | % | | | (190 334 | ) | | | 190 334 | |
Real estate | | | -6 | % | | | 7 | % | | | (143 057 | ) | | | 156 777 | | | | -6 | % | | | 6 | % | | | (120 235 | ) | | | 125 032 | |
| | | | | | | | | | | (2 199 785 | ) | | | 2 213 585 | | | | | | | | | | | | (2 503 730 | ) | | | 2 508 575 | |
| (1) | Cash and fixed interest includes exposure to interest rate and inflation overlays on hedging instruments. |
| (2) | Diversified alternatives include exposure to both price and interest rate risk. |
No external cash flows are generated from the Long Term Assets as deposits and withdrawals from the fixed rate notes result in a corresponding change in the investment held and do not expose QTC to liquidity risk arising from these daily movements. Interest on the fixed rate notes and distributions and fees on the Long Term Assets are capitalised.
Financial instruments have been classified in accordance with the hierarchy described in AASB 13 Fair Value Measurement, as per note 12.
Investments in unit trusts are valued by QIC using fair value methodologies adjusted for fees outstanding. QIC reports the net asset value based on the hard close unit price at measurement date (classified as Level 2 - Observable inputs). As at 30 June 2015, investments in unit trusts are valued at $34,656 million (2014: $33,431 million).
The Board considers that the carrying value of financial liabilities recorded at amortised cost in the financial statements approximates their fair value. For the purposes of the fair value hierarchy, the fixed rate notes are categorised as Level 3 – Unobservable inputs.
| | | | |
| 42 | | ANNUAL REPORT 2014-15 | | QUEENSLAND TREASURY CORPORATION |
Notes to the Financial Statements Other information
For the year ended 30 June 2015
The following contingent liabilities existed at balance date:
| • | | With regard to certain cross border lease transactions, QTC has assumed responsibility for a significant portion of the transaction risk. If certain events occur, QTC could be liable to make additional payments under the transactions. However external advice and history to date indicate the likelihood of these events occurring is remote. In addition, QTC has provided certain guarantees and indemnities to various participants in the cross border lease transactions. Expert external advisors consider that unless exceptional and extreme circumstances arise, QTC will not be required to make a significant payment under these guarantees and indemnities. |
| • | | QTC has provided guarantees relating to the trading activities of Ergon Energy, a Queensland Government owned corporation, to the value of $100 million (2014 $102 million) which are supported by a counter indemnity. |
| • | | QTC has provided guarantees to the value of $362 million (2014 $345 million) to support the commercial activities of various Queensland public sector entities. In each case, a counter indemnity has been obtained by QTC from the appropriate public sector entity. |
| • | | QTC can lend stock to support the liquidity of QTC bonds in the financial markets. At 30 June 2015 and 30 June 2014, no QTC inscribed stock was lent to other financial institutions. |
| 19 | RELATED PARTY TRANSACTIONS |
A related party is one that controls, or is controlled by, or under common control with the entity.
| (a) | Ultimate controlling entity |
The immediate controlling entity and ultimate controlling entity is the Under Treasurer of Queensland as the Corporation Sole of QTC.
| (b) | Key management personnel |
Disclosures relating to key management personnel are set out in note 20.
| (c) | Investments in companies |
Details of investments in associates and other companies are set out in note 22.
| (d) | Transactions with related parties |
Transactions undertaken with related parties during the year include loans issued to public sector entities (refer note 9), the investment of cash surpluses (refer note 10), advisory, banking and company secretarial services. These transactions were in the normal course of business and on commercial terms and conditions. They exclude certain advisory and other services provided to Queensland Treasury, its associated companies and other related parties at no charge.
QTC may from time to time indirectly hold a small amount of investments in QTC Bonds via its investments in unit trusts managed by QIC. QTC does not have direct legal ownership of these assets and therefore no adjustment has been made in the financial statements. The nature and amount of any individually significant transactions with principal related parties are disclosed below.
QTC has incurred costs on behalf of the State for the performance of due diligence services for which QTC has been reimbursed. These services are in the form of an agency arrangement for which QTC does not bear any significant risks or benefits and as such costs have been offset in the financial statements. The amount of these costs offset during the financial year totalled $43.6 million.
QTC has interests in other government related entities through various shareholdings. These entities hold deposits (refer note 10) and loans (refer note 9) with QTC that are provided on an arm’s length basis and are subject to QTC’s normal terms and conditions.
| 20 | KEY MANAGEMENT PERSONNEL |
Key management personnel are defined as those persons having authority and responsibility for planning, directing and controlling the activities of QTC, being members of the Board and certain members of the Executive Management Team.
QTC has designated its powers to its two boards, the Capital Markets Board and the Long Term Asset Advisory Board. Both boards are appointed by the Governor-in-Council, pursuant to section 10(2) of the Queensland Treasury Corporation Act 1988.
Executive management are those members of the Executive Management Team who set the strategic direction and control of the major activities of the organisation.
| (c) | Remuneration principles |
Directors – Capital Markets Board
The process for reviewing Board remuneration requires any increase in the Board’s remuneration to be approved by the Treasurer and endorsed by Cabinet. Remuneration was last increased effective 1 July 2012.
Directors – Long Term Asset Advisory Board
No remuneration is payable to the directors of the Long Term Asset Advisory Board.
Executives and employees
QTC employees (including executive management) are employed on individual contracts and are appointed pursuant to the Queensland Treasury Corporation Act 1988.
As the majority of QTC’s employees are sourced from the financial markets in which it operates, it is crucial that QTC’s employment practices are competitive with these markets.
QTC aims to ensure that its remuneration principles enable it to:
| • | | Attract and retain quality employees by offering a total remuneration package commensurate with and competitive against the market and ensuring consistency, transparency and equity in remuneration outcomes |
| • | | Drive superior organisational performance, by embedding a high-performance culture and aligning reward with QTC’s business and client outcomes |
| • | | Maintain rigor in its pay outcomes appropriate to the (financial institutions) market and the environment in which QTC operates, and |
| • | | Drive employee engagement, through transparency and consistency of outcomes. |
The remuneration framework comprises both fixed and variable remuneration (in the form of an annual short-term incentive (STI) opportunity) which are approved by the QTC Board annually. Both components are market-competitive and linked to performance.
Remuneration governance
The Human Resources Committee of the Board is responsible for governance of remuneration practices and arrangements, with the Board maintaining absolute responsibility and decision making for remuneration matters.
QTC receives annual industry benchmarking data from the Financial Industry Remuneration Group (FIRG) database, which is mapped to relevant organisations within the FIRG membership. Analysis and advice is obtained from external consultants to ensure that we continue to align QTC roles to the market. External validation of QTC’s remuneration framework is undertaken as part of the Audit process within the wider Governance arrangements.
Fixed remuneration
The fixed remuneration of each QTC employee is reviewed in July each year and is benchmarked against the FIRG remuneration data. Fixed remuneration levels are set around the FIRG market median position of a relevant sub-set of the FIRG database, and role scope, experience, skills and performance are considered when determining the remuneration level of each employee.
Variable remuneration - short-term incentives
QTC’s variable remuneration framework provides an annual short-term incentive opportunity for eligible employees, aligned to financial year performance.
This opportunity is designed to differentiate and reward outstanding organisational, group and individual performance, and to align performance at these levels with incentive outcomes. It also aims to ensure market competitiveness, with ‘target’ STI outcomes aligned to the conservative market position and approved at Board level each year. For the 2014–15 year, STI payments were made to eligible staff in July.
Variable remuneration - executive management
For the 2014–15 year, where executive management has performed strongly against corporate and individual KPIs, they will be eligible to receive a ‘target’ STI payment of 40%-45% of their total fixed remuneration. The actual outcome will vary dependent on performance and for executive management is 75% based on corporate performance, and 25% based on individual performance.
This acknowledges the strategic focus of these roles (with STI payments reflecting progress against the QTC Strategic Plan 2014-18) and recognises and rewards collaborative behaviour. For exceptional performance, the maximum potential STI payment is 60%-67% of their total fixed remuneration. The maximum percentage determined for 2014–15 was 50%.
| | | | |
| QUEENSLAND TREASURY CORPORATION | | ANNUAL REPORT 2014-15 | | 43 |
Notes to the Financial Statements Other information
For the year ended 30 June 2015
| 20 | KEY MANAGEMENT PERSONNEL CONTINUED |
| (d) | Remuneration by category |
| | | | | | | | |
| | | 2015 | | | 2014 | |
| | | $ | | | $ | |
| | |
Capital markets operations | | | | | | | | |
| | |
Directors | | | | | | | | |
Short-term employment benefits(1) | | | 299 806 | | | | 377 703 | |
Post-employment benefits(4) | | | 17 405 | | | | 17 690 | |
| | | | | | | | |
Total | | | 317 211 | | | | 395 393 | |
| | | | | | | | |
| | |
Executive management | | | | | | | | |
Short-term employment benefits(2) | | | 2 540 825 | | | | 2 350 422 | |
Long-term employment benefits(3) | | | 48 707 | | | | 62 471 | |
Post-employment benefits(4) | | | 85 531 | | | | 79 273 | |
| | | | | | | | |
Total | | | 2 675 063 | | | | 2 492 166 | |
| | | | | | | | |
| (1) | Directors’ short-term benefits include board member and committee fees, and in relation to the Chairman, also includes the provision of a car park. |
| (2) | Executive management personnel’s short-term benefits include wages, annual leave taken, short-term incentives and non-monetary benefits such as car parks and motor vehicle benefits. |
| (3) | Long-term employment benefits relates to long-service leave. |
| (4) | Post-employment benefits include superannuation contributions made by the Corporation. |
Details of the nature and amount of each major element of the remuneration are as follows:
| | | | | | | | | | | | | | | | | | | | | | | | |
| | | SHORT-TERM | | | POST-EMPLOYMENT | | | | | | | |
| | | EMPLOYMENT BENEFITS | | | BENEFITS | | | TOTAL | |
| | | 2015 | | | 2014 | | | 2015 | | | 2014 | | | 2015 | | | 2014 | |
| | | $ | | | $ | | | $ | | | $ | | | $ | | | $ | |
Gerard Bradley - Chairman | | | 122 133 | | | | 122 145 | | | | 10 529 | | | | 10 303 | | | | 132 662 | | | | 132 448 | |
Warwick Agnew(1) | | | — | | | | — | | | | — | | | | — | | | | — | | | | — | |
Alex Beavers(2) | | | 15 305 | | | | 41 425 | | | | — | | | | — | | | | 15 305 | | | | 41 425 | |
Stephen Bizzell | | | 47 753 | | | | 44 273 | | | | — | | | | — | | | | 47 753 | | | | 44 273 | |
Gillian Brown(3) | | | 6 702 | | | | 40 209 | | | | 637 | | | | 3 719 | | | | 7 339 | | | | 43 928 | |
Tonianne Dwyer | | | 40 209 | | | | 39 657 | | | | 3 820 | | | | 3 668 | | | | 44 029 | | | | 43 325 | |
Neville Ide(4) | | | — | | | | 46 950 | | | | — | | | | — | | | | — | | | | 46 950 | |
Bill Shields | | | 42 238 | | | | 43 044 | | | | — | | | | — | | | | 42 238 | | | | 43 044 | |
Jim Stening(5) | | | 25 466 | | | | — | | | | 2 419 | | | | — | | | | 27 885 | | | | — | |
| | | | | | | | | | | | | | | | | | | | | | | | |
Total | | | 299 806 | | | | 377 703 | | | | 17 405 | | | | 17 690 | | | | 317 211 | | | | 395 393 | |
| | | | | | | | | | | | | | | | | | | | | | | | |
| (1) | Appointed 13 November 2014 – From the date of appointment, no remuneration is payable to the Queensland Treasury representative |
| (2) | Resigned 13 November 2014 |
| (3) | Resigned 20 August 2014 |
| (4) | Resigned 30 June 2014 |
| (5) | Appointed 13 November 2014 |
| | | | |
| 44 | | ANNUAL REPORT 2014-15 | | QUEENSLAND TREASURY CORPORATION |
Notes to the Financial Statements Other information
For the year ended 30 June 2015
| 20 | KEY MANAGEMENT PERSONNEL CONTINUED |
| (d) | Remuneration by category CONTINUED |
Details of the nature and amount of each major element of the remuneration of the executive management personnel are as follows:
| | | | | | | | | | | | | | | | | | | | | | | | |
| | | SHORT-TERM EMPLOYMENT BENEFITS | | | POST-EMPLOYMENT
BENEFITS | | | LONG-TERM
BENEFITS | | | TOTAL | |
30 JUNE 2015 | | BASE
$ | | | SHORT-TERM
INCENTIVE
$ | | | NON-
MONETARY $ | | | $ | | | $ | | | $ | |
Chief Executive | | | 613 094 | | | | 317 000 | | | | 29 152 | | | | 18 700 | | | | 16 056 | | | | 994 002 | |
Executive General Manager, Funding & Markets | | | 439 782 | | | | 201 294 | | | | 9 003 | | | | 18 717 | | | | 13 506 | | | | 682 302 | |
Chief Operating Officer | | | 309 445 | | | | 148 761 | | | | 13 429 | | | | 29 397 | | | | 11 055 | | | | 512 087 | |
Executive General Manager, Client Services | | | 298 985 | | | | 147 451 | | | | 13 429 | | | | 18 717 | | | | 8 090 | | | | 486 672 | |
| | | | | | |
30 JUNE 2014 | | | | | | | | | | | | | | | | | | |
Chief Executive | | | 594 041 | | | | 249 840 | | | | 22 740 | | | | 17 714 | | | | 17 006 | | | | 901 341 | |
Executive General Manager, Funding & Markets | | | 427 537 | | | | 169 600 | | | | 8 519 | | | | 17 714 | | | | 14 968 | | | | 638 338 | |
Chief Operating Officer | | | 294 918 | | | | 134 000 | | | | 12 774 | | | | 26 131 | | | | 21 011 | | | | 488 834 | |
Executive General Manager, Client Services | | | 285 879 | | | | 137 800 | | | | 12 774 | | | | 17 714 | | | | 9 486 | | | | 463 653 | |
There were no loans to/from key management personnel during the financial year.
The external auditor (Auditor-General of Queensland) does not provide any consulting services to QTC. Details of amounts paid or payable to the auditor of QTC (GST exclusive) are shown below:
| | | | | | | | |
| | | 2015
$ | | | 2014
$ | |
| | |
Audit services | | | | | | | | |
Audit and review of QTC financial statements | | | 360 000 | | | | 375 000 | |
| 22 | INVESTMENTS IN COMPANIES |
Investments in the following companies are held at cost:
| | |
NAME | | PRINCIPAL ACTIVITIES |
| Queensland Treasury Holdings Pty Ltd (QTH) | | Holding company for a number of subsidiaries and strategic investments held on behalf of the State of Queensland |
| Queensland Lottery Corporation Pty Ltd | | Holds the Golden Casket lottery licence and trade marks |
| DBCT Holdings Pty Ltd | | Holds the bulk coal terminal tenure and facilities at Dalrymple Bay near Mackay, which is leased under a long term lease arrangement |
| Queensland Airport Holdings (Mackay) Pty Ltd | | Owns the Mackay airport land and infrastructure which it has leased under a 99 year lease arrangement |
| Queensland Airport Holdings (Cairns) Pty Ltd | | Owns the Cairns airport land and infrastructure which it has leased under a 99 year lease arrangement |
| Brisbane Port Holdings Pty Ltd | | Owns the Port of Brisbane tenure and infrastructure which it has leased under a 99 year lease arrangement |
| City North Infrastructure Pty Ltd | | Project managed the procurement of the Airport Link, Northern Busway and Airport Round-about Upgrade projects |
The principal activity of QTC’s main investment company, Queensland Treasury Holdings Pty Ltd (QTH), is to act as a corporate vehicle through which the Queensland Government undertakes activities of strategic importance to the State. QTH holds a 100 per cent beneficial interest in the companies listed above. Queensland Treasury holds a 60 per cent beneficial interest in QTH. The remaining 40 per cent is held by QTC for and on behalf of the Under Treasurer as Corporation Sole of QTC. QTC does not apply the equity method to its investment in QTH as it does not have power over the entity, exposure or rights to variable returns or power to affect those returns.
QTC pays dividends to the Queensland Government from time to time. A dividend of $41.0 million was provided for during the year (2014 $120.0 million).
| 24 | EVENTS SUBSEQUENT TO BALANCE DATE |
There are no matters or circumstances which have arisen since the end of the financial year that have significantly affected or may significantly affect the operations of QTC, the results of those operations or the state of affairs of QTC in future years.
| | | | |
| QUEENSLAND TREASURY CORPORATION | | ANNUAL REPORT 2014-15 | | 45 |
Certificate of the Queensland Treasury Corporation
The foregoing general purpose financial statements have been prepared in accordance with the Financial Accountability Act 2009 and other prescribed requirements.
The Directors draw attention to note 2(a) to the financial statements, which includes a statement of compliance with International Financial Reporting Standards.
We certify that in our opinion:
| (i) | the prescribed requirements for establishing and keeping the accounts have been complied with in all material respects |
| (ii) | the foregoing annual financial statements have been drawn up so as to present a true and fair view of Queensland Treasury Corporation’s assets and liabilities, financial position and financial performance for the year ended 30 June 2015, and |
| (iii) | the management report includes a fair review of the information required under article 3(2)(c) of the Law of January 11, 2008 on transparency requirements for issuers of securities on the Luxembourg Stock Exchange. |
Signed in accordance with a resolution of the directors.
| | |

| | 
|
| G P BRADLEY | | P C NOBLE |
| Chairman | | Chief Executive |
Brisbane
13 August 2015
| | | | |
| 46 | | ANNUAL REPORT 2014-15 | | QUEENSLAND TREASURY CORPORATION |
Independent Auditor’s report
To the Capital Markets Board of Queensland Treasury Corporation
REPORT ON THE FINANCIAL REPORT
I have audited the accompanying financial report of Queensland Treasury Corporation, which comprises the balance sheet as at 30 June 2015, the statement of comprehensive income, statement of changes in equity and statement of cash flows for the year then ended, notes comprising a summary of significant accounting policies and other explanatory information, and certificates given by the Chairman and Chief Executive.
THE BOARD’S RESPONSIBILITY FOR THE FINANCIAL REPORT
The Capital Markets Board (the Board), as delegated by the Corporation Sole, is responsible for the preparation of the financial report that gives a true and fair view in accordance with prescribed accounting requirements identified in the Financial Accountability Act 2009 and the Financial and Performance Management Standard 2009, including compliance with Australian Accounting Standards. The Board’s responsibility also includes such internal control as the Board determines is necessary to enable the preparation of the financial report that gives a true and fair view and is free from material misstatement, whether due to fraud or error. In Note 2(a), the Board also states, in accordance with Accounting Standard AASB 101 Presentation of Financial Statements, that the financial statements comply with International Financial Reporting Standards.
AUDITOR’S RESPONSIBILITY
My responsibility is to express an opinion on the financial report based on the audit. The audit was conducted in accordance with the Auditor-General of Queensland Auditing Standards, which incorporate the Australian Auditing Standards. Those standards require compliance with relevant ethical requirements relating to audit engagements and that the audit is planned and performed to obtain reasonable assurance about whether the financial report is free from material misstatement.
An audit involves performing procedures to obtain audit evidence about the amounts and disclosures in the financial report. The procedures selected depend on the auditor’s judgement, including the assessment of the risks of material misstatement of the financial report, whether due to fraud or error. In making those risk assessments, the auditor considers internal control relevant to the entity’s preparation of the financial report that gives a true and fair view in order to design audit procedures that are appropriate in the circumstances, but not for the purpose of expressing an opinion on the effectiveness of the entity’s internal control, other than in expressing an opinion on compliance with prescribed requirements. An audit also includes evaluating the appropriateness of accounting policies used and the reasonableness of accounting estimates made by the Board, as well as evaluating the overall presentation of the financial report including any mandatory financial reporting requirements approved by the Treasurer for application in Queensland.
I believe that the audit evidence obtained is sufficient and appropriate to provide a basis for my audit opinion.
INDEPENDENCE
The Auditor-General Act 2009 promotes the independence of the Auditor-General and all authorised auditors. The Auditor-General is the auditor of all Queensland public sector entities and can be removed only by Parliament.
The Auditor-General may conduct an audit in any way considered appropriate and is not subject to direction by any person about the way in which audit powers are to be exercised. The Auditor-General has for the purposes of conducting an audit, access to all documents and property and can report to Parliament matters which in the Auditor-General’s opinion are significant.
| | | | |
| QUEENSLAND TREASURY CORPORATION | | ANNUAL REPORT 2014-15 | | 47 |
OPINION
In accordance with s.40 of the Auditor-General Act 2009 –
(a) I have received all the information and explanations which I have required; and
(b) in my opinion –
| | (i) | the prescribed requirements in relation to the establishment and keeping of accounts have been complied with in all material respects; and |
| | (ii) | the financial report presents a true and fair view, in accordance with the prescribed accounting standards, of the transactions of the Queensland Treasury Corporation for the financial year 1 July 2014 to 30 June 2015 and of the financial position as at the end of that year; and |
| | (iii) | the financial report also complies with International Financial Reporting Standards as disclosed in Note 2(a). |
OTHER MATTERS – ELECTRONIC PRESENTATION OF THE AUDITED FINANCIAL REPORT
Those viewing an electronic presentation of these financial statements should note that audit does not provide assurance on the integrity of the information presented electronically and does not provide an opinion on any information which may be hyperlinked to or from the financial statements. If users of the financial statements are concerned with the inherent risks arising from electronic presentation of information, they are advised to refer to the printed copy of the audited financial statements to confirm the accuracy of this electronically presented information.
| | | | |

| | | | 
|
| A M GREAVES FCA FCPA | | | | |
| Auditor-General of Queensland | | | | Queensland Audit Office Brisbane |
| | | | |
| 48 | | ANNUAL REPORT 2014-15 | | QUEENSLAND TREASURY CORPORATION |
Management report
for the year ended 30 June 2015
REVIEW OF OPERATIONS
QTC made an operating profit after tax for the year ended 30 June 2015 of AUD 192.558 million consisting of the following operating segment results:
CAPITAL MARKETS OPERATIONS
During the period from 1 July 2014 to 30 June 2015, QTC continued in its ordinary course of business as the State of Queensland’s central financing authority and corporate treasury services provider. The operating profit after tax for the year ended 30 June 2015 for the Capital Markets Operations segment was AUD 41.280 million.
LONG TERM ASSETS
QTC holds a portfolio of assets which were transferred to QTC by the State Government under an administrative arrangement. These assets are the investments of QTC’s Long Term Assets segment and were accumulated to fund superannuation and other long-term obligations of the State such as insurance and long service leave. In return, QTC issued to the State fixed rate notes which has resulted in the State receiving a fixed rate of return on the notes, while QTC bears the impact of fluctuations in the value and returns on the asset portfolio.
The operating profit after tax for the Long Term Assets segment was AUD 151.278 million with all major asset classes of the portfolio delivering positive outcomes for the year.
PRINCIPAL RISKS AND UNCERTAINTIES
During the financial year, financial market conditions were more volatile relative to the prior year due to geo-political risks in the Middle-East, Russia and Ukraine. The collapse of negotiations between Greece and its creditors as well as the uncertainty over the anticipated tightening cycle by US monetary policymakers and the volatility in China’s equity markets provide uncertainties leading into 2015–16. A sustained market reaction to any of these issues would make QTC’s funding task more difficult compared to the past. However QTC has established a long track record of attracting investors and raising funds in a cost effective manner across a variety of market conditions and as such, the volatile market conditions are not expected to materially impact on QTC’s performance or its ability to fund the State’s borrowing requirement in 2015–16.
| | | | |
| QUEENSLAND TREASURY CORPORATION | | ANNUAL REPORT 2014-15 | | 49 |
Appendices
| | | | |
Appendix A – Loans to clients | | | 50 | |
| |
Appendix B – Statutory and mandatory disclosures | | | 54 | |
| |
Appendix C – Glossary | | | 55 | |
| |
Appendix D – Compliance checklist | | | 56 | |
| |
Appendix E – Contacts | | | 57 | |
| | | | |
| 50 | | ANNUAL REPORT 2014-15 | | QUEENSLAND TREASURY CORPORATION |
Appendix A – Loans to clients
| | | | | | | | |
LOANS TO CLIENTS | | TOTAL DEBT OUTSTANDING
(MARKET VALUE)
30 JUNE 2014
$000 | | | TOTAL DEBT OUTSTANDING
(MARKET VALUE)
30 JUNE 2015
$000 | |
| | |
BODIES WITHIN THE PUBLIC ACCOUNTS | | | | | | | | |
CITEC | | | 8 643 | | | | 1 958 | |
Department of Education and Training | | | 62 569 | | | | 57 696 | |
Department of National Parks Sport and Racing | | | 204 | | | | 92 | |
Department of Premier and Cabinet –Arts Queensland | | | 6 370 | | | | 3 355 | |
Department of State Development | | | 90 290 | | | | 78 933 | |
Department of the Premier and Cabinet | | | 11 759 | | | | — | |
Department of Transport and Main Roads – Main Roads | | | 936 367 | | | | 852 036 | |
Department of Transport and Main Roads – Queensland Transport | | | 105 208 | | | | 105 281 | |
Public Safety Business Agency | | | — | | | | 10 122 | |
Public Works – Department of Housing and Public Works | | | 16 939 | | | | 15 364 | |
QFleet | | | 129 362 | | | | 137 934 | |
Queensland Health | | | 82 830 | | | | 70 854 | |
Queensland Treasury | | | 41 482 531 | | | | 43 605 019 | |
| | | | | | | | |
Total | | | 42 933 073 | | | | 44 938 644 | |
| | | | | | | | |
| | |
GOVERNMENT OWNED CORPORATIONS | | | | | | | | |
CS Energy Ltd | | | 925 178 | | | | 938 681 | |
ENERGEX Limited | | | 6 706 288 | | | | 7 006 356 | |
Ergon Energy Corporation Limited | | | 5 396 157 | | | | 5 506 523 | |
Gladstone Ports Corporation | | | 507 053 | | | | 508 777 | |
North Queensland Bulk Ports Corporation Limited | | | 69 622 | | | | 69 551 | |
Port of Townsville Limited | | | 89 088 | | | | 87 749 | |
Powerlink | | | 4 422 729 | | | | 4 761 669 | |
Stanwell Corporation Limited | | | 639 161 | | | | 902 689 | |
SunWater Limited | | | 298 249 | | | | 296 014 | |
| | | | | �� | | | |
Total | | | 19 053 525 | | | | 20 078 008 | |
| | | | | | | | |
| | |
LOCAL GOVERNMENTS | | | | | | | | |
Aurukun Shire Council | | | — | | | | 744 | |
Balonne Shire Council | | | 4 196 | | | | 4 004 | |
Banana Shire Council | | | 13 127 | | | | 12 989 | |
Barcaldine Regional Council | | | 3 034 | | | | 3 813 | |
Barcoo Shire Council | | | 103 | | | | 77 | |
Blackall Tambo Regional Council | | | 2 420 | | | | 2 016 | |
Boulia Shire Council | | | — | | | | 1 308 | |
Brisbane City Council | | | 2 917 889 | | | | 2 403 979 | |
Bulloo Shire Council | | | 5 572 | | | | 5 024 | |
Bundaberg Regional Council | | | 59 268 | | | | 76 442 | |
Burdekin Shire Council | | | 8 110 | | | | 8 669 | |
Cairns Regional Council | | | 98 405 | | | | 97 034 | |
Carpentaria Shire Council | | | 5 211 | | | | 11 068 | |
Cassowary Coast Regional Council | | | 25 850 | | | | 24 985 | |
Central Highlands Regional Council | | | 59 659 | | | | 75 571 | |
Charters Towers Regional Council | | | 86 | | | | — | |
Cloncurry Shire Council | | | 15 405 | | | | 13 135 | |
Cook Shire Council | | | 5 038 | | | | 6 107 | |
| | | | |
| QUEENSLAND TREASURY CORPORATION | | ANNUAL REPORT 2014-15 | | 51 |
Appendix A – Loans to clients continued
| | | | | | | | |
LOANS TO CLIENTS | | TOTAL DEBT OUTSTANDING
(MARKET VALUE)
30 JUNE 2014
$000 | | | TOTAL DEBT OUTSTANDING
(MARKET VALUE)
30 JUNE 2015
$000 | |
| | |
LOCAL GOVERNMENTS CONTINUED | | | | | | | | |
Diamantina Shire Council | | | 1 156 | | | | 1 228 | |
Douglas Shire Council | | | 2 617 | | | | 2 545 | |
Etheridge Shire Council | | | 1 402 | | | | 858 | |
Flinders Shire Council | | | 1 004 | | | | 1 645 | |
Fraser Coast Regional Council | | | 122 701 | | | | 169 962 | |
Gladstone Regional Council | | | 190 813 | | | | 185 709 | |
Gold Coast City Council | | | 882 090 | | | | 877 992 | |
Goondiwindi Regional Council | | | — | | | | 2 006 | |
Gympie Regional Council | | | 28 212 | | | | 27 561 | |
Ipswich City Council | | | 456 713 | | | | 277 499 | |
Isaac Regional Council | | | 42 502 | | | | 42 052 | |
Kowanyama Aboriginal Council | | | 2 019 | | | | 2 167 | |
Livingstone Shire Council | | | 84 695 | | | | 79 930 | |
Local Government Association of Queensland | | | 7 246 | | | | 10 312 | |
Lockyer Valley Regional Council | | | 36 070 | | | | 37 576 | |
Logan City Council | | | 247 183 | | | | 284 883 | |
Longreach Regional Council | | | 9 034 | | | | 9 607 | |
Mackay Regional Council | | | 262 600 | | | | 223 970 | |
Maranoa Regional Council | | | 23 476 | | | | 17 926 | |
Mareeba Shire Council | | | 6 523 | | | | 2 368 | |
McKinlay Shire Council | | | 575 | | | | 386 | |
Moreton Bay Regional Council | | | 446 535 | | | | 454 240 | |
Mount Isa City Council | | | 33 869 | | | | 33 374 | |
Murweh Shire Council | | | 4 040 | | | | 3 521 | |
Noosa Shire Council | | | 48 056 | | | | 44 938 | |
North Burnett Regional Council | | | 3 843 | | | | 3 442 | |
Northern Peninsula Area Regional Council | | | 2 405 | �� | | | 2 466 | |
Paroo Shire Council | | | 6 075 | | | | 2 495 | |
Redland City Council | | | 66 724 | | | | 62 728 | |
Richmond Shire Council | | | 439 | | | | — | |
Rockhampton Regional Council | | | 171 244 | | | | 171 517 | |
Scenic Rim Regional Council | | | 15 556 | | | | 19 285 | |
South Burnett Regional Council | | | 38 076 | | | | 47 030 | |
Southern Downs Regional Council | | | 35 149 | | | | 33 879 | |
Sunshine Coast Regional Council | | | 249 224 | | | | 297 022 | |
Tablelands Regional Council | | | 6 375 | | | | 7 826 | |
Toowoomba Regional Council | | | 172 533 | | | | 185 047 | |
Torres Shire Council | | | 1 580 | | | | 1 316 | |
Torres Strait Island Regional Council | | | 476 | | | | 432 | |
Townsville City Council | | | 388 311 | | | | 389 222 | |
Western Downs Regional Council | | | 74 854 | | | | 63 270 | |
Whitsunday Regional Council | | | 77 635 | | | | 69 489 | |
Winton Shire Council | | | 3 373 | | | | 3 262 | |
| | | | | | | | |
Total | | | 7 478 377 | | | | 6 900 944 | |
| | | | | | | | |
| | | | |
| 52 | | ANNUAL REPORT 2014-15 | | QUEENSLAND TREASURY CORPORATION |
Appendix A – Loans to clients continued
| | | | | | | | |
LOANS TO CLIENTS | | TOTAL DEBT OUTSTANDING
(MARKET VALUE)
30 JUNE 2014
$000 | | | TOTAL DEBT OUTSTANDING
(MARKET VALUE)
30 JUNE 2015
$000 | |
| | |
STATUTORY BODIES | | | | | | | | |
| | |
Grammar schools | | | | | | | | |
Brisbane Girls’ Grammar School | | | 31 724 | | | | 29 775 | |
Brisbane Grammar School | | | 11 196 | | | | 9 606 | |
Ipswich Girls Grammar School | | | 22 661 | | | | 22 339 | |
Ipswich Grammar School | | | 1 216 | | | | — | |
Rockhampton Girls Grammar School | | | 4 279 | | | | 4 120 | |
Rockhampton Grammar School | | | 20 344 | | | | 19 874 | |
Toowoomba Grammar School | | | 7 652 | | | | 13 060 | |
Townsville Grammar School | | | 15 436 | | | | 14 755 | |
| | |
Queensland Water Entities | | | | | | | | |
Queensland Urban Utilities | | | 599 418 | | | | 1 578 888 | |
Seqwater | | | 10 530 999 | | | | 10 863 074 | |
Unitywater | | | 412 397 | | | | 418 143 | |
| | |
Universities | | | | | | | | |
Griffith University | | | 36 451 | | | | 95 612 | |
James Cook University | | | 82 958 | | | | 80 156 | |
Queensland University of Technology | | | 80 689 | | | | 81 264 | |
Sunshine Coast University | | | 14 171 | | | | 12 547 | |
University of Southern Queensland | | | 12 181 | | | | 10 805 | |
| | |
Water Boards | | | | | | | | |
Fernlee Water Authority | | | 946 | | | | 925 | |
Gladstone Area Water Board | | | 240 074 | | | | 229 846 | |
Glamorgan Vale Water Board | | | — | | | | 146 | |
Grevillea Water Pty Ltd | | | 159 | | | | 154 | |
Kelsey Creek Water Board | | | 225 | | | | — | |
Mount Isa Water Board | | | 4 880 | | | | 4 218 | |
Pioneer Valley Water Board | | | 611 | | | | 339 | |
| | |
Water Supply Boards | | | | | | | | |
Bollon South Water Authority | | | 482 | | | | 406 | |
Bollon West Water Authority | | | 1 362 | | | | 1 249 | |
Ingie Water Authority | | | 305 | | | | 268 | |
| | |
Other Statutory Bodies | | | | | | | | |
Economic Development Queensland | | | 57 616 | | | | 46 592 | |
Queensland Rail Limited | | | 3 351 674 | | | | 3 385 746 | |
Queensland Rural Adjustments Authority | | | 3 555 | | | | 2 394 | |
South Bank Corporation | | | 13 673 | | | | — | |
Stadiums Queensland | | | 121 233 | | | | 117 995 | |
| | | | | | | | |
Total | | | 15 680 569 | | | | 17 044 296 | |
| | | | | | | | |
| | | | |
| QUEENSLAND TREASURY CORPORATION | | ANNUAL REPORT 2014-15 | | 53 |
Appendix A – Loans to clients continued
| | | | | | | | |
LOANS TO CLIENTS | | TOTAL DEBT OUTSTANDING
(MARKET VALUE)
30 JUNE 2014
$000 | | | TOTAL DEBT OUTSTANDING
(MARKET VALUE)
30 JUNE 2015
$000 | |
| | |
QTC RELATED ENTITIES | | | | | | | | |
DBCT Holdings Pty Ltd | | | 157 520 | | | | 148 302 | |
| | | | | | | | |
Total | | | 157 520 | | | | 148 302 | |
| | | | | | | | |
| | |
OTHER BODIES | | | | | | | | |
Aspire Schools Financing Services | | | 229 229 | | | | 232 637 | |
Aviation Australia Pty Ltd | | | 1 895 | | | | 1 681 | |
Cooperative Housing Societies | | | 1 027 | | | | 1 218 | |
Royal National Agricultural Industry Association of Queensland | | | 71 028 | | | | 70 455 | |
State Schools | | | 2 548 | | | | 2 124 | |
Suncorp Metway Facility | | | 856 | | | | 680 | |
| | | | | | | | |
Total | | | 306 582 | | | | 308 794 | |
| | | | | | | | |
GRAND TOTAL | | | 85 609 647 | | | | 89 418 988 | |
| | | | | | | | |
| | | | |
| 54 | | ANNUAL REPORT 2014-15 | | QUEENSLAND TREASURY CORPORATION |
Appendix B – Statutory and mandatory disclosures
QTC is required to make various disclosures in its Annual Report. QTC is also required to make various disclosures on the Queensland Government’s Open Data website (qld.gov.au/data) in lieu of inclusion in its Annual Report. This Appendix sets out those mandatory disclosure statements that are not included elsewhere in the report or made available on the Open Data website.
INFORMATION SYSTEMS AND RECORD KEEPING
During the year, QTC continued its compliance with the provisions of the Public Records Act 2002, and its implementation of the Information Standard 40: Recordkeeping and Information Standard 31: Retention and Disposal of Public Records.
QTC has continued its work with State Archives on the development of a QTC-specific Local Retention and Disposal Schedule, and provides training to staff in the appropriate management of public records in all formats, including email.
During the year, QTC implemented a new electronic document management system for improved information management and storage cost reduction.
PUBLIC SECTOR ETHICS ACT
QTC provides the following information pursuant to obligations under section 23 of the Public Sector Ethics Act 1994 (Qld) to report on action taken to comply with certain sections of the Act.
QTC employees are required to comply with QTC’s Code of Conduct for employees, which aligns with the ethics principles and values in the Public Sector Ethics Act 1994, as well as the Code of Ethics and Code of Conduct established by the Australian Financial Markets Association of which QTC is a member. Both codes are available to employees via QTC’s intranet. Copies of these codes can be inspected by contacting QTC’s Human Resources Group (see Appendix E for contact details). Appropriate education and training about the code of conduct has been provided to QTC staff.
QTC’s human resource management and corporate governance policies and practices ensure that QTC:
| • | | acts ethically with regard to its Code of Conduct and within appropriate law, policy and convention, and |
| • | | addresses the systems and processes necessary for the proper direction and management of its business and affairs. |
QTC is committed to:
| • | | observing high standards of integrity and fair-dealing in the conduct of its business, and |
| • | | acting with due care, diligence and skill. |
QTC’s Compliance Policy requires that QTC and all employees comply with the letter and the spirit of all relevant laws and regulations, industry standards, and relevant government policies, as well as QTC’s own policies and procedures.
REMUNERATION: BOARD AND COMMITTEE
For the year ending 30 June 2015, the remuneration and committee fees of the QTC Capital Market Board members (excluding superannuation contributions and non-monetary benefits) were as follows:
| | | | | | | | | | |
Board | | | | | Committee | | | |
Chairperson | | $ | 100,527 | | | Chairperson | | $ | 6,658 | |
Member | | $ | 33,551 | | | Member | | $ | 5,152 | |
The total remuneration payments made to the members of the QTC Capital Market Board was $305,909 and the total on-costs (including travel, accommodation, and hiring of motor vehicles for the members) was $36,623.
No payments in relation to remuneration or on-costs (including travel, accommodation, and hiring of motor vehicles for the members) were made to members of the Long Term Asset Advisory Board in the year ending 30 June 2015.
RELATED ENTITIES
The related entities in Note 22 (except City North Infrastructure Pty Ltd) are consolidated into Queensland Treasury’s financial report.
| | | | |
| QUEENSLAND TREASURY CORPORATION | | ANNUAL REPORT 2014-15 | | 55 |
Appendix C – Glossary
Australian Government Guarantee (AGG): Also known as the Commonwealth Government Guarantee. In response to the global financial crisis, on 25 March 2009, the Australian Government provided a time-limited, voluntary guarantee over existing and new Australian state and territory government borrowing. On 16 June 2009, the Queensland Government took up the guarantee on all existing QTC AUD denominated benchmark bond lines (global and domestic) with a maturity date of between 12 months and 180 months (1-15 years). The RBA approved QTC’s application on 11 December 2009. The AGG was withdrawn for new borrowings after 31 December 2010.
Basis point: One hundredth of one per cent (0.01%).
Bond: A financial instrument where the borrower agrees to pay the investor a rate of interest for a fixed period of time. A typical bond will involve regular interest payments and a return of principal at maturity.
Commonwealth Government Guarantee (CGG): See Australian Government Guarantee above.
CP (commercial paper): A short-term money market instrument issued at a discount with the full face value repaid at maturity. CP can be issued in various currencies with a term to maturity of less than one year.
Credit rating: Measures a borrower’s creditworthiness and provides an international framework for comparing the credit quality of issuers and rated debt securities. Rating agencies allocate three kinds of ratings: issuer credit ratings, long-term debt and short-term debt. Issuer credit ratings are among the most widely watched. They measure the creditworthiness of the borrower including its capacity and willingness to meet financial obligations. QTC has a strong rating from two rating agencies—Standard & Poor’s, and Moody’s.
Fixed Income Distribution Group: A group of financial intermediaries who market and make prices in QTC’s debt instruments.
Floating rate notes (FRNs): A debt instrument which pays a variable rate of interest (coupon) at specified dates over the term of the debt, as well as repaying the principal of the maturity date. The floating rate is usually a money market reference rate, such as BBSW, plus a fixed margin. Typically the interest is paid quarterly or monthly.
GOC: Government-owned corporation.
Issue price: The price at which a new security is issued in the primary market.
Liquid: Markets or instruments are described as being liquid, and having depth, if there are enough buyers and sellers to absorb sudden shifts in supply and demand without price distortions.
Market value: The price at which an instrument can be purchased or sold in the current market.
MTN (Medium-Term Note): A financial debt instrument that can be structured to meet an investor’s requirements in regards to interest rate basis, currency and maturity. MTNs usually have maturities between 9 months and 30 years.
QTC: Queensland Treasury Corporation.
RBA: Reserve Bank of Australia.
T-Note (Treasury Note): A short-term money market instrument issued at a discount with the full face value repaid at maturity. T-Notes are issued in Australian dollars with a term to maturity of less than 1 year.
| | | | |
| 56 | | ANNUAL REPORT 2014-15 | | QUEENSLAND TREASURY CORPORATION |
Appendix D – Compliance checklist
| | | | | | |
SUMMARY OF REQUIREMENT | | | | BASIS FOR REQUIREMENT | | ANNUAL REPORT REFERENCE |
| LETTER OF COMPLIANCE | | A letter of compliance from the accountable officer or statutory body to the relevant Minister/s | | ARRs – section 8 | | Page 1 |
| | | |
| ACCESSIBILITY | | Table of contents | | ARRs – section 10.1 | | Inside front cover |
| | Glossary | | | | Appendix C |
| | Public availability | | ARRs – section 10.2 | | Appendix E |
| | Interpreter service statement | | Queensland Government
Language Services Policy | | Appendix E |
| | | | ARRs – section 10.3 | | |
| | Copyright notice | | Copyright Act 1968 | | Back cover |
| | | | ARRs – section 10.4 | | |
| | | |
| GENERAL | | Introductory Information | | ARRs – section 11.1 | | Page 2 |
| INFORMATION | | Agency role and main functions | | ARRs – section 11.2 | | Page 2-3, back cover |
| | Operating environment | | ARRs – section 11.3 | | Pages 3-13, 15 |
| | | |
NON-FINANCIAL PERFORMANCE | | Government’s objectives for the community | | ARRs – section 12.1 | | Pages 6-13 |
| | Agency objectives and | | ARRs – section 12.3 | | Pages 4-13 |
| | performance indicators | | | | |
| | | |
FINANCIAL PERFORMANCE | | Summary of financial performance | | ARRs – section 13.1 | | Pages 4-5, Notes to Financial
Statements: Pages 24-45 |
| | | |
| GOVERNANCE – | | Organisational structure | | ARRs – section 14.1 | | Pages 14-18 |
| MANAGEMENT | | Executive management | | ARRs – section 14.2 | | Page 5, 18 |
| AND STRUCTURE | | Public Sector Ethics Act 1994 | | Public Sector Ethics Act 1994 | | Appendix B |
| | | | ARRs – section 14.4 | | |
| | | |
| GOVERNANCE – | | Risk management | | ARRs – section 15.1 | | Page 12 |
| RISK MANAGEMENT | | Audit committee | | ARRs – section 15.3 | | Pages 14-15 |
| AND ACCOUNTABILITY | | Internal audit | | ARRs – section 15.4 | | Page 18 |
| | Information systems and recordkeeping | | ARRs – section 15.5 | | Appendix B |
| | | |
GOVERNANCE – HUMAN RESOURCES | | Workforce planning and performance | | ARRs – section 16.1 | | Pages 12-13 |
| | | |
| OPEN DATA | | Consultancies | | ARRs – section 17 | | Appendix B |
| | | | ARRs – section 34.1 | | |
| | Overseas travel | | ARRs – section 17 | | Appendix B |
| | | | ARRs – section 34.2 | | |
| | Queensland Language Services Policy | | ARRs – section 17
ARRs – section 34.3 | | Appendix B |
| | Government bodies | | ARRs – section 17 | | Appendix B |
| | | | ARRs – section 34.4 | | |
| | | |
FINANCIAL STATEMENTS | | Certification of financial statements | | FAA – section 62
FPMS – sections 42, 43 and 50 | | Page 45 |
| | | | ARRs – section 18.1 | | |
| | Independent Auditor’s Report | | FAA – section 62 | | Pages 46-47 |
| | | | FPMS – section 50 | | |
| | | | ARRs – section 18.2 | | |
| | Remuneration disclosures | | Financial Reporting Requirements
for Queensland Government
Agencies | | Financial Statements
Note 20 |
| | | | ARRs – section 18.3 | | |
Note: This checklist excludes reference to any requirements that do not apply to QTC for the current reporting period.
FAA: Financial Accountability Act 2009; FPMS: Financial and Performance Management Standard 2009; ARRs: Annual report requirements for Queensland Government agencies
| | | | |
| QUEENSLAND TREASURY CORPORATION | | ANNUAL REPORT 2014-15 | | 57 |
Appendix E – Contacts
QUEENSLAND TREASURY CORPORATION
| | |
| Level 6, 123 Albert Street |
| Brisbane Queensland Australia |
|
| GPO Box 1096 |
| Brisbane Queensland |
| Australia 4001 |
| |
Telephone: | | +61 7 3842 4600 |
| Facsimile: | | +61 7 3221 4122 |
| |
| Email: | | enquiry@qtc.com.au |
| Internet: | | www.qtc.com.au |
Queensland Treasury Corporation’s annual and half-yearly reports (ISSN 1837-1256 print; ISSN 1837-1264 online) are available on QTC’s website at www.qtc.com.au/ qtc/public/annual-reports. If you would like a copy of a report posted to you, please call QTC’s Corporate Affairs office on +61 7 3842 4761.
If you would like to comment on a report, please complete the online enquiry form located on our website.
| | |
| | | TELEPHONE |
| Reception | | +61 7 3842 4600 |
| Executive Office | | +61 7 3842 4611 |
| Business Services | | +61 7 3842 4872 |
| Client Services | | +61 7 3842 4901 |
| Corporate Services | | +61 7 3842 4833 |
| Funding & Markets | | +61 7 3842 4647 |
| Strategic Alignment & Implementation | | +61 7 3842 4736 |
| Stock Registry (Link Market Services Ltd) | | 1800 777 166 |

QTC is committed to providing accessible services to Queensland residents from culturally and linguistically diverse backgrounds. If you have difficulty understanding this report, please contact QTC’s Corporate Affairs office on +61 7 3842 4761 and we will arrange for an interpreter to assist you.
| | | | |
| 58 | | ANNUAL REPORT 2014-15 | | QUEENSLAND TREASURY CORPORATION |
Appendix E – Contacts continued
DEALER PANELS AS AT 30 JUNE 2015
Note: actual dealer entities may vary depending on the facility and location of the dealer.
| | |
DOMESTIC AND GLOBAL AUD BOND FACILITY DISTRIBUTION GROUP | | Telephone |
| Australia and New Zealand Banking Group Ltd |
| Domestic (Australia) | | +61 2 8037 0220 |
| Global (London) | | +44 203 229 2070 |
| Bank of America Merrill Lynch |
| Domestic (Australia) | | +61 2 9226 5570 |
| Global (London) | | +44 207 995 6750 |
| BNP Paribas | | |
| Domestic (Australia) | | +61 2 9025 5011 |
| Global (London) | | +44 207 595 8231 |
| Citigroup Global Markets Australia Ltd |
| Domestic (Australia) | | +61 2 8225 6077 |
| Global (London) | | +44 207 986 9521 |
| Commonwealth Bank of Australia |
| Domestic (Australia) | | +61 2 9117 0020 |
| Global (London) | | +44 207 329 6444 |
| Deutsche Capital Markets Australia1 |
| Domestic (Australia) | | +61 2 8258 1444 |
| Global (London) | | +44 207 547 1931 |
| JP Morgan | | |
| Domestic (Australia) | | +61 2 9003 7988 |
| Global (London) | | +44 207 742 1829 |
| National Australia Bank Ltd |
| Domestic (Australia) | | +61 2 9295 1166 |
| Global (London) | | +44 207 726 2747 |
| Nomura International Plc |
| Domestic (Australia) | | +61 2 8062 8000 |
| Global (London) | | +44 207 103 6631 |
| RBC Capital Markets |
| Domestic (Australia) | | +61 2 9033 3222 |
| Global (London) | | +44 207 029 0094 |
| UBS Investment Bank2 |
| Domestic (Australia) | | +61 2 9324 2222 |
| Global (London) | | +44 207 567 3645 |
| Westpac Banking Corporation |
| Domestic (Australia) | | +61 2 8204 2711 |
| Global (London) | | +44 207 7621 7620 |
| | |
PANEL MEMBERS | | Telephone |
| QTC Treasury Note Facility Dealer Panel |
| Australia and New Zealand | | +61 2 8037 0360 |
| Banking Group Ltd | | |
| Commonwealth Bank of Australia Ltd (Sydney) | | +61 2 9117 0020 |
| Deutsche Bank AG (Sydney) | | +61 2 8258 2288 |
| National Australia Bank Ltd (Sydney) | | +61 2 9295 1133 |
| Westpac Banking Corporation Ltd (Sydney) | | +61 2 8204 2744 |
| US Commercial Paper Facility Dealer Panel |
| Bank of America Merrill Lynch | | +1 646 855 9561 |
| Citigroup Global Markets Inc (New York) | | +1 212 723 6252 |
| UBS Securities | | +1 203 719 7014 |
| Multicurrency Euro Commercial Paper Facility Dealer Panel |
| Bank of America Merrill Lynch | | +44 207 996 8904 |
| Barclays Bank Plc (London) | | +44 207 773 7863 |
| Citigroup International Plc (Hong Kong)3 | | +852 2501 2974 |
| National Australia Bank Limited | | +852 2526 5892 |
| (Hong Kong and London) | | |
| UBS Ltd (London) | | +44 207 329 0203 |
| Multicurrency Euro Medium-Term Note Facility Dealer Panel4 |
| Includes all Domestic and Global AUD Bond |
| Facility Distribution Group | | |
| Multicurrency US Medium-Term Note Facility Dealer Panel |
| Australia and New Zealand | | +1 212 801 9160 |
| Banking Group Limited | | |
| Bank of America Merrill Lynch | | +1 646 855 8032 |
| BNP Paribas | | +1 212 471 8240 |
| Citigroup (New York) | | +1 212 723 6171 |
| Commonwealth Bank of Australia | | +44 207 329 6444 |
| Daiwa Capital Markets Europe Limited | | +61 3 9916 1313 |
| Deutsche Bank Securities Inc (New York)3 | | +1 212 250 6801 |
| JP Morgan | | +1 212 834 4533 |
| National Australia Bank (New York) | | +1 212 916 9677 |
| RBC Capital Markets (New York) | | +1 212 858 8343 |
| UBS Investment Bank | | +1 203 719 1830 |
| 1 | Lead Manager – United States |
| 4 | Lead Arranger – UBS Ltd (London) |
| | | | |
| QUEENSLAND TREASURY CORPORATION | | ANNUAL REPORT 2014-15 | | 59 |
Appendix E – Contacts continued
ISSUING AND PAYING AGENTS
| | | | | | | | |
| | | Contact | | Telephone | | Facsimile | | Email |
AUD Treasury Notes Austraclear Services Ltd Sydney | | Help Desk | | 1300 362 257 | | +61 2 9256 0456 | | cad@asx.com.au |
AUD Domestic Bonds Link Market Services Ltd | | Markings/Transfers | | +61 2 8571 6488 | | +61 2 9287 0315 | | qtcops@linkmarketservices.com.au |
AUD Global Bonds Deutsche Bank Trust Company Americas | | Client Services | | 1 800 735 7777 Option #5 | | +1 615 866 3887 | | dwac.processing@db.com |
Euro Commercial Paper Deutsche Bank AG, London | | Client Services | | +44 207 545 8000 | | +44 207 547 6149 | | tss-gds.row@db.com |
US Commercial Paper Deutsche Bank Trust Company Americas | | Client Services | | +1 866 770 0355 | | +1 732 578 2655 | | mmi.operations@db.com |
Euro Medium-Term Notes Deutsche Bank AG, London | | Client Services | | +44 207 545 8000 | | +44 207 547 6149 | | tss-gds.row@db.com |
US Medium-Term Notes Deutsche Bank Trust Company Americas | | Client Services | | +1 866 797 2808 | | +1 212 461 4450 | | mtn.operations@db.com |
INFORMATION FOR INSTITUTIONAL INVESTORS
Core to its key funding principles, QTC is committed to being open and transparent with investors and its partners in the financial markets.
Through its website, QTC provides a range of information for investors on its various funding facilities and annual borrowing program. The website also hosts an analysts’ centre with information and links about Australia and Queensland to help investors gain a better understanding of:
| • | | the different levels of government in Australia |
| • | | the forms of fiscal support the Australian Government provides to the states and territories |
| • | | relevant governance practices, legislation and polices |
| • | | financial data and budget information, and |
| • | | economic and trade data. |
QTC also offers investors the ability to subscribe to quarterly funding updates in English, Japanese, as well as Modern Chinese and Traditional Chinese.
Website: qtc.qld.gov.au/qtc/public/web/investors
Quarterly investor updates: Subscribe from the institutional investor section of the website
Analysts’ centre: qtc.qld.gov.au/qtc/public/web/investors/ analystcentre
Bloomberg ticker: qtc
| | |
 | | Level 6 123 Albert Street Brisbane GPO Box 1096 Brisbane Queensland Australia 4001 Telephone: +61 7 3842 4600 Facsimile: +61 7 3221 4122 www.qtc.com.au |
© Queensland Treasury Corporation 2015