EXHIBIT (c)(iv)
Report entitled
“State Budget 2015-16 Mid Year Fiscal and Economic Review”.
Queensland Budget 2015-16 Mid Year Fiscal and Economic Review JOBS NOW JOBS FOR THE FUTURE Queensland Government
Mid Year Fiscal and Economic Review 2015-16
QUEENSLAND’S

| | u | | $45 million payroll tax rebate over the next three years for apprentices and trainees – 1,792 businesses have already claimed more than $3.04 million in rebates |
| | u | | Up to $5,000 Home-Based Business grants to help Queenslanders build a global business from their home |
| | u | | $40 million Business Development Fund over the next four years to match private sector investments dollar-for-dollar and take innovative business ideas to the next level |
Delivering certainty through no new fees, taxes or charges, and no change to royalties
| | u | | $1.6 billion Working Queensland jobs plan including $180 million Advance Queensland innovation initiative |
| | u | | Skilling Queenslanders for Work $8 return for every dollar spent |
| | u | | $500m Schools and Hospitals Fund providing local jobs for local projects |
Dear Fellow Queenslanders,
In the five months since our first State Budget, the Palaszczuk Government has delivered on its commitment to Queenslanders. The Budget was unashamedly pro-business and pro-jobs.
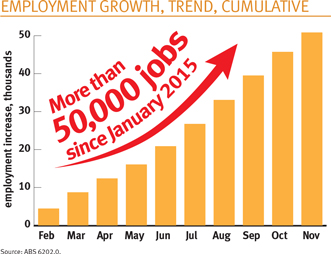
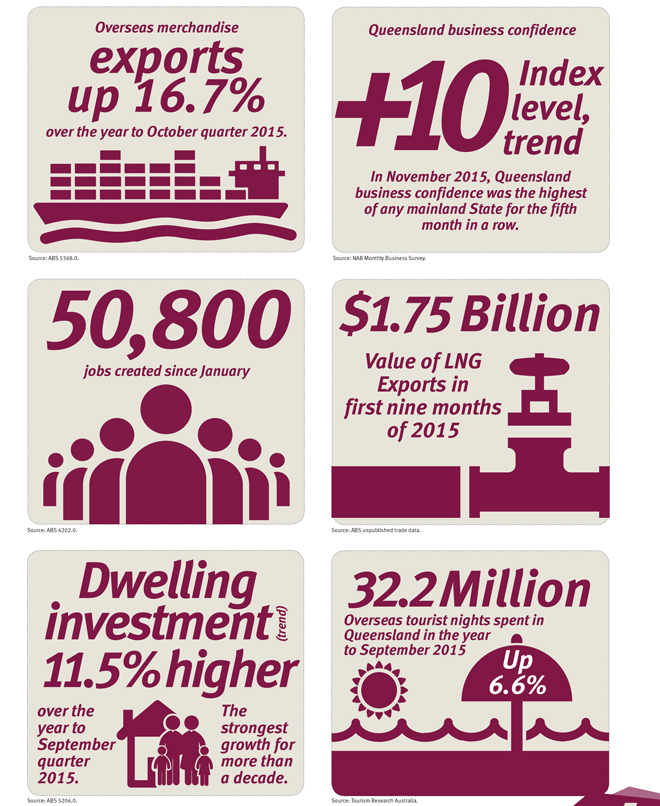
Since the Budget, business confidence has rebounded and job creation has continued to recover. Since the State Election in January, 50,800 new jobs have been created in Queensland. This includes almost 1,500 full-time jobs per month, compared with an average decline of 330 full-time jobs each month under the previous Government.
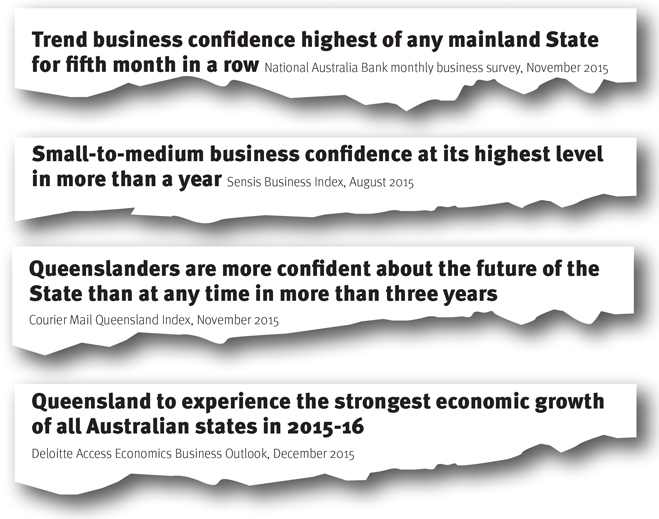
And in each of the five months since the Budget, the National Australia Bank’s monthly business survey has
ranked trend business confidence in Queensland higher than in any other mainland State.
These statistics reflect on the Government’s positive economic agenda. Queensland has the highest forecast growth of any State in both this financial year and 2016-17.
This growth is driven by growing overseas exports and a pro-business commitment to no new fees, taxes or charges in our first term.
The 2015-16 Mid Year Fiscal and Economic Review shows the progress the Government has made in building a sustainable surplus, reducing debt, fixing our schools and hospitals, and building and facilitating new infrastructure.
Mid Year Fiscal and Economic Review 2015-16
ECONOMIC PLAN

The State’s first Infrastructure Plan in four years with $10 billion allocated to planned projects and capital works this financial year
MARKET-LED PROPOSALS
Encouraging private sector projects for economic and social infrastructure
| | u | | More proposals received in the first three months than in the previous three years, including the $450 million Logan Motorway Enhancement Project |
| | u | | Delivering $680 million in savings over forecast period 19/20 through merging Ergon Energy and Energex and other efficiency measures |
| | u | | A further $1 billion to lower General Government Sector debt under the Debt Action Plan |
| | u | | Election commitments more than fully offset by savings and reprioritisations |
| | u | | Sustained operating surpluses driven by a commitment to new Fiscal Principles |
We are continuing to diversify our economy and are helping create the jobs of the future.
Growth is improving, jobs are being created and business confidence is strong. We are determined to keep this momentum going.

Curtis Pitt
Treasurer
Minister for Aboriginal and Torres Strait Islander Partnerships
Minister for Sport
Mid Year Fiscal and Economic Review 2015-16
ECONOMIC OVERVIEW

| | | | | | | | | | | | | | | | | | | | | | | | | | | | |
| | | 2014-15 | | | 2015-16 | | | 2016-17 | | | 2017-182 | | | 2018-192 | |
| | | Outcome | | | Budget | | | MYFER | | | Budget | | | MYFER | | | Forecast | | | Projection | |
Real GSP | | | 0.5 | | | | 41/2 | | | | 4 | | | | 41/2 | | | | 41/2 | | | | 33/4 | | | | 31/4 | |
Employment | | | 0.3 | | | | 11/4 | | | | 11/4 | | | | 13/4 | | | | 11/2 | | | | 2 | | | | 21/4 | |
Unemployment Rate | | | 6.5 | | | | 61/2 | | | | 61/2 | | | | 61/2 | | | | 61/2 | | | | 61/4 | | | | 6 | |
CPI | | | 1.9 | | | | 21/4 | | | | 2 | | | | 21/2 | | | | 21/2 | | | | 21/2 | | | | 21/2 | |
Wage Price Index | | | 2.4 | | | | 21/2 | | | | 21/4 | | | | 23/4 | | | | 23/4 | | | | 3 | | | | 31/4 | |
Population1 | | | 1.4 | | | | 13/4 | | | | 11/2 | | | | 13/4 | | | | 11/2 | | | | 13/4 | | | | 13/4 | |
| 1. | 2014 – 15 based on annual growth in three quarters to March quarter 2015. |
| 2. | 2017 – 18 and 2018 – 19 are as per the 2015 – 16 Budget. |
Sources: ABS 3101.0, 5220.0, 6202.0, 6345.0, 6401.0 and Queensland Treasury.
| | |
Queensland forecast growth the strongest of all states in 2015-16 | | Growth to strengthen further in 2016-17 |
| | |
|
| |
New LNG industry driving continued growth in overseas exports | | Jobs growth is forecast to pick-up |
READ MORE ON PAGE 16
Mid Year Fiscal and Economic Review 2015-16
FISCAL OUTLOOK
KEY FISCAL AGGREGATES – GENERAL GOVERNMENT SECTOR ($ MILLION)
| | | | | | | | | | | | | | | | | | | | | | | | |
| | | 2014-15
Actual | | | 2015-16
Budget | | | 2015-16
MYFER | | | 2016-17
Projection | | | 2017-18
Projection | | | 2018-19
Projection | |
Revenue | | | 49,765 | | | | 51,186 | | | | 51,354 | | | | 53,520 | | | | 55,392 | | | | 55,630 | |
Expenses | | | 49,224 | | | | 49,973 | | | | 50,180 | | | | 52,107 | | | | 53,752 | | | | 54,485 | |
Net Operating Balance | | | 542 | | | | 1,213 | | | | 1,175 | | | | 1,413 | | | | 1,640 | | | | 1,145 | |
Debt | | | 43,105 | | | | 38,151 | | | | 37,973 | | | | 38,561 | | | | 39,721 | | | | 40,921 | |
Net Debt | | | 5,772 | | | | 3,910 | | | | 4,060 | | | | 4,453 | | | | 5,621 | | | | 6,884 | |
Source: Queensland Treasury.
Meeting Fiscal Principles
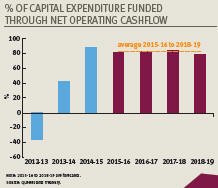
The Government is meeting its commitment to responsible fiscal management, funding 82% of its capital works program from operating cashflow across the forward estimates.
READ MORE ON PAGE 31
3

CREATING THE ENERGY
BUSINESSES OF THE FUTURE
The Queensland Government is creating an energy distribution
business for the future through the merger of Energex and
Ergon Energy under a new parent company.
The new business, with $24 billion dollars in assets, will have both the scale and expertise to meet the changing demands of Queensland consumers.
Keeping Energex and Ergon Energy in public ownership will allow the companies to focus on delivering a secure energy supply, investing in better services and supporting emerging technologies.
The merger, along with other efficiency measures across Queensland’s electricity network and generation businesses, will deliver $680 million of savings over the period to 2019-20.
The new business will be able to focus on delivering solutions that Queenslanders need in an age of rapidly evolving technology.
Merging Energex and Ergon Energy will form a larger, more diverse business, which will create new opportunities for employees. The two companies will keep their existing regionally-based operational focus but remove duplication of management, boards and corporate costs.
A new energy services business, headquartered in Townsville, will be created to combine the competitive elements of Energex and Ergon Energy.
It will deliver renewable solutions and energy management options that respond to customer demand and harness the latest innovations in energy technology, with a special focus on delivering solutions for Queensland’s remote and isolated communities.
The new energy services business will also support the development of regional Queensland and support the creation of more regional jobs.
The parent company is expected to be put in place by mid-2016. Once a new management team is established this team will guide further integration activities.
To ensure a competitive wholesale market is maintained, the generation businesses CS Energy and Stanwell will not be merged. Electricity transmission company Powerlink will also remain separate and independent.
Consistent with existing employee agreements, the Government is committed to ensuring there will be no forced redundancies as a result of the merger process.
READ MORE ON PAGE 27

4
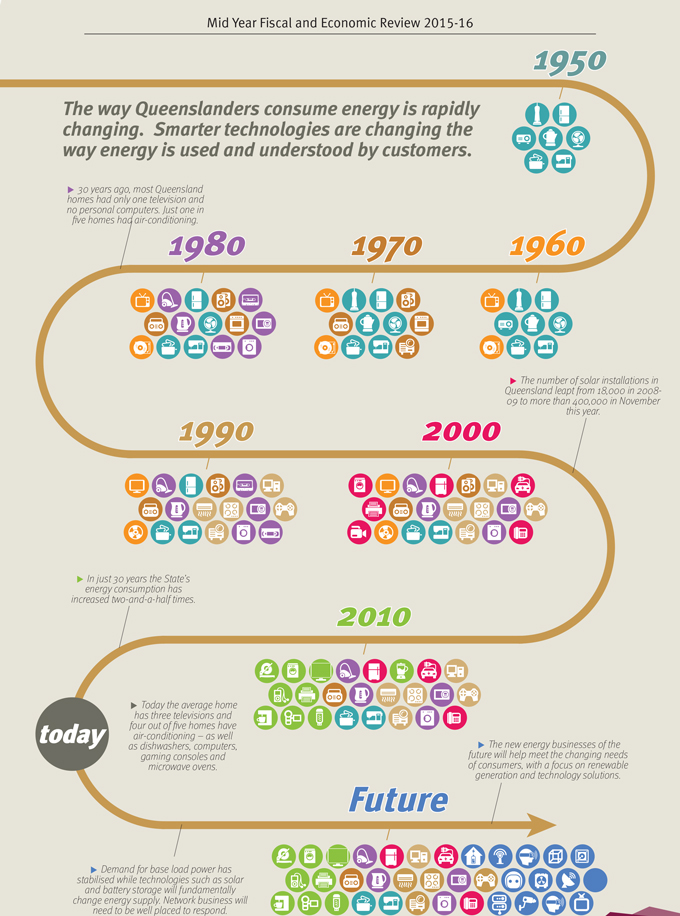
1950
The way Queenslanders consume energy is rapidly changing. Smarter technologies are changing the way energy is used and understood by customers. 30 years ago, most Queensland homes had only one television and no personal computers. Just one in five homes had air-conditioning.
1980 1970 1960 1990 2000
The number of solar installations in Queensland leapt from 18,000 in 2008- 09 to more than 400,000 in November this year.
In just 30 years the State’s energy consumption has increased two-and-a-half times.
2010 today
Today the average home has three televisions and four out of five homes have air-conditioning – as well as dishwashers, computers, gaming consoles and microwave ovens.
Future
The new energy businesses of the future will help meet the changing needs of consumers, with a focus on renewable generation and technology solutions.
Demand for base load power has stabilised while technologies such as solar and battery storage will fundamentally change energy supply. Network business will need to be well placed to respond.
5
Mid Year Fiscal and Economic Review 2015-16
ECONOMIC DEVELOPMENT
| | |
 | | Market-led proposals Encouraging private sector projects for economic and social infrastructure. More proposals received in the first three months than in the previous three years. The $450 million Logan Motorway Enhancement Project is the first project to progress to Stage 2 detailed assessment. |
6
Mid Year Fiscal and Economic Review 2015-16
A STRONG, DIVERSE ECONOMY
Mid Year Fiscal and Economic Review 2015-16
JOB CREATION INITIATIVES
Northern Economic Summit
The Government’s Northern Queensland Economic Summit 2015 was the first event of its kind to bring together international and domestic investors to hear first-hand about current and future investment opportunities in Australia’s northern Queensland region.
More than 250 domestic and international investors gathered for a unique program of speakers, networking opportunities and activities including local site visits.
The Summit has spurred significant interest in several North Queensland business opportunities.
Screen Queensland
The Queensland Government has invested to secure large- scale film and high-end television productions.
Queensland has already secured two major blockbusters to be filmed in Queensland.
Thor: Ragnarok, and King Kong reboot Kong: Skull Island, will both be filmed on the Gold Coast next year, spending more than $115 million and providing employment for more than 750 crew.
The Government has contributed $11 million towards the construction of the new Village Roadshow Sound Stage 9 at Oxenford, the biggest of its kind in Australia. The stage will double as the 2018 Commonwealth Games squash centre.

Advance Queensland
The $180 million Advance Queensland program is an investment in innovation, skills, education, business development and startups. It will diversify the economy and deliver knowledge-based jobs now and into the future.
Since the initiative was announced in the Budget, the Government has held 11 regional forums to talk to the research, business, investment and startup sectors. More than 800 people have attended these forums.
Seven grant programs have opened since July 2015 with more than 200 applications received.
Successful recipients of the first round of the Knowledge Transfer Partnerships program were announced in early December, with successful applicants for other programs to be announced progressively from early next year.
8
Mid Year Fiscal and Economic Review 2015-16
STRENGTHENING
QUEENSLAND’S BUSINESSES
Since the Palaszczuk Government’s pro-business, pro-jobs Budget
in July, Queensland business confidence has rebounded.
| | | | | | | | |
 | | The Draft State Infrastructure Plan was released announcing a blueprint to prioritise and deliver projects that foster economic growth and promote community wellbeing across the state. | | | |  | | Established an independent Building Queensland body to provide objective and transparent advice to the Queensland Government to enable better infrastructure decisions. |
| | | | | | | | |
 | | Red Tape Reduction Advisory Council set up to help eliminate regulatory issues which inhibit small business growth. | | | |  | | Queensland Productivity Commission (QPC) established to undertake independent, in-depth reviews of complex economic, industry and regulatory issues through open and transparent processes informed by wide public consultation. |
Mid Year Fiscal and Economic Review 2015-16
DELIVERING BETTER SERVICES
| | |
$11.7m boost to Domestic and Family Violence services Since the Budget the Queensland Government has committed an extra $11.7 million over five years to help battle the scourge of domestic and family violence. This brings total spending over the five years to 2019–20 to implement the Special Taskforce on Domestic and Family Violence report to $47.3 million since the Government came to power. The extra funding will help fast track initiatives in the Palaszczuk Government’s Not Now, Not Ever taskforce report. These will include an integrated response trial, safety upgrades to support victims staying in their homes, and the establishment of specialist sexual assault services in priority areas. These initiatives will complement existing action against Domestic Violence, including fast-tracked amendments to increase penalties for breaches of DVOs, greater support and leave entitlements for Queensland public service employees affected by domestic violence and non-fatal strangulation to become an offence under the Queensland Criminal Code. Premier Anastasia Palaszczuk has appointed Queensland’s first Minister for the Prevention of Domestic and Family Violence and former Governor General Dame Quentin Bryce as Chair of Queensland Domestic Violence Council. The increased funding includes an additional $1.2M for domestic violence crisis service DV Connect, bringing total funding to $4.7M in 2015-16. | |  |
| | |

| | Social Benefit Bonds Social Benefit Bonds are a new and innovative approach to tackling complex social and economic challenges. The Government is piloting three social benefit bonds in the areas of homelessness, reoffending and reducing Indigenous disadvantage. This program will source funds from private investors to run new programs, providing a return when agreed outcomes are met. The program has engaged with more than 1000 stakeholders since the Budget. The market sounding process culminated in a discussion forum which provided an opportunity for representatives across all stakeholder groups to come together to share knowledge and provide input on the challenges and commercial framework. The outcomes from the discussion forum will be published in a report to be released early in 2016. The program is proposing to go to market with a release of Expressions of Interest (EOI) in February-March 2016. Early market interest and indications of willingness to participate in the pilot program are very encouraging with many investors and service providers mobilising in anticipation. |
Mid Year Fiscal and Economic Review 2015-16
FOR ALL QUEENSLANDERS
| | |
 | | National Disability Insurance Scheme Early Launch On 25 September, the Government announced that yong people under the age of 18 with a disability in Townsville and Charters Towers, and all eligible people with a disability on Palm Island will be the first Queenslanders to access the National Disability Insurance Scheme (NDIS). This roll-out will occur six months ahead of the planned full roll out of the Scheme. This early access means up to 1,600 eligible people with disability in North Queensland will start seeing the benefits of the NDIS before the full roll out starts mid next year, with around 600 of these people progressively accessing reasonable and necessary services from April 2016. The State Government contributed up to $1.9 million towards early access to the Scheme in North Queensland, with the Commonwealth Government supplying $2.5 million. The Queensland Government is considering options to implement the National Injury Insurance Scheme to provide reasonable and necessary care and support for people catastrophically injured in road traffic crashes, irrespective of fault. Options to implement the scheme to give Queenslanders the coverage and certainty enjoyed by other Australians have been referred to the bipartisan Communities, Disability Services and Domestic and Family Violence Prevention Parliamentary Committee for consideration. |
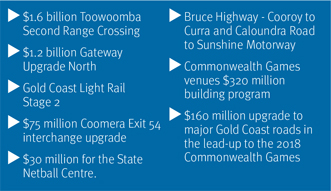
$500 million Schools and Hospitals Fund
The Government has committed an extra $500 million to maintain, refurbish and upgrade schools and hospitals around the State.
About 250 State schools will receive more than $26 million in maintenance work over the current Christmas holidays.
The Government’s investment will support more than 2600 full-time jobs over the next four years – many of them local tradespeople in regional Queensland.
And Queensland Health will begin construction of new facilities in 2016, including the Hervey Bay Emergency Department, the Gladstone Emergency Department and Hospital Redevelopment, the Roma Hospital Redevelopment and the Caloundra Hospital Reconfiguration.
S97.9M BOOST FOR ROAD SAFETY
The Government will invest an additional $97.9 million from the Camera Detected Offences program to boost its targeted road safety infrastructure, including its Safer Roads Sooner program, as well as increased road safety education through the Join the Drive to Save Lives campaign.
| | |
$500 million Schools and Hospitals Fund
The Government has committed an extra $500 million to maintain, refurbish and upgrade schools and hospitals around the State.
About 250 State schools will receive more than $26 million in maintenance work over the current Christmas holidays.
The Government’s investment will support more than 2600 full-time jobs over the next four years – many of them local tradespeople in regional Queensland.
And Queensland Health will begin construction of new facilities in 2016, including the Hervey Bay Emergency Department, the Gladstone Emergency Department and Hospital Redevelopment, the Roma Hospital Redevelopment and the Caloundra Hospital Reconfiguration. |
11
Mid Year Fiscal and Economic Review 2015-16
UPDATE ON DEBT ACTION PLAN
The Government will deliver an extra
$1 BILLION
in debt reduction through enhancements to the Debt Action Plan.
The Government is delivering on its commitment to focus on reducing the General Government Sector debt burden without selling government-owned corporations, increasing taxes or cutting services.
The Debt Action Plan announced in the 2015-16 Budget contained three measures:
| | • | | revising the capital structure of the Government’s energy network businesses (Ergon Energy, Energex and Powerlink) to more commercial levels; |
| | • | | funding long service leave on an emergent basis, rather than setting aside financial assets; and |
| | • | | temporary suspension of investment of defined benefit employer contributions, whilst maintaining a fully–funded status. |
The Budget advised that combined, these measures are expected to result in a reduction of General Government Sector debt of $9.6 billion in 2017-18, compared to the level of debt in the absence of these measures.
It was also announced that Government would consider if the level of equity held in other government–owned corporations remains appropriate, and if there is potential to also move these businesses to more commercial gearing levels.
The Government has realised $3.5 billion in debt reduction through revising the capital structure of the State’s energy network businesses announced at the Budget.
The 2015-16 MYFER continues to lower debt, with more than $1 billion of enhancements to the Debt Action Plan. This includes continuing to revise the capital structure of select non-network government-owned corporations.
As a result, General Government Sector debt will now be $10.6 billion lower in 2017-18 than it would have been in the absence of these measures.
READ MORE ON PAGE 26
Mid Year Fiscal and Economic Review 2015-16
Contents
| | | | | | |
1.0 | | Overview | | | 14 | |
| | |
2.0 | | Economic overview | | | 16 | |
| | |
2.1 | | International conditions | | | 17 | |
| | |
2.2 | | Queensland conditions | | | 17 | |
| | |
2.3 | | Overseas exports | | | 18 | |
| | |
2.4 | | Labour market | | | 19 | |
| | |
2.5 | | Economic forecasts | | | 20 | |
| | |
3.0 | | Fiscal overview | | | 21 | |
| | |
3.1 | | Net operating balance | | | 21 | |
| | |
3.2 | | Reconciliation with 2015–16 Budget | | | 22 | |
| | |
3.3 | | Expenses | | | 23 | |
| | |
3.4 | | Revenue | | | 23 | |
| | |
3.5 | | Intergovernmental financial relations | | | 25 | |
| | |
3.6 | | Debt action plan | | | 26 | |
| | |
3.7 | | Electricity enterprise merger | | | 27 | |
| | |
3.8 | | Infrastructure investment | | | 29 | |
| | |
3.9 | | Balance sheet | | | 30 | |
| | |
4.0 | | Achievement of the Government’s fiscal principles | | | 31 | |
| | |
5.0 | | Uniform Presentation Framework and Loan Council Allocation | | | 35 | |
| | |
5.1 | | Uniform Presentation Framework financial information | | | 35 | |
| | |
5.2 | | Loan Council Allocation | | | 44 | |
| | |
6.0 | | Taxation and royalty revenue assumptions | | | 45 | |
| | |
7.0 | | Key fiscal aggregates | | | 46 | |
Mid Year Fiscal and Economic Review 2015-16
The 2015–16 Budget demonstrated the Government’s responsible and measured approach to managing the State’s finances. In particular, the 2015–16 Budget delivered:
| | • | | the Government’s election commitments, including key measures to revitalise the State economy and frontline service delivery, with the cost of these more than offset by savings and reprioritisations; |
| | • | | significant reductions in General Government debt, without selling government–owned corporations, without increasing taxes and without cutting services; and |
| | • | | revised fiscal principles that target an ongoing reduction in Queensland’s General Government debt burden and ensure that new capital investment is primarily funded through recurrent revenues, rather than borrowings. |
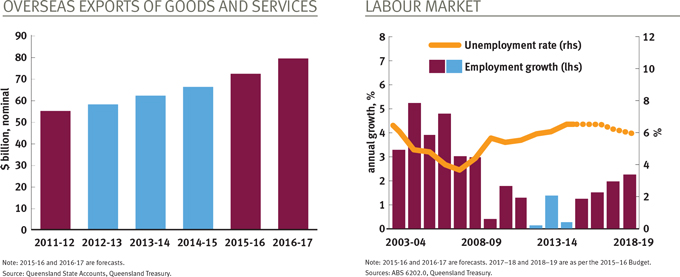
Since the 2015–16 Budget, the outlook for growth in Queensland’s major trading partners has weakened, which has led to some softening of the outlook for growth in gross state product and employment.
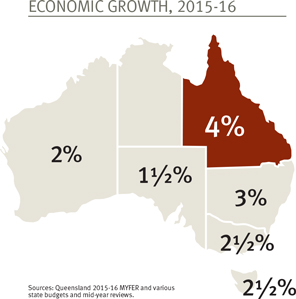
Even so, growth in the Queensland economy is expected to strengthen to 4% in 2015–16, driven by a surge in liquefied natural gas (LNG) exports. Importantly, Queensland is expected to have the highest rate of economic growth of any Australian state in both 2015–16 and 2016–17.
Revisions to the international outlook have resulted in lower price and volume projections for Queensland’s major mineral and energy exports, which have been partly mitigated by depreciation in the Australian dollar.
Softer global economic conditions have contributed to weaker than expected growth in wages. When combined with the labour market impacts of the transition away from mining–related construction, this has led to significant revisions to the outlook for payroll tax across the forward estimates (2015–16 to 2018–19). The unemployment rate, however, is at its lowest level in almost two years, at 6.1% (trend) in November 2015.
The Government remains focussed on the delivery of key services to Queenslanders, coupled with investment in initiatives that support job creation and economic growth, such as the Advance Queensland initiatives announced in the 2015–16 Budget. Accordingly, a modest amount of new expenditure has been initiated since Budget.
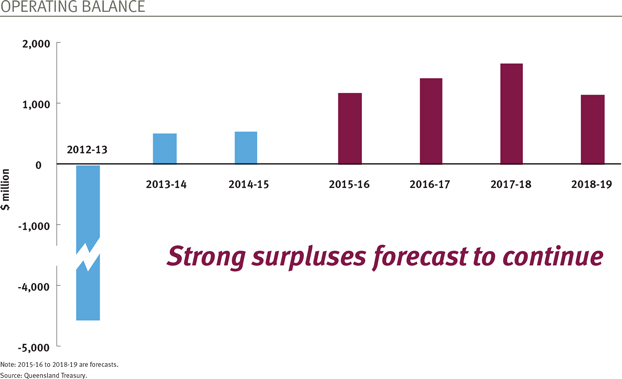
These factors have led to downward revisions to the size of net operating surpluses across the forward estimates. Despite these challenges, Queensland’s fiscal position is strong, with surpluses projected to exceed $1 billion each year. The 2015–16 operating position is expected to be the largest surplus since 2006–07.
Chart 1: Net operating balance1
(General Government Sector, $ billion)
Note:
| 1. | 2015–16 onwards are forecasts. |
Source: Queensland Treasury.
Mid Year Fiscal and Economic Review 2015-16
The Government’s fiscal principles highlight the importance of delivering substantial operating surpluses, such that capital expenditure can be primarily funded from operating cashflows, rather than debt.
The 2015–16 MYFER continues to refocus the balance sheet to lower debt, with further enhancements to the Debt Action Plan. As a result of the Debt Action Plan, General Government debt will now be $10.6 billion lower in 2017–18 than it would have been in the absence of these debt measures. However, the level of debt projected in 2017–18 is similar to that forecast in the 2015–16 Budget, primarily due to the deterioration in revenue forecasts.
The MYFER includes additional measures to address debt through the Government’s Debt Action Plan. This is expected to further assist in delivering the Government’s commitment to reduce the General Government Sector debt burden, as part of the fiscal principles introduced with the 2015–16 Budget. The Government continues to actively investigate further options to reduce Queensland’s debt. The Government will consider these options as part of developing the 2016–17 Budget.
An update of the Government’s progress in meeting its fiscal principles is included at Section 4.0.
Chart 2: Borrowings1
(General Government Sector, $ billion)
Note:
| 1. | In the 2015–16 MYFER, 2014–15 borrowing is an actual. 2015–16 onwards are forecasts. There was not a forecast for 2018–19 in the 2014–15 MYFER. |
Source: Queensland Treasury.
Mid Year Fiscal and Economic Review 2015-16
Economic growth in Queensland will be strong in 2015–16 and 2016–17, reflecting the ramp–up in LNG exports, although the outlook is now somewhat softer than previously expected.
In the 2015–16 Queensland Budget, a range of risks to the economic outlook were identified. Some of these have materialised over the second half of 2015. In particular, the growth outlook in major advanced economies has weakened, leading to further falls in commodity prices and heightened risk aversion in financial markets. Further, Queensland’s population growth has slowed more sharply than expected, while a strengthening in the El Niño weather pattern is likely to extend drought conditions well into 2016.
With the construction of the large LNG projects almost complete, the resulting fall in investment significantly detracted from growth in 2014–15. Combined with soft global trends mentioned above, this resulted in a further slow–down in economic growth in Queensland to 0.5%, below the national average of 2.3% (Chart 3).
The construction of the LNG projects will be completed in 2015–16, keeping state final demand subdued. At the same time, the associated fall in imports of LNG capital goods together with the ramp up in LNG exports – now well under way – will see net exports boost economic growth to 4% in 2015–16. LNG exports will continue to grow strongly in 2016–17 and, with a greater forecast contribution from state final demand, economic growth is expected to pick up further, to a robust 4 1⁄2%.
Based on latest Commonwealth and state government publications as at 14 December, Queensland is expected to have the fastest growing state economy in 2015–16 and 2016–17. However, with the strong contribution coming from less labour intensive LNG exports, income and employment growth will remain moderate in these two years.
Chart 3: Real economic growth1, Queensland and Australia
Notes:
| 1. | Chain volume measure (CVM), 2013–14 reference year. 2015–16 and 2016–17 are forecasts. |
| 2. | The Australian forecast for 2015–16 is the Reserve Bank of Australia (RBA) point forecast while for 2016–17 it is the mid–point of the RBA forecast range. |
Sources: ABS 5220.0 for historical data, Queensland Treasury and RBA, Statement on Monetary Policy, November 2015 for Australian forecasts.
Mid Year Fiscal and Economic Review 2015-16
| 2.1 | International conditions |
The growth outlook for Queensland’s major trading partners for 2015 and 2016 has softened further since the 2015–16 Budget, to be 3 1⁄2% and 3 3⁄4% respectively. These growth rates compare to an annual average rate of growth of 5.0% over the decade to 2007, the year before the onset of the Global Financial Crisis (GFC). Table 1 shows that the main reason for the revisions is lower growth in the Asian economies.
Table 1: Economic outlook for Queensland’s major trading partners1
| | | | | | | | | | | | | | | | | | | | |
| | | 2014 | | | 2015 | | | 2016 | |
| | | Actual | | | Budget | | | Current | | | Budget | | | Current | |
Major trading partners | | | 3.7 | | | | 4 | | | | 3 1⁄2 | | | | 4 1⁄4 | | | | 3 3⁄4 | |
Non–Japan Asia | | | 5.7 | | | | 5 1⁄2 | | | | 5 | | | | 5 3⁄4 | | | | 5 1⁄4 | |
China | | | 7.3 | | | | 7 | | | | 7 | | | | 6 3⁄4 | | | | 6 1⁄2 | |
India2 | | | 7.3 | | | | 7 3⁄4 | | | | 7 1⁄2 | | | | 8 | | | | 7 3⁄4 | |
South Korea | | | 3.3 | | | | 3 | | | | 2 1⁄2 | | | | 3 1⁄2 | | | | 2 3⁄4 | |
Japan | | | -0.1 | | | | 1 | | | | 1⁄2 | | | | 1 3⁄4 | | | | 1 1⁄4 | |
Europe | | | 1.4 | | | | 2 | | | | 2 | | | | 2 | | | | 2 | |
US | | | 2.4 | | | | 2 1⁄4 | | | | 2 1⁄2 | | | | 2 3⁄4 | | | | 2 1⁄2 | |
Notes:
| 2. | India’s economic growth profile is on its fiscal year basis (April to March). |
Sources: Consensus Economics and Queensland Treasury.
Consensus forecasts of industrial production have been revised down sharply in all major economies since mid–2015. Industrial production in Japan, South Korea and Taiwan is now expected to decline or remain flat in 2015, and growth in industrial production in China is expected to be the slowest since the GFC. This weakness is reflected in declines in imports of coal, iron ore and LNG by these countries – all key Australian exports.
Lower demand has resulted in commodity prices for coal, base metals and oil falling further than previously expected. The fall in oil prices will, in turn, be reflected in lower prices for LNG exports. While the Australian dollar (A$) has also depreciated, this has not been sufficient to prevent commodity prices from falling in A$ terms, leading to slower than expected growth in domestic income and profits from exports.
In response to the softer outlook, many central banks have continued monetary easing in recent months. Both China and India have cut their policy interest rates by 75 basis points since June. Central banks of South Korea and Taiwan have also cut their policy rates in that period. In early December, the European Central Bank announced further stimulatory measures, including a further 10 basis points cut in the deposit rate.
Declines in commodity prices, together with an expectation that the US Federal Reserve will soon raise its policy rate have also seen the currencies of most countries, especially resource exporters, depreciate against the US$.
Coinciding with these developments, international and domestic financial markets have experienced widespread falls in equity prices, especially in the Asian region and other emerging economies. This has led investors to refocus on rising vulnerabilities in those markets, resulting in heightened risk aversion. Overall, these developments suggest that international risks to the outlook remain clearly on the downside.
International developments have led to slower growth in household income and consumption. In 2014–15, household consumption grew by 2.5%, compared with an historical average of around 4.2%. With income growth expected to remain modest in the next two years and recovery in the labour market somewhat slower than previously anticipated, consumption is now forecast to grow more slowly in 2015–16 and 2016–17 than expected in the 2015–16 Budget.
Mid Year Fiscal and Economic Review 2015-16
Dwelling investment grew for the second successive year in 2014–15, by a solid 8.6%. Favourable rental yields relative to Sydney and Melbourne and continued low borrowing costs have driven strong investor interest. To date, this has been predominantly in medium–to–high density dwellings, although more recent data on approvals suggest that growth in this market segment is beginning to ease, while house approvals have begun to pick up.
Residential property prices in Brisbane grew by a moderate 2.9% over the year to June quarter 2015, well below the 18.9% and 7.8% recorded in Sydney and Melbourne respectively. Strong growth in investor housing supply and a slowing in population growth is likely to constrain growth in the owner–occupier market in 2015–16 and 2016–17.
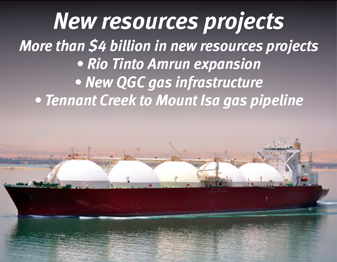
The substantial fall in business investment as the construction phase of the LNG projects nears completion has been anticipated for some time, being first identified in the 2012–13 Budget. The substantial fall in commodity prices has prompted resources companies to cut exploration and capital investment budgets and change focus to improving productivity and cutting costs. However, there have been some new resource projects recently announced, including the Queensland Gas Company A$1.7 billion development of natural gas tenements west of Wandoan and the Rio Tinto US$1.9 billion Amrun bauxite project near Weipa.
Since the Budget, the Queensland drought has worsened as El Niño conditions have intensified. As a result, agricultural investment is likely to be weaker than previously expected.
With real state final demand lower in 2014–15 than in 2011–12, there remains ample spare capacity in the Queensland economy. This is expected to keep growth in non–resources investment subdued and insufficient to prevent further falls in total business investment in 2015–16. From 2016–17, growth in the Queensland economy is expected to become more broadly based.
|
Box 1 Population growth A slowdown in population growth, both nationally and for Queensland, will have a significant impact on the level of economic growth to be expected over the longer–term. Over the twenty years up to the GFC, Queensland’s population growth averaged around 2.2% per annum. Since then growth has been on a downward trend, to be only 1.4% in the year to March 2015. This can be attributed, in large part, to the impact on the labour market from the slowdown in resources investment, which has resulted in falls in net overseas and interstate migration to Queensland. It is expected that there will be some recovery in population growth over the medium term. A lower population growth rate will enable living standards to be maintained despite a lower rate of economic growth. |
Since the Budget, international coal prices have continued to fall, with the impact on earnings only partially offset by the concurrent depreciation of the A$. Meanwhile, weakening global demand, combined with announced production cuts by major mining companies, will suppress growth in coal production and exports in 2015–16, and to a lesser degree, in 2016–17.
Metal exports are expected to fall in both 2015–16 and 2016–17. The closure of MMG’s Century zinc mine and Glencore’s announcement of cuts to zinc production will significantly affect Queensland’s zinc and lead exports. In addition, South32 has projected that deterioration in ore grades will lower lead production in the current and next financial years. After achieving double–digit annual growth between 2010–11 and 2012–13, production growth in Rio Tinto’s Weipa bauxite mine is expected to moderate over the forecast period. More positively, Glencore announced in mid–October 2015 it would extend the life of its copper smelter and refinery beyond previously planned closure dates of 2016 and 2017 respectively.
Beef exports have grown strongly as high prices and drought have led to higher slaughter rates. However, it is expected that production and exports will be constrained by the impact of intensifying drought on carrying capacity.
A lower A$ and more favourable visa application policies have already led to a recovery in overseas education exports in the past two financial years. Asian markets should continue to drive this upward trend in 2015–16 and 2016–17. Similarly, overseas tourism exports are expected to benefit from the depreciation of the A$ and rising popularity in Asia of working holidays in Australia.
Mid Year Fiscal and Economic Review 2015-16
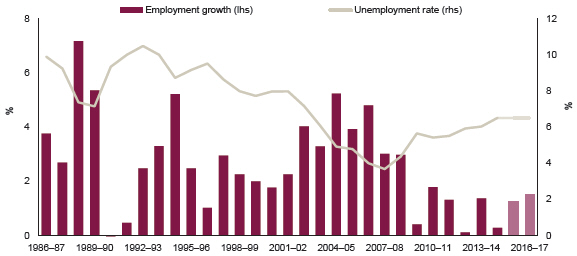
With the economic outlook now softer than expected in the 2015–16 Budget, the labour market is forecast to recover more slowly than previously expected.
In the five months to November 2015, employment was 1.5% higher than the same period a year ago, but this in part reflects weak outcomes a year ago. Given ongoing subdued domestic activity expected in 2015–16, this rate of growth is forecast to soften in the remainder of the year. As a result, year–average growth is expected to be around 1 1⁄4% in 2015–16, unchanged from Budget. Reflecting the flow–on effects of current weaker domestic economic conditions, employment growth has been revised down to 1 1⁄2% in 2016–17.
Despite some recent improvement in monthly data, employment growth is expected to be at or below population growth in 2015–16 and 2016–17. As a result, the year–average unemployment rate is forecast to stabilise at around 6 1⁄2%, an unchanged outlook from Budget. The slower than expected recovery in the labour market will keep wages and price growth modest in 2015–16 and slightly below the Budget forecast.
Chart 4: Queensland labour market1
Note:
| 1. | 2015–16 and 2016–17 are forecasts. |
Sources: ABS 6202.0 and Queensland Treasury.
Mid Year Fiscal and Economic Review 2015-16
Table 2 shows the MYFER forecasts for key variables in 2015–16 and 2016–17 compared with Budget forecasts.
Table 2: Economic forecasts1
| | | | | | | | | | | | | | | | | | | | | | | | | | | | |
| | | 2014–15 | | | 2015–16 | | | 2016–17 | | | 2017–182 | | | 2018–192 | |
| | | Outcome | | | Budget | | | MYFER | | | Budget | | | MYFER | | | Forecast | | | Projection | |
Gross state product | | | 0.5 | | | | 4 1⁄2 | | | | 4 | | | | 4 1⁄2 | | | | 4 1⁄2 | | | | 3 3⁄4 | | | | 3 1⁄4 | |
Employment | | | 0.3 | | | | 1 1⁄4 | | | | 1 1⁄4 | | | | 1 3⁄4 | | | | 1 1⁄2 | | | | 2 | | | | 2 1⁄4 | |
Unemployment rate | | | 6.5 | | | | 6 1⁄2 | | | | 6 1⁄2 | | | | 6 1⁄2 | | | | 6 1⁄2 | | | | 6 1⁄4 | | | | 6 | |
Inflation | | | 1.9 | | | | 2 1⁄4 | | | | 2 | | | | 2 1⁄2 | | | | 2 1⁄2 | | | | 2 1⁄2 | | | | 2 1⁄2 | |
Wage Price Index | | | 2.4 | | | | 2 1⁄2 | | | | 2 1⁄4 | | | | 2 3⁄4 | | | | 2 3⁄4 | | | | 3 | | | | 3 1⁄4 | |
Population3 | | | 1.4 | | | | 1 3⁄4 | | | | 1 1⁄2 | | | | 1 3⁄4 | | | | 1 1⁄2 | | | | 1 3⁄4 | | | | 1 3⁄4 | |
Notes:
| 1. | Annual % change, except for unemployment rate. |
| 2. | 2017–18 and 2018–19 are as per the 2015–16 Budget. |
| 3. | Population growth for 2014–15 is the annual growth rate in the three quarters to March quarter 2015, as June quarter 2015 data were not available at the time of printing. |
Sources: ABS 3101.0, 5220.0, 6202.0, 6345.0, 6401.0 and Queensland Treasury.
Mid Year Fiscal and Economic Review 2015-16
Table 3: General Government Sector – key fiscal aggregates1
| | | | | | | | | | | | | | | | | | | | | | | | |
| | | 2014–15 | | | 2015–16 | | | 2015–16 | | | 2016–17 | | | 2017–18 | | | 2018–19 | |
| | | Actual2 | | | Budget | | | Revised | | | Projection | | | Projection | | | Projection | |
| | | $ million | | | $ million | | | $ million | | | $ million | | | $ million | | | $ million | |
Revenue | | | 49,765 | | | | 51,186 | | | | 51,354 | | | | 53,520 | | | | 55,392 | | | | 55,630 | |
Expenses | | | 49,224 | | | | 49,973 | | | | 50,180 | | | | 52,107 | | | | 53,752 | | | | 54,485 | |
Net operating balance | | | 542 | | | | 1,213 | | | | 1,175 | | | | 1,413 | | | | 1,640 | | | | 1,145 | |
Capital purchases | | | 4,779 | | | | 5,374 | | | | 5,325 | | | | 5,822 | | | | 5,935 | | | | 5,188 | |
Fiscal balance | | | (581 | ) | | | (1,162 | ) | | | (1,140 | ) | | | (1,708 | ) | | | (1,130 | ) | | | (1,050 | ) |
Borrowing | | | 43,105 | | | | 38,151 | | | | 37,973 | | | | 38,561 | | | | 39,721 | | | | 40,921 | |
Borrowing (NFPS)3 | | | 75,233 | | | | 74,113 | | | | 73,878 | | | | 76,342 | | | | 77,979 | | | | 79,667 | |
Notes:
| 1. | Numbers may not add due to rounding. Bracketed numbers represent negative amounts. |
| 2. | Reflects published actuals. |
| 3. | NFPS: Non–financial Public Sector. |
Source: Queensland Treasury.
The General Government Sector net operating balance for 2014–15 was a surplus of $542 million. This is lower than the 2015–16 Budget estimated actual surplus of $962 million, due to an unanticipated technical accounting adjustment, but higher than the original 2014–15 Budget estimate of a $188 million surplus and the 2014–15 MYFER estimate of a $64 million deficit.
The 2014–15 result is the largest operating surplus since 2006–07.
The General Government Sector net operating balance expected for 2015–16 is a surplus of $1.175 billion, similar to the surplus of $1.213 billion forecast at the time of the 2015–16 Budget. The small movement in the 2015–16 net operating balance primarily reflects downward revisions of estimates for royalty revenue and taxation revenue, partially offset by an increase in GST revenue (associated with an underpayment in 2014–15) and lower employee expenses.
The estimated operating surplus in 2015–16 would be the third consecutive operating surplus, and the largest operating surplus since 2006–07.
The forecast General Government Sector net operating balances over the remainder of the forward estimates are expected to be lower than published in the 2015–16 Budget, with the key driver being a reduction in payroll tax forecasts. Nevertheless, consistent with the Government’s fiscal principles, Queensland remains on track to deliver substantial operating surpluses in each year of the forward estimates. This will ensure that the General Government Sector capital program is primarily funded from recurrent revenues, rather than borrowings.
As can be seen in Chart 5, the reduction in the operating surplus since Budget is most significant in 2016–17. This is predominantly the result of a significant reduction in revenue from capital grants in 2016–17 primarily due to a change in timing of Commonwealth grants associated with the Toowoomba Second Range Crossing. Taxation revenue and royalties are also forecast to be substantially lower from 2016–17 onwards than at Budget.
Mid Year Fiscal and Economic Review 2015-16
Chart 5: Net operating balance – 2015–16 to 2018–191
($ billion)
Note:
| 1. | 2015–16 onwards are forecasts. |
Source: Queensland Treasury.
| 3.2 | Reconciliation with 2015–16 Budget |
Table 4 provides a breakdown of the movements in the net operating balance since the 2015–16 Budget.
Table 4: Reconciliation of net operating balance, 2015–16 Budget to 2015–16 MYFER1
| | | | | | | | | | | | | | | | |
| | | 2015–16 | | | 2016–17 | | | 2017–18 | | | 2018–19 | |
| | | Revised | | | Projection | | | Projection | | | Projection | |
| | | $ million | | | $ million | | | $ million | | | $ million | |
2015–16 Budget net operating balance | | | 1,213 | | | | 2,226 | | | | 2,132 | | | | 1,327 | |
| | | | |
Taxation revisions | | | (137 | ) | | | (342 | ) | | | (364 | ) | | | (408 | ) |
| | | | |
Royalty revisions | | | (94 | ) | | | (100 | ) | | | (119 | ) | | | (33 | ) |
| | | | |
Net Commonwealth revenues and expenses | | | 107 | | | | (244 | ) | | | (20 | ) | | | 55 | |
| | | | |
Net flows from PNFC and PFC sector | | | (47 | ) | | | (42 | ) | | | 68 | | | | 153 | |
| | | | |
Policy measures | | | (143 | ) | | | (61 | ) | | | (129 | ) | | | (41 | ) |
| | | | |
Other parameter adjustments2 | | | 275 | | | | (23 | ) | | | 72 | | | | 91 | |
2015–16 MYFER net operating balance | | | 1,175 | | | | 1,413 | | | | 1,640 | | | | 1,145 | |
Notes:
| 1. | Numbers may not add due to rounding. Bracketed numbers represent negative amounts. Denotes impacts on the operating balances. |
| 2. | Refers to adjustments largely of a non–policy nature, primarily changes in actuarial assessments of long service leave and superannuation expenses, interest expenses, depreciation, growth funding, swaps, deferrals and administered revenue. |
Source: Queensland Treasury.
Mid Year Fiscal and Economic Review 2015-16
Total expenses in 2015–16 are expected to be $50.180 billion, $207 million (or 0.4%) higher than the Budget estimate, primarily associated with the increased provision of health services, for which the State receives activity–based funding from the Commonwealth. Even so, growth in expenses in 2015–16 is expected to be subdued, at 1.9%. In underlying terms, growth in 2015–16 is 3.6%, after excluding National Disaster Relief and Recovery Arrangement spending and allowing for the accounting treatment of Stage 1 of the Gold Coast Light Rail project in 2014–15.
Expenditure growth remains modest across the forward estimates, with expenses projected to grow on average by 2.6% per year over the four years to 2018–19, or 3.0% per annum across the forward estimates excluding disaster recovery expenses.
The Government has implemented a number of new initiatives since the 2015–16 Budget, including:
| | • | | The Queensland Government has invested to secure large–scale film and high-end television productions, including $11 million towards the construction of the new Village Roadshow Sound Stage 9 at Oxenford. The stage will double as the 2018 Commonwealth Games squash centre. |
| | • | | Funding of $11.7 million over five years for domestic and family violence initiatives, particularly the fast tracking of initiatives relating to the Not Now, Not Ever Taskforce Report. These include an integrated response trial, safety upgrades to support victims staying in their homes, and the establishment of specialist sexual assault services in priority areas. |
The increase in operating expenses in 2017–18 includes increased expenditure associated with the Gold Coast 2018 Commonwealth Games, which is being partially offset by savings from delivering the Commonwealth Games Village at a lower cost. Overall, Commonwealth Games expenditure remains within the approved whole–of–Games budget.
The 2015–16 Budget estimates took into account the Government’s wages policy of 2.5% per annum.
The Government has reached in–principle agreement on settling the long standing dispute on a new State Government Departments (Core) Agreement. The Core agreement has been the subject of protracted negotiations which resulted in no wage increase being provided to affected employees between 1 August 2012 and 30 November 2013. The annual component of the offer is in accordance with the Government’s wages policy, while the offer also provides a one–off payment in recognition of the period during which there was no pay increase. The one–off payment is expected to cost up to $58 million in 2015–16 and this cost has been included in the MYFER.
As a result of the prudent assumptions built into estimates of employee expenses in the 2015–16 Budget, which includes estimates of staffing levels, wage outcomes and on–costs such as long service leave and superannuation expenses, total employee expenses are now estimated to be slightly lower than anticipated in the 2015–16 Budget in each year of the forward estimates.
The appointment of three additional Cabinet Ministers and an additional Assistant Minister is expected to cost an average of $6 million per annum. These costs will be met from reductions to Government advertising, consultants and contractors.
General Government revenue in 2015–16 is estimated to be $51.4 billion, $168 million (0.3%) more than the 2015–16 Budget estimate. This reflects upward revisions to estimates of grants from the Australian Government and interest income, partially offset by downwards revisions to estimates of taxation and royalty revenue.
Across the period 2015–16 to 2018–19, total revenue has been revised down by $534 million. This primarily reflects downward revisions to state taxes, particularly payroll tax, and revisions to royalties associated with a weaker outlook for commodities prices. Indeed, the key revenues of taxation, royalties and GST are now forecast to be $1.5 billion lower over the forward estimates than in the 2015–16 Budget (see Chart 6). These revisions are partially offset by increased estimates of Australian Government funding for Hospital and Health Services (consistent with increased expected activity).
Revenue is expected to grow by 3.2% in 2015–16, following growth of 6.6% in 2014–15. For the five years 2014–15 to 2018–19, revenue is estimated to grow by an average of 2.8% per annum, or 3.5% per annum when excluding NDRRA payments.
Mid Year Fiscal and Economic Review 2015-16
Chart 6: Revisions to key revenue forecasts since 2015–16 Budget1
(General Government Sector, $ billion)
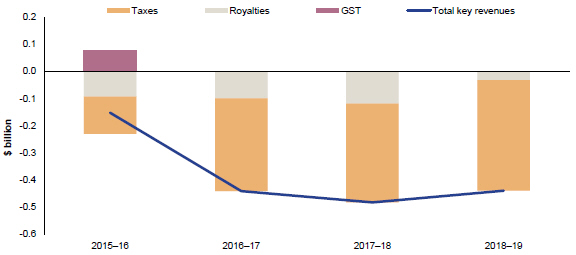
Note:
| 1. | 2015–16 onwards are forecasts. |
Source: Queensland Treasury.
Taxation revenues have been revised down by $137 million in 2015–16 and $1.251 billion across the four years of the forward estimates. This is largely driven by a weaker outlook for payroll tax, reflecting lower than expected collections so far in 2015–16 and the likelihood of this continuing into 2016–17 as the economy continues to transition out of the construction phase of the mining investment cycle.
Payroll tax has been revised down by $160 million in 2015–16 and by $938 million in total across the forward estimates. In 2015–16, payroll tax growth is expected to be weaker than growth in overall employment and wages due to changes in the composition of the payroll tax base. Declines in payroll tax collections from the mining and construction sectors, which have a higher concentration of larger organisations, are offsetting modest growth in the rest of the labour market. Beyond 2016–17, payroll tax growth is anticipated to be similar to Budget estimates, albeit from a lower base, as the domestic economy strengthens and labour market conditions improve.
Estimates of revenue from transfer duties are higher than Budget in 2015–16, supported by large commercial transactions, and unchanged since Budget across the outyears. General insurance duties are $198 million lower across the forward estimates than at Budget, reflecting lower than anticipated growth in insurance premiums.
Royalty revenue has been revised down by $94 million in 2015–16 since the Budget, reflecting downwards revisions to prices, particularly for hard coking coal, and export volumes.
Across the remainder of the forward estimates, royalty revenue has also been revised down, mainly reflecting revisions to estimates of prices for coal and oil. The impact of these factors has been partially offset by reductions to estimates of the A$–US$ exchange rate. In total across the forward estimates, royalty revenue has been revised down by $346 million.
Since the 2015–16 Budget, estimates of the contract price for hard coking coal have been revised down by around US$14 per tonne in 2015–16 and in each year of the forward estimates. Similarly, thermal coal prices have been declining. This reflects flat global pig iron production, downgrades to forecasts of industrial production growth of major importers of Queensland coal, and a reduction in thermal coal usage in China.
The emergence of the LNG export industry in 2014–15 had previously been expected to contribute strongly to growth in royalty revenue from 2015–16. As discussed in detail in Box 3.1 of 2015–16 Budget Paper 2, royalties are imposed on the coal seam gas (CSG) used as feedstock for the LNG industry. Since Budget, estimates of LNG export prices, and therefore CSG prices, which are both linked to oil prices, have been revised down, resulting in reductions in forecast LNG related revenue in each year of the forward estimates. While a slightly longer timeframe for all LNG plants to reach full production is also expected, CSG volumes are still anticipated to grow strongly across the forward estimates.
Taxation and royalty projections for 2015–16 and the forward estimates are outlined in Table 18 with royalty assumptions provided in Table 19.
Mid Year Fiscal and Economic Review 2015-16
| 3.5 | Intergovernmental financial relations |
| 3.5.1 | Australian Government payments |
The 2015–16 Commonwealth Budget continued to reflect the funding cuts included in the 2014–15 Commonwealth Budget, which unilaterally reduced or reversed a range of funding agreements with the States and Territories. These cuts, including cuts of $18 billion in health and education funding, remain an ongoing fiscal challenge for Queensland.
The reduction in Australian Government funding in core services such as health and education highlights the volatility of Queensland’s revenue base due to its vulnerability to Australian Government actions. This underlines the importance of federalism reform to ensure an appropriate allocation of roles and responsibilities, supported by a sustainable revenue stream to meet our service delivery responsibilities.
The Queensland Government is committed to working with the Australian Government to achieve positive outcomes for Queenslanders. The Australian Government’s economic and fiscal reform agenda includes the White Paper processes on Federalism and Tax Reform. These processes present an opportunity for Queensland to ensure reforms align with the Queensland Government’s objectives, clarify federal–state roles and responsibilities, improve the sustainability and efficiency of Queensland’s revenue base, and address the vertical fiscal imbalance characteristic of federal financial relations in Australia.
The draft Federalism discussion paper was released in June 2015 and will be followed by the release of the Green Paper. The White Paper is expected to be released in 2016. The Tax Reform discussion paper was released in March 2015 and the Green Paper is expected to be released in early 2016, followed by a White Paper before the next federal general election.
| 3.5.2 | National Disaster Relief and Recovery Arrangements |
The timing of revenue and expenditure in relation to natural disasters continues to significantly impact Queensland’s budget position in 2015–16, with these effects moderating across the forward estimates. Table 5 sets out the current expected impact on Queensland’s headline net operating balance and the underlying net operating balance.
Table 5: Impact of NDRRA funding on the net operating balance1
| | | | | | | | | | | | | | | | |
| | | 2015–16
MYFER
$ million | | | 2016–17
Projection
$ million | | | 2017–18
Projection
$ million | | | 2018–19
Projection
$ million | |
Published net operating balance | | | 1,175 | | | | 1,413 | | | | 1,640 | | | | 1,145 | |
less disaster revenue | | | 1,106 | | | | 245 | | | | 200 | | | | — | |
add disaster expenses | | | 496 | | | | 278 | | | | 32 | | | | — | |
Underlying net operating balance | | | 565 | | | | 1,446 | | | | 1,472 | | | | 1,145 | |
Disaster related capital2 | | | 197 | | | | 10 | | | | — | | | | — | |
Notes:
| 1. | Numbers may not add due to rounding. |
| 2. | Excludes loans provided through the State. |
Source: Queensland Treasury.
Mid Year Fiscal and Economic Review 2015-16
The Debt Action Plan, announced in the 2015–16 Budget, contained three measures:
| | • | | revising the capital structure of the Government’s energy network businesses (Ergon Energy, Energex and Powerlink) to more commercial levels; |
| | • | | funding long service leave on an emergent basis, rather than setting aside financial assets; and |
| | • | | temporary suspension of investment of defined benefit employer contributions, whilst maintaining a fully–funded status. |
The 2015–16 Budget outlined that these measures will result in a reduction of General Government debt of $9.6 billion in 2017–18, compared to the level of debt in the absence of these measures.
Implementation of these measures is significantly progressed and the 2015–16 MYFER further incorporates over $1 billion of enhancements to the Debt Action Plan. This includes revising the capital structure of select non–network government-owned corporations.
As a result, General Government debt will now be $10.6 billion lower in 2017-18 than it would have been in the absence of these measures. However, the level of debt projected in 2017–18 is similar to that forecast in the 2015–16 Budget, due to the deterioration in revenue forecasts.
Revising the capital structure of the Government’s non–network businesses
The 2015–16 Budget announced changes to the capital structure and dividend payout ratios of the three energy network businesses as part of the Debt Action Plan. It was also announced that Government would consider if the level of equity held in other government–owned corporations remains appropriate, and if there is potential to move these businesses to more commercial gearing levels.
Analysis undertaken by KPMG supports regearing Gladstone Ports Corporation Limited, North Queensland Bulk Ports Limited and SunWater Limited. The proposed regearing is set at a level that will ensure these businesses have efficient capital structures and maintain standalone investment grade credit ratings.
A return of $150 million in equity from Stanwell Corporation Limited has also been included in line with a proposal received from the Stanwell Board.
Other than for the energy network businesses, the current dividend payout ratio is 80% of net profit after tax. It is now proposed to move the payout ratio for all government–owned corporations, other than CS Energy Limited, to 100%.
As a result of these measures being implemented as part of the Debt Action Plan, over $1 billion will be made available to the General Government Sector across the forward estimates for debt reduction. This will ensure that Government is making best use of its available capital and delivering on its commitment to focus on reducing General Government debt.
As announced in the 2015–16 Budget, the Government is considering opportunities for Queensland’s defined benefit superannuation scheme to invest in the State’s government–owned corporations and benefit from the returns that these businesses offer.
Under this arrangement, the Government would receive funds to be applied to further reduce debt and also invest in priority infrastructure projects.
The Government’s conditions for any proposal are that the government–owned corporations remain 100% Government owned and controlled with dividends continuing to be received by the State.
As stated in the 2015–16 Budget, any proposal would need to both meet these conditions and satisfy the Government’s commitment to maintain a fully funded superannuation scheme. A detailed analysis and due diligence process will need to be conducted by the Board overseeing the State’s superannuation investments before it is in a position to present a firm proposal for Government to consider.
The Government’s recent decision on which government–owned corporations will be merged clears the way for that work to proceed.
Accordingly, the decision on this part of the Debt Action Plan is expected to be made in 2016, and details provided in the 2016–17 Budget.
Mid Year Fiscal and Economic Review 2015-16
| 3.7 | Electricity enterprise merger |
Since the 2015–16 Budget, the Government has undertaken a detailed review of possible merger options for the government–owned energy network, generation and retail businesses. Following this review, the Government has decided to merge Energex and Ergon Energy under a parent company to streamline operations, harness efficiencies, and prepare the distribution business for the challenges of a rapidly changing energy industry. A parent company is expected to be put in place by mid–2016, with further integration of the Energex and Ergon Energy businesses to continue progressively once the new management team is in place.
Powerlink will remain separate and independent from the merged distribution businesses, but will be reviewed to align work practices with the other network businesses. To ensure a competitive wholesale market is maintained, the generation businesses (CS Energy and Stanwell) will not be merged.
The future energy market will be very different to the current market, with emerging technologies likely to change how energy is consumed and how energy users interact with market participants. To take advantage of these opportunities, a new energy services business will be created. This business will combine the competitive elements from Energex and Ergon to and deliver renewable solutions and energy management options that respond to customer demand and harness the latest innovations in energy technology, such as battery storage, with a focus on delivering solutions for remote and isolated communities. Ergon Retail will also form part of this Townsville–based business.
Hard–working frontline staff will be vital to the success of the merged distribution business in adapting to the changing energy environment. The merger of Energex and Ergon Energy will result in a larger, more diverse business, creating opportunities for employees, while a dedicated energy services business will generate new jobs and opportunities for existing staff to work in a business unit focussed on delivering innovative products and services. Consistent with existing employee agreements, this Government is committed to ensuring there will be no forced redundancies as a result of the merger process.
|
|
Box 2 Review of energy government-owned corporations In the lead–up to the January 2015 election, the Government committed to pay down General Government Sector debt of $12.1 billion by 2024–25 by keeping government–owned corporations in the hands of Queenslanders, improving their performance, and using government–owned corporation dividends to pay down debt. The pre–election Our State Our Assets Fiscal Strategy and Debt Action Plan identified more than $150 million per annum in savings by consolidating government owned corporations in the energy sector. As part of the 2015–16 State Budget, the Government announced revised capital structures and dividend payout ratios for the energy network businesses. This strategy aligns the businesses’ gearing with more commercial industry standards, and is expected to remit $4.1 billion from the businesses to General Government Sector over the forward estimates. To date, some $3.5 billion has been remitted to Government. Since the 2015–16 Budget, the Government has undertaken a detailed review of possible merger options for the government–owned energy network, generation and retail businesses to optimise the efficiency and effectiveness of the State’s energy businesses. Electricity networks The review has concluded that the Energex and Ergon Energy should be merged to achieve operational synergies, efficiency savings and be able to adapt to electricity supply markets with increased presence of renewables. A parent company will be established by mid–2016 and will facilitate the merger of corporate functions, while allowing Ergon Energy and Energex to retain their strong regionally–based operational focus, with frontline staff continuing to deliver network services in their respective regions. A new energy services business will be formed, combining the competitive elements from Energex and Ergon Energy to offer a broad range of new products and services, particularly in regional areas. These products and services could include solar panels, battery storage, energy management systems, smart meters, and demand management services that will respond to customer needs and innovations in energy technology. This business will be based in Townsville, which will help create new local jobs while delivering solutions for all of Queensland, including for remote and isolated communities in regional Queensland. Ergon Retail will form part of the Townsville-based business. |
Mid Year Fiscal and Economic Review 2015-16
|
Powerlink will remain a stand–alone transmission business, with an increased expectation of delivering efficiency savings across its business. This decision recognises the different roles of the transmission and distribution network operators in facing the challenges presented by the changing energy market. Powerlink will have to adapt to increasing levels of renewable generation while maintaining high levels of reliability and low costs. Government will also commence a strategic assessment of Powerlink to align work practices with the other network businesses. The Government remains committed to a policy of no forced redundancies throughout this reform process. Electricity generators A core consideration in assessing the forward strategy for the generation businesses is ensuring an appropriate level of competition is maintained in the wholesale market. After close consultation with the Australian Competition and Consumer Commission (ACCC), Government has decided to retain CS Energy and Stanwell as separate generation businesses, delivering efficiency savings without compromising the market. This is consistent with Government’s commitment to protect competition and consult with the ACCC. Coal–fired generation businesses are facing the challenges of new technologies, an increasing influence of renewables and a transition to a lower carbon emitting economy. The Government will consider further how best to position these businesses to adapt to the challenges of an aging fleet and competition from alternative technologies. There will be a renewed focus on pursuing efficiency savings and optimising capital investments to provide portfolio flexibility as the wholesale electricity market continues to evolve. Savings The energy businesses have commenced the implementation of efficiency savings ahead of any merger announcement. Total savings since the 2015–16 Budget up until 2019–20 are expected to amount to $680 million, of which $570 million relates to savings in the network businesses and $110 million of savings in generation businesses. Savings will be realised by removing the duplication in the corporate overhead functions, such as using only one enterprise management system instead of two and reducing the investment required needed to upgrade network ICT systems. Savings will also be realised by reducing the number of executives and board members, with their corresponding administrative overhead costs, and rationalising office property to reduce accommodation costs. The businesses will also reduce their spending on building new network assets or replacing old network assets by adopting enhanced network technologies and asset management strategies. |
| 3.7.1 | Savings from efficiencies and merger synergies |
Table 6 shows the estimated efficiencies and merger synergies savings across the energy government–owned corporations. The estimated savings from the merger of the distribution entities have been based on an expected date of mid–2016 for the establishment of the parent company. The efficiencies across each of the energy government–owned corporations are assumed to commence in 2015–16.
Table 6: Savings from efficiencies and merger synergies
| | | | | | | | | | | | | | | | | | | | | | | | |
| | | 2015–16
$ million | | | 2016–17
$ million | | | 2017–18
$ million | | | 2018–19
$ million | | | 2019–20
$ million | | | Total
$ million | |
Distribution Merger and Efficiency Savings | | | (8 | ) | | | 10 | | | | 178 | | | | 180 | | | | 202 | | | | 562 | |
Transmission Efficiency Savings | | | 1 | | | | 5 | | | | (4 | ) | | | 0 | | | | 6 | | | | 8 | |
Generation Efficiency Savings | | | 17 | | | | 31 | | | | (1 | ) | | | 57 | | | | 6 | | | | 110 | |
Total | | | 10 | | | | 46 | | | | 173 | | | | 237 | | | | 214 | | | | 680 | |
Note:
| 1. | Numbers may not add due to rounding. Bracketed numbers represent negative amounts. |
Source: Queensland Treasury.
Mid Year Fiscal and Economic Review 2015-16
| 3.8 | Infrastructure investment |
| 3.8.1 | General Government Sector |
Within the General Government Sector, purchases of non–financial assets (capital spending) are expected to be $5.325 billion in 2015–16 and $5.822 billion in 2016–17, broadly consistent with estimates in the 2015–16 Budget. Capital purchases of $5.935 billion in 2017–18 and $5.188 billion in 2018–19 are less than the forecasts of $6.125 billion and $5.851 billion for these years respectively in the 2015–16 Budget. The apparent reduction since the 2015–16 Budget in General Government Sector capital spending is primarily due to the Toowoomba Second Range Crossing now being accounted for as a Public Private Partnership, which reduces the level of direct capital purchases identified by the Government.
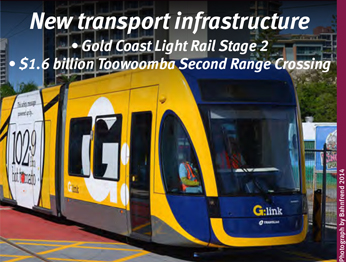
The Government is progressing with Gold Coast Light Rail Stage 2, which will deliver a seamless connection with Helensvale heavy rail station, providing a world–class integrated public transport solution for residents and visitors on the Gold Coast. The State Government is working with the Gold Coast City Council and Australian Government to deliver the project which is expected to be completed and operational before the commencement of the 2018 Commonwealth Games. The State’s contribution will be funded from savings identified within the existing budget of the Department of Transport and Main Roads.
| 3.8.2 | Non–financial Public Sector |
The Non–financial Public Sector (NFPS) is the consolidation of the General Government and Public Non–financial Corporations (i.e. commercial) Sectors, with transactions between these sectors eliminated. Capital spending of $8.474 billion in the NFPS in 2015–16, is $100 million less than the 2015–16 Budget estimate. Forecast capital spending in the NFPS for the period 2016–17 to 2018–19 is $25.474 billion, $1.314 billion lower than estimated in the 2015–16 Budget. The reduction over the forward estimates largely relates to the take–up of Public Private Partnerships, the impact of the Australian Energy Regulator determination for Energex and Ergon Energy and capital efficiencies associated with the merger of energy network businesses.
| 3.8.3 | Facilitating private infrastructure investment |
The Government is also working with the business community on a range of infrastructure projects that will provide significant stimulus to economic and employment growth in Queensland. These projects include:
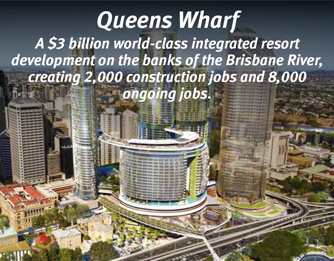
| | • | | Queen’s Wharf Brisbane, which will deliver a $3 billion world class integrated resort development creating 2,000 construction jobs and 8,000 ongoing jobs. It will also deliver in excess of $200 million cash in 2016 from the Destination Brisbane Consortium, which will reduce General Government Sector debt. Further, the Consortium has guaranteed to pay a minimum of $880 million in gambling taxes for the first ten years of operation. |
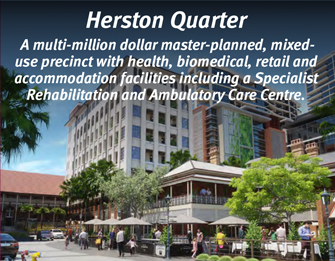
| | • | | Herston Quarter Redevelopment Project, an approximately five hectare site adjacent to the Royal Brisbane and Women’s Hospital earmarked to become a mixed use precinct for health, bio–medical, residential and retail activity. Proposals for the redevelopment will be received in early 2016 and are required to include the delivery of a public health facility, known as the Specialist Rehabilitation and Ambulatory Care Centre. |
| | • | | A private industry market–led proposal to address congestion and safety concerns on the vital freight routes of the Logan and Gateway Extension Motorways through a $450 million package of upgrade works. |
Mid Year Fiscal and Economic Review 2015-16
| 3.9.1 | General Government Sector |
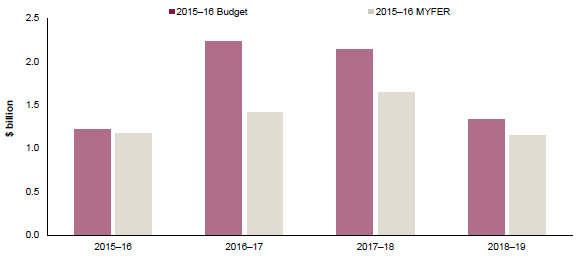
General Government Sector borrowings are estimated to be $37.973 billion at 30 June 2016, a reduction of $5.132 billion on the 2014–15 actual of $43.105 billion. Estimates of borrowings are similar to the 2015–16 Budget across the forward estimates period, with smaller net operating surpluses largely offset by the implementation of further measures under the Debt Action Plan.
The MYFER maintains the significant reductions in General Government Sector borrowings announced in the 2015–16 Budget, with borrowings projected to be lower at the end of the forward estimates than in 2014–15.
General Government Sector debt, which incorporates the impact of the Debt Action Plan, as well as all other budget movements, is expected to fall from $43.105 billion in 2014–15, to $39.721 billion in 2017–18. This is $7.4 billion lower than the projection for 2017–18 at the time of the 2014–15 MYFER and $8.7 billion lower than projected in the 2014–15 Budget.
Chart 7: Borrowings1
(General Government Sector, $ billion)
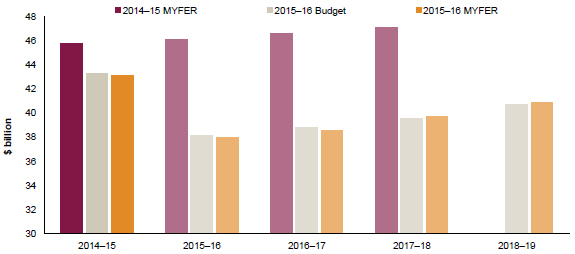
Note:
| 1. | In the 2015-16 MYFER, 2014-15 borrowing is an actual. 2015-16 onwards are forecasts. There was not a forecast for 2018-19 in the 2014-15 MYFER. |
Source: Queensland Treasury.
| 3.9.2 | Non–financial Public Sector |
Borrowings of $73.878 billion are projected at 30 June 2016 in the NFPS, $235 million less than the 2015–16 Budget estimate, driven by lower borrowings in the General Government Sector.
Across the remainder of the forward estimates, modest upward revisions have been made to NFPS borrowings. By 2018–19, borrowings are expected to be $79.667 billion, 1.0% higher than anticipated in the 2015–16 Budget. This is mainly driven by the smaller General Government net operating surpluses.
Mid Year Fiscal and Economic Review 2015-16
| 4.0 | Achievement of the Government’s fiscal principles |
The Government remains committed to its five fiscal principles that were tabled in Parliament in the Charter of Fiscal Responsibility. These principles underpin the development of the State fiscal strategy and financial decision making.
Table 7: The fiscal principles of the Queensland Government1
| | | | | | | | | | | | |
Principle | | Indicator | |
| | | General Government Debt to Revenue Ratio | |
| | | | | | 2015–16 Budget
% | | | 2015–16 MYFER
% | |
Target ongoing reductions in Queensland’s relative debt burden, as measured by the General Government debt to revenue ratio | | | 2014–15 | | | | 87 | | | | 87 | |
| | | 2015–16 | | | | 75 | | | | 74 | |
| | | 2016–17 | | | | 72 | | | | 72 | |
| | | 2017–18 | | | | 71 | | | | 72 | |
| | | 2018–19 | | | | 73 | | | | 74 | |
| |
| | | General Government Operating Cashflows as a
proportion of the Capital Program | |
| | | | | | 2015–16 Budget
% | | | 2015–16 MYFER
% | |
Target net operating surpluses that ensure any new capital investment in the General Government Sector is funded primarily through recurrent revenues rather than borrowing | | | 2014–15 | | | | 82 | | | | 89 | |
| | | 2015–16 | | | | 83 | | | | 82 | |
| | | 2016–17 | | | | 99 | | | | 83 | |
| | | 2017–18 | | | | 94 | | | | 85 | |
| | | 2018–19 | | | | 77 | | | | 80 | |
| |
| | | General Government Capital Program | |
| | | | | | 2015–16 Budget
($ million) | | | 2015–16 MYFER
($ million) | |
The capital program will be managed to ensure a consistent flow of works to support jobs and the economy and reduce the risk of backlogs emerging | | | 2014–15 | | | | 4,987 | | | | 4,779 | |
| | | 2015–16 | | | | 5,374 | | | | 5,325 | |
| | | 2016–17 | | | | 5,832 | | | | 5,822 | |
| | | 2017–18 | | | | 6,125 | | | | 5,935 | |
| | | 2018–19 | | | | 5,851 | | | | 5,188 | |
| |
| | | General Government own–source revenue to GSP | |
Maintain competitive taxation – own–source revenue to remain at or below 8.5% as a proportion of nominal gross state product | | | 2015–16: | | | | | | | | 8.2 | % |
| |
| Average across the
forward estimates: |
| | | 7.8 | % |
Target full funding of long term liabilities such as superannuation and WorkCover in accordance with actuarial advice | |
| As at last actuarial review (released
June 2014), accruing superannuation
liabilities were fully funded. The
State Actuary reviews the scheme
every three years. The WorkCover
scheme was fully funded as at 30
June 2015. |
|
Mid Year Fiscal and Economic Review 2015-16
Principle 1 – Target ongoing reductions in Queensland’s relative debt burden, as measured by the General Government debt to revenue ratio
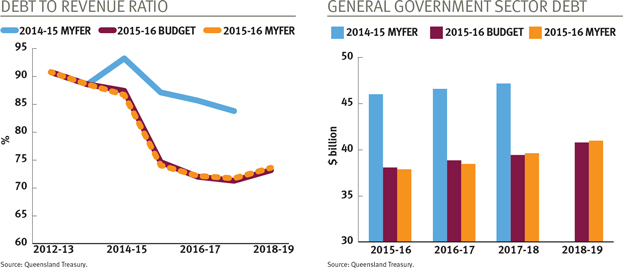
The initial measures in the Debt Action Plan are being implemented and the Government has made a commitment to further debt reduction measures under the Debt Action Plan. The debt to revenue ratio is expected to reduce from 87% in 2014–15 to 74% in 2015–16, staying around this level across the forward estimates on current policy settings.
Chart 8: Debt to revenue ratio1
(General Government Sector, %)
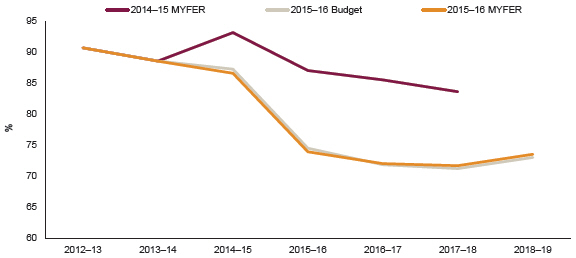
Note:
| 1. | 2015–16 onwards are forecasts. |
Source: Queensland Treasury.
Mid Year Fiscal and Economic Review 2015-16
Principle 2 – Target net operating surpluses that ensure any new capital investment in the General Government Sector is funded primarily through recurrent revenues rather than borrowing
Despite the revenue challenges facing the State, the Government will continue to deliver strong net operating surpluses in each year of the forward estimates. In 2015–16 it is expected that net cash inflows from operating activities will cover 82% of the capital program, with 82% also representing the average proportion of capital funded from net operating cash flows across the forward estimates.
Chart 9: Net cash inflows from operating activities as a proportion of purchases of non–financial assets1
(General Government Sector, %)
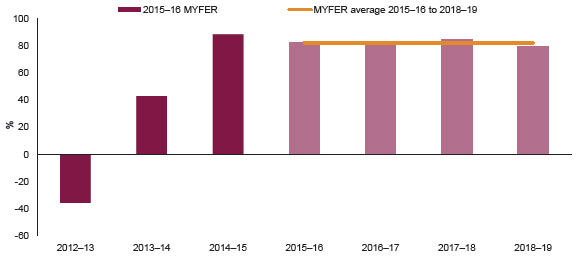
Note:
| 1. | 2015–16 onwards are forecasts. |
Source: Queensland Treasury.
Principle 3 – The capital program will be managed to ensure a consistent flow of works to support jobs and the economy and reduce the risk of backlogs emerging
The 2015–16 capital program is on track and the recently released draft State Infrastructure Plan will provide the basis for ongoing planning and delivery of the State’s investment in infrastructure.
While the value of the capital program can fluctuate across individual years, due to the lumpy nature of large projects and the timing of Commonwealth–funded projects, the 2015–16 MYFER provides for an increase in General Government Sector capital purchases from $4.8 billion in 2014–15 to $5.3 billion in 2015–16.
Mid Year Fiscal and Economic Review 2015-16
Principle 4 – Maintain competitive taxation by ensuring that General Government sector own–source revenue remains at or below 8.5% of nominal gross state product, on average, across the forward estimates
General Government own source revenue averages 7.8% across the forward estimates, ensuring that Government’s revenue efforts do not constrain economic activity or place an undue burden on households.
In addition, Queensland’s level of state taxation remains competitive, with Queensland’s state taxation of $2,638 per person well below the average of other Australian jurisdictions of $3,358 per person. Queensland’s tax per capita is $28 lower for 2015–16 at MYFER than forecast in the 2015–16 Budget.
Chart 10: State taxation per capita1
(thousand $ per person)
Note:
| 1. | 2015–16 figures are forecasts. Weighted average of other regions excludes Qld. |
Source: ABS 3101.0; Commonwealth Treasury; various 2015–16 state and territory budgets (NSW; WA; Tas.; ACT) and mid–year reviews (Vic.; NT; SA); Queensland Treasury.
Principle 5 – Target full funding of long term liabilities such as superannuation and WorkCover in accordance with actuarial advice
Consistent with the long–standing practice of successive governments, the Queensland Government is committed to ensuring that the State sets aside assets, on an actuarially determined basis, to meet long term liabilities such as superannuation and WorkCover.
Queensland continues to be the only state that has fully funded superannuation liabilities. WorkCover is also fully funded.
Mid Year Fiscal and Economic Review 2015-16
| 5.0 | Uniform Presentation Framework and Loan Council Allocation |
| | 5.1 | Uniform Presentation Framework financial information |
Table 8: General Government Sector Operating Statement1
| | | | | | | | | | | | | | | | | | | | | | | | | | |
| | | | | 2014-15
Actual
$ million | | | 2015-16
Budget
$ million | | | 2015-16
Revised
$ million | | | 2016-17
Projection
$ million | | | 2017-18
Projection
$ million | | | 2018-19
Projection
$ million | |
| | Revenue from Transactions | | | | | | | | | | | | | | | | | | | | | | | | |
| | Taxation revenue | | | 12,575 | | | | 12,926 | | | | 12,788 | | | | 13,265 | | | | 13,925 | | | | 14,599 | |
| | Grants revenue | | | 23,594 | | | | 24,555 | | | | 24,801 | | | | 26,217 | | | | 27,023 | | | | 26,217 | |
| | Sales of goods and services | | | 5,250 | | | | 5,430 | | | | 5,447 | | | | 5,416 | | | | 5,818 | | | | 5,796 | |
| | Interest income | | | 2,470 | | | | 2,372 | | | | 2,499 | | | | 2,313 | | | | 2,301 | | | | 2,289 | |
| | Dividend and income tax equivalent income | | | 2,554 | | | | 2,395 | | | | 2,397 | | | | 2,446 | | | | 1,987 | | | | 1,991 | |
| | Other revenue | | | 3,322 | | | | 3,509 | | | | 3,422 | | | | 3,862 | | | | 4,339 | | | | 4,737 | |
| | Total Revenue from Transactions | | | 49,765 | | | | 51,186 | | | | 51,354 | | | | 53,520 | | | | 55,392 | | | | 55,630 | |
| | | | | | | |
| Less | | Expenses from Transactions | | | | | | | | | | | | | | | | | | | | | | | | |
| | Employee expenses | | | 18,593 | | | | 19,937 | | | | 19,886 | | | | 20,495 | | | | 21,123 | | | | 21,590 | |
| | Superannuation expenses | | | | | | | | | | | | | | | | | | | | | | | | |
| | Superannuation interest cost | | | 878 | | | | 803 | | | | 757 | | | | 797 | | | | 832 | | | | 840 | |
| | Other superannuation expenses | | | 2,319 | | | | 2,553 | | | | 2,588 | | | | 2,585 | | | | 2,572 | | | | 2,606 | |
| | Other operating expenses | | | 14,519 | | | | 14,980 | | | | 15,169 | | | | 16,242 | | | | 17,281 | | | | 17,568 | |
| | Depreciation and amortisation | | | 3,154 | | | | 3,264 | | | | 3,280 | | | | 3,452 | | | | 3,524 | | | | 3,637 | |
| | Other interest expenses | | | 2,328 | | | | 2,115 | | | | 2,198 | | | | 1,987 | | | | 1,967 | | | | 1,949 | |
| | Grants expenses | | | 7,433 | | | | 6,320 | | | | 6,302 | | | | 6,548 | | | | 6,452 | | | | 6,295 | |
| | Total Expenses from Transactions | | | 49,224 | | | | 49,973 | | | | 50,180 | | | | 52,107 | | | | 53,752 | | | | 54,485 | |
| Equals | | Net Operating Balance | | | 542 | | | | 1,213 | | | | 1,175 | | | | 1,413 | | | | 1,640 | | | | 1,145 | |
| | | | | | | |
| Plus | | Other economic flows - included in operating result | | | 3,535 | | | | (139 | ) | | | 507 | | | | (437 | ) | | | (3 | ) | | | 8 | |
| | | | | | | |
| Equals | | Operating Result | | | 4,076 | | | | 1,074 | | | | 1,681 | | | | 976 | | | | 1,638 | | | | 1,153 | |
| | | | | | | |
| Plus | | Other economic flows - other movements in equity | | | (5,159 | ) | | | 2,619 | | | | 1,407 | | | | 2,823 | | | | 2,281 | | | | 2,069 | |
| | | | | | | |
| Equals | | Comprehensive Result - Total Change In Net Worth | | | (1,083 | ) | | | 3,693 | | | | 3,088 | | | | 3,798 | | | | 3,919 | | | | 3,222 | |
| | | | | | | | | | | | | | | | | | | | | | | | | | |
| | | | | | | |
| | KEY FISCAL AGGREGATES | | | | | | | | | | | | | | | | | | | | | | | | |
| | | | | | | |
| | Net Operating Balance | | | 542 | | | | 1,213 | | | | 1,175 | | | | 1,413 | | | | 1,640 | | | | 1,145 | |
| | | | | | | |
| Less | | Net Acquisition of Non-financial Assets | | | | | | | | | | | | | | | | | | | | | | | | |
| | Purchases of non-financial assets | | | 4,779 | | | | 5,374 | | | | 5,325 | | | | 5,822 | | | | 5,935 | | | | 5,188 | |
| | Less Sales of non-financial assets | | | 417 | | | | 305 | | | | 284 | | | | 258 | | | | 241 | | | | 176 | |
| | Less Depreciation | | | 3,154 | | | | 3,264 | | | | 3,280 | | | | 3,452 | | | | 3,524 | | | | 3,637 | |
| | Plus Change in inventories | | | (57 | ) | | | 25 | | | | 8 | | | | (15 | ) | | | (12 | ) | | | (21 | ) |
| | Plus Other movements in non-financial assets | | | (29 | ) | | | 545 | | | | 544 | | | | 1,023 | | | | 612 | | | | 841 | |
| | Equals Total Net Acquisition of Non-financial | | | | | | | | | | | | | | | | | | | | | | | | |
| | Assets | | | 1,122 | | | | 2,375 | | | | 2,314 | | | | 3,121 | | | | 2,770 | | | | 2,195 | |
| Equals | | Fiscal Balance | | | (581 | ) | | | (1,162 | ) | | | (1,140 | ) | | | (1,708 | ) | | | (1,130 | ) | | | (1,050 | ) |
Note:
| 1. | Numbers may not add due to rounding and bracketed numbers represent negative amounts. |
Mid Year Fiscal and Economic Review 2015-16
Table 9: Public Non-financial Corporations Sector Operating Statement1
| | | | | | | | | | | | | | | | | | | | | | | | | | |
| | | | | 2014-15
Actual
$ million | | | 2015-16
Budget
$ million | | | 2015-16
Revised
$ million | | | 2016-17
Projection
$ million | | | 2017-18
Projection
$ million | | | 2018-19
Projection
$ million | |
| | Revenue from Transactions | | | | | | | | | | | | | | | | | | | | | | | | |
| | Grants revenue | | | 763 | | | | 649 | | | | 667 | | | | 785 | | | | 743 | | | | 801 | |
| | Sales of goods and services | | | 10,230 | | | | 10,477 | | | | 10,295 | | | | 10,879 | | | | 10,750 | | | | 10,915 | |
| | Interest income | | | 68 | | | | 53 | | | | 56 | | | | 43 | | | | 45 | | | | 45 | |
| | Dividend and income tax equivalent income | | | 10 | | | | | | | | 11 | | | | 11 | | | | 11 | | | | 11 | |
| | Other revenue | | | 342 | | | | 191 | | | | 157 | | | | 173 | | | | 199 | | | | 208 | |
| | Total Revenue from Transactions | | | 11,413 | | | | 11,370 | | | | 11,186 | | | | 11,891 | | | | 11,746 | | | | 11,981 | |
| | | | | | | |
| Less | | Expenses from Transactions | | | | | | | | | | | | | | | | | | | | | | | | |
| | Employee expenses | | | 1,534 | | | | 1,691 | | | | 1,697 | | | | 1,738 | | | | 1,719 | | | | 1,714 | |
| | Superannuation expenses | | | | | | | | | | | | | | | | | | | | | | | | |
| | Superannuation interest cost | | | (5 | ) | | | — | | | | — | | | | — | | | | — | | | | — | |
| | Other superannuation expenses | | | 199 | | | | 221 | | | | 222 | | | | 225 | | | | 228 | | | | 233 | |
| | Other operating expenses | | | 3,115 | | | | 3,095 | | | | 2,894 | | | | 3,107 | | | | 3,303 | | | | 3,471 | |
| | Depreciation and amortisation | | | 2,358 | | | | 2,380 | | | | 2,389 | | | | 2,456 | | | | 2,563 | | | | 2,628 | |
| | Other interest expenses | | | 1,898 | | | | 1,907 | | | | 1,924 | | | | 2,036 | | | | 2,019 | | | �� | 2,024 | |
| | Grants expenses | | | 11 | | | | 15 | | | | 15 | | | | 15 | | | | 15 | | | | 15 | |
| | Other property expenses | | | 678 | | | | 738 | | | | 723 | | | | 747 | | | | 603 | | | | 602 | |
| | Total Expenses from Transactions | | | 9,788 | | | | 10,047 | | | | 9,864 | | | | 10,324 | | | | 10,450 | | | | 10,688 | |
| Equals | | Net Operating Balance | | | 1,625 | | | | 1,323 | | | | 1,322 | | | | 1,567 | | | | 1,296 | | | | 1,293 | |
| | | | | | | |
| Plus | | Other economic flows - included in operating result | | | 121 | | | | 26 | | | | 109 | | | | (14 | ) | | | (67 | ) | | | (79 | ) |
| | | | | | | |
| Equals | | Operating Result | | | 1,746 | | | | 1,349 | | | | 1,432 | | | | 1,554 | | | | 1,229 | | | | 1,214 | |
| | | | | | | |
| Plus | | Other economic flows - other movements in equity | | | (5,133 | ) | | | (1,216 | ) | | | (2,425 | ) | | | (1,107 | ) | | | (1,011 | ) | | | (1,074 | ) |
| | | | | | | |
| Equals | | Comprehensive Result - Total Change In Net Worth | | | (3,387 | ) | | | 133 | | | | (993 | ) | | | 446 | | | | 218 | | | | 140 | |
| | | | | | | | | | | | | | | | | | | | | | | | | | |
| | | | | | | |
| | KEY FISCAL AGGREGATES | | | | | | | | | | | | | | | | | | | | | | | | |
| | | | | | | |
| | Net Operating Balance | | | 1,625 | | | | 1,323 | | | | 1,322 | | | | 1,567 | | | | 1,296 | | | | 1,293 | |
| | | | | | | |
| Less | | Net Acquisition of Non-financial Assets | | | | | | | | | | | | | | | | | | | | | | | | |
| | Purchases of non-financial assets | | | 3,173 | | | | 3,201 | | | | 3,149 | | | | 3,022 | | | | 2,736 | | | | 2,770 | |
| | Less Sales of non-financial assets | | | 124 | | | | 46 | | | | 53 | | | | 58 | | | | 32 | | | | 32 | |
| | Less Depreciation | | | 2,358 | | | | 2,380 | | | | 2,389 | | | | 2,456 | | | | 2,563 | | | | 2,628 | |
| | Plus Change in inventories | | | (12 | ) | | | (11 | ) | | | 13 | | | | 3 | | | | 21 | | | | 18 | |
| | Plus Other movements in non-financial assets | | | 102 | | | | 45 | | | | 30 | | | | 36 | | | | 39 | | | | 41 | |
| | Equals Total Net Acquisition of Non-financial | | | | | | | | | | | | | | | | | | | | | | | | |
| | Assets | | | 781 | | | | 809 | | | | 749 | | | | 547 | | | | 201 | | | | 169 | |
| Equals | | Fiscal Balance | | | 844 | | | | 513 | | | | 573 | | | | 1,021 | | | | 1,095 | | | | 1,124 | |
Note:
| 1. | Numbers may not add due to rounding and bracketed numbers represent negative amounts. |
36
Mid Year Fiscal and Economic Review 2015-16
Table 10: Non-financial Public Sector Operating Statement1
| | | | | | | | | | | | | | | | | | | | | | | | | | |
| | | | | 2014-15
Actual
$ million | | | 2015-16
Budget
$ million | | | 2015-16
Revised
$ million | | | 2016-17
Projection
$ million | | | 2017-18
Projection
$ million | | | 2018-19
Projection
$ million | |
| | Revenue from Transactions | | | | | | | | | | | | | | | | | | | | | | | | |
| | Taxation revenue | | | 12,227 | | | | 12,584 | | | | 12,457 | | | | 12,906 | | | | 13,545 | | | | 14,209 | |
| | Grants revenue | | | 23,683 | | | | 24,698 | | | | 24,904 | | | | 26,333 | | | | 27,143 | | | | 26,340 | |
| | Sales of goods and services | | | 13,709 | | | | 14,022 | | | | 13,872 | | | | 14,349 | | | | 14,613 | | | | 14,745 | |
| | Interest income | | | 2,537 | | | | 2,426 | | | | 2,555 | | | | 2,356 | | | | 2,345 | | | | 2,334 | |
| | Dividend and income tax equivalent income | | | 161 | | | | 72 | | | | 83 | | | | 98 | | | | 116 | | | | 138 | |
| | Other revenue | | | 3,655 | | | | 3,699 | | | | 3,579 | | | | 4,036 | | | | 4,538 | | | | 4,946 | |
| | Total Revenue from Transactions | | | 55,973 | | | | 57,501 | | | | 57,450 | | | | 60,077 | | | | 62,301 | | | | 62,713 | |
| | | | | | | |
| Less | | Expenses from Transactions | | | | | | | | | | | | | | | | | | | | | | | | |
| | Employee expenses | | | 20,030 | | | | 21,531 | | | | 21,474 | | | | 22,123 | | | | 22,730 | | | | 23,190 | |
| | Superannuation expenses | | | | | | | | | | | | | | | | | | | | | | | | |
| | Superannuation interest cost | | | 873 | | | | 803 | | | | 757 | | | | 797 | | | | 832 | | | | 840 | |
| | Other superannuation expenses | | | 2,518 | | | | 2,775 | | | | 2,810 | | | | 2,810 | | | | 2,801 | | | | 2,839 | |
| | Other operating expenses | | | 15,841 | | | | 16,183 | | | | 16,185 | | | | 17,395 | | | | 18,621 | | | | 19,064 | |
| | Depreciation and amortisation | | | 5,511 | | | | 5,644 | | | | 5,669 | | | | 5,908 | | | | 6,087 | | | | 6,265 | |
| | Other interest expenses | | | 3,994 | | | | 3,791 | | | | 3,911 | | | | 3,787 | | | | 3,732 | | | | 3,711 | |
| | Grants expenses | | | 6,769 | | | | 5,829 | | | | 5,753 | | | | 5,894 | | | | 5,846 | | | | 5,632 | |
| | Total Expenses from Transactions | | | 55,537 | | | | 56,556 | | | | 56,560 | | | | 58,714 | | | | 60,648 | | | | 61,542 | |
| Equals | | Net Operating Balance | | | 436 | | | | 946 | | | | 890 | | | | 1,364 | | | | 1,653 | | | | 1,171 | |
| | | | | | | |
| Plus | | Other economic flows - included in operating result | | | 522 | | | | (268 | ) | | | (649 | ) | | | (450 | ) | | | (367 | ) | | | (416 | ) |
| | | | | | | |
| Equals | | Operating Result | | | 959 | | | | 678 | | | | 242 | | | | 914 | | | | 1,286 | | | | 755 | |
| | | | | | | |
| Plus | | Other economic flows - other movements in equity | | | (2,042 | ) | | | 3,016 | | | | 2,846 | | | | 2,885 | | | | 2,633 | | | | 2,467 | |
| | | | | | | |
| Equals | | Comprehensive Result - Total Change In Net Worth | | | (1,083 | ) | | | 3,693 | | | | 3,088 | | | | 3,798 | | | | 3,919 | | | | 3,222 | |
| | | | | | | | | | | | | | | | | | | | | | | | | | |
| | | | | | | |
| | KEY FISCAL AGGREGATES | | | | | | | | | | | | | | | | | | | | | | | | |
| | | | | | | |
| | Net Operating Balance | | | 436 | | | | 946 | | | | 890 | | | | 1,364 | | | | 1,653 | | | | 1,171 | |
| | | | | | | |
| Less | | Net Acquisition of Non-financial Assets | | | | | | | | | | | | | | | | | | | | | | | | |
| | Purchases of non-financial assets | | | 7,954 | | | | 8,574 | | | | 8,474 | | | | 8,844 | | | | 8,672 | | | | 7,958 | |
| | Less Sales of non-financial assets | | | 542 | | | | 351 | | | | 337 | | | | 316 | | | | 272 | | | | 208 | |
| | Less Depreciation | | | 5,511 | | | | 5,644 | | | | 5,669 | | | | 5,908 | | | | 6,087 | | | | 6,265 | |
| | Plus Change in inventories | | | (69 | ) | | | 14 | | | | 22 | | | | (12 | ) | | | 9 | | | | (3 | ) |
| | Plus Other movements in non-financial assets | | | 72 | | | | 590 | | | | 574 | | | | 1,059 | | | | 651 | | | | 882 | |
| | Equals Total Net Acquisition of Non-financial | | | | | | | | | | | | | | | | | | | | | | | | |
| | Assets | | | 1,905 | | | | 3,184 | | | | 3,064 | | | | 3,668 | | | | 2,971 | | | | 2,364 | |
| Equals | | Fiscal Balance | | | (1,469 | ) | | | (2,238 | ) | | | (2,173 | ) | | | (2,304 | ) | | | (1,319 | ) | | | (1,193 | ) |
Note:
| 1. | Numbers may not add due to rounding and bracketed numbers represent negative amounts. |
Mid Year Fiscal and Economic Review 2015-16
Table 11: General Government Sector Balance Sheet1
| | | | | | | | | | | | | | | | | | | | | | | | |
| | | 2014-15
Actual
$ million | | | 2015-16
Budget
$ million | | | 2015-16
Revised
$ million | | | 2016-17
Projection
$ million | | | 2017-18
Projection
$ million | | | 2018-19
Projection
$ million | |
Assets | | | | | | | | | | | | | | | | | | | | | | | | |
Financial Assets | | | | | | | | | | | | | | | | | | | | | | | | |
Cash and deposits | | | 1,172 | | | | 875 | | | | 786 | | | | 744 | | | | 614 | | | | 561 | |
Advances paid | | | 643 | | | | 820 | | | | 759 | | | | 805 | | | | 857 | | | | 801 | |
Investments, loans and placements | | | 36,146 | | | | 33,229 | | | | 33,034 | | | | 33,221 | | | | 33,285 | | | | 33,289 | |
Receivables | | | 7,557 | | | | 4,177 | | | | 5,306 | | | | 3,770 | | | | 3,698 | | | | 3,754 | |
Equity | | | | | | | | | | | | | | | | | | | | | | | | |
Investments in other public sector entities | | | 23,441 | | | | 22,528 | | | | 22,448 | | | | 22,894 | | | | 23,113 | | | | 23,253 | |
Investments - other | | | 158 | | | | 170 | | | | 169 | | | | 179 | | | | 189 | | | | 199 | |
Total Financial Assets | | | 69,117 | | | | 61,798 | | | | 62,503 | | | | 61,614 | | | | 61,756 | | | | 61,857 | |
Non-financial Assets | | | | | | | | | | | | | | | | | | | | | | | | |
Land and other fixed assets | | | 173,143 | | | | 180,775 | | | | 176,361 | | | | 180,038 | | | | 183,501 | | | | 187,254 | |
Other non-financial assets | | | 6,520 | | | | 6,283 | | | | 6,685 | | | | 7,092 | | | | 7,498 | | | | 7,119 | |
Total Non-financial Assets | | | 179,663 | | | | 187,058 | | | | 183,045 | | | | 187,129 | | | | 190,999 | | | | 194,373 | |
Total Assets | | | 248,779 | | | | 248,856 | | | | 245,548 | | | | 248,743 | | | | 252,755 | | | | 256,230 | |
Liabilities | | | | | | | | | | | | | | | | | | | | | | | | |
Payables | | | 3,188 | | | | 3,328 | | | | 3,001 | | | | 2,931 | | | | 2,988 | | | | 3,059 | |
Superannuation liability | | | 25,869 | | | | 24,278 | | | | 24,532 | | | | 22,984 | | | | 21,656 | | | | 20,385 | |
Other employee benefits | | | 4,725 | | | | 5,204 | | | | 4,890 | | | | 5,039 | | | | 5,189 | | | | 5,365 | |
Deposits held | | | 3 | | | | 1 | | | | 3 | | | | 3 | | | | 3 | | | | 3 | |
Advances received | | | 625 | | | | 682 | | | | 664 | | | | 659 | | | | 654 | | | | 611 | |
Borrowing | | | 43,105 | | | | 38,151 | | | | 37,973 | | | | 38,561 | | | | 39,721 | | | | 40,921 | |
Other liabilities | | | 3,082 | | | | 3,512 | | | | 3,217 | | | | 3,498 | | | | 3,557 | | | | 3,678 | |
Total Liabilities | | | 80,597 | | | | 75,155 | | | | 74,278 | | | | 73,675 | | | | 73,768 | | | | 74,021 | |
Net Worth | | | 168,182 | | | | 173,701 | | | | 171,270 | | | | 175,068 | | | | 178,987 | | | | 182,209 | |
| | | | | | | | | | | | | | | | | | | | | | | | |
Net Financial Worth | | | (11,481 | ) | | | (13,357 | ) | | | (11,775 | ) | | | (12,061 | ) | | | (12,012 | ) | | | (12,164 | ) |
Net Financial Liabilities | | | 34,922 | | | | 35,885 | | | | 34,223 | | | | 34,955 | | | | 35,125 | | | | 35,417 | |
Net Debt | | | 5,772 | | | | 3,910 | | | | 4,060 | | | | 4,453 | | | | 5,621 | | | | 6,884 | |
Note:
| 1. | Numbers may not add due to rounding and bracketed numbers represent negative amounts. |
Mid Year Fiscal and Economic Review 2015-16
Table 12: Public Non-financial Corporations Sector Balance Sheet1
| | | | | | | | | | | | | | | | | | | | | | | | |
| | | 2014-15
Actual
$ million | | | 2015-16
Budget
$ million | | | 2015-16
Revised
$ million | | | 2016-17
Projection
$ million | | | 2017-18
Projection
$ million | | | 2018-19
Projection
$ million | |
Assets | | | | | | | | | | | | | | | | | | | | | | | | |
Financial Assets | | | | | | | | | | | | | | | | | | | | | | | | |
Cash and deposits | | | 2,001 | | | | 1,257 | | | | 1,115 | | | | 847 | | | | 877 | | | | 883 | |
Advances paid | | | 41 | | | | 33 | | | | 33 | | | | 25 | | | | 18 | | | | 11 | |
Investments, loans and placements | | | 312 | | | | 415 | | | | 275 | | | | 265 | | | | 171 | | | | 169 | |
Receivables | | | 1,377 | | | | 1,527 | | | | 1,695 | | | | 1,795 | | | | 1,810 | | | | 1,823 | |
Equity | | | | | | | | | | | | | | | | | | | | | | | | |
Investments - other | | | 284 | | | | 271 | | | | 284 | | | | 284 | | | | 284 | | | | 284 | |
Total Financial Assets | | | 4,013 | | | | 3,502 | | | | 3,401 | | | | 3,216 | | | | 3,160 | | | | 3,169 | |
Non-financial Assets | | | | | | | | | | | | | | | | | | | | | | | | |
Land and other fixed assets | | | 60,021 | | | | 59,978 | | | | 61,305 | | | | 62,493 | | | | 63,335 | | | | 64,181 | |
Other non-financial assets | | | 1,373 | | | | 1,421 | | | | 1,383 | | | | 1,401 | | | | 1,426 | | | | 1,456 | |
Total Non-financial Assets | | | 61,393 | | | | 61,399 | | | | 62,688 | | | | 63,894 | | | | 64,761 | | | | 65,638 | |
Total Assets | | | 65,407 | | | | 64,901 | | | | 66,090 | | | | 67,110 | | | | 67,921 | | | | 68,807 | |
Liabilities | | | | | | | | | | | | | | | | | | | | | | | | |
Payables | | | 6,160 | | | | 2,652 | | | | 3,884 | | | | 2,415 | | | | 2,342 | | | | 2,385 | |
Superannuation liability | | | (304 | ) | | | (131 | ) | | | (284 | ) | | | (264 | ) | | | (244 | ) | | | (244 | ) |
Other employee benefits | | | 658 | | | | 720 | | | | 664 | | | | 673 | | | | 683 | | | | 693 | |
Deposits held | | | 27 | | | | 26 | | | | 26 | | | | 26 | | | | 26 | | | | 26 | |
Advances received | | | 9 | | | | 8 | | | | 8 | | | | 7 | | | | 6 | | | | 6 | |
Borrowing | | | 32,128 | | | | 35,962 | | | | 35,905 | | | | 37,781 | | | | 38,258 | | | | 38,746 | |
Other liabilities | | | 7,505 | | | | 7,597 | | | | 7,654 | | | | 7,793 | | | | 7,953 | | | | 8,158 | |
Total Liabilities | | | 46,182 | | | | 46,834 | | | | 47,858 | | | | 48,432 | | | | 49,025 | | | | 49,771 | |
Net Worth | | | 19,225 | | | | 18,067 | | | | 18,232 | | | | 18,678 | | | | 18,896 | | | | 19,036 | |
| | | | | | | | | | | | | | | | | | | | | | | | |
Net Financial Worth | | | (42,169 | ) | | | (43,332 | ) | | | (44,457 | ) | | | (45,216 | ) | | | (45,865 | ) | | | (46,602 | ) |
Net Debt | | | 29,810 | | | | 34,292 | | | | 34,517 | | | | 36,677 | | | | 37,224 | | | | 37,716 | |
Note:
| 1. | Numbers may not add due to rounding and bracketed numbers represent negative amounts. |
Mid Year Fiscal and Economic Review 2015-16
Table 13: Non-financial Public Sector Balance Sheet1
| | | | | | | | | | | | | | | | | | | | | | | | |
| | | 2014-15
Actual
$ million | | | 2015-16
Budget
$ million | | | 2015-16
Revised
$ million | | | 2016-17
Projection
$ million | | | 2017-18
Projection
$ million | | | 2018-19
Projection
$ million | |
Assets | | | | | | | | | | | | | | | | | | | | | | | | |
Financial Assets | | | | | | | | | | | | | | | | | | | | | | | | |
Cash and deposits | | | 3,172 | | | | 2,131 | | | | 1,901 | | | | 1,590 | | | | 1,491 | | | | 1,444 | |
Advances paid | | | 675 | | | | 846 | | | | 784 | | | | 823 | | | | 869 | | | | 806 | |
Investments, loans and placements | | | 36,457 | | | | 33,643 | | | | 33,309 | | | | 33,487 | | | | 33,456 | | | | 33,458 | |
Receivables | | | 3,484 | | | | 3,704 | | | | 3,724 | | | | 3,764 | | | | 3,762 | | | | 3,761 | |
Equity | | | | | | | | | | | | | | | | | | | | | | | | |
Investments in other public sector entities | | | 4,217 | | | | 4,462 | | | | 4,217 | | | | 4,217 | | | | 4,217 | | | | 4,217 | |
Investments - other | | | 442 | | | | 441 | | | | 453 | | | | 463 | | | | 473 | | | | 483 | |
Total Financial Assets | | | 48,448 | | | | 45,226 | | | | 44,388 | | | | 44,345 | | | | 44,269 | | | | 44,168 | |
Non-financial Assets | | | | | | | | | | | | | | | | | | | | | | | | |
Land and other fixed assets | | | 233,162 | | | | 240,752 | | | | 237,665 | | | | 242,530 | | | | 246,836 | | | | 251,435 | |
Other non-financial assets | | | 1,084 | | | | 473 | | | | 1,114 | | | | 1,371 | | | | 1,566 | | | | 949 | |
Total Non-financial Assets | | | 234,247 | | | | 241,225 | | | | 238,779 | | | | 243,901 | | | | 248,402 | | | | 252,384 | |
Total Assets | | | 282,694 | | | | 286,451 | | | | 283,168 | | | | 288,246 | | | | 292,671 | | | | 296,552 | |
Liabilities | | | | | | | | | | | | | | | | | | | | | | | | |
Payables | | | 3,947 | | | | 4,029 | | | | 3,656 | | | | 3,594 | | | | 3,633 | | | | 3,677 | |
Superannuation liability | | | 25,566 | | | | 24,147 | | | | 24,248 | | | | 22,720 | | | | 21,413 | | | | 20,142 | |
Other employee benefits | | | 5,383 | | | | 5,925 | | | | 5,554 | | | | 5,713 | | | | 5,873 | | | | 6,058 | |
Deposits held | | | 29 | | | | 27 | | | | 29 | | | | 29 | | | | 29 | | | | 29 | |
Advances received | | | 625 | | | | 682 | | | | 664 | | | | 659 | | | | 654 | | | | 611 | |
Borrowing | | | 75,233 | | | | 74,113 | | | | 73,878 | | | | 76,342 | | | | 77,979 | | | | 79,667 | |
Other liabilities | | | 3,730 | | | | 3,829 | | | | 3,868 | | | | 4,121 | | | | 4,103 | | | | 4,159 | |
Total Liabilities | | | 114,512 | | | | 112,751 | | | | 111,897 | | | | 113,177 | | | | 113,683 | | | | 114,343 | |
Net Worth | | | 168,182 | | | | 173,701 | | | | 171,270 | | | | 175,068 | | | | 178,987 | | | | 182,209 | |
| | | | | | | | | | | | | | | | | | | | | | | | |
Net Financial Worth | | | (66,065 | ) | | | (67,524 | ) | | | (67,509 | ) | | | (68,833 | ) | | | (69,415 | ) | | | (70,175 | ) |
Net Financial Liabilities | | | 70,282 | | | | 71,986 | | | | 71,727 | | | | 73,050 | | | | 73,632 | | | | 74,392 | |
Net Debt | | | 35,582 | | | | 38,201 | | | | 38,577 | | | | 41,130 | | | | 42,845 | | | | 44,600 | |
Note:
| 1. | Numbers may not add due to rounding and bracketed numbers represent negative amounts. |
Mid Year Fiscal and Economic Review 2015-16
Table 14: General Government Sector Cash Flow Statement1
| | | | | | | | | | | | | | | | | | | | | | | | |
| | | 2014-15
Actual
$ million | | | 2015-16
Budget
$ million | | | 2015-16
Revised
$ million | | | 2016-17
Projection
$ million | | | 2017-18
Projection
$ million | | | 2018-19
Projection
$ million | |
Cash Receipts from Operating Activities | | | | | | | | | | | | | | | | | | | | | | | | |
Taxes received | | | 12,540 | | | | 12,924 | | | | 12,786 | | | | 13,264 | | | | 13,924 | | | | 14,598 | |
Grants and subsidies received | | | 23,507 | | | | 24,650 | | | | 24,896 | | | | 26,315 | | | | 27,079 | | | | 26,274 | |
Sales of goods and services | | | 5,737 | | | | 5,565 | | | | 5,559 | | | | 5,588 | | | | 5,950 | | | | 5,975 | |
Interest receipts | | | 2,476 | | | | 2,372 | | | | 2,499 | | | | 2,313 | | | | 2,301 | | | | 2,289 | |
Dividends and income tax equivalents | | | 2,091 | | | | 2,740 | | | | 2,823 | | | | 2,658 | | | | 2,340 | | | | 1,965 | |
Other receipts | | | 4,388 | | | | 4,605 | | | | 4,529 | | | | 4,928 | | | | 5,431 | | | | 5,853 | |
Total Operating Receipts | | | 50,738 | | | | 52,856 | | | | 53,092 | | | | 55,067 | | | | 57,026 | | | | 56,954 | |
Cash Payments for Operating Activities | | | | | | | | | | | | | | | | | | | | | | | | |
Payments for employees | | | (21,531 | ) | | | (23,113 | ) | | | (23,194 | ) | | | (24,034 | ) | | | (24,797 | ) | | | (25,419 | ) |
Payments for goods and services | | | (15,918 | ) | | | (16,289 | ) | | | (16,493 | ) | | | (17,570 | ) | | | (18,505 | ) | | | (18,797 | ) |
Grants and subsidies | | | (6,450 | ) | | | (6,506 | ) | | | (6,494 | ) | | | (6,498 | ) | | | (6,332 | ) | | | (6,244 | ) |
Interest paid | | | (2,327 | ) | | | (2,115 | ) | | | (2,198 | ) | | | (1,987 | ) | | | (1,967 | ) | | | (1,949 | ) |
Other payments | | | (282 | ) | | | (348 | ) | | | (326 | ) | | | (165 | ) | | | (400 | ) | | | (414 | ) |
Total Operating Payments | | | (46,507 | ) | | | (48,372 | ) | | | (48,706 | ) | | | (50,255 | ) | | | (52,000 | ) | | | (52,823 | ) |
Net Cash Inflows from Operating Activities | | | 4,230 | | | | 4,485 | | | | 4,386 | | | | 4,812 | | | | 5,026 | | | | 4,131 | |
Cash Flows from Investments in Non-Financial Assets | | | | | | | | | | | | | | | | | | | | | | | | |
Purchases of non-financial assets | | | (4,779 | ) | | | (5,374 | ) | | | (5,325 | ) | | | (5,822 | ) | | | (5,935 | ) | | | (5,188 | ) |
Sales of non-financial assets | | | 417 | | | | 305 | | | | 284 | | | | 258 | | | | 241 | | | | 176 | |
Net Cash Flows from Investments in Non-financial Assets | | | (4,362 | ) | | | (5,069 | ) | | | (5,041 | ) | | | (5,564 | ) | | | (5,695 | ) | | | (5,012 | ) |
Net Cash Flows from Investments in Financial Assets for Policy Purposes | | | 22 | | | | 3,100 | | | | 3,093 | | | | 1,265 | | | | (1 | ) | | | 298 | |
Net Cash Flows from Investments in Financial Assets for Liquidity Purposes | | | (1,283 | ) | | | 3,061 | | | | 3,130 | | | | (118 | ) | | | (58 | ) | | | 5 | |
Receipts from Financing Activities | | | | | | | | | | | | | | | | | | | | | | | | |
Advances received (net) | | | 33 | | | | (41 | ) | | | (45 | ) | | | (34 | ) | | | (28 | ) | | | 7 | |
Borrowing (net) | | | 1,626 | | | | (5,514 | ) | | | (5,934 | ) | | | (404 | ) | | | 626 | | | | 519 | |
Deposits received (net) | | | 3 | | | | — | | | | — | | | | — | | | | — | | | | — | |
Net Cash Flows from Financing Activities | | | 1,661 | | | | (5,555 | ) | | | (5,980 | ) | | | (438 | ) | | | 598 | | | | 525 | |
Net Increase/(Decrease) in Cash held | | | 269 | | | | 22 | | | | (412 | ) | | | (42 | ) | | | (130 | ) | | | (53 | ) |
Net cash from operating activities | | | 4,230 | | | | 4,485 | | | | 4,386 | | | | 4,812 | | | | 5,026 | | | | 4,131 | |
Net cash flows from investments in non-financial assets | | | (4,362 | ) | | | (5,069 | ) | | | (5,041 | ) | | | (5,564 | ) | | | (5,695 | ) | | | (5,012 | ) |
Surplus/(Deficit) | | | (131 | ) | | | (584 | ) | | | (655 | ) | | | (752 | ) | | | (669 | ) | | | (881 | ) |
| | | | | | | | | | | | | | | | | | | | | | | | |
Derivation of ABS GFS Cash Surplus/Deficit | | | | | | | | | | | | | | | | | | | | | | | | |
Cash surplus/(deficit) | | | (131 | ) | | | (584 | ) | | | (655 | ) | | | (752 | ) | | | (669 | ) | | | (881 | ) |
Acquisitions under finance leases and similar arrangements | | | (470 | ) | | | (385 | ) | | | (385 | ) | | | (843 | ) | | | (502 | ) | | | (661 | ) |
ABS GFS Cash Surplus/(Deficit) Including Finance Leases and Similar Arrangements | | | (601 | ) | | | (968 | ) | | | (1,040 | ) | | | (1,595 | ) | | | (1,171 | ) | | | (1,542 | ) |
Note:
| 1. | Numbers may not add due to rounding and bracketed numbers represent negative amounts. |
Mid Year Fiscal and Economic Review 2015-16
Table 15: Public Non-financial Corporations Sector Cash Flow Statement1
| | | | | | | | | | | | | | | | | | | | | | | | |
| | | 2014-15
Actual
$ million | | | 2015-16
Budget
$ million | | | 2015-16
Revised
$ million | | | 2016-17
Projection
$ million | | | 2017-18
Projection
$ million | | | 2018-19
Projection
$ million | |
Cash Receipts from Operating Activities | | | | | | | | | | | | | | | | | | | | | | | | |
Grants and subsidies received | | | 743 | | | | 665 | | | | 623 | | | | 769 | | | | 726 | | | | 785 | |
Sales of goods and services | | | 11,408 | | | | 11,954 | | | | 11,524 | | | | 11,892 | | | | 11,865 | | | | 12,037 | |
Interest receipts | | | 68 | | | | 53 | | | | 54 | | | | 43 | | | | 45 | | | | 45 | |
Dividends and income tax equivalents | | | 10 | | | | — | | | | 11 | | | | 11 | | | | 11 | | | | 11 | |
Other receipts | �� | | 248 | | | | 148 | | | | 153 | | | | 147 | | | | 173 | | | | 192 | |
Total Operating Receipts | | | 12,477 | | | | 12,821 | | | | 12,364 | | | | 12,862 | | | | 12,820 | | | | 13,069 | |
Cash Payments for Operating Activities | | | | | | | | | | | | | | | | | | | | | | | | |
Payments for employees | | | (1,707 | ) | | | (1,879 | ) | | | (1,893 | ) | | | (1,934 | ) | | | (1,917 | ) | | | (1,937 | ) |
Payments for goods and services | | | (3,934 | ) | | | (3,853 | ) | | | (3,744 | ) | | | (3,689 | ) | | | (3,927 | ) | | | (4,110 | ) |
Grants and subsidies | | | (9 | ) | | | (13 | ) | | | (14 | ) | | | (14 | ) | | | (14 | ) | | | (14 | ) |
Interest paid | | | (1,791 | ) | | | (1,787 | ) | | | (1,792 | ) | | | (2,042 | ) | | | (2,021 | ) | | | (2,033 | ) |
Other payments | | | (1,054 | ) | | | (1,582 | ) | | | (1,588 | ) | | | (1,484 | ) | | | (1,205 | ) | | | (1,147 | ) |
Total Operating Payments | | | (8,496 | ) | | | (9,115 | ) | | | (9,030 | ) | | | (9,163 | ) | | | (9,084 | ) | | | (9,241 | ) |
Net Cash Inflows from Operating Activities | | | 3,981 | | | | 3,706 | | | | 3,334 | | | | 3,698 | | | | 3,736 | | | | 3,828 | |
Cash Flows from Investments in Non-Financial Assets | | | | | | | | | | | | | | | | | | | | | | | | |
Purchases of non-financial assets | | | (3,173 | ) | | | (3,201 | ) | | | (3,149 | ) | | | (3,022 | ) | | | (2,736 | ) | | | (2,770 | ) |
Sales of non-financial assets | | | 124 | | | | 46 | | | | 53 | | | | 58 | | | | 32 | | | | 32 | |
Net Cash Flows from Investments in Non-financial Assets | | | (3,049 | ) | | | (3,155 | ) | | | (3,096 | ) | | | (2,964 | ) | | | (2,705 | ) | | | (2,738 | ) |
Net Cash Flows from Investments in Financial Assets for Policy Purposes | | | — | | | | (3,159 | ) | | | (3,133 | ) | | | (1,265 | ) | | | 1 | | | | (298 | ) |
Net Cash Flows from Investments in Financial Assets for Liquidity Purposes | | | 51 | | | | — | | | | — | | | | — | | | | — | | | | — | |
Receipts from Financing Activities | | | | | | | | | | | | | | | | | | | | | | | | |
Advances received (net) | | | (1 | ) | | | (1 | ) | | | (1 | ) | | | (1 | ) | | | (1 | ) | | | (1 | ) |
Borrowing (net) | | | 962 | | | | 3,828 | | | | 3,703 | | | | 1,916 | | | | 616 | | | | 497 | |
Dividends paid | | | (1,375 | ) | | | (1,651 | ) | | | (1,732 | ) | | | (1,653 | ) | | | (1,617 | ) | | | (1,284 | ) |
Deposits received (net) | | | 1 | | | | — | | | | — | | | | — | | | | — | | | | — | |
Other financing (net) | | | (138 | ) | | | 59 | | | | 39 | | | | — | | | | — | | | | — | |
Net Cash Flows from Financing Activities | | | (551 | ) | | | 2,235 | | | | 2,009 | | | | 262 | | | | (1,001 | ) | | | (787 | ) |
Net Increase/(Decrease) in Cash held | | | 432 | | | | (373 | ) | | | (886 | ) | | | (268 | ) | | | 31 | | | | 5 | |
Net cash from operating activities | | | 3,981 | | | | 3,706 | | | | 3,334 | | | | 3,698 | | | | 3,736 | | | | 3,828 | |
Net cash flows from investments in non-financial assets | | | (3,049 | ) | | | (3,155 | ) | | | (3,096 | ) | | | (2,964 | ) | | | (2,705 | ) | | | (2,738 | ) |
Dividends paid | | | (1,375 | ) | | | (1,651 | ) | | | (1,732 | ) | | | (1,653 | ) | | | (1,617 | ) | | | (1,284 | ) |
Surplus/(Deficit) | | | (443 | ) | | | (1,100 | ) | | | (1,494 | ) | | | (918 | ) | | | (586 | ) | | | (193 | ) |
| | | | | | | | | | | | | | | | | | | | | | | | |
Derivation of ABS GFS Cash Surplus/Deficit | | | | | | | | | | | | | | | | | | | | | | | | |
Cash surplus/(deficit) | | | (443 | ) | | | (1,100 | ) | | | (1,494 | ) | | | (918 | ) | | | (586 | ) | | | (193 | ) |
Acquisitions under finance leases and similar arrangements | | | (9 | ) | | | — | | | | — | | | | — | | | | — | | | | — | |
ABS GFS Cash Surplus/(Deficit) Including Finance Leases and Similar Arrangements | | | (452 | ) | | | (1,100 | ) | | | (1,494 | ) | | | (918 | ) | | | (586 | ) | | | (193 | ) |
Note:
| 1. | Numbers may not add due to rounding and bracketed numbers represent negative amounts. |
Mid Year Fiscal and Economic Review 2015-16
Table 16: Non-financial Public Sector Cash Flow Statement1
| | | | | | | | | | | | | | | | | | | | | | | | |
| | | 2014-15
Actual
$ million | | | 2015-16
Budget
$ million | | | 2015-16
Revised
$ million | | | 2016-17
Projection
$ million | | | 2017-18
Projection
$ million | | | 2018-19
Projection
$ million | |
Cash Receipts from Operating Activities | | | | | | | | | | | | | | | | | | | | | | | | |
Taxes received | | | 12,194 | | | | 12,583 | | | | 12,456 | | | | 12,905 | | | | 13,544 | | | | 14,208 | |
Grants and subsidies received | | | 23,585 | | | | 24,778 | | | | 24,986 | | | | 26,418 | | | | 27,187 | | | | 26,384 | |
Sales of goods and services | | | 15,404 | | | | 15,280 | | | | 15,020 | | | | 15,339 | | | | 15,667 | | | | 15,852 | |
Interest receipts | | | 2,544 | | | | 2,426 | | | | 2,554 | | | | 2,356 | | | | 2,345 | | | | 2,334 | |
Dividends and income tax equivalents | | | 253 | | | | 146 | | | | 166 | | | | 88 | | | | 105 | | | | 124 | |
Other receipts | | | 4,627 | | | | 4,753 | | | | 4,681 | | | | 5,075 | | | | 5,605 | | | | 6,045 | |
Total Operating Receipts | | | 58,606 | | | | 59,966 | | | | 59,863 | | | | 62,182 | | | | 64,453 | | | | 64,948 | |
Cash Payments for Operating Activities | | | | | | | | | | | | | | | | | | | | | | | | |
Payments for employees | | | (23,142 | ) | | | (24,894 | ) | | | (24,979 | ) | | | (25,858 | ) | | | (26,603 | ) | | | (27,242 | ) |
Payments for goods and services | | | (18,104 | ) | | | (17,915 | ) | | | (18,186 | ) | | | (19,130 | ) | | | (20,296 | ) | | | (20,760 | ) |
Grants and subsidies | | | (5,794 | ) | | | (5,983 | ) | | | (5,976 | ) | | | (5,847 | ) | | | (5,727 | ) | | | (5,584 | ) |
Interest paid | | | (3,887 | ) | | | (3,672 | ) | | | (3,780 | ) | | | (3,793 | ) | | | (3,734 | ) | | | (3,720 | ) |
Other payments | | | (842 | ) | | | (963 | ) | | | (954 | ) | | | (696 | ) | | | (948 | ) | | | (967 | ) |
Total Operating Payments | | | (51,768 | ) | | | (53,426 | ) | | | (53,875 | ) | | | (55,324 | ) | | | (57,309 | ) | | | (58,273 | ) |
Net Cash Inflows from Operating Activities | | | 6,838 | | | | 6,540 | | | | 5,988 | | | | 6,858 | | | | 7,144 | | | | 6,676 | |
Cash Flows from Investments in Non-Financial Assets | | | | | | | | | | | | | | | | | | | | | | | | |
Purchases of non-financial assets | | | (7,954 | ) | | | (8,574 | ) | | | (8,474 | ) | | | (8,844 | ) | | | (8,672 | ) | | | (7,958 | ) |
Sales of non-financial assets | | | 542 | | | | 351 | | | | 337 | | | | 316 | | | | 272 | | | | 208 | |
Net Cash Flows from Investments in Non-financial Assets | | | (7,413 | ) | | | (8,224 | ) | | | (8,137 | ) | | | (8,528 | ) | | | (8,399 | ) | | | (7,750 | ) |
Net Cash Flows from Investments in Financial Assets for Policy Purposes | | | — | | | | — | | | | — | | | | — | | | | — | | | | — | |
Net Cash Flows from Investments in Financial Assets for Liquidity Purposes | | | (1,236 | ) | | | 3,061 | | | | 3,129 | | | | (118 | ) | | | (58 | ) | | | 5 | |
Receipts from Financing Activities | | | | | | | | | | | | | | | | | | | | | | | | |
Advances received (net) | | | 32 | | | | (41 | ) | | | (46 | ) | | | (34 | ) | | | (29 | ) | | | 6 | |
Borrowing (net) | | | 2,588 | | | | (1,686 | ) | | | (2,231 | ) | | | 1,512 | | | | 1,243 | | | | 1,016 | |
Deposits received (net) | | | 3 | | | | — | | | | — | | | | — | | | | — | | | | — | |
Other financing (net) | | | (112 | ) | | | — | | | | — | | | | — | | | | — | | | | — | |
Net Cash Flows from Financing Activities | | | 2,511 | | | | (1,728 | ) | | | (2,277 | ) | | | 1,477 | | | | 1,214 | | | | 1,022 | |
Net Increase/(Decrease) in Cash held | | | 701 | | | | (351 | ) | | | (1,298 | ) | | | (311 | ) | | | (99 | ) | | | (48 | ) |
Net cash from operating activities | | | 6,838 | | | | 6,540 | | | | 5,988 | | | | 6,858 | | | | 7,144 | | | | 6,676 | |
Net cash flows from investments in non-financial assets | | | (7,413 | ) | | | (8,224 | ) | | | (8,137 | ) | | | (8,528 | ) | | | (8,399 | ) | | | (7,750 | ) |
Surplus/(Deficit) | | | (574 | ) | | | (1,684 | ) | | | (2,149 | ) | | | (1,670 | ) | | | (1,255 | ) | | | (1,075 | ) |
| | | | | | | | | | | | | | | | | | | | | | | | |
Derivation of ABS GFS Cash Surplus/Deficit | | | | | | | | | | | | | | | | | | | | | | | | |
Cash surplus/(deficit) | | | (574 | ) | | | (1,684 | ) | | | (2,149 | ) | | | (1,670 | ) | | | (1,255 | ) | | | (1,075 | ) |
Acquisitions under finance leases and similar arrangements | | | (479 | ) | | | (385 | ) | | | (385 | ) | | | (843 | ) | | | (502 | ) | | | (661 | ) |
ABS GFS Cash Surplus/(Deficit) Including Finance Leases and Similar Arrangements | | | (1,053 | ) | | | (2,068 | ) | | | (2,534 | ) | | | (2,514 | ) | | | (1,757 | ) | | | (1,735 | ) |
Note:
| 1. | Numbers may not add due to rounding and bracketed numbers represent negative amounts. |
Mid Year Fiscal and Economic Review 2015-16
| 5.2 | Loan Council Allocation |
The Australian Loan Council requires all jurisdictions to prepare Loan Council Allocations to provide an indication of each government’s probable call on financial markets over the forthcoming financial year.
Table 17: Loan Council Allocation1
| | | | | | | | | | |
| | | | | 2015 - 16
Budget
$ million | | | 2015 - 16
Revised
$ million | |
| | General Government sector cash deficit/(surplus) | | | 584 | | | | 655 | |
| | PNFC sector cash deficit/(surplus) | | | 1,100 | | | | 1,494 | |
| | Non Financial Public Sector cash deficit/(surplus) | | | 1,684 | | | | 2,149 | |
| | Acquisitions under finance leases and similar arrangements | | | 385 | | | | 385 | |
Equals | | ABS GFS cash deficit/(surplus) | | | 2,068 | | | | 2,534 | |
Less | | Net cash flows from investments in financial assets for policy purposes | | | — | | | | — | |
Plus | | Memorandum items 2 | | | 384 | | | | 403 | |
| | Loan Council Allocation | | | 2,452 | | | | 2,937 | |
Notes:
| 1. | Numbers may not add due to rounding. |
| 2. | Memorandum items include operating leases and local government borrowings. |
Mid Year Fiscal and Economic Review 2015-16
| 6.0 | Taxation and royalty revenue assumptions |
Table 18: Taxation and royalty revenue1
| | | | | | | | | | | | | | | | | | | | | | | | |
| | | 2014–15
Actual2
$ million | | | 2015–16
Budget
$ million | | | 2015–16
Revised
$ million | | | 2016–17
Projection
$ million | | | 2017–18
Projection
$ million | | | 2018–19
Projection
$ million | |
Payroll tax | | | 3,782 | | | | 3,955 | | | | 3,795 | | | | 3,950 | | | | 4,204 | | | | 4,475 | |
Transfer duty | | | 3,082 | | | | 3,009 | | | | 3,117 | | | | 3,130 | | | | 3,224 | | | | 3,320 | |
Other duties | | | 1,366 | | | | 1,423 | | | | 1,383 | | | | 1,469 | | | | 1,538 | | | | 1,615 | |
Gambling taxes and levies | | | 1,077 | | | | 1,123 | | | | 1,141 | | | | 1,190 | | | | 1,242 | | | | 1,296 | |
Land tax | | | 977 | | | | 1,016 | | | | 996 | | | | 1,057 | | | | 1,132 | | | | 1,200 | |
Motor vehicle registration | | | 1,571 | | | | 1,654 | | | | 1,632 | | | | 1,692 | | | | 1,760 | | | | 1,831 | |
Other taxes | | | 719 | | | | 745 | | | | 724 | | | | 778 | | | | 825 | | | | 863 | |
Total taxation revenue | | | 12,575 | | | | 12,926 | | | | 12,788 | | | | 13,265 | | | | 13,925 | | | | 14,599 | |
Royalties | | | | | | | | | | | | | | | | | | | | | | | | |
Coal | | | 1,614 | | | | 1,684 | | | | 1,738 | | | | 1,938 | | | | 2,163 | | | | 2,476 | |
Petroleum and Gas | | | 51 | | | | 129 | | | | 33 | | | | 273 | | | | 423 | | | | 474 | |
Other royalties | | | 393 | | | | 463 | | | | 412 | | | | 370 | | | | 442 | | | | 443 | |
Land rents | | | 165 | | | | 167 | | | | 167 | | | | 176 | | | | 182 | | | | 188 | |
Total royalties and land rents | | | 2,223 | | | | 2,444 | | | | 2,350 | | | | 2,757 | | | | 3,210 | | | | 3,581 | |
Notes:
| 1. | Numbers may not add due to rounding. |
Table 19: Royalty assumptions
| | | | | | | | | | | | | | | | |
| | | 2015–16 | | | 2016–17 | | | 2017–18 | | | 2018–19 | |
| | | Revised | | | Projection | | | Projection | | | Projection | |
Tonnages – Crown Export Coal1 (Mt) | | | 213 | | | | 218 | | | | 225 | | | | 229 | |
Exchange Rate US$ per A$2 | | | 0.71 | | | | 0.71 | | | | 0.73 | | | | 0.73 | |
Year average coal prices3 (US$ per tonne) | | | | | | | | | | | | | | | | |
Hard coking | | | 90 | | | | 100 | | | | 110 | | | | 120 | |
Semi–soft | | | 78 | | | | 82 | | | | 88 | | | | 94 | |
Thermal | | | 65 | | | | 65 | | | | 67 | | | | 69 | |
Year average oil price | | | | | | | | | | | | | | | | |
Brent ($US per barrel) | | | 48 | | | | 56 | | | | 60 | | | | 62 | |
Notes:
| 1. | Excludes coal produced for domestic consumption and coal where royalties are not paid to the government, i.e. private royalties. 2015–16 estimate for domestic coal volume is approximately 22 Mt and private coal is 10 Mt. |
| 3. | Represent the benchmark contract price for higher quality coal type. In forecasting royalties, contract prices are discounted to reflect prices for lower quality coal. |
Mid Year Fiscal and Economic Review 2015-16
Table 20: Key Fiscal Aggregates1
| | | | | | | | | | | | | | | | | | | | | | | | | | | | | | | | | | | | | | | | | | | | | | | | |
| | | 2007-08
Actual
$ million | | | 2008-09
Actual
$ million | | | 2009-10
Actual
$ million | | | 2010-11
Actual
$ million | | | 2011-12
Actual
$ million | | | 2012-13
Actual
$ million | | | 2013-14
Actual
$ million | | | 2014-15
Actual
$ million | | | 2015-16
MYFER
$ million | | | 2016-17
Projection
$ million | | | 2017-08
Projection
$ million | | | 2018-19
Projection
$ million | |
General Government | | | | | | | | | | | | | | | | | | | | | | | | | | | | | | | | | | | | | | | | | | | | | | | | |
Total revenue | | | 31,424 | | | | 37,078 | | | | 39,727 | | | | 42,013 | | | | 45,801 | | | | 41,755 | | | | 46,705 | | | | 49,765 | | | | 51,354 | | | | 53,520 | | | | 55,392 | | | | 55,630 | |
Tax revenue | | | 9,546 | | | | 8,866 | | | | 9,375 | | | | 9,981 | | | | 10,608 | | | | 10,937 | | | | 11,840 | | | | 12,575 | | | | 12,788 | | | | 13,265 | | | | 13,925 | | | | 14,599 | |
Total expenses | | | 33,030 | | | | 37,099 | | | | 39,599 | | | | 43,479 | | | | 46,028 | | | | 46,313 | | | | 46,217 | | | | 49,224 | | | | 50,180 | | | | 52,107 | | | | 53,752 | | | | 54,485 | |
Employee expenses | | | 13,175 | | | | 14,310 | | | | 15,566 | | | | 16,826 | | | | 18,250 | | | | 18,130 | | | | 17,816 | | | | 18,593 | | | | 19,886 | | | | 20,495 | | | | 21,123 | | | | 21,590 | |
Net operating balance | | | (1,606 | ) | | | (21 | ) | | | 128 | | | | (1,466 | ) | | | (226 | ) | | | (4,558 | ) | | | 488 | | | | 542 | | | | 1,175 | | | | 1,413 | | | | 1,640 | | | | 1,145 | |
Capital purchases | | | 5,725 | | | | 6,772 | | | | 8,959 | | | | 8,237 | | | | 7,971 | | | | 7,001 | | | | 6,324 | | | | 4,779 | | | | 5,325 | | | | 5,822 | | | | 5,935 | | | | 5,188 | |
Net capital purchases | | | 3,680 | | | | 4,349 | | | | 6,665 | | | | 5,583 | | | | 5,241 | | | | 3,389 | | | | 3,088 | | | | 1,122 | | | | 2,314 | | | | 3,121 | | | | 2,770 | | | | 2,195 | |
Fiscal balance | | | (5,286 | ) | | | (4,371 | ) | | | (6,537 | ) | | | (7,049 | ) | | | (5,467 | ) | | | (7,947 | ) | | | (2,600 | ) | | | (581 | ) | | | (1,140 | ) | | | (1,708 | ) | | | (1,130 | ) | | | (1,050 | ) |
Borrowings | | | 6,328 | | | | 10,308 | | | | 15,916 | | | | 24,593 | | | | 29,517 | | | | 37,878 | | | | 41,369 | | | | 43,105 | | | | 37,973 | | | | 38,561 | | | | 39,721 | | | | 40,921 | |
Net debt | | | (22,586 | ) | | | (19,251 | ) | | | (13,354 | ) | | | (9,542 | ) | | | (5,720 | ) | | | 2,399 | | | | 5,208 | | | | 5,772 | | | | 4,060 | | | | 4,453 | | | | 5,621 | | | | 6,884 | |
Non-financial Public Sector | | | | | | | | | | | | | | | | | | | | | | | | | | | | | | | | | | | | | | | | | | | | | | | | |
Total revenue | | | 38,356 | | | | 43,749 | | | | 47,883 | | | | 49,040 | | | | 52,307 | | | | 49,181 | | | | 53,502 | | | | 55,973 | | | | 57,450 | | | | 60,077 | | | | 62,301 | | | | 62,713 | |
Capital purchases | | | 13,976 | | | | 15,101 | | | | 15,007 | | | | 13,306 | | | | 11,980 | | | | 10,774 | | | | 9,313 | | | | 7,954 | | | | 8,474 | | | | 8,844 | | | | 8,672 | | | | 7,958 | |
Borrowings | | | 30,856 | | | | 42,645 | | | | 51,713 | | | | 53,708 | | | | 61,542 | | | | 69,086 | | | | 72,637 | | | | 75,233 | | | | 73,878 | | | | 76,342 | | | | 77,979 | | | | 79,667 | |
Notes:
| 1. | Bracketed numbers represent negative amounts. |
Mid Year Fiscal and Economic Review 2015-16
Table 21: Key Fiscal Indicators1
| | | | | | | | | | | | | | | | | | | | | | | | | | | | | | | | | | | | | | | | | | | | | | | | |
| | | 2007-08
Actual
% | | | 2008-09
Actual
% | | | 2009-10
Actual
% | | | 2010-11
Actual
% | | | 2011-12
Actual
% | | | 2012-13
Actual
% | | | 2013-14
Actual
% | | | 2014-15
Actual
% | | | 2015-16
MYFER
% | | | 2016-17
Projection
% | | | 2017-18
Projection
% | | | 2018-19
Projection
% | |
General Government | | | | | | | | | | | | | | | | | | | | | | | | | | | | | | | | | | | | | | | | | | | | | | | | |
Revenue/GSP | | | 13.5 | | | | 14.3 | | | | 15.7 | | | | 15.6 | | | | 15.8 | | | | 14.4 | | | | 15.6 | | | | 16.3 | | | | 15.8 | | | | 15.3 | | | | 15.0 | | | | 14.3 | |
Tax/GSP | | | 4.1 | | | | 3.4 | | | | 3.7 | | | | 3.7 | | | | 3.7 | | | | 3.8 | | | | 4.0 | | | | 4.1 | | | | 3.9 | | | | 3.8 | | | | 3.8 | | | | 3.7 | |
Own source revenue/GSP | | | 6.9 | | | | 7.5 | | | | 7.7 | | | | 8.0 | | | | 8.0 | | | | 8.1 | | | | 8.4 | | | | 8.6 | | | | 8.2 | | | | 7.8 | | | | 7.7 | | | | 7.5 | |
Expenses/GSP | | | 14.2 | | | | 14.3 | | | | 15.7 | | | | 16.1 | | | | 15.9 | | | | 15.9 | | | | 15.5 | | | | 16.1 | | | | 15.4 | | | | 14.9 | | | | 14.6 | | | | 14.0 | |
Employee expenses/GSP | | | 5.7 | | | | 5.5 | | | | 6.2 | | | | 6.2 | | | | 6.3 | | | | 6.2 | | | | 6.0 | | | | 6.1 | | | | 6.1 | | | | 5.9 | | | | 5.7 | | | | 5.5 | |
Net operating balance/GSP | | | (0.7 | ) | | | (0.0 | ) | | | 0.1 | | | | (0.5 | ) | | | (0.1 | ) | | | (1.6 | ) | | | 0.2 | | | | 0.2 | | | | 0.4 | | | | 0.4 | | | | 0.4 | | | | 0.3 | |
Capital purchases/GSP | | | 2.5 | | | | 2.6 | | | | 3.5 | | | | 3.1 | | | | 2.8 | | | | 2.4 | | | | 2.1 | | | | 1.6 | | | | 1.6 | | | | 1.7 | | | | 1.6 | | | | 1.3 | |
Net cash inflows from operating activities/capital purchases | | | 6.9 | | | | 53.1 | | | | 37.8 | | | | 25.5 | | | | 35.4 | | | | (35.5 | ) | | | 43.0 | | | | 88.5 | | | | 82.4 | | | | 82.6 | | | | 84.7 | | | | 79.6 | |
Fiscal balance/GSP | | | (2.3 | ) | | | (1.7 | ) | | | (2.6 | ) | | | (2.6 | ) | | | (1.9 | ) | | | (2.7 | ) | | | (0.9 | ) | | | (0.2 | ) | | | (0.4 | ) | | | (0.5 | ) | | | (0.3 | ) | | | (0.3 | ) |
Borrowings/GSP | | | 2.7 | | | | 4.0 | | | | 6.3 | | | | 9.1 | | | | 10.2 | | | | 13.0 | | | | 13.9 | | | | 14.1 | | | | 11.7 | | | | 11.0 | | | | 10.8 | | | | 10.5 | |
Borrowings/revenue | | | 20.1 | | | | 27.8 | | | | 40.1 | | | | 58.5 | | | | 64.4 | | | | 90.7 | | | | 88.6 | | | | 86.6 | | | | 73.9 | | | | 72.0 | | | | 71.7 | | | | 73.6 | |
Revenue growth | | | (1.8 | ) | | | 18.0 | | | | 7.1 | | | | 5.8 | | | | 9.0 | | | | (8.8 | ) | | | 11.9 | | | | 6.6 | | | | 3.2 | | | | 4.2 | | | | 3.5 | | | | 0.4 | |
Tax growth | | | 12.5 | | | | (7.1 | ) | | | 5.7 | | | | 6.5 | | | | 6.3 | | | | 3.1 | | | | 8.3 | | | | 6.2 | | | | 1.7 | | | | 3.7 | | | | 5.0 | | | | 4.8 | |
Expenses growth | | | 9.9 | | | | 12.3 | | | | 6.7 | | | | 9.8 | | | | 5.9 | | | | 0.6 | | | | (0.2 | ) | | | 6.5 | | | | 1.9 | | | | 3.8 | | | | 3.2 | | | | 1.4 | |
Employee expenses growth | | | 12.3 | | | | 8.6 | | | | 8.8 | | | | 8.1 | | | | 8.5 | | | | (0.7 | ) | | | (1.7 | ) | | | 4.4 | | | | 7.0 | | | | 3.1 | | | | 3.1 | | | | 2.2 | |
Non-financial Public Sector | | | | | | | | | | | | | | | | | | | | | | | | | | | | | | | | | | | | | | | | | | | | | | | | |
Capital purchases/GSP | | | 6.0 | | | | 5.8 | | | | 5.9 | | | | 4.9 | | | | 4.1 | | | | 3.7 | | | | 3.1 | | | | 2.6 | | | | 2.6 | | | | 2.5 | | | | 2.4 | | | | 2.0 | |
Borrowings/GSP | | | 13.3 | | | | 16.4 | | | | 20.4 | | | | 19.9 | | | | 21.3 | | | | 23.8 | | | | 24.3 | | | | 24.6 | | | | 22.7 | | | | 21.9 | | | | 21.1 | | | | 20.4 | |
Borrowings/revenue | | | 80.4 | | | | 97.5 | | | | 108.0 | | | | 109.5 | | | | 117.7 | | | | 140.5 | | | | 135.8 | | | | 134.4 | | | | 128.6 | | | | 127.1 | | | | 125.2 | | | | 127.0 | |
Net financial liabilities2/revenue | | | 75.4 | | | | 97.4 | | | | 112.5 | | | | 96.2 | | | | 115.6 | | | | 133.4 | | | | 129.8 | | | | 125.6 | | | | 124.8 | | | | 121.6 | | | | 118.2 | | | | 118.6 | |
Notes:
| 1. | Bracketed numbers represent negative amounts. |
| 2. | UPF definition, which is equal to total financial assets less investments in other public sector entities less total liabilities. |
This page has been intentionally left blank
This page has been intentionally left blank
© The State of Queensland (Queensland Treasury) 2015
Licence:
This document is licensed under a Creative Commons Attribution (CC BY 4.0) International licence.

To view a copy of this licence, visit http://creativecommons.org/licenses/by/4.0/
The Queensland Government supports and encourages the dissemination and exchange of information. However, copyright protects this publication. The State of Queensland has no objection to this material being reproduced, made available online or electronically but only if it is recognised as the owner of the copyright and this material remains unaltered.
Attribution:
Content from the Mid Year Fiscal and Economic Review should be attributed to:
The State of Queensland (Queensland Treasury) Mid Year Fiscal and Economic Review.
ISSN 1837–2848
Translating and interpreting assistance

The Queensland Government is committed to providing accessible services to Queenslanders from all culturally and linguistically diverse backgrounds. If you have difficulty in understanding the annual report, contact us on (07) 3035 3503 between 9am and 5pm Monday to Friday and we will arrange an interpreter to help you.