EXHIBIT (c)(iii)
Budget Papers of the Co-Registrant for 2015-16.
FORWARD-LOOKING STATEMENTS
This exhibit contains forward-looking statements. Statements that are not historical facts, including statements about the State of Queensland’s (the “State” or “Queensland”) beliefs and expectations, are forward-looking statements. These statements are based on current plans, budgets, estimates and projections and therefore you should not place undue reliance on them. The words “believe”, “may”, “will”, “should”, “estimate”, “continue”, “anticipate”, “intend”, “expect”, “forecast” and similar words are intended to identify forward-looking statements. Forward-looking statements speak only as of the date they are made, and neither the Queensland Treasury Corporation nor the State undertake any obligation to update publicly any of them in light of new information or future events.
Forward-looking statements are based on current plans, estimates and projections and, therefore, undue reliance should not be placed on them. Although the Queensland Treasury Corporation and the State believe that the beliefs and expectations reflected in such forward-looking statements are reasonable, no assurance can be given that such beliefs and expectations will prove to have been correct. Forward-looking statements involve inherent risks and uncertainties. We caution you that actual results may differ materially from those contained in any forward-looking statements.
A number of important factors could cause actual results to differ materially from those expressed in any forward-looking statement. Factors that could cause the actual outcomes to differ materially from those expressed or implied in forward-looking statements include:
| | • | | the international and Australian economies, and in particular the rates of growth (or contraction) of the State’s major trading partners; |
| | • | | the effects, both internationally and in Australia, of any further global financial crisis, any subsequent economic downturn, the ongoing economic, banking and sovereign debt crisis in Europe and any stalling of the protracted United States recovery; |
| | • | | increases or decreases in international and Australian domestic interest rates; |
| | • | | changes in the State’s domestic consumption; |
| | • | | changes in the State’s labor force participation and productivity; |
| | • | | downgrades in the credit ratings of the State and Australia; |
| | • | | changes in the rate of inflation in the State; |
| | • | | changes in environmental and other regulation; and |
| | • | | changes in the distribution of revenue from the Commonwealth of Australia Government to the State. |
Queensland Budget 2015-16
Budget Speech
Budget Paper No. 1

2015-16 Queensland Budget Papers
1. Budget Speech
2. Budget Strategy and Outlook
3. Capital Statement
4. Budget Measures
5. Service Delivery Statements
Appropriation Bills
Jobs Now, Jobs for the Future - Queensland Government employment plan
Budget Highlights
The suite of Budget Papers is similar to that published in 2014-15.
The Budget Papers are available online at www.budget.qld.gov.au
© Crown copyright
All rights reserved
Queensland Government 2015
Excerpts from this publication may be reproduced, with appropriate
acknowledgement, as permitted under the Copyright Act.
Budget Speech
Budget Paper No. 1
ISSN 1445-4890 (Print)
ISSN 1445-4904 (Online)
Appropriation Bill 2015
(First reading speech, 14 July 2015)
Treasurer
The Honourable Curtis Pitt MP
Treasurer, Minister for Employment and Industrial Relations
Minister for Aboriginal and Torres Strait Islander Partnerships
Appropriation Bill 2015
(First reading speech, 14 July 2015)
Treasurer
The Honourable Curtis Pitt MP
Treasurer, Minister for Employment and Industrial Relations
Minister for Aboriginal and Torres Strait Islander Partnerships
Mr Speaker
I move that the Bill be now read for a first time.
Mr Speaker,
The 31st of January 2015 was a victory for the Queensland we know we can be, and a defeat for the kind of Queensland we’d long left behind.
Labor governments will always believe that our most valuable economic assets are our people and our communities. When a measured and responsible approach is needed and fairness must be restored – we’re there to put in the hard work.
Labor Budgets reflect this.
Labor Budgets are positive.
They are optimistic.
They seek to challenge, to extend, to grow new industries, to tackle the enduring tests with optimism about the future.
A Better Way
Mr Speaker, today I introduce a Budget that delivers on the plan that Labor took to Queenslanders.
Consistent with our approach to responsibly manage the State’s finances, the Palaszczuk Government’s first Budget delivers on all of the commitments we made at the election.
And as promised, we have more than offset that spending.
On final analysis, our election commitments have been estimated by Treasury to cost $1.97 billion over the next four years.
1
Through offsets and reprioritisations, funding of $2.31 billion was identified, providing a net fiscal improvement of $340 million.
This has been achieved without redundancies – forced or voluntary.
Mr Speaker, we told the people of Queensland, that we would improve front line services.
This Budget delivers.
We said we would have an operating surplus and that we would not introduce new taxes, fees and charges.
This Budget delivers.
We said we had a plan to grow the economy and to deliver jobs – jobs now, and jobs for the future.
We said there was a better way – one that did not involve selling the State’s income-generating assets.
This Budget keeps that promise.
Budget Strategy
Mr Speaker, we also said we would manage the State’s finances responsibly.
Today I can confirm that for the 2014-15 year, the Palaszczuk Government expects a $962 million surplus.
And I am proud to advise that for 2015-16, we are forecasting a surplus of $1.2 billion.
Queensland has not achieved a surplus of this size in nearly a decade - not since 2006-07.
What’s more, the Palaszczuk Government is forecasting surpluses above $2 billion for both 2016-17 and 2017-18.
The combined surpluses over the next four years will be $6.9 billion.
These surpluses are achieved notwithstanding a forecast reduction of royalty revenue since the Mid Year Fiscal and Economic Review and a $396 million write-down in payroll tax.
These surpluses are achieved through a measured, responsible approach to balancing the books.
More importantly, these surpluses represent the underlying strength of the Queensland economy and position the State to capture sustainable economic growth.
Operating expenses – excluding natural disaster payments – are forecast to grow on average by 4.1% across the forward estimates.
This is a sustainable rate which is lower than forecast revenue growth of 4.3%, even with the significant revenue write downs seen in this Budget.
2
Economic outlook
Mr Speaker, Queensland has an economy that faces the world and trades with all parts of it.
And while enormous benefits come with such an outlook, there are also impacts.
The global economic outlook has softened over the last year, with continued financial uncertainty in the Eurozone and sharp declines in world commodity prices.
What happens to oil prices as a result of decisions made in Saudi Arabia, matters to Queensland.
What happens to steel production in China, impacts upon the Queensland economy and the Queensland Budget.
And what we have seen as a result of global conditions is a $3.2 billion write-down in royalties since the MYFER.
There is no doubt our revenues have taken a hit.
Overall, revenue growth has fallen from 6.1% last year to a forecast 3.2% in 2015-16.
Mr Speaker, this is partly because Queensland has an economy in transition.
Not just from resource sector construction to production – although this is a big part of our journey.
When Labor was last in government we set out a blueprint for the establishment of a $60 billion LNG industry.
This investment was both historic and significant, and as a result a new industry is now a reality.
$648 million worth of LNG exports have left the Port of Gladstone so far in 2015.
The success of this new industry underscores the duty of responsible Governments to always be seeking out ways to diversify the economy, rather than rely on past successes.
Mr Speaker, we are transitioning to a multi-faceted service economy, with growth industries in health and human services, particularly disability services, education exports, bio-technology and a burgeoning tech sector.
As Labor helps to facilitate this transition, our economic growth and labour market will strengthen.
Mr Speaker, I can announce today that Queensland’s economic growth is forecast to improve, from 2% in 2014-15 to 4 1⁄2% in 2015-16 and 2016-17.
As a testament to the Queensland economy’s enduring strength, this is stronger growth than any other State in the country.
Mr Speaker, as the economy grows, we need jobs to follow.
In 2014-15, employment growth slowed to half a percent.
This was the weakest result since 2012-13 when the previous government undertook severe cuts to the government workforce.
But employment growth is forecast to improve to 2% by the end of this term.
3
This reflects improving domestic activity, including an increase in household spending, dwelling investment and the lower Australian dollar improving the competitiveness of the services export sector.
This will encourage more Queenslanders to participate in the labour market.
Unemployment, however, is forecast to remain around 6% over the coming years.
Mr Speaker, this is too high.
Putting downward pressure on the unemployment rate will be the enduring challenge of this term.
There is nothing more important for each and every Queenslander than to have the opportunity to gain work.
Labor believes in Queensland, and in Queenslanders.
We believe in the value and dignity of work, in opportunity, equality, and fairness.
It is the very reason why the success of our $1.6 billion Working Queensland jobs measures in this Budget are so critical.
Jobs now, jobs for the future
The Palaszczuk Government went to the election promising jobs now and jobs for the future.
This Budget delivers for those Queenslanders seeking a job by implementing our commitment to the Working Queensland jobs plan.
More Queenslanders in work means a more prosperous and inclusive future for us all.
Our Working Queensland jobs plan will help create the conditions for growing jobs and building new businesses.
Specifically, it will focus on five key priorities:
| 1. | Improving skills and training |
| 2. | Enhancing business productivity |
| 3. | Boosting Government services |
| 4. | Fostering emerging and innovative industries |
A key element of this Budget’s $1.6 billion jobs plan is the Skilling Queenslanders for Work initiative, which will support some 32,000 Queenslanders back into work.
A return of around $8 into the economy from every $1 invested.
Skills improvement will be crucial and the role to be played by the revitalised TAFE sector is significant.
Additional funding of $34.5 million will be provided over four years to restore TAFE to its rightful place – delivering more foundation courses, more TAFE qualifications through schools and more TAFE teachers.
4
To better align skills demand and long-term workforce planning, we will also allocate $40 million to the establishment of Jobs Queensland as an independent statutory authority.
And Government will play its part, with 10% of the workforce on all Government projects required to be apprentices and trainees.
This now applies for the first time to Government-owned businesses and for public-private partnerships over a certain size.
Mr Speaker, this is a budget that will support business.
It factors in our legislated payroll tax rebate for apprentices and trainees, resulting in an estimated $45 million in tax savings for businesses to reinvest.
Small business will be supported via initiatives such as the Entrepreneurs of Tomorrow fund, which will help stay-at-home parents grow their home-based businesses.
Like Elise Easdown, a Brisbane ‘mumpreneur’ with three young children and a growing online business called ‘What’s On 4’, which she started from home.
It is now an international business providing an online directory for family friendly events, and kids party planning worldwide.
Local infrastructure for local jobs
Mr Speaker, Labor Governments recognise that there are times when economic uplift is required, in order to deliver jobs now.
In a decentralised state like Queensland, Government building projects help deliver employment when and where it’s most needed.
Today’s Budget includes an estimated $10.1 billion spend on infrastructure across Queensland, supporting an estimated 27,500 direct jobs.
This year’s capital works Budget is higher by nearly $400 million, compared to the estimated actual spend last year.
The infrastructure priorities in this Budget are about getting value for money from the delivery of real and tangible local projects right now.
Mr Speaker, today I can announce that this year’s Budget includes an injection of $500 million of new money over four years for a Statewide Schools and Hospitals Fund.
Real Labor Budgets have education and health at their heart, and these will be the sorts of local hospital and school refurbishments that support local jobs and families.
$180 million of this $500 million package will be spent on enhancing regional hospitals.
Essential improvements will be made to hospitals including Caloundra, Roma, Hervey Bay and Gladstone.
This is in addition to the nearly half a billion dollars that will be spent this year alone to continue delivery of the Sunshine Coast University Hospital.
Education maintenance will receive a crucial $300 million boost over the next four years.
5
This is new funding over and above Education Queensland’s base budget for maintenance.
These funds will start to address the education maintenance backlog left over recent years.
The $300 million education maintenance boost will give Queensland families access to quality educational facilities.
Mr Speaker, the Auditor-General has recommended that Queensland invest 1% of the value of its education asset base – per annum – in improving school facilities.
This Budget meets that baseline.
We will see schools refurbished across the length and breadth of Queensland.
Our State Schools, High Schools and Special Schools.
Local projects that will benefit painters, carpenters, tilers and floorers, electricians, plasterers, plumbers and other trades right around the State.
Local tradespeople will be able to register their interest and become an accredited supplier of works, as part of this $300 million education maintenance boost.
An example of where this government is taking a new approach to education maintenance, is a trial currently underway to upgrade all state schools in the Roma area.
This involves refurbishing classroom spaces, some built in the 1950s for a 1950s curriculum, into modern facilities for a modern curriculum.
The Department of Education is giving preference to regional contractors to support local employment, with a focus on apprentices and trainees.
This will help ensure the economic and social benefits of local projects stay in the region.
Early indications from the Roma trial are that these changes will achieve at least 20% savings, compared to the traditional way of doing things.
Mr Speaker, I can also announce today, with funds set aside in this Budget, that three new future schools will be built in regional Queensland.
A new $25 million Special School will finally be built in Cairns, in time for the 2017 school year.
In North West Townsville, $50 million will be spent on a new primary school to be built in time for the 2018 school year. While $40 million will enable construction to begin on a new Townsville high school to open by 2020.
These will be schools fitted with the technology required to prepare our next generation for the knowledge-economy.
Advance Queensland
Mr Speaker, the Palaszczuk Government wants Queensland workers of today to have access to the new jobs of the future.
6
Queensland’s geographical proximity, our shared time zone with Asia and our shared tropical climate with around half the world’s population, positions us perfectly as a gateway to the fastest growing regions in the world.
This presents Queensland with immense global opportunities by:
| • | | building on our world recognised expertise in areas such as medical science, biotechnology and robotics – sharing our tropical expertise with the world |
| • | | unlocking our untapped startup potential to turn innovative ideas into new products and services. |
The source of Queensland’s enormous potential continues to be our people – our human capital.
The Palaszczuk Government is positive about Queensland’s future because we believe in the ability of this and the next generation to drive innovation, build a stronger economy and create jobs.
We need to act now if we want to remain and thrive as a global innovation hub.
Advance Queensland is the next important step.
Our Advance Queensland strategy was a key point of difference for Labor during the January election.
One of the centrepieces of this Budget is that Advance Queensland has been boosted, from an election commitment of $50 million, to a $180 million investment.
An investment in innovation, in skills, in education, in business development and in a startup culture to deliver knowledge-based jobs now and into the future.
Without a focus on science and innovation in Queensland, Professor Ian Frazer would not have developed the world’s first cervical cancer vaccine here.
And without the Translational Research Institute, we would not be able to keep researchers employed in Queensland, exporting future breakthroughs to the world.
We want to attract and develop the best and brightest talent in Queensland, translate our science and technology ideas into commercial and employment outcomes, and play our role in supporting a thriving startup eco-system.
This Advance Queensland investment is expected to co-leverage funding and generate total investment of $300 million.
Advance Queensland will include a $50 million Best and Brightest Fund to develop, attract and retain world-class talent – both scientific and entrepreneurial.
Mr Speaker, Advance Queensland will also see $46 million invested through a Future Jobs Strategy that will open the door to new industry and research collaborations, tackle the big innovation challenges, focus on translation and deliver 10-year roadmaps for industries with global growth potential.
7
Three partnerships have already been identified following the Premier’s overseas trade mission to the United States:
| • | | the Queensland Emory Drug Discovery Initiative |
| • | | a new Siemens Innovation and Translation Centre at the Translational Research Institute, and |
| • | | the Government will support the establishment of a Johnson & Johnson Partnering Office to be located within QUT. |
As a Government, we know that the real drivers of economic change are entrepreneurs and ambitious businesses.
That’s why Advance Queensland will deliver a $76 million Business Investment Attraction package.
To encourage a new wave of Queensland startups, to provide new opportunities for small business, to support proof-of-concept projects and attract co-investment.
Currently only seven per cent of Australia’s tech startups are in Brisbane.
Tech startups are vital to job creation and prosperity.
Studies have found that each technology job created leads to five additional jobs in other sectors.
Halfbrick Studios is a Brisbane tech startup success story.
Without it, the world wouldn’t have ‘Fruit Ninja’.
Brisbane also wouldn’t have the global headquarters of one of the world’s most powerful App developers, employing 85 Queenslanders, with a further 11 positions advertised on their website right now.
To build on successes like Halfbrick, this Budget delivers a $24 million Startup Queensland program, as part of the Advance Queensland Business Investment Attraction package.
We will be examining opportunities to offer a time-limited research and development tax credit matching program for technology startups establishing or relocating to Queensland.
We will also provide a three year payroll tax exemption for new companies established in Queensland as part of Advance Queensland research programs.
Mr Speaker, the Advance Queensland Business Investment Attraction package will include $52 million to improve access to finance and management support for start-ups and SMEs with ambition to grow in international markets.
This will include a $12 million Queensland Commercialisation Program to support proof-of-concept projects designed to lead to new products and services.
And a $40 million Business Development Fund to provide seed co-investment, to encourage greater angel and venture capital investment in Queensland businesses, to help turn good ideas into a commercial reality.
Mr Speaker, across a spectrum of initiatives, the $180 million Advance Queensland package will provide a roadmap for diversifying our economy and growing the jobs of the future.
8
Building our regions
Mr Speaker, I’m proud to be a Treasurer from regional Queensland – the first since the late 1980s.
During the election we promised that the Building Our Regions fund would commence from 2016-17.
However, in light of the need for jobs-generating infrastructure projects to help provide economic uplift to Queensland sooner, I can announce today, Mr Speaker, that this funding has been brought forward by a full year to commence in 2015-16.
Over the next two years, local councils in rural and regional Queensland will share in an additional $200 million in infrastructure, through the Building Our Regions fund.
$55 million of this commitment will be set aside for royalty producing local government areas to improve infrastructure in the communities where royalties are actually generated.
From our regional centres to the outback, this Budget recognises that some parts of Queensland are doing it particularly tough.
That’s why we will provide $52 million of drought relief in this Budget, including emergency rebates and freight subsidies.
We will also provide mental health support and bio-security initiatives such as wild dog eradication.
In addition, $9.5 million will support the bio-security response to the detection of Tropical Race 4 Panama disease – to protect the future of North Queensland’s banana industry.
In the North West and South West of our State, we will deliver a $40 million Western Roads Upgrade Program, to improve roads and keep road crews on the job.
Central Queensland has also been doing it tough in the aftermath of Tropical Cyclone Marcia.
The final damage bill was around $750 million but there have been untold impacts on those communities.
Today I can announce the provision of $25 million to revitalise the Yeppoon Foreshore and $15 million to restore the Rockhampton Riverbank.
We have stepped in to fund these cyclone recovery projects, despite the Federal Government rejecting our request for assistance.
Infrastructure
Mr Speaker, this is an infrastructure Budget – one which delivers over $10 billion in capital investment, supporting 27,500 direct jobs.
This investment includes a $4 billion Transport and Roads program to build and upgrade the key transport arteries that will keep Queensland moving:
| • | | upgrading of the Gateway Motorway North to six lanes |
9
| • | | the commencement of the Toowoomba Second Range Crossing |
| • | | a suite of roads projects on the Gold Coast in preparation for the Commonwealth Games, and |
| • | | further duplication works on the Bruce Highway. |
The capital program includes $300 million for rail improvements, including early spending to deliver 75 new trains by December 2018.
And business can have certainty that a pipeline of all major infrastructure projects will be properly sequenced through the State-wide Infrastructure Plan and properly costed through Building Queensland to deliver maximum value for money.
Restoring frontline services
Mr Speaker, I am proud this is also a Budget that will restore frontline services, with record investment in health and education, to repair the neglect of the last three years.
We will spend more on health and education than ever before, ensuring that the quality of our hospitals and schools are returned to the level Queenslanders expect and deserve.
Health
Queensland Health’s budget will grow by 4% to $14.2 billion this year, the largest on record, and continue to grow across the forward estimates.
This increase includes growth funding of $2.3 billion over four years for Queensland Health to deliver frontline services and improved health outcomes for all Queenslanders.
Mr Speaker, the previous Government had chronically underfunded Queensland Health.
Today’s Budget redresses this.
In addition, $361 million is provided over four years to implement the Outpatient Long Wait Reduction Strategy to finally address what the former Government wouldn’t admit to…
The ‘wait for the wait list’.
This funding has been provided in difficult circumstances, given the Commonwealth’s $11.8 billion in cuts to health have not been restored.
And make no mistake, the Commonwealth’s cuts are still expected to place considerable pressure on the Health budget in the out-years.
Mr Speaker, the Palaszczuk Government made a commitment to our State’s tireless nurses that we would support them to offer the best in patient care.
Today’s Budget includes the funding required to deliver on our election commitment to support up to 4,000 new graduate nursing places, as well as employ 400 Nurse Navigators across our Hospital and Health Services to work with patients, assisting them to navigate across the health system.
10
As a government that looks to address the challenges of the future, we will invest in tackling preventable conditions like type 2 diabetes and heart diseases.
We will do this by partnering with peak bodies to deliver dynamic and proven preventative health programs.
Education
Mr Speaker, ours is a Government that cares for Queensland families and recognises the importance of investing in our next generation.
That’s why we have ensured Queensland’s education and training budget is also a record spend, growing by over 7% to $12.4 billion in 2015-16.
Instead of cutting resources to our schools, we are investing in our schools and our children.
Additional funding of nearly $250 million over four years is provided to lower class sizes and to provide an extra 875 teachers – including 275 specialist teachers for high schools.
An additional 45 guidance officers will be provided for Queensland secondary schools so that every high school over 500 students will have access to a full-time equivalent guidance officer.
We are providing additional funding to our teaching principals who work in our small schools across the State to enable them to better manage the running of their schools.
We will provide enhanced middle management in our primary and special schools to help deliver the curriculum of the future
As well as increased teacher release time to facilitate greater planning, curriculum co-ordination and collaboration time.
If we want our children to be equipped for the jobs of the future, we need to resource and support our principals, teachers and support staff to get the job done.
Public Safety
Mr Speaker, the Palaszczuk Government values the safety of the community and is investing in that safety.
The Government has allocated $31 million over four years as a preliminary response to the Not Now, Not Ever Report.
We will soon release a draft Queensland Domestic and Family Violence Prevention Strategy for public consultation.
Funding of $32 million over four years is allocated in this Budget to address alcohol-fuelled violence across the State.
A further $20 million over four years will be provided to the Police Service to target organised crime, alcohol fuelled violence and the drug ICE.
And having seen first-hand their importance, $6 million has been allocated over three years for body worn cameras to improve safety for our police officers.
11
Frontline services will be bolstered with:
| • | | 266 new police officers |
| • | | 977 new and replacement police vehicles |
| • | | 155 new and replacement ambulances, and |
| • | | 75 additional paramedics. |
$65 million has also been allocated for new and upgraded fire and emergency services facilities and equipment.
Tourism
Mr Speaker, when it comes to tourism, Queensland is where Australia shines.
Under the previous Government, however, no funding certainty was provided for the tourism Budget beyond 2014-15.
The former Government budgeted to cut funding for Tourism and Events Queensland to around half its 2014-15 level by 2018-19, which would have had a real impact on major events, marketing campaigns and on regional tourism operators.
It potentially put a question mark over major events such as the V8 Supercars, Australian Festival of Chamber Music – even the Cairns Amateur Racing Carnival.
All of which support thousands of jobs and generate millions of dollars for the Queensland economy.
The Palaszczuk Government is determined to grow tourism in our state because we know it supports more than 131,000 direct Queensland jobs.
Today’s Budget restores tourism and events funding, providing a total budget of around $400 million over four years so the industry can move forward with confidence.
This funding certainty will help grow the capacity of Tourism and Events Queensland, to promote our destinations and drive our tourism growth.
The Environment
Mr Speaker, no government in history has been more committed to protecting the Great Barrier Reef than the Palaszczuk Government.
This commitment has been recognised by UNESCO and the World Heritage Committee.
We will provide an additional $100 million over five years to protect the iconic Great Barrier Reef.
This funding will enable investment in water quality initiatives and scientific research, together with helping businesses to transition to better environmental practices.
We will also improve coordination of existing Reef water quality spending through annual investment plans and reports.
This addresses the deficiencies recently highlighted by the Auditor-General.
12
Communities
Mr Speaker, one of the fundamental social reforms of this generation is the National Disability Insurance Scheme – a Labor initiative that I’ve supported since my first term.
Queensland deserves a launch site to ensure that we are ready to participate in the NDIS from 1 July 2016.
Funding of $1.9 million has been set aside for the launch, which will enable up to 600 people with a disability to progressively commence access to reasonable and necessary services in preparation for the NDIS.
Mr Speaker, families will be supported in this Budget with $6.6 million over two years to deliver an innovative program of parenting support.
The Positive Parenting Program will include a state-wide free service, providing face-to-face and online training to help improve parenting skills.
Seniors too will be supported in this Budget, with the provision of $233 million in concessions over the next four years for electricity, water and transport that were cut by the Commonwealth Government.
Innovative approaches
Mr Speaker, when it comes to tackling complex social and economic challenges, the Palaszczuk Government is committed to innovation.
We intend to take a collaborative approach to working with the private sector and NGOs on financing solutions to difficult problems.
After several months of investigation, I can announce that the Government will pilot three Social Benefit Bonds.
These Bonds will examine ways to partner with service providers and the private sector in the areas of re-offending, homelessness and Indigenous disadvantage.
This initiative will aim to source funds from private investors and provide a return when agreed social outcomes are met – improving service delivery and saving money.
I can also announce today that the Government will launch a new Market-Led Proposals framework to enable the private sector to submit projects for potential partnership with the State.
The business community will be encouraged to propose solutions to major infrastructure challenges, and submit these for coordinated assessment via a Market-Led Proposals portal.
We want to engage more seamlessly with industry to secure new projects – proposals which can capture economic uplift and job opportunities.
Market-led proposals will allow Queensland to look beyond the Commonwealth’s failure to help fund Queensland’s next-generation infrastructure projects.
It could allow us to consider a genuine partnership with the private sector to deliver projects like Cross River Rail.
13
Responsible Debt Management
While Queensland’s operating position is back in the black, it is clear that the level of debt we are carrying remains too high.
Mr Speaker, it is time to take the politics out of debt. It’s time to roll up our sleeves and systematically set about reducing the State’s debt levels.
Today I hand down the first Queensland budget in 16 years to reduce debt.
Our Debt Action Plan will deliver $9.6 billion in debt reduction by 2017-18.
This is the first Queensland Budget since 1999-2000 to project a reduction in General Government debt across the forward estimates.
Total borrowings are forecast to be lower over every year of the forward estimates, compared with those forecast by the previous Government.
After factoring in revenue write-downs and critically needed funding for health and education, General Government borrowings are still forecast to be more than $3.7 billion lower in 2017-18, than they were in 2014-15.
This debt reduction is achieved without selling assets.
It is achieved through a Debt Action Plan, prompted by the Review of State Finances.
Review of State Finances
Mr Speaker, in accordance with our 2015 election commitment, the Government commissioned Queensland Treasury to undertake a review of the State’s finances, for publication as part of the first State Budget of the term.
We saw no need to employ highly paid external people – certainly not a former federal Treasurer.
We had confidence in the independent officers of Treasury for such a task.
The Review of State Finances made recommendations for a revised set of fiscal principles that will see the Government direct its focus towards targeting a reduced General Government debt-to-revenue ratio over this term.
In 2014-15, Queensland’s debt-to-revenue ratio was 87%.
The Review of State Finances advised that a reduction to between 70-80% over the next decade was desirable.
Today I can confirm that as a result of measures taken in this Budget, Queensland’s debt to revenue ratio will be reduced to around 70% – not over the next decade, but over the forward estimates.
Debt Action Plan
Achieving these fiscal principles requires a new approach.
14
The Government’s Debt Action Plan will refocus the State’s balance sheet through three initiatives.
A $4.1 billion reduction in General Government debt is achieved from re-gearing our energy network businesses.
This is the first step in merging these businesses as committed at the election.
It was recommended by the independent Treasury’s Review of State Finances, and is supported by analysis by KPMG which states that there will be no impact on electricity prices.
With these assets staying in government ownership, we have an obligation to make them work harder and more efficiently for the people of Queensland.
This will result in lower General Government interest expenses of around $600 million over the forward estimates – without the need for asset sales.
The second measure of our Debt Action Plan will see total State debt reduced by a further $3.4 billion, through meeting Long Service Leave obligations on an ‘as required basis’, rather than holding a central investment allocation.
This measure was also identified by the Review of State Finances.
Queensland is the only Australian jurisdiction to fund long service leave in this manner.
The standard practice of all other States and Territories is to fund long service leave when the leave is taken.
The Government considers the current approach of holding significant financial assets – at the same time as significant levels of debt – is no longer appropriate.
Importantly, there will be no change for employees, who will not experience any difference in the way their long service leave is paid.
Long service leave entitlements are guaranteed by legislation, and will be paid when claimed.
This measure will allow us to reduce interest repayments by just under $600 million over the forward estimates – without the need for asset sales.
The third element of our Debt Action Plan will see total State debt reduced by $2 billion over five years, through a time-limited suspension of annual employer contributions to the Defined Benefit Scheme.
The Scheme will remain 100% fully funded at all times.
Mr Speaker, Queensland is the only Australian jurisdiction to fully fund its defined benefit superannuation liabilities.
The Palaszczuk Government made an election commitment that we would target full funding of long-term liabilities – such as superannuation and WorkCover – in accordance with actuarial advice.
And we have confirmed this commitment again as a fiscal principle in today’s Budget.
Recent valuations by the State Actuary indicate the defined benefit scheme currently has a funding surplus of more than $10 billion.
15
On the more conservative accounting basis, the scheme currently has a surplus in the range of $2 billion to $2.5 billion.
Given the size of the surplus and the importance of reducing the State’s debt, the Government will suspend employer contributions in the defined benefit scheme for up to five years.
No money is taken out.
Nothing is being raided.
To suggest anything else is playing politics and scaremongering.
The degree to which employer contributions need to be increased or decreased is assessed every three years by the boards of most superannuation funds – based on actuarial advice.
In this case, the State Actuary has provided written advice that this measure can be undertaken, with the scheme remaining fully funded for its approximately 50,000 members – as is guaranteed by legislation.
Again, importantly, there will be no change in entitlements for defined benefit members and the scheme will remain at least 100% fully funded.
There will also be absolutely no change to the accumulation superannuation scheme to which the vast majority of the Queensland public service belong.
This measure will reduce State debt by $2 billion over five years and result in lower interest expenses of around $150 million over the forward estimates.
Again, without the need for asset sales.
Mr Speaker, the combined impact of these three initiatives is General Government debt reduction of $9.6 billion over this term
And a reduction in our total interest bill of around $1.35 billion over the forward estimates.
All without the need to massively raise taxes, fees and charges, and without the need for the asset sales that we were told by the former government were our ‘only choices’.
This is a responsible step-change in approaching the State’s debt, and one that should be supported by all members of this House.
This Government will always be vigilant about the quality of our credit and responsibly managing the finances.
Next steps
Mr Speaker, while this may be the Palaszczuk Government’s first Budget, it will not be the last to pay down debt over the forward estimates.
The measures announced today cannot simply be one off measures.
The importance of strong fiscal discipline going forward cannot be understated.
We will continue to look at ways to improve the State’s finances, consistent with both our core principles and our fiscal principles, and our commitment to grow a vibrant Queensland economy.
16
Over the next six months we will work with Treasury to examine ways for Queenslanders to invest in Queensland.
This due diligence work may include enabling the defined benefit scheme to invest in growing Queensland infrastructure through our energy GOCs.
The defined benefit fund currently invests Queensland money in a range of interstate and overseas infrastructure, including Thames Water in the UK and the Ohio University car parking system in the US.
The fund is also currently carrying historically high levels of cash that could be responsibly invested in Queensland to deliver much needed employment and economic growth.
Our guiding principle will always be no sales and no leases of our income-generating assets.
These assets will always be 100% owned by Government, 100% controlled by Government and 100% of all dividends continuing to be paid to the Government.
But we will look at new approaches, new partnerships and better ways of doing things – to create jobs and deliver growth.
Unlike the previous Government, we will grow our way to prosperity.
Not take the easy option of austerity measures and asset sales.
That hasn’t worked elsewhere in the world and it won’t work for Queensland.
Conclusion
Mr Speaker, we are a collaborative and consultative government.
We’ve listened to the concerns of Queenslanders and we’ve acted to heal the wounds opened by the former government.
Their approach was about asserting the primacy of fiscal austerity, over compassion and consideration for the whole community.
They were more concerned about bankers than battlers.
More concerned about meeting the needs of company executives, than the needs of everyday Queenslanders.
The former government missed a fundamental truth.
That is, the crucial role people play, and that the economy is part of the overall framework by which we live.
The economy is simply a description of our circumstances, and the finances are but a tool to build a community.
People must always be seen as more than simply a number.
I am unashamedly a Treasurer who likes people.
And we are a government that will work to see society and the economy fit together for the greatest benefit.
17
Mr Speaker, this is a responsible and measured Budget – pro-growth and pro-jobs – which delivers vital funding for health and education.
The Budget demonstrates our responsible fiscal management.
It is the first Budget in 16 years to reduce debt every year of the forward estimates.
Mr Speaker, this Budget demonstrates that there is a better way.
It sets Queensland on a new course.
A return to growth.
A return to optimism.
As Queenslanders get back to work, as businesses get back to hiring, as we get on with the job of growing the economy.
And as we secure Queensland’s most priceless natural asset for future generations – the Great Barrier Reef.
This is a Budget that’s prepared to undertake long overdue balance sheet measures.
Paying down debt.
Keeping our State-owned businesses in public hands, but operating them like businesses should be.
These are financially responsible reforms.
Reforms that are fair, that promote growth and create jobs.
Jobs now, and jobs for the future.
The jobs we want our children and grandchildren to have.
Hi-tech, knowledge-based jobs.
Jobs that rely on innovation and creativity, and our strengths in education.
Jobs that attract international visitors, that promote export growth, that attract inward investment.
We’re building a diversified Queensland economy for the future. One that will thrive – no matter what the global economic conditions.
This is what Queenslanders do.
We believe we can once again lead the way for growth in this country.
Mr Speaker, this Palaszczuk Labor Government will never forget why it was elected:
To get Queenslanders back to work and to grow our economy.
With the next generation always in our minds and in our hearts.
I commend the Bills to the House.
18
Queensland Budget 2015-16 Budget Speech Budget Paper No. 1
Queensland Budget 2015-16 Budget Speech Budget Paper No. 1 www.budget.qld.gov.au
Queensland Budget 2015-16
Budget Strategy and Outlook
Budget Paper No. 2
2015-16 Queensland Budget Papers
1. Budget Speech
2. Budget Strategy and Outlook
3. Capital Statement
4. Budget Measures
5. Service Delivery Statements
Appropriation Bills
Jobs Now, Jobs for the Future - Queensland Government employment plan
Budget Highlights
The suite of Budget Papers is similar to that published in 2014-15.
The Budget Papers are available online at www.budget.qld.gov.au
© Crown copyright
All rights reserved
Queensland Government 2015
Excerpts from this publication may be reproduced, with appropriate
acknowledgement, as permitted under the Copyright Act.
Budget Strategy and Outlook
Budget Paper No. 2
ISSN 1445-4890 (Print)
ISSN 1445-4904 (Online)
Budget Strategy and Outlook 2015-16

State Budget
2015-16
Budget Strategy and Outlook
Budget Paper No. 2
Budget Strategy and Outlook 2015-16
Contents
| | | | | | |
| 1 | | Fiscal strategy and outlook | | | 1 | |
| | |
| 1.1 | | Context | | | 2 | |
| 1.2 | | Key fiscal aggregates | | | 8 | |
| 1.3 | | Fiscal principles | | | 17 | |
| 1.4 | | Achievement of fiscal principles | | | 21 | |
| | |
| 2 | | Economic performance and outlook | | | 22 | |
| | |
| 2.1 | | External environment | | | 23 | |
| 2.2 | | Queensland economy | | | 28 | |
| | |
| 3 | | Revenue | | | 44 | |
| | |
| 3.1 | | 2014-15 estimated actual | | | 45 | |
| 3.2 | | 2015-16 revenue by category | | | 46 | |
| 3.3 | | Queensland’s revenue trends | | | 47 | |
| 3.4 | | Election commitments | | | 54 | |
| 3.5 | | Taxation revenue | | | 54 | |
| 3.6 | | Queensland’s competitive tax status | | | 60 | |
| 3.7 | | Grants revenue | | | 62 | |
| 3.8 | | Sales of goods and services | | | 64 | |
| 3.9 | | Interest income | | | 66 | |
| 3.10 | | Dividend and income tax equivalent income | | | 66 | |
| 3.11 | | Other revenue | | | 67 | |
| | |
| 4 | | Expenses | | | 69 | |
| | |
| 4.1 | | 2014-15 estimated actual | | | 70 | |
| 4.2 | | 2015-16 Budget and outyears | | | 70 | |
| 4.3 | | Expenses by operating statement category | | | 71 | |
| 4.4 | | Operating expenses by purpose | | | 79 | |
| 4.5 | | Departmental expenses | | | 80 | |
Budget Strategy and Outlook 2015-16
| | | | | | |
| | |
| 5 | | Balance sheet and cash flows | | | 87 | |
| | |
| 5.1 | | Context | | | 87 | |
| 5.2 | | Balance sheet | | | 88 | |
| 5.3 | | Cash flows | | | 94 | |
| 5.4 | | Reconciliation of operating cash flows to the operating statement | | | 96 | |
| | |
| 6 | | Intergovernmental financial relations | | | 97 | |
| | |
| 6.1 | | Federal financial arrangements | | | 98 | |
| 6.2 | | Australian Government funding to the states | | | 104 | |
| 6.3 | | Australian Government funding to Queensland | | | 107 | |
| 6.4 | | GST revenue payments | | | 109 | |
| 6.5 | | Payments to Queensland for specific purposes | | | 114 | |
| | |
| 7 | | Public Non-Financial Corporations Sector | | | 120 | |
| | |
| 7.1 | | Context | | | 120 | |
| 7.2 | | Finances and performance | | | 121 | |
| | |
| 8 | | Uniform Presentation Framework | | | 132 | |
| | |
| 8.1 | | Context | | | 132 | |
| 8.2 | | Uniform Presentation Framework financial information | | | 132 | |
| 8.3 | | Reconciliation of net operating balance to accounting operating result | | | 142 | |
| 8.4 | | General Government Sector time series | | | 143 | |
| 8.5 | | Other General Government uniform presentation framework data | | | 145 | |
| 8.6 | | Contingent liabilities | | | 151 | |
| 8.7 | | Background and interpretation of uniform presentation framework | | | 151 | |
| 8.8 | | Sector classification | | | 153 | |
| 8.9 | | Reporting entities | | | 154 | |
Budget Strategy and Outlook 2015-16
| | | | |
| |
Appendix A: Tax expenditure statement | | | 157 | |
| |
Context | | | 157 | |
Methodology | | | 157 | |
The Tax Expenditure Statement | | | 158 | |
Discussion of individual taxes | | | 160 | |
| |
Appendix B: Concessions statement | | | 164 | |
| |
Context | | | 164 | |
Focus | | | 165 | |
Explanation of scope | | | 166 | |
Concessions by agency | | | 173 | |
| |
Appendix C: Revenue and expense assumptions and sensitivity analysis | | | 190 | |
| |
Taxation and royalty revenue | | | 191 | |
Taxation revenue assumptions and revenue risks | | | 192 | |
Royalty assumptions and revenue risks | | | 193 | |
Sensitivity of expenditure estimates and expenditure risks | | | 194 | |
| |
Appendix D: Fiscal aggregates and indicators | | | 196 | |
Budget Strategy and Outlook 2015-16
| 1 | Fiscal strategy and outlook |
Features
| • | | The 2015-16 Budget delivers the Government’s election commitments, with key measures to revitalise the State economy and frontline service delivery, especially in the areas of health, education and training. |
| • | | At the same time, this Budget delivers on the Government’s commitment to reduce General Government debt without selling government-owned corporations, without increasing taxes and without cutting services. |
| • | | Weaker commodity prices and a subdued labour market present challenges for the State Budget, in a similar way that they present challenges for the Queensland economy and national economy. |
| • | | Nonetheless, Queensland’s economic growth is forecast to rise from 2% to 4 1⁄2% in 2015-16, the strongest economic growth of any state or territory across Australia, with much of this growth driven by liquefied natural gas exports. |
| • | | The Government’s Debt Action Plan will reduce General Government debt by approximately $7.5 billion in 2015-16, compared to the level of debt in the absence of measures. Further reductions across the forward estimates result in a debt reduction of $9.6 billion by 2017-18. |
| • | | This is the first Budget since 1999-2000 that has projected a reduction in General Government borrowings across the forward estimates, such that debt will be lower in 2018-19 than it was in 2014-15. |
| • | | General Government debt, which incorporates the impact of the Debt Action Plan, as well as all other budget movements, is expected to fall from $43.268 billion in 2014-15 to $39.532 billion in 2017-18. This is $7.5 billion lower than the projection for 2017-18 at the time of the 2014-15 Mid Year Fiscal and Economic Review (MYFER) and $8.9 billion lower than projected in the 2014-15 Budget. |
| • | | Following consideration of the Review of State Finances, the Government is introducing revised fiscal principles that target an ongoing reduction in Queensland’s debt burden, as measured by the General Government debt to revenue ratio. |
| • | | This will be supported by the Government’s principle of targeting net operating surpluses that ensure any new capital investment is primarily funded through recurrent revenues, rather than borrowing. |
| • | | Reflecting the Government’s commitment to responsible and measured management of the State’s finances, the General Government Sector is forecast to deliver a net operating surplus of $962 million in 2014-15, rising to $1.213 billion in 2015-16. |
1
Budget Strategy and Outlook 2015-16
| • | | Net operating surpluses are expected across each year of the forward estimates, despite royalty revenue forecasts being revised down by $3.186 billion across the period 2014-15 to 2017-18 since the MYFER, and downward revisions to payroll tax. |
| • | | Consistent with the position taken to the 2015 Election, the Government is implementing reprioritisations and specific measures that more than offset the cost of election commitments. Across the period 2014-15 to 2018-19, there is a net budget improvement of $340 million as a result. |
| • | | Additional net funding for service delivery of $1.85 billion is being provided over the period 2014-15 to 2017-18, particularly to restore frontline capacity for Queensland Health and improve health outcomes. |
| • | | There has been an increase in the net cost of rebuilding in response to natural disasters, including the incorporation of the cost of Tropical Cyclone Marcia. While there continues to be a mismatch between the timing of revenue and expenditure, the scale of this variation is less pronounced than in previous budgets. |
| • | | Operating expenses are forecast to grow at a sustainable rate, averaging 4.1% per annum across the forward estimates, excluding disaster recovery expenses. This is less than the forecast rate of revenue growth of 4.3% per annum, excluding disaster recovery revenues, supporting stronger operating surpluses. |
The Palaszczuk Government announced a number of key policy positions in the lead-up to the January 2015 Election. These positions and the associated commitments included:
| • | | paying down General Government Sector debt of $5.4 billion over six years, with a target of paying down $12 billion of General Government Sector debt over 10 years, while retaining assets in public hands |
| • | | implementing election commitments, reprioritisations and specific measures that deliver an improvement in the net operating balance |
| • | | bolstering frontline service delivery, particularly in the key areas of health and education |
| • | | boosting skills and training to provide improved employment and economic outcomes for all Queenslanders |
| • | | commissioning Queensland Treasury to prepare a full review of the State’s finances |
| • | | not increasing royalties, tax rates, or the rate of growth of fees and charges. |
The 2015-16 Budget delivers on each of these commitments.
2
Budget Strategy and Outlook 2015-16
The Palaszczuk Government has responded to the significant fall in royalties since the MYFER by enhancing the pre-election Debt Action Plan to include further modest and responsible measures refocusing the balance sheet to lower debt. These additional balance sheet measures will contribute towards General Government Sector debt being $7.5 billion lower by 2017-18, relative to the MYFER, compared with a pay down of $2.1 billion by 2018-19 under the pre-election Our State Our Assets Fiscal Strategy and Debt Action Plan. The Palaszczuk Government remains committed to merging energy government-owned corporations to increase dividends and further lower debt as set out in the pre-election Debt Action Plan.
The Government’s Debt Action Plan will deliver a reduction in General Government Sector debt without requiring the sale of government-owned corporations, without increases in taxes and without cuts to services. Further detail on the Debt Action Plan is provided in Box 1.1.
The Government’s election commitments focussed on the key service areas of education, training, health and environmental protection, as well as providing additional funding for regional development and supporting the tourism industry. These commitments are more than offset by specific measures and the reprioritisation of agency funding, with a net positive impact on the budget of $340 million across the forward estimates. Agencies have been instructed that there will be no forced or voluntary redundancies associated with these reprioritisations. Further detail on the Government’s election commitments is provided in Budget Paper 4 – Budget Measures.
The Review of State Finances, released concurrently with the 2015-16 Budget, has confirmed the importance of delivering substantial net operating surpluses to ensure that the General Government Sector capital program can be funded primarily from recurrent revenues, rather than borrowings. The Review has also confirmed the importance of managing General Government Sector debt through targeting an ongoing reduction in the ratio of debt to revenue.
Following consideration of the Review of State Finances, the Government has adopted five fiscal principles aimed at improving the sustainability of the State’s finances. These principles are:
| • | | target ongoing reductions in Queensland’s relative debt burden, as measured by the General Government Sector debt to revenue ratio |
| • | | target net operating surpluses that ensure any new capital investment in the General Government Sector is funded primarily through recurrent revenues rather than borrowing |
| • | | the capital program will be managed to ensure a consistent flow of works to support jobs and the economy and reduce the risk of backlogs emerging |
| • | | maintain competitive taxation by ensuring that General Government Sector own-source revenue remains at or below 8.5% of nominal gross state product, on average, across the forward estimates |
| • | | target full funding of long term liabilities such as superannuation and WorkCover in accordance with actuarial advice. |
Further discussion of the fiscal principles, and the Government’s progress in meeting its targets, is provided in Sections 1.3 and 1.4.
3
Budget Strategy and Outlook 2015-16
The fiscal environment facing the State remains challenging. A softening of the outlook for the global economy, particularly in the key coal export markets of China and Japan, has contributed to a sharp decline in the outlook for coal prices. Weaker oil prices are weighing on the State’s coal seam gas royalty revenues (as liquefied natural gas export prices are linked to oil prices).
Reflecting these factors, which have only been partly offset by a slight decline in the exchange rate, royalty forecasts have been revised down by $3.186 billion since the 2014-15 MYFER.
The Queensland Government recognises that the current level of General Government debt restricts the State’s capacity to respond to shocks, whether in financial markets or by way of natural disasters. The Government received independent advice in the Review of State Finances about measures available to immediately reduce General Government debt, in order to deliver a material improvement in the State’s debt to revenue ratio.
The following measures have since been adopted as part of the Government’s Debt Action Plan. These debt reduction measures will be achieved while retaining 100% state ownership of the Government’s income-generating assets and maintaining 100% funding of superannuation liabilities.
General Government debt increased by $14 billion over the past three years and the Government made a decision that a policy response was required to take a whole-of-balance-sheet approach to managing the State’s assets and liabilities and to reduce risks associated with the current structure of the State’s balance sheet. This will enable better use of the capital available to the State.
The measures being implemented as part of the Government’s Debt Action Plan will reduce General Government debt by approximately $7.5 billion in 2015-16, compared to the level of debt in the absence of measures, with further reductions across the forward estimates resulting in a reduction of $9.6 billion in 2017-18.
Revising the capital structure of the Government’s energy network businesses
The State’s energy network businesses are currently geared at a net debt to Regulated Asset Base ratio of approximately 55%, on average. In comparison, the industry average gearing ratio is around 80%, which means that the equity (of the owner) is only used to fund around 20% of the asset.
The Review of State Finances, informed by the Queensland Treasury Corporation’s assessment, identified that there is capacity to increase the gearing levels of the network businesses towards more commercial levels. The re-gearing plan was recommended by the Independent Review of State Finances. In addition, analysis by KPMG shows that this measure is consistent with industry practice which supports efficient capital management and enables shareholders to ration their equity across a wider range of investments with no impact on prices or charges, which are independently determined by the regulator.
4
Budget Strategy and Outlook 2015-16
The Government has given consideration to the revised outlook for the capital expenditure requirements of the energy network businesses, the benefits of the forthcoming merger, and the advice regarding the capacity to move towards more commercial gearing levels.
Taking each of these factors into account, the Government has decided that the level of the State’s equity committed to assets in the businesses will be reduced, consistent with targeting a gearing ratio of 70% for Ergon Energy and Energex and 75% for Powerlink, measured with reference to net debt as a proportion of the Regulated Asset Base.
The lower capital expenditure requirements of the network businesses will allow for future dividends to be increased from 80% to 100% whilst still allowing for gearing levels to remain at the target ratios of 70%-75%.
The energy network businesses will be closely monitored to ensure that their financial position remains consistent with a standalone investment grade credit rating, and that the businesses will be able to service their borrowings without requiring Government support. Revising the capital structure will have no impact on electricity transmission and distribution costs, which represent approximately 40% of the electricity price paid by consumers and are independently regulated by the Australian Energy Regulator. The State will retain full ownership and control of the businesses.
As a result of these changes, an additional $4.1 billion will be remitted from the energy network businesses to the General Government Sector across the forward estimates. Approximately $600 million of this will be recognised as operating receipts, with $3.5 billion being a withdrawal of equity.
The General Government Sector will also benefit from lower interest expenses associated with using these funds to reduce General Government debt.
Funding long service leave on an emergent basis
The Review of State Finances also makes reference to the current arrangements where the State sets aside assets to match the value of long service leave liabilities as they accrue. Amongst Australian jurisdictions, this arrangement is unique to Queensland. The standard practice is to fund long service leave entitlements on an emergent basis, when the leave is paid. Queensland’s arrangements reflect a decision made in 1998, when the State’s debt levels were low and the State had surplus financial assets.
With relatively high debt, compared with other Australian jurisdictions, the Government considers that the current approach, which results in the State holding significant financial assets at the same time as significant levels of debt, is no longer appropriate. Accordingly, the Government has decided that the State’s investments currently set aside to match accrued long service leave liabilities will be drawn down, with the proceeds used to repay General Government debt.
This will result in a debt reduction of approximately $3.4 billion, which will take effect during 2015-16.
5
Budget Strategy and Outlook 2015-16
There will be no change for employees, with all long service leave entitlements being maintained and met when claimed. There will also be no change to the administrative arrangements under which Government departments currently contribute to, and draw down from, the Long Service Leave Central Scheme.
This measure will align Queensland’s long service leave arrangements with standard practice across Australia.
Temporary suspension of investment of defined benefit employer contributions, whilst maintaining fully-funded status
Queensland is the only Australian jurisdiction to fully fund its defined benefit superannuation liabilities, consistent with long-standing fiscal principles maintained by successive governments.
Recent valuations by the State Actuary indicate that the defined benefit scheme is currently in a surplus position of over $10 billion on a funding basis. On the more conservative accounting valuation basis, (which uses Australian Government bond rates rather than expected returns in calculating the future value of scheme assets) the surplus is considered to be in the range of $2 billion - $2.5 billion.
The surplus represents additional cash and investments above the actuarially assessed level required to meet payment obligations to members of the defined benefit scheme (primarily current or former Queensland Government employees). Any surplus funding in the scheme returns to the State when all funding obligations to members have been met.
The Government has decided that, taking into account the size of the surplus in the defined benefit scheme and the magnitude of the State’s debt, the investment of defined benefit employer contributions will be suspended for a period of five years. These contributions will instead be directed to paying down General Government debt.
Rather than investing further in an over-funded scheme, General Government debt will be reduced by approximately $2 billion across the forward estimates. If there are any significant risks to the scheme remaining in surplus, the State will resume investment of contributions to maintain the commitment to targeting full funding of the scheme.
There will be no change to the entitlements of defined benefit members and the scheme is expected to remain in surplus. The Government’s commitment to full funding of long term liabilities, such as superannuation and WorkCover will be maintained. The State Actuary has advised that the defined benefit scheme is well placed to accommodate the Government’s decision, while retaining consistency with the principle of fully funding superannuation entitlements.
Further debt reduction
The Government will continue to consider opportunities for further reducing General Government debt, while maintaining its commitments to retaining ownership of government-owned corporations and fully funding superannuation.
6
Budget Strategy and Outlook 2015-16
One option available to Government is to consider whether the level of equity held in other government-owned corporations remains appropriate, or if there is potential to move these corporations towards more commercial gearing levels. This would ensure that corporations have efficient capital structures, having regard to their peers, while retaining sufficient capital to meet the ongoing needs of their organisation.
In addition, the opportunity for Queensland’s defined benefit superannuation scheme to invest in the State’s government-owned corporations will be closely examined.
Specific options are still to be developed, and will be subject to extensive due diligence and Government consideration. However, there would appear to be potential to provide the defined benefit scheme with the opportunity to share in the growth potential of Queensland’s government-owned corporations where commercial returns are available.
This plan will also provide the State with capacity to further reduce debt and also invest in productivity-enhancing infrastructure projects that will be identified and prioritised by Building Queensland.
All options would ensure that government-owned corporations would continue to be 100% controlled and 100% owned by the Government, with all dividends continuing to be paid to the Government.
Further debt reduction proposals, and associated infrastructure investment, will also be consistent with the Government’s fiscal principles, in particular the commitments to ongoing reductions in the General Government debt to revenue ratio and fully funding the State’s superannuation and WorkCover liabilities in accordance with actuarial advice.
Details of the outcome of the next phase of the Government’s Fiscal Strategy and Debt Action Plan will be provided in the 2015-16 MYFER.
These additional measures are considered necessary in order to implement a structural and sustained reduction in debt over the long-term.
7
Budget Strategy and Outlook 2015-16
The key fiscal aggregates of the General Government Sector for the 2015-16 Budget are outlined in Table 1.1 and are discussed in detail in this chapter.
| Table 1.1 | General Government Sector – key fiscal aggregates1 |
| | | | | | | | | | | | | | | | | | | | | | | | | | | | |
| | | 2013-14
Actual2
$ million | | | 2014-15
MYFER
$ million | | | 2014-15
Est. Act.
$ million | | | 2015-16
Budget
$ million | | | 2016-17
Projection
$ million | | | 2017-18
Projection
$ million | | | 2018-19
Projection
$ million | |
Revenue | | | 46,734 | | | | 49,149 | | | | 49,578 | | | | 51,186 | | | | 54,010 | | | | 55,486 | | | | 55,748 | |
Expenses | | | 46,115 | | | | 49,213 | | | | 48,615 | | | | 49,973 | | | | 51,784 | | | | 53,354 | | | | 54,421 | |
Net operating balance | | | 619 | | | | (64 | ) | | | 962 | | | | 1,213 | | | | 2,226 | | | | 2,132 | | | | 1,327 | |
Capital purchases | | | 6,322 | | | | 5,903 | | | | 4,987 | | | | 5,374 | | | | 5,832 | | | | 6,125 | | | | 5,851 | |
Fiscal balance | | | (2,581 | ) | | | (2,842 | ) | | | (896 | ) | | | (1,162 | ) | | | (968 | ) | | | (881 | ) | | | (1,101 | ) |
Borrowing | | | 41,403 | | | | 45,801 | | | | 43,268 | | | | 38,151 | | | | 38,818 | | | | 39,532 | | | | 40,724 | |
Borrowing (NFPS)3 | | | 72,716 | | | | 77,553 | | | | 75,535 | | | | 74,113 | | | | 75,714 | | | | 77,119 | | | | 78,802 | |
Notes:
| 1. | Numbers may not add due to rounding. Bracketed numbers represent negative amounts. |
| 2. | Reflects published actuals. |
| 3. | NFPS: Non-Financial Public Sector. |
| 1.2.1 | Net operating balance |
Consistent with the Government’s fiscal principles, substantial operating surpluses are projected in each year of the forward estimates. This will ensure that the General Government Sector capital program is primarily funded from recurrent revenues, rather than borrowings.
As identified in Table 1.1, the anticipated 2014-15 operating surplus of $962 million compares with a forecast deficit of $64 million expected in the 2014-15 MYFER. This $1.026 billion improvement is largely the result of lower than forecast expenses.
Specific drivers for the improvement in 2014-15 are:
| • | | re-profiling expenditure in the Health portfolio, which will assist in funding sustainable growth in health expenditure from 2015-16 onwards |
| • | | revisions to the timing of natural disaster expenses and reimbursements, resulting in higher revenues and lower expenses in 2014-15. |
Further details on revenue and expenses are contained in Chapters 3 and 4 respectively.
The net operating surplus in 2014-15 represents only the second surplus since 2008-09, as shown in Chart 1.1. The operating surplus in 2015-16 is estimated to be the largest operating surplus since 2006-07.
8
Budget Strategy and Outlook 2015-16
| Chart 1.1 | Net operating balance |
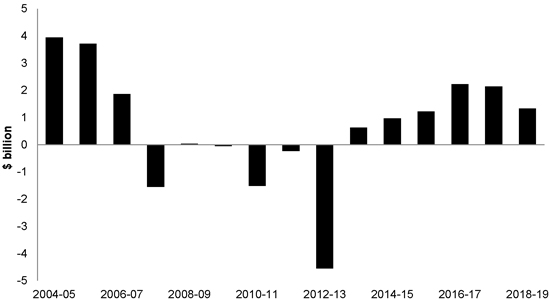
The estimated 2015-16 General Government Sector operating surplus of $1.213 billion is weaker than the forecast surplus of $3.078 billion in the 2014-15 MYFER. This is primarily a result of weaker royalty revenue, along with increases in Natural Disaster Relief and Recovery Arrangements (NDRRA) expenses and revisions to NDRRA reimbursements from the Australian Government. Revisions to NDRRA expenses and revenue in 2015-16 are expected to detract $885 million from the operating balance compared to MYFER.
Royalty revenue estimates have been revised down by $891 million in 2015-16, primarily because of substantially lower coal prices, as well as revisions to the timing and value of liquefied natural gas exports.
Taxation revenue has been revised down by $89 million in 2015-16 relative to MYFER. This is primarily because of reductions in the rate of growth in payroll tax, offset, to some extent, by stronger transfer duty.
Goods and services tax (GST) revenue has been revised up by $489 million since MYFER, reflecting an increase in Queensland’s share of GST, as recommended by the Commonwealth Grants Commission (CGC).
Funding of $558 million, in addition to election commitments, is being provided in 2015-16 to improve service delivery, primarily to restore frontline capacity for Queensland Health and improve health outcomes.
Downward revisions to operating surpluses in 2016-17 and 2017-18 compared to the 2014-15 MYFER primarily reflect substantial revisions to royalty revenue, with the cost of new policy measures broadly offset by increases to GST revenue in these years.
9
Budget Strategy and Outlook 2015-16
| Table 1.2 | General Government Sector – net operating balance forecasts1 |
| | | | | | | | | | | | | | | | | | | | | | | | |
| | | 2013-14
$ million | | | 2014-15
$ million | | | 2015-16
$ million | | | 2016-17
$ million | | | 2017-18
$ million | | | 2018-19
$ million | |
2014-15 Budget | | | (2,298 | ) | | | 188 | | | | 3,188 | | | | 3,534 | | | | 2,968 | | | | n/a | |
2014-15 MYFER | | | 619 | | | | (64 | ) | | | 3,078 | | | | 3,120 | | | | 3,011 | | | | n/a | |
2015-16 Budget | | | 619 | | | | 962 | | | | 1,213 | | | | 2,226 | | | | 2,132 | | | | 1,327 | |
Note:
| 1. | Bracketed numbers represent negative amounts. |
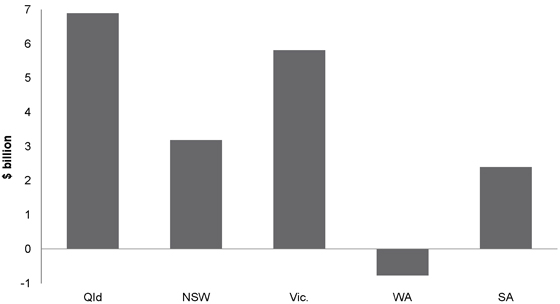
Despite the deterioration in the operating position since MYFER, which has been driven by a weaker outlook for commodity prices, Queensland’s operating position remains stronger than that of other states, as shown in Chart 1.2.
In aggregate, Queensland is projecting surpluses of $6.9 billion across 2015-16 to 2018-19, with the next strongest projection being $5.8 billion in Victoria.
| Chart 1.2 | Net operating balance – aggregated 2015-16 to 2018-191 |
Note:
| 1. | New South Wales figures exclude the impacts of the Transport Asset Holding Entity. |
10
Budget Strategy and Outlook 2015-16
Table 1.3 provides a breakdown of the movements in the net operating balance since the 2014-15 MYFER.
| Table 1.3 | Reconciliation of net operating balance, 2014-15 MYFER to 2015-16 Budget1 |
| | | | | | | | | | | | | | | | |
| | | 2014-15 | | | 2015-16 | | | 2016-17 | | | 2017-18 | |
| | | $ million | | | $ million | | | $ million | | | $ million | |
2014-15 MYFER net operating balance | | | (64 | ) | | | 3,078 | | | | 3,120 | | | | 3,011 | |
Taxation revisions2 | | | 108 | | | | (89 | ) | | | (71 | ) | | | (89 | ) |
Royalty revisions | | | (279 | ) | | | (891 | ) | | | (1,042 | ) | | | (974 | ) |
GST revisions | | | 11 | | | | 489 | | | | 613 | | | | 669 | |
Natural disaster revisions3 | | | | | | | | | | | | | | | | |
Change in revenue | | | 213 | | | | (722 | ) | | | 163 | | | | 200 | |
Change in expenses | | | 271 | | | | (163 | ) | | | (278 | ) | | | (32 | ) |
| | | | | | | | | | | | | | | | |
Net change | | | 484 | | | | (885 | ) | | | (115 | ) | | | 168 | |
Election commitments4 | | | — | | | | (43 | ) | | | 103 | | | | 182 | |
Measures5 | | | 314 | | | | (558 | ) | | | (763 | ) | | | (847 | ) |
Net flows from PNFC and PFC Sector entities6 | | | 181 | | | | 474 | | | | 99 | | | | (542 | ) |
Australian Government funding revisions7 | | | 2 | | | | (528 | ) | | | 226 | | | | 625 | |
Other parameter adjustments8 | | | 205 | | | | 166 | | | | 56 | | | | (71 | ) |
2015-16 Budget net operating balance | | | 962 | | | | 1,213 | | | | 2,226 | | | | 2,132 | |
Notes:
| 1. | Numbers may not add due to rounding. Numbers indicate impact on the operating balance. A number in brackets indicates a negative impact on the operating balance. |
| 2. | Represents parameter adjustments to taxation revenue. |
| 3. | Represents movements in revenue, expense and capital for natural disaster restoration. Largely represents the State’s cost of damage from Tropical Cyclone Marcia and revisions to expected reimbursements. |
| 4. | Represents the net impact of election commitments on the operating balance. This number is lower than in Budget Paper 4 – Budget Measures as Budget Paper 4 also incorporates capital expenditure. |
| 5. | Reflects the value of Government decisions since the 2014-15 MYFER, excluding election commitments. This number is lower than in Budget Paper 4 – Budget Measures as it excludes measures funded by the Australian Government and funds held centrally for these measures. |
| 6. | Represents revisions to dividends and tax equivalent payments from, and community service obligation and Transport Service Contract payments to, Public Non-Financial Corporations and Public Financial Corporations. |
| 7. | Represents the net impact of funding provided by the Australian Government primarily for Specific Purpose Payments and National Partnership payments (mainly for transport infrastructure). |
| 8. | Refers to adjustments largely of a non-policy nature, primarily changes in interest paid on borrowings, depreciation, growth funding, swaps, deferrals and administered revenue, as well as changes in expenses resulting from Australian Government funding decisions. |
11
Budget Strategy and Outlook 2015-16
| 1.2.2 | Natural Disaster Relief and Recovery Arrangements |
The timing of revenue and expenditure in relation to natural disasters continues to significantly impact Queensland’s budget position. Table 1.4 outlines the impact of natural disaster arrangements on Queensland’s net operating balance.
| Table 1.4 | Impact of Natural Disaster Relief and Recovery Arrangements funding on the net operating balance1 |
| | | | | | | | | | | | | | | | | | | | |
| | | 2014-15 | | | 2015-16 | | | 2016-17 | | | 2017-18 | | | 2018-19 | |
| | | $ million | | | $ million | | | $ million | | | $ million | | | $ million | |
Published net operating balance | | | 962 | | | | 1,213 | | | | 2,226 | | | | 2,132 | | | | 1,327 | |
less Disaster revenue | | | 1,163 | | | | 1,106 | | | | 245 | | | | 200 | | | | — | |
add Disaster expenses | | | 750 | | | | 496 | | | | 278 | | | | 32 | | | | — | |
Underlying net operating balance | | | 549 | | | | 603 | | | | 2,259 | | | | 1,964 | | | | 1,327 | |
Disaster related capital2 | | | 469 | | | | 197 | | | | 10 | | | | — | | | | — | |
Notes:
| 1. | Numbers may not add due to rounding. |
| 2. | Excludes loans provided through the State. |
The cost of all disasters is $2.232 billion over the period 2014-15 to 2017-18, of which the estimate of the NDRRA-eligible cost of Tropical Cyclone Marcia is $577 million. The total expenditure across the period is $343 million greater than in the 2014-15 MYFER, with the additional cost of Tropical Cyclone Marcia partly offset by downward revisions to the cost of previous events.
Changes to the expected timing of Australian Government reimbursements for previous disasters has brought revenue forward from 2015-16 into 2014-15. However, revenue across 2016-17 and 2017-18 is projected to be $363 million greater than forecast in MYFER, primarily because of revisions to the quantum and timing of claims.
| 1.2.3 | Cash flows and balance sheet |
General Government Sector
Cash surplus/(deficit)
The General Government Sector is expected to record a cash deficit in 2014-15 of $487 million, compared to a $2.434 billion deficit forecast in the MYFER. The smaller than expected cash deficit primarily reflects higher operating receipts and reduced recurrent and capital expenditure.
A cash deficit of $584 million is expected for the General Government Sector in 2015-16, improving to a surplus of $132 million in 2016-17 before returning to modest cash deficits in each of the following years. Across the period 2015-16 to 2018-19, cash deficits equate to 8% of purchases of non-financial assets.
12
Budget Strategy and Outlook 2015-16
Capital purchases
The State’s 2015-16 capital program comprises $8.574 billion of capital purchases ($404 million above the 2014-15 estimated actual) and $1.531 billion of capital grants. Budget Paper 3 – Capital Statement provides details of budgeted 2015-16 capital outlays by portfolio.
Within the General Government Sector, purchases of non-financial assets (capital spending) in 2014-15 are estimated to be $4.987 billion. This is $916 million less than forecast in the MYFER, largely due to a range of deferrals associated with transport and health infrastructure.
General Government Sector capital purchases of $5.374 billion are budgeted for 2015-16, $715 million less than the $6.089 billion forecast in the 2014-15 MYFER. This primarily relates to the deferral of Commonwealth-funded transport infrastructure, consistent with the 2015-16 Commonwealth Budget.
Over the period 2015-16 to 2018-19, purchases of non-financial assets in the General Government Sector of $23.182 billion are planned.
Borrowings
Gross borrowings (the stock of borrowings outstanding as stated in the Balance Sheet) of $43.268 billion at 30 June 2015 are $2.533 billion less than forecast in the 2014-15 MYFER and $4.873 billion less than forecast in the 2014-15 Budget. The significant reduction since MYFER is due to the lower cash deficit and an improved utilisation of cash balances across the General Government Sector.
A net borrowing repayment of $5.514 billion is budgeted for 2015-16, with the $7.5 billion achieved from the Debt Action Plan being partly offset by lower net cash inflows from operating activities, driven by the reduction in royalty forecasts.
A further net borrowing repayment of $182 million is projected in 2016-17, driven by the Debt Action Plan. Net borrowing requirements are modest across the remainder of the forward estimates, ensuring that the benefits of the reduction in debt resulting from the Debt Action Plan are maintained, particularly in terms of the debt to revenue ratio, as demonstrated in Table 1.5.
| Table 1.5 | General Government Sector gross borrowings as a proportion of revenue |
| | | | | | | | | | | | | | | | | | | | |
| | | 2014-15 | | | 2015-16 | | | 2016-17 | | | 2017-18 | | | 2018-19 | |
| | | Est. Act. | | | Forecast | | | Projection | | | Projection | | | Projection | |
| | | $ million | | | $ million | | | $ million | | | $ million | | | $ million | |
Gross borrowings | | | 43,268 | | | | 38,151 | | | | 38,818 | | | | 39,532 | | | | 40,724 | |
Revenue | | | 49,578 | | | | 51,186 | | | | 54,010 | | | | 55,486 | | | | 55,748 | |
Borrowings/revenue ratio | | | 87 | % | | | 75 | % | | | 72 | % | | | 71 | % | | | 73 | % |
General Government Sector borrowings are expected to be $2.544 billion lower in 2018-19 than in 2014-15. This represents the first budgeted reduction in General Government Sector borrowings across the forward estimates period since 1999-2000.
13
Budget Strategy and Outlook 2015-16
Chart 1.3 compares the 2015-16 borrowing projections with those in the 2014-15 MYFER. The chart also demonstrates that General Government Sector borrowings are expected to be substantially lower in 2018-19 than in 2014-15.
| Chart 1.3 | General Government Sector borrowings |
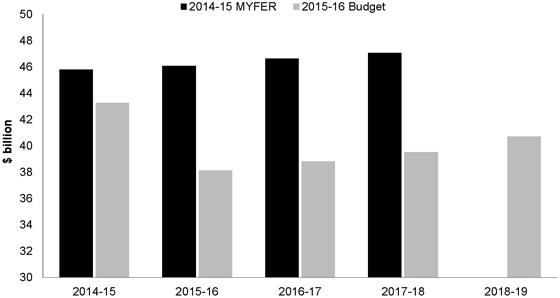
Table 1.6 identifies that General Government Sector borrowings are estimated to have peaked at $43.268 billion in 2014-15. In comparison, the 2014-15 Budget projected General Government Sector borrowings would reach $48.421 billion in 2017-18, with the 2014-15 MYFER projecting borrowings of $47.072 billion.
| Table 1.6 | Revisions to General Government Sector borrowings |
| | | | | | | | | | | | | | | | |
| | | 2014-15 | | | 2015-16 | | | 2016-17 | | | 2017-18 | |
| | | $ million | | | $ million | | | $ million | | | $ million | |
2014-15 Budget | | | 48,141 | | | | 48,023 | | | | 48,216 | | | | 48,421 | |
2014-15 MYFER | | | 45,801 | | | | 46,097 | | | | 46,630 | | | | 47,072 | |
2015-16 Budget | | | 43,268 | | | | 38,151 | | | | 38,818 | | | | 39,532 | |
Public Non-Financial Corporations Sector
The Public Non-Financial Corporations (PNFC) Sector is comprised of the State’s commercial entities, such as those that operate in the energy, transport and water industries. Further detail on the PNFC Sector is provided in Chapter 7.
14
Budget Strategy and Outlook 2015-16
The PNFC Sector is expecting net borrowings of $826 million in 2014-15, an increase from the $651 million 2014-15 MYFER estimate, largely reflecting higher than expected cash holdings in the sector at 30 June 2015. Gross borrowings in the PNFC Sector are estimated to have been $32.268 billion at 30 June 2015, somewhat above the MYFER estimate of $31.752 billion.
Borrowings in this Sector are expected to increase to $38.078 billion in 2018-19, with the increase partly attributable to the Government’s decision to increase the targeted gearing ratios of the energy network businesses.
Non-Financial Public Sector
The Non-Financial Public (NFP) Sector is the combination of the General Government and PNFC Sectors, with transactions between these sectors being eliminated.
Gross borrowings of $75.535 billion are estimated at 30 June 2015 in the NFP Sector, $2.018 billion less than the 2014-15 MYFER estimate as a result of the improvement in the General Government Sector. By 2017-18, borrowings are expected to reach $77.119 billion, $2.673 billion less than projected in the 2014-15 MYFER, as demonstrated in Chart 1.4.
| Chart 1.4 | Non-Financial Public Sector gross borrowings |
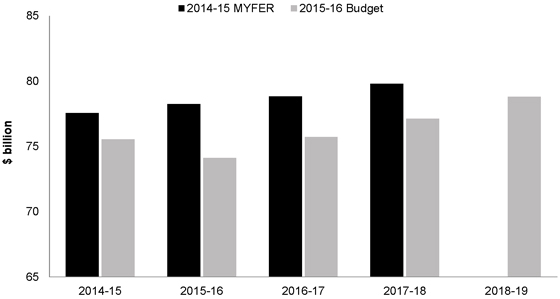
15
Budget Strategy and Outlook 2015-16
Table 1.7 identifies the revisions to NFP Sector borrowings since the 2014-15 Budget.
| Table 1.7 | Revisions to Non-Financial Public Sector borrowings |
| | | | | | | | | | | | | | | | |
| | | 2014-15
$ million | | | 2015-16
$ million | | | 2016-17
$ million | | | 2017-18
$ million | |
2014-15 Budget | | | 79,956 | | | | 80,619 | | | | 81,234 | | | | 82,070 | |
2014-15 MYFER | | | 77,553 | | | | 78,241 | | | | 78,840 | | | | 79,792 | |
2015-16 Budget | | | 75,535 | | | | 74,113 | | | | 75,714 | | | | 77,119 | |
The NFP Sector debt to revenue ratio is estimated at 136% in 2014-15 (down from 140% estimated at MYFER). This ratio is forecast to decline to 123% in 2017-18, compared with a ratio of 126% projected at MYFER, as shown in Chart 1.5.
| Chart 1.5 | Non-Financial Public Sector debt to revenue ratio |
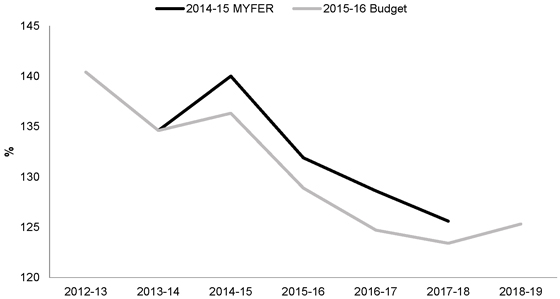
Purchases of non-financial assets (capital spending) of $8.170 billion is estimated in the NFP Sector in 2014-15, $1.159 billion less than the 2014-15 MYFER estimate. This decrease is largely due to deferred capital expenditure particularly in the areas of transport and health as well as reductions in the capital program of the PNFC Sector.
Over the period 2015-16 to 2018-19, purchases of non-financial assets in the NFP Sector of $35.4 billion are planned.
16
Budget Strategy and Outlook 2015-16
In the lead-up to the January 2015 Election, the Government set out five fiscal principles for the responsible and measured management of the State’s finances. Following consideration of the Review of State Finances, prepared by Queensland Treasury, the Government has refined the principles that relate to General Government Sector debt and the size of the net operating surplus. These refinements are intended to ensure the fiscal principles present a consistent strategy to underpin the development of the State Budget and financial decision-making.
Fiscal principles
Principle 1 – Target ongoing reductions in Queensland’s relative debt burden, as measured by the General Government debt to revenue ratio
The Government has consistently identified that its primary focus is on managing the debt of the General Government Sector, which must be serviced from General Government Sector revenues such as taxes (either state or federal), charges and royalties. In contrast, the debt of government-owned corporations is serviced from the operating cashflows of these businesses.
In managing General Government Sector debt, a debt to revenue ratio is a key measure of the sustainability of a jurisdiction’s debt levels. With Queensland’s General Government Sector debt to revenue ratio currently higher than that of other jurisdictions, it is important to seek ongoing reductions in the ratio to continue to improve the State’s fiscal sustainability.
Queensland’s debt to revenue ratio is expected to have peaked at 91% in 2012-13 (compared with a peak of 100% expected in 2013-14 in the 2014-15 Budget and 93% in 2014-15 projected in the 2014-15 MYFER). This ratio is expected to fall substantially in 2015-16, to 75%, as a result of the Debt Action Plan, with the improvement maintained across the forward estimates such that the ratio is projected at 73% in 2018-19, as shown in Chart 1.6.
17
Budget Strategy and Outlook 2015-16
| Chart 1.6 | General Government Sector debt to revenue ratio |
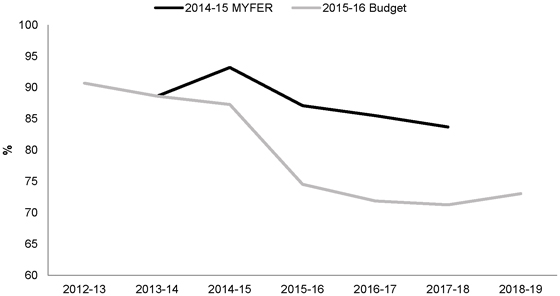
Principle 2 – Target net operating surpluses that ensure any new capital investment in the General Government Sector is funded primarily through recurrent revenues rather than borrowing
Consistent with the position in other states and territories, the Queensland Government considers that the net operating balance is the appropriate measure of the State’s annual operating position. Further, the Government recognises that the size of the operating surplus must be large enough that recurrent revenues, rather than borrowings, are the primary funding source for capital investment in the General Government Sector.
This was a significant factor in the position the Government took to the January 2015 election of more than offsetting all election commitments with reprioritisations and specific measures, providing an overall improvement in the net operating balance.
The most direct way of identifying the sources of funding of capital investment is in the General Government Sector Cash Flow Statement (Table 8.7). This Statement identifies that net cash inflows from operating activities equate to 83% of the funding required for the 2015-16 capital program. Across the period 2015-16 to 2018-19, this proportion fluctuates between 77% and 99%, with an average of 88% of capital purchases funded from net operating cashflows as shown in Chart 1.7.
18
Budget Strategy and Outlook 2015-16
| Chart 1.7 | General Government Sector net operating cashflow as a proportion of capital expenditure |
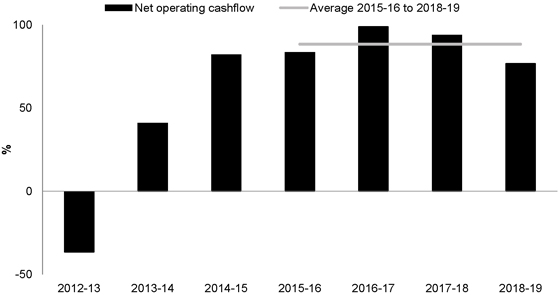
Principle 3 – The capital program will be managed to ensure a consistent flow of works to support jobs and the economy and reduce the risk of backlogs emerging
The General Government Sector capital program peaked in 2009-10, reflecting a significant State infrastructure program bolstered by the Australian Government’s stimulus program in response to the Global Financial Crisis. In the 2014-15 MYFER, the capital program was expected to continue to decrease across the forward estimates.
While the value of the capital program can fluctuate across individual years, due to the lumpy nature of large projects and the timing of Commonwealth-funded projects, the 2015-16 Budget provides for an increase in General Government Sector capital purchases from $4.987 billion estimated in 2014-15 to an average of $5.8 billion across 2015-16 to 2018-19.
Principle 4 – Maintain competitive taxation by ensuring that General Government Sector own-source revenue remains at or below 8.5% of nominal gross state product, on average, across the forward estimates
Government has a clear role in providing an economic environment that supports business and jobs growth and does not place undue strain on households. In addition to measures of interstate tax competitiveness (as discussed in Chapter 3), there are a range of other own-source revenues, such as user charges and royalties, which are also relevant for businesses and households.
19
Budget Strategy and Outlook 2015-16
General Government Sector own-source revenue is forecast at 8.1% of nominal gross state product in 2015-16 and an average of 7.7% across the period 2015-16 to 2018-19.
Principle 5 – Target full funding of long term liabilities such as superannuation and WorkCover in accordance with actuarial advice
Consistent with the long-standing practice of successive governments, the Queensland Government is committed to ensuring that the State sets aside assets, on an actuarially determined basis, to meet long term liabilities such as superannuation and WorkCover.
As a result of strong investment returns in financial markets in recent years, the value of the assets held against superannuation liabilities significantly exceeds the value of those liabilities. As set out in the Debt Action Plan, the Government intends to suspend making further investment of employer contributions against superannuation liabilities for five years. Actuarial advice confirms that the current funding position accommodates this suspension.
As at 30 June 2014, the most recently available assessment, the WorkCover scheme was fully funded.
20
Budget Strategy and Outlook 2015-16
| 1.4 | Achievement of fiscal principles |
Table 1.8 demonstrates that the 2015-16 Budget projections are consistent with achieving the Government’s fiscal principles.
| Table 1.8 | The fiscal principles of the Queensland Government |
| | | | | | | | | | | | |
Principle | | Indicator | |
| | | General Government Debt to Revenue Ratio | |
| | | | | | 2014-15 MYFER
% | | | 2015-16 Budget
% | |
Target ongoing reductions in Queensland’s relative debt burden, as measured by the General Government debt to revenue ratio | | | 2014-15 | | | | 93 | | | | 87 | |
| | | 2015-16 | | | | 87 | | | | 75 | |
| | | 2016-17 | | | | 86 | | | | 72 | |
| | | 2017-18 | | | | 84 | | | | 71 | |
| | | 2018-19 | | | | n/a | | | | 73 | |
| |
| | | General Government Operating Cashflows as a
proportion of the Capital Program | |
| | | | | | 2014-15 MYFER
% | | | 2015-16 Budget
% | |
Target net operating surpluses that ensure any new capital investment in the General Government Sector is funded primarily through recurrent revenues rather than borrowing | | | 2014-15 | | | | 53 | | | | 82 | |
| | | 2015-16 | | | | 105 | | | | 83 | |
| | | 2016-17 | | | | 113 | | | | 99 | |
| | | 2017-18 | | | | 112 | | | | 94 | |
| | | 2018-19 | | | | n/a | | | | 77 | |
| |
| | | General Government Capital Program | |
| | | | | | 2014-15 MYFER
($ million) | | | 2015-16 Budget
($ million) | |
The capital program will be managed to ensure a consistent flow of works to support jobs and the economy and reduce the risk of backlogs emerging | | | 2014-15 | | | | 5,903 | | | | 4,987 | |
| | | 2015-16 | | | | 6,089 | | | | 5,374 | |
| | | 2016-17 | | | | 5,768 | | | | 5,832 | |
| | | 2017-18 | | | | 5,496 | | | | 6,125 | |
| | | 2018-19 | | | | n/a | | | | 5,851 | |
| |
| | | General Government own-source revenue to GSP | |
| | | 2015-16: | | | | 8.1 | % |
Maintain competitive taxation - own-source revenue to remain at or below 8.5% as a proportion of nominal gross state product | |
| Average across the
forward
estimates: |
| | | 7.7 | % |
Target full funding of long term liabilities such as superannuation and WorkCover in accordance with actuarial advice | |
| As at last actuarial review (released
June 2014), accruing
superannuation liabilities were
fully funded. The State Actuary
reviews the scheme every three
years. The WorkCover scheme
was fully funded as at 30 June
2014. |
|
21
Budget Strategy and Outlook 2015-16
| 2 | Economic performance and outlook |
Features
| • | | Economic growth and labour market conditions in Queensland continue to be influenced by the transition from the historic surge in resources investment towards growth driven by the household and trade sectors. Reflecting this, following two years of subdued outcomes, growth in Queensland gross state product (GSP) is forecast to strengthen to 4 1⁄2% in both 2015-16 and 2016-17, driven by the surge in liquefied natural gas (LNG) exports. |
| • | | The global and national economic outlook has softened over the past year. This has prompted the Reserve Bank of Australia (RBA) and central banks in key Queensland export markets, such as China, Japan and Korea, to support growth by easing monetary policy. |
| • | | A more subdued global outlook, combined with stronger global supply, has contributed to sharp declines in world commodity prices, including for coal – the State’s single largest export – and oil (which the price of Queensland’s LNG exports is linked to). |
| • | | While tempered by lower A$ exchange rates, weaker commodity prices have flowed through to the Queensland domestic economy via several channels. In particular, lower returns have seen coal producers cut operating costs to sustain profitability, weakened prospects for new investment in the sector, and resulted in softer household income growth. |
| • | | Slower income growth, subdued labour market conditions and ongoing consumer caution suggest growth in household consumption will remain below average over the forecast period, despite lower domestic interest rates and improvements in household wealth. |
| • | | With investment outside the resources sector taking longer to recover than expected, the step-down in LNG construction will result in declines in business investment in both 2014-15 and 2015-16, before returning to a more sustainable growth path from 2016-17 onwards. |
| • | | Lower interest rates, solid house price growth and rising investor interest are driving a sustained recovery in dwelling investment, particularly in medium-to-high density housing. |
| • | | With the long-anticipated growth boost from LNG exports now expected to be spread across 2015-16 and 2016-17, and imports falling due to the step-down in investment, the trade sector will be a key driver of growth in these years. |
| • | | Queensland’s overseas tourism exports are also expected to grow at a healthy pace in coming years, reflecting increased outbound tourism from China, the rising popularity of working holidays in the wider Asian tourism market and lower A$ exchange rates. |
| • | | Employment growth slowed to 0.5% in 2014-15, with weak household income growth constraining jobs growth in labour-intensive service industries and lower commodity prices and ongoing drought impacting the mining and agriculture industries respectively. |
| • | | Looking ahead, as the full impact of the Government’s employment measures flow through and the domestic economy strengthens, labour market conditions are expected to improve. |
| • | | Employment growth is expected to improve from a low base, reflecting the forecast acceleration in dwelling investment and the lower A$ improving the competitiveness of services export sectors such as tourism and education. |
| • | | A modest recovery in employment is expected to see the unemployment rate remain around 6 1⁄2% over the next two years, before easing to 6% by 2018-19 as domestic activity strengthens. |
22
Budget Strategy and Outlook 2015-16
| 2.1.1 | International conditions |
Global economic conditions deteriorated over the past year and forecasts for growth have been downgraded. While long-term bond yields in most major economies have risen in recent months, they remain somewhat lower than a year earlier, particularly in Europe, where deflationary pressures have emerged. Further, long-term forecasts for industrial production in Queensland’s major export markets have been substantially downgraded (see Chart 2.1). Reflecting weaker global demand and increased supply, commodity prices, including those important to Queensland, have declined substantially. Meanwhile, the sharp decline in crude oil prices since September 2014 is expected to provide some offsetting impetus to net importers of oil.
| Chart 2.1 | Industrial production growth forecasts, 2013 to 2019 |
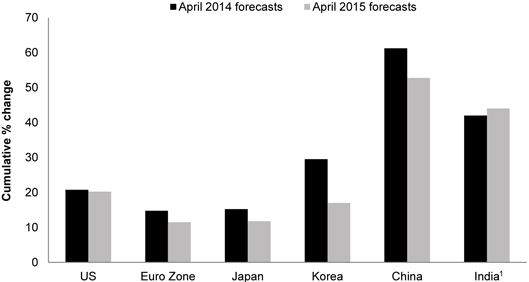
Note:
| 1. | India’s industrial production growth profile is on its fiscal year basis (April to March). |
Source: Consensus Economics.
23
Budget Strategy and Outlook 2015-16
Policy settings in major economies remain remarkably accommodative and the response to potential changes in monetary conditions over the period ahead, particularly in the US, will be a key determinant of global economic conditions. The outcome of negotiations between Greece and its creditors remain uncertain at the time of printing. Failure to reach a lasting agreement on debt refinancing will have significant implications for Greece’s economy and potentially the fragile Euro Zone recovery.
Economic growth in Queensland’s major trading partners is expected to be 4% for 2015, slightly stronger than the 3.7% recorded for 2014, but still below pre-Global Financial Crisis rates. Growth is forecast to improve to 4 1⁄4% in 2016, largely due to stronger forecast growth for Japan, the State’s second largest trading partner. Although uncertainties remain around its implementation, a second consumption tax increase in Japan is scheduled for April 2017 and this is expected to pull consumption spending forward into 2016. Major trading partner growth is forecast to subsequently moderate due to slower growth in China, India and Japan (see Table 2.1).
| Table 2.1 | Queensland’s major trading partners’ economic outlook1 |
| | | | | | | | | | | | | | | | | | | | | | | | |
| | | Actual | | | Forecasts | |
| | | 2014 | | | 2015 | | | 2016 | | | 2017 | | | 2018 | | | 2019 | |
Major trading partners | | | 3.7 | | | | 4 | | | | 4 1⁄4 | | | | 3 3⁄4 | | | | 3 3⁄4 | | | | 3 3⁄4 | |
Non-Japan Asia | | | 5.6 | | | | 5 1⁄2 | | | | 5 3⁄4 | | | | 5 1⁄2 | | | | 5 1⁄4 | | | | 5 1⁄4 | |
China | | | 7.4 | | | | 7 | | | | 6 3⁄4 | | | | 6 1⁄2 | | | | 6 1⁄2 | | | | 6 1⁄4 | |
India2 | | | 7.3 | | | | 7 3⁄4 | | | | 8 | | | | 7 1⁄2 | | | | 7 1⁄2 | | | | 7 1⁄2 | |
Japan | | | -0.1 | | | | 1 | | | | 1 3⁄4 | | | | 3⁄4 | | | | 1 | | | | 1 | |
Europe | | | 1.3 | | | | 2 | | | | 2 | | | | 1 3⁄4 | | | | 1 3⁄4 | | | | 1 3⁄4 | |
US | | | 2.4 | | | | 2 1⁄4 | | | | 2 3⁄4 | | | | 2 1⁄2 | | | | 2 1⁄2 | | | | 2 1⁄2 | |
Notes:
| 1. | Annual % change. Decimal point figures indicate an actual outcome. |
| 2. | India’s economic growth profile is on its fiscal year basis (April to March). |
Sources: Consensus Economics and Queensland Treasury.
The performance of the US economy has significant flow-on effects to growth prospects for Queensland’s larger export markets, despite it being a relatively small direct trading partner. While recent severe weather conditions temporarily slowed growth in March quarter 2015, the outlook for the US economy has strengthened over the past six months.
The US Federal Reserve (the Fed) has made significant purchases of US Treasury and mortgage-backed securities since the Global Financial Crisis and the value of assets held on its balance sheet is large by historical standards. While the third phase of the quantitative easing program (QE3, which began in September 2012) was halted in October 2014, monetary policy in the US remains historically accommodative. Implications of an increase in official interest rates and the eventual reduction in assets held on the Fed’s balance sheet remain uncertain.
24
Budget Strategy and Outlook 2015-16
The US housing sector remains an important element in the recovery, with housing starts improving so far in 2015, albeit from a low base. With increases in real disposable income, personal consumption expenditure is making a moderate contribution to growth. While US business investment has grown solidly over the past few years, the significant decline in the oil price has resulted in recent cut-backs to energy-related investment. Meanwhile, ongoing weakness in corporate profits may pose some uncertainty for the timing of the first interest rate increase, anticipated by many to occur in September 2015.
The US labour market, which has been a key obstacle to tighter monetary policy in recent years, continues to improve. Employment growth is accelerating, the unemployment rate is at its lowest since mid-2008 and growth in real wages appears to be picking up, following four years of lacklustre outcomes. However, the participation rate has declined throughout most of the recovery and across most age cohorts. This suggests some of the improvement in the unemployment rate is a result of potential workers exiting the labour force and, combined with persistent underemployment, is an indication of somewhat softer underlying conditions.
The Chinese economy, Queensland’s largest trading partner, is slowing. The Chinese Government announced a more modest 7% economic growth target for 2015, compared with the 7.4% growth recorded in 2014. The moderation in growth partly reflects the planned transition to a more sustainable growth trajectory, reducing the reliance on investment and exports in favour of consumption. As part of its transition to a more sustainable longer-term growth path, Chinese authorities continue to manage local government debt, address income inequality and target a reduction in pollution. Meanwhile, with house prices continuing to fall nationwide, China’s real estate sector presents an ongoing risk, as does volatility in China’s equity markets.
China’s coal production and imports fell in 2014, and a continuation of this trend may have flow-on effects to Queensland’s coal exports. In recent years, growth in Queensland coal export volumes has been driven by strong demand from China, but this started to slow in 2014-15. In an attempt to counter slower economic growth and moderating inflation, the People’s Bank of China has cut interest rates several times. However, China’s economic growth is still expected to continue to moderate over the majority of the forecast period.
The stock market in China has fallen by over 30% since mid-June 2015, unwinding a large part of the significant gains made over the past year. While Chinese authorities responded with an interest rate cut in late-June, falling share prices have triggered margin calls with investors having to sell other assets to meet these calls. A substantial number of companies have reacted by suspending trading in their shares. The People’s Bank of China is working with the China Securities Finance Corporation in an attempt to steady the stock market and the Government has announced new economic stimulus measures.
Following the April 2014 consumption tax increase, the Japanese economy went into recession, resulting in lower economic output in 2014 than in the previous year. While a depreciation of the Yen has improved its trade performance, Japan’s overall growth trajectory remains unclear and a consistently declining and ageing population has been constraining economic growth. Stimulus packages are yet to boost growth and allay deflationary fears as intended. The Bank of Japan expanded its quantitative easing program in October 2014 and economic growth is expected to improve in 2015 and 2016, before moderating to around 1% per annum for the remainder of the forecast period.
25
Budget Strategy and Outlook 2015-16
Korea’s trade performance is crucial to its economic outlook. With Japan and Korea sharing a similar mix of goods exports, the depreciation of the Yen is adversely impacting Korea’s economic growth prospects. As a result, further stimulus may be needed to boost growth in Korea, whether in the form of fiscal policy or monetary easing.
Economic growth in Europe has been weak and inflation is extremely low, partly reflecting lower oil prices. In an attempt to lift the path of inflation, boost economic growth and reduce the Euro area unemployment rate, the European Central Bank recently expanded its asset purchasing program (targeted at around €1.1 trillion). The expanded liquidity is likely to weigh on the Euro exchange rate, which should assist Euro area export competitiveness. Despite the stimulus, growth in the Euro area is forecast to remain subdued in the near term.
At the time of printing this Budget, negotiations between Greece and its creditors were yet to be finalised. Failure to reach a lasting agreement will have significant implications for Greece’s economy, and potentially the fragile European recovery.
The Australian economy has experienced a significant fall in the prices received for key commodity exports, although its terms of trade remain above the historical average of the last three decades. As is the case with the Queensland economy, the transition from the resources sector investment boom to broader based growth is likely to take longer than originally expected. Australian Treasury forecasts gross domestic product (GDP) to grow 2 3⁄4% in 2015-16, before accelerating to 3 1⁄4% in 2016-17, close to trend growth (see Table 2.2).
After holding the cash rate steady at 2.5% since August 2013, the RBA responded to softness in economic activity by cutting the cash rate, by 25 basis points in both February and May 2015, to an historic low of 2%. The associated fall in the A$ in recent months is expected to support export oriented and import competing businesses. The Australian Treasury also expects lower oil and electricity prices to support growth.
Growth in household consumption started to pick up during 2014-15, assisted by increases in household wealth, and is expected to return to just below trend over the forecast period. Growth in dwelling investment has been strong and is expected to remain so, largely driven by investor rather than owner occupier activity. However, business investment is now forecast to be weaker than previously expected, with recent data suggesting firms in non-mining sectors of the economy are yet to commit to significant additional investment in 2015-16.
As a result, the Australian Treasury forecasts employment growth to remain subdued, with the national unemployment rate expected to rise to 6 1⁄2% by June quarter 2016 and then edge back to 6 1⁄4% by June quarter 2017. In line with below trend economic growth, inflation and wages growth are expected to remain contained.
26
Budget Strategy and Outlook 2015-16
| Table 2.2 | Australian Treasury national economic forecasts |
| | | | | | | | | | | | | | | | |
| | | Actual1 | | | Forecasts | |
| | | 2013-14 | | | 2014-15 | | | 2015-16 | | | 2016-17 | |
GDP2 | | | 2.5 | | | | 2 1⁄2 | | | | 2 3⁄4 | | | | 3 1⁄4 | |
Employment3 | | | 0.7 | | | | 1.8 | | | | 1 1⁄2 | | | | 2 | |
Unemployment rate4 | | | 5.9 | | | | 6.0 | | | | 6 1⁄2 | | | | 6 1⁄4 | |
Inflation5 | | | 3.0 | | | | 1 3⁄4 | | | | 2 1⁄2 | | | | 2 1⁄2 | |
Population6 | | | 1.4 | | | | 1 3⁄4 | | | | 1 3⁄4 | | | | 1 3⁄4 | |
Terms of trade | | | -3.7 | | | | -12 1⁄4 | | | | -8 1⁄2 | | | | 3⁄4 | |
Notes:
| 1. | Calculated using original data unless otherwise indicated. |
| 2. | Per cent change on previous year. Chain volume measure (CVM), 2012-13 reference year. |
| 3. | Seasonally adjusted, through-the-year growth rate to the June quarter. Actual outcome for 2014-15. |
| 4. | Seasonally adjusted rate for the June quarter. Actual outcome for 2014-15. |
| 5. | Through-the-year growth rate to the June quarter. |
| 6. | Through-the-year growth rate to 31 December. |
Sources: ABS 3101.0, 6202.0, 6401.0 and the 2015-16 Australian Government Budget.
Forecasts for the Queensland economy are based on a number of assumptions, including the RBA’s monetary policy stance, the A$ exchange rate, the crude oil price and seasonal conditions over the forecast period:
| • | | The RBA is assumed to maintain an easing bias in 2015-16, with the official cash rate beginning to move gradually upwards in 2016-17. |
| • | | At the time the Budget forecasts were prepared, the A$ was trading at a little below $US0.80. Since then, the A$ has fallen further in response to volatility in financial markets. |
| • | | Crude oil prices have fallen substantially since mid-2014. Consistent with current pricing of futures markets, it is assumed that oil prices will gradually rise over the next few years. |
| • | | Dry seasonal conditions and other adverse weather events relating to the current El Niño weather pattern have been factored into estimates of agricultural exports in 2015-16. Seasonal conditions are assumed to gradually improve from 2016-17. |
This chapter ends with a discussion of the risks related to the global economy, financial markets and other assumptions driving the Queensland outlook.
27
Budget Strategy and Outlook 2015-16
| 2.2.1 | Summary of conditions and outlook |
Queensland economic growth is forecast to strengthen to 4 1⁄2% in both 2015-16 and 2016-17, before moderating to 3 3⁄4% in 2017-18 (see Table 2.3). As a result, growth in Queensland is forecast to be stronger than that of all other states over the forecast period (see Chart 2.2).
| Chart 2.2 | Economic growth, by state1 |
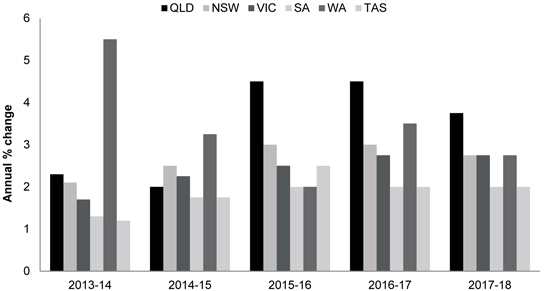
Note:
| 1. | CVM, 2012-13 reference year. 2014-15 are estimates and 2015-16 onwards are forecasts. |
Sources: ABS 5220.0, various state Budgets and Queensland Treasury.
The Queensland economy is now well into a transition period, as the investment phase of the large LNG projects nears completion and production and exports of LNG are underway. However, the ramp up in these exports and the recovery in most other sectors of the domestic economy is expected to take longer than originally anticipated.
Household consumption growth has been subdued in recent years and is estimated to remain so in 2014-15. Sustained low interest rates and rising asset prices have not been sufficient to offset the impact of weak growth in household income. Consumption is also being restrained as households save to rebuild their balance sheets. The recovery in dwelling investment gained further momentum in 2014-15, driven by strong activity in medium-to-high density housing.
28
Budget Strategy and Outlook 2015-16
However, growth in consumption and dwelling investment is not sufficient to compensate for the large step-down in LNG investment, which is driving a fall in business investment and overall state final demand in 2014-15 (see Chart 2.3). The step-down in LNG construction is also driving a significant decline in overseas imports, while overseas exports are experiencing moderate growth. As a result, the contribution from net exports is expected to underpin economic growth of 2% in 2014-15, slightly below the outcome of 2.3% in the previous year.
In 2015-16, a continuation of accommodative monetary policy is expected to support household consumption and dwelling investment. However, business investment will be lower in 2015-16 as it returns to more sustainable levels. As a result, state final demand is forecast to grow only marginally. Recent company guidance suggests the ramp up of LNG exports is expected to be later than originally anticipated, making a more even contribution to economic growth across 2015-16 and 2016-17. Nonetheless, total overseas exports are forecast to grow by a strong 11 3⁄4% in 2015-16. With the fall in business investment driving a further fall in overseas imports, net exports are forecast to drive GSP growth of 4 1⁄2%.
Overseas export growth will continue to be strong in 2016-17, as LNG plants approach full operational capacity. With expected moderate consumption growth, continued robust dwelling investment growth and a small rebound in business investment, GSP growth is forecast to remain solid at 4 1⁄2%. Looking further ahead, GSP growth is expected to be more balanced across its major components. However, there is emerging evidence that population growth in Queensland has moved onto a lower trajectory and so GSP growth is projected to ease back to 3 1⁄4% by 2018-19, below the historical average of around 4%.
Labour market conditions in Queensland are expected to be softer than previously anticipated, and similar to those forecast nationally. With economic growth being driven by less labour intensive sectors of the economy, employment is forecast to grow moderately in 2015-16 and 2016-17. This is expected to keep the unemployment rate elevated through that period, before an improvement in domestic activity sees it ease back to 6% by 2018-19.
| Table 2.3 | Economic forecasts/projections, Queensland1 |
| | | | | | | | | | | | | | | | | | | | | | | | |
| | | Actual | | | Estimate | | | | | | Forecasts | | | | | | Projection | |
| | | 2013-14 | | | 2014-15 | | | 2015-16 | | | 2016-17 | | | 2017-18 | | | 2018-19 | |
Gross state product | | | 2.3 | | | | 2 | | | | 4 1⁄2 | | | | 4 1⁄2 | | | | 3 3⁄4 | | | | 3 1⁄4 | |
Employment2 | | | 1.4 | | | | 0.5 | | | | 1 1⁄4 | | | | 1 3⁄4 | | | | 2 | | | | 2 1⁄4 | |
Unemployment rate2 | | | 6.0 | | | | 6.5 | | | | 6 1⁄2 | | | | 6 1⁄2 | | | | 6 1⁄4 | | | | 6 | |
Inflation | | | 2.8 | | | | 2 | | | | 2 1⁄4 | | | | 2 1⁄2 | | | | 2 1⁄2 | | | | 2 1⁄2 | |
Wage Price Index | | | 2.6 | | | | 2 1⁄2 | | | | 2 1⁄2 | | | | 2 3⁄4 | | | | 3 | | | | 3 1⁄4 | |
Population | | | 1.6 | | | | 1 1⁄2 | | | | 1 3⁄4 | | | | 1 3⁄4 | | | | 1 3⁄4 | | | | 1 3⁄4 | |
Notes:
| 1. | Annual % change, except for unemployment rate. |
| 2. | Actual outcome for 2014-15. |
Sources: ABS 3101.0, 5220.0, 6202.0, 6345.0, 6401.0 and Queensland Treasury.
29
Budget Strategy and Outlook 2015-16
| Chart 2.3 | Contributions to growth in Queensland’s gross state product1 |
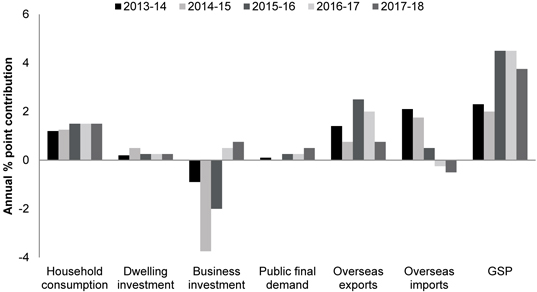
Note:
| 1. | CVM, 2012-13 reference year. 2014-15 are estimates and 2015-16 onwards are forecasts. |
Sources: ABS 5206.0, 5220.0 and Queensland Treasury.
Household consumption
Growth in household consumption spending has been below its historical average in recent years, driven by weak household income growth (see Chart 2.4) and increased saving. As LNG investment has wound down and coal prices fallen, resource related employment has also declined. Drought conditions have affected farm production and incomes, leading to further reductions in agricultural employment. These impacts have flowed through to other sectors of the economy, including the retail sector.
While rising equity and house prices have driven strong growth in nominal household wealth over the last two years, it remains below its long-run trend. There is evidence to suggest that consumption is being restrained as households rebuild wealth in the wake of the Global Financial Crisis, for example, by using income to pay down debt more rapidly than required.
These influences continued in 2014-15, with a subdued labour market, slow wages growth and weaker commodity prices offsetting the benefits of increasing wealth and low interest rates.
Over the forecast period, growth in household spending is expected to pick up, as employment conditions begin to improve and dwelling investment recovers further. However, consumption growth is expected to remain well below its long-term average of over 4%, also reflecting in part the additional impact of slower expected population growth.
30
Budget Strategy and Outlook 2015-16
| Chart 2.4 | Nominal household consumption and employee income, Queensland |
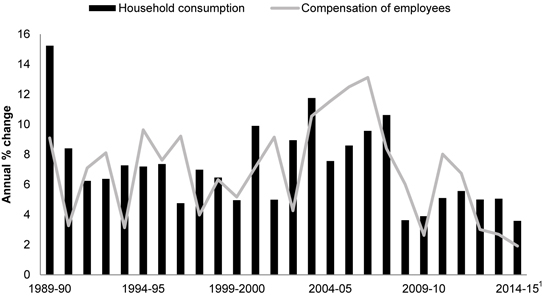
Note:
| 1. | First three quarters of 2014-15. |
Sources: ABS 5206.0 and Queensland Treasury.
Dwelling investment
Dwelling investment in Queensland grew 4.8% in 2013-14, the first increase in six years. This recovery accelerated in 2014-15, supported by record low interest rates and increased activity by investors. However, unlike previous growth phases in Queensland, investment in new dwellings is being driven by strong demand for the construction of medium-to-high density dwellings (flats, units or apartments), particularly in Inner City Brisbane (see Chart 2.5).
A moderation in approvals in mining regions, which had previously benefited from strong demand (particularly for houses) as a result of resource-related investment, is only partly offsetting growth elsewhere in the State. Renovation activity across the State is growing at a softer pace, and is expected to remain subdued, as a result of slower household income growth and a subdued labour market.
Looking ahead, investor interest in Queensland is expected to strengthen as house prices are comparatively low compared to major southern states. Recent large gains in Sydney house prices will prompt interstate and overseas investors to seek more attractive rental yields. As a result, dwelling investment is forecast to continue to grow at a robust rate in 2015-16 and then moderate as the RBA moves towards a more neutral monetary setting.
31
Budget Strategy and Outlook 2015-16
| Chart 2.5 | Dwelling approvals1 by type, Queensland |
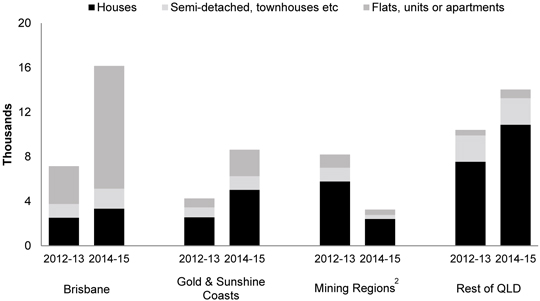
Notes:
| 1. | 12 months to May 2013 and May 2015. |
| 2. | Mining regions are Fitzroy, Mackay, Queensland Outback and Townsville. |
Sources: ABS 8731.0 and Queensland Treasury.
32
Budget Strategy and Outlook 2015-16
Business investment
As construction of the three large LNG projects winds down, business investment in Queensland has fallen from the historically high levels of the past few years. With combined capital expenditure exceeding $60 billion, the unprecedented scale of these projects means that a substantial fall in investment has been anticipated for some time, regardless of the pipeline of projects to follow (see Chart 2.6).
| Chart 2.6 | Non-dwelling construction and work yet to be done, by sector1 |
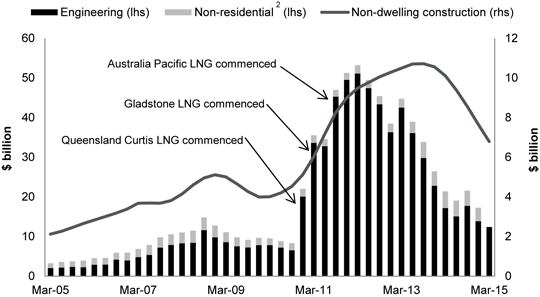
Notes:
| 1. | Nominal, private. Work yet to be done in stacked bar, original. Non-dwelling construction in line, trend. |
| 2. | March quarter 2015 non-residential work yet to be done not available at time of printing. |
Sources: ABS 5206.0, 8752.0 and 8762.0.
Considerable falls in key commodity prices have prompted resource companies to focus on improving productivity of existing operations and to implement cuts to their exploration and capital investment budgets, including the deferral or cancellation of projects.
An anticipated pick-up in non-resource investment has yet to materialise, and a rebound is unlikely in the short term. Subdued household consumption and the downturn in the resources industry are serving to sustain spare capacity created by recent projects in several sectors, including retail, commercial offices and warehouses.
With around 80% of the State currently drought declared, the agricultural sector is also unlikely to contribute to growth in investment.
33
Budget Strategy and Outlook 2015-16
Business investment is expected to fall further in 2015-16, due primarily to the staged completion of the LNG projects. However, as non-resources investment gradually strengthens in line with improving household sector activity, business investment is expected to return to a more sustainable longer-term growth path from 2016-17 onwards.
34
Budget Strategy and Outlook 2015-16
| Table 2.4 | Queensland economic forecasts1, by component |
| | | | | | | | | | | | | | | | | | | | |
| | | Actual
2013-14 | | | Estimate
2014-15 | | | 2015-16 | | | Forecasts
2016-17 | | | 2017-18 | |
Economic output2 | | | | | | | | | | | | | | | | | | | | |
Household consumption | | | 2.1 | | | | 2 | | | | 2 1⁄2 | | | | 2 3⁄4 | | | | 3 | |
Private investment | | | -3.6 | | | | -11 3⁄4 | | | | -6 | | | | 4 3⁄4 | | | | 5 1⁄2 | |
Dwelling investment | | | 4.8 | | | | 9 1⁄4 | | | | 7 | | | | 6 1⁄2 | | | | 4 1⁄2 | |
New and used | | | 7.2 | | | | 15 1⁄2 | | | | 10 | | | | 8 1⁄4 | | | | 5 | |
Alterations and additions | | | 2.0 | | | | 1 1⁄2 | | | | 3 | | | | 4 | | | | 4 | |
Business investment | | | -6.4 | | | | -20 | | | | -13 1⁄4 | | | | 3 1⁄2 | | | | 5 3⁄4 | |
Non-dwelling construction | | | -3.0 | | | | -26 | | | | -16 1⁄2 | | | | 3 1⁄4 | | | | 6 | |
Machinery and equipment | | | -14.0 | | | | -5 | | | | -6 1⁄2 | | | | 4 1⁄4 | | | | 5 1⁄2 | |
Private final demand | | | 0.1 | | | | -2 1⁄2 | | | | 0 | | | | 3 1⁄4 | | | | 3 3⁄4 | |
Public final demand | | | 0.8 | | | | 0 | | | | 1 1⁄4 | | | | 1 1⁄2 | | | | 1 3⁄4 | |
State final demand | | | 0.3 | | | | -2 | | | | 1⁄4 | | | | 3 | | | | 3 1⁄4 | |
Net overseas exports3,4,5 | | | 3 1⁄2 | | | | 2 1⁄2 | | | | 3 | | | | 1 3⁄4 | | | | 1⁄2 | |
Overseas exports of goods and services4 | | | 6 3⁄4 | | | | 2 3⁄4 | | | | 11 3⁄4 | | | | 9 | | | | 3 3⁄4 | |
Overseas imports of goods and services5 | | | -10 1⁄4 | | | | -10 3⁄4 | | | | -3 3⁄4 | | | | 1 3⁄4 | | | | 3 | |
Gross state product | | | 2.3 | | | | 2 | | | | 4 1⁄2 | | | | 4 1⁄2 | | | | 3 3⁄4 | |
Nominal gross state product | | | 2.8 | | | | 4 1⁄2 | | | | 7 | | | | 7 1⁄2 | | | | 6 3⁄4 | |
Other economic measures | | | | | | | | | | | | | | | | | | | | |
Employment6 | | | 1.4 | | | | 0.5 | | | | 1 1⁄4 | | | | 1 3⁄4 | | | | 2 | |
Unemployment rate (%, year-average)6 | | | 6.0 | | | | 6.5 | | | | 6 1⁄2 | | | | 6 1⁄2 | | | | 6 1⁄4 | |
Inflation | | | 2.8 | | | | 2 | | | | 2 1⁄4 | | | | 2 1⁄2 | | | | 2 1⁄2 | |
Wage Price Index | | | 2.6 | | | | 2 1⁄2 | | | | 2 1⁄2 | | | | 2 3⁄4 | | | | 3 | |
Population | | | 1.6 | | | | 1 1⁄2 | | | | 1 3⁄4 | | | | 1 3⁄4 | | | | 1 3⁄4 | |
Notes:
| 1. | Unless otherwise stated, all figures are annual % changes. |
| 2. | CVM, 2012-13 reference year, except nominal GSP. Components not separately reported are other investment (cultivated biological resources, intellectual property products and ownership transfer costs), the balancing item (including interstate trade and inventories) and the statistical discrepancy. |
| 3. | Percentage point contribution to growth in gross state product. |
| 4. | Adjusted to include re-exports and Queensland’s confidential exports (largely raw sugar). |
| 5. | Adjusted for the imports of capital goods for major resource projects. |
| 6. | Actual outcome for 2014-15. |
Sources: ABS 3101.0, 5206.0, 5220.0, 6202.0, 6345.0, 6401.0 and Queensland Treasury.
35
Budget Strategy and Outlook 2015-16
Public final demand
Consistent with the Government’s responsible and measured approach to managing the State’s finances, public final demand (the sum of federal, state and local government consumption and investment) is expected to grow moderately over the forward estimates period.
Overseas exports and imports
The volume of overseas goods exports is expected to grow by 3 3⁄4% in 2014-15, following an 8.1% rise in the previous year. Growth in coal export volumes has been driven by demand from China and, to a lesser extent, India. Meanwhile, exports of base metals are expected to be relatively flat. In the rural sector, drought conditions have driven growth in beef exports as farmers reduce herd sizes, while unfavourable growing conditions have contributed to lower cotton and other crop exports.
Growth in the nominal value of overseas exports is expected to be lower than volume growth, mainly due to falling coal prices. In the first 11 months of 2014-15, unit export prices of hard coking, thermal and semi-soft/PCI coal fell 9.8%, 9.3% and 9.1% respectively compared to the same period a year ago. In contrast, total coal export volumes increased by 5.1% over the same period.
Coal export volumes are forecast to grow moderately from 2015-16 onwards (see Chart 2.7). In China, which has been a significant source of growth for Queensland’s coal exports, the pace of economic growth is expected to be constrained by the ongoing effort to rebalance the economy and reduce pollution. On the supply side, the ramp up of production in a number of Queensland mines will continue to support export growth across the forecast period. However, weaker global demand and increased world supply of coal products is expected to keep coal prices subdued.
The projections of relevant coal parameters are shown in Appendix C.
36
Budget Strategy and Outlook 2015-16
| Chart 2.7 | Queensland coal exports1 |
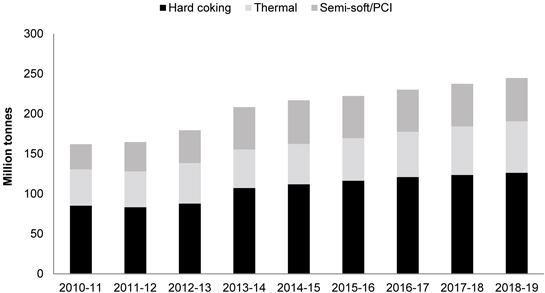
Note:
| 1. | 2014-15 are estimates; 2015-16 onwards are forecasts. |
Sources: ABS unpublished trade data and Queensland Treasury.
While the ramp up of new mines supported base metals exports in 2013-14, a decline in the quality of remaining deposits, prospective closures of depleted mines and the absence of significant new projects is expected to result in a fall in the volume of base metals exports over the forecast period.
The first shipment of LNG from the Queensland Curtis LNG plant was exported in January 2015. This will be followed by the commencement of LNG exports from the Gladstone LNG and Australia Pacific LNG plants towards the end of 2015. Construction and commissioning of these projects has taken longer than previously anticipated, causing delays to the expected commencement of LNG production and, consequently, the ramp up in exports. While expectations for the total export capacity of these projects once fully operational is largely unchanged, their contribution to Queensland’s economic growth is now expected to be more evenly spread across 2015-16 and 2016-17 (see Chart 2.8).
37
Budget Strategy and Outlook 2015-16
| Chart 2.8 | Queensland’s forecast LNG exports |
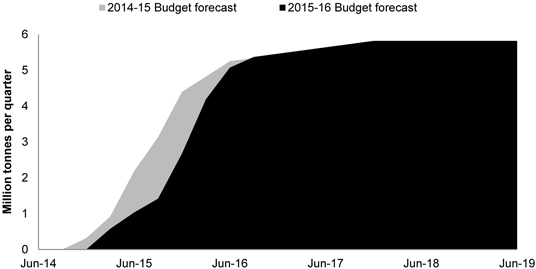
Sources: Company reports and Queensland Treasury.
Beef export volumes increased by 6.8% in the first 11 months of 2014-15, when compared with the same period a year ago. Demand for Australian beef has been supported by a sharp fall in supply in the US, which has led to a rise in export prices over the past year. Combined with ongoing drought, this encouraged producers to increase slaughter rates. However, stock numbers are in decline, and will continue to fall over the next few years unless climatic conditions improve. Lower stock levels are expected to limit the supply of cattle available for slaughter and reduce the volume of beef exported in 2015-16 and 2016-17.
Cotton exports are forecast to fall in 2015-16 as a result of dry seasonal conditions. Subdued prices are expected to result in a continued fall in nominal exports in 2016-17.
Sugar producing regions have been less affected by drought and were not affected by the natural disasters that hindered production in previous years. Moderate growth in exports is expected for 2014-15. However, production is anticipated to increase only marginally in the medium term, reflecting limited capacity to increase the area of plantation.
Overseas tourism exports are estimated to recover in 2014-15, after declining in 2013-14. Moderate improvement in global economic conditions, the lower A$ and the rising popularity of overseas travel by Chinese tourists are expected to drive growth in Queensland’s overseas tourism exports over the forecast period. In addition, the Commonwealth Games, which will be held on the Gold Coast in April 2018, will boost tourism exports in 2017-18.
38
Budget Strategy and Outlook 2015-16
Overseas education exports increased strongly in the first half of 2014-15, driven by a substantial increase in commencements in vocational education and training courses and an increase in higher education enrolments. Australian Government reforms implemented since late 2011 appear to have had a positive impact on education exports and overseas enrolments are expected to continue to grow.
An unwinding of the current high levels of LNG-related imports, as well as a broader decline in business investment outside the LNG sector, is expected to result in lower total goods imports in 2014-15. Weaker household expenditure growth is also expected to constrain imports of consumption goods in that year. As conditions in these sectors improve, Queensland imports are forecast to rise from 2016-17 onwards.
Labour market
Employment growth in Queensland moderated to 0.5% in 2014-15, and has averaged just 0.9% per annum since the Global Financial Crisis. The recent weakness in employment highlights the importance of the Government’s Working Queensland jobs plan, which is outlined in the Government’s Jobs Now, Jobs for the Future paper.
Weak household income growth as a result of the fall in the terms of trade is constraining employment growth in labour intensive service industries such as retail trade. Meanwhile, drought conditions impacting Queensland’s agricultural industry are expected to be sustained by the current El Niño weather pattern.
Employment supported by the construction of major resources projects is expected to continue to decline in 2015-16 as these projects are completed. In an environment of low commodity prices, mining operators have reduced their workforces and continue to target efficiency gains to maintain profitability. This is also having an impact on employment in industries servicing the resources sector, such as professional services and equipment hiring.
The forecast acceleration in Queensland’s economic growth in 2015-16 is expected to be driven largely by LNG exports, which is unlikely to provide a significant boost to employment. LNG production and exports are less labour-intensive than both LNG construction and economic activity more generally. As a result, employment and labour income growth will be more subdued than in other periods of similar economic growth.
Employment growth is expected to improve from a low base, partly reflecting the forecast acceleration in dwelling investment as work on the significant pipeline of medium-to-high density projects is undertaken. Improved competitiveness for trade exposed sectors outside of mining, such as tourism and education, should also support jobs growth.
Further ahead, employment outcomes are forecast to continue to improve as non-resources investment gradually recovers and domestic demand strengthens. Labour market outcomes are also expected to be supported by the roll out of the Government’s $1.6 billion Working Queensland package, which aims to help grow the State’s economy and create real and sustainable jobs for Queenslanders. More details of this package are available in Jobs Now, Jobs for the Future.
39
Budget Strategy and Outlook 2015-16
Queensland’s unemployment rate is forecast to remain around 6 1⁄2% over the next two years. From 2017-18, the unemployment rate is forecast to gradually fall as employment begins to grow faster than population (see Chart 2.9). Queensland’s participation rate is expected to be marginally lower over the period ahead, having already fallen significantly from its peak. The ageing of the population is expected to continue to place downward pressure on the participation rate as more people enter age cohorts that tend to be less reliant on employment related income.
| Chart 2.9 | Labour market, Queensland1 |
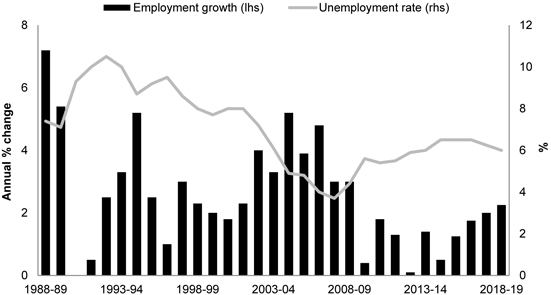
Note:
| 1. | Year-average. 2014-15 are actual outcomes, 2015-16 to 2017-18 are forecasts and 2018-19 are projections. |
Sources: ABS 6202.0 and Queensland Treasury.
Prices and wages
After accelerating to 2.8% in 2013-14, Brisbane consumer price inflation is expected to moderate to 2% in 2014-15. This slowing in headline inflation can be largely explained by two temporary factors. First, a significant fall in global oil prices since mid-2014 led to a sharp decrease in domestic automotive fuel prices. Second, a range of factors canvassed by the Australian Energy Regulator have combined to result in slower growth in electricity prices. Partially offsetting these effects, the cumulative depreciation of the A$ over recent years has led to higher prices for imported goods.
With lower oil prices and slower growth in electricity prices largely impacting 2014-15, a modest acceleration in inflation is forecast for 2015-16. Despite a reduction in the main residential electricity tariff for the typical household in 2015-16, higher prices for imported goods are expected to gradually filter through to retail prices in that year and beyond.
40
Budget Strategy and Outlook 2015-16
Wage growth has moderated over the past couple of years and is currently at an historically low rate. Consistent with ongoing spare capacity in the labour market, little improvement in nominal wage growth is expected in the near term. As employment growth strengthens and the unemployment rate falls, wage growth is expected to pick up.
Population
With the surge in resources investment unwinding and Queensland’s unemployment rate remaining above the national average, Queensland’s annual population growth slowed to 64,000 in 2014. This reflects a decline in net inflows from both overseas and interstate migration (see Chart 2.10).
The slowdown in net overseas migration has also occurred nationally and resulted in a slowing in Australia’s population growth rate. Queensland’s share of the national migration total has also fallen below its long-run average. At the same time, Queensland’s net interstate migration has persisted at historically low levels. Notably, net inflows from New South Wales have declined considerably and there has been a sustained period of net outflows to Victoria for the first time on record.
Looking ahead, national net overseas migration is expected to be subdued, but net overseas migration to Queensland is assumed to pick up towards its long-run average share. Net interstate migration is forecast to recover only slightly in coming years, as soft labour market conditions in Queensland offset the attraction of greater housing affordability in Brisbane relative to Sydney and Melbourne.
Overall, Queensland’s population growth is expected to be 1 1⁄2% in 2014-15, broadly in line with that expected nationally. Population growth in Queensland is then expected to strengthen to around 1 3⁄4% per annum over the remainder of the forecast period, also in line with expected national growth.
41
Budget Strategy and Outlook 2015-16
| Chart 2.10 | Population growth, by component, Queensland |
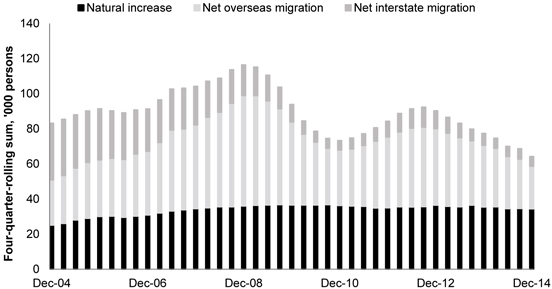
Source: ABS 3101.0.
| 2.2.2 | Risks to the economic outlook |
Internationally, a key risk for the economic outlook is any disruption to the economic recovery in the US and Europe.
In relation to Greece, Australia’s trade and direct financial connections are minor. Consequently, the impact of the Greek debt crisis will only become significant if there are flow-on effects to the Euro Zone as a whole or global financial markets are destabilised. The impact on Australia and Queensland would then depend on how much this affects growth in the US and China. Given the current uncertainties it is difficult to predict the ultimate impact of this crisis.
In Asia, the Chinese Government’s focus on rebalancing growth, consolidating local government debt, addressing corruption and containing pollution means that China’s economic growth may be weaker than currently anticipated. If this is the case, China’s demand for energy and mineral products may weaken, with adverse implications for the Queensland economy, particularly commodity prices.
With the Chinese economy already slowing, the recent substantial correction in the Chinese stock market could further impact the real economy. This could then flow through to other Asian economies with strong links to China, as well as to the Australian economy, and drive further falls in commodity prices.
42
Budget Strategy and Outlook 2015-16
Uncertainty related to the pace of the completion of LNG investment and the transition to the production and export phase, as well as the possibility that non-mining investment remains weaker for longer, present risks to the growth outlook.
The emergence of an El Niño weather pattern means that any relief from the current drought conditions may take longer than previously thought.
Population growth, both nationally and in Queensland, has slowed in recent years. At the national level, this has been driven by a slowdown in net overseas migration. Australian Government forecasts currently imply a moderate recovery in net overseas migration. However, if this does not occur, both national and Queensland population growth could be lower than currently forecast. Further, if Queensland’s share of net overseas migration does not recover toward longer-run average levels, Queensland’s population growth rate may not recover from its current level.
If some of these risks were to eventuate, the forecast recovery in domestic activity and labour market conditions may be slower than currently anticipated.
This heightens the importance of the Government’s $1.6 billion Working Queensland package. The full suite of measures to grow jobs now and jobs for the future is expected to strengthen the labour market and put downward pressure on unemployment. These measures are outlined in the supplementary Jobs Now, Jobs for the Future paper.
43
Budget Strategy and Outlook 2015-16
Features
| • | | The Government has met its commitment to no new taxes, fees and charges in this Budget. |
| • | | Queensland will retain its competitive tax status, with per capita state tax estimated at $2,666 in 2015-16, compared to an average of $3,343 for the other states and territories. |
| • | | Total General Government Sector revenue is estimated to be $49.578 billion in 2014-15, $2.844 billion (or 6.1%) higher than in 2013-14. This is largely attributable to an increase in current grants from the Australian Government (including $941 million of specific purpose payments and $920 million of goods and services tax (GST) revenue) and $862 million in taxation revenue. |
| • | | The revenue outlook is challenging. Total revenue is expected to grow at an average annual growth rate of 3.6% over the period 2013-14 to 2018-19 (or 4.3%, excluding Natural Disaster Relief and Recovery Arrangements (NDRRA) payments). This is significantly less than the 7.9% average growth over the period 2001-02 to 2013-14. |
| • | | Total General Government Sector revenue in 2014-15 is estimated to have been $542 million (or 1.1%) lower than was estimated in the 2014-15 Budget. A major driver of this decrease has been a $762 million reduction in grants from the Australian Government and a $619 million reduction in royalty revenue due to the impact of falling commodity prices, partially offset by higher taxation and dividend revenue. |
| • | | Since the 2014-15 Budget, forecasts for royalty revenue have been downgraded by $4.635 billion over the period 2014-15 to 2017-18. This reflects significant reductions in the expectation for commodity prices, including the average coking coal price being 28.3% lower over the period and oil prices being 30.1% lower over the period. The reduction since the 2014-15 Mid Year Fiscal and Economic Review (MYFER) is $3.186 billion over the comparable period. |
| • | | Total General Government Sector revenue is estimated to be $51.186 billion in 2015-16. The increase of $1.608 billion (or 3.2%) on 2014-15 estimated actual revenue is primarily driven by grants from the Australian Government, including an increase of $1.174 billion in GST revenue. |
| • | | Liquefied natural gas (LNG) exports commenced in 2014-15, with the first shipment of LNG from the Queensland Curtis LNG plant occurring in January 2015. Other proponents are expected to begin exporting during 2015-16, contributing significantly to strong growth in royalty revenue in that year. Coal seam gas royalties are discussed further in Box 3.1. |
| • | | To encourage businesses to employ apprentices or trainees, the Government has introduced a 25% rebate on payroll tax on the wages of each apprentice and trainee employed. This rebate is in addition to apprentice and trainee wages being exempt from payroll tax and is offset against the tax payable on the wages of other employees. |
44
Budget Strategy and Outlook 2015-16
This chapter provides an overview of General Government Sector revenue for the 2014-15 estimated actual outcome, forecasts for the 2015-16 Budget year and projections for 2016-17 to 2018-19.
| Table 3.1 | General Government Sector revenue1 |
| | | | | | | | | | | | | | | | | | | | | | | | | | | | |
| | | 2013-14
Actual
$ million | | | 2014-15
Budget
$ million | | | 2014-15
Est. Act.
$ million | | | 2015-16
Budget
$ million | | | 2016-17
Projection
$ million | | | 2017-18
Projection
$ million | | | 2018-19
Projection
$ million | |
Taxation revenue | | | 11,845 | | | | 12,455 | | | | 12,707 | | | | 12,926 | | | | 13,607 | | | | 14,289 | | | | 15,007 | |
Grants revenue | | | | | | | | | | | | | | | | | | | | | | | | | | | | |
Current grants | | | 19,172 | | | | 20,610 | | | | 20,962 | | | | 21,895 | | | | 23,555 | | | | 24,592 | | | | 24,820 | |
Capital grants | | | 2,583 | | | | 3,433 | | | | 2,411 | | | | 2,660 | | | | 2,744 | | | | 2,385 | | | | 1,241 | |
Sales of goods and services | | | 5,048 | | | | 5,187 | | | | 5,350 | | | | 5,430 | | | | 5,444 | | | | 5,565 | | | | 5,769 | |
Interest income | | | 2,460 | | | | 2,429 | | | | 2,467 | | | | 2,372 | | | | 2,274 | | | | 2,289 | | | | 2,302 | |
Dividend and income tax equivalent income | | | | | | | | | | | | | | | | | | | | | | | | | | | | |
Dividends | | | 1,568 | | | | 1,515 | | | | 1,752 | | | | 1,632 | | | | 1,636 | | | | 1,283 | | | | 1,233 | |
Income tax equivalent income | | | 407 | | | | 633 | | | | 658 | | | | 762 | | | | 800 | | | | 639 | | | | 618 | |
Other revenue | | | | | | | | | | | | | | | | | | | | | | | | | | | | |
Royalties and land rents | | | 2,537 | | | | 2,846 | | | | 2,220 | | | | 2,444 | | | | 2,857 | | | | 3,329 | | | | 3,614 | |
Other | | | 1,114 | | | | 1,013 | | | | 1,051 | | | | 1,065 | | | | 1,093 | | | | 1,116 | | | | 1,146 | |
Total revenue | | | 46,734 | | | | 50,120 | | | | 49,578 | | | | 51,186 | | | | 54,010 | | | | 55,486 | | | | 55,748 | |
Note:
| 1. | Numbers may not add due to rounding. |
| 3.1 | 2014-15 estimated actual |
General Government Sector revenue in 2014-15 is estimated to be $49.578 billion, which is $542 million (or 1.1%) less than the 2014-15 Budget estimate.
Significant variations from the 2014-15 Budget estimates include:
| • | | a $1.035 billion (or 31.1%) decrease in capital grants from the Australian Government largely due to payments for disaster recovery in 2014-15 being lower than estimated (with 2013-14 being higher due to an early payment from the Australian Government) |
| • | | lower royalty revenue, by $619 million (or 23.2%), due to significant decreases in oil prices and coal contract prices |
| • | | a $252 million (or 2.0%) increase in taxation, primarily associated with higher transfer duty receipts. |
45
Budget Strategy and Outlook 2015-16
| 3.2 | 2015-16 revenue by category |
General Government Sector revenue in 2015-16 is estimated to be $51.186 billion, $1.608 billion (or 3.2%) higher than the 2014-15 estimated actual revenue of $49.578 billion. This is largely due to growth of $1.225 billion in grants from the Australian Government and modest increases in royalty and taxation revenue.
The significant increase in grants from the Australian Government is largely due to the $1.174 billion increase in GST. Total NDRRA payments for 2015-16 are estimated at $1.106 billion. After adjusting for natural disaster payments, the underlying growth in revenue is $1.665 billion (or 3.4%) in 2015-16, compared to $3.196 billion (or 7.1%) in 2014-15.
Major sources of General Government Sector revenue in 2015-16 are grants revenue (48.0% of revenue) and taxation revenue (25.3%). Chart 3.1 illustrates the composition of General Government Sector revenue.
| Chart 3.1 | Revenue by operating statement category, 2015-161, 2 |
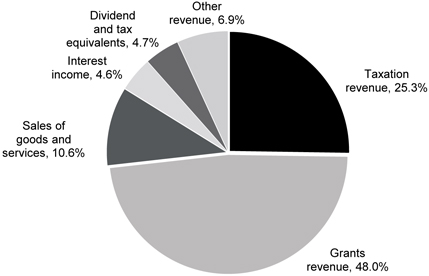
Notes:
| 1. | Numbers may not add due to rounding. |
| 2. | The major component of other revenue is royalties and land rents (4.8% of total revenue). |
Chart 3.2 compares 2015-16 estimates with 2014-15 estimated actuals. The main driver of revenue growth in 2015-16 is increased GST revenue of $1.174 billion.
46
Budget Strategy and Outlook 2015-16
| Chart 3.2 | Revenue by operating statement category for 2014-15 and 2015-16 |

| 3.3 | Queensland’s revenue trends |
Chart 3.3 examines the contribution of the key revenue sources of GST, taxation and royalties to revenue growth. As shown, the primary driver of the growth in these three key revenues in 2015-16 is GST revenue distributed to Queensland by the Australian Government.
47
Budget Strategy and Outlook 2015-16
| Chart 3.3 | Contribution to growth of key revenues1 |
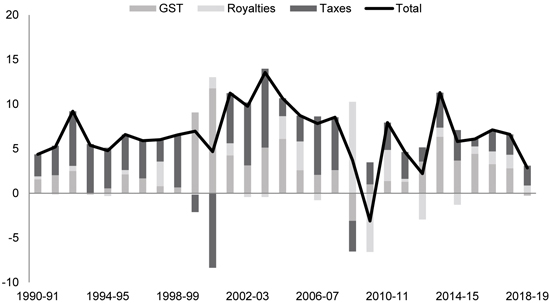
Note:
| 1. | GST, royalties and taxes are annual percentage point contribution to growth of the aggregate of the three categories. Total is the annual % growth in revenues of the aggregate of the three categories. |
Queensland’s GST revenue grew by an average rate of 7.5% across 2001-02 to 2007-08, primarily due to strong growth in national GST collections. Growth in GST was supported by strong growth in household consumption and dwelling investment activity, which were sustained by high levels of consumer confidence and partly funded by increases in household borrowings.
Queensland’s GST revenue is expected to grow by 9.9% in 2015-16 compared to the 2014-15 estimated actual. This is due to the Commonwealth Grants Commission (CGC) assessment that Queensland should receive a higher per capita share of the GST pool in 2015-16 than 2014-15, and growth in the overall GST pool. This reflects the relative weakness in Queensland’s revenue base between 2011-12 and 2013-14 resulting in a higher relativity in 2015-16. Additionally, in its 2015-16 Budget, the Australian Government’s forecasts of total GST collections were revised upwards by $1.570 billion over the period 2014-15 to 2017-18 since the 2014-15 Mid Year Economic and Fiscal Outlook (MYEFO).
The 2015-16 relativity reflects the application of the CGC’s assessment to state budget outcomes from the period 2011-12 to 2013-14. Queensland’s single year relativity for 2013-14, which enters the assessment for the first time is historically high, reflecting short-term factors such as expenses relating to natural disaster events in 2011 and 2012, and strong mining revenue in Western Australia in 2013-14. As GST shares are based on a three year lagged average of relativities, the 2013-14 result will continue to affect Queensland’s GST share up to 2017-18.
48
Budget Strategy and Outlook 2015-16
Further discussion of Queensland’s share of GST is provided in Chapter 6.
Annual growth in transfer duty averaged 22.6% over the seven years to 2007-08, driven by a range of factors including Queensland’s relative affordability of housing, high population growth and the impact of the burgeoning mining sector. This was a key contributor to total taxation growth of 12.1% per annum over this period, with revenue from transfer duty effectively offsetting a number of reductions in other taxes.
Looking forward, the expected average annual transfer duty growth of 6.7% over the period 2013-14 to 2018-19 is modest relative to that experienced between 2000-01 and 2007-08. While low interest rates and a solid economic outlook are expected to support recovery in the property market, this is expected to occur at a gradual pace, particularly in the non-residential sector.
Although transfer duty is expected to have grown by 30.7% in 2014-15, this has been boosted by several extraordinary large business transactions.
Residential turnover has been strong in 2014-15 with investor activity a particular driver, and relatively modest price growth anticipated.
Since the Global Financial Crisis, payroll tax has overtaken transfer duty as the key contributor to Queensland’s tax revenue collections. In 2007-08, these two taxes contributed around $2.5 billion each, but in 2014-15 payroll tax is expected to be $3.8 billion while transfer duty will reach $3.1 billion.
The growth in payroll tax is due to the relatively stable base and relationship to the underlying strength in economic conditions compared with the volatility associated with transfer duty. Slower than historical growth in employment and wages, along with changes in the composition of the payroll tax base (including relatively low growth in the resources sector) is moderating growth.
Hence, payroll tax is expected to grow by 4.0% on average across the period 2013-14 to 2018-19, well below the 9.4% average across the period 1999-2000 to 2013-14.
Royalty revenue grew strongly between 2000-01 and 2007-08, with growth of around 50% in both 2004-05 and 2005-06. In contrast to the other key discretionary revenues, royalty revenues reached a peak in 2008-09, as coal prices had been contracted at record levels prior to the onset of the Global Financial Crisis (see Chart 3.4). Royalty revenue then fell significantly in 2009-10, along with coal contract prices, and has not returned to the levels of 2008-09.
Royalty revenue is estimated to be $619 million lower in 2014-15 than was estimated in the 2014-15 Budget. Although coal export volumes have increased with mining companies pushing for productivity increases, weaker than anticipated coal and oil prices have more than offset this.
49
Budget Strategy and Outlook 2015-16
After falling by 13.7% in 2014-15, royalties are expected to grow by 10.9% in 2015-16, supported by increased LNG export volumes as production ramps up, and a depreciating exchange rate. However, coal prices are expected to remain around their current low levels for the first half of 2015-16, with hard coking coal prices for 2015-16 expected to be around US$36 per tonne (or around 26%) lower than estimated in the 2014-15 MYFER.
Although a gradual recovery in coal prices is expected from early 2016, coking coal prices are forecast to be significantly lower in 2017-18 than they were in the 2014-15 MYFER (see Chart 3.5 below).
Across the forward estimates, a modest recovery in commodity prices, combined with growth in export volumes (especially from LNG) is expected to see royalty revenue pick up.
| Chart 3.4 | Coking coal price |
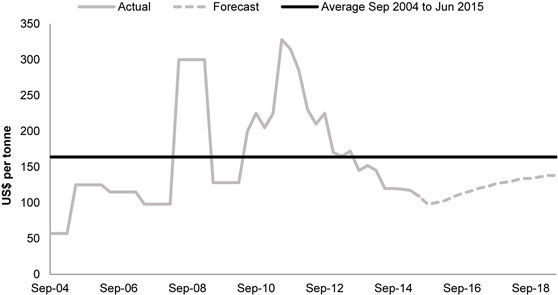
Sources: Consensus Economics and Queensland Treasury.
The exchange rate is assumed to remain flat across the forward estimates to be in line with the International Monetary Fund methodology for estimating fair value.
There is a significant degree of uncertainty associated with estimates of commodity prices and the A$-US$ exchange rate, both of which have significant impacts on royalty revenue. Budget coal price forecasts are generally consistent with the forecasts contained in the Consensus Economics reports issued just prior to finalising the Budget.
Coal price forecasts have been significantly downgraded since the 2014-15 MYFER but as shown in Chart 3.5, this is consistent with revisions in the outlook by Consensus Economics forecasters.
50
Budget Strategy and Outlook 2015-16
| Chart 3.5 | Coking coal price forecasts, by iteration1 |
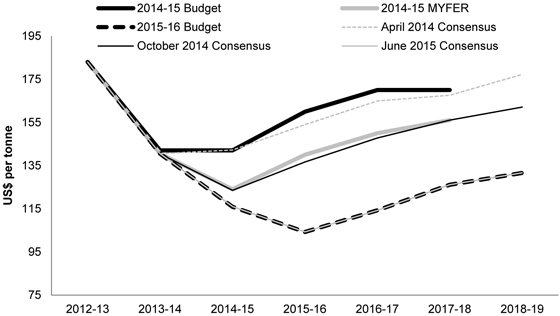
Note:
| 1. | The Consensus Economics estimates represent the most recent releases to the published Budgets and MYFER. |
Sources: Queensland State Budget 2014-15 and 2015-16; 2014-15 MYFER and Consensus Economics Energy and Metals April 2014, October 2014 and June 2015.
As explained in Chapter 2, although the first exports of LNG occurred in January 2015, the construction and commissioning of these projects has taken longer than previously anticipated. This has caused delays to the commencement of LNG production, and consequently, a slower ramp up in coal seam gas (CSG) production and royalty revenue.
Royalties on CSG used as feedstock for LNG production are calculated the same way as other petroleum in that it is based on wellhead value. However, as explained in Box 3.1 there can be additional complexity in determining the CSG value at its first point of disposal. Royalties are expected to be lower in the early stages of production when claimable capital costs are spread across a lower production volume.
While expectations for the total export capacity of these projects once fully operational is largely unchanged, their contribution to royalty revenue is now expected to be more prominent in 2016-17.
51
Budget Strategy and Outlook 2015-16
| Box 3.1 | LNG process and CSG royalties |
Queensland has abundant CSG reserves that are underpinning the development of Queensland’s LNG industry. In coming years, the expansion of CSG production and the LNG industry in Queensland will make an increased contribution to Queensland’s exports, gross state product and royalty revenue.
CSG is extracted from the Bowen and Surat Basins before either being sold on the domestic market, or being piped to plants on Curtis Island, where it is processed into LNG. The LNG is then shipped out of the Port of Gladstone in specially designed LNG tankers. The LNG value chain in Queensland covers the surveying, drilling, extraction, processing and compression of CSG and the transmission of CSG via high pressure pipelines to the Gladstone LNG plants for CSG conversion into a liquid form for storage and shipping.
The three LNG projects on Curtis Island near Gladstone are moving towards full scale production. Queensland Curtis LNG has entered into production, with Santos GLNG and APLNG projects expected to enter production during the second half of 2015. Capital expenditure for construction of these projects is in excess of $60 billion. The partnerships behind the LNG projects include significant international and domestic energy companies. The three LNG processing plants will have a combined capacity of 25.3 million tonnes of LNG per annum.
In Queensland, royalties are calculated at the rate of 10% of the wellhead value of CSG produced as LNG feedstock and for other purposes. Calculating the wellhead value of CSG involves determining the market value of the CSG at the first point of disposal, and then deducting from this the value of certain expenses related to getting the CSG from the wellhead to that point.
Most of the LNG produced by the three Queensland LNG plants will be sold under long-term contracts to customers in Asia with prices linked to oil prices. There is no single global price for LNG. Across different regions there are variations in LNG markets and pricing. In East Asian markets, LNG contracts can be linked to the Japanese Customs-Cleared (JCC) average price for crude oils delivered into Japan. Historically, there is a correlation between the JCC price and the Brent oil price. On this basis, the outlook for the Brent oil price is an important input for the 2015-16 Budget assumptions regarding LNG prices and in turn the expected royalties from CSG.
The expansion of Queensland’s CSG sector in response to the emergence of the LNG industry will have a significant positive effect on Queensland’s royalty revenue. At this early stage of the Queensland LNG industry, forecasting royalties from the CSG used for LNG production faces a number of complexities in relation to several variables, including:
| • | | the timing for the remaining LNG projects to enter production |
| • | | the rate at which the three LNG projects ramp up to full production |
| • | | the outlook for the Brent crude oil price |
| • | | the correlation between the Brent crude oil price and the JCC price |
| • | | the relationship (if any) between the LNG export price and the producer’s initial CSG disposal price |
| • | | the extent and variability of deductions allowed to determine wellhead value. |
52
Budget Strategy and Outlook 2015-16
As discussed above, oil prices are a significant driver of LNG prices and therefore potentially royalties collected. Oil prices have fallen significantly since mid-2014 but consistent with current pricing of futures markets, it is assumed that oil prices will gradually rise over the next few years as the supply of oil starts to rebalance with demand (see Chart 3.6).
While somewhat below the latest Consensus Economics forecasts, the 2015-16 assumptions for the oil price are similar to the current pricing of futures markets, consistent with a conservative approach.
| Chart 3.6 | Revisions to Brent Oil price forecasts1 |
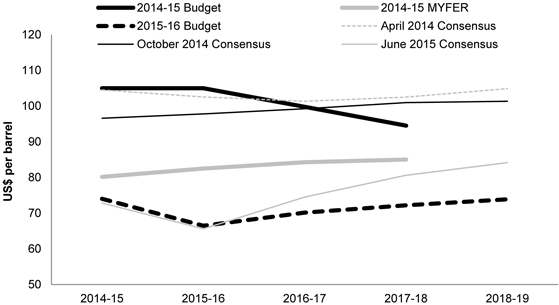
Note:
| 1. | The Consensus Economics estimates represent the most recent releases to the published Budgets and MYFER. |
Sources: Queensland State Budget 2014-15 and 2015-16 and 2014-15 MYFER and Consensus Economics Energy and Metals April 2014 and October 2014 and June 2015.
Further details of the assumptions underlying the royalty estimates, and the impact of changes in the assumptions are contained in Appendix C.
53
Budget Strategy and Outlook 2015-16
| 3.4.1 | Payroll tax rebate for apprentices and trainees |
Since 1 July 2015, in addition to being exempt from payroll tax, the Government is providing a 25% rebate on payroll tax on the wages of eligible apprentices and trainees. This measure, a component of Working Queensland, and an election commitment, recognises that apprenticeships and traineeships provide a great employment pathway, particularly for younger Queenslanders.
| 3.4.2 | Payroll tax threshold |
Queensland’s current payroll tax arrangements are very competitive. Queensland has the highest exemption threshold of any mainland state, and the lowest tax rate of any jurisdiction (see Table 3.2).
The threshold will remain at $1.1 million from 1 July 2015.
| Table 3.2 | Comparison of payroll tax rates and thresholds |
| | | | | | | | | | | | | | | | | | | | | | | | | | | | | | | | |
| | | QLD | | | NSW | | | Vic. | | | SA | | | WA | | | Tas. | | | ACT | | | NT | |
Exemption threshold ($000) | | | 1,100 | | | | 750 | | | | 550 | | | | 600 | | | | 800 | | | | 1,250 | | | | 1,850 | | | | 1,500 | |
Tax rate (%) | | | 4.75 | | | | 5.45 | | | | 4.85 | | | | 4.95 | | | | 5.5 | | | | 6.10 | | | | 6.85 | | | | 5.5 | |
Source: Other jurisdictions State Revenue Offices.
| 3.4.3 | No new or increased taxes, fees or charges |
The Government considers that the business community needs certainty and as such has committed to not increasing current or introducing new taxes, fees or charges.
Already scheduled increases in annual indexation of certain fees and charges will continue. The 3.5% rate of indexation was determined by the former Government, with the associated revenue factored into forward estimates at the time of the 2014-15 MYFER.
Total revenue from taxation is expected to grow by 1.7% in 2015-16, following estimated growth of 7.3% in 2014-15. The strong growth in 2014-15 was partly due to the transfer duty on large commercial transactions. The main components of taxation revenue are shown in Table 3.3.
54
Budget Strategy and Outlook 2015-16
| Table 3.3 | Taxation revenue1 |
| | | | | | | | | | | | | | | | | | | | | | | | |
| | | 2013-14
Actual
$ million | | | 2014-15
Est. Act.
$ million | | | 2015-16
Budget
$ million | | | 2016-17
Projection
$ million | | | 2017-18
Projection
$ million | | | 2018-19
Projection
$ million | |
Payroll tax | | | 3,914 | | | | 3,836 | | | | 3,955 | | | | 4,194 | | | | 4,462 | | | | 4,751 | |
Duties | | | | | | | | | | | | | | | | | | | | | | | | |
Transfer | | | 2,403 | | | | 3,140 | | | | 3,009 | | | | 3,130 | | | | 3,224 | | | | 3,320 | |
Vehicle registration | | | 486 | | | | 488 | | | | 495 | | | | 520 | | | | 546 | | | | 573 | |
Insurance2 | | | 767 | | | | 833 | | | | 882 | | | | 938 | | | | 998 | | | | 1,062 | |
Other duties3 | | | 28 | | | | 44 | | | | 46 | | | | 48 | | | | 51 | | | | 53 | |
Total duties | | | 3,684 | | | | 4,505 | | | | 4,433 | | | | 4,636 | | | | 4,818 | | | | 5,009 | |
Gambling taxes and levies | | | | | | | | | | | | | | | | | | | | | | | | |
Gaming machine tax | | | 608 | | | | 648 | | | | 677 | | | | 707 | | | | 739 | | | | 772 | |
Health Services Levy | | | 51 | | | | 61 | | | | 67 | | | | 73 | | | | 81 | | | | 89 | |
Lotteries taxes | | | 240 | | | | 240 | | | | 247 | | | | 255 | | | | 262 | | | | 270 | |
Wagering taxes | | | 40 | | | | 14 | | | | 14 | | | | 14 | | | | 15 | | | | 15 | |
Casino taxes and levies | | | 83 | | | | 94 | | | | 97 | | | | 100 | | | | 103 | | | | 106 | |
Keno tax | | | 22 | | | | 21 | | | | 21 | | | | 22 | | | | 23 | | | | 23 | |
Total gambling taxes and levies | | | 1,044 | | | | 1,076 | | | | 1,123 | | | | 1,171 | | | | 1,222 | | | | 1,275 | |
Other taxes | | | | | | | | | | | | | | | | | | | | | | | | |
Land tax | | | 986 | | | | 977 | | | | 1,016 | | | | 1,067 | | | | 1,132 | | | | 1,200 | |
Motor vehicle registration | | | 1,543 | | | | 1,583 | | | | 1,654 | | | | 1,728 | | | | 1,806 | | | | 1,887 | |
Emergency Management | | | | | | | | | | | | | | | | | | | | | | | | |
Levy4 | | | 391 | | | | 436 | | | | 461 | | | | 487 | | | | 515 | | | | 544 | |
Guarantee fees | | | 230 | | | | 238 | | | | 232 | | | | 269 | | | | 278 | | | | 283 | |
Other taxes5 | | | 53 | | | | 56 | | | | 53 | | | | 55 | | | | 56 | | | | 58 | |
Total taxation revenue | | | 11,845 | | | | 12,707 | | | | 12,926 | | | | 13,607 | | | | 14,289 | | | | 15,007 | |
Notes:
| 1. | Numbers may not add due to rounding. |
| 2. | Includes duty on accident insurance premiums. |
| 3. | Includes duty on life insurance premiums. |
| 4. | Prior to 1 January 2014 this was the Fire Levy. |
| 5. | Includes the Statutory Insurance Scheme Levy and Nominal Defendant Levy. |
55
Budget Strategy and Outlook 2015-16
Chart 3.7 indicates the composition of estimated State taxation revenue for 2015-16.
| Chart 3.7 | Taxation by tax category, 2015-161 |
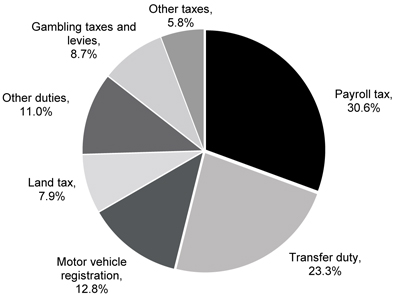
Note:
| 1. | Percentage may not add to 100% due to rounding. “Other duties” includes vehicle registration duty, insurance duty and other minor duties. “Other taxes” includes the Emergency Management Levy, guarantee fees and other minor taxes. |
The largest sources of taxation revenue are payroll tax and transfer duty, which together represent around 54.0% of the State’s total taxation revenue in 2015-16.
Payroll tax (30.6% of total tax revenue in 2015-16) has a stable base with growth driven by the underlying strength of the State economy. In contrast, revenue growth from transfer duty (representing 23.3% of tax revenue) can vary significantly from year to year due to the volatility of both the residential and non-residential segments of the property market.
Land tax represents 7.9% of total tax revenue in 2015-16. While also subject to the volatility of price movements in the property market, this impact is moderated by a relatively stable base and the effect of three year averaging of land values for assessments.
Gambling taxes and levies represent 8.7% of tax revenues in 2015-16. Motor vehicle registration represents 12.8% of total tax revenue.
Other duties, including registration duty and insurance duty represent 11.0% of total tax revenue.
56
Budget Strategy and Outlook 2015-16
Payroll tax is chargeable at a rate of 4.75% when the total yearly Australian taxable wages of an employer, or those of a group of related employers, exceed the exemption threshold of $1.1 million.
The overall payroll tax rate of 4.75% is the lowest in Australia and the exemption threshold of $1.1 million is the highest threshold of any mainland state. Queensland employers with total yearly Australian taxable wages between $1.1 million and $5.5 million also obtain a partial deduction, with the deduction withdrawn at a rate of $1 in every $4 of taxable wages.
Payroll tax collections are estimated to be $3.955 billion in 2015-16, representing growth of 3.1% on the 2014-15 estimated actual. The decline in mining investment has seen a reduction in payroll tax receipts in 2014-15 and this is expected to continue to weigh on 2015-16 as the construction of resources projects is completed.
Payroll tax is now forecast to be $1.191 billion lower over the period 2014-15 to 2017-18 than was estimated in the 2014-15 Budget, reflecting the significant deterioration in employment growth and rising unemployment prior to the 2015 State election. These reductions would have been larger if the previous Government’s scheduled threshold increases had been progressed.
In an environment of low commodity prices, mining operators have reduced their workforce and continue to target efficiency gains to maintain profitability. This is also having an impact on employment in industries servicing the resources sector, such as professional services and equipment hiring.
The forecast acceleration in Queensland’s economic growth in 2015-16 is expected to be driven largely by LNG exports, which are less labour-intensive than both LNG construction and the economy more generally. As a result, employment and labour income growth will be more subdued than in other periods of similar economic growth and payroll tax is expected to grow only moderately. The average annual payroll tax growth of 4.0% remains well below the average of 9.4% from the period 1999-2000 to 2013-14.
The Government has committed to fully fund their election commitments by finding savings or reprioritisations and given the competitiveness of Queensland’s payroll tax regime has decided not to progress the annual threshold increases planned by the previous Government (noting this was previously also deferred in the 2013-14 Budget). The savings from this decision will be utilised to meet election commitments including those focused on jobs and training programs.
From 1 July 2015, in addition to their wages already being exempt from payroll tax, a 25% payroll tax rebate applies to the wages of eligible apprentice and trainees.
Duties are levied on a range of financial and property transactions. The major duties include transfer, vehicle registration and insurance duties.
57
Budget Strategy and Outlook 2015-16
Transfer duty
Transfer duty is charged at various rates on the transfer of real and business property. The Queensland Government offers extensive concessions for the transfer of land where the property is purchased as a home. For example, eligible home buyers pay a 1% concessional rate on dutiable values up to $350,000, rather than the normal schedule of rates between 1.5% and 3.5%. If a first home buyer purchases a property up to $500,000 they will pay no duty, with reduced rates available up to $550,000.
Revenue from transfer duty is expected to be 4.2% lower in 2015-16 than in 2014-15, following strong growth in 2013-14 and 2014-15 that was supported by a number of large commercial transactions. Underlying growth was 12.0% in 2014-15 and is estimated to be 4.4% in 2015-16 once the impact of these large transactions is removed.
The forecasts are based on the expectation that the growth in the number of transactions experienced during 2014-15 will moderate, but that modest improvements in house prices will continue and offset a subdued outlook for non-residential activity.
Over the period 2013-14 to 2018-19 transfer duty is estimated to grow by on average 6.7% per annum. Again this modest rate of growth reflects the strength of 2014-15.
Vehicle registration
Vehicle registration duty is charged at rates of between 2% and 4% of the dutiable value of a motor vehicle on the transfer or initial registration of the motor vehicle, with the rate generally depending on the number of cylinders or rotors of the vehicle.
Revenue from vehicle registration duty is expected to grow by 1.5% in 2015-16, reflecting a modest recovery in the value of sales following a flat 2014-15.
Insurance duty
Insurance duty is charged on contracts of general insurance (for example, insurance for house and contents, vehicle, professional indemnity), life insurance, compulsory third party insurance and accident insurance. Revenue from insurance duty is expected to grow by 5.9% in 2015-16.
| 3.5.3 | Gambling taxes and levies |
A range of gambling activities are subject to State taxes and levies. Total gambling tax and levy collections are estimated to grow by 4.3% in 2015-16, and 4.1% on average over the period 2013-14 to 2018-19.
Land tax is levied on the taxable value of the landowner’s aggregated holdings of freehold land owned in Queensland as at midnight on 30 June each year. The principal place of residence is deducted from this value.
58
Budget Strategy and Outlook 2015-16
Resident individuals are generally liable for land tax if the total taxable value of the freehold land owned by that person as at 30 June is equal to or greater than $600,000. Companies, trustees and absentees are liable for land tax if the total taxable value of the freehold land owned as at 30 June is equal to or greater than $350,000.
Land tax is estimated to grow by 4.0% to $1.016 billion in 2015-16 reflecting a modest recovery in land values. The three year averaging process dilutes the impact on tax collections which is reflected by the moderate annual growth of 4.0% over the period 2013-14 to 2018-19.
| 3.5.5 | Motor vehicle registration |
Motor vehicle registration fees are expected to grow by 4.5% in 2015-16, reflecting an increase in the number of motor vehicles as well as the annual indexation of fees.
| 3.5.6 | Emergency Management Levy |
The Emergency Management Levy revenue, which is used to partly offset the costs of emergency management in Queensland, is expected to grow by 5.7% in 2015-16.
Guarantee fees are revenues collected by Queensland Treasury Corporation (QTC) on behalf of the State and comprise competitive neutrality fees and credit margin fees. These fees promote competitive neutrality between public sector agencies and those in the private sector, and ensure that the benefits accruing from the financial backing of the State (through QTC) are shared between the borrower and the State.
Other taxes represent revenue from taxes such as the Statutory Insurance Scheme levy and the Nominal Defendant levy.
Tax expenditures are reductions in tax revenue that result from the use of the tax system as a policy tool to deliver Government policy objectives. Tax expenditures are provided through a range of concessions, including tax exemptions, reduced tax rates, tax rebates, tax deductions and provisions which defer payment of a tax liability to a future period. Appendix A provides details of tax expenditure arrangements currently provided by the Queensland Government.
59
Budget Strategy and Outlook 2015-16
| 3.6 | Queensland’s competitive tax status |
Taxation can impact on business decisions regarding investment and employment, and also household investment and home ownership. Maintaining the competitiveness of Queensland’s tax system provides a competitive advantage to business and moderates the tax burden for its citizens, and is therefore fundamental to the Government’s commitment to job creation and sustainable development.
One of the Government’s Fiscal Principles is to maintain competitive taxation by ensuring that General Government Sector own-source revenue remains at or below 8.5% of nominal gross state product (GSP), on average, across the forward estimates. Own-source revenue is derived from total State revenue less any grants received from external sources, mainly the Australian Government.
As Chart 3.8 shows, this principle is expected to be met over the forward estimates period.
| Chart 3.8 | Own-source revenue1 as a proportion of nominal GSP |
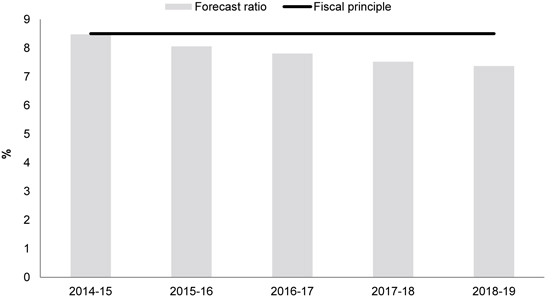
Note:
| 1. | Own-source revenue derived from total revenue less grants revenue. |
Source: Queensland Treasury.
As Chart 3.9 shows, taxation per capita in Queensland is significantly lower than the average taxation per capita in the other states and territories. In 2015-16, it is estimated that Queensland’s taxation per capita will be $676 per capita less than the average of other jurisdictions.
60
Budget Strategy and Outlook 2015-16
| Chart 3.9 | Taxation per capita, 2015-16 |
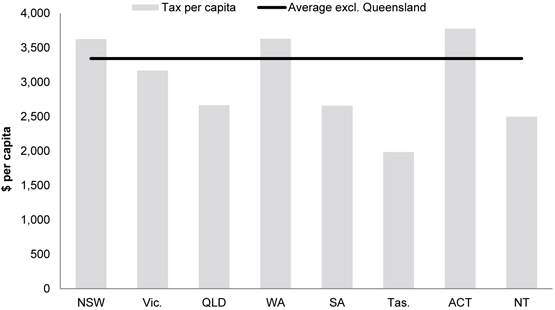
Sources: 2015-16 Budgets for all jurisdictions. Population data from 2015-16 Commonwealth Budget.
Table 3.4 demonstrates using various measures of tax competitiveness that the Queensland tax system remains amongst the most competitive in Australia.
Queensland’s tax effort, as measured by the Commonwealth Grants Commission, was more than 11% below the national average in 2013-14. A third measure of competitiveness, taxation as a share of gross state product (GSP), also confirms that Queensland’s taxes are competitive with other states.
61
Budget Strategy and Outlook 2015-16
| Table 3.4 | Queensland’s tax competitiveness |
| | | | | | | | | | | | | | | | | | | | | | | | | | | | | | | | | | | | |
| | | Qld | | | NSW | | | Vic. | | | WA | | | SA | | | Tas.4 | | | ACT5 | | | NT4 | | | Avg6 | |
Taxation per capita1($) | | | 2,666 | | | | 3,626 | | | | 3,170 | | | | 3,631 | | | | 2,659 | | | | 1,986 | | | | 3,777 | | | | 2,500 | | | | 3,343 | |
Taxation effort2 (%) | | | 88.9 | | | | 105.5 | | | | 102.1 | | | | 98.8 | | | | 103.8 | | | | 93.7 | | | | 96.1 | | | | 86.8 | | | | 100.0 | |
Taxation % of GSP3 (%) | | | 3.91 | | | | 5.14 | | | | 4.97 | | | | 3.36 | | | | 4.34 | | | | 3.80 | | | | 3.91 | | | | 2.50 | | | | 4.44 | |
Notes:
| 1. | 2015-16 data. Sources: 2015-16 Budget for all jurisdictions. Population data from Commonwealth 2015-16 Budget. |
| 2. | 2013-14 data. Source: Commonwealth Grants Commission 2015 Review – total tax revenue effort for assessed taxes (payroll, transfer duty, land tax, insurance duty and motor vehicle taxes). Revenue raising effort ratios, assessed by the Commonwealth Grants Commission, isolate policy impacts from revenue capacity impacts and are an indicator of the extent to which governments burden their revenue bases. Queensland’s tax revenue raising effort is well below the Australian policy standard (equal to 100%). |
| 3. | 2015-16 data. Sources: 2015-16 Budget for all jurisdictions. GSP derived using 2013-14 ABS 5220.0 and published GSP growth rates. |
| 4. | Low taxation per capita primarily reflects the lower revenue raising capacity of those jurisdictions. |
| 5. | Figures include municipal rates. |
| 6. | Weighted average of states and territories, excluding Queensland. |
Grants revenue is comprised of Australian Government grants, grants from the community and industry, and other miscellaneous grants. The growth of $1.183 billion (or 5.1%) in 2015-16 largely reflects the $1.174 billion increase in GST revenue.
| | | | | | | | | | | | |
| | | 2013-14
Actual
$ million | | | 2014-15
Est. Act.
$ million | | | 2015-16
Budget
$ million | |
Current grants | | | | | | | | | | | | |
Australian Government grants | | | 18,841 | | | | 20,580 | | | | 21,578 | |
Other grants and contributions | | | 331 | | | | 382 | | | | 317 | |
Total current grants | | | 19,172 | | | | 20,962 | | | | 21,895 | |
Capital grants | | | | | | | | | | | | |
Australian Government grants | | | 2,574 | | | | 2,398 | | | | 2,625 | |
Other grants and contributions | | | 9 | | | | 13 | | | | 35 | |
Total capital grants | | | 2,583 | | | | 2,411 | | | | 2,660 | |
Total grants revenue | | | 21,755 | | | | 23,373 | | | | 24,555 | |
Note:
| 1. | Numbers may not add due to rounding. |
62
Budget Strategy and Outlook 2015-16
| 3.7.1 | Australian Government payments |
Australian Government payments to Queensland comprise:
| • | | general purpose payments, consisting of GST revenue grants and associated payments. General purpose payments are ‘untied’ and are used for both recurrent and capital purposes |
| • | | payments for specific purposes, including grants for health, schools, skills and workforce development, disabilities and housing. These grants are used to meet Australian Government and shared policy objectives. |
Australian Government payments to Queensland in 2015-16 are expected to total $24.203 billion, representing growth of $1.225 billion (or 5.3%) compared to payments in 2014-15. This significant increase is due to growth of $1.174 billion in GST revenue and $227 million in capital grants. Changes made in the 2014-15 Commonwealth Budget to the provision of health and education growth funding have resulted in $18 billion worth of Federal funding cuts that will impact on the Queensland Budget in the outyears of the forward estimates and beyond. These significant cuts were not restored in the 2015-16 Commonwealth Budget.
| Table 3.6 | Australian Government payments1 |
| | | | | | | | | | | | |
| | | 2013-14
Actual
$ million | | | 2014-15
Est. Act.
$ million | | | 2015-16
Budget
$ million | |
GST revenue grants | | | 10,896 | | | | 11,816 | | | | 12,990 | |
Total payments for specific purposes2 | | | 10,519 | | | | 11,162 | | | | 11,213 | |
Total Australian Government payments | | | 21,415 | | | | 22,978 | | | | 24,203 | |
Notes:
| 1. | Numbers may not add due to rounding. |
| 2. | Differs from Chapter 6 due to the inclusion of direct Australian Government payments to Queensland agencies for Commonwealth own purpose expenditure. |
Chapter 6 provides detailed background on federal-state financial arrangements, including an analysis of Queensland’s share of GST revenue and details of Australian Government payments to Queensland.
GST revenue grants and associated payments
GST revenue grants and associated payments to Queensland in 2015-16 are expected to be $12.990 billion, which represents growth of $1.174 billion on the 2014-15 estimated actual.
GST revenue projections are based on expected growth in economic parameters, such as household consumption and dwelling investment, which have a strong link to the GST base. In the 2015-16 Budget, the Australian Government has increased their estimate for the GST pool by approximately $1.570 billion over the period 2014-15 to 2017-18 since the 2014-15 MYEFO.
The distribution of GST revenues is based on the recommendations of the Commonwealth Grants Commission in accordance with the application of horizontal fiscal equalisation principles.
63
Budget Strategy and Outlook 2015-16
Queensland’s share of GST funding (relativity) increased in the 2015 update from the Commonwealth Grants Commission. Chapter 6 provides further detail on Queensland’s expected GST revenue.
Payments for specific purposes
Australian Government payments for specific purposes to Queensland in 2015-16 are estimated at $11.213 billion.
| 3.7.2 | Other grants and contributions |
Other grants and contributions are funds received from other state and local government agencies, other bodies and individuals where there is no direct benefit to the provider. Contributions exclude Australian Government grants and user charges. The main sources of contributions are:
| • | | those received from private enterprise and community groups to fund research projects and community services, including the contributions of parents and citizens associations to state schools |
| • | | contributed assets and goods and services received for a nominal amount. |
| Table 3.7 | Other grants and contributions |
| | | | | | | | | | | | |
| | | 2013-14
Actual
$ million | | | 2014-15
Est. Act.
$ million | | | 2015-16
Budget
$ million | |
Other grants and contributions | | | 340 | | | | 394 | | | | 352 | |
Revenues will vary from year to year based on the number and size of research projects, assets transferred between the Government and the private sector, and contributed assets and services.
| 3.8 | Sales of goods and services |
Sales of goods and services revenue comprises cost recoveries from providing goods or services. Table 3.8 shows a breakdown of the sales of goods and services category.
The Government provides concessions in the form of discounts, rebates and subsidies to improve access to and the affordability of a range of services for individuals or families, based on eligibility criteria relating to factors such as age, income and special needs or disadvantage. Appendix B provides details of the concession arrangements provided by the Queensland Government.
64
Budget Strategy and Outlook 2015-16
| Table 3.8 | Sales of goods and services1 |
| | | | | | | | | | | | |
| | | 2013-14
Actual
$ million | | | 2014-15
Est. Act.
$ million | | | 2015-16
Budget
$ million | |
Fee for service activities | | | 2,057 | | | | 2,207 | | | | 2,220 | |
Public Transport: South East Queensland | | | 374 | | | | 384 | | | | 391 | |
Rent revenue | | | 482 | | | | 549 | | | | 536 | |
Sale of land inventory | | | 160 | | | | 126 | | | | 112 | |
Hospital fees | | | 718 | | | | 765 | | | | 776 | |
Transport and traffic fees | | | 356 | | | | 376 | | | | 378 | |
Other sales of goods and services | | | 901 | | | | 942 | | | | 1,017 | |
Total sales of goods and services | | | 5,048 | | | | 5,350 | | | | 5,430 | |
Note:
| 1. | Numbers may not add due to rounding. |
| 3.8.1 | Fee for service activities |
Major items of fee for service activities across the General Government Sector include:
| • | | recoverable works carried out by the Department of Transport and Main Roads and the commercialised arm of the department |
| • | | fees charged by Technical and Further Education (TAFE) colleges |
| • | | fees charged by CITEC to commercial clients for information brokerage services. |
| 3.8.2 | Other sales of goods and services |
As shown in Table 3.8, there are a variety of other types of sales of goods and services and these are discussed in more detail below:
| • | | Revenues arising from the arrangements associated with South East Queensland integrated ticketing and public transport arrangements, which commenced in July 2004. The Department of Transport and Main Roads collects revenues from the operation of public transport services in South East Queensland to assist in funding public transport services in the region. These revenues are estimated at $391 million in 2015-16. |
| • | | Rent revenue is earned on the rent or lease of Government buildings, housing, plant and equipment and car parks. Major items under this category include public housing rentals and rents charged for Government buildings. |
| • | | Sale of land inventory includes property transactions where it is a core business of the agency, such as Economic Development Queensland’s role to facilitate land to unlock economic growth opportunities. As such, it is distinct from business as usual transactions undertaken by most Government agencies. |
65
Budget Strategy and Outlook 2015-16
| • | | Hospital fees are collected by public hospitals for a range of hospital services. Fees include those received from private patients and other third party payers, as well as payments received from the Australian Government Department of Veterans’ Affairs for the treatment of veterans. |
| • | | Transport and traffic fees comprise state transport fees, the Traffic Improvement Fee, drivers’ licence fees and various marine licence and registration fees. |
| • | | Other sales of goods and services include items such as Title Registration Fees, recreational ship registrations and other licences and permits. |
Interest income accounts for 4.6% of total General Government Sector revenue in 2015-16. Interest income is expected to decline, reflecting a reduction in the value of financial assets held as a result of the implementation of the Debt Action Plan (refer to Box 1.1 of Chapter 1 for more detail).
| | | | | | | | | | | | |
| | | 2013-14
Actual
$ million | | | 2014-15
Est. Act.
$ million | | | 2015-16
Budget
$ million | |
Interest income | | | 2,460 | | | | 2,467 | | | | 2,372 | |
Interest income primarily comprises interest earned on investments including those held for superannuation and insurance purposes.
| 3.10 | Dividend and income tax equivalent income |
Dividend and income tax equivalent income account for 4.7% of total General Government Sector revenue in 2015-16. Much of this income would have been lost had the previous Government sold the State’s assets.
| Table 3.10 | Dividend and income tax equivalent income1 |
| | | | | | | | | | | | |
| | | 2013-14
Actual
$ million | | | 2014-15
Est. Act.
$ million | | | 2015-16
Budget
$ million | |
Dividend | | | 1,568 | | | | 1,752 | | | | 1,632 | |
Income tax equivalent income | | | 407 | | | | 658 | | | | 762 | |
Total dividend and income tax equivalent income2 | | | 1,975 | | | | 2,410 | | | | 2,395 | |
Notes:
| 1. | Numbers may not add due to rounding. |
| 2. | Does not match tables 7.3 and 7.4 in Chapter 7 because it includes dividends and tax equivalents from outside the Public Non-Financial Corporations Sector such as QIC Limited. |
66
Budget Strategy and Outlook 2015-16
Dividends are received from the State’s equity investments in Public Non-financial Corporations and Public Financial Corporations, for example, the Queensland electricity supply industry, QIC Limited, Queensland Treasury Corporation, port authorities and Queensland Rail. Income tax equivalent income comprises payments by government-owned corporations in lieu of state and Australian Government taxes and levies from which they are exempt. These payments arise from an agreement reached between the Australian Government and state governments in 1994 to establish a process for achieving tax uniformity and competitive neutrality between public sector and private sector trading activities.
Dividends and income tax equivalent income do not represent the full extent of financial arrangements between the Public Non-financial Corporations Sector and the General Government Sector. As discussed in Chapter 7, General Government Sector expenditure on community service obligations and Transport Service Contracts are expected to be over $2 billion in both 2014-15 and 2015-16.
Other revenue, including royalty revenue, accounts for 6.9% of total General Government Sector revenue in 2015-16.
| | | | | | | | | | | | |
| | | 2013-14
Actual
$ million | | | 2014-15
Est. Act.
$ million | | | 2015-16
Budget
$ million | |
Royalties and land rents | | | 2,537 | | | | 2,220 | | | | 2,444 | |
Fines and forfeitures | | | 398 | | | | 402 | | | | 484 | |
Revenue not elsewhere classified | | | 716 | | | | 650 | | | | 581 | |
Total other revenue | | | 3,650 | | | | 3,271 | | | | 3,509 | |
Note:
| 1. | Numbers may not add due to rounding. |
| 3.11.1 | Royalties and land rents |
Royalty estimates
The State earns royalties from the extraction of coal, base and precious metals, bauxite, petroleum and gas, mineral sands and other minerals and land rents from pastoral holdings, mining and petroleum tenures. Royalties return some of the proceeds of the extraction of non-renewable resources to the community.
67
Budget Strategy and Outlook 2015-16
| Table 3.12 | Royalties and land rents1 |
| | | | | | | | | | | | |
| | | 2013-14
Actual
$ million | | | 2014-15
Est. Act.
$ million | | | 2015-16
Budget
$ million | |
Coal | | | 1,947 | | | | 1,610 | | | | 1,684 | |
Petroleum2 | | | 69 | | | | 51 | | | | 129 | |
Other royalties3 | | | 363 | | | | 392 | | | | 463 | |
Land rents | | | 158 | | | | 167 | | | �� | 167 | |
Total royalties and land rents | | | 2,537 | | | | 2,220 | | | | 2,444 | |
Notes:
| 1. | Numbers may not add due to rounding. |
| 3. | Includes base and precious metal and other minerals royalties. |
Revenue from royalties and land rents in 2014-15 is expected to be $286 million lower than forecast in the 2014-15 MYFER. This weakness is largely due to export coal prices being significantly lower than expected, partially offset by an improvement in the A$-US$ exchange rate.
Royalty and land rent revenue is expected to grow by 10.1% in 2015-16 due to moderate increases in export coal volumes, and the A$ depreciating slightly against the US$. Further, 2015-16 represents the first year with multiple proponents exporting LNG although the low price of oil has offset some of this volume impact.
| 3.11.2 | Fines and forfeitures |
The major fines and infringements included in this category are issued by the Department of Transport and Main Roads and Queensland Police Service, incorporating fixed and mobile camera offences, speeding and tolling offences. The expected increase of 20.3% in fines and forfeitures in 2015-16 relates to increased referrals of tolling fines to the State Penalty Enforcement Registry for collection, an increase in failure to vote fines following the State election and the 3.5% increase in the penalty unit.
| 3.11.3 | Revenue not elsewhere classified |
The $68 million decrease in 2015-16 includes an expected decline in asset transfers from non-Queensland Government entities and reductions in sundry revenue across a number of departments.
68
Budget Strategy and Outlook 2015-16
Features
| • | | The Government has fully funded its election commitments, totalling $1.975 billion over the forward estimates from departmental savings, reprioritisations, contingencies and revenue measures. |
| • | | Total expenses are projected to grow on average by 3.4% over the period 2013-14 to 2018-19 or 4.1% per annum across the forward estimates excluding disaster recovery expenses. |
| • | | Interest on General Government Sector borrowings is an estimated $963 million less than projected in the Mid Year Fiscal and Economic Review (MYFER) for the period 2014-15 to 2017-18, largely as a result of the Government’s Debt Action Plan. |
| • | | Expenses for 2014-15 are estimated to be $48.615 billion, an increase of 5.4% from 2013-14. The increase is mainly due to growth funding to support ongoing demand for health services, education expenditure for enrolment growth and Australian Government funding for the Students First program and an advance payment of Financial Assistance grants to local governments by the Australian Government in 2014-15. |
| • | | Compared to the 2014-15 MYFER, General Government Sector expenses for 2014-15 were $598 million lower, reflecting: |
| | • | | re-profiling of $320 million of health expenditure as part of the Government’s growth funding package |
| | • | | changes to the quantity and timing of Natural Disaster Relief and Recovery Arrangements (NDRRA) expenditure of $271 million |
| | • | | deferral of $124 million of Commonwealth funded expenditure for various National Partnership Agreements (NPs) including Skills Reform and Universal Access to Early Childhood Education. |
| • | | In 2015-16, General Government Sector expenses are expected to increase by $1.358 billion (or 2.8%) over the estimated actual for 2014-15. This primarily is a result of increased service delivery including funding to support the ongoing growth in demand for health and education services and deferrals of Commonwealth funding from 2014-15. |
| • | | The average growth in employee expenses over the forward estimates period is 4.0%. |
| • | | The major areas of expenditure are health and education, which together constitute approximately 52.7% of General Government Sector expenses. |
This chapter provides an overview of General Government Sector expenses for the estimated actual for 2014-15, forecasts for the 2015-16 Budget year and projections for 2016-17 to 2018-19. The forward estimates are based on the economic projections outlined in Chapter 2.
69
Budget Strategy and Outlook 2015-16
| 4.1 | 2014-15 estimated actual |
General Government Sector expenses in 2014-15 are estimated to be $48.615 billion, $598 million lower than the 2014-15 MYFER. Downward revisions to other operating expenses and grant expenses are the key contributions to lower overall expenses in 2014-15.
Other operating expenses have declined $478 million from 2014-15 MYFER due in part to:
| • | | the re-profiling of $320 million of health expenditure to be redirected to support Outpatient Waiting Lists strategy |
| • | | the deferral of Australian Government NPs including Skills Reform and Universal Access to Early Childhood Education. |
Grant expenses are estimated to be $303 million less than 2014-15 MYFER largely reflecting:
| • | | lower than expected natural disaster reimbursements to local governments of $271 million as the extensive program of works in relation to the pre-2015 disasters nears completion and ineligible expenditure is identified |
| • | | lower community service obligation payments to Ergon Energy |
| • | | offset in part, by the Australian Government’s advance payment of Financial Assistance grants to local governments in 2014-15 for 2015-16 of $225 million. |
| 4.2 | 2015-16 Budget and outyears |
| Table 4.1 | General Government Sector expenses1 |
| | | | | | | | | | | | | | | | | | | | | | | | |
| | | 2013-14
Actual
$ million | | | 2014-15
Est. Act.
$ million | | | 2015-16
Budget
$ million | | | 2016-17
Projection
$ million | | | 2017-18
Projection
$ million | | | 2018-19
Projection
$ million | |
Employee expenses | | | 17,817 | | | | 18,938 | | | | 19,937 | | | | 20,567 | | | | 21,135 | | | | 21,648 | |
Superannuation interest costs | | | 963 | | | | 872 | | | | 803 | | | | 848 | | | | 886 | | | | 898 | |
Other superannuation expenses | | | 2,277 | | | | 2,359 | | | | 2,553 | | | | 2,564 | | | | 2,554 | | | | 2,588 | |
Other operating expenses | | | 13,114 | | | | 14,158 | | | | 14,980 | | | | 16,075 | | | | 16,931 | | | | 17,451 | |
Depreciation and amortisation | | | 2,946 | | | | 3,116 | | | | 3,264 | | | | 3,443 | | | | 3,525 | | | | 3,628 | |
Other interest expenses | | | 2,201 | | | | 2,265 | | | | 2,115 | | | | 1,873 | | | | 1,914 | | | | 1,956 | |
Grants expenses | | | 6,796 | | | | 6,907 | | | | 6,320 | | | | 6,414 | | | | 6,409 | | | | 6,252 | |
Total Expenses | | | 46,115 | | | | 48,615 | | | | 49,973 | | | | 51,784 | | | | 53,354 | | | | 54,421 | |
Note:
| 1. | Numbers may not add due to rounding. |
70
Budget Strategy and Outlook 2015-16
General Government Sector expenses of $49.973 billion in 2015-16 represent an increase of $1.358 billion (or 2.8%) over the 2014-15 estimated actual. Factors influencing the growth in expenses include:
| • | | growth in funding to Queensland Health through the $2.3 billion Growth Funding package to support growing demand and critical service needs, funding for Sunshine Coast Public University Hospital Transition program and new initiatives including the Outpatient Long Wait Strategy |
| • | | growth in education expenditure for student enrolment growth and the impact of increases in Australian Government funding for the Students First program and National Partnership programs for Skills Reform and Universal Access to Early Childhood Education |
| • | | expenditure on venues in the lead up to the Commonwealth Games |
| • | | costs associated with enterprise bargaining agreements. |
| 4.3 | Expenses by operating statement category |
As outlined in Chart 4.1, the largest expense categories in the General Government Sector in 2015-16 are employee and superannuation expenses (46.6%), followed by other operating expenses (30.1%) that reflects non-labour costs of service.
| Chart 4.1 | Expenses by operating statement category, 2015-161 |
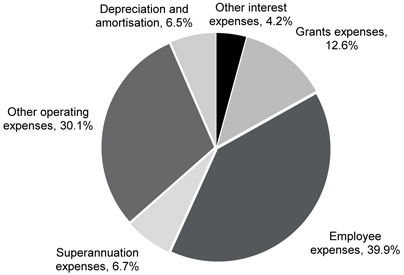
Note:
| 1. | Percentages may not add to 100% due to rounding. |
71
Budget Strategy and Outlook 2015-16
Chart 4.2 compares the 2014-15 estimated actual expenses for each operating statement category with the 2015-16 Budget. Growth in the two largest categories, employee expenses and other operating expenses, is contributing most to growth in 2015-16.
| Chart 4.2 | Expenses by operating statement category |
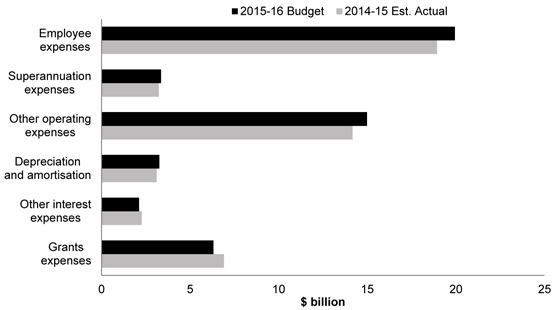
Employee expenses include salaries and wages, annual leave, long service leave and redundancy payments.
In 2015-16, employee expenses are expected to be $19.937 billion, $999 million or 5.3% higher than the 2014-15 estimated actual. Much of the increase in employee expenses in 2015-16 is in the key front line service areas of health and education.
72
Budget Strategy and Outlook 2015-16
Full time equivalents
Chart 4.3 shows actual Full Time Equivalents (FTEs) from 2003-04 to 2013-14 and estimated FTEs from 2014-15 to 2018-19.
| Chart 4.3 | Departmental FTEs1 |
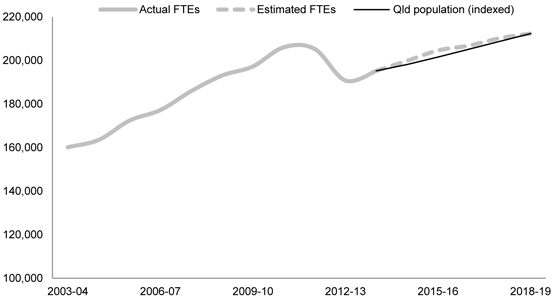
Note:
| 1. | Does not match Table 4.2 because additional funding for frontline services has not been allocated across specific agencies. |
This chart demonstrates the significant impact of the previous Government’s austerity program.
FTEs are expected to grow modestly, at a rate similar to expected State population growth over the period to 2018-19. This largely reflects the Government’s commitment to deliver quality frontline services and public sector job security in a manner that is financially sustainable.
73
Budget Strategy and Outlook 2015-16
Table 4.2 shows the total funded FTE positions by department and is consistent with agency Service Delivery Statements. In 2015-16, FTEs are expected to grow by just over 3,000. Eighty per cent of this growth is attributable to frontline services in the areas of health and education.
| Table 4.2 | Total funded FTE positions by Department1, 17 |
| | | | | | | | | | | | |
| | | 2014-15
Adjusted
Budget | | | 2014-15
Est. Act | | | 2015-16
Budget | |
Aboriginal and Torres Strait Islander Partnerships | | | 343 | | | | 335 | | | | 341 | |
Agriculture and Fisheries2 | | | 2,168 | | | | 2,168 | | | | 2,030 | |
Communities, Child Safety and Disability Services | | | 5,937 | | | | 5,937 | | | | 5,994 | |
Education and Training3 | | | 65,653 | | | | 66,633 | | | | 67,641 | |
Electoral Commission of Queensland | | | 52 | | | | 52 | | | | 52 | |
Energy and Water Supply | | | 225 | | | | 207 | | | | 217 | |
Environment and Heritage Protection | | | 1,026 | | | | 1,050 | | | | 1,056 | |
Housing and Public Works4 | | | 2,805 | | | | 2,989 | | | | 2,915 | |
Infrastructure, Local Government and Planning5 | | | 428 | | | | 444 | | | | 521 | |
Justice and Attorney-General6,14 | | | 8,456 | | | | 8,726 | | | | 8,228 | |
Legislative Assembly | | | 473 | | | | 478 | | | | 479 | |
National Parks, Sport and Racing7 | | | 1,346 | | | | 1,357 | | | | 1,371 | |
Natural Resources and Mines | | | 2,440 | | | | 2,440 | | | | 2,440 | |
Office of the Governor | | | 44 | | | | 44 | | | | 44 | |
Office of the Inspector-General Emergency Management | | | 21 | | | | 21 | | | | 21 | |
Office of the Ombudsman | | | 63 | | | | 63 | | | | 63 | |
Premier and Cabinet8 | | | 849 | | | | 826 | | | | 821 | |
Public Safety Business Agency9 | | | 2,435 | | | | 1,994 | | | | 1,994 | |
Public Service Commission | | | 74 | | | | 74 | | | | 86 | |
Queensland Audit Office | | | 190 | | | | 183 | | | | 190 | |
Queensland Fire and Emergency Services10 | | | 2,941 | | | | 3,001 | | | | 3,077 | |
Queensland Health11 | | | 72,595 | | | | 73,982 | | | | 75,442 | |
Queensland Police Service12 | | | 14,029 | | | | 14,431 | | | | 14,582 | |
Queensland Treasury13 | | | 969 | | | | 972 | | | | 1,790 | |
Science, Information Technology and Innovation14 | | | 2,861 | | | | 2,744 | | | | 2,757 | |
State Development15 | | | 585 | | | | 609 | | | | 588 | |
The Public Trustee of Queensland | | | 578 | | | | 567 | | | | 584 | |
Tourism, Major Events, Small Business and the Commonwealth Games | | | 121 | | | | 126 | | | | 130 | |
Transport and Main Roads16 | | | 7,290 | | | | 7,266 | | | | 7,333 | |
Total | | | 196,997 | | | | 199,719 | | | | 202,787 | |
Notes:
| 1. | Explanation of variations in departmental FTEs can be found in the Service Delivery Statements. Departmental totals may include multiple tables from Service Delivery Statements, due to separate FTE tables being provided for Commercialised Business Units. |
74
Budget Strategy and Outlook 2015-16
| 2. | FTEs for the 2014-15 Budget and estimated actual were nominal thresholds for the department’s budget management purposes. The actual number of occupied positions during this period was less. Following extensive reviews, the 2015-16 staffing budget has now been recalibrated to better reflect the department’s requirements. The budgeted FTE resources will be supported by short term labour hire capacity as required, providing the department with greater flexibility to meet surge, seasonal and emergency response demands across the State. Reductions between 2014-15 estimated actual and Budget also relate to positions transferring to the University of Southern Queensland and funding arrangements for National Cost Sharing having yet to be finalised. |
| 3. | Includes TAFE Queensland. The increase between 2014-15 adjusted budget and 2014-15 estimated actual primarily relates to state schools utilising the additional Australian Government Students First funding to employ more teachers and support. Also contributing are increases associated with Early Childhood Education and Care (ECEC) and reflects the department’s increased focus on regional frontline services to the ECEC sector and families, and working with schools to support children’s successful transitions into Prep. The increase in the 2015-16 Budget is mainly related to the impact of election commitments for the first year of an additional 875 teachers and 45 guidance officers over 3 years and forecast school enrolment growth. |
| 4. | Variance between 2014-15 adjusted budget and 2014-15 estimated actual is mainly due to the deferral in outsourcing of the tenancy and maintenance function in Logan City until 2015-16, a number of Procurement Transformation projects finishing in 2014-15, and the planned transition of some apprentices and field staff to the private sector no longer progressing. Variance between 2014-15 estimated actual and 2015-16 Budget is mainly due to a number of apprentices completing their training in 2015-16, as well as the outsourcing of the tenancy and maintenance function in Logan City in 2015-16. |
| 5. | Represents the transfer of Planning and Infrastructure functions from the Department of State Development on 1 March 2015. In addition, Building Queensland has been established to provide independent, expert advice on infrastructure priorities. In addition, the Government has provided additional funding to the department to deliver a better planning system. |
| 6. | Variance between 2014-15 adjusted budget and 2014-15 estimated actual is mainly due to the establishment of the Commission of Inquiry into Organised Crime, reinstating the Sentencing Advisory Council, the departmental response to Domestic and Family Violence, additional staff to accommodate growth of youths and prisoners in detention, and to commission and operate additional prison capacity. The decrease in the 2015-16 Budget is due to the Office of Industrial Relations being transferred to Queensland Treasury from 1 July 2015. This is partly offset by the reinstatement of the Courts and Youth Justice Conferencing diversionary process, additional staff to accommodate growth in prisoner numbers and to commission and operate additional prison capacity. |
| 7. | The increase in the 2014-15 estimated actual is mainly due to the Queensland Greyhound Racing Industry Commission of Inquiry, staff employed on the Nest to Ocean program and filling of vacancies within Sport and Recreation. The increase in 2015-16 Budget is due to staff required for managing newly acquired National Park estate as well as Cape York Peninsula Aboriginal Land National Parks. |
| 8. | Reduction is mainly due to fewer support staff required as a result of the reduction in the number of Ministerial Offices. |
| 9. | The decrease in the 2014-15 estimated actual is due to police officers being seconded from, and included in the numbers for, the Queensland Police Service. |
| 10. | Increase largely to due to expansion in the number of district (Area) offices. |
| 11. | This represents Health Consolidated, which consolidates Queensland Health controlled, the Queensland Ambulance Service and the Hospital and Health Services (HHSs). The 2015-16 Budget for HHSs may change due to updates to the 2015-16 Service Agreement throughout the financial year. Variations between 2014-15 adjusted budget and 2014-15 estimated actual are mainly due to commissioning of new services and additional activity purchased from HHSs through amendments to the 2014-15 Service Agreements. Increases in FTEs for the 2015-16 Budget reflect commissioning of new services, additional activity purchased from HHSs and election commitments. |
| 12. | Relates to increases in projected recruit numbers and police officers being seconded from the Public Safety Business Agency. |
75
Budget Strategy and Outlook 2015-16
| 13. | The increase in the 2015-16 Budget relates to the transfer of the Office of Industrial Relations (formerly Office of Fair and Safe Work Queensland) transferring from Justice and Attorney-General on 1 July 2015, the filling of vacancies and graduate intakes. |
| 14. | Reduction in 2014-15 estimated actual is mainly due to a reduction in staff delivering externally funded projects and increased efficiencies due to automation and process improvements. |
| 15. | Includes the transfer of planning and infrastructure functions to the Department of Infrastructure, Local Government and Planning on 1 March 2015. The increase in the 2014-15 estimated actual and subsequent decrease in 2015-16 Budget is due to temporary staff engaged for Commonwealth Games venue projects and other high priority projects. |
| 16. | The forecasted increase in 2015-16 Budget is due to RoadTek accommodating apprentices and trainees into the workforce and continuing to reduce long term reliance on labour hire and transitioning temporary resources to support maintenance delivery. |
| 17. | The estimate of 195,612 FTEs in Table 4.2 of the published 2014-15 Budget did not include approximately 1,500 lower than shown in this table because certain smaller departments. The additional departments are the Electoral Commission, Legislative Assembly, Office of the Governor, Office of the Inspector-General Emergency Management, Office of the Ombudsman, Public Service Commission, Queensland Audit Office, and The Public Trustee. |
| 4.3.2 | Superannuation expenses |
The superannuation interest cost represents the imputed interest on the Government’s accruing defined benefit superannuation liabilities.
In determining the State’s defined benefit superannuation liabilities, AASB 119 Employee Benefits requires the discounting of future benefit obligations using yield rates on Government bonds net of investment tax. Interest costs are calculated on a net liability approach by applying the discount rate to both the gross liability and superannuation plan assets.
In 2015-16, superannuation interest costs are projected to decrease by $69 million over the estimated actual to $803 million due to the lower estimated actuarial valuation of superannuation liabilities as at 30 June 2015. The defined benefit scheme, which is closed to new members and subject to interest rate fluctuations, will decline over time as members leave.
Other superannuation expenses represent employer superannuation contributions to accumulation superannuation and the current service cost of the State’s defined benefit obligation (or the increase in the present value of the defined benefit obligation resulting from employee service in the current period).
The Government’s decision to suspend future investment in the over-funded defined benefit superannuation scheme will not impact on employee entitlements. Accordingly, these expenses are not impacted by the investment suspension.
| 4.3.3 | Other operating expenses |
Other operating expenses comprise the non-labour costs of providing goods and services, including services to government and non-government organisations, repairs and maintenance, consultancies, contractors, electricity, communications and marketing.
76
Budget Strategy and Outlook 2015-16
Other operating expenses have decreased $478 million from the 2014-15 MYFER mainly as a result of Queensland Health’s estimated $320 million re-profiling and deferrals of Australian Government National Partnership programs for education, including Skills Reform.
In 2015-16, other operating expenses are expected to be $14.980 billion, an increase of $822 million or 5.8% over the 2014-15 estimated actual. Significant movements from the 2014-15 estimated actual outcome are due to:
| • | | health growth funding for frontline services and new initiatives including Outpatient Long Wait Reduction Strategy |
| • | | anticipated student enrolment growth, and the impact of increases in Australian Government funding for the Students First program and National Partnership programs (including deferrals) for Skills Reform and completion of the Fixing Our Schools program |
| • | | introduction of Skilling Queenslanders for Work and Jobs Queensland initiatives |
| • | | expenses for Commonwealth Games venues |
| • | | increased funding for child protection and family and parenting support systems and disability services, including preparing Queensland for the National Disability Insurance Scheme. |
| 4.3.4 | Depreciation and amortisation |
Depreciation and amortisation expense is an estimate of the progressive consumption of the State’s assets through normal usage, wear and tear and obsolescence. Growth in this expense category primarily reflects asset revaluations and the size of the State’s capital program.
| 4.3.5 | Other interest expenses |
Other interest expenses include interest paid on borrowings to acquire capital assets and infrastructure such as roads and government buildings.
In 2015-16, the General Government Sector has total debt servicing costs forecast at $2.115 billion, a decrease of 6.6% over the 2014-15 estimated actual.
Interest expenses are expected to be an estimated $963 million less than projected in the MYFER for the period 2014-15 to 2017-18 due to the implementation of the Government’s Debt Action Plan. Details of the Government’s Debt Action Plan can be found in Chapter 1 - Fiscal Strategy and Outlook.
Current grants include grants and subsidies to the community (such as schools, hospitals, benevolent institutions and local governments) and personal benefit payments. Community service obligations (CSOs) are provided where Public Non-financial Corporations (PNFCs) are required to provide non-commercial services or services at non-commercial prices for the benefit of the community (for further details refer Chapter 7).
77
Budget Strategy and Outlook 2015-16
Grant expenses have decreased $303 million from the 2014-15 MYFER as a result of the timing of NDRRA payments to local councils, lower CSO payments to Ergon Energy and lower levels of Australian Government grant assistance to non-state schools, offset in part by the Australian Government’s advance payment of Financial Assistance grants to local governments in 2014-15 for 2015-16.
Table 4.3 provides a breakdown of grants by category and recipient type.
| | | | | | | | |
| | | 2014-15
Est. Act.
$ million | | | 2015-16
Budget
$ million | |
Current | | | | | | | | |
Grants to local government | | | 858 | | | | 404 | |
Grants to private and not-for-profit organisations | | | | | | | | |
State funding for non-state schools | | | 694 | | | | 757 | |
Australian Government funding for non-state schools | | | 2,107 | | | | 2,249 | |
Other | | | 809 | | | | 599 | |
Grants to other sectors of government | | | | | | | | |
Community service obligations to PNFCs | | | 640 | | | | 444 | |
Other payments to PNFCs | | | 24 | | | | 23 | |
Other | | | 4 | | | | 4 | |
Other | | | 208 | | | | 283 | |
Total current transfers | | | 5,345 | | | | 4,764 | |
Capital | | | | | | | | |
Grants to local government | | | 1,004 | | | | 829 | |
Grants to private and not-for-profit organisations | | | 427 | | | | 566 | |
Payments to PNFCs | | | 13 | | | | 25 | |
First Home Owner Grant schemes | | | 95 | | | | 92 | |
Other | | | 22 | | | | 44 | |
Total capital transfers | | | 1,561 | | | | 1,556 | |
Total current and capital transfers | | | 6,907 | | | | 6,320 | |
Note:
| 1. | Numbers may not add due to rounding. |
Current grants are estimated to decrease by $581 million in 2015-16. This decrease is due to lower CSO payments to Ergon Energy under the Uniform Tariff Policy, the Australian Government’s advance payment of Financial Assistance grants to local governments in 2014-15 in relation to the 2015-16 financial year (thereby reducing 2015-16) and other grants to private and not-for-profit organisations. These reductions are partly offset by increases in State and Australian Government funding for non-state schools.
78
Budget Strategy and Outlook 2015-16
Capital transfers represent grants to PNFCs, local governments, not-for-profit institutions and other non-government entities, such as businesses and households (including the Great Start Grant) for capital purposes.
Capital grants are estimated to decrease $5 million to $1.556 billion in 2015-16. The decline in capital grants to local government is largely represented by re-profiling natural disaster grants to local governments for the rebuilding of roads, bridges and transport infrastructure related to pre-2015 natural disaster events. This finalisation of natural disaster payments has been mainly offset by the Government’s new Building Our Regions initiative and higher level of expenditure for the Royalties for Regions program (fourth and final round).
| 4.4 | Operating expenses by purpose |
Chart 4.4 indicates the proportion of expenditure by major purpose classification for the 2015-16 Budget. Health accounts for the largest share of expenses (28.5%) followed by Education (24.2%).
| Chart 4.4 | General Government Sector expenses by purpose, 2015-16 |
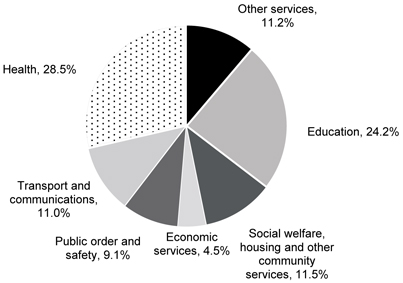
79
Budget Strategy and Outlook 2015-16
Data presented in Tables 4.4 and 4.5 provide a summary drawn from financial statements contained in the Service Delivery Statements (SDS). Further information on the composition of expenses, outputs delivered and factors influencing the movement in expenses can also be obtained from the SDS.
| Table 4.4 | Departmental controlled expense1, 2 |
| | | | | | | | | | | | | | | | |
| | | Notes | | | 2014-15
Budget
$ 000 | | | 2014-15
Est. Act.
$ 000 | | | 2015-16
Budget
$ 000 | |
Aboriginal and Torres Strait Islander Partnerships | | | 3, 5 | | | | 154,284 | | | | 118,303 | | | | 118,719 | |
Agriculture and Fisheries | | | 6 | | | | 408,579 | | | | 426,524 | | | | 437,986 | |
Communities, Child Safety and Disability Services | | | 3, 7 | | | | 2,521,217 | | | | 2,563,177 | | | | 2,684,004 | |
Education and Training | | | 8 | | | | 8,552,849 | | | | 8,327,596 | | | | 9,003,741 | |
Electoral Commission of Queensland | | | 9 | | | | 54,124 | | | | 54,317 | | | | 39,640 | |
Energy and Water Supply | | | 10 | | | | 50,729 | | | | 46,029 | | | | 50,087 | |
Environment and Heritage Protection | | | 11 | | | | 175,034 | | | | 176,684 | | | | 207,651 | |
Health Consolidated | | | 4, 12 | | | | 13,621,951 | | | | 13,560,255 | | | | 14,182,562 | |
Housing and Public Works | | | 3, 13 | | | | 1,851,318 | | | | 1,737,534 | | | | 1,777,427 | |
Inspector General Emergency Management | | | | | | | 4,495 | | | | 4,504 | | | | 4,607 | |
Infrastructure, Local Government and Planning | | | 3, 14 | | | | 223,380 | | | | 196,841 | | | | 318,350 | |
Justice and Attorney-General | | | 3, 15 | | | | 1,436,188 | | | | 1,448,574 | | | | 1,386,142 | |
Legislative Assembly | | | 16 | | | | 86,484 | | | | 89,195 | | | | 86,093 | |
National Parks, Sport and Racing | | | 17 | | | | 420,049 | | | | 335,200 | | | | 404,318 | |
Natural Resources and Mines | | | 18 | | | | 450,002 | | | | 439,345 | | | | 449,187 | |
Office of the Governor | | | | | | | 6,263 | | | | 6,148 | | | | 6,575 | |
Office of the Ombudsman | | | | | | | 8,602 | | | | 8,350 | | | | 8,719 | |
Premier and Cabinet | | | 3, 19 | | | | 166,319 | | | | 169,570 | | | | 239,347 | |
Public Safety Business Agency | | | 20 | | | | 610,265 | | | | 621,289 | | | | 680,760 | |
Public Service Commission | | | | | | | 17,025 | | | | 17,107 | | | | 17,762 | |
Queensland Audit Office | | | 21 | | | | 38,372 | | | | 42,922 | | | | 42,704 | |
Queensland Fire and Emergency Services | | | 22 | | | | 620,024 | | | | 616,561 | | | | 647,682 | |
Queensland Police Service | | | 23 | | | | 2,070,324 | | | | 2,046,282 | | | | 2,084,895 | |
Queensland Treasury | | | 3, 24 | | | | 203,033 | | | | 241,940 | | | | 330,415 | |
Science, Information Technology and Innovation | | | 3, 25 | | | | 408,355 | | | | 421,825 | | | | 390,300 | |
State Development | | | 3, 26 | | | | 396,264 | | | | 251,701 | | | | 620,138 | |
The Public Trustee of Queensland | | | | | | | 87,705 | | | | 81,207 | | | | 84,723 | |
Tourism, Major Events, Small Business and the Commonwealth Games | | | 27 | | | | 107,441 | | | | 52,015 | | | | 205,186 | |
Transport and Main Roads | | | 28 | | | | 5,390,333 | | | | 5,388,419 | | | | 5,482,261 | |
Total expenses | | | | | | | 40,141,008 | | | | 39,489,414 | | | | 41,991,981 | |
80
Budget Strategy and Outlook 2015-16
Notes:
| 1. | Total expenses by department does not equate to total General Government Sector expenses in Uniform Presentation Framework (UPF) terms reported elsewhere in the Budget Papers as General Government Sector expenses include a wider range of entities including State Government statutory authorities. In addition transactions eliminated between entities within the General Government Sector are excluded in the preparation of whole-of-government UPF financial statements. |
| 2. | Full explanation of variations in departmental controlled expenses can be found in the SDS. A summary of major variances is provided below. |
| 3. | 2014-15 Budget figures have been adjusted to reflect machinery-of-government changes. |
| 4. | This represents Health Consolidated in the Service Delivery Statement, which consolidates Queensland Health controlled and the Hospital and Health Services. |
| 5. | The decrease from the 2014-15 Budget to the 2014-15 estimated Actual relates to the timing of land and infrastructure-related works undertaken by the department under the National Partnership Agreement on Remote Indigenous Housing (NPARIH). |
| 6. | The increase from 2014-15 Budget to 2014-15 estimated actual is principally due to additional expenses for pest and disease emergency responses during 2014-15, increased expenses for research and development projects, and increased expenses in relation to Drought Relief Assistance Scheme Payments. This is partially offset by a reduction in expenses due to the deferral of funding from 2014-15 to 2015-16 to realign with anticipated expenditure. |
| 7. | The increase from 2014-15 Budget to 2014-15 estimated actual is mainly due to Commonwealth revenue for the National Partnership Agreement (NPA) for pay equity for the social and community services sector (SACS) being received in 2012-13 and 2013-14 and spent in 2014-15; additional funding transferred from the Department of Housing and Public Works for Youth Housing and Reintegration and Post Care Support programs; and the repurposing of prior years’ grant refunds, received from non-government organisations through the annual acquittal process, to respond to disability and child safety demand pressures. The increase from 2014-15 estimated actual to 2015-16 Budget is primarily due to population growth and indexation funding to meet increased demand for services and cost pressures; increased expenditure on National Disability Insurance Scheme related activity and to continue implementing the child and family reforms (Stronger Families – the Government’s response to the recommendations of the Queensland Child Protection Commission of Inquiry); Commonwealth revenue relating to the NPA for pay equity for SACS; and new funding provided as part of the 2015-16 Budget for parenting support programs, the Alcohol Fuelled Violence Program, an extension of existing drought relief arrangements, and multicultural initiatives. |
| 8. | The decrease from 2014-15 Budget to 2014-15 estimated actual is partly due to deferrals of funding for various Australian Government National Partnership Agreement payments, with the remaining difference mainly due to lower actual expenditure incurred by state schools and delays in delivery of numerous minor programs. The increase from 2014-15 estimated actual to 2015-16 Budget is mainly due to expenses associated with student enrolment growth, new education and training initiatives, and increases in employee expenses attributable to Enterprise Bargaining Arrangements. |
| 9. | The expenditure profile reflects election activity, including the 2015 State Election and 2016 local government quadrennial elections. |
| 10. | The decrease from the 2014-15 Budget to the 2014-15 estimated actual include the lapse of $3.3 million due to finalisation of the Dam Spillway Upgrade Program, plus energy related deferrals of $2.9 million to fund the Government’s election commitments relating to renewable energy initiatives. The deferred funding will now be directed towards the Government’s solar and other renewable initiatives in 2015-16. In addition, funds for a consumer education campaign ($3.3 million) related to the reform of SEQ electricity tariffs will now be expended in 2015-16 rather than 2014-15 following the Government’s decision to delay the reform by one year. |
| 11. | The increase from the 2014-15 Budget and 2014-15 estimated actual to 2015-16 Budget reflects new funding for Saving the Great Barrier Reef and Climate Change Adaptation initiatives; additional funding for underground coal gasification investigations, the NatureAssist program, wildlife management activities and environmental impact assessments; and the impact of the deferral of funding from 2014-15 to 2015-16. |
81
Budget Strategy and Outlook 2015-16
| 12. | The decrease in expenditure from the 2014-15 Budget to the 2014-15 estimated actual mainly relates to the deferral of a Queensland Health surplus across the forward estimates partly offset by equity to output swaps for capital items that are required to be expensed under the accounting standards. The increase from the 2014-15 estimate actual to the 2015-16 Budget mainly relates to existing enterprising bargaining costs, the More Beds for Hospitals program, election commitments and growth funding to support ongoing increases in demand for health and ambulance services offset by a decrease in Commonwealth funding due to expired National Partnership Agreements. |
| 13. | The decrease in 2014-15 estimated actual is mainly due to the deferral of funding for various Indigenous housing programs including the Indigenous Rural and Remote, Indigenous Community Housing Organisations and Deed of Grants in Trust (DOGIT) programs; the transfer of expenses from capital grants to capital works for the DOGIT program; and the deferral of funding for some Public Works programs, in particular the Office Accommodation program and ICT projects. The increase between the 2014-15 estimated actual and the 2015-16 Budget is driven primarily by increased expenditure on grants under the renewed two year National Partnership Agreement on Homelessness commencing in 2015-16 and increased costs associated with the re-instatement of the Tenant Advisory and Advocacy Service. |
| 14. | The decrease from the 2014-15 Budget to the 2014-15 estimated actual is primarily due to the deferral of funding for the Royalties for the Region program (due to delays in round four projects commencing), the Torres Strait Major infrastructure program, Local Government capacity building programs and flood studies. This is partially offset by increased recurrent expenditure on the Commonwealth Games Athletes Village as a result of a revised funding profile across the forward estimates following the finalisation of a development agreement. The increase between the 2014-15 estimated actual and the 2015-16 Budget is primarily due to new funding for the establishment of the Community Resilience Fund and Building Queensland; increased funding to deliver a better planning system for Queensland; increased expenditure on the Commonwealth Games Athletes Village; and machinery-of-government changes. This is partially offset by decreased funding for the Natural Disaster Resilience program. |
| 15. | The increase from 2014-15 Budget to 2014-15 estimated actual reflects additional funding to accommodate growth in prisoner and young offender numbers, depreciation and the Commission of Inquiry into Organised Crime. The decrease in funding from 2014-15 estimated actual to 2015-16 Budget is mainly due to the machinery-of-government transfer of the Office of Fair and Safe Work Queensland from the Department of Justice and Attorney-General to Queensland Treasury in July 2015, finalisation of the revitalisation program for the Registry of Births, Deaths and Marriages, the whole-of-Government reprioritisation program, partially offset by additional funding provided to accommodate growth in young offender and prisoner numbers, wage costs and Budget measures. |
| 16. | The increase from 2014-15 Budget to 2014-15 estimated actual is largely due to additional one-off expenses related to the January 2015 State election, including transition allowances for departing Members and Electorate Officer severance payments. The decrease in expenses in the 2015-16 Budget reflects the impact of these one-off expenses in 2014-15 as well as the savings from the reduction in the number of Ministers and Assistant Ministers ($1.909 million ongoing from 2015-16). |
| 17. | The decrease from the 2014-15 Budget to the 2014-15 estimated actual and the increase from the 2014-15 Est. Actual to the 2015-16 Budget mainly relate to the timing of expenditure under major grant programs, including Sport and Recreation grant programs, the Racing Industry Capital Development Scheme and the Racing Infrastructure Fund. |
| 18. | The decrease in the 2014-15 Est. Actual is mainly due to revised estimates for Australian Government programs such as the Water for the Future and Murray Darling Basin programs and the timing of payments for various other programs. |
| 19. | The increase from 2014-15 estimated actual and 2015-16 Budget is primarily related to the machinery-of-government transfer of Arts Queensland to the Department of the Premier and Cabinet. Expenditure related to the transfer includes an increase in grants and subsidies primarily due to restoration of arts grant funding and the additional funding for the Visual Arts and Crafts Strategy, Backing Indigenous Arts and Queensland Art Gallery exhibitions, and an increase in depreciation and amortisation primarily due to the funding realignment of Cultural Precinct non-land assets to match annual depreciation expense. Further departmental expenditure includes activities focussed upon reducing Domestic and Family Violence and impending Cultural Precinct capital maintenance works. Expenditure is partially offset by the completion of G20 activities, Queensland Health Renewal Taskforce and Our Community Newsletter. |
| 20. | The increase in the 2014-15 estimated actual expenses over budget reflects the finalisation of the machinery-of-government transfer of corporate services from the Queensland Police Service (QPS), partly offset by project deferrals, including the human resource and payroll systems replacement project. The spike in 2015-16 expenses reflects expenditure on major projects including for QPS mobile services and capital works, improved safety equipment, and the machinery-of-government transfer of the community helicopter providers from Queensland Health. |
82
Budget Strategy and Outlook 2015-16
| 21. | Increase from 2014-15 Budget to 2014-15 estimated actual is mainly due to underestimation of contracted-out audit work for 2014-15 Budget. Decrease from 2014-15 estimated Actual to 2015-16 Budget mainly reflects lower contracting and travel expenses, partly offset by increases in employee expenses due to Enterprise Bargaining Arrangements. |
| 22. | The decrease in 2014-15 estimated actual relative to 2014-15 Budget reflects lower than expected supplier expenses including on motor vehicle and property repairs and maintenance, operational equipment, professional services and contractor expense, communications and marketing. The increase in 2015-16 Budget reflects expected increases in employee and supplier expenses including for property repairs and to address critical digital communications requirements; and continuation of projects related to cultural change and the Police and Community Safety Review. |
| 23. | The decrease in 2014-15 estimated actual relative to the 2014-15 Budget is due to the finalisation of the machinery-of-government transfer of corporate functions to the Public Safety Business Agency, as well as the deferral of expenditure related to several projects budgeted for 2014-15 including Telecommunications Interception System Upgrade, ICT and Mobile Services. The increase from 2014-15 estimated actual to 2015-16 Budget reflects additional funding for police growth (266 new police officers in 2015-16), wage increases and additional resources for targeting organised crime, partly offset by finalisation of the G20 operation. In addition, rescheduling of Telecommunications Interception System Upgrade, ICT and Mobile Service programs also boosts 2015-16 expenditure. |
| 24. | The increase from the 2014-15 Budget to the 2014-15 estimated actual primarily relates to payment to Queensland Treasury Corporation to compensate for costs incurred during the preparation of assets for lease or sale under the direction of the former State Government. The increase from the 2014-15 estimated Actual to the 2015-16 Budget is due to the machinery-of-government transfer of the Office of Fair and Safe Work Queensland from the Department of Justice and Attorney-General to Queensland Treasury in July 2015. |
| 25. | The decrease from the 2014-15 estimated actual to 2015-16 Budget is mainly due to the impact of the Machinery-of-government transfer of Arts Queensland to the Department of the Premier and Cabinet in February 2015. |
| 26. | The decrease in the 2014-15 estimated actual relates to the deferral of approximately $40 million in funding to 2015-16 high priority projects (including the Mission Beach Safe Boating Infrastructure Project, the Bundaberg Gas Pipeline and Great Barrier Reef Ports Reform activities) and the transfer of Royalties for Regions funding to Transport and Main Roads and Infrastructure, Local Government and Planning. The increase in 2015-16 Budget relates to new funding for the Building our Regions program and Townsville Stadium; increased expenditure on Commonwealth Games Venue projects; the deferral of projects from 2014-15; and higher expenditure under Round 4 of the Royalties for the Regions program. |
| 27. | The decrease in expenditure from the 2014-15 Budget to the 2014-15 estimated actual is primarily due to the deferral of funding to 2015-16 to match the timing of anticipated expenditure on venues for the Gold Coast 2018 Commonwealth Games. The increase from 2014-15 estimated actual to 2015-16 Budget is almost entirely due to the increase in planned expenditure associated with the delivery of venues for the Gold Coast 2018 Commonwealth Games. |
| 28. | The increase in expenses in 2015-16 Budget mainly reflects increased expenditure under the Transport Service Contract with Queensland Rail, expenditure on the Lawnton to Petrie rail line project, and increases in road operations and maintenance costs. This is partially offset by decreases in expenditure on regional freight and livestock contracts. |
83
Budget Strategy and Outlook 2015-16
| Table 4.5 | Departmental administered expense1, 2 |
| | | | | | | | | | | | | | | | |
| | | Notes | | | 2014-15
Budget
$ 000 | | | 2014-15
Est. Act.
$ 000 | | | 2015-16
Budget
$ 000 | |
Aboriginal and Torres Strait Islander Partnerships | | | 4 | | | | 8,100 | | | | 9,974 | | | | 9,935 | |
Agriculture and Fisheries | | | 5 | | | | 9,395 | | | | 11,868 | | | | 11,305 | |
Communities, Child Safety and Disability Services | | | 6 | | | | 239,631 | | | | 257,061 | | | | 253,949 | |
Education and Training | | | 7 | | | | 3,083,848 | | | | 3,021,234 | | | | 3,108,900 | |
Energy and Water Supply | | | 8 | | �� | | 711,303 | | | | 654,226 | | | | 465,849 | |
Health Consolidated | | | | | | | 33,910 | | | | 33,934 | | | | 33,548 | |
Housing and Public Works | | | 9 | | | | 3,452 | | | | 8,061 | | | | 3,468 | |
Infrastructure, Local Government and Planning | | | 3, 10 | | | | 2,308,584 | | | | 1,479,475 | | | | 1,163,549 | |
Justice and Attorney-General | | | 11 | | | | 308,257 | | | | 296,744 | | | | 313,987 | |
National Parks, Sport and Racing | | | 12 | | | | 26,811 | | | | 26,715 | | | | 41,754 | |
Natural Resources and Mines | | | | | | | 51,625 | | | | 51,625 | | | | 51,625 | |
Premier and Cabinet | | | 3, 13 | | | | 74,336 | | | | 64,890 | | | | 126,420 | |
Queensland Treasury | | | 14 | | | | 6,500,940 | | | | 6,397,817 | | | | 6,305,214 | |
Science, Information Technology and Innovation | | | 3, 15 | | | | 131,942 | | | | 123,949 | | | | 80,117 | |
State Development | | | 3, 16 | | | | 27,433 | | | | 27,433 | | | | 2,500 | |
The Public Trustee of Queensland | | | | | | | — | | | | 850 | | | | 438 | |
Tourism, Major Events, Small Business and the Commonwealth Games | | | 17 | | | | 119,393 | | | | 127,662 | | | | 170,386 | |
Total expenses | | | | | | | 13,638,960 | | | | 12,593,518 | | | | 12,142,944 | |
Notes:
| 1. | Total expenses by department does not equate to total General Government Sector expenses in Uniform Presentation Framework (UPF) terms reported elsewhere in the Budget Papers as General Government Sector expenses include a wider range of entities including State Government statutory authorities. In addition transactions eliminated between entities within the General Government Sector (for example payroll tax payments) are excluded in the preparation of whole-of-Government UPF financial statements. |
| 2. | Full explanation of variations in departmental administered expenses can be found in the SDS. A summary of major variances is provided below. |
| 3. | 2014-15 Budget figures have been adjusted to reflect machinery-of-government changes. |
| 4. | The increase in 2014-15 estimated actual reflects additional funding provided for the Western Cape Communities Trust under the Western Cape Communities Co-existence agreement and additional funding provided to the Family Responsibilities Commission for the expansion into Doomadgee during 2014-15. |
| 5. | The increase from 2014-15 Budget to 2014-15 estimated actual reflects the additional funding towards supporting service delivery for the Queensland Agricultural Training Colleges. |
| 6. | The increase from 2014-15 Budget to 2014-15 estimated actual is largely due to the recognition of expenditure incurred relating to natural disasters in 2013-14 and 2014-15. The decrease in the 2015-16 Budget is due to the winding down of spending on natural disasters and an increase in concessions due to growth and indexation. |
84
Budget Strategy and Outlook 2015-16
| 7. | The decrease in administered expenditure from 2014-15 Budget to 2014-15 estimated actual is mainly due to an adjustment in expenses relating to the Central Queensland TAFE/Central Queensland University merger and lower expenses due to a decrease in Australian Government Students First funding. The increase from 2014-15 Budget to 2015-16 Budget is mainly due to increased Australian Government funding for non-government schools reflecting enrolment growth and indexation of per student funding, and the introduction of the Non-State Schools Capital Grants program. |
| 8. | Decreases in the 2014-15 estimated actual and the 2015-16 Budget are attributable to reduced expenditure required for the Government’s Uniform Tariff Policy. The large reduction in the 2015-16 requirement follows recent determinations by the Australian Energy Regulator, which have reduced allowable revenues of Ergon Energy by more than those of Energex. The decrease is also affected by the cessation of a smaller ($30 million) community service obligation payment to Energex, which was paid in 2014-15. |
| 9. | The increase in the 2014-15 estimated actual primarily reflects the cost of severance payments made to Building and Asset Services following the amalgamation of the former QBuild and Project Services Commercialised Business Units. This also explains the reduction in expenditure in the 2015-16 Budget. |
| 10. | The decrease in the 2014-15 estimated actual primarily relates to funding for the Queensland Reconstruction Authority and is due to a change in the profile of reconstruction expenditure by agencies. |
| 11. | The decrease from 2014-15 Budget to 2014-15 estimated actual relates to a realignment of the former Safe Night Out Strategy (to be replaced by the new Alcohol Fuelled Violence Program) and lower benefit payments under the victims of crime financial assistance and compensation scheme. The increase in 2015-16 Budget is primarily due to the funding profile under the National Partnership Agreement on Legal Assistance Services for Community Legal Centres, indexation for Gambling Community Benefit Fund grants, enterprise bargaining for statutory bodies and the new Domestic Violence Duty Lawyer Service. |
| 12. | The increase in the 2015-16 Budget relates to a capital grant payment to Stadiums Queensland towards the construction of a state netball facility. |
| 13. | The reduction in expenditure between 2014-15 Budget and 2014-15 estimated actual primarily relates to a decrease in Employee expenses and Supplies and Services in relation to the Government’s election commitment to reduce the number of Ministers and Ministerial Offices. The increase in expenditure from 2014-15 estimated actual to 2015-16 Budget primarily relates to an increase in grants and subsidies due to the machinery-of-government transfer of Arts Queensland to the Department of the Premier and Cabinet. Further expenditure relates to additional funding provided to statutory bodies for Enterprise Bargaining arrangements as well as to Queensland Family and Child Commission to develop a Customer Services Directory, Workforce Strategy, public education, an evaluation framework and a new records management system; Queensland Performing Arts Trust for the Out of the Box Festival; and to Screen Queensland. |
| 14. | The decrease in 2014-15 estimated actual largely relates to a decrease in borrowing costs due to lower than budgeted borrowings in 2013-14 which reduced the opening stock of borrowing for 2014-15. Additionally, new borrowings were lower than budgeted due to the improved operating position and lower capital purchases by the State. The decrease in 2015-16 Budget is largely due to the impact of the Government’s Debt Action Plan which is reflected in lower borrowing costs. |
| 15. | The decrease in expenditure from 2014-15 Budget to 2014-15 estimated actual is largely due to Queensland Shared Services (QSS) deferrals, a reduction in subsidy to account for payroll tax exemption for QSS and the transfer of Chief Technology Officer funding and functions to the Department from CITEC. The decrease in 2015-16 Budget relates mainly to the full year impact of the machinery-of-government transfer of Arts statutory bodies to Department of the Premier and Cabinet in February 2015 and a reduction in subsidies to QSS. |
| 16. | The decrease in 2015-16 Budget relates to funding for the management and operation of South Bank and Roma Street Parklands transferring to the Department of Infrastructure, Local Government and Planning as part of machinery-of-government changes. |
| 17. | The increase from 2014-15 Budget to 2014-15 estimated actual is the result of a deferral of funds by Tourism and Events Queensland (TEQ) from 2013-14 to 2014-15 which occurred after the publication of TEQ’s 2014-15 Budget. The increase from 2014-15 Est. Actual to 2015-16 Budget principally relates to an increase in grants to the Gold Coast 2018 Commonwealth Games Corporation for expenditure associated with event planning and preparation for the Gold Coast 2018 Commonwealth Games. Increased funding of $128.3 million over four years has been provided to TEQ to restore its funding and provide it with Budget certainty. |
85
Budget Strategy and Outlook 2015-16
Table 4.6 reconciles the departmental expenses set out above with General Government Sector total expenses.
| Table 4.6 | Reconciliation of departmental to UPF expenses1 |
| | | | | | | | |
| | | 2014-15
Est. Act.
$ million | | | 2015-16
Budget
$ million | |
Departmental expenses per Service Delivery Statements | | | | | | | | |
- Controlled (Table 4.4) | | | 39,489 | | | | 41,992 | |
- Administered (Table 4.5) | | | 12,594 | | | | 12,143 | |
| | |
Non-UPF departmental expenses and whole-of-Government schemes2 | | | (4,078 | ) | | | (4,009 | ) |
| | |
Other General Government entities (e.g. CBUs, SSPs, Statutory Bodies) | | | 5,084 | | | | 4,413 | |
| | |
| | | 53,089 | | | | 54,540 | |
| | |
Superannuation Interest cost | | | 872 | | | | 803 | |
| | |
Eliminations and Other whole-of-Government adjustments | | | | | | | | |
Elimination of payments to CBUs and SSPs | | | (2,795 | ) | | | (2,590 | ) |
Other eliminations and adjustments | | | (2,551 | ) | | | (2,779 | ) |
| | |
Total General Government UPF expenses | | | 48,615 | | | | 49,973 | |
Notes:
| 1. | Numbers may not add due to rounding and bracketed numbers represent negative amounts. |
| 2. | Certain expenses such as asset valuation changes are excluded from UPF reporting. In addition, this item removes the effect of cash payments for whole-of-government schemes such as the State’s share of superannuation beneficiary payments reported in Treasury Administered’s expenses. Costs associated with these schemes are accrued annually. |
86
Budget Strategy and Outlook 2015-16
| 5 | Balance sheet and cash flows |
Features
| • | | The Government’s Debt Action Plan will reduce General Government Sector debt by approximately $7.5 billion in 2015-16, compared to the level of debt in the absence of measures. Further reductions across the forward estimates result in a debt reduction of $9.6 billion by 2017-18. |
| • | | This is the first budget since 1999-2000 that has projected a reduction in General Government Sector borrowings across the forward estimates, such that debt will be lower in 2018-19 than it was in 2014-15. |
| • | | General Government Sector debt, which incorporates the impact of the Debt Action Plan, as well as all other budget movements, is expected to fall from $43.268 billion in 2014-15 to $39.532 billion in 2017-18. This is $7.5 billion lower than the projection for 2017-18 at the time of the 2014-15 Mid Year Fiscal and Economic Review (MYFER) and $8.9 billion lower than projected in the 2014-15 Budget. |
| • | | Due to measures being implemented by the current Government refocusing the balance sheet to lower debt, Non-Financial Public (NFP) Sector debt by 2017-18 is projected to be $4.951 billion lower than the original 2014-15 Budget projections under the previous Government. |
| • | | In 2015-16, budgeted General Government Sector borrowings of $38.151 billion will be $7.946 billion lower than anticipated at 2014-15 MYFER. Meanwhile, budgeted NFP Sector borrowings will be around $4 billion lower as a direct result of the Government’s Debt Action Plan. |
| • | | Over 80% of General Government Sector capital purchases of $4.987 billion estimated for 2014-15 will be funded by operating cash flows. Over the period 2014-15 to 2018-19 around 87% of General Government Sector capital purchases are forecast to be funded by operating cash flows. This is consistent with the Government’s key fiscal principles of primarily funding capital from recurrent revenue, rather than borrowing. |
The balance sheet shows the projected assets, liabilities and net worth of the General Government Sector as at 30 June each financial year. It is important for the Government to maintain a strong balance sheet to provide it with the stability, flexibility and capacity to deal with emerging financial and economic pressures, and to provide a strong foundation for future economic growth.
87
Budget Strategy and Outlook 2015-16
The Review of State Finances document, released concurrently with the 2015-16 Budget, has confirmed the need for the Government to have the capacity to respond to market and environmental shocks. The Government recognises that this capacity is restricted where there are high levels of General Government Sector debt. The Review of State Finances, and the resultant Debt Action Plan, will see General Government Sector debt reduce substantially over the forward estimates while retaining government-owned corporations in public hands.
Table 5.1 provides a summary of the key balance sheet aggregates for the General Government Sector.
| Table 5.1 | General Government Sector: summary of budgeted balance sheet1 |
| | | | | | | | | | | | | | | | | | | | | | | | |
| | | 2014-15
Budget2
$ million | | | 2014-15
Est. Act.
$ million | | | 2015-16
Budget
$ million | | | 2016-17
Projection
$ million | | | 2017-18
Projection
$ million | | | 2018-19
Projection
$ million | |
Financial assets | | | 66,962 | | | | 67,920 | | | | 61,798 | | | | 61,965 | | | | 62,096 | | | | 62,397 | |
Non-financial assets | | | 197,556 | | | | 183,503 | | | | 187,058 | | | | 191,285 | | | | 195,428 | | | | 199,034 | |
Total assets3 | | | 264,518 | | | | 251,423 | | | | 248,856 | | | | 253,250 | | | | 257,525 | | | | 261,431 | |
Borrowings, advances and deposits | | | 48,685 | | | | 43,911 | | | | 38,833 | | | | 39,495 | | | | 40,204 | | | | 41,354 | |
Superannuation liability | | | 23,641 | | | | 25,744 | | | | 24,278 | | | | 22,672 | | | | 21,298 | | | | 20,003 | |
Other provisions and liabilities | | | 13,101 | | | | 11,760 | | | | 12,044 | | | | 12,495 | | | | 12,893 | | | | 13,308 | |
Total liabilities | | | 85,428 | | | | 81,415 | | | | 75,155 | | | | 74,663 | | | | 74,395 | | | | 74,665 | |
Net worth | | | 179,091 | | | | 170,007 | | | | 173,701 | | | | 178,588 | | | | 183,130 | | | | 186,766 | |
Net financial worth | | | (18,466 | ) | | | (13,496 | ) | | | (13,357 | ) | | | (12,697 | ) | | | (12,299 | ) | | | (12,268 | ) |
Net financial liabilities | | | 43,495 | | | | 35,891 | | | | 35,885 | | | | 35,654 | | | | 35,611 | | | | 36,174 | |
Net debt | | | 10,942 | | | | 6,056 | | | | 3,910 | | | | 4,405 | | | | 5,074 | | | | 6,307 | |
Notes:
| 1. | Numbers may not add due to rounding and bracketed numbers represent negative numbers. |
| 2. | Numbers have been restated where subsequent changes in classification have occurred. |
| 3. | For UPF purposes, the State’s assets are classified as either financial or non-financial assets. |
The General Government Sector holds the equity of the State’s public enterprises, principally its shareholding in government-owned corporations (GOCs) but also Public Financial Corporations like Queensland Treasury Corporation (QTC), in much the same manner as the parent or holding company in a group of companies. The estimated investment in public enterprises is included in the General Government Sector’s financial assets.
88
Budget Strategy and Outlook 2015-16
Financial assets of $67.920 billion are estimated for 2014-15, $958 million higher than originally budgeted for 2014-15. This is due primarily to an increase in the value of holdings in Public Financial Corporations, principally as a result of the gain on divestment of Queensland Motorways Limited by the Queensland Investment Corporation Trust at 30 June 2014, which was not budgeted.
In the year to 30 June 2016, financial assets are projected to decrease by $6.122 billion over the 2014-15 estimated actual, attributable principally to the draw down of long service leave investments, temporary suspension of investment of employer defined benefit contributions and capital returns from the Government’s energy network businesses as part of the Government’s Debt Action Plan.
Chart 5.1 shows forecast General Government Sector financial assets by category at 30 June 2016. Investments held to meet future liabilities, including superannuation and the Queensland Government Insurance Fund, comprise the major part of the State’s financial assets.
| Chart 5.1 | Forecast General Government Sector financial assets by category at 30 June 2016 |
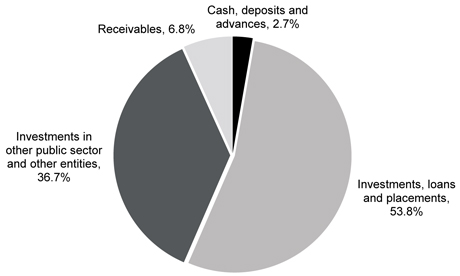
| 5.2.2 | Non-financial assets |
General Government Sector non-financial assets are estimated to total $183.503 billion at 30 June 2015, $14.053 billion lower than forecast at the 2014-15 Budget and $1.205 billion lower than in the 2014-15 MYFER.
89
Budget Strategy and Outlook 2015-16
The decrease since the 2014-15 Budget reflects the first time implementation of AASB13 Fair Value Measurement and the flow through of downward revaluations at 30 June 2014 primarily for reserve and leasehold land. These downward revaluations were incorporated in the 2014-15 MYFER.
Non-financial assets in the year ending 30 June 2016 are expected to grow by $3.555 billion over the 2014-15 estimated actuals, to be $187.058 billion at 30 June. These assets consist primarily of land and other fixed assets of $180.775 billion, the majority of which are roads, schools, hospitals and other infrastructure used to provide services to Queenslanders. Other non-financial assets of $6.283 billion held by the State include prepayments and deferred tax assets relating to income tax equivalents collected primarily from GOCs.
Since the mid-1990s, the Queensland Government has invested in new infrastructure at levels well beyond that of the other states. General Government Sector purchases of non-financial assets per capita have exceeded the average of the other states and territories for well over a decade (refer Chart 5.2).
| Chart 5.2 | General Government Sector per capita purchases of non-financial assets |
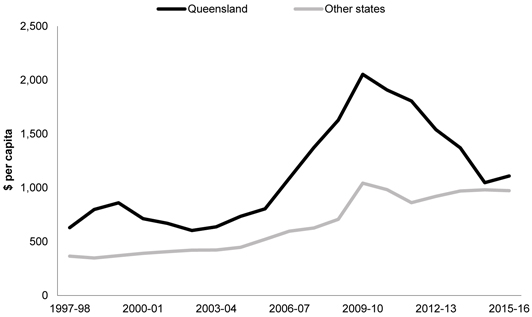
Source: ABS 5512.0, various state Budgets.
Following consideration of the Review of State Finances, the Government has established five fiscal principles, one of which aims to better manage the capital program to ensure a consistent flow of works to support jobs and the economy, and one that targets net operating surpluses that ensure any new capital investment in the General Government Sector is funded primarily through recurrent revenues rather than borrowing.
90
Budget Strategy and Outlook 2015-16
Purchases of non-financial assets for the General Government Sector are forecast to increase from $4.987 billion in 2014-15 estimated actual to $5.851 billion in 2018-19.
Forecast capital purchases for the General Government Sector and Public Non-Financial Corporations Sector over the period 2015-16 to 2018-19 is $35.362 billion, which is an average of $8.840 billion per annum. While its primary aim is to facilitate service delivery to Queenslanders, infrastructure investment makes an important contribution to the economy and is a cornerstone of the Queensland job market, particularly in the construction industry.
In terms of ensuring new capital investment in the General Government Sector is primarily funded through operating revenues, forecast net operating cash flows from 2015-16 to 2018-19 of $20.492 billion are funding capital purchases of $23.182 billion. Over this period, almost 90% of capital spending is funded by operating revenues.
The State has also entered into a number of finance leases, mainly in relation to Public Private Partnerships, totalling $2.376 billion over the period 2014-15 to 2018-19. There is no cash impact at commencement of these leases, however they do increase the level of non-financial assets and gross borrowing to the same extent.
General Government Sector
Estimated General Government Sector liabilities of $81.415 billion in 2014-15 are $4.013 billion lower than the 2014-15 Budget. This is mainly due to the flow through from 30 June 2014 of lower than expected gross borrowing. In addition, better than expected operating results and lower than expected capital outlays estimated for 2014-15 are contributing to the lower debt. Offsetting this is the flow through of the impact of lower than expected bond yields on the actuarially assessed superannuation and long service leave liabilities at 30 June 2014.
Total liabilities in the General Government Sector in 2015-16 are budgeted to decrease by a further $6.260 billion from 2014-15 estimated actual. This is primarily due to measures being implemented to refocus the balance sheet to lower debt as part of the Government’s Debt Action Plan.
Liabilities relating to employee entitlements (principally superannuation and long service leave) are projected to total $29.482 billion at 30 June 2016, a 3.8% decrease on the 2014-15 estimated actual. The State’s superannuation liability can be seen to decline over the forward estimates as a result of the defined benefit fund being closed to new entrants from 2009. In addition, as interest rates return to more normal levels (following a period of historically low bond yields) it is expected that their negative impact on superannuation liabilities will start to reverse.
General Government Sector borrowings of $38.151 billion are budgeted for 2015-16, a decrease of $5.117 billion over 2014-15 estimated actual. This decrease is primarily due to the combination of aligning gearing ratios of Government energy network businesses with the industry average, the draw down of long service leave assets and the temporary suspension of the investment of employer defined benefit contributions, to repay debt.
91
Budget Strategy and Outlook 2015-16
The remainder of the liabilities consist of payables and other liabilities such as unearned revenue and provisions.
The composition of the General Government Sector’s forecast liabilities at 30 June 2016 is illustrated in Chart 5.3.
The Government considers the General Government Sector debt to revenue ratio to be an important indicator consistent with its fiscal principle of targeting ongoing reductions in Queensland’s relative debt burden (refer Chart 1.6 in Chapter 1). Consistent with the practice of ratings agencies, less emphasis is now placed on the net financial liabilities to revenue ratio, which incorporates the superannuation liability.
| Chart 5.3 | Forecast General Government Sector liabilities by category, at 30 June 2016 |
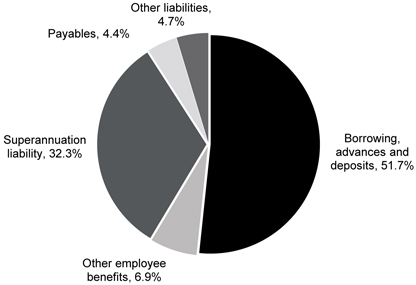
Non-Financial Public Sector borrowings
NFP Sector borrowings of $75.535 billion are expected for 2014-15, $4.421 billion lower than expected at the 2014-15 Budget.
NFP Sector borrowings of $74.113 billion are budgeted for 2015-16, a further decrease of $1.422 billion over 2014-15 estimated actual, largely reflecting the draw down of long service leave assets in response to the Review of State Finances.
92
Budget Strategy and Outlook 2015-16
The net financial worth measure is an indicator of financial strength. Net financial worth is defined as financial assets less all existing and accruing liabilities. Financial assets include cash and deposits, advances, financial investments, loans, receivables and equity in public enterprises.
The net financial worth measure is broader than the alternative measure – net debt – which measures only cash, advances and investments on the assets side and borrowings and advances on the liabilities side.
The net financial worth of the General Government Sector for 2014-15 is estimated at negative $13.496 billion, an improvement of $4.970 billion over the 2014-15 Budget mainly as a result of the flow through of lower borrowing in the outcomes at 30 June 2014. Net financial worth is expected to stabilise and improve slightly over the forward estimates period.
| 5.2.5 | Net financial liabilities |
Net financial liabilities are total liabilities less financial assets, other than equity investments in other public sector entities. This measure is broader than net debt as it includes other significant liabilities, rather than just borrowings (for example, accrued employee liabilities such as superannuation and long service leave entitlements).
The net financial liabilities of the General Government Sector for 2014-15 are estimated to be $35.891 billion, $7.604 billion lower than 2014-15 Budget. This largely reflects the flow through of lower borrowings in the outcomes at 30 June 2014 and the increase in dividends receivable from energy GOCs as a result of the revisions to their capital structure and dividend policy.
Net financial liabilities are expected to stabilise from 2014-15 as movements in borrowings and financial assets offset each other.
The net worth, or equity, of the State is the amount by which the State’s assets exceed its liabilities. This is the value of the investment held on behalf of the people of Queensland by public sector instrumentalities.
Changes in the State’s net worth occur for a number of reasons including:
| • | | operating surpluses (deficits) that increase (decrease) the Government’s equity |
| • | | revaluation of assets and liabilities as required by accounting standards. For example, the Government’s accruing liabilities for employee superannuation and long service leave are determined by actuarial assessments |
| • | | movements in the net worth of the State’s investments in the Public Non-Financial Corporations and Public Financial Corporations sectors |
| • | | gains or losses on disposal of assets. Where the selling price of an asset is greater (less) than its value in an agency’s accounts, the resultant profit (loss) affects net worth. |
93
Budget Strategy and Outlook 2015-16
The net worth of the General Government Sector in 2014-15 is estimated to be $170.007 billion. This is $9.084 billion lower than forecast in the 2014-15 Budget primarily due to the downward revaluation of reserve and leasehold land at 30 June 2014 (under AASB13 Fair Value Measurement) and higher superannuation liabilities as a result of lower bond rates, offset by lower stocks of borrowings.
From 2015-16, net worth is projected to steadily increase mainly as a result of the growth in non-financial assets.
Net debt is the sum of advances received and borrowings less cash and deposits, advances paid and investments, loans and placements.
Net debt for the General Government Sector in 2014-15 is estimated to be $6.056 billion, $4.886 billion less than the 2014-15 Budget. Net debt will reduce by a further $2.146 billion to be $3.910 billion in 2015-16 as a result of the Government’s Debt Action Plan.
In the Non-Financial Public Sector, net debt is estimated at $36.083 billion in 2014-15, $5.434 billion less than the 2014-15 Budget. Net debt is expected to increase to $38.201 billion in 2015-16 and then grow slowly in line with borrowings through to 2018-19.
The cash flow statement provides information on the Government’s estimated cash flows from its operating, financing and investing activities.
The cash flow statement records estimated cash payments and cash receipts and hence differs from accrued revenue and expenditure recorded in the operating statement. In particular, the operating statement records certain revenues and expenses that do not have an associated cash flow (for example, depreciation expense). The timing of recognition of accrued revenues or expenses in the operating statement may differ from the actual cash disbursement or receipt (for example, tax equivalents). A reconciliation between the cash flows from operations and the operating statement is provided in Table 5.2.
The cash flow statement also records cash flows associated with investing and financing activities that are otherwise reflected in the balance sheet. For example, purchases of capital equipment are recorded in the cash flow statement and impact on the balance sheet through an increase in physical assets.
The cash flow statement provides the cash surplus (deficit) measure which is comprised of the net cash flow from operating activities plus the net cash flow from investment in non-financial assets (or physical capital).
The Australian Bureau of Statistics Government Finance Statistics (GFS) surplus (deficit) is derived by including the initial increase in liability at the commencement of finance leases in the cash surplus (deficit). This measure is also used to derive the Loan Council Allocation nomination, provided in Chapter 8.
94
Budget Strategy and Outlook 2015-16
The estimated General Government Sector cash deficit of $487 million in 2014-15 is $1.855 billion lower than that forecast at the time of the 2014-15 Budget. This is largely due to the lower than expected capital program and improved operating position.
After taking into account a capital program of $5.374 billion, a cash deficit of only $584 million is forecast for 2015-16, demonstrating the Government’s commitment to funding new capital investment primarily through net operating surpluses.
Net cash flows from investments in financial assets for policy purposes include net cash flows from disposal or return of equity, and net equity injections into GOCs. Cash flows from the return of equity in the energy network businesses as a result of the Debt Action Plan are expected to total $3.482 billion over the period 2015-16 to 2018-19.
Net cash flows from investments in financial assets for liquidity purposes represent net investment in financial assets to cover liabilities such as superannuation, other employee entitlements and insurance. The draw down of long service leave assets and suspension of employer defined benefit contributions as a result of the Debt Action Plan flow through this line in the Statement of Cash Flows.
Total General Government Sector capital purchases of $5.374 billion are budgeted for 2015-16 and, over the period 2015-16 to 2018-19, capital expenditure is expected to total $23.182 billion in the General Government Sector. As discussed in 5.2.2, this capital is funded to the extent of almost 90% by operating cash flows.
95
Budget Strategy and Outlook 2015-16
| 5.4 | Reconciliation of operating cash flows to the operating statement |
Table 5.2 provides a reconciliation of the cash flows from operating activities to the operating result for the General Government Sector.
| Table 5.2 | General Government Sector: reconciliation of cash flows from operating activities to accrual operating activities1 |
| | | | | | | | |
| | | 2014-15
Est. Act.
$ million | | | 2015-16
Budget
$ million | |
Revenue from transactions | | | 49,578 | | | | 51,186 | |
Plus/(less) movement in tax equivalent and dividend receivables | | | (363 | ) | | | 343 | |
Plus GST receipts | | | 1,921 | | | | 1,764 | |
Plus/(less) movement in other receivables | | | (318 | ) | | | (437 | ) |
Equals cash receipts from operating activities | | | 50,818 | | | | 52,856 | |
Expenses from transactions | | | 48,615 | | | | 49,973 | |
(Less) non-cash items | | | | | | | | |
Depreciation and amortisation expense | | | (3,116 | ) | | | (3,264 | ) |
Accrued superannuation expense | | | (1,803 | ) | | | (1,750 | ) |
Accrued employee entitlements | | | (613 | ) | | | (648 | ) |
Other accrued costs | | | (155 | ) | | | (81 | ) |
Plus superannuation benefits paid – defined benefit | | | 1,856 | | | | 1,943 | |
Plus/(less) movement in employee entitlement provisions | | | 386 | | | | 275 | |
Plus/(less) GST paid | | | 1,847 | | | | 1,786 | |
Plus/(less) movement in other provisions and payables | | | (286 | ) | | | 137 | |
Equals cash payments for operating activities | | | 46,731 | | | | 48,372 | |
Note:
| 1. | Numbers may not add due to rounding. |
The main difference between the accrual operating statement and the cash flow relates to the timing of cash payments and receipts and their recognition in accrual terms and the inclusion of non-cash expenses and revenues. The largest differences between accrual accounting and cash flows are in relation to depreciation and superannuation. Differences due to the timing of receipt or payment of amounts are recorded as either a receivable or payable in the balance sheet.
96
Budget Strategy and Outlook 2015-16
| 6 | Intergovernmental financial relations |
Features
| • | | The Queensland Government is committed to working with the Australian Government to achieve outcomes for Queenslanders. The fiscal constraints facing all levels of government are well understood, but the Australian Government’s plan to grow health funding in line with Consumer Price Index (CPI) and population, and education funding with CPI and enrolments is not sustainable. This is expected to result in $18 billion worth of Australian Government cuts over the next decade based on Queensland’s population share. This highlights the importance of the White Paper processes on Federalism and Tax Reform to ensure federal financial relations are sensible and sustainable, and do not simply cost shift to the states. |
| • | | The White Paper processes provide an opportunity to restructure federal-state relations, clarify roles and responsibilities, improve the long-term sustainability of government finances, create a fairer and simpler tax system and consider the merits of the current horizontal fiscal equalisation system. |
| • | | The 2015-16 Commonwealth Budget extended funding for a number of key agreements – early childhood education, homelessness and legal assistance services. However, funding cuts made to health ($11.8 billion) and education ($6 billion) in the 2014-15 Commonwealth Budget remain a significant ongoing fiscal challenge for Queensland. Not addressing these cuts in the 2015-16 Commonwealth Budget, combined with parameter adjustments to growth funding, only adds to these challenges. Equally concerning is the lack of advice on funding for mental health reforms and key Queensland infrastructure projects. |
| • | | The Queensland Government notes the Australian Government’s budget measures to assist development of infrastructure in northern Australia. North Queensland has the potential to be the growth engine of our State and the nation, and infrastructure is a key part of driving this growth. Queensland deserves our fair share of this funding. |
| • | | Estimated Australian Government funding in 2015-16 for Queensland is $23.747 billion. Queensland is estimated to receive $10.757 billion in payments for specific purposes, with $850 million as National Specific Purpose Payments, $3.229 billion as National Health Reform funding, $3.534 billion as Students First funding and $3.145 billion as National Partnership payments including Natural Disaster Relief and Recovery Arrangements. |
| • | | The Queensland Government welcomes acceptance of the Commonwealth Grants Commission (CGC) 2015 Methodology Review recommendations for states’ goods and services tax (GST) shares in 2015-16. Increases to Queensland’s GST share duly recognise the impact of factors beyond the State’s control on its fiscal capacity, such as the significant rebuilding expenses following natural disasters in 2011 and 2012. |
| • | | Queensland is estimated to receive $12.990 billion of GST revenue in 2015-16, $1.509 billion more than its population share. Total GST revenue to all states is expected to be $57.050 billion in 2015-16, an increase of $3.050 billion or 5.6% on 2014-15. |
97
Budget Strategy and Outlook 2015-16
| 6.1 | Federal financial arrangements |
Federal financial relations in Australia are characterised by vertical fiscal imbalance (VFI). This is where the Australian Government’s own spending responsibilities are less than its revenue, and State and Territory governments’ spending responsibilities are greater than their revenue. The Australian Government collected the majority of taxation revenues (81%) in 2013-14, whilst the states collected 16% and local governments collected the remaining 3%.1 The states and territories (states)2 require grants from the Australian Government to meet their spending responsibilities. These grants represent 45.3% of all states’ revenues in 2015-16, based on the Australian Government budget estimates.3
VFI in Australia arises from a number of factors including:
| • | | The Australian Constitution, which precludes states from levying customs duty or excise duty, or introducing taxes based on the value of goods produced, for example, a consumption or retail tax. |
| • | | Restrictions imposed by the Australian Government, particularly on the states’ levying of income tax. While the Constitution permits states to levy income tax, High Court decisions effectively allow the Australian Government to obstruct the states’ application of this power through its ability to reduce other grants to offset any revenue benefits to a state that chooses to raise its own income tax. |
| • | | Agreements with the Australian Government, which prevent reinstatement of taxes that were abolished under the arrangements associated with the introduction of the GST. These include a number of duties and financial taxes, such as debits tax. |
In Australia, governments look to address VFI through a system of intergovernmental grants from the Australian Government to the states. Just over half these grants are untied ‘general revenue assistance’, mainly the proceeds from the GST. Most other grants are payments for specific purposes, provided to fund particular activities.
National tax reform and other changes since 2000 have led to an increase in VFI. Chart 6.1 shows that while the states received 35% of their revenues from the Australian Government in 1999-2000, this is forecast to increase to 45.3% in 2015-16. In contrast, the proportion of the states’ General Government Sector revenues from state taxes has declined from 39.8% in 1999-2000 to 32.4% in 2015-16.
| 1 | ABS Government Finance Statistics Cat No. 5506.0. |
| 2 | States refers to States and Territories unless otherwise specified. |
| 3 | National aggregates and interstate comparisons in this chapter will use Australian Government estimates for consistency. Queensland specific figures are consistent with Queensland Budget estimates. |
98
Budget Strategy and Outlook 2015-16
| Chart 6.1 | General Government revenue sources, all states, 1999-2000 and 2015-161 |
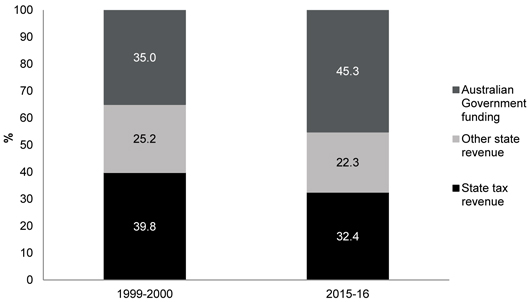
Note:
Sources: ABS Government Finance Statistics Cat No. 5512.0 and State and Commonwealth Budgets, 2015-16.
One of the outcomes of VFI has been overlap and duplication in roles and responsibilities relating to service delivery and infrastructure provision, particularly in the areas of health and education. This can result in excessive administration, unnecessary additional costs, blurred accountability and a misallocation of resources to areas of lower priority. Receiving a significant proportion of their revenue through Australian Government grants leaves states subject to unilateral decisions by the Australian Government affecting the stability and predictability of their finances. Reforms to address VFI are being explored as part of the Australian Government’s White Paper process.
Another important element of Australian federal financial arrangements is the process of horizontal fiscal equalisation (HFE). Like many federations, different Australian states have different capacities to raise revenue or deliver services due to factors largely beyond their control, such as demography, socio-economic status, geography and natural resources. The HFE process is designed to equalise states’ fiscal capacities. Under the process, GST revenue is distributed amongst state governments so they have the capacity to provide similar levels of services to their communities.
The CGC provides advice to the Treasurer of Australia on the distribution of GST revenue.
99
Budget Strategy and Outlook 2015-16
| 6.1.1 | 2015-16 Commonwealth Budget |
The 2015-16 Commonwealth Budget was released on 12 May 2015. The Commonwealth Budget provided short-term extensions of funding for a range of essential agreements including early childhood education, homelessness, legal assistance services and adult public dental services, but provided no advice on funding for mental health reforms. It is essential in the future that the renegotiation of National Partnership Agreements (NPs) is a genuine collaboration and not a unilateral decision to extend payments made just weeks before the Commonwealth Budget.
The implications of the 2014-15 Commonwealth Budget, including a number of revisions and reversals to funding agreements unilaterally determined by the Australian Government, remain an ongoing fiscal challenge for Queensland. Not addressing these issues in the 2015-16 Commonwealth Budget, combined with changes in parameter adjustments to growth funding (such as lower estimates of population and lower wage cost index), will have ongoing implications for the capacity of the State to fund growth in services to meet demand. More information on the implications of the 2014-15 Commonwealth Budget is provided in Box 6.1.
Despite the additional funding for some NPs, the 2015-16 Commonwealth Budget does not provide ongoing funding certainty, with most funding arrangements relatively short term (less than three years). This poses a considerable risk for Queensland to manage future service delivery responsibilities when faced with uncertainty around the Australian Government’s willingness to remain committed to longer term agreements. How these issues are addressed in the White Paper processes will be crucial to ensure Queensland has a sustainable revenue stream to meet our service delivery responsibilities.
Queensland will closely consider the potential impacts and implications for the State of the White Paper on Developing Northern Australia, and is keen to work with the Australian Government to identify north Queensland infrastructure needs and priority projects for targeted funding.
100
Budget Strategy and Outlook 2015-16
| Box 6.1 | Reductions in Australian Government funding to health and education |
In the 2014-15 Commonwealth Budget, the Australian Government announced revised funding arrangements for public hospitals (from 1 July 2017) and schools (from 1 January 2018), resulting in expected funding cuts to the states of over $80 billion in the period to 2024-25.
Based on Australian Government estimates, Queensland’s share of these funding cuts is expected to be around $11.8 billion for public hospital funding and around $6 billion in schools funding, in total across the period from 2017-18 to 2024-25 (as shown in Chart 6.2). The 2015-16 Commonwealth Budget continued this funding decision.
| Chart 6.2 | Reduced Australian Government funding for health and education |
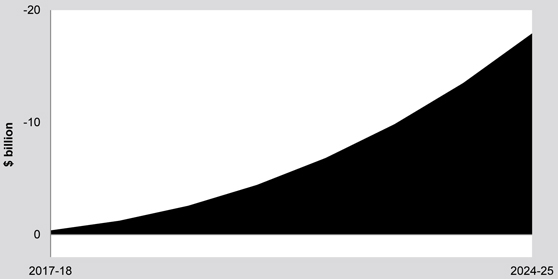
The reduction in health, education and other funding represents a significant cost shift from the Australian Government to Queensland’s budget, increasing the fiscal burden on Queensland if the State has to find the lost funding.
From 1 July 2017 the Australian Government’s funding contribution for public hospitals will grow in line with CPI and population growth only, irrespective of demand or activity. Similarly, from the 2018 school year, the Australian Government’s changes will index recurrent school funding by CPI only, with an allowance for changes in enrolments, resulting in a reduction of around $6 billion to 2024-25 compared with previous indexation arrangements.
The removal of billions of dollars of Australian Government funds from core services in Queensland highlights the volatility and vulnerability of the state revenue base to Australian Government actions. This underlines the importance of federalism reform to ensure an appropriate allocation of roles and responsibilities, supported by a sustainable revenue stream to meet our service delivery responsibilities.
101
Budget Strategy and Outlook 2015-16
| 6.1.2 | Opportunities for reform |
The Australian Government’s ambitious economic and fiscal reform agenda includes the National Commission of Audit (NCoA) and White Paper processes on Federalism and Tax Reform.
The Queensland Government is supportive of the White Paper processes on Federalism and Tax Reform and is working productively with the Australian Government and other states to address the key challenges faced by the nation, including the need to restructure federal-state relations, make government finances more sustainable, and to foster robust and diverse economic growth across the nation.
Funding cuts in the 2014-15 Commonwealth Budget remain an ongoing fiscal challenge for Queensland, and not addressing these cuts in the 2015-16 Commonwealth Budget adds to these challenges, and highlights the need to secure sustainable financial positions for states.
The context for the White Papers was set by the NCoA report which was critical of the size of the federal bureaucracy and the duplication of state functions. The NCoA recommended a comprehensive review of roles and responsibilities of the Australian and state governments be undertaken.
To assist, a Steering Committee, chaired by the Australian Government and involving all state governments and the Australian Local Government Association, was established to oversee the development of the Federalism White Paper. The Tax Reform White Paper is being coordinated by the Australian Treasury.
The Federalism White Paper seeks to clarify roles and responsibilities to ensure states are sovereign in their own spheres and reduce duplication between levels of government. Broadly it will consider: (i) improvements to federation governance and accountability arrangements; (ii) improving allocation of roles and responsibilities across the key reform areas of Health, Education, and Housing and Homelessness; and (iii) federal financial relations, and addressing VFI and the merits of and potential reform to the current system of HFE.
The objective of the White Paper on Tax Reform is to achieve a better tax system that delivers taxes that are lower, simpler, and fairer – a system that supports higher economic growth and living standards, improves international competitiveness and is able to adjust to a changing economy. This is achieved by raising the revenue needed without imposing unnecessary costs on the economy.
As part of the White Paper processes, Queensland will be focused on ensuring state sovereignty over its policy and service delivery responsibilities is maintained and supported by sustainable revenue streams.
The Australian Government and states are committed to considering expenditure responsibilities across a range of areas, and the parallel consideration of tax reform means that appropriate revenue arrangements can also be addressed. Approaches that increase the likelihood of successful reform will inevitably involve better division of roles and responsibilities to reduce VFI, and a combination of Australian Government and state tax reform.
Further detail on the White Paper processes is provided in Box 6.2.
102
Budget Strategy and Outlook 2015-16
| Box 6.2 | Federalism and Tax Reform White Papers |
In 2013, the Australian Government announced the preparation of two White Papers on Federalism and Tax Reform, to be prepared collaboratively with states.
The White Paper processes present an opportunity for Queensland to ensure reforms align with the Queensland Government’s objectives, clarify federal-state relations, improve the sustainability and efficiency of Queensland’s revenue base, and address VFI.
Federalism White Paper
The Federalism White Paper seeks to clarify roles and responsibilities to ensure states are sovereign in their own spheres and reduce duplication between levels of government. Ensuring states have access to a sustainable and stable revenue base will also need to be considered and will link with the Australian Treasury led Tax Reform White Paper process. The key sectors under consideration for reform of roles and responsibilities are health, education, housing and homelessness.
The key principles that the federalism reform process aims to address include: subsidiarity; equity, efficiency and effectiveness of service delivery; national interest; accountability and outcomes; durability; and fiscal sustainability.
A number of issues papers have been released and public consultation forums held to consider the issues of federalism. A draft Discussion Paper was released in June 2015, to be followed by release of the Green Paper, and the White Paper by the end of 2015 or early 2016.
Tax Reform White Paper
On 30 March 2015, the Australian Government released the first Tax Reform issues paper “Re:think” for public consultation. The Australian Government’s issues paper has begun the consultation process for future directions of Australia’s tax system including state taxes.
The Queensland Government will take a lead role in shaping the direction of this process, including the special Treasurers’ Tax Summit in August 2015 with a view to providing options for the Green Paper which will be released in late 2015, followed by a White Paper later in 2016.
From this process the Queensland Government supports improved efficiency and equity of Australia’s tax system and a fair and sustainable model of distribution of all tax revenues to encourage economic growth, supported by a division of roles and responsibilities which reduces the current inefficient levels of VFI.
Queensland has undertaken tax reform over the past decade and a half, with reform of its mix, design and administration, and removal of a large number of less efficient taxes. However Queensland does not have the fiscal capacity to simply cut its own taxes given the need to ensure Queenslanders can access quality services.
States face significant spending pressures, reflecting rising community expectations about the breadth and quality of services delivered. States require reliable streams of revenue, but also capacity to adjust their levels of revenue to allow them to meet fiscal and economic challenges that arise.
103
Budget Strategy and Outlook 2015-16
| 6.2 | Australian Government funding to the states |
The framework for federal financial relations is set out in the Intergovernmental Agreement on Federal Financial Relations (IGA). The IGA outlines the Australian Government’s commitment to provide ongoing financial support to the states through two types of grants - general revenue assistance and payments for specific purposes.
General revenue assistance grants are able to be used by the states for any purpose (untied funding). Payments for specific purposes are considered tied funding, where the state is restricted in how the funding can be spent (either by sector or for specific projects or reforms). Chart 6.3 outlines Australian Government grants to states.
| Chart 6.3 | Breakdown of Australian Government grants to states, 2015-161 |
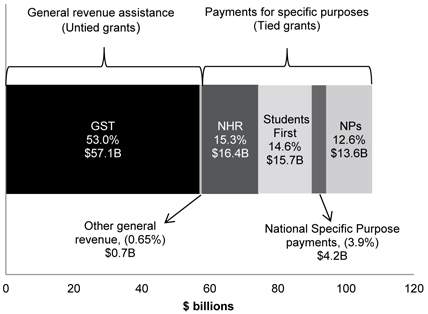
Note:
| 1. | NHR is funding under the National Health Reform. NPs is funding for National Partnership payments. |
Source: Commonwealth Budget 2015-16 and Queensland Treasury estimates.
104
Budget Strategy and Outlook 2015-16
Table 6.1 shows total Australian Government payments to the states in 2015-16 are expected to be $107.711 billion, an increase of $6 billion or 5.9% in nominal terms when compared with 2014-15. This increase is primarily driven by increases to the GST. These figures are based on 2015-16 Commonwealth Budget estimates.
GST revenue from the Australian Government to all states is expected to be $57.050 billion in 2015-16, an increase of 5.6% in nominal terms. In real per capita terms, GST is expected to increase by 1.3% in 2015-16.
Total payments for specific purposes in 2015-16 are expected to be $49.962 billion, a 7.4% increase in nominal terms and a 3.0% increase in real per capita terms compared with 2014-15.
| Table 6.1 | Estimated Australian Government payments to the states, 2014-15 and 2015-161 |
| | | | | | | | | | | | | | | | | | | | | | | | |
| | | 2013-14
Actual
$ million | | | 2014-15
Est. Act.
$ million | | | 2015-16
Budget
$ million | | | Change
Nominal
Terms
% | | | Change
Real
Terms
% | | | Change
Real Per
Capita
% | |
GST revenue | | | 51,090 | | | | 54,000 | | | | 57,050 | | | | 5.6 | | | | 3.1 | | | | 1.3 | |
Payments for specific purposes | | | | | | | | | | | | | | | | | | | | | | | | |
National Partnership payments | | | 14,534 | | | | 12,272 | | | | 13,557 | | | | | | | | | | | | | |
National Specific Purpose Payments | | | 10,415 | | | | 4,135 | | | | 4,222 | | | | | | | | | | | | | |
National Health Reform Funding | | | 13,841 | | | | 15,459 | | | | 16,441 | | | | | | | | | | | | | |
Students First – Education Reform Funding | | | 6,766 | | | | 14,664 | | | | 15,743 | | | | | | | | | | | | | |
Total payments for specific purposes | | | 45,557 | | | | 46,530 | | | | 49,962 | | | | 7.4 | | | | 4.8 | | | | 3.0 | |
Other general revenue2 | | | 1,300 | | | | 1,178 | | | | 699 | | | | | | | | | | | | | |
Total payments | | | 97,948 | | | | 101,708 | | | | 107,711 | | | | 5.9 | | | | 3.3 | | | | 1.6 | |
Notes:
| 1. | Numbers may not add due to rounding. |
| 2. | Include payments to the Australian Capital Territory for municipal services, compensation for reduced royalties, royalties and Snowy Hydro Limited tax compensation. |
Source: Commonwealth Budget 2015-16 and Queensland Treasury estimates.
105
Budget Strategy and Outlook 2015-16
Table 6.2 shows the expected shares of total Australian Government payments to each state for 2015-16 compared with each state’s population share.
Queensland is expected to receive payments above its population share, with above-population shares of payments for both general and specific purposes, for reasons explained in Section 6.4 and 6.5.
| Table 6.2 | Relative shares of Australian Government payments to the states, 2015-161 |
| | | | | | | | | | | | |
| | | Share of
payments2
% | | | Share of
population
% | | | Relative
share3
% | |
New South Wales | | | 30.5 | | | | 31.9 | | | | 95.5 | |
Victoria | | | 23.0 | | | | 24.9 | | | | 92.4 | |
Queensland | | | 21.7 | | | | 20.1 | | | | 108.0 | |
Western Australia | | | 7.0 | | | | 11.2 | | | | 62.8 | |
South Australia | | | 8.5 | | | | 7.1 | | | | 120.1 | |
Tasmania | | | 3.2 | | | | 2.1 | | | | 149.0 | |
Australian Capital Territory | | | 1.8 | | | | 1.6 | | | | 106.8 | |
Northern Territory | | | 4.3 | | | | 1.0 | | | | 414.3 | |
Notes:
| 1. | Numbers may not add due to rounding. |
| 2. | Excludes payments unallocated among the states and territories in the Commonwealth Budget papers and royalties paid by the Australian Government to Western Australia and the Northern Territory. |
| 3. | A state’s relative share is measured as its funding share as a percentage of its population share (may not divide due to rounding). |
Source: Commonwealth Budget 2015-16.
106
Budget Strategy and Outlook 2015-16
| 6.3 | Australian Government funding to Queensland |
This section reflects the Queensland Government’s estimates of proposed Australian Government funding.
Queensland’s reliance on Australian Government funding is expected to increase from 34.8% in 1999-2000 to an estimated 46.4% in 2015-16 (see Chart 6.4). This is consistent with the national trend (shown in Chart 6.1), with states receiving 45.3% of their revenues from the Australian Government in 2015-16, compared to 35% in 1999-2000.
National tax reform and other changes since 2000 have led to an increase in vertical fiscal imbalance and reliance on Australian Government funding.
| Chart 6.4 | General Government Sector revenue sources, Queensland, 2015-16 |
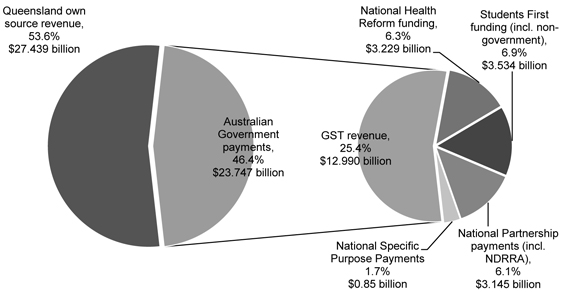
Sources: Commonwealth Budget 2015-16 Paper No. 3 and Queensland Treasury estimates.
107
Budget Strategy and Outlook 2015-16
Estimated Australian Government funding in 2015-16 for Queensland, included in the 2015-16 Queensland Budget, is $23.747 billion4, an increase of $1.733 billion or 7.9% compared with 2014-15 (as shown in Table 6.3).
| Table 6.3 | Estimated Australian Government payments to Queensland1, 2 |
| | | | | | | | | | | | | | | | | | | | | | | | |
| | | 2013-14
Actual
$ million | | | 2014-15
Est. Act.
$ million | | | 2015-16
Budget
$ million | | | Change
Nominal
Terms
% | | | Change
Real
Terms
% | | | Change
Real Per
Capita
% | |
GST revenue | | | 10,823 | | | | 11,746 | | | | 12,990 | | | | 10.6 | | | | 8.2 | | | | 6.2 | |
GST balancing item3 | | | 73 | | | | 69 | | | | — | | | | | | | | | | | | | |
Total payments for general purposes | | | 10,896 | | | | 11,816 | | | | 12,990 | | | | | | | | | | | | | |
Payments for specific purposes | | | | | | | | | | | | | | | | | | | | | | | | |
National Partnership payments (excluding NDRRA4) | | | 1,889 | | | | 1,917 | | | | 2,039 | | | | | | | | | | | | | |
NDRRA | | | 1,515 | | | | 1,163 | | | | 1,106 | | | | | | | | | | | | | |
National Specific Purpose Payments | | | 807 | | | | 831 | | | | 850 | | | | | | | | | | | | | |
National Health Reform Funding | | | 2,815 | | | | 3,057 | | | | 3,229 | | | | | | | | | | | | | |
Students First – Education Reform Funding | | | 2,926 | | | | 3,231 | | | | 3,534 | | | | | | | | | | | | | |
Total payments for specific purposes | | | 9,951 | | | | 10,198 | | | | 10,757 | | | | 5.5 | | | | 3.2 | | | | 1.3 | |
Total payments | | | 20,847 | | | | 22,014 | | | | 23,747 | | | | 7.9 | | | | 5.5 | | | | 3.6 | |
Notes:
| 1. | Numbers may not add due to rounding. |
| 2. | Does not include Australian Government funding direct to Local Governments. |
| 3. | The balancing adjustment accounts for differences between the GST paid to states and the final GST pool size and population outcomes in the prior year (2012-13 and 2013-14). |
| 4. | NDRRA is funding for the Natural Disaster Relief and Recovery Arrangements. |
Sources: Commonwealth Budget 2015-16 Paper No. 3 and Queensland Treasury estimates.
Queensland expects to receive $12.990 billion of GST revenue in 2015-16, $1.509 billion greater than its population share. In the same year, total payments for specific purposes are forecast to be $10.757 billion, with $3.229 billion as National Health Reform funding, $3.534 billion as Students First funding, $850 million as National Specific Purpose Payments and $2.039 billion as National Partnership payments. Payments for Natural Disaster Relief and Recovery Arrangements (NDRRA) are estimated to be $1.106 billion in 2015-16.
| 4 | This figure differs to Chapter 3 Australian Government grants estimates, due to the exclusion of direct Australian Government payments to Queensland departments for Commonwealth own purpose expenditure. |
108
Budget Strategy and Outlook 2015-16
Under the terms of the Intergovernmental Agreement on Federal Financial Relations (IGA), states receive the revenue collected by the Australian Government’s GST. The IGA also required GST revenue to be distributed on the basis of horizontal fiscal equalisation (HFE) principles. The application of HFE principles aims to give all states the same fiscal capacity to deliver services to their populations after the distribution of the GST, taking into account states’ capacities to raise revenue from their own sources, as well as their different expenditure needs.
The CGC is tasked with recommending state shares of GST funding to the Australian Government. The amount of GST revenue received by an individual state is determined by the national pool of revenue collected through the GST and the Australian Government’s determination of the distribution of that revenue amongst the states.
In April 2015, the Australian Government released the results of the CGC’s 2015 Review of Methodology (the 2015 Review) used to determine the distribution of GST among the states. The 2015 Review considered the recommendations of the 2012 GST Distribution Review, the implications of recent national reforms (such as the National Disability Insurance Scheme) on the GST distribution, and other improvements and simplifications to the methodology. More information on the 2015 Review is provided in Box 6.3.
The White Paper on Reform of the Federation is to consider the merits and potential reforms to the current HFE process.
| 6.4.1 | Queensland’s share of GST revenue |
The Australian Government has accepted the CGC’s recommendations of GST revenue sharing relativities as the basis for the distribution of the GST revenue to the states in 2015-16.
In the 2015 Review, the CGC recommended an underlying increase in Queensland’s share of GST revenue of $556 million in 2015-16, as shown in Table 6.4.
| Table 6.4 | GST share and underlying impact of relativities, 2015-161 |
| | | | | | | | | | | | | | | | | | | | | | | | | | | | | | | | |
| | | NSW | | | Vic. | | | Qld | | | WA | | | SA | | | Tas. | | | ACT | | | NT | |
Underlying impact of relativities2 ($ million) | | | (517 | ) | | | 131 | | | | 556 | | | | (494 | ) | | | 284 | | | | 225 | | | | (129 | ) | | | (56 | ) |
GST Share ($ million) | | | 17,295 | | | | 12,730 | | | | 12,990 | | | | 1,915 | | | | 5,518 | | | | 2,236 | | | | 1,032 | | | | 3,335 | |
GST per capita ($) | | | 2,251 | | | | 2,121 | | | | 2,679 | | | | 713 | | | | 3,229 | | | | 4,324 | | | | 2,614 | | | | 13,234 | |
Notes:
| 1. | Bracketed numbers represent negative amounts. |
| 2. | The underlying impact reflects the change to Queensland’s GST share from the CGC’s new relativities using estimated 2015-16 GST pool size and populations. |
Sources: Commonwealth Budget 2015-16, Commonwealth Grants Commission Report on GST Revenue Sharing Relativities 2015 Review.
109
Budget Strategy and Outlook 2015-16
Queensland’s share of GST for 2015-16 has increased due to:
| • | | A higher level of NDRRA expenses, due to the high level of disaster spending in 2013-14 relating to 2011 and 2012 disaster events. NDRRA expenses are shared between the Australian Government and states, with the Australian Government providing reimbursement for a proportion of state expenses resulting from a natural disaster. The GST distribution takes into account the proportion of NDRRA expenses that are not reimbursed by the Australian Government, as these arise from circumstances beyond states’ control. |
| • | | Strong mining production value in Western Australia in 2013-14, which reduced the GST redistributed away from Queensland due to its mining royalties, and changes to the mining assessment methodology. As the CGC’s assessments are lagged by two years, this affects GST shares in 2015-16. These gains were partially offset by changes to the methodology for transport infrastructure and services expenses. |
More detail on the outcomes of the 2015 Review is in Box 6.3.
For the last few years, Queensland’s single year relativity has been above 1.0, that is, Queensland has been assessed as having a lower than average fiscal capacity and requiring a greater than population share of GST. This reflects the relatively higher cost of service provision in the State.
In the 2015 Review Final Report, Queensland received its highest single year relativity since the introduction of the GST, a result that was driven primarily by short term factors outside of the State’s control such as the significant rebuilding following natural disasters in Queensland.
To determine the GST share of each state, the CGC uses a three year average of single year relativities (with a two year lag). This dampens the impact of single year relativity changes so that states’ GST shares are more predictable and less volatile.
As shown in Chart 6.5, Queensland’s three year average relativity has risen above 1.0 for the third consecutive year, meaning that Queensland will receive a greater than population share of GST in 2015-16. The impact of the historically high 2013-14 single year relativity is likely to keep Queensland’s three year average relativity above 1.0 for the next few years, but many of the factors driving the 2013-14 result are short term.
Net expenses for NDRRA are expected to be lower in 2014-15, and Western Australia’s mining revenue has been adversely affected by a fall in iron ore prices. Queensland’s share of GST can be expected to move closer to 1.0 once the short term impact of 2013-14 factors are removed from the averaging process.
110
Budget Strategy and Outlook 2015-16
| Chart 6.5 | Queensland’s GST Relativity, 2000-2001 to 2014-151 |
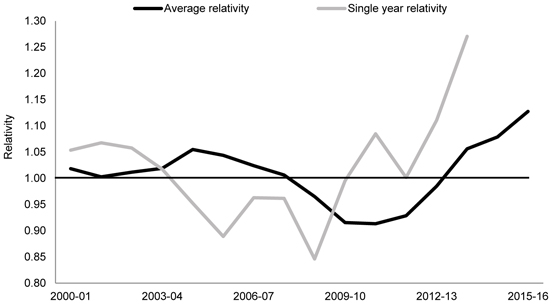
Note:
| 1. | GST shares have used a three year average of single year relativities since 2010-11. Previous average relativities were based on a five year average of single year relativities. Average relativities are calculated with a two year lag. |
Sources: Commonwealth Grants Commission Report on GST Revenue Sharing Relativities 2015 Review, Queensland Treasury.
In general, the CGC assesses Queensland as having higher than average expenditure needs, due to the state’s higher proportions of remote and Indigenous populations. Other factors, such as a higher capacity to raise revenue from mining royalties and lower assessed public sector wage costs offset these additional needs.
In the longer term, Queensland’s fiscal capacity can be expected to be around the average of states (relativity of 1.0). However, many of the factors impacting Queensland’s relativity are volatile, such as transfer duty, mining revenue, natural disaster relief and other Australian Government payments.
Mining revenue is heavily influenced by volatile commodity prices, while Queensland’s relative capacity to raise revenue from transfer duty is driven by differences in the timing of property cycles between states and NDRRA expenses are driven by the incidence of large disasters.
The significant impact of volatile factors means that while Queensland’s relativity may be around the average of states in the longer term, on an annual basis it will continue to fluctuate, and be above 1.0 in some years and below in others.
111
Budget Strategy and Outlook 2015-16
Chart 6.6 shows the impact of the volatile assessments.
| Chart 6.6 | Contribution of volatile assessments to Queensland’s difference from an equal per capita share of GST (three year average)1, 2 |
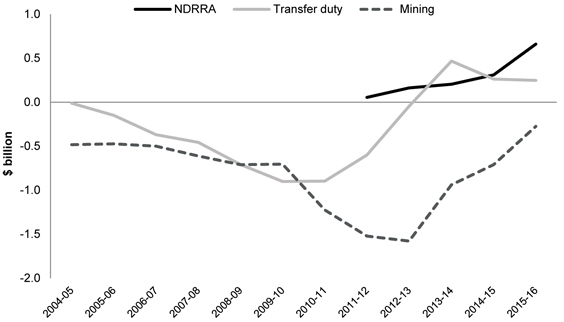
Notes:
| 1. | Contributions are scaled to the growth in the pool size from 2004-05 to 2015-16 to improve comparability. |
| 2. | NDRRA data for earlier years is not available. |
Sources: Commonwealth Grants Commission and Queensland Treasury.
112
Budget Strategy and Outlook 2015-16
| Box 6.3 | 2015 Review of CGC methodology |
In April 2015, the CGC released the Final Report of its 2015 Review of the methodology used to determine the distribution of GST among the states. The Final Report recommended that Queensland’s share of GST revenue be increased by $556 million in 2015-16. The 2015 Review outcome encompasses the impact of methodology changes on states’ GST shares, as well as the impact of changes to states’ circumstances and revisions to the data used in the CGC’s assessments. Table 6.5 shows the contribution of these factors to the overall impact.
| Table 6.5 | Underlying changes in GST allocations 2015-16 ($ million)1, 2 |
| | | | | | | | | | | | | | | | | | | | | | | | | | | | | | | | |
| | | NSW | | | Vic. | | | Qld | | | WA | | | SA | | | Tas. | | | ACT | | | NT | |
Methodology change | | | (105 | ) | | | 423 | | | | (186 | ) | | | (255 | ) | | | 74 | | | | 89 | | | | (93 | ) | | | 53 | |
Data revisions | | | (157 | ) | | | (44 | ) | | | (45 | ) | | | 202 | | | | 58 | | | | (7 | ) | | | (47 | ) | | | 40 | |
States’ circumstances | | | (254 | ) | | | (249 | ) | | | 787 | | | | (441 | ) | | | 152 | | | | 144 | | | | 10 | | | | (149 | ) |
Total change | | | (517 | ) | | | 131 | | | | 556 | | | | (494 | ) | | | 284 | | | | 225 | | | | (129 | ) | | | (56 | ) |
Notes:
| 1. | Bracketed numbers represent negative amounts. |
| 2. | Numbers may not add due to rounding. |
Sources: Commonwealth Grants Commission Report on GST Revenue Sharing Relativities – 2015 Review.
The increase to Queensland’s GST share was mainly driven by a weakening in Queensland’s circumstances relative to other states since the last CGC update in 2014 ($787 million increase). Updates to the CGC’s recommendations are designed to capture changes in factors beyond states’ control that impact their fiscal circumstances. For Queensland, high NDRRA expenditure (net of contributions from the Australian Government) as well as relatively weaker mining revenue have meant that Queensland has been assessed as requiring additional GST. The increase in Queensland’s share of GST in 2015-16 is not a windfall, rather, it recognises that Queensland has had higher expenses and weaker revenues than in previous updates.
Methodological changes made by the CGC in the 2015 Review have negatively impacted Queensland. This is largely due to a new assessment of states’ requirements for transport infrastructure. The new methodology places a larger emphasis on city size than on population growth, redistributing GST away from Queensland because it does not have a city the size of Sydney or Melbourne. Queensland has argued against this methodology, which does not have a robust evidence base, and considers that fundamental changes to this assessment should be a priority of the next CGC methodology review.
Along with the 2015 Review Final Report, the CGC also released its advice on the treatment of large volatile state revenues in its GST distribution methodology. This was in the context of large decreases in Western Australia’s iron ore royalties in 2014-15. Although the CGC found there were no grounds for special treatment of iron ore royalties, the 2015-16 Commonwealth Budget provided an additional $499 million of infrastructure funding to Western Australia. Queensland supports the CGC advice, noting there was no special treatment when Queensland faced similar circumstances when coal prices fell in 2009-10. The Australian Government should ensure that additional capital payments made to Western Australia are not at the expense of other states.
113
Budget Strategy and Outlook 2015-16
| 6.5 | Payments to Queensland for specific purposes |
| 6.5.1 | Structure of payments for specific purposes |
Payments for specific purposes comprise National Specific Purpose Payments (SPPs), National Health Reform funding, Students First funding and National Partnership (NP) payments. These payments represent a significant source of revenue to Queensland, comprising 21.0% of total expected revenue in 2015-16 and 45.3% of Australian Government funding to Queensland.
Projections of specific purpose funding to Queensland
Funding for National SPPs is relatively stable across the forward estimates, with growth of 2.4% in 2016-17 increasing to 2.6% in 2018-19. Growth in National Health Reform (NHR) funding increases to 7.1% in 2017-18, but declines to 4.4% in 2018-19. Growth in Students First funding of 8.8% in 2016-17 is expected to decline to 2.9% in 2018-19. The decrease in growth in funding for health and education is mainly due to revised indexation arrangements from 2017-18 announced at the 2014-15 Commonwealth Budget. Total payments for specific purposes decreases in 2018-19 mainly due to current time limited NP agreements ceasing in 2017-18.
| Chart 6.7 | Payments for specific purposes to Queensland1 |
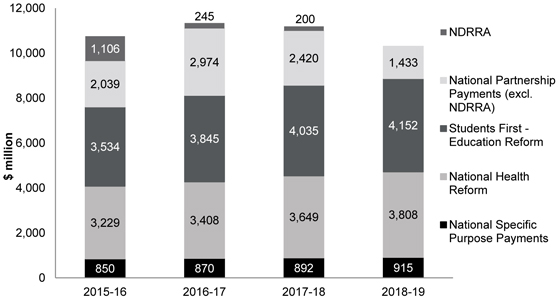
Note:
| 1. | Excludes Australian Government direct funding to local government. |
Sources: Commonwealth Budget 2015-16 Paper No. 3 and Queensland Treasury estimates.
114
Budget Strategy and Outlook 2015-16
The level of NP payments varies from year to year, depending on the nature and duration of agreements, and the value of new agreements. Chart 6.7 outlines how NP funding, including NDRRA, is expected to rise to $3.219 billion in 2016-17, before declining to $1.433 billion in 2018-19. This variability is primarily due to fluctuations in the timing of funding for NDRRA and infrastructure payments.
| 6.5.2 | National Specific Purpose Payments |
National SPPs are an ongoing financial payment to the states for service delivery in a particular sector. National SPPs are considered to be ‘tied’ payments since they must be spent in the relevant sector. Apart from this condition, states have total budget flexibility to allocate SPP funding within the relevant sector according to their priorities. In turn, states are accountable to their communities on SPP expenditure and the achievement of outcomes, as set out in the associated National Agreements.
In addition to funding for Health and Education, there are three National SPPs to the states for skills and workforce development, disability services and affordable housing. Chart 6.8 shows the breakdown of Australian Government funding across these sectors for SPPs, National Health Reform funding and Students First funding.
| Chart 6.8 | National Specific Purpose Payments by sector, 2015-16 |
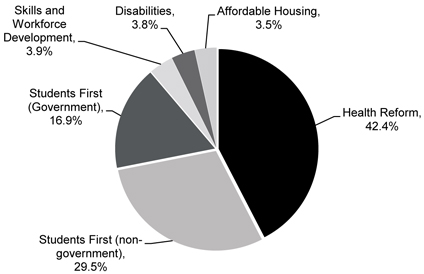
Sources: Commonwealth Budget 2015-16 Paper No. 3 and Queensland Treasury estimates.
115
Budget Strategy and Outlook 2015-16
National Health Reform funding
The National Health Reform Agreement (NHRA) commenced on 1 July 2012. Under this arrangement, growth in funding from the Australian Government was based on 45% of the efficient costs of additional hospital activity, increasing to 50% in 2017-18. In the 2014-15 Commonwealth Budget, the Australian Government revised the indexation arrangement and funding from 2017-18 will instead be tied to a combination of the CPI and population growth.
The 2014-15 Commonwealth Budget also removed the funding guarantees which were a feature of the NHRA that ensured a guaranteed level of additional funding would flow to the State irrespective of growth in public hospital activity. This revision has major implications for the State in managing the long term growth in hospital demand services. These changes to the NHRA were confirmed by the Australian Government in its 2015-16 Budget. Queensland is expected to receive $3.229 billion in 2015-16 ($14.093 billion over four years to 2018-19).
Students First – A fairer funding agreement for schools
Australian Government funding under Students First for Queensland Government schools will be $1.286 billion in 2015-16 ($5.827 billion over four years to 2018-19). Non-government schools funding will be $2.044 billion in 2015-16 ($8.854 billion over four years to 2018-19).
In the 2014-15 Commonwealth Budget, the Australian Government announced that from the 2018 school year onwards, the Students First funding will be indexed to CPI with an allowance for school enrolment numbers. This will result in cuts to education funding for Queensland schools from the Australian Government compared to previous indexation arrangements.
In the 2015-16 Commonwealth Budget, there was an overall reduction in Students First funding of $466 million for the period 2014-15 to 2017-18 compared to the 2014-15 Commonwealth Budget. This comprises a $140 million decrease for government schools and $326 million for non-government schools. For Queensland, the decrease in funding is largely attributed to revised enrolment estimates associated with the transition of Year 7 into secondary school and incorporation of updated enrolment projections.
A review by the Australian Government of the new funding arrangements for schools will occur later in 2015.
National Disability funding
The Australian Government’s significant reforms to disability services will impact the National Disability SPP to Queensland in future years. From 2019-20, the Australian and Queensland Government contributions to the National Disability Insurance Scheme (NDIS) will be $2.140 billion and $2.030 billion respectively. The roll out of NDIS in Queensland will commence on 1 July 2016 with full implementation expected by 1 July 2019.
The Queensland Government has consistently argued for Queensland’s share of the Medicare Levy Surcharge introduced in 2014 for the NDIS to be paid in alignment with the State’s service delivery requirements associated with NDIS, and as a consequence the State should be provided with its full share of the Medicare Levy Surcharge from 1 July from 2016. The Australian Government has instead unilaterally decided to ration Queensland’s access to its rightful share of funding for the NDIS and this will have an impact on the rollout of the Scheme.
116
Budget Strategy and Outlook 2015-16
| 6.5.3 | National Partnership payments |
NP payments are paid to states to implement specific NP agreements. These agreements are usually time limited and support the delivery of projects, facilitate reforms or reward states that deliver on national reforms or achieve service delivery improvements.
NP payments are an important source of revenue for Queensland. In 2015-16, proposed NP payments to Queensland, including NDRRA, will be 13.2% ($3.145 billion) of total Australian Government funding to Queensland.
NP funding by sector
Excluding payments for NDRRA, NP payments for infrastructure, housing, health and education represent the major components of NP funding in 2015-16 (refer Chart 6.9), representing 87.9% of non-NDRRA NP funding. NDRRA payments are excluded as these payments are contingent payments that will only arise following a reimbursement claim for expenditure on eligible natural disasters.
| Chart 6.9 | National Partnership Payments by sector (excluding NDRRA), 2015-161 |
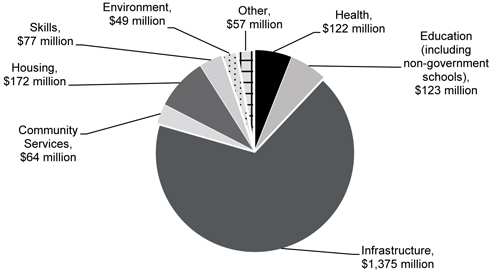
Note:
| 1. | Excludes Australian Government direct funding to local government. |
Sources: Commonwealth Budget 2015-16 Paper No. 3 and Queensland Treasury estimates.
117
Budget Strategy and Outlook 2015-16
Major funding agreements
The 2015-16 Commonwealth Budget will provide short-term extensions to the following National Partnership Agreements, despite the requests of all states and territories for long-term funding certainty:
| • | | $175.8 million for early childhood education with an extension to the current program, with the new agreement to now expire in 2017-18. Funding in 2015-16 is increased by $26.0 million (total of $86.0 million), with additional funding of $87.5 million in 2016-17 and $62.3 million in 2017-18. |
| • | | $57.4 million for homelessness through an extension of the current program to 2016-17 ($28.7 million in 2015-16 and 2016-17). |
| • | | Confirmation of ongoing funding for the Legal Assistance Services NP ($202.6 million over four years to 2018-19). |
| • | | A new NP on Adult Public Dental Services providing $30.3 million in 2015-16. |
Infrastructure funding provided in the 2015-16 Commonwealth Budget, includes a new NP for improving cattle supply chains in northern Australia (with estimated funding of $62 million from 2016-17 to 2018-19). Further detail on Queensland’s Infrastructure funding is contained in Box 6.4.
As part of the 2015-16 Commonwealth Budget, the Australian Government also announced changes to the Remote Indigenous Housing NP (currently due to expire in 2017-18). The Australian Government is intending to replace the existing NP with a new Remote Indigenous Housing Strategy over three years (2015-16 to 2017-18) to build new houses and refurbish existing houses in remote Indigenous communities. State funding allocations for the new proposal have not been determined, and the Queensland Government will seek further details of the new Strategy and the implications for Queensland remote Indigenous communities.
118
Budget Strategy and Outlook 2015-16
Infrastructure plays a crucial role in driving Queensland’s productivity and competitiveness. It is a concern the 2015-16 Commonwealth Budget did not provide any funding towards Queensland’s key infrastructure priority projects such as Brisbane’s second river rail crossing, Gold Coast light rail extension and Sunshine Coast rail duplication.
The Australian Government also continues to deny Queensland its fair share of infrastructure funding from the Asset Recycling Initiative Fund. Under the fund, the Australian Government will provide states with incentive payments to sell public assets, provided the proceeds are reinvested in additional economic infrastructure.
In January 2015, Queenslanders rejected the sale of income earning assets, including power networks and ports. The Queensland Government will not sell these essential income earning and strategic public assets – a position that now has bipartisan support in Queensland. The Australian Government has decided to withhold infrastructure funding from Queensland for not engaging in asset sales by allocating the remaining $800 million to pay for infrastructure initiatives under the Developing Northern Australia White Paper with funds to be shared with Western Australia and Northern Territory. Western Australia is also receiving another $499 million in road funding outside of the GST distribution process.
The 2015-16 Commonwealth Budget also included a $5 billion loan scheme to promote infrastructure investment in northern Australia. The Queensland Government supports measures aimed at assisting and encouraging development to open the untapped economic potential of northern Australia. Queensland will engage with the Australian Government to understand the full implications of the Northern Australia Infrastructure Facility and the proposed path forward.
Expiring agreements
As of 30 June 2015, there were 52 active agreements between the Queensland Government and the Australian Government, with a further 16 agreements under development.
In 2015-16, there are 11 agreements expiring, with minimal advice from the Australian Government about the future of these programs, which will have impacts on service delivery. The 2015-16 Commonwealth Budget provided no extension of funding for Mental Health Reform, with the current agreement providing $51.5 million in funding over 5 years, and expiring in 2015-16.
The expiry of a number of large NPs over the last few years in a tight fiscal environment has brought the risks posed by the number of fixed term funding arrangements into sharp focus. States have had limited capacity to influence the continuation of expiring agreements and often there is little warning on whether funding will be continued. An early indication as to the continuation, lapse or other treatment of funding under expiring agreements is necessary, to enable states to undertake effective service delivery and budgetary planning. The uncertain nature of expiring agreements demonstrates why the outcomes of the federalism reform process and the allocation of roles and responsibilities into the future will be crucial for States.
119
Budget Strategy and Outlook 2015-16
| 7 | Public Non-Financial Corporations Sector |
Features
| • | | Returns from the Public Non-Financial Corporations (PNFC) are expected to reduce over the forward estimates period. This is largely driven by the Australian Energy Regulator’s (AER) April 2015 regulatory decisions for Energex and Ergon Energy, which cut revenue for both businesses significantly. |
| • | | Consumers are already starting to see the benefits of these revenue reductions, with electricity prices falling in 2015-16. |
| • | | The generators are expecting a material improvement in their performance in 2015-16 and across the forward estimate period. Demand growth from liquefied natural gas (LNG) plants at Gladstone is expected to tighten the wholesale market, leading to higher sales and stronger prices for the generators. The generators have also implemented a number of cost-saving measures to maximise their ongoing competitiveness with other generators. |
| • | | Growth in LNG exports is also expected to help the ports. This growth from LNG, alongside additional revenue from the newly commissioned Wiggins Island Coal Export Terminal, will contribute to growth in revenues and dividends from the port businesses. |
| • | | Borrowings across the sector are forecast to continue to grow to $35.962 billion in 2015-16, driven in part by an increase in gearing in the electricity network businesses associated with the Government’s Debt Action Plan (as detailed in Box 1.1 of Chapter 1). |
A number of industries are covered by the PNFC Sector, including energy, rail, port and water. Queensland’s government-owned corporations (GOCs), declared by regulation to be GOCs under the Government Owned Corporations Act 1993, make up a large part of the PNFC sector. Also included in the sector are non-GOC entities including Seqwater, Queensland Rail, local water boards and other public corporations. A list of PNFC Sector entities is available in Chapter 8.
GOCs are accountable for their financial performance and are required to be commercial and efficient organisations. These requirements are legislated under the Government Owned Corporations Act 1993.
120
Budget Strategy and Outlook 2015-16
PNFC Sector entities provide services or commodities like other businesses. The entities incur costs and bear commercial risks to deliver their services or products and generate revenue from the sale of these services or products. The aim of these entities is to achieve a commercial rate of return which is returned to the Government as dividends. In some cases, part of a PNFC entity’s revenue may arise from community service obligation (CSO) payments from the Government. These payments subsidise the provision of a service or commodity supplied on a non-commercial basis in order to support the Government’s broader policy objectives.
| 7.2 | Finances and performance |
| 7.2.1 | Earnings before interest and tax |
Total forecast PNFC Sector earnings before interest and tax (EBIT) for 2014-15 is estimated to be $3.994 billion, down from $4.137 billion at the time of the 2014-15 Budget. This decline is primarily due to worse than budgeted performance by Stanwell Corporation Limited (Stanwell) and SunWater Limited (SunWater).
EBIT is set to decline to $3.987 billion in 2015-16 and $3.806 billion by 2018-19 (Table 7.1).
| Table 7.1 | Earnings Before Interest and Tax1 |
| | | | | | | | | | | | | | | | | | | | | | | | | | | | |
| | | 2013-14
Actual
$ million | | | 2014-15
Budget
$ million | | | 2014-15
Est. Act.
$ million | | | 2015-16
Budget
$ million | | | 2016-17
Projection
$ million | | | 2017-18
Projection
$ million | | | 2018-19
Projection
$ million | |
Electricity Networks2 | | | 2,636 | | | | 2,783 | | | | 2,803 | | | | 2,652 | | | | 2,579 | | | | 2,090 | | | | 1,971 | |
Electricity Generation3 | | | 209 | | | | 296 | | | | 200 | | | | 320 | | | | 516 | | | | 474 | | | | 518 | |
Transport | | | 616 | | | | 666 | | | | 645 | | | | 547 | | | | 675 | | | | 673 | | | | 704 | |
Water | | | 244 | | | | 439 | | | | 361 | | | | 475 | | | | 528 | | | | 593 | | | | 641 | |
Other | | | 152 | | | | (47 | ) | | | (14 | ) | | | (7 | ) | | | (9 | ) | | | (26 | ) | | | (28 | ) |
Total PNFC sector Earnings Before Interest and Tax | | | 3,857 | | | | 4,137 | | | | 3,994 | | | | 3,987 | | | | 4,289 | | | | 3,803 | | | | 3,806 | |
Notes:
| 1. | Numbers may not add due to rounding. Bracketed numbers represent negative amounts. |
| 2. | The decline relates to lower earnings from Energex and Ergon Energy as a result of the new AER regulatory determinations. |
| 3. | Includes Stanwell coal revenue sharing arrangements. |
This decline in earnings over the projection period is attributable to lower earnings from Energex Limited (Energex) and Ergon Energy Corporation Limited (Ergon Energy) as a result of the new AER regulatory determinations, offset by increased earnings from generation, transport and water sectors. CS Energy Limited’s (CS Energy) and Stanwell’s (electricity generation) earnings increase as a result of a forecast improvement in wholesale electricity prices, primarily due to increased demand from the LNG industry. Seqwater’s earnings increase in line with the current bulk water price path and increased forecast water demand. The forecast increase in earnings in the transport sector from 2016-17 reflects forecast growth in port tonnages.
121
Budget Strategy and Outlook 2015-16
Energy Sector
Generation
CS Energy’s and Stanwell’s core business is the generation and sale of electricity. Combined, the companies have over 6,600 megawatts (MW) of installed capacity, a combination of coal, gas and hydro powered plant. CS Energy also has access for trading purposes to 810MW from the Gladstone Power Station. Together CS Energy and Stanwell provide over 60% of Queensland’s electricity supply.
The generation businesses of CS Energy and Stanwell are facing substantial challenges with the evolution of the electricity market and the growth of new technologies. The Government is investigating structural and non-structural options for improving the performance of the businesses, in light of these challenges to the current businesses, and the evolving energy market including the growth of renewable energy supplies. Throughout these investigations, the Government is committed to delivering efficiencies whilst ensuring competition in the wholesale electricity markets is maintained.
After years of oversupply of generation capacity in the Queensland region of the National Electricity Market (NEM), the LNG industry is changing the Queensland energy market.
The demand outlook, and consequently the supply demand balance, is forecast to improve in 2015-16 and out to 2018-19 as LNG plants on Curtis Island progressively commence operation. LNG-related electricity consumption is forecast to increase from 250 gigawatt hours (GWh) in 2013-14 to 8,350 GWh in 2018-19. This ramp-up of LNG will boost Queensland’s electricity demand by approximately 15% and is expected to result in an improved outlook for the wholesale electricity market.
The tightening of the supply and demand balance and the increasing gas costs creates an environment where the existing coal fired generators may improve their returns.
The expected increase in electricity demand from the LNG industry will be tempered by the continued growth of solar photovoltaic (PV) panels and consumers’ ongoing sensitivity to increases in electricity retail tariffs. At 31 May 2015, installed PV capacity in Queensland was 1,385MW (approximately 10% of total capacity in Queensland). Solar PV generation in Queensland in 2014-15 is estimated to have been almost 1,900 GWh.
Networks
The Queensland Government owns three network businesses that are responsible for transporting safe, reliable electricity to consumers across the state.
Powerlink is a high-voltage transmission network that transports electricity long distances from generation plants to the distribution networks and connects Queensland to other states.
Ergon Energy and Energex are low-voltage distribution networks that take electricity from Powerlink’s transmission network and distribute it to households across Queensland. Ergon Energy is also Queensland’s second largest electricity retailer, providing retail services to the bulk of customers in regional Queensland.
122
Budget Strategy and Outlook 2015-16
Revenues for these businesses are largely derived from network services that are regulated by the AER. The AER determines these revenues on a five-yearly basis, based on the businesses’ proposals and its view of the reasonable benchmark costs for a network business. In April 2015, the AER released its preliminary determination on Energex’s and Ergon Energy’s revenues for 2015-16 to 2019-20. The AER has made significant cuts to both businesses’ revenues reflecting the flat energy demand forecasts for the next five years, the efficiency programs within the businesses to reduce their costs, and a significant reduction in the returns the businesses receive on their assets. This will flow through to customers in reduced or flat prices, but will also lead to a significant reduction in returns to Government from these businesses.
Powerlink’s current determination commenced in 2012-13 and concludes in 2016-17, meaning the revenue outlook for Powerlink is relatively set until 2016-17. From 2017-18, the outlook for Powerlink is less certain, and will depend on the new determination set by the AER. Government has committed to finding efficiencies within the network businesses to benefit consumers and achieve the best possible value from the businesses. To drive this work and streamline performance, the Queensland Government proposes to merge the network businesses, consolidating Boards, backroom office functions and senior management positions. The Government remains committed to a policy of no forced redundancies within these businesses, meaning any staffing reductions will occur only through natural attrition and voluntary redundancies.
Energex, Ergon Energy and Powerlink are giving significant consideration to their future roles in the energy market. As technology continues to advance, consumers will change the way they consume energy. Accordingly, the businesses will need to evolve with the market to ensure they stay current and provide the services that consumers demand. The Government has stated its intention to operate these government-owned corporations as efficiently as possible for the long term.
Queensland Rail
Queensland Rail is an integrated, publicly owned rail operator, responsible for the delivery of passenger transport in South East Queensland, long distance passenger services in rural and regional Queensland, and provision of third party access to networks for freight transport across the State. Efficient and effective delivery of rail services, including network access, contributes to positive economic and social benefits for Queensland.
The majority of Queensland Rail’s services are delivered under a Rail Transport Services Contract (Rail TSC) between the Government, represented by the Department of Transport and Main Roads, and Queensland Rail. The Rail TSC provides funding for rail infrastructure, Citytrain (South East Queensland passenger services) and Traveltrain (regional passenger services).
Queensland Rail is focused on the delivery of safe, reliable and value for money rail services. During 2014-15, Queensland Rail continued to focus on the achievement of further efficiencies in the delivery of its services.
123
Budget Strategy and Outlook 2015-16
Ports
Queensland has an extensive network of ports along its coastline, ranging from small community ports to large export terminals. With the exception of the Port of Brisbane, all Queensland ports are owned by the Queensland Government. These ports are a major component of Queensland’s supply chain and economy. The efficient operation of Queensland’s port network is essential to delivering continued economic growth, job creation and sustainable development in Queensland.
The financial performance of the port sector is influenced by the level of economic activity in the State, particularly in terms of international demand for Queensland’s resources and agricultural commodities. Demand for coal impacts most significantly on the coal-handling ports of Gladstone and Abbot Point. The recent contraction in investment in the mining sector and lower forecast coal prices are anticipated to impact on growth in tonnages in 2015-16. The ports continue to look for opportunities to enhance supply chain efficiency and identify new trades to improve financial outcomes.
The Government has recently committed through the Reef 2050 Long Term Sustainability Plan to protect the Great Barrier Reef by banning sea-based disposal of capital-dredged material from ports in the Great Barrier Reef World Heritage Area and restricting port-related capital dredging. Economic development, investment and job creation will be supported by master planning for priority ports.
A key project in 2015-16 include the Abbot Point Gateway Expansion project at the Port of Abbot Point.
Water Infrastructure
SunWater
SunWater is the Government’s major bulk water supply business outside of South East Queensland. SunWater supplies untreated bulk water to around 5,000 customers across the mining, power generation, industrial, local government and irrigated agriculture sectors via its regional network of dams, weirs, pumping stations, pipelines and channels and other supply and distribution assets.
SunWater has experienced a period of slow growth across key customer segments, and its ongoing interaction with customers and industry representative groups suggests the outlook for key customer sectors will remain subdued. Notwithstanding the subdued market, SunWater continues to actively work with customers to investigate all business opportunities which are consistent with the Government’s expectations and priorities.
In light of this low growth operating environment, SunWater will target incremental improvements across all business areas, particularly through the improvement of the quality and effectiveness of the company’s engagement with customers, communities and other stakeholders.
124
Budget Strategy and Outlook 2015-16
While SunWater core business areas remain unchanged, it will continue to facilitate, develop and operate bulk water supply infrastructure throughout regional Queensland. From 1 July 2015, SunWater’s internal business structure will change to ensure the business is best placed to deliver services to customers in the most efficient way possible and to maximise the utilisation of its staff in the current market.
Seqwater
Seqwater is responsible for ensuring a safe, secure and reliable bulk drinking water supply for 3.3 million people across South East Queensland. Seqwater also provides essential flood mitigation services, and provides irrigation services to around 1,200 rural customers in seven water supply schemes.
Seqwater’s revenue is largely driven by the bulk water price. Seqwater is also forecasting average water use to slightly increase over the forward estimates. The bulk water price is smoothing the implementation of cost reflective pricing over a ten year period ending in 2017-18. The price path and increased water use will see Seqwater’s revenue increase over the forward estimates.
Seqwater continues to pursue operational and capital efficiency targets in order to deliver value for money for residents of South East Queensland. Seqwater uses asset management programs, benchmarking against similar providers, multiskilling of employees and streamlining of operational structure to ensure the business runs efficiently.
Given the high level of water security, the Gold Coast Desalination Plant (GCDP) continues to operate in hot-standby mode producing a minimal amount of water to ensure the plant stays in a fully maintained status, but reducing operating and maintenance costs as far as possible. The GCDP is expected to be utilised if key water storages reach 60% of their full supply levels. The Western Corridor Recycled Water Scheme (WCRWS) has been decommissioned to minimise its ongoing costs. It is now operated in a care and maintenance mode to preserve the asset to allow reactivation if required.
Under the forecast future operating conditions, Seqwater is projecting an improvement to its fiscal position driven by operational and capital efficiency targets and certainty in regard to bulk water pricing, following the adoption of prices recommended by the Queensland Competition Authority for the period 2015-16 to 2017-18. As a result of this improved operating position, Seqwater will proceed to reduce its $9.6 billion debt, incurred in building the Water Grid and managing the subsequent annual losses, over the forward estimates.
Borrowings
Entities in the PNFC Sector utilise debt financing as a source of funds for asset renewal, capital investments and to maintain an optimum capital structure.
PNFC Sector entities are required to take a prudent and sound approach to the management of debt, including the establishment of borrowing arrangements which are appropriate to the business risk of the organisation. These arrangements take into account the appropriateness of the proposed capital expenditure program, together with the implications of the borrowings for key financial and performance related indicators.
125
Budget Strategy and Outlook 2015-16
Total forecast PNFC Sector borrowings for 2014-15 are estimated to be $32.268 billion (Table 7.2).
| | | | | | | | | | | | | | | | | | | | | | | | | | | | |
| | | 2013-14 | | | 2014-15 | | | 2014-15 | | | 2015-16 | | | 2016-17 | | | 2017-18 | | | 2018-19 | |
| | | Actual | | | Budget | | | Est. Act. | | | Budget | | | Projection | | | Projection | | | Projection | |
| | | $ million | | | $ million | | | $ million | | | $ million | | | $ million | | | $ million | | | $ million | |
Electricity Networks | | | 15,994 | | | | 16,791 | | | | 16,760 | | | | 20,692 | | | | 21,820 | | | | 22,723 | | | | 23,446 | |
Electricity Generation | | | 1,600 | | | | 1,588 | | | | 2,117 | | | | 1,914 | | | | 1,648 | | | | 1,494 | | | | 1,457 | |
Transport | | | 3,631 | | | | 3,654 | | | | 3,622 | | | | 3,811 | | | | 3,941 | | | | 3,941 | | | | 3,957 | |
Water | | | 9,913 | | | | 9,970 | | | | 9,808 | | | | 9,799 | | | | 9,756 | | | | 9,713 | | | | 9,515 | |
Other | | | 175 | | | | (189 | ) | | | (40 | ) | | | (254 | ) | | | (269 | ) | | | (283 | ) | | | (298 | ) |
Total PNFC Sector borrowings | | | 31,313 | | | | 31,814 | | | | 32,268 | | | | 35,962 | | | | 36,896 | | | | 37,587 | | | | 38,078 | |
Note:
| 1. | Numbers may not add due to rounding. Bracketed numbers represent negative amounts. |
Borrowings are budgeted to increase to $35.962 billion in 2015-16 and to $38.078 billion in 2018-19. The increase in borrowings in 2015-16 is driven by revisions to the capital structure of the Electricity Network businesses associated with the Government’s Debt Action Plan, as detailed in Box 1.1 of Chapter 1. Increased borrowings in the Electricity Network and Transport sectors are partly offset by reduced borrowings by CS Energy, Stanwell and SunWater as a result of improved earnings and cash management practices.
| 7.2.2 | Returns to Government |
PNFC Sector entities provide returns to Government by way of dividends and current tax equivalent payments (TEPs).
Dividends
A GOC’s dividend policy is agreed with shareholding Ministers as part of the Statement of Corporate Intent for the relevant period. A Statement of Corporate Intent represents a performance contract between the shareholding Ministers and a GOC board, with the board being accountable to shareholding Ministers for meeting financial and non-financial performance targets and delivering on the outcomes detailed in the Statement of Corporate Intent. When establishing the dividend policy for the period, GOC boards are expected to ensure that the dividend policy takes into account the return shareholders expect on their investments and the levels of equity required to maintain a preferred capital structure.
As part of the changes to the preferred capital structure of the Electricity Network businesses under the Debt Action Plan, the dividend payout ratios of these businesses have increased from 80% of net profit after tax to 100% of net profit after tax (as detailed in Box 1.1 of Chapter 1).
126
Budget Strategy and Outlook 2015-16
Total forecast PNFC sector dividends for the 2014-15 period are estimated to be $1.659 billion, up from $1.420 billion at the time of the 2014-15 Budget (Table 7.3). The increase in expected dividends is driven by the Electricity Networks sector, partly due to the move to a dividend payout ratio of 100%.
| Table 7.3 | Dividends1, 2, 3 |
| | | | | | | | | | | | | | | | | | | | | | | | | | | | |
| | | 2013-14 | | | 2014-15 | | | 2014-15 | | | 2015-16 | | | 2016-17 | | | 2017-18 | | | 2018-19 | |
| | | Actual | | | Budget | | | Est. Act. | | | Budget | | | Projection | | | Projection | | | Projection | |
| | | $ million | | | $ million | | | $ million | | | $ million | | | $ million | | | $ million | | | $ million | |
Electricity Networks | | | 965 | | | | 1,007 | | | | 1,326 | | | | 1,198 | | | | 1,038 | | | | 690 | | | | 577 | |
Electricity Generation | | | 97 | | | | 98 | | | | 56 | | | | 125 | | | | 210 | | | | 182 | | | | 209 | |
Transport | | | 262 | | | | 264 | | | | 257 | | | | 216 | | | | 287 | | | | 296 | | | | 325 | |
Water | | | 48 | | | | 51 | | | | 20 | | | | 50 | | | | 52 | | | | 59 | | | | 57 | |
Other | | | — | | | | — | | | | — | | | | — | | | | — | | | | — | | | | — | |
Total PNFC Sector Dividends | | | 1,372 | | | | 1,420 | | | | 1,659 | | | | 1,590 | | | | 1,587 | | | | 1,227 | | | | 1,168 | |
Notes:
| 1. | Numbers may not add due to rounding. |
| 2. | The above dividends do not include amounts from the Public Financial Corporations Sector. |
| 3. | Dividends are declared as part of end-of-year accounting arrangements and paid in the following November. |
Dividends are budgeted to increase to $1.590 billion in 2015-16. In 2018-19, dividends are expected to be $1.168 billion. The decline in dividends is predominantly due to substantially lower returns from Energex, Ergon Energy and Powerlink reflecting their lower revenue outlook. These reductions are partially offset by improved profitability in the generation and transport sectors. The improvement in the generation sector is driven by forecasts of improved wholesale electricity prices as a result of increased demand from the LNG industry. SunWater dividends are forecast to improve, driven by the profitable Woleebee Creek Pipeline Project which was completed in 2014-15.
Tax equivalent payments
Tax equivalent payments (TEPs) are paid by PNFC Sector entities to recognise the benefits derived because they are not liable to pay Australian Government tax. The primary objective of the payment is to promote competitive neutrality, through a uniform application of income tax laws between the government-owned entities and their privately held counterparts.
Total forecast PNFC Sector TEPs for 2014-15 are estimated to be $625 million, up from $604 million at the time of the 2014-15 Budget (Table 7.4).
Generally TEPs move in line with earnings. TEPs are forecast to increase to $733 million in 2015-16 and then decline to $577 million in 2018-19, in line with GOC earnings.
127
Budget Strategy and Outlook 2015-16
| Table 7.4 | Tax equivalent payments1 |
| | | | | | | | | | | | | | | | | | | | | | | | | | | | |
| | | 2013-14 | | | 2014-15 | | | 2014-15 | | | 2015-16 | | | 2016-17 | | | 2017-18 | | | 2018-19 | |
| | | Actual | | | Budget | | | Est. Act. | | | Budget | | | Projection | | | Projection | | | Projection | |
| | | $ million | | | $ million | | | $ million | | | $ million | | | $ million | | | $ million | | | $ million | |
Electricity Networks | | | 196 | | | | 389 | | | | 425 | | | | 514 | | | | 445 | | | | 298 | | | | 253 | |
Electricity Generation | | | 44 | | | | 56 | | | | 27 | | | | 84 | | | | 129 | | | | 107 | | | | 118 | |
Transport | | | 110 | | | | 146 | | | | 139 | | | | 113 | | | | 146 | | | | 140 | | | | 151 | |
Water | | | 10 | | | | 7 | | | | 30 | | | | 20 | | | | 45 | | | | 56 | | | | 54 | |
Other | | | 2 | | | | 6 | | | | 4 | | | | 1 | | | | 1 | | | | 1 | | | | 1 | |
Total PNFC Sector tax equivalents | | | 361 | | | | 604 | | | | 625 | | | | 733 | | | | 767 | | | | 602 | | | | 577 | |
Note:
| 1. | Numbers may not add due to rounding. |
Competitive neutrality fees
In accordance with the National Competition Policy principles, GOCs are expected to operate on the basis that they do not experience significant advantages or disadvantages by virtue of their Government ownership. One of the most significant advantages available to GOCs is the ability to borrow funds at a lower rate than private sector competitors on the basis of the State Government’s credit strength. In order to account for this advantage, the Competition Principles Agreement requires a notional charge to be applied to a GOC’s cost of debt. A competitive neutrality fee (CNF) is thus applied to all borrowings and financial arrangements in the nature of debt obligations.
Total forecast PNFC sector CNF payments for 2014-15 are estimated to be $238 million, down from $245 million at the time of the 2014-15 Budget (Table 7.5).
Changes in CNF payments reflect movements in borrowing amounts, interest rate spreads and the entity’s stand-alone credit rating. CNF payments are forecast to increase to $283 million in 2018-19.
128
Budget Strategy and Outlook 2015-16
| Table 7.5 | Competitive neutrality fee payments1 |
| | | | | | | | | | | | | | | | | | | | | | | | | | | | |
| | | 2013-14 | | | 2014-15 | | | 2014-15 | | | 2015-16 | | | 2016-17 | | | 2017-18 | | | 2018-19 | |
| | | Actual | | | Budget | | | Est. Act. | | | Budget | | | Projection | | | Projection | | | Projection | |
| | | $ million | | | $ million | | | $ million | | | $ million | | | $ million | | | $ million | | | $ million | |
Electricity Networks | | | 144 | | | | 153 | | | | 149 | | | | 155 | | | | 192 | | | | 203 | | | | 209 | |
Electricity Generation | | | 25 | | | | 32 | | | | 30 | | | | 30 | | | | 29 | | | | 27 | | | | 27 | |
Transport | | | 55 | | | | 54 | | | | 51 | | | | 42 | | | | 45 | | | | 45 | | | | 45 | |
Water | | | 7 | | | | 6 | | | | 7 | | | | 4 | | | | 3 | | | | 3 | | | | 3 | |
Other | | | — | | | | — | | | | — | | | | — | | | | — | | | | — | | | | — | |
Total PNFC Sector CNF payments | | | 230 | | | | 245 | | | | 238 | | | | 232 | | | | 269 | | | | 278 | | | | 283 | |
Note:
| 1. | Numbers may not add due to rounding. |
| 7.2.3 | Community service obligation and Rail Transport Service Contract payments |
CSOs arise in situations where a commercial entity is required by Government to perform activities that on their own are not in the entity’s commercial interests. In these situations, Government will often provide payments for the cost of delivering the service.
Transport Service Contract (TSC) payments are made to Queensland Rail for non-commercial rail passenger services for the commuter and tourism markets. These payments were reported previously as CSOs.
Total forecast PNFC CSO and TSC payments for the 2014-15 period are estimated to be $2.175 billion, down from $2.396 billion at the time of the 2014-15 Budget (Table 7.6).
In 2015-16, it is estimated that the Government will provide CSO and TSC payments to PNFC Sector entities of $2.042 billion. This is forecast to increase to $2.392 billion in 2018-19. The increase is attributable to the TSC and is due to a mix of factors such as growth in patronage, escalation of service delivery costs and forecast growth in services.
129
Budget Strategy and Outlook 2015-16
| Table 7.6 | Community service obligations and Transport Service Contracts receipts1 |
| | | | | | | | | | | | | | | | | | | | | | | | | | | | |
| | | 2013-14 | | | 2014-15 | | | 2014-15 | | | 2015-16 | | | 2016-17 | | | 2017-18 | | | 2018-19 | |
| | | Actual | | | Budget | | | Est. Act. | | | Budget | | | Projection | | | Projection | | | Projection | |
| | | $ million | | | $ million | | | $ million | | | $ million | | | $ million | | | $ million | | | $ million | |
Electricity Networks | | | 523 | | | | 683 | | | | 626 | | | | 432 | | | | 540 | | | | 566 | | | | 632 | |
Electricity Generation | | | — | | | | — | | | | — | | | | — | | | | — | | | | — | | | | — | |
Transport2 | | | 1,620 | | | | 1,699 | | | | 1,535 | | | | 1,598 | | | | 1,758 | | | | 1,758 | | | | 1,758 | |
Water | | | 13 | | | | 14 | | | | 14 | | | | 12 | | | | 6 | | | | 3 | | | | 3 | |
Other | | | — | | | | — | | | | — | | | | — | | | | — | | | | — | | | | — | |
Total PNFC Sector CSO and TSC | | | 2,155 | | | | 2,396 | | | | 2,175 | | | | 2,042 | | | | 2,303 | | | | 2,327 | | | | 2,392 | |
Notes:
| 1. | Numbers may not add due to rounding. |
| 2. | The presentation of Transport revenue is not directly comparable to CSO revenue disclosed in the 2013-14 Budget Paper 2, as it now includes patronage revenue received by Queensland Rail and remitted to the Department of Transport and Main Roads under integrated ticketing arrangements. |
In line with the Queensland Government’s uniform electricity tariff policy, a CSO payment is provided to Ergon Energy to compensate its non-competitive retail subsidiary for the difference between network charges and distribution loss factors applicable in Ergon Energy’s region and the relevant Energex network charges and distribution loss factors which are used to set uniform retail electricity tariff prices, which are regulated by the State. This subsidy is a key part of the uniform electricity tariff policy and is provided to ensure that Queenslanders, regardless of their geographic location, pay a reasonable price for their electricity. The Budget includes an amount to ensure tariffs are consistent with the Queensland Competition Authority’s draft determination. The drop in the CSO to $432 million in 2015-16 largely relates to the outcome of the AER determination. Specifically, the AER has reduced Ergon Energy’s allowable revenue more than Energex’s, reducing the difference between SEQ prices and cost-reflective regional prices. While the CSO reduces in 2015-16, customers outside southeast Queensland will continue to pay the same regulated rate as customers in southeast Queensland.
The Queensland Government compensates SunWater for the shortfall in revenues generated by complying with the irrigation price path in SunWater-managed irrigation schemes. The shortfall represents the difference between the efficient cost of supply of water to irrigators (lower bound cost) as determined by the Queensland Competition Authority, and the prices charged to irrigators as directed by the Government. Similarly, Seqwater receives a CSO from the Queensland Government for the provision of rural irrigation water to rural irrigators.
130
Budget Strategy and Outlook 2015-16
Net flows, as shown in Table 7.7, represent the net value of flows to and from the PNFC Sector (dividends and TEPs less CSO and TSC payments).
| Table 7.7 | Net Flows to the General Government Sector from PNFC Sector entities1 |
| | | | | | | | | | | | | | | | | | | | | | | | | | | | |
| | | 2013-14 | | | 2014-15 | | | 2014-15 | | | 2015-16 | | | 2016-17 | | | 2017-18 | | | 2018-19 | |
| | | Actual | | | Budget | | | Est. Act. | | | Budget | | | Projection | | | Projection | | | Projection | |
| | | $ million | | | $ million | | | $ million | | | $ million | | | $ million | | | $ million | | | $ million | |
Net Flows | | | (421 | ) | | | (372 | ) | | | 109 | | | | 281 | | | | 50 | | | | (497 | ) | | | (647 | ) |
Note:
| 1. | Numbers may not add due to rounding. Bracketed numbers represent a net flow from the General Government Sector to the PNFC Sector. |
The levels and weightings of GOC debt and equity are managed by the Government to maintain an optimal and efficient capital structure. Corporations may have different target capital structures for different business entities or to support expected capital programs and projects.
Total forecast PNFC equity movements for 2014-15 are estimated to be negative $3.170 billion, reflecting the return of equity from the PNFC Sector to the General Government Sector associated with the Debt Action Plan (Table 7.8).
Estimated equity movements for PNFCs are negative $97 million in 2015-16.
The $59 million equity contribution to the transport sector in 2015-16 represents a contribution to Queensland Rail for the Toowoomba Rail Freight Crossing Loops project.
| Table 7.8 | Equity movements1 |
| | | | | | | | | | | | | | | | | | | | | | | | | | | | |
| | | 2013-14 | | | 2014-15 | | | 2014-15 | | | 2015-16 | | | 2016-17 | | | 2017-18 | | | 2018-19 | |
| | | Actual | | | Budget | | | Est. Act. | | | Budget | | | Projection | | | Projection | | | Projection | |
| | | $ million | | | $ million | | | $ million | | | $ million | | | $ million | | | $ million | | | $ million | |
Electricity Networks | | | — | | | | — | | | | (3,159 | ) | | | (156 | ) | | | (2 | ) | | | (165 | ) | | | — | |
Electricity Generation | | | — | | | | — | | | | — | | | | — | | | | — | | | | — | | | | — | |
Transport | | | (35 | ) | | | (10 | ) | | | (11 | ) | | | 59 | | | | — | | | | — | | | | — | |
Water | | | — | | | | — | | | | — | | | | — | | | | — | | | | — | | | | — | |
Other | | | — | | | | — | | | | — | | | | — | | | | — | | | | — | | | | — | |
Total PNFC Sector equity movements | | | (35 | ) | | | (10 | ) | | | (3,170 | ) | | | (97 | ) | | | (2 | ) | | | (165 | ) | | | — | |
Note:
| 1. | Bracketed numbers represent equity returns from the PNFC Sector to the General Government Sector. |
131
Budget Strategy and Outlook 2015-16
| 8 | Uniform Presentation Framework |
This chapter contains detailed financial statements for the Queensland Public Sector prepared under the Uniform Presentation Framework (UPF) of reporting as required under the Australian Loan Council arrangements.
The UPF was reviewed following the release in October 2007 of the Australian Accounting Standards Board’s (AASB) accounting standard, AASB 1049 Whole of Government and General Government Sector Financial Reporting. The standard aims to harmonise Government Finance Statistics (GFS) and Generally Accepted Accounting Principles (GAAP) with the objective of improving the clarity and transparency of government financial statements.
In addition, the chapter provides:
| • | | a reconciliation of the General Government Sector net operating balance to the accounting operating result |
| • | | a time series for the General Government Sector using the revised UPF |
| • | | details of General Government Sector grant revenue and expenses |
| • | | details of General Government Sector dividend and income tax equivalent income |
| • | | data on General Government Sector expenses and purchases of non-financial assets by function |
| • | | details of taxation revenue collected by the General Government Sector |
| • | | the State’s revised Loan Council Budget allocation |
| • | | details of contingent liabilities |
| • | | background information on the revised UPF and disclosure differences arising from it, including the conceptual basis, sector definitions and a list of reporting entities. |
| 8.2 | Uniform Presentation Framework financial information |
The tables on the following pages present operating statements, balance sheets and cash flow statements prepared on a harmonised basis for the General Government, Public Non-financial Corporations (PNFC) and Non-financial Public Sectors.
Under the UPF requirements, budgeted financial information for the Public Financial Corporations Sector is not included.
132
Budget Strategy and Outlook 2015-16
| Table 8.1 | General Government Sector Operating Statement1 |
| | | | | | | | | | | | | | | | | | | | | | | | | | | | | | | | |
| | | | | | | 2013-14
Actual
$ million | | | 2014-15
Budget
$ million | | | 2014-15
Est. Actual
$ million | | | 2015-16
Budget
$ million | | | 2016-17
Projection
$ million | | | 2017-18
Projection
$ million | | | 2018-19
Projection
$ million | |
| | | | | | | | |
| | Revenue from Transactions | | | | | | | | | | | | | | | | | | | | | | | | | | | | |
| | Taxation revenue | | | 11,845 | | | | 12,455 | | | | 12,707 | | | | 12,926 | | | | 13,607 | | | | 14,289 | | | | 15,007 | |
| | Grants revenue | | | 21,755 | | | | 24,043 | | | | 23,373 | | | | 24,555 | | | | 26,298 | | | | 26,977 | | | | 26,061 | |
| | Sales of goods and services | | | 5,048 | | | | 5,187 | | | | 5,350 | | | | 5,430 | | | | 5,444 | | | | 5,565 | | | | 5,769 | |
| | Interest income | | | 2,460 | | | | 2,429 | | | | 2,467 | | | | 2,372 | | | | 2,274 | | | | 2,289 | | | | 2,302 | |
| | Dividend and income tax equivalent income | | | 1,975 | | | | 2,148 | | | | 2,410 | | | | 2,395 | | | | 2,436 | | | | 1,923 | | | | 1,851 | |
| | Other revenue | | | 3,650 | | | | 3,859 | | | | 3,271 | | | | 3,509 | | | | 3,950 | | | | 4,445 | | | | 4,760 | |
| | Total Revenue from Transactions | | | 46,734 | | | | 50,120 | | | | 49,578 | | | | 51,186 | | | | 54,010 | | | | 55,486 | | | | 55,748 | |
| | | | | | | | |
| Less | | Expenses from Transactions | | | | | | | | | | | | | | | | | | | | | | | | | | | | |
| | Employee expenses | | | 17,817 | | | | 18,585 | | | | 18,938 | | | | 19,937 | | | | 20,567 | | | | 21,135 | | | | 21,648 | |
| | Superannuation expenses | | | | | | | | | | | | | | | | | | | | | | | | | | | | |
| | Superannuation interest cost | | | 963 | | | | 932 | | | | 872 | | | | 803 | | | | 848 | | | | 886 | | | | 898 | |
| | Other superannuation expenses | | | 2,277 | | | | 2,364 | | | | 2,359 | | | | 2,553 | | | | 2,564 | | | | 2,554 | | | | 2,588 | |
| | Other operating expenses | | | 13,114 | | | | 15,249 | | | | 14,158 | | | | 14,980 | | | | 16,075 | | | | 16,931 | | | | 17,451 | |
| | Depreciation and amortisation | | | 2,946 | | | | 3,226 | | | | 3,116 | | | | 3,264 | | | | 3,443 | | | | 3,525 | | | | 3,628 | |
| | Other interest expenses | | | 2,201 | | | | 2,379 | | | | 2,265 | | | | 2,115 | | | | 1,873 | | | | 1,914 | | | | 1,956 | |
| | Grants expenses | | | 6,796 | | | | 7,198 | | | | 6,907 | | | | 6,320 | | | | 6,414 | | | | 6,409 | | | | 6,252 | |
| | Total Expenses from Transactions | | | 46,115 | | | | 49,933 | | | | 48,615 | | | | 49,973 | | | | 51,784 | | | | 53,354 | | | | 54,421 | |
| | | | | | | | |
| Equals | | Net Operating Balance | | | 619 | | | | 188 | | | | 962 | | | | 1,213 | | | | 2,226 | | | | 2,132 | | | | 1,327 | |
| | | | | | | | |
| Plus | | Other economic flows - included in operating result | | | 334 | | | | 158 | | | | 3,273 | | | | (139 | ) | | | (254 | ) | | | (119 | ) | | | (277 | ) |
| | | | | | | | |
| Equals | | Operating Result | | | 952 | | | | 345 | | | | 4,236 | | | | 1,074 | | | | 1,971 | | | | 2,013 | | | | 1,051 | |
| | | | | | | | |
| Plus | | Other economic flows - other movements in equity | | | (5,407 | ) | | | 3,079 | | | | (3,517 | ) | | | 2,619 | | | | 2,916 | | | | 2,529 | | | | 2,586 | |
| | | | | | | | |
| Equals | | Comprehensive Result - Total Change In Net Worth | | | (4,455 | ) | | | 3,424 | | | | 719 | | | | 3,693 | | | | 4,887 | | | | 4,542 | | | | 3,637 | |
| | | | | | | | |
| | KEY FISCAL AGGREGATES | | | | | | | | | | | | | | | | | | | | | | | | | | | | |
| | | | | | | | |
| | Net Operating Balance | | | 619 | | | | 188 | | | | 962 | | | | 1,213 | | | | 2,226 | | | | 2,132 | | | | 1,327 | |
| | | | | | | | |
| Less | | Net Acquisition of Non-financial Assets | | | | | | | | | | | | | | | | | | | | | | | | | | | | |
| | Purchases of non-financial assets | | | 6,322 | | | | 5,972 | | | | 4,987 | | | | 5,374 | | | | 5,832 | | | | 6,125 | | | | 5,851 | |
| | Less | | Sales of non-financial assets | | | 389 | | | | 292 | | | | 414 | | | | 305 | | | | 196 | | | | 202 | | | | 184 | |
| | Less | | Depreciation | | | 2,946 | | | | 3,226 | | | | 3,116 | | | | 3,264 | | | | 3,443 | | | | 3,525 | | | | 3,628 | |
| | Plus | | Change in inventories | | | (42 | ) | | | (2 | ) | | | (37 | ) | | | 25 | | | | (24 | ) | | | 4 | | | | (22 | ) |
| | Plus | | Other movements in non-financial assets | | | 255 | | | | 6 | | | | 438 | | | | 545 | | | | 1,024 | | | | 612 | | | | 411 | |
| | Equals | | Total Net Acquisition of Non-financial Assets | | | 3,200 | | | | 2,458 | | | | 1,858 | | | | 2,375 | | | | 3,193 | | | | 3,013 | | | | 2,428 | |
| | | | | | | | |
| Equals | | Fiscal Balance | | | (2,581 | ) | | | (2,271 | ) | | | (896 | ) | | | (1,162 | ) | | | (968 | ) | | | (881 | ) | | | (1,101 | ) |
Note:
| 1. | Numbers may not add due to rounding and bracketed numbers represent negative amounts. |
133
Budget Strategy and Outlook 2015-16
| Table 8.2 | Public Non-financial Corporations Sector Operating Statement1 |
| | | | | | | | | | | | | | | | | | | | | | | | | | | | | | | | |
| | | | | | | 2013-14
Actual
$ million | | | 2014-15
Budget
$ million | | | 2014-15
Est. Actual
$ million | | | 2015-16
Budget
$ million | | | 2016-17
Projection
$ million | | | 2017-18
Projection
$ million | | | 2018-19
Projection
$ million | |
| | | | | | | | |
| | Revenue from Transactions | | | | | | | | | | | | | | | | | | | | | | | | | | | | |
| | Grants revenue | | | 787 | | | | 989 | | | | 815 | | | | 649 | | | | 754 | | | | 769 | | | | 838 | |
| | Sales of goods and services | | | 10,398 | | | | 10,164 | | | | 9,837 | | | | 10,477 | | | | 10,961 | | | | 10,776 | | | | 10,812 | |
| | Interest income | | | 141 | | | | 86 | | | | 64 | | | | 53 | | | | 48 | | | | 54 | | | | 53 | |
| | Dividend and income tax equivalent income | | | 21 | | | | — | | | | 10 | | | | — | | | | — | | | | — | | | | — | |
| | Other revenue | | | 391 | | | | 292 | | | | 232 | | | | 191 | | | | 254 | | | | 233 | | | | 248 | |
| | Total Revenue from Transactions | | | 11,738 | | | | 11,531 | | | | 10,959 | | | | 11,370 | | | | 12,018 | | | | 11,831 | | | | 11,952 | |
| | | | | | | | |
| Less | | Expenses from Transactions | | | | | | | | | | | | | | | | | | | | | | | | | | | | |
| | Employee expenses | | | 1,582 | | | | 1,705 | | | | 1,614 | | | | 1,691 | | | | 1,698 | | | | 1,717 | | | | 1,747 | |
| | Superannuation expenses | | | | | | | | | | | | | | | | | | | | | | | | | | | | |
| | Superannuation interest cost | | | (2 | ) | | | — | | | | — | | | | — | | | | — | | | | — | | | | — | |
| | Other superannuation expenses | | | 204 | | | | 211 | | | | 215 | | | | 221 | | | | 224 | | | | 228 | | | | 233 | |
| | Other operating expenses | | | 3,812 | | | | 3,188 | | | | 2,634 | | | | 3,095 | | | | 3,211 | | | | 3,402 | | | | 3,449 | |
| | Depreciation and amortisation | | | 2,232 | | | | 2,255 | | | | 2,279 | | | | 2,380 | | | | 2,486 | | | | 2,572 | | | | 2,616 | |
| | Other interest expenses | | | 2,043 | | | | 2,009 | | | | 1,894 | | | | 1,907 | | | | 2,011 | | | | 1,968 | | | | 1,990 | |
| | Grants expenses | | | 21 | | | | 15 | | | | 14 | | | | 15 | | | | 15 | | | | 15 | | | | 15 | |
| | Other property expenses | | | 368 | | | | 607 | | | | 630 | | | | 738 | | | | 772 | | | | 608 | | | | 582 | |
| | Total Expenses from Transactions | | | 10,260 | | | | 9,990 | | | | 9,281 | | | | 10,047 | | | | 10,417 | | | | 10,511 | | | | 10,632 | |
| | | | | | | | |
| Equals | | Net Operating Balance | | | 1,478 | | | | 1,541 | | | | 1,678 | | | | 1,323 | | | | 1,601 | | | | 1,320 | | | | 1,320 | |
| | | | | | | | |
| Plus | | Other economic flows - included in operating result | | | 36 | | | | (109 | ) | | | (337 | ) | | | 26 | | | | (86 | ) | | | (93 | ) | | | (95 | ) |
| | | | | | | | |
| Equals | | Operating Result | | | 1,514 | | | | 1,433 | | | | 1,341 | | | | 1,349 | | | | 1,515 | | | | 1,227 | | | | 1,225 | |
| | | | | | | | |
| Plus | | Other economic flows - other movements in equity | | | (27 | ) | | | (921 | ) | | | (6,026 | ) | | | (1,216 | ) | | | (1,086 | ) | | | (871 | ) | | | (631 | ) |
| | | | | | | | |
| Equals | | Comprehensive Result - Total Change In Net Worth | | | 1,486 | | | | 512 | | | | (4,685 | ) | | | 133 | | | | 429 | | | | 356 | | | | 594 | |
| | | | | | | | |
| | KEY FISCAL AGGREGATES | | | | | | | | | | | | | | | | | | | | | | | | | | | | |
| | | | | | | | |
| | Net Operating Balance | | | 1,478 | | | | 1,541 | | | | 1,678 | | | | 1,323 | | | | 1,601 | | | | 1,320 | | | | 1,320 | |
| | | | | | | | |
| Less | | Net Acquisition of Non-financial Assets | | | | | | | | | | | | | | | | | | | | | | | | | | | | |
| | Purchases of non-financial assets | | | 2,991 | | | | 3,429 | | | | 3,182 | | | | 3,201 | | | | 3,168 | | | | 2,923 | | | | 2,889 | |
| | Less | | Sales of non-financial assets | | | 105 | | | | 56 | | | | 85 | | | | 46 | | | | 58 | | | | 32 | | | | 49 | |
| | Less | | Depreciation | | | 2,232 | | | | 2,255 | | | | 2,279 | | | | 2,380 | | | | 2,486 | | | | 2,572 | | | | 2,616 | |
| | Plus | | Change in inventories | | | 77 | | | | (14 | ) | | | 10 | | | | (11 | ) | | | (7 | ) | | | 20 | | | | 17 | |
| | Plus | | Other movements in non-financial assets | | | 103 | | | | — | | | | 16 | | | | 45 | | | | 47 | | | | 50 | | | | 52 | |
| | Equals | | Total Net Acquisition of Non-financial Assets | | | 835 | | | | 1,104 | | | | 844 | | | | 809 | | | | 663 | | | | 389 | | | | 294 | |
| | | | | | | | |
| Equals | | Fiscal Balance | | | 643 | | | | 438 | | | | 834 | | | | 513 | | | | 938 | | | | 931 | | | | 1,026 | |
Note:
| 1. | Numbers may not add due to rounding and bracketed numbers represent negative amounts. |
134
Budget Strategy and Outlook 2015-16
| Table 8.3 | Non-financial Public Sector Operating Statement1 |
| | | | | | | | | | | | | | | | | | | | | | | | | | | | | | | | |
| | | | | | | 2013-14 | | | 2014-15 | | | 2014-15 | | | 2015-16 | | | 2016-17 | | | 2017-18 | | | 2018-19 | |
| | | | | | | Actual | | | Budget | | | Est. Actual | | | Budget | | | Projection | | | Projection | | | Projection | |
| | | | | | | $ million | | | $ million | | | $ million | | | $ million | | | $ million | | | $ million | | | $ million | |
| | | | | | | | |
| | Revenue from Transactions | | | | | | | | | | | | | | | | | | | | | | | | | | | | |
| | Taxation revenue | | | 11,497 | | | | 12,109 | | | | 12,363 | | | | 12,584 | | | | 13,226 | | | | 13,896 | | | | 14,606 | |
| | Grants revenue | | | 21,946 | | | | 24,281 | | | | 23,498 | | | | 24,698 | | | | 26,446 | | | | 27,130 | | | | 26,218 | |
| | Sales of goods and services | | | 13,671 | | | | 13,513 | | | | 13,385 | | | | 14,022 | | | | 14,428 | | | | 14,352 | | | | 14,591 | |
| | Interest income | | | 2,601 | | | | 2,515 | | | | 2,531 | | | | 2,426 | | | | 2,323 | | | | 2,342 | | | | 2,355 | |
| | Dividend and income tax equivalent income | | | 263 | | | | 123 | | | | 136 | | | | 72 | | | | 82 | | | | 94 | | | | 105 | |
| | Other revenue | | | 4,030 | | | | 4,147 | | | | 3,498 | | | | 3,699 | | | | 4,204 | | | | 4,678 | | | | 5,008 | |
| | Total Revenue from Transactions | | | 54,008 | | | | 56,687 | | | | 55,412 | | | | 57,501 | | | | 60,710 | | | | 62,491 | | | | 62,883 | |
| | | | | | | | |
Less | | Expenses from Transactions | | | | | | | | | | | | | | | | | | | | | | | | | | | | |
| | Employee expenses | | | 19,301 | | | | 20,198 | | | | 20,458 | | | | 21,531 | | | | 22,166 | | | | 22,751 | | | | 23,292 | |
| | Superannuation expenses | | | | | | | | | | | | | | | | | | | | | | | | | | | | |
| | Superannuation interest cost | | | 962 | | | | 932 | | | | 872 | | | | 803 | | | | 848 | | | | 886 | | | | 898 | |
| | Other superannuation expenses | | | 2,482 | | | | 2,574 | | | | 2,574 | | | | 2,775 | | | | 2,788 | | | | 2,782 | | | | 2,821 | |
| | Other operating expenses | | | 15,138 | | | | 16,589 | | | | 14,980 | | | | 16,183 | | | | 17,301 | | | | 18,335 | | | | 18,900 | |
| | Depreciation and amortisation | | | 5,178 | | | | 5,480 | | | | 5,395 | | | | 5,644 | | | | 5,929 | | | | 6,098 | | | | 6,244 | |
| | Other interest expenses | | | 4,013 | | | | 4,143 | | | | 3,921 | | | | 3,791 | | | | 3,615 | | | | 3,604 | | | | 3,663 | |
| | Grants expenses | | | 6,210 | | | | 6,462 | | | | 6,231 | | | | 5,829 | | | | 5,823 | | | | 5,809 | | | | 5,587 | |
| | Total Expenses from Transactions | | | 53,284 | | | | 56,379 | | | | 54,431 | | | | 56,556 | | | | 58,470 | | | | 60,266 | | | | 61,405 | |
| | | | | | | | |
Equals | | Net Operating Balance | | | 724 | | | | 309 | | | | 981 | | | | 946 | | | | 2,240 | | | | 2,226 | | | | 1,479 | |
| | | | | | | | |
Plus | | Other economic flows - included in operating result | | | 110 | | | | (104 | ) | | | (223 | ) | | | (268 | ) | | | (342 | ) | | | (377 | ) | | | (371 | ) |
| | | | | | | | |
Equals | | Operating Result | | | 834 | | | | 205 | | | | 759 | | | | 678 | | | | 1,897 | | | | 1,849 | | | | 1,107 | |
| | | | | | | | |
Plus | | Other economic flows - other movements in equity | | | (5,289 | ) | | | 3,223 | | | | 982 | | | | 3,016 | | | | 2,990 | | | | 2,693 | | | | 2,529 | |
| | | | | | | | |
Equals | | Comprehensive Result - Total Change In Net Worth | | | (4,455 | ) | | | 3,428 | | | | 1,741 | | | | 3,693 | | | | 4,887 | | | | 4,542 | | | | 3,637 | |
| | | | | | | | |
| | KEY FISCAL AGGREGATES | | | | | | | | | | | | | | | | | | | | | | | | | | | | |
| | | | | | | | |
| | Net Operating Balance | | | 724 | | | | 309 | | | | 981 | | | | 946 | | | | 2,240 | | | | 2,226 | | | | 1,479 | |
| | | | | | | | |
Less | | Net Acquisition of Non-financial Assets | | | | | | | | | | | | | | | | | | | | | | | | | | | | |
| | Purchases of non-financial assets | | | 9,312 | | | | 9,401 | | | | 8,170 | | | | 8,574 | | | | 9,000 | | | | 9,048 | | | | 8,740 | |
| | Less | | Sales of non-financial assets | | | 494 | | | | 348 | | | | 499 | | | | 351 | | | | 254 | | | | 234 | | | | 232 | |
| | Less | | Depreciation | | | 5,178 | | | | 5,480 | | | | 5,395 | | | | 5,644 | | | | 5,929 | | | | 6,098 | | | | 6,244 | |
| | Plus | | Change in inventories | | | 35 | | | | (17 | ) | | | (27 | ) | | | 14 | | | | (31 | ) | | | 24 | | | | (5 | ) |
| | Plus | | Other movements in non-financial assets | | | 358 | | | | 6 | | | | 454 | | | | 590 | | | | 1,071 | | | | 662 | | | | 464 | |
| | Equals | | Total Net Acquisition of Non-financial Assets | | | 4,033 | | | | 3,562 | | | | 2,703 | | | | 3,184 | | | | 3,857 | | | | 3,402 | | | | 2,722 | |
| | | | | | | | |
Equals | | Fiscal Balance | | | (3,309 | ) | | | (3,253 | ) | | | (1,721 | ) | | | (2,238 | ) | | | (1,617 | ) | | | (1,176 | ) | | | (1,243 | ) |
Note:
| 1. | Numbers may not add due to rounding and bracketed numbers represent negative numbers. |
135
Budget Strategy and Outlook 2015-16
| Table 8.4 | General Government Sector Balance Sheet1 |
| | | | | | | | | | | | | | | | | | | | | | | | | | | | |
| | | 2013-14
Actual
$ million | | | 2014-15
Budget
$ million | | | 2014-15
Est. Actual
$ million | | | 2015-16
Budget
$ million | | | 2016-17
Projection
$ million | | | 2017-18
Projection
$ million | | | 2018-19
Projection
$ million | |
| | | | | | | |
Assets | | | | | | | | | | | | | | | | | | | | | | | | | | | | |
Financial Assets | | | | | | | | | | | | | | | | | | | | | | | | | | | | |
Cash and deposits | | | 897 | | | | 1,056 | | | | 853 | | | | 875 | | | | 825 | | | | 750 | | | | 695 | |
Advances paid | | | 686 | | | | 878 | | | | 728 | | | | 820 | | | | 845 | | | | 879 | | | | 827 | |
Investments, loans and placements | | | 35,171 | | | | 35,810 | | | | 36,274 | | | | 33,229 | | | | 33,421 | | | | 33,501 | | | | 33,526 | |
Receivables | | | 4,080 | | | | 4,022 | | | | 7,509 | | | | 4,177 | | | | 3,738 | | | | 3,463 | | | | 3,244 | |
Equity | | | | | | | | | | | | | | | | | | | | | | | | | | | | |
Investments in other public sector entities | | | 26,421 | | | | 25,029 | | | | 22,395 | | | | 22,528 | | | | 22,957 | | | | 23,313 | | | | 23,906 | |
Investments - other | | | 160 | | | | 167 | | | | 160 | | | | 170 | | | | 180 | | | | 190 | | | | 200 | |
Total Financial Assets | | | 67,416 | | | | 66,962 | | | | 67,920 | | | | 61,798 | | | | 61,965 | | | | 62,096 | | | | 62,397 | |
| | | | | | | |
Non-financial Assets | | | | | | | | | | | | | | | | | | | | | | | | | | | | |
Land and other fixed assets | | | 173,998 | | | | 190,033 | | | | 177,435 | | | | 180,775 | | | | 184,893 | | | | 188,842 | | | | 192,246 | |
Other non-financial assets | | | 6,784 | | | | 7,524 | | | | 6,067 | | | | 6,283 | | | | 6,391 | | | | 6,587 | | | | 6,788 | |
Total Non-financial Assets | | | 180,783 | | | | 197,556 | | | | 183,503 | | | | 187,058 | | | | 191,285 | | | | 195,428 | | | | 199,034 | |
| | | | | | | |
Total Assets | | | 248,198 | | | | 264,518 | | | | 251,423 | | | | 248,856 | | | | 253,250 | | | | 257,525 | | | | 261,431 | |
| | | | | | | |
Liabilities | | | | | | | | | | | | | | | | | | | | | | | | | | | | |
Payables | | | 3,315 | | | | 3,405 | | | | 3,504 | | | | 3,328 | | | | 3,260 | | | | 3,317 | | | | 3,387 | |
Superannuation liability | | | 25,512 | | | | 23,641 | | | | 25,744 | | | | 24,278 | | | | 22,672 | | | | 21,298 | | | | 20,003 | |
Other employee benefits | | | 4,976 | | | | 5,611 | | | | 4,892 | | | | 5,204 | | | | 5,435 | | | | 5,661 | | | | 5,879 | |
Deposits held | | | 1 | | | | — | | | | 1 | | | | 1 | | | | 1 | | | | 1 | | | | 1 | |
Advances received | | | 554 | | | | 544 | | | | 643 | | | | 682 | | | | 677 | | | | 672 | | | | 630 | |
Borrowing | | | 41,403 | | | | 48,141 | | | | 43,268 | | | | 38,151 | | | | 38,818 | | | | 39,532 | | | | 40,724 | |
Other liabilities | | | 3,171 | | | | 4,085 | | | | 3,363 | | | | 3,512 | | | | 3,799 | | | | 3,914 | | | | 4,042 | |
Total Liabilities | | | 78,933 | | | | 85,428 | | | | 81,415 | | | | 75,155 | | | | 74,663 | | | | 74,395 | | | | 74,665 | |
| | | | | | | |
Net Worth | | | 169,265 | | | | 179,091 | | | | 170,007 | | | | 173,701 | | | | 178,588 | | | | 183,130 | | | | 186,766 | |
| | | | | | | | | | | | | | | | | | | | | | | | | | | | |
Net Financial Worth | | | (11,517 | ) | | | (18,466 | ) | | | (13,496 | ) | | | (13,357 | ) | | | (12,697 | ) | | | (12,299 | ) | | | (12,268 | ) |
Net Financial Liabilities | | | 37,938 | | | | 43,495 | | | | 35,891 | | | | 35,885 | | | | 35,654 | | | | 35,611 | | | | 36,174 | |
Net Debt | | | 5,203 | | | | 10,942 | | | | 6,056 | | | | 3,910 | | | | 4,405 | | | | 5,074 | | | | 6,307 | |
Notes:
| 1. | Numbers may not add due to rounding and bracketed numbers represent negative amounts. |
136
Budget Strategy and Outlook 2015-16
| Table 8.5 | Public Non-financial Corporations Sector Balance Sheet1 |
| | | | | | | | | | | | | | | | | | | | | | | | | | | | |
| | | 2013-14
Actual
$ million | | | 2014-15
Budget
$ million | | | 2014-15
Est. Actual
$ million | | | 2015-16
Budget
$ million | | | 2016-17
Projection
$ million | | | 2017-18
Projection
$ million | | | 2018-19
Projection
$ million | |
| | | | | | | |
Assets | | | | | | | | | | | | | | | | | | | | | | | | | | | | |
Financial Assets | | | | | | | | | | | | | | | | | | | | | | | | | | | | |
Cash and deposits | | | 1,568 | | | | 1,143 | | | | 1,629 | | | | 1,257 | | | | 1,198 | | | | 1,241 | | | | 1,318 | |
Advances paid | | | 49 | | | | 41 | | | | 41 | | | | 33 | | | | 25 | | | | 18 | | | | 11 | |
Investments, loans and placements | | | 392 | | | | 91 | | | | 605 | | | | 415 | | | | 249 | | | | 114 | | | | 112 | |
Receivables | | | 2,796 | | | | 2,959 | | | | 1,638 | | | | 1,527 | | | | 1,634 | | | | 1,656 | | | | 1,654 | |
Equity | | | | | | | | | | | | | | | | | | | | | | | | | | | | |
Investments - other | | | 278 | | | | 4 | | | | 271 | | | | 271 | | | | 271 | | | | 271 | | | | 271 | |
Total Financial Assets | | | 5,083 | | | | 4,238 | | | | 4,184 | | | | 3,502 | | | | 3,377 | | | | 3,300 | | | | 3,365 | |
| | | | | | | |
Non-financial Assets | | | | | | | | | | | | | | | | | | | | | | | | | | | | |
Land and other fixed assets | | | 58,190 | | | | 58,708 | | | | 58,520 | | | | 59,978 | | | | 61,268 | | | | 62,305 | | | | 63,280 | |
Other non-financial assets | | | 1,371 | | | | 2,504 | | | | 1,407 | | | | 1,421 | | | | 1,436 | | | | 1,442 | | | | 1,463 | |
Total Non-financial Assets | | | 59,561 | | | | 61,212 | | | | 59,927 | | | | 61,399 | | | | 62,704 | | | | 63,747 | | | | 64,742 | |
| | | | | | | |
Total Assets | | | 64,644 | | | | 65,451 | | | | 64,111 | | | | 64,901 | | | | 66,081 | | | | 67,046 | | | | 68,107 | |
| | | | | | | |
Liabilities | | | | | | | | | | | | | | | | | | | | | | | | | | | | |
Payables | | | 2,522 | | | | 2,491 | | | | 5,920 | | | | 2,652 | | | | 2,273 | | | | 1,989 | | | | 1,766 | |
Superannuation liability | | | (155 | ) | | | (61 | ) | | | (151 | ) | | | (131 | ) | | | (109 | ) | | | (87 | ) | | | (85 | ) |
Other employee benefits | | | 701 | | | | 846 | | | | 707 | | | | 720 | | | | 733 | | | | 744 | | | | 754 | |
Deposits held | | | 26 | | | | 28 | | | | 26 | | | | 26 | | | | 26 | | | | 26 | | | | 26 | |
Advances received | | | 9 | | | | 8 | | | | 8 | | | | 8 | | | | 7 | | | | 6 | | | | 5 | |
Borrowing | | | 31,313 | | | | 31,814 | | | | 32,268 | | | | 35,962 | | | | 36,896 | | | | 37,587 | | | | 38,078 | |
Other liabilities | | | 7,617 | | | | 8,578 | | | | 7,400 | | | | 7,597 | | | | 7,760 | | | | 7,930 | | | | 8,118 | |
Total Liabilities | | | 42,033 | | | | 43,705 | | | | 46,178 | | | | 46,834 | | | | 47,586 | | | | 48,195 | | | | 48,662 | |
| | | | | | | |
Net Worth | | | 22,611 | | | | 21,745 | | | | 17,934 | | | | 18,067 | | | | 18,496 | | | | 18,852 | | | | 19,445 | |
| | | | | | | | | | | | | | | | | | | | | | | | | | | | |
Net Financial Worth | | | (36,950 | ) | | | (39,467 | ) | | | (41,994 | ) | | | (43,332 | ) | | | (44,208 | ) | | | (44,895 | ) | | | (45,297 | ) |
Net Debt | | | 29,339 | | | | 30,575 | | | | 30,027 | | | | 34,292 | | | | 35,457 | | | | 36,247 | | | | 36,669 | |
Notes:
| 1. | Numbers may not add due to rounding and bracketed numbers represent negative amounts. |
137
Budget Strategy and Outlook 2015-16
| Table 8.6 | Non-financial Public Sector Balance Sheet1 |
| | | | | | | | | | | | | | | | | | | | | | | | | | | | |
| | | 2013-14
Actual
$ million | | | 2014-15
Budget
$ million | | | 2014-15
Est. Actual
$ million | | | 2015-16
Budget
$ million | | | 2016-17
Projection
$ million | | | 2017-18
Projection
$ million | | | 2018-19
Projection
$ million | |
| | | | | | | |
Assets | | | | | | | | | | | | | | | | | | | | | | | | | | | | |
Financial Assets | | | | | | | | | | | | | | | | | | | | | | | | | | | | |
Cash and deposits | | | 2,466 | | | | 2,199 | | | | 2,482 | | | | 2,131 | | | | 2,023 | | | | 1,991 | | | | 2,013 | |
Advances paid | | | 727 | | | | 911 | | | | 761 | | | | 846 | | | | 863 | | | | 891 | | | | 832 | |
Investments, loans and placements | | | 35,562 | | | | 35,902 | | | | 36,879 | | | | 33,643 | | | | 33,670 | | | | 33,615 | | | | 33,638 | |
Receivables | | | 5,156 | | | | 4,868 | | | | 3,846 | | | | 3,704 | | | | 3,766 | | | | 3,785 | | | | 3,782 | |
Equity | | | | | | | | | | | | | | | | | | | | | | | | | | | | |
Investments in other public sector entities | | | 3,810 | | | | 3,186 | | | | 4,462 | | | | 4,462 | | | | 4,462 | | | | 4,462 | | | | 4,462 | |
Investments - other | | | 438 | | | | 171 | | | | 431 | | | | 441 | | | | 451 | | | | 461 | | | | 471 | |
Total Financial Assets | | | 48,159 | | | | 47,237 | | | | 48,860 | | | | 45,226 | | | | 45,235 | | | | 45,204 | | | | 45,196 | |
| | | | | | | |
Non-financial Assets | | | | | | | | | | | | | | | | | | | | | | | | | | | | |
Land and other fixed assets | | | 232,188 | | | | 248,740 | | | | 235,955 | | | | 240,752 | | | | 246,161 | | | | 251,146 | | | | 255,525 | |
Other non-financial assets | | | 1,279 | | | | 956 | | | | 478 | | | | 473 | | | | 393 | | | | 369 | | | | 343 | |
Total Non-financial Assets | | | 233,467 | | | | 249,695 | | | | 236,433 | | | | 241,225 | | | | 246,554 | | | | 251,516 | | | | 255,868 | |
| | | | | | | |
Total Assets | | | 281,626 | | | | 296,932 | | | | 285,293 | | | | 286,451 | | | | 291,789 | | | | 296,720 | | | | 301,064 | |
| | | | | | | |
Liabilities | | | | | | | | | | | | | | | | | | | | | | | | | | | | |
Payables | | | 4,164 | | | | 3,832 | | | | 4,170 | | | | 4,029 | | | | 3,976 | | | | 4,021 | | | | 4,086 | |
Superannuation liability | | | 25,357 | | | | 23,580 | | | | 25,594 | | | | 24,147 | | | | 22,563 | | | | 21,211 | | | | 19,918 | |
Other employee benefits | | | 5,677 | | | | 6,458 | | | | 5,599 | | | | 5,925 | | | | 6,168 | | | | 6,405 | | | | 6,633 | |
Deposits held | | | 26 | | | | 28 | | | | 26 | | | | 27 | | | | 27 | | | | 27 | | | | 27 | |
Advances received | | | 554 | | | | 544 | | | | 643 | | | | 682 | | | | 677 | | | | 672 | | | | 630 | |
Borrowing | | | 72,716 | | | | 79,956 | | | | 75,535 | | | | 74,113 | | | | 75,714 | | | | 77,119 | | | | 78,802 | |
Other liabilities | | | 3,865 | | | | 3,542 | | | | 3,719 | | | | 3,829 | | | | 4,076 | | | | 4,136 | | | | 4,203 | |
Total Liabilities | | | 112,361 | | | | 117,940 | | | | 115,286 | | | | 112,751 | | | | 113,201 | | | | 113,590 | | | | 114,298 | |
| | | | | | | |
Net Worth | | | 169,265 | | | | 178,992 | | | | 170,007 | | | | 173,701 | | | | 178,588 | | | | 183,130 | | | | 186,766 | |
| | | | | | | | | | | | | | | | | | | | | | | | | | | | |
Net Financial Worth | | | (64,201 | ) | | | (70,703 | ) | | | (66,426 | ) | | | (67,524 | ) | | | (67,966 | ) | | | (68,386 | ) | | | (69,102 | ) |
Net Financial Liabilities | | | 68,012 | | | | 73,889 | | | | 70,888 | | | | 71,986 | | | | 72,428 | | | | 72,848 | | | | 73,564 | |
Net Debt | | | 34,542 | | | | 41,517 | | | | 36,083 | | | | 38,201 | | | | 39,862 | | | | 41,321 | | | | 42,976 | |
Notes:
| 1. | Numbers may not add due to rounding and bracketed numbers represent negative amounts. |
138
Budget Strategy and Outlook 2015-16
| Table 8.7 | General Government Sector Cash Flow Statement1 |
| | | | | | | | | | | | | | | | | | | | | | | | | | | | |
| | | 2013-14
Actual
$ million | | | 2014-15
Budget
$ million | | | 2014-15
Est. Actual
$ million | | | 2015-16
Budget
$ million | | | 2016-17
Projection
$ million | | | 2017-18
Projection
$ million | | | 2018-19
Projection
$ million | |
| | | | | | | |
Cash Receipts from Operating Activities | | | | | | | | | | | | | | | | | | | | | | | | | | | | |
Taxes received | | | 11,889 | | | | 12,453 | | | | 12,671 | | | | 12,924 | | | | 13,606 | | | | 14,288 | | | | 15,006 | |
Grants and subsidies received | | | 21,847 | | | | 24,117 | | | | 23,424 | | | | 24,650 | | | | 26,397 | | | | 27,033 | | | | 26,118 | |
Sales of goods and services | | | 5,420 | | | | 5,435 | | | | 5,696 | | | | 5,565 | | | | 5,600 | | | | 5,738 | | | | 5,939 | |
Interest receipts | | | 2,348 | | | | 2,429 | | | | 2,467 | | | | 2,372 | | | | 2,274 | | | | 2,289 | | | | 2,302 | |
Dividends and income tax equivalents | | | 1,386 | | | | 1,887 | | | | 2,084 | | | | 2,740 | | | | 2,655 | | | | 2,347 | | | | 1,898 | |
Other receipts | | | 4,745 | | | | 4,929 | | | | 4,477 | | | | 4,605 | | | | 5,013 | | | | 5,540 | | | | 5,879 | |
Total Operating Receipts | | | 47,635 | | | | 51,251 | | | | 50,818 | | | | 52,856 | | | | 55,545 | | | | 57,234 | | | | 57,141 | |
| | | | | | | |
Cash Payments for Operating Activities | | | | | | | | | | | | | | | | | | | | | | | | | | | | |
Payments for employees | | | (21,101 | ) | | | (21,579 | ) | | | (21,995 | ) | | | (23,113 | ) | | | (23,992 | ) | | | (24,725 | ) | | | (25,405 | ) |
Payments for goods and services | | | (14,603 | ) | | | (16,585 | ) | | | (15,641 | ) | | | (16,289 | ) | | | (17,361 | ) | | | (18,143 | ) | | | (18,653 | ) |
Grants and subsidies | | | (6,893 | ) | | | (7,019 | ) | | | (6,476 | ) | | | (6,506 | ) | | | (6,366 | ) | | | (6,289 | ) | | | (6,202 | ) |
Interest paid | | | (2,202 | ) | | | (2,378 | ) | | | (2,265 | ) | | | (2,115 | ) | | | (1,873 | ) | | | (1,914 | ) | | | (1,957 | ) |
Other payments | | | (249 | ) | | | (351 | ) | | | (354 | ) | | | (348 | ) | | | (184 | ) | | | (414 | ) | | | (431 | ) |
Total Operating Payments | | | (45,047 | ) | | | (47,912 | ) | | | (46,731 | ) | | | (48,372 | ) | | | (49,776 | ) | | | (51,487 | ) | | | (52,649 | ) |
| | | | | | | |
Net Cash Inflows from Operating Activities | | | 2,587 | | | | 3,338 | | | | 4,087 | | | | 4,485 | | | | 5,768 | | | | 5,747 | | | | 4,492 | |
| | | | | | | |
Cash Flows from Investments in Non-Financial Assets | | | | | | | | | | | | | | | | | | | | | | | | | | | | |
Purchases of non-financial assets | | | (6,322 | ) | | | (5,972 | ) | | | (4,987 | ) | | | (5,374 | ) | | | (5,832 | ) | | | (6,125 | ) | | | (5,851 | ) |
Sales of non-financial assets | | | 389 | | | | 292 | | | | 414 | | | | 305 | | | | 196 | | | | 202 | | | | 184 | |
Net Cash Flows from Investments in Non-financial Assets | | | (5,933 | ) | | | (5,680 | ) | | | (4,574 | ) | | | (5,069 | ) | | | (5,636 | ) | | | (5,922 | ) | | | (5,668 | ) |
| | | | | | | |
Net Cash Flows from Investments in Financial Assets for Policy Purposes | | | 527 | | | | 169 | | | | 12 | | | | 3,100 | | | | 156 | | | | 2 | | | | 165 | |
| | | | | | | |
Net Cash Flows from Investments in Financial Assets for Liquidity Purposes | | | (667 | ) | | | (866 | ) | | | (1,088 | ) | | | 3,061 | | | | (124 | ) | | | (77 | ) | | | (23 | ) |
| | | | | | | |
Receipts from Financing Activities | | | | | | | | | | | | | | | | | | | | | | | | | | | | |
Advances received (net) | | | 95 | | | | (52 | ) | | | (52 | ) | | | (41 | ) | | | (31 | ) | | | (26 | ) | | | 10 | |
Borrowing (net) | | | 3,449 | | | | 3,107 | | | | 1,551 | | | | (5,514 | ) | | | (182 | ) | | | 201 | | | | 968 | |
Deposits received (net) | | | 1 | | | | — | | | | — | | | | — | | | | — | | | | — | | | | — | |
Net Cash Flows from Financing Activities | | | 3,544 | | | | 3,055 | | | | 1,498 | | | | (5,555 | ) | | | (213 | ) | | | 175 | | | | 978 | |
| | | | | | | |
Net Increase/(Decrease) in Cash held | | | 59 | | | | 16 | | | | (64 | ) | | | 22 | | | | (50 | ) | | | (75 | ) | | | (55 | ) |
| | | | | | | |
Net cash from operating activities | | | 2,587 | | | | 3,338 | | | | 4,087 | | | | 4,485 | | | | 5,768 | | | | 5,747 | | | | 4,492 | |
Net cash flows from investments in non-financial assets | | | (5,933 | ) | | | (5,680 | ) | | | (4,574 | ) | | | (5,069 | ) | | | (5,636 | ) | | | (5,922 | ) | | | (5,668 | ) |
Surplus/(Deficit) | | | (3,345 | ) | | | (2,342 | ) | | | (487 | ) | | | (584 | ) | | | 132 | | | | (176 | ) | | | (1,176 | ) |
| | | | | | | |
Derivation of ABS GFS Cash Surplus/Deficit | | | | | | | | | | | | | | | | | | | | | | | | | | | | |
Cash surplus/(deficit) | | | (3,345 | ) | | | (2,342 | ) | | | (487 | ) | | | (584 | ) | | | 132 | | | | (176 | ) | | | (1,176 | ) |
Acquisitions under finance leases | | | (94 | ) | | | (14 | ) | | | (415 | ) | | | (385 | ) | | | (843 | ) | | | (502 | ) | | | (231 | ) |
ABS GFS Cash Surplus/(Deficit) Including Finance Leases and Similar Arrangements | | | (3,440 | ) | | | (2,356 | ) | | | (901 | ) | | | (968 | ) | | | (711 | ) | | | (678 | ) | | | (1,407 | ) |
Note:
| 1. | Numbers may not add due to rounding and bracketed numbers represent negative amounts. |
139
Budget Strategy and Outlook 2015-16
| Table 8.8 | Public Non-financial Corporations Sector Cash Flow Statement1 |
| | | | | | | | | | | | | | | | | | | | | | | | | | | | |
| | | 2013-14
Actual
$ million | | | 2014-15
Budget
$ million | | | 2014-15
Est. Actual
$ million | | | 2015-16
Budget
$ million | | | 2016-17
Projection
$ million | | | 2017-18
Projection
$ million | | | 2018-19
Projection
$ million | |
| | | | | | | |
Cash Receipts from Operating Activities | | | | | | | | | | | | | | | | | | | | | | | | | | | | |
Grants and subsidies received | | | 890 | | | | 1,005 | | | | 778 | | | | 665 | | | | 739 | | | | 753 | | | | 822 | |
Sales of goods and services | | | 11,237 | | | | 10,839 | | | | 10,623 | | | | 11,954 | | | | 11,980 | | | | 11,860 | | | | 11,921 | |
Interest receipts | | | 141 | | | | 86 | | | | 65 | | | | 53 | | | | 48 | | | | 54 | | | | 53 | |
Dividends and income tax equivalents | | | 21 | | | | — | | | | 10 | | | | — | | | | — | | | | — | | | | — | |
Other receipts | | | 215 | | | | 375 | | | | 232 | | | | 148 | | | | 210 | | | | 184 | | | | 196 | |
Total Operating Receipts | | | 12,504 | | | | 12,305 | | | | 11,709 | | | | 12,821 | | | | 12,977 | | | | 12,851 | | | | 12,992 | |
| | | | | | | |
Cash Payments for Operating Activities | | | | | | | | | | | | | | | | | | | | | | | | | | | | |
Payments for employees | | | (1,837 | ) | | | (1,905 | ) | | | (1,820 | ) | | | (1,879 | ) | | | (1,890 | ) | | | (1,914 | ) | | | (1,969 | ) |
Payments for goods and services | | | (4,563 | ) | | | (3,830 | ) | | | (3,373 | ) | | | (3,853 | ) | | | (3,801 | ) | | | (4,026 | ) | | | (4,076 | ) |
Grants and subsidies | | | (9 | ) | | | (13 | ) | | | (11 | ) | | | (13 | ) | | | (14 | ) | | | (14 | ) | | | (14 | ) |
Interest paid | | | (1,918 | ) | | | (1,897 | ) | | | (1,770 | ) | | | (1,787 | ) | | | (2,007 | ) | | | (1,977 | ) | | | (1,990 | ) |
Other payments | | | (911 | ) | | | (954 | ) | | | (971 | ) | | | (1,582 | ) | | | (1,507 | ) | | | (1,231 | ) | | | (1,134 | ) |
Total Operating Payments | | | (9,237 | ) | | | (8,599 | ) | | | (7,944 | ) | | | (9,115 | ) | | | (9,218 | ) | | | (9,162 | ) | | | (9,183 | ) |
| | | | | | | |
Net Cash Inflows from Operating Activities | | | 3,267 | | | | 3,706 | | | | 3,764 | | | | 3,706 | | | | 3,759 | | | | 3,689 | | | | 3,809 | |
| | | | | | | |
Cash Flows from Investments in Non-Financial Assets | | | | | | | | | | | | | | | | | | | | | | | | | | | | |
Purchases of non-financial assets | | | (2,991 | ) | | | (3,429 | ) | | | (3,182 | ) | | | (3,201 | ) | | | (3,168 | ) | | | (2,923 | ) | | | (2,889 | ) |
Sales of non-financial assets | | | 105 | | | | 56 | | | | 85 | | | | 46 | | | | 58 | | | | 32 | | | | 49 | |
Net Cash Flows from Investments in Non-financial Assets | | | (2,886 | ) | | | (3,373 | ) | | | (3,097 | ) | | | (3,155 | ) | | | (3,110 | ) | | | (2,891 | ) | | | (2,840 | ) |
| | | | | | | |
Net Cash Flows from Investments in Financial Assets for Policy Purposes | | | 644 | | | | 180 | | | | — | | | | (3,159 | ) | | | (156 | ) | | | (2 | ) | | | (165 | ) |
| | | | | | | |
Net Cash Flows from Investments in Financial Assets for Liquidity Purposes | | | 8 | | | | — | | | | (31 | ) | | | — | | | | — | | | | — | | | | — | |
| | | | | | | |
Receipts from Financing Activities | | | | | | | | | | | | | | | | | | | | | | | | | | | | |
Advances received (net) | | | (1 | ) | | | (1 | ) | | | (1 | ) | | | (1 | ) | | | (1 | ) | | | (1 | ) | | | (1 | ) |
Borrowing (net) | | | 94 | | | | 716 | | | | 826 | | | | 3,828 | | | | 1,095 | | | | 834 | | | | 499 | |
Dividends paid | | | (1,038 | ) | | | (1,293 | ) | | | (1,376 | ) | | | (1,651 | ) | | | (1,646 | ) | | | (1,587 | ) | | | (1,227 | ) |
Deposits received (net) | | | 2 | | | | 2 | | | | — | | | | — | | | | — | | | | — | | | | — | |
Other financing (net) | | | (516 | ) | | | (185 | ) | | | (25 | ) | | | 59 | | | | — | | | | — | | | | — | |
Net Cash Flows from Financing Activities | | | (1,458 | ) | | | (760 | ) | | | (576 | ) | | | 2,235 | | | | (552 | ) | | | (753 | ) | | | (728 | ) |
| | | | | | | |
Net Increase/(Decrease) in Cash held | | | (426 | ) | | | (248 | ) | | | 61 | | | | (373 | ) | | | (58 | ) | | | 43 | | | | 76 | |
| | | | | | | |
Net cash from operating activities | | | 3,267 | | | | 3,706 | | | | 3,764 | | | | 3,706 | | | | 3,759 | | | | 3,689 | | | | 3,809 | |
Net cash flows from investments in non-financial assets | | | (2,886 | ) | | | (3,373 | ) | | | (3,097 | ) | | | (3,155 | ) | | | (3,110 | ) | | | (2,891 | ) | | | (2,840 | ) |
Dividends paid | | | (1,038 | ) | | | (1,293 | ) | | | (1,376 | ) | | | (1,651 | ) | | | (1,646 | ) | | | (1,587 | ) | | | (1,227 | ) |
Surplus/(Deficit) | | | (657 | ) | | | (960 | ) | | | (709 | ) | | | (1,100 | ) | | | (997 | ) | | | (788 | ) | | | (258 | ) |
| | | | | | | |
Derivation of ABS GFS Cash Surplus/Deficit | | | | | | | | | | | | | | | | | | | | | | | | | | | | |
Cash surplus/(deficit) | | | (657 | ) | | | (960 | ) | | | (709 | ) | | | (1,100 | ) | | | (997 | ) | | | (788 | ) | | | (258 | ) |
Acquisitions under finance leases | | | (44 | ) | | | — | | | | — | | | | — | | | | — | | | | — | | | | — | |
ABS GFS Cash Surplus/(Deficit) Including Finance Leases and Similar Arrangements | | | (701 | ) | | | (960 | ) | | | (709 | ) | | | (1,100 | ) | | | (997 | ) | | | (788 | ) | | | (258 | ) |
Note:
| 1. | Numbers may not add due to rounding and bracketed numbers represent negative amounts. |
140
Budget Strategy and Outlook 2015-16
| Table 8.9 | Non-financial Public Sector Cash Flow Statement1 |
| | | | | | | | | | | | | | | | | | | | | | | | | | | | |
| | | 2013-14
Actual
$ million | | | 2014-15
Budget
$ million | | | 2014-15
Est. Actual
$ million | | | 2015-16
Budget
$ million | | | 2016-17
Projection
$ million | | | 2017-18
Projection
$ million | | | 2018-19
Projection
$ million | |
| | | | | | | |
Cash Receipts from Operating Activities | | | | | | | | | | | | | | | | | | | | | | | | | | | | |
Taxes received | | | 11,536 | | | | 12,108 | | | | 12,328 | | | | 12,583 | | | | 13,225 | | | | 13,895 | | | | 14,605 | |
Grants and subsidies received | | | 22,040 | | | | 24,343 | | | | 23,514 | | | | 24,778 | | | | 26,532 | | | | 27,174 | | | | 26,262 | |
Sales of goods and services | | | 14,760 | | | | 14,237 | | | | 14,139 | | | | 15,280 | | | | 15,242 | | | | 15,249 | | | | 15,509 | |
Interest receipts | | | 2,489 | | | | 2,515 | | | | 2,532 | | | | 2,426 | | | | 2,323 | | | | 2,342 | | | | 2,355 | |
Dividends and income tax equivalents | | | 81 | | | | 217 | | | | 238 | | | | 146 | | | | 76 | | | | 86 | | | | 98 | |
Other receipts | | | 4,959 | | | | 5,299 | | | | 4,705 | | | | 4,753 | | | | 5,223 | | | | 5,724 | | | | 6,075 | |
Total Operating Receipts | | | 55,866 | | | | 58,719 | | | | 57,456 | | | | 59,966 | | | | 62,621 | | | | 64,470 | | | | 64,904 | |
| | | | | | | |
Cash Payments for Operating Activities | | | | | | | | | | | | | | | | | | | | | | | | | | | | |
Payments for employees | | | (22,839 | ) | | | (23,392 | ) | | | (23,720 | ) | | | (24,894 | ) | | | (25,783 | ) | | | (26,539 | ) | | | (27,272 | ) |
Payments for goods and services | | | (17,349 | ) | | | (18,391 | ) | | | (16,846 | ) | | | (17,915 | ) | | | (18,838 | ) | | | (19,833 | ) | | | (20,392 | ) |
Grants and subsidies | | | (6,135 | ) | | | (6,252 | ) | | | (5,798 | ) | | | (5,983 | ) | | | (5,776 | ) | | | (5,691 | ) | | | (5,538 | ) |
Interest paid | | | (3,885 | ) | | | (4,032 | ) | | | (3,799 | ) | | | (3,672 | ) | | | (3,611 | ) | | | (3,613 | ) | | | (3,664 | ) |
Other payments | | | (843 | ) | | | (903 | ) | | | (817 | ) | | | (963 | ) | | | (732 | ) | | | (944 | ) | | | (964 | ) |
Total Operating Payments | | | (51,051 | ) | | | (52,969 | ) | | | (50,980 | ) | | | (53,426 | ) | | | (54,739 | ) | | | (56,620 | ) | | | (57,830 | ) |
| | | | | | | |
Net Cash Inflows from Operating Activities | | | 4,815 | | | | 5,751 | | | | 6,475 | | | | 6,540 | | | | 7,882 | | | | 7,850 | | | | 7,074 | |
| | | | | | | |
Cash Flows from Investments in Non-Financial Assets | | | | | | | | | | | | | | | | | | | | | | | | | | | | |
Purchases of non-financial assets | | | (9,312 | ) | | | (9,401 | ) | | | (8,170 | ) | | | (8,574 | ) | | | (9,000 | ) | | | (9,048 | ) | | | (8,740 | ) |
Sales of non-financial assets | | | 494 | | | | 348 | | | | 499 | | | | 351 | | | | 254 | | | | 234 | | | | 232 | |
Net Cash Flows from Investments in Non-financial Assets | | | (8,817 | ) | | | (9,053 | ) | | | (7,671 | ) | | | (8,224 | ) | | | (8,746 | ) | | | (8,813 | ) | | | (8,507 | ) |
| | | | | | | |
Net Cash Flows from Investments in Financial Assets for Policy Purposes | | | 651 | | | | 174 | | | | (8 | ) | | | — | | | | — | | | | — | | | | — | |
| | | | | | | |
Net Cash Flows from Investments in Financial Assets for Liquidity Purposes | | | (659 | ) | | | (866 | ) | | | (1,119 | ) | | | 3,061 | | | | (124 | ) | | | (77 | ) | | | (23 | ) |
| | | | | | | |
Receipts from Financing Activities | | | | | | | | | | | | | | | | | | | | | | | | | | | | |
Advances received (net) | | | 94 | | | | (53 | ) | | | (53 | ) | | | (41 | ) | | | (31 | ) | | | (26 | ) | | | 9 | |
Borrowing (net) | | | 3,543 | | | | 3,823 | | | | 2,377 | | | | (1,686 | ) | | | 913 | | | | 1,035 | | | | 1,468 | |
Deposits received (net) | | | 3 | | | | 2 | | | | — | | | | — | | | | — | | | | — | | | | — | |
Other financing (net) | | | 4 | | | | (10 | ) | | | (5 | ) | | | — | | | | — | | | | — | | | | — | |
Net Cash Flows from Financing Activities | | | 3,644 | | | | 3,763 | | | | 2,319 | | | | (1,728 | ) | | | 881 | | | | 1,008 | | | | 1,477 | |
| | | | | | | |
Net Increase/(Decrease) in Cash held | | | (366 | ) | | | (232 | ) | | | (3 | ) | | | (351 | ) | | | (108 | ) | | | (32 | ) | | | 21 | |
| | | | | | | |
Net cash from operating activities | | | 4,815 | | | | 5,751 | | | | 6,475 | | | | 6,540 | | | | 7,882 | | | | 7,850 | | | | 7,074 | |
Net cash flows from investments in non-financial assets | | | (8,817 | ) | | | (9,053 | ) | | | (7,671 | ) | | | (8,224 | ) | | | (8,746 | ) | | | (8,813 | ) | | | (8,507 | ) |
Surplus/(Deficit) | | | (4,003 | ) | | | (3,302 | ) | | | (1,195 | ) | | | (1,684 | ) | | | (865 | ) | | | (964 | ) | | | (1,433 | ) |
| | | | | | | |
Derivation of ABS GFS Cash Surplus/Deficit | | | | | | | | | | | | | | | | | | | | | | | | | | | | |
Cash surplus/(deficit) | | | (4,003 | ) | | | (3,302 | ) | | | (1,195 | ) | | | (1,684 | ) | | | (865 | ) | | | (964 | ) | | | (1,433 | ) |
Acquisitions under finance leases | | | (138 | ) | | | (14 | ) | | | (415 | ) | | | (385 | ) | | | (843 | ) | | | (502 | ) | | | (231 | ) |
ABS GFS Cash Surplus/(Deficit) Including Finance Leases and Similar Arrangements | | | (4,141 | ) | | | (3,316 | ) | | | (1,610 | ) | | | (2,068 | ) | | | (1,708 | ) | | | (1,466 | ) | | | (1,664 | ) |
Note:
| 1. | Numbers may not add due to rounding and bracketed numbers represent negative amounts. |
141
Budget Strategy and Outlook 2015-16
| 8.3 | Reconciliation of net operating balance to accounting operating result |
The primary difference between the net operating balance and the accounting operating result calculated under Australian Accounting Standards is that valuation adjustments are excluded from the net operating balance.
Data presented in Table 8.10 provides a reconciliation of the General Government Sector net operating balance to the accounting operating result.
| Table 8.10 | Reconciliation of UPF net operating balance to accounting operating result1 |
| | | | | | | | | | | | |
| | | 2014-15
Budget
$ million | | | 2014-15
Est. Act.
$ million | | | 2015-16
Budget
$ million | |
| | | |
Net operating balance General Government sector (Table 8.1) | | | 188 | | | | 962 | | | | 1,213 | |
| | | |
Remeasurement/valuation adjustments | | | | | | | | | | | | |
Bad debts and amortisation | | | (83 | ) | | | (40 | ) | | | (100 | ) |
Deferred tax equivalents | | | 99 | | | | 116 | | | | (19 | ) |
Dividends received on privatisation sales | | | 152 | | | | — | | | | — | |
Dividends from network GOCs under Debt Action Plan (treated as return of equity for UPF) | | | — | | | | 3,159 | | | | 156 | |
Market value adjustments investments/loans | | | 20 | | | | 28 | | | | 23 | |
Revaluation of provisions | | | 136 | | | | 322 | | | | 66 | |
Decommissioned infrastructure assets and land under roads | | | (143 | ) | | | (143 | ) | | | (143 | ) |
Gain/(loss) on assets sold/written off/impaired | | | (25 | ) | | | (169 | ) | | | (121 | ) |
| | | |
Accounting operating result General Government sector | | | 345 | | | | 4,236 | | | | 1,074 | |
Note:
| 1 | Numbers may not add due to rounding and bracketed numbers represent negative amounts. |
142
Budget Strategy and Outlook 2015-16
| 8.4 | General Government Sector time series |
Data presented in Table 8.11 provides a time series from 2003-04 to 2013-14 for the General Government Sector on the key fiscal aggregates used by the Government to measure financial performance. These aggregates have been backcast (as far as is possible) to comply with AASB 1049 Whole of Government and General Government Sector Financial Reporting.
143
Budget Strategy and Outlook 2015-16
Table 8.11 General Government Sector1
| | | | | | | | | | | | | | | | | | | | | | | | | | | | | | | | | | | | | | | | | | | | |
| | | 2003-04
Actual
$ million | | | 2004-05
Actual
$ million | | | 2005-06
Actual
$ million | | | 2006-07
Actual
$ million | | | 2007-08
Actual
$ million | | | 2008-09
Actual
$ million | | | 2009-10
Actual
$ million | | | 2010-11
Actual
$ million | | | 2011-12
Actual
$ million | | | 2012-13
Actual
$ million | | | 2013-14
Actual
$ million | |
| | | | | | | | | | | |
Revenue from Transactions | | | | | | | | | | | | | | | | | | | | | | | | | | | | | | | | | | | | | | | | | | | | |
Taxation revenue | | | 6,676 | | | | 6,952 | | | | 7,396 | | | | 8,484 | | | | 9,546 | | | | 8,866 | | | | 9,375 | | | | 9,981 | | | | 10,608 | | | | 10,937 | | | | 11,845 | |
Grant revenue | | | 11,528 | | | | 12,755 | | | | 13,590 | | | | 14,378 | | | | 15,510 | | | | 17,481 | | | | 20,205 | | | | 20,338 | | | | 22,652 | | | | 18,322 | | | | 21,755 | |
Sales of goods and services | | | 2,105 | | | | 2,380 | | | | 2,641 | | | | 2,909 | | | | 3,357 | | | | 3,648 | | | | 3,961 | | | | 4,172 | | | | 5,002 | | | | 5,087 | | | | 5,048 | |
Interest income | | | 2,723 | | | | 2,972 | | | | 3,414 | | | | 3,338 | | | | (275 | ) | | | 1,482 | | | | 2,204 | | | | 2,368 | | | | 2,485 | | | | 2,644 | | | | 2,460 | |
Dividend and income tax equivalent income | | | 1,148 | | | | 1,022 | | | | 1,059 | | | | 858 | | | | 1,244 | | | | 1,180 | | | | 949 | | | | 1,232 | | | | 1,112 | | | | 1,351 | | | | 1,975 | |
Other revenue | | | 1,035 | | | | 1,517 | | | | 1,983 | | | | 2,032 | | | | 2,041 | | | | 4,421 | | | | 3,033 | | | | 3,921 | | | | 3,942 | | | | 3,415 | | | | 3,650 | |
Total Revenue | | | 25,214 | | | | 27,599 | | | | 30,084 | | | | 31,999 | | | | 31,424 | | | | 37,078 | | | | 39,727 | | | | 42,013 | | | | 45,801 | | | | 41,755 | | | | 46,734 | |
| | | | | | | | | | | |
Expenses from Transactions | | | | | | | | | | | | | | | | | | | | | | | | | | | | | | | | | | | | | | | | | | | | |
Employee expenses | | | 8,972 | | | | 9,621 | | | | 10,615 | | | | 11,731 | | | | 13,175 | | | | 14,310 | | | | 15,566 | | | | 16,826 | | | | 18,250 | | | | 18,130 | | | | 17,817 | |
Superannuation expenses | | | | | | | | | | | | | | | | | | | | | | | | | | | | | | | | | | | | | | | | | | | | |
Superannuation interest costs | | | 1,040 | | | | 867 | | | | 840 | | | | 1,154 | | | | 816 | | | | 858 | | | | 1,320 | | | | 1,240 | | | | 1,216 | | | | 923 | | | | 963 | |
Other superannuation expenses | | | 1,061 | | | | 1,238 | | | | 1,367 | | | | 1,513 | | | | 1,865 | | | | 2,012 | | | | 2,051 | | | | 2,171 | | | | 2,301 | | | | 2,420 | | | | 2,277 | |
Other operating expenses | | | 3,948 | | | | 4,522 | | | | 5,236 | | | | 6,138 | | | | 6,646 | | | | 7,300 | | | | 7,568 | | | | 8,646 | | | | 9,497 | | | | 12,817 | | | | 13,114 | |
Depreciation and amortisation | | | 1,460 | | | | 1,526 | | | | 1,678 | | | | 1,764 | | | | 1,851 | | | | 2,496 | | | | 2,501 | | | | 2,507 | | | | 2,777 | | | | 2,902 | | | | 2,946 | |
Other interest expenses | | | 213 | | | | 213 | | | | 174 | | | | 180 | | | | 347 | | | | 599 | | | | 803 | | | | 1,125 | | | | 1,659 | | | | 1,940 | | | | 2,201 | |
Grant expenses | | | 5,180 | | | | 5,647 | | | | 6,467 | | | | 7,565 | | | | 8,329 | | | | 9,525 | | | | 9,790 | | | | 10,963 | | | | 10,327 | | | | 7,182 | | | | 6,796 | |
Total Expenses | | | 21,873 | | | | 23,634 | | | | 26,378 | | | | 30,046 | | | | 33,030 | | | | 37,099 | | | | 39,599 | | | | 43,479 | | | | 46,028 | | | | 46,312 | | | | 46,115 | |
| | | | | | | | | | | |
Net Operating Balance | | | 3,341 | | | | 3,964 | | | | 3,707 | | | | 1,953 | | | | (1,606 | ) | | | (21 | ) | | | 128 | | | | (1,466 | ) | | | (226 | ) | | | (4,558 | ) | | | 619 | |
| | | | | | | | | | | |
OTHER KEY AGGREGATES | | | | | | | | | | | | | | | | | | | | | | | | | | | | | | | | | | | | | | | | | | | | |
| | | | | | | | | | | |
Purchases of non-financial assets | | | 2,415 | | | | 2,717 | | | | 3,196 | | | | 4,412 | | | | 5,725 | | | | 6,772 | | | | 8,959 | | | | 8,237 | | | | 7,971 | | | | 7,001 | | | | 6,322 | |
| | | | | | | | | | | |
Net acquisition of non-financial assets | | | 521 | | | | 1,016 | | | | 1,234 | | | | 2,157 | | | | 3,680 | | | | 4,349 | | | | 6,665 | | | | 5,583 | | | | 5,241 | | | | 3,389 | | | | 3,200 | |
| | | | | | | | | | | |
Fiscal Balance | | | 2,819 | | | | 2,946 | | | | 2,472 | | | | (204 | ) | | | (5,286 | ) | | | (4,371 | ) | | | (6,537 | ) | | | (7,049 | ) | | | (5,467 | ) | | | (7,947 | ) | | | (2,581 | ) |
| | | | | | | | | | | |
Cash Surplus/(Deficit) | | | 3,489 | | | | 4,635 | | | | 4,649 | | | | 2,360 | | | | (4,924 | ) | | | (2,866 | ) | | | (5,341 | ) | | | (5,880 | ) | | | (4,951 | ) | | | (8,585 | ) | | | (3,345 | ) |
| | | | | | | | | | | |
Net Worth | | | 77,723 | | | | 92,148 | | | | 104,446 | | | | 118,532 | | | | 193,838 | | | | 184,277 | | | | 175,588 | | | | 177,875 | | | | 170,745 | | | | 172,963 | | | | 169,265 | |
| | | | | | | | | | | |
Net Debt | | | (14,811 | ) | | | (19,354 | ) | | | (23,203 | ) | | | (26,622 | ) | | | (22,586 | ) | | | (19,251 | ) | | | (13,354 | ) | | | (9,542 | ) | | | (5,720 | ) | | | 2,399 | | | | 5,203 | |
| | | | | | | | | | | |
Borrowing | | | 3,208 | | | | 2,794 | | | | 2,084 | | | | 2,267 | | | | 6,328 | | | | 10,308 | | | | 15,916 | | | | 24,593 | | | | 29,517 | | | | 37,878 | | | | 41,403 | |
| | | | | | | | | | | |
Borrowing (NFPS) | | | 15,248 | | | | 15,819 | | | | 17,314 | | | | 23,971 | | | | 30,856 | | | | 42,645 | | | | 51,713 | | | | 53,708 | | | | 61,542 | | | | 69,086 | | | | 72,716 | |
Note:
| 1. | Numbers may not add due to rounding. |
Source: Report on State Finances for Queensland 2003-04 to 2013-14. (Numbers have been recast for changes to UPF presentation.)
144
Budget Strategy and Outlook 2015-16
| 8.5 | Other General Government uniform presentation framework data |
Data in the following tables are presented in accordance with the UPF.
Data presented in Tables 8.12 and 8.13 provide details of General Government Sector current and capital grant revenue and expenses.
| Table 8.12 | General Government Sector grant revenue1 |
| | | | | | | | |
| | | 2014-15
Est. Actual
$ million | | | 2015-16
Budget
$ million | |
| | |
Current grant revenue | | | | | | | | |
Current grants from the Commonwealth | | | | | | | | |
General purpose grants | | | 11,823 | | | | 12,994 | |
Specific purpose grants | | | 5,966 | | | | 6,109 | |
Specific purpose grants for on-passing | | | 2,791 | | | | 2,474 | |
Total current grants from the Commonwealth | | | 20,580 | | | | 21,578 | |
Other contributions and grants | | | 382 | | | | 317 | |
Total current grant revenue | | | 20,962 | | | | 21,895 | |
| | |
Capital grant revenue | | | | | | | | |
Capital grants from the Commonwealth | | | | | | | | |
Specific purpose grants | | | 2,393 | | | | 2,613 | |
Specific purpose grants for on-passing | | | 5 | | | | 12 | |
Total capital grants from the Commonwealth | | | 2,398 | | | | 2,625 | |
Other contributions and grants | | | 13 | | | | 35 | |
Total capital grant revenue | | | 2,411 | | | | 2,660 | |
Total grant revenue | | | 23,373 | | | | 24,555 | |
Note:
| 1. | Numbers may not add due to rounding. |
145
Budget Strategy and Outlook 2015-16
| Table 8.13 | General Government Sector grant expense1 |
| | | | | | | | |
| | | 2014-15
Est. Actual
$ million | | | 2015-16
Budget
$ million | |
| | |
Current grant expense | | | | | | | | |
Private and Not-for-profit sector | | | 1,498 | | | | 1,341 | |
Private and Not-for-profit sector on-passing | | | 2,113 | | | | 2,264 | |
Local Government | | | 179 | | | | 179 | |
Local Government on-passing | | | 678 | | | | 225 | |
Grants to other sectors of Government | | | 668 | | | | 472 | |
Other | | | 208 | | | | 283 | |
Total current grant expense | | | 5,345 | | | | 4,764 | |
| | |
Capital grant expense | | | | | | | | |
Private and Not-for-profit sector | | | 427 | | | | 566 | |
Local Government | | | 999 | | | | 817 | |
Local Government on-passing | | | 5 | | | | 12 | |
Grants to other sectors of Government | | | 13 | | | | 25 | |
Other | | | 117 | | | | 136 | |
Total capital grant expense | | | 1,561 | | | | 1,556 | |
Total grant expense | | | 6,907 | | | | 6,320 | |
Note:
| 1. | Numbers may not add due to rounding. |
| 8.5.2 | Dividend and income tax equivalent income |
Table 8.14 provides details of the source of dividend and income tax equivalent income in the General Government Sector.
| Table 8.14 | General Government Sector dividend and income tax equivalent income1 |
| | | | | | | | |
| | | 2014-15
Est. Actual
$ million | | | 2015-16
Budget
$ million | |
| | |
Dividend and Income Tax Equivalent income from PNFC sector | | | 2,285 | | | | 2,323 | |
Dividend and Income Tax Equivalent income from PFC sector | | | 125 | | | | 72 | |
Total Dividend and Income Tax Equivalent income | | | 2,410 | | | | 2,395 | |
Note:
| 1. | Numbers may not add due to rounding. |
146
Budget Strategy and Outlook 2015-16
| 8.5.3 | Expenses by function |
Data presented in Table 8.15 provides details of General Government Sector expenses by function.
| Table 8.15 | General Government Sector expenses by function1 |
| | | | | | | | | | | | | | | | | | | | | | | | |
| | | 2014-15
Budget
$ million | | | 2014-15
Est. Actual
$ million | | | 2015-16
Budget
$ million | | | 2016-17
Projection
$ million | | | 2017-18
Projection
$ million | | | 2018-19
Projection
$ million | |
| | | | | | |
General public services | | | 1,333 | | | | 1,294 | | | | 1,261 | | | | 1,195 | | | | 1,212 | | | | 1,209 | |
Public order and safety | | | 4,348 | | | | 4,303 | | | | 4,566 | | | | 4,587 | | | | 4,676 | | | | 4,761 | |
Education | | | 11,727 | | | | 11,449 | | | | 12,076 | | | | 12,869 | | | | 13,464 | | | | 13,869 | |
Health | | | 13,761 | | | | 13,654 | | | | 14,272 | | | | 14,964 | | | | 15,580 | | | | 16,201 | |
Social security and welfare | | | 2,808 | | | | 2,855 | | | | 2,976 | | | | 3,401 | | | | 3,611 | | | | 3,922 | |
Housing and community amenities | | | 1,626 | | | | 1,554 | | | | 1,614 | | | | 1,550 | | | | 1,513 | | | | 1,552 | |
Recreation and culture | | | 932 | | | | 895 | | | | 1,135 | | | | 1,280 | | | | 1,430 | | | | 872 | |
Fuel and energy | | | 734 | | | | 669 | | | | 482 | | | | 577 | | | | 604 | | | | 669 | |
Agriculture, forestry, fishing and hunting | | | 668 | | | | 603 | | | | 674 | | | | 636 | | | | 604 | | | | 601 | |
Mining, manufacturing and construction | | | 312 | | | | 334 | | | | 345 | | | | 352 | | | | 354 | | | | 362 | |
Transport and communications | | | 5,829 | | | | 5,524 | | | | 5,475 | | | | 5,613 | | | | 5,553 | | | | 5,679 | |
Other economic affairs | | | 894 | | | | 804 | | | | 755 | | | | 733 | | | | 744 | | | | 742 | |
Other purposes | | | 4,961 | | | | 4,677 | | | | 4,341 | | | | 4,029 | | | | 4,010 | | | | 3,983 | |
| | | | | | |
Total Expenses | | | 49,933 | | | | 48,615 | | | | 49,973 | | | | 51,784 | | | | 53,354 | | | | 54,421 | |
Note:
| 1. | Numbers may not add due to rounding. |
147
Budget Strategy and Outlook 2015-16
| 8.5.4 | Purchases of non-financial assets by function |
Data presented in Table 8.16 provides details of General Government Sector purchases of non-financial assets by function.
| Table 8.16 | General Government Sector purchases of non-financial assets by function1 |
| | | | | | | | | | | | | | | | | | | | | | | | |
| | | 2014-15
Budget
$ million | | | 2014-15
Est. Actual
$ million | | | 2015-16
Budget
$ million | | | 2016-17
Projection
$ million | | | 2017-18
Projection
$ million | | | 2018-19
Projection
$ million | |
| | | | | | |
General public services | | | 29 | | | | 22 | | | | 40 | | | | 236 | | | | 20 | | | | 19 | |
Public order and safety | | | 336 | | | | 307 | | | | 370 | | | | 294 | | | | 317 | | | | 316 | |
Education | | | 373 | | | | 378 | | | | 474 | | | | 418 | | | | 407 | | | | 467 | |
Health | | | 1,353 | | | | 1,073 | | | | 1,159 | | | | 921 | | | | 619 | | | | 535 | |
Social security and welfare | | | 29 | | | | 74 | | | | 23 | | | | 31 | | | | 26 | | | | 23 | |
Housing and community amenities | | | 265 | | | | 269 | | | | 387 | | | | 378 | | | | 359 | | | | 262 | |
Recreation and culture | | | 66 | | | | 69 | | | | 103 | | | | 73 | | | | 48 | | | | 41 | |
Agriculture, forestry, fishing and hunting | | | 21 | | | | 24 | | | | 33 | | | | 25 | | | | 25 | | | | 26 | |
Mining, manufacturing and construction | | | 5 | | | | 4 | | | | 6 | | | | 1 | | | | 1 | | | | 2 | |
Transport and communications | | | 3,458 | | | | 2,715 | | | | 2,709 | | | | 3,387 | | | | 4,257 | | | | 4,114 | |
Other economic affairs | | | 6 | | | | 6 | | | | 8 | | | | 7 | | | | 8 | | | | 8 | |
Other purposes | | | 32 | | | | 44 | | | | 61 | | | | 61 | | | | 38 | | | | 38 | |
| | | | | | |
Total Purchases | | | 5,972 | | | | 4,987 | | | | 5,374 | | | | 5,832 | | | | 6,125 | | | | 5,851 | |
Note:
| 1. | Numbers may not add due to rounding. |
148
Budget Strategy and Outlook 2015-16
Data presented in Table 8.17 provides details of taxation revenue collected by the General Government Sector.
| Table 8.17 | General Government Sector taxes1 |
| | | | | | | | |
| | | 2014-15
Est. Actual
$ million | | | 2015-16
Budget
$ million | |
| | |
Taxes on employers’ payroll and labour force | | | 3,836 | | | | 3,955 | |
| | |
Taxes on property | | | | | | | | |
Land taxes | | | 977 | | | | 1,016 | |
Stamp duties on financial and capital transactions | | | 3,140 | | | | 3,009 | |
Other | | | 718 | | | | 738 | |
| | |
Taxes on the provision of goods and services | | | | | | | | |
Taxes on gambling | | | 1,076 | | | | 1,123 | |
Taxes on insurance | | | 889 | | | | 935 | |
| | |
Taxes on use of goods and performance of activities | | | | | | | | |
Motor vehicle taxes | | | 2,071 | | | | 2,149 | |
| | |
Total Taxation Revenue | | | 12,707 | | | | 12,926 | |
Note:
| 1. | Numbers may not add due to rounding. |
149
Budget Strategy and Outlook 2015-16
| 8.5.6 | Loan Council Allocation |
The Australian Loan Council requires all jurisdictions to prepare Loan Council Allocations (LCA) to provide an indication of each government’s probable call on financial markets over the forthcoming financial year.
Table 8.18 presents the State’s revised Budget LCA and the Loan Council endorsed LCA for 2015-16.
| Table 8.18 | Loan Council Allocation1 |
| | | | | | | | | | |
| | | | | 2015-16
Nomination
$ million | | | 2015-16
Budget
$ million | |
| | | |
| | General Government sector cash deficit/(surplus) | | | (571 | ) | | | 584 | |
| | PNFC sector cash deficit/(surplus) | | | 667 | | | | 1,100 | |
| | | |
| | Non-financial Public sector cash deficit/(surplus) | | | 96 | | | | 1,684 | |
| | Acquisitions under finance leases and similar arrangements | | | 195 | | | | 385 | |
| | | |
Equals | | ABS GFS cash deficit/(surplus) | | | 290 | | | | 2,068 | |
| | | |
Less | | Net cash flows from investments in financial assets for policy purposes | | | 249 | | | | — | |
Plus | | Memorandum items 2 | | | 422 | | | | 384 | |
| | | |
| | Loan Council Allocation | | | 463 | | | | 2,452 | |
Notes:
| 1. | Numbers may not add due to rounding. |
| 2. | Memorandum items include operating leases and local government borrowings. |
The State’s Budget LCA is a deficit of $2.452 billion, compared to the LCA nomination of $463 million. This deterioration is largely the result of changes in the timing and quantum of spending on disasters and the resulting payment under Natural Disaster Relief and Recovery Arrangements, as well as lower royalty receipts.
150
Budget Strategy and Outlook 2015-16
| 8.6 | Contingent liabilities |
Contingent liabilities represent items that are not included in the Budget as significant uncertainty exists as to whether the Government would sacrifice future economic benefits in respect of these items. Nevertheless, such contingencies need to be recognised and managed wherever possible in terms of their potential impact on the Government’s financial position in the future.
The State’s quantifiable and non-quantifiable contingent liabilities are detailed in the 2013-14 Report on State Finances – whole-of-government financial statements (Note 47).
A summary of the State’s quantifiable contingent liabilities as at 30 June 2014 is provided in Table 8.19.
| Table 8.19 | Contingent liabilities |
| | | | |
| | | 2013-14
$ million | |
Nature of contingent liability | | | | |
| |
Guarantees and indemnities | | | 9,774 | |
Other | | | 1,181 | |
| |
Total | | | 10,955 | |
| 8.7 | Background and interpretation of uniform presentation framework |
As mentioned in the introduction to this chapter, the UPF was reviewed in 2007 following the release of the AASB accounting standard, AASB 1049 Whole of Government and General Government Sector Financial Reporting.
This standard aims to harmonise GFS and GAAP with the objective of improving the clarity and transparency of government financial statements.
| 8.7.1 | Accrual Government Finance Statistics framework |
The GFS reporting framework, developed by the Australian Bureau of Statistics (ABS), is based on international statistical standards (the International Monetary Fund Manual on Government Finance Statistics and the United Nations System of National Accounts). This allows comprehensive assessments to be made of the economic impact of government.
151
Budget Strategy and Outlook 2015-16
The accrual GFS framework is based on an integrated recording of stocks and flows. Stocks refer to a unit’s holdings of assets and liabilities at a point in time, whilst flows represent the movement in the stock of assets and liabilities between two points in time. Flows comprise two separate types, transactions and other economic flows. Transactions come about as a result of mutually agreed interactions between units or within a single unit. Other economic flows would include revaluations and destruction or discovery of assets that do not result from a transaction. In GFS operating statements, other economic flows, being outside of the control of government, are excluded and do not affect the net operating balance or fiscal balance.
| 8.7.2 | Generally Accepted Accounting Principles |
In addition to the GFS framework, public sector entities were previously required to report at year end against AAS 31 Financial Reporting by Government, which meant complying with the Accounting Standards issued by the AASB.
| 8.7.3 | Harmonisation under AASB 1049 |
This dual reporting regime caused confusion for financial report users and the Financial Reporting Council asked the AASB to develop a framework harmonising GAAP and GFS and to issue an Australian accounting standard for a single set of government reports.
In the development of AASB 1049, the AASB adopted the following approaches:
| • | | adoption of GAAP definition, recognition and measurement principles in almost all cases |
| • | | amending presentation requirements to encompass a comprehensive result that retains GAAP classification system but overlays it with a transactions and other economic flows classification system based on GFS |
| • | | expanding the disclosure requirements to incorporate key fiscal aggregates required by GFS. |
| 8.7.4 | Revisions to the Uniform Presentation Framework |
Following the introduction of AASB 1049, the Australian, state and territory governments consider that the UPF will continue to be an important framework for ensuring comparability of financial information across jurisdictions. The UPF shall continue to apply to financial statements produced by government in budgets, mid-year budget updates and final budget outcome reports, whereas the accounting standard applies only to outcome reports.
Therefore, rather than replacing the UPF with the accounting standard, the framework was updated to align with AASB 1049. Australian, state and territory governments agreed that the updated framework would continue to provide a common core of comparable financial information in their budget papers and comparable data amongst jurisdictions while maintaining at least the current level of transparency.
152
Budget Strategy and Outlook 2015-16
Aligning the framework with AASB 1049 was not intended to create a UPF that complies with all the reporting requirements of AASB 1049. For example, the UPF does not include the same level of detail in relation to disclosure requirements as AASB 1049. Instead, the revised UPF allows jurisdictions to utilise the framework as the base set of statements and add additional relevant information in order to comply with AASB 1049.
GFS data is presented by institutional sector, distinguishing between the General Government Sector and the PNFC Sector.
Budget reporting focuses on the General Government Sector, which provides regulatory services and goods and services of a non-market nature that are provided at less than cost or at no cost. These services are largely financed by general revenue (Australian Government grants and state taxation). This sector comprises government departments, their commercialised business units/shared service providers and certain statutory bodies.
The PNFC Sector comprises bodies that provide mainly market goods and services that are of a non-regulatory and non-financial nature. PNFCs are financed through sales to consumers of their goods and services and may be supplemented by explicit government subsidy to satisfy community service obligations. In general, PNFCs are legally distinguishable from the governments that own them. Examples of PNFCs include the energy entities and Queensland Rail.
Together, the General Government Sector and the PNFC Sector comprise the Non-financial Public Sector.
Further discussion of the GFS framework of reporting, including definitions of GFS terms, can be obtained from the webpage of the ABS at www.abs.gov.au.
153
Budget Strategy and Outlook 2015-16
The reporting entities included in the General Government and PNFC Sectors in these Budget papers are provided below.
Departments
Aboriginal and Torres Strait Islander Partnerships
Agriculture and Fisheries
Communities, Child Safety and Disability Services
Education and Training
Electoral Commission of Queensland
Energy and Water Supply
Environment and Heritage Protection
Housing and Public Works
Infrastructure, Local Government and Planning
Justice and Attorney-General
Legislative Assembly
National Parks, Sport and Racing
Natural Resources and Mines
Office of the Governor
Office of the Inspector-General Emergency Management
Office of the Ombudsman
Premier and Cabinet
Public Safety Business Agency
Public Service Commission
Queensland Audit Office
Queensland Fire and Emergency Services
Queensland Health
Queensland Police Service
Queensland Treasury
Science, Information Technology and Innovation
State Development
The Public Trustee of Queensland
Tourism, Major Events, Small Business and the Commonwealth Games
Transport and Main Roads
Commercialised Business Units
Building and Asset Services
CITEC
Economic Development Queensland
QFleet
RoadTek
Shared Service Providers
Corporate Administration Agency
Queensland Shared Services
154
Budget Strategy and Outlook 2015-16
Statutory Authorities
Anti-Discrimination Commission
Board of the Queensland Museum
City North Infrastructure Pty Ltd
Crime and Corruption Commission
Gold Coast 2018 Commonwealth Games Corporation
Gold Coast Waterways Authority
Hospital and Health Services
Cairns and Hinterland
Central Queensland
Central West
Children’s Health Queensland
Darling Downs
Gold Coast
Mackay
Metro North
Metro South
North West
South West
Sunshine Coast
Torres and Cape
Townsville
West Moreton
Wide Bay
Legal Aid Queensland
Library Board of Queensland
Motor Accident Insurance Commission
Nominal Defendant
Office of the Information Commissioner
Office of the Health Ombudsman
Prostitution Licensing Authority
Queensland Agricultural Training Colleges
Queensland Art Gallery Board of Trustees
Queensland Building and Construction Commission
Queensland Curriculum and Assessment Authority
Queensland Family and Child Commission
Queensland Mental Health Commission
Queensland Performing Arts Trust
Queensland Reconstruction Authority
QRAA
Queensland Training Assets Management Authority
Residential Tenancies Authority
South Bank Corporation
TAFE Queensland
The Council of the Queensland Institute of Medical Research
Tourism and Events Queensland
Trade and Investment Queensland
155
Budget Strategy and Outlook 2015-16
| 8.9.2 | Public Non-financial Corporations |
Brisbane Port Holdings Pty Ltd
CS Energy Limited
DBCT Holdings Pty Ltd
Energex Limited
Ergon Energy Corporation Limited
Far North Queensland Ports Corporation Limited
Gladstone Area Water Board
Gladstone Ports Corporation Limited
Mount Isa Water Board
North Queensland Bulk Ports Corporation Limited
Port of Townsville Limited
Powerlink Queensland
Queensland Bulk Water Supply Authority (Seqwater)
Queensland Lottery Corporation Pty Ltd
Queensland Rail
Queensland Treasury Holdings Pty Ltd
Stadiums Queensland
Stanwell Corporation Limited
SunWater Limited
156
Budget Strategy and Outlook 2015-16
Appendices
| Appendix A: | Tax expenditure statement |
Context
Governments employ a range of policy tools to achieve social and economic objectives. These include the use of direct budgetary outlays, regulatory mechanisms and taxation. This Tax Expenditure Statement (TES) details revenue foregone as a result of Government decisions relating to the provision of tax exemptions or concessions. The TES is designed to improve transparency in the use of tax expenditures and increase public understanding of the fiscal process.
Tax expenditures are reductions in tax revenue that result from the use of the taxation system as a policy tool to deliver Government policy objectives. Tax expenditures are provided through a range of measures, including:
| • | | the application of reduced tax rates to certain groups or sectors of the community |
| • | | provisions which defer payment of a tax liability to a future period. |
Labelling an exemption or concession as a tax expenditure does not necessarily imply any judgement as to its appropriateness. It merely makes the amount of the exemption or concession explicit and thereby facilitates its scrutiny as part of the annual Budget process.
Methodology
Revenue foregone approach
The method used almost exclusively by governments to quantify the value of their tax expenditures is the revenue foregone approach. This method estimates the revenue foregone through use of the concession by applying the benchmark rate of taxation to the volume of activities or assets affected by the concession. One of the deficiencies of the revenue foregone approach is that the effect on taxpayer behaviour resulting from the removal of the particular tax expenditure is not factored into the estimate. Consequently, the aggregation of costings for individual tax expenditure items presented in the TES will not necessarily provide an accurate estimate of the total level of assistance provided through tax expenditures.
157
Budget Strategy and Outlook 2015-16
Measuring tax expenditures requires the identification of:
| • | | concessionally taxed components of the benchmark tax base such as a specific activity or class of taxpayer |
| • | | a benchmark tax rate to apply to the concessionally taxed components of the tax base. |
Defining the tax benchmark
The most important step in the preparation of a TES is the establishment of a benchmark for each tax included in the statement. The benchmark provides a basis against which each tax concession can be evaluated. The aim of the benchmark is to determine which concessions are tax expenditures as opposed to structural elements of the tax. The key features of a tax benchmark are:
| • | | any specific accounting conventions applicable to the tax |
| • | | the deductibility of compulsory payments |
| • | | any provisions to facilitate administration |
| • | | provisions relating to any fiscal obligations. |
By definition, tax expenditures are those tax concessions not included as part of the tax benchmark.
Identification of benchmark revenue bases and rates requires a degree of judgement and is not definitive. Furthermore, data limitations mean that the tax expenditures are approximations and are not exhaustive. This statement does not include estimates of revenue foregone from exemptions or concessions provided to Government agencies. Very small exemptions or concessions are also excluded.
The Tax Expenditure Statement
This year’s statement includes estimates of tax expenditures in 2013-14 and 2014-15 for payroll tax, land tax, duties and gambling taxes. A summary of the major tax expenditures valued on the basis of revenue foregone is presented in Table A.1. Not all expenditures can be quantified at this time. Accordingly, the total value of tax expenditures should be considered as indicative only.
158
Budget Strategy and Outlook 2015-16
| Table A.1 | Tax expenditure summary1 |
| | | | | | | | |
| | | 2013-142
$ million | | | 2014-15
$ million | |
Payroll Tax | | | | | | | | |
Exemption threshold | | | 1,242 | | | | 1,274 | |
Deduction scheme | | | 288 | | | | 297 | |
Section 14 exemptions | | | | | | | | |
Local Government | | | 147 | | | | 153 | |
Education | | | 157 | | | | 161 | |
Hospitals | | | 304 | | | | 311 | |
Total payroll tax | | | 2,138 | | | | 2,196 | |
Land tax | | | | | | | | |
Liability thresholds3 | | | 570 | | | | 584 | |
Graduated land tax scale | | | 513 | | | | 534 | |
Primary production deduction | | | 92 | | | | 87 | |
Part 6 Divisions 2 and 3 exemptions not included elsewhere4 | | | 105 | | | | 103 | |
Land developers’ concession | | | 19 | | | | 23 | |
Total land tax | | | 1,299 | | | | 1,331 | |
Duties | | | | | | | | |
Transfer duty on residential | | | | | | | | |
Home concession | | | 343 | | | | 346 | |
First home concession | | | 216 | | | | 211 | |
First home vacant land | | | 19 | | | | 19 | |
Insurance duty5 | | | | | | | | |
Non-life insurance | | | 62 | | | | 0 | |
Workcover | | | 64 | | | | 60 | |
Health insurance | | | 302 | | | | 323 | |
Total duties | | | 1,006 | | | | 959 | |
Taxes on gambling | | | | | | | | |
Gaming machine taxes | | | 112 | | | | 114 | |
Casino taxes | | | 9 | | | | 9 | |
Total gambling tax | | | 121 | | | | 123 | |
Total | | | 4,564 | | | | 4,609 | |
Notes:
| 1. | Numbers may not add due to rounding. |
| 2. | 2013-14 estimates may have been revised since the 2014-15 Budget. |
| 3. | Land tax is payable only on the value of taxable land above a threshold which depends on the ownership structure. |
| 4. | Applicable, but not limited, to religious bodies, public benevolent institutions and other exempt charitable institutions. |
| 5. | From August 2013 the rate of duty applicable to insurance premiums for Class 1 and Class 2 general insurance products increased to 9%. The new rates apply to premiums paid on or after 1 August 2013, for policies entered into on or after that date. |
159
Budget Strategy and Outlook 2015-16
Discussion of individual taxes
Payroll tax
The benchmark tax base for payroll tax is assumed to be all wages, salaries and supplements (including employer superannuation contributions) paid in Queensland, as defined in the Payroll Tax Act 1971. The benchmark tax rate for payroll tax is assumed to be the statutory rate applying in each financial year.
Payroll tax exemption threshold
Employers who employ in Queensland with an annual Australian payroll of $1.1 million or less are exempt from payroll tax. On the basis of 2013-14 average weekly earnings, this threshold corresponded to approximately 15 full-time equivalent employees. This exemption is designed to assist small and medium sized businesses.
Deduction scheme
Employers who employed in Queensland with Australian payrolls between $1.1 million and $5.5 million benefited from a deduction of $1.1 million, which reduced by $1 for every $4 by which the annual payroll exceeded $1.1 million. The deduction is pro-rated for interstate wages. There was no deduction for employers or groups that had an annual payroll in excess of $5.5 million.
Section 14 exemptions
A number of organisations are provided with exemptions from payroll tax under Section 14 of the Payroll Tax Act 1971. The activities for which estimates have been calculated are wages paid by public hospitals, non-tertiary private educational institutions and local governments (excluding commercial activities).
Land tax
The benchmark tax base is assumed to be all freehold land within Queensland, excluding residential land used as a principal place of residence and land owned by individuals with a value for that year below the threshold. The benchmark tax rate for land tax is assumed to be the top rate of land tax applicable in Queensland in each financial year.
Liability thresholds
Land tax is payable on the value of taxable land equal to or above a threshold which depends on the land’s ownership. The threshold for companies, trusts and absentees is $350,000 and for resident individuals the threshold is $600,000.
Land owned by resident individuals as their principal place of residence is excluded from the estimate. The exemption from paying below a minimum amount is not included as a tax expenditure as it is regarded as the application of an administration threshold.
160
Budget Strategy and Outlook 2015-16
Graduated land tax scale
A graduated (concessional) scale of land tax rates is applicable to land with a taxable value of less than $5 million for resident individuals and companies, trustees and absentees. The benchmark rates used for estimating the tax expenditures were 1.75% for individuals and 2.0% for companies, trustees and absentees.
Primary production deduction
The taxable value of land owned by a resident individual, trustee or some absentees and companies does not include all or part of their land that is used for the business of agriculture, pasturage or dairy farming.
Part 6 Divisions 2 and 3 exemptions (not elsewhere included)
A number of land tax exemptions are granted in Part 6 Divisions 2 and 3 of the Land Tax Act 2010 to eligible organisations. These include, but are not limited to, public benevolent institutions, religious institutions and other exempt charitable institutions, retirement villages, trade unions and showgrounds.
Land developers’ concession
Land tax payable by land developers is calculated on the basis that the unimproved value of (undeveloped) land subdivided in the previous financial year and which remains unsold at 30 June of that year is 60% of the Valuer-General’s value. This concession is outlined in Section 30 of the Land Tax Act 2010.
Transfer duty concession on residential property
The benchmark tax base is assumed to be all sales of residential property within Queensland. The benchmark tax scale is assumed to be the scale that actually applied in each financial year.
Home concession
A concessional rate of duty applies to purchases of a principal place of residence. A 1% concessional rate applies on dutiable values up to $350,000, rather than the normal schedule of rates between 1.5% and 3.5%. For properties valued over $350,000, the scheduled rates of transfer duty apply on the excess.
161
Budget Strategy and Outlook 2015-16
First home concession
Where a purchaser has not previously owned a residence in Queensland or elsewhere, the purchaser of a home receives a more generous concession on duty. This concession comprises a rebate in addition to the home concession on properties (this concession may not be applicable if the purchase price is less than the full market value of the property). The size of the rebate depends on the value of the property. A full concession is provided to purchases of a first principal place of residence valued up to $500,000.
First home vacant land concession
A first home concession is available for the purchase of certain vacant land up to the value of $400,000, with a full concession available on certain vacant land up to the value of $250,000.
Insurance duty
The benchmark tax base is assumed to be all premiums for general insurance policies (not for life insurance). The benchmark tax scale is assumed to be the scale that actually applied in each financial year.
The rate of duty applicable to general insurance increased to 9% on 1 August 2013 (previously 7.5% for Class 1 products and 5% for Class 2 products). There was no change in duty payable on Compulsory Third Party or Workers’ Compensation premiums.
Gaming machine tax concessions for licensed clubs
The benchmark tax base is assumed to be all gaming machines operated by licensed clubs and hotels in Queensland. The benchmark tax rate is assumed to be the highest marginal tax rate (as is applied to hotels) that actually applied in each financial year.
A progressive tax rate scale applies to gaming machines operated by licensed clubs. The tax rate is calculated monthly on the gaming machine taxable metered win and the top tax rate is only applied to the portion of gaming machine revenue where the monthly metered win exceeds $1.4 million for any licensed club.
Casino tax concessions
The benchmark tax base is assumed to be all casinos operating in Queensland. The benchmark tax rate is assumed to be the highest tax rate that is actually applied in each financial year.
A tax rate of 20% of gross revenue applies for standard transactions in the Brisbane and Gold Coast casinos. A concessional tax rate of 10% applies for gross revenue from standard transactions in the Cairns and Townsville casinos. The tax rate applicable to gaming machines in casinos is 30% of gross revenue in the Brisbane and Gold Coast casinos and 20% in the Cairns and Townsville casinos.
162
Budget Strategy and Outlook 2015-16
In addition concessional rates of 10% also apply for revenue from high rollers in all casinos. A goods and services tax (GST) credit is provided to casinos that approximates a reduction in the above tax rates of 9.09%.
163
Budget Strategy and Outlook 2015-16
| Appendix B: | Concessions statement |
Context
The Government provides a diverse range of concessions across a wide variety of services. In addition to targeted discounts, rebates and subsidies for individuals or families based on eligibility criteria relating to factors such as age, income and special needs or disadvantage, broader concession arrangements are in place that reduce the price paid by all consumers in areas such as transport, electricity and water.
The majority of people will benefit from at least one concession and in many cases will benefit from multiple concessions each year. For example, aged pensioners are eligible for a number of Queensland Government concessions, including discounts on their council rates, water, gas and electricity bills, vehicle registration fees as well as subsidised optometry and dental services.
Further information on the eligibility requirements and benefits of a range of Government concessions can be found at: http://www.qld.gov.au/community/cost-of-living-support/concessions/.
Concessions provided to Pensioners and Seniors Card holders despite termination of Australian Government assistance
In its 2014-15 Budget, the Australian Government announced that it would unilaterally terminate the National Partnership Agreement on Certain Concessions for Pensioner Concession Card and Seniors Card Holders (the NPA) from 1 July 2014. This reduced funding to Queensland by $223.2 million from 2014-15 to 2017-18, or 15% of the total cost of concessions supported through the NPA for Pensioner Concession Card and Seniors Card holders (Budget Paper 4 shows the cost of these concessions over the period 2014-15 to 2018-19). Impacted concessions are set out in Table B.1.
The Queensland Government will deliver certainty to Pensioners and Seniors Card holders in this Budget by guaranteeing that concessions will remain fully funded. Reversing the Commonwealth cuts to Pensioner and Seniors Card holder concessions will cost $56 million in 2015-16.
164
Budget Strategy and Outlook 2015-16
| Table B.1 | Concessions (Pensioner and Seniors Card holder portion) impacted by the termination of the NPA1 |
| | | | |
Concession | | 2015-16
Estimate
$ million | |
Electricity Rebate Scheme | | | 154.3 | |
Pensioner Rate Subsidy Scheme | | | 53.6 | |
South East Queensland (SEQ) Pensioner Water Subsidy Scheme | | | 19.3 | |
Reticulated Natural Gas Rebate Scheme | | | 2.2 | |
Vehicle registration concessions2 | | | 87.0 | |
TransLink Transport Concessions (South East Queensland)3 | | | 18.3 | |
Rail Concession Scheme4 | | | 12.6 | |
Designated Public Transport Concessions for Seniors Card Holders | | | 3.8 | |
Total | | | 351.1 | |
Notes:
| 1. | Numbers may not add due to rounding. |
| 2. | The NPA related only to the motor vehicle portion of this concession provided to Pensioner Concession Card and Seniors Card holders. The 2015-16 estimate in Table B.2 includes all recipients and concessions for boat registrations. |
| 3. | This estimate is the Pensioner and Seniors Card holder component of this concession. The 2015-16 estimate in Table B.2 includes a broad range of recipients in addition to Pensioner Concession Card and Seniors Card holders. |
| 4. | The NPA only related to the urban rail component of this concession provided to Pensioner Concession Card and Seniors Card holders. The 2015-16 estimate for this item in Table B.2 includes both urban rail and long distance rail concessions. |
Focus
This statement highlights the cost and nature of concessions provided by the Queensland Government. It covers concessions that are direct Budget outlays (for example, fee subsidy payments) and revenue foregone through fees and charges that are set at a lower rate than applies to the wider community or, in the case of broader concessions, the full cost of service provision.
Table B.2 sets out the cost of concessions by agency. The total value of these concessions is estimated at $4.735 billion in 2015-16. This represents a significant Government and taxpayer commitment to improving the accessibility and affordability of a diverse range of services; and reducing the price paid by consumers of those services to ease cost of living pressures.
165
Budget Strategy and Outlook 2015-16
Explanation of scope
For the purposes of this document, concessions include:
| • | | discounts, rebates and subsidies to improve access to, and the affordability of, a range of services for individuals or families based on eligibility criteria relating to factors such as age, income and special needs or disadvantage |
| • | | concessional prices for Government services, where the price charged to all consumers is less than the full cost of service provision. |
Both General Government and Public Non-financial Corporations (PNFC) Sector concessions are included. Where a payment is made from a General Government Sector agency to a PNFC entity for a concession arrangement, the expenditure is reported against the GG sector agency only to avoid double counting.
To be included in this statement, concessions must meet the minimum materiality threshold of estimated expenditure or revenue foregone of $100,000 in 2015-16.
Varying methods have been used to estimate the cost of concessions depending on the nature of the concessions, including:
| • | | direct Budget outlay cost (for example, direct subsidy or rebate payments or Government’s contribution in the case of items such as rental subsidies) |
| • | | revenue foregone (for example, concessional fees and charges) |
| • | | cost of goods and services provided. |
For the purposes of illustration, the document often uses averages to demonstrate the value of the concession to consumers. However, averages are not reflective of individual circumstances, meaning the actual dollar value of the concession to consumers may vary from person to person.
This Concessions Statement does not include Tax Expenditures (for example, tax exemptions, reduced tax rates, tax rebates and deductions). Information on Tax Expenditures is provided in Appendix A – Tax expenditure statement.
166
Budget Strategy and Outlook 2015-16
| Table B.2 | Concession by agency1 |
| | | | | | | | |
Agency | | 2014-15
Est. act
$ million | | | 2015-16
Estimate
$ million | |
Department of Agriculture and Fisheries | | | | | | | | |
Drought Relief Assistance Scheme - Emergency Water Infrastructure Rebate | | | 17.1 | | | | 19.0 | |
Drought Relief Assistance Scheme - Fodder and Water Freight | | | 11.3 | | | | 12.5 | |
Primary Industry Productivity Enhancement Scheme | | | 15.2 | | | | 15.2 | |
Hendra Virus - Rebate to front line veterinarians | | | 0.1 | | | | 0.3 | |
| | |
Department of Communities, Child Safety and Disability Services | | | | | | | | |
Electricity Rebate Scheme2,3 | | | 149.2 | | | | 154.3 | |
Electricity Life Support Concession Scheme | | | 2.2 | | | | 2.3 | |
Medical Cooling and Heating Electricity Concession Scheme | | | 1.1 | | | | 1.2 | |
Pensioner Rate Subsidy Scheme2,3 | | | 52.0 | | | | 53.6 | |
South East Queensland (SEQ) Pensioner Water Subsidy Scheme3,4 | | | 19.6 | | | | 19.3 | |
Home Energy Emergency Assistance Scheme | | | 10.0 | | | | 10.0 | |
Reticulated Natural Gas Rebate Scheme3 | | | 2.1 | | | | 2.2 | |
| | |
Department of Education and Training | | | | | | | | |
User Choice - Apprentice and Trainee Training Subsidy5 | | | 209.0 | | | | 243.0 | |
Vocational Education and Training (VET) - Certificate 3 Guarantee Tuition Fee Subsidy6 | | | 140.0 | | | | 122.6 | |
VET - Higher Level Skills Tuition Fee Subsidy7 | | | 37.0 | | | | 60.0 | |
Travel and Accommodation Subsidy8 | | | 3.5 | | | | 4.5 | |
Textbook and Resource Allowance9 | | | 55.4 | | | | 57.5 | |
School Transport Assistance for Students with Disabilities10 | | | 39.3 | | | | 40.7 | |
Living Away from Home Allowance Scheme | | | 6.8 | | | | 7.8 | |
Non-Government Schools Transport Assistance Scheme | | | 5.5 | | | | 5.9 | |
Distance Education - Information and Communication Technology Subsidy Scheme | | | 0.9 | | | | 0.8 | |
Distance Education - Non-Government Student Fee Subsidy11 | | | 0.5 | | | | 0.2 | |
Dalby State High School - Bunya Campus Residential Facility12 | | | 2.0 | | | | 2.5 | |
Spinifex State College - Mount Isa Student Residential Facility | | | 1.0 | | | | 1.0 | |
Far North Queensland Region - Student Residential College | | | 0.5 | | | | 0.5 | |
Tuition fee exemptions/waivers - Dependants of international students | | | 6.3 | | | | 6.3 | |
167
Budget Strategy and Outlook 2015-16
| | | | | | | | |
Agency | | 2014-15
Est. act
$ million | | | 2015-16
Estimate
$ million | |
Department of Energy and Water Supply | | | | | | | | |
Ergon Energy - Uniform Tariff Policy (excluding Isolated Systems)13 | | | 529.9 | | | | 375.7 | |
Ergon Energy - Uniform Tariff Policy for Isolated Systems14 | | | 66.0 | | | | 56.0 | |
Origin Energy - Uniform Tariff Policy15 | | | 4.0 | | | | 6.5 | |
Urban Water Price Path16 | | | 154.7 | | | | 56.8 | |
Cloncurry Water Pipeline Water Supply Subsidy | | | 5.5 | | | | 5.5 | |
SunWater Rural Irrigation Water Price Subsidy17 | | | 6.0 | | | | 4.7 | |
Seqwater Rural Irrigation Water Price Subsidy18 | | | 2.3 | | | | 2.0 | |
Extending Existing Drought Relief Arrangements19,20 | | | — | | | | 2.5 | |
| | |
Department of Environment and Heritage Protection | | | | | | | | |
Protected Plant Licence and Permits Concessions | | | 0.1 | | | | 0.1 | |
| | |
Department of Housing and Public Works | | | | | | | | |
Government managed housing rental rebate21 | | | 404.1 | | | | 393.7 | |
National Rental Affordability Scheme22 | | | 24.6 | | | | 28.8 | |
Home Assist Secure23 | | | 17.9 | | | | 19.6 | |
Non-residential buildings - subsidised rents | | | 5.8 | | | | 6.0 | |
Rental Bond Loans20 | | | 1.7 | | | | 1.9 | |
Non-government managed housing24 | | | N/A | | | | N/A | |
| | |
Department of Justice and Attorney-General | | | | | | | | |
Public Trustee of Queensland - Concessions | | | 30.1 | | | | 31.4 | |
Court Services - Civil Court Fees | | | 17.0 | | | | 17.5 | |
Queensland Civil and Administrative Tribunal Fees | | | 15.9 | | | | 16.2 | |
Body Corporate and Community Management - Dispute Resolution | | | 2.1 | | | | 2.1 | |
| | |
Department of National Parks, Sport and Racing | | | | | | | | |
Tour fee and access permit concessions | | | 1.2 | | | | 1.2 | |
Queensland Recreation Centres - Concessional usage rates25 | | | 0.4 | | | | 0.4 | |
| | |
Department of Natural Resources and Mines | | | | | | | | |
Drought Assistance Package - Water Licence Fee Waiver and Land Rental Rebates | | | 3.9 | | | | 4.1 | |
168
Budget Strategy and Outlook 2015-16
| | | | | | | | |
Agency | | 2014-15
Est. act
$ million | | | 2015-16
Estimate
$ million | |
Department of Science, Information Technology and Innovation | | | | | | | | |
State Library of Queensland - Venue hire rebates | | | 0.3 | | | | 0.3 | |
| | |
Department of Transport and Main Roads | | | | | | | | |
General Public Transport Concessions (South East Queensland)26 | | | 1,134.2 | | | | 1,147.6 | |
General Public Transport Concessions (Regional Queensland) | | | 206.0 | | | | 206.2 | |
TransLink Transport Concessions (South East Queensland)3 | | | 100.5 | | | | 104.1 | |
Other transport concessions (Regional Queensland) and taxi subsidies | | | 25.6 | | | | 27.3 | |
Designated Public Transport Concessions for Seniors Card Holders | | | 3.8 | | | | 3.8 | |
Rail Network and Infrastructure Funding27 | | | 502.2 | | | | 554.1 | |
Livestock and Regional Freight Contracts28 | | | 119.7 | | | | 46.3 | |
Rail Concession Scheme3 | | | 36.0 | | | | 36.0 | |
Vehicle and boat registration concessions3 | | | 133.7 | | | | 146.1 | |
School Transport Assistance Scheme | | | 138.2 | | | | 144.3 | |
Practical Driving Test | | | 5.8 | | | | 6.2 | |
Commercial ship registration and licensing | | | 4.9 | | | | 4.9 | |
| | |
Department of the Premier and Cabinet | | | | | | | | |
Arts Queensland - Discount on property lease rentals | | | 0.6 | | | | 0.5 | |
Arts Queensland - Venue hire rebates | | | 0.2 | | | | 0.2 | |
Queensland Performing Arts Trust - Arts concessional entry fees29 | | | 0.5 | | | | 0.9 | |
Queensland Performing Arts Trust - Venue hire rebates | | | 0.8 | | | | 0.8 | |
Queensland Museum - Arts concessional entry fees | | | 1.5 | | | | 1.6 | |
Queensland Art Gallery - Arts concessional entry fees | | | 0.9 | | | | 1.0 | |
| | |
Public Safety Business Agency | | | | | | | | |
Blue card assessments - Volunteer applicants30 | | | 11.0 | | | | 7.6 | |
| | |
Queensland Fire and Emergency Services | | | | | | | | |
Emergency Management Levy Concession | | | 8.6 | | | | 9.1 | |
169
Budget Strategy and Outlook 2015-16
| | | | | | | | |
Agency | | 2014-15
Est. act
$ million | | | 2015-16
Estimate
$ million | |
Queensland Health | | | | | | | | |
Oral Health Scheme31 | | | 159.4 | | | | 157.8 | |
Patient Travel Subsidy Scheme32 | | | 71.1 | | | | 79.0 | |
Medical Aids Subsidy Scheme | | | 40.3 | | | | 40.5 | |
Spectacle Supply Scheme | | | 9.1 | | | | 9.2 | |
Community Aids Equipment and Assistive Technologies Initiative and Vehicle Options Subsidy Scheme33 | | | 8.7 | | | | 5.0 | |
| | |
CS Energy Limited | | | | | | | | |
Gladstone Power Station Interconnection and Power Pooling Agreement34 | | | N/A | | | | N/A | |
| | |
Energex Limited | | | | | | | | |
Regulated Service Charges | | | 13.6 | | | | 15.4 | |
| | |
Ergon Energy Corporation Limited | | | | | | | | |
Regulated Service Charges | | | 4.7 | | | | 4.5 | |
| | |
Far North Queensland Ports Corporation Limited | | | | | | | | |
Concessional Leases - Industry/Commercial | | | 0.6 | | | | 0.6 | |
Concessional Leases - Community | | | 0.2 | | | | 0.2 | |
| | |
Gladstone Ports Corporation Limited | | | | | | | | |
Concessional Port Charges | | | 49.4 | | | | 49.6 | |
Concessional Leases - Industry/Commercial | | | 3.2 | | | | 3.0 | |
Concessional Leases - Community | | | 0.5 | | | | 0.5 | |
| | |
North Queensland Bulk Ports Corporation Limited | | | | | | | | |
Concessional Leases - Industry/Commercial | | | 1.4 | | | | 1.4 | |
Concessional Leases - Community | | | 0.2 | | | | 0.2 | |
| | |
Port of Townsville Limited | | | | | | | | |
Concessional Leases - Industry/Commercial | | | 5.4 | | | | 5.4 | |
Concessional Leases - Community | | | 0.1 | | | | 0.1 | |
170
Budget Strategy and Outlook 2015-16
| | | | | | | | |
Agency | | 2014-15
Est. act
$ million | | | 2015-16
Estimate
$ million | |
Queensland Rail Limited | | | | | | | | |
Kuranda Scenic Railway | | | 8.2 | | | | 9.7 | |
Heritage Rail Services | | | 6.2 | | | | 5.9 | |
Concessional Leases - Community | | | 1.6 | | | | 1.6 | |
| | |
SunWater Limited | | | | | | | | |
Water Supply Contracts | | | 21.0 | | | | 21.0 | |
| | |
Total | | | 4,920.7 | | | | 4,735.4 | |
Notes:
| 1. | Numbers may not add due to rounding. |
| 2. | The increase between the 2014-15 estimated actual and the 2015-16 estimate reflects the impact of an increased number of recipients. |
| 3. | The Australian Government ceased the National Partnership Agreement on Certain Concessions for Pensioner Concession Card and Seniors Card Holders from 1 July 2014. Concessions are fully funded by the State. |
| 4. | The decrease between the 2014-15 estimated actual and the 2015-16 estimate is due to increased verification checks by water retailers to ensure only eligible customers are accessing the subsidy. |
| 5. | The increase is due to a CPI increase on subsidies, the anticipated increase in apprentices and related program activity. |
| 6. | The decrease is due to a higher amount of Australian Government funding available that contributes to the total cost of the program. Overall the Certificate 3 Guarantee program will report an increased investment in 2015-16. |
| 7. | The increase is due to the anticipated increase in activity through demand-driven funding arrangements. |
| 8. | The increase in 2015-16 is due to a low take up of this subsidy in 2014-15. |
| 9. | The increase in 2015-16 is due to a combination of CPI indexation and forecast enrolment growth in State and non-government schools. |
| 10. | The increase in the 2015-16 estimate is due to CPI indexation. |
| 11. | The decrease in 2015-16 is due to an anticipated lower take up of this subsidy in 2016. |
| 12. | The increase in 2015-16 is due to anticipated increased student enrolments in 2016. |
| 13. | The variance between the 2014-15 estimated actual and the 2015-16 estimate reflects a reduction in network charges due to the Australian Energy Regulator’s Preliminary Decision Ergon Energy Determination 2015-16 to 2019-20. |
| 14. | The variance between the 2014-15 estimated actual and the 2015-16 estimate reflects a decrease in costs of generating power. |
| 15. | The cost depends on the relative difference between Queensland and New South Wales retail electricity prices for non-market customers. |
| 16. | The variance between the 2014-15 estimated actual and the 2015-16 estimate reflects a decrease in the difference between the price paid by consumers and the cost of supply, consistent with the staged transition to full cost recovery under the 10 year bulk water price path in South East Queensland. |
| 17. | The change between the 2014-15 estimated actual and 2015-16 estimate reflects irrigation prices increasing as a result of the current 2012-17 price path leading to a reduction in the concession required. |
| 18. | The change between the 2014-15 estimated actual and 2015-16 estimate reflects irrigation prices increasing as a result of the current 2013-17 price path leading to a reduction in the concession required. |
| 19. | Additional funding for expected uptake of drought relief as a result of extended drought conditions in regional Queensland. |
| 20. | New item for the 2015-16 Concessions statement. |
171
Budget Strategy and Outlook 2015-16
| 21. | The decrease between the 2014-15 estimated actual and the 2015-16 estimate is a result of an increase in market rents, offset by the impact of the implementation of the new rent policy introduced by the previous government. |
| 22. | The increase between the 2014-15 estimated actual and the 2015-16 estimate is due to an expected increase in the number of dwellings delivered. |
| 23. | The increase reflects a grant indexation adjustment and increased demand for supported accommodation initiatives. |
| 24. | The value of this concession arrangement is not easily quantified. |
| 25. | Previously reported as ‘Active Recreation Centres - Concessional usage rate’. |
| 26. | The General Public Transport Concessions (South East Queensland) is increasing in 2015-16 due to annual cost indexation while fare box revenue is impacted by the November 2014 5% fare decrease and January 2015 fare freeze. |
| 27. | The estimated cost increase in 2015-16 is due to annual cost indexation. |
| 28. | The decrease between the 2014-15 estimated actual and 2015-16 estimate is primarily due to the majority of rail services becoming commercially viable. |
| 29. | The increase between the 2014-15 estimated actual and 2015-16 estimate is due to a change in the number and type of shows that will attract concessional ticket pricing. |
| 30. | The decrease between the 2014-15 estimated actual to the 2015-16 estimate is due to the impact of the change in the validity period of blue cards, which was extended from two to three years from April 2010. As a result of this change, there was a significant drop in the volume of renewal applications received in 2012-13, which is forecast to impact again in 2015-16. |
| 31. | The reduction in the 2015-16 estimate reflects the cash flow arrangements of the National Partnership Agreement for Adult Public Dental Services and Medicare Child Dental Benefits Schedule. |
| 32. | The variation between the 2014-15 estimated actual and 2015-16 estimate is due to predicted annual growth. |
| 33. | The decrease between 2014-15 estimated actual and the 2015-16 estimate reflects an additional one-off budget allocation relating to increased demand in 2014-15. In addition, the implementation of the National Disability Insurance Scheme will affect both programs’ expenditure. |
| 34. | Due to the parties to the Interconnection and Power Pooling Agreement including private sector companies, current estimates are commercial-in-confidence and are unable to be published. |
172
Budget Strategy and Outlook 2015-16
Concessions by agency
Department of Agriculture and Fisheries
Funding for the Drought Relief Assistance Scheme (DRAS) provides freight subsidies and emergency water infrastructure rebates to support producers and communities that have been affected by drought conditions across the State. Freight subsidies of up to 50% and emergency water infrastructure rebates of up to 50% are available to eligible applicants, up to a maximum of between $20,000 and $40,000 per property, per financial year.
The Primary Industry Productivity Enhancement Scheme is administered by QRAA and provides concessional rates of interest on loans to eligible primary producers in need of financial assistance. First Start Loans and Sustainability Loans of up to $650,000 support applicants to enter primary production and to improve productivity and sustainability. Concessional interest rates on these loans range from 3.23% to 3.45%.
The Government provides a rebate towards the cost of eligible personal protective equipment used by veterinarians in the testing of suspected Hendra virus cases. The rebate scheme came into effect on 1 July 2012. The rebate scheme allows private veterinarians to claim up to $250 from Biosecurity Queensland to help equip veterinarians with appropriate personal protective equipment for themselves and anyone else assisting with the testing of horses.
A replenishment rebate of $250 is also available for veterinarians that have conducted Hendra virus testing in order to assist them with the cost of restocking personal protective equipment. Funding of $0.3 million is allocated in 2015-16 for this initiative. As at 1 May 2015, 59 payments have been made to veterinarians across the State during 2014-15 with some of these payments incorporating multiple rebates.
Department of Communities, Child Safety and Disability Services
The Electricity Rebate Scheme provides a rebate of up to $321 per annum to assist with the cost of domestic electricity supply to the home of eligible holders of a Pensioner Concession Card, a Queensland Seniors Card or a Department of Veterans’ Affairs Gold Card (and receive the War Widow/er Pension or special rate Totally or Permanently Incapacitated Pension).
The Electricity Life Support Concession Scheme is aimed at assisting seriously ill people who use home based life support systems by providing a rebate of up to $654 per annum for users of oxygen concentrators and a rebate of up to $438 per annum for users of kidney dialysis machines to meet their electricity costs. The concession is paid quarterly and is subject to the patient being medically assessed in accordance with Queensland Health eligibility criteria.
173
Budget Strategy and Outlook 2015-16
The Medical Cooling and Heating Electricity Concession Scheme provides a rebate of up to $321 per annum for eligible concession card holders with a medical condition who have dependence on air conditioning to regulate body temperature.
These electricity price linked rebates have historically been adjusted annually according to the Queensland Competition Authority (QCA) price determination for general household electricity tariff. For 2015-16, the QCA determined that the general household electricity tariff will decrease by 0.5%. The Queensland Government has decided to not decrease the value of the concessions and will instead continue the electricity price linked rebates at their 2014-15 values.
The Pensioner Rate Subsidy Scheme offers a 20% subsidy (up to a maximum of $200 per annum) to lessen the impact of local government rates and charges on pensioners, thereby assisting them to continue to live in their own homes.
The South East Queensland (SEQ) Pensioner Water Subsidy Scheme provides an annual subsidy of up to $120 to eligible pensioner property owners in the SEQ Water Grid to lessen the impact of increased water prices. This subsidy is in addition to the Pensioner Rate Subsidy Scheme.
The Home Energy Emergency Assistance Scheme provides one off emergency assistance of up to $720 per annum (for a maximum of two consecutive years) to assist low income households experiencing a short term financial crisis and who are unable to pay their current electricity and/or reticulated natural gas account. It is not a requirement for the claimant to hold a concession card.
The Reticulated Natural Gas Rebate Scheme provides a rebate of up to $69 per annum to assist with the cost of reticulated natural gas supplied to the home of eligible holders of a Pensioner Concession Card, Queensland Seniors Card or a Department of Veterans’ Affairs Gold Card (and receive the War Widow/er Pension or special rate Totally or Permanently Incapacitated Pension).
Department of Education and Training
The User Choice - Apprentice and Trainee Training Subsidy program provides Government funding towards the costs of training and assessment for eligible Queensland apprentices and trainees. The subsidy is available to public and private registered training organisations (pre-approved as pre-qualified suppliers) to subsidise tuition fees to reduce the cost of required accredited, entry level training for apprentices and trainees. The program provides greater flexibility for apprentices, trainees and their employers to select a preferred registered training organisation of their choice and to negotiate the type of training to meet their specific needs. Whilst the full cost of each training subsidy varies by course, the average annual dollar value of the Government fee subsidy per student is $2,686.
174
Budget Strategy and Outlook 2015-16
The Vocational Education and Training (VET) Certificate 3 Guarantee Tuition Fee Subsidy provides a government subsidy to allow eligible Queenslanders to obtain their first post-school Certificate III qualification to gain a job or to improve their employment status. The subsidy is available to private and public registered training organisations (pre-approved as pre-qualified suppliers) to subsidise tuition fees paid by students undertaking eligible vocation education and training qualifications (primarily Certificate III qualifications).
The annual average dollar value of the Government fee subsidy for each qualification ranges from $520 to $7,730 depending on the eligibility and qualification subsidised. The average subsidy value is $2,703.
The VET Higher Level Skills Tuition Fee Subsidy provides a government subsidy to eligible students and employers to undertake a priority Certificate IV, diploma or advanced diploma or industry endorsed skill set. This program will help individuals gain employment in a critical occupation, career advancement in a priority industry or transition to university to continue their studies. The subsidy is available to private and public registered training organisations (pre-approved as pre-qualified suppliers) to subsidise tuition fees paid by students undertaking eligible vocational education and training qualifications at Certificate IV or above.
The annual average dollar value of the Government fee subsidy for each qualification ranges from $1,305 to $8,130 depending on the eligibility and qualification subsidised. The average subsidy value is $4,416.
The Travel and Accommodation Subsidy provides financial assistance to Queensland apprentices and trainees for travel expenses incurred in attending off the job training at a registered training organisation. To be eligible, apprentices must attend the closest registered training organisation that offers the required qualification and travel a minimum of 100km return from their usual place of residence to the registered training organisation. The subsidy provides for:
| • | | return land travel to the registered training organisation of 15 cents per km for distances between 100 - 649km, increasing to 19 cents per km for distances between 650 - 1,400 km |
| • | | accommodation assistance of $27 per day, if it is necessary to live away from their usual place of residence to attend training |
| • | | a return economy air ticket to the location of the registered training organisation if necessary |
| • | | cost of ferry travel if necessary. |
The Textbook and Resource Allowance is for parents/caregivers of secondary school age students attending State and approved non-government schools to assist with the cost of textbooks and learning resources. Parents generally sign over this allowance to the school to reduce the fees associated with participating in the school’s textbook and resource scheme. In 2015, the rates per annum are $119 for students in Years 7 to 10 and $258 for students in Years 11 and 12.
175
Budget Strategy and Outlook 2015-16
School Transport Assistance for Students with Disabilities is provided for students to attend State school programs that meet their individual education needs. This transport assistance includes the provision of taxis or specialised contracted minibuses, payment of fares on regular buses or trains, or an allowance for parents who drive their children to school. The benefit level is to a maximum of $400 per week, per student, however in exceptional circumstances higher amounts may be approved. A separate scheme is in place for students with disabilities attending non-government schools (refer ‘Non-Government Schools Transport Assistance Scheme’).
The Living Away from Home Allowance Scheme provides financial assistance to support Queensland families and targets geographically-isolated families. The scheme meets the costs of children who are required to live away from home to attend schools. This concession is available to Queensland students attending both State and non-government schools.
The benefits available for eligible students in 2015 are:
| • | | Remote Area Tuition Allowance - primary students up to $3,401 per annum and secondary students up to $4,898 per annum. Benefit levels are linked to the tuition fees charged by approved boarding schools |
| • | | Remote Area Travel Allowance - available where the distance from the family home to the boarding location is at least 50km. Benefit levels depend on the distance travelled, and range from $131 to a maximum of $1,639 per annum |
| • | | Remote Area Allowance - assistance of $2,138 per annum is available to students attending campuses of the Australian Agricultural College Corporation in lieu of Years 11 and 12 |
| • | | Remote Area Disability Supplement - available to students with disabilities who incur additional costs associated with living away from home to attend school. Benefits are up to $6,959 per student per annum. |
The Non-Government School Transport Assistance Scheme assists families by providing funding towards the transport costs of students attending non-government schools outside of the Brisbane City Council area. Under the scheme, reimbursement is provided for transport expenses above a set weekly threshold amount. In 2015, the threshold is $33 per week for families, or $25 for families with a Health Care Card, Pensioner or Department of Veteran’s Affairs Pensioner Card.
The program also assists families of students with disabilities who attend a non-government school. The level of assistance provided is dependent on the type of transport needed and travel assistance already provided by the Department of Transport and Main Roads. For families using taxis, assistance is capped at $300 per week.
176
Budget Strategy and Outlook 2015-16
The Distance Education - Information and Communication Technology Subsidy Scheme provides assistance to students enrolled in a school of distance education that are geographically isolated or in the medical category.
The scheme provides $250 per annum to assist with purchasing, replacing or upgrading computer hardware for students in the distance/geographically isolated and medical categories, and $500 per annum to assist students in the distance/geographically isolated category to meet the costs of broadband internet access and download charges for the home classroom. Eligible students also receive access to free software licences.
The Distance Education - Non-Government Student Fee Subsidy is available to students who are enrolled in non-government schools and also choose to access distance education subjects. It provides an average annual subsidy of approximately $1,232.50 per distance education subject enrolment.
This subsidises approximately 50% of the total average cost per annum of providing a subject through distance education for non-government school students. The concession contributes towards the state continuing to make distance education available to non-government schools, ensuring the widest possible subject choice for students, while recovering a proportion of the teaching and overhead costs.
The Dalby State High School - Bunya Campus Residential Facility provides affordable residential accommodation for secondary school students in a boarding facility. The concession particularly targets secondary school students from rural and remote communities, however, any secondary age student is eligible. Students accommodated at the residential facility are enrolled at Dalby State High School and participate in agricultural education programs.
The Spinifex State College - Mount Isa Student Residential Facility provides an affordable residential facility in Mount Isa for students from the North Western area of the state whose home community does not provide secondary schooling. The funding meets the cost of wages for the residential college, increasing the affordability of the accommodation rates charged to students.
The Far North Queensland Region - Student Residential College provides a residential schooling option for students from the Torres Strait and Cape York. This college provides an option that is more familiar for students from remote locations with the intent to increase participation and retention of secondary students in schooling. The concession targets students from the Torres Strait and Cape York seeking secondary education when their home community does not provide secondary schooling. The concession provides wages for the residential college allowing the rates charged to students to be more affordable.
177
Budget Strategy and Outlook 2015-16
Tuition fee exemptions/waivers - Dependants of international students allows students who meet the approved exemption criteria and wish to enrol their child in Preparatory (Prep) Year to Year 12 of schooling to be exempt from paying dependant tuition fees. The exemption only applies for the duration of the main temporary visa holder’s (parent) course of study in Queensland. A dependant student (Prep to Year 12) of a temporary visa holder may also be eligible for a tuition fee waiver in certain circumstances, including financial hardship. The average value of the exception/waiver is $6,543.40 per student.
Department of Energy and Water Supply
The Ergon Energy – Uniform Tariff Policy (excluding Isolated Systems) ensures that, where possible, all Queensland non-market electricity customers of a similar type pay the same price for electricity regardless of where they live. As the notified prices do not reflect the full cost of electricity supply for most remote and regional Queenslanders, a subsidy is provided. The community service obligation (CSO) payment to Ergon Energy Queensland Pty Ltd (Ergon Energy) covers the difference between the revenue earned by charging customers notified prices and the actual costs in the regional areas (due to differences in network costs and energy losses).
The drop in the CSO in 2015-16 largely relates to the outcome of the Australian Energy Regulator’s (AER) determination. Specifically, the AER has reduced Ergon Energy’s allowable revenue more than Energex Limited’s, reducing the difference between South East Queensland prices and cost-reflective regional prices. While the CSO reduces in 2015-16, customers outside South East Queensland will continue to pay the same regulated rate as customers in South East Queensland.
The Ergon Energy - Uniform Tariff Policy for Isolated Systems ensures that, where possible, all Queensland non-market electricity customers of a similar type pay the same price for electricity regardless of where they live. Ergon Energy owns and operates 33 isolated power stations which supply electricity to remote and isolated Queensland communities. Ergon Energy Queensland Pty Ltd retails electricity to these customers at the notified prices and the Government provides funding to Ergon Energy Queensland Pty Ltd to cover the difference between the revenue earned and the cost of supplying electricity to these customers.
The Origin Energy - Uniform Tariff Policy ensures that, where possible, all Queensland non-market electricity customers of a similar type pay the same price for electricity regardless of where they live. Origin Energy retails electricity to approximately 5,450 Queensland non-market customers in the Goondiwindi, Texas and Inglewood areas who are supplied electricity through the New South Wales Essential Energy distribution network.
The Government provides a rebate to these customers, via Origin Energy, to ensure they pay no more for electricity than other similar customers in Queensland.
178
Budget Strategy and Outlook 2015-16
Urban Water Price Path: Bulk water price revenues in South East Queensland (SEQ) are currently set at levels below the cost of supply. This has been the case since the commencement of a 10 year price path in 2008. The difference between revenue received, based on these below cost prices, and the costs to be recovered is due to be repaid from bulk water prices over the period to 2027-28.
However, it should be noted that this under recovery is not funded through a CSO or consolidated revenue, but is to be recovered through SEQ bulk water prices. The reduction in the level of under recovery between the 2014-15 estimated actual and the 2015-16 estimate is due to the narrowing gap between the cost of supplying water and the price paid by consumers.
Cloncurry Water Pipeline Water Supply Subsidy: North West Queensland Water Pipeline Limited (NWQWP), a SunWater subsidiary, owns and operates the Cloncurry Water Pipeline between the Ernest Henry Mine and Cloncurry. The pipeline guarantees Cloncurry Shire Council’s long term water supply and supports industrial development in the region. As the construction and operation of the Cloncurry Water Pipeline is a non-commercial investment, the Government provides funding to NWQWP to ensure that SunWater receives a return on its investment in the pipeline.
SunWater Rural Irrigation Water Price Subsidy: SunWater Limited (SunWater) owns and operates water supply schemes across regional Queensland. As the owner of SunWater, the Government decides how much to recover of SunWater’s costs through irrigation prices. Currently, SunWater’s irrigation water prices for some schemes are set below the level which recovers the costs of supplying water to the irrigators. Government funding is provided to SunWater to offset the reduced revenue and to ensure that increases in water prices paid by rural irrigation customers to recover costs are gradual.
Seqwater Rural Irrigation Water Price Subsidy: Seqwater owns and operates water supply schemes across SEQ which also supply bulk water services to rural irrigation customers. Currently Seqwater’s rural irrigation prices for some schemes are set below the level which recovers the costs of supplying water to the irrigators. Government funding is provided to Seqwater to offset the reduced revenue and to ensure that increases in water prices paid by rural irrigation customers to recover costs are gradual.
The Government is extending existing Drought Relief Arrangements by providing increased funding of $2.5 million in 2015-16 to provide relief to farming customers from fixed charges for electricity accounts that are used to pump water for farm or irrigation purposes during periods of drought.
Department of Environment and Heritage Protection
The Nature Conservation Act 1992 and its subordinate legislation regulate the clearing, growing, harvesting and trade of protected plants in Queensland. Protected Plant Licence and Permits Concessions are available for individuals and groups undertaking activities for educational purposes, scientific research purposes, conservation, clearing to establish necessary property infrastructure and traditional owner activity. The dollar amount of the fee reduction provided under the concession depends on the type of permit or licence; it is $401.20 for plant growing licences, $803.30 for plant harvesting licences and $2,009 for plant clearing permits.
179
Budget Strategy and Outlook 2015-16
Department of Housing and Public Works
The Government managed housing rental rebate targets low income families and individuals and represents the difference between the rents that would be payable in the private market and rent that is charged by Government based on household income.
Assistance is provided to approximately 57,000 households. The estimated average yearly subsidy per household for 2015-16 is $7,313.
The National Rental Affordability Scheme (NRAS) is an Australian Government initiative, delivered in partnership with the Queensland Government, to increase the supply of new affordable rental housing. The scheme provides financial incentives to investors to build well located dwellings and rent them to eligible low to moderate income households, at a discounted rate, at least 20% below market rent.
Under the scheme the concession to the tenant is provided by the property owner. Due to the nature of the arrangement, the overall value of the concession to the tenant cannot be quantified. In 2015-16, the Government has allocated $28.8 million for the payment of financial incentives to NRAS investors who are then required to discount rents to tenants.
Home Assist Secure provides free safety related information and referrals, and subsidised assistance to eligible clients unable to undertake or pay for critical maintenance services. To be considered for assistance, home owners or tenants with a disability or who are over the age of 60 must hold a Pensioner Concession Card and be unable to complete the work themselves. In addition, they must be unable to access assistance from family or friends or other services. Labour costs (up to $400 per household per year) for the assistance provided are subsidised by Home Assist Secure while the balance of the costs (including all materials) are met by the client.
Home Assist Secure targets home owners and those in rental housing who are over 60 years of age or have a disability, and who require assistance to remain living in their home. In 2015-16, $19.6 million in grants to Home Assist Secure providers will be issued to ensure the ongoing delivery of assistance to those in greatest need. It is estimated that 50,000 households will be assisted.
The provision of non-residential buildings – subsidised rents assists various organisations to deliver services to communities. Accommodation is provided to 44 community, arts and not-for-profit organisations in Government owned non-residential buildings. Tenures for the occupancies are by way of leases, licences or month to month arrangements. Rents paid by the organisations are often below independently assessed market rent levels. Subsidised rental arrangements are provided to 27 properties comprising a total floor area of approximately 29,000 square metres. The total subsidy is calculated by deducting the actual amount paid by the occupants from the total estimated annual market rent for the office space.
The Government provides interest-free rental bond loans equivalent to a maximum amount of four weeks rent to people who cannot afford to pay a full bond to move into private rental accommodation reducing the need for more costly, subsidised housing assistance. The concession represents the interest saving for the client on the bond loan. In 2015-16, it is estimated that $31.6 million in bond loans will be advanced to approximately 23,800 clients.
180
Budget Strategy and Outlook 2015-16
The Government provides contributions to non-government managed housing providers, including capital grants, granted land or properties, or recurrent funding, to assist in increasing housing affordability and access to social housing. Due to the nature of the arrangement, the overall value of the concession provided by the Government is not easily quantified. Rents charged for social housing managed by the providers are based on 25% of a household’s assessable income, which substantially reduces accommodation costs for eligible individuals and families.
Department of Justice and Attorney-General
The Public Trustee of Queensland (the Public Trustee) is a self-funding organisation and uses a scale of fees which is designed to reflect a fair cost for the services provided.
The Public Trustee has established a safety net limit on the annual fees payable by certain clients. The arrangement provides for a rebate of fees for some clients with limited assets, for example financial administration for clients with impaired capacity, or administration of deceased estates or trusts. The Public Trustee also provides free will making services for Queenslanders.
The Public Trustee also provides funding to the Public Guardian (formerly the Office of the Adult Guardian) and financial assistance under the Civil Law Legal Aid Scheme administered by Legal Aid Queensland, to enable these organisations to provide services to the people of Queensland.
The Supreme, District and Magistrates Courts hear civil disputes between two or more parties (people or organisations) where one party sues the other, usually to obtain compensation, or seek some other remedy. These disputes may involve anything from defamation to outstanding debts. Civil Court Fees are prescribed under the Uniform Civil Procedure (Fees) Regulation 2009 for proceedings commenced in civil matters and are set below full cost recovery to ensure that civil remedies are accessible to all Queenslanders.
The Queensland Civil and Administrative Tribunal (QCAT) is an independent tribunal which makes decisions and resolves disputes across a wide range of jurisdictions for the community. Fees for these services are below cost recovery to ensure services are accessible, fair and inexpensive. QCAT provides human rights services with no application fees for matters in guardianship and administration of adults, children and young people and anti-discrimination.
The Office of the Commissioner for Body Corporate and Community Management provides a dispute resolution service to parties unable to resolve disputes themselves. The service consists of conciliation, with the aim of achieving a voluntary agreement, and adjudication, which results in a formal order. The service is delivered below full cost recovery so as to not restrict access to justice due to affordability reasons.
181
Budget Strategy and Outlook 2015-16
Department of National Parks, Sport and Racing
Tour fee and access permit concessions are available in specified protected areas including David Fleay Wildlife Park, Mon Repos Conservation Park, St Helena Island National Park, Walk-About Creek Wildlife Centre, Fort Lytton National Park, Cooloola Recreation Area, Moreton Island and Fraser Island.
Queensland Recreation Centres - Concessional usage rates are offered to students and children 17 years and under, for the use of Queensland Recreation Centres, primarily at Currimundi and Tallebudgera. These concessional rates provide discounts of between 3.4% and 41.4%.
Department of Natural Resources and Mines
As part of the Government’s drought assistance package, the annual water licence fee of $74.00 will be waived for 2015-16 for landholders in Local Government Areas (LGA) that are drought declared and those declared as individually droughted properties.
Category 11 Grazing and Primary Production landholders under the Land Act 1994 will also be eligible to a rent rebate in 2015-16. The rebate is available to lessees, other than those on minimum rent that are in a drought declared LGA and to individually droughted properties. In addition to this rebate, drought declared landholders will be granted hardship deferral for required rent payments.
Department of Science, Information Technology and Innovation
State Library of Queensland provides venue hire concessions to targeted community and non-profit groups including cultural and charitable organisations and educational institutions in order to support events and programs directly linked to State Library of Queensland’s services, programs and activities.
Department of Transport and Main Roads
The General Public Transport Concessions (South East Queensland) represent the direct funding contribution that Government makes towards the cost of operating public transport services within South East Queensland. This contribution effectively reduces the ticket price paid by all public transport users on bus, rail and ferry services, increasing the affordability of these services. This concession incorporates the recent 5% decrease in fares in November 2014 and subsequent fare freeze in January 2015.
182
Budget Strategy and Outlook 2015-16
The General Public Transport Concessions (Regional Queensland) identify the financial contribution that Government provides across a range of transport services in regional Queensland. The impact of this contribution benefits all public transport users through reduced transport fares. This concession covers:
| • | | TravelTrain (excluding the ‘Rail Concession Scheme’ for eligible pensioners, veterans and seniors) |
| • | | subsidies for regional bus and ferry operators (excluding concessional top up amounts and School Transport Assistance Scheme related amounts) |
| • | | subsidies for air services to remote and rural communities within the State |
| • | | subsidies for the Rail XPT Service (Sydney-Brisbane) and Savannahlander (Atherton Tableland) |
| • | | subsidies for long distance coach services to rural and remote communities within the State. |
The TransLink Transport Concessions (South East Queensland) are provided by the Government to ensure access and mobility for Queenslanders who require assistance because of age, disability or fixed low income. Passengers entitled to receive public transport concessions include holders of a Pensioner Concession Card, Veterans’ Affairs Gold Card, Seniors Card (all states and territories), Companion Card, Vision Impairment Travel Pass, TPI Veteran Travel Pass, children, as well as secondary and tertiary students. For a peak two zone journey using a go card, the concession will reduce an adult fare from $3.93 to $1.96.
Other transport concessions (Regional Queensland) and taxi subsidies are provided by the Government to ensure access and mobility for Queenslanders who require assistance because of age, disability or fixed low income. Passengers entitled to receive public transport concessions include holders of a Pensioner Concession Card, Veterans’ Affairs Gold Card, Seniors Card (all states and territories), Companion Card, Vision Impairment Travel Pass, TPI Veteran Travel Pass, children, as well as secondary and tertiary students.
The Taxi Subsidy Scheme aims to improve the mobility of persons with severe disabilities by providing a 50% concession fare up to a maximum subsidy of $25 per trip.
Designated Public Transport Concessions for Seniors Card Holders allows visitors from interstate, who hold a state or territory Seniors Card, to access public transport concessions within Queensland and is fully funded by the Queensland Government.
Rail network and infrastructure funding ensures that the State supported rail network is safe, reliable and fit for purpose. The contract also provides funding to Queensland Rail to support major capital projects and related asset strategies. The funding provided via this contract directly benefits customers of the State supported rail network, including both freight and passengers. Without this funding, rail access charges (including public transport fares) would be significantly higher for all users of the rail network.
The Livestock and Regional Freight Contracts provide funding to support the movement of cattle (via rail only) and freight (via road and rail) to and from regional areas of Queensland. The funding provided directly benefits the cattle industry and enables regional communities to maintain employment and directly benefits communities in regional Queensland who are reliant on rail freight services by reducing the cost of these freight services for users.
183
Budget Strategy and Outlook 2015-16
The Queensland Rail Concession Scheme improves the affordability of long distance and urban rail services for eligible pensioners, veterans and seniors. Assistance for long distance rail services is provided through discounted fares and free travel vouchers. For TravelTrain (long distance rail) services, depending on the service, the concession may be for free travel for up to four trips per year for Queensland pensioners (subject to availability of seats and payment of an administration fee).
Vehicle and boat registration concessions are provided to holders of the Pensioner Concession Card, Queensland Seniors Card and to those assessed by the Department of Veterans’ Affairs as meeting the necessary degree of incapacity or impairment. The concession is aimed at improving access to travel for pensioners, seniors and persons with a disability by providing a reduced rate of registration fees. For most eligible card holders, a concession for a private use 4-cylinder vehicle would reduce the 12 month registration charge from $289.85 to $144.95. For a recreational boat up to and including 4.5 metres in length, the concession reduces the registration charge from $98.25 to $59.10 (based on registration charges at 1 July 2015).
A special interest vehicle (SIV) registration concession is offered for motor vehicles that have low use associated with vintage and historic and street rod car club events. A 12 month registration for a 6-cylinder SIV concession reduces registration from $458.95 for a private use vehicle to $81.70. Other motor vehicle and boat registration concessions are also provided to primary producers, local governments, charitable and community service organisations, and people living in remote areas without access to the wider road network.
The School Transport Assistance Scheme assists students that do not have a school in their local area or who are from defined low income groups with travel costs. The scheme provides funding to reduce the cost of travelling to school on bus, rail and/or ferry services, with allowances for private vehicle transport in certain circumstances. A typical concession would be to fully fund the cost of travel from home to the nearest State primary or high school where no local primary or high school is available (for example from Bargara to Bundaberg High School).
As part of the State’s driver licensing arrangements, applicants for new licences are required to undertake a practical driving test. The total cost to pre-book driver examinations and to perform the practical driver assessment is not fully recovered by the fee charged ($47.50 as at 1 July 2015), providing a direct concession to applicants.
The commercial vessel safety program including ship design and inspection standards and ship operator competency standards is funded from commercial ship registration and licensing revenue. The commercial ship registration and licensing concession represents the difference between the cost of supporting safety of commercial vessels in Queensland waters and revenue collected via commercial registration and compliance fees. The concession represents a benefit to commercial ship owners and operators. Vessels operated by primary or secondary schools used in marine education courses, vessels owned by Queensland Fire and Emergency Services, volunteer marine rescue associations and surf lifesaving associations are exempt from fees. From 2013-14, the Australian Maritime Safety Authority is responsible for regulation of domestic commercial vessels. Under an interim agreement, the State Government will continue to provide these services until 2017.
184
Budget Strategy and Outlook 2015-16
Department of the Premier and Cabinet
Arts Queensland – Discount on property lease rentals are provided to arts and cultural organisations at a discount from market rental rates at the Judith Wright Centre of Contemporary Arts, 381 Brunswick Street, Fortitude Valley and the Cairns Centre of Contemporary Arts. Discounts range from 20% to 100% of the market rate (dependent on location) of the commercial office space. Further discounts on specialist rehearsal and gallery space are given as negotiated at the time of entering the lease and dependent on the individual arts or cultural organisation and its funding.
Arts Queensland – Venue hire rebates are provided to support Queensland funded arts organisations and professional artists to create, rehearse and present new productions at the Judith Wright Centre of Contemporary Arts and the Cairns Centre of Contemporary Arts.
Queensland Performing Arts Trust – Arts concessional entry fees are offered for specific QPAT productions and provide support for other not for profit theatre companies to enable tickets to be sold at concessional prices. The level of concession provided varies depending on the number and size of events being held each year.
Queensland Performing Arts Trust – Venue hire rebates are offered to Government funded cultural organisations, charitable organisations, government departments and educational institutions. Organisations currently receiving discounts are Queensland Symphony Orchestra, Opera Queensland, Queensland Theatre Company and Queensland Ballet.
Queensland Museum - Arts concessional entry fees are provided to seniors, students, children, families and a variety of concession card holders for ticketed exhibitions at Queensland Museum & Sciencentre and for general entry to Cobb & Co Museum Toowoomba, The Workshops Rail Museum Ipswich, and Museum of Tropical Queensland Townsville. Concessions are also provided to targeted groups, such as schools, to encourage visits to museums. The level of concession provided varies depending on the venue and the event.
Queensland Art Gallery’s ticket prices are set to ensure that they are affordable and to maximise attendance, with additional concessions provided to seniors, students, children, families and a variety of concession card holders. The purpose of the Queensland Art Gallery – Arts concessional entry fees concession is to contribute to the cultural, social and intellectual development of Queenslanders, and encourage diverse audiences.
Public Safety Business Agency
Individuals providing child-related services or conducting child-related activities in regulated service environments are required to undergo an assessment of their police and relevant disciplinary information, and if approved, are issued with a blue card. A blue card is valid for three years unless cancelled or suspended earlier. The application fee for a blue card is $81.40 (as at 1 July 2015). Since the inception of the blue card system in 2001, Government has met the cost of blue card assessments – volunteer applicants.
185
Budget Strategy and Outlook 2015-16
Queensland Fire and Emergency Services
The Emergency Management Levy applies to all prescribed properties within Queensland. The levy provides a sustainable funding base for all emergency services including emergency management, fire and rescue services. Owners of prescribed properties who are in receipt of an Australian Government pension are eligible to receive a discount of 20% on the levy payable for a property that is their principal place of residence. In addition, community organisation owners of specified properties are exempt from payment of the levy.
Queensland Health
The Oral Health Scheme provides free dental care to eligible clients and their dependants who possess a current Health Care Card, Pensioner Concession Card, Queensland Seniors Card or Commonwealth Seniors Card. The average value of a course of treatment for eligible clients is approximately $600 for general care, $1,800 for treatment involving dentures, and $265 for emergency dental care. In rural and remote areas where no private dental practitioner exists, access to dental care for the general public is provided at a concessional rate, generally 15% to 20% less than average private dental fees.
The Patient Travel Subsidy Scheme provides financial assistance to patients who need to access specialist medical services which are not available within their local area. The Scheme provides a subsidy towards the cost of travel and accommodation for patients and, in some cases, an approved escort. Patients will receive fully subsidised commercial transport if arranged by Queensland Health or alternatively a subsidy of 30 cents per kilometre where a private vehicle is used. The accommodation subsidy is $60 per person per night for commercial accommodation. A subsidy of $10 per person per night is payable to patients and approved escorts who stay in private accommodation.
The Medical Aids Subsidy Scheme provides access to funding assistance for the provision of a range of aids and equipment to eligible Queensland residents with permanent and stabilised conditions or disabilities. Aids and equipment are provided primarily to assist people to live at home thus avoiding premature or inappropriate residential care or hospitalisation.
Subsidies vary based on service category and clinical criteria and are provided to assist with the costs of communication aids, continence aids, daily living aids, medical grade footwear, mobility aids, orthoses and oxygen. The scheme provides over 65,000 occasions of service to approximately 42,000 clients each year.
The Spectacle Supply Scheme provides eligible Queensland residents with free access to a comprehensive range of basic spectacles every two years including bifocals and trifocals. Applicants must be holders of eligible concession cards and be deemed by a prescriber to have a clinical need for spectacles.
The scheme provides around 80,000 items each year to approximately 70,000 clients (some clients require more than one pair of spectacles due to clinical need). With eligibility on a two year basis, this equates to over 140,000 clients. The average cost of services provided to applicants is approximately $115 per item, including the costs of administering the scheme through the Medical Aids Subsidy Scheme.
186
Budget Strategy and Outlook 2015-16
The Community Aids Equipment and Assistive Technologies Initiative (CAEATI) and Vehicle Options Subsidy Scheme (VOSS) provide financial assistance to eligible Queensland residents to support them to be more independent, participate further in social and economic opportunities in the community and contribute to a better quality of life.
CAEATI funding is capped at $10,000 per client over a three year period. CAEATI includes aids equipment and assistive technologies for postural support, communication support, community mobility and active participation.
VOSS funding is capped at $10,000 per client over a five year period. VOSS provides subsidies for a range of vehicle access options, including the subsidy of driving lessons on a suitably modified vehicle, modifications to a vehicle, purchase of a suitably modified vehicle or vehicle suitable for modification.
To receive funding through either of these schemes, an individual must be assessed as eligible for specialist disability support under the Disability Support Act 2006. Queensland resident eligibility is determined during the intake process, and confirmed as part of the assessment process.
CS Energy Limited
CS Energy Limited is party to the Interconnection and Power Pooling Agreement (IPPA), a long term contract which allows CS Energy Limited to dispatch and partially trade the output of Gladstone Power Station. The costs of maintaining this contract exceed the revenues of the trade which benefits the private sector owners of the Gladstone Power Station.
Whilst current estimates are commercial-in-confidence, CS Energy Limited’s 2013-14 Annual Report quantifies the value of the agreement up to the contract expiry date at $388.6 million as at 30 June 2014.
Energex Limited
Under Schedule 8 of the Electricity Regulation 2006, service charges for a range of services provided by Energex Limited (Energex) to energy retailers, for example disconnection and reconnection of supply, are capped. The maximum amount Energex is able to charge for these services is, on average, less than 5% of the value which the Australian Energy Regulator ascribes to the provision of these services by Energex, resulting in a concession provided to energy retailers and in turn households.
Ergon Energy Corporation Limited
Under Schedule 8 of the Electricity Regulation 2006, service charges for a range of services provided by Ergon Energy Corporation Limited (Ergon Energy) to energy retailers, for example disconnection and reconnection of supply, are capped. The maximum amount Ergon Energy is able to charge for these services is, on average, less than the value which the Australian Energy Regulator ascribes to the provision of these services by Ergon Energy, resulting in a concession provided to energy retailers and in turn households.
187
Budget Strategy and Outlook 2015-16
Far North Queensland Ports Corporation Limited
Far North Queensland Ports Corporation Limited (FNQPC) provides several leases to agricultural industry proponents at below commercial rates. FNQPC also provides leases to various community organisations at below commercial rates. The amounts shown are estimates of the revenue foregone by not charging commercial rates.
Gladstone Ports Corporation Limited
The Gladstone Ports Corporation Limited (GPC) is subject to a number of long term major industry contracts where port charges are significantly lower than market rates. These historical contracts were entered into to support various industries and government initiatives from time to time. The amounts shown are estimates of the revenue foregone by GPC as a result of being unable to charge commercial rates.
GPC also has various land and building lease arrangements at non-commercial rates. These contracts relate to incentives to improve utilisation of port land and assets and to establish businesses within port precincts. GPC also provides support to community and not-for-profit organisations through concessional leasing arrangements. The amounts shown are estimates of the revenue foregone by not charging commercial rates.
North Queensland Bulk Ports Corporation Limited
North Queensland Bulk Ports Corporation Limited (NQBP) provides several long term leases to agricultural industry proponents at below commercial rates. NQBP also provides leases to various community organisations, local councils and Government departments at below commercial rates. The amounts shown are estimates of the revenue foregone by not charging commercial rates.
Port of Townsville Limited
Port of Townsville Limited has a number of long term leases at below commercial rates with the sugar industry, recreational marine businesses and the not-for-profit sector at the Port of Townsville and the Port of Lucinda. The amounts shown are estimates of the revenue foregone by not charging commercial rates.
Queensland Rail
Kuranda Scenic Rail is a 37km railway line used predominantly for tourist railway services between Cairns and Kuranda. The amount shown represents the difference between ticket revenue and the cost of providing the service, effectively subsidising users of the railway.
Heritage Rail Services repairs and maintains the heritage fleet and hires it out to interested parties at below cost. The amount shown represents the shortfall between revenue and the cost of providing these services.
188
Budget Strategy and Outlook 2015-16
Queensland Rail leases properties, typically to community organisations, at below commercial rates under the continuation of pre-existing arrangements. The properties are generally of historical significance to the local community and the lessee often undertakes beautification works on the property. The amount shown is an estimate of the revenue foregone by not charging commercial rates.
SunWater Limited
SunWater Limited has a number of historic non-commercial water supply contracts that benefit specific entities, predominantly local government authorities. The future treatment of these water supply contracts is currently being considered by Government. The amount shown represents the difference between revenue and expenses under a fully costed allocation model.
189
Budget Strategy and Outlook 2015-16
| Appendix C: | Revenue and expense assumptions and sensitivity analysis |
The Queensland Budget, like those of other jurisdictions, is based in part on assumptions made about parameters that are uncertain, both internal and external to the State, which can impact directly on economic and fiscal forecasts.
This appendix outlines the assumptions underlying the revenue and expense estimates and analyses the sensitivity of the estimates to changes in the economic and other assumptions. This analysis is provided to enhance the level of transparency and accountability of the Government.
The forward estimates in the Budget are framed on a no policy change basis. That is, the expenditure and revenue policies in place at the time of the Budget (including those announced in the Budget) are applied consistently throughout the forward estimates period.
The following discussion provides details of some of the key assumptions, estimates and risks associated with revenue and expenditure and, where a direct link can be established, the indicative impact on forecasts resulting from a movement in those variables.
190
Budget Strategy and Outlook 2015-16
Taxation and royalty revenue
| Table C.1 | Taxation and royalty revenue1 |
| | | | | | | | | | | | | | | | | | | | | | | | |
| | | 2013-14 | | | 2014-15 | | | 2015-16 | | | 2016-17 | | | 2017-18 | | | 2018-19 | |
| | | Actual | | | Est. Act. | | | Budget | | | Projection | | | Projection | | | Projection | |
| | | $ million | | | $ million | | | $ million | | | $ million | | | $ million | | | $ million | |
Payroll tax | | | 3,914 | | | | 3,836 | | | | 3,955 | | | | 4,194 | | | | 4,462 | | | | 4,751 | |
Transfer duty | | | 2,403 | | | | 3,140 | | | | 3,009 | | | | 3,130 | | | | 3,224 | | | | 3,320 | |
Other duties | | | 1,281 | | | | 1,365 | | | | 1,423 | | | | 1,506 | | | | 1,595 | | | | 1,688 | |
Gambling taxes and levies | | | 1,044 | | | | 1,076 | | | | 1,123 | | | | 1,171 | | | | 1,222 | | | | 1,275 | |
Land tax | | | 986 | | | | 977 | | | | 1,016 | | | | 1,067 | | | | 1,132 | | | | 1,200 | |
Motor vehicle registration | | | 1,543 | | | | 1,583 | | | | 1,654 | | | | 1,728 | | | | 1,806 | | | | 1,887 | |
Other taxes | | | 674 | | | | 729 | | | | 746 | | | | 811 | | | | 849 | | | | 885 | |
Total taxation revenue | | | 11,845 | | | | 12,707 | | | | 12,926 | | | | 13,607 | | | | 14,289 | | | | 15,007 | |
Royalties | | | | | | | | | | | | | | | | | | | | | | | | |
Coal | | | 1,947 | | | | 1,610 | | | | 1,684 | | | | 1,913 | | | | 2,255 | | | | 2,474 | |
Petroleum2 | | | 69 | | | | 51 | | | | 129 | | | | 369 | | | | 467 | | | | 518 | |
Other royalties3 | | | 363 | | | | 392 | | | | 463 | | | | 399 | | | | 426 | | | | 434 | |
Land rents | | | 158 | | | | 167 | | | | 167 | | | | 176 | | | | 182 | | | | 188 | |
Total royalties and land rents | | | 2,537 | | | | 2,220 | | | | 2,444 | | | | 2,857 | | | | 3,329 | | | | 3,614 | |
Notes:
| 1. | Numbers may not add due to rounding. |
| 2. | Includes impact of liquefied natural gas (LNG) from 2014-15. |
| 3. | Includes base and precious metal and other mineral royalties. |
191
Budget Strategy and Outlook 2015-16
Taxation revenue assumptions and revenue risks
The rate of growth in tax revenues is dependent on a range of factors that are linked to the rate of growth in economic activity in the State. Some taxes are closely related to activity in specific sectors of the economy, whilst others are broadly related to the general rate of economic growth, employment, inflation and wages. A change in the level of economic activity, resulting from economic growth differing from forecast levels, would impact upon a broad range of taxation receipts.
Wages and employment growth – payroll tax collections
Wages and employment growth have a direct impact on payroll tax collections. The Budget assumptions are for an increase in wages of 2 1⁄2% and an increase in employment of 1 1⁄4% in 2015-16. The composition of the payroll tax base is also important. For example, the rate of growth in payroll tax is expected to be lower as fast growing sectors such as tourism, retail and hospitality are often outside the tax base because they are below the threshold.
A one percentage point variation in either Queensland wages growth or employment would change payroll tax collections by approximately $40 million in 2015-16.
Transfer duty estimates
Transfer duty collections in 2015-16 are expected to fall by 4.2% on the 2014-15 estimated actual. This fall reflects the large contribution from one-off transactions in 2014-15.
In underlying terms, the forecast is predicated on a moderation in residential property market volumes from those experienced in 2014-15 and increasing house prices, somewhat moderated by restrained levels of activity in the non-residential property sector. Across the forward estimates period, modest house price growth is expected to provide further support for transfer duty collections, while non-residential sector activity is expected to gradually improve in response to increased levels of employment and economic activity.
A one percentage point variation in either the average value of property transactions or the volume of transactions would change transfer duty collections by approximately $30 million in 2015-16.
192
Budget Strategy and Outlook 2015-16
Royalty assumptions and revenue risks
| Table C.2 | Coal royalty assumptions |
| | | | | | | | | | | | | | | | | | | | |
| | | 2014-15 | | | 2015-16 | | | 2016-17 | | | 2017-18 | | | 2018-19 | |
| | | Est. Act. | | | Budget | | | Projection | | | Projection | | | Projection | |
Tonnages - crown export1 coal (Mt) | | | 208 | | | | 212 | | | | 218 | | | | 225 | | | | 233 | |
Exchange rate US$ per A$2 | | | 0.84 | | | | 0.80 | | | | 0.80 | | | | 0.80 | | | | 0.80 | |
Year average coal prices (US$ per tonne)3 | | | | | | | | | | | | | | | | | | | | |
Hard coking | | | 116 | | | | 104 | | | | 114 | | | | 126 | | | | 132 | |
Semi-soft | | | 92 | | | | 82 | | | | 87 | | | | 92 | | | | 97 | |
Thermal | | | 67 | | | | 66 | | | | 69 | | | | 75 | | | | 78 | |
Year average oil price | | | | | | | | | | | | | | | | | | | | |
Brent ($US per barrel) | | | 74 | | | | 66 | | | | 70 | | | | 72 | | | | 74 | |
Notes:
| 1. | Excludes coal produced for domestic consumption and coal where royalties are not paid to the Government, i.e private royalties. 2015-16 estimate for domestic coal volume is approximately 24Mt and private coal is 8Mt. |
| 3. | Price for highest quality coking and thermal coal. Lower quality coal can be sold below this price with indicative average prices for 2015-16 as follows: Hard coking US$99 and thermal US$63. |
Royalty Assumptions
Table C.2 provides the 2015-16 Budget assumptions regarding coal royalties, which represent the bulk of Queensland’s royalty revenue.
As discussed in Chapter 3, the CSG industry made a small contribution to royalties in 2014-15 and will increase from 2015-16 onwards as LNG production ramps up.
Exchange rate and commodity prices and volumes – royalties estimates
Estimates of mining royalties are sensitive to movements in the A$-US$ exchange rate and commodity prices and volumes. Contracts for the supply of commodities are generally written in US dollars. Accordingly, a change in the exchange rate impacts on the Australian dollar price of commodities and therefore expected royalties collections.
Coal
For each one cent movement in the A$-US$ exchange rate, the impact on royalty revenue would be approximately $30 million in 2015-16.
A 1% variation in export coking and thermal coal volumes would lead to a change in royalty revenue of approximately $15 million.
A 1% variation in the average price of export coal would lead to a change in royalty revenue of approximately $25 million.
193
Budget Strategy and Outlook 2015-16
Parameters influencing Australian Government GST payments to Queensland
The Queensland Budget incorporates estimates of GST revenue grants to Queensland based on Australian Government estimates of national GST collections and Queensland Treasury assumptions of Queensland’s share. The estimates of collections are primarily determined by the value of consumption subject to GST.
Since the Australian Government payments are based on the amount actually collected, it is Queensland’s Budget that bears the risks of fluctuations in GST collections. As with all other tax estimates, there is a risk of lower collections than estimated if economic growth and consumption are weaker than expected.
Due to the complexities associated with the GST base, the information provided in the Australian Government Budget Papers is not sufficient to prepare indicative forecasts of the sensitivity of GST estimates to key variables.
Sensitivity of expenditure estimates and expenditure risks
Public sector wage costs
Salaries and wages form a large proportion of General Government Sector operating expenses. Increases in salaries and wages are negotiated through enterprise bargaining agreements.
The 2015-16 Budget and forward estimates includes funding for wage increases as per existing agreements and reflect the Government’s wages policy where outcomes are yet to be finalised.
A general 1% increase in wage outcomes in a particular year would increase expenses by around $200 million in that year. The impact would compound and be much larger in the later years.
Interest rates
The General Government Sector has a total debt servicing cost estimated at $2.1 billion in 2015-16.
The current average duration of General Government Sector debt is around five years. The majority of General Government Sector debt is held under fixed interest rates and therefore the impact of interest rate variations on debt servicing costs in 2015-16 would be relatively modest, with the impact occurring progressively across the forward estimates.
Actuarial estimates of superannuation and long service leave
Liabilities for superannuation and long service leave are estimated by the State Actuary with reference to, among other things, assumed rates of investment returns, salary growth, inflation and discount rate. These liabilities are therefore subject to changes in these parameters.
Similarly, the long service leave liabilities are subject to the risk that the actual rates of employee retention will vary from those assumed in the liability calculation.
194
Budget Strategy and Outlook 2015-16
While these impacts have been estimated and allowances made in the Budget and forward estimates to accommodate them, the actual outcome may differ from the estimates calculated for the Budget.
Demographic and demand based risks
Unforeseen changes in the size, location and composition of Queensland’s population can impact on the demand for goods and services and therefore on the cost of maintaining existing policies. This is particularly evident in the health, education, community services and criminal justice sectors.
State government expenditure is often more closely associated with socio-demographic factors, such as the number of school age children or the number of elderly residents, than with economic activity. Such changes are likely to impact significantly in the medium term.
For this reason, the composition, size and location of the State’s population are more significant in projecting the State’s expenditure needs across the forward estimates period than for the current or budget year.
195
Budget Strategy and Outlook 2015-16
| Appendix D: | Fiscal aggregates and indicators |
196
Budget Strategy and Outlook 2015-16
Table D.1 Key Fiscal Aggregates1
| | | | | | | | | | | | | | | | | | | | | | | | | | | | | | | | | | | | | | | | | | | | | | | | |
| | | 2007-08 | | | 2008-09 | | | 2009-10 | | | 2010-11 | | | 2011-12 | | | 2012-13 | | | 2013-14 | | | 2014-15 | | | 2015-16 | | | 2016-17 | | | 2017-18 | | | 2018-19 | |
| | | Actual | | | Actual | | | Actual | | | Actual | | | Actual | | | Actual | | | Actual | | | Est. Act. | | | Budget | | | Projection | | | Projection | | | Projection | |
| | | $ million | | | $ million | | | $ million | | | $ million | | | $ million | | | $ million | | | $ million | | | $ million | | | $ million | | | $ million | | | $ million | | | $ million | |
General Government | | | | | | | | | | | | | | | | | | | | | | | | | | | | | | | | | | | | | | | | | | | | | | | | |
Total revenue | | | 31,424 | | | | 37,078 | | | | 39,727 | | | | 42,013 | | | | 45,801 | | | | 41,755 | | | | 46,734 | | | | 49,578 | | | | 51,186 | | | | 54,010 | | | | 55,486 | | | | 55,748 | |
Tax revenue | | | 9,546 | | | | 8,866 | | | | 9,375 | | | | 9,981 | | | | 10,608 | | | | 10,937 | | | | 11,845 | | | | 12,707 | | | | 12,926 | | | | 13,607 | | | | 14,289 | | | | 15,007 | |
Total expenses | | | 33,030 | | | | 37,099 | | | | 39,599 | | | | 43,479 | | | | 46,028 | | | | 46,313 | | | | 46,115 | | | | 48,615 | | | | 49,973 | | | | 51,784 | | | | 53,354 | | | | 54,421 | |
Employee expenses | | | 13,175 | | | | 14,310 | | | | 15,566 | | | | 16,826 | | | | 18,250 | | | | 18,130 | | | | 17,817 | | | | 18,938 | | | | 19,937 | | | | 20,567 | | | | 21,135 | | | | 21,648 | |
Net operating balance | | | (1,606 | ) | | | (21 | ) | | | 128 | | | | (1,466 | ) | | | (226 | ) | | | (4,558 | ) | | | 619 | | | | 962 | | | | 1,213 | | | | 2,226 | | | | 2,132 | | | | 1,327 | |
Capital purchases | | | 5,725 | | | | 6,772 | | | | 8,959 | | | | 8,237 | | | | 7,971 | | | | 7,001 | | | | 6,322 | | | | 4,987 | | | | 5,374 | | | | 5,832 | | | | 6,125 | | | | 5,851 | |
Net capital purchases | | | 3,680 | | | | 4,349 | | | | 6,665 | | | | 5,583 | | | | 5,241 | | | | 3,389 | | | | 3,200 | | | | 1,858 | | | | 2,375 | | | | 3,193 | | | | 3,013 | | | | 2,428 | |
Fiscal balance | | | (5,286 | ) | | | (4,371 | ) | | | (6,537 | ) | | | (7,049 | ) | | | (5,467 | ) | | | (7,947 | ) | | | (2,581 | ) | | | (896 | ) | | | (1,162 | ) | | | (968 | ) | | | (881 | ) | | | (1,101 | ) |
Borrowings | | | 6,328 | | | | 10,308 | | | | 15,916 | | | | 24,593 | | | | 29,517 | | | | 37,878 | | | | 41,402 | | | | 43,268 | | | | 38,151 | | | | 38,818 | | | | 39,532 | | | | 40,724 | |
Net debt | | | (22,586 | ) | | | (19,251 | ) | | | (13,354 | ) | | | (9,542 | ) | | | (5,720 | ) | | | 2,399 | | | | 5,203 | | | | 6,056 | | | | 3,910 | | | | 4,405 | | | | 5,074 | | | | 6,307 | |
| | | | | | | | | | | | |
Non-Financial Public Sector | | | | | | | | | | | | | | | | | | | | | | | | | | | | | | | | | | | | | | | | | | | | | | | | |
Total revenue | | | 38,356 | | | | 43,749 | | | | 47,883 | | | | 49,040 | | | | 52,307 | | | | 49,181 | | | | 54,008 | | | | 55,412 | | | | 57,501 | | | | 60,710 | | | | 62,491 | | | | 62,883 | |
Capital purchases | | | 13,976 | | | | 15,101 | | | | 15,007 | | | | 13,306 | | | | 11,980 | | | | 10,774 | | | | 9,312 | | | | 8,170 | | | | 8,574 | | | | 9,000 | | | | 9,048 | | | | 8,740 | |
Borrowings | | | 30,856 | | | | 42,645 | | | | 51,713 | | | | 53,708 | | | | 61,542 | | | | 69,086 | | | | 72,716 | | | | 75,535 | | | | 74,113 | | | | 75,714 | | | | 77,119 | | | | 78,802 | |
Notes:
| 1. | Bracketed numbers represent negative amounts. |
197
Budget Strategy and Outlook 2015-16
Table D.2 Key Fiscal Indicators1
| | | | | | | | | | | | | | | | | | | | | | | | | | | | | | | | | | | | | | | | | | | | | | | | |
| | | 2007 -08 | | | 2008-09 | | | 2009-10 | | | 2010-11 | | | 2011-12 | | | 2012-13 | | | 2013-14 | | | 2014-15 | | | 2015-16 | | | 2016-17 | | | 2017-18 | | | 2018-19 | |
| | | Actual | | | Actual | | | Actual | | | Actual | | | Actual | | | Actual | | | Actual | | | Est. Act. | | | Budget | | | Projection | | | Projection | | | Projection | |
| | | % | | | % | | | % | | | % | | | % | | | % | | | % | | | % | | | % | | | % | | | % | | | % | |
General Government | | | | | | | | | | | | | | | | | | | | | | | | | | | | | | | | | | | | | | | | | | | | | | | | |
Revenue/GSP | | | 13.6 | | | | 14.4 | | | | 15.8 | | | | 15.7 | | | | 16.1 | | | | 14.5 | | | | 15.8 | | | | 16.0 | | | | 15.5 | | | | 15.2 | | | | 14.6 | | | | 13.8 | |
Tax/GSP | | | 4.1 | | | | 3.4 | | | | 3.7 | | | | 3.7 | | | | 3.7 | | | | 3.8 | | | | 4.0 | | | | 4.1 | | | | 3.9 | | | | 3.8 | | | | 3.8 | | | | 3.7 | |
Own source revenue/GSP | | | 6.9 | | | | 7.6 | | | | 7.8 | | | | 8.1 | | | | 8.1 | | | | 8.1 | | | | 8.4 | | | | 8.5 | | | | 8.1 | | | | 7.8 | | | | 7.5 | | | | 7.4 | |
Expenses/GSP | | | 14.3 | | | | 14.4 | | | | 15.8 | | | | 16.2 | | | | 16.1 | | | | 16.1 | | | | 15.6 | | | | 15.7 | | | | 15.1 | | | | 14.6 | | | | 14.1 | | | | 13.5 | |
Employee expenses/GSP | | | 5.7 | | | | 5.5 | | | | 6.2 | | | | 6.3 | | | | 6.4 | | | | 6.3 | | | | 6.0 | | | | 6.1 | | | | 6.0 | | | | 5.8 | | | | 5.6 | | | | 5.4 | |
Net operating balance/GSP | | | (0.7 | ) | | | (0.0 | ) | | | 0.1 | | | | (0.5 | ) | | | (0.1 | ) | | | (1.6 | ) | | | 0.2 | | | | 0.3 | | | | 0.4 | | | | 0.6 | | | | 0.6 | | | | 0.3 | |
Capital purchases/GSP | | | 2.5 | | | | 2.6 | | | | 3.6 | | | | 3.1 | | | | 2.8 | | | | 2.4 | | | | 2.1 | | | | 1.6 | | | | 1.6 | | | | 1.6 | | | | 1.6 | | | | 1.5 | |
Net cash inflows from operating activities/capital purchases | | | 6.9 | | | | 53.1 | | | | 37.8 | | | | 25.5 | | | | 35.4 | | | | (35.5 | ) | | | 40.9 | | | | 81.9 | | | | 83.5 | | | | 98.9 | | | | 93.8 | | | | 76.8 | |
Fiscal balance/GSP | | | (2.3 | ) | | | (1.7 | ) | | | (2.6 | ) | | | (2.6 | ) | | | (1.9 | ) | | | (2.8 | ) | | | (0.9 | ) | | | (0.3 | ) | | | (0.4 | ) | | | (0.3 | ) | | | (0.2 | ) | | | (0.3 | ) |
Borrowings/GSP | | | 2.7 | | | | 4.0 | | | | 6.3 | | | | 9.2 | | | | 10.4 | | | | 13.1 | | | | 14.0 | | | | 14.0 | | | | 11.5 | | | | 10.9 | | | | 10.4 | | | | 10.1 | |
Borrowings/revenue | | | 20.1 | | | | 27.8 | | | | 40.1 | | | | 58.5 | | | | 64.4 | | | | 90.7 | | | | 88.6 | | | | 87.3 | | | | 74.5 | | | | 71.9 | | | | 71.2 | | | | 73.0 | |
| | | | | | | | | | | | |
Revenue growth | | | (1.8 | ) | | | 18.0 | | | | 7.1 | | | | 5.8 | | | | 9.0 | | | | (8.8 | ) | | | 11.9 | | | | 6.1 | | | | 3.2 | | | | 5.5 | | | | 2.7 | | | | 0.5 | |
Taxgrowth | | | 12.5 | | | | (7.1 | ) | | | 5.7 | | | | 6.5 | | | | 6.3 | | | | 3.1 | | | | 8.3 | | | | 7.3 | | | | 1.7 | | | | 5.3 | | | | 5.0 | | | | 5.0 | |
Expenses growth | | | 9.9 | | | | 12.3 | | | | 6.7 | | | | 9.8 | | | | 5.9 | | | | 0.6 | | | | (0.4 | ) | | | 5.4 | | | | 2.8 | | | | 3.6 | | | | 3.0 | | | | 2.0 | |
Employee expenses growth | | | 12.3 | | | | 8.6 | | | | 8.8 | | | | 8.1 | | | | 8.5 | | | | (0.7 | ) | | | (1.7 | ) | | | 6.3 | | | | 5.3 | | | | 3.2 | | | | 2.8 | | | | 2.4 | |
| | | | | | | | | | | | |
Non-Financial Public Sector | | | | | | | | | | | | | | | | | | | | | | | | | | | | | | | | | | | | | | | | | | | | | | | | |
Capital purchases/GSP | | | 6.0 | | | | 5.8 | | | | 6.0 | | | | 5.0 | | | | 4.2 | | | | 3.7 | | | | 3.1 | | | | 2.6 | | | | 2.6 | | | | 2.5 | | | | 2.4 | | | | 2.2 | |
Borrowings/GSP | | | 13.3 | | | | 16.5 | | | | 20.6 | | | | 20.0 | | | | 21.6 | | | | 24.0 | | | | 24.5 | | | | 24.4 | | | | 22.4 | | | | 21.3 | | | | 20.4 | | | | 19.6 | |
Borrowings/revenue | | | 80.4 | | | | 97.5 | | | | 108.0 | | | | 109.5 | | | | 117.7 | | | | 140.5 | | | | 134.6 | | | | 136.3 | | | | 128.9 | | | | 124.7 | | | | 123.4 | | | | 125.3 | |
Net financial liabilities2/revenue | | | 75.4 | | | | 97.4 | | | | 112.5 | | | | 96.2 | | | | 115.6 | | | | 133.4 | | | | 125.9 | | | | 127.9 | | | | 125.2 | | | | 119.3 | | | | 116.6 | | | | 117.0 | |
Notes:
| 1. | Bracketed numbers represent negative amounts. |
| 2. | UPF definition, which is equal to total financial assets less investments in other public sector entities less total liabilities. |
198
Budget Strategy and Outlook 2015-16
199
Queensland Budget 2015-16 Budget Strategy and Outlook Budget Paper No. 2 www.budget.qld.gov.au
Queensland Budget 2015-16 Budget Strategy and Outlook Budget Paper No. 2
Queensland Budget 2015-16 Budget Strategy and Outlook Budget Paper No. 2 www.budget.qld.gov.au
Queensland Budget 2015-16
Capital Statement
Budget Paper No. 3
2015-16 Queensland Budget Papers
1. Budget Speech
2. Budget Strategy and Outlook
3. Capital Statement
4. Budget Measures
5. Service Delivery Statements
Appropriation Bills
Jobs Now, Jobs for the Future - Queensland Government employment plan
Budget Highlights
The suite of Budget Papers is similar to that published in 2014-15.
The Budget Papers are available online at www.budget.qld.gov.au
© Crown copyright
All rights reserved
Queensland Government 2015
Excerpts from this publication may be reproduced, with appropriate
acknowledgement, as permitted under the Copyright Act.
Capital Statement
Budget Paper No. 3
ISSN 1445-4890 (Print)
ISSN 1445-4904 (Online)

State Budget
2015-16
Capital Statement
Budget Paper No. 3
Contents
| | | | | | |
| 1 | | Overview | | | 1 | |
| | |
| 1.1 | | Introduction | | | 2 | |
| 1.2 | | Capital purchases | | | 2 | |
| 1.3 | | Capital grants | | | 7 | |
| | |
| 2 | | State capital program – planning and priorities | | | 10 | |
| | |
| 2.1 | | Introduction | | | 10 | |
| 2.2 | | Capital planning and prioritisation | | | 10 | |
| 2.3 | | Key projects | | | 13 | |
| 2.4 | | 2015-16 Highlights | | | 19 | |
| | |
| 3 | | Capital outlays by entity | | | 24 | |
| |
Aboriginal and Torres Strait Islander Partnerships | | | 24 | |
Agriculture and Fisheries | | | 25 | |
Communities, Child Safety and Disability Services | | | 28 | |
Education and Training | | | 31 | |
Electoral Commission of Queensland | | | 39 | |
Energy and Water Supply | | | 40 | |
Environment and Heritage Protection | | | 57 | |
Fire and Emergency Services | | | 59 | |
Queensland Health | | | 60 | |
Housing and Public Works | | | 69 | |
Infrastructure, Local Government and Planning | | | 74 | |
Justice and Attorney General | | | 78 | |
Legislative Assembly of Queensland | | | 83 | |
National Parks, Sport and Racing | | | 84 | |
Natural Resources and Mines | | | 88 | |
| | | | | | |
Office of the Governor | | | 89 | |
Office of the Ombudsman | | | 90 | |
Queensland Police Service | | | 91 | |
Premier and Cabinet | | | 92 | |
Public Safety Business Agency | | | 96 | |
Queensland Audit Office | | | 100 | |
Science, Information Technology and Innovation | | | 101 | |
State Development | | | 104 | |
Tourism, Major Events, Small Business and the Commonwealth Games | | | 105 | |
Transport and Main Roads | | | 107 | |
Queensland Treasury | | | 124 | |
| | | | | | |
| Appendix A: | | Entities included in capital outlays 2015-16 | | | 125 | |
| | |
| Appendix B: | | Key concepts and coverage | | | 128 | |
| | |
| Appendix C: | | Capital Purchases by Entity by Region 2015-16 | | | 129 | |
Capital Statement 2015-16
Features
| • | | The total capital program in 2015-16 is estimated to be $10.105 billion with capital purchases of $8.574 billion and capital grants estimated to be $1.531 billion. |
| • | | The 2015-16 capital program is focused on ensuring a consistent flow of works to support jobs and the economy and reduce the risk of backlogs emerging. To ensure Government assets continue to efficiently deliver key social services and support the development of the State, capital expenditure will focus on the needs of local communities and support local employment opportunities. |
| • | | In 2015-16, a State-wide schools and hospitals fund will deliver $500 million for new education and health projects across Queensland, providing much needed refurbishments and maintenance works to our schools and hospitals in support of local jobs. |
| • | | There will be capital expenditure of $3.931 billion for transport and main roads in 2015-16, including $175.9 million towards the Gateway Upgrade North, $172.1 million towards the Toowoomba Second Range Crossing and $113.1 million towards the duplication of the Bruce Highway (Cooroy to Curra) Section A. |
| • | | The energy and water sector will make capital purchases of $2.423 billion over a range of initiatives to support the Government to deliver cost effective, safe, secure and reliable energy and water supply. |
| • | | Capital purchases for the health portfolio are $1.303 billion in 2015-16, including $488.7 million to continue delivery of the Sunshine Coast University Hospital and $179 million to continue the statewide roll out of clinical and administrative support systems. A further $113.6 million will be invested to finalise a number of major projects including Logan Hospital, Lady Cilento Children’s Hospital, Centre for Children’s Health Research, Mackay Base Hospital, Mount Isa Health Campus and Gold Coast University Hospital. |
| • | | In 2015-16, $861.4 million is allocated towards capital purchases for Queensland Rail, including a $568.4 million network infrastructure program. |
| • | | The Government will make capital purchases of $427.3 million for schools in 2015-16, including $168.7 million to undertake new stages for four recently-opened schools and provide additional classrooms at existing schools in growth areas throughout the State. Construction of the $25 million Cairns Special School will commence in 2015-16, with the Government investing $7.1 million. |
| • | | $408.9 million is being provided to Local Government Authorities to undertake recovery, reconstruction and betterment projects following Tropical Cyclone Marcia and other recovery and reconstruction projects relating to natural disaster events of 2013 to 2015. |
| • | | Capital purchases in the Public Non-financial Corporations sector, predominately government owned corporations, constitute 40.0% of total investments. |
1
Capital Statement 2015-16
The capital statement provides an overview of the Queensland Government’s approach to capital planning and delivery and the capital program for 2015-16. Capital purchases in 2015-16 are expected to be $8.574 billion, with capital grants totalling $1.531 billion.
The 2015-16 capital program is focused on supporting economic growth and creating jobs across the State. Queensland Treasury estimates that capital works in 2015-16 will directly support approximately 27,500 full-time jobs.
The Government will invest $3.931 billion in capital expenditure on roads and transport infrastructure. There will be a continuation of the reconstruction effort following Tropical Cyclone Marcia and other natural disasters of 2013 to 2015. In addition, there will be significant investments in health, education and housing, to address population growth and improve the productivity and prosperity of the State.
Each year, part of the Queensland Government’s capital program is undertaken through the Public Non-financial Corporations (PNFC) sector, (that is, commercial entities of Government, including Government-owned corporations). For 2015-16, capital purchases by the PNFC sector will comprise 40.0% of the State capital program, reflecting major investments in port and rail infrastructure and in energy.
The Queensland Government invests in capital assets to support the services it provides to the community and to improve the productivity of the Queensland economy.
Capital purchases by purpose in 2015-16 are shown in Chart 1.1 below. Transport infrastructure continues to account for the largest share of purchases, followed by energy infrastructure and health, housing and community services.
2
Capital Statement 2015-16
| Chart 1.1 | Capital Purchases by Purpose, 2015-16 |
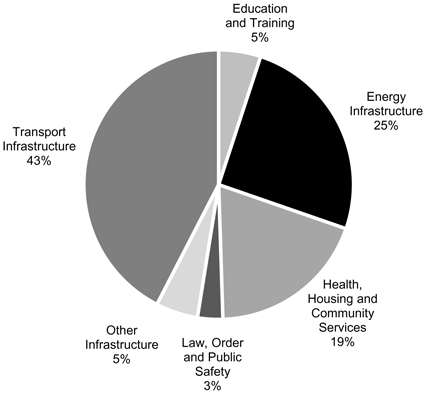
Table 1.1 shows capital purchases in 2015-16 by State Government entity. The transport and main roads, energy and health portfolios account for the majority of planned expenditure.
3
Capital Statement 2015-16
| Table 1.1 | Capital Purchases for 2015-16 by State Government Entity1,2 |
| | | | | | | | |
Entity | | 2014-15
Est. Actual
$‘000 | | | 2015-16
Budget
$‘000 | |
Aboriginal and Torres Strait Islander Partnerships | | | 3,290 | | | | 1,120 | |
Agriculture and Fisheries | | | 17,234 | | | | 25,963 | |
Communities, Child Safety and Disability Services | | | 17,745 | | | | 29,403 | |
Education and Training | | | 375,143 | | | | 474,229 | |
Energy and Water Supply | | | | | | | | |
Energy and Water Supply | | | 144 | | | | 2,117 | |
Energy Generation Sector | | | 254,389 | | | | 325,019 | |
Energy Transmission and Distribution | | | 2,291,853 | | | | 1,901,192 | |
Water Distribution and Supply | | | 166,068 | | | | 195,096 | |
Environment and Heritage Protection3 | | | 24,484 | | | | 11,671 | |
Fire and Emergency Services | | | 4,000 | | | | 8,367 | |
Housing and Public Works | | | 260,927 | | | | 381,511 | |
Infrastructure, Local Government and Planning | | | 44,042 | | | | 47,668 | |
Justice and Attorney-General | | | 104,155 | | | | 98,755 | |
Legislative Assembly of Queensland | | | 3,452 | | | | 8,397 | |
National Parks, Sport and Racing | | | 40,284 | | | | 69,341 | |
Natural Resources and Mines | | | 16,351 | | | | 21,789 | |
Premier and Cabinet | | | 5,086 | | | | 14,400 | |
Public Safety Business Agency4 | | | 137,133 | | | | 178,126 | |
Queensland Health | | | 1,174,843 | | | | 1,303,112 | |
Queensland Police Service | | | 22,848 | | | | 31,954 | |
Queensland Treasury | | | — | | | | 7,022 | |
Science, Information Technology and Innovation | | | 9,611 | | | | 24,713 | |
State Development | | | 9,742 | | | | 4,356 | |
Tourism, Major Events, Small Business and the Commonwealth Games | | | 14,899 | | | | 43,439 | |
Transport and Main Roads | | | | | | | | |
Transport and Main Roads | | | 2,515,264 | | | | 2,708,939 | |
Queensland Rail | | | 546,966 | | | | 861,445 | |
Port Authorities | | | 141,457 | | | | 148,796 | |
Other Agencies5 | | | 7,626 | | | | 6,421 | |
Other Adjustments6 | | | (39,223 | ) | | | (60,018 | ) |
Anticipated Capital Contingency Reserve7 | | | — | | | | (300,000 | ) |
Total Capital Purchases | | | 8,169,813 | | | | 8,574,343 | |
4
Capital Statement 2015-16
Notes:
| 1. | Includes all associated statutory bodies. |
| 2. | Numbers may not add due to rounding. |
| 3. | The decrease to 2015-16 primarily relates to the Investing in Our Environment and Investing to Protect our Koalas land acquisition programs nearing completion. |
| 4. | The Public Safety Business Agency will purchase any capital on behalf of Inspector General Emergency Management. |
| 5. | Includes the Electoral Commission of Queensland, Office of the Governor, Office of the Ombudsman and Queensland Audit Office, together with other Government entities with non-material capital programs. |
| 6. | Representing Inter-agency eliminations, movements in capital payable and receivable and other accounting adjustments to align with Uniform Presentation Framework Statements. |
| 7. | Contingency recognises that on a whole-of-Government basis, there is likely to be under spending, resulting in a carryover of capital allocations. |
Table 1.2 shows capital purchases by statistical area and region, while Chart 1.2 shows the geographical classification of regions for budget paper 3 purposes. Brisbane, Sunshine Coast and Darling Downs account for the majority of capital purchases by region. By statistical area, the Sunshine Coast, Fitzroy and Gold Coast areas have the highest levels of capital purchases.
| Table 1.2 | Capital Purchases by Statistical Area for 2015-161,2 |
| | | | | | | | | | | | | | |
Region | | Capital
Purchases
$‘000 | | | Statistical Area | | Capital
Purchases
$‘000 | |
Brisbane | | | 1,921,629 | | | | 301 | | | Brisbane East | | | 192,060 | |
| | | | | | | 302 | | | Brisbane North | | | 505,931 | |
| | | | | | | 303 | | | Brisbane South | | | 404,298 | |
| | | | | | | 304 | | | Brisbane West | | | 196,781 | |
| | | | | | | 305 | | | Inner Brisbane | | | 622,559 | |
Ipswich | | | 410,967 | | | | 310 | | | Ipswich | | | 410,967 | |
Wide Bay | | | 478,706 | | | | 319 | | | Wide Bay | | | 478,706 | |
Darling Downs | | | 1,022,107 | | | | 307 | | | Darling Downs Maranoa | | | 588,890 | |
| | | | | | | 317 | | | Toowoomba | | | 433,217 | |
Gold Coast | | | 899,884 | | | | 309 | | | Gold Coast | | | 708,109 | |
| | | | | | | 311 | | | Logan Beaudesert | | | 191,775 | |
Mackay | | | 310,340 | | | | 312 | | | Mackay | | | 310,340 | |
Outback | | | 594,808 | | | | 315 | | | Outback | | | 594,808 | |
Cairns | | | 330,168 | | | | 306 | | | Cairns | | | 330,168 | |
Fitzroy | | | 786,913 | | | | 308 | | | Fitzroy | | | 786,913 | |
Sunshine Coast | | | 1,375,499 | | | | 316 | | | Sunshine Coast | | | 968,555 | |
| | | | | | | 313 | | | Moreton Bay North | | | 157,477 | |
| | | | | | | 314 | | | Moreton Bay South | | | 249,467 | |
Townsville | | | 443,322 | | | | 318 | | | Townsville | | | 443,322 | |
Total Capital Purchases | | | | | | | | | | | | | 8,574,343 | |
Notes:
| 1. | Numbers may not add due to rounding. |
| 2. | The anticipated Capital Contingency Reserve and other adjustments have been spread across statistical areas proportionate to capital spends. |
5
Capital Statement 2015-16
| Chart 1.2 | Queensland Regions for Capital Statement Purposes |
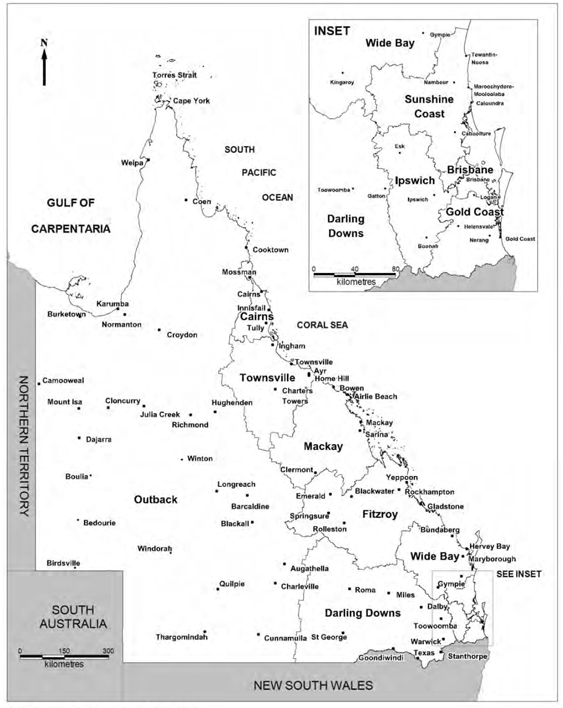
Note: Boundaries are based on ASGS 2011
6
Capital Statement 2015-16
The Queensland Government provides grants for capital purposes to a range of organisations and private individuals.
Capital grants to local governments, non-government organisations (NGOs) and individuals are illustrated in Chart 1.3 below. Capital grants are expected to be $1.531 billion in 2015-16, driven by capital grants to local governments (LG) for the continued rebuilding effort following Tropical Cyclone Marcia and other recovery and reconstruction projects relating to natural disaster events of 2013 to 2015.
| Chart 1.3 | Capital Grants by Purpose and Recipient |
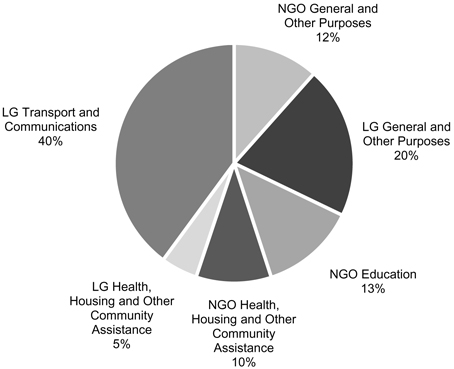
Table 1.3 shows the planned expenditure on capital grants by State Government entity for 2015-16. Queensland Reconstruction Authority has the highest level of capital grants, followed by the State Development and Transport and Main Roads portfolios.
7
Capital Statement 2015-16
| Table 1.3 | Expenditure on Capital Grants by State Government Entity for 2015-161,2 |
| | | | | | | | |
Entity | | 2014-15
Est. Actual
$‘000 | | | 2015-16
Budget
$‘000 | |
Aboriginal and Torres Strait Islander Partnerships | | | 30,077 | | | | 27,243 | |
Communities, Child Safety and Disability Services | | | 12,853 | | | | 17,477 | |
Education and Training | | | 111,794 | | | | 133,034 | |
Fire and Emergency Services | | | 1,449 | | | | 1,263 | |
Housing and Public Works | | | 37,572 | | | | 67,299 | |
Infrastructure, Local Government and Planning | | | | | | | | |
Infrastructure, Local Government and Planning | | | 93,921 | | | | 183,919 | |
Queensland Reconstruction Authority | | | 685,522 | | | | 408,912 | |
National Parks, Sport and Racing | | | 28,345 | | | | 84,209 | |
Premier and Cabinet | | | 7,573 | | | | 3,658 | |
Queensland Health | | | 100 | | | | 1,500 | |
Queensland Treasury | | | 4,989 | | | | — | |
Science, Information Technology and Innovation | | | 6,725 | | | | 23,855 | |
State Development | | | 6,063 | | | | 211,755 | |
Tourism, Major Events, Small Business and the Commonwealth Games | | | 18,161 | | | | 131,134 | |
Transport and Main Roads | | | 223,322 | | | | 211,452 | |
Other Adjustments3 | | | 279,637 | | | | 24,211 | |
Total Capital Grants | | | 1,548,671 | | | | 1,530,921 | |
Notes:
| 1. | Includes associated statutory bodies. |
| 2. | Numbers may not add due to rounding. |
| 3. | Includes assets transferred and other technical accounting adjustments. |
Table 1.4 shows expenditure on capital grants by statistical area. The Gold Coast has the highest level of capital grants by region, driven by expenditure on capital works in preparation for the 2018 Gold Coast Commonwealth Games.
8
Capital Statement 2015-16
| Table 1.4 | Capital Grants by Statistical Area for 2015-161,2 |
| | | | | | | | | | | | | | |
Region | | Grants
$‘000 | | | Statistical Area | | Grants
$‘000 | |
Brisbane | | | 244,438 | | | | 301 | | | Brisbane East | | | 40,408 | |
| | | | | | | 302 | | | Brisbane North | | | 37,243 | |
| | | | | | | 303 | | | Brisbane South | | | 63,781 | |
| | | | | | | 304 | | | Brisbane West | | | 29,824 | |
| | | | | | | 305 | | | Inner Brisbane | | | 73,182 | |
Ipswich | | | 73,082 | | | | 310 | | | Ipswich | | | 73,082 | |
Wide Bay | | | 93,839 | | | | 319 | | | Wide Bay | | | 93,839 | |
Darling Downs | | | 104,447 | | | | 307 | | | Darling Downs Maranoa | | | 39,811 | |
| | | | | | | 317 | | | Toowoomba | | | 64,636 | |
Gold Coast | | | 293,930 | | | | 309 | | | Gold Coast | | | 231,681 | |
| | | | | | | 311 | | | Logan Beaudesert | | | 62,249 | |
Mackay | | | 40,567 | | | | 312 | | | Mackay | | | 40,567 | |
Outback | | | 237,825 | | | | 315 | | | Outback | | | 237,825 | |
Cairns | | | 113,629 | | | | 306 | | | Cairns | | | 113,629 | |
Fitzroy | | | 105,984 | | | | 308 | | | Fitzroy | | | 105,984 | |
Sunshine Coast | | | 123,570 | | | | 316 | | | Sunshine Coast | | | 54,492 | |
| | | | | | | 313 | | | Moreton Bay North | | | 36,148 | |
| | | | | | | 314 | | | Moreton Bay South | | | 32,930 | |
Townsville | | | 99,610 | | | | 318 | | | Townsville | | | 99,610 | |
Total Capital Grants | | | | | | | | | | | | | 1,530,921 | |
Notes:
| 1. | Numbers may not add due to rounding. |
| 2. | Other adjustments referred to in Table 1.3 have been spread across statistical areas proportionate to allocation of Grants. |
9
Capital Statement 2015-16
| 2 | State capital program – planning and priorities |
The State Government has an important role in providing essential infrastructure and capital works to meet the State’s increasing service needs and to facilitate improved productivity and efficiency for the State’s industries.
The Queensland Government is committed to providing the necessary economic and social infrastructure to support the development of the State. Capital investment of the general government sector is designed to support these service delivery priorities. These priorities are influenced by population growth and the economic development priorities of the Government.
Over the past decade Queensland has been significantly impacted by natural disasters including droughts, flood and cyclones. This has resulted in significant capital expenditure being directed towards rebuilding and recovery activities.
The Government’s capital works program supports significant economic activity and jobs, particularly in the construction industry and sectors providing associated support services. For example, in 2015-16, the State’s capital works program is estimated at around $8.574 billion plus $1.531 billion in capital grants. Queensland Treasury estimates that the State’s 2015-16 capital works program will directly support approximately 27,500 full-time jobs.
| 2.2 | Capital planning and prioritisation |
The Queensland Government announced its intention to establish Building Queensland during the 2015 General State Election.
The implementation of Building Queensland as an independent statutory body in late 2015 will be pivotal in ensuring a whole-of-government perspective is brought to major infrastructure planning and investment in Queensland, supported by, and in collaboration with, government departments.
Building Queensland has been established administratively under the Department of Infrastructure, Local Government and Planning as an interim arrangement while it awaits the formal enactment of the Building Queensland Bill, which is anticipated to occur in late 2015.
Building Queensland provides independent expert advice to the government on infrastructure priorities. It helps ensure the State invests in value for money infrastructure projects that provide long term benefits to our community.
Building Queensland has specific functions in assisting the Government to deliver the infrastructure that Queensland needs, and these include to:
| • | | provide expert advice on productivity-lifting infrastructure priorities based on rigorous business cases including cost-benefit analysis and community need and benefits assessments. |
10
Capital Statement 2015-16
| • | | provide a consistent framework across Government for prioritising and assessing the costs and benefits of competing infrastructure projects. |
| • | | assist departments to develop business cases for infrastructure projects with an estimated cost of more than $50 million (but less than $100 million), or if the net present value of financial commitments entered into by the State, for the proposal, is estimated to be more than $50 million but less than $100 million. |
| • | | lead preparation of business cases for infrastructure projects with an estimated cost of $100 million or more, or if the net present value of financial commitments entered into by the State, for the proposal, is estimated to be $100 million or more. |
| • | | increase opportunities for leveraging Australian Government funding. |
| • | | consult globally with key stakeholders to develop a new best-practice framework for infrastructure delivery. |
The scope of Building Queensland’s responsibilities ensures a consistent approach to the assessment of projects, which will result in more effective identification, prioritisation and selection of the appropriate procurement and financing options.
Building Queensland will develop a pipeline of priority infrastructure projects to inform the Queensland Government’s consideration of current and future infrastructure needs and priorities.
| 2.2.2 | State Infrastructure Plan |
The Queensland Government has committed to develop a State Infrastructure Plan by early 2016 to improve the liveability and productivity of our State. This plan will be developed by the Department of Infrastructure, Local Government and Planning and will include input drawn from the independent advice of Building Queensland.
The State Infrastructure Plan will:
| • | | set the strategic direction and foster innovation in government’s planning, investment and delivery of infrastructure. |
| • | | identify the anticipated service needs and infrastructure investment opportunities for a prosperous Queensland. |
| • | | develop a sustainable and credible pipeline of investment, which will also enable sequencing by the construction and contracting industry. |
| • | | provide context to enable greater coordination between public and private infrastructure. |
The State Infrastructure Plan will provide a coordinated and integrated approach to infrastructure planning, prioritisation, funding and delivery. Based on robust planning and a focus on value for money, the plan will ensure better use of existing assets and better allocation of new investment.
11
Capital Statement 2015-16
| 2.2.3 | Capital delivery – private finance |
The Government is seeking innovative approaches in financing and delivery to optimise the State’s investment in, and provision of, productivity-lifting infrastructure.
Partnering with the private sector is key to strengthening Queensland’s infrastructure delivery capability. It allows Government to access innovation and expertise to deliver projects that balance benefits for the community and commercial outcomes for infrastructure investors.
With the establishment of Building Queensland, Queensland Treasury’s focus, in partnership with infrastructure delivery agencies, is on pursuing opportunities to deliver on the infrastructure needs of Queensland in partnership with the private sector. This will be achieved in many ways including through the assessment of innovative and emerging procurement, financing and delivery models, and engaging with the private sector to explore opportunities for better investment in public infrastructure and service delivery.
The specific functions of Queensland Treasury are to:
| • | | manage the procurement of all privately financed major public infrastructure and service projects. |
| • | | provide governance oversight to the delivery of privately financed major public infrastructure and service projects by agencies, including the management of restructures and major variations to existing arrangements, to ensure achievement of contracted value for money outcomes. |
| • | | provide commercial advice to the Government in relation to infrastructure projects, including potential innovative financing options and procurement models, to find ways to partner with the private sector to deliver the infrastructure identified in the State Infrastructure Plan. |
| • | | provide a ‘one-stop shop’ for private sector proponents seeking to submit market-led proposals for infrastructure projects. |
| • | | manage the State’s Project Assessment Framework (PAF) and Market-Led Proposals Guidelines. |
Queensland Treasury’s responsibilities ensure a consistent approach to the assessment of projects, selection of the appropriate procurement and financing options. This supports the establishment of a pipeline of privately financed projects and ensures consistency of dealings with the private sector on government projects.
Queensland Treasury will work closely with Building Queensland in the early assessment and business case development stages of projects to assess opportunities for private financing and innovative private sector engagement in infrastructure proposals.
The PAF provides a rigorous approach to ensuring the Queensland community receives maximum benefit from the Government’s investments by assessing significant projects over their lifecycle to ensure value for money in delivery.
However, it is important that the Government’s ability to consider innovative ways to fund this infrastructure is not constrained and can also leverage private sector capacity in the State to deliver productivity-lifting infrastructure.
12
Capital Statement 2015-16
The Queensland Government has recently completed a review of the State’s PAF. As part of the review, dedicated guidelines for the assessment of market-led proposals were developed. The review also included the addition of a staged process for assessing market-led proposals to provide greater detail on the Government’s processes, reduce costs for proponents and greater clarity on how the proposals can meet the criteria required for the issuing of an exclusive mandate.
Creation of a central portal for the submission of proposals and a renewed focus on the balancing of project risks and/or costs against benefits are further additions to the revised Market Led Proposals Guidelines. These outcomes will achieve improved outcomes for Government and industry.
This section provides an overview of key projects by scope.
Townsville Sports Stadium
The Queensland Government is undertaking a business case on the options for the development of a Stadium or Integrated Sports and Entertainment Centre in Townsville. The Department of State Development is leading the business case phase, with the findings expected to be reported back to the Government by late 2015.
Brisbane Inner City Rail
The Government supports an inner city rail solution consistent with the previous Cross River Rail capacity outcome as part of a broader vision to revitalise and transform rail services in Brisbane. Building Queensland will undertake an assessment of the previous Bus and Train and Cross River Rail projects to ensure the preferred public transport solution is affordable and meets the future needs of South East Queensland. Consideration of funding and financing options, including seeking funding support from the Australian Government, will be key aspects of this project assessment.
Gold Coast Light Rail
Gold Coast Light Rail Stage 2 is the proposed second stage of a world class public transport system for residents and visitors to the Gold Coast.
The Department of Transport and Main Roads is undertaking planning for an extension of the existing light rail system from Parklands station (Stage 1) to connect with the heavy rail network on the northern end of the Gold Coast. This connection would improve public transport network integration.
Consideration of funding and financing options, including seeking funding support from the Australian Government will be a key component of this project assessment.
13
Capital Statement 2015-16
State Netball Centre
The Budget provides $30 million over 2015-16 and 2016-17 towards the development of a state netball facility at the Queensland Sport and Athletics Centre, in partnership with Netball Queensland.
Central Queensland Special Reconstruction Funding
The Budget provides $40 million over 2015-16 and 2016-17 for a special assistance package for the revitalisation of the riverfront in Rockhampton and the Yeppoon foreshore.
Enhancing Regional Hospitals program
The Budget provides $20.6 million in 2015-16 to commence the $180 million Enhancing Regional Hospitals program. This funding will be used to undertake essential upgrades at Caloundra Hospital Service, Roma Hospital, Hervey Bay Emergency Department and Gladstone Emergency Department.
Sunshine Coast Rail Upgrade
The Caboolture to Landsborough Rail Upgrade Study looked at the need to upgrade and duplicate the rail line between these two stations on the North Coast Rail Line. The first section of the plan, the Caboolture to Beerburrum Rail Duplication project, was commissioned in April 2009.
The second section of this plan, the Beerburrum to Landsborough Track Duplication, will straighten and duplicate this 17 kilometre rail line and upgrade the Glasshouse Mountains and Beerwah rail stations.
North Queensland
The Queensland Government is considering bringing forward a number of proposals for economic infrastructure in North Queensland that may potentially be supported under the Australian Government’s $5 billion Northern Australia Infrastructure Fund. Queensland will also seek its fair share of $800 million in Commonwealth funding for Northern Australia projects.
These potential proposals include:
| • | | Nullinga Dam – could be constructed on the Walsh River in the Tablelands Regional Council area, south west of the Mareeba township, with storage volume of about 365,000 megalitres. This could provide a future urban water supply for Cairns and underpin long term domestic and commercial water requirements. |
| • | | Hann Highway Upgrade – an alternate route to the Bruce Highway, especially in times of flood impacts. This project could increase economic efficiency in the region and deliver economic value by delivering increasing productivity through an enhanced supply chain across sectors such as, but not limited to, mining, agribusiness, tourism and services delivery. |
| • | | Townsville Eastern Access Rail Corridor – to improve access for bulk freight traffic to the Port of Townsville and corresponding port expansion works at the Port of Townsville, optimise the Mount Isa to Townsville export supply chain and generate increased economic growth for the region. |
| • | | Galilee Rail – establishment of a new rail line to open up the Galilee Basin for export of high quality thermal coal to meet global demand for increased electricity production. |
14
Capital Statement 2015-16
The terms of this Fund and the participation by the Queensland Government remain subject to discussion with the Australian Government at this time.
Building Our Regions
The Building Our Regions program commences in 2015-16. It will be a targeted infrastructure program that delivers support for local government projects totalling $200 million over two years. There are four focused infrastructure initiatives:
| • | | Transport Infrastructure Development Scheme ($60 million over two years). |
| • | | Regional Capital Fund ($70 million over two years). |
| • | | Royalties for Resource Producing Communities Fund ($55 million over two years). |
| • | | Remote Communities Infrastructure Fund ($15 million over two years). |
Integrated Resort Developments
Integrated Resort Developments can support the growth of the tourism sector by contributing to increased international tourism and boosting the State’s economy through increased tourism and construction. Developments can support major events and reinvigorate key regional locations across the State for entertainment and recreation to locals and visitors.
An expression of interest for Integrated Resort Developments in regional Queensland was released in October 2013. Six bids were considered for the regional Integrated Resort Developments. From this field, Aquis at the Great Barrier Reef Pty Ltd (Aquis) and ASF Consortium Pty (Ltd) (ASF) were each selected for the two available major regional Integrated Resort Developments, with developments proposed in Cairns and on the Gold Coast.
The State released requests for proposals in Cairns and the Gold Coast in August 2014 and the State continues to be in discussions with Aquis and ASF in relation to their proposals.
Train Control System Upgrade
The Queensland Government is considering upgrading rail signalling systems across the South East Queensland passenger network to incorporate in-cab train on train collision and over-speed derailment protection.
Queen’s Wharf Brisbane
Queen’s Wharf Brisbane involves the redevelopment of State-owned land, generally located between the Brisbane River and George Street and between Alice and Queen Streets to create a hub that connects some key defining parts of the city - the Botanic Gardens, the Queen Street Mall, the Cultural Precinct, South Bank, the Parliamentary Precinct and the Brisbane River.
15
Capital Statement 2015-16
The area contains significant heritage buildings, a number of under-utilised government buildings as well as neglected riverfront land under the Riverside Expressway.
In December 2014, the final two proponents unveiled their design concepts for an integrated resort development in the Queen’s Wharf Brisbane precinct. The announcement of the preferred proponent is expected in the near future.
Herston Quarter Redevelopment
The Herston Quarter Redevelopment project is a proposed new development on a 4.8 hectare site, located two kilometres from Brisbane’s CBD and integrated in the world-class Herston Health Precinct. The Herston Quarter is available for redevelopment following the relocation of children’s health services from the Royal Children’s Hospital to the new Lady Cilento Children’s Hospital in late 2014. The Government has commenced consultation with key site stakeholders to ensure the health needs of the site are fully considered and, if proven, incorporated into the scope of the project.
The redevelopment planning process will deliver on the Government’s vision of establishing a vibrant and integrated mixed-use precinct that complements the existing world-class biomedical health and knowledge facilities situated within the Herston Health Precinct.
The Government is expected to announce shortlisted proponents as a priority, and it is expected that Request for Proposals will be called for by late 2015.
Toowoomba Second Range Crossing
The Toowoomba Second Range Crossing (TSRC) is a proposed bypass route to the north of Toowoomba, approximately 41 kilometres in length, running from the Warrego Highway at Helidon in the east, to the Gore Highway at Athol in the west via Charlton. The TSRC will provide safer and more efficient passenger and freight movements on this important part of the National Land Transport Network.
The State and Australian Governments have publicly announced a total funding commitment of $1.6 billion for the TSRC, with the State Government contributing $342 million. A multi-phase competitive bid process was held to select a preferred proponent to finance, build, operate and maintain the TSRC under an availability based PPP contract. The contract will provide for the design and construction of the TSRC, with 25 years of operations and maintenance post completion of construction.
The TSRC procurement process commenced in June 2014 with the release to the market of the Expression of Interest. In September 2014, the Request for Proposals process commenced with three shortlisted consortia, made up of national and international contractors, financiers and operators, preparing detailed proposals. These detailed proposals were submitted to Government in late-February 2015.
Nexus has been announced as the preferred tenderer for the project and the project is expected to be completed in late 2018.
16
Capital Statement 2015-16
Gateway Upgrade North
The Gateway Upgrade North project will see the widening of 11.3 kilometres of the Gateway Motorway from four to six lanes between Nudgee and Bracken Ridge.
The estimated $1.162 billion upgrade project is being funded by the Australian and Queensland Governments, with the State Government contributing $232.4 million to the project. Completion of the early works on the project is expected in 2015, weather permitting.
Lend Lease Engineering Pty Ltd has been identified to deliver the project, which is expected to be completed by late 2018.
New Generation Rollingstock
The New Generation Rollingstock (NGR) project involves purchasing 75, six car train sets to cater for the increase in passenger services as South East Queensland grows, and to replace an aging train fleet. The contract term with Bombardier NGR Consortium is for 32 years and includes the maintenance of the trains, as well as construction and maintenance of a modern, purpose built maintenance centre at Wulkuraka.
The Department of Transport and Main Roads is overseeing the delivery and management of the contract. Testing of the first completed train is expected to commence in December 2015, and all 75 trains are to be delivered and in service by December 2018.
Government Wireless Network (South East Queensland)
The Government Wireless Network (GWN) will deliver enhanced digital radio voice and narrowband data communications for Queensland’s public safety agencies in SEQ, with improved communications security, interoperability between public safety agencies, added functionality and a foundation to support effective front-line public safety services.
Following the procurement phase of the project, the Government awarded the contract to the Telstra Corporation to provide the services of the GWN under a 15-year managed services agreement, with a nominal value of $651.8 million (approximately $457.3 million net present cost). The Department of Science, Information Technology and Innovation is overseeing the delivery and management of the contract.
The GWN operated successfully during the G20 Leaders’ Summit in November 2014 and delivered a positive user experience for Public Safety Agencies.
The GWN will be activated throughout South East Queensland in a staged process during the second half of 2015, with the full rollout in South East Queensland expected to be completed by June 2016.
17
Capital Statement 2015-16
Gold Coast 2018 Commonwealth Games Infrastructure
Grocon has been appointed as the developer of the 2018 Commonwealth Games Athletes Village. After the Games, the development will form part of the Gold Coast Health and Knowledge Precinct. Early site works commenced in August 2014 and construction is scheduled to commence in late 2015.
The construction of the Village is one of the most significant urban renewal projects on the Gold Coast and one of the most important projects for the Commonwealth Games.
The Department of Tourism, Major Events, Small Business and the Commonwealth Games in 2015-16 will fund construction of the following Gold Coast 2018 Commonwealth Games venues:
| • | | $83.5 million for the Carrara Precinct including the Carrara Sport and Leisure Centre and Carrara Indoor Stadium. |
| • | | $39.5 million for the Queensland State Velodrome. |
| • | | $30.8 million for the Coomera Sports and Leisure Centre. |
| • | | $5.1 million for the Gold Coast Hockey Centre. |
| • | | $5.1 million for the Runaway Bay Sports Centre. |
| • | | $3.7 million towards the Belmont Shooting Centre. |
| • | | $2 million for the Runaway Bay Super Sports Centre. |
| • | | $1.3 million for the Broadbeach Bowls Club. |
| • | | $1.2 million for the Nerang Bike Trails. |
| • | | $330,000 for the Gold Coast Aquatic Centre. |
18
Capital Statement 2015-16
This section provides an overview of major capital projects by agency.
| 2.4.1 | Education and Training |
The Department of Education and Training will make capital purchases of $439.2 million in 2015-16. This includes $427.3 million for schools and $11.9 million for early childhood education. The department will make capital grant payments of $133 million to other organisations.
Highlights of the department’s capital program include:
| • | | $161.6 million to undertake new stages for four recently-opened schools and provide additional classrooms at existing schools in growth areas across the State. |
| • | | $133 million in capital grants including $112.7 million in grants to non-State schools and $10.3 million in grants for early childhood education and care. |
| • | | $10 million as part of $90 million over four years for the construction of a new primary school in north-west Townsville and master planning works for a new high school in Townsville. |
| • | | $35.3 million to replace and enhance facilities at existing schools. |
| • | | $23 million to continue the delivery of the Australian Government Trade Training Centres in Schools Program. |
| • | | $7.1 million to commence construction for the new Cairns Special School as part of the 2015-16 election commitment of $25 million. |
Generation
The liquefied natural gas (LNG) industry is changing the Queensland energy market.
The demand outlook, and consequently the supply demand balance, is forecast to improve in 2015-16 and out to 2018-19 with LNG plants on Curtis Island progressively commencing operation. LNG-related electricity consumption is forecast to increase from 250 gigawatt hours in 2013-14 to 8,350 gigawatt hours in 2018-19. This will boost Queensland’s electricity demand by approximately 15 per cent.
CS Energy Limited and Stanwell Corporation Limited will spend $325 million in 2015-16 on the maintenance of existing plant and supporting operations. Their focus will remain on the efficient, reliable and safe operation of their existing plant and equipment.
Networks
There are three network energy government-owned corporations in Queensland.
Ergon Energy and Energex own and operate the electricity distribution networks in regional Queensland and in south east Queensland respectively.
19
Capital Statement 2015-16
Powerlink owns and operates the transmission network which connects the different states within the National Electricity Market and transports electricity to the networks.
All three of these network businesses are regulated by the Australian Energy Regulator (AER) under a revenue cap arrangement which applies for the five year determination period. This determines how much revenue these businesses can recover by charging customers through their electricity bills.
Powerlink’s current determination commenced in 2012-13 and concludes in 2016-17. For Energex and Ergon Energy, their new five year regulatory period commenced on 1 July 2015 and will have an immediate effect on their revenue. In April 2015, the AER released its preliminary revenue determination for 2015-16 to 2019-20. Due to reduced energy demand, efficiency programs within these businesses and the cost of capital reducing significantly, Energex and Ergon have received significant reductions in their allowable revenue from the AER.
Energex, Ergon and Powerlink are all giving significant consideration to their future roles in the energy market. As technology continues to advance, consumers will change the way they consume energy and the businesses will need to change their business model to reflect this.
Capital programs have been closely examined to ensure expenditure is prudent. Budgeted capital expenditure in 2015-16 of $1.901 billion will continue the provision of a reliable transmission and distribution network. In the face of continued softening in electricity demand forecasts in Queensland, capital expenditure on the electricity network is expected to remain moderate over the coming years.
| 2.4.3 | Gold Coast 2018 Commonwealth Games Infrastructure |
In 2015-16, the total capital program for the Gold Coast 2018 Commonwealth Games is forecast to be $174.6 million including capital grants.
The construction of the Athletes’ Village is one of the most significant urban renewal projects on the Gold Coast. The 2015-16 Budget provides $19 million for continuing works on the Athletes’ Village. Early site works commenced in August 2014.
Further highlights of the 2015-16 Gold Coast 2018 Commonwealth Games infrastructure program include the following projects jointly funded by the Queensland and Australian Governments:
| • | | $83.5 million towards the Carrara Precinct including the Carrara Sport and Leisure Centre and Carrara Indoor Stadium at a total cost of $123 million (including a local Government contribution). |
| • | | $39.5 million to the Queensland State Velodrome at a total cost of $58 million. |
| • | | $30.8 million towards the Coomera Indoor Sports Centre at a total cost of $39.9 million. |
In 2015-16, the Government continues its significant investment in health infrastructure (including Queensland Health, Hospital and Health Services, Queensland Ambulance Services and the Council of the Queensland Institute of Medical Research), with $1.303 billion in capital purchases. The focus for 2015-16 includes investment in hospitals, hospital redevelopments and expansions, ambulance stations and vehicles, research and scientific services, and investment in information and health technology to support the delivery of health services.
20
Capital Statement 2015-16
Highlights of the 2015-16 capital program for Queensland Health include:
| • | | $488.7 million to continue delivery of the Sunshine Coast Public University Hospital and its Skills, Academic and Research Centre as a PPP, at a total estimated cost of $1.872 billion. |
| • | | $40 million to complete the redevelopment of the $466.3 million Cairns Hospital. The project on commissioning will deliver an additional 168 beds, an ambulatory cancer care centre, new pathology facilities and new low-risk Family Birth Centre. This additional capacity will enable Cairns Hospital to increase services including surgical, intensive care, birthing services, rehabilitation and mental health. |
| • | | $113.6 million to finalise a number of major projects where construction is largely complete, including: Logan Hospital, Lady Cilento Children’s Hospital, Centre for Children’s Health Research, Mackay Base Hospital, Mount Isa Health Campus and Gold Coast University Hospital. |
| • | | $179 million will be invested in the continued statewide roll out of clinical and administrative support systems and technology equipment replacement to ensure the right information and technology is available to assist and support the provision of better services for patients and better health care in the community. |
| • | | $20 million in 2015-16 to commence the $180 million Enhancing Regional Hospitals program. This funding will be used to undertake essential upgrades to Caloundra Hospital Service, Roma Hospital, Hervey Bay Emergency Department and Gladstone Emergency Department. |
| 2.4.5 | Transport and Main Roads |
In 2015-16, the total capital program for the Transport and Main Roads portfolio is forecast to be $3.931 billion including total capital grants of $221.5 million. The Transport and Main Roads portfolio includes the Department of Transport and Main Roads, Roadtek, Queensland Rail, Gold Coast Waterways Authority, Far North Queensland Ports Corporation Limited, Gladstone Ports Corporation Limited, North Queensland Bulk Ports Corporation Limited and the Port of Townsville Limited.
21
Capital Statement 2015-16
Roads and public transport infrastructure
Highlights of the 2015-16 roads and public transport infrastructure program include:
| • | | $175.9 million towards the Gateway Motorway North to six lanes, between Nudgee and Bracken Ridge, at a total cost of $1.162 billion, which is jointly Australian and Queensland Government funded. |
| • | | $172.1 million towards the Toowoomba Second Range Crossing project, a bypass route to the north of Toowoomba, approximately 41 kilometres in length, running from the Warrego Highway at Helidon to the Gore Highway at Athol, via Charlton, at a total cost of $1.606 billion which is jointly funded by the Australian and State Governments. |
| • | | $113.1 million towards the duplication of the Bruce Highway (Cooroy to Curra) from Cooroy Southern Interchange to Sankeys Road (Section A), at a total cost of $490 million, which is jointly funded by the Australian and State Governments. |
| • | | Approximately $40 million has been allocated for the Western Roads Upgrade Program. This funding will be provided over two years for roads in western Queensland that require widening, rehabilitation and sealing works. For example, $5 million will be provided to widen and seal the Gulf Developmental Road between Croydon and Georgetown. |
| • | | $30 million has been provided for the Government’s commitment to continue the Marine Infrastructure Fund. These funds will be used for public boat ramps, pontoons, jetties, floating walkways, barge ramps and wharves throughout Queensland. The Department of Transport and Main Roads will work in partnership with local government, port authorities and private developers to deliver new and upgraded recreational boating infrastructure for Queenslanders. |
Rail and Ports
The Rail and Ports 2015-16 capital program totals capital purchases of $1.010 billion. Highlights of this program include:
| • | | Queensland Rail – as part of a $568.4 million network infrastructure program, $72.6 million will be provided for the continuing construction of the third track on the existing network between Lawnton and Petrie Stations, $63.4 million will be provided to continue duplication of the Gold Coast line between Coomera and Helensvale Stations and $55.7 million to continue the Toowoomba Range Stabilisation project. |
| • | | $78.1 million for the New Generation Rollingstock project, to construct a new maintenance facility and new rollingstock to meet the growing demand for rail services in South East Queensland. |
| • | | $226.5 million is provided to deliver new and upgrade existing rollingstock, including $51.6 million to construct stabling facilities to accommodate the New Generation Rollingstock and $26.2 million towards upgrading existing infrastructure to support the Wulkuraka Maintenance Centre. |
| • | | Far North Queensland Ports Corporation Limited - as part of a $7.2 million capital program, $1.6 million will be provided to continue the extension of the Cairns boardwalk and foreshore promenade. |
22
Capital Statement 2015-16
| • | | Gladstone Ports Corporation Limited - as part of an ongoing $98.1 million capital program, $57.5 million is allocated towards continuing upgrades at the RG Tanna Coal Terminal at the Port of Gladstone and $11 million towards the monitoring program for the Great Barrier Reef Marine Park. |
| • | | Port of Townsville Limited - as part of an $29.8 million capital program, $10.2 million is allocated towards the redevelopment of the Berth 4 facility. |
23
Capital Statement 2015-16
| 3 | Capital outlays by entity |
ABORIGINAL AND TORRES STRAIT ISLANDER PARTNERSHIPS
Department of Aboriginal and Torres Strait Islander Partnerships
Total capital purchases for the Department of Aboriginal and Torres Strait Islander Partnerships are estimated to be $1.1 million in 2015-16. Total capital grants for the department are estimated to be $27.2 million in 2015-16.
Program Highlights (Property, Plant and Equipment)
| • | | $505,000 for plant and equipment replacement in the Retail Stores. |
| • | | $615,000 for other property, plant and equipment. |
Program Highlights (Capital Grants)
| • | | $27.2 million for programs to develop land infrastructure and subdivisions for social housing in remote and discrete Indigenous communities. |
| | | | | | | | | | | | | | | | | | |
| Aboriginal and Torres Strait Islander Partnerships | |
Project | | Statistical
Area | | Total
Estimated
Cost
$‘000 | | | Expenditure
to
30-06-15
$‘000 | | | Budget
2015-16
$‘000 | | | Post
2015-16
$‘000 | |
DEPARTMENT OF ABORIGINAL AND TORRES STRAIT ISLANDER PARTNERSHIPS | | | | | | | | | | | | | | | | | | |
| | | | | |
Property, Plant and Equipment | | | | | | | | | | | | | | | | | | |
Retail Stores property, plant and equipment replacement | | Various | | | | | | | | | | | 505 | | | | Ongoing | |
Other property, plant and equipment | | Various | | | | | | | | | | | 615 | | | | Ongoing | |
| | | | | | | | | | | | | | | | | | |
Total Property, Plant and Equipment | | | | | | | | | | | | | 1,120 | | | | | |
| | | | | | | | | | | | | | | | | | |
| | | | | |
Capital Grants | | | | | | | | | | | | | | | | | | |
Indigenous land and infrastructure programs | | Various | | | 87,671 | | | | 60,428 | | | | 27,243 | | | | | |
| | | | | | | | | | | | | | | | | | |
Total Capital Grants | | | | | | | | | | | | | 27,243 | | | | | |
| | | | | | | | | | | | | | | | | | |
| | | | | | | | | | | | | | | | | | |
| | | | | | | | | | | | | | | | | | |
TOTAL ABORIGINAL AND TORRES STRAIT ISLANDER PARTNERSHIPS (PPE) | | | | | | | | | | | | | 1,120 | | | | | |
| | | | | | | | | | | | | | | | | | |
| | | | | | | | | | | | | | | | | | |
| | | | | | | | | | | | | | | | | | |
TOTAL ABORIGINAL AND TORRES STRAIT ISLANDER PARTNERSHIPS (CG) | | | | | | | | | | | | | 27,243 | | | | | |
| | | | | | | | | | | | | | | | | | |
24
Capital Statement 2015-16
AGRICULTURE AND FISHERIES
Total capital purchases for the Agriculture and Fisheries portfolio including statutory bodies reporting to the Minister for Agriculture and Fisheries are $26 million for 2015-16.
Department of Agriculture and Fisheries
Capital purchases for the Department of Agriculture and Fisheries (DAF) in 2015-16 are $19.3 million. The department’s capital program is focused on developing and upgrading research facilities to deliver outcomes for agriculture, biosecurity, fisheries and forestry.
DAF has facilities located throughout rural and regional Queensland. These require minor works, mechanical items and plant and equipment upgrades to keep them operating effectively.
Program Highlights (Property, Plant and Equipment)
| • | | $4.3 million is allocated to continue upgrades to the department’s research and operational facilities through the Research Facilities Development, Scientific Equipment and Minor Works programs. |
| • | | $2.8 million is allocated for the upgrade and refurbishment of existing facilities to enhance service delivery and improve operational efficiencies. |
| • | | $1.7 million is allocated to provide new and replacement heavy plant and equipment including trucks, tractors and other machinery. |
| • | | $1.3 million is allocated for upgrades and additional infrastructure at the Hermitage Research Facility to bring the facility to current industry standard for the delivery of quality grains research outcomes. |
| • | | $1.1 million is allocated for the enhancement of existing biosecurity laboratory facilities. |
| • | | $0.8 million is allocated to continue the replacement of vessels and marine equipment for fisheries research and regulatory functions. |
Queensland Agricultural Training Colleges
Capital purchases for the Queensland Agricultural Training Colleges are $3.4 million in 2015-16. The capital program is primarily focused on upgrading infrastructure at the Longreach Pastoral College and the Emerald Agricultural College to meet relevant legislative standards. There is also a smaller allocation to support various business growth initiatives.
25
Capital Statement 2015-16
QRAA
QRAA’s 2015-16 capital expenditure of $3.3 million will be used primarily for computer hardware and software upgrades.
| | | | | | | | | | | | | | | | | | |
| Agriculture and Fisheries | |
Project | | Statistical
Area | | Total
Estimated
Cost
$‘000 | | | Expenditure
to
30-06-15
$‘000 | | | Budget
2015-16
$‘000 | | | Post
2015-16
$‘000 | |
DEPARTMENT OF AGRICULTURE AND FISHERIES | | | | | | | | | | | | | |
| | | | | |
Property, Plant and Equipment | | | | | | | | | | | | | | | | | | |
Hermitage Research Facility Upgrade | | 307 | | | 2,000 | | | | 13 | | | | 1,300 | | | | 687 | |
Upgrade and Refurbishment of Existing Facilities | | Various | | | 7,350 | | | | 36 | | | | 2,800 | | | | 4,514 | |
Spyglass Research Facility Dam Construction | | 318 | | | 650 | | | | | | | | 650 | | | | | |
Biosecurity Laboratory Upgrades | | 303 | | | 1,100 | | | | | | | | 1,100 | | | | | |
Computer Equipment | | Various | | | | | | | | | | | 4,965 | | | | Ongoing | |
Scientific Equipment | | Various | | | | | | | | | | | 1,500 | | | | Ongoing | |
Minor Works | | Various | | | | | | | | | | | 1,500 | | | | Ongoing | |
Heavy Plant and Equipment | | Various | | | | | | | | | | | 1,700 | | | | Ongoing | |
Research Facilities Development | | Various | | | | | | | | | | | 1,300 | | | | Ongoing | |
Vessels and Marine Equipment | | Various | | | | | | | | | | | 800 | | | | Ongoing | |
Software Purchases and Development | | 305 | | | | | | | | | | | 500 | | | | Ongoing | |
Biosecurity Information Management System | | 305 | | | 508 | | | | 208 | | | | 300 | | | | | |
Livestock Purchases | | Various | | | | | | | | | | | 450 | | | | Ongoing | |
Other Property Plant and Equipment | | Various | | | | | | | | | | | 391 | | | | Ongoing | |
| | | | | | | | | | | | | | | | | | |
Total Property, Plant and Equipment | | | | | | | | | | | | | 19,256 | | | | | |
| | | | | | | | | | | | | | | | | | |
| | | | | |
QUEENSLAND AGRICULTURAL TRAINING COLLEGES | | | | | | | | | | | | | | | | | | |
| | | | | |
Property, Plant and Equipment | | | | | | | | | | | | | | | | | | |
Longreach Pastoral College Buildings and Infrastructure upgrades | | 315 | | | 1,330 | | | | | | | | 1,330 | | | | | |
Emerald Agricultural College Buildings and Infrastructure | | 308 | | | 1,415 | | | | | | | | 1,415 | | | | | |
Plant and Equipment (including IT upgrades) | | 315 | | | 425 | | | | | | | | 425 | | | | | |
26
Capital Statement 2015-16
| | | | | | | | | | | | | | | | |
| Agriculture and Fisheries | |
Project | | Statistical
Area | | Total
Estimated
Cost
$‘000 | | | Expenditure
to
30-06-15
$‘000 | | Budget
2015-16
$‘000 | | | Post
2015-16
$‘000 | |
Major Plant and Equipment Replacements | | 315 | | | 230 | | | | | | 230 | | | | | |
| | | | | | | | | | | | | | | | |
Total Property, Plant and Equipment | | | | | | | | | | | 3,400 | | | | | |
| | | | | | | | | | | | | | | | |
| | | | | |
QRAA | | | | | | | | | | | | | | | | |
| | | | | |
Property, Plant and Equipment | | | | | | | | | | | | | | | | |
Computer Software | | 305 | | | 2,934 | | | | | | 2,934 | | | | | |
Other Plant & Equipment | | 305 | | | | | | | | | 373 | | | | Ongoing | |
| | | | | | | | | | | | | | | | |
Total Property, Plant and Equipment | | | | | | | | | | | 3,307 | | | | | |
| | | | | | | | | | | | | | | | |
| | | | | | | | | | | | | | | | |
| | | | | | | | | | | | | | | | |
TOTAL AGRICULTURE AND FISHERIES (PPE) | | | | | | | | | | | 25,963 | | | | | |
| | | | | | | | | | | | | | | | |
27
Capital Statement 2015-16
COMMUNITIES, CHILD SAFETY AND DISABILITY SERVICES
Department of Communities, Child Safety and Disability Services
The capital works program for the Department of Communities, Child Safety and Disability Services is $29.4 million in 2015-16. Total capital grants for the portfolio will be $17.5 million. These funds provide for integrated community services and strengthen and protect the well-being of Queenslanders, particularly those who are vulnerable and most in need.
Program Highlights (Property, Plant and Equipment)
| • | | $4 million to provide two 72-hour crisis shelters in Brisbane and Townsville for women and children escaping violence at a total cost of $8 million over two years. |
| • | | $9 million to continue infrastructure upgrades and construct purpose built accommodation as part of a targeted response for people with an intellectual and/or cognitive disability who exhibit severely challenging behaviours. |
| • | | $2 million to establish a maintenance and upgrade program for multipurpose and neighbourhood centres at a total cost of $12.2 million over four years. |
| • | | $1 million to continue construction activities and establish facilities to support the Safe Havens Program. This program provides culturally appropriate services to respond to the safety needs of children, young people and their families experiencing or witnessing domestic and family violence in the communities of Mornington Island, Coen, Cherbourg and Palm Island. |
| • | | $4.4 million has been allocated for enhancements to various existing information systems including the Integrated Client Management System, Disability Business Information System, Grants Management System and Records Management System. These enhancements will provide additional system functionality, information security, improved service delivery and business efficiencies. |
| • | | $805,000 for remote Indigenous service delivery to establish child safe houses in the communities at Torres Strait and Lockhart River. |
Program Highlights (Capital Grants)
| • | | $6.6 million to continue the Elderly Parent Carer Innovation Trial which is aimed at assisting elderly parent carers to secure accommodation for their adult son or daughter with a disability when they can no longer care for them. This program will invest in projects to create new living arrangements that include use of accessible housing designs and assistive technologies to enable adults with disability to live a rich and valued life in their communities. |
28
Capital Statement 2015-16
| • | | $6 million to build or purchase supported accommodation for people with disability living in inappropriate settings. |
| • | | $3.1 million to build or purchase suitable supported accommodation options for people with high and complex needs providing safe and sustainable long term accommodation in Cairns, Townsville, Wynnum and Banyo. |
| • | | $1.4 million for remote Indigenous communities in Coen and Bamaga to add to and upgrade safe haven service infrastructure and improve child safe house service facilities. |
| • | | $400,000 to upgrade residential care facilities in Biboohra. |
| | | | | | | | | | | | | | | | | | |
| Communities, Child Safety and Disability Services | |
Project | | Statistical
Area | | Total
Estimated
Cost
$‘000 | | | Expenditure
to
30-06-15
$‘000 | | | Budget
2015-16
$‘000 | | | Post
2015-16
$‘000 | |
DEPARTMENT OF COMMUNITIES, CHILD SAFETY AND DISABILITY SERVICES | | | | | | | | | | | | | | | | | | |
| | | | | |
Property, Plant and Equipment | | | | | | | | | | | | | | | | | | |
Child and Family Services | | | | | | | | | | | | | | | | | | |
Safe Havens | | 315 | | | 3,659 | | | | 326 | | | | 1,012 | | | | 2,321 | |
Services for Indigenous Communities | | 315 | | | 1,603 | | | | 798 | | | | 805 | | | | | |
Residential Care | | Various | | | | | | | | | | | 250 | | | | Ongoing | |
| | | | | | | | | | | | | | | | | | |
Sub-total Child and Family Services | | | | | | | | | | | | | 2,067 | | | | | |
| | | | | | | | | | | | | | | | | | |
| | | | | |
Disability Services | | | | | | | | | | | | | | | | | | |
Infrastructure Program | | Various | | | | | | | | | | | 8,959 | | | | Ongoing | |
| | | | | | | | | | | | | | | | | | |
Sub-total Disability Services | | | | | | | | | | | | | 8,959 | | | | | |
| | | | | | | | | | | | | | | | | | |
| | | | | |
Community Services | | | | | | | | | | | | | | | | | | |
Multipurpose and Neighbourhood Centres | | Various | | | 12,150 | | | | | | | | 1,950 | | | | 10,200 | |
Crisis Shelters | | Various | | | 8,000 | | | | | | | | 4,000 | | | | 4,000 | |
| | | | | | | | | | | | | | | | | | |
Sub-total Community Services | | | | | | | | | | | | | 5,950 | | | | | |
| | | | | | | | | | | | | | | | | | |
| | | | | |
Other Property Plant and Equipment | | | | | | | | | | | | | | | | | | |
Information Systems Enhancements | | Various | | | | | | | | | | | 4,415 | | | | Ongoing | |
Office Accommodation | | Various | | | | | | | | | | | 3,484 | | | | Ongoing | |
Other Property, Plant and Equipment | | Various | | | | | | | | | | | 4,528 | | | | Ongoing | |
| | | | | | | | | | | | | | | | | | |
Total Property, Plant and Equipment | | | | | | | | | | | | | 29,403 | | | | | |
| | | | | | | | | | | | | | | | | | |
29
Capital Statement 2015-16
| | | | | | | | | | | | | | | | | | |
| Communities, Child Safety and Disability Services | |
Project | | Statistical
Area | | Total
Estimated
Cost
$‘000 | | | Expenditure
to
30-06-15
$‘000 | | | Budget
2015-16
$‘000 | | | Post
2015-16
$‘000 | |
Capital Grants | | | | | | | | | | | | | | | | | | |
Child and Family Services | | | | | | | | | | | | | | | | | | |
Coen Safe Haven | | 315 | | | 1,424 | | | | 88 | | | | 1,336 | | | | | |
Residential Care Upgrades | | 315 | | | 400 | | | | | | | | 400 | | | | | |
Bamaga Child Safe House | | 315 | | | 56 | | | | | | | | 56 | | | | | |
| | | | | | | | | | | | | | | | | | |
Sub-total Child and Family Services | | | | | | | | | | | | | 1,792 | | | | | |
| | | | | | | | | | | | | | | | | | |
| | | | | |
Disability Services | | | | | | | | | | | | | | | | | | |
Elderly Parent Carer Innovation Trial | | Various | | | 16,944 | | | | 6,145 | | | | 6,585 | | | | 4,214 | |
Supported Accommodation for People with Disability Living in Inappropriate Settings | | Various | | | 6,600 | | | | 600 | | | | 6,000 | | | | | |
Supported Accommodation | | Various | | | 3,100 | | | | | | | | 3,100 | | | | | |
| | | | | | | | | | | | | | | | | | |
Sub-total Disability Services | | | | | | | | | | | | | 15,685 | | | | | |
| | | | | | | | | | | | | | | | | | |
| | | | | | | | | | | | | | | | | | |
| | | | | | | | | | | | | | | | | | |
Total Capital Grants | | | | | | | | | | | | | 17,477 | | | | | |
| | | | | | | | | | | | | | | | | | |
| | | | | | | | | | | | | | | | | | |
| | | | | | | | | | | | | | | | | | |
TOTAL COMMUNITIES, CHILD SAFETY AND DISABILITY SERVICES (PPE) | | | | | | | | | | | | | 29,403 | | | | | |
| | | | | | | | | | | | | | | | | | |
| | | | | | | | | | | | | | | | | | |
| | | | | | | | | | | | | | | | | | |
TOTAL COMMUNITIES, CHILD SAFETY AND DISABILITY SERVICES (CG) | | | | | | | | | | | | | 17,477 | | | | | |
| | | | | | | | | | | | | | | | | | |
30
Capital Statement 2015-16
EDUCATION AND TRAINING
Total capital purchases for the Education and Training portfolio (including the Department of Education and Training and related entities) are $474.2 million in 2015-16. Total capital grants for the portfolio are $133 million in 2015-16.
Department of Education and Training
The 2015-16 capital purchases of $439.2 million includes the capital works program of $386.8 million for the construction and refurbishment of educational facilities, Early Childhood Education and Care services, integrated Early Years Services and pre-prep outdoor learning environments. This includes $108.2 million in 2015-16 allocated to the $1.380 billion Queensland Schools Public Private Partnerships project for 10 new schools in South East Queensland.
Capital works planning targets Government priorities and needs through consideration of population growth and shifts, changes in educational needs and addressing high priority needs for student and staff health and safety.
Program Highlights (Property, Plant and Equipment)
| • | | $168.7 million to undertake new stages for four recently opened schools and provide additional classrooms at existing schools in growth areas throughout the State, including $7.1 million to commence construction for the new Cairns Special School. |
| • | | $10 million as part of the $90 million program over four years for the construction of a new primary school in north-west Townsville and master planning works for a new high school in Townsville. |
| • | | $8.7 million to continue the redevelopment of Brisbane State High School to introduce Year 7 as the first year of secondary schooling from 2015. |
| • | | $23 million to continue delivery of round five of the Australian Government Trades Skills Centres program. |
| • | | $12 million to undertake electrical upgrades and replace evaporative air-conditioning systems at Moranbah State High School, Moranbah State School, Moranbah East State School and Biloela State School. |
| • | | $35.3 million to replace and enhance facilities at existing schools. |
| • | | $4.8 million to continue refurbishment of existing Early Childhood Education and Care facilities. |
| • | | $4.1 million of $10 million total funding to commence construction of integrated Early Years Services at Gordonvale State School and Serviceton South State School, out of four sites identified. |
| • | | $1.9 million to commence enhancement of pre-prep outdoor learning environments. |
31
Capital Statement 2015-16
Program Highlights (Capital Grants)
| • | | $122.7 million is provided in 2015-16 to the non-State schooling sector. |
| • | | $10.4 million is provided for capital grants for early childhood education and care services. |
TAFE Queensland
The 2015-16 capital works program for TAFE Queensland provides $32.6 million to support, improve and innovate services and delivery, and enhance TAFE Queensland’s competitiveness.
Program Highlights (Property, Plant and Equipment)
| • | | $11.5 million will be invested in the acquisition or replacement of end of life equipment required to support training delivery. |
| • | | $4.1 million will be invested to finalise the implementation of a new student management system that will provide a streamlined enrolment experience for students, companies, agents and staff; improve system usability including the ability to do more online; and enable streamlined and standardised student management processes across TAFE Queensland. |
| • | | $7 million will be invested in the development of master product which will increase access through a wider variety of delivery modes, improve alignment of offerings to employment outcomes, and provide uniformity of product across all of TAFE Queensland’s delivery locations. |
Queensland Training Assets Management Authority
Program Highlights (Property, Plant and Equipment)
| • | | $2.5 million will be invested in the acquisition or replacement of building plant and associated site/building improvements to ensure safety and ongoing support of training activity on State-owned training sites. |
32
Capital Statement 2015-16
| | | | | | | | | | | | | | | | | | |
| Education and Training | |
Project | | Statistical
Area | | Total
Estimated
Cost
$‘000 | | | Expenditure
to
30-06-15
$‘000 | | | Budget
2015-16
$‘000 | | | Post
2015-16
$‘000 | |
DEPARTMENT OF EDUCATION AND TRAINING | | | | | | | | | | | | | | | | | | |
KEY TO ABBREVIATIONS | | | | | | | | | | | | | | | | | | |
CWP - Capital Works Program | | | | | | | | | | | | | | | | | | |
ECEC - Early Childhood Education and Care | | | | | | | | | | | | | | | | | | |
PPP - Public Private Partnerships | | | | | | | | | | | | | | | | | | |
QGF - Queensland Government Insurance Fund | | | | | | | | | | | | | | | | | | |
| | | | | |
Property, Plant and Equipment | | | | | | | | | | | | | | | | | | |
Education | | | | | | | | | | | | | | | | | | |
Australian Music Examinations Board - Refurbishment | | 304 | | | 627 | | | | 290 | | | | 337 | | | | | |
Biloela State School - Replacement Of Air Conditioning | | 308 | | | 1,875 | | | | | | | | 1,875 | | | | | |
Boonah State High School - Bauernhof Agricultural Trade Skills Centre | | 310 | | | 1,000 | | | | 303 | | | | 697 | | | | | |
Bounty Boulevard State School - Additional Accommodation | | 314 | | | 4,335 | | | | 648 | | | | 3,687 | | | | | |
Brightwater State School - Additional Accommodation | | 316 | | | 2,450 | | | | | | | | 2,450 | | | | | |
Brisbane State High School - Additional Accommodation | | 303 | | | 18,692 | | | | 14,534 | | | | 4,158 | | | | | |
Brisbane State High School - Redevelopment | | 303 | | | 9,679 | | | | 7,568 | | | | 2,111 | | | | | |
Brisbane State High School - Decanting And Lease Costs | | 303 | | | 4,627 | | | | 3,153 | | | | 1,322 | | | | 152 | |
Brisbane State High School - Relocation and decanting Edmonstone St | | 303 | | | 5,388 | | | | 4,286 | | | | 1,102 | | | | | |
Bulimba State School - Additional Accommodation | | 301 | | | 6,860 | | | | 33 | | | | 4,136 | | | | 2,691 | |
Caboolture Special School - Additional Accommodation | | 313 | | | 1,470 | | | | | | | | 1,470 | | | | | |
Caboolture Special School - Caboolture Community Specialist Trade Skills Centre | | 313 | | | 600 | | | | 101 | | | | 499 | | | | | |
Caboolture Special School - One classroom facility | | 313 | | | 273 | | | | | | | | 273 | | | | | |
33
Capital Statement 2015-16
| | | | | | | | | | | | | | | | | | |
| Education and Training | |
Project | | Statistical
Area | | Total
Estimated
Cost
$‘000 | | | Expenditure
to
30-06-15
$‘000 | | | Budget
2015-16
$‘000 | | | Post
2015-16
$‘000 | |
Cairns Special School - New School | | 306 | | | 22,250 | | | | | | | | 7,120 | | | | 15,130 | |
Calamvale Special School - Additional Accommodation | | 303 | | | 4,900 | | | | | | | | 1,960 | | | | 2,940 | |
Calliope State School - Additional Accommodation | | 308 | | | 5,880 | | | | | | | | 1,960 | | | | 3,920 | |
Cannonvale State School - Additional Accommodation | | 312 | | | 4,900 | | | | | | | | 1,960 | | | | 2,940 | |
Coomera Rivers State School - Additional Accommodation | | 309 | | | 1,470 | | | | | | | | 1,470 | | | | | |
Cunnamulla P-12 State School - New Industrial Technology Centre /QGF | | 315 | | | 1,440 | | | | 975 | | | | 465 | | | | | |
Currimundi Special School - Additional Accommodation | | 316 | | | 1,470 | | | | | | | | 1,470 | | | | | |
Currumbin Valley State School - Additional Accommodation | | 309 | | | 3,386 | | | | 522 | | | | 2,864 | | | | | |
Dalby State School - Replacement Amenities | | 307 | | | 1,160 | | | | | | | | 1,160 | | | | | |
Emu Park State School - Additional Accommodation | | 308 | | | 2,940 | | | | | | | | 2,940 | | | | | |
Enoggera State School - Capital Works Improvements | | 304 | | | 753 | | | | | | | | 753 | | | | | |
Geebung State School - Replacement Of Amenities | | 302 | | | 481 | | | | 104 | | | | 377 | | | | | |
Gladstone State High School - Gladstone Transport Log & Electro Trade Skills Centre | | 308 | | | 3,400 | | | | 296 | | | | 3,104 | | | | | |
Glenala State High School - Glenala Trades Skills Centre | | 303 | | | 3,000 | | | | 305 | | | | 2,695 | | | | | |
Goondiwindi State High School - Goondiwindi Trade Skills Centre | | 307 | | | 1,500 | | | | 415 | | | | 1,085 | | | | | |
Grandchester State School - Replacement Of Amenities Block | | 310 | | | 290 | | | | 2 | | | | 288 | | | | | |
Gumdale State School - Stage 1 - Master Plan | | 301 | | | 6,664 | | | | 32 | | | | 6,632 | | | | | |
Highfields State Secondary College - Stage 2 | | 317 | | | 14,550 | | | | | | | | 2,910 | | | | 11,640 | |
Ingham State High School - Hinchinbrook Trade Skills Centre | | 318 | | | 1,500 | | | | 160 | | | | 1,340 | | | | | |
34
Capital Statement 2015-16
| | | | | | | | | | | | | | | | | | |
| Education and Training | |
Project | | Statistical
Area | | Total
Estimated
Cost
$‘000 | | | Expenditure
to
30-06-15
$‘000 | | | Budget
2015-16
$‘000 | | | Post
2015-16
$‘000 | |
Innisfail State College - Innisfail Health Trade Skills Centre | | 306 | | | 1,500 | | | | 376 | | | | 1,124 | | | | | |
Ironside State School - Additional Accommodation | | 304 | | | 6,863 | | | | 46 | | | | 2,460 | | | | 4,357 | |
Jamboree Heights State School - Replacement Modular Building | | 304 | | | 580 | | | | | | | | 580 | | | | | |
Kelvin Grove State College - Additional Accommodation | | 305 | | | 7,840 | | | | | | | | 1,960 | | | | 5,880 | |
Kelvin Grove State College - Accessibility for students | | 305 | | | 335 | | | | | | | | 335 | | | | | |
Kruger State School - Additional Accommodation | | 310 | | | 2,450 | | | | | | | | 2,450 | | | | | |
Macgregor State School - Replacement Accommodation | | 303 | | | 4,060 | | | | 722 | | | | 3,338 | | | | | |
Mackay Northern Beaches State High School - Stage 2B | | 312 | | | 5,820 | | | | 679 | | | | 5,141 | | | | | |
Mango Hill State School - Additional Accommodation | | 314 | | | 3,920 | | | | | | | | 3,920 | | | | | |
Mareeba State School - Special Ed Facilities | | 306 | | | 1,960 | | | | | | | | 1,960 | | | | | |
Meridan State College - Additional Accommodation | | 316 | | | 1,470 | | | | | | | | 1,470 | | | | | |
Mirani State High School - CWP Sports Facility | | 312 | | | 5,022 | | | | 730 | | | | 4,292 | | | | | |
Moranbah East State School - Replacement Of Air Conditioning | | 312 | | | 2,250 | | | | | | | | 2,250 | | | | | |
Moranbah State High School - Replacement Of Air Conditioning | | 312 | | | 3,938 | | | | | | | | 3,938 | | | | | |
Moranbah State School - Replacement Of Air Conditioning | | 312 | | | 3,938 | | | | | | | | 3,938 | | | | | |
Nerang State High School - GC Resource Industries Trade Skills Centre | | 309 | | | 2,230 | | | | 193 | | | | 2,037 | | | | | |
Park Lake State School - Additional Accommodation | | 309 | | | 2,081 | | | | | | | | 2,081 | | | | | |
Peregian Springs State School - Additional Accommodation /PPP | | 316 | | | 4,656 | | | | | | | | 4,656 | | | | | |
Pimpama State School - Additional Accommodation | | 309 | | | 1,960 | | | | | | | | 1,960 | | | | | |
35
Capital Statement 2015-16
| | | | | | | | | | | | | | | | | | |
| Education and Training | |
Project | | Statistical
Area | | Total
Estimated
Cost
$‘000 | | | Expenditure
to
30-06-15
$‘000 | | | Budget
2015-16
$‘000 | | | Post
2015-16
$‘000 | |
Pimpama State Secondary College - Stage 3 | | 309 | | | 9,700 | | | | | | | | 7,760 | | | | 1,940 | |
Pine Rivers Special School - Additional Accommodation | | 313 | | | 3,920 | | | | | | | | 3,920 | | | | | |
Rockhampton Special School - Additional Accommodation | | 308 | | | 490 | | | | | | | | 490 | | | | | |
Runaway Bay Sport And Leadership Excellence Centre - Facilities Renewal | | 309 | | | 3,863 | | | | 427 | | | | 3,436 | | | | | |
Runcorn State High School - Metro South Engineering Trade Skills Centre | | 303 | | | 3,600 | | | | 193 | | | | 3,407 | | | | | |
Sandgate District State High School - Metro North Engineering & Auto Trade Skills Centre | | 302 | | | 3,000 | | | | 151 | | | | 2,849 | | | | | |
Springfield Central State High School - Stage 3 | | 310 | | | 14,550 | | | | | | | | 8,730 | | | | 5,820 | |
Springfield Central State School - Additional Accommodation | | 310 | | | 2,450 | | | | | | | | 2,450 | | | | | |
Springfield Central State School - Stage 3 | | 310 | | | 4,850 | | | | | | | | 970 | | | | 3,880 | |
Tamborine Mountain State High School - Additional Accommodation | | 309 | | | 2,450 | | | | | | | | 2,450 | | | | | |
Townsville Community Learning Centre - A State Special School - Additional Accommodation | | 318 | | | 4,900 | | | | | | | | 1,960 | | | | 2,940 | |
New School North West Townsville - New Primary School | | 318 | | | 50,000 | | | | | | | | 10,000 | | | | 40,000 | |
Tropical North Learning Academy - Trinity Beach State School - Additional Accommodation | | 306 | | | 3,920 | | | | | | | | 1,960 | | | | 1,960 | |
Western Cape College - Weipa - Western Cape Trade Skills Centre | | 315 | | | 1,500 | | | | 290 | | | | 1,210 | | | | | |
William Ross State High School - William Ross Trade Skills Centre | | 318 | | | 1,000 | | | | 183 | | | | 817 | | | | | |
Wondai State School - Replacement Library /QGF | | 319 | | | 561 | | | | | | | | 561 | | | | | |
Woodridge State High School - Logan Logistical Trade Skills Centre | | 311 | | | 2,400 | | | | 276 | | | | 2,124 | | | | | |
36
Capital Statement 2015-16
| | | | | | | | | | | | | | | | | | | | |
| Education and Training | |
Project | | Statistical
Area | | | Total
Estimated
Cost
$‘000 | | | Expenditure
to
30-06-15
$‘000 | | | Budget
2015-16
$‘000 | | | Post
2015-16
$‘000 | |
Queensland Schools PPP | | | Various | | | | | | | | | | | | 108,222 | | | | Ongoing | |
Schools Subsidy Scheme | | | Various | | | | | | | | | | | | 5,602 | | | | Ongoing | |
Employee Housing | | | Various | | | | | | | | | | | | 888 | | | | Ongoing | |
General and Minor Works | | | Various | | | | | | | | | | | | 68,038 | | | | Ongoing | |
Land Acquisition | | | Various | | | | | | | | | | | | 16,957 | | | | Ongoing | |
Additional Year 7 Transition Projects | | | Various | | | | | | | | | | | | 3,540 | | | | Ongoing | |
Plant and Equipment | | | Various | | | | | | | | | | | | 52,396 | | | | Ongoing | |
| | | | | | | | | | | | | | | | | | | | |
Sub-total Education | | | | | | | | | | | | | | | 427,297 | | | | | |
| | | | | | | | | | | | | | | | | | | | |
| | | | | |
Early Childhood Education and Care | | | | | | | | | | | | | | | | | | | | |
Gordonvale State School - Early Years Service | | | 306 | | | | 2,137 | | | | 158 | | | | 1,979 | | | | | |
Mornington Island Children And Family Centre - Staff Housing - Mornington Island | | | 315 | | | | 1,201 | | | | 580 | | | | 621 | | | | | |
Serviceton South State School - Early Years Service | | | 303 | | | | 2,091 | | | | 10 | | | | 2,081 | | | | | |
Various - Pre-Prep outdoor learning environment | | | 305 | | | | 1,914 | | | | | | | | 1,914 | | | | | |
General and Minor Works | | | Various | | | | | | | | | | | | 481 | | | | Ongoing | |
ECEC Renewal | | | Various | | | | | | | | | | | | 4,783 | | | | Ongoing | |
| | | | | | | | | | | | | | | | | | | | |
Sub-total Early Childhood Education and Care | | | | | | | | | | | | | | | 11,859 | | | | | |
| | | | | | | | | | | | | | | | | | | | |
| | | | | | | | | | | | | | | | | | | | |
| | | | | | | | | | | | | | | | | | | | |
Total Property, Plant and Equipment | | | | | | | | | | | | | | | 439,156 | | | | | |
| | | | | | | | | | | | | | | | | | | | |
| | | | | |
Capital Grants | | | | | | | | | | | | | | | | | | | | |
Education | | | | | | | | | | | | | | | | | | | | |
Capital Grants | | | Various | | | | | | | | | | | | 122,675 | | | | Ongoing | |
| | | | | | | | | | | | | | | | | | | | |
Sub-total Education | | | | | | | | | | | | | | | 122,675 | | | | | |
| | | | | | | | | | | | | | | | | | | | |
| | | | | |
Early Childhood Education and Care | | | | | | | | | | | | | | | | | | | | |
Capital Grants | | | Various | | | | | | | | | | | | 10,359 | | | | Ongoing | |
| | | | | | | | | | | | | | | | | | | | |
Sub-total Early Childhood Education and Care | | | | | | | | | | | | | | | 10,359 | | | | | |
| | | | | | | | | | | | | | | | | | | | |
| | | | | | | | | | | | | | | | | | | | |
| | | | | | | | | | | | | | | | | | | | |
Total Capital Grants | | | | | | | | | | | | | | | 133,034 | | | | | |
| | | | | | | | | | | | | | | | | | | | |
37
Capital Statement 2015-16
| | | | | | | | | | | | | | | | | | |
| Education and Training | |
Project | | Statistical
Area | | Total
Estimated
Cost
$‘000 | | | Expenditure
to
30-06-15
$‘000 | | | Budget
2015-16
$‘000 | | | Post
2015-16
$‘000 | |
TAFE QUEENSLAND | | | | | | | | | | | | | | | | | | |
| | | | | |
Property, Plant and Equipment | | | | | | | | | | | | | | | | | | |
Plant and equipment replacement | | Various | | | | | | | | | | | 11,500 | | | | Ongoing | |
Minor capital projects and acquisitions | | Various | | | | | | | | | | | 5,000 | | | | Ongoing | |
Product development | | Various | | | | | | | | | | | 7,000 | | | | Ongoing | |
Student Management System | | Various | | | 11,290 | | | | 7,217 | | | | 4,073 | | | | | |
Other minor IT and systems development and replacement | | Various | | | | | | | | | | | 5,000 | | | | Ongoing | |
| | | | | | | | | | | | | | | | | | |
Total Property, Plant and Equipment | | | | | | | | | | | | | 32,573 | | | | | |
| | | | | | | | | | | | | | | | | | |
| | | | | |
QUEENSLAND TRAINING ASSETS MANAGEMENT AUTHORITY | | | | | | | | | | | | | | | | | | |
| | | | | |
Property, Plant and Equipment | | | | | | | | | | | | | | | | | | |
Training Plant & Equipment replacement and upgrades | | Various | | | 2,500 | | | | | | �� | | 2,500 | | | | | |
| | | | | | | | | | | | | | | | | | |
Total Property, Plant and Equipment | | | | | | | | | | | | | 2,500 | | | | | |
| | | | | | | | | | | | | | | | | | |
| | | | | | | | | | | | | | | | | | |
| | | | | | | | | | | | | | | | | | |
TOTAL EDUCATION AND TRAINING (PPE) | | | | | | | | | | | | | 474,229 | | | | | |
| | | | | | | | | | | | | | | | | | |
| | | | | | | | | | | | | | | | | | |
| | | | | | | | | | | | | | | | | | |
TOTAL EDUCATION AND TRAINING (CG) | | | | | | | | | | | | | 133,034 | | | | | |
| | | | | | | | | | | | | | | | | | |
38
Capital Statement 2015-16
ELECTORAL COMMISSION OF QUEENSLAND
An amount of $1.4 million has been allocated in 2015-16 to replace the Commission’s Strategic Election Management System. This ICT project will enable the delivery of efficient and fair elections, including the 2018 State General Election. A further $79,000 has been allocated for the ongoing replacement of plant and equipment.
| | | | | | | | | | | | | | | | |
| Electoral Commission of Queensland | |
Project | | Statistical
Area | | Total
Estimated
Cost
$‘000 | | | Expenditure
to
30-06-15
$‘000 | | Budget
2015-16
$‘000 | | | Post
2015-16
$‘000 | |
ELECTORAL COMMISSION OF QUEENSLAND | | | | | | | | | | | | | | | | |
| | | | | |
Property, Plant and Equipment | | | | | | | | | | | | | | | | |
SEMS Replacement Project | | 305 | | | 6,306 | | | | | | 1,359 | | | | 4,947 | |
Plant and equipment | | 305 | | | | | | | | | 79 | | | | Ongoing | |
| | | | | | | | | | | | | | | | |
Total Property, Plant and Equipment | | | | | | | | | | | 1,438 | | | | | |
| | | | | | | | | | | | | | | | |
| | | | | | | | | | | | | | | | |
| | | | | | | | | | | | | | | | |
TOTAL ELECTORAL COMMISSION OF QUEENSLAND (PPE) | | | | | | | | | | | 1,438 | | | | | |
| | | | | | | | | | | | | | | | |
39
Capital Statement 2015-16
ENERGY AND WATER SUPPLY
The Energy and Water Supply portfolio includes the Department of Energy and Water Supply, statutory bodies reporting to the Minister for Energy and Water Supply, and energy and water supply government-owned corporations. The portfolio capital program for 2015-16 is $2.423 billion for capital purchases. The capital works program supports the Government commitment to deliver cost effective, safe, secure and reliable energy and water supply.
Department of Energy and Water Supply
The Department of Energy and Water Supply is responsible for overseeing Queensland’s energy and water industries to ensure these essential services are provided to Queensland consumers in a safe, efficient and reliable way.
The capital program of $2.1 million relates to upgrades on non-commercial water assets, which provide a range of services and public values including recreation and water supply for mining, irrigation and construction. These non-commercial assets were transferred to the department on its establishment in 2012. These structures include water supply dams that were abandoned by mining companies and non-commercial water infrastructure that was not vested with SunWater, such as water supply weirs and a barrage.
CS Energy Limited
A $99.9 million capital expenditure program is planned for 2015-16. This reflects the continued commitment to ongoing reliability and efficiency of generation plant at its Queensland power station sites.
Program Highlights (Property, Plant and Equipment)
| • | | $33.9 million for Callide power station projects including $24.8 million for overhaul work. |
| • | | $48.7 million for Kogan Creek power station projects including $39 million for overhaul work. |
| • | | $6.4 million for Kogan Creek mine projects. |
| • | | $8.2 million for Wivenhoe power station projects including $7.6 million for overhaul work. |
| • | | $2.7 million for corporate capital outlays primarily related to information communication and technology projects. |
40
Capital Statement 2015-16
Stanwell Corporation Limited
Stanwell Corporation’s planned capital purchases for 2015-16 are $225.1 million, which primarily relates to maintaining operations at its Queensland power station sites. This reflects the continued commitment to ongoing reliability and efficiency of generation.
Program Highlights (Property, Plant and Equipment)
| • | | $76.4 million for Tarong Power Stations projects including $43.9 million for two major overhauls on Tarong Unit 4 and Tarong North. |
| • | | $56 million for Meandu Mine projects including $20.2 million for the replacement of mine fleet equipment, $7.1 million for mine exploration and development and $9.2 million for the Coal Handling Processing Plant replacements and upgrades. |
| • | | $51.8 million for Stanwell Power Station projects including $25 million for the major overhaul of Unit 1 and $7 million for the Unit Cooling Water Mid Life Condenser Re-tube. |
| • | | $11.8 million for Mica Creek Power Station projects including $7.2 million for the A6 overhaul. |
| • | | $2.2 million for Stanwell’s Hydro Power Stations including $1.5 million for Kareeya Power Station. |
| • | | $1.5 million for Swanbank Power Station other sustaining projects. |
| • | | $24.4 million for other corporate capital outlays including $15 million for Information and Business Services projects and $8.2 million for Fuel Strategy projects. |
Energex Limited
Energex has a capital program of $713.7 million as part of its commitment to providing a safe, secure and highly reliable, cost effective electricity delivery to its customers. The capital program aims to improve and reinforce electricity supplies across South East Queensland, especially to meet peak electricity demand periods, and to support the increased use of residential solar power and lifestyle enhancing appliances, such as air conditioners and flat screen televisions.
Included in the program is:
| • | | Electricity upgrades to support commercial infrastructure expansion in regions including Brisbane, Ipswich, Logan, Redlands and the Gold and Sunshine Coasts. |
| • | | Important electricity upgrades in growing areas in Brisbane’s northern, southern and western gateways and to improve and reinforce electricity supply across South East Queensland. |
41
Capital Statement 2015-16
The regulated electricity capital expenditure program for 2015-16 is $634.3 million. A further $79.4 million is allocated for non-system and unregulated capital programs including vehicles, building, ICT software and hardware.
The capital expenditure program is subject to on-going review to ensure it represents a prudent and efficient program to meet customer and demand forecasts and is subject to change.
Program Highlights (Property, Plant and Equipment)
| • | | $1.3 million to continue the upgrade of the Coorparoo substation to improve network performance. The total estimated cost of the project is $15.1 million. |
| • | | $1.1 million to continue the redevelopment of the Victoria Park substation at Herston to increase network capacity. The total estimated cost of the project is $63 million. |
| • | | $2.1 million to upgrade the Cleveland substation to improve network performance. The total estimated cost of the project is $9.1 million. |
| • | | $1.2 million to enhance the capacity of the Samford substation to increase network capacity and improve reliability. The total estimated cost of the project is $8 million. |
| • | | $26.3 million to continue work on a high voltage sub-transmission project in the southern Logan-northern Scenic Rim area to increase network capacity and improve reliability. The total estimated cost of the project is $63 million. |
| • | | $4.6 million to replace high voltage underground cables between Nudgee and Hendra to improve network performance. The total estimated cost of the project is $13.1 million. |
| • | | $2.4 million to upgrade the Stradbroke Island substation to improve network performance. The total estimated cost of the project is $3.7 million. |
| • | | $746,000 to upgrade the Lockrose substation to increase network capacity and improve reliability. The total estimated cost of the project is $10.9 million. |
| • | | $1.4 million to upgrade the Jindalee substation to improve network reliability. The total estimated cost of the project is $9.1 million. |
| • | | $5 million to continue work on the multi-stage SunCoast sub-transmission powerline project to increase network capacity and improve reliability. The total estimated cost of the project is $85.7 million. |
42
Capital Statement 2015-16
| • | | $1 million to continue the upgrade of the Archerfield substation to improve network performance. The total estimated cost of the project is $11 million. |
| • | | $967,000 to continue with the establishment of a new substation at Springfield to increase network capacity and improve reliability. The total estimated cost of the project is $51.8 million. |
| • | | $651,000 towards the establishment of new powerline at the Moggill substation to increase network capacity. The total estimated cost of the projects is $4.2 million. |
Ergon Energy Corporation Limited
Ergon Energy Corporation Limited’s capital expenditure for 2015-16 of $864.4 million includes prudent investments primarily related to providing a safe and reliable electricity supply that is both cost effective and dependable for customers by continuing a focus on efficiencies, asset management; network capability and working with our domestic and commercial customers to help them better manage their electricity usage and therefore their electricity costs.
Program Highlights (Property, Plant and Equipment)
| • | | $16 million for the $19.1 million project redeveloping the Gladstone South zone substation. |
| • | | $9.6 million for the $33.4 million project redeveloping the East Warwick zone substation. |
| • | | $17.7 million for the $84.5 million project redeveloping the Central Toowoomba zone substation. |
| • | | $7.1 million to continue the $12.2 million project for Battery Storage Network Development (GUSS-Grid Utility Support Systems). |
Powerlink Queensland
Powerlink Queensland is the high voltage electricity transmission entity for Queensland. Powerlink’s budgeted capital expenditure for 2015-16 is $323 million and includes the following program highlights.
Program Highlights (Property, Plant and Equipment)
| • | | $14.6 million has been provided in 2015-16 to replace assets at Callide A Substation (switchyard), due for completion in 2017-18. The replacement of aged substation assets ensures the ongoing reliable supply of high voltage electricity in this region. |
43
Capital Statement 2015-16
| • | | $12.5 million has been provided in 2015-16 for the replacement of assets at Moura Substation (switchyard), due for completion in 2016-17. The replacement of aged substation assets ensures the ongoing reliable supply of high voltage electricity in this region. |
| • | | $6.7 million has been provided in 2015-16 to continue works to replace the Mackay Substation, due for completion in 2017-18. The project will maintain a reliable supply of high voltage electricity to the Mackay area. |
| • | | $6.2 million has been provided in 2015-16 to continue works associated with replacement of critical substation equipment used for monitoring and controlling high voltage operations at the Blackwall Substation. The project is due for completion in 2017-18. |
| • | | $3.6 million has been provided in 2015-16 to continue works associated with replacement of critical substation equipment used for monitoring and controlling high voltage operations at the Braemar Substation. The project is due for completion in 2015-16. |
| • | | $3.6 million has been provided in 2015-16 for the replacement of Secondary Systems used for controlling high voltage operations at the Rocklea Substation. The project is due for completion in 2017-18. |
| • | | $3.4 million has been provided in 2015-16 to continue works associated with the replacement of Secondary Systems used for controlling high voltage operations at Ross Substation in North Queensland. The project is due for completion in 2017-18. |
| • | | $2.7 million has been provided in 2015-16 to continue works associated with rebuilding the Swanbank B 275kV Substation, due for completion in 2016. The replacement of aged substation assets ensures the ongoing reliable supply of high voltage electricity in this region. |
| • | | $1.4 million has been provided in 2015-16 to undertake the Nebo primary plant replacement, due for completion in 2019-20. The replacement of the primary plant ensures the ongoing reliable supply of high voltage electricity in this region. |
SunWater Limited
The main components of SunWater’s $39.1 million capital program for 2015-16 are projects to upgrade existing infrastructure (Paradise Dam spillway, Eungella Dam spillway), repairs of damage caused by flood events in 2013 and 2015, and the ongoing refurbishment and enhancement program to maintain existing infrastructure.
44
Capital Statement 2015-16
Program Highlights (Property, Plant and Equipment)
| • | | $11.4 million for Paradise Dam Spillway Upgrade. |
| • | | $8.4 million for minor works including plant and equipment, software development and hardware. |
| • | | $7.2 million for projects mostly related to flood events. |
| • | | $6.6 million for the Refurbishment and Enhancement program. |
| • | | $2.6 million for completion of Woleebee pipeline to Glebe weir. |
| • | | $1.5 million for Lower Fitzroy River Infrastructure. Investigation into the raising of Eden Bann Weir and construction of a new weir at Rookwood on the Fitzroy River. |
| • | | $1.4 million for Eungella Dam Spillway Upgrade. |
Gladstone Area Water Board
Gladstone Area Water Board has total capital purchases expenditure of $33.7 million in 2015-16.
Program Highlights (Property, Plant and Equipment)
| • | | $6.7 million for Yarwun Water Treatment Plant interconnection to increase the plant capacity. |
| • | | $4.2 million for Offline Water Storage between Awoonga Dam and Gladstone. |
| • | | $3.3 million for replacement of the variable frequency drives at Awoonga Dam. |
| • | | $2.1 million for upgrade of the filter media at Gladstone Water Treatment Plant. |
| • | | $1.7 million for the upgrade of the South Trees Bridge to maintain pipeline integrity. |
| • | | $1.3 million for the rationalisation of land tenure for Lake Awoonga. |
Mount Isa Water Board
Total capital expenditure for the Mount Isa Water Board for 2015-16 is budgeted at $5.4 million. The majority of projects are expected to be completed within the financial year.
Program Highlights (Property, Plant and Equipment)
| • | | $1.3 million to complete the installation of the remaining filtration plant including the purchase and installation of the 5th MF5000 filtration unit. |
45
Capital Statement 2015-16
| • | | $750,000 to renew electrical assets within the Lake Julius power distribution system. |
| • | | $470,000 to complete procurement and installation of a new switchboard at Lake Moondarra Deep Well Pump Station. |
| • | | $550,000 to procure pipework for installation in 2016-17 at Clear Water Lagoon. |
| • | | $300,000 to renew electrical assets within the Lake Moondarra power distribution system. This project will continue over two financial years. |
SEQWATER
Seqwater has planned total capital purchases of $117 million in 2015-16 on water infrastructure and non-infrastructure assets.
Program Highlights (Property, Plant and Equipment)
| • | | $19.2 million from a total budget of $53.8 million to undertake renewals and compliance works at Mount Crosby Water Treatment Plant. |
| • | | $6.9 million from a total budget of $17.9 million to undertake renewals and compliance works at North Pine Water Treatment Plant. |
| • | | $5.4 million from a total budget of $9.3 million to undertake renewals and compliance works at Landers Shute Water Treatment Plant. |
| • | | $2.5 million from a total budget of $17.6 million to undertake renewals and compliance works at Lowood Water Treatment Plant. |
| • | | $2 million from a total budget of $2.8 million to undertake renewals and compliance works at Holts / Camerons Control Building. |
| • | | $2.4 million from a total budget of $66.4 million to undertake investigations to ensure that Lake MacDonald Dam will continue to meet compliance requirements. |
46
Capital Statement 2015-16
| | | | | | | | | | | | | | | | | | |
| Energy and Water Supply | |
Project | | Statistical
Area | | Total
Estimated
Cost
$‘000 | | | Expenditure
to
30-06-15
$‘000 | | | Budget
2015-16
$‘000 | | | Post
2015-16
$‘000 | |
DEPARTMENT OF ENERGY AND WATER SUPPLY | | | | | | | | | | | | | | | | | | |
| | | | | |
Property, Plant and Equipment | | | | | | | | | | | | | | | | | | |
Non-Commercial Assets General Upgrades | | Various | | | 433 | | | | 70 | | | | 363 | | | | | |
Jumna Dam Upgrade - Irvinebank | | 315 | | | 2,000 | | | | | | | | 1,000 | | | | 1,000 | |
Copperfield Dam Upgrade - Kidston | | 315 | | | 500 | | | | 10 | | | | 490 | | | | | |
Plant and Equipment | | 305 | | | | | | | | | | | 64 | | | | Ongoing | |
Bajool Weir Upgrade - Bajool | | 308 | | | 200 | | | | | | | | 200 | | | | | |
| | | | | | | | | | | | | | | | | | |
Total Property, Plant and Equipment | | | | | | | | | | | | | 2,117 | | | | | |
| | | | | | | | | | | | | | | | | | |
| | | | | |
CS ENERGY LIMITED | | | | | | | | | | | | | | | | | | |
| | | | | |
Property, Plant and Equipment | | | | | | | | | | | | | | | | | | |
Callide Power Stations | | 308 | | | 33,946 | | | | | | | | 33,946 | | | | | |
Kogan Creek Power Station | | 307 | | | 48,675 | | | | | | | | 48,675 | | | | | |
Kogan Creek Mine | | 307 | | | 6,371 | | | | | | | | 6,371 | | | | | |
Wivenhoe Power Station | | 310 | | | 8,219 | | | | | | | | 8,219 | | | | | |
Corporate | | 305 | | | 2,663 | | | | | | | | 2,663 | | | | | |
| | | | | | | | | | | | | | | | | | |
Total Property, Plant and Equipment | | | | | | | | | | | | | 99,874 | | | | | |
| | | | | | | | | | | | | | | | | | |
| | | | | |
STANWELL CORPORATION LIMITED | | | | | | | | | | | | | | | | | | |
| | | | | |
Property, Plant and Equipment | | | | | | | | | | | | | | | | | | |
Barron Gorge Power Station | | | | | | | | | | | | | | | | | | |
Barron Gorge Power Station Minor Works | | 306 | | | | | | | | | | | 642 | | | | Ongoing | |
Kareeya Power Station | | | | | | | | | | | | | | | | | | |
Kareeya Power Station Minor Works | | 306 | | | | | | | | | | | 1,476 | | | | Ongoing | |
Koombooloomba Power Station | | | | | | | | | | | | | | | | | | |
Koombooloomba Power Station Minor Works | | 306 | | | | | | | | | | | 115 | | | | Ongoing | |
Meandu Mine | | | | | | | | | | | | | | | | | | |
Coal Handling Processing Plant Replacements and Upgrades | | 319 | | | | | | | | | | | 9,173 | | | | Ongoing | |
Mine Exploration and Development | | 319 | | | | | | | | | | | 7,091 | | | | Ongoing | |
Mine Fleet Equipment Replacement | | 319 | | | | | | | | | | | 20,170 | | | | Ongoing | |
47
Capital Statement 2015-16
| | | | | | | | | | | | | | | | | | |
| Energy and Water Supply | |
Project | | Statistical
Area | | Total
Estimated
Cost
$‘000 | | | Expenditure
to
30-06-15
$‘000 | | | Budget
2015-16
$‘000 | | | Post
2015-16
$‘000 | |
Other Sustaining Projects | | 319 | | | | | | | | | | | 14,911 | | | | Ongoing | |
Rehabilitation | | 319 | | | | | | | | | | | 2,900 | | | | Ongoing | |
Dragline Overhaul | | 319 | | | | | | | | | | | 1,750 | | | | Ongoing | |
Mica Creek Power Station | | | | | | | | | | | | | | | | | | |
Other Sustaining Projects | | 315 | | | | | | | | | | | 2,080 | | | | Ongoing | |
Overhauls | | 315 | | | | | | | | | | | 7,219 | | | | Ongoing | |
Rehabilitation | | 315 | | | | | | | | | | | 2,500 | | | | Ongoing | |
Mackay Gas Turbine | | | | | | | | | | | | | | | | | | |
Rehabilitation | | 312 | | | | | | | | | | | 662 | | | | Ongoing | |
Stanwell Power Station | | | | | | | | | | | | | | | | | | |
Ash Storage Area Management Plan | | 308 | | | | | | | | | | | 1,574 | | | | Ongoing | |
Control System Upgrade | | 308 | | | | | | | | | | | 4,829 | | | | Ongoing | |
Other Sustaining Projects | | 308 | | | | | | | | | | | 10,612 | | | | Ongoing | |
Overhauls | | 308 | | | | | | | | | | | 27,766 | | | | Ongoing | |
Unit Cooling Water Mid Life Condenser Retube | | 308 | | | | | | | | | | | 7,019 | | | | Ongoing | |
Swanbank Power Station | | | | | | | | | | | | | | | | | | |
Other Sustaining Projects | | 310 | | | | | | | | | | | 1,523 | | | | Ongoing | |
Rehabilitation | | 310 | | | | | | | | | | | 320 | | | | Ongoing | |
Tarong Power Station | | | | | | | | | | | | | | | | | | |
Other Sustaining Projects | | 319 | | | | | | | | | | | 32,533 | | | | Ongoing | |
Overhauls | | 319 | | | | | | | | | | | 43,859 | | | | Ongoing | |
Other Capital Projects | | | | | | | | | | | | | | | | | | |
Energy Trading & Commercial Strategy | | Various | | | | | | | | | | | 1,200 | | | | Ongoing | |
Fuel Strategy | | Various | | | | | | | | | | | 8,178 | | | | Ongoing | |
Hardware and Software Upgrades | | Various | | | | | | | | | | | 4,135 | | | | Ongoing | |
“Information, Communication & Technology Other Capital Projects” | | Various | | | | | | | | | | | 8,600 | | | | Ongoing | |
Other Capital Projects | | Various | | | | | | | | | | | 2,308 | | | | Ongoing | |
| | | | | | | | | | | | | | | | | | |
Total Property, Plant and Equipment | | | | | | | | | | | | | 225,145 | | | | | |
| | | | | | | | | | | | | | | | | | |
| | | | | |
ENERGEX LIMITED | | | | | | | | | | | | | | | | | | |
| | | | | |
Property, Plant and Equipment | | | | | | | | | | | | | | | | | | |
Sub Transmission - Brisbane | | Various | | | 662,939 | | | | 354,316 | | | | 85,317 | | | | 223,306 | |
48
Capital Statement 2015-16
| | | | | | | | | | | | | | | | | | |
| Energy and Water Supply | |
Project | | Statistical
Area | | Total
Estimated
Cost
$‘000 | | | Expenditure
to
30-06-15
$‘000 | | | Budget
2015-16
$‘000 | | | Post
2015-16
$‘000 | |
C0121634 - Victoria Park (VPK) - substation augmentation works - Convert to 110/11kV with 2 x 60MVA Transformers | | 305 | | | 62,983 | | | | 56,898 | | | | 1,086 | | | | 4,999 | |
C0151677 Nudgee (NGE) to Hendra (HDA) - Replace 33kV Feeders F622 and F623 | | 303 | | | 13,076 | | | | 5,818 | | | | 4,626 | | | | 2,632 | |
C0139853 - Coorparoo (CPR) - Replace 2 x 33/11 kV Transformers and 11 kV Switchboard | | 303 | | | 15,103 | | | | 12,096 | | | | 1,284 | | | | 1,723 | |
C0151613 -Archerfield (AFD) - Replace 11kV Circuit Breakers | | 303 | | | 11,044 | | | | 8,460 | | | | 1,041 | | | | 1,543 | |
Replace 33/11kV Transformers at Cleveland Zone Substation | | 301 | | | 9,105 | | | | 6,233 | | | | 2,136 | | | | 736 | |
Install a Second 11/33kV Transformer, Switchgear and Capacitor Bank at Samford Zone Substation | | 304 | | | 7,999 | | | | 5,430 | | | | 1,235 | | | | 1,334 | |
Upgrade Jindalee Zone Substation to Improve Flood Resilience | | 304 | | | 9,128 | | | | 7,413 | | | | 1,358 | | | | 357 | |
Replace 11kV Switchgear at Belmont Substation | | 303 | | | 4,037 | | | | 3,160 | | | | 567 | | | | 310 | |
Upgrade the 33kV Feeder between Raby Bay and Capalaba Zone Substations | | 301 | | | 2,777 | | | | 751 | | | | 640 | | | | 1,386 | |
Establish New 11kV Feeder at Moggill Zone Substation | | 304 | | | 4,234 | | | | 1,116 | | | | 651 | | | | 2,467 | |
Replace Transformer and Install Capacitor Bank at Lytton Bulk Supply Substation | | 301 | | | 2,090 | | | | 485 | | | | 1,433 | | | | 172 | |
Replace Transformers at Gibson Island | | 305 | | | 5,534 | | | | 4,168 | | | | 1,108 | | | | 258 | |
Establish New 11kV Feeder at McLachlan St Zone Substation (Fortitude Valley) | | 305 | | | 2,139 | | | | 907 | | | | 1,187 | | | | 45 | |
Replace 33/11kV Transformers at Stradbroke Island Zone Substation | | 301 | | | 3,730 | | | | 901 | | | | 2,442 | | | | 387 | |
Sub Transmission - Gold Coast | | 309 | | | 82,805 | | | | 21,644 | | | | 15,350 | | | | 45,811 | |
49
Capital Statement 2015-16
| | | | | | | | | | | | | | | | | | |
| Energy and Water Supply | |
Project | | Statistical
Area | | Total
Estimated
Cost
$‘000 | | | Expenditure
to
30-06-15
$‘000 | | | Budget
2015-16
$‘000 | | | Post
2015-16
$‘000 | |
C0100550 - Establish a second 110Kv Feeder between Powerlink Bulk Substation at Loganlea (H22) and Energex Bulk Supply Substation at Jimboomba (JBB) | | 311 | | | 63,000 | | | | 30,904 | | | | 26,340 | | | | 5,756 | |
Sub Transmission - Ipswich | | 310 | | | 73,128 | | | | 7,313 | | | | 27,913 | | | | 37,902 | |
C0101112 - Springfield Central (SFC) - Establish 33/11kV Zone Substation | | 310 | | | 51,812 | | | | 39,484 | | | | 967 | | | | 11,361 | |
C0065317-Lockrose (LRE) - Upgrade 110/33kV Bulk Supply Substation | | 310 | | | 10,861 | | | | 9,363 | | | | 746 | | | | 752 | |
Replace 33kV Underground Feeders between Wacol Zone Substation and Richlands Bulk Supply Substation | | 310 | | | 6,803 | | | | 5,181 | | | | 43 | | | | 1,579 | |
Replace 33/11kV Transformers and Split Feeders at Wacol Zone Substation | | 310 | | | 7,050 | | | | 5,519 | | | | 273 | | | | 1,258 | |
Sub Transmission - WBB | | 319 | | | 33,987 | | | | 8,321 | | | | 3,245 | | | | 22,421 | |
Sub Transmission - Sunshine Coast | | 316 | | | 79,869 | | | | 23,239 | | | | 13,976 | | | | 42,654 | |
C0077634 -132KV DCCT Palmwoods - West Maroochydore (WMD) | | 316 | | | 85,726 | | | | 10,045 | | | | 5,034 | | | | 70,647 | |
Distribution Augmentation - Brisbane | | Various | | | 227,419 | | | | | | | | 227,419 | | | | | |
Distribution Augmentation - Ipswich | | 310 | | | 18,705 | | | | | | | | 18,705 | | | | | |
Distribution Augmentation - WBB | | 319 | | | 4,840 | | | | | | | | 4,840 | | | | | |
Distribution Augmentation - Gold Coast | | 309 | | | 37,395 | | | | | | | | 37,395 | | | | | |
Distribution Augmentation - Sunshine Coast | | 316 | | | 43,560 | | | | | | | | 43,560 | | | | | |
ACS Distribution - Brisbane | | Various | | | 79,767 | | | | | | | | 79,767 | | | | | |
ACS Distribution - Ipswich | | 310 | | | 5,383 | | | | | | | | 5,383 | | | | | |
ACS Distribution - WBB | | 319 | | | 807 | | | | | | | | 807 | | | | | |
ACS Distribution - Gold Coast | | 309 | | | 9,184 | | | | | | | | 9,184 | | | | | |
ACS Distribution - Sunshine Coast | | 316 | | | 7,260 | | | | | | | | 7,260 | | | | | |
Fleet | | 305 | | | | | | | | | | | 31,200 | | | | Ongoing | |
Tools & Equipment | | 305 | | | | | | | | | | | 7,800 | | | | Ongoing | |
Capital ICT - Software and Hardware | | 305 | | | | | | | | | | | 2,250 | | | | Ongoing | |
Metering Dynamics | | 305 | | | | | | | | | | | 6,270 | | | | Ongoing | |
Property Buildings | | Various | | | | | | | | | | | 28,803 | | | | Ongoing | |
50
Capital Statement 2015-16
| | | | | | | | | | | | | | | | | | |
| Energy and Water Supply | |
Project | | Statistical
Area | | Total
Estimated
Cost
$‘000 | | | Expenditure
to
30-06-15
$‘000 | | | Budget
2015-16
$‘000 | | | Post
2015-16
$‘000 | |
Fleet under salary sacrifice arrangement | | 305 | | | | | | | | | | | 3,100 | | | | Ongoing | |
| | | | | | | | | | | | | | | | | | |
Total Property, Plant and Equipment | | | | | | | | | | | | | 713,741 | | | | | |
| | | | | | | | | | | | | | | | | | |
| | | | | |
ERGON ENERGY CORPORATION LIMITED | | | | | | | | | | | | | | | | | | |
| | | | | |
Property, Plant and Equipment | | | | | | | | | | | | | | | | | | |
Regulated Network Initiated Capital Works | | | | | | | | | | | | | | | | | | |
Redevelop Gladstone South Zone Substation | | 308 | | | 19,100 | | | | 2,100 | | | | 16,000 | | | | 1,000 | |
Redevelop East Warwick Zone Substation | | 307 | | | 33,390 | | | | 23,752 | | | | 9,602 | | | | 36 | |
Redevelop Central Toowoomba Zone Substation | | 317 | | | 84,487 | | | | 66,769 | | | | 17,718 | | | | | |
Telecommunications Asset Replacements | | 315 | | | 3,244 | | | | 450 | | | | 2,794 | | | | | |
Reinforcement of supply to Dalby | | 307 | | | 27,824 | | | | 25,545 | | | | 2,279 | | | | | |
Jarvisfield Substation Improvement Program (via Ayr) | | 315 | | | 4,015 | | | | 527 | | | | 2,631 | | | | 857 | |
Refurbish Collinsville Zone Substation | | 318 | | | 6,903 | | | | 5,113 | | | | 1,790 | | | | | |
Meter Replacement Program | | Various | | | 4,893 | | | | 2,729 | | | | 2,164 | | | | | |
GUSS - Grid Utility Support System | | 315 | | | 12,245 | | | | 5,105 | | | | 7,140 | | | | | |
Demand Response System Project | | Various | | | 4,317 | | | | | | | | 1,556 | | | | 2,761 | |
Other Regulated Network Initiated Capital Works | | Various | | | | | | | | | | | 354,720 | | | | Ongoing | |
Regulated Customer Initiated Capital Works | | | | | | | | | | | | | | | | | | |
Other Regulated Customer Initiated Capital Works | | Various | | | | | | | | | | | 213,284 | | | | Ongoing | |
Regulated Non-System Capital Works | | | | | | | | | | | | | | | | | | |
Regulated Non System Capex | | Various | | | | | | | | | | | 129,274 | | | | Ongoing | |
Isolated Systems Capital Works | | | | | | | | | | | | | | | | | | |
Generation | | Various | | | | | | | | | | | 38,923 | | | | Ongoing | |
Unregulated Capital Works | | | | | | | | | | | | | | | | | | |
Unregulated Capex | | Various | | | | | | | | | | | 8,742 | | | | Ongoing | |
51
Capital Statement 2015-16
| | | | | | | | | | | | | | | | | | |
| Energy and Water Supply | |
Project | | Statistical
Area | | Total
Estimated
Cost
$‘000 | | | Expenditure
to
30-06-15
$‘000 | | | Budget
2015-16
$‘000 | | | Post
2015-16
$‘000 | |
Related Party Capital Expenditure | | | | | | | | | | | | | | | | | | |
Sparq consolidation Capex | | Various | | | | | | | | | | | 55,791 | | | | Ongoing | |
| | | | | | | | | | | | | | | | | | |
Total Property, Plant and Equipment | | | | | | | | | | | | | 864,408 | | | | | |
| | | | | | | | | | | | | | | | | | |
| | | | | |
POWERLINK QUEENSLAND | | | | | | | | | | | | | | | | | | |
| | | | | |
Property, Plant and Equipment | | | | | | | | | | | | | | | | | | |
Mackay Substation Replacement | | 312 | | | 32,300 | | | | 7,396 | | | | 6,700 | | | | 18,204 | |
Swanbank B 275kV Substation Replacement | | 310 | | | 57,900 | | | | 24,391 | | | | 2,700 | | | | 30,809 | |
Ross Secondary System Replacement | | 318 | | | 27,000 | | | | 22,120 | | | | 3,400 | | | | 1,480 | |
Blackwall iPASS Secondary Systems Replacement | | 310 | | | 26,200 | | | | 3,772 | | | | 6,200 | | | | 16,228 | |
Bulli Creek iPass Secondary System Replacement | | 317 | | | 25,300 | | | | 10,434 | | | | 500 | | | | 14,366 | |
Moura Switchyard Replacement | | 308 | | | 24,500 | | | | 8,593 | | | | 12,500 | | | | 3,407 | |
Braemar iPASS Secondary System Replacement | | 307 | | | 22,400 | | | | 17,336 | | | | 3,600 | | | | 1,464 | |
Nebo Primary Plant Replacement | | 312 | | | 22,500 | | | | 634 | | | | 1,400 | | | | 20,466 | |
Rocklea Secondary Systems Replacement | | 303 | | | 10,500 | | | | 129 | | | | 3,600 | | | | 6,771 | |
Callide A Switchyard Replacement | | 308 | | | 34,800 | | | | 4,265 | | | | 14,600 | | | | 15,935 | |
Stanwell Secondary Systems Replacement | | 308 | | | 16,200 | | | | 764 | | | | 1,300 | | | | 14,136 | |
Total Non-Prescribed Transmission Network Connections | | Various | | | 510,530 | | | | 448,787 | | | | 61,743 | | | | | |
Total Other Projects | | Various | | | 613,667 | | | | 408,867 | | | | 204,800 | | | | | |
| | | | | | | | | | | | | | | | | | |
Total Property, Plant and Equipment | | | | | | | | | | | | | 323,043 | | | | | |
| | | | | | | | | | | | | | | | | | |
| | | | | |
SUNWATER LIMITED | | | | | | | | | | | | | | | | | | |
| | | | | |
Property, Plant and Equipment | | | | | | | | | | | | | | | | | | |
Flood Event 2013 Bundaberg | | 319 | | | | | | | | | | | 1,920 | | | | Ongoing | |
Flood Event 2015 Callide | | 308 | | | | | | | | | | | 1,910 | | | | Ongoing | |
Flood Event Contingencies | | 305 | | | | | | | | | | | 3,342 | | | | Ongoing | |
Lower Fitzroy Infrastructure | | 308 | | | | | | | | | | | 1,520 | | | | Ongoing | |
Woleebee Post Commission | | 307 | | | | | | | | | | | 2,641 | | | | Ongoing | |
52
Capital Statement 2015-16
| | | | | | | | | | | | | | | | | | |
| Energy and Water Supply | |
Project | | Statistical
Area | | Total
Estimated
Cost
$‘000 | | | Expenditure
to
30-06-15
$‘000 | | | Budget
2015-16
$‘000 | | | Post
2015-16
$‘000 | |
Minor Works | | 305 | | | | | | | | | | | 2,745 | | | | Ongoing | |
Software Development and Hardware | | 305 | | | | | | | | | | | 3,567 | | | | Ongoing | |
Plant & Equipment | | 305 | | | | | | | | | | | 2,110 | | | | Ongoing | |
Dam Spillway Upgrade - Eungella | | 312 | | | 1,371 | | | | | | | | 1,371 | | | | | |
Dam Spillway Upgrade - Paradise | | 319 | | | 23,085 | | | | | | | | 11,400 | | | | 11,685 | |
Refurbishment & Enhancement - Eton Water Supply | | 312 | | | | | | | | | | | 284 | | | | Ongoing | |
Refurbishment & Enhancement - Bundaberg Irrigation | | 319 | | | | | | | | | | | 488 | | | | Ongoing | |
Refurbishment & Enhancement - Burdekin Irrigation | | 318 | | | | | | | | | | | 373 | | | | Ongoing | |
Refurbishment & Enhancement - Emerald Irrigation | | 308 | | | | | | | | | | | 343 | | | | Ongoing | |
Refurbishment & Enhancement - Eton Irrigation | | 312 | | | | | | | | | | | 382 | | | | Ongoing | |
Refurbishment & Enhancement - Mareeba Irrigation | | 306 | | | | | | | | | | | 838 | | | | Ongoing | |
Refurbishment & Enhancement - St George Irrigation | | 307 | | | | | | | | | | | 411 | | | | Ongoing | |
Refurbishment & Enhancement - Awoonga Callide Pipeline | | 308 | | | | | | | | | | | 865 | | | | Ongoing | |
Refurbishment & Enhancement - Blackwater Pipeline | | 308 | | | | | | | | | | | 502 | | | | Ongoing | |
Refurbishment & Enhancement - Collinsville Pipeline | | 308 | | | | | | | | | | | 632 | | | | Ongoing | |
Refurbishment & Enhancement - Tarong Pipeline | | 319 | | | | | | | | | | | 481 | | | | Ongoing | |
Refurbishment & Enhancement - Burnett Water | | 319 | | | | | | | | | | | 439 | | | | Ongoing | |
Refurbishment & Enhancement - Eungella Water | | 312 | | | | | | | | | | | 308 | | | | Ongoing | |
Refurbishment & Enhancement - North West Water | | 315 | | | | | | | | | | | 185 | | | | Ongoing | |
| | | | | | | | | | | | | | | | | | |
Total Property, Plant and Equipment | | | | | | | | | | | | | 39,057 | | | | | |
| | | | | | | | | | | | | | | | | | |
| | | | | |
GLADSTONE AREA WATER BOARD | | | | | | | | | | | | | | | | | | |
| | | | | |
Property, Plant and Equipment | | | | | | | | | | | | | | | | | | |
Interconnection Yarwun water treatment plant | | 308 | | | 6,672 | | | | 1 | | | | 6,671 | | | | | |
53
Capital Statement 2015-16
| | | | | | | | | | | | | | | | | | |
| Energy and Water Supply | |
Project | | Statistical
Area | | Total
Estimated
Cost
$‘000 | | | Expenditure
to
30-06-15
$‘000 | | | Budget
2015-16
$‘000 | | | Post
2015-16
$‘000 | |
Standby storage/pumping | | 308 | | | 22,168 | | | | 842 | | | | 4,220 | | | | 17,106 | |
Awoonga Dam variable frequency drive replacement | | 308 | | | 4,741 | | | | 1,417 | | | | 3,324 | | | | | |
Gladstone water treatment plant filter upgrade & filter resurfacing | | 308 | | | 2,214 | | | | 104 | | | | 2,110 | | | | | |
South trees pipe bridge structural refurbishment | | 308 | | | 1,685 | | | | | | | | 1,685 | | | | | |
Lake Awoonga land rationalisation1 | | 308 | | | 1,901 | | | | 602 | | | | 1,299 | | | | | |
East End reservoir various works | | 308 | | | 1,145 | | | | | | | | 1,145 | | | | | |
Offline storage to Fitzsimmons 700mm internal linings | | 308 | | | 1,261 | | | | 125 | | | | 1,136 | | | | | |
High lift pump station & Low lift pump station switchboard upgrade | | 308 | | | 5,029 | | | | 216 | | | | 925 | | | | 3,888 | |
Source projects | | 308 | | | 18,473 | | | | 10,330 | | | | 1,771 | | | | 6,372 | |
Delivery projects | | 308 | | | 32,538 | | | | 7,028 | | | | 5,057 | | | | 20,453 | |
Corporate and IT projects | | 308 | | | 8,896 | | | | 2,770 | | | | 2,369 | | | | 3,757 | |
Treatment Projects | | 308 | | | 8,125 | | | | 1,639 | | | | 1,960 | | | | 4,526 | |
| | | | | | | | | | | | | | | | | | |
Total Property, Plant and Equipment | | | | | | | | | | | | | 33,672 | | | | | |
| | | | | | | | | | | | | | | | | | |
| | | | | |
MOUNT ISA WATER BOARD | | | | | | | | | | | | | | | | | | |
| | | | | |
Property, Plant and Equipment | | | | | | | | | | | | | | | | | | |
R48 Minor Works Projects | | 315 | | | 120 | | | | | | | | 120 | | | | | |
Upgrade power line from Clear Water Lagoon to Blackrock | | 315 | | | 300 | | | | | | | | 300 | | | | | |
Purchase and Install 5th MF5000 Unit | | 315 | | | 1,265 | | | | | | | | 1,265 | | | | | |
Power Reliability Hilton - Lake Julius | | 315 | | | 1,595 | | | | | | | | 750 | | | | 845 | |
Moondarra to Mount Isa Terminal Reservoir Pipeline Upgrade | | 315 | | | 550 | | | | | | | | 550 | | | | | |
Replace Lake Moondarra Deep Well Pump Station Distribution Board | | 315 | | | 518 | | | | 48 | | | | 470 | | | | | |
Power Realiability Lake Moondarra System | | 315 | | | 300 | | | | | | | | 300 | | | | | |
Lake Julius Power Pole Replacement | | 315 | | | 3,032 | | | | 1,832 | | | | 300 | | | | 900 | |
Clear Water Lagoon Rehabilitation works | | 315 | | | 280 | | | | | | | | 280 | | | | | |
54
Capital Statement 2015-16
| | | | | | | | | | | | | | | | | | |
| Energy and Water Supply | |
Project | | Statistical
Area | | Total
Estimated
Cost
$‘000 | | | Expenditure
to
30-06-15
$‘000 | | | Budget
2015-16
$‘000 | | | Post
2015-16
$‘000 | |
Fred Haigh Pump Station Stairway to Pumpwell | | 315 | | | 264 | | | | 14 | | | | 250 | | | | | |
Minor Capital Works | | 315 | | | 773 | | | | | | | | 773 | | | | | |
| | | | | | | | | | | | | | | | | | |
Total Property, Plant and Equipment | | | | | | | | | | | | | 5,358 | | | | | |
| | | | | | | | | | | | | | | | | | |
| | | | | |
SEQWATER | | | | | | | | | | | | | | | | | | |
| | | | | |
Property, Plant and Equipment | | | | | | | | | | | | | | | | | | |
Boonah Kalbar Water Treatment Plant Upgrade | | 311 | | | 2,787 | | | | 2,737 | | | | 50 | | | | | |
Capalaba Water Treatment Plant Upgrade | | 301 | | | 6,945 | | | | 5,285 | | | | 1,660 | | | | | |
Cooloolabin Dam Upgrade Stage 1 | | 316 | | | 1,550 | | | | 50 | | | | 1,000 | | | | 500 | |
Leslie Harrison Dam Upgrade Stage 1 | | 301 | | | 50,778 | | | | 269 | | | | 1,047 | | | | 49,462 | |
Lake MacDonald Dam Compliance | | 316 | | | 66,362 | | | | 471 | | | | 2,381 | | | | 63,510 | |
Holts/Camerons Hill Control Building | | 310 | | | 2,772 | | | | 759 | | | | 2,013 | | | | | |
Image Flat Water Treatment Plant Upgrade | | 316 | | | 8,365 | | | | 8,355 | | | | 10 | | | | | |
Maroon Dam Upgrade Stage 1 | | 311 | | | 11,578 | | | | 11,528 | | | | 50 | | | | | |
Moogerah Dam Upgrade Stage 1 | | 311 | | | 3,153 | | | | 3,103 | | | | 50 | | | | | |
Mt Crosby Water Treatment Plant Upgrade | | 310 | | | 53,836 | | | | 9,496 | | | | 19,230 | | | | 25,110 | |
Mudgeeraba Water Treatment Plant pipework | | 309 | | | 1,812 | | | | 192 | | | | 1,620 | | | | | |
North Pine Water Treatment Plant upgrade | | 314 | | | 17,919 | | | | 1,497 | | | | 6,905 | | | | 9,517 | |
Wellers Hill Res 1 Refurbishment | | 301 | | | 1,457 | | | | 417 | | | | 1,040 | | | | | |
Tugan Desalination Plant Capital Works | | 309 | | | 5,164 | | | | 296 | | | | 96 | | | | 4,772 | |
Lowood Water Treatment Plant Upgrade | | 310 | | | 17,569 | | | | 299 | | | | 2,500 | | | | 14,770 | |
Landers Shute Water Treatment Plant Upgrade | | 316 | | | 9,344 | | | | 280 | | | | 5,380 | | | | 3,684 | |
Computer Hardware and Software | | Various | | | | | | | | | | | 4,212 | | | | Ongoing | |
Other Infrastructure Capital works | | Various | | | | | | | | | | | 51,263 | | | | Ongoing | |
Other Non Infrastructure Capital works | | Various | | | | | | | | | | | 1,225 | | | | Ongoing | |
Building | | Various | | | | | | | | | | | 1,843 | | | | Ongoing | |
55
Capital Statement 2015-16
| | | | | | | | | | | | | | |
| Energy and Water Supply | |
Project | | Statistical
Area | | Total
Estimated
Cost
$‘000 | | Expenditure
to
30-06-15
$‘000 | | Budget
2015-16
$‘000 | | | Post
2015-16
$‘000 | |
Fleet | | Various | | | | | | | 1,400 | | | | Ongoing | |
Land & Easements | | Various | | | | | | | 12,034 | | | | Ongoing | |
| | | | | | | | | | | | | | |
Total Property, Plant and Equipment | | | | | 117,009 | | | | | |
| | | | | | | | | | | | | | |
| | | | | | | | | | |
| | | | | | | | | | | | | | |
TOTAL ENERGY AND WATER SUPPLY (PPE) | | | 2,423,424 | | | | | |
| | | | | | | | | | | | | | |
Note:
| 1. | Lake Awoonga Land Rationalisation - Budget 2015-16 $1,420 |
Less Adjustments Land held for sale 116112 movement in QIA - Budget 2015-15 $121
Total Land Rationalisation $1,299
56
Capital Statement 2015-16
ENVIRONMENT AND HERITAGE PROTECTION
Total capital purchases for the Department of Environment and Heritage Protection for 2015-16 are $11.7 million, including $7.9 million for land acquisitions. The capital purchases reflect the department’s mission to lead environment and heritage protection and sustainability in Queensland.
The 2015-16 capital purchases will deliver simplified and standardised processes and systems across the department, including a new Information and Communication Technology system which will enhance a number of licensing and permitting functions and deliver ongoing efficiencies and savings. The capital purchases will also contribute to the protection of the State’s natural environment by acquiring land for inclusion in the protected estate and for koala habitat protection.
Program Highlights (Property, Plant and Equipment)
| • | | $4.3 million in 2015-16 for protected area land acquisitions under the Investing in Our Environment program. |
| • | | $3.3 million in 2015-16 of a total $5.5 million over three years for the Compliance Review Program system development which will deliver integrated and cost- effective services across the department and improve services to Queensland industry and the general public by offering easy to access on-line and app led customer interfaces. |
| • | | $1.9 million in 2015-16 for other land acquisitions. |
| • | | $1.6 million in 2015-16 to increase available koala habitat through the acquisition of suitable land under the Investing to Protect Our Koalas program. |
57
Capital Statement 2015-16
| | | | | | | | | | | | | | | | |
| Environment and Heritage Protection |
Project | | Statistical
Area | | Total
Estimated
Cost
$‘000 | | | Expenditure
to
30-06-15
$‘000 | | | Budget
2015-16
$‘000 | | | Post
2015-16
$‘000 |
DEPARTMENT OF ENVIRONMENT AND HERITAGE PROTECTION | | | | | | | | | | | | | | | | |
| | | | | |
Property, Plant and Equipment | | | | | | | | | | | | | | | | |
Land Acquisitions | | | | | | | | | | | | | | | | |
Investing in Our Environment | | Various | | | 16,858 | | | | 12,546 | | | | 4,312 | | | |
Investing to Protect Our Koalas | | Various | | | 19,393 | | | | 17,746 | | | | 1,647 | | | |
Other Land Acquisitions | | Various | | | 1,900 | | | | | | | | 1,900 | | | |
Systems | | | | | | | | | | | | | | | | |
Compliance Review Program | | Various | | | 5,478 | | | | 2,138 | | | | 3,340 | | | |
Minor Works | | Various | | | 472 | | | | | | | | 472 | | | |
| | | | | | | | | | | | | | | | |
Total Property, Plant and Equipment | | | | | | | | | | | | | 11,671 | | | |
| | | | | | | | | | | | | | | | |
| | | | | | | | | | | | | | | | |
| | | | | | | | | | | | | | | | |
TOTAL ENVIRONMENT AND HERITAGE PROTECTION (PPE) | | | | | | | | | | | | | 11,671 | | | |
| | | | | | | | | | | | | | | | |
58
Capital Statement 2015-16
QUEENSLAND FIRE AND EMERGENCY SERVICES
Most new and ongoing capital initiatives to support Queensland Fire and Emergency Services operational capability are now delivered by the Public Safety Business Agency.
Queensland Fire and Emergency Services continues to be responsible for delivering operational equipment and information systems.
In 2015-16, Queensland Fire and Emergency Services will invest $8.4 million in capital purchases and $1.3 million in capital grants.
Program Highlights (Property, Plant and Equipment)
| • | | $5.5 million for operational equipment, which may include special purpose operational trailers, scientific analysis and detection equipment, thermal imaging cameras, fully encapsulated gas and chemical suits, technical and road crash rescue equipment, portable generators, breathing apparatus compressors, portable decontamination facilities and self-contained temporary shelter facilities. |
| • | | $2.9 million for upgrades to operational information systems. |
| • | | $1.1 million for State Emergency Services and $185,000 for rural fire brigade capital grants. |
| | | | | | | | | | | | | | |
| Fire and Emergency Services | |
Project | | Statistical
Area | | Total
Estimated
Cost
$‘000 | | Expenditure
to
30-06-15
$‘000 | | Budget
2015-16
$‘000 | | | Post
2015-16
$‘000 | |
QUEENSLAND FIRE AND EMERGENCY SERVICES | | | | | | | | | | | | | | |
| | | | | |
Property, Plant and Equipment | | | | | | | | | | | | | | |
Operational Equipment | | Various | | | | | | | 5,467 | | | | Ongoing | |
Information systems development | | Various | | | | | | | 2,900 | | | | Ongoing | |
| | | | | | | | | | | | | | |
Total Property, Plant and Equipment | | | | | | | | | 8,367 | | | | | |
| | | | | | | | | | | | | | |
| | | | | |
Capital Grants | | | | | | | | | | | | | | |
Rural fire brigades | | Various | | | | | | | 185 | | | | Ongoing | |
State Emergency Service | | Various | | | | | | | 1,078 | | | | Ongoing | |
| | | | | | | | | | | | | | |
Total Capital Grants | | | | | | | | | 1,263 | | | | | |
| | | | | | | | | | | | | | |
| | | | | | | | | | | | | | |
| | | | | | | | | | | | | | |
TOTAL FIRE AND EMERGENCY SERVICES (PPE) | | | | | | | | | 8,367 | | | | | |
| | | | | | | | | | | | | | |
| | | | | | | | | | | | | | |
| | | | | | | | | | | | | | |
TOTAL FIRE AND EMERGENCY SERVICES (CG) | | | | | | | | | 1,263 | | | | | |
| | | | | | | | | | | | | | |
59
Capital Statement 2015-16
QUEENSLAND HEALTH
The Queensland public healthcare system collectively known as ‘Queensland Health’ comprises the Department of Health, Queensland Ambulance Service and 16 independent Hospital and Health Services. The total capital purchases in 2015-16 for Queensland Health and the Council of the Queensland Institute of Medical Research are $1.303 billion and $1.5 million in capital grants.
Queensland Health and Hospital and Health Services
The Queensland Health capital investment program is an important input into the delivery of health services with outputs that underpin the provision of better services for patients and better healthcare in the community. The Department takes a strategic view of infrastructure and both technology and information communication to strengthen our public health system to meet future needs.
During 2015-16, Queensland Health will develop a five year capital plan in partnership with Building Queensland. The capital plan will support the Government to formulate a comprehensive statewide view of priority infrastructure projects to achieve the best possible value for money outcome for Queensland’s capital investment. Prioritised projects will proceed progressively through an Investment Management Framework process.
Program Highlights (Property, Plant and Equipment)
Queensland Health will continue capital works and purchases across a broad range of health infrastructure including hospitals, ambulance stations and vehicles, health technology, research and scientific services, mental health services, staff accommodation, and information and communication technology.
Hospital and health facility projects highlights in 2015-16 include:
| • | | $488.7 million to continue delivery of the Sunshine Coast Public University Hospital and its Skills, Academic and Research Centre as a public private partnership, at a total estimated cost of $1.872 billion. |
| • | | $113.6 million to finalise a number of major projects where construction is largely complete, including: Logan Hospital, Lady Cilento Children’s Hospital, Centre for Children’s Health Research, Mackay Base Hospital, Mount Isa Health Campus and Gold Coast University Hospital. |
| • | | $40 million to complete the $446.3 million Cairns Hospital redevelopment. The project on commissioning will deliver an additional 168 beds, an ambulatory cancer care centre, new pathology facilities and new low-risk Family Birth Centre. This additional capacity will enable Cairns Hospital to increase services including surgical, intensive care, birthing services, rehabilitation and mental health. |
60
Capital Statement 2015-16
| • | | $20.6 million in 2015-16 to commence the $180 million Enhancing Regional Hospitals program. This funding will be used to undertake essential upgrades to Caloundra Hospital Service, Roma Hospital, Hervey Bay Emergency Department and Gladstone Emergency Department. |
| • | | $18.4 million in 2015-16 to complete the $334 million Townsville Hospital Expansion. The project will deliver significantly expanded facilities including the emergency department, maternity unit, intensive care unit, medical imaging, operating theatres, a new clinical support and services building, pathology and south block inpatient facility. An additional $9 million to continue with the $12.1 million planned procedure clinic for elective surgery funded by the Australian Government under the Health and Hospital Fund Regional Priority Round. |
| • | | $14.4 million to continue the $17.5 million Alpha Hospital and Co-Located Emergency Services Project, a pilot project to co-locate hospital, ambulance, police, fire and emergency services and other management infrastructure. This will improve utilisation, increase efficiency and provide better integrated emergency responses in Central West region of Queensland. |
| • | | $5.1 million to complete the final stages of the $173.1 million Rockhampton Hospital Expansion. In addition, $9 million to continue with the $17.7 million investments in a new helipad and establishment of a 10 bed intensive care unit. |
| • | | $45 million to continue with the delivery of a range of asset renewal and enhancement works across the state under the Priority Capital Program. |
Queensland Health has allocated $1.2 million to finalise the planning for the refurbishment of the Nambour General Hospital. Funding for the project will be detemined following the finalisation of the business case.
In 2015-16 $179 million will be invested in the continued statewide roll out of clinical and administrative support systems and technology equipment replacement to ensure the right information and technology is available to assist and support the provision of better services for patients and better health care in the community.
Queensland Health will invest $81.8 million in 2015-16 to continue the $327 million four year Backlog Maintenance Remediation Program to address high priority and critical operational maintenance, life cycle replacements and upgrades.
$151.3 million has been allocated to Hospital and Health Services across Queensland for minor capital projects and acquisitions and health technology equipment.
61
Capital Statement 2015-16
Queensland Ambulance Service
In 2015-16, the Queensland Ambulance Service (QAS) will invest $45.4 million in capital purchases to support essential frontline services in order to provide the highest possible pre-hospital quality emergency and non-emergency care and services to the community. In implementing its capital program the QAS will review opportunities to co-locate with existing health services, to improve linkages and working relationships between public hospitals, as well as other emergency management infrastructure.
Program Highlights
| • | | $23 million to purchase 155 ambulance vehicles. |
| • | | $4.8 million for operational equipment including the further acquisition of new powered stretchers. |
| • | | $2.5 million for strategic land acquisitions to accommodate future expansion of services. |
| • | | $3.7 million for information systems development to enhance patient care and service delivery. |
| • | | $11.4 million for ambulance facilities, including: |
| | • | | completing a replacement ambulance station and relief quarters at Russell Island and replacement ambulance stations at Miriam Vale and Collinsville; |
| | • | | continuing with the new stations at Birtinya, Bundaberg, and Rainbow Beach; |
| | • | | continuing with the replacement station and relief accommodation at Thursday Island; |
| | • | | commencing planning for the new ambulance stations at Kenilworth and Yandina; |
| | • | | commencing planning for the replacement of the Coral Gardens ambulance station; and |
| | • | | minor works at various stations to improve functionality and prolong useful life. |
Council of the Queensland Institute of Medical Research
The QIMR capital program in 2015-16 will invest $5.5 million for the acquisition of new and/or replacement equipment including state-of-the-art scientific equipment.
62
Capital Statement 2015-16
| | | | | | | | | | | | | | | | | | |
| Queensland Health | |
Project | | Statistical
Area | | Total
Estimated
Cost
$‘000 | | | Expenditure
to
30-06-15
$‘000 | | | Budget
2015-16
$‘000 | | | Post
2015-16
$‘000 | |
QUEENSLAND HEALTH AND HOSPITAL AND HEALTH SERVICES | | | | | |
| | | | | |
Property, Plant and Equipment | | | | | | | | | | | | | | | | | | |
Hospital and Health Services | | | | | | | | | | | | | | | | | | |
Area Health Demand Management | | Various | | | 297,500 | | | | 277,309 | | | | 8,000 | | | | 12,191 | |
Alpha Hospital and Co-located Emergency Services Project | | 315 | | | 17,500 | | | | 1,144 | | | | 14,356 | | | | 2,000 | |
Building Access to Emergency care through Improved Bed Management Practices | | Various | | | 2,732 | | | | | | | | 2,732 | | | | | |
Cairns Hospital Redevelopment1 | | 306 | | | 446,300 | | | | 400,953 | | | | 40,000 | | | | 5,347 | |
Cape York Staff Accommodation - Kowanyama | | 315 | | | 1,375 | | | | 100 | | | | 1,275 | | | | | |
Community Mental Health Program | | Various | | | 4,851 | | | | 798 | | | | 4,053 | | | | | |
Enhancing Regional Hospitals Program | | Various | | | 180,000 | | | | | | | | 20,600 | | | | 159,400 | |
Faster Emergency Care in our1 Hospitals (Including expanded rehabilitation facilities) | | Various | | | 147,187 | | | | 142,377 | | | | 4,810 | | | | | |
Gold Coast University Hospital1,2 | | 309 | | | 1,761,853 | | | | 1,710,049 | | | | 31,804 | | | | 20,000 | |
Health and Hospital Fund Regional Priority Round | | Various | | | 108,528 | | | | 59,866 | | | | 40,455 | | | | 8,207 | |
Housing Stock Upgrades | | Various | | | | | | | | | | | 1,000 | | | | Ongoing | |
Ipswich Hospital Additional Beds1 | | 310 | | | 113,000 | | | | 111,310 | | | | 1,690 | | | | | |
Lady Cilento Children’s Hospital1,3 | | 305 | | | 1,433,145 | | | | 1,364,798 | | | | 41,000 | | | | 27,347 | |
Centre for Children’s Health4 Research | | 305 | | | 125,000 | | | | 107,470 | | | | 10,530 | | | | 7,000 | |
Mackay Base Hospital Redevelopment | | 312 | | | 408,285 | | | | 392,957 | | | | 8,516 | | | | 6,812 | |
Master Planning Studies | | Various | | | | | | | | | | | 850 | | | | Ongoing | |
Mount Isa Health Campus1 Redevelopment | | 315 | | | 62,575 | | | | 46,271 | | | | 10,000 | | | | 6,304 | |
National Partnership Agreement Improving Public Hospital Services | | Various | | | 192,686 | | | | 181,781 | | | | 10,905 | | | | | |
Priority Capital Program | | Various | | | | | | | | | | | 45,000 | | | | Ongoing | |
Queensland Plan for Mental Health | | Various | | | 130,562 | | | | 117,615 | | | | 4,000 | | | | 8,947 | |
Regional Cancer Centres | | Various | | | 164,120 | | | | 156,234 | | | | 7,279 | | | | 607 | |
Rockhampton Hospital Expansion1 | | 308 | | | 173,064 | | | | 166,925 | | | | 5,139 | | | | 1,000 | |
63
Capital Statement 2015-16
| | | | | | | | | | | | | | | | | | |
| Queensland Health | |
Project | | Statistical
Area | | Total
Estimated
Cost
$‘000 | | | Expenditure
to
30-06-15
$‘000 | | | Budget
2015-16
$‘000 | | | Post
2015-16
$‘000 | |
Rural and Remote Infrastructure Rectification Works | | Various | | | 51,580 | | | | 49,068 | | | | 2,512 | | | | | |
Sunshine Coast Public University5 Hospital | | 316 | | | 1,872,151 | | | | 617,896 | | | | 488,717 | | | | 765,538 | |
Townsville Hospital Expansion1 | | 318 | | | 334,000 | | | | 308,587 | | | | 18,413 | | | | 7,000 | |
Project Finalisation | | Various | | | 691 | | | | | | | | 691 | | | | | |
| | | | | | | | | | | | | | | | | | |
Sub-total Hospital and Health Services | | | | | | | | | | | | | 824,327 | | | | | |
| | | | | | | | | | | | | | | | | | |
| | | | | |
Other Acquisitions of Property, Plant and Equipment | | | | | | | | | | | | | | | | | | |
Building Works Capital Project Management | | Various | | | | | | | | | | | 850 | | | | Ongoing | |
Capital Program Land Acquisition | | Various | | | 4,162 | | | | | | | | 4,162 | | | | | |
Commissioning Performance Reporting Licencing and Development Project | | Various | | | 1,462 | | | | 1,024 | | | | 379 | | | | 59 | |
Emergent Works Program | | Various | | | | | | | | | | | 23,240 | | | | Ongoing | |
Health Technology Equipment | | Various | | | | | | | | | | | 6,771 | | | | Ongoing | |
Minor Capital Projects and6 Acquisitions | | Various | | | | | | | | | | | 33,557 | | | | Ongoing | |
Telehealth (Revitalisation of Regional, Rural and Remote Health Services) | | Various | | | 2,000 | | | | 680 | | | | 1,320 | | | | | |
| | | | | | | | | | | | | | | | | | |
Sub-total Other Acquisitions of Property, Plant and Equipment | | | | | | | | | | | | | 70,279 | | | | | |
| | | | | | | | | | | | | | | | | | |
| | | | | |
Information Communication and Technology7 | | | | | | | | | | | | | | | | | | |
Information Technology Equipment | | Various | | | | | | | | | | | 144,548 | | | | Ongoing | |
Information Communication and Technology | | Various | | | | | | | | | | | 34,412 | | | | Ongoing | |
| | | | | | | | | | | | | | | | | | |
Sub-total Information Communication and Technology | | | | 178,960 | | | | | |
| | | | | | | | | | | | | | | | | | |
| | | | | |
Cairns and Hinterland | | | | | | | | | | | | | | | | | | |
Minor Capital Projects and Acquisitions | | 306 | | | | | | | | | | | 3,096 | | | | Ongoing | |
Health Technology Equipment | | 306 | | | | | | | | | | | 4,437 | | | | Ongoing | |
| | | | | | | | | | | | | | | | | | |
Sub-total Cairns and Hinterland | | | | | | | | | | | | | 7,533 | | | | | |
| | | | | | | | | | | | | | | | | | |
| | | | | |
Central Queensland | | | | | | | | | | | | | | | | | | |
Minor Capital Projects and Acquisitions | | 308 | | | | | | | | | | | 2,274 | | | | Ongoing | |
Health Technology Equipment | | 308 | | | | | | | | | | | 4,177 | | | | Ongoing | |
Rockhampton Hospital Helipad | | 308 | | | 5,000 | | | | 2,478 | | | | 2,522 | | | | | |
64
Capital Statement 2015-16
| | | | | | | | | | | | | | | | | | |
| Queensland Health | |
Project | | Statistical
Area | | Total
Estimated
Cost
$‘000 | | | Expenditure
to
30-06-15
$‘000 | | | Budget
2015-16
$‘000 | | | Post
2015-16
$‘000 | |
Rockhampton Intensive Care Unit | | 308 | | | 12,674 | | | | 6,223 | | | | 6,451 | | | | | |
| | | | | | | | | | | | | | | | | | |
Sub-total Central Queensland | | | | | | | | | | | | | 15,424 | | | | | |
| | | | | | | | | | | | | | | | | | |
| | | | | |
Central West | | | | | | | | | | | | | | | | | | |
Minor Capital Projects and Acquisitions | | 315 | | | | | | | | | | | 1,155 | | | | Ongoing | |
Health Technology Equipment | | 315 | | | | | | | | | | | 483 | | | | Ongoing | |
| | | | | | | | | | | | | | | | | | |
Sub-total Central West | | | | | | | | | | | | | 1,638 | | | | | |
| | | | | | | | | | | | | | | | | | |
| | | | | |
Children’s Health Queensland | | | | | | | | | | | | | | | | | | |
Minor Capital Projects and Acquisitions | | 305 | | | | | | | | | | | 1,668 | | | | Ongoing | |
Health Technology Equipment | | 305 | | | | | | | | | | | 2,638 | | | | Ongoing | |
| | | | | | | | | | | | | | | | | | |
Sub-total Children’s Health Queensland | | | | | | | | | | | | | 4,306 | | | | | |
| | | | | | | | | | | | | | | | | | |
| | | | | |
Darling Downs | | | | | | | | | | | | | | | | | | |
Minor Capital Projects and Acquisitions | | 307 | | | | | | | | | | | 7,783 | | | | Ongoing | |
Health Technology Equipment | | 307 | | | | | | | | | | | 3,851 | | | | Ongoing | |
MRI | | 307 | | | 9,550 | | | | | | | | 9,550 | | | | | |
| | | | | | | | | | | | | | | | | | |
Sub-total Darling Downs | | | | | | | | | | | | | 21,184 | | | | | |
| | | | | | | | | | | | | | | | | | |
| | | | | |
Gold Coast | | | | | | | | | | | | | | | | | | |
Minor Capital Projects and Acquisitions | | 309 | | | | | | | | | | | 3,543 | | | | Ongoing | |
Health Technology Equipment | | 309 | | | | | | | | | | | 6,300 | | | | Ongoing | |
| | | | | | | | | | | | | | | | | | |
Sub-total Gold Coast | | | | | | | | | | | | | 9,843 | | | | | |
| | | | | | | | | | | | | | | | | | |
| | | | | |
Mackay | | | | | | | | | | | | | | | | | | |
Minor Capital Projects and Acquisitions | | 312 | | | | | | | | | | | 1,489 | | | | Ongoing | |
Health Technology Equipment | | 312 | | | | | | | | | | | 2,747 | | | | Ongoing | |
| | | | | | | | | | | | | | | | | | |
Sub-total Mackay | | | | | | | | | | | | | 4,236 | | | | | |
| | | | | | | | | | | | | | | | | | |
| | | | | |
Metro North | | | | | | | | | | | | | | | | | | |
Minor Capital Projects and Acquisitions | | 302 | | | | | | | | | | | 14,364 | | | | Ongoing | |
Health Technology Equipment | | 302 | | | | | | | | | | | 26,000 | | | | Ongoing | |
| | | | | | | | | | | | | | | | | | |
Sub-total Metro North | | | | | | | | | | | | | 40,364 | | | | | |
| | | | | | | | | | | | | | | | | | |
65
Capital Statement 2015-16
| | | | | | | | | | | | | | | | | | |
| Queensland Health | |
Project | | Statistical
Area | | Total
Estimated
Cost
$‘000 | | | Expenditure
to
30-06-15
$‘000 | | | Budget
2015-16
$‘000 | | | Post
2015-16
$‘000 | |
Metro South | | | | | | | | | | | | | | | | | | |
Minor Capital Projects and Acquisitions | | 303 | | | | | | | | | | | 11,086 | | | | Ongoing | |
Health Technology Equipment | | 303 | | | | | | | | | | | 19,806 | | | | Ongoing | |
Southern Queensland Centre of Excellence Stage 2 | | 303 | | | 10,000 | | | | 350 | | | | 8,850 | | | | 800 | |
| | | | | | | | | | | | | | | | | | |
Sub-total Metro South | | | | | | | | | | | | | 39,742 | | | | | |
| | | | | | | | | | | | | | | | | | |
| | | | | |
North West | | | | | | | | | | | | | | | | | | |
Minor Capital Projects and Acquisitions | | 315 | | | | | | | | | | | 869 | | | | Ongoing | |
Health Technology Equipment | | 315 | | | | | | | | | | | 629 | | | | Ongoing | |
| | | | | | | | | | | | | | | | | | |
Sub-total North West | | | | | | | | | | | | | 1,498 | | | | | |
| | | | | | | | | | | | | | | | | | |
| | | | | |
South West | | | | | | | | | | | | | | | | | | |
Minor Capital Projects and Acquisitions | | 315 | | | | | | | | | | | 882 | | | | Ongoing | |
Health Technology Equipment | | 315 | | | | | | | | | | | 704 | | | | Ongoing | |
| | | | | | | | | | | | | | | | | | |
Sub-total South West | | | | | | | | | | | | | 1,586 | | | | | |
| | | | | | | | | | | | | | | | | | |
| | | | | |
Torres and Cape | | | | | | | | | | | | | | | | | | |
Minor Capital Projects and Acquisitions | | 315 | | | | | | | | | | | 1,434 | | | | Ongoing | |
Health Technology Equipment | | 315 | | | | | | | | | | | 917 | | | | Ongoing | |
| | | | | | | | | | | | | | | | | | |
Sub-total Torres and Cape | | | | | | | | | | | | | 2,351 | | | | | |
| | | | | | | | | | | | | | | | | | |
| | | | | |
Sunshine Coast | | | | | | | | | | | | | | | | | | |
Minor Capital Projects and Acquisitions | | 316 | | | | | | | | | | | 2,969 | | | | Ongoing | |
Health Technology Equipment | | 316 | | | | | | | | | | | 4,239 | | | | Ongoing | |
| | | | | | | | | | | | | | | | | | |
Sub-total Sunshine Coast | | | | | | | | | | | | | 7,208 | | | | | |
| | | | | | | | | | | | | | | | | | |
| | | | | |
Townsville | | | | | | | | | | | | | | | | | | |
Minor Capital Projects and Acquisitions | | 318 | | | | | | | | | | | 4,763 | | | | Ongoing | |
Health Technology Equipment | | 318 | | | | | | | | | | | 7,123 | | | | Ongoing | |
| | | | | | | | | | | | | | | | | | |
Sub-total Townsville | | | | | | | | | | | | | 11,886 | | | | | |
| | | | | | | | | | | | | | | | | | |
| | | | | |
West Moreton | | | | | | | | | | | | | | | | | | |
Minor Capital Projects and Acquisitions | | 310 | | | | | | | | | | | 2,488 | | | | Ongoing | |
66
Capital Statement 2015-16
| | | | | | | | | | | | | | | | | | |
| Queensland Health | |
Project | | Statistical
Area | | Total
Estimated
Cost
$‘000 | | | Expenditure
to
30-06-15
$‘000 | | | Budget
2015-16
$‘000 | | | Post
2015-16
$‘000 | |
Health Technology Equipment | | 310 | | | | | | | | | | | 2,369 | | | | Ongoing | |
| | | | | | | | | | | | | | | | | | |
Sub-total West Moreton | | | | | | | | | | | | | 4,857 | | | | | |
| | | | | | | | | | | | | | | | | | |
| | | | | |
Wide Bay | | | | | | | | | | | | | | | | | | |
Minor Capital Projects and Acquisitions | | 319 | | | | | | | | | | | 2,125 | | | | Ongoing | |
Health Technology Equipment | | 319 | | | | | | | | | | | 2,866 | | | | Ongoing | |
| | | | | | | | | | | | | | | | | | |
Sub-total Wide Bay | | | | | | | | | | | | | 4,991 | | | | | |
| | | | | | | | | | | | | | | | | | |
| | | | | | | | | | | | | | | | | | |
| | | | | | | | | | | | | | | | | | |
Total Property, Plant and Equipment | | | | | | | | | | | | | 1,252,213 | | | | | |
| | | | | | | | | | | | | | | | | | |
| | | | | |
Capital Grants | | | | | | | | | | | | | | | | | | |
Hummingbird House - Palliative Care Hospice for Children | | 303 | | | 1,500 | | | | | | | | 1,500 | | | | | |
| | | | | | | | | | | | | | | | | | |
Total Capital Grants | | | | | | | | | | | | | 1,500 | | | | | |
| | | | | | | | | | | | | | | | | | |
| | | | | |
QUEENSLAND AMBULANCE SERVICE | | | | | | | | | | | | | | | | | | |
| | | | | |
Property, Plant and Equipment | | | | | | | | | | | | | | | | | | |
Queensland Ambulance Service | | | | | | | | | | | | | | | | | | |
Birtinya New Station | | 316 | | | 6,000 | | | | | | | | 2,000 | | | | 4,000 | |
Bundaberg New Station | | 319 | | | 5,000 | | | | 992 | | | | 2,000 | | | | 2,008 | |
Collinsville Replacement Station | | 312 | | | 1,800 | | | | 54 | | | | 1,046 | | | | 700 | |
Coral Gardens Replacement Station | | 309 | | | 3,000 | | | | | | | | 100 | | | | 2,900 | |
Kenilworth New Station | | 316 | | | 1,500 | | | | | | | | 100 | | | | 1,400 | |
Miriam Vale Replacement Station | | 319 | | | 2,000 | | | | 30 | | | | 1,970 | | | | | |
Rainbow Beach New Station | | 316 | | | 1,500 | | | | 20 | | | | 300 | | | | 1,180 | |
Russell Island Station and Residence Replacement | | 301 | | | 1,318 | | | | 729 | | | | 589 | | | | | |
Thursday Island Station and relief accommodation | | 315 | | | 5,100 | | | | | | | | 200 | | | | 4,900 | |
Yandina New Station | | 316 | | | 2,200 | | | | | | | | 100 | | | | 2,100 | |
Minor Works | | Various | | | | | | | | | | | 3,000 | | | | Ongoing | |
| | | | | | | | | | | | | | | | | | |
Sub-total Queensland Ambulance Service | | | | | | | | | | | | | 11,405 | | | | | |
| | | | | | | | | | | | | | | | | | |
| | | | | |
Land | | | | | | | | | | | | | | | | | | |
Strategic Land Acquisitions | | Various | | | | | | | | | | | 2,500 | | | | Ongoing | |
| | | | | | | | | | | | | | | | | | |
Sub-total Land | | | | | | | | | | | | | 2,500 | | | | | |
| | | | | | | | | | | | | | | | | | |
67
Capital Statement 2015-16
| | | | | | | | | | | | | | | | | | |
| Queensland Health | |
Project | | Statistical
Area | | | Total
Estimated
Cost
$‘000 | | | Expenditure
to
30-06-15
$‘000 | | Budget
2015-16
$‘000 | | | Post
2015-16
$‘000 | |
Other Plant and Equipment | | | | | | | | | | | | | | | | | | |
Ambulance Vehicle Purchases | | | Various | | | | | | | | | | 23,000 | | | | Ongoing | |
Operational Equipment | | | Various | | | | | | | | | | 4,825 | | | | Ongoing | |
Information Systems Development | | | Various | | | | 3,671 | | | | | | 3,671 | | | | | |
| | | | | | | | | | | | | | | | | | |
Sub-total Other Plant and Equipment | | | | | | | | | | | | | 31,496 | | | | | |
| | | | | | | | | | | | | | | | | | |
| | | | | | | | | | | | | | | | | | |
| | | | | | | | | | | | | | | | | | |
Total Property, Plant and Equipment | | | | | | | | | | | | | 45,401 | | | | | |
| | | | | | | | | | | | | | | | | | |
| | | | | |
COUNCIL OF THE QUEENSLAND INSTITUTE OF MEDICAL RESEARCH | | | | | | | | | | | | | | | | | | |
| | | | | |
Property, Plant and Equipment | | | | | | | | | | | | | | | | | | |
Other scientific equipment | | | 305 | | | | | | | | | | 5,498 | | | | Ongoing | |
| | | | | | | | | | | | | | | | | | |
Total Property, Plant and Equipment | | | | | | | | | | | | | 5,498 | | | | | |
| | | | | | | | | | | | | | | | | | |
| | | | | | | | | | | | | | | | | | |
| | | | | | | | | | | | | | | | | | |
TOTAL QUEENSLAND HEALTH (PPE) | | | | | | | | | | | | | 1,303,112 | | | | | |
| | | | | | | | | | | | | | | | | | |
| | | | | | | | | | | | | | | | | | |
| | | | | | | | | | | | | | | | | | |
TOTAL QUEENSLAND HEALTH (CG) | | | | | | | | | | | | | 1,500 | | | | | |
| | | | | | | | | | | | | | | | | | |
Notes:
| 1. | Total Estimated Cost is inclusive of both non-capital and capital component of project expenditure. |
| 2. | The Gold Coast University Hospital opened in September 2013. Remaining expenditure relates to finalisation of procurement for Furniture, Fittings and Equipment, completion of Information and Communication Technology and Health Precinct fitout |
| 3. | The Lady Cilento Children’s Hospital opened in November 2014. The funding allocation for the 2015-16 financial year is for the defects liability period, finalisation of contracts, finalisation of Information and Communication Technology deferred works, commissioning of Tri Generation Plant and staff to support the phases of the project. |
| 4. | The $125 million comprises of $80 million for the State contribution and a total of $45 million has also been contributed through tenancy agreements of $15 million each with Queensland University of Technology, University of Queensland and Translational Research Institute. A further $9.9 million has been provided from within the Lady Cilento Children’s Hospital Program for pathology and Centre for Children’s Health Research future expansion enabling works. |
| 5. | The $1.872 billion includes the total Skills, Academic and Research Centre (SARC) fit-out capital cost. Those elements of the total SARC fit-out capital cost that relate to the proposed (non-QH) SARC tenants (University of Sunshine Coast, Sunshine Coast TAFE and future medical school provider) will be funded directly via capital contributions from those tenants. |
| 6. | Amount is net of $23.5 million non-capital component of project expenditure. |
| 7. | In 2015-16 Health Services Information Agency (HSIA) is consolidating its four programs of work for reporting (eHealth, Infrastructure, Clinical and Business Solutions and Other Health Systems) to one Portfolio to be called Information Communication and Technology. |
68
Capital Statement 2015-16
HOUSING AND PUBLIC WORKS
Total capital purchases for the Housing and Public Works portfolio, including its statutory bodies, are $381.5 million in 2015-16, with capital grants of $67.3 million. Capital purchases include the Queensland Building and Construction Commission of $4.7 million and the Residential Tenancies Authority of $8.5 million.
Department of Housing and Public Works
Total capital purchases and capital grants expenditure in 2015-16 are $435.6 million.
Program Highlights (Property, Plant and Equipment)
| • | | $183.6 million for social housing to commence construction of 274 rental units, complete construction of 258 rental units, purchase 32 rental units and upgrade existing social housing. |
| • | | $129 million for social housing in Indigenous communities (including $112.8 million funding through the National Partnership Agreement on Remote Indigenous Housing) to commence construction of 60 rental units, complete construction of 207 rental units and upgrade existing social housing. |
| • | | $11.9 million is allocated for the provision of Government Employee Housing on Thursday Island through the construction of multi-unit developments to support Queensland Health’s Chronic Disease Centre as part of the Commonwealth National Partnership Agreement for Health Infrastructure Projects. |
| • | | $9.4 million is allocated for the provision of Government Employee Housing to undertake upgrades of residences across the existing portfolio. This will support the attraction and retention of government employees in rural and remote Queensland. |
| • | | $9.1 million to commence construction of a facility in Townsville to support people from Indigenous communities pursuing employment, education and training opportunities. |
| • | | $6.2 million for roof repairs at the Cairns Convention Centre and the repair of associated structural elements. |
| • | | $5.6 million to construct a facility in Cairns to provide specialist supported accommodation for rough sleepers. |
Program Highlights (Capital Grants)
| • | | $38.3 million for social housing in Indigenous communities to commence construction of 14 rental units, complete construction of 12 rental units, upgrade existing social housing and undertake infrastructure development. |
| • | | $29 million for social housing to commence construction of 56 rental units, upgrade existing social housing and undertake infrastructure development. |
69
Capital Statement 2015-16
Queensland Building and Construction Commission
| • | | In 2015-16, the Queensland Building and Construction Commission has capital purchases of $4.7 million to relocate two regional offices, enhance the customer service centre in Brisbane, continue replacing ageing information technology systems and replacing ageing property, plant and equipment to reduce administration costs, improve customer service and turnaround times. |
Residential Tenancies Authority
| • | | In 2015-16, the Residential Tenancies Authority has capital purchases of $8.5 million including replacing the ageing information technology systems to meet the future needs of Queensland’s residential rental sector. |
| | | | | | | | | | | | | | |
| Housing and Public Works | |
Project | | Statistical
Area | | Total
Estimated
Cost
$‘000 | | Expenditure
to
30-06-15
$‘000 | | Budget
2015-16
$‘000 | | | Post
2015-16
$‘000 | |
DEPARTMENT OF HOUSING AND PUBLIC WORKS | | | | | | | | | | | | | | |
| | | | | |
Property, Plant and Equipment | | | | | | | | | | | | | | |
Housing Services | | | | | | | | | | | | | | |
Brisbane - East Construction | | 301 | | | | | | | 6,511 | | | | Ongoing | |
Brisbane - North Construction | | 302 | | | | | | | 5,419 | | | | Ongoing | |
Brisbane - South Construction | | 303 | | | | | | | 4,670 | | | | Ongoing | |
Brisbane - West Construction | | 304 | | | | | | | 1,745 | | | | Ongoing | |
Brisbane Inner City Construction | | 305 | | | | | | | 2,741 | | | | Ongoing | |
Cairns Construction | | 306 | | | | | | | 14,661 | | | | Ongoing | |
Fitzroy Construction | | 308 | | | | | | | 2,604 | | | | Ongoing | |
Gold Coast Construction | | 309 | | | | | | | 15,070 | | | | Ongoing | |
Ipswich Construction | | 310 | | | | | | | 6,509 | | | | Ongoing | |
Logan - Beaudesert Construction | | 311 | | | | | | | 425 | | | | Ongoing | |
Mackay Construction | | 312 | | | | | | | 2,488 | | | | Ongoing | |
Queensland - Outback Construction | | 315 | | | | | | | 89,678 | | | | Ongoing | |
Sunshine Coast Construction | | 316 | | | | | | | 1,994 | | | | Ongoing | |
Toowoomba Construction | | 317 | | | | | | | 6,778 | | | | Ongoing | |
Townsville Construction | | 318 | | | | | | | 32,932 | | | | Ongoing | |
Wide Bay Construction | | 319 | | | | | | | 2,286 | | | | Ongoing | |
Statewide Construction | | Various | | | | | | | 9,000 | | | | Ongoing | |
Brisbane - East Upgrades | | 301 | | | | | | | 1,931 | | | | Ongoing | |
70
Capital Statement 2015-16
| | | | | | | | | | | | | | | | | | |
| Housing and Public Works | |
Project | | Statistical
Area | | Total
Estimated
Cost
$‘000 | | | Expenditure
to
30-06-15
$‘000 | | | Budget
2015-16
$‘000 | | | Post
2015-16
$‘000 | |
Brisbane - North Upgrades | | 302 | | | | | | | | | | | 2,936 | | | | Ongoing | |
Brisbane - South Upgrades | | 303 | | | | | | | | | | | 4,733 | | | | Ongoing | |
Brisbane - West Upgrades | | 304 | | | | | | | | | | | 1,682 | | | | Ongoing | |
Brisbane Inner City Upgrades | | 305 | | | | | | | | | | | 3,289 | | | | Ongoing | |
Cairns Upgrades | | 306 | | | | | | | | | | | 2,727 | | | | Ongoing | |
Darling Downs - Maranoa Upgrades | | 307 | | | | | | | | | | | 1,392 | | | | Ongoing | |
Fitzroy Upgrades | | 308 | | | | | | | | | | | 3,986 | | | | Ongoing | |
Gold Coast Upgrades | | 309 | | | | | | | | | | | 1,225 | | | | Ongoing | |
Ipswich Upgrades | | 310 | | | | | | | | | | | 2,096 | | | | Ongoing | |
Logan - Beaudesert Upgrades | | 311 | | | | | | | | | | | 69 | | | | Ongoing | |
Mackay Upgrades | | 312 | | | | | | | | | | | 2,867 | | | | Ongoing | |
Moreton Bay - North Upgrades | | 313 | | | | | | | | | | | 1,199 | | | | Ongoing | |
Moreton Bay - South Upgrades | | 314 | | | | | | | | | | | 854 | | | | Ongoing | |
Queensland - Outback Upgrades | | 315 | | | | | | | | | | | 13,904 | | | | Ongoing | |
Sunshine Coast Upgrades | | 316 | | | | | | | | | | | 3,624 | | | | Ongoing | |
Toowoomba Upgrades | | 317 | | | | | | | | | | | 1,150 | | | | Ongoing | |
Townsville Upgrades | | 318 | | | | | | | | | | | 9,085 | | | | Ongoing | |
Wide Bay Upgrades | | 319 | | | | | | | | | | | 4,079 | | | | Ongoing | |
Statewide Upgrades | | Various | | | | | | | | | | | 33,871 | | | | Ongoing | |
Statewide Land | | Various | | | | | | | | | | | 16,657 | | | | Ongoing | |
Cairns Purchase of existing properties | | 306 | | | | | | | | | | | 3,500 | | | | Ongoing | |
Townsville Purchase of existing properties | | 318 | | | | | | | | | | | 2,100 | | | | Ongoing | |
Statewide Purchase of existing properties | | Various | | | | | | | | | | | 2,775 | | | | Ongoing | |
Other Plant and Equipment | | Various | | | | | | | | | | | 1,701 | | | | Ongoing | |
| | | | | | | | | | | | | | | | | | |
Sub-total Housing Services | | | | | | | | | | | | | 328,943 | | | | | |
| | | | | | | | | | | | | | | | | | |
| | | | | |
Public Works | | | | | | | | | | | | | | | | | | |
Brisbane - Boggo Road Precinct Redevelopment | | 303 | | | 42,067 | | | | 39,147 | | | | 1,199 | | | | 1,721 | |
Building Works and Capital Replacements | | Various | | | | | | | | | | | 8,478 | | | | Ongoing | |
Cairns - Convention Centre Roof Repairs | | 306 | | | 7,200 | | | | | | | | 6,200 | | | | 1,000 | |
Government Employee Housing | | Various | | | | | | | | | | | 9,370 | | | | Ongoing | |
Government House Refurbishment and Equitable Access | | 305 | | | 3,335 | | | | 3,035 | | | | 300 | | | | | |
71
Capital Statement 2015-16
| | | | | | | | | | | | | | | | | | |
| Housing and Public Works | |
Project | | Statistical
Area | | Total
Estimated
Cost
$‘000 | | | Expenditure
to
30-06-15
$‘000 | | | Budget
2015-16
$‘000 | | | Post
2015-16
$‘000 | |
Other Property, Plant and Equipment | | Various | | | | | | | | | | | 1,931 | | | | Ongoing | |
Thursday Island - Queensland Health Staff Accommodation | | 315 | | | 12,745 | | | | 833 | | | | 11,912 | | | | | |
| | | | | | | | | | | | | | | | | | |
Sub-total Public Works | | | | | | | | | | | | | 39,390 | | | | | |
| | | | | | | | | | | | | | | | | | |
| | | | | | | | | | | | | | | | | | |
| | | | | | | | | | | | | | | | | | |
Total Property, Plant and Equipment | | | | | | | | | | | | | 368,333 | | | | | |
| | | | | | | | | | | | | | | | | | |
| | | | | |
Capital Grants | | | | | | | | | | | | | | | | | | |
Housing Services | | | | | | | | | | | | | | | | | | |
Brisbane - North Capital Grants | | 302 | | | | | | | | | | | 1,683 | | | | Ongoing | |
Brisbane - South Capital Grants | | 303 | | | | | | | | | | | 8,740 | | | | Ongoing | |
Cairns Capital Grants | | 306 | | | | | | | | | | | 15,684 | | | | Ongoing | |
Queensland - Outback Capital Grants | | 315 | | | | | | | | | | | 19,452 | | | | Ongoing | |
Townsville Capital Grants | | 318 | | | | | | | | | | | 3,911 | | | | Ongoing | |
Wide Bay Capital Grants | | 319 | | | | | | | | | | | 7,128 | | | | Ongoing | |
Statewide Capital Grants | | Various | | | | | | | | | | | 10,701 | | | | Ongoing | |
| | | | | | | | | | | | | | | | | | |
Sub-total Housing Services | | | | | | | | | | | | | 67,299 | | | | | |
| | | | | | | | | | | | | | | | | | |
| | | | | | | | | | | | | | | | | | |
| | | | | | | | | | | | | | | | | | |
Total Capital Grants | | | | | | | | | | | | | 67,299 | | | | | |
| | | | | | | | | | | | | | | | | | |
| | | | | |
QUEENSLAND BUILDING AND CONSTRUCTION COMMISSION | | | | | | | | | | | | | | | | | | |
| | | | | |
Property, Plant and Equipment | | | | | | | | | | | | | | | | | | |
Other Property, Plant and Equipment | | 303 | | | | | | | | | | | 563 | | | | Ongoing | |
QBCC Software | | 303 | | | 3,468 | | | | 1,004 | | | | 2,464 | | | | | |
Leasehold Restoration | | 303 | | | 500 | | | | | | | | 500 | | | | | |
Leasehold Restoration | | 317 | | | 585 | | | | | | | | 585 | | | | | |
Leasehold Restoration | | 319 | | | 545 | | | | | | | | 545 | | | | | |
| | | | | | | | | | | | | | | | | | |
Total Property, Plant and Equipment | | | | | | | | | | | | | 4,657 | | | | | |
| | | | | | | | | | | | | | | | | | |
| | | | | |
RESIDENTIAL TENANCIES AUTHORITY | | | | | | | | | | | | | | | | | | |
| | | | | |
Property, Plant and Equipment | | | | | | | | | | | | | | | | | | |
myRTA Platform (CCSP)1 | | 305 | | | 11,637 | | | | 3,663 | | | | 7,974 | | | | | |
Asset Replacement Program | | 305 | | | 957 | | | | 217 | | | | 215 | | | | 525 | |
72
Capital Statement 2015-16
| | | | | | | | | | | | | | | | |
| Housing and Public Works | |
Project | | Statistical
Area | | Total
Estimated
Cost
$‘000 | | | Expenditure
to
30-06-15
$‘000 | | Budget
2015-16
$‘000 | | | Post
2015-16
$‘000 | |
Program Delivery Projects | | 305 | | | 2,729 | | | | | | 332 | | | | 2,397 | |
| | | | | | | | | | | | | | | | |
Total Property, Plant and Equipment | | | | | | | | | | | 8,521 | | | | | |
| | | | | | | | | | | | | | | | |
| | | | | | | | | | | | | | | | |
| | | | | | | | | | | | | | | | |
TOTAL HOUSING AND PUBLIC WORKS (PPE) | | | | | | | | | | | 381,511 | | | | | |
| | | | | | | | | | | | | | | | |
| | | | | | | | | | | | | | | | |
| | | | | | | | | | | | | | | | |
TOTAL HOUSING AND PUBLIC WORKS (CG) | | | | | | | | | | | 67,299 | | | | | |
| | | | | | | | | | | | | | | | |
Note:
| 1. | The Core Client System Program (CCSP) was officially renamed as the myRTA program in the 2014-15 financial year. |
73
Capital Statement 2015-16
INFRASTRUCTURE, LOCAL GOVERNMENT AND PLANNING
In 2015-16, the Infrastructure, Local Government and Planning portfolio, including Economic Development Queensland, South Bank Corporation, and Queensland Reconstruction Authority, has capital purchases of $47.7 million and capital grants of $592.8 million.
Department of Infrastructure, Local Government and Planning
In 2015-16, the capital expenditure for the Department of Infrastructure, Local Government and Planning includes capital purchases of $7.2 million and capital grants of $183.9 million.
Program Highlights (Property, Plant and Equipment)
| • | | $7.1 million for the continued work of the Indigenous State Infrastructure Program which aims to improve environmental health conditions for people living in major communities in Indigenous council areas. |
Program Highlights (Capital Grants)
| • | | $16 million for the revitalisation of the riverfront in Rockhampton and the Yeppoon foreshore as part of a total $40 million assistance package. |
| • | | $40 million for the Community Resilience Fund to support Local Governments to deliver critical infrastructure that will develop and improve resilience in the built environment. |
| • | | $44.3 million to be distributed under the Royalties for the Regions Program. |
| • | | $36.1 million for the Local Government Grants and Subsidies Program which provides funding for priority infrastructure projects to meet identified community needs; to support projects that will protect communities and infrastructure from future floods. |
| • | | $17.6 million for the Natural Disaster Resilience Program which will work to build community resilience to natural disasters. |
Economic Development Queensland
In 2015-16, Economic Development Queensland has capital purchases of $25.7 million.
Program Highlights (Property, Plant and Equipment)
| • | | $19 million for continuing works on the Commonwealth Games Athletes Village. |
| • | | $5.3 million for development works in various industrial estates. |
74
Capital Statement 2015-16
South Bank Corporation
In 2015-16, South Bank Corporation has capital works totalling $14.8 million, to be developed in consultation with the Government, to maintain and enhance the value of assets, particularly its investment properties.
Queensland Reconstruction Authority
The capital expenditure for the Queensland Reconstruction Authority in 2015-16 consists of capital grants of $408.9 million. This is funded up to 75 percent by the Australian Government (under the Natural Disaster Relief and Recovery Arrangements) with the remainder funded by the State Government.
Program Highlights (Capital Grants)
| • | | In 2015-16, $408.9 million is being provided to Local Government Authorities to undertake recovery, reconstruction and betterment projects following Tropical Cyclone Marcia and other recovery and reconstruction projects relating to natural disaster events of 2013 to 2015. |
| | | | | | | | | | | | | | | | | | |
| Infrastructure, Local Government and Planning | |
Project | | Statistical
Area | | Total
Estimated
Cost
$‘000 | | | Expenditure
to
30-06-15
$‘000 | | | Budget
2015-16
$‘000 | | | Post
2015-16
$‘000 | |
DEPARTMENT OF INFRASTRUCTURE, LOCAL GOVERNMENT AND PLANNING | | | | | | | | | | | | | | | | | | |
| | | | | |
Property, Plant and Equipment | | | | | | | | | | | | | | | | | | |
Indigenous State Infrastructure Projects | | Various | | | 62,952 | | | | 55,862 | | | | 7,090 | | | | | |
Other Property, Plant and Equipment | | 305 | | | | | | | | | | | 102 | | | | Ongoing | |
| | | | | | | | | | | | | | | | | | |
Total Property, Plant and Equipment | | | | | | | | | | | | | 7,192 | | | | | |
| | | | | | | | | | | | | | | | | | |
| | | | | |
Capital Grants | | | | | | | | | | | | | | | | | | |
Community Resilience Fund | | Various | | | 40,000 | | | | | | | | 40,000 | | | | | |
Indigenous State Infrastructure Projects | | 315 | | | 7,027 | | | | 5,706 | | | | 1,321 | | | | | |
Jezzine Barracks Redevelopment - Townsville | | 318 | | | 8,000 | | | | 6,000 | | | | 2,000 | | | | | |
Kuranda Skyrail and Infrastructure Levy | | 306 | | | | | | | | | | | 744 | | | | Ongoing | |
Local Government Grants and Subsidies Program | | Various | | | | | | | | | | | 36,061 | | | | Ongoing | |
National Insurance Affordability Initiative - Australian Government | | 310 | | | 17,000 | | | | 5,020 | | | | 11,980 | | | | | |
75
Capital Statement 2015-16
| | | | | | | | | | | | | | | | | | |
| Infrastructure, Local Government and Planning | |
Project | | Statistical
Area | | Total
Estimated
Cost
$‘000 | | | Expenditure
to
30-06-15
$‘000 | | | Budget
2015-16
$‘000 | | | Post
2015-16
$‘000 | |
Natural Disaster Resilience Program 2009-12 | | Various | | | 6,804 | | | | 4,555 | | | | 2,249 | | | | | |
Natural Disaster Resilience Program 2009-12 - Australian Government | | Various | | | 7,093 | | | | 4,844 | | | | 2,249 | | | | | |
Natural Disaster Resilience Program 2013-15 | | Various | | | 11,406 | | | | 6,866 | | | | 3,490 | | | | 1,050 | |
Natural Disaster Resilience Program 2013-15 - Australian Government | | Various | | | 22,330 | | | | 6,745 | | | | 9,582 | | | | 6,003 | |
Regional Flood Mitigation Program - Australian Government | | Various | | | 1,820 | | | | 1,580 | | | | 240 | | | | | |
Rockhampton and Livingstone Iconic Projects (Special Assistance Package) | | 308 | | | 40,000 | | | | | | | | 16,000 | | | | 24,000 | |
Royalties for the Region - Round 1 | | Various | | | 20,330 | | | | 12,221 | | | | 7,534 | | | | 575 | |
Royalties for the Region - Round 2 | | Various | | | 41,769 | | | | 16,846 | | | | 19,713 | | | | 5,210 | |
Royalties for the Region - Round 3 | | Various | | | 19,525 | | | | 2,472 | | | | 17,053 | | | | | |
South Bank and Roma Street Parklands | | 305 | | | | | | | | | | | 4,103 | | | | Ongoing | |
Torres Strait Major Infrastructure Program (Stage 5) | | 315 | | | 13,200 | | | | 3,600 | | | | 9,600 | | | | | |
| | | | | | | | | | | | | | | | | | |
Total Capital Grants | | | | | | | | | | | | | 183,919 | | | | | |
| | | | | | | | | | | | | | | | | | |
| | | | | |
ECONOMIC DEVELOPMENT QUEENSLAND | | | | | | | | | | | | | | | | | | |
| | | | | |
Property, Plant and Equipment | | | | | | | | | | | | | | | | | | |
Abbot Point State Development Area | | 312 | | | 6,507 | | | | 507 | | | | 500 | | | | 5,500 | |
Clinton Industrial Development | | 308 | | | 11,695 | | | | 195 | | | | 1,000 | | | | 10,500 | |
Commonwealth Games Athletes Village | | 309 | | | 86,667 | | | | 36,830 | | | | 18,953 | | | | 30,884 | |
Gladstone State Development Area | | 308 | | | 12,601 | | | | 1,601 | | | | 2,000 | | | | 9,000 | |
Townsville Regional Industrial Estate | | 318 | | | 9,750 | | | | | | | | 250 | | | | 9,500 | |
Willowbank Industrial Development | | 310 | | | 74,534 | | | | 10,634 | | | | 1,500 | | | | 62,400 | |
Other Property, Plant and Equipment | | Various | | | 1,500 | | | | | | | | 1,500 | | | | | |
| | | | | | | | | | | | | | | | | | |
Total Property, Plant and Equipment | | | | | | | | | | | | | 25,703 | | | | | |
| | | | | | | | | | | | | | | | | | |
| | | | | |
SOUTH BANK CORPORATION | | | | | | | | | | | | | | | | | | |
| | | | | |
Property, Plant and Equipment | | | | | | | | | | | | | | | | | | |
Capital purchases, enhancement and refurbishment | | 305 | | | | | | | | | | | 3,597 | | | | Ongoing | |
76
Capital Statement 2015-16
| | | | | | | | | | | | | | | | | | |
| Infrastructure, Local Government and Planning | |
Project | | Statistical
Area | | Total
Estimated
Cost $‘000 | | | Expenditure
to
30-06-15
$‘000 | | | Budget
2015-16
$‘000 | | | Post
2015-16
$‘000 | |
Enhancements - investment properties | | 305 | | | | | | | | | | | 6,701 | | | | Ongoing | |
Capital purchases, enhancement and refurbishment - Brisbane Convention and Exhibition Centre | | 305 | | | | | | | | | | | 4,475 | | | | Ongoing | |
| | | | | | | | | | | | | | | | | | |
Total Property, Plant and Equipment | | | | | | | | | | | | | 14,773 | | | | | |
| | | | | | | | | | | | | | | | | | |
| | | | | |
QUEENSLAND RECONSTRUCTION AUTHORITY | | | | | | | | | | | | | | | | | | |
| | | | | |
Capital Grants | | | | | | | | | | | | | | | | | | |
2015 Local Government Authorities Other Assistance Package | | Various | | | 20,000 | | | | | | | | 6,000 | | | | 14,000 | |
Local Government Authorities | | Various | | | 4,546,644 | | | | 3,879,982 | | | | 402,912 | | | | 263,750 | |
| | | | | | | | | | | | | | | | | | |
Total Capital Grants | | | | | | | | | | | | | 408,912 | | | | | |
| | | | | | | | | | | | | | | | | | |
| | | | | | | | | | | | | | | | | | |
| | | | | | | | | | | | | | | | | | |
TOTAL INFRASTRUCTURE, LOCAL GOVERNMENT AND PLANNING (PPE) | | | | | | | | | | | | | 47,668 | | | | | |
| | | | | | | | | | | | | | | | | | |
| | | | | | | | | | | | | | | | | | |
| | | | | | | | | | | | | | | | | | |
TOTAL INFRASTRUCTURE, LOCAL GOVERNMENT AND PLANNING (CG) | | | | | | | | | | | | | 592,831 | | | | | |
| | | | | | | | | | | | | | | | | | |
77
Capital Statement 2015-16
JUSTICE AND ATTORNEY-GENERAL
The 2015-16 capital purchases for the Justice and Attorney-General portfolio (including the Public Trustee of Queensland, Legal Aid Queensland and Crime and Corruption Commission) total $98.8 million.
Department of Justice and Attorney-General
The Department of Justice and Attorney-General capital purchases for 2015-16 are $82 million. The department’s capital purchases will primarily focus on prison infrastructure, perimeter security upgrades, correctional centre enhancements, the security management system upgrade and the programmed renewal and minor works of courthouses and youth justice facilities.
Program Highlights (Property, Plant and Equipment)
| • | | $10.3 million towards the Perimeter Security Upgrade Program - Stage 2. This program will upgrade the perimeter security at various correctional centres over seven years, which is due for completion in 2019-20. |
| • | | $8.1 million to complete the recommissioning of Borallon Correctional Centre. |
| • | | $10.4 million in correctional centre enhancements including Lotus Glen Correctional Centre, Southern Queensland Correctional Centre and the upgrade of the power supply at Woodford Correctional Centre. |
| • | | $6.4 million towards the upgrade of the security management system at the Brisbane Youth Detention Centre, due for completion in 2016-17. |
| • | | $18.6 million for the on-going programmed renewal, maintenance and minor works of courthouses and youth justice facilities. |
Public Trustee of Queensland
The 2015-16 capital purchases for the Public Trustee of Queensland are $13.5 million. The Public Trustee continues to re-develop regional offices to improve efficiency of frontline service delivery and accessibility to all clients, as well as continuing to maintain appropriate workplace health and safety standards for clients and staff.
Program Highlights (Property, Plant and Equipment)
The total capital budget for 2015-16 includes:
| • | | $10.6 million for building improvements and refurbishment in existing regional offices and head office. |
| • | | $1.8 million for furniture and fittings and computer hardware. |
| • | | $1.1 million as part of the strategy to upgrade business systems on an ongoing basis. |
78
Capital Statement 2015-16
Legal Aid Queensland
Legal Aid Queensland’s 2015-16 capital expenditure program is $2.1 million. Legal Aid Queensland will invest $1.4 million on major property, plant and equipment projects including the refurbishment of the Inala office along with the assessment of refurbishment or relocation of the Southport office.
Subject to the outcome associated with Legal Aid Queensland’s Brisbane CBD accommodation strategy expected in early 2015-16, planning and design capital expenditure has been included for the continued refurbishment of the offices at 44 Herschel Street Brisbane.
A further $662,000 will be invested to maintain Legal Aid Queensland’s business systems, replace motor vehicles and purchase minor property, plant and equipment.
Crime and Corruption Commission
The Crime and Corruption Commission will spend $1.2 million on its capital purchases in 2015-16. The Commission will invest $617,000 on vehicle replacement and $598,000 in computer and other equipment replacement.
| | | | | | | | | | | | | | | | | | |
| Justice and Attorney-General | |
Project | | Statistical
Area | | Total
Estimated
Cost
$‘000 | | | Expenditure
to
30-06-15
$‘000 | | | Budget
2015-16
$‘000 | | | Post
2015-16
$‘000 | |
DEPARTMENT OF JUSTICE AND ATTORNEY-GENERAL | | | | | | | | | | | | | | | | | | |
| | | | | |
Property, Plant and Equipment | | | | | | | | | | | | | | | | | | |
Queensland Corrective Services | | | | | | | | | | | | | | | | | | |
Major Works - Correctional Centres | | | | | | | | | | | | | | | | | | |
Borallon Correctional Centre - Recommission | | 310 | | | 56,250 | | | | 48,200 | | | | 8,050 | | | | | |
Perimeter Security Upgrade - Stage 2 | | Various | | | 76,579 | | | | 528 | | | | 10,270 | | | | 65,781 | |
Southern Qld Correctional Centre | | 317 | | | 1,000 | | | | | | | | 1,000 | | | | | |
| | | | | | | | | | | | | | | | | | |
Sub-total Major Works - Correctional Centres | | | | | | | | | | | | | 19,320 | | | | | |
| | | | | | | | | | | | | | | | | | |
| | | | | |
Correctional Centre Enhancements | | | | | | | | | | | | | | | | | | |
Lotus Glen Correctional Centre | | 306 | | | 7,000 | | | | 4,733 | | | | 2,267 | | | | | |
Southern Qld Correctional Centre | | 317 | | | 11,080 | | | | 9,214 | | | | 1,866 | | | | | |
79
Capital Statement 2015-16
| | | | | | | | | | | | | | | | | | |
| Justice and Attorney-General | |
Project | | Statistical
Area | | Total
Estimated
Cost
$‘000 | | | Expenditure
to
30-06-15
$‘000 | | | Budget
2015-16
$‘000 | | | Post
2015-16
$‘000 | |
Woodford Correctional Centre - upgrade power supply | | 313 | | | 2,000 | | | | 150 | | | | 1,850 | | | | | |
Prison infrastructure | | Various | | | 8,435 | | | | 7,550 | | | | 885 | | | | | |
Correctional Centre Enhancements | | Various | | | 3,500 | | | | | | | | 3,500 | | | | | |
| | | | | | | | | | | | | | | | | | |
Sub-total Correctional Centre Enhancements | | | | | | | | | | | | | 10,368 | | | | | |
| | | | | | | | | | | | | | | | | | |
| | | | | |
Probation and Parole office accommodation | | Various | | | | | | | | | | | 4,255 | | | | Ongoing | |
Other acqusitions of property, plant and equipment | | Various | | | | | | | | | | | 11,450 | | | | Ongoing | |
| | | | | | | | | | | | | | | | | | |
Sub-total Queensland Corrective Services | | | | | | | | | | | | | 45,393 | | | | | |
| | | | | | | | | | | | | | | | | | |
| | | | | |
Youth Justice Services | | | | | | | | | | | | | | | | | | |
Brisbane Youth Detention Centre - Security Management System Upgrade | | 304 | | | 9,344 | | | | 178 | | | | 6,396 | | | | 2,770 | |
Cleveland Youth Detention Centre - Building Security Upgrade | | 318 | | | 3,400 | | | | 200 | | | | 3,200 | | | | | |
Youth Justice Facilities | | Various | | | | | | | | | | | 7,533 | | | | Ongoing | |
Youth Justice Facilities, Minor Capital Works | | Various | | | | | | | | | | | 319 | | | | Ongoing | |
| | | | | | | | | | | | | | | | | | |
Sub-total Youth Justice Services | | | | | | | | | | | | | 17,448 | | | | | |
| | | | | | | | | | | | | | | | | | |
| | | | | |
Justice Services | | | | | | | | | | | | | | | | | | |
Courthouses, Programmed Renewal | | Various | | | | | | | | | | | 7,374 | | | | Ongoing | |
Courthouses, Minor Capital Works | | Various | | | | | | | | | | | 3,381 | | | | Ongoing | |
Other acquisitions of property, plant and equipment | | Various | | | | | | | | | | | 1,158 | | | | Ongoing | |
Queensland Wide Integrated Courts (QWIC) System - Enhancements | | 305 | | | | | | | | | | | 715 | | | | Ongoing | |
Minor capital works - software | | 305 | | | | | | | | | | | 300 | | | | Ongoing | |
| | | | | | | | | | | | | | | | | | |
Sub-total Justice Services | | | | | | | | | | | | | 12,928 | | | | | |
| | | | | | | | | | | | | | | | | | |
| | | | | |
Other Departmental | | | | | | | | | | | | | | | | | | |
Minor Capital Works - Software | | 305 | | | | | | | | | | | 3,992 | | | | Ongoing | |
Leasehold Improvements | | Various | | | | | | | | | | | 1,269 | | | | Ongoing | |
80
Capital Statement 2015-16
| | | | | | | | | | | | | | | | | | |
| Justice and Attorney-General | |
Project | | Statistical
Area | | Total
Estimated
Cost
$‘000 | | | Expenditure
to
30-06-15
$‘000 | | | Budget
2015-16
$‘000 | | | Post
2015-16
$‘000 | |
Other acquisitions of property, plant and equipment | | Various | | | | | | | | | | | 946 | | | | Ongoing | |
| | | | | | | | | | | | | | | | | | |
Sub-total Other Departmental | | | | | | | | | | | | | 6,207 | | | | | |
| | | | | | | | | | | | | | | | | | |
| | | | | | | | | | | | | | | | | | |
| | | | | | | | | | | | | | | | | | |
Total Property, Plant and Equipment | | | | | | | | | | | | | 81,976 | | | | | |
| | | | | | | | | | | | | | | | | | |
| | | | | |
PUBLIC TRUSTEE OF QUEENSLAND | | | | | | | | | | | | | | | | | | |
| | | | | |
Property, Plant and Equipment | | | | | | | | | | | | | | | | | | |
Building refurbishment | | Various | | | | | | | | | | | 798 | | | | Ongoing | |
Building improvements | | Various | | | | | | | | | | | 9,815 | | | | Ongoing | |
Furniture and fitting | | Various | | | | | | | | | | | 1,550 | | | | Ongoing | |
Computer hardware | | 305 | | | | | | | | | | | 250 | | | | Ongoing | |
Computer software | | 305 | | | | | | | | | | | 1,100 | | | | Ongoing | |
| | | | | | | | | | | | | | | | | | |
Total Property, Plant and Equipment | | | | | | | | | | | | | 13,513 | | | | | |
| | | | | | | | | | | | | | | | | | |
| | | | | |
LEGAL AID QUEENSLAND | | | | | | | | | | | | | | | | | | |
| | | | | |
Property, Plant and Equipment | | | | | | | | | | | | | | | | | | |
Brisbane building refurbishment | | 305 | | | 969 | | | | 744 | | | | 225 | | | | | |
Leasehold Improvements | | | | | | | | | | | | | | | | | | |
Inala office refurbishment | | 310 | | | 255 | | | | | | | | 255 | | | | | |
Southport office refurbishment | | 309 | | | 798 | | | | 33 | | | | 765 | | | | | |
Other office refurbishment | | Various | | | | | | | | | | | 144 | | | | Ongoing | |
| | | | | | | | | | | | | | | | | | |
Sub-total Leasehold Improvements | | | | | | | | | | | | | 1,164 | | | | | |
| | | | | | | | | | | | | | | | | | |
| | | | | |
IT business systems | | 305 | | | | | | | | | | | 225 | | | | Ongoing | |
Motor vehicle replacement | | 305 | | | 274 | | | | 154 | | | | 120 | | | | | |
Other acquisitions of property. plant and equipment | | Various | | | 317 | | | | | | | | 317 | | | | | |
| | | | | | | | | | | | | | | | | | |
Total Property, Plant and Equipment | | | | | | | | | | | | | 2,051 | | | | | |
| | | | | | | | | | | | | | | | | | |
| | | | | |
CRIME AND CORRUPTION COMMISSION | | | | | | | | | | | | | | | | | | |
| | | | | |
Property, Plant and Equipment | | | | | | | | | | | | | | | | | | |
Vehicle replacement | | 303 | | | | | | | | | | | 617 | | | | Ongoing | |
81
Capital Statement 2015-16
| | | | | | | | | | | | | | |
| Justice and Attorney-General | |
Project | | Statistical
Area | | Total
Estimated
Cost
$‘000 | | Expenditure
to
30-06-15
$‘000 | | Budget
2015-16
$‘000 | | | Post
2015-16
$‘000 | |
Computer and other equipment | | 305 | | | | | | | 598 | | | | Ongoing | |
| | | | | | | | | | | | | | |
Total Property, Plant and Equipment | | | | | | | | | 1,215 | | | | | |
| | | | | | | | | | | | | | |
| | | | | | | | | | | | | | |
| | | | | | | | | | | | | | |
TOTAL JUSTICE AND ATTORNEY-GENERAL (PPE) | | | | | | | | | 98,755 | | | | | |
| | | | | | | | | | | | | | |
82
Capital Statement 2015-16
LEGISLATIVE ASSEMBLY OF QUEENSLAND
Legislative Assembly of Queensland
Total capital purchases for the Legislative Assembly of Queensland are $8.4 million in 2015-16. Significant capital purchases include commencing implementation of a fire protection system for the heritage listed Parliament House building, rectification works on level 7 of the Parliamentary Annexe, the ongoing Parliament House stonework restoration program, and the replacement of various information technology infrastructure, plant and equipment.
| | | | | | | | | | | | | | | | | | |
| Legislative Assembly of Queensland | |
Project | | Statistical
Area | | Total
Estimated
Cost
$‘000 | | | Expenditure
to
30-06-15
$‘000 | | | Budget
2015-16
$‘000 | | | Post
2015-16
$‘000 | |
LEGISLATIVE ASSEMBLY OF QUEENSLAND | | | | | | | | | | | | | | | | | | |
| | | | | |
Property, Plant and Equipment | | | | | | | | | | | | | | | | | | |
Parliament House stonework restoration | | 305 | | | 6,160 | | | | 4,764 | | | | 500 | | | | 896 | |
Data cabling upgrade | | 305 | | | 500 | | | | 350 | | | | 150 | | | | | |
Precinct audio visual equipment | | 305 | | | 900 | | | | 400 | | | | 100 | | | | 400 | |
Parliament House fire protection system | | 305 | | | 5,621 | | | | | | | | 2,227 | | | | 3,394 | |
Rectification works for the Parliamentary Annexe | | 305 | | | 3,000 | | | | | | | | 3,000 | | | | | |
Electorate Office Accommodation Improvement Program | | 305 | | | | | | | | | | | 600 | | | | Ongoing | |
Other property, plant and equipment to be prioritised by the Speaker | | 305 | | | | | | | | | | | 1,820 | | | | Ongoing | |
| | | | | | | | | | | | | | | | | | |
Total Property, Plant and Equipment | | | | | | | | | | | | | 8,397 | | | | | |
| | | | | | | | | | | | | | | | | | |
| | | | | | | | | | | | | | | | | | |
| | | | | | | | | | | | | | | | | | |
TOTAL LEGISLATIVE ASSEMBLY OF QUEENSLAND (PPE) | | | | | | | | | | | | | 8,397 | | | | | |
| | | | | | | | | | | | | | | | | | |
83
Capital Statement 2015-16
NATIONAL PARKS, SPORT AND RACING
Total capital outlays for the Department of National Parks, Sport and Racing and Stadiums Queensland are $153.6 million for 2015-16.
Department of National Parks, Sport and Racing
Capital purchases for the Department of National Parks, Sport and Racing for 2015-16 are $38.6 million, with $84.2 million in capital grants.
The department’s objectives are to manage protected areas to ensure their sustainability, encourage active participation in recreation and sport and ensure the integrity of the racing industry across the state. The department has three service areas working towards these objectives: National Parks; Sport and Recreation; and Racing.
The 2015-16 capital program directly supports these objectives through significant capital grant programs for Sport and Recreation and Racing; a significant capital works program for National Parks and Sport and Recreation; ongoing replacement of plant and equipment; and development of systems to support delivery of its frontline services.
Program Highlights (Property, Plant and Equipment)
| • | | $4.8 million for the development of management bases, ranger accommodation and supporting infrastructure on Cape York Peninsula. |
| • | | $3.3 million towards construction of internal roads, fences, signage and firebreaks, the establishment of management bases and ranger accommodation, and for the purchase of plant and equipment for newly acquired properties. |
| • | | $2.3 million for visitor access and park management facilities and equipment on North Stradbroke Island, jointly managed with the Quandamooka Yoolooburrabee Aboriginal Corporation. |
| • | | $1.6 million towards the refurbishment of the Carnarvon visitor information centre and office. |
| • | | $1.5 million for improvements and upgrades to high priority urban interface firelines. |
| • | | $1.1 million towards the replacement of visitor amenities at Eurong and Dundaburra on Fraser Island. |
| • | | $1.1 million towards the development of management infrastructure at the Curtis Island Environmental Management Precinct. |
84
Capital Statement 2015-16
| • | | $0.7 million for vessel replacements and plant and equipment for the Great Barrier Reef Region, jointly funded through the Great Barrier Reef Field Management Program. |
| • | | $11.7 million in various other capital works and property plant and equipment purchases for parks and forests. |
| • | | $6.5 million towards the $7.1 million redevelopment of the Sunshine Coast Recreation Centre. |
| • | | $3.6 million to maintain and upkeep Queensland Recreation Centres, Sports Reserves and Sports Houses throughout the state as well as the Racing Science Centre. |
Program Highlights (Capital Grants)
| • | | $14.6 million in capital grants from the Racing Industry Capital Development Scheme and $23.4 million under the Racing Infrastructure Fund to assist the racing industry to improve racing infrastructure. |
| • | | $37.2 million under the Get Playing and Get Playing Plus programs to increase participation in sport and recreation through developing infrastructure. |
| • | | $9 million for various capital grants programs to develop sport and recreation activities statewide. |
Stadiums Queensland
Stadiums Queensland’s total 2015-16 capital outlays are $30.8 million, which includes $15.8 million to maintain Queensland’s major sports facilities to a standard appropriate for the conduct of national and international events, and community sports activity.
Program Highlights (Property, Plant and Equipment)
| • | | $15 million in 2015-16 towards the development of a state netball facility at the Queensland Sport and Athletics Centre, in partnership with Netball Queensland with a total funding package of $30 million over 2 years. |
85
Capital Statement 2015-16
| | | | | | | | | | | | | | | | | | |
| National Parks, Sport and Racing | |
Project | | Statistical
Area | | Total
Estimated
Cost
$‘000 | | | Expenditure
to
30-06-15
$‘000 | | | Budget
2015-16
$‘000 | | | Post
2015-16
$‘000 | |
DEPARTMENT OF NATIONAL PARKS, SPORT AND RACING | | | | | | | | | | | | | | | | | | |
| | | | | |
Property, Plant and Equipment | | | | | | | | | | | | | | | | | | |
Management and access facilities - Parks and forests | | Various | | | | | | | | | | | 10,919 | | | | Ongoing | |
Recreation and visitor facilities - Parks and forests | | Various | | | | | | | | | | | 12,285 | | | | Ongoing | |
System Development - Parks and forests | | Various | | | | | | | | | | | 1,405 | | | | Ongoing | |
Various plant and equipment - Parks and forests | | Various | | | | | | | | | | | 3,478 | | | | Ongoing | |
Sunshine Coast Recreation Centre Redevelopment | | 316 | | | 7,100 | | | | 619 | | | | 6,481 | | | | | |
Queensland Recreation Centres and Sport Houses Capital Works | | Various | | | | | | | | | | | 3,114 | | | | Ongoing | |
Various plant and equipment - Sport and Recreation | | Various | | | | | | | | | | | 253 | | | | Ongoing | |
Various plant and equipment - Racing | | Various | | | | | | | | | | | 251 | | | | Ongoing | |
Various plant and equipment - Departmental | | Various | | | | | | | | | | | 400 | | | | Ongoing | |
| | | | | | | | | | | | | | | | | | |
Total Property, Plant and Equipment | | | | | | | | | | | | | 38,586 | | | | | |
| | | | | | | | | | | | | | | | | | |
| | | | | |
Capital Grants | | | | | | | | | | | | | | | | | | |
Get Playing Plus | | Various | | | 42,635 | | | | | | | | 17,966 | | | | 24,669 | |
Get Playing Rounds 1-3 | | Various | | | 28,700 | | | | 20,500 | | | | 8,200 | | | | | |
Get Playing Rounds 4-6 | | Various | | | 33,000 | | | | | | | | 11,000 | | | | 22,000 | |
Various capital grants - Sport and Recreation | | Various | | | 9,048 | | | | | | | | 9,048 | | | | | |
Racing Industry Capital Development Scheme | | Various | | | 66,305 | | | | 51,747 | | | | 14,558 | | | | | |
Racing Infrastructure Fund | | Various | | | 118,696 | | | | | | | | 23,437 | | | | 95,259 | |
| | | | | | | | | | | | | | | | | | |
Total Capital Grants | | | | | | | | | | | | | 84,209 | | | | | |
| | | | | | | | | | | | | | | | | | |
| | | | | |
STADIUMS QUEENSLAND | | | | | | | | | | | | | | | | | | |
| | | | | |
Property, Plant and Equipment | | | | | | | | | | | | | | | | | | |
Annual capital and maintenance program | | Various | | | | | | | | | | | 15,755 | | | | Ongoing | |
86
Capital Statement 2015-16
| | | | | | | | | | | | | | | | |
| National Parks, Sport and Racing | |
Project | | Statistical
Area | | Total
Estimated
Cost
$‘000 | | | Expenditure
to
30-06-15
$‘000 | | Budget
2015-16
$‘000 | | | Post
2015-16
$‘000 | |
State netball facility | | 303 | | | 30,000 | | | | | | 15,000 | | | | 15,000 | |
| | | | | | | | | | | | | | | | |
Total Property, Plant and Equipment | | | | | | | | | | | 30,755 | | | | | |
| | | | | | | | | | | | | | | | |
| | | | | | | | | | | | | | | | |
| | | | | | | | | | | | | | | | |
TOTAL NATIONAL PARKS, SPORT AND RACING (PPE) | | | | | | | | | | | 69,341 | | | | | |
| | | | | | | | | | | | | | | | |
| | | | | | | | | | | | | | | | |
| | | | | | | | | | | | | | | | |
TOTAL NATIONAL PARKS, SPORT AND RACING (CG) | | | | | | | | | | | 84,209 | | | | | |
| | | | | | | | | | | | | | | | |
87
Capital Statement 2015-16
NATURAL RESOURCES AND MINES
Total capital purchases for the Natural Resources and Mines portfolio for 2015-16 is $21.8 million.
Department of Natural Resources and Mines
As an economic development agency, the Department of Natural Resources and Mines’ purpose is to create opportunities as the champion for the sustained use of our natural resources now and into the future. The capital purchases support this primarily through modifications and enhancements for critical business systems.
Program Highlights (Property, Plant and Equipment)
| • | | $7.8 million for the Modernising Our Online Services Environment program that will contribute to the department’s goal of reconfiguring and enhancing our ageing information and communication technology portfolio to contemporary and flexible platforms, assisting the department to improve the ease and speed at which online services can be provided to customers and respond more quickly to future business needs. |
| • | | $5 million for the Zillmere Core Library Extension initiative for the construction of additional core storage, adjacent to the existing Exploration Data Centre at Zillmere Government Precinct. The extension of the purpose-built storage facility will enable the State to preserve economically and scientifically valuable sections of core to ensure that this resource of subsurface knowledge is not lost. |
| | | | | | | | | | | | | | | | | | |
| Natural Resources and Mines | |
Project | | Statistical
Area | | Total
Estimated
Cost
$‘000 | | | Expenditure
to
30-06-15
$‘000 | | | Budget
2015-16
$‘000 | | | Post
2015-16
$‘000 | |
DEPARTMENT OF NATURAL RESOURCES AND MINES | | | | | | | | | | | | | | | | | | |
| | | | | |
Property, Plant and Equipment | | | | | | | | | | | | | | | | | | |
Modernising Our Online Services Environment program | | 305 | | | | | | | | | | | 7,764 | | | | Ongoing | |
Zillmere Core Library Extension initiative | | 302 | | | 5,000 | | | | 50 | | | | 4,950 | | | | | |
Systems development | | 305 | | | | | | | | | | | 5,001 | | | | Ongoing | |
Other property, plant and equipment | | Various | | | | | | | | | | | 4,074 | | | | Ongoing | |
| | | | | | | | | | | | | | | | | | |
Total Property, Plant and Equipment | | | | | | | | | | | | | 21,789 | | | | | |
| | | | | | | | | | | | | | | | | | |
| | | | | | | | | | | | | | | | | | |
| | | | | | | | | | | | | | | | | | |
TOTAL NATURAL RESOURCES AND MINES (PPE) | | | | | | | | | | | | | 21,789 | | | | | |
| | | | | | | | | | | | | | | | | | |
88
Capital Statement 2015-16
OFFICE OF THE GOVERNOR
During 2015-16, the Office of the Governor’s capital purchases will be $64,000 for the replacement of plant and equipment. Ongoing replacement of capital items enables the Office of the Governor to effectively and efficiently support the Governor in his role.
| | | | | | | | | | | | | | |
| Office of the Governor | |
Project | | Statistical
Area | | Total
Estimated
Cost
$‘000 | | Expenditure
to
30-06-15
$‘000 | | Budget
2015-16
$‘000 | | | Post
2015-16
$‘000 | |
OFFICE OF THE GOVERNOR | | | | | | | | | | | | | | |
| | | | | |
Property, Plant and Equipment | | | | | | | | | | | | | | |
Replacement of plant and equipment | | 305 | | | | | | | 64 | | | | Ongoing | |
| | | | | | | | | | | | | | |
Total Property, Plant and Equipment | | | | | | | | | 64 | | | | | |
| | | | | | | | | | | | | | |
| | | | | | | | | | | | | | |
| | | | | | | | | | | | | | |
TOTAL OFFICE OF THE GOVERNOR (PPE) | | | | | | | | | 64 | | | | | |
| | | | | | | | | | | | | | |
89
Capital Statement 2015-16
OFFICE OF THE OMBUDSMAN
The Office of the Ombudsman’s capital purchases will be $80,000 in 2015-16 to complete a redevelopment of the Office website.
| | | | | | | | | | | | | | | | | | |
| Office of the Ombudsman | |
Project | | Statistical
Area | | Total
Estimated
Cost
$‘000 | | | Expenditure
to
30-06-15
$‘000 | | | Budget
2015-16
$‘000 | | | Post
2015-16
$‘000 | |
OFFICE OF THE OMBUDSMAN | | | | | | | | | | | | | | | | | | |
| | | | | |
Property, Plant and Equipment | | | | | | | | | | | | | | | | | | |
Office website | | 305 | | | 150 | | | | 70 | | | | 80 | | | | | |
Brisbane office and computer equipment | | 305 | | | | | | | | | | | | | | | Ongoing | |
| | | | | | | | | | | | | | | | | | |
Total Property, Plant and Equipment | | | | | | | | | | | | | 80 | | | | | |
| | | | | | | | | | | | | | | | | | |
| | | | | | | | | | | | | | | | | | |
| | | | | | | | | | | | | | | | | | |
TOTAL OFFICE OF THE OMBUDSMAN (PPE) | | | | | | | | | | | | | 80 | | | | | |
| | | | | | | | | | | | | | | | | | |
90
Capital Statement 2015-16
QUEENSLAND POLICE SERVICE
Most new and ongoing capital initiatives to support the operational capability of the Queensland Police Service (QPS) are provided by the Public Safety Business Agency. This includes police accommodation facilities, motor vehicles, vessels and information technology. In 2015-16, the QPS will invest $32 million in capital purchases.
Program Highlights (Property, Plant and Equipment)
| • | | $7.2 million for Camera Detected Offence Program equipment. |
| • | | $24.8 million for other property, plant and equipment including the replacement of operational assets. |
| | | | | | | | | | | | | | |
| Queensland Police Service | |
Project | | Statistical
Area | | Total
Estimated
Cost
$‘000 | | Expenditure
to
30-06-15
$‘000 | | Budget
2015-16
$‘000 | | | Post
2015-16
$‘000 | |
QUEENSLAND POLICE SERVICE | | | | | | | | | | | | | | |
| | | | | |
Property, Plant and Equipment | | | | | | | | | | | | | | |
Camera Detected Offence Program | | Various | | | | | | | 7,200 | | | | Ongoing | |
Other plant and equipment | | Various | | | | | | | 24,754 | | | | Ongoing | |
| | | | | | | | | | | | | | |
Total Property, Plant and Equipment | | | | | | | | | 31,954 | | | | | |
| | | | | | | | | | | | | | |
| | | | | | | | | | | | | | |
| | | | | | | | | | | | | | |
TOTAL QUEENSLAND POLICE SERVICE (PPE) | | | | | | | | | 31,954 | | | | | |
| | | | | | | | | | | | | | |
91
Capital Statement 2015-16
PREMIER AND CABINET
Department of the Premier and Cabinet
The Department of the Premier and Cabinet (including Ministerial Offices and Office of the Leader of the Opposition) has planned capital purchases of $9.2 million and capital grants of $3.7 million in 2015-16.
Program Highlights (Property, Plant and Equipment)
| • | | $7 million (for a total cost of $20.3 million) to renew and replace large critical infrastructure items at the Cultural Precinct, including the central energy plant, electrical safety program, precinct accessibility and mobility, building fabric, vertical transportation and general modernisation. |
| • | | $1 million (for a total cost of $7.6 million) for the creation of a new permanent Anzac Legacy Gallery at the Queensland Museum, South Bank as part of Queensland’s Anzac Centenary commemoration program 2014-18. This project will provide an experiential encounter with one of Australia’s, and the world’s, most significant war relics - the A7V Sturmpanzerwagen armoured assault vehicle, ‘Mephisto’ - and is designed to create an enduring legacy for the people of Queensland beyond 2018. |
| • | | $700,000 for upgrades to the communications and security control room at the Cultural Precinct. |
| • | | $124,000 for eLegislative System completion of integrated legislative drafting, publishing system and website. |
Program Highlights (Capital Grants)
| • | | $3.7 million is provided in 2015-16 for the restoration and enhancement of the state’s war memorials in Brisbane (including $3.3 million for Anzac Square). In 2015-16 the Department of the Premier and Cabinet will continue to support delivery of key projects as part of the State’s Anzac Centenary commemoration program 2014-18. This project is designed to create an enduring legacy for the people of Queensland beyond 2018. |
Queensland Museum
The Queensland Museum will invest $1 million in capital replacements as well as phase one implementation of a new Customer Relationship Management and a Point of Sale system across the museum network.
92
Capital Statement 2015-16
Program Highlights (Property, Plant and Equipment)
| • | | $450,000 investment in life cycle capital replacements including acquired collections. |
| • | | $250,000 investment in information technology primarily for the life cycle replacement of assets and upgrades across the museum network. |
Queensland Art Gallery
The Queensland Art Gallery will invest $2.8 million in acquiring art for the Gallery’s collection as well as life cycle replacement of other property, plant and equipment assets.
Program Highlights (Property, Plant and Equipment)
| • | | $310,000 to replace other property, plant and equipment assets. |
| • | | $2.5 million investment in the acquisition of art for the Gallery’s collection. |
Queensland Performing Arts Trust
The Queensland Performing Arts Trust will invest $1.4 million in IT management software systems, IT network upgrades and the lifecycle replacement of operational property, plant and equipment assets.
Program Highlights (Property, Plant and Equipment)
| • | | $980,000 investment in capital projects that relate to facilities and services such for IT management software systems. |
| • | | $420,000 in life cycle replacement of operational property plant and equipment assets such as IT network upgrades. |
93
Capital Statement 2015-16
| | | | | | | | | | | | | | | | | | |
| Premier and Cabinet | |
Project | | Statistical
Area | | Total
Estimated
Cost
$‘000 | | | Expenditure
to
30-06-15
$‘000 | | | Budget
2015-16
$‘000 | | | Post
2015-16
$‘000 | |
DEPARTMENT OF THE PREMIER AND CABINET | | | | | | | | | | | | | | | | | | |
| | | | | |
Property, Plant and Equipment | | | | | | | | | | | | | | | | | | |
Cultural Precinct Critical Infrastructure | | 305 | | | 20,300 | | | | | | | | 7,017 | | | | 13,283 | |
Anzac Gallery at Queensland Museum South Bank | | 305 | | | 7,600 | | | | 144 | | | | 1,000 | | | | 6,456 | |
Communications and Security Control Upgrade at Cultural Precinct | | 305 | | | 700 | | | | | | | | 700 | | | | | |
eLegislative System | | 305 | | | 2,188 | | | | 2,064 | | | | 124 | | | | | |
Asset replacement program | | 305 | | | | | | | | | | | 349 | | | | Ongoing | |
| | | | | | | | | | | | | | | | | | |
Total Property, Plant and Equipment | | | | | | | | | | | | | 9,190 | | | | | |
| | | | | | | | | | | | | | | | | | |
| | | | | |
Capital Grants | | | | | | | | | | | | | | | | | | |
Anzac Centenary Commemoration Legacy Projects | | 305 | | | 3,658 | | | | | | | | 3,658 | | | | | |
| | | | | | | | | | | | | | | | | | |
Total Capital Grants | | | | | | | | | | | | | 3,658 | | | | | |
| | | | | | | | | | | | | | | | | | |
| | | | | |
QUEENSLAND MUSEUM | | | | | | | | | | | | | | | | | | |
| | | | | |
Property, Plant and Equipment | | | | | | | | | | | | | | | | | | |
Customer Relationship Management and Point of Sale | | 305 | | | 300 | | | | | | | | 300 | | | | | |
Life cycle capital asset replacement and collection acquisition | | 305 | | | 450 | | | | | | | | 450 | | | | | |
Information Technology replacement and upgrades | | 305 | | | 250 | | | | | | | | 250 | | | | | |
| | | | | | | | | | | | | | | | | | |
Total Property, Plant and Equipment | | | | | | | | | | | | | 1,000 | | | | | |
| | | | | | | | | | | | | | | | | | |
| | | | | |
QUEENSLAND ART GALLERY | | | | | | | | | | | | | | | | | | |
| | | | | |
Property, Plant and Equipment | | | | | | | | | | | | | | | | | | |
Purchase of Plant and Equipment | | 305 | | | 310 | | | | | | | | 310 | | | | | |
Acquisition of Art Works for the Gallery | | 305 | | | 2,500 | | | | | | | | 2,500 | | | | | |
| | | | | | | | | | | | | | | | | | |
Total Property, Plant and Equipment | | | | | | | | | | | | | 2,810 | | | | | |
| | | | | | | | | | | | | | | | | | |
94
Capital Statement 2015-16
| | | | | | | | | | | | | | |
| Premier and Cabinet | |
Project | | Statistical
Area | | Total
Estimated
Cost
$‘000 | | Expenditure
to
30-06-15
$‘000 | | Budget
2015-16
$‘000 | | | Post
2015-16
$‘000 | |
QUEENSLAND PERFORMING ARTS TRUST | | | | | | | | | | | | | | |
| | | | | |
Property, Plant and Equipment | | | | | | | | | | | | | | |
IT Management software systems | | 305 | | | | | | | 980 | | | | Ongoing | |
IT Network Upgrade | | 305 | | | | | | | 420 | | | | Ongoing | |
| | | | | | | | | | | | | | |
Total Property, Plant and Equipment | | | | | | | | | 1,400 | | | | | |
| | | | | | | | | | | | | | |
| | | | | | | | | | | | | | |
| | | | | | | | | | | | | | |
TOTAL PREMIER AND CABINET (PPE) | | | | | | | | | 14,400 | | | | | |
| | | | | | | | | | | �� | | | |
| | | | | | | | | | | | | | |
| | | | | | | | | | | | | | |
TOTAL PREMIER AND CABINET (CG) | | | | | | | | | 3,658 | | | | | |
| | | | | | | | | | | | | | |
95
Capital Statement 2015-16
PUBLIC SAFETY BUSINESS AGENCY
The 2015-16 Public Safety Business Agency capital program provides an investment of $178.1 million in capital purchases to support the delivery of essential frontline public safety services to Queensland’s communities.
This investment will fund capital works, information technology and other essential equipment for the Queensland Police Service, Queensland Fire and Emergency Services and the Office of the Inspector-General Emergency Management.
Program highlights (Property, Plant and Equipment):
Queensland Fire and Emergency Services
$55.5 million is provided for fire and emergency services facilities, urban and rural fire appliances and communications equipment including:
| • | | $9.5 million to deliver a replacement permanent fire and rescue station at Petrie, a replacement auxiliary fire and rescue station at Dayboro, and upgrades to permanent fire and rescue stations at Bundamba, Burleigh and Kemp Place. |
| • | | $4 million to progress the replacement permanent fire and rescue station at Bundaberg. |
| • | | $1.2 million to commence the replacement of auxiliary fire and rescue stations at Cunnamulla and Gordonvale, and upgrade the Roma auxiliary fire and rescue station. |
| • | | $2 million to deliver fitout of facilities at Kunda Park and Morningside, and enhancements to the State Disaster Coordination Centre. |
| • | | $4.4 million for strategic land acquisitions and rural land purchases. |
| • | | $27.5 million for replacement and new urban and rural fire appliances. |
| • | | $3.8 million for minor capital works across the State including upgrades of fire and rescue station amenities. |
| • | | $3.1 million for operational and communications equipment. |
Queensland Police Service
$107.8 million is provided for Queensland Police Service facilities, information and communication equipment including:
| • | | $7.7 million to complete the replacement of the police station and watchhouse at Kingaroy and upgrade the Nanango police station. |
| • | | $2.7 million to complete upgrades to the Thursday Island police station and watchhouse, the Police Communications Centre and the Forensic Service facility in Brisbane. |
96
Capital Statement 2015-16
| • | | $1.3 million to complete additional police housing in Bamaga. |
| • | | $2.4 million to provide upgraded closed circuit cameras (CCTV) across the State, including at Sandgate, Townsville, Wynnum and Gladstone watchhouses. |
| • | | $8.9 million for minor capital works across the State. |
| • | | $34.9 million for 15 new and 962 replacement police service vehicles. |
| • | | $43 million for a range of information and communication technology initiatives including mobile services and the Public Safety Network. |
| • | | $5.2 million for major plant and equipment including aircraft maintenance and upgrades. |
Public Safety Business Agency - Other Departmental Capital
$14.9 million is provided to fund information systems development and other plant and equipment including information technology asset replacements across the Public Safety Portfolio and to support the Queensland Ambulance Service information and communication technology.
| | | | | | | | | | | | | | | | | | |
| Public Safety Business Agency | |
Project | | Statistical
Area | | Total
Estimated
Cost
$‘000 | | | Expenditure
to
30-06-15
$‘000 | | | Budget
2015-16
$‘000 | | | Post
2015-16
$‘000 | |
PUBLIC SAFETY BUSINESS AGENCY | | | | | | | | | | | | | | | | | | |
| | | | | |
Property, Plant and Equipment | | | | | | | | | | | | | | | | | | |
Fire and Emergency Services | | | | | | | | | | | | | | | | | | |
Building/General Works | | | | | | | | | | | | | | | | | | |
Bundaberg replacement permanent station | | 319 | | | 6,500 | | | | 50 | | | | 3,950 | | | | 2,500 | |
Bundamba permanent station upgrade | | 310 | | | 1,923 | | | | 50 | | | | 1,873 | | | | | |
Burleigh permanent station upgrade | | 309 | | | 1,817 | | | | 250 | | | | 1,567 | | | | | |
Cunnamulla replacement auxiliary station | | 315 | | | 1,500 | | | | | | | | 350 | | | | 1,150 | |
Dayboro replacement auxiliary station | | 314 | | | 650 | | | | 50 | | | | 600 | | | | | |
Gordonvale replacement auxiliary station | | 306 | | | 2,500 | | | | | | | | 250 | | | | 2,250 | |
97
Capital Statement 2015-16
| | | | | | | | | | | | | | | | | | |
| Public Safety Business Agency | |
Project | | Statistical
Area | | Total
Estimated
Cost
$‘000 | | | Expenditure
to
30-06-15
$‘000 | | | Budget
2015-16
$‘000 | | | Post
2015-16
$‘000 | |
Kemp Place permanent station upgrade | | 305 | | | 1,400 | | | | 50 | | | | 1,350 | | | | | |
Kunda Park Project | | 316 | | | 1,181 | | | | 931 | | | | 250 | | | | | |
Morningside Leased Warehouse Fitout | | 305 | | | 970 | | | | 20 | | | | 950 | | | | | |
Petrie replacement permanent station | | 313 | | | 4,100 | | | | 40 | | | | 4,060 | | | | | |
Roma station upgrade auxiliary station | | 307 | | | 3,600 | | | | | | | | 600 | | | | 3,000 | |
State Disaster Coordination Centre Enhancement | | 305 | | | 1,180 | | | | 380 | | | | 800 | | | | | |
Minor works | | Various | | | | | | | | | | | 3,825 | | | | Ongoing | |
Land | | | | | | | | | | | | | | | | | | |
Strategic land acquisitions | | Various | | | | | | | | | | | 4,345 | | | | Ongoing | |
Rural Operations land purchases | | Various | | | | | | | | | | | 100 | | | | Ongoing | |
Plant and Equipment | | | | | | | | | | | | | | | | | | |
Rural fire appliances | | Various | | | | | | | | | | | 7,500 | | | | Ongoing | |
Urban fire appliances | | Various | | | | | | | | | | | 20,000 | | | | Ongoing | |
Communications equipment | | Various | | | | | | | | | | | 2,530 | | | | Ongoing | |
Other plant and equipment | | Various | | | | | | | | | | | 550 | | | | Ongoing | |
| | | | | | | | | | | | | | | | | | |
Sub-total Fire and Emergency Services | | | | | | | | | | | | | 55,450 | | | | | |
| | | | | | | | | | | | | | | | | | |
| | | | | |
Police Service | | | | | | | | | | | | | | | | | | |
Building/General Works | | | | | | | | | | | | | | | | | | |
Bamaga - residential accommodation | | 315 | | | 1,480 | | | | 150 | | | | 1,330 | | | | | |
Kingaroy replacement station and watchhouse | | 319 | | | 8,300 | | | | 1,411 | | | | 6,889 | | | | | |
Nanango station upgrade | | 319 | | | 1,000 | | | | 200 | | | | 800 | | | | | |
Police Communications Centre and Forensic Service facility upgrade | | 305 | | | 4,923 | | | | 3,033 | | | | 1,890 | | | | | |
Thursday Island station and watchhouse upgrade | | 315 | | | 3,300 | | | | 2,500 | | | | 800 | | | | | |
Closed circuit camera upgrades in various watchhouses | | Various | | | | | | | | | | | 2,420 | | | | Ongoing | |
Minor works | | Various | | | | | | | | | | | 8,905 | | | | Ongoing | |
Plant and Equipment | | | | | | | | | | | | | | | | | | |
Information and communication technology | | Various | | | | | | | | | | | 12,000 | | | | Ongoing | |
98
Capital Statement 2015-16
| | | | | | | | | | | | | | | | | | |
| Public Safety Business Agency | |
Project | | Statistical
Area | | Total
Estimated
Cost
$‘000 | | | Expenditure
to
30-06-15
$‘000 | | | Budget
2015-16
$‘000 | | | Post
2015-16
$‘000 | |
Mobile Services | | Various | | | 20,359 | | | | 1,452 | | | | 14,787 | | | | 4,120 | |
Public Safety Network Management Centre | | 305 | | | | | | | | | | | 16,246 | | | | Ongoing | |
Major plant and equipment | | Various | | | | | | | | | | | 5,180 | | | | Ongoing | |
Other plant and equipment | | Various | | | | | | | | | | | 1,595 | | | | Ongoing | |
Vehicle replacement and growth | | Various | | | | | | | | | | | 34,947 | | | | Ongoing | |
| | | | | | | | | | | | | | | | | | |
Sub-total Police Service | | | | | | | | | | | | | 107,789 | | | | | |
| | | | | | | | | | | | | | | | | | |
| | | | | |
Other Departmental | | | | | | | | | | | | | | | | | | |
Information systems development | | Various | | | | | | | | | | | 14,464 | | | | Ongoing | |
Other property, plant and equipment | | Various | | | | | | | | | | | 423 | | | | Ongoing | |
| | | | | | | | | | | | | | | | | | |
Sub-total Other Departmental | | | | | | | | | | | | | 14,887 | | | | | |
| | | | | | | | | | | | | | | | | | |
| | | | | | | | | | | | | | | | | | |
| | | | | | | | | | | | | | | | | | |
Total Property, Plant and Equipment | | | | | | | | | | | | | 178,126 | | | | | |
| | | | | | | | | | | | | | | | | | |
| | | | | | | | | | | | | | | | | | |
| | | | | | | | | | | | | | | | | | |
TOTAL PUBLIC SAFETY BUSINESS AGENCY (PPE) | | | | | | | | | | | | | 178,126 | | | | | |
| | | | | | | | | | | | | | | | | | |
99
Capital Statement 2015-16
QUEENSLAND AUDIT OFFICE
Queensland Audit Office
Queensland Audit Office’s capital purchases of $1.4 million in 2015-16 are to maintain and replace current office and IT equipment, replace legacy finance and practice management systems and maintain Integrated Public Sector Audit Methodology software.
| | | | | | | | | | | | | | | | | | |
| Queensland Audit Office | |
Project | | Statistical
Area | | Total
Estimated
Cost
$‘000 | | | Expenditure
to
30-06-15
$‘000 | | | Budget
2015-16
$‘000 | | | Post
2015-16
$‘000 | |
QUEENSLAND AUDIT OFFICE | | | | | | | | | | | | | | | | | | |
| | | | | |
Property, Plant and Equipment | | | | | | | | | | | | | | | | | | |
Legacy Systems Replacement | | 305 | | | 1,120 | | | | 160 | | | | 960 | | | | | |
Integrated Public Sector Audit Methodology software | | 305 | | | 500 | | | | | | | | 120 | | | | 380 | |
Minor Works | | 305 | | | | | | | | | | | 316 | | | | Ongoing | |
| | | | | | | | | | | | | | | | | | |
Total Property, Plant and Equipment | | | | | | | �� | | | | | | 1,396 | | | | | |
| | | | | | | | | | | | | | | | | | |
| | | | | | | | | | | | | | | | | | |
| | | | | | | | | | | | | | | | | | |
TOTAL QUEENSLAND AUDIT OFFICE (PPE) | | | | | | | | | | | | | 1,396 | | | | | |
| | | | | | | | | | | | | | | | | | |
100
Capital Statement 2015-16
SCIENCE, INFORMATION TECHNOLOGY AND INNOVATION
In 2015-16, total capital purchases are $24.7 million and capital grants are $23.9 million for the Science, Information Technology and Innovation portfolio including its statutory body, commercialised business unit and shared service provider.
Department of Science, Information Technology and Innovation
The Department of Science, Information Technology and Innovation invests in and maintains the State’s scientific research facilities and equipment. The department provides reliable information systems, technologies and infrastructure to support service delivery across Government and to the community.
Program Highlights (Property Plant and Equipment)
| • | | $8.2 million for consolidation and upgrade of finance and human resource systems managed by Queensland Shared Services. |
| • | | $5.9 million for replacement of assets and information brokerage legacy software in CITEC. |
| • | | $4 million for ongoing replacement of departmental assets including essential scientific equipment. |
| • | | $3 million to the One-Stop Shop for the procurement of Queensland Government Customer Identity Management system and finalisation of phase 2 deliverables. |
| • | | $2.2 million to the Library Board of Queensland for the purchase of heritage and infrastructure collections, intangible assets in the form of digital collections as well as replacement of information technology and micrographic equipment. |
| • | | $1.1 million to the Government Wireless Network (GWN) for the purchase of software to deliver an integrated digital wireless network for Queensland’s public safety agencies and emergency workers. |
101
Capital Statement 2015-16
| | | | | | | | | | | | | | | | | | |
| Science, Information Technology and Innovation | |
Project | | Statistical
Area | | Total
Estimated
Cost
$‘000 | | | Expenditure
to
30-06-15
$‘000 | | | Budget
2015-16
$‘000 | | | Post
2015-16
$‘000 | |
DEPARTMENT OF SCIENCE, INFORMATION TECHNOLOGY AND INNOVATION | | | | | | | | | | | | | | | | | | |
| | | | | |
Property, Plant and Equipment | | | | | | | | | | | | | | | | | | |
Asset Replacement | | 305 | | | | | | | | | | | 4,060 | | | | Ongoing | |
Government Wireless Network Implementation | | Various | | | 1,100 | | | | | | | | 1,100 | | | | | |
One-Stop Shop | | Various | | | 6,251 | | | | 3,204 | | | | 3,047 | | | | | |
| | | | | | | | | | | | | | | | | | |
Total Property, Plant and Equipment | | | | | | | | | | | | | 8,207 | | | | | |
| | | | | | | | | | | | | | | | | | |
| | | | | |
Capital Grants | | | | | | | | | | | | | | | | | | |
Other | | Various | | | 125 | | | | | | | | 125 | | | | | |
Australian Institute of Tropical Health and Medicine | | Various | | | 36,320 | | | | 10,090 | | | | 23,730 | | | | 2,500 | |
| | | | | | | | | | | | | | | | | | |
Total Capital Grants | | | | | | | | | | | | | 23,855 | | | | | |
| | | | | | | | | | | | | | | | | | |
| | | | | |
LIBRARY BOARD OF QUEENSLAND | | | | | | | | | | | | | | | | | | |
| | | | | |
Property, Plant and Equipment | | | | | | | | | | | | | | | | | | |
Plant and Equipment Replacement | | 305 | | | 1,011 | | | | | | | | 1,011 | | | | | |
Information Collection Additions | | 305 | | | 349 | | | | | | | | 349 | | | | | |
Heritage Collection Additions | | 305 | | | 341 | | | | | | | | 341 | | | | | |
Digital Collection Additions | | 305 | | | 466 | | | | | | | | 466 | | | | | |
| | | | | | | | | | | | | | | | | | |
Total Property, Plant and Equipment | | | | | | | | | | | | | 2,167 | | | | | |
| | | | | | | | | | | | | | | | | | |
| | | | | |
CITEC | | | | | | | | | | | | | | | | | | |
| | | | | |
Property, Plant and Equipment | | | | | | | | | | | | | | | | | | |
Replace Information Brokerage Legacy Software | | 305 | | | 5,000 | | | | | | | | 2,500 | | | | 2,500 | |
Ongoing Software Enhancements | | 305 | | | | | | | | | | | 300 | | | | Ongoing | |
Asset Replacement Program - ICT | | 305 | | | | | | | | | | | 3,100 | | | | Ongoing | |
| | | | | | | | | | | | | | | | | | |
Total Property, Plant and Equipment | | | | | | | | | | | | | 5,900 | | | | | |
| | | | | | | | | | | | | | | | | | |
| | | | | |
QUEENSLAND SHARED SERVICES | | | | | | | | | | | | | | | | | | |
| | | | | |
Property, Plant and Equipment | | | | | | | | | | | | | | | | | | |
Asset Replacement | | 305 | | | 300 | | | | 100 | | | | 200 | | | | | |
102
Capital Statement 2015-16
| | | | | | | | | | | | | | | | | | |
| Science, Information Technology and Innovation | |
Project | | Statistical
Area | | Total
Estimated
Cost
$‘000 | | | Expenditure
to
30-06-15
$‘000 | | | Budget
2015-16
$‘000 | | | Post
2015-16
$‘000 | |
Shared System Reform | | 305 | | | 13,358 | | | | 758 | | | | 8,239 | | | | 4,361 | |
| | | | | | | | | | | | | | | | | | |
Total Property, Plant and Equipment | | | | | | | | | | | | | 8,439 | | | | | |
| | | | | | | | | | | | | | | | | | |
| | | | | | | | | | | | | | | | | | |
| | | | | | | | | | | | | | | | | | |
TOTAL SCIENCE, INFORMATION TECHNOLOGY AND INNOVATION (PPE) | | | | | | | | | | | | | 24,713 | | | | | |
| | | | | | | | | | | | | | | | | | |
| | | | | | | | | | | | | | | | | | |
| | | | | | | | | | | | | | | | | | |
TOTAL SCIENCE, INFORMATION TECHNOLOGY AND INNOVATION (CG) | | | | | | | | | | | | | 23,855 | | | | | |
| | | | | | | | | | | | | | | | | | |
103
Capital Statement 2015-16
STATE DEVELOPMENT
In 2015-16, the Department of State Development has capital purchases of $4.4 million and capital grants of $211.8 million to support economic development in Queensland.
Program Highlights (Property, Plant and Equipment)
| • | | $2.8 million for land acquisition in the Materials Transport and Services Corridor in the Gladstone State Development Area. |
Program Highlights (Capital Grants)
| • | | $70 million for the Building Our Regions Fund in 2015-16. The Building Our Regions Fund will provide $100 million per annum in 2015-16 and 2016-17 with $30 million per annum in 2015-16 and 2016-17 provided to the Department of Transport and Main Roads for regional roads. |
| • | | $141 million for the Royalties for the Regions program to support regional communities. |
| | | | | | | | | | | | | | | | | | |
| State Development | |
Project | | Statistical
Area | | Total
Estimated
Cost
$‘000 | | | Expenditure
to
30-06-15
$‘000 | | | Budget
2015-16
$‘000 | | | Post
2015-16
$‘000 | |
DEPARTMENT OF STATE DEVELOPMENT | | | | | | | | | | | | | | | | | | |
| | | | | |
Property, Plant and Equipment | | | | | | | | | | | | | | | | | | |
Material Transport and Services Corridor | | 308 | | | 19,499 | | | | 4,350 | | | | 2,849 | | | | 12,300 | |
Targinie Precinct | | 308 | | | 67,868 | | | | 61,407 | | | | 461 | | | | 6,000 | |
Townsville Eastern Access Corridor | | 318 | | | 17,507 | | | | 17,063 | | | | 444 | | | | | |
Other Plant and Equipment | | Various | | | | | | | | | | | 602 | | | | Ongoing | |
| | | | | | | | | | | | | | | | | | |
Total Property, Plant and Equipment | | | | | | | | | | | | | 4,356 | | | | | |
| | | | | | | | | | | | | | | | | | |
| | | | | |
Capital Grants | | | | | | | | | | | | | | | | | | |
Building Our Regions | | Various | | | 140,000 | | | | | | | | 70,000 | | | | 70,000 | |
Royalties for the Regions | | Various | | | 142,147 | | | | 1,192 | | | | 140,955 | | | | | |
Recreation Rail Trails | | Various | | | 300 | | | | | | | | 300 | | | | | |
Aurukun Barge Landing | | 306 | | | 630 | | | | 130 | | | | 500 | | | | | |
| | | | | | | | | | | | | | | | | | |
Total Capital Grants | | | | | | | | | | | | | 211,755 | | | | | |
| | | | | | | | | | | | | | | | | | |
| | | | | | | | | | | | | | | | | | |
| | | | | | | | | | | | | | | | | | |
TOTAL STATE DEVELOPMENT (PPE) | | | | | | | | | | | | | 4,356 | | | | | |
| | | | | | | | | | | | | | | | | | |
| | | | | | | | | | | | | | | | | | |
| | | | | | | | | | | | | | | | | | |
TOTAL STATE DEVELOPMENT (CG) | | | | | | | | | | | | | 211,755 | | | | | |
| | | | | | | | | | | | | | | | | | |
104
Capital Statement 2015-16
TOURISM, MAJOR EVENTS, SMALL BUSINESS AND THE COMMONWEALTH GAMES
The total capital purchases for the Department of Tourism, Major Events, Small Business and the Commonwealth Games in 2015-16 are $43.4 million with $131.1 million in capital grants.
Program Highlights (Property, Plant and Equipment)
| • | | $39.5 million is allocated to the Queensland State Velodrome for track cycling. |
| • | | $3.7 million is allocated towards the Belmont Shooting Centre for shooting (clay, target, full bore, pistol and small bore). |
Program Highlights (Capital Grants)
The capital grants for the Department of Tourism, Major Events, Small Business and the Commonwealth Games in 2015-16 are $131.1 million for construction of Gold Coast 2018 Commonwealth Games venues.
| • | | $83.5 million is allocated as grants for the Carrara Precinct including the Carrara Sport and Leisure Centre and Carrara Indoor Stadium. |
| • | | $30.8 million is allocated as grants for the Coomera Sports and Leisure Centre. |
| • | | $5.1 million is allocated as grants for the Gold Coast Hockey Centre. |
| • | | $5.1 million is allocated as grants for the Runaway Bay Sports Centre. |
| • | | $2 million is allocated as grants for the Runaway Bay Super Sports Centre. |
| • | | $1.3 million is allocated as grants for the Broadbeach Bowls Club. |
| • | | $1.2 million is allocated as grants for the Nerang Bike Trails. |
| • | | $333,000 is allocated as grants for the Gold Coast Aquatic Centre. |
105
Capital Statement 2015-16
| | | | | | | | | | | | | | | | | | |
| Tourism, Major Events, Small Business and the Commonwealth Games1 | |
Project | | Statistical
Area | | Total
Estimated
Cost
$‘000 | | | Expenditure
to
30-06-15
$‘000 | | | Budget
2015-16
$‘000 | | | Post
2015-16
$‘000 | |
DEPARTMENT OF TOURISM, MAJOR EVENTS, SMALL BUSINESS AND THE COMMONWEALTH GAMES | | | | | | | | | | | | | | | | | | |
| | | | | |
Property, Plant and Equipment | | | | | | | | | | | | | | | | | | |
Queensland State Velodrome | | 301 | | | 58,043 | | | | 14,734 | | | | 39,508 | | | | 3,801 | |
Belmont Shooting Centre | | 301 | | | 13,540 | | | | 456 | | | | 3,727 | | | | 9,357 | |
Other Venues Gold Coast 20182 Commonwealth Games | | Various | | | 10,346 | | | | 371 | | | | 184 | | | | 9,791 | |
Other PP&E | | 305 | | | 120 | | | | | | | | 20 | | | | 100 | |
| | | | | | | | | | | | | | | | | | |
Total Property, Plant and Equipment | | | | | | | | | | | | | 43,439 | | | | | |
| | | | | | | | | | | | | | | | | | |
| | | | | |
Capital Grants | | | | | | | | | | | | | | | | | | |
Carrara Precinct | | 309 | | | 123,071 | | | | 8,324 | | | | 83,485 | | | | 31,262 | |
Coomera Indoor Sports Centre | | 309 | | | 39,873 | | | | 5,171 | | | | 30,777 | | | | 3,925 | |
Gold Coast Hockey Centre | | 309 | | | 14,742 | | | | 625 | | | | 5,107 | | | | 9,010 | |
Runaway Bay Sports Centre | | 309 | | | 12,293 | | | | 319 | | | | 5,097 | | | | 6,877 | |
Runaway Bay Super Sports Centre | | 309 | | | 2,000 | | | | | | | | 2,000 | | | | | |
Other Venues Gold Coast 2018 Commonwealth Games | | Various | | | 22,602 | | | | 131 | | | | 1,761 | | | | 20,710 | |
Broadbeach Bowls Club | | 309 | | | 2,735 | | | | 116 | | | | 1,347 | | | | 1,272 | |
Nerang Bike Trails | | 309 | | | 3,191 | | | | 129 | | | | 1,227 | | | | 1,835 | |
Gold Coast Aquatic Centre | | 309 | | | 41,391 | | | | 40,948 | | | | 333 | | | | 110 | |
| | | | | | | | | | | | | | | | | | |
Total Capital Grants | | | | | | | | | | | | | 131,134 | | | | | |
| | | | | | | | | | | | | | | | | | |
| | | | | | | | | | | | | | | | | | |
| | | | | | | | | | | | | | | | | | |
TOTAL TOURISM, MAJOR EVENTS, SMALL BUSINESS AND THE COMMONWEALTH GAMES (PPE) | | | | | | | | | | | | | 43,439 | | | | | |
| | | | | | | | | | | | | | | | | | |
| | | | | | | | | | | | | | | | | | |
| | | | | | | | | | | | | | | | | | |
TOTAL TOURISM, MAJOR EVENTS, SMALL BUSINESS AND THE COMMONWEALTH GAMES (CG) | | | | | | | | | | | | | 131,134 | | | | | |
| | | | | | | | | | | | | | | | | | |
Notes:
| 1. | In accordance with the Venue Infrastructure Governance Framework, the Department of State Development has project and budget accountability and responsibility for Gold Coast 2018 Commonwealth Games venue delivery. |
| 2. | Other venues noted under Property, Plant and Equipment for the Gold Coast 2018 Commonwealth Games include works associated with the Gold Coast Convention and Exhibition Centre, Carrara Stadium, Cairns Convention Centre and Robina Stadium. |
106
Capital Statement 2015-16
TRANSPORT AND MAIN ROADS
In 2015-16, total capital purchases for the Transport and Main Roads portfolio are $3.931 billion including capital grants of $211.5 million. The portfolio includes the Department of Transport and Main Roads, Queensland Rail, Far North Queensland Ports Corporation Limited, Gladstone Ports Corporation Limited, North Queensland Bulk Ports Corporation Limited, Port of Townsville Limited, RoadTek and the Gold Coast Waterways Authority.
Department of Transport and Main Roads
In 2015-16, capital purchases total $2.905 billion towards critical infrastructure investment across the State. The Queensland Government is committed to delivering an integrated, safe and efficient transport system that meets the current and future needs of Queensland.
Program Highlights (Property, Plant and Equipment)
| • | | $175.9 million towards widening the Gateway Motorway North to six lanes, between Nudgee and Bracken Ridge, at a total cost of $1.162 billion, which is jointly Australian and Queensland Government funded. |
| • | | $172.1 million towards the Toowoomba Second Range Crossing project, a bypass route to the north of Toowoomba, approximately 41km in length, running from the Warrego Highway at Helidon to the Gore Highway at Athol, via Charlton, at a total cost of $1.606 billion, which is jointly Australian and Queensland Government funded. |
| • | | $113.1 million towards duplication of the Bruce Highway (Cooroy to Curra) from Cooroy Southern Interchange to Sankey’s Road (Section A), at a total cost of $490 million, which is jointly Australian and Queensland Government funded. |
| • | | $78.1 million for the New Generation Rollingstock project to construct a new maintenance facility and new rollingstock to meet the growing demand for rail services in South East Queensland. |
| • | | $33.4 million to provide a new elevated crossing on the Bruce Highway across the Yeppen Floodplain, at a total cost of $170 million, which is jointly Australian and Queensland Government funded. |
| • | | $19.3 million for the Western Roads Upgrade Program, providing targeted road network upgrades, focusing on road widening and sealing, within western Queensland local government areas, at a total estimated cost of $40 million. |
| • | | $15 million to signalise Ashmore Road and Ross Street intersection on Labrador- Carrara Road in preparation for the Commonwealth Games, at a total estimated cost of $30 million, as part of the $160.7 million program of works to upgrade roads on the Gold Coast in preparation for the Commonwealth Games. |
| • | | $12.9 million towards replacement of timber bridges and approaches at various locations on the Peak Downs Highway, between Nebo and Mackay, at a total estimated cost of $70 million, which is jointly Australian and Queensland Government funded. |
107
Capital Statement 2015-16
Program Highlights (Capital Grants)
| • | | $70 million of transport infrastructure development grants to local governments including Aboriginal and Torres Strait Islander community assistance. |
| • | | $34.3 million of Royalties for the Regions funding to provide better, safer roads to support regional development. |
| • | | $12 million towards the development of cycle networks throughout Queensland. |
| • | | $3 million for sealing and upgrading sections of the Outback Way between Boulia and Tobermorey. |
Gold Coast Waterways Authority
In 2015-16, Gold Coast Waterways Authority has allocated $10.2 million to improve management of and provide better access to the Gold Coast waterways, canals and rivers.
Program Highlights (Property, Plant and Equipment)
| • | | $8.2 million to improve access and safety by dredging navigation channels and improve accessibility and quality of waterways information. |
| • | | $1.2 million to provide boating infrastructure such as boat ramps, pontoons and implementing the Surfers Riverfront Masterplan. |
Queensland Rail Limited
In 2015-16, $861.4 million is allocated towards capital purchases for Queensland Rail.
Program Highlights (Property, Plant and Equipment)
$568.4 million is provided towards network infrastructure across Queensland including:
| • | | $72.6 million to continue construction of the third track on the existing network between Lawnton and Petrie Stations, at a total estimated cost of $167.6 million. |
| • | | $63.4 million to continue duplication of the Gold Coast line between Coomera and Helensvale stations, at a total estimated cost of $163.3 million. |
108
Capital Statement 2015-16
| • | | $55.7 million to commence work on the Toowoomba Range Capacity and Clearance Upgrades project, at a total estimated cost of $58.1 million. |
| • | | $42.6 million to continue passenger safety and accessibility works, including station upgrade works at Nambour, Alderley, Newmarket, Dinmore, Graceville and detailed design for upgrades at Strathpine, Boondall and Auchenflower train stations. |
$226.5 million is provided to deliver new and upgrade existing rollingstock across Queensland including:
| • | | $51.6 million to construct stabling facilities to accommodate the New Generation Rollingstock. |
| • | | $26.2 million towards upgrading existing infrastructure to support the Wulkuraka Maintenance Centre. |
$66.5 million is allocated towards customer and enabling projects across Queensland Rail.
Far North Queensland Ports Corporation Limited
In 2015-16, Far North Queensland Ports Corporation Limited has allocated $7.2 million towards new and continuing development within its ports in Far North Queensland.
Program Highlights (Property, Plant and Equipment)
| • | | $2.25 million for development of the Tingira Street Precinct. |
| • | | $1.6 million to continue the extension of the Cairns boardwalk and foreshore promenade, at a total cost of $22.1 million. |
Gladstone Ports Corporation Limited
In 2015-16, Gladstone Ports Corporation Limited has allocated $98.1 million towards ongoing development at the Port of Gladstone, and additional works at the Port of Bundaberg and Port of Rockhampton.
Program Highlights (Property, Plant and Equipment)
| • | | $62.3 million towards continuing upgrades at the RG Tanna Coal Terminal at the Port of Gladstone, at a total estimated cost of $99.6 million. |
| • | | $11 million for projects relating to the monitoring program for the Great Barrier Reef Marine Park, at a total estimated cost of 26.8 million. |
| • | | $5.5 million for the Fisherman’s Landing projects relating to preventative works and drainage, at a total estimated cost of $6.5 million. |
109
Capital Statement 2015-16
North Queensland Bulk Ports Corporation Limited
In 2015-16, North Queensland Bulk Ports Corporation has allocated $13.7 million to continue port planning and development initiatives to meet industry requirements for export coal facilities.
Program Highlights (Property, Plant and Equipment)
| • | | $3.5 million for the purchase of buffer land at Louisa Creek, at a total estimated cost of $15.3 million. |
Port of Townsville Limited
In 2015-16, Port of Townsville has allocated $29.8 million towards ongoing development at the Port of Townsville, and additional works at the Port of Lucinda.
Program Highlights (Property, Plant and Equipment)
| • | | $10.2 million for the redevelopment of the Berth 4 facility, including alignment with adjacent berth and deck surface works, at a total estimated cost of $55.2 million. |
| • | | $9.7 million for the demolition of existing Berth 6 and 7 to allow improved navigational access to the port’s existing berths and allow larger ship access, at a total estimated cost of $14.7 million. |
| | | | | | | | | | | | | | | | | | |
| Transport and Main Roads | |
Project | | Statistical
Area | | Total
Estimated
Cost
$‘000 | | | Expenditure
to
30-06-15
$‘000 | | | Budget
2015-16
$‘000 | | | Post
2015-16
$‘000 | |
DEPARTMENT OF TRANSPORT AND MAIN ROADS | | | | | | | | | | | | | | | | | | |
| | | | | |
Property, Plant and Equipment | | | | | | | | | | | | | | | | | | |
Metropolitan District | | | | | | | | | | | | | | | | | | |
East-West Arterial Road, Eliza Street to Sandgate Road, install/replace signs | | 305 | | | 1,944 | | | | 88 | | | | 807 | | | | 1,049 | |
Gateway Upgrade North, widen to 6 lanes | | 302 | | | 1,161,975 | | | | 62,400 | | | | 175,940 | | | | 923,635 | |
Mains Road Transit Ways Stops, Sunnybank | | 303 | | | 2,300 | | | | 1,000 | | | | 1,300 | | | | | |
Moggill Road Cycle Bridge, Indooroopilly, construction | | 304 | | | 10,547 | | | | 2,080 | | | | 6,402 | | | | 2,065 | |
Moggill Sub-Arterial Road, Pinjarra Hills, upgrade roadside delineation | | 304 | | | 1,473 | | | | 147 | | | | 1,000 | | | | 326 | |
110
Capital Statement 2015-16
| | | | | | | | | | | | | | | | | | |
| Transport and Main Roads | |
Project | | Statistical
Area | | Total
Estimated
Cost
$‘000 | | | Expenditure
to
30-06-15
$‘000 | | | Budget
2015-16
$‘000 | | | Post
2015-16
$‘000 | |
Mount Cotton Road, Woodlands Drive, Mount Cotton, improve intersection | | 301 | | | 1,000 | | | | 115 | | | | 885 | | | | | |
New Generation Rollingstock and Wulkuraka Maintenance Centre | | 310 | | | 4,155,705 | | | | 24,804 | | | | 78,100 | | | | 4,052,801 | |
North Brisbane Bikeway, Bowen Hills to Wooloowin, construct cycleway | | 305 | | | 24,789 | | | | 6,847 | | | | 2,942 | | | | 15,000 | |
Pacific Motorway, Veloway 1 (Stages C & D), construct cycleway | | 303 | | | 36,513 | | | | 11,466 | | | | 6,085 | | | | 18,962 | |
Redland Bay Marina Bus Station | | 301 | | | 5,212 | | | | 1,430 | | | | 3,500 | | | | 282 | |
Sandgate Road / Junction Road, Clayfield, intersection improvements | | 305 | | | 6,900 | | | | 617 | | | | 4,722 | | | | 1,561 | |
Western Arterial Road (Ellen Grove - Jindalee), Mount Ommaney, realign traffic lanes | | 304 | | | 2,000 | | | | 182 | | | | 1,638 | | | | 180 | |
Other construction | | 305 | | | 69,077 | | | | | | | | 69,077 | | | | | |
| | | | | | | | | | | | | | | | | | |
Sub-total Metropolitan District | | | | | | | | | | | | | 352,398 | | | | | |
| | | | | | | | | | | | | | | | | | |
| | | | | |
South Coast District | | | | | | | | | | | | | | | | | | |
Beenleigh Connection Road, Logan Central, minor realignment of traffic lanes | | 311 | | | 1,665 | | | | 374 | | | | 1,291 | | | | | |
Commonwealth Games Upgrade1 Package, miscellaneous works | | 309 | | | 71,700 | | | | | | | | 14,600 | | | | 57,100 | |
Cunningham Highway (Ipswich -2 Warwick), Mutdapilly to Warrill View, rehabilitate pavement | | 310 | | | 12,500 | | | | | | | | 500 | | | | 12,000 | |
Labrador-Carrara Road (Olsen Avenue) / Smith Street Motorway Interchange Upgrade | | 309 | | | 118,152 | | | | 111,059 | | | | 7,093 | | | | | |
Labrador-Carrara Road (Ross1 Street) / Ashmore Road, intersection signalisation | | 309 | | | 30,000 | | | | | | | | 15,000 | | | | 15,000 | |
Mount Lindsey Highway/Camp Cable Road, intersection signalisation | | 311 | | | 5,000 | | | | | | | | 5,000 | | | | | |
Pacific Motorway, Coomera Exit 54 Interchange Upgrade | | 309 | | | 74,700 | | | | 1,700 | | | | 48,000 | | | | 25,000 | |
111
Capital Statement 2015-16
| | | | | | | | | | | | | | | | | | |
| Transport and Main Roads | |
Project | | Statistical
Area | | Total
Estimated
Cost
$‘000 | | | Expenditure
to
30-06-15
$‘000 | | | Budget
2015-16
$‘000 | | | Post
2015-16
$‘000 | |
Southport-Burleigh Road, Fremar1 Street to Rudd Street, widen to 6 lanes | | 309 | | | 21,000 | | | | | | | | 11,000 | | | | 10,000 | |
Southport-Burleigh Road, North1 Street to Vespa Crescent, widen to 6 lanes | | 309 | | | 38,000 | | | | | | | | 10,000 | | | | 28,000 | |
Tamborine Mountain Road, realign traffic lanes | | 309 | | | 1,821 | | | | 452 | | | | 1,369 | | | | | |
Tamborine-Oxenford Road, south of Hayes Road, minor regrade | | 309 | | | 2,762 | | | | 1,250 | | | | 1,512 | | | | | |
Other construction | | 309 | | | 75,515 | | | | | | | | 75,515 | | | | | |
| | | | | | | | | | | | | | | | | | |
Sub-total South Coast District | | | | | | | | | | | | | 190,880 | | | | | |
| | | | | | | | | | | | | | | | | | |
| | | | | |
Wide Bay Burnett District | | | | | | | | | | | | | | | | | | |
Bruce Highway (Brisbane - Gympie), Cooroy to Curra (Section C), construct to new sealed 4 lane standard | | 319 | | | 624,250 | | | | 50 | | | | 25,500 | | | | 598,700 | |
Bruce Highway (Gympie - Maryborough), Bauple-Woolooga Road to Chapmans Road, widening | | 319 | | | 3,600 | | | | 282 | | | | 1,543 | | | | 1,775 | |
Bruce Highway (Gympie - Maryborough), Old Gympie Road to north of Seven Mile Road, rehabilitate and widen | | 319 | | | 5,182 | | | | 1,282 | | | | 3,800 | | | | 100 | |
Bruce Highway (Gympie - Maryborough), south of Old Gympie Road, Tiaro, widen and overlay | | 319 | | | 6,760 | | | | 250 | | | | 764 | | | | 5,746 | |
Bruce Highway (Gympie - Maryborough), Tiaro, construct additional lanes | | 319 | | | 5,000 | | | | 222 | | | | 2,143 | | | | 2,635 | |
Bruce Highway (Gympie - Maryborough), Tinana Interchange Upgrade | | 319 | | | 38,000 | | | | 582 | | | | 1,500 | | | | 35,918 | |
Bruce Highway (Maryborough - Gin Gin), near Apple Tree Creek, improve intersections | | 319 | | | 4,443 | | | | 334 | | | | 2,109 | | | | 2,000 | |
112
Capital Statement 2015-16
| | | | | | | | | | | | | | | | | | |
| Transport and Main Roads | |
Project | | Statistical
Area | | Total
Estimated
Cost
$‘000 | | | Expenditure
to
30-06-15
$‘000 | | | Budget
2015-16
$‘000 | | | Post
2015-16
$‘000 | |
Bruce Highway (Maryborough - Gin Gin), north of Howard exit, widen and overlay | | 319 | | | 5,500 | | | | 120 | | | | 688 | | | | 4,692 | |
Bruce Highway (Maryborough - Gin Gin), north of Wongi Forest, rehabilitate and widen | | 319 | | | 7,101 | | | | 1,213 | | | | 5,788 | | | | 100 | |
Bundaberg-Gin Gin Road, Bundaberg Central, rehabilitate bridges and culverts | | 319 | | | 5,000 | | | | | | | | 5,000 | | | | | |
Monto-Mount Perry Road, various locations, construct to sealed standard | | 319 | | | 15,200 | | | | 6,355 | | | | 7,345 | | | | 1,500 | |
Other construction | | 319 | | | 75,143 | | | | | | | | 75,143 | | | | | |
| | | | | | | | | | | | | | | | | | |
Sub-total Wide Bay Burnett District | | | | | | | | | | | | | 131,323 | | | | | |
| | | | | | | | | | | | | | | | | | |
| | | | | |
North Coast District | | | | | | | | | | | | | | | | | | |
Bruce Highway (Brisbane - Gympie), Boundary Road Interchange | | 313 | | | 105,000 | | | | 1,000 | | | | 6,000 | | | | 98,000 | |
Bruce Highway (Brisbane - Gympie), Caboolture, upgrade Intelligent Transport System hardware and field devices | | 313 | | | 34,832 | | | | 21,956 | | | | 8,000 | | | | 4,876 | |
Bruce Highway (Brisbane - Gympie), Cooroy to Curra (Section A), construct new alignment | | 316 | | | 490,000 | | | | 189,453 | | | | 113,066 | | | | 187,481 | |
Burpengary-Caboolture Road, Caboolture River Bridge Replacement | | 313 | | | 17,137 | | | | | | | | 7,000 | | | | 10,137 | |
D’Aguilar Highway (Caboolture - Kilcoy), Woodford, miscellaneous works | | 313 | | | 16,000 | | | | 406 | | | | 9,594 | | | | 6,000 | |
David Low Way Cycle Facilities | | 316 | | | 15,970 | | | | 6,452 | | | | 3,303 | | | | 6,215 | |
Deception Bay Bus Station Upgrade, Bay Avenue | | 313 | | | 4,992 | | | | 1,967 | | | | 2,426 | | | | 599 | |
Maroochydore-Noosa Road (David Low Way), various locations, improve intersections | | 316 | | | 2,201 | | | | 147 | | | | 1,874 | | | | 180 | |
Moreton Bay Rail Link, Petrie Station to Kippa-Ring Station | | 314 | | | 988,000 | | | | 656,734 | | | | 136,762 | | | | 194,504 | |
113
Capital Statement 2015-16
| | | | | | | | | | | | | | | | | | |
| Transport and Main Roads | |
Project | | Statistical
Area | | Total
Estimated
Cost
$‘000 | | | Expenditure
to
30-06-15
$‘000 | | | Budget
2015-16
$‘000 | | | Post
2015-16
$‘000 | |
Samford Road Cycleway, Samford Village to Ferny Grove, construct cycleway | | 314 | | | 3,498 | | | | 537 | | | | 2,503 | | | | 458 | |
Other construction | | 316 | | | 87,092 | | | | | | | | 87,092 | | | | | |
| | | | | | | | | | | | | | | | | | |
Sub-total North Coast District | | | | | | | | | | | | | 377,620 | | | | | |
| | | | | | | | | | | | | | | | | | |
| | | | | |
Darling Downs District | | | | | | | | | | | | | | | | | | |
Chinchilla-Tara Road, various locations, widen pavement | | 307 | | | 11,682 | | | | 1,305 | | | | 10,377 | | | | | |
Chinchilla-Tara Road, Wambo Creek Bridge, widen to 2 lanes | | 307 | | | 7,929 | | | | 730 | | | | 3,570 | | | | 3,629 | |
Dalby-Kogan Road, Apunyal, widen pavement | | 307 | | | 5,494 | | | | 1,014 | | | | 4,480 | | | | | |
Dalby-Kogan Road, Kogan Creek Bridge Replacement | | 307 | | | 6,880 | | | | | | | | 6,880 | | | | | |
Toowoomba Second Range Crossing | | 317 | | | 1,606,250 | | | | 16,045 | | | | 172,055 | | | | 1,418,150 | |
Warrego Highway (Dalby - Miles),3 Brigalow to Chinchilla, widening | | 307 | | | 36,000 | | | | 964 | | | | 23,146 | | | | 11,890 | |
Warrego Highway (Dalby - Miles),3 Jingi Jingi Creek Bridge, construction | | 307 | | | 35,000 | | | | 934 | | | | 1,206 | | | | 32,860 | |
Warrego Highway (Toowoomba -3 Dalby), Nugent Pinch Road to west of Charlton, widen to 4 lanes | | 317 | | | 110,000 | | | | 19,281 | | | | 73,419 | | | | 17,300 | |
Warrego Highway Upgrade3 Program, miscellaneous works | | 307 | | | 454,000 | | | | 1,765 | | | | 10,040 | | | | 442,195 | |
Other construction | | 307 | | | 41,368 | | | | | | | | 41,368 | | | | | |
| | | | | | | | | | | | | | | | | | |
Sub-total Darling Downs District | | | | | | | | | | | | | 346,541 | | | | | |
| | | | | | | | | | | | | | | | | | |
| | | | | |
South West District | | | | | | | | | | | | | | | | | | |
Balonne Highway (Bollon -4 Cunnamulla), various locations, widen pavement | | 315 | | | 3,000 | | | | | | | | 3,000 | | | | | |
Bulloo Developmental Road4 (Cunnamulla - Thargomindah), various locations, widen pavement | | 315 | | | 2,000 | | | | | | | | 2,000 | | | | | |
114
Capital Statement 2015-16
| | | | | | | | | | | | | | | | | | |
| Transport and Main Roads | |
Project | | Statistical
Area | | Total
Estimated
Cost
$‘000 | | | Expenditure
to
30-06-15
$‘000 | | | Budget
2015-16
$‘000 | | | Post
2015-16
$‘000 | |
Diamantina Developmental Road,4 Charleville to Windorah, various locations, widen pavement | | 315 | | | 8,000 | | | | | | | | 8,000 | | | | | |
Jackson-Wandoan Road, various locations, upgrade roadside delineation | | 307 | | | 1,500 | | | | 390 | | | | 1,110 | | | | | |
Mitchell Highway (Barringun -4 Cunnamulla), various locations, widen pavement | | 315 | | | 1,600 | | | | | | | | 1,600 | | | | | |
Mitchell Highway (Cunnamulla - Charleville), Angellala Creek Bridge Replacement | | 315 | | | 10,000 | | | | 3,580 | | | | 6,420 | | | | | |
Other construction | | 307 | | | 19,876 | | | | | | | | 19,876 | | | | | |
| | | | | | | | | | | | | | | | | | |
Sub-total South West District | | | | | | | | | | | | | 42,006 | | | | | |
| | | | | | | | | | | | | | | | | | |
| | | | | |
Fitzroy District | | | | | | | | | | | | | | | | | | |
Blackwater - Rolleston Road, pave and seal section | | 308 | | | 3,900 | | | | | | | | 3,900 | | | | | |
Bruce Highway (Benaraby - Rockhampton), construct overtaking lanes | | 308 | | | 7,650 | | | | 2,000 | | | | 5,650 | | | | | |
Bruce Highway (Benaraby - Rockhampton), Yeppen South, bridge and road upgrades | | 308 | | | 170,000 | | | | 110,431 | | | | 33,353 | | | | 26,216 | |
Bruce Highway (Rockhampton - St Lawrence), Marlborough, widen and seal | | 308 | | | 7,900 | | | | 500 | | | | 7,400 | | | | | |
Burnett Highway (Monto - Biloela), various locations, widening | | 308 | | | 10,000 | | | | 1,000 | | | | 9,000 | | | | | |
Dawson Developmental Road (Springsure - Tambo), Nandowrie, construct to sealed standard | | 308 | | | 3,100 | | | | | | | | 3,100 | | | | | |
Dawson Highway (Gladstone - Biloela), Kin Kora Intersection Upgrade | | 308 | | | 25,200 | | | | 5,350 | | | | 11,700 | | | | 8,150 | |
Gladstone-Mount Larcom Road, various locations, widening | | 308 | | | 6,800 | | | | 1,739 | | | | 5,061 | | | | | |
Burnett Highway (Monto - Biloela), Poor Man’s Gully Bridge Replacement | | 308 | | | 3,000 | | | | | | | | 3,000 | | | | | |
115
Capital Statement 2015-16
| | | | | | | | | | | | | | | | | | |
| Transport and Main Roads | |
Project | | Statistical
Area | | Total
Estimated
Cost
$‘000 | | | Expenditure
to
30-06-15
$‘000 | | | Budget
2015-16
$‘000 | | | Post
2015-16
$‘000 | |
Other construction | | 308 | | | 114,958 | | | | | | | | 114,958 | | | | | |
| | | | | | | | | | | | | | | | | | |
Sub-total Fitzroy District | | | | | | | | | | | | | 197,122 | | | | | |
| | | | | | | | | | | | | | | | | | |
| | | | | |
Central West District | | | | | | | | | | | | | | | | | | |
Alpha-Tambo Road, various5 locations, pave and seal | | 315 | | | 2,150 | | | | 352 | | | | 1,798 | | | | | |
Birdsville Developmental Road (Morney - Birdsville), Betoota, pave and seal | | 315 | | | 1,393 | | | | 410 | | | | 983 | | | | | |
Clermont-Alpha Road, Native Companion Creek Bridge, construction | | 315 | | | 7,073 | | | | 3,440 | | | | 3,633 | | | | | |
Jundah-Quilpie Road, pave and5 seal section | | 315 | | | 1,269 | | | | 42 | | | | 1,227 | | | | | |
Landsborough Highway (Blackall -2 Barcaldine), rehabilitate and widen | | 315 | | | 12,500 | | | | 10 | | | | 865 | | | | 11,625 | |
Outback Way - Queensland5 | | 315 | | | 12,581 | | | | 4,762 | | | | 6,069 | | | | 1,750 | |
Other construction | | 315 | | | 21,461 | | | | | | | | 21,461 | | | | | |
| | | | | | | | | | | | | | | | | | |
Sub-total Central West District | | | | | | | | | | | | | 36,036 | | | | | |
| | | | | | | | | | | | | | | | | | |
| | | | | |
Mackay Whitsunday District | | | | | | | | | | | | | | | | | | |
Bruce Highway (Bowen - Ayr), Sandy Gully Bridge Upgrade | | 312 | | | 57,500 | | | | 1,100 | | | | 4,000 | | | | 52,400 | |
Bruce Highway (Mackay - Proserpine), Calen to Kuttabul, construct overtaking lanes | | 312 | | | 7,000 | | | | 365 | | | | 6,635 | | | | | |
Bruce Highway (St Lawrence - Mackay), Hay Point Road, construct roundabout | | 312 | | | 15,000 | | | | 2,491 | | | | 9,874 | | | | 2,635 | |
Bruce Highway (St Lawrence - Mackay), Koumala, widen pavement | | 312 | | | 2,940 | | | | 175 | | | | 2,765 | | | | | |
Bruce Highway (St Lawrence - Mackay), Showground and Shakespeare Street, improve intersections | | 312 | | | 13,843 | | | | 5,410 | | | | 7,090 | | | | 1,343 | |
116
Capital Statement 2015-16
| | | | | | | | | | | | | | | | | | |
| Transport and Main Roads | |
Project | | Statistical
Area | | Total
Estimated
Cost
$‘000 | | | Expenditure
to
30-06-15
$‘000 | | | Budget
2015-16
$‘000 | | | Post
2015-16
$‘000 | |
Peak Downs Highway (Nebo - Mackay) / Rocky Waterholes Wollingford Road / Greenmount Road, Walkerston, improve intersection | | 312 | | | 2,470 | | | | 100 | | | | 2,370 | | | | | |
Peak Downs Highway (Nebo - Mackay), Eton Range Realignment | | 312 | | | 189,200 | | | | 10,530 | | | | 11,200 | | | | 167,470 | |
Peak Downs Highway (Nebo - Mackay), Timber Bridge Replacements | | 312 | | | 70,000 | | | | | | | | 12,916 | | | | 57,084 | |
Other construction | | 312 | | | 75,765 | | | | | | | | 75,765 | | | | | |
| | | | | | | | | | | | | | | | | | |
Sub-total Mackay Whitsunday District | | | | | | | | | | | | | 132,615 | | | | | |
| | | | | | | | | | | | | | | | | | |
| | | | | |
Far North District | | | | | | | | | | | | | | | | | | |
Cairns Southern Access Corridor (Stage 2), widen to 6 lanes | | 306 | | | 58,000 | | | | 250 | | | | 13,250 | | | | 44,500 | |
Cape York Region Package,6 miscellaneous works | | 315 | | | 215,347 | | | | 21,158 | | | | 21,437 | | | | 172,752 | |
Captain Cook Highway (Cairns - Mossman), Ellis Beach, relocate hazardous objects close to road | | 307 | | | 2,510 | | | | 251 | | | | 2,259 | | | | | |
Endeavour Valley Road, various6 locations, Cooktown, construct to sealed standard | | 315 | | | 10,000 | | | | 1,200 | | | | 2,400 | | | | 6,400 | |
Gillies Range Road, Goldsborough, widen and seal | | 306 | | | 2,050 | | | | 791 | | | | 1,259 | | | | | |
Gulf Developmental Road4 (Croydon - Georgetown), various locations, widen and seal | | 315 | | | 5,000 | | | | | | | | 1,500 | | | | 3,500 | |
Malanda - Upper Barron Road, intersection and road upgrades | | 306 | | | 5,000 | | | | | | | | 2,000 | | | | 3,000 | |
Peninsula Developmental Road6 (Coen - Weipa), Mein Deviation | | 315 | | | 29,326 | | | | 3,400 | | | | 25,926 | | | | | |
Peninsula Developmental Road6 (Coen - Weipa), Sorayas Hill, pave and seal | | 315 | | | 5,827 | | | | 287 | | | | 5,540 | | | | | |
Other construction | | 306 | | | 68,502 | | | | | | | | 68,502 | | | | | |
| | | | | | | | | | | | | | | | | | |
Sub-total Far North District | | | | | | | | | | | | | 144,073 | | | | | |
| | | | | | | | | | | | | | | | | | |
117
Capital Statement 2015-16
| | | | | | | | | | | | | | | | | | |
| Transport and Main Roads | |
Project | | Statistical
Area | | Total
Estimated
Cost
$‘000 | | | Expenditure
to
30-06-15
$‘000 | | | Budget
2015-16
$‘000 | | | Post
2015-16
$‘000 | |
Northern District | | | | | | | | | | | | | | | | | | |
Bruce Highway (Ayr - Townsville), Alligator Creek Road to Allendale Drive, construct overtaking lane | | 318 | | | 9,840 | | | | 350 | | | | 6,340 | | | | 3,150 | |
Bruce Highway (Bowen - Ayr), Burdekin River Bridge Rehabilitation | | 318 | | | 43,750 | | | | 30,263 | | | | 4,355 | | | | 9,132 | |
Bruce Highway (Bowen - Ayr), Yellow Gin Creek Bridge Upgrade | | 318 | | | 45,000 | | | | 2,400 | | | | 20,800 | | | | 21,800 | |
Bruce Highway (Townsville - Ingham), Townsville Ring Road (Stage 4), construct bypass | | 318 | | | 200,000 | | | | 49,055 | | | | 72,183 | | | | 78,762 | |
Bruce Highway (Townsville - Ingham), Veales Road to Pope Road, widen and seal | | 318 | | | 3,450 | | | | 150 | | | | 1,800 | | | | 1,500 | |
Bruce Highway Upgrade (Vantassel to Cluden), widen to four lanes | | 318 | | | 137,500 | | | | 121,333 | | | | 16,167 | | | | | |
Bruce Highway (Townsville - Ingham), Cattle Creek and Frances Creek Upgrade | | 318 | | | 174,000 | | | | 150 | | | | 5,902 | | | | 167,948 | |
Other construction | | 318 | | | 26,390 | | | | | | | | 26,390 | | | | | |
| | | | | | | | | | | | | | | | | | |
Sub-total Northern District | | | | | | | | | | | | | 153,937 | | | | | |
| | | | | | | | | | | | | | | | | | |
| | | | | |
North West District | | | | | | | | | | | | | | | | | | |
Burke Developmental Road, Burke4 and Wills Junction to Normanton, rehabilitate and widen | | 315 | | | 4,000 | | | | | | | | 1,000 | | | | 3,000 | |
Cloncurry-Dajarra Road, Cloncurry4 to Duchess, construct to sealed standard | | 315 | | | 5,000 | | | | | | | | 1,000 | | | | 4,000 | |
Flinders Highway, various2 locations, rehabilitate and overlay | | 315 | | | 25,000 | | | | | | | | 12,300 | | | | 12,700 | |
Other construction | | 315 | | | 52,355 | | | | | | | | 52,355 | | | | | |
| | | | | | | | | | | | | | | | | | |
Sub-total North West District | | | | | | | | | | | | | 66,655 | | | | | |
| | | | | | | | | | | | | | | | | | |
| | | | | |
State Wide | | | | | | | | | | | | | | | | | | |
Boating Infrastructure Minor Works | | Various | | | | | | | | | | | 9,475 | | | | Ongoing | |
Emergency Vehicle priority system | | Various | | | 13,500 | | | | | | | | 1,480 | | | | 12,020 | |
Lookout rehabilitation program | | Various | | | 3,000 | | | | | | | | 1,000 | | | | 2,000 | |
Maritime Safety Minor Works | | Various | | | | | | | | | | | 8,807 | | | | Ongoing | |
118
Capital Statement 2015-16
| | | | | | | | | | | | | | | | | | |
| Transport and Main Roads | |
Project | | Statistical
Area | | Total
Estimated
Cost
$‘000 | | | Expenditure
to
30-06-15
$‘000 | | | Budget
2015-16
$‘000 | | | Post
2015-16
$‘000 | |
Passenger Transport Facilities Program | | Various | | | | | | | | | | | 13,965 | | | | Ongoing | |
Transport Corridor Acquisition Fund | | Various | | | | | | | | | | | 70,000 | | | | Ongoing | |
Other construction | | Various | | | 380,257 | | | | | | | | 380,257 | | | | | |
| | | | | | | | | | | | | | | | | | |
Sub-total State Wide | | | | | | | | | | | | | 484,984 | | | | | |
| | | | | | | | | | | | | | | | | | |
| | | | | |
Other Property, Plant and Equipment | | | | | | | | | | | | | | | | | | |
Corporate Buildings | | Various | | | | | | | | | | | 1,000 | | | �� | Ongoing | |
Information Technology | | Various | | | | | | | | | | | 11,402 | | | | Ongoing | |
Plant and Equipment | | Various | | | | | | | | | | | 25,180 | | | | Ongoing | |
| | | | | | | | | | | | | | | | | | |
Sub-total Other Property, Plant and Equipment | | | | | | | | | | | | | 37,582 | | | | | |
| | | | | | | | | | | | | | | | | | |
| | | | | | | | | | | | | | | | | | |
| | | | | | | | | | | | | | | | | | |
Total Property, Plant and Equipment | | | | | | | | | | | | | 2,693,772 | | | | | |
| | | | | | | | | | | | | | | | | | |
| | | | | |
Capital Grants | | | | | | | | | | | | | | | | | | |
Black Spot | | Various | | | | | | | | | | | 32,474 | | | | Ongoing | |
Boating Capital Grants | | Various | | | | | | | | | | | 500 | | | | Ongoing | |
Bridges Renewal Program | | Various | | | 5,376 | | | | | | | | 5,376 | | | | | |
Cycle Program | | Various | | | | | | | | | | | 12,000 | | | | Ongoing | |
Heavy Vehicle Safety and Productivity | | Various | | | 1,687 | | | | | | | | 1,687 | | | | | |
Outback Way - Queensland | | 315 | | | 8,500 | | | | 3,500 | | | | 3,000 | | | | 2,000 | |
Passenger Transport Accessible Infrastructure Program | | Various | | | | | | | | | | | 5,076 | | | | Ongoing | |
Queensland School Bus Upgrade | | Various | | | | | | | | | | | 23,190 | | | | Ongoing | |
Royalties for the Regions | | | | | | | | | | | | | | | | | | |
Dalrymple Road, Bohle River Bridge Construction | | 318 | | | 25,000 | | | | 6,500 | | | | 10,500 | | | | 8,000 | |
Hulbert Bridge Replacement, Maxwelton Bunda Road | | 315 | | | 3,376 | | | | | | | | 3,376 | | | | | |
Lyndhurst Lane Bridge Replacement | | 307 | | | 2,070 | | | | | | | | 2,070 | | | | | |
Mosby Creek Bridge Replacement | | 315 | | | 2,277 | | | | | | | | 2,277 | | | | | |
Southern Downs Timber Bridge Replacements | | 307 | | | 2,640 | | | | | | | | 2,640 | | | | | |
Other Royalties for the Regions | | Various | | | 20,435 | | | | | | | | 20,435 | | | | | |
Underwood Road/School Road/ improve intersection, Rochedale South | | 303 | | | 7,000 | | | | | | | | 500 | | | | 6,500 | |
119
Capital Statement 2015-16
| | | | | | | | | | | | | | | | | | |
| Transport and Main Roads | |
Project | | Statistical
Area | | Total
Estimated
Cost
$‘000 | | | Expenditure
to
30-06-15
$‘000 | | | Budget
2015-16
$‘000 | | | Post
2015-16
$‘000 | |
Transport Infrastructure Development Scheme | | Various | | | | | | | | | | | 70,000 | | | | Ongoing | |
Whisper Bay, Cannonvale, boat ramp breakwater | | 312 | | | 2,000 | | | | | | | | 2,000 | | | | | |
Yarrabah Jetty | | 306 | | | 7,000 | | | | | | | | 500 | | | | 6,500 | |
Other Capital Grants | | Various | | | 13,851 | | | | | | | | 13,851 | | | | | |
| | | | | | | | | | | | | | | | | | |
Total Capital Grants | | | | | | | | | | | | | 211,452 | | | | | |
| | | | | | | | | | | | | | | | | | |
| | | | | |
GOLD COAST WATERWAYS AUTHORITY | | | | | | | | | | | | | | | | | | |
| | | | | |
Property, Plant and Equipment | | | | | | | | | | | | | | | | | | |
Navigation Access and Safety | | 309 | | | 16,184 | | | | 8,007 | | | | 8,177 | | | | | |
Boating Infrastructure Program | | 309 | | | 6,191 | | | | 5,041 | | | | 1,150 | | | | | |
Plant, Equipment and Minor Works | | 309 | | | 2,852 | | | | 2,012 | | | | 840 | | | | | |
| | | | | | | | | | | | | | | | | | |
Total Property, Plant and Equipment | | | | | | | | | | | | | 10,167 | | | | | |
| | | | | | | | | | | | | | | | | | |
| | | | | |
ROADTEK | | | | | | | | | | | | | | | | | | |
| | | | | |
Property, Plant and Equipment | | | | | | | | | | | | | | | | | | |
Hire Plant | | Various | | | | | | | | | | | 5,000 | | | | Ongoing | |
| | | | | | | | | | | | | | | | | | |
Total Property, Plant and Equipment | | | | | | | | | | | | | 5,000 | | | | | |
| | | | | | | | | | | | | | | | | | |
| | | | | |
QUEENSLAND RAIL LIMITED | | | | | | | | | | | | | | | | | | |
| | | | | |
Property, Plant and Equipment | | | | | | | | | | | | | | | | | | |
Network Assets | | | | | | | | | | | | | | | | | | |
South East Queensland | | | | | | | | | | | | | | | | | | |
Lawnton to Petrie, Third Track | | 302 | | | 167,572 | | | | 76,873 | | | | 72,559 | | | | 18,140 | |
Coomera To Helensvale, Duplication | | 309 | | | 163,257 | | | | 880 | | | | 63,373 | | | | 99,004 | |
Concrete Resleepering | | Various | | | 97,359 | | | | 57,359 | | | | 30,000 | | | | 10,000 | |
Rail Management Centre | | 305 | | | 43,579 | | | | 28,395 | | | | 15,184 | | | | | |
Network Management and Enhancement | | Various | | | | | | | | | | | 92,665 | | | | Ongoing | |
Passenger Safety and Accessibility | | Various | | | | | | | | | | | 42,585 | | | | Ongoing | |
Bridge Replacement and Renewal | | Various | | | | | | | | | | | 31,948 | | | | Ongoing | |
120
Capital Statement 2015-16
| | | | | | | | | | | | | | | | | | |
| Transport and Main Roads | |
Project | | Statistical
Area | | Total
Estimated
Cost
$‘000 | | | Expenditure
to
30-06-15
$‘000 | | | Budget
2015-16
$‘000 | | | Post
2015-16
$‘000 | |
Turnout Replacements and Renewal | | Various | | | | | | | | | | | 15,535 | | | | Ongoing | |
Track Replacement and Renewal | | Various | | | | | | | | | | | 12,937 | | | | Ongoing | |
Other Network Renewal | | Various | | | | | | | | | | | 26,080 | | | | Ongoing | |
Regional Queensland | | | | | | | | | | | | | | | | | | |
Toowoomba Range Capacity and Clearance Upgrades | | 317 | | | 58,144 | | | | 2,149 | | | | 55,735 | | | | 260 | |
Network Management and Enhancement | | Various | | | | | | | | | | | 49,488 | | | | Ongoing | |
Bridge Replacement and Renewal | | Various | | | | | | | | | | | 43,197 | | | | Ongoing | |
Statewide Network Management and Enhancement | | Various | | | | | | | | | | | 12,267 | | | | Ongoing | |
Track and Overhead Geometry Vehicle | | Various | | | 10,585 | | | | 2,955 | | | | 4,872 | | | | 2,758 | |
| | | | | | | | | | | | | | | | | | |
Sub-total Network Assets | | | | | | | | | | | | | 568,425 | | | | | |
| | | | | | | | | | | | | | | | | | |
| | | | | |
Passenger Rail Operations | | | | | | | | | | | | | | | | | | |
New Generation Rollingstock | | | | | | | | | | | | | | | | | | |
Stabling Facilities | | Various | | | 110,749 | | | | 5,254 | | | | 51,632 | | | | 53,863 | |
Wulkuraka Connection Works | | 310 | | | 73,042 | | | | 46,454 | | | | 26,188 | | | | 400 | |
Operational Readiness | | Various | | | 69,147 | | | | 7,397 | | | | 28,510 | | | | 33,240 | |
Outsourced Major Overhauls | | Various | | | 138,627 | | | | 135,520 | | | | 3,107 | | | | | |
Citytrain Rollingstock Overhaul | | Various | | | | | | | | | | | 50,564 | | | | Ongoing | |
Traveltrain Rollingstock Overhaul | | Various | | | | | | | | | | | 38,081 | | | | Ongoing | |
Rollingstock Improvements | | Various | | | | | | | | | | | 28,417 | | | | Ongoing | |
| | | | | | | | | | | | | | | | | | |
Sub-total Passenger Rail Operations | | | | | | | | | | | | | 226,499 | | | | | |
| | | | | | | | | | | | | | | | | | |
| | | | | |
Business Enabling | | | | | | | | | | | | | | | | | | |
Statewide Enabling Works | | Various | | | | | | | | | | | 66,521 | | | | Ongoing | |
| | | | | | | | | | | | | | | | | | |
Sub-total Business Enabling | | | | | | | | | | | | | 66,521 | | | | | |
| | | | | | | | | | | | | | | | | | |
| | | | | | | | | | | | | | | | | | |
| | | | | | | | | | | | | | | | | | |
Total Property, Plant and Equipment | | | | | | | | | | | | | 861,445 | | | | | |
| | | | | | | | | | | | | | | | | | |
| | | | | |
FAR NORTH QUEENSLAND PORTS CORPORATION LIMITED | | | | | | | | | | | | | | | | | | |
| | | | | |
Property, Plant and Equipment | | | | | | | | | | | | | | | | | | |
Tingira St Warehouse/Shops - Release 3 | | 306 | | | 2,250 | | | | | | | | 2,250 | | | | | |
Foreshore Development | | 306 | | | 22,092 | | | | 19,452 | | | | 1,640 | | | | 1,000 | |
121
Capital Statement 2015-16
| | | | | | | | | | | | | | | | | | |
| Transport and Main Roads | |
Project | | Statistical
Area | | Total
Estimated
Cost
$‘000 | | | Expenditure
to
30-06-15
$‘000 | | | Budget
2015-16
$‘000 | | | Post
2015-16
$‘000 | |
Tingira St Subdivision Development | | 306 | | | 32,521 | | | | 2,757 | | | | 703 | | | | 29,061 | |
Mourilyan Lease Acquisitions | | 306 | | | 250 | | | | | | | | 250 | | | | | |
Cityport Commercial Allowance | | 306 | | | 3,870 | | | | 2,770 | | | | 200 | | | | 900 | |
Plant, Equipment and Minor Works | | 306 | | | | | | | | | | | 2,176 | | | | Ongoing | |
| | | | | | | | | | | | | | | | | | |
Total Property, Plant and Equipment | | | | | | | | | | | | | 7,219 | | | | | |
| | | | | | | | | | | | | | | | | | |
| | | | | |
GLADSTONE PORTS CORPORATION LIMITED | | | | | | | | | | | | | | | | | | |
| | | | | |
Property, Plant and Equipment | | | | | | | | | | | | | | | | | | |
RG Tanna Coal Terminal Projects | | | | | | | | | | | | | | | | | | |
Process Control Systems, Stockpile Management and Upgrades | | 308 | | | 74,439 | | | | 25,094 | | | | 40,420 | | | | 8,925 | |
Conveyor Life Extension | | 308 | | | 20,400 | | | | 3,300 | | | | 17,100 | | | | | |
Capacity Maximisation | | 308 | | | 4,800 | | | | | | | | 4,800 | | | | | |
Port Services Projects | | 308 | | | 26,756 | | | | 15,750 | | | | 11,006 | | | | | |
Fisherman’s Landing Projects | | 308 | | | 6,500 | | | | 1,050 | | | | 5,450 | | | | | |
Commercial Projects | | 308 | | | 4,257 | | | | 427 | | | | 3,830 | | | | | |
Marina Pilot Services Projects | | 308 | | | 4,250 | | | | 500 | | | | 3,750 | | | | | |
Corporate Projects | | 308 | | | 3,400 | | | | 1,200 | | | | 2,200 | | | | | |
Barney Point Mooring Upgrade and Water Truck | | 308 | | | 1,400 | | | | | | | | 1,400 | | | | | |
Port of Bundaberg Bulk Liquids Wharf | | 319 | | | 1,255 | | | | | | | | 1,255 | | | | | |
Port of Bundaberg Knauf Development | | 319 | | | 550 | | | | | | | | 550 | | | | | |
Port Alma Building Replacement | | 308 | | | 600 | | | | | | | | 600 | | | | | |
Property Projects | | 308 | | | 850 | | | | 250 | | | | 600 | | | | | |
Engineering Services: Front End Loader | | 308 | | | 500 | | | | | | | | 500 | | | | | |
Plant, Equipment and Minor Works | | 308 | | | | | | | | | | | 4,649 | | | | Ongoing | |
| | | | | | | | | | | | | | | | | | |
Total Property, Plant and Equipment | | | | | | | | | | | | | 98,110 | | | | | |
| | | | | | | | | | | | | | | | | | |
| | | | | |
NORTH QUEENSLAND BULK PORTS CORPORATION LIMITED | | | | | | | | | | | | | | | | | | |
| | | | | |
Property, Plant and Equipment | | | | | | | | | | | | | | | | | | |
Louisa Creek Land Acquisitions | | 312 | | | 15,300 | | | | 10,645 | | | | 3,456 | | | | 1,199 | |
Mackay Port Development General | | 312 | | | | | | | | | | | 2,021 | | | | Ongoing | |
Mackay Port Area 1 Development | | 312 | | | 10,450 | | | | 450 | | | | 2,000 | | | | 8,000 | |
122
Capital Statement 2015-16
| | | | | | | | | | | | | | | | | | |
| Transport and Main Roads | |
Project | | Statistical
Area | | Total
Estimated
Cost
$‘000 | | | Expenditure
to
30-06-15
$‘000 | | | Budget
2015-16
$‘000 | | | Post
2015-16
$‘000 | |
Abbot Point Port Development General | | 312 | | | | | | | | | | | 940 | | | | Ongoing | |
Weipa Port Development General | | 315 | | | | | | | | | | | 790 | | | | Ongoing | |
Hay Point Port Development General | | 312 | | | | | | | | | | | 20 | | | | Ongoing | |
Mackay Lay Down Area | | 312 | | | 1,000 | | | | | | | | 1,000 | | | | | |
Middle Breakwater Fuel Line | | 312 | | | 990 | | | | | | | | 990 | | | | | |
Mt Basset Reservoir | | 312 | | | 850 | | | | | | | | 850 | | | | | |
Abbot Point Indigenous Land Use Agreement | | 312 | | | 4,000 | | | | 3,475 | | | | 525 | | | | | |
Upgrade Pilot Vessel | | 312 | | | | | | | | | | | 382 | | | | Ongoing | |
Plant, Equipment and Minor Works | | Various | | | | | | | | | | | 686 | | | | Ongoing | |
| | | | | | | | | | | | | | | | | | |
Total Property, Plant and Equipment | | | | | | | | | | | | | 13,660 | | | | | |
| | | | | | | | | | | | | | | | | | |
| | | | | |
PORT OF TOWNSVILLE LIMITED | | | | | | | | | | | | | | | | | | |
| | | | | |
Property, Plant and Equipment | | | | | | | | | | | | | | | | | | |
Berth 4 Upgrade | | 318 | | | 55,150 | | | | | | | | 10,150 | | | | 45,000 | |
Berth 6 and 7 Demolition | | 318 | | | 14,728 | | | | 5,018 | | | | 9,710 | | | | | |
Berth 8 and 9 Pile Encapsulation | | 318 | | | 1,858 | | | | | | | | 929 | | | | 929 | |
Berth 8 and 9 Central Pier Slab Strengthening for Cargo Storage | | 318 | | | 319 | | | | | | | | 319 | | | | | |
Harbour Entrance Widening | | 318 | | | 2,523 | | | | | | | | 2,523 | | | | | |
Breakwater Groyne Removal & Beacon Relocation | | 318 | | | 1,500 | | | | | | | | 1,500 | | | | | |
Replacement of Pilot Vessel Petrel II | | 318 | | | 2,800 | | | | | | | | 800 | | | | 2,000 | |
Multi Combination Vehicle Port Access Improvement Works | | 318 | | | 611 | | | | 61 | | | | 550 | | | | | |
Plant, Equipment and Minor Works | | 318 | | | | | | | | | | | 3,326 | | | | Ongoing | |
| | | | | | | | | | | | | | | | | | |
Total Property, Plant and Equipment | | | | | | | | | | | | | 29,807 | | | | | |
| | | | | | | | | | | | | | | | | | |
| | | | | | | | | | | | | | | | | | |
| | | | | | | | | | | | | | | | | | |
TOTAL TRANSPORT AND MAIN ROADS (PPE) | | | | | | | | | | | | | 3,719,180 | | | | | |
| | | | | | | | | | | | | | | | | | |
| | | | | | | | | | | | | | | | | | |
| | | | | | | | | | | | | | | | | | |
TOTAL TRANSPORT AND MAIN ROADS (CG) | | | | | | | | | | | | | 211,452 | | | | | |
| | | | | | | | | | | | | | | | | | |
Notes:
| 1. | Part of the $160.7 million Commonwealth Games Upgrade Package. |
| 2. | Part of the $61.6 million National Highway Upgrade Program. |
| 3. | Part of the $635 million Warrego Highway Upgrade Package to upgrade the Warrego Highway between Toowoomba and Miles. |
| 4. | Part of the $40 million Western Roads Upgrade Program. |
| 5. | Part of the $24.5 million Outback Way Program. |
| 6. | Part of the $260.5 million Cape York Region Package. |
123
Capital Statement 2015-16
QUEENSLAND TREASURY
Queensland Treasury’s capital purchases for 2015-16 will be $7.0 million.
Program Highlights (Property, Plant and Equipment)
| • | | $5.5 million in capital expenditure to support improvement to the State Penalties Enforcement Registry (SPER) system. |
| • | | $1.5 million for ongoing asset replacement, primarily the replacement of existing IT assets, office equipment and leaseholds improvement. |
| | | | | | | | | | | | | | | | |
| Queensland Treasury | |
Project | | Statistical
Area | | Total
Estimated
Cost
$‘000 | | | Expenditure
to
30-06-15
$‘000 | | Budget
2015-16
$‘000 | | | Post
2015-16
$‘000 | |
QUEENSLAND TREASURY | | | | | | | | | | | | | | | | |
| | | | | |
Property, Plant and Equipment | | | | | | | | | | | | | | | | |
Improvement to SPER system | | 305 | | | 5,500 | | | | | | 5,500 | | | | | |
Asset Replacement | | 305 | | | | | | | | | 1,522 | | | | Ongoing | |
| | | | | | | | | | | | | | | | |
Total Property, Plant and Equipment | | | | | | | | | | | 7,022 | | | | | |
| | | | | | | | | | | | | | | | |
| | | | | | | | | | | | | | | | |
| | | | | | | | | | | | | | | | |
TOTAL QUEENSLAND TREASURY (PPE) | | | | | | | | | | | 7,022 | | | | | |
| | | | | | | | | | | | | | | | |
124
Capital Statement 2015-16
Appendices
| Appendix A: | Entities included in capital outlays 2015-16 |
Aboriginal and Torres Strait Islander Partnerships
Department of Aboriginal and Torres Strait Islander Partnerships
Agriculture and Fisheries
Department of Agriculture and Fisheries
Queensland Agricultural Training Colleges
QRAA
Communities, Child Safety and Disability Services
Department of Communities, Child Safety and Disability Services
Education and Training
Department of Education and Training
TAFE Queensland
Queensland Training and Assets Management Authority
Electoral Commission of Queensland
Energy and Water Supply
Department of Energy and Water Supply
CS Energy Limited
Stanwell Corporation Limited
Energex Limited
Ergon Energy Corporation Limited
Powerlink Queensland
SunWater Limited
Gladstone Area Water Board
Mount Isa Water Board
Seqwater
Environment and Heritage Protection
Department of Environment and Heritage Protection
Housing and Public Works
Department of Housing and Public Works
Queensland Building and Construction Commission
Residential Tenancies Authority
125
Capital Statement 2015-16
Justice and Attorney General
Department of Justice and Attorney-General
Public Trustee of Queensland
Legal Aid Queensland
Crime and Corruption Commission
Legislative Assembly of Queensland
Infrastructure, Local Government and Planning
Department of Infrastructure, Local Government, and Planning.
Economic Development Queensland
Southbank Corporation
Queensland Reconstruction Authority
National Parks, Sport and Racing
Department of National Parks Sport and Racing
Stadiums Queensland
Natural Resources and Mines
Department of Natural Resources and Mines
Office of the Governor
Office of the Ombudsman
Premier and Cabinet
Department of the Premier and Cabinet
Queensland Museum
Queensland Art Gallery
Queensland Performing Arts Trust
Public Safety Business Agency
Queensland Audit Office
Fire and Emergency Services
Queensland Fire and Emergency Services
Queensland Health
Queensland Health and Hospital and Health Services
Queensland Ambulance Service
Council of the Queensland Institute of Medical Research
Queensland Police Service
Queensland Police Service
Queensland Treasury
Science, Information Technology and Innovation
Department of Science, Information Technology and Innovation
Library Board of Queensland
CITEC
Queensland Shared Services
126
Capital Statement 2015-16
State Development
Department of State Development
Tourism, Major Events, Small Business and the Commonwealth Games
Department of Tourism, Major Events, Small Business and the Commonwealth Games
Transport and Main Roads
Department of Transport and Main Roads
Gold Coast Waterways Authority
RoadTek
Queensland Rail Limited
Far North Queensland Ports Corporation Limited
Gladstone Ports Corporation Limited
North Queensland Bulk Ports Corporation Limited
Port of Townsville Limited.
127
Capital Statement 2015-16
| Appendix B: | Key concepts and coverage |
Coverage of the capital statement
Under accrual output budgeting, capital is the stock of assets including property, plant and equipment and intangible assets that an agency owns and/or controls and uses in the delivery of services, as well as capital grants made to other entities. The following definitions are applicable throughout this document:
| • | | capital purchases – property, plant and equipment outlays as per the financial statements excluding asset sales, depreciation and revaluations; and |
| • | | capital grants – capital grants to other entities and individuals (excluding grants to other Government departments and statutory bodies). |
Capital purchases and capital grants include information for all bodies defined as reporting entities for the purpose of whole-of-Government financial reporting requirements, excluding Public Financial Corporations. Projects without a recorded total estimated cost are ongoing. The entities included in scope for the Capital Statement are listed in Appendix A.
Capital contingency
Consistent with the approach adopted in previous years, a capital contingency reserve has been included. This reserve recognises that while agencies budget to fully use their capital works allocation, circumstances such as project lead-in times, project management constraints, unexpected weather conditions and capacity constraints such as the supply of labour and materials may prevent full usage. On a whole-of-Government basis, there is likely to be underspending, resulting in a carryover of capital allocations.
128
Capital Statement 2015-16
| Appendix C: | Capital Purchases by Entity by Region 2015-16 |
Table C.1 Total Capital Purchases within Statistical Area for 2015-16
| | | | | | | | | | | | | | | | | | | | | | | | | | | | | | | | |
| | | Brisbane | | | Ipswich | | | Wide Bay | |
| | | Bris Est | | | Bris Nth | | | Bris Sth | | | Bris Wst | | | Inner Bris | | | Sub Total | | | | | | | |
Entity2 | | $‘000 | | | $‘000 | | | $‘000 | | | $‘000 | | | $‘000 | | | $‘000 | | | $‘000 | | | $‘000 | |
| | | | | | | | |
Aboriginal and Torres Strait Islander Partnerships | | | — | | | | — | | | | — | | | | — | | | | 369 | | | | 368 | | | | — | | | | — | |
| | | | | | | | |
Agriculture and Fisheries | | | 617 | | | | 559 | | | | 3,278 | | | | 501 | | | | 4,775 | | | | 9,730 | | | | 831 | | | | 936 | |
| | | | | | | | |
Communities, Child Safety and Disability Services | | | 2,880 | | | | 800 | | | | 1,325 | | | | 717 | | | | 955 | | | | 6,677 | | | | 3,990 | | | | 1,125 | |
| | | | | | | | |
Education and Training | | | 25,058 | | | | 16,595 | | | | 44,318 | | | | 15,776 | | | | 19,705 | | | | 121,452 | | | | 34,948 | | | | 18,896 | |
| | | | | | | | |
Energy and Water Supply | | | 26,904 | | | | 119,920 | | | | 151,798 | | | | 88,611 | | | | 228,924 | | | | 616,157 | | | | 129,257 | | | | 181,112 | |
| | | | | | | | |
Environment and Heritage Protection | | | 568 | | | | 516 | | | | 855 | | | | 462 | | | | 616 | | | | 3,017 | | | | 767 | | | | 725 | |
| | | | | | | | |
Fire and Emergency Services | | | 407 | | | | 370 | | | | 613 | | | | 331 | | | | 442 | | | | 2,163 | | | | 550 | | | | 520 | |
| | | | | | | | |
Housing and Public Works | | | 12,017 | | | | 11,700 | | | | 19,511 | | | | 6,334 | | | | 19,861 | | | | 69,423 | | | | 13,429 | | | | 11,469 | |
| | | | | | | | |
Infrastructure, Local Government and Planning | | | — | | | | — | | | | — | | | | — | | | | 14,875 | | | | 14,875 | | | | 1,500 | | | | — | |
| | | | | | | | |
Justice and Attorney-General | | | 1,841 | | | | 2,670 | | | | 4,045 | | | | 11,691 | | | | 15,449 | | | | 35,696 | | | | 11,831 | | | | 3,755 | |
| | | | | | | | |
Legislative Assembly of Queensland | | | — | | | | — | | | | — | | | | — | | | | 8,397 | | | | 8,397 | | | | — | | | | — | |
| | | | | | | | |
National Parks, Sport and Racing | | | 7,371 | | | | 2,413 | | | | 19,206 | | | | 1,864 | | | | 6,840 | | | | 37,694 | | | | 2,039 | | | | 2,063 | |
| | | | | | | | |
Natural Resources and Mines | | | — | | | | 4,950 | | | | 150 | | | | — | | | | 14,239 | | | | 19,339 | | | | 200 | | | | 150 | |
| | | | | | | | |
Premier and Cabinet | | | — | | | | — | | | | — | | | | — | | | | 14,400 | | | | 14,400 | | | | — | | | | — | |
| | | | | | | | |
Public Safety Business Agency3 | | | 6,503 | | | | 5,904 | | | | 9,791 | | | | 5,289 | | | | 28,289 | | | | 55,776 | | | | 10,649 | | | | 19,934 | |
| | | | | | | | |
Queensland Health | | | 20,971 | | | | 58,862 | | | | 70,420 | | | | 16,573 | | | | 83,432 | | | | 250,258 | | | | 34,044 | | | | 49,951 | |
| | | | | | | | |
Queensland Police Service | | | 1,558 | | | | 1,412 | | | | 2,342 | | | | 1,265 | | | | 1,687 | | | | 8,264 | | | | 2,099 | | | | 1,984 | |
| | | | | | | | |
Queensland Treasury | | | — | | | | — | | | | — | | | | — | | | | 7,022 | | | | 7,022 | | | | — | | | | — | |
| | | | | | | | |
Science, Information Technology and Innovation | | | 202 | | | | 185 | | | | 304 | | | | 165 | | | | 20,788 | | | | 21,644 | | | | 271 | | | | 258 | |
| | | | | | | | |
State Development | | | 29 | | | | 27 | | | | 44 | | | | 24 | | | | 32 | | | | 156 | | | | 40 | | | | 37 | |
Tourism, Major Events, Small Business and the Commonwealth Games | | | 43,245 | | | | 8 | | | | 13 | | | | 7 | | | | 30 | | | | 43,303 | | | | 12 | | | | 11 | |
| | | | | | | | |
Transport and Main Roads | | | 49,787 | | | | 300,131 | | | | 93,010 | | | | 55,298 | | | | 154,410 | | | | 652,636 | | | | 181,535 | | | | 205,670 | |
| | | | | | | | |
Other Agencies4 | | | 166 | | | | 152 | | | | 251 | | | | 135 | | | | 3,162 | | | | 3,866 | | | | 231 | | | | 210 | |
Anticipated Capital Contingency Reserve and Other Adjustments5 | | | | | | | | | | | | | | | | | | | | | | | | | | | | | | | | |
| | | | | | | | |
Funds Allocated | | | 192,060 | | | | 505,931 | | | | 404,298 | | | | 196,781 | | | | 622,559 | | | | 1,921,629 | | | | 410,967 | | | | 478,706 | |
Notes:
| 1. | Numbers may not add due to rounding and location of adjustments. |
| 2. | Includes associated statutory bodies. |
| 3. | The Public Safety Business Agency will purchase any capital on behalf of the Inspector General Emergency Management. |
| 4. | Includes the Electoral Commission of Queensland, Office of the Governor, Office of the Ombudsman and Queensland Audit Office. |
| 5. | The Anticipated Capital Contingency Reserve and other adjustments have been spread across statistical areas proportionate to capital spend. |
129
Capital Statement 2015-16
| | | | | | | | | | | | | | | | | | | | | | | | | | | | | | | | |
| | | Darling Downs | | | Gold Coast | | | Mackay | | | QLD
Outback | |
| | | D Downs
Maranoa | | | Toowoomba | | | Sub Total | | | G Coast | | | Logan
B’desert | | | Sub-Total | | | | | | | |
Entity2 | | $‘000 | | | $‘000 | | | $‘000 | | | $‘000 | | | $‘000 | | | $‘000 | | | $‘000 | | | $‘000 | |
| | | | | | | | |
Aboriginal and Torres Strait Islander Partnerships | | | — | | | | — | | | | — | | | | — | | | | — | | | | — | | | | — | | | | 488 | |
| | | | | | | | |
Agriculture and Fisheries | | | 556 | | | | 1,751 | | | | 2,307 | | | | 1,597 | | | | 849 | | | | 2,446 | | | | 587 | | | | 2,278 | |
| | | | | | | | |
Communities, Child Safety and Disability Services | | | 559 | | | | 522 | | | | 1,081 | | | | 2,145 | | | | 1,216 | | | | 3,361 | | | | 697 | | | | 2,165 | |
| | | | | | | | |
Education and Training | | | 12,447 | | | | 10,389 | | | | 22,836 | | | | 59,145 | | | | 21,905 | | | | 81,050 | | | | 32,830 | | | | 7,946 | |
| | | | | | | | |
Energy and Water Supply | | | 225,779 | | | | 237,509 | | | | 463,288 | | | | 106,490 | | | | 39,943 | | | | 146,433 | | | | 49,323 | | | | 220,275 | |
| | | | | | | | |
Environment and Heritage Protection | | | 375 | | | | 323 | | | | 698 | | | | 1,381 | | | | 783 | | | | 2,164 | | | | 449 | | | | 224 | |
| | | | | | | | |
Fire and Emergency Services | | | 269 | | | | 232 | | | | 501 | | | | 990 | | | | 561 | | | | 1,551 | | | | 322 | | | | 161 | |
| | | | | | | | |
Housing and Public Works | | | 10,588 | | | | 3,707 | | | | 14,295 | | | | 25,506 | | | | 5,421 | | | | 30,927 | | | | 8,182 | | | | 125,337 | |
| | | | | | | | |
Infrastructure, Local Government and Planning | | | — | | | | — | | | | — | | | | 18,953 | | | | — | | | | 18,953 | | | | 1,700 | | | | 6,968 | |
| | | | | | | | |
Justice and Attorney-General | | | 4,079 | | | | 1,047 | | | | 5,126 | | | | 7,785 | | | | 2,535 | | | | 10,320 | | | | 1,455 | | | | 2,644 | |
| | | | | | | | |
Legislative Assembly of Queensland | | | — | | | | — | | | | — | | | | — | | | | — | | | | — | | | | — | | | | — | |
| | | | | | | | |
National Parks, Sport and Racing | | | 1,057 | | | | 898 | | | | 1,955 | | | | 4,482 | | | | 2,089 | | | | 6,571 | | | | 1,246 | | | | 609 | |
| | | | | | | | |
Natural Resources and Mines | | | 200 | | | | 150 | | | | 350 | | | | 150 | | | | 100 | | | | 250 | | | | 200 | | | | 200 | |
| | | | | | | | |
Premier and Cabinet | | | — | | | | — | | | | — | | | | — | | | | — | | | | — | | | | — | | | | — | |
| | | | | | | | |
Public Safety Business Agency3 | | | 4,288 | | | | 4,300 | | | | 8,588 | | | | 17,368 | | | | 8,963 | | | | 26,331 | | | | 5,142 | | | | 5,045 | |
| | | | | | | | |
Queensland Health | | | 13,435 | | | | 32,777 | | | | 46,212 | | | | 91,259 | | | | 28,082 | | | | 119,341 | | | | 29,911 | | | | 40,939 | |
| | | | | | | | |
Queensland Police Service | | | 1,026 | | | | 885 | | | | 1,911 | | | | 3,780 | | | | 2,144 | | | | 5,924 | | | | 1,230 | | | | 614 | |
| | | | | | | | |
Queensland Treasury | | | — | | | | — | | | | — | | | | — | | | | — | | | | — | | | | — | | | | — | |
| | | | | | | | |
Science, Information Technology and Innovation | | | 132 | | | | 115 | | | | 247 | | | | 489 | | | | 279 | | | | 768 | | | | 160 | | | | 78 | |
| | | | | | | | |
State Development | | | 19 | | | | 17 | | | | 36 | | | | 71 | | | | 40 | | | | 111 | | | | 23 | | | | 12 | |
| | | | | | | | |
Tourism, Major Events, Small Business and the Commonwealth Games | | | 6 | | | | 5 | | | | 11 | | | | 22 | | | | 12 | | | | 34 | | | | 7 | | | | 4 | |
| | | | | | | | |
Transport and Main Roads | | | 338,707 | | | | 156,670 | | | | 495,377 | | | | 395,820 | | | | 84,673 | | | | 480,493 | | | | 189,773 | | | | 203,732 | |
| | | | | | | | |
Other Agencies4 | | | 94 | | | | 110 | | | | 204 | | | | 408 | | | | 232 | | | | 640 | | | | 133 | | | | 64 | |
| | | | | | | | |
Anticipated Capital Contingency Reserve and Other Adjustments5 | | | | | | | | | | | | | | | | | | | | | | | | | | | | | | | | |
| | | | | | | | |
Funds Allocated | | | 588,890 | | | | 433,217 | | | | 1,022,107 | | | | 708,109 | | | | 191,775 | | | | 899,884 | | | | 310,340 | | | | 594,808 | |
Notes:
| 1. | Numbers may not add due to rounding and location of adjustments. |
| 2. | Includes associated statutory bodies. |
| 3. | The Public Safety Business Agency will purchase any capital on behalf of the Inspector General Emergency Management. |
| 4. | Includes the Electoral Commission of Queensland, Office of the Governor, Office of the Ombudsman and Queensland Audit Office. |
| 5. | The Anticipated Capital Contingency Reserve and other adjustments have been spread across statistical areas proportionate to capital spend. |
130
Capital Statement 2015-16
| | | | | | | | | | | | | | | | | | | | | | | | | | | | | | | | |
| | | Cairns | | | Fitzroy | | | Sunshine Coast | | | Townsville | | | Totals | |
| | | | Sunshine
Coast | | | Moreton B
Nth | | | Moreton B
Sth | | | Sub Total | | | | | | | |
Entity2 | | $‘000 | | | $‘000 | | | $‘000 | | | $‘000 | | | $‘000 | | | $‘000 | | | $‘000 | | | $‘000 | |
| | | | | | | | |
Aboriginal and Torres Strait Islander Partnerships | | | 62 | | | | 40 | | | | — | | | | — | | | | — | | | | — | | | | 162 | | | | 1,120 | |
| | | | | | | | |
Agriculture and Fisheries | | | 806 | | | | 2,034 | | | | 1,099 | | | | 629 | | | | 495 | | | | 2,223 | | | | 1,785 | | | | 25,963 | |
| | | | | | | | |
Communities, Child Safety and Disability Services | | | 937 | | | | 884 | | | | 3,975 | | | | 898 | | | | 705 | | | | 5,578 | | | | 2,908 | | | | 29,403 | |
| | | | | | | | |
Education and Training | | | 29,509 | | | | 24,720 | | | | 31,019 | | | | 20,921 | | | | 19,162 | | | | 71,102 | | | | 28,940 | | | | 474,229 | |
| | | | | | | | |
Energy and Water Supply | | | 42,703 | | | | 364,854 | | | | 120,268 | | | | 5,844 | | | | 23,588 | | | | 149,700 | | | | 60,322 | | | | 2,423,424 | |
| | | | | | | | |
Environment and Heritage Protection | | | 605 | | | | 571 | | | | 829 | | | | 580 | | | | 456 | | | | 1,865 | | | | 586 | | | | 11,671 | |
| | | | | | | | |
Fire and Emergency Services | | | 433 | | | | 409 | | | | 594 | | | | 416 | | | | 327 | | | | 1,337 | | | | 420 | | | | 8,367 | |
| | | | | | | | |
Housing and Public Works | | | 31,062 | | | | 10,180 | | | | 10,831 | | | | 4,848 | | | | 3,725 | | | | 19,404 | | | | 47,803 | | | | 381,511 | |
| | | | | | | | |
Infrastructure, Local Government and Planning | | | 122 | | | | 3,300 | | | | — | | | | — | | | | — | | | | — | | | | 250 | | | | 47,668 | |
| | | | | | | | |
Justice and Attorney-General | | | 4,574 | | | | 2,082 | | | | 2,683 | | | | 3,728 | | | | 1,477 | | | | 7,888 | | | | 13,384 | | | | 98,755 | |
| | | | | | | | |
Legislative Assembly of Queensland | | | — | | | | — | | | | — | | | | — | | | | — | | | | — | | | | — | | | | 8,397 | |
| | | | | | | | |
National Parks, Sport and Racing | | | 1,710 | | | | 1,585 | | | | 8,813 | | | | 1,545 | | | | 1,201 | | | | 11,559 | | | | 2,310 | | | | 69,341 | |
| | | | | | | | |
Natural Resources and Mines | | | 300 | | | | 300 | | | | 100 | | | | 100 | | | | 100 | | | | 300 | | | | 200 | | | | 21,789 | |
| | | | | | | | |
Premier and Cabinet | | | — | | | | — | | | | — | | | | — | | | | — | | | | — | | | | — | | | | 14,400 | |
| | | | | | | | |
Public Safety Business Agency3 | | | 7,169 | | | | 6,532 | | | | 9,734 | | | | 10,698 | | | | 5,823 | | | | 26,255 | | | | 6,705 | | | | 178,126 | |
| | | | | | | | |
Queensland Health | | | 69,212 | | | | 46,629 | | | | 528,140 | | | | 20,801 | | | | 16,365 | | | | 565,306 | | | | 51,309 | | | | 1,303,112 | |
| | | | | | | | |
Queensland Police Service | | | 1,655 | | | | 1,563 | | | | 2,269 | | | | 1,588 | | | | 1,249 | | | | 5,106 | | | | 1,604 | | | | 31,954 | |
| | | | | | | | |
Queensland Treasury | | | — | | | | — | | | | — | | | | — | | | | — | | | | — | | | | — | | | | 7,022 | |
| | | | | | | | |
Science, Information Technology and Innovation | | | 214 | | | | 202 | | | | 295 | | | | 206 | | | | 161 | | | | 662 | | | | 209 | | | | 24,713 | |
| | | | | | | | |
State Development | | | 31 | | | | 3,339 | | | | 43 | | | | 30 | | | | 24 | | | | 97 | | | | 474 | | | | 4,356 | |
| | | | | | | | |
Tourism, Major Events, Small Business and the Commonwealth Games | | | 10 | | | | 9 | | | | 13 | | | | 9 | | | | 7 | | | | 29 | | | | 9 | | | | 43,439 | |
| | | | | | | | |
Transport and Main Roads | | | 152,740 | | | | 350,550 | | | | 288,273 | | | | 91,077 | | | | 184,940 | | | | 564,290 | | | | 242,384 | | | | 3,719,180 | |
| | | | | | | | |
Other Agencies4 | | | 177 | | | | 171 | | | | 245 | | | | 171 | | | | 137 | | | | 553 | | | | 172 | | | | 6,421 | |
| | | | | | | | |
Anticipated Capital Contingency Reserve and Other Adjustments5 | | | | | | | | | | | | | | | | | | | | | | | | | | | | | | | (360,018 | ) |
| | | | | | | | |
Funds Allocated | | | 330,168 | | | | 786,913 | | | | 968,555 | | | | 157,477 | | | | 249,467 | | | | 1,375,499 | | | | 443,322 | | | | 8,574,343 | |
Notes:
| 1. | Numbers may not add due to rounding and location of adjustments. |
| 2. | Includes associated statutory bodies. |
| 3. | The Public Safety Business Agency will purchase any capital on behalf of the Inspector General Emergency Management. |
| 4. | Includes the Electoral Commission of Queensland, Office of the Governor, Office of the Ombudsman and Queensland Audit Office. |
| 5. | The Anticipated Capital Contingency Reserve and other adjustments have been spread across statistical areas proportionate to capital spend. |
131
Queensland Budget 2015-16 Capital Statement Budget Paper No. 3 www.budget.qld.gov.au
Queensland Budget 2015-16 Capital Statement Budget Paper No. 3
Queensland Budget 2015-16 Capital Statement Budget Paper No. 3 www.budget.qld.gov.au
Queensland Budget 2015-16
Budget Measures
Budget Paper No. 4
2015-16 Queensland Budget Papers
1. Budget Speech
2. Budget Strategy and Outlook
3. Capital Statement
4. Budget Measures
5. Service Delivery Statements
Appropriation Bills
Jobs Now, Jobs for the Future - Queensland Government employment plan
Budget Highlights
The suite of Budget Papers is similar to that published in 2014-15.
The Budget Papers are available online at www.budget.qld.gov.au
© Crown copyright
All rights reserved
Queensland Government 2015
Excerpts from this publication may be reproduced, with appropriate
acknowledgement, as permitted under the Copyright Act.
Budget Measures
Budget Paper No. 4
ISSN 1445-4890 (Print)
ISSN 1445-4904 (Online)

State Budget
2015-16
Budget Measures
Budget Paper No. 4
Contents
| | | | | | |
| 1 | | Overview | | | 1 | |
| | |
| 1.1 | | Introduction | | | 1 | |
| 1.2 | | Explanation of scope and terms | | | 2 | |
| 1.3 | | Funding of election commitments | | | 4 | |
| | Summary tables | | | 6 | |
| | |
| 2 | | Expense Measures | | | 19 | |
| | |
| | Whole-of-Government | | | 20 | |
| | Department of Aboriginal and Torres Strait Islander Partnerships | | | 21 | |
| | Department of Agriculture and Fisheries | | | 23 | |
| | Department of Communities, Child Safety and Disability Services | | | 25 | |
| | Department of Education and Training | | | 29 | |
| | Department of Energy and Water Supply | | | 35 | |
| | Department of Environment and Heritage Protection | | | 36 | |
| | Department of Housing and Public Works | | | 39 | |
| | Department of Infrastructure, Local Government and Planning | | | 42 | |
| | Department of Justice and Attorney-General | | | 45 | |
| | Department of National Parks, Sport and Racing | | | 51 | |
| | Department of Natural Resources and Mines | | | 53 | |
| | Department of Science, Information Technology and Innovation | | | 55 | |
| | Department of State Development | | | 57 | |
| | Department of the Premier and Cabinet | | | 59 | |
| | Department of Tourism, Major Events, Small Business and the Commonwealth Games | | | 64 | |
| | Department of Transport and Main Roads | | | 66 | |
| | Electoral Commission of Queensland | | | 69 | |
| | Legislative Assembly of Queensland | | | 70 | |
| | Public Safety Business Agency | | | 73 | |
| | Public Service Commission | | | 75 | |
| | | | | | |
| | Queensland Health | | | 76 | |
| | Queensland Police Service | | | 86 | |
| | Queensland Treasury | | | 89 | |
| | |
| 3 | | Capital Measures | | | 92 | |
| | |
| | Department of Communities, Child Safety and Disability Services | | | 93 | |
| | Department of Education and Training | | | 94 | |
| | Department of Housing and Public Works | | | 96 | |
| | Department of Infrastructure, Local Government and Planning | | | 97 | |
| | Department of National Parks, Sport and Racing | | | 98 | |
| | Department of State Development | | | 99 | |
| | Department of the Premier and Cabinet | | | 100 | |
| | Department of Transport and Main Roads | | | 101 | |
| | Electoral Commission of Queensland | | | 103 | |
| | Legislative Assembly of Queensland | | | 104 | |
| | Queensland Health | | | 105 | |
| | Queensland Police Service | | | 106 | |
| | Queensland Treasury | | | 107 | |
| | |
| 4 | | Revenue Measures | | | 108 | |
| | |
| | Department of Natural Resources and Mines | | | 109 | |
| | Queensland Treasury | | | 111 | |
Budget Measures 2015-16
Features
| • | | This Budget Paper presents a consolidation of expense, capital and revenue measures reflecting decisions since the 2014-15 Budget. |
| • | | Consistent with its measured and responsible management of the State’s finances, the Government has more than offset the cost of its election commitments through reprioritisation measures. |
| • | | The measures of the Government reflect its policy agenda of creating jobs and fostering emerging and innovative industries, revitalising front line services and implementing election commitments. |
| • | | In the Health portfolio, the Government is providing new growth funding for Queensland Health of $2.3 billion over four years to support the ongoing growth in demand for health and ambulance services. |
| • | | In Education and Training, the Government is investing $240 million over four years to restore the successful Skilling Queenslanders for Work program. |
| • | | In addition to these commitments, the Government is allocating $500 million towards a State-wide Schools and Hospitals Fund to provide an economic uplift with a focus on health refurbishment and education capital and maintenance projects. |
| • | | Operating expenses are forecast to grow at a sustainable rate, averaging 4.1% per annum across the forward estimates (excluding disaster recovery expenses). |
| • | | The Government has committed to no new taxes, fees or charges. Already scheduled increases in annual indexation of certain fees and charges, as determined by the previous Government, will continue. |
The purpose of this document is to provide a consolidated view of policy decisions with budgetary impacts made by the Government since taking office.
This document complements other Budget Papers, in particular Budget Paper No. 2 – Budget Strategy and Outlook, Budget Paper No. 3 – Capital Statement, Concessions Statement and the Service Delivery Statements.
This paper includes only new policy decisions and does not detail the full amount of additional funding being provided to agencies to deliver services and infrastructure. For example, parameter based adjustments, where the funding formula remains unchanged, are not included.
The total funding impact of new measures is summarised in Tables 1.3 to 1.5 at the conclusion of this chapter. For completeness, these tables also include the funding impact of measures announced by the former Government since the 2014-15 Budget. For details on the total funding available to agencies, refer to agencies’ Service Delivery Statements.
1
Budget Measures 2015-16
| 1.2 | Explanation of scope and terms |
The following is a description of the scope and terms applied in this document.
This document includes measures with the following features:
| • | | Sector. Only Queensland General Government sector agencies are included. Measures involving Government-owned corporations or other Public Non-financial Corporations sector agencies are within scope only if the measures are being funded directly by the General Government sector or if there is a flow through effect (for example, Community Service Obligations). |
| • | | Timeframe. Measures based on decisions made by the Government since taking office. |
| • | | Type. Measures with budgetary impacts, in particular: (i) expense and capital measures with service delivery, capital enhancement, grant or subsidy impacts on the community; and (ii) revenue measures involving a significant change in revenue policy, including changes in tax rate. |
Initiatives of a technical nature or non-policy based adjustments, such as parameter based funding adjustments, are not included if the formula to calculate these adjustments has not changed, as they do not reflect changes in government policy. The main focus is on measures reflecting policy decisions that impact directly on the community through service delivery or other means.
| • | | Materiality. Minor measures or measures with non-significant community impact are not included in this document. |
2
Budget Measures 2015-16
Tables in this document are presented on a net funding basis.
| • | | Net funding refers to the impact that the funding of the measure has on appropriations from the Consolidated Fund or centrally held funds to the relevant General Government agency. The tables do not include funding directed to the measure from existing agency resources or other sources. |
| • | | Amounts refer to additional funding being provided to agencies for a particular program or project, as a result of Government decisions since the 2014-15 Budget. This may differ to other Budget papers, such as Budget Paper No. 3 – Capital Statement, that may refer to total funding. |
| • | | Where a measure involves material expenditure or revenue collections by more than one department, the measure is reported under each department involved. The addition of each individual department’s portion of a particular measure may not equate to the reported total whole-of-Government figure due to the omission of some department’s portions that did not meet Budget Paper 4’s materiality threshold (i.e. $250,000 over four years). |
| • | | Amounts included in the tables relating to revenue measures represent the impact of the measure on Government revenue (with a positive amount representing additional revenue). |
Tables 1.3 to 1.5 identify expense, capital and revenue measures separately, categorised as follows:
| • | | Decisions of the current Government |
| • | | Decisions of the former Government. |
3
Budget Measures 2015-16
| 1.3 | Funding of election commitments |
Consistent with its measured and responsible management of the State’s finances, the Government has more than offset the cost of its election commitments through a range of measures as outlined in Table 1.1 below.
The total cost of election commitments is defined as where additional funding from the Consolidated Fund has been appropriated to agencies or a funding contingency has been set up centrally. This excludes any costs associated with election commitments that are funded through other means or funded internally by agencies.
| Table 1.1 | Funding of election commitments1 |
| | | | | | | | | | | | | | | | | | | | | | | | |
| | | 2014-15 | | | 2015-16 | | | 2016-17 | | | 2017-18 | | | 2018-19 | | | Total | |
| | | $ million | | | $ million | | | $ million | | | $ million | | | $ million | | | $ million | |
Total cost of election commitments2,3 | | | 2 | | | | 527 | | | | 567 | | | | 519 | | | | 361 | | | | 1,975 | |
Total reprioritisations2,4 | | | (2 | ) | | | (431 | ) | | | (529 | ) | | | (521 | ) | | | (431 | ) | | | (1,915 | ) |
Including reductions in number of Ministers | | | (0.7 | ) | | | (9.0 | ) | | | (9.0 | ) | | | (9.0 | ) | | | (9.0 | ) | | | (36.7 | ) |
Deferral of the increase in payroll tax threshold2 | | | 0 | | | | (40 | ) | | | (80 | ) | | | (120 | ) | | | (160 | ) | | | (400 | ) |
Net cost of election commitments | | | 0 | | | | 56 | | | | (42 | ) | | | (123 | ) | | | (231 | ) | | | (340 | ) |
Notes:
| 1. | Numbers may not add due to rounding. |
| 2. | Details of individual measures are included in the relevant agency sections of this document. |
| 3. | Includes capital and expense measures, and revenue foregone. Individual measures may not add due to some funds being held in a central contingency. |
| 4. | Includes the reprioritisation allocations in Table 1.2, and a general policy contingency sourced from the draw-down of a whole-of-Government general funding contingency held centrally in the 2014-15 Mid Year Fiscal and Economic Review. |
4
Budget Measures 2015-16
| 1.3.1 | Whole-of-Government measures |
The Government has more than offset the cost of its election commitments, totalling $1.975 billion over five years to 2018-19, through a range of measures. This includes a whole-of-Government reprioritisation allocation of $1.125 billion over 2015-16 to 2018-19. The allocations for individual portfolios are outlined in Table 1.2 below.
Achieving these allocations will be the responsibility of each Minister, and will be done in a manner consistent with the Government’s commitment to public sector job security. There will be no forced redundancies or voluntary redundancy programs in response to reprioritisation measures.
To achieve their reprioritisation target Ministers can reduce discretionary spending in areas such as consultants, contractors and advertising, as well as utilise savings from improvements to productivity and procurement.
| Table 1.2 | Reprioritisation allocations1 |
| | | | | | | | | | | | | | | | | | | | |
| | | 2015-16 | | | 2016-17 | | | 2017-18 | | | 2018-19 | | | Total | |
| | | $ million | | | $ million | | | $ million | | | $ million | | | $ million | |
Aboriginal and Torres Strait Islander Partnerships | | | (0.5 | ) | | | (0.6 | ) | | | (0.6 | ) | | | (0.6 | ) | | | (2.4 | ) |
Agriculture and Fisheries | | | (1.9 | ) | | | (2.8 | ) | | | (2.7 | ) | | | (2.7 | ) | | | (10.2 | ) |
Communities, Child Safety and Disability Services | | | (7.5 | ) | | | (12.8 | ) | | | (13.2 | ) | | | (13.2 | ) | | | (46.8 | ) |
Education and Training | | | (43.5 | ) | | | (72.8 | ) | | | (74.2 | ) | | | (74.2 | ) | | | (264.7 | ) |
Environment and Heritage Protection | | | (0.8 | ) | | | (1.2 | ) | | | (1.2 | ) | | | (1.2 | ) | | | (4.4 | ) |
Infrastructure, Local Government and Planning | | | (1.2 | ) | | | (1.3 | ) | | | (1.1 | ) | | | (1.1 | ) | | | (4.7 | ) |
Justice and Attorney-General | | | (6.5 | ) | | | (10.6 | ) | | | (10.6 | ) | | | (10.6 | ) | | | (38.3 | ) |
National Parks, Sport and Racing | | | (1.8 | ) | | | (2.8 | ) | | | (2.5 | ) | | | (2.5 | ) | | | (9.7 | ) |
Natural Resources and Mines | | | (2.1 | ) | | | (3.2 | ) | | | (3.0 | ) | | | (3.0 | ) | | | (11.2 | ) |
Science, Information Technology and Innovation | | | (2.0 | ) | | | (2.7 | ) | | | (2.5 | ) | | | (2.5 | ) | | | (9.7 | ) |
State Development | | | (1.6 | ) | | | (0.9 | ) | | | (0.8 | ) | | | (0.8 | ) | | | (4.1 | ) |
Premier and Cabinet | | | (1.4 | ) | | | (2.2 | ) | | | (2.2 | ) | | | (2.2 | ) | | | (7.9 | ) |
Tourism, Major Events, Small Business and the Commonwealth Games | | | (0.1 | ) | | | (0.1 | ) | | | (0.1 | ) | | | (0.1 | ) | | | (0.4 | ) |
Transport and Main Roads | | | (24.1 | ) | | | (38.1 | ) | | | (38.5 | ) | | | (38.5 | ) | | | (139.3 | ) |
Public Safety Business Agency | | | (2.3 | ) | | | (3.3 | ) | | | (3.2 | ) | | | (3.2 | ) | | | (12.1 | ) |
Public Service Commission | | | (0.1 | ) | | | (0.1 | ) | | | (0.1 | ) | | | (0.1 | ) | | | (0.4 | ) |
Queensland Fire and Emergency Services | | | (2.7 | ) | | | (4.5 | ) | | | (4.5 | ) | | | (4.5 | ) | | | (16.2 | ) |
Queensland Health | | | (95.2 | ) | | | (137.7 | ) | | | (136.1 | ) | | | (115.4 | ) | | | (484.4 | ) |
Queensland Police Service | | | (9.0 | ) | | | (14.9 | ) | | | (15.0 | ) | | | (15.0 | ) | | | (54.0 | ) |
Queensland Treasury | | | (0.7 | ) | | | (1.1 | ) | | | (1.1 | ) | | | (1.1 | ) | | | (4.0 | ) |
Reprioritisation total | | | (205.1 | ) | | | (313.7 | ) | | | (313.5 | ) | | | (292.8 | ) | | | (1125.0 | ) |
Notes:
| 1. | Numbers may not add due to rounding. |
5
Budget Measures 2015-16
| Table 1.3: | Expense measures since the 2014-15 Budget |
| | | | | | | | | | | | | | | | | | | | |
Expense measures of the current Government | | 2014-15
$‘000 | | | 2015-16
$‘000 | | | 2016-17
$‘000 | | | 2017-18
$‘000 | | | 2018-19
$‘000 | |
| | | | | |
Whole-of-Government Measures | | | | | | | | | | | | | | | | | | | | |
Whole-of-Government reprioritisation | | | — | | | | (205,089 | ) | | | (313,664 | ) | | | (313,518 | ) | | | (292,768 | ) |
| | | | | | | | | | | | | | | | | | | | |
Portfolio Total | | | — | | | | (205,089 | ) | | | (313,664 | ) | | | (313,518 | ) | | | (292,768 | ) |
| | | | | | | | | | | | | | | | | | | | |
| | | | | |
Department of Aboriginal and Torres Strait Islander Partnerships | | | | | | | | | | | | | | | | | | | | |
Reparations for Government Controls of Wages and Savings of Aboriginal and Torres Strait Islander People | | | — | | | | 4,020 | | | | 13,250 | | | | 3,730 | | | | — | |
Welfare Reform | | | — | | | | 4,000 | | | | 8,000 | | | | 8,185 | | | | 8,378 | |
Implementation of high priority recommendations of the Domestic and Family Violence Taskforce | | | — | | | | 131 | | | | — | | | | — | | | | — | |
| | | | | | | | | | | | | | | | | | | | |
Portfolio Total | | | — | | | | 8,151 | | | | 21,250 | | | | 11,915 | | | | 8,378 | |
| | | | | | | | | | | | | | | | | | | | |
| | | | | |
Department of Agriculture and Fisheries | | | | | | | | | | | | | | | | | | | | |
Extending Existing Drought Relief Arrangements | | | — | | | | 30,187 | | | | 3,395 | | | | 2,395 | | | | 295 | |
Panama Disease Tropical Race 4 Response | | | — | | | | 9,534 | | | | — | | | | — | | | | — | |
Food And Fibre Plan | | | — | | | | 2,500 | | | | 3,530 | | | | 2,050 | | | | — | |
| | | | | | | | | | | | | | | | | | | | |
Portfolio Total | | | — | | | | 42,221 | | | | 6,925 | | | | 4,445 | | | | 295 | |
| | | | | | | | | | | | | | | | | | | | |
| | | | | |
Department of Communities, Child Safety and Disability Services | | | | | | | | | | | | | | | | | | | | |
Extending Existing Drought Relief Arrangements | | | — | | | | 4,000 | | | | — | | | | — | | | | — | |
Alcohol Fuelled Violence Program | | | — | | | | 3,540 | | | | 3,540 | | | | 3,680 | | | | — | |
Parenting Support for Queensland Families | | | — | | | | 3,000 | | | | 3,600 | | | | — | | | | — | |
Queensland National Disability Insurance Scheme Launch Site | | | — | | | | 1,900 | | | | — | | | | — | | | | — | |
Multicultural Events and Projects | | | — | | | | 1,000 | | | | 1,000 | | | | 1,000 | | | | 1,000 | |
Multicultural Recognition Legislation and Multicultural Advisory Council | | | — | | | | 770 | | | | 770 | | | | 770 | | | | 770 | |
Financial Literacy and Resilience | | | — | | | | — | | | | — | | | | — | | | | — | |
Implementation of high priority recommendations of the Domestic and Family Violence Taskforce | |
| —
|
| | | — | | | | — | | | | — | | | | — | |
One Stop Shop for Seniors and Advisory Taskforce on Residential Transition for Ageing Queenslanders | |
| —
|
| | | — | | | | — | | | | — | | | | — | |
| | | | | | | | | | | | | | | | | | | | |
Portfolio Total | | | — | | | | 14,210 | | | | 8,910 | | | | 5,450 | | | | 1,770 | |
| | | | | | | | | | | | | | | | | | | | |
| | | | | |
Department of Education and Training | | | | | | | | | | | | | | | | | | | | |
State School Maintenance Program | | | — | | | | 70,000 | | | | 73,000 | | | | 76,000 | | | | 81,000 | |
Education Minor Works Fund | | | — | | | | 10,000 | | | | 10,000 | | | | 10,000 | | | | — | |
Skilling Queenslanders for Work | | | — | | | | 60,000 | | | | 60,000 | | | | 60,000 | | | | 60,000 | |
Non-State schools Capital Grants | | | — | | | | 41,200 | | | | 41,200 | | | | 41,200 | | | | — | |
Southbank Education and Training Precinct Public Private Partnership | | | — | | | | 22,700 | | | | — | | | | — | | | | — | |
Extra Teachers | | | — | | | | 16,250 | | | | 50,180 | | | | 85,950 | | | | 96,316 | |
Jobs Queensland | | | — | | | | 10,000 | | | | 10,000 | | | | 10,000 | | | | 10,000 | |
Queensland Children and Family Centres | | | — | | | | 7,000 | | | | 10,288 | | | | 10,583 | | | | 10,888 | |
Rescuing TAFE | | | — | | | | 6,630 | | | | 13,540 | | | | 13,830 | | | | 500 | |
Kindergarten Disability Support Funding | | | — | | | | 2,803 | | | | 3,303 | | | | 3,803 | | | | 4,303 | |
Letting Teachers Teach | | | — | | | | 2,000 | | | | 2,000 | | | | 2,000 | | | | — | |
Water Based Fire Protection Systems | | | — | | | | 2,000 | | | | — | | | | — | | | | — | |
6
Budget Measures 2015-16
| | | | | | | | | | | | | | | | | | | | |
Expense measures of the current Government | | 2014-15
$‘000 | | | 2015-16
$‘000 | | | 2016-17
$‘000 | | | 2017-18
$‘000 | | | 2018-19
$‘000 | |
| | | | | |
Supporting Students | | | — | | | | 1,000 | | | | 2,900 | | | | 5,000 | | | | 5,603 | |
A Flying Start | | | — | | | | (52,900 | ) | | | — | | | | — | | | | — | |
Great Teachers = Great Results Savings Measure | | | — | | | | (53,470 | ) | | | (60,150 | ) | | | (66,830 | ) | | | — | |
| | | | | | | | | | | | | | | | | | | | |
Portfolio Total | | | — | | | | 145,213 | | | | 216,261 | | | | 251,536 | | | | 268,610 | |
| | | | | | | | | | | | | | | | | | | | |
| | | | | |
Department of Energy and Water Supply | | | | | | | | | | | | | | | | | | | | |
Extending Existing Drought Relief Arrangements | | | — | | | | 2,500 | | | | — | | | | — | | | | — | |
Queensland Water Regional Alliances Program | | | — | | | | 500 | | | | 500 | | | | 500 | | | | — | |
| | | | | | | | | | | | | | | | | | | | |
Portfolio Total | | | — | | | | 3,000 | | | | 500 | | | | 500 | | | | — | |
| | | | | | | | | | | | | | | | | | | | |
| | | | | |
Department of Environment and Heritage Protection | | | | | | | | | | | | | | | | | | | | |
Saving the Great Barrier Reef | | | — | | | | 12,683 | | | | 21,830 | | | | 21,830 | | | | 21,830 | |
Climate Change Adaptation | | | — | | | | 5,000 | | | | 5,000 | | | | 5,000 | | | | — | |
NatureAssist Program | | | — | | | | 5,000 | | | | — | | | | — | | | | — | |
Underground Coal Gasification Investigations | | | 1,966 | | | | 2,145 | | | | — | | | | — | | | | — | |
Wildlife Management and Conservation | | | — | | | | 1,754 | | | | — | | | | — | | | | — | |
Expansion of Waterway Health Report Cards | | | — | | | | 1,500 | | | | 1,500 | | | | 1,500 | | | | 1,500 | |
Environmental Impact Assessments | | | — | | | | 1,400 | | | | — | | | | — | | | | — | |
Industry Driven Waste Strategy | | | — | | | | (200 | ) | | | (200 | ) | | | (200 | ) | | | — | |
| | | | | | | | | | | | | | | | | | | | |
Portfolio Total | | | 1,966 | | | | 29,282 | | | | 28,130 | | | | 28,130 | | | | 23,330 | |
| | | | | | | | | | | | | | | | | | | | |
| | | | | |
Department of Housing and Public Works | | | | | | | | | | | | | | | | | | | | |
National Partnership Agreement on Homelessness | | | — | | | | 28,710 | | | | 28,710 | | | | — | | | | — | |
Independent Advisory Service for Tenants | | | — | | | | 6,600 | | | | 6,600 | | | | 6,600 | | | | 6,600 | |
Cairns Convention Centre Roof Repairs | | | — | | | | — | | | | — | | | | — | | | | — | |
Cyclone Shelter Upgrades | | | — | | | | — | | | | — | | | | — | | | | — | |
Demonstration project to address service gaps in housing and health systems | | | — | | | | — | | | | — | | | | — | | | | — | |
Implementation of high priority recommendations of the Domestic and Family Violence Taskforce | | | — | | | | — | | | | — | | | | — | | | | — | |
| | | | | | | | | | | | | | | | | | | | |
Portfolio Total | | | — | | | | 35,310 | | | | 35,310 | | | | 6,600 | | | | 6,600 | |
| | | | | | | | | | | | | | | | | | | | |
| | | | | |
Department of Infrastructure, Local Government and Planning | | | | | | | | | | | | | | | | | | | | |
Establishment of the Community Resilience Fund | | | — | | | | 40,000 | | | | — | | | | — | | | | — | |
Better Planning for Queensland | | | 2,119 | | | | 29,231 | | | | 11,025 | | | | 8,849 | | | | 8,126 | |
Special Assistance Package - Iconic projects in Rockhampton and Livingstone shires | | | — | | | | 16,000 | | | | 24,000 | | | | — | | | | — | |
Establishment of Building Queensland | | | — | | | | 5,486 | | | | 4,973 | | | | — | | | | — | |
Queensland Reconstruction Authority Operations | | | — | | | | 5,000 | | | | 30,658 | | | | 31,280 | | | | 31,914 | |
Trade and Investment Queensland | | | — | | | | 1,927 | | | | 1,881 | | | | 1,915 | | | | 1,941 | |
Local Government Graffiti Removal Grants | | | — | | | | (2,000 | ) | | | — | | | | — | | | | — | |
| | | | | | | | | | | | | | | | | | | | |
Portfolio Total | | | 2,119 | | | | 95,644 | | | | 72,537 | | | | 42,044 | | | | 41,981 | |
| | | | | | | | | | | | | | | | | | | | |
| | | | | |
Department of Justice and Attorney-General | | | | | | | | | | | | | | | | | | | | |
Correctional Centre Capacity | | | — | | | | 28,804 | | | | 38,051 | | | | 38,818 | | | | 39,641 | |
Brisbane Youth Detention Centre Capacity | | | 5,000 | | | | 5,188 | | | | 5,289 | | | | 5,391 | | | | 5,495 | |
7
Budget Measures 2015-16
| | | | | | | | | | | | | | | | | | | | |
Expense measures of the current Government | | 2014-15
$‘000 | | | 2015-16
$‘000 | | | 2016-17
$‘000 | | | 2017-18
$‘000 | | | 2018-19
$‘000 | |
| | | | | |
Commission of Inquiry into Organised Crime | | | 2,000 | | | | 4,000 | | | | — | | | | — | | | | — | |
Reinstate Diversionary Processes | | | — | | | | 3,811 | | | | 10,020 | | | | 10,551 | | | | 7,878 | |
Alcohol Fuelled Violence Program | | | — | | | | 3,330 | | | | 3,095 | | | | 3,160 | | | | — | |
Prisoner Reintegration to Reduce Reoffending | | | — | | | | 2,200 | | | | 2,200 | | | | 3,700 | | | | 3,700 | |
Reinstate Sentencing Advisory Council | | | — | | | | 1,800 | | | | 1,820 | | | | 1,840 | | | | — | |
Increase Investment in Legal Aid Services | | | — | | | | 1,100 | | | | — | | | | — | | | | — | |
Queensland Civil and Administrative Tribunal - Justice of the Peace Trial | | | — | | | | 972 | | | | — | | | | — | | | | — | |
Crime and Corruption Commission - Administrative measures | | | — | | | | 721 | | | | 721 | | | | 721 | | | | 721 | |
Implementation of high priority recommendations of the Domestic and Family Violence Taskforce | | | — | | | | 500 | | | | 511 | | | | 522 | | | | 534 | |
Resourcing for the Confiscations Unit | | | — | | | | 416 | | | | 431 | | | | 222 | | | | — | |
Environmental Defenders Offices | | | — | | | | 200 | | | | 200 | | | | 200 | | | | 200 | |
Enhancement of Community Engagement | | | — | | | | 99 | | | | 97 | | | | 97 | | | | — | |
Safe Night Out Strategy | | | — | | | | (6,227 | ) | | | (6,049 | ) | | | (4,830 | ) | | | (3,800 | ) |
| | | | | | | | | | | | | | | | | | | | |
Portfolio Total | | | 7,000 | | | | 46,914 | | | | 56,386 | | | | 60,392 | | | | 54,369 | |
| | | | | | | | | | | | | | | | | | | | |
| | | | | |
Department of National Parks, Sport and Racing | | | | | | | | | | | | | | | | | | | | |
State Netball Centre | | | — | | | | 15,000 | | | | 15,000 | | | | — | | | | — | |
Queensland Parks and Forest Management | | | — | | | | 2,377 | | | | — | | | | — | | | | — | |
North Stradbroke Island - Joint Management | | | — | | | | 1,749 | | | | 3,396 | | | | 3,464 | | | | 3,533 | |
Cape York Peninsula Aboriginal Land National Parks | | | — | | | | 1,699 | | | | 2,008 | | | | 1,819 | | | | 1,910 | |
Indigenous Rangers | | | — | | | | 1,400 | | | | 1,928 | | | | 1,966 | | | | 2,006 | |
| | | | | | | | | | | | | | | | | | | | |
Portfolio Total | | | — | | | | 22,225 | | | | 22,332 | | | | 7,249 | | | | 7,449 | |
| | | | | | | | | | | | | | | | | | | | |
| | | | | |
Department of Natural Resources and Mines | | | | | | | | | | | | | | | | | | | | |
Great Artesian Basin Sustainability Initiative | | | — | | | | 8,000 | | | | 3,550 | | | | — | | | | — | |
Abandoned Mines Land Program | | | — | | | | 6,200 | | | | — | | | | — | | | | — | |
Coal Seam Gas Compliance Unit | | | — | | | | 3,577 | | | | — | | | | — | | | | — | |
Additional Native Title Trial Costs | | | 2,200 | | | | 2,200 | | | | 2,200 | | | | 2,200 | | | | 2,200 | |
North Stradbroke Island Indigenous Land Use Agreement | | | — | | | | 840 | | | | 840 | | | | — | | | | — | |
| | | | | | | | | | | | | | | | | | | | |
Portfolio Total | | | 2,200 | | | | 20,817 | | | | 6,590 | | | | 2,200 | | | | 2,200 | |
| | | | | | | | | | | | | | | | | | | | |
| | | | | |
Department of Science, Information Technology and Innovation | | | | | | | | | | | | | | | | | | | | |
Advance Queensland | | | — | | | | 37,062 | | | | 38,082 | | | | 38,112 | | | | 22,547 | |
Mobile Black Spot Program | | | — | | | | 5,000 | | | | 5,000 | | | | — | | | | — | |
| | | | | | | | | | | | | | | | | | | | |
Portfolio Total | | | — | | | | 42,062 | | | | 43,082 | | | | 38,112 | | | | 22,547 | |
| | | | | | | | | | | | | | | | | | | | |
| | | | | |
Department of State Development | | | | | | | | | | | | | | | | | | | | |
Building Our Regions | | | — | | | | 70,000 | | | | 70,000 | | | | — | | | | — | |
Townsville Stadium | | | — | | | | 5,000 | | | | — | | | | — | | | | — | |
North Stradbroke Island Economic Transition Strategy | | | — | | | | 500 | | | | 2,000 | | | | 7,500 | | | | 7,500 | |
Port Dredging - Cairns Shipping Development Project | | | (1,500 | ) | | | (21,000 | ) | | | (10,000 | ) | | | — | | | | — | |
Royalties for Regions - unallocated | | | — | | | | (24,100 | ) | | | — | | | | — | | | | — | |
| | | | | | | | | | | | | | | | | | | | |
Portfolio Total | | | (1,500 | ) | | | 30,400 | | | | 62,000 | | | | 7,500 | | | | 7,500 | |
| | | | | | | | | | | | | | | | | | | | |
8
Budget Measures 2015-16
| | | | | | | | | | | | | | | | | | | | |
Expense measures of the current Government | | 2014-15
$‘000 | | | 2015-16
$‘000 | | | 2016-17
$‘000 | | | 2017-18
$‘000 | | | 2018-19
$‘000 | |
| | | | | |
Department of the Premier and Cabinet | | | | | | | | | | | | | | | | | | | | |
Restoration of Arts Grant Funding | | | — | | | | 5,000 | | | | 5,000 | | | | 5,000 | | | | 5,000 | |
Queensland Commission of Inquiry - Barrett Adolescent Centre | | | — | | | | 4,500 | | | | — | | | | — | | | | — | |
Implementation of high priority recommendations of the Domestic and Family Violence Taskforce | | | — | | | | 3,000 | | | | — | | | | — | | | | — | |
Cultural Precinct Critical Infrastructure | | | — | | | | 2,000 | | | | 2,000 | | | | 2,000 | | | | 2,000 | |
Stronger Families Reforms | | | — | | | | 500 | | | | — | | | | — | | | | — | |
Alcohol Fuelled Violence | | | — | | | | 155 | | | | 155 | | | | 155 | | | | — | |
Community Services Directory | | | — | | | | 125 | | | | 250 | | | | 250 | | | | 250 | |
Counter Extremism Strategy | | | — | | | | — | | | | — | | | | — | | | | — | |
Safe Night Out Strategy | | | — | | | | (465 | ) | | | — | | | | — | | | | — | |
Reduction in the Number of Ministers | | | — | | | | (7,100 | ) | | | (7,100 | ) | | | (7,100 | ) | | | (7,100 | ) |
Public Sector Renewal Program | | | — | | | | (7,590 | ) | | | (4,550 | ) | | | (1,000 | ) | | | | |
| | | | | | | | | | | | | | | | | | | | |
Portfolio Total | | | — | | | | 125 | | | | (4,245 | ) | | | (695 | ) | | | 150 | |
| | | | | | | | | | | | | | | | | | | | |
| | | | | |
Department of Tourism, Major Events, Small Business and the Commonwealth Games | | | | | | | | | | | | | | | | | | | | |
Tourism and Events Queensland Restoration of Funding | | | — | | | | 24,567 | | | | 31,454 | | | | 37,614 | | | | 34,707 | |
Grow and Promote Events for Queensland | | | — | | | | 10,000 | | | | 10,000 | | | | 10,000 | | | | 10,000 | |
Business and Industry Portal | | | — | | | | 4,696 | | | | — | | | | — | | | | — | |
Attracting Aviation Boost | | | — | | | | 3,300 | | | | 3,300 | | | | 3,400 | | | | — | |
Queensland Entrepreneurs of Tomorrow Program | | | — | | | | 660 | | | | 660 | | | | 660 | | | | — | |
| | | | | | | | | | | | | | | | | | | | |
Portfolio Total | | | — | | | | 43,223 | | | | 45,414 | | | | 51,674 | | | | 44,707 | |
| | | | | | | | | | | | | | | | | | | | |
| | | | | |
Department of Transport and Main Roads | | | | | | | | | | | | | | | | | | | | |
Building our Regions | | | — | | | | 30,000 | | | | 30,000 | | | | — | | | | — | |
Road Safety - Enhancements (CDOP) | | | — | | | | 6,457 | | | | 15,909 | | | | 16,835 | | | | 15,304 | |
Local Fare Scheme For Cape York and Torres Strait Air Services | | | — | | | | 5,600 | | | | — | | | | — | | | | — | |
Continuation of Public Transport Concessions For Interstate Seniors Card Holders | | | — | | | | 3,809 | | | | 3,818 | | | | 3,828 | | | | 3,837 | |
Extension of the Marine Infrastructure Fund | | | — | | | | 2,000 | | | | — | | | | — | | | | — | |
Gold Coast Waterways Authority | | | — | | | | 727 | | | | — | | | | — | | | | — | |
| | | | | | | | | | | | | | | | | | | | |
Portfolio Total | | | — | | | | 48,593 | | | | 49,727 | | | | 20,663 | | | | 19,141 | |
| | | | | | | | | | | | | | | | | | | | |
| | | | | |
Electoral Commission of Queensland | | | | | | | | | | | | | | | | | | | | |
SEMS Replacement Project | | | — | | | | 900 | | | | 900 | | | | 900 | | | | — | |
| | | | | | | | | | | | | | | | | | | | |
Portfolio Total | | | — | | | | 900 | | | | 900 | | | | 900 | | | | — | |
| | | | | | | | | | | | | | | | | | | | |
| | | | | |
Legislative Assembly of Queensland | | | | | | | | | | | | | | | | | | | | |
Salaries for Office Holders of 55th Parliament | | | 253 | | | | 786 | | | | 786 | | | | 786 | | | | 786 | |
Resourcing for independent and minor party Members | | | 115 | | | | 612 | | | | 612 | | | | 612 | | | | 612 | |
Resourcing for an additional portfolio committee | | | — | | | | 120 | | | | 120 | | | | 120 | | | | 120 | |
Electorate office staff training program | | | — | | | | 75 | | | | 75 | | | | 75 | | | | 75 | |
Electorate Officer severance payments | | | 1,404 | | | | — | | | | — | | | | — | | | | — | |
Electorate office leasing costs | | | 342 | | | | — | | | | — | | | | — | | | | — | |
Electorate office transition costs | | | 180 | | | | — | | | | — | | | | — | | | | — | |
9
Budget Measures 2015-16
| | | | | | | | | | | | | | | | | | | | |
Expense measures of the current Government | | 2014-15
$‘000 | | | 2015-16
$‘000 | | | 2016-17
$‘000 | | | 2017-18
$‘000 | | | 2018-19
$‘000 | |
| | | | | |
Members’ Transition Allowance | | | 1,483 | | | | — | | | | — | | | | — | | | | — | |
Savings from reduction in the number of Ministers and Assistant Ministers | | | (701 | ) | | | (1,909 | ) | | | (1,909 | ) | | | (1,909 | ) | | | (1,909 | ) |
| | | | | | | | | | | | | | | | | | | | |
Portfolio Total | | | 3,076 | | | | (316 | ) | | | (316 | ) | | | (316 | ) | | | (316 | ) |
| | | | | | | | | | | | | | | | | | | | |
| | | | | |
Public Safety Business Agency | | | | | | | | | | | | | | | | | | | | |
Body Worn Video Cameras for Police | | | — | | | | 4,000 | | | | 1,000 | | | | 1,030 | | | | — | |
Blue Card Efficiency Savings | | | (1,316 | ) | | | 2,500 | | | | — | | | | — | | | | — | |
Independent Body to Publish Crime Statistics | | | — | | | | — | | | | — | | | | — | | | | — | |
Regional College of Disaster Management Program | | | (1,100 | ) | | | — | | | | (3,750 | ) | | | — | | | | — | |
| | | | | | | | | | | | | | | | | | | | |
Portfolio Total | | | (2,416 | ) | | | 6,500 | | | | (2,750 | ) | | | 1,030 | | | | — | |
| | | | | | | | | | | | | | | | | | | | |
| | | | | |
Public Service Commission | | | | | | | | | | | | | | | | | | | | |
First Project | | | — | | | | 4,240 | | | | — | | | | — | | | | — | |
Public Sector Initiatives Savings | | | — | | | | (1,500 | ) | | | (1,500 | ) | | | (1,500 | ) | | | (1,500 | ) |
| | | | | | | | | | | | | | | | | | | | |
Portfolio Total | | | — | | | | 2,740 | | | | (1,500 | ) | | | (1,500 | ) | | | (1,500 | ) |
| | | | | | | | | | | | | | | | | | | | |
| | | | | |
Queensland Health | | | | | | | | | | | | | | | | | | | | |
New Growth Funding | | | — | | | | 202,060 | | | | 426,919 | | | | 719,279 | | | | 954,173 | |
Outpatient Long Wait Reduction Strategy | | | — | | | | 71,330 | | | | 114,210 | | | | 126,530 | | | | 49,170 | |
Sunshine Coast Public University Hospital Transition Program | | | — | | | | 47,150 | | | | 106,410 | | | | 36,160 | | | | 3,800 | |
Refresh Nursing: Graduate Program | | | — | | | | 26,611 | | | | 27,303 | | | | 28,013 | | | | 28,741 | |
Nursing Guarantee: 400 Additional Nurses | | | — | | | | 9,339 | | | | 28,946 | | | | 46,830 | | | | 16,480 | |
Herston Quarter Redevelopment Project | | | — | | | | 5,700 | | | | — | | | | — | | | | — | |
Action for a Healthier Queensland: Biala Sexual Health Clinic | | | — | | | | 3,369 | | | | 3,138 | | | | 3,317 | | | | 3,417 | |
Rebuilding Intensive Mental Health Care for Young People: Townsville | | | — | | | | 2,772 | | | | 2,883 | | | | 2,998 | | | | 3,120 | |
Action for a Healthier Queensland: School Aged Nursing Service | | | — | | | | 2,695 | | | | 2,811 | | | | 2,872 | | | | 3,035 | |
Social Respite Centres | | | — | | | | 2,250 | | | | 5,890 | | | | 5,970 | | | | 5,890 | |
Health for Life! - Taking Action on Diabetes | | | — | | | | 2,000 | | | | 7,000 | | | | 9,000 | | | | 9,240 | |
Extending Existing Drought Relief Arrangements | | | — | | | | 1,500 | | | | — | | | | — | | | | — | |
Action for a Healthier Queensland: Go for 2 and 5 Fruit and Vegetable Program | | | — | | | | 1,250 | | | | 1,250 | | | | 1,250 | | | | 1,355 | |
Action for a Healthier Queensland: Sexual Health Strategy | | | — | | | | 906 | | | | 1,164 | | | | 1,415 | | | | 1,789 | |
Health Consumers Queensland Service Agreement | | | — | | | | 800 | | | | 830 | | | | 830 | | | | — | |
Action for a Healthier Queensland: Queensland Health Promotion Commission | | | — | | | | 600 | | | | 2,000 | | | | 2,300 | | | | 2,590 | |
Action for a Healthier Queensland: Extend Smoking Bans | | | — | | | | 420 | | | | — | | | | — | | | | — | |
Action for a Healthier Queensland: Fast Food Kilojoule Menu Labelling | | | — | | | | 400 | | | | 125 | | | | — | | | | — | |
Action for a Healthier Queensland: Cardiac Rehabilitation and Prevention | | | — | | | | 350 | | | | 275 | | | | 303 | | | | 333 | |
Action for a Healthier Queensland: Walking Groups | | | — | | | | 278 | | | | 278 | | | | 278 | | | | 278 | |
Security Guards for Townsville Hospital and Health Service | | | — | | | | 130 | | | | 140 | | | | 140 | | | | — | |
Action for a Healthier Queensland: 10,000 Steps Program | | | — | | | | — | | | | 280 | | | | — | | | | — | |
Alcohol Fuelled Violence Program | | | — | | | | — | | | | — | | | | — | | | | — | |
Demonstration Project to Address Service Gaps in Housing and Health Systems | | | — | | | | — | | | | — | | | | — | | | | — | |
Nambour Hospital Repurposing: Design and Planning | | | — | | | | — | | | | — | | | | — | | | | — | |
Protecting Queensland Kids - Vaccination Legislation | | | — | | | | — | | | | — | | | | — | | | | — | |
Rebuilding Mental Health Care for Young People: Barrett Adolescent Centre | | | — | | | | — | | | | — | | | | — | | | | — | |
10
Budget Measures 2015-16
| | | | | | | | | | | | | | | | | | | | |
Expense measures of the current Government | | 2014-15
$‘000 | | | 2015-16
$‘000 | | | 2016-17
$‘000 | | | 2017-18
$‘000 | | | 2018-19
$‘000 | |
| | | | | |
Recashflow 2014-15 Operating Surplus | | | (320,000 | ) | | | — | | | | — | | | | — | | | | — | |
Sunshine Coast Public University Hospital ICT works | | | — | | | | — | | | | — | | | | — | | | | — | |
| | | | | | | | | | | | | | | | | | | | |
Portfolio Total | | | (320,000 | ) | | | 381,910 | | | | 731,852 | | | | 987,485 | | | | 1,083,411 | |
| | | | | | | | | | | | | | | | | | | | |
| | | | | |
Queensland Police Service | | | | | | | | | | | | | | | | | | | | |
Target Organised Crime, Alcohol Fuelled Violence and the Drug, Ice | | | — | | | | 5,000 | | | | 5,000 | | | | 5,000 | | | | 5,000 | |
Road Safety - Enhancements (CDOP) | | | — | | | | 3,695 | | | | 3,530 | | | | 4,223 | | | | 4,855 | |
Community Liaison Officers | | | — | | | | 200 | | | | — | | | | — | | | | — | |
Create Community Policing Boards | | | — | | | | 135 | | | | 139 | | | | 142 | | | | — | |
Mobile Services | | | — | | | | — | | | | — | | | | — | | | | — | |
e-Rostering | | | — | | | | — | | | | — | | | | — | | | | — | |
Safe Night Out Strategy | | | — | | | | (1,071 | ) | | | (1,071 | ) | | | (1,071 | ) | | | (1,071 | ) |
| | | | | | | | | | | | | | | | | | | | |
Portfolio Total | | | — | | | | 7,959 | | | | 7,598 | | | | 8,294 | | | | 8,784 | |
| | | | | | | | | | | | | | | | | | | | |
| | | | | |
Queensland Treasury | | | | | | | | | | | | | | | | | | | | |
Establishment of Social Benefit Bond Pilots | | | — | | | | 2,000 | | | | 1,000 | | | | — | | | | — | |
Road Safety - Enhancements (CDOP) | | | — | | | | 1,019 | | | | 1,019 | | | | 1,019 | | | | 1,019 | |
Establishment of the Industrial Relations Legislative Reform Unit | | | — | | | | 642 | | | | — | | | | — | | | | — | |
Establishment of the Queensland Productivity Commission | | | — | | | | 300 | | | | 2,500 | | | | 2,500 | | | | 2,500 | |
Asset Transactions - Preparation and Due Diligence | | | 43,601 | | | | — | | | | — | | | | — | | | | — | |
Safe Night Out Strategy | | | — | | | | (89 | ) | | | (89 | ) | | | (161 | ) | | | — | |
Transition of the Office of Best Practice Regulation | | | — | | | | (3,200 | ) | | | (3,200 | ) | | | (3,200 | ) | | | (3,200 | ) |
| | | | | | | | | | | | | | | | | | | | |
Portfolio Total | | | 43,601 | | | | 672 | | | | 1,230 | | | | 158 | | | | 319 | |
| | | | | | | | | | | | | | | | | | | | |
| | | | | |
Total impact on Expense of the current Government | | | (263,954 | ) | | | 822,666 | | | | 1,094,459 | | | | 1,220,248 | | | | 1,306,957 | |
11
Budget Measures 2015-16
| | | | | | | | | | | | | | | | | | | | |
Expense measures of the former Government | | 2014-15
$‘000 | | | 2015-16
$‘000 | | | 2016-17
$‘000 | | | 2017-18
$‘000 | | | 2018-19
$‘000 | |
| | | | | |
Whole-of-Government Measures | | | | | | | | | | | | | | | | | | | | |
Concessions for Pensioners and Seniors Card Holders1 | | | 54,153 | | | | 52,207 | | | | 54,303 | | | | 54,871 | | | | 56,243 | |
Carbon Tax Repeal Savings | | | (17,487 | ) | | | (34,969 | ) | | | (34,969 | ) | | | (34,969 | ) | | | (34,954 | ) |
| | | | | | | | | | | | | | | | | | | | |
Portfolio Total | | | 36,666 | | | | 17,238 | | | | 19,334 | | | | 19,902 | | | | 21,289 | |
| | | | | | | | | | | | | | | | | | | | |
| | | | | |
Department of Agriculture and Fisheries | | | | | | | | | | | | | | | | | | | | |
Queensland Agricultural Training Colleges | | | 2,500 | | | | 1,700 | | | | 900 | | | | — | | | | — | |
Queensland Biosecurity Responses and Obligations | | | 3,752 | | | | 1,012 | | | | 1,000 | | | | — | | | | — | |
Drought Relief Assistance Scheme | | | 18,500 | | | | — | | | | — | | | | — | | | | — | |
| | | | | | | | | | | | | | | | | | | | |
Portfolio Total | | | 24,752 | | | | 2,712 | | | | 1,900 | | | | — | | | | — | |
| | | | | | | | | | | | | | | | | | | | |
| | | | | |
Department of Education and Training | | | | | | | | | | | | | | | | | | | | |
Great Results Guarantee | | | 90,117 | | | | 93,143 | | | | — | | | | — | | | | — | |
Living Away From Home Allowance Scheme | | | 380 | | | | 380 | | | | 380 | | | | 380 | | | | 380 | |
| | | | | | | | | | | | | | | | | | | | |
Portfolio Total | | | 90,497 | | | | 93,523 | | | | 380 | | | | 380 | | | | 380 | |
| | | | | | | | | | | | | | | | | | | | |
| | | | | |
Department of Energy and Water Supply | | | | | | | | | | | | | | | | | | | | |
Community Service Obligation - Cloncurry | | | — | | | | 5,500 | | | | — | | | | — | | | | — | |
Local Management Arrangements Stage 3 | | | 648 | | | | 1,732 | | | | — | | | | — | | | | — | |
Consumer Education Campaign - Market Monitoring | | | 3,310 | | | | — | | | | — | | | | — | | | | — | |
Drought Relief from Electricty Charges Scheme | | | 150 | | | | — | | | | — | | | | — | | | | — | |
| | | | | | | | | | | | | | | | | | | | |
Portfolio Total | | | 4,108 | | | | 7,232 | | | | — | | | | — | | | | — | |
| | | | | | | | | | | | | | | | | | | | |
| | | | | |
Department of Environment and Heritage Protection | | | | | | | | | | | | | | | | | | | | |
Compliance Review Program | | | 500 | | | | — | | | | — | | | | — | | | | — | |
Legal and Related Costs | | | 2,487 | | | | — | | | | — | | | | — | | | | — | |
Reef Facts Campaign | | | 2,200 | | | | — | | | | — | | | | — | | | | — | |
| | | | | | | | | | | | | | | | | | | | |
Portfolio Total | | | 5,187 | | | | — | | | | — | | | | — | | | | — | |
| | | | | | | | | | | | | | | | | | | | |
| | | | | |
Department of Infrastructure, Local Government and Planning | | | | | | | | | | | | | | | | | | | | |
Queensland Reconstruction Authority | | | — | | | | 25,000 | | | | — | | | | — | | | | — | |
Community Recovery and Resilience Initiatives | | | — | | | | 1,700 | | | | — | | | | — | | | | — | |
| | | | | | | | | | | | | | | | | | | | |
Portfolio Total | | | — | | | | 26,700 | | | | — | | | | — | | | | — | |
| | | | | | | | | | | | | | | | | | | | |
| | | | | |
Department of National Parks, Sport and Racing | | | | | | | | | | | | | | | | | | | | |
Queensland Parks and Forest Management 2014-15 | | | 1,544 | | | | — | | | | — | | | | — | | | | — | |
| | | | | | | | | | | | | | | | | | | | |
Portfolio Total | �� | | 1,544 | | | | — | | | | — | | | | — | | | | — | |
| | | | | | | | | | | | | | | | | | | | |
| | | | | |
Department of Natural Resources and Mines | | | | | | | | | | | | | | | | | | | | |
Improved Management of Flood Early Warning Systems | | | 950 | | | | 894 | | | | — | | | | — | | | | — | |
Native Title Trial Costs | | | 1,800 | | | | — | | | | — | | | | — | | | | — | |
| | | | | | | | | | | | | | | | | | | | |
Portfolio Total | | | 2,750 | | | | 894 | | | | — | | | | — | | | | — | |
| | | | | | | | | | | | | | | | | | | | |
| | | | | |
Department of Science, Information Technology and Innovation | | | | | | | | | | | | | | | | | | | | |
One-Stop Shop - Phase 2 | | | 11,703 | | | | 5,100 | | | | — | | | | — | | | | — | |
12
Budget Measures 2015-16
| | | | | | | | | | | | | | | | | | | | |
Expense measures of the former Government | | 2014-15
$‘000 | | | 2015-16
$‘000 | | | 2016-17
$‘000 | | | 2017-18
$‘000 | | | 2018-19
$‘000 | |
| | | | | |
Best Start: Family Literacy Initiative 2015-20182 | | | 5,000 | | | | 5,000 | | | | 5,000 | | | | 5,000 | | | | — | |
Whole of Government Digital Archiving Solution | | | — | | | | 2,500 | | | | — | | | | — | | | | — | |
| | | | | | | | | | | | | | | | | | | | |
Portfolio Total | | | 16,703 | | | | 12,600 | | | | 5,000 | | | | 5,000 | | | | — | |
| | | | | | | | | | | | | | | | | | | | |
| | | | | |
Department of the Premier and Cabinet | | | | | | | | | | | | | | | | | | | | |
Reimbursement of Legal Expenditure | | | 2,565 | | | | — | | | | — | | | | — | | | | — | |
| | | | | | | | | | | | | | | | | | | | |
Portfolio Total | | | 2,565 | | | | — | | | | — | | | | — | | | | — | |
| | | | | | | | | | | | | | | | | | | | |
| | | | | |
Department of Transport and Main Roads | | | | | | | | | | | | | | | | | | | | |
Road Safety | | | 1,936 | | | | 2,775 | | | | 612 | | | | 784 | | | | 1,331 | |
Cheaper Public Transport Fares | | | — | | | | — | | | | — | | | | — | | | | — | |
| | | | | | | | | | | | | | | | | | | | |
Portfolio Total | | | 1,936 | | | | 2,775 | | | | 612 | | | | 784 | | | | 1,331 | |
| | | | | | | | | | | | | | | | | | | | |
| | | | | |
Queensland Police Service | | | | | | | | | | | | | | | | | | | | |
Referral Management | | | 1,535 | | | | 1,023 | | | | 992 | | | | 1,027 | | | | 1,027 | |
Additional Security - response to the heightened threat level | | | 1,500 | | | | — | | | | — | | | | — | | | | — | |
| | | | | | | | | | | | | | | | | | | | |
Portfolio Total | | | 3,035 | | | | 1,023 | | | | 992 | | | | 1,027 | | | | 1,027 | |
| | | | | | | | | | | | | | | | | | | | |
| | | | | |
Total impact on Expense of the former Government | | | 189,743 | | | | 164,697 | | | | 28,218 | | | | 27,093 | | | | 24,027 | |
| | | | | |
Total impact on Expense since the 2014-15 Budget | | | (74,211 | ) | | | 987,363 | | | | 1,122,677 | | | | 1,247,341 | | | | 1,330,984 | |
| | | | | |
Less Australian Government funding | | | 90,117 | | | | 125,853 | | | | 30,460 | | | | — | | | | — | |
| | | | | |
Net of Measures funded by Australian Government | | | (164,328 | ) | | | 861,510 | | | | 1,092,217 | | | | 1,247,341 | | | | 1,330,984 | |
| 1. | Public transport concessions for interstate Seniors Card Holders from 2015-16 provided by the Department of Transport and Main Roads is under the expense measures of the current Government. These concessions were previously a component of the National Partnership Agreement on Certain Concessions for Pensioner Concession Card and Seniors Card Holders which was terminated by the Australian Government. |
| 2. | Now referred to as First Five Forever. |
13
Budget Measures 2015-16
| Table 1.4: | Capital measures since the 2014-15 Budget |
| | | | | | | | | | | | | | | | | | | | |
Capital measures of the current Government | | 2014-15
$‘000 | | | 2015-16
$‘000 | | | 2016-17
$‘000 | | | 2017-18
$‘000 | | | 2018-19
$‘000 | |
| | | | | |
Department of Communities, Child Safety and Disability Services | | | | | | | | | | | | | | | | | | | | |
Implementation of high priority recommendations of the Domestic and Family Violence Taskforce Crisis Shelters | | | — | | | | — | | | | — | | | | — | | | | — | |
| | | | | | | | | | | | | | | | | | | | |
Portfolio Total | | | — | | | | — | | | | — | | | | — | | | | — | |
| | | | | | | | | | | | | | | | | | | | |
| | | | | |
Department of Education and Training | | | | | | | | | | | | | | | | | | | | |
State School Capital Works Program | | | — | | | | 159,700 | | | | — | | | | — | | | | — | |
State-wide Schools and Hospitals Fund - New Schools | | | — | | | | 10,000 | | | | 25,000 | | | | 20,000 | | | | 35,000 | |
Cairns Special School | | | — | | | | 3,000 | | | | 12,000 | | | | — | | | | — | |
A Flying Start | | | — | | | | (45,700 | ) | | | — | | | | — | | | | — | |
Operational cash surplus | | | — | | | | (114,000 | ) | | | — | | | | — | | | | — | |
| | | | | | | | | | | | | | | | | | | | |
Portfolio Total | | | — | | | | 13,000 | | | | 37,000 | | | | 20,000 | | | | 35,000 | |
| | | | | | | | | | | | | | | | | | | | |
| | | | | |
Department of Housing and Public Works | | | | | | | | | | | | | | | | | | | | |
Cairns Convention Centre Roof Repairs | | | — | | | | — | | | | — | | | | — | | | | — | |
Old Museum Repair Works | | | — | | | | — | | | | — | | | | — | | | | — | |
| | | | | | | | | | | | | | | | | | | | |
Portfolio Total | | | — | | | | — | | | | — | | | | — | | | | — | |
| | | | | | | | | | | | | | | | | | | | |
| | | | | |
Department of Infrastructure, Local Government and Planning | | | | | | | | | | | | | | | | | | | | |
Catalyst Infrastructure Program | | | — | | | | 20,000 | | | | 20,000 | | | | 19,350 | | | | — | |
Priority Development Infrastructure Co-Investment Program - Reprioritisation | | | (59,350 | ) | | | — | | | | — | | | | — | | | | — | |
| | | | | | | | | | | | | | | | | | | | |
Portfolio Total | | | (59,350 | ) | | | 20,000 | | | | 20,000 | | | | 19,350 | | | | — | |
| | | | | | | | | | | | | | | | | | | | |
| | | | | |
Department of National Parks, Sport and Racing | | | | | | | | | | | | | | | | | | | | |
Queensland Parks and Forest Management | | | — | | | | 2,599 | | | | — | | | | — | | | | — | |
North Stradbroke Island - Joint Management | | | — | | | | 275 | | | | — | | | | — | | | | — | |
| | | | | | | | | | | | | | | | | | | | |
Portfolio Total | | | — | | | | 2,874 | | | | — | | | | — | | | | — | |
| | | | | | | | | | | | | | | | | | | | |
| | | | | |
Department of State Development | | | | | | | | | | | | | | | | | | | | |
Townsville Stadium | | | — | | | | — | | | | 25,000 | | | | 35,000 | | | | 35,000 | |
| | | | | | | | | | | | | | | | | | | | |
Portfolio Total | | | — | | | | — | | | | 25,000 | | | | 35,000 | | | | 35,000 | |
| | | | | | | | | | | | | | | | | | | | |
| | | | | |
Department of the Premier and Cabinet | | | | | | | | | | | | | | | | | | | | |
Cultural Precinct Critical Infrastructure | | | — | | | | 6,717 | | | | 6,467 | | | | 5,256 | | | | 1,560 | |
| | | | | | | | | | | | | | | | | | | | |
Portfolio Total | | | — | | | | 6,717 | | | | 6,467 | | | | 5,256 | | | | 1,560 | |
| | | | | | | | | | | | | | | | | | | | |
| | | | | |
Department of Transport and Main Roads | | | | | | | | | | | | | | | | | | | | |
Road Safety - Enhancements (CDOP) | | | — | | | | 55,708 | | | | 68,496 | | | | 54,088 | | | | 51,500 | |
Regional Transport Boost | | | — | | | | 5,000 | | | | 19,100 | | | | — | | | | — | |
Extension of the Marine Infrastructure Fund | | | — | | | | — | | | | 14,000 | | | | 14,000 | | | | — | |
Western Roads Upgrade Program | | | — | | | | — | | | | — | | | | — | | | | — | |
| | | | | | | | | | | | | | | | | | | | |
Portfolio Total | | | — | | | | 60,708 | | | | 101,596 | | | | 68,088 | | | | 51,500 | |
| | | | | | | | | | | | | | | | | | | | |
14
Budget Measures 2015-16
| | | | | | | | | | | | | | | | | | | | |
Capital measures of the current Government | | 2014-15
$‘000 | | | 2015-16
$‘000 | | | 2016-17
$‘000 | | | 2017-18
$‘000 | | | 2018-19
$‘000 | |
| | | | | |
Electoral Commission of Queensland | | | | | | | | | | | | | | | | | | | | |
SEMS Replacement Project | | | — | | | | 1,359 | | | | 4,947 | | | | — | | | | — | |
| | | | | | | | | | | | | | | | | | | | |
Portfolio Total | | | — | | | | 1,359 | | | | 4,947 | | | | — | | | | — | |
| | | | | | | | | | | | | | | | | | | | |
| | | | | |
Legislative Assembly of Queensland | | | | | | | | | | | | | | | | | | | | |
Rectification works for the Parliamentary Annexe | | | — | | | | 3,000 | | | | — | | | | — | | | | — | |
Parliament House fire protection system | | | — | | | | 2,227 | | | | 3,097 | | | | 297 | | | | — | |
| | | | | | | | | | | | | | | | | | | | |
Portfolio Total | | | — | | | | 5,227 | | | | 3,097 | | | | 297 | | | | — | |
| | | | | | | | | | | | | | | | | | | | |
| | | | | |
Queensland Health | | | | | | | | | | | | | | | | | | | | |
State-wide Schools and Hospitals Fund - Enhancing Regional Hospitals Program | | | — | | | | 20,600 | | | | 113,400 | | | | 35,000 | | | | 11,000 | |
| | | | | | | | | | | | | | | | | | | | |
Portfolio Total | | | — | | | | 20,600 | | | | 113,400 | | | | 35,000 | | | | 11,000 | |
| | | | | | | | | | | | | | | | | | | | |
| | | | | |
Queensland Police Service | | | | | | | | | | | | | | | | | | | | |
Road Safety - Enhancements (CDOP) | | | — | | | | 4,350 | | | | 2,850 | | | | — | | | | — | |
| | | | | | | | | | | | | | | | | | | | |
Portfolio Total | | | — | | | | 4,350 | | | | 2,850 | | | | — | | | | — | |
| | | | | | | | | | | | | | | | | | | | |
| | | | | |
Queensland Treasury | | | | | | | | | | | | | | | | | | | | |
Establishment of the Business Development Fund | | | — | | | | 10,000 | | | | 10,000 | | | | 10,000 | | | | 10,000 | |
| | | | | | | | | | | | | | | | | | | | |
Portfolio Total | | | — | | | | 10,000 | | | | 10,000 | | | | 10,000 | | | | 10,000 | |
| | | | | | | | | | | | | | | | | | | | |
| | | | | |
Total impact on Capital of the current Government | | | (59,350 | ) | | | 144,835 | | | | 324,357 | | | | 192,991 | | | | 144,060 | |
15
Budget Measures 2015-16
| | | | | | | | | | | | | | | | | | | | |
Capital measures of the current Government | | 2014-15
$‘000 | | | 2015-16
$‘000 | | | 2016-17
$‘000 | | | 2017-18
$‘000 | | | 2018-19
$‘000 | |
| | | | | |
Department of Housing and Public Works | | | | | | | | | | | | | | | | | | | | |
Thursday Island Queensland Health Staff Accommodation | | | 833 | | | | 11,912 | | | | — | | | | — | | | | — | |
| | | | | | | | | | | | | | | | | | | | |
Portfolio Total | | | 833 | | | | 11,912 | | | | — | | | | — | | | | — | |
| | | | | | | | | | | | | | | | | | | | |
| | | | | |
Department of Infrastructure, Local Government and Planning | | | | | | | | | | | | | | | | | | | | |
Priority Development Infrastructure Co-Investment Program | | | 100,000 | | | | — | | | | — | | | | — | | | | — | |
| | | | | | | | | | | | | | | | | | | | |
Portfolio Total | | | 100,000 | | | | — | | | | — | | | | — | | | | — | |
| | | | | | | | | | | | | | | | | | | | |
| | | | | |
Department of National Parks, Sport and Racing | | | | | | | | | | | | | | | | | | | | |
Queensland Parks and Forest Management 2014-15 | | | 1,192 | | | | — | | | | — | | | | — | | | | — | |
| | | | | | | | | | | | | | | | | | | | |
Portfolio Total | | | 1,192 | | | | — | | | | — | | | | — | | | | — | |
| | | | | | | | | | | | | | | | | | | | |
| | | | | |
Department of Science, Information Technology and Innovation | | | | | | | | | | | | | | | | | | | | |
One-Stop Shop - Phase 2 | | | 2,197 | | | | — | | | | — | | | | — | | | | — | |
| | | | | | | | | | | | | | | | | | | | |
Portfolio Total | | | 2,197 | | | | — | | | | — | | | | — | | | | — | |
| | | | | | | | | | | | | | | | | | | | |
| | | | | |
Department of Transport and Main Roads | | | | | | | | | | | | | | | | | | | | |
Road Safety | | | 664 | | | | 2,850 | | | | — | | | | — | | | | — | |
Toowoomba Range Capacity and Clearance Upgrades | | | — | | | | — | | | | — | | | | — | | | | — | |
| | | | | | | | | | | | | | | | | | | | |
Portfolio Total | | | 664 | | | | 2,850 | | | | — | | | | — | | | | — | |
| | | | | | | | | | | | | | | | | | | | |
| | | | | |
Queensland Police Service | | | | | | | | | | | | | | | | | | | | |
Referral Management | | | 187 | | | | — | | | | — | | | | — | | | | — | |
| | | | | | | | | | | | | | | | | | | | |
Portfolio Total | | | 187 | | | | — | | | | — | | | | — | | | | — | |
| | | | | | | | | | | | | | | | | | | | |
| | | | | |
Total impact on Capital of the former Government | | | 105,073 | | | | 14,762 | | | | — | | | | — | | | | — | |
| | | | | |
Total impact on Capital since the 2014-15 Budget | | | 45,723 | | | | 159,597 | | | | 324,357 | | | | 192,991 | | | | 144,060 | |
| | | | | |
Less Australian Government funding | | | 833 | | | | 11,912 | | | | — | | | | — | | | | — | |
| | | | | |
Net of Measures funded by Australian Government | | | 44,890 | | | | 147,685 | | | | 324,357 | | | | 192,991 | | | | 144,060 | |
16
Budget Measures 2015-16
| Table 1.5: | Revenue measures since the 2014-15 Budget |
| | | | | | | | | | | | | | | | | | | | |
Revenue measures of the current Government | | 2014-15
$‘000 | | | 2015-16
$‘000 | | | 2016-17
$‘000 | | | 2017-18
$‘000 | | | 2018-19
$‘000 | |
| | | | | |
Department of Natural Resources and Mines | | | | | | | | | | | | | | | | | | | | |
Explosives Reserve Fees | | | — | | | | 756 | | | | 782 | | | | 810 | | | | 838 | |
Titles Registry - Survey Plan Copyright Fees | | | — | | | | 300 | | | | 310 | | | | 321 | | | | 333 | |
Land Rent Capping | | | — | | | | (362 | ) | | | — | | | | — | | | | — | |
Titles Registry Fee Rationalisation | | | — | | | | (696 | ) | | | (696 | ) | | | (696 | ) | | | (696 | ) |
Extending Existing Drought Relief Arrangements | | | — | | | | (4,113 | ) | | | — | | | | — | | | | — | |
| | | | | | | | | | | | | | | | | | | | |
Portfolio Total | | | — | | | | (4,115 | ) | | | 396 | | | | 435 | | | | 475 | |
| | | | | | | | | | | | | | | | | | | | |
| | | | | |
Queensland Treasury | | | | | | | | | | | | | | | | | | | | |
Deferral of the Increase in Payroll Tax Threshold | | | — | | | | 40,000 | | | | 80,000 | | | | 120,000 | | | | 160,000 | |
Rebate of Payroll Tax for Apprentices and Trainees | | | — | | | | (15,000 | ) | | | (15,000 | ) | | | (15,000 | ) | | | — | |
| | | | | | | | | | | | | | �� | | | | | | |
Portfolio Total | | | — | | | | 25,000 | | | | 65,000 | | | | 105,000 | | | | 160,000 | |
| | | | | | | | | | | | | | | | | | | | |
| | | | | |
Total impact on Revenue of the current Government | | | — | | | | 20,885 | | | | 65,396 | | | | 105,435 | | | | 160,475 | |
17
Budget Measures 2015-16
| | | | | | | | | | | | | | | | | | | | |
Revenue measures of the current Government | | 2014-15
$‘000 | | | 2015-16
$‘000 | | | 2016-17
$‘000 | | | 2017-18
$‘000 | | | 2018-19
$‘000 | |
| | | | | |
Department of Science, Information Technology and Innovation | | | | | | | | | | | | | | | | | | | | |
Early repayment of science infrastructure loans (10% discount) | | | (4,098 | ) | | | — | | | | — | | | | — | | | | — | |
| | | | | | | | | | | | | | | | | | | | |
Portfolio Total | | | (4,098 | ) | | | — | | | | — | | | | — | | | | — | |
| | | | | | | | | | | | | | | | | | | | |
| | | | | |
Total impact on Revenue of the former Government | | | (4,098 | ) | | | — | | | | — | | | | — | | | | — | |
| | | | | |
Total impact on Revenue since the 2014-15 Budget | | | (4,098 | ) | | | 20,885 | | | | 65,396 | | | | 105,435 | | | | 160,475 | |
18
Budget Measures 2015-16
Introduction
The following tables present the relevant portfolio expense measures relating to decisions taken since the 2014-15 Budget. This does not represent the full amount of additional funding provided to agencies since the 2014-15 Budget. For further explanation, refer to the Introduction and the Explanation of Scope and Terms in Chapter 1.
19
Budget Measures 2015-16
Whole-of-Government
| | | | | | | | | | | | | | | | | | | | |
| | | 2014-15
$‘000 | | | 2015-16
$‘000 | | | 2016-17
$‘000 | | | 2017-18
$‘000 | | | 2018-19
$‘000 | |
Whole-of-Government reprioritisation | | | — | | | | (205,089 | ) | | | (313,664 | ) | | | (313,518 | ) | | | (292,768 | ) |
The Government has more than offset the cost of its election commitments, totalling $1.975 billion over five years to 2018-19, through a range of measures. This includes a whole-of-Government reprioritisation allocation of $1.125 billion over 2015-16 to 2018-19.
Achieving these allocations will be the responsibility of each Minister, and will be done in a manner consistent with the Government’s commitment to public sector job security. There will be no forced redundancies or voluntary redundancy programs in response to reprioritisation measures.
20
Budget Measures 2015-16
Department of Aboriginal and Torres Strait Islander Partnerships
| | | | | | | | | | | | | | | | | | | | |
| | | 2014-15
$‘000 | | | 2015-16
$‘000 | | | 2016-17
$‘000 | | | 2017-18
$‘000 | | | 2018-19
$‘000 | |
Reparations for Government Controls of Wages and Savings of Aboriginal and Torres Strait Islander People | | | — | | | | 4,020 | | | | 13,250 | | | | 3,730 | | | | — | |
In keeping with the election commitment, the Government is providing additional funding of $21 million over three years to address the long standing historical issue of reparation for the wages and savings stolen from Aboriginal and Torres Strait Islander Queenslanders by the government of the time. It includes establishing a special taskforce to advise on and assist with this process.
| | | | | | | | | | | | | | | | | | | | |
| | | 2014-15
$‘000 | | | 2015-16
$‘000 | | | 2016-17
$‘000 | | | 2017-18
$‘000 | | | 2018-19
$‘000 | |
Welfare Reform | | | — | | | | 4,000 | | | | 8,000 | | | | 8,185 | | | | 8,378 | |
The Government is providing increased funding of $8 million per annum ongoing (adjusted for growth) for the continuation of the Welfare Reform initiative, which includes the Family Responsibilities Commission.
| | | | | | | | | | | | | | | | | | | | |
| | | 2014-15
$‘000 | | | 2015-16
$‘000 | | | 2016-17
$‘000 | | | 2017-18
$‘000 | | | 2018-19
$‘000 | |
Implementation of high priority recommendations of the Domestic and Family Violence Taskforce | | | — | | | | 131 | | | | — | | | | — | | | | — | |
The Government is providing additional funding of $131,000 in 2015-16 to implement high priority recommendations of the Domestic and Family Violence Taskforce Report. This includes working with other agencies to develop an integrated service delivery response model for domestic and family violence services in a discrete Indigenous community.
21
Budget Measures 2015-16
Total funding of $31.3 million over four years from 2015-16 has been provided across agencies as an initial response by Government to implement high priority recommendations of the Domestic and Family Violence Taskforce Report. This includes $5.2 million in new funding and $26.1 million from internal reallocation. Further details of this funding can be found in the Department of the Premier and Cabinet, Department of Communities, Child Safety and Disability Services, Department of Justice and Attorney-General and Department of Housing and Public Works sections of this chapter, and the Department of Communities, Child Safety and Disability Services section of Chapter 3 Capital Measures . The Government will soon release its response to all 140 recommendations in the Report, which will underpin the development of a Queensland Domestic and Family Violence Prevention Strategy.
22
Budget Measures 2015-16
Department of Agriculture and Fisheries
| | | | | | | | | | | | | | | | | | | | |
| | | 2014-15
$‘000 | | | 2015-16
$‘000 | | | 2016-17
$‘000 | | | 2017-18
$‘000 | | | 2018-19
$‘000 | |
Extending Existing Drought Relief Arrangements | | | — | | | | 30,187 | | | | 3,395 | | | | 2,395 | | | | 295 | |
As per the election commitment, the Government is providing increased funding of $36.3 million over four years and funding of $3.7 million over three years has been internally reallocated by the department for the continuation of the Drought Assistance package and ongoing funding for drought reform initiatives. This funding provides freight subsidies and emergency water infrastructure rebates to support producers and communities that have been affected by drought conditions across the State.
The Drought Assistance package is a total of $52.1 million over four years across several departments to support drought affected communities across the State. Further funding can be found in the Department of Communities, Child Safety and Disability Services, Department of Energy and Water Supply and Queensland Heath sections of this chapter and the Department of Natural Resources and Mines section of Chapter 4 Revenue Measures.
| | | | | | | | | | | | | | | | | | | | |
| | | 2014-15
$‘000 | | | 2015-16
$‘000 | | | 2016-17
$‘000 | | | 2017-18
$‘000 | | | 2018-19
$‘000 | |
Panama Disease Tropical Race 4 Response | | | — | | | | 9,534 | | | | — | | | | — | | | | — | |
The Government is providing additional funding of $9.5 million in 2015-16 and funding of $300,000 has been internally reallocated by the department to support the response program following the detection of the Tropical Race 4 strain of Panama disease. The funding provides surveillance to delimit the disease, tracing to determine the extent of spread of the disease, activities to contain and prevent the spread of the disease and destruction of the contaminated plants.
In 2014-15 $3.9 million was internally reallocated to fund additional expenses incurred by the department as a result of the initial emergency response phase. The Australian Government provided $210,000 to assist with establishing the laboratory diagnostic capability and for communication and engagement support. Outside of these additional costs, the department has redirected significant existing resources from normal business operations.
23
Budget Measures 2015-16
| | | | | | | | | | | | | | | | | | | | |
| | | 2014-15
$‘000 | | | 2015-16
$‘000 | | | 2016-17
$‘000 | | | 2017-18
$‘000 | | | 2018-19
$‘000 | |
Food And Fibre Plan | | | — | | | | 2,500 | | | | 3,530 | | | | 2,050 | | | | — | |
As per the election commitment, the Government is providing additional funding of $8.1 million over three years and funding of $5.1 million over three years has been internally reallocated by the department for Queensland’s Food and Fibre Plan. This initiative aims to implement a range of initiatives that will ensure the growth of a productive and prosperous food and fibre sector in Queensland and to actively address the challenges facing primary producers including dealing with agricultural pests such as wild dogs, access to a modern skilled workforce and by identifying new export opportunities.
24
Budget Measures 2015-16
Department of Communities, Child Safety and Disability Services
| | | | | | | | | | | | | | | | | | | | |
| | | 2014-15
$‘000 | | | 2015-16
$‘000 | | | 2016-17
$‘000 | | | 2017-18
$‘000 | | | 2018-19
$‘000 | |
Extending Existing Drought Relief Arrangements | | | — | | | | 4,000 | | | | — | | | | — | | | | — | |
As per the election commitment, the Government is providing increased funding of $4 million in 2015-16 to extend existing community support measures in drought declared areas to strengthen the resilience of drought affected Queenslanders.
The Drought Assistance package is a total of $52.1 million over four years across several departments to support drought affected communities across the State. Further funding can be found in the Department of Agriculture and Fisheries, Department of Energy and Water Supply and Queensland Health sections of this chapter and the Department of Natural Resources and Mines section of Chapter 4 Revenue Measures.
| | | | | | | | | | | | | | | | | | | | |
| | | 2014-15
$‘000 | | | 2015-16
$‘000 | | | 2016-17
$‘000 | | | 2017-18
$‘000 | | | 2018-19
$‘000 | |
Alcohol Fuelled Violence Program | | | — | | | | 3,540 | | | | 3,540 | | | | 3,680 | | | | — | |
The Government is providing increased funding of $10.8 million over three years to expand the number of rest and recovery services in Drink Safe Precincts to reduce alcohol related violence and create safer entertainment precincts.
The funding allocated for the Alcohol Fuelled Violence Program is a total of $32.1 million over four years across several departments to address alcohol fuelled violence across the State. Further funding can be found in Department of Justice and Attorney-General and Queensland Health sections of this chapter.
25
Budget Measures 2015-16
| | | | | | | | | | | | | | | | | | | | |
| | | 2014-15
$‘000 | | | 2015-16
$‘000 | | | 2016-17
$‘000 | | | 2017-18
$‘000 | | | 2018-19
$‘000 | |
Parenting Support for Queensland Families | | | — | | | | 3,000 | | | | 3,600 | | | | — | | | | — | |
The Government is providing funding of $6.6 million over two years to deliver parenting support programs for Queensland families. This initiative will provide families in Queensland with access to an innovative program of parenting support, which will help them thrive. This state-wide program will be a free service that will be delivered through a range of formats including on-line and face to face training focussed on developing peoples parenting skills. The program will be evaluated to assess its effectiveness and the benefits of continuing the program beyond two years.
| | | | | | | | | | | | | | | | | | | | |
| | | 2014-15
$‘000 | | | 2015-16
$‘000 | | | 2016-17
$‘000 | | | 2017-18
$‘000 | | | 2018-19
$‘000 | |
Queensland National Disability Insurance Scheme Launch Site | | | — | | | | 1,900 | | | | — | | | | — | | | | — | |
In keeping with the election commitment, the Government is providing additional funding of $1.9 million in 2015-16 to fund a NDIS launch site in Queensland. Additional funds will enable up to 600 people with disability to progressively commence access to reasonable and necessary services and fund NDIS participant and provider readiness activities for the launch.
| | | | | | | | | | | | | | | | | | | | |
| | | 2014-15
$‘000 | | | 2015-16
$‘000 | | | 2016-17
$‘000 | | | 2017-18
$‘000 | | | 2018-19
$‘000 | |
Multicultural Events and Projects | | | — | | | | 1,000 | | | | 1,000 | | | | 1,000 | | | | 1,000 | |
The Government is providing ongoing funding certainty of $1 million per annum to demonstrate the Queensland Government’s commitment to acknowledging the strengths of our multicultural community, celebrating and making the most of Queensland’s diversity. It is anticipated that more than 1.1 million Queenslanders will participate each year in more than 100 events supported by this funding.
26
Budget Measures 2015-16
| | | | | | | | | | | | | | | | | | | | |
| | | 2014-15
$‘000 | | | 2015-16
$‘000 | | | 2016-17
$‘000 | | | 2017-18
$‘000 | | | 2018-19
$‘000 | |
Multicultural Recognition Legislation and Multicultural Advisory Council | | | — | | | | 770 | | | | 770 | | | | 770 | | | | 770 | |
In keeping with the election commitment, the Government is providing additional funding of $770,000 per annum to support the implementation of Multicultural Recognition Legislation. This investment will enable the promotion of a Multicultural Queensland Charter and support a Queensland Multicultural Advisory Council to engage with stakeholders across Queensland. This will support initiatives to foster a harmonious and inclusive Queensland.
| | | | | | | | | | | | | | | | | | | | |
| | | 2014-15
$‘000 | | | 2015-16
$‘000 | | | 2016-17
$‘000 | | | 2017-18
$‘000 | | | 2018-19
$‘000 | |
Financial Literacy and Resilience | | | — | | | | — | | | | — | | | | — | | | | — | |
Funding of $5.5 million per annum commencing in 2016-17 will be reprioritised to fund a Financial Resilience program, including emergency relief and budgeting and financial management skills, to support Queenslanders to respond better to financial stresses, personal issues and cost of living pressures. The program will be developed and procured in 2015-16, informed by a Queensland Financial Resilience and Inclusion Action Plan.
| | | | | | | | | | | | | | | | | | | | |
| | | 2014-15
$‘000 | | | 2015-16
$‘000 | | | 2016-17
$‘000 | | | 2017-18
$‘000 | | | 2018-19
$‘000 | |
Implementation of high priority recommendations of the Domestic and Family Violence Taskforce | | | — | | | | — | | | | — | | | | — | | | | — | |
Funding of $4.2 million over four years from 2015-16 has been reprioritised by the department to implement the high priority recommendations of the Queensland Domestic and Family Violence Taskforce Report including integrated service delivery responses, review of domestic violence among people with disability, review of elder abuse and establishment of the department’s Domestic and Family Violence Taskforce Response Team.
27
Budget Measures 2015-16
Total funding of $31.3 million over four years from 2015-16 has been provided across agencies as an initial response by Government to implement high priority recommendations of the Domestic and Family Violence Taskforce Report. This includes $5.2 million in new funding and $26.1 million from internal reallocation. Further details of this funding can be found in the Department of Justice and Attorney-General, Department of the Premier and Cabinet, Department of Housing and Public Works and Department of Aboriginal and Torres Strait Islander Partnership sections of this chapter, and the Department of Communities, Child Safety and Disability Services section of Chapter 3 Capital Measures. The Government will soon release its response to all 140 recommendations in the Report, which will underpin the development of a Queensland Domestic and Family Violence Prevention Strategy.
| | | | | | | | | | | | | | | | | | | | |
| | | 2014-15
$‘000 | | | 2015-16
$‘000 | | | 2016-17
$‘000 | | | 2017-18
$‘000 | | | 2018-19
$‘000 | |
One Stop Shop for Seniors and Advisory Taskforce on Residential Transition for Ageing Queenslanders | | | — | | | | — | | | | — | | | | — | | | | — | |
In keeping with the election commitment, funding of $2 million over four years has been allocated to establish a One-Stop Shop for Seniors and establish an Advisory Taskforce on Residential Transition for Ageing Queenslanders.
28
Budget Measures 2015-16
Department of Education and Training
| | | | | | | | | | | | | | | | | | | | |
| | | 2014-15
$‘000 | | | 2015-16
$‘000 | | | 2016-17
$‘000 | | | 2017-18
$‘000 | | | 2018-19
$‘000 | |
State School Maintenance Program | | | — | | | | 70,000 | | | | 73,000 | | | | 76,000 | | | | 81,000 | |
The Government is providing additional funding of $70 million in 2015-16 for additional maintenance of existing state schools. This funding will help address Queensland’s maintenance backlog and meet the Auditor-General’s recommendations in relation to the proportion of funds allocated against the total asset base of Queensland state schools.
The $230 million over three years from 2016-17 is part of the $500 million State-wide Schools and Hospitals Fund. The capital component of the State-wide Schools and Hospitals Fund can be found in Chapter 3 Capital Measures.
The State-wide Schools and Hospitals Fund is a $500 million initiative that provides an economic uplift with a focus on health refurbishment and education capital and maintenance projects. Further funding can be found in the Queensland Health section of Chapter 3 Capital Measures.
| | | | | | | | | | | | | | | | | | | | |
| | | 2014-15
$‘000 | | | 2015-16
$‘000 | | | 2016-17
$‘000 | | | 2017-18
$‘000 | | | 2018-19
$‘000 | |
Education Minor Works Fund | | | — | | | | 10,000 | | | | 10,000 | | | | 10,000 | | | | — | |
The Government is providing additional funding of $30 million over three years as per the Education Minor Works Fund election commitment for priority minor works and maintenance across state schools.
29
Budget Measures 2015-16
| | | | | | | | | | | | | | | | | | | | |
| | | 2014-15
$‘000 | | | 2015-16
$‘000 | | | 2016-17
$‘000 | | | 2017-18
$‘000 | | | 2018-19
$‘000 | |
Skilling Queenslanders for Work | | | — | | | | 60,000 | | | | 60,000 | | | | 60,000 | | | | 60,000 | |
The Government is providing additional funding of $240 million over four years to reinstate Skilling Queenslanders for Work as part of the Government’s election commitment to support up to 32,000 Queenslanders into work through a suite of targeted skills and training programs.
| | | | | | | | | | | | | | | | | | | | |
| | | 2014-15
$‘000 | | | 2015-16
$‘000 | | | 2016-17
$‘000 | | | 2017-18
$‘000 | | | 2018-19
$‘000 | |
Non-State schools Capital Grants | | | — | | | | 41,200 | | | | 41,200 | | | | 41,200 | | | | — | |
The Government is providing additional funding of $123.6 million over three years in capital grants to the non-state schooling sector to meet enrolment growth as per the Non-State School Capital Grant election commitment.
| | | | | | | | | | | | | | | | | | | | |
| | | 2014-15
$‘000 | | | 2015-16
$‘000 | | | 2016-17
$‘000 | | | 2017-18
$‘000 | | | 2018-19
$‘000 | |
Southbank Education and Training Precinct Public Private Partnership | | | — | | | | 22,700 | | | | — | | | | — | | | | — | |
The Government is providing additional funding of $22.7 million in 2015-16 to assist the department in meeting its obligations under the Southbank Education and Training Precinct Public Private Partnership arrangement.
30
Budget Measures 2015-16
| | | | | | | | | | | | | | | | | | | | |
| | | 2014-15
$‘000 | | | 2015-16
$‘000 | | | 2016-17
$‘000 | | | 2017-18
$‘000 | | | 2018-19
$‘000 | |
Extra Teachers | | | — | | | | 16,250 | | | | 50,180 | | | | 85,950 | | | | 96,316 | |
The Government is providing additional funding of $152.4 million over three years and ongoing funding of $96.3 million per annum as part of the Government’s election commitment to provide an extra 875 teachers with 275 specialist teachers directed to high schools.
| | | | | | | | | | | | | | | | | | | | |
| | | 2014-15
$‘000 | | | 2015-16
$‘000 | | | 2016-17
$‘000 | | | 2017-18
$‘000 | | | 2018-19
$‘000 | |
Jobs Queensland | | | — | | | | 10,000 | | | | 10,000 | | | | 10,000 | | | | 10,000 | |
The Government is providing $40 million over four years to establish Jobs Queensland as an independent statutory authority as part of the election commitment to provide advice to government on skills demand and long-term workforce planning.
| | | | | | | | | | | | | | | | | | | | |
| | | 2014-15
$‘000 | | | 2015-16
$‘000 | | | 2016-17
$‘000 | | | 2017-18
$‘000 | | | 2018-19
$‘000 | |
Queensland Children and Family Centres | | | — | | | | 7,000 | | | | 10,288 | | | | 10,583 | | | | 10,888 | |
The Government is providing additional funding of $38.8 million over four years and ongoing funding of $10.9 million per annum to secure the future of Queensland’s 10 Children and Family Centres. Funding for these centres was previously associated with a National Partnership Agreement allocation that was cut by the Commonwealth in its 2014-15 Budget.
31
Budget Measures 2015-16
| | | | | | | | | | | | | | | | | | | | |
| | | 2014-15
$‘000 | | | 2015-16
$‘000 | | | 2016-17
$‘000 | | | 2017-18
$‘000 | | | 2018-19
$‘000 | |
Rescuing TAFE | | | — | | | | 6,630 | | | | 13,540 | | | | 13,830 | | | | 500 | |
The Government is providing additional funding of $34 million over three years, and ongoing funding of $500,000 per annum from 2018-19, to restore TAFE Queensland’s status as Queensland’s premier provider of vocational education and training as part of the Rescuing TAFE election commitment.
| | | | | | | | | | | | | | | | | | | | |
| | | 2014-15
$‘000 | | | 2015-16
$‘000 | | | 2016-17
$‘000 | | | 2017-18
$‘000 | | | 2018-19
$‘000 | |
Kindergarten Disability Support Funding | | | — | | | | 2,803 | | | | 3,303 | | | | 3,803 | | | | 4,303 | |
The Government is providing additional funding of $14.2 million over four years and ongoing funding of $4.3 million per annum in addition to the existing commitment of $697,000 per annum to support children with suspected or diagnosed disability to actively participate in a kindergarten program.
| | | | | | | | | | | | | | | | | | | | |
| | | 2014-15
$‘000 | | | 2015-16
$‘000 | | | 2016-17
$‘000 | | | 2017-18
$‘000 | | | 2018-19
$‘000 | |
Letting Teachers Teach | | | — | | | | 2,000 | | | | 2,000 | | | | 2,000 | | | | — | |
The Government is providing additional funding of $6 million over three years as per the Letting Teachers Teach election commitment to develop an enhanced and rigorous new teacher classification system and pay structure to modernise and improve the teaching profession.
32
Budget Measures 2015-16
| | | | | | | | | | | | | | | | | | | | |
| | | 2014-15
$‘000 | | | 2015-16
$‘000 | | | 2016-17
$‘000 | | | 2017-18
$‘000 | | | 2018-19
$‘000 | |
Water Based Fire Protection Systems | | | — | | | | 2,000 | | | | — | | | | — | | | | — | |
The Government is providing additional funding of $2 million in 2015-16 to progressively upgrade fire protection systems in state schools to meet required pressure and flow requirements.
| | | | | | | | | | | | | | | | | | | | |
| | | 2014-15
$‘000 | | | 2015-16
$‘000 | | | 2016-17
$‘000 | | | 2017-18
$‘000 | | | 2018-19
$‘000 | |
Supporting Students | | | — | | | | 1,000 | | | | 2,900 | | | | 5,000 | | | | 5,603 | |
The Government is providing additional funding of $8.9 million over three years and ongoing funding of $5.6 million per annum (including $603,000 for non-state schools) for the provision of an additional 45 guidance officers for Queensland secondary, combined and special schools with high school aged students as per the Supporting Students election commitment.
| | | | | | | | | | | | | | | | | | | | |
| | | 2014-15
$‘000 | | | 2015-16
$‘000 | | | 2016-17
$‘000 | | | 2017-18
$‘000 | | | 2018-19
$‘000 | |
A Flying Start | | | — | | | | (52,900 | ) | | | — | | | | — | | | | — | |
The Government has reprioritised savings of $52.9 million from the Flying Start initiative to state school maintenance initiatives following the successful transition of Year 7 to high school in 2015. The capital component of this measure can be found in Chapter 3 Capital Measures.
33
Budget Measures 2015-16
| | | | | | | | | | | | | | | | | | | | |
| | | 2014-15
$‘000 | | | 2015-16
$‘000 | | | 2016-17
$‘000 | | | 2017-18
$‘000 | | | 2018-19
$‘000 | |
Great Teachers = Great Results Savings Measure | | | — | | | | (53,470 | ) | | | (60,150 | ) | | | (66,830 | ) | | | — | |
As part of the Government’s strategy to fund its election commitments, the Government has approved savings measures of over $180.5 million over three years to re-direct previous funding for Great Teachers = Great Results to other education initiatives.
34
Budget Measures 2015-16
Department of Energy and Water Supply
| | | | | | | | | | | | | | | | | | | | |
| | | 2014-15
$‘000 | | | 2015-16
$‘000 | | | 2016-17
$‘000 | | | 2017-18
$‘000 | | | 2018-19
$‘000 | |
Extending Existing Drought Relief Arrangements | | | — | | | | 2,500 | | | | — | | | | — | | | | — | |
As per the election commitment, the Government is providing increased funding of $2.5 million in 2015-16 to provide relief to farming customers from fixed charges for electricity accounts that are used to pump water for farm or irrigation purposes during periods of drought.
The Drought Assistance package is a total of $52.1 million over four years across several departments to support drought affected communities across the State. Further funding can be found in the Department of Agriculture and Fisheries, Department of Communities, Child Safety and Disability Services and Queensland Health sections of this chapter and the Department of Natural Resources and Mines section of Chapter 4 Revenue Measures.
| | | | | | | | | | | | | | | | | | | | |
| | | 2014-15
$‘000 | | | 2015-16
$‘000 | | | 2016-17
$‘000 | | | 2017-18
$‘000 | | | 2018-19
$‘000 | |
Queensland Water Regional Alliances Program | | | — | | | | 500 | | | | 500 | | | | 500 | | | | — | |
In keeping with the election commitment, the Government has allocated $1.5 million and the department has allocated $300,000 over three years to retain and expand the QWRAP program. The program is managed by the Local Government Association of Queensland (LGAQ). The program is designed to provide leadership and support for Queensland councils wishing to investigate and transition to collaborative regional arrangements for the provision of drinking water and sewerage services.
35
Budget Measures 2015-16
Department of Environment and Heritage Protection
| | | | | | | | | | | | | | | | | | | | |
| | | 2014-15
$‘000 | | | 2015-16
$‘000 | | | 2016-17
$‘000 | | | 2017-18
$‘000 | | | 2018-19
$‘000 | |
Saving the Great Barrier Reef | | | — | | | | 12,683 | | | | 21,830 | | | | 21,830 | | | | 21,830 | |
In keeping with its election commitment, the Government is providing additional funding of $100 million over five years, including $21.8 million in 2019-20, as part of the Saving the Great Barrier Reef policy. This funding will deliver on the Government’s commitments to protect the Great Barrier Reef by investing in water quality initiatives and scientific research as well as helping businesses to transition to better environmental practices in the primary production, mining and fishing industries. All Great Barrier Reef spending across State Government agencies will be reported by the Department of Environment and Heritage Protection in an annual investment plan and annual report.
| | | | | | | | | | | | | | | | | | | | |
| | | 2014-15 | | | 2015-16 | | | 2016-17 | | | 2017-18 | | | 2018-19 | |
| | | $‘000 | | | $‘000 | | | $‘000 | | | $‘000 | | | $‘000 | |
Climate Change Adaptation | | | — | | | | 5,000 | | | | 5,000 | | | | 5,000 | | | | — | |
In keeping with its election commitment, the Government is providing additional funding of $4 million per annum for three years for the establishment of the Local Government Coastal Hazard Climate Adaptation Fund, and $1 million per annum for three years to support the development and implementation of a new Queensland Climate Change Adaptation Strategy. Total funding for the initiative is $15 million over three years. The Adaptation Fund will assist local governments to develop coastal hazard adaptation strategies and coastal adaptation pilot projects. The Adaptation Strategy will be developed in collaboration with local government and other key stakeholder groups.
36
Budget Measures 2015-16
| | | | | | | | | | | | | | | | | | | | |
| | | 2014-15 | | | 2015-16 | | | 2016-17 | | | 2017-18 | | | 2018-19 | |
| | | $‘000 | | | $‘000 | | | $‘000 | | | $‘000 | | | $‘000 | |
NatureAssist Program | | | — | | | | 5,000 | | | | — | | | | — | | | | — | |
In keeping with its election commitment, the Government is providing additional funding of $5 million in 2015-16 to continue the NatureAssist program to secure nature refuges for lands of significant conservation and high climate change value on leasehold and freehold land. This program secures perpetual, legally-binding covenants over areas of significant current and potential conservation value on privately managed lands. These covenants, known as Nature Refuges, are established through voluntary negotiation between landholders and the Government.
| | | | | | | | | | | | | | | | | | | | |
| | | 2014-15 | | | 2015-16 | | | 2016-17 | | | 2017-18 | | | 2018-19 | |
| | | $‘000 | | | $‘000 | | | $‘000 | | | $‘000 | | | $‘000 | |
Underground Coal Gasification Investigations | | | 1,966 | | | | 2,145 | | | | — | | | | — | | | | — | |
The Government has provided additional funding of $2.0 million in 2014-15 and is providing a further $2.1 million in 2015-16 to support continuing investigation and compliance activities into instances of alleged serious environmental harm.
| | | | | | | | | | | | | | | | | | | | |
| | | 2014-15 | | | 2015-16 | | | 2016-17 | | | 2017-18 | | | 2018-19 | |
| | | $‘000 | | | $‘000 | | | $‘000 | | | $‘000 | | | $‘000 | |
Wildlife Management and Conservation | | | — | | | | 1,754 | | | | — | | | | — | | | | — | |
The Government is providing additional funding of $1.8 million in 2015-16 to continue to support a range of wildlife management and conservation activities, including regulating the use and trading of native plants and animals, management of crocodiles and other dangerous species, responding to marine mammal strandings, management of sick and injured animals, and the protection of koalas.
37
Budget Measures 2015-16
| | | | | | | | | | | | | | | | | | | | |
| | | 2014-15 | | | 2015-16 | | | 2016-17 | | | 2017-18 | | | 2018-19 | |
| | | $‘000 | | | $‘000 | | | $‘000 | | | $‘000 | | | $‘000 | |
Expansion of Waterway Health Report Cards | | | — | | | | 1,500 | | | | 1,500 | | | | 1,500 | | | | 1,500 | |
The Government is providing additional funding of $1.5 million per annum to expand integrated water quality monitoring and report cards to support the Reef 2050 Long Term Sustainability Plan. The program aims to build partnerships with industry, community groups and land owners to provide valuable information and engagement on local water quality hot-spots.
| | | | | | | | | | | | | | | | | | | | |
| | | 2014-15 | | | 2015-16 | | | 2016-17 | | | 2017-18 | | | 2018-19 | |
| | | $‘000 | | | $‘000 | | | $‘000 | | | $‘000 | | | $‘000 | |
Environmental Impact Assessments | | | — | | | | 1,400 | | | | — | | | | — | | | | — | |
The Government is providing increased funding of $1.4 million in 2015-16 to support the delivery of Environmental Impact Statement (EIS) assessments. EIS assessments are undertaken for large scale projects and projects of State significance.
| | | | | | | | | | | | | | | | | | | | |
| | | 2014-15 | | | 2015-16 | | | 2016-17 | | | 2017-18 | | | 2018-19 | |
| | | $‘000 | | | $‘000 | | | $‘000 | | | $‘000 | | | $‘000 | |
Industry Driven Waste Strategy | | | — | | | | (200 | ) | | | (200 | ) | | | (200 | ) | | | — | |
As part of the Government’s strategy to fund its election commitments, the Government has delivered savings of $600,000 over three years from the Industry Driven Waste Strategy program.
38
Budget Measures 2015-16
Department of Housing and Public Works
| | | | | | | | | | | | | | | | | | | | |
| | | 2014-15 | | | 2015-16 | | | 2016-17 | | | 2017-18 | | | 2018-19 | |
| | | $‘000 | | | $‘000 | | | $‘000 | | | $‘000 | | | $‘000 | |
National Partnership Agreement on Homelessness | | | — | | | | 28,710 | | | | 28,710 | | | | — | | | | — | |
The Australian Government will provide funding of $57.4 million over two years to renew the National Partnership Agreement on Homelessness to 30 June 2017. The Queensland Government will provide matched funding of $57.4 million over two years. The Agreement will prioritise front line service delivery to support victims of domestic violence and improve services for young people at risk of homelessness.
| | | | | | | | | | | | | | | | | | | | |
| | | 2014-15 | | | 2015-16 | | | 2016-17 | | | 2017-18 | | | 2018-19 | |
| | | $‘000 | | | $‘000 | | | $‘000 | | | $‘000 | | | $‘000 | |
Independent Advisory Service for Tenants | | | — | | | | 6,600 | | | | 6,600 | | | | 6,600 | | | | 6,600 | |
As per the election commitment, the Government is providing additional funding of $6.6 million per annum to reinstate an independent advisory service for Queensland tenants. This service will provide independent information and advice to residential tenants in Queensland.
| | | | | | | | | | | | | | | | | | | | |
| | | 2014-15 | | | 2015-16 | | | 2016-17 | | | 2017-18 | | | 2018-19 | |
| | | $‘000 | | | $‘000 | | | $‘000 | | | $‘000 | | | $‘000 | |
Cairns Convention Centre Roof Repairs | | | — | | | | — | | | | — | | | | — | | | | — | |
Funding of $500,000 over two years from 2014-15 has been internally reallocated by the department to repair the roof of the Cairns Convention Centre. The capital component of this measure can be found in Chapter 3 Capital Measures.
39
Budget Measures 2015-16
| | | | | | | | | | | | | | | | | | | | |
| | | 2014-15 | | | 2015-16 | | | 2016-17 | | | 2017-18 | | | 2018-19 | |
| | | $‘000 | | | $‘000 | | | $‘000 | | | $‘000 | | | $‘000 | |
Cyclone Shelter Upgrades | | | — | | | | — | | | | — | | | | — | | | | — | |
Funding of $1.5 million over two years from 2014-15 has been internally reallocated by the department to upgrade the Innisfail and Redlynch cyclone shelters.
| | | | | | | | | | | | | | | | | | | | |
| | | 2014-15 | | | 2015-16 | | | 2016-17 | | | 2017-18 | | | 2018-19 | |
| | | $‘000 | | | $‘000 | | | $‘000 | | | $‘000 | | | $‘000 | |
Demonstration project to address service gaps in housing and health systems | | | — | | | | — | | | | — | | | | — | | | | — | |
As per the election commitment, funding of $542,000 in 2015-16 and $678,000 in 2016-17 has been internally reallocated by the department to undertake a new demonstration project integrating housing, health and welfare support service responses to address service delivery gaps for social housing tenants experiencing mental illness. Further funding can be found in the Queensland Health section of this chapter.
| | | | | | | | | | | | | | | | | | | | |
| | | 2014-15 | | | 2015-16 | | | 2016-17 | | | 2017-18 | | | 2018-19 | |
| | | $‘000 | | | $‘000 | | | $‘000 | | | $‘000 | | | $‘000 | |
Implementation of high priority recommendations of the Domestic and Family Violence Taskforce | | | — | | | | — | | | | — | | | | — | | | | — | |
Funding of $12.2 million over 4 years from 2015-16 has been internally reallocated by the department to implement high priority recommendations of the Domestic and Family Violence Taskforce Report. This is comprised of $300,000 in 2015-16 to develop integrated service delivery models in three locations (one urban, one regional and one discrete Indigenous community) and $11.9 million over four years from 2015-16, to establish two additional 72-hour crisis shelters in Brisbane and Townsville respectively for women and children escaping violence.
40
Budget Measures 2015-16
Total funding of $31.3 million over four years from 2015-16 has been provided across agencies as an initial response by Government to implement high priority recommendations of the Domestic and Family Violence Taskforce Report. This includes $5.2 million in new funding and $26.1 million from internal reallocation. Further details of this funding can be found in the Department of the Premier and Cabinet, Department of Communities, Child Safety and Disability Services, Department of Justice and Attorney-General and Department of Aboriginal and Torres Strait Islander Partnership sections of this chapter, and the Department of Communities, Child Safety and Disability Services section of Chapter 3 Capital Measures. The Government will soon release its response to all 140 recommendations in the Report, which will underpin the development of a Queensland Domestic and Family Violence Prevention Strategy.
41
Budget Measures 2015-16
Department of Infrastructure, Local Government and Planning
| | | | | | | | | | | | | | | | | | | | |
| | | 2014-15 | | | 2015-16 | | | 2016-17 | | | 2017-18 | | | 2018-19 | |
| | | $‘000 | | | $‘000 | | | $‘000 | | | $‘000 | | | $‘000 | |
Establishment of the Community Resilience Fund | | | — | | | | 40,000 | | | | — | | | | — | | | | — | |
In keeping with the election commitment, the Government is providing additional funding of $40 million in 2015-16 for the establishment of the Community Resilience Fund to support local governments with mitigating the impact of natural disasters on infrastructure, to better protect vulnerable communities.
| | | | | | | | | | | | | | | | | | | | |
| | | 2014-15 | | | 2015-16 | | | 2016-17 | | | 2017-18 | | | 2018-19 | |
| | | $‘000 | | | $‘000 | | | $‘000 | | | $‘000 | | | $‘000 | |
Better Planning for Queensland | | | 2,119 | | | | 29,231 | | | | 11,025 | | | | 8,849 | | | | 8,126 | |
The Government is providing additional funding of $59.4 million over five years to 2018-19, to deliver a better planning system that supports effective and genuine public participation in planning, whilst providing for efficient and consistent decision making that instils investment and community confidence.
| | | | | | | | | | | | | | | | | | | | |
| | | 2014-15 | | | 2015-16 | | | 2016-17 | | | 2017-18 | | | 2018-19 | |
| | | $‘000 | | | $‘000 | | | $‘000 | | | $‘000 | | | $‘000 | |
Special Assistance Package - Iconic projects in Rockhampton and Livingstone shires | | | — | | | | 16,000 | | | | 24,000 | | | | — | | | | — | |
The Government is providing $40 million as a special assistance package following Tropical Cyclone Marcia for iconic projects in Rockhampton and Livingstone shires, including revitalisation of the riverfront in Rockhampton and the Yeppoon foreshore.
42
Budget Measures 2015-16
| | | | | | | | | | | | | | | | | | | | |
| | | 2014-15 | | | 2015-16 | | | 2016-17 | | | 2017-18 | | | 2018-19 | |
| | | $‘000 | | | $‘000 | | | $‘000 | | | $‘000 | | | $‘000 | |
Establishment of Building Queensland | | | — | | | | 5,486 | | | | 4,973 | | | | — | | | | — | |
As per the election commitment, the Government is providing funding of $20.2 million to establish Building Queensland to provide independent, expert advice on infrastructure priorities. This funding package includes additional funding of $10.5 million over two years to 2016-17 and $9.8 million of funding reprioritised across Government over four years to 2018-19.
| | | | | | | | | | | | | | | | | | | | |
| | | 2014-15 | | | 2015-16 | | | 2016-17 | | | 2017-18 | | | 2018-19 | |
| | | $‘000 | | | $‘000 | | | $‘000 | | | $‘000 | | | $‘000 | |
Queensland Reconstruction Authority Operations | | | — | | | | 5,000 | | | | 30,658 | | | | 31,280 | | | | 31,914 | |
The Government is providing increased funding of $5 million in 2015-16 (in addition to the $25 million allocated for 2015-16 in the former Government’s 2014-15 Mid Year Fiscal and Economic Review) and then approximately $30 million per annum for the operations of the Queensland Reconstruction Authority.
| | | | | | | | | | | | | | | | | | | | |
| | | 2014-15 | | | 2015-16 | | | 2016-17 | | | 2017-18 | | | 2018-19 | |
| | | $‘000 | | | $‘000 | | | $‘000 | | | $‘000 | | | $‘000 | |
Trade and Investment Queensland | | | — | | | | 1,927 | | | | 1,881 | | | | 1,915 | | | | 1,941 | |
The Government is providing increased funding of $7.7 million over four years to grow Queensland’s International Education and Training industry by continuing funding to promote Queensland education providers and services from various sectors internationally under a single Queensland brand. This funding was due to cease at the end of 2014-15.
43
Budget Measures 2015-16
| | | | | | | | | | | | | | | | | | | | |
| | | 2014-15
$‘000 | | | 2015-16
$‘000 | | | 2016-17
$‘000 | | | 2017-18
$‘000 | | | 2018-19
$‘000 | |
Local Government Graffiti Removal Grants | | | — | | | | (2,000 | ) | | | — | | | | — | | | | — | |
As part of the Government’s strategy to fund its election commitments, the Government has reprioritised the balance of the $8 million allocated for the GraffitiSTOP Funding Program.
44
Budget Measures 2015-16
Department of Justice and Attorney-General
| | | | | | | | | | | | | | | | | | | | |
| | | 2014-15
$‘000 | | | 2015-16
$‘000 | | | 2016-17
$‘000 | | | 2017-18
$‘000 | | | 2018-19
$‘000 | |
Correctional Centre Capacity | | | — | | | | 28,804 | | | | 38,051 | | | | 38,818 | | | | 39,641 | |
The Government is providing additional funding of $145.3 million over four years from 2015-16 for the re-commissioning and operation of Borallon Correctional Centre to provide additional prison capacity.
| | | | | | | | | | | | | | | | | | | | |
| | | 2014-15
$‘000 | | | 2015-16
$‘000 | | | 2016-17
$‘000 | | | 2017-18
$‘000 | | | 2018-19
$‘000 | |
Brisbane Youth Detention Centre Capacity | | | 5,000 | | | | 5,188 | | | | 5,289 | | | | 5,391 | | | | 5,495 | |
The Government has provided increased funding of $26.4 million over five years from 2014-15 for additional bed capacity in Brisbane Youth Detention Centre.
| | | | | | | | | | | | | | | | | | | | |
| | | 2014-15
$‘000 | | | 2015-16
$‘000 | | | 2016-17
$‘000 | | | 2017-18
$‘000 | | | 2018-19
$‘000 | |
Commission of Inquiry into Organised Crime | | | 2,000 | | | | 4,000 | | | | — | | | | — | | | | — | |
As per the election commitment, the Government has provided additional funding of $6 million over two years from 2014-15 to establish a Commission of Inquiry into Organised Crime in Queensland. The Commission has been directed to examine and report on the extent, nature and societal impacts of Organised Crime.
45
Budget Measures 2015-16
| | | | | | | | | | | | | | | | | | | | |
| | | 2014-15
$‘000 | | | 2015-16
$‘000 | | | 2016-17
$‘000 | | | 2017-18
$‘000 | | | 2018-19
$‘000 | |
Reinstate Diversionary Processes | | | — | | | | 3,811 | | | | 10,020 | | | | 10,551 | | | | 7,878 | |
As per the election commitment, the Government is providing additional funding of $32.3 million over four years from 2015-16 to reinstate diversionary processes. This includes $8.7 million to reinstate specialist courts and $23.6 million to reinstate court based referrals to Youth Justice Conferencing. The reinstatement of specialist courts is an opportunity to divert offenders from prison by providing them with opportunities to address their offending behaviour through intervention. The reinstatement of Youth Justice Conferencing provides an opportunity for young people to take responsibility for their criminal behaviour.
| | | | | | | | | | | | | | | | | | | | |
| | | 2014-15
$‘000 | | | 2015-16
$‘000 | | | 2016-17
$‘000 | | | 2017-18
$‘000 | | | 2018-19
$‘000 | |
Alcohol Fuelled Violence Program | | | — | | | | 3,330 | | | | 3,095 | | | | 3,160 | | | | — | |
The Government is providing additional funding of $9.6 million over three years from 2015-16 to tackle alcohol fuelled violence in and around licensed premises, particularly within Queensland’s key entertainment precincts.
The funding allocated for the Alcohol Fuelled Violence Program is a total of $32.1 million over four years across several departments to address alcohol fuelled violence across the State. Further funding can be found in the Department of Communities, Child Safety and Disability Services and Queensland Health sections of this chapter.
46
Budget Measures 2015-16
| | | | | | | | | | | | | | | | | | | | |
| | | 2014-15
$‘000 | | | 2015-16
$‘000 | | | 2016-17
$‘000 | | | 2017-18
$‘000 | | | 2018-19
$‘000 | |
Prisoner Reintegration to Reduce Reoffending | | | — | | | | 2,200 | | | | 2,200 | | | | 3,700 | | | | 3,700 | |
The Government is providing increased funding of $2.2 million in 2015-16 and 2016-17, and $3.7 million per annum ongoing from 2017-18 for the continued delivery of prisoner reintegration services to reduce reoffending. Re-entry programs address employment assistance, accommodation, substance abuse and mental illness to enable a successful transition into the community. Additional funding of $1.5 million per annum in 2015-16 and 2016-17 has been sought for this initiative from the Australian Government under the National Partnership Agreement on Homelessness.
| | | | | | | | | | | | | | | | | | | | |
| | | 2014-15
$‘000 | | | 2015-16
$‘000 | | | 2016-17
$‘000 | | | 2017-18
$‘000 | | | 2018-19
$‘000 | |
Reinstate Sentencing Advisory Council | | | — | | | | 1,800 | | | | 1,820 | | | | 1,840 | | | | — | |
As per the election commitment, the Government is providing additional funding of $5.5 million over three years from 2015-16 to reinstate the Sentencing Advisory Council. The Council has an important role in educating the community about the justice system and sentencing, collating statistical information about sentencing and researching the effectiveness of sentencing practices in reducing crime.
| | | | | | | | | | | | | | | | | | | | |
| | | 2014-15
$‘000 | | | 2015-16
$‘000 | | | 2016-17
$‘000 | | | 2017-18
$‘000 | | | 2018-19
$‘000 | |
Increase Investment in Legal Aid Services | | | — | | | | 1,100 | | | | — | | | | — | | | | — | |
As per the election commitment, the Government is providing additional funding of $1.1 million in 2015-16 for the expansion of Domestic Violence Duty Lawyer Service across Queensland through Legal Aid Queensland. The service will empower victims to pursue matters, smooth court processes and improve victim safety and compliance with court orders.
47
Budget Measures 2015-16
| | | | | | | | | | | | | | | | | | | | |
| | | 2014-15
$‘000 | | | 2015-16
$‘000 | | | 2016-17
$‘000 | | | 2017-18
$‘000 | | | 2018-19
$‘000 | |
Queensland Civil and Administrative Tribunal - Justice of the Peace Trial | | | — | | | | 972 | | | | — | | | | — | | | | — | |
The Government is providing additional funding of $972,000 in 2015-16 to continue the Justice of the Peace trial in existing locations for 12 months. The trial is a unique initiative where Justices of the Peace hear some minor civil dispute matters before the tribunal. This reduces the time and cost to finalise minor civil disputes. The trial operates in five locations: Brisbane; Ipswich; Maroochydore; Southport; and Townsville.
| | | | | | | | | | | | | | | | | | | | |
| | | 2014-15
$‘000 | | | 2015-16
$‘000 | | | 2016-17
$‘000 | | | 2017-18
$‘000 | | | 2018-19
$‘000 | |
Crime and Corruption Commission - Administrative measures | | | — | | | | 721 | | | | 721 | | | | 721 | | | | 721 | |
The Government is providing additional funding to implement the election commitment to provide access to a judicial pension for the Crime and Corruption Commission Chair. The funding will be allocated from the Consolidated Fund as per other judicial pension arrangements.
| | | | | | | | | | | | | | | | | | | | |
| | | 2014-15
$‘000 | | | 2015-16
$‘000 | | | 2016-17
$‘000 | | | 2017-18
$‘000 | | | 2018-19
$‘000 | |
Implementation of high priority recommendations of the Domestic and Family Violence Taskforce | | | — | | | | 500 | | | | 511 | | | | 522 | | | | 534 | |
The Government has provided additional funding of $3 million over four years from 2015-16 to implement the high priority recommendations of the Domestic and Family Violence Taskforce Report. This funding comprises additional funding of $2.1 million over four years from 2015-16 to establish an independent Domestic and Family Violence Death Review Board and expand the Domestic and Family Violence Review Unit and reprioritised funding of $888,000 in 2015-16 to review the Domestic and Family Violence Protection Act 2012 and support integrated service responses.
48
Budget Measures 2015-16
Total funding of $31.3 million over four years from 2015-16 has been provided across agencies as an initial response by Government to implement high priority recommendations of the Domestic and Family Violence Taskforce Report. This includes $5.2 million in new funding and $26.1 million from internal reallocation. Further details of this funding can be found in the Department of the Premier and Cabinet, Department of Communities, Child Safety and Disability Services, Department of Housing and Public Works and Department of Aboriginal and Torres Strait Islander Partnership sections of this chapter, and the Department of Communities, Child Safety and Disability Services section of Chapter 3 Capital Measures. The Government will soon release its response to all 140 recommendations in the Report, which will underpin the development of a Queensland Domestic and Family Violence Prevention Strategy.
| | | | | | | | | | | | | | | | | | | | |
| | | 2014-15
$‘000 | | | 2015-16
$‘000 | | | 2016-17
$‘000 | | | 2017-18
$‘000 | | | 2018-19
$‘000 | |
Resourcing for the Confiscations Unit | | | — | | | | 416 | | | | 431 | | | | 222 | | | | — | |
The Government is providing additional funding of $1.1 million over three years from 2015-16 to the Office of the Director of Public Prosecutions for litigation to confiscate the proceeds of crime under the Criminal Proceeds Confiscation Act 2002.
| | | | | | | | | | | | | | | | | | | | |
| | | 2014-15
$‘000 | | | 2015-16
$‘000 | | | 2016-17
$‘000 | | | 2017-18
$‘000 | | | 2018-19
$‘000 | |
Environmental Defenders Offices | | | — | | | | 200 | | | | 200 | | | | 200 | | | | 200 | |
As per the election commitment, the Government is providing additional funding of $1 million over five years from 2015-16 for the Environmental Defenders Offices and returning them to the list of community organisations eligible for legal assistance service delivery funding.
49
Budget Measures 2015-16
| | | | | | | | | | | | | | | | | | | | |
| | | 2014-15
$‘000 | | | 2015-16
$‘000 | | | 2016-17
$‘000 | | | 2017-18
$‘000 | | | 2018-19
$‘000 | |
Enhancement of Community Engagement | | | — | | | | 99 | | | | 97 | | | | 97 | | | | — | |
The Government is providing additional funding of $293,000 over three years from 2015-16 for the Anti-Discrimination Commission Queensland to deliver community assistance activities. These activities result in local communities having the capacity to develop local solutions with the assistance of relevant government agencies, local business and community organisations.
| | | | | | | | | | | | | | | | | | | | |
| | | 2014-15
$‘000 | | | 2015-16
$‘000 | | | 2016-17
$‘000 | | | 2017-18
$‘000 | | | 2018-19
$‘000 | |
Safe Night Out Strategy | | | — | | | | (6,227 | ) | | | (6,049 | ) | | | (4,830 | ) | | | (3,800 | ) |
As part of the Government’s strategy to fund its election commitments, the department delivered savings of $17.1 million over three years from 2015-16 and $3.8 million per annum ongoing from 2018-19 from ceasing the Safe Night Out Strategy.
50
Budget Measures 2015-16
Department of National Parks, Sport and Racing
| | | | | | | | | | | | | | | | | | | | |
| | | 2014-15
$‘000 | | | 2015-16
$‘000 | | | 2016-17
$‘000 | | | 2017-18
$‘000 | | | 2018-19
$‘000 | |
State Netball Centre | | | — | | | | 15,000 | | | | 15,000 | | | | — | | | | — | |
The Government is providing additional funding of $30 million over two years to develop and build a state netball facility at the Queensland Sport and Athletics Centre, in partnership with Netball Queensland.
| | | | | | | | | | | | | | | | | | | | |
| | | 2014-15
$‘000 | | | 2015-16
$‘000 | | | 2016-17
$‘000 | | | 2017-18
$‘000 | | | 2018-19
$‘000 | |
Queensland Parks and Forest Management | | | — | | | | 2,377 | | | | — | | | | — | | | | — | |
The Government is providing additional funding of $2.4 million in 2015-16 to manage land that has been acquired due to its high environmental and conservation value. The capital component of this measure can be found in Chapter 3 Capital Measures.
| | | | | | | | | | | | | | | | | | | | |
| | | 2014-15
$‘000 | | | 2015-16
$‘000 | | | 2016-17
$‘000 | | | 2017-18
$‘000 | | | 2018-19
$‘000 | |
North Stradbroke Island - Joint Management | | | — | | | | 1,749 | | | | 3,396 | | | | 3,464 | | | | 3,533 | |
In keeping with the election commitment, the Government is providing additional funding of $12.1 million over four years to jointly manage the North Stradbroke Island protected area estate with the traditional owners, the Quandamooka people. The capital component of this measure can be found in Chapter 3 Capital Measures.
51
Budget Measures 2015-16
| | | | | | | | | | | | | | | | | | | | |
| | | 2014-15 | | | 2015-16 | | | 2016-17 | | | 2017-18 | | | 2018-19 | |
| | | $‘000 | | | $‘000 | | | $‘000 | | | $‘000 | | | $‘000 | |
Cape York Peninsula Aboriginal Land National Parks | | | — | | | | 1,699 | | | | 2,008 | | | | 1,819 | | | | 1,910 | |
The Government is providing additional funding of $7.4 million over four years to jointly manage with traditional owners approximately 2.6 million hectares of park estate on Cape York Peninsula, as part of indigenous management agreements. This includes the employment of seven additional rangers.
| | | | | | | | | | | | | | | | | | | | |
| | | 2014-15 | | | 2015-16 | | | 2016-17 | | | 2017-18 | | | 2018-19 | |
| | | $‘000 | | | $‘000 | | | $‘000 | | | $‘000 | | | $‘000 | |
Indigenous Rangers | | | — | | | | 1,400 | | | | 1,928 | | | | 1,966 | | | | 2,006 | |
The Government is providing additional funding of $7.3 million over four years to provide continued employment of Indigenous rangers to work across the protected area estate to ensure that parks are adequately managed and maintained, including protection from the threats of fire, pest and weed infestation and ensuring sustainable visitor access outcomes.
52
Budget Measures 2015-16
Department of Natural Resources and Mines
| | | | | | | | | | | | | | | | | | | | |
| | | 2014-15 | | | 2015-16 | | | 2016-17 | | | 2017-18 | | | 2018-19 | |
| | | $‘000 | | | $‘000 | | | $‘000 | | | $‘000 | | | $‘000 | |
Great Artesian Basin Sustainability Initiative | | | — | | | | 8,000 | | | | 3,550 | | | | — | | | | — | |
The Government is providing additional funding of $5.8 million over two years for the Great Artesian Basin Sustainability Initiative Phase 4, matching the Australian Government contribution of $5.8 million. This measure will assist landholders to rehabilitate uncontrolled flowing bores and to replace open bore drains with piped water reticulation systems.
| | | | | | | | | | | | | | | | | | | | |
| | | 2014-15 | | | 2015-16 | | | 2016-17 | | | 2017-18 | | | 2018-19 | |
| | | $‘000 | | | $‘000 | | | $‘000 | | | $‘000 | | | $‘000 | |
Abandoned Mines Land Program | | | — | | | | 6,200 | | | | — | | | | — | | | | — | |
The Government is providing funding of $6.2 million in 2015-16 for the Abandoned Mines Land Program to manage the public safety risks associated with abandoned mine sites across Queensland.
| | | | | | | | | | | | | | | | | | | | |
| | | 2014-15 | | | 2015-16 | | | 2016-17 | | | 2017-18 | | | 2018-19 | |
| | | $‘000 | | | $‘000 | | | $‘000 | | | $‘000 | | | $‘000 | |
Coal Seam Gas Compliance Unit | | | — | | | | 3,577 | | | | — | | | | — | | | | — | |
The Government is providing funding of $3.6 million in 2015-16 for the regulation and administration of the Coal Seam Gas industry.
53
Budget Measures 2015-16
| | | | | | | | | | | | | | | | | | | | |
| | | 2014-15 | | | 2015-16 | | | 2016-17 | | | 2017-18 | | | 2018-19 | |
| | | $‘000 | | | $‘000 | | | $‘000 | | | $‘000 | | | $‘000 | |
Additional Native Title Trial Costs | | | 2,200 | | | | 2,200 | | | | 2,200 | | | | 2,200 | | | | 2,200 | |
The Government is providing increased funding of $2.2 million per annum to address immediate Native Title claims trial costs. This is in response to the Federal Court aiming to resolve all existing native title claims within 10 years from 1 January 2011 and to dispose of all new applications made after that date within five years of lodgement.
| | | | | | | | | | | | | | | | | | | | |
| | | 2014-15 | | | 2015-16 | | | 2016-17 | | | 2017-18 | | | 2018-19 | |
| | | $‘000 | | | $‘000 | | | $‘000 | | | $‘000 | | | $‘000 | |
North Stradbroke Island Indigenous Land Use Agreement | | | — | | | | 840 | | | | 840 | | | | — | | | | — | |
The Government is providing additional funding of $840,000 per annum over two years to meet its commitments under the North Stradbroke Island Indigenous Land Use Agreement.
54
Budget Measures 2015-16
Department of Science, Information Technology and Innovation
| | | | | | | | | | | | | | | | | | | | |
| | | 2014-15 | | | 2015-16 | | | 2016-17 | | | 2017-18 | | | 2018-19 | |
| | | $‘000 | | | $‘000 | | | $‘000 | | | $‘000 | | | $‘000 | |
Advance Queensland | | | — | | | | 37,062 | | | | 38,082 | | | | 38,112 | | | | 22,547 | |
The Government is providing additional funding of $140 million over four years to stimulate the growth of new cutting edge companies, take advantage of our excellent research facilities, attract and retain the brightest minds and take advantage of scientific and technological developments.
This includes $45.6 million for the Government’s Advance Queensland election commitment (with an additional $4.6 million for this initiative being held in contingency by Queensland Treasury), and a further $90.2 million for a suite of programs to drive industry research collaboration and commercialisation of new ideas and to create an environment which boosts entrepreneurship.
This initiative will help create high-tech jobs by encouraging partnerships between researchers and industry. It will turn ideas, discovery and innovation into economic activity.
This funding forms part of the Government’s $180 million Advance Queensland investment in innovation, skills, education, business development and a start-up culture to deliver knowledge-based jobs now and into the future. Further funding can be found in the Queensland Treasury section of Chapter 3 Capital Measures.
55
Budget Measures 2015-16
| | | | | | | | | | | | | | | | | | | | |
| | | 2014-15 | | | 2015-16 | | | 2016-17 | | | 2017-18 | | | 2018-19 | |
| | | $‘000 | | | $‘000 | | | $‘000 | | | $‘000 | | | $‘000 | |
Mobile Black Spot Program | | | — | | | | 5,000 | | | | 5,000 | | | | — | | | | — | |
The Government is providing $10 million over two years for the Mobile Black Spot Program which has been able to leverage a total package of $53.9 million for Queensland with 68 new or upgraded towers to be built.
56
Budget Measures 2015-16
Department of State Development
| | | | | | | | | | | | | | | | | | | | |
| | | 2014-15 | | | 2015-16 | | | 2016-17 | | | 2017-18 | | | 2018-19 | |
| | | $‘000 | | | $‘000 | | | $‘000 | | | $‘000 | | | $‘000 | |
Building Our Regions | | | — | | | | 70,000 | | | | 70,000 | | | | — | | | | — | |
In keeping with its election commitment, the Government is providing the Department of State Development with additional funding of $140 million over two years for the Building Our Regions - Regional Infrastructure Fund for critical infrastructure in regional Queensland. Funding will be targeted to meet the specific needs of communities and support economic development. Total funding for the Building Our Regions - Regional Infrastructure Fund is $200 million. $100 million of this funding has been brought forward to 2015-16 in recognition of the need to invest in regional Queensland. Further funding can be found in the Department of Transport and Main Roads section of this Chapter.
| | | | | | | | | | | | | | | | | | | | |
| | | 2014-15 | | | 2015-16 | | | 2016-17 | | | 2017-18 | | | 2018-19 | |
| | | $‘000 | | | $‘000 | | | $‘000 | | | $‘000 | | | $‘000 | |
Townsville Stadium | | | — | | | | 5,000 | | | | — | | | | — | | | | — | |
In keeping with its election commitment, the Government is providing additional funding of $5 million in 2015-16 for the development of a business plan and master plan for a sports centre in Townsville. The capital component of this $100 million measure can be found in Chapter 3 Capital Measures.
57
Budget Measures 2015-16
| | | | | | | | | | | | | | | | | | | | |
| | | 2014-15 | | | 2015-16 | | | 2016-17 | | | 2017-18 | | | 2018-19 | |
| | | $‘000 | | | $‘000 | | | $‘000 | | | $‘000 | | | $‘000 | |
North Stradbroke Island Economic Transition Strategy | | | — | | | | 500 | | | | 2,000 | | | | 7,500 | | | | 7,500 | |
In keeping with its election commitment, the Government is providing additional funding of $20 million over five years from 2015-16, including $2.5 million in 2019-20, to develop the North Stradbroke Island Economic Transition Strategy. The Strategy will address the impacts of the cessation of sand mining on North Stradbroke Island in 2019.
| | | | | | | | | | | | | | | | | | | | |
| | | 2014-15 | | | 2015-16 | | | 2016-17 | | | 2017-18 | | | 2018-19 | |
| | | $‘000 | | | $‘000 | | | $‘000 | | | $‘000 | | | $‘000 | |
Port Dredging - Cairns Shipping Development Project | | | (1,500 | ) | | | (21,000 | ) | | | (10,000 | ) | | | — | | | | — | |
As part of the Government’s strategy to fund its election commitments, the Government is ceasing the Cairns Shipping Development Project, generating savings of $32.5 million.
| | | | | | | | | | | | | | | | | | | | |
| | | 2014-15 | | | 2015-16 | | | 2016-17 | | | 2017-18 | | | 2018-19 | |
| | | $‘000 | | | $‘000 | | | $‘000 | | | $‘000 | | | $‘000 | |
Royalties for Regions - unallocated | | | — | | | | (24,100 | ) | | | — | | | | — | | | | — | |
The Government is reallocating $24.1 million in unallocated funds from Round 4 of the Royalties for the Regions program to regional transport initiatives.
58
Budget Measures 2015-16
Department of the Premier and Cabinet
| | | | | | | | | | | | | | | | | | | | |
| | | 2014-15 | | | 2015-16 | | | 2016-17 | | | 2017-18 | | | 2018-19 | |
| | | $‘000 | | | $‘000 | | | $‘000 | | | $‘000 | | | $‘000 | |
Restoration of Arts Grant Funding | | | — | | | | 5,000 | | | | 5,000 | | | | 5,000 | | | | 5,000 | |
The Government is providing increased funding of $5 million per annum to the arts grant funding pool. This will see the continuation of the Visual Arts and Crafts Strategy and Backing Indigenous Arts program, additional funding to grants programs reduced by the former Government and funding for Queensland Art Gallery exhibitions.
| | | | | | | | | | | | | | | | | | | | |
| | | 2014-15 | | | 2015-16 | | | 2016-17 | | | 2017-18 | | | 2018-19 | |
| | | $‘000 | | | $‘000 | | | $‘000 | | | $‘000 | | | $‘000 | |
Queensland Commission of Inquiry - Barrett Adolescent Centre | | | — | | | | 4,500 | | | | — | | | | — | | | | — | |
The Government is providing additional funding of up to $4.5 million in 2015-16 to meet the cost of the State’s legal representation before the Queensland Commission of Inquiry into the Barrett Adolescent Centre. This is a 2015 Government election commitment which will consider the decisions and circumstances surrounding the closure of the Barrett Adolescent Centre at Wacol. Any remaining funding from this allocation will be reallocated to providing a new acute inpatient adolescent service for South East Queensland to replace the Barrett Centre. The separate costs associated with running the Commission will be met within current Queensland Health resourcing.
59
Budget Measures 2015-16
| | | | | | | | | | | | | | | | | | | | |
| | | 2014-15
$‘000 | | | 2015-16
$‘000 | | | 2016-17
$‘000 | | | 2017-18
$‘000 | | | 2018-19
$‘000 | |
Implementation of high priority recommendations of the Domestic and Family Violence Taskforce | | | — | | | | 3,000 | | | | — | | | | — | | | | — | |
Funding of $3.3 million in 2015-16 has been provided to implement high priority recommendations of the Domestic and Family Violence Taskforce Report. This is comprised of additional funding of $3 million for Queensland’s contribution to a national communication campaign to reduce violence against women and their children and reprioritised funding of $327,000 for a six month trial of a specialist domestic and family violence Magistrate.
Total funding of $31.3 million over four years from 2015-16 has been provided across agencies as an initial response by Government to implement high priority recommendations of the Domestic and Family Violence Taskforce Report. This includes $5.2 million in new funding and $26.1 million from internal reallocation. Further details of this funding can be found in the Department of Communities, Child Safety and Disability Services, Department of Housing and Public Works, Department of Justice and Attorney-General and Department of Aboriginal and Torres Strait Islander Partnership sections of this chapter, and the Department of Communities, Child Safety and Disability Services section of Chapter 3 Capital Measures. The Government will soon release its response to all 140 recommendations in the Report, which will underpin the development of a Queensland Domestic and Family Violence Prevention Strategy.
| | | | | | | | | | | | | | | | | | | | |
| | | 2014-15
$‘000 | | | 2015-16
$‘000 | | | 2016-17
$‘000 | | | 2017-18
$‘000 | | | 2018-19
$‘000 | |
Cultural Precinct Critical Infrastructure | | | — | | | | 2,000 | | | | 2,000 | | | | 2,000 | | | | 2,000 | |
The Government is providing additional funding of $8 million over four years to facilitate additional capital maintenance at the Cultural Precinct in South Brisbane. This measure will address a backlog of maintenance works associated with infrastructure and assets at the Cultural Precinct which are reaching or are beyond their designed useful life. This funding is part of a $28 million package which includes $20 million in additional capital for cultural precinct critical infrastructure. Further details on this funding can be found in Chapter 3 Capital Measures.
60
Budget Measures 2015-16
| | | | | | | | | | | | | | | | | | | | |
| | | 2014-15
$‘000 | | | 2015-16
$‘000 | | | 2016-17
$‘000 | | | 2017-18
$‘000 | | | 2018-19
$‘000 | |
Stronger Families Reforms | | | — | | | | 500 | | | | — | | | | — | | | | — | |
The Government is providing additional funding of $500,000 in 2015-16 for the collaborative development of a comprehensive workforce development strategy for the child protection and family support systems and a capacity-building strategy for non-government organisations. Capable non-government organisations and a skilled workforce are essential to delivering the significant level of transformation required within the Stronger Families reform program.
| | | | | | | | | | | | | | | | | | | | |
| | | 2014-15
$‘000 | | | 2015-16
$‘000 | | | 2016-17
$‘000 | | | 2017-18
$‘000 | | | 2018-19
$‘000 | |
Alcohol Fuelled Violence | | | — | | | | 155 | | | | 155 | | | | 155 | | | | — | |
The Government is providing additional funding of $465,000 over three years as part of a whole of government approach to tackle alcohol fuelled violence. Through this funding, the department will work with Queensland Health to educate the community, particularly young people, about safe drinking practices and the dangers of binge drinking and excessive alcohol consumption.
| | | | | | | | | | | | | | | | | | | | |
| | | 2014-15
$‘000 | | | 2015-16
$‘000 | | | 2016-17
$‘000 | | | 2017-18
$‘000 | | | 2018-19
$‘000 | |
Community Services Directory | | | — | | | | 125 | | | | 250 | | | | 250 | | | | 250 | |
The Government is providing additional funding of $125,000 in 2015-16 and $250,000 per annum from 2016-17 to maintain a Community Services Directory. This online directory lists universal, early intervention and preventitive community services available to families and children in Queensland. It will provide professionals within the social services sector and Queensland community members easy access to comprehensive information about available services. It also assists Government to map services in Queensland for referral and planning activities.
61
Budget Measures 2015-16
| | | | | | | | | | | | | | | | | | | | |
| | | 2014-15
$‘000 | | | 2015-16
$‘000 | | | 2016-17
$‘000 | | | 2017-18
$‘000 | | | 2018-19
$‘000 | |
Counter Extremism Strategy | | | — | | | | — | | | | — | | | | — | | | | — | |
The Government will provide $5 million over three years for a taskforce to counter violent extremism in Queensland, to be funded internally by the department. The taskforce will deliver a co-ordinated whole of government approach to build social cohesion and religious tolerance in schools and the community to prevent extremism. Young people at risk will be mentored and set on the right path through training and employment programs.
| | | | | | | | | | | | | | | | | | | | |
| | | 2014-15
$‘000 | | | 2015-16
$‘000 | | | 2016-17
$‘000 | | | 2017-18
$‘000 | | | 2018-19
$‘000 | |
Safe Night Out Strategy | | | — | | | | (465 | ) | | | — | | | | — | | | | — | |
As part of the Government’s strategy to fund its election commitments, the Government has reprioritised funding of $465,000 from the Safe Night Out Strategy toward its strategy to tackle alcohol fuelled violence.
| | | | | | | | | | | | | | | | | | | | |
| | | 2014-15
$‘000 | | | 2015-16
$‘000 | | | 2016-17
$‘000 | | | 2017-18
$‘000 | | | 2018-19
$‘000 | |
Reduction in the Number of Ministers | | | — | | | | (7,100 | ) | | | (7,100 | ) | | | (7,100 | ) | | | (7,100 | ) |
As part of the Government’s strategy to fund its election commitments, the Government delivered annual savings associated with the reduction in the number of Ministers and Ministerial offices.
In addition, $1.9 million in savings is derived from the Legislative Assembly as a result of the reduction in Ministers, bringing the total savings to $9 million per annum.
62
Budget Measures 2015-16
| | | | | | | | | | | | | | | | | | | | |
| | | 2014-15
$‘000 | | | 2015-16
$‘000 | | | 2016-17
$‘000 | | | 2017-18
$‘000 | | | 2018-19
$‘000 | |
Public Sector Renewal Program | | | — | | | | (7,590 | ) | | | (4,550 | ) | | | (1,000 | ) | | | — | |
As part of the Government’s strategy to fund its election commitments, the Government is decreasing funding of $13.1 million for Public Sector Renewal Programs. Of this, $4.2 million has been reallocated to a new community and people focused program, First Project (Community Insights) within the Public Service Commission. The project is designed to improve services across the public sector. The project team will work with the public and government departments to drive process redesign, efficiencies and advance the use of technology solutions for improved access to government services.
63
Budget Measures 2015-16
Department of Tourism, Major Events, Small Business and the Commonwealth Games
| | | | | | | | | | | | | | | | | | | | |
| | | 2014-15
$‘000 | | | 2015-16
$‘000 | | | 2016-17
$‘000 | | | 2017-18
$‘000 | | | 2018-19
$‘000 | |
Tourism and Events Queensland Restoration of Funding | | | — | | | | 24,567 | | | | 31,454 | | | | 37,614 | | | | 34,707 | |
The Government is providing increased funding of $128.3 million over four years to restore Tourism and Events Queensland’s funding to allow it to continue to carry out its core functions including promoting Queensland destinations and driving tourism growth.
| | | | | | | | | | | | | | | | | | | | |
| | | 2014-15
$‘000 | | | 2015-16
$‘000 | | | 2016-17
$‘000 | | | 2017-18
$‘000 | | | 2018-19
$‘000 | |
Grow and Promote Events for Queensland | | | — | | | | 10,000 | | | | 10,000 | | | | 10,000 | | | | 10,000 | |
The Government is providing increased funding of $40 million over four years in keeping with the election commitment to assist Tourism and Events Queensland to grow and promote events for Queensland. The increased funding will provide an environment that allows new and exciting events to become established and expands tourism product offerings.
| | | | | | | | | | | | | | | | | | | | |
| | | 2014-15
$‘000 | | | 2015-16
$‘000 | | | 2016-17
$‘000 | | | 2017-18
$‘000 | | | 2018-19
$‘000 | |
Business and Industry Portal | | | — | | | | 4,696 | | | | — | | | | — | | | | — | |
The Government is providing additional funding of $4.7 million in 2015-16 to continue enhancing and transforming how the Queensland Government delivers online services and to make it easier for business and industry customers to interact with Government.
64
Budget Measures 2015-16
| | | | | | | | | | | | | | | | | | | | |
| | | 2014-15
$‘000 | | | 2015-16
$‘000 | | | 2016-17
$‘000 | | | 2017-18
$‘000 | | | 2018-19
$‘000 | |
Attracting Aviation Boost | | | — | | | | 3,300 | | | | 3,300 | | | | 3,400 | | | | — | |
The Government is providing increased funding of $10 million over three years as ongoing support for the Attracting Aviation Investment Fund (AAIF) in keeping with the election commitment to promote Queensland destinations to international source markets. The AAIF is provided to boost the tourism industry by attracting more international aviation routes or capacity, and more international visitors to Queensland.
| | | | | | | | | | | | | | | | | | | | |
| | | 2014-15
$‘000 | | | 2015-16
$‘000 | | | 2016-17
$‘000 | | | 2017-18
$‘000 | | | 2018-19
$‘000 | |
Queensland Entrepreneurs of Tomorrow Program | | | — | | | | 660 | | | | 660 | | | | 660 | | | | — | |
The Government is providing additional funding of $2 million over three years for the Queensland Entrepreneurs of Tomorrow Program in keeping with the election commitment. The program comprises two sub-programs. The Schools Program will support entrepreneurship through school education in computational science and business development. The Home Based Business Program will support stay-at-home parents who want to establish and develop home-based businesses, while maintaining a healthy balance between work and family.
65
Budget Measures 2015-16
Department of Transport and Main Roads
| | | | | | | | | | | | | | | | | | | | |
| | | 2014-15
$‘000 | | | 2015-16
$‘000 | | | 2016-17
$‘000 | | | 2017-18
$‘000 | | | 2018-19
$‘000 | |
Building our Regions | | | — | | | | 30,000 | | | | 30,000 | | | | — | | | | — | |
The Government will provide additional funding of $60 million over two years for the Transport Infrastructure Development Scheme. This election commitment for Building Our Regions provides targeted investment in local government transport infrastructure. Further funding can be found in the Department of State Development section of this Chapter.
| | | | | | | | | | | | | | | | | | | | |
| | | 2014-15
$‘000 | | | 2015-16
$‘000 | | | 2016-17
$‘000 | | | 2017-18
$‘000 | | | 2018-19
$‘000 | |
Road Safety - Enhancements (CDOP) | | | — | | | | 6,457 | | | | 15,909 | | | | 16,835 | | | | 15,304 | |
The Government is providing total funding of $74.9 million over four years to be allocated from revenues received from the Camera Detected Offence Program towards road safety, trauma recovery, rehabilitation services and the administration costs associated with infringements. The department will receive $54.5 million over four years from these revenues for road safety education and awareness programs, road accident injury rehabilitation programs, and to improve the safety of the sections of state-controlled roads where accidents frequently happen. Further funding can be found in the Queensland Police Service and Queensland Treasury sections of this chapter. The capital component of this measure can be found in the Queensland Police Service and Department of Transport and Main Roads sections of Chapter 3 Capital Measures.
66
Budget Measures 2015-16
| | | | | | | | | | | | | | | | | | | | |
| | | 2014-15
$‘000 | | | 2015-16
$‘000 | | | 2016-17
$‘000 | | | 2017-18
$‘000 | | | 2018-19
$‘000 | |
Local Fare Scheme For Cape York and Torres Strait Air Services | | | — | | | | 5,600 | | | | — | | | | — | | | | — | |
As per the election commitment, the Government is providing funding of $5.6 million in 2015-16 to improve access to critical services in Cape York, Torres Strait and Gulf regions. A local fare scheme for residents will assist with affordability of air travel in these regional and remote low socio-economic communities.
| | | | | | | | | | | | | | | | | | | | |
| | | 2014-15
$‘000 | | | 2015-16
$‘000 | | | 2016-17
$‘000 | | | 2017-18
$‘000 | | | 2018-19
$‘000 | |
Continuation of Public Transport Concessions For Interstate Seniors Card Holders | | | — | | | | 3,809 | | | | 3,818 | | | | 3,828 | | | | 3,837 | |
The Government will provide $15.3 million over four years to support the provision of public transport concessions to out-of-state Seniors Card holders on the same basis as they are provided to resident Seniors Card holders.
| | | | | | | | | | | | | | | | | | | | |
| | | 2014-15
$‘000 | | | 2015-16
$‘000 | | | 2016-17
$‘000 | | | 2017-18
$‘000 | | | 2018-19
$‘000 | |
Extension of the Marine Infrastructure Fund | | | — | | | | 2,000 | | | | — | | | | — | | | | — | |
As per the election commitment, the Government is providing $2 million in 2015-16 to complete a $3 million upgrade to the Whitsunday Regional Council-owned boat ramp at Whisper Bay, Cannonvale. The capital component of this initiative can be found in Chapter 3 Capital Measures.
67
Budget Measures 2015-16
| | | | | | | | | | | | | | | | | | | | |
| | | 2014-15
$‘000 | | | 2015-16
$‘000 | | | 2016-17
$‘000 | | | 2017-18
$‘000 | | | 2018-19
$‘000 | |
Gold Coast Waterways Authority | | | — | | | | 727 | | | | — | | | | — | | | | — | |
The Government is providing additional funding of $727,000 in 2015-16 so that the Gold Coast Waterways Authority can fully deliver the proposed capital and operational works programs.
68
Budget Measures 2015-16
Electoral Commission of Queensland
| | | | | | | | | | | | | | | | | | | | |
| | | 2014-15
$‘000 | | | 2015-16
$‘000 | | | 2016-17
$‘000 | | | 2017-18
$‘000 | | | 2018-19
$‘000 | |
SEMS Replacement Project | | | — | | | | 900 | | | | 900 | | | | 900 | | | | — | |
The Government is providing additional funding of $2.7 million ($900,000 per annum) over three years to replace the Strategic Elections Management System (SEMS). SEMS is the primary operating system fundamental to electoral administration in Queensland. An additional $1.4 million has been reallocated internally by the Commission towards the replacement system. The capital component of this measure can be found in Chapter 3 Capital Measures.
69
Budget Measures 2015-16
Legislative Assembly of Queensland
| | | | | | | | | | | | | | | | | | | | |
| | | 2014-15
$‘000 | | | 2015-16
$‘000 | | | 2016-17
$‘000 | | | 2017-18
$‘000 | | | 2018-19
$‘000 | |
Salaries for Office Holders of 55th Parliament | | | 253 | | | | 786 | | | | 786 | | | | 786 | | | | 786 | |
The Government is providing additional funding of $253,000 in 2014-15 and recurrent funding of $786,000 per annum from 2015-16 to meet additional office holder salary costs for Members of the Legislative Assembly.
| | | | | | | | | | | | | | | | | | | | |
| | | 2014-15
$‘000 | | | 2015-16
$‘000 | | | 2016-17
$‘000 | | | 2017-18
$‘000 | | | 2018-19
$‘000 | |
Resourcing for independent and minor party Members | | | 115 | | | | 612 | | | | 612 | | | | 612 | | | | 612 | |
The Government is providing additional funding of $115,000 in 2014-15 and recurrent funding of $612,000 per annum from 2015-16 to provide additional resources to independent and minor party Members.
| | | | | | | | | | | | | | | | | | | | |
| | | 2014-15
$‘000 | | | 2015-16
$‘000 | | | 2016-17
$‘000 | | | 2017-18
$‘000 | | | 2018-19
$‘000 | |
Resourcing for an additional portfolio committee | | | — | | | | 120 | | | | 120 | | | | 120 | | | | 120 | |
The Government is providing additional funding of $120,000 per annum to meet costs associated with establishment of an additional portfolio committee for the 55th Parliament.
70
Budget Measures 2015-16
| | | | | | | | | | | | | | | | | | | | |
| | | 2014-15 | | | 2015-16 | | | 2016-17 | | | 2017-18 | | | 2018-19 | |
| | | $‘000 | | | $‘000 | | | $‘000 | | | $‘000 | | | $‘000 | |
Electorate office staff training program | | | — | | | | 75 | | | | 75 | | | | 75 | | | | 75 | |
The Government is providing increased funding of $75,000 per annum to deliver training programs to electorate office staff across the State.
| | | | | | | | | | | | | | | | | | | | |
| | | 2014-15 | | | 2015-16 | | | 2016-17 | | | 2017-18 | | | 2018-19 | |
| | | $‘000 | | | $‘000 | | | $‘000 | | | $‘000 | | | $‘000 | |
Electorate Officer severance payments | | | 1,404 | | | | — | | | | — | | | | — | | | | — | |
The Government has provided additional funding of $1.4 million in 2014-15 to meet costs associated with severance payments made to electorate office staff terminated as a result of the January 2015 State election.
| | | | | | | | | | | | | | | | | | | | |
| | | 2014-15 | | | 2015-16 | | | 2016-17 | | | 2017-18 | | | 2018-19 | |
| | | $‘000 | | | $‘000 | | | $‘000 | | | $‘000 | | | $‘000 | |
Electorate office leasing costs | | | 342 | | | | — | | | | — | | | | — | | | | — | |
The Government has provided increased funding of $342,000 in 2014-15 to address increases in leasing costs associated with Members’ electorate offices.
| | | | | | | | | | | | | | | | | | | | |
| | | 2014-15 | | | 2015-16 | | | 2016-17 | | | 2017-18 | | | 2018-19 | |
| | | $‘000 | | | $‘000 | | | $‘000 | | | $‘000 | | | $‘000 | |
Electorate office transition costs | | | 180 | | | | — | | | | — | | | | — | | | | — | |
The Government has provided additional funding of $180,000 in 2014-15 to meet electorate office transition costs associated with the January 2015 State election, including changes to signage, cleaning and changes to locks and security codes.
71
Budget Measures 2015-16
| | | | | | | | | | | | | | | | | | | | |
| | | 2014-15 | | | 2015-16 | | | 2016-17 | | | 2017-18 | | | 2018-19 | |
| | | $‘000 | | | $‘000 | | | $‘000 | | | $‘000 | | | $‘000 | |
Members’ Transition Allowance | | | 1,483 | | | | — | | | | — | | | | — | | | | — | |
The Government has provided additional funding of $1.5 million in 2014-15 to meet costs associated with Transition Allowance payments made to Members retiring involuntarily from the Parliament as a result of the January 2015 State election.
| | | | | | | | | | | | | | | | | | | | |
| | | 2014-15 | | | 2015-16 | | | 2016-17 | | | 2017-18 | | | 2018-19 | |
| | | $‘000 | | | $‘000 | | | $‘000 | | | $‘000 | | | $‘000 | |
Savings from reduction in the number of Ministers and Assistant Ministers | | | (701 | ) | | | (1,909 | ) | | | (1,909 | ) | | | (1,909 | ) | | | (1,909 | ) |
As part of the Government’s commitment to save $27 million over the term of the current Parliament, the Premier announced a reduction in the number of Ministers and Assistant Ministers. As a result, Legislative Assembly of Queensland has delivered savings of $701,000 in 2014-15 and recurrent savings of $1.9 million per annum from 2015-16. This forms part of the Government’s strategy to fund its election commitments.
72
Budget Measures 2015-16
Public Safety Business Agency
| | | | | | | | | | | | | | | | | | | | |
| | | 2014-15 | | | 2015-16 | | | 2016-17 | | | 2017-18 | | | 2018-19 | |
| | | $‘000 | | | $‘000 | | | $‘000 | | | $‘000 | | | $‘000 | |
Body Worn Video Cameras for Police | | | — | | | | 4,000 | | | | 1,000 | | | | 1,030 | | | | — | |
In keeping with the election commitment, the Government is providing additional funding of $6 million over three years for improved safety equipment for police, including body-worn cameras.
| | | | | | | | | | | | | | | | | | | | |
| | | 2014-15 | | | 2015-16 | | | 2016-17 | | | 2017-18 | | | 2018-19 | |
| | | $‘000 | | | $‘000 | | | $‘000 | | | $‘000 | | | $‘000 | |
Blue Card Efficiency Savings | | | (1,316 | ) | | | 2,500 | | | | — | | | | — | | | | — | |
As part of the commitment to protecting jobs, and maintaining the integrity of the Blue Card System, the Government has delivered savings of $1.3 million in 2014-15 from ceasing the former Government’s Blue Card Review and has reversed the $2.5 million efficiency dividend that was to be sought from Blue Card Services in 2015-16. The removal of the $2.5 million efficiency dividend from the forward estimates in 2015-16 will enable Blue Card Services to retain current staffing levels.
| | | | | | | | | | | | | | | | | | | | |
| | | 2014-15 | | | 2015-16 | | | 2016-17 | | | 2017-18 | | | 2018-19 | |
| | | $‘000 | | | $‘000 | | | $‘000 | | | $‘000 | | | $‘000 | |
Independent Body to Publish Crime Statistics | | | — | | | | — | | | | — | | | | — | | | | — | |
In keeping with the election commitment, the Government is providing additional funding of $3.1 million over three years for an independent body to publish crime statistics for all criminal offending across Queensland. This funding is to be held in a contingency pending finalisation on the details of this body, expected by the end of 2015.
73
Budget Measures 2015-16
| | | | | | | | | | | | | | | | | | | | |
| | | 2014-15 | | | 2015-16 | | | 2016-17 | | | 2017-18 | | | 2018-19 | |
| | | $‘000 | | | $‘000 | | | $‘000 | | | $‘000 | | | $‘000 | |
Regional College of Disaster Management Program | | | (1,100 | ) | | | — | | | | (3,750 | ) | | | — | | | | — | |
The Government has delivered savings of $1.1 million in 2014-15 and will deliver savings of $3.8 million in 2016-17 by completing the contract for the Regional College of Disaster Management Program within its current scheduled timeframe. The program is delivered through the Australian Emergency Management Institute.
74
Budget Measures 2015-16
Public Service Commission
| | | | | | | | | | | | | | | | | | | | |
| | | 2014-15 | | | 2015-16 | | | 2016-17 | | | 2017-18 | | | 2018-19 | |
| | | $‘000 | | | $‘000 | | | $‘000 | | | $‘000 | | | $‘000 | |
First Project | | | — | | | | 4,240 | | | | — | | | | — | | | | — | |
The Government has reallocated funding of $4.2 million from the previous Public Sector Renewal budget to a new community and people focused program, First Project. This is a limited-life project funded for 2015-16.
The project is designed to improve services across the public sector. The project team will work with the public and government departments to drive process redesign, efficiencies and advance the use of technology solutions for improved access to government services.
| | | | | | | | | | | | | | | | | | | | |
| | | 2014-15 | | | 2015-16 | | | 2016-17 | | | 2017-18 | | | 2018-19 | |
| | | $‘000 | | | $‘000 | | | $‘000 | | | $‘000 | | | $‘000 | |
Public Sector Initiatives Savings | | | — | | | | (1,500 | ) | | | (1,500 | ) | | | (1,500 | ) | | | (1,500 | ) |
As part of the Government’s strategy to fund its election commitments, the Public Service Commission will be delivering savings of $6 million over four years.
75
Budget Measures 2015-16
Queensland Health
| | | | | | | | | | | | | | | | | | | | |
| | | 2014-15 | | | 2015-16 | | | 2016-17 | | | 2017-18 | | | 2018-19 | |
| | | $‘000 | | | $‘000 | | | $‘000 | | | $‘000 | | | $‘000 | |
New Growth Funding | | | — | | | | 202,060 | | | | 426,919 | | | | 719,279 | | | | 954,173 | |
The Government is providing increased funding of $2.302 billion over four years to support the ongoing growth in demand for health and ambulance services. The funding is based on growth in activity of four per cent per year for clinical services and cost growth in line with the projected Consumer Price Index (CPI).
| | | | | | | | | | | | | | | | | | | | |
| | | 2014-15 | | | 2015-16 | | | 2016-17 | | | 2017-18 | | | 2018-19 | |
| | | $‘000 | | | $‘000 | | | $‘000 | | | $‘000 | | | $‘000 | |
Outpatient Long Wait Reduction Strategy | | | — | | | | 71,330 | | | | 114,210 | | | | 126,530 | | | | 49,170 | |
The Government is providing additional funding of $361.2 million over four years to reduce the number of people waiting longer than clinically recommended for a specialist outpatient appointment.
This funding is in addition to internally funded initiatives totalling $60 million that were announced on 10 March 2015 and 4 May 2015 to reduce the number of outpatient long waits.
| | | | | | | | | | | | | | | | | | | | |
| | | 2014-15 | | | 2015-16 | | | 2016-17 | | | 2017-18 | | | 2018-19 | |
| | | $‘000 | | | $‘000 | | | $‘000 | | | $‘000 | | | $‘000 | |
Sunshine Coast Public University Hospital Transition Program | | | — | | | | 47,150 | | | | 106,410 | | | | 36,160 | | | | 3,800 | |
The Government is providing additional funding of $193.5 million over four years for the safe start-up of the new Sunshine Coast Public University Hospital which will require reconfigured services across the Hospital and Health Service. This funding will also support the agreed service models for pathology and radiation oncology clinical services as well as soft facilities management and medical school placements.
76
Budget Measures 2015-16
| | | | | | | | | | | | | | | | | | | | |
| | | 2014-15
$‘000 | | | 2015-16
$‘000 | | | 2016-17
$‘000 | | | 2017-18
$‘000 | | | 2018-19
$‘000 | |
Refresh Nursing: Graduate Program | | | — | | | | 26,611 | | | | 27,303 | | | | 28,013 | | | | 28,741 | |
The Government is providing additional funding of $110.7 million over four years in addition to internal funding to deliver on its election commitment to support up to 4,000 new one year graduate nursing places in our Hospital and Health Services.
| | | | | | | | | | | | | | | | | | | | |
| | | 2014-15
$‘000 | | | 2015-16
$‘000 | | | 2016-17
$‘000 | | | 2017-18
$‘000 | | | 2018-19
$‘000 | |
Nursing Guarantee: 400 Additional Nurses | | | — | | | | 9,339 | | | | 28,946 | | | | 46,830 | | | | 16,480 | |
The Government is providing additional funding of $101.6 million over four years in addition to internal funding to deliver on its election commitment to support 400 Nurse Navigator positions in Hospital and Health Services across Queensland. These positions will work with patients, assisting them to navigate across the health system.
| | | | | | | | | | | | | | | | | | | | |
| | | 2014-15
$‘000 | | | 2015-16
$‘000 | | | 2016-17
$‘000 | | | 2017-18
$‘000 | | | 2018-19
$‘000 | |
Herston Quarter Redevelopment Project | | | — | | | | 5,700 | | | | — | | | | — | | | | — | |
The Government is providing additional funding of $5.7 million in 2015-16 for procurement activities relating to the Herston Quarter Redevelopment Project. This precinct will potentially incorporate bio-medical research, health and hospital services and other residential, retail and commercial opportunities.
77
Budget Measures 2015-16
| | | | | | | | | | | | | | | | | | | | |
| | | 2014-15
$‘000 | | | 2015-16
$‘000 | | | 2016-17
$‘000 | | | 2017-18
$‘000 | | | 2018-19
$‘000 | |
Action for a Healthier Queensland: Biala Sexual Health Clinic | | | — | | | | 3,369 | | | | 3,138 | | | | 3,317 | | | | 3,417 | |
The Government is providing additional funding of $13.2 million over four years with an ongoing allocation of $3.4 million per annum thereafter to deliver on its election commitment to reinvigorate public sexual health services at the Biala Sexual Health Clinic on Roma Street, Brisbane and in other locations to provide a range of testing, counselling and information services.
| | | | | | | | | | | | | | | | | | | | |
| | | 2014-15
$‘000 | | | 2015-16
$‘000 | | | 2016-17
$‘000 | | | 2017-18
$‘000 | | | 2018-19
$‘000 | |
Rebuilding Intensive Mental Health Care for Young People: Townsville | | | — | | | | 2,772 | | | | 2,883 | | | | 2,998 | | | | 3,120 | |
The Government is providing increased funding of $11.8 million over four years to deliver on the first stage of its election commitment to rebuild intensive mental health care for young people by providing expanded youth residential mental health and family services in Townsville.
| | | | | | | | | | | | | | | | | | | | |
| | | 2014-15
$‘000 | | | 2015-16
$‘000 | | | 2016-17
$‘000 | | | 2017-18
$‘000 | | | 2018-19
$‘000 | |
Action for a Healthier Queensland: School Aged Nursing Service | | | — | | | | 2,695 | | | | 2,811 | | | | 2,872 | | | | 3,035 | |
The Government is providing increased funding of $11.4 million over four years with an ongoing allocation of $3 million per annum thereafter to deliver on its election commitment to re-establish and expand the School Aged Nursing Service.
78
Budget Measures 2015-16
| | | | | | | | | | | | | | | | | | | | |
| | | 2014-15
$‘000 | | | 2015-16
$‘000 | | | 2016-17
$‘000 | | | 2017-18
$‘000 | | | 2018-19
$‘000 | |
Social Respite Centres | | | — | | | | 2,250 | | | | 5,890 | | | | 5,970 | | | | 5,890 | |
The Government is providing additional funding of $20 million over four years to deliver on its election commitment to provide grants to community based organisations to provide long day social respite services to elderly people with dementia and other degenerative neurological disorders who are residing in the community.
| | | | | | | | | | | | | | | | | | | | |
| | | 2014-15
$‘000 | | | 2015-16
$‘000 | | | 2016-17
$‘000 | | | 2017-18
$‘000 | | | 2018-19
$‘000 | |
Health for Life! - Taking Action on Diabetes | | | — | | | | 2,000 | | | | 7,000 | | | | 9,000 | | | | 9,240 | |
The Government is providing additional funding of $27.2 million over four years to implement its election commitment Health for Life!, a Type 2 Diabetes prevention program that will target 10,000 Queenslanders at high risk of developing diabetes, and help them make positive changes to their lifestyles.
| | | | | | | | | | | | | | | | | | | | |
| | | 2014-15
$‘000 | | | 2015-16
$‘000 | | | 2016-17
$‘000 | | | 2017-18
$‘000 | | | 2018-19
$‘000 | |
Extending Existing Drought Relief Arrangements | | | — | | | | 1,500 | | | | — | | | | — | | | | — | |
The Government is providing increased funding of $1.5 million in 2015-16 to deliver on its election commitment to continue the existing Drought Assistance package. Funding will continue the delivery of mental health support workshops and interventions to support individuals and local communities in drought affected areas.
The Drought Assistance package totals $52.1 million over four years across several departments to support drought affected communities across the State. Further funding can be found in the Department of Agriculture and Fisheries, Department of Communities, Child Safety and Disability Services, and Department of Energy and Water Supply sections of this chapter and the Department of Natural Resources and Mines section of Chapter 4 Revenue Measures.
79
Budget Measures 2015-16
| | | | | | | | | | | | | | | | | | | | |
| | | 2014-15
$‘000 | | | 2015-16
$‘000 | | | 2016-17
$‘000 | | | 2017-18
$‘000 | | | 2018-19
$‘000 | |
Action for a Healthier Queensland: Go for 2 and 5 Fruit and Vegetable Program | | | — | | | | 1,250 | | | | 1,250 | | | | 1,250 | | | | 1,355 | |
The Government is providing increased funding of $5.1 million over four years with an ongoing allocation of $1.4 million per annum to deliver on its election commitment to update the Go for 2 & 5 Fruit and Vegetable health promotion program. The program promotes the consumption of fruit and vegetables through a variety of communication channels.
| | | | | | | | | | | | | | | | | | | | |
| | | 2014-15
$‘000 | | | 2015-16
$‘000 | | | 2016-17
$‘000 | | | 2017-18
$‘000 | | | 2018-19
$‘000 | |
Action for a Healthier Queensland: Sexual Health Strategy | | | — | | | | 906 | | | | 1,164 | | | | 1,415 | | | | 1,789 | |
The Government is providing additional funding of $5.3 million over four years to deliver on its election commitment to develop and implement a statewide sexual health strategy in partnership with community organisations including community education and clinical services for sexual health and well-being.
| | | | | | | | | | | | | | | | | | | | |
| | | 2014-15
$‘000 | | | 2015-16
$‘000 | | | 2016-17
$‘000 | | | 2017-18
$‘000 | | | 2018-19
$‘000 | |
Health Consumers Queensland Service Agreement | | | — | | | | 800 | | | | 830 | | | | 830 | | | | — | |
The Government is providing additional funding of $2.5 million over three years to deliver on its election commitment to establish a service agreement with Health Consumers Queensland to advocate independently for patients and their families and to empower health consumers in the planning, design, delivery, monitoring and evaluation of Hospital and Health Services.
80
Budget Measures 2015-16
| | | | | | | | | | | | | | | | | | | | |
| | | 2014-15
$‘000 | | | 2015-16
$‘000 | | | 2016-17
$‘000 | | | 2017-18
$‘000 | | | 2018-19
$‘000 | |
Action for a Healthier Queensland: Queensland Health Promotion Commission | | | — | | | | 600 | | | | 2,000 | | | | 2,300 | | | | 2,590 | |
The Government is providing additional funding of $7.5 million over four years with an ongoing allocation of $2.6 million per annum thereafter to deliver on its election commitment to support the establishment of a state-wide Health Promotion Commission. The Health Promotion Commission will provide strategic leadership for whole-of-government initiatives aimed at maintaining and improving the health and wellbeing of Queenslanders by preventing and slowing the increase of chronic illness.
| | | | | | | | | | | | | | | | | | | | |
| | | 2014-15
$‘000 | | | 2015-16
$‘000 | | | 2016-17
$‘000 | | | 2017-18
$‘000 | | | 2018-19
$‘000 | |
Action for a Healthier Queensland: Extend Smoking Bans | | | — | | | | 420 | | | | — | | | | — | | | | — | |
The Government is providing additional funding of $420,000 in 2015-16 to deliver on its election commitment to provide incentives for local governments to create local smoke-free laws and initiate community consultation to assess further strategies to prevent passive smoking.
| | | | | | | | | | | | | | | | | | | | |
| | | 2014-15
$‘000 | | | 2015-16
$‘000 | | | 2016-17
$‘000 | | | 2017-18
$‘000 | | | 2018-19
$‘000 | |
Action for a Healthier Queensland: Fast Food Kilojoule Menu Labelling | | | — | | | | 400 | | | | 125 | | | | — | | | | — | |
The Government is providing additional funding of $525,000 in addition to internal funding of $675,000 over two years to deliver on its election commitment to incorporate education elements into existing Queensland Health campaigns to enable consumers to make informed choices and introduce legislation that requires fast food chains to display the kilojoule content of their food and beverages.
81
Budget Measures 2015-16
| | | | | | | | | | | | | | | | | | | | |
| | | 2014-15
$‘000 | | | 2015-16
$‘000 | | | 2016-17
$‘000 | | | 2017-18
$‘000 | | | 2018-19
$‘000 | |
Action for a Healthier Queensland: Cardiac Rehabilitation and Prevention | | | — | | | | 350 | | | | 275 | | | | 303 | | | | 333 | |
The Government is providing increased funding of $1.3 million over four years with an ongoing allocation of $333,000 per annum thereafter to deliver on its election commitment to address referral rates of patients to cardiac rehabilitation. The program will develop the Heart Foundation’s My Heart My Life education booklet into an electronic patient education resource and will improve cardiac rehabilitation service directory functionality including enhanced linkages with Google Maps.
| | | | | | | | | | | | | | | | | | | | |
| | | 2014-15
$‘000 | | | 2015-16
$‘000 | | | 2016-17
$‘000 | | | 2017-18
$‘000 | | | 2018-19
$‘000 | |
Action for a Healthier Queensland: Walking Groups | | | — | | | | 278 | | | | 278 | | | | 278 | | | | 278 | |
The Government is providing additional funding of $1.1 million over four years with an ongoing allocation of $278,000 per annum thereafter to deliver on its election commitment to assist the Heart Foundation to recruit host organisations, community volunteer walk organisers and walkers into its Walking Program.
| | | | | | | | | | | | | | | | | | | | |
| | | 2014-15
$‘000 | | | 2015-16
$‘000 | | | 2016-17
$‘000 | | | 2017-18
$‘000 | | | 2018-19
$‘000 | |
Security Guards for Townsville Hospital and Health Service | | | — | | | | 130 | | | | 140 | | | | 140 | | | | — | |
The Government is providing additional funding of $410,000 over three years to deliver on its election commitment to increase the out-of-hours security arrangements in Townsville Hospital and Health Service facilities through two additional security guards.
82
Budget Measures 2015-16
| | | | | | | | | | | | | | | | | | | | |
| | | 2014-15
$‘000 | | | 2015-16
$‘000 | | | 2016-17
$‘000 | | | 2017-18
$‘000 | | | 2018-19
$‘000 | |
Action for a Healthier Queensland: 10,000 Steps Program | | | — | | | | — | | | | 280 | | | | — | | | | — | |
The Government is providing additional funding of $280,000 in 2016-17, in addition to internal funding of $560,000 over two years, to deliver on its election commitment to fund the 10,000 Steps Program that encourages Queenslanders to undertake physical activity for their health.
| | | | | | | | | | | | | | | | | | | | |
| | | 2014-15
$‘000 | | | 2015-16
$‘000 | | | 2016-17
$‘000 | | | 2017-18
$‘000 | | | 2018-19
$‘000 | |
Alcohol Fuelled Violence Program | | | — | | | | — | | | | — | | | | — | | | | — | |
The Government has approved $3 million over two years to be reallocated internally by Queensland Health for an education and awareness campaign targeting young male drinkers. This funding is contributing to the whole-of-government commitment to deliver an Alcohol Fuelled Violence Program.
The funding allocated for the Alcohol Fuelled Violence Program is a total of $32.1 million over four years across several departments to address alcohol fuelled violence across the State. Further funding can be found in the Department of Justice and Attorney-General, Department of Communities, Child Safety and Disability Services sections of this chapter.
| | | | | | | | | | | | | | | | | | | | |
| | | 2014-15
$‘000 | | | 2015-16
$‘000 | | | 2016-17
$‘000 | | | 2017-18
$‘000 | | | 2018-19
$‘000 | |
Demonstration Project to Address Service Gaps in Housing and Health Systems | | | — | | | | — | | | | — | | | | — | | | | — | |
The Government has approved funding of $886,000 over two years to be internally reallocated to deliver on their election commitment to support a new demonstration project integrating housing, health and welfare support service responses to address service delivery gaps for social housing tenants experiencing mental illness. Further funding can be found in the Department of Housing and Public Works section of this chapter.
83
Budget Measures 2015-16
| | | | | | | | | | | | | | | | | | | | |
| | | 2014-15
$‘000 | | | 2015-16
$‘000 | | | 2016-17
$‘000 | | | 2017-18
$‘000 | | | 2018-19
$‘000 | |
Nambour Hospital Repurposing: Design and Planning | | | — | | | | — | | | | — | | | | — | | | | — | |
The Government has approved the internal reallocation of $1.2 million over two years (2015-16 and 2016-17) to finalise the planning for the refurbishment of Nambour General Hospital. Funding for the project will be determined following the finalisation of the business case.
| | | | | | | | | | | | | | | | | | | | |
| | | 2014-15
$‘000 | | | 2015-16
$‘000 | | | 2016-17
$‘000 | | | 2017-18
$‘000 | | | 2018-19
$‘000 | |
Protecting Queensland Kids - Vaccination Legislation | | | — | | | | — | | | | — | | | | — | | | | — | |
The Government has approved the reallocation of $2.7 million over three years to deliver on its election commitment to deliver a comprehensive communication strategy to support amendments to vaccination legislation that would give the person in charge of an education and care service the option to refuse to allow children who are not fully immunised to enrol in the early childhood facility or to participate in activities or services provided by the facility.
| | | | | | | | | | | | | | | | | | | | |
| | | 2014-15
$‘000 | | | 2015-16
$‘000 | | | 2016-17
$‘000 | | | 2017-18
$‘000 | | | 2018-19
$‘000 | |
Rebuilding Mental Health Care for Young People: Barrett Adolescent Centre | | | — | | | | — | | | | — | | | | — | | | | — | |
The Government has approved the reallocation of up to $5 million in 2015-16 to progress delivery of its election commitment for a replacement Barrett Centre and to support the inquiry. The full cost of the new service centre will be determined following the finalisation of the Commission of Inquiry and project business case.
84
Budget Measures 2015-16
| | | | | | | | | | | | | | | | | | | | |
| | | 2014-15
$‘000 | | | 2015-16
$‘000 | | | 2016-17
$‘000 | | | 2017-18
$‘000 | | | 2018-19
$‘000 | |
Recashflow 2014-15 Operating Surplus | | | (320,000 | ) | | | — | | | | — | | | | — | | | | — | |
The Government has approved the internal reallocation of a $320.0 million surplus that was achieved in 2014-15 to be retained by Queensland Health to meet its funding commitments from 2015-16.
| | | | | | | | | | | | | | | | | | | | |
| | | 2014-15
$‘000 | | | 2015-16
$‘000 | | | 2016-17
$‘000 | | | 2017-18
$‘000 | | | 2018-19
$‘000 | |
Sunshine Coast Public University Hospital ICT works | | | — | | | | — | | | | — | | | | — | | | | — | |
The Government has approved the internal reallocation of $9 million in 2015-16 toward the commencement of ICT at the Sunshine Coast Public University Hospital. The full cost of the project and required funding allocation will be determined following the finalisation of the project business case.
85
Budget Measures 2015-16
Queensland Police Service
| | | | | | | | | | | | | | | | | | | | |
| | | 2014-15
$‘000 | | | 2015-16
$‘000 | | | 2016-17
$‘000 | | | 2017-18
$‘000 | | | 2018-19
$‘000 | |
Target Organised Crime, Alcohol Fuelled Violence and the Drug, Ice | | | — | | | | 5,000 | | | | 5,000 | | | | 5,000 | | | | 5,000 | |
In support of its election commitment, the Government is providing additional funding of $20 million over four years to target crime hotspots throughout the state, and issues such as organised crime, alcohol fuelled violence and the drug, ice.
| | | | | | | | | | | | | | | | | | | | |
| | | 2014-15
$‘000 | | | 2015-16
$‘000 | | | 2016-17
$‘000 | | | 2017-18
$‘000 | | | 2018-19
$‘000 | |
Road Safety - Enhancements (CDOP) | | | — | | | | 3,695 | | | | 3,530 | | | | 4,223 | | | | 4,855 | |
The Government is providing total funding of $74.9 million over four years to be allocated from revenues received from the Camera Detected Offence Program towards road safety, trauma recovery, rehabilitation services and the administration costs associated with infringements. The Queensland Police Service will receive $16.3 million of this funding for the installation and maintenance of additional fixed and mobile digital cameras. The capital component of this measure can be found in Chapter 3 Capital Measures. Further funding can be found in the Queensland Treasury and Department of Transport and Main Roads sections of this Chapter.
86
Budget Measures 2015-16
| | | | | | | | | | | | | | | | | | | | |
| | | 2014-15
$‘000 | | | 2015-16
$‘000 | | | 2016-17
$‘000 | | | 2017-18
$‘000 | | | 2018-19
$‘000 | |
Community Liaison Officers | | | — | | | | 200 | | | | — | | | | — | | | | — | |
The Government is providing increased funding of $200,000 in 2015-16 for two community liaison officers to provide an operational policing response and develop long term sustainable relationships within the Islamic community.
| | | | | | | | | | | | | | | | | | | | |
| | | 2014-15
$‘000 | | | 2015-16
$‘000 | | | 2016-17
$‘000 | | | 2017-18
$‘000 | | | 2018-19
$‘000 | |
Create Community Policing Boards | | | — | | | | 135 | | | | 139 | | | | 142 | | | | — | |
In keeping with the election commitment, the Government is providing additional funding of $416,000 over three years to create community policing boards and give local people a say on crime issues in their communities. This initiative will build on existing community crime prevention frameworks including Neighbourhood Watch, Community Consultative Committees, Crime Stoppers, multi-faith and Indigenous Community/Police Consultative Groups.
| | | | | | | | | | | | | | | | | | | | |
| | | 2014-15
$‘000 | | | 2015-16
$‘000 | | | 2016-17
$‘000 | | | 2017-18
$‘000 | | | 2018-19
$‘000 | |
Mobile Services | | | — | | | | — | | | | — | | | | — | | | | — | |
The Government has approved the reallocation of $25.1 million over three years, commencing in 2016-17, to continue delivering mobile service capability and complete delivery of 5,400 mobile devices. The mobile devices enhance officer and community safety by providing real time access to information for officers in the field and free up officer capacity to respond to demands for service.
87
Budget Measures 2015-16
| | | | | | | | | | | | | | | | | | | | |
| | | 2014-15
$‘000 | | | 2015-16
$‘000 | | | 2016-17
$‘000 | | | 2017-18
$‘000 | | | 2018-19
$‘000 | |
e-Rostering | | | — | | | | — | | | | — | | | | — | | | | — | |
The Government has approved the QPS and PSBA to progress the e-Rostering initiative to replace the current paper based police rostering system with an electronic process to improve productivity. A business case is currently being developed and the initiative will be funded by agency borrowings.
| | | | | | | | | | | | | | | | | | | | |
| | | 2014-15
$‘000 | | | 2015-16
$‘000 | | | 2016-17
$‘000 | | | 2017-18
$‘000 | | | 2018-19
$‘000 | |
Safe Night Out Strategy | | | — | | | | (1,071 | ) | | | (1,071 | ) | | | (1,071 | ) | | | (1,071 | ) |
As part of the Government’s strategy to fund its election commitments, the Government is delivering savings of $1.1 million per annum over four years from the former Safe Night Out Strategy.
88
Budget Measures 2015-16
Queensland Treasury
| | | | | | | | | | | | | | | | | | | | |
| | | 2014-15
$‘000 | | | 2015-16
$‘000 | | | 2016-17
$‘000 | | | 2017-18
$‘000 | | | 2018-19
$‘000 | |
Establishment of Social Benefit Bond Pilots | | | — | | | | 2,000 | | | | 1,000 | | | | — | | | | — | |
The Government is providing additional funding of $2 million over two years in recognition of the establishment and transaction costs associated with implementing three Social Benefit Bond (SBB) pilots and a further $1 million in 2015-16 for a Readiness Fund to assist service providers to prepare for contracting through the SBB pilots.
The Government will pilot three SBBs in the policy areas of recidivism, homelessness and indigenous services. SBBs are based on a payment by outcomes contracting approach, with funding initially sourced from private investors.
| | | | | | | | | | | | | | | | | | | | |
| | | 2014-15
$‘000 | | | 2015-16
$‘000 | | | 2016-17
$‘000 | | | 2017-18
$‘000 | | | 2018-19
$‘000 | |
Road Safety - Enhancements (CDOP) | | | — | | | | 1,019 | | | | 1,019 | | | | 1,019 | | | | 1,019 | |
The Government is providing total funding of $74.9 million over four years to be allocated from revenues received from the Camera Detected Offence Program towards road safety, trauma recovery, rehabilitation services and the administration costs associated with infringements. Queensland Treasury will receive $4.1 million of this funding for the additional activity for the State Penalties Enforcement Registry associated with the Program. Further funding can be found in the Queensland Police Service and Department of Transport and Main Roads sections of this chapter and Chapter 3 Capital Measures.
89
Budget Measures 2015-16
| | | | | | | | | | | | | | | | | | | | |
| | | 2014-15
$‘000 | | | 2015-16
$‘000 | | | 2016-17
$‘000 | | | 2017-18
$‘000 | | | 2018-19
$‘000 | |
Establishment of the Industrial Relations Legislative Reform Unit | | | — | | | | 642 | | | | — | | | | — | | | | — | |
In keeping with its election commitment, the Government is providing additional funding of $642,000 in 2015-16 for the establishment of a dedicated Industrial Relations Legislative Reform Unit. The Unit will focus on a comprehensive review of Queensland’s Industrial Relations framework, including implementation of the Government’s ‘Restoring Fairness’ legislation.
| | | | | | | | | | | | | | | | | | | | |
| | | 2014-15
$‘000 | | | 2015-16
$‘000 | | | 2016-17
$‘000 | | | 2017-18
$‘000 | | | 2018-19
$‘000 | |
Establishment of the Queensland Productivity Commission | | | — | | | | 300 | | | | 2,500 | | | | 2,500 | | | | 2,500 | |
As per its election commitment, the Government is providing additional funding of $300,000 in 2015-16 and $2.5 million per annum from 2016-17 for the establishment of the Queensland Productivity Commission (QPC). The QPC will undertake independent, in-depth reviews of complex economic, industry and regulatory issues through open and transparent processes informed by wide public consultation, and formulate policy proposals and recommendations to Government to encourage economic growth, productivity and improved living standards across Queensland.
The QPC was initially established on 1 May 2015 within Treasury, under the Public Service Act 2008. It will be transitioned to a statutory body structure under its own legislation as soon as practicable. The QPC under both structures will operate independently.
90
Budget Measures 2015-16
| | | | | | | | | | | | | | | | | | | | |
| | | 2014-15
$‘000 | | | 2015-16
$‘000 | | | 2016-17
$‘000 | | | 2017-18
$‘000 | | | 2018-19
$‘000 | |
Asset Transactions - Preparation and Due Diligence | | | 43,601 | | | | — | | | | — | | | | — | | | | — | |
The Government has provided additional funding of $43.6 million to reimburse Queensland Treasury Corporation for costs incurred in relation to the former Government’s preparatory and due diligence activities for transactions associated with the State’s income-generating assets.
| | | | | | | | | | | | | | | | | | | | |
| | | 2014-15
$‘000 | | | 2015-16
$‘000 | | | 2016-17
$‘000 | | | 2017-18
$‘000 | | | 2018-19
$‘000 | |
Safe Night Out Strategy | | | — | | | | (89 | ) | | | (89 | ) | | | (161 | ) | | | — | |
As part of the Government’s strategy to fund its election commitments, the department is delivering savings of $339,000 over three years from 2015-16 from the former Safe Night Out Strategy.
| | | | | | | | | | | | | | | | | | | | |
| | | 2014-15
$‘000 | | | 2015-16
$‘000 | | | 2016-17
$‘000 | | | 2017-18
$‘000 | | | 2018-19
$‘000 | |
Transition of the Office of Best Practice Regulation | | | — | | | | (3,200 | ) | | | (3,200 | ) | | | (3,200 | ) | | | (3,200 | ) |
As part of the Government’s strategy to fund its election commitments, the Government has transitioned the Office of Best Practice Regulation with its functions and staff to form part of the Queensland Productivity Commission, delivering savings of $3.2 million per annum from 2015-16.
91
Budget Measures 2015-16
Introduction
The following tables present the relevant portfolio capital measures relating to decisions taken since the 2014-15 Budget. This does not represent the full amount of additional funding provided to agencies since the 2014-15 Budget. For further explanation, refer to the Introduction and the Explanation of Scope and Terms in Chapter 1.
92
Budget Measures 2015-16
Department of Communities, Child Safety and Disability Services
| | | | | | | | | | | | | | | | | | | | |
| | | 2014-15
$‘000 | | | 2015-16
$‘000 | | | 2016-17
$‘000 | | | 2017-18
$‘000 | | | 2018-19
$‘000 | |
Implementation of high priority recommendations of the Domestic and Family Violence Taskforce Crisis Shelters | | | — | | | | — | | | | — | | | | — | | | | — | |
Funding of $8 million over two years from 2015-16 has been reprioritised by the department to implement the high priority recommendations of the Queensland Domestic and Family Violence Taskforce Report. This funding is to establish two 72-hour crisis shelters in Brisbane and Townsville for women and children escaping violence.
Total funding of $31.3 million over four years from 2015-16 has been provided across agencies as an initial response by Government to implement high priority recommendations of the Domestic and Family Violence Taskforce Report. This includes $5.2 million in new funding and $26.1 million from internal reallocation. Further details of this funding can be found in the Department of Communities, Child Safety and Disability Services, Department of Justice and Attorney-General, Department of the Premier and Cabinet, Department of Housing and Public Works and Department of Aboriginal and Torres Strait Islander Partnership sections of Chapter 2 Expense Measures. The Government will soon release its response to all 140 recommendations in the Report, which will underpin the development of a Queensland Domestic and Family Violence Prevention Strategy.
93
Budget Measures 2015-16
Department of Education and Training
| | | | | | | | | | | | | | | | | | | | |
| | | 2014-15
$‘000 | | | 2015-16
$‘000 | | | 2016-17
$‘000 | | | 2017-18
$‘000 | | | 2018-19
$‘000 | |
State School Capital Works Program | | | — | | | | 159,700 | | | | — | | | | — | | | | — | |
The Government is providing additional funding of $159.7 million in 2015-16 to fund the development of new schools to meet enrolment demand, complete stages and additional classrooms at existing schools and continue to renew and rectify state school infrastructure. This will take the total capital works spend in the education portfolio to $439.2 million in 2015-16.
| | | | | | | | | | | | | | | | | | | | |
| | | 2014-15
$‘000 | | | 2015-16
$‘000 | | | 2016-17
$‘000 | | | 2017-18
$‘000 | | | 2018-19
$‘000 | |
State-wide Schools and Hospitals Fund - New Schools | | | — | | | | 10,000 | | | | 25,000 | | | | 20,000 | | | | 35,000 | |
The Government is providing additional funding of $90 million over four years from 2015-16 for the construction of a priority new primary school in North West Townsville and master planning works for a new high school in Townsville. This funding is part of the $500 million State-wide Schools and Hospitals Fund. The expense component of this measure can be found in Chapter 2 Expense Measures.
The State-wide Schools and Hospitals Fund is a $500 million initiative that provides an economic uplift with a focus on health refurbishment and education capital and maintenance projects. Further funding can be found in the Queensland Health section of this chapter.
94
Budget Measures 2015-16
| | | | | | | | | | | | | | | | | | | | |
| | | 2014-15 | | | 2015-16 | | | 2016-17 | | | 2017-18 | | | 2018-19 | |
| | | $‘000 | | | $‘000 | | | $‘000 | | | $‘000 | | | $‘000 | |
Cairns Special School | | | — | | | | 3,000 | | | | 12,000 | | | | — | | | | — | |
The Government is providing total funding of $25 million over two years to construct a dedicated special school for students with severe disability and highly specialised and individualised needs, including exploring development opportunities with the non-state schooling sector. This includes $15 million over two years in additional funding, as per the election commitment, and $10 million internally allocated by the department.
| | | | | | | | | | | | | | | | | | | | |
| | | 2014-15 | | | 2015-16 | | | 2016-17 | | | 2017-18 | | | 2018-19 | |
| | | $‘000 | | | $‘000 | | | $‘000 | | | $‘000 | | | $‘000 | |
A Flying Start | | | — | | | | (45,700 | ) | | | — | | | | — | | | | — | |
The Government has reprioritised savings of $45.7 million from the Flying Start initiative to state school capital priorities following the successful transition of Year 7 to high school in 2015. The expense component of this measure can be found in Chapter 2 Expense Measures.
| | | | | | | | | | | | | | | | | | | | |
| | | 2014-15 | | | 2015-16 | | | 2016-17 | | | 2017-18 | | | 2018-19 | |
| | | $‘000 | | | $‘000 | | | $‘000 | | | $‘000 | | | $‘000 | |
Operational cash surplus | | | — | | | | (114,000 | ) | | | — | | | | — | | | | — | |
The Government has reprioritised operational cash savings of $114 million from past year operating surpluses. This funding will be directed to education’s capital priorities in 2015-16.
95
Budget Measures 2015-16
Department of Housing and Public Works
| | | | | | | | | | | | | | | | | | | | |
| | | 2014-15 | | | 2015-16 | | | 2016-17 | | | 2017-18 | | | 2018-19 | |
| | | $‘000 | | | $‘000 | | | $‘000 | | | $‘000 | | | $‘000 | |
Cairns Convention Centre Roof Repairs | | | — | | | | — | | | | — | | | | — | | | | — | |
Funding of $7.2 million over two years from 2015-16 has been internally reallocated by the department to repair the roof of the Cairns Convention Centre. The expense component of this measure can be found in Chapter 2 Expense Measures.
| | | | | | | | | | | | | | | | | | | | |
| | | 2014-15 | | | 2015-16 | | | 2016-17 | | | 2017-18 | | | 2018-19 | |
| | | $‘000 | | | $‘000 | | | $‘000 | | | $‘000 | | | $‘000 | |
Old Museum Repair Works | | | — | | | | — | | | | — | | | | — | | | | — | |
Funding of $3 million in 2014-15 has been internally reallocated by the department for structural and repair works to the Old Museum.
96
Budget Measures 2015-16
Department of Infrastructure, Local Government and Planning
| | | | | | | | | | | | | | | | | | | | |
| | | 2014-15
$‘000 | | | 2015-16
$‘000 | | | 2016-17
$‘000 | | | 2017-18
$‘000 | | | 2018-19
$‘000 | |
Catalyst Infrastructure Program | | | — | | | | 20,000 | | | | 20,000 | | | | 19,350 | | | | — | |
The Government is providing $59.4 million over three years (2015-16 to 2017-18) to establish a Catalyst Infrastructure Program to invest in urban infrastructure that unlocks development and creates construction and long term employment.
| | | | | | | | | | | | | | | | | | | | |
| | | 2014-15
$‘000 | | | 2015-16
$‘000 | | | 2016-17
$‘000 | | | 2017-18
$‘000 | | | 2018-19
$‘000 | |
Priority Development Infrastructure Co-Investment Program - Reprioritisation | | | (59,350 | ) | | | — | | | | — | | | | — | | | | — | |
The Government has reprioritised the $59.4 million uncommitted balance of the Priority Development Infrastructure (PDI) Co-Investment Program to fund emerging priorities, including planning reform.
$40.7 million has been allocated to projects from the PDI program, including the Beaudesert Town Bypass and works at Mt Peter (Cairns) and the Central Queensland University (Rockhampton).
97
Budget Measures 2015-16
Department of National Parks, Sport and Racing
| | | | | | | | | | | | | | | | | | | | |
| | | 2014-15 | | | 2015-16 | | | 2016-17 | | | 2017-18 | | | 2018-19 | |
| | | $‘000 | | | $‘000 | | | $‘000 | | | $‘000 | | | $‘000 | |
Queensland Parks and Forest Management | | | — | | | | 2,599 | | | | — | | | | — | | | | — | |
The Government is providing additional funding of $2.6 million in 2015-16 to develop facilities on land that has been acquired due to its high environmental and conservation value. The expense component of this measure can be found in Chapter 2 Expense Measures.
| | | | | | | | | | | | | | | | | | | | |
| | | 2014-15 | | | 2015-16 | | | 2016-17 | | | 2017-18 | | | 2018-19 | |
| | | $‘000 | | | $‘000 | | | $‘000 | | | $‘000 | | | $‘000 | |
North Stradbroke Island - Joint Management | | | — | | | | 275 | | | | — | | | | — | | | | — | |
In keeping with the election commitment, the Government is providing additional funding of $275,000 to develop infrastructure on North Stradbroke Island with the traditional owners, the Quandamooka people. The expense component of this measure can be found in Chapter 2 Expense Measures.
98
Budget Measures 2015-16
Department of State Development
| | | | | | | | | | | | | | | | | | | | |
| | | 2014-15 | | | 2015-16 | | | 2016-17 | | | 2017-18 | | | 2018-19 | |
| | | $‘000 | | | $‘000 | | | $‘000 | | | $‘000 | | | $‘000 | |
Townsville Stadium | | | — | | | | — | | | | 25,000 | | | | 35,000 | | | | 35,000 | |
In keeping with its election commitment, the Government will provide additional capital funding of $95 million over three years for the development of a sports centre in Townsville, in addition to $5 million in expense funding, taking the total project funding to $100 million. The expense component of this measure can be found in Chapter 2 Expense Measures.
99
Budget Measures 2015-16
Department of the Premier and Cabinet
| | | | | | | | | | | | | | | | | | | | |
| | | 2014-15 | | | 2015-16 | | | 2016-17 | | | 2017-18 | | | 2018-19 | |
| | | $‘000 | | | $‘000 | | | $‘000 | | | $‘000 | | | $‘000 | |
Cultural Precinct Critical Infrastructure | | | — | | | | 6,717 | | | | 6,467 | | | | 5,256 | | | | 1,560 | |
The Government is providing additional funding of $20 million over four years to renew and replace large critical infrastructure items at the Cultural Precinct, including the central energy plant, electrical safety program, precinct accessibility and mobility, building fabric, vertical transportation and general modernisation. This funding is part of a $28 million total package. Further funding can be found in Chapter 2 Expense Measures.
100
Budget Measures 2015-16
Department of Transport and Main Roads
| | | | | | | | | | | | | | | | | | | | |
| | | 2014-15 | | | 2015-16 | | | 2016-17 | | | 2017-18 | | | 2018-19 | |
| | | $‘000 | | | $‘000 | | | $‘000 | | | $‘000 | | | $‘000 | |
Road Safety - Enhancements (CDOP) | | | — | | | | 55,708 | | | | 68,496 | | | | 54,088 | | | | 51,500 | |
The Government will provide additional funding of $237 million over four years from the Camera Detected Offence Program for expansion of the camera program that is necessary to enable ongoing prevention of road trauma as Queensland’s road network and driving population continues to increase. The department will receive $229.8 million of this funding over four years to improve the safety of the sections of State-controlled roads where accidents frequently happen. Further funding can be found in the Queensland Police Service section of this chapter. The expense component of this initiative can be found in the Queensland Police Service, Queensland Treasury and Department of Transport and Main Roads sections of Chapter 2 Expense Measures.
| | | | | | | | | | | | | | | | | | | | |
| | | 2014-15 | | | 2015-16 | | | 2016-17 | | | 2017-18 | | | 2018-19 | |
| | | $‘000 | | | $‘000 | | | $‘000 | | | $‘000 | | | $‘000 | |
Regional Transport Boost | | | — | | | | 5,000 | | | | 19,100 | | | | — | | | | — | |
The Government is providing funding of $24.1 million over two years towards a regional transport boost. The balance of funding will be provided by the Department of Transport and Main Roads from internal reallocations. This funding is allocated from the previous government’s unallocated Royalties for Regions Round 4.
101
Budget Measures 2015-16
| | | | | | | | | | | | | | | | | | | | |
| | | 2014-15 | | | 2015-16 | | | 2016-17 | | | 2017-18 | | | 2018-19 | |
| | | $‘000 | | | $‘000 | | | $‘000 | | | $‘000 | | | $‘000 | |
Extension of the Marine Infrastructure Fund | | | — | | | | — | | | | 14,000 | | | | 14,000 | | | | — | |
As per the election commitment, the Government will provide increased funding of $28 million over two years to extend the Marine Infrastructure Fund (MIF). The extension of the MIF will allow the department to continue to invest in new and upgraded recreational boating infrastructure, including boat ramps, pontoons, floating walkways and artificial reefs, which will benefit the recreational boating and fishing community. The total funding provided for this initiative is $30 million. The expense component of this initiative can be found in Chapter 2 Expense Measures.
| | | | | | | | | | | | | | | | | | | | |
| | | 2014-15 | | | 2015-16 | | | 2016-17 | | | 2017-18 | | | 2018-19 | |
| | | $‘000 | | | $‘000 | | | $‘000 | | | $‘000 | | | $‘000 | |
Western Roads Upgrade Program | | | — | | | | — | | | | — | | | | — | | | | — | |
The Department of Transport and Main Roads has internally reallocated $40 million towards a Western Roads Upgrade Program.
102
Budget Measures 2015-16
Electoral Commission of Queensland
| | | | | | | | | | | | | | | | | | | | |
| | | 2014-15 | | | 2015-16 | | | 2016-17 | | | 2017-18 | | | 2018-19 | |
| | | $‘000 | | | $‘000 | | | $‘000 | | | $‘000 | | | $‘000 | |
SEMS Replacement Project | | | — | | | | 1,359 | | | | 4,947 | | | | — | | | | — | |
The Government is providing additional funding of $6.3 million over two years to replace the Commission’s Strategic Elections Management System. SEMS is the primary operating system fundamental to electoral administration in Queensland. The expense component of this measure can be found in Chapter 2 Expense Measures.
103
Budget Measures 2015-16
Legislative Assembly of Queensland
| | | | | | | | | | | | | | | | | | | | |
| | | 2014-15 | | | 2015-16 | | | 2016-17 | | | 2017-18 | | | 2018-19 | |
| | | $‘000 | | | $‘000 | | | $‘000 | | | $‘000 | | | $‘000 | |
Rectification works for the Parliamentary Annexe | | | — | | | | 3,000 | | | | — | | | | — | | | | — | |
The Government is providing additional funding of $3 million in 2015-16 to address waterproofing issues on level 7 of the Parliamentary Annexe. The project will involve removal of ageing external structures on level 7, the installation of a new drainage system and replacement of existing waterproof membranes and outdoor tile surfaces. The project will address current water penetration issues affecting the Parliamentary Library and its contents, and was a recommendation of the bipartisan Committee of the Legislative Assembly.
| | | | | | | | | | | | | | | | | | | | |
| | | 2014-15 | | | 2015-16 | | | 2016-17 | | | 2017-18 | | | 2018-19 | |
| | | $‘000 | | | $‘000 | | | $‘000 | | | $‘000 | | | $‘000 | |
Parliament House fire protection system | | | — | | | | 2,227 | | | | 3,097 | | | | 297 | | | | — | |
The Government is providing additional funding of $5.6 million over three years to install a fire protection system in Parliament House. The new system will feature fire compartmentalisation systems in roof spaces, full sprinkler protection, and gas suppression systems in various rooms housing valuable and sensitive material. The project will reduce the current fire risk facing Parliament House, its occupants and contents, and was a recommendation of the bipartisan Committee of the Legislative Assembly.
104
Budget Measures 2015-16
Queensland Health
| | | | | | | | | | | | | | | | | | | | |
| | | 2014-15 | | | 2015-16 | | | 2016-17 | | | 2017-18 | | | 2018-19 | |
| | | $‘000 | | | $‘000 | | | $‘000 | | | $‘000 | | | $‘000 | |
State-wide Schools and Hospitals Fund - Enhancing Regional Hospitals Program | | | — | | | | 20,600 | | | | 113,400 | | | | 35,000 | | | | 11,000 | |
The Government is providing additional funding of $180 million over four years for the Enhancing Regional Hospitals Program. This funding will be used to undertake essential upgrades to Queensland Health facilities including Caloundra Hospital Service, Roma Hospital, Hervey Bay Emergency Department and Gladstone Emergency Department.
The State-wide Schools and Hospitals Fund is a $500 million initiative that provides an economic uplift with a focus on health refurbishment and education capital and maintenance projects. Further funding can be found in the Department of Education and Training section of this chapter.
105
Budget Measures 2015-16
Queensland Police Service
| | | | | | | | | | | | | | | | | | | | |
| | | 2014-15 | | | 2015-16 | | | 2016-17 | | | 2017-18 | | | 2018-19 | |
| | | $‘000 | | | $‘000 | | | $‘000 | | | $‘000 | | | $‘000 | |
Road Safety - Enhancements (CDOP) | | | — | | | | 4,350 | | | | 2,850 | | | | — | | | | — | |
The Government will provide total additional funding of $237 million over four years from the Camera Detected Offence Program to improve the safety of sections of state-controlled roads where crashes most frequently happen and for expansion of the camera program that is necessary to enable ongoing prevention of road trauma as Queensland’s road network and driving population continues to increase. The Queensland Police Service will receive $7.2 million of this funding over two years for the installation of additional fixed and mobile digital cameras. Further funding can be found in the Department of Transport and Main Roads section of this chapter. The expense component of this measure can be found in the Queensland Police Service, Queensland Treasury and Department of Transport and Main Roads sections of Chapter 2 Expense Measures.
106
Budget Measures 2015-16
Queensland Treasury
| | | | | | | | | | | | | | | | | | | | |
| | | 2014-15 | | | 2015-16 | | | 2016-17 | | | 2017-18 | | | 2018-19 | |
| | | $‘000 | | | $‘000 | | | $‘000 | | | $‘000 | | | $‘000 | |
Establishment of the Business Development Fund | | | — | | | | 10,000 | | | | 10,000 | | | | 10,000 | | | | 10,000 | |
In keeping with its election commitment, the Government is providing additional funding of $40 million over four years to establish the Business Development Fund. The Fund will provide early stage venture capital by investing in innovative growing businesses based in Queensland to create new opportunities and productive capacity. Investments in start-ups will be made on a matching basis with private sector co-investors.
This funding forms part of the Government’s $180 million Advance Queensland investment in innovation, skills, education, business development and a start-up culture to deliver knowledge-based jobs now and into the future. Further funding can be found in the Department of Science, Information Technology and Innovation section of Chapter 2 Expense Measures.
107
Budget Measures 2015-16
Introduction
The following tables present the relevant portfolio revenue measures relating to decisions taken since the 2014-15 Budget. This does not represent the full amount of additional funding provided to agencies since the 2014-15 Budget. For further explanation, refer to the Introduction and the Explanation of Scope and Terms in Chapter 1.
108
Budget Measures 2015-16
Department of Natural Resources and Mines
| | | | | | | | | | | | | | | | | | | | |
| | | 2014-15 | | | 2015-16 | | | 2016-17 | | | 2017-18 | | | 2018-19 | |
| | | $‘000 | | | $‘000 | | | $‘000 | | | $‘000 | | | $‘000 | |
Explosives Reserve Fees | | | — | | | | 756 | | | | 782 | | | | 810 | | | | 838 | |
The Government will increase explosive reserve fees under the Explosives Act 1999 from 1 July 2015 to cover all reasonable costs associated with magazine operations and to fund required capital investment and security priorities.
| | | | | | | | | | | | | | | | | | | | |
| | | 2014-15 | | | 2015-16 | | | 2016-17 | | | 2017-18 | | | 2018-19 | |
| | | $‘000 | | | $‘000 | | | $‘000 | | | $‘000 | | | $‘000 | |
Titles Registry - Survey Plan Copyright Fees | | | — | | | | 300 | | | | 310 | | | | 321 | | | | 333 | |
The Government will increase survey plan fees from 1 July 2015 to cover the cost of the obligation to remunerate survey plan copyright owners through their collecting society, Copyright Agency Limited. This is the result of a court decision in New South Wales that surveyors be paid for public use of their plans beyond the initial lodgement and registration.
| | | | | | | | | | | | | | | | | | | | |
| | | 2014-15 | | | 2015-16 | | | 2016-17 | | | 2017-18 | | | 2018-19 | |
| | | $‘000 | | | $‘000 | | | $‘000 | | | $‘000 | | | $‘000 | |
Land Rent Capping | | | — | | | | (362 | ) | | | — | | | | — | | | | — | |
The Government has extended current land rent capping on tourism and residential leases for 2015-16.
109
Budget Measures 2015-16
| | | | | | | | | | | | | | | | | | | | |
| | | 2014-15 | | | 2015-16 | | | 2016-17 | | | 2017-18 | | | 2018-19 | |
| | | $‘000 | | | $‘000 | | | $‘000 | | | $‘000 | | | $‘000 | |
Titles Registry Fee Rationalisation | | | — | | | | (696 | ) | | | (696 | ) | | | (696 | ) | | | (696 | ) |
The Government has rationalised the current complex multi-level fee structure for administered titles fees down to four main fee levels.
| | | | | | | | | | | | | | | | | | | | |
| | | 2014-15 | | | 2015-16 | | | 2016-17 | | | 2017-18 | | | 2018-19 | |
| | | $‘000 | | | $‘000 | | | $‘000 | | | $‘000 | | | $‘000 | |
Extending Existing Drought Relief Arrangements | | | — | | | | (4,113 | ) | | | — | | | | — | | | | — | |
As per the election commitment, the Government is providing fee and rental relief of $4.1 million in 2015-16. This includes rebates for land rental and the waiving of water licence fees for drought affected landholders and lessees.
The Drought Assistance package is a total of $52.1 million over four years across several departments to support drought affected communities across the State. Further funding can be found in the Department of Agriculture and Fisheries, Department of Communities, Child Safety and Disability Services, Queensland Health and the Department of Energy and Water Supply sections of Chapter 2 Expense Measures.
110
Budget Measures 2015-16
Queensland Treasury
| | | | | | | | | | | | | | | | | | | | |
| | | 2014-15 | | | 2015-16 | | | 2016-17 | | | 2017-18 | | | 2018-19 | |
| | | $‘000 | | | $‘000 | | | $‘000 | | | $‘000 | | | $‘000 | |
Deferral of the Increase in Payroll Tax Threshold | | | — | | | | 40,000 | | | | 80,000 | | | | 120,000 | | | | 160,000 | |
As per its election commitment, the Government has deferred implementation of planned increases in the payroll tax threshold by $100,000 on 1 July 2015 and each year thereafter until the threshold reached $1.6 million on 1 July 2019.
Maintaining the current payroll tax threshold is a component of the Government’s dedication to fully funding its election commitments, including the payroll tax rebate on apprentice and trainee wages and a range of initiatives under the Working Queensland plan. Queensland’s payroll tax threshold is already the highest of the mainland states and the payroll tax rate is the lowest in Australia.
| | | | | | | | | | | | | | | | | | | | |
| | | 2014-15 | | | 2015-16 | | | 2016-17 | | | 2017-18 | | | 2018-19 | |
| | | $‘000 | | | $‘000 | | | $‘000 | | | $‘000 | | | $‘000 | |
Rebate of Payroll Tax for Apprentices and Trainees | | | — | | | | (15,000 | ) | | | (15,000 | ) | | | (15,000 | ) | | | — | |
In keeping with its election commitment, the Government is providing a payroll tax rebate of 25 per cent on the wages of apprentices and trainees in addition to their wages being exempt from payroll tax up to 30 June 2018. The rebate will be used as an offset against payroll tax payable on the wages of other employees.
111
Queensland Budget 2015-16 Budget Measures Budget Paper No. 4 www.budget.qld.gov.au
Queensland Budget 2015-16 Budget Measures Budget Paper No. 4
Queensland Budget 2015-16 Budget Measures Budget Paper No. 4 www.budget.qld.gov.au
Queensland Budget 2015-16
Jobs Now,
Jobs for the Future
Queensland Government employment plan
2015-16 Queensland Budget Papers
1. Budget Speech
2. Budget Strategy and Outlook
3. Capital Statement
4. Budget Measures
5. Service Delivery Statements
Appropriation Bills
Jobs Now, Jobs for the Future - Queensland Government employment plan
Budget Highlights
The suite of Budget Papers is similar to that published in 2014-15.
The Budget Papers are available online at www.budget.qld.gov.au
© Crown copyright
All rights reserved
Queensland Government 2015
Excerpts from this publication may be reproduced, with appropriate
acknowledgement, as permitted under the Copyright Act.
Jobs Now, Jobs for the Future - Queensland Government employment plan
ISSN 1445-4890 (Print)
ISSN 1445-4904 (Online)
Jobs Now, Jobs for the Future

State Budget
2015-16
Jobs Now,
Jobs for the Future
Queensland Government employment plan
Jobs Now, Jobs for the Future
Contents
| | | | | | |
| 1 | | Overview | | | 1 | |
| | |
| 2 | | The Queensland labour market | | | 3 | |
| | |
| 2.1 | | Recent performance | | | 3 | |
| 2.2 | | Outlook | | | 9 | |
| | |
| 3 | | Employment, economic growth and living standards | | | 11 | |
| | |
| 4 | | Policy and labour market outcomes | | | 13 | |
| | |
| 4.1 | | Policy levers and the role of government | | | 13 | |
| 4.2 | | The Queensland Government’s employment policy framework | | | 16 | |
| 4.3 | | Key employment policy channels | | | 17 | |
| | |
| 5 | | Working Queensland | | | 19 | |
| | |
| 5.1 | | Enhancing productivity and efficiency of business | | | 20 | |
| 5.2 | | Improving skills and training | | | 21 | |
| 5.3 | | Fostering emerging and innovative industries | | | 24 | |
| 5.4 | | Growing our regions | | | 29 | |
| 5.5 | | Boosting the delivery of government and social services | | | 33 | |
| | |
| 6 | | Future direction | | | 35 | |
Jobs Now, Jobs for the Future
The Queensland labour market has performed strongly for most of the last 20 years, underpinned by a sustained period of above trend economic growth. Over 865,000 new jobs have been created since 1994-95, providing the opportunity for more Queenslanders to enjoy a higher quality of life.
However, in recent years, Queensland’s labour market has been characterised by weak employment growth, a falling participation rate and a rising unemployment rate. Under the former government, the number of Queenslanders in full-time employment fell by 6,300 and over 29,000 additional Queenslanders became unemployed.
While there are tentative signs of improvement, conditions remain challenging, particularly for a number of cohorts within our community including youth, older workers, Aboriginal and Torres Strait Islanders and the long-term unemployed. It is incumbent on the Government to take action to improve this situation.
Labour market outcomes in Queensland are determined by the interaction of a range of policy and non-policy factors. These factors include economic conditions, climatic conditions, population growth, participation and technological change, as well as policy settings at various levels of Government in areas such as labour market regulation, the tax and transfer payment system, education and training, and employment programs.
Reflecting the role policy can play in influencing labour market decisions, the Government has identified job creation as its core policy objective to lead Queensland to a prosperous and inclusive future. To achieve this, the Government is implementing its Working Queensland jobs plan.
Working Queensland is a $1.6 billion package that will help boost the confidence of business to create jobs, increase the productivity of our labour force through skills development, foster emerging and innovative industries and support investment in productive infrastructure.
Working Queensland recognises that improving employment outcomes will require a combination of approaches – broader economic policies to create an environment conducive to business confidence and economic growth, as well as specific programs targeting key groups within the labour market.
To ensure the State’s economy grows for the benefit of all, Working Queensland focuses on:
| • | | enhancing productivity and efficiency of business |
| • | | improving skills and training |
| • | | fostering emerging and innovative industries |
| • | | boosting the delivery of government and social services. |
1
Jobs Now, Jobs for the Future
Key initiatives such as Skilling Queenslanders for Work, Building our Regions and the Government’s broader infrastructure investment will provide immediate employment opportunities for Queenslanders.
In coming years, Working Queensland will also help create the high paid jobs of tomorrow by revitalising science and innovation and fostering emerging and innovative industries through Advance Queensland and the Business Development Fund.
The job creation measures outlined in the 2015-16 State Budget will be complemented by additional policies and programs in the future as the Government continues to consult widely with industry, communities and other stakeholders on ways to increase employment opportunities for Queenslanders.
Through Working Queensland, the Government will help grow the State’s economy and create real and sustainable jobs for Queenslanders.
2
Jobs Now, Jobs for the Future
| 2 | The Queensland labour market |
The creation of over 865,000 new jobs in Queensland in the last 20 years has been one of the State’s most important economic and social success stories. However, in recent times, conditions in the Queensland labour market have been soft. This has been the result of a number of factors, including tougher global economic conditions and a subdued domestic economy. As a consequence, the unemployment rate currently sits near decade highs. The subdued outlook for the Queensland labour market highlights the need for a strong Government focus on improving employment outcomes.
The Queensland labour market is currently experiencing a period of relative weakness, in contrast to its performance for most of the last 20 years (Chart 2.1). This has occurred during a period of softer economic growth as Queensland transitions from the historic surge in resources investment towards broader based drivers of growth. Weaker growth in Queensland’s major trading partners and falls in world commodity prices (including coal and oil) have also impacted business and household incomes, with flow-on effects to economic activity and employment opportunities.
| Chart 2.1 | Gross state product1 and employment growth2, Queensland |
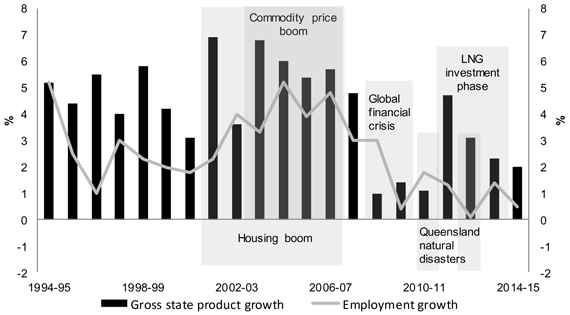
Notes:
| 1. | CVM reference year 2012-13, percentage change on previous year. 2014-15 is an estimate. |
| 2. | Annual percentage change. |
Sources: ABS 5220.0, 6202.0 and Queensland Treasury.
3
Jobs Now, Jobs for the Future
To help better understand the recent performance of the Queensland labour market, it is useful to examine developments from three different perspectives – employment, participation and unemployment.
The total number of people employed1 in Queensland has increased from around 1.5 million in the mid-1990s to more than 2.3 million today.
Through the mid-2000s, Queensland experienced a sustained period of historically strong employment growth, driven by robust activity across most sectors of the economy, including the housing and mining boom periods highlighted in Chart 2.1.
This sustained period of growth resulted in the unemployment rate falling to its lowest level in a generation, resulting in skills shortages, rising prices and higher interest rates.
Since the global financial crisis in the late 2000s, employment growth slowed significantly.
Prior to the global financial crisis, employment growth averaged over 3% per annum and peaked at over 5% in 2004-05, consistently stronger than the rest of Australia. However, since 2008-09, employment growth has been below its long-run average, at just 0.7% on average across the period 2012-13 to 2014-15, with growth of 0.1% in 2012-13 the lowest since the early 1990s.
Modest employment growth over the past year has been driven primarily by the accommodation and food services, professional, scientific and technical services industries and health care and social assistance.
This outcome is consistent with the longer-run trend of job creation in Queensland being led by health, professional services and tourism related industries, as the State’s economy continues its ongoing structural shift and diversification into services (Chart 2.2). The share of jobs in health care and social assistance has increased from 8.7% to 12.5% since 1994-95, while professional, scientific and technical services has increased from 5.4% to 7.8%.
Gains over the past year have been partially offset by falls in retail trade, construction and manufacturing employment. Mining employment has also fallen sharply over the past year as conditions in the sector have deteriorated. While mining employment has grown as a proportion of the State’s labour market over the past 20 years, its capital-intensive nature means it remains outside the top 10 employing industries in Queensland. Many of the jobs created during the construction phase of the resources boom have been classified by the Australian Bureau of Statistics (ABS) as construction industry and professional services industry employment.
Previous strong rates of employment growth were a key factor in attracting many new residents to Queensland. Strong rates of interstate and overseas migration underpinned population growth of around 2% each year over the past two decades, well above the national average. However, in recent years, net interstate migration has fallen significantly and currently sits at historical lows.
| 1 | Employment is defined as persons aged 15 years and over who are in paid work of one or more hours a week. |
4
Jobs Now, Jobs for the Future
This outcome is the result of a number of factors, including a reduction in employment opportunities in Queensland relative to other States, particularly Victoria and New South Wales in recent times. However, it also reflects the maturing of the Queensland economy, with the cost of living differential between Queensland and other major states having reduced over time.
| Chart 2.2 | Employment by industry1, Queensland |
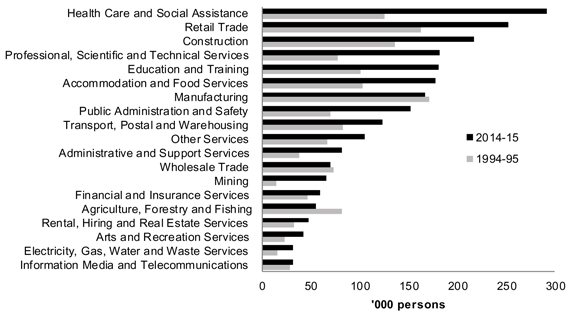
Note:
| 1. | Average number of persons employed in the financial year. |
Source: ABS 6291.0.55.003.
Queensland’s trend participation rate2 has fallen sharply, down nearly one percentage point to 65.4% over the past year. Weaker labour market conditions have discouraged job seekers from actively looking for work (and therefore being classified as participating in the labour market). As a result, aggregate participation currently sits at levels last seen prior to the start of the commodity price boom (Chart 2.3). This underscores the importance of the Government’s Working Queensland plan to create the policy settings that will encourage increased workforce participation.
| 2 | The participation rate is defined as the ratio of the labour force to the population aged 15 years and over, where the labour force is defined as all persons who are employed or unemployed. |
5
Jobs Now, Jobs for the Future
Recent falls in the participation rate contrasts with the gains made in previous decades as increased job opportunities encouraged more people to enter and remain in the workforce. The rise in the State’s participation rate over this period was driven by increasing female participation in the labour force, boosted by skills and educational attainment and industry structural change.
| Chart 2.3 | Participation rates1, Queensland |
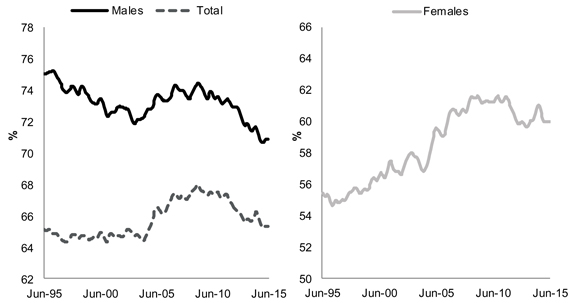
Note:
Source: ABS 6202.0.
Increasing female participation in the labour force has more than offset the long-run decline in male participation. Female participation rose significantly during the 1990s and 2000s, encouraged by increased workforce flexibility and greater job opportunities. While female participation has eased slightly over recent years in line with the broader downturn in labour market conditions, it remains well above rates recorded prior to the start of the commodity price boom.
While cyclical factors are currently weighing on Queensland’s participation rate, the ageing of the State’s population is also exerting downward pressure on participation, with lower rates of participation traditionally recorded amongst older age groups. Over the next 40 years, the number of persons over the age of 65 for each person of working age in Queensland will almost double. As a result, encouraging greater participation by all Queenslanders, especially older Queenslanders, will be important for boosting the supply of labour and therefore the potential output of the Queensland economy. Further details of the importance of labour market participation for potential economic growth are discussed in Chapter 3.
6
Jobs Now, Jobs for the Future
The State’s trend unemployment rate3 currently sits at 6.3%, above the national rate of 6.0%. Queensland currently has the second highest rate of unemployment of the mainland states (Chart 2.4), highlighting the need for the Government to take action to help deliver jobs now and jobs for the future.
| Chart 2.4 | State unemployment rates1 |
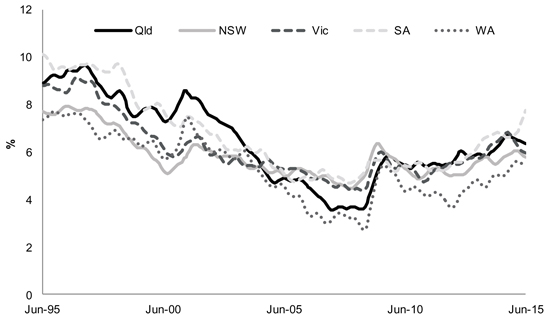
Note:
Source: ABS 6202.0.
The rise in the unemployment rate reflects employment growth not keeping pace with labour force growth in Queensland over recent years. In addition to rises in the headline rate of unemployment, ABS measures of labour underutilisation4 have also trended higher in recent years.
Weaker employment outcomes have been experienced across Queensland, with average unemployment rates rising in all regions except Cairns and the Outback over the past year. Regions heavily exposed to slowing activity in the resources sector, including Mackay, Townsville and Fitzroy, have been amongst the hardest hit (Chart 2.5).
| 3 | The unemployment rate is defined as the number of unemployed persons as a proportion of the labour force. |
| 4 | Labour underutilisation is defined as the sum of the number of persons unemployed and the number of persons in underemployment, where underemployment refers to employed persons aged 15 years and over who want, and are available for, more hours of work than they currently have. |
7
Jobs Now, Jobs for the Future
| Chart 2.5 | Regional unemployment rates1,2, Queensland |
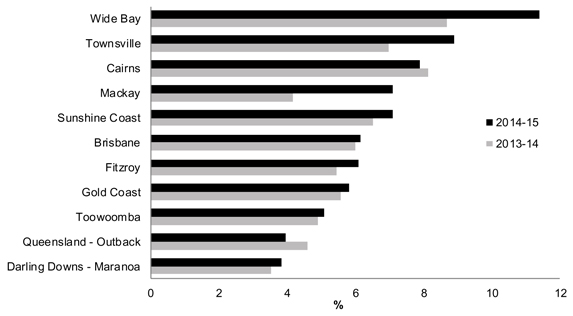
Notes:
| 1. | Monthly, original. Average unemployment rate in the financial year. |
| 2. | 2014-15 is average unemployment rate for 12 months to May 2015. |
Sources: ABS 6291.0.55.003 and Queensland Treasury.
Recent weakness contrasts with the improvement in employment opportunities experienced across the State over the last 20 years. While up from recent lows, regional unemployment rates are on average lower and the variation across the State is also lower than what has been experienced through much of the past two decades. An important factor, playing at least some role, in lowering unemployment rates has been an increased willingness of people to travel or move to areas where there are greater employment opportunities. This has particularly been the case during the resources boom where many jobs have been in regional or remote areas.
The recent decline in job opportunities has impacted on a range of labour market groups. For example, youth5 currently account for almost 40% of the total number of unemployed persons in Queensland, despite only representing around 20% of the State’s working age population. Youth unemployment rates have historically risen more quickly and recovered more slowly than aggregate unemployment after periods of slower economic growth, reflecting the lower degree of attachment youth have to the labour market and their less-developed skill sets.
| 5 | Youth are defined as those aged between 15 and 24. |
8
Jobs Now, Jobs for the Future
Looking forward, the outlook for the Queensland labour market remains modest as the State continues its transition from resources-led construction to production and services and broader-based drivers of growth. This emphasises the need for the Queensland Government to have a strong focus on improving employment outcomes.
Weak household income growth as a result of the fall in the terms of trade is constraining employment growth in labour intensive service industries such as retail trade. Meanwhile, drought conditions impacting Queensland’s agricultural industry are expected to be sustained by the current El Niño weather pattern.
Employment supported by the construction of major resources projects is expected to continue to decline in 2015-16 as these projects are completed. In an environment of low commodity prices, mining operators have begun reducing their workforce and continue to target efficiency gains to maintain profitability. This is also having an impact on employment in industries servicing the resources sector, such as professional services and equipment hiring.
The forecast acceleration in Queensland’s economic growth in 2015-16 is expected to be driven largely by liquefied natural gas (LNG) exports, which is unlikely to provide a significant boost to employment. LNG production and exports are less labour intensive than both LNG construction and the economy more generally. As a result, employment and labour income growth will be more subdued than in other periods of similar economic growth.
Employment growth is expected to improve, partly reflecting the forecast acceleration in dwelling investment as work on the significant pipeline of medium to high density projects is undertaken. Continued population growth and improved competitiveness for trade exposed sectors outside of mining, such as tourism and education, should also support jobs growth.
Further ahead, employment outcomes are forecast to continue to improve as non-resources investment gradually recovers and domestic demand strengthens. Labour market outcomes are also expected to be supported by the roll out of the Government’s $1.6 billion Working Queensland jobs package, discussed further in Chapter 5.
Queensland’s unemployment rate is forecast to gradually fall over the forward estimates as domestic activity strengthens (see Chart 2.6). Queensland’s participation rate is expected to be marginally lower over the period ahead, having already fallen significantly from its peak. The ageing of the population is expected to continue to place downward pressure on the participation rate as more people enter age cohorts which tend to rely less on employment related income.
9
Jobs Now, Jobs for the Future
| Chart 2.6 | Labour market1, Queensland |
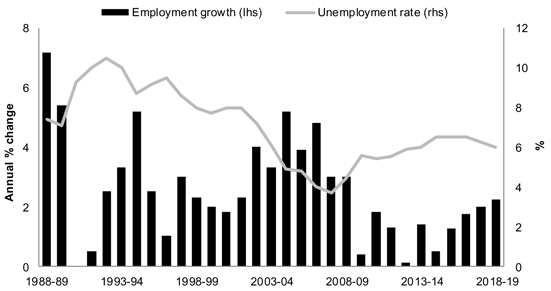
Note:
| 1. | Year average. 2014-15 are actual outcomes, 2015-16 to 2017-18 are forecasts and 2018-19 are projections. |
Sources: ABS 6202.0 and Queensland Treasury.
These developments are expected to occur alongside continuous structural change in the Queensland labour market, as the economy continues to diversify and workplace flexibility increases. The diversification of the economy will be assisted by the Government’s $180 million Advance Queensland plan for working smarter and working together to grow the jobs of the future, particularly in the knowledge economy.
Structural change is creating new employment opportunities across the State. In particular, the ageing of the Queensland population, combined with recent policy shifts at the State and Federal level, should lead to increased employment in key sectors delivering social services, including disability services and aged care. For example, it is estimated that the number of disability care workers in Queensland will double by the end of the decade, following the introduction of the National Disability Insurance Scheme from 1 July 2016.
New technology and work practices are also increasing the flexibility and mobility of the Queensland workforce. Greater flexibility will provide new employment opportunities for Queenslanders, including for many who have not previously been attached to the workforce.
It is important for the Queensland Government to support the further diversification of the State’s industries, including opportunities to expand our knowledge-intensive and technology-intensive industries, such as bio-manufacturing and eHealth. Such fields have the potential to be significant creators of the jobs of the future, as well as becoming leading contributors to the State’s economic growth.
Further details of the current conditions and outlook for the Queensland economy and labour market are available in Budget Paper 2, Chapter 2.
10
Jobs Now, Jobs for the Future
| 3 | Employment, economic growth and living standards |
Economic and employment growth are both key drivers of higher living standards and an improved quality of life. Increased output in the economy and improved employment outcomes lead to higher incomes, on average, for Queenslanders. The income individuals receive determines the quantity and quality of goods and services they are able to demand or consume, commonly referred to as their standard of living.
By their nature, economic growth and labour market outcomes are inter-dependent. Higher economic growth tends to result in greater demand for labour and, therefore, more jobs. Meanwhile, improved and more productive participation in employment contributes to greater production and output, resulting in economic growth.
Economic growth can be analysed by disaggregating overall growth into the contributions from the three key elements (working age population, employment participation and labour productivity) that determine the quantity and quality of labour utilised in an economy.
The way in which each of these three elements contributes to economic and employment growth, often referred to as the 3Ps framework, is outlined below.
Working age population
The potential workforce available to contribute to economic activity at any time is determined by the working age population (15 years and over).
Overall population growth is a function of three factors: the natural population increase (births less deaths); net interstate migration; and net overseas migration. However, the extent to which changes in the total population are reflected in the working age population depends on the specific characteristics of the population (for example, the extent to which the population is ageing and the proportion of interstate and overseas migrants in various age cohorts).
Employment participation
Potential output in an economy and total income received are dependent on the extent to which the working age population participates in employment (reflecting both the number of people in employment and the hours they work on average).
Labour productivity
Economic output is also determined by the productivity of the labour supply in an economy (that is, the average output produced per hour worked).
The more productive workers become, the more output is able to be produced and, therefore, the more people’s incomes and quality of life are likely to improve.
Increases in labour productivity over time can occur as a result of a range of factors including: a more highly and appropriately-skilled workforce; capital deepening (increases in the capital to labour ratio, including investment in strategic economic infrastructure); efficiency improvements (making better use of existing labour and capital, including reducing the burden of red tape); and technological change and innovation.
11
Jobs Now, Jobs for the Future
Contribution of the 3Ps to Queensland’s economic growth
The extent to which each of these factors contributes to economic growth (and, therefore, incomes and living standards) can vary in different years and over different time periods, depending on underlying economic and labour market conditions, changes in the structure of the economy and other external influences.
This is highlighted by analysis of the relative contribution to Queensland’s economic growth over the last 25 years from each of these key elements, as shown below (Chart 3.1).
| Chart 3.1 | Drivers of real economic growth, Queensland (1988-89 to 2013-14) |
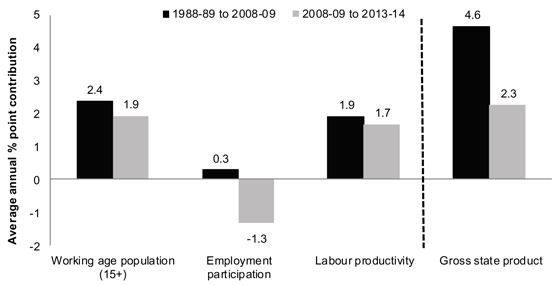
Sources: ABS 3101.0, 6202.0, 5220.0 and Queensland Treasury.
As highlighted above increases in the working age population, employment participation and labour productivity all contributed to Queensland’s economic growth over the 20 years to 2008-09. However, in the five years to 2013-14 since the global financial crisis, the reduction in employment participation detracted from economic growth, while growth in the working age population and labour productivity slowed and, therefore, contributed to growth to a lesser extent.
Understanding the role policy can play in influencing these drivers of economic growth and labour market outcomes more broadly is discussed in Chapter 4.
12
Jobs Now, Jobs for the Future
| 4 | Policy and labour market outcomes |
Employment outcomes are determined by a wide range of policy and non-policy factors that influence interactions between various labour market participants, including employers, employees and their agents (unions, employer groups and industry bodies).
Each of these factors influence, to varying degrees, the demand for labour (that is, the amount and type of labour required by employers) and/or the supply of labour (that is, the amount and quality of labour available from workers) in the economy.
It is the intersection of labour demand and supply that ultimately determines the total number of persons employed and the extent to which they are employed, as well as other important outcomes such as wages and income levels.
The combination of these labour market outcomes contributes significantly to the standard of living and quality of life of individuals, families and their communities.
At any point in time, labour market conditions in Queensland are influenced by a variety of broad underlying external factors, such as the national and international economic environment, technological developments and prevailing climatic conditions. These factors impact on the demand for goods and services in the Queensland economy and, therefore, the need for employees with the appropriate skills and attributes to produce those goods and services.
| 4.1 | Policy levers and the role of government |
Different levels of government have roles in helping shape employment outcomes, both at an aggregate level and for individuals, through the various economic, fiscal and social policy levers that directly or indirectly influence labour demand and supply.
Some of the more significant areas where government policies can influence labour market outcomes and the ways in which policy decisions can impact on labour demand or supply are discussed below.
Key demand side policy levers, aimed at creating an environment conducive to increased business confidence and investment, fostering emerging and innovative industries and increasing the productivity and competitiveness of business and industry, include:
| • | | Monetary policy – lower interest rates reduce the cost of borrowing and increase the level of capital investment, thereby increasing the capacity of business to employ labour. Lower borrowing costs also boost the disposable income of households, encouraging higher levels of consumption, which stimulates economic activity and the demand for labour. |
| • | | Sustainable government finances – sustainable government finances enhance business and consumer confidence because taxation and expenditure policy settings are relatively predictable and provide government with the capacity to respond to emerging priorities. |
| • | | Taxation system – more efficient and competitive taxes can act as an incentive for business to increase employment. |
13
Jobs Now, Jobs for the Future
| • | | Expenditure on capital works and economic infrastructure – capital expenditure supports jobs in the short term, while improving the productivity of labour and the efficiency of businesses in the longer term, boosting economic activity and increasing employment demand. |
| • | | Removing unnecessary regulation and providing business support – reducing costs for business and non-government organisations enables them to grow and create more employment opportunities. |
| • | | Regional development – supporting economic growth through both infrastructure delivery and support for new industry development in regional areas creates more local employment opportunities. |
Key supply side policy levers, aimed at improving the participation and productivity of the workforce, include:
| • | | Childcare – enabling parents to return to the workforce, should they choose, as well as supporting early engagement in education. |
| • | | Schools, vocational education and training (VET) and higher education – increasing the skills and capacity of individuals, and enabling greater workforce flexibility to meet labour demand. |
| • | | Employment services – assisting the unemployed and under-employed to enter or re-enter the workforce. |
| • | | Transfer system – providing a social safety net that provides financial support for those seeking assistance to encourage greater workforce participation. |
The complexity of the labour market means that some important policy levers have both demand and supply side impacts, for example:
| • | | Industrial relations – appropriate industrial relations settings can provide incentives for businesses to employ workers and encourage greater workforce participation by individuals. |
| • | | Science and research, innovation and entrepreneurship – fostering the development of knowledge and skills in these areas builds human capital and supports industry growth, particularly in new and emerging sectors. |
| • | | Migration – attracting new entrants to the labour market to address skills and labour shortages that cannot be met from the existing workforce. Migration is also an important source of population growth, which boosts the demand for goods and services. |
| • | | Health and community services – effective public and social services provide employment opportunities and allow individuals to participate more effectively in the labour market. |
| • | | Strong and sustainable public service – a public service capable of efficiently delivering services to the community is critical and is also a key employer in a wide range of occupations including teachers, doctors and nurses, particularly in regional Queensland. |
The diagram on the following page provides a stylised representation of the labour market and the potential impacts of various key policy levers discussed above (Diagram 4.1).
14
Jobs Now, Jobs for the Future
| Diagram 4.1 | Illustrative model of the Queensland labour market |
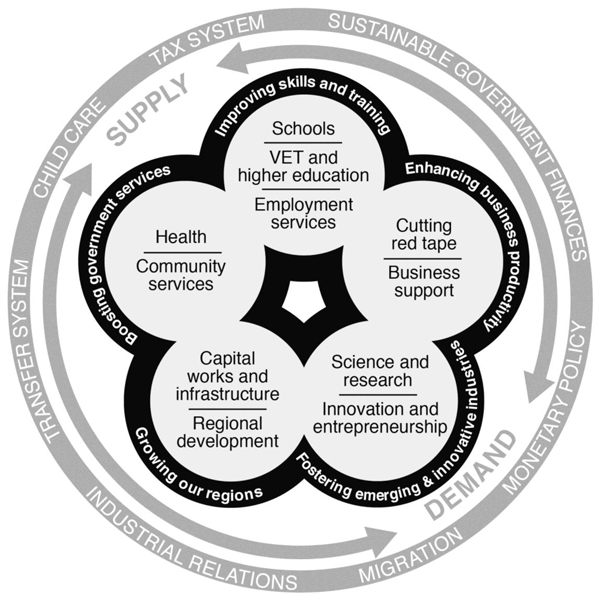
15
Jobs Now, Jobs for the Future
| 4.2 | The Queensland Government’s employment policy framework |
Queensland’s economic and labour market performance is heavily influenced by national policy settings in a range of key areas, including monetary policy, taxation and transfer payments, industrial relations, migration and child care.
However, within this context and prevailing external economic conditions, the State Government has an important role to play in shaping and improving employment outcomes at the state level, through the development and implementation of its employment policy.
Given the complex nature of labour markets, the Queensland Government’s employment policy framework is multi-faceted – including policies and programs aimed at:
| • | | generating more employment opportunities for Queenslanders |
| • | | increasing the capacity of Queenslanders to participate in the labour market and the supply of appropriately skilled workers |
| • | | helping facilitate more efficient and effective matching of skilled workers with the employment opportunities provided by employers. |
To achieve effective and sustainable improvements in employment outcomes for both current job seekers and future generations of Queenslanders, the Government’s employment policy also balances measures focussed on the short, medium and longer terms.
By its nature, the Government’s employment policy framework comprises a broad range of approaches, directed at various elements of the labour market on both the demand and supply sides including:
| • | | broad economic policies aimed at creating an environment conducive to business investment and economic growth |
| • | | policies and programs to foster the growth of new businesses and industries, as well as supporting the continued growth of existing industries |
| • | | specific employment programs aimed at improving the participation and employment outcomes for targeted key groups within the labour market |
| • | | providing direct assistance to individuals in securing employment. |
The extent to which various policy options are likely to be effective is also dependent on the prevailing economic conditions at any time. Therefore, another key element of the Government’s employment policy framework is ensuring resources are efficiently and effectively allocated where they will achieve the greatest economic and employment benefits for Queenslanders.
16
Jobs Now, Jobs for the Future
| 4.3 | Key employment policy channels |
In general, the Queensland Government can influence employment outcomes through a number of broad policy channels.
To foster increased employment demand, particularly in the private and non-government sector, one of the Government’s key policy focuses is enhancing the productivity and efficiency of business.
To create the conditions and provide the incentives for business and industry to develop, invest, grow and innovate, the Government will be reducing costs for business, cutting red tape and unnecessary regulation, ensuring state taxes are competitive and reducing barriers to investment.
Another key role for the Government is encouraging and facilitating investment in the key economic and social infrastructure needed to meet Queensland’s increasing service needs, improve the productivity and efficiency of business, and support economic growth.
Given Queensland’s vast size, the regionalised nature of the State’s population and workforce, and its diversified industry structure, the Government’s employment policy also has a specific focus on growing the State’s regions and creating employment in rural and regional areas.
In particular, enhancing the productivity and efficiency of the State’s key export-oriented industries, such as agriculture, tourism and mining, will help make them more competitive in international markets. Improved competitiveness will increase the sustainability and profitability of these industries and therefore enable them to employ more people.
The combination of these measures will not only help existing Queensland businesses and organisations to grow and prosper but will also make Queensland a more attractive location for interstate and overseas businesses looking to expand or relocate.
In the medium to longer term, the Government’s employment policy will also support the growth of emerging and innovative industries, which will create and support many of the jobs of the future, including for Queensland’s youth.
Fostering the innovation and entrepreneurial thinking needed to help drive the development of new ideas, products and services is crucial to achieving sustainable economic and employment growth in Queensland in the medium to longer term.
In terms of labour supply, the Government has a vital role in improving labour force skills and training. This includes the provision of quality education and training for both current job seekers and future generations of Queenslanders.
The Government’s employment policy includes a focus on identifying areas where skill shortages may develop and designing the delivery of school, VET and other targeted skills and training programs accordingly.
The Government will also be assisting disadvantaged cohorts in the labour market through tailored programs and policies to maximise the opportunities for these individuals to gain productive, meaningful and sustainable employment.
17
Jobs Now, Jobs for the Future
The provision of effective and forward-focussed education, training and skills development is also critical to ensure the Queensland workforce is flexible and able to adapt to structural changes in the economy.
Finally, the Government has a vital role in ensuring Queenslanders have the capacity to engage productively in employment through the efficient and effective delivery of government and social services.
In particular, the Government has direct responsibility for the delivery of important health and community services, as well as working closely with the private and not-for-profit sectors to ensure an appropriately skilled workforce is available to deliver social services more broadly throughout Queensland.
An ongoing policy focus in this area will maximise employment opportunities in the social services sector, as well as ensuring individuals, families and communities throughout Queensland have access to the services they need to allow them to live healthy, productive lives.
18
Jobs Now, Jobs for the Future
Working Queensland is the Queensland Government’s employment policy response to the State’s current labour market performance and outlook, taking into account the wide range of policy and non-policy factors currently influencing the Queensland labour market.
Working Queensland is a $1.6 billion package that will help boost the confidence of business to create jobs, increase the productivity of our labour force through skills development, foster emerging and innovative industries and support investment in productive infrastructure.
In addition to supporting jobs in areas of the State where they are most needed now, Working Queensland will also put in place the building blocks for future employment growth.
As the Queensland economy transitions from resources-led construction to production and services, it has never been more important that the State continues to shift towards a knowledge-based economy that supports highly skilled workers in well-paid jobs.
Working Queensland represents a significant investment in the human capital of the Queensland workforce. It will help deliver the jobs of tomorrow by revitalising science and innovation and fostering emerging and innovative industries. This will support the State’s economic growth for years to come.
Another key component of Working Queensland is the Government’s infrastructure investment, which will support economic growth and prosperity across Queensland by increasing productive capacity, generating jobs, and expanding business and labour market opportunities.
While many of the Working Queensland programs and initiatives will help address broader issues contributing to unemployment in Queensland, some are also targeted at assisting groups of people within the economy who face significant challenges in achieving and maintaining employment, particularly our youth.
The diagram on the following page highlights the major Working Queensland initiatives and demonstrates how they align with the key policy channels through which the Government can influence labour market outcomes (Diagram 5.1).
19
Jobs Now, Jobs for the Future
| Diagram 5.1 | Major Working Queensland initiatives |
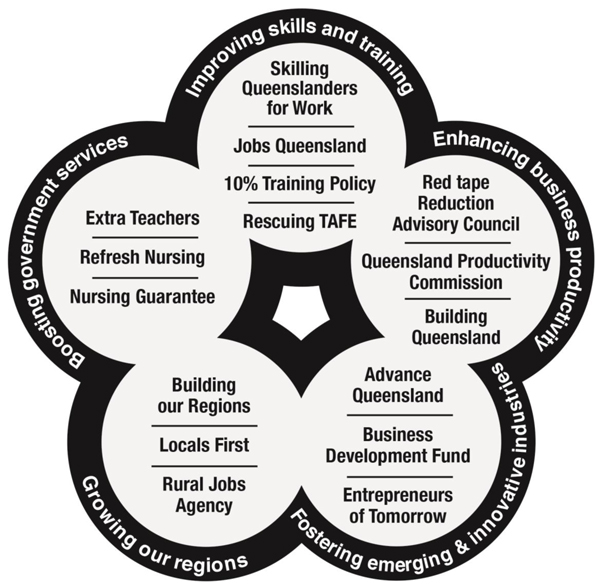
| 5.1 | Enhancing productivity and efficiency of business |
Working Queensland will create jobs for Queenslanders by enhancing the productivity and efficiency of business. It will deliver the right economic settings for business to have confidence in investing in the future and growing their businesses. This will boost the demand for labour.
To achieve this, the Government is committed to removing regulatory requirements that are not needed to achieve the desired social, environmental and/or economic outcomes. Excessive regulation detracts from Queensland’s economic competitiveness and productivity and discourages the new investment needed to transform the State’s economy.
20
Jobs Now, Jobs for the Future
To create an environment conducive to strong, profitable and globally competitive business, the Government is establishing the Red Tape Reduction Advisory Council to recommend areas in which regulation could be reduced for small business.
The Government is also providing $7.8 million over the next four years to deliver its election commitment to establish the independent Queensland Productivity Commission, which will formulate policy proposals and recommendations to encourage economic growth, productivity and improved living standards across Queensland.
Other measures the Government is implementing aimed at enhancing the productivity and efficiency of business include:
| • | | Payroll tax rebate for apprentices and trainees – in keeping with its election commitment, the Government is providing a payroll tax rebate of 25% on the wages of apprentices and trainees in addition to their wages being exempt from payroll tax up to 30 June 2018. The rebate will be used as an offset against payroll tax payable on the wages of other employees, and will enable Queensland to continue developing a highly skilled workforce into the future. The Government is providing this incentive at an estimated cost of $45 million over the next three years. |
| • | | Building Queensland – as per its election commitment, the Government is providing $20.2 million to establish Building Queensland as a statutory authority to provide independent, expert advice on infrastructure priorities. Advice will be based on rigorous cost-benefit analysis and community benefits. |
| • | | Business and Industry Portal – the Government is providing additional funding of $4.7 million in 2015-16 to continue enhancing and transforming how the Queensland Government delivers online services and to make it easier for business and industry customers to interact with government. |
| • | | Queensland Small Business Advisory Council – the Council will provide direct input to the Government on issues facing the small business sector. |
| 5.2 | Improving skills and training |
Working Queensland is not just about creating jobs, but providing people with the appropriate knowledge and skills needed to take advantage of new opportunities. As industries evolve and new industries emerge, there will be a need for employees who can meet new skill set requirements. There will also be a need for people to retrain or upskill to remain employable as industries change.
Reflecting this, the Government is investing significantly in improving skills and training. In particular, the Government is delivering its election commitment to provide $240 million over four years to reinstate the highly successful Skilling Queenslanders for Work initiative. Skilling Queenslanders for Work will support up to 32,000 Queenslanders into work through a suite of targeted skills and training programs. It will provide Queensland job seekers with tailored support, inclusive services, literacy and numeracy skills, job preparation skills, work placement training opportunities and subsidised work placements (Box 5.1).
21
Jobs Now, Jobs for the Future
Other measures the Government is implementing aimed at improving skills and training include:
| • | | Rescuing TAFE – additional funding of $34 million over three years, and further ongoing funding of $0.5 million per annum from 2018-19, to restore TAFE Queensland’s status as Queensland’s premier provider of VET as part of the Rescuing TAFE election commitment. Funding will be directed at helping TAFE Queensland deliver foundation courses, increase the number of qualifications available through VET in schools and hire additional teaching and support staff. The Government will also ensure Queensland regains its reputation as a quality training provider, by establishing an independent Training Ombudsman to investigate complaints made by students and apprentices. |
| • | | Jobs Queensland – the Government is providing $40 million over four years to establish Jobs Queensland as an independent statutory authority as part of the election commitment to provide advice to government on skills demand and long-term workforce planning. |
| • | | Extending the Queensland Building and Construction Training Policy – the Government is leading by example on employing apprentices and trainees by requiring 10% of total labour hours on eligible government-funded infrastructure projects is allocated to apprentices and trainees. The Policy has been extended to include government owned corporations. |
For projects in Indigenous communities and other declared Indigenous Projects, the required labour hours must be met by Aboriginal or Torres Strait Islander apprentices and trainees and local Aboriginal and Torres Strait Islander workers. In addition, a further 10% of total labour hours for these projects must be provided toward an agreed Indigenous Economic Opportunities Plan that maximises the economic opportunities for local communities.
22
Jobs Now, Jobs for the Future
| Box 5.1 | Skilling Queenslanders for Work |
| | | | | | | | | | | | | | | | |
| | | 2015-16 | | | 2016-17 | | | 2017-18 | | | 2018-19 | |
| | | $’000 | | | $’000 | | | $’000 | | | $’000 | |
Skilling Queenslanders for Work | | | 60,000 | | | | 60,000 | | | | 60,000 | | | | 60,000 | |
The Government has reinstated the highly successful Skilling Queenslanders for Work (SQW) initiative. SQW represents a significant investment of $240 million over four years to support up to 32,000 Queenslanders into work.
The initiative is designed to boost the skills of individuals and provide assistance to those Queenslanders that require support to enter and stay in the workforce. SQW provides training to people who are under-utilised or under-employed in the labour market, as well as building the skills of young people, Aboriginal and Torres Strait Islanders, people with disability, mature-age job seekers and people from culturally and linguistically diverse backgrounds.
The initiative is supported by a state-wide regional network, working closely and forming partnerships with community organisations and local employers to determine local skills and entry-level industry and labour needs.
SQW has a proven track record of delivering Queenslanders real employment opportunities. It will also pay for itself, with an independent evaluation conducted by Deloitte Access Economics in 2012 finding that for every dollar invested in the program, it generated nearly eight dollars in return for the community.
SQW comprises a suite of six targeted skills and training programs:
| • | | Community Work Skills – will assist disadvantaged Queenslanders gain nationally recognised skills and qualifications up to a certificate III level, or to be employed on community, construction or environmental projects whilst undertaking a Work Skills Traineeship. Paid work placements in these projects will be for up to six months. |
| • | | Get Set for Work – will provide intensive employment and training assistance over a 12 month period to young, disengaged Queenslanders aged 15-19. The program is directed at transitioning youth to work, entering further training or returning them to school. |
| • | | Ready for Work – will assist young people aged 15-24 to transition into the workforce by providing six to eight week courses focused on job search assistance and training. The program will deliver basic job preparation and employability skills courses. |
| • | | Youth Skills – will provide nationally recognised training and employment support to 15-19 year olds who are subject to court orders or bail. |
| • | | First Start – will provide wage subsidies to local councils to employ additional trainees. The program will allow young people and disadvantaged job seekers to gain nationally recognised qualifications and 12 months employment by undertaking a traineeship. |
| • | | Work Start – is an incentive program that rewards private sector employers with a one-off $2,000 payment, after a qualifying period, if they employ a Queenslander in a traineeship or apprenticeship who has previously participated in a Community Work Skills, Get Set for Work, Ready for Work or Youth Skills project. |
23
Jobs Now, Jobs for the Future
The first funding round of the reinstated SQW initiative closed on 19 June 2015 with over 550 applications received. Successful projects will be announced shortly, with the second funding round opening later in 2015.
| 5.3 | Fostering emerging and innovative industries |
Another important focus for Working Queensland is fostering emerging and innovative industries by providing opportunities for research and entrepreneurship. Science and innovation is a key opportunity for Queensland’s economy, and is important if Queensland is to be competitive at a global level. By investing in research and development, we will be able to create the well-paid, knowledge-based jobs of the future, ensure workers maintain their standard of living and drive productivity improvements.
With the Queensland economy currently in the midst of a major transition from resources-led sources of growth, it has never been more important that the State continues to diversify and shift towards a knowledge-based economy.
To ensure this, the Government is delivering a $180 million Advance Queensland investment in innovation, skills, education, business development and a startup culture to deliver knowledge-based jobs now and into the future. This Advance Queensland investment is expected to co-leverage funding and generate total investment of approximately $300 million into the State.
The package delivers the Government’s Advance Queensland and Business Development Fund election commitments and includes further funding for a suite of programs to drive collaboration between researchers and industry, commercialisation of new ideas and to create an environment that boosts entrepreneurship (Boxes 5.2 and 5.3).
Other programs and initiatives the Government is implementing to foster emerging and innovative industries include:
| • | | Queensland Entrepreneurs of Tomorrow – in keeping with its election commitment, the Government is providing funding of $2 million over three years for the Queensland Entrepreneurs of Tomorrow. The program comprises two sub-programs: |
| | • | | Schools Program – providing up to $1 million over three years to support entrepreneurship through school education in computational science and business development. |
| | • | | Home Based Business Program – providing $1 million over three years to support stay-at-home parents who want to establish and develop home-based businesses, while maintaining a healthy balance between work and family (Box 5.4). |
24
Jobs Now, Jobs for the Future
| Box 5.2 | Advance Queensland |
| | | | | | | | | | | | | | | | |
| | | 2015-16 | | | 2016-17 | | | 2017-18 | | | 2018-19 | |
| | | $’000 | | | $’000 | | | $’000 | | | $’000 | |
Advance Queensland | | | 37,062 | | | | 38,082 | | | | 38,112 | | | | 22,547 | |
The Government is focused on harnessing the opportunities that are available in startups, innovative businesses and our science and research base so that the Queensland workers of today have access to the new jobs of the future.
Queensland’s geographical proximity and shared time zone with Asia and our shared tropical climate with almost half the world’s population positions us perfectly as a gateway to the fastest growing regions in the world. This presents Queensland with immense global opportunities by both building on our world recognised expertise in areas such as medical science, biotechnology and robotics, and by unlocking our untapped startup potential to turn innovative ideas into new products and services.
It is not just our geographical location, our pristine environment and our resources that make Queensland the best place to live. The source of Queensland’s enormous potential continues to be our people – our human capital. The Government is positive about Queensland’s future because we believe in the ability of the current and next generation to drive innovation, build a stronger economy and create jobs.
The Smart State investment of previous Labor governments attracted great scientists and researchers and led to the development of world leading research capability in science, technology, engineering and maths in Queensland. But the competition for global talent and investment is fierce. We are witnessing other developed and emerging economies make ever greater investments in their innovation systems.
So we need to act now if we want to remain and thrive as a global innovation hub. Advance Queensland is the next important step. We want to attract and develop the best and brightest talent in Queensland, translate our science and technology ideas into commercial and employment outcomes, and play our role in supporting a thriving startup ecosystem.
The $180 million Advance Queensland investment incorporates a range of initiatives including:
| • | | $50 million to develop, attract and retain world-class talent and skills by: |
| | • | | delivering new Fellowships and Scholarships to increase research talent |
| | • | | Global Partnership Awards to support collaboration between Queensland graduates and entrepreneurs with international companies and institutions |
| | • | | a future schools review of the teaching of science, technology, engineering and maths (STEM) including coding and computational science, ICT and robotics so that our kids have the jobs of the future |
| | • | | Knowledge Transfer Partnerships to link industry and universities through funding opportunities for small and medium enterprises (SMEs) to have people with postgraduate qualifications work in their business on an identified problem or project |
25
Jobs Now, Jobs for the Future
| • | | a $45 million investment through an Advance Queensland Future Jobs Strategy to make Queensland the nation’s largest source of investment for industry-research collaboration projects through: |
| | • | | Advance Queensland Innovation Partnerships of $25 million to support collaborative research and development projects in priority areas |
| | • | | the Advance Queensland Innovations Challenges program with $20 million to support large collaborative proposals that drive Queensland forward in areas such as agriculture, innovation, health services delivery and renewable energy. Opportunities under this program will support the development of Queensland’s emerging biofuels agenda with funding matched by partner contributions |
| • | | $2.3 million over four years to run an engagement strategy to build shared understanding across the community of the importance of science, innovation and STEM education to support the development of a vibrant knowledge-based economy. |
As a Government, we know that the real drivers of economic change are entrepreneurs and ambitious businesses. Startups can reshape the way entire industries work by displacing established players through technology and business model innovation.
Currently only 7% of Australia’s tech startups are in Brisbane. Tech startups are vital to job creation and prosperity – studies have found that each technology job created leads to five additional jobs in other sectors. So we are determined to play our role in supporting high growth, technology based businesses and help to develop the entrepreneurial skills of the workforce. This includes:
| • | | a $24 million Startup Queensland program to increase startup formation and attraction in Queensland. This will include funding: |
| | • | | for innovation advisory and skills development services |
| | • | | innovation and technology vouchers for partnering research and/or technology and SMEs |
| | • | | support to scale up successful incubators and accelerators and programs supporting startup and student entrepreneurship |
Alongside improved support for existing startups and SMEs, Government will also look to develop a new program designed to attract overseas entrepreneurs to set up in Queensland. This program will be modelled on international successes such as Startup Chile and Sirius in the UK. For domestic entrepreneurs, we will examine opportunities to offer a time-limited research and development tax credit matching program for technology startups establishing or relocating to Queensland.
| • | | a $52 million investment to improve access to finance and management support for startups and SMEs with ambition to grow in international markets through |
| | • | | a $12 million Queensland Commercialisation Program to support proof of concept projects designed to lead to new products and services |
| | • | | the $40 million Business Development Fund to provide seed co-investment to encourage greater angel and venture capital investment in Queensland businesses to help turn good ideas into a commercial reality (further details on the Business Development Fund are available in Box 5.3) |
26
Jobs Now, Jobs for the Future
We also recognise the need to diversify our economy in the face of greater competition, policy changes that could impact key markets and digital disruption. That is why we will provide dedicated funding of $1 million to work with industry and establish 10-year roadmaps and investment prospectuses for key industries such as industrial biotechnology (including biofuels) that could spur future growth in jobs and new applications for existing industries and products.
These roadmaps will target high potential areas with global growth potential. They will help to identify the policy, regulation and standard settings that can best provide the certainty to help new industries to emerge, alongside identifying priorities for investment in research, technology demonstrators and to support commercialisation.
Remaining funds will be retained to allow the flexibility to respond to new opportunities as they arise, particularly as the Government develops roadmaps with industry partners.
Arrangements for Advance Queensland are currently being developed, including guidelines and assessment processes for applications for funding, to ensure the program objectives are met and the program is well subscribed.
The suite of programs will be rolled out over August to November 2015.
27
Jobs Now, Jobs for the Future
| Box 5.3 | Business Development Fund |
| | | | | | | | | | | | | | | | |
| | | 2015-16 | | | 2016-17 | | | 2017-18 | | | 2018-19 | |
| | | $’000 | | | $’000 | | | $’000 | | | $’000 | |
Business Development Fund | | | 10,000 | | | | 10,000 | | | | 10,000 | | | | 10,000 | |
To assist emerging and innovative Queensland industries, including niche manufacturing businesses, and to ensure they have access to the startup capital they need, the Government is establishing the Business Development Fund (the Fund). The Fund will help Queensland’s best and brightest turn their ideas and innovations into a commercial reality and create jobs for Queenslanders.
The Fund will provide early stage venture capital of $40 million over the next four years to emerging and innovative Queensland businesses. Investments, up to a defined limit, will be made on a matching basis with private sector co-investors.
Administration of the Fund
QIC has been tasked to administer the Fund. A Business Development Fund Investment Panel will be established to assess proposals for co-investment. The Panel will be made up of independent experienced investors with a strong history in entrepreneurship and early stage investment, particularly in innovative startups or growing businesses. Investment proposals will be brought to the Panel by co-investors.
Investment criteria
To maximise long-term business and employment outcomes, the Fund will have a range of investment criteria, including:
| • | | businesses having the majority of their assets and employees located in Queensland |
| • | | having at least matching private sector co-investment funding |
| • | | commercialising research, an innovative idea or an innovative product or service |
| • | | creating opportunities for new high value and skilled employment. |
Investigation is currently underway on the detailed design and delivery of the Fund to leverage private sector investment in Queensland-based startup businesses. The opening of applications for funding is expected in the second half of 2015.
28
Jobs Now, Jobs for the Future
| Box 5.4 | Home Based Business Program |
The Queensland Government is making grants available to home-based entrepreneurs in what is the only program of its type in Australia.
Under the Queensland Entrepreneurs of Tomorrow Home Based Business program, funding will be available to stay-at-home parents seeking to establish or grow their home-based business.
The Government has committed $1 million over three years to support this program with funding of up to $5,000 provided to successful applicants.
Grants of up to $2,500 may be provided to stay-at-home parents to assist them to engage a consultant for professional advice, to help establish or develop a home-based business.
Successful recipients may then be eligible for matching grant funding (dollar-for-dollar) of up to a further $2,500 to make improvements or establish the business.
To be eligible for the grant, home-based business owners must have at least one child under the age of 12 residing in care for 50% of the time or more, be an Australian resident, have an Australian Business Number (ABN) and be based in Queensland.
Regional unemployment rates have risen in most regions across Queensland over the past year. Regions heavily exposed to slowing activity in the resources sector have been amongst the hardest hit. To ensure the future of our regions, a range of measures under Working Queensland are specifically designed to support regional employment.
In keeping with its election commitment, the Government is implementing Building our Regions, a $200 million Regional Infrastructure Fund to deliver critical infrastructure and jobs in regional Queensland. Funding will be targeted to meet the specific needs of communities and support economic development. In recognition of the need to invest in regional economies, funding has been brought forward by one year, with $100 million to be invested in each of 2015-16 and 2016-17, rather than 2016-17 and 2017-18 as originally announced. This scheme complements the Government’s broader infrastructure investment through the Queensland Government capital works program.
Other programs and initiatives the Government is implementing to support employment in our regions include:
| • | | Locals First – taking a ‘locals first’ approach to all new major projects and development opportunities to help local communities take full advantage of these as they emerge in Queensland regions. As part of this commitment, the Government is also undertaking a review of fly-in, fly-out (FIFO) mines where the operation is located near a resource town or regional community. An expert panel will provide recommendations to the Government on FIFO operations near regional communities. |
29
Jobs Now, Jobs for the Future
| • | | Rural Job Agency – exploring the establishment of a Rural Job Agency in conjunction with industry to provide greater opportunities for facilitating the employment of rural workers with rural employers by matching workers with appropriate skills with the employers that require them. |
| • | | Grow and promote events for Queensland – the Government is providing increased funding of $40 million over four years in keeping with its election commitment to assist Tourism and Events Queensland to grow and promote events for Queensland, particularly in the regions. The increased funding will provide an environment that allows new and exciting events to be established and expands the tourism product offerings. |
| • | | Queensland Government capital works program – the 2015-16 capital program is focused on ensuring a consistent flow of works to support jobs and the economy and reduce the risk of backlogs emerging. To ensure Government assets continue to efficiently deliver key social services and support the development of the State, capital expenditure will focus on the needs of local communities and support local employment opportunities (Box 5.5). |
| • | | Jobs generated from new infrastructure investment in regional Queensland including: |
| | • | | $90 million over four years to deliver a new primary school and a new high school in Townsville |
| | • | | a $40 million Western Roads package |
| | • | | a $24 million Regional Transport Boost |
| | • | | $25 million to revitalise the Yeppoon foreshore following Tropical Cyclone Marcia |
| | • | | $15 million to restore the Rockhampton Riverbank following Tropical Cyclone Marcia. |
30
Jobs Now, Jobs for the Future
| Box 5.5 | State Government capital works program |
| | | | | | | | |
| | | 2014-15
$’000 | | | 2015-16
$’000 | |
Capital Purchases | | | 8,169,813 | | | | 8,574,343 | |
Capital Grants | | | 1,548,671 | | | | 1,530,921 | |
The State Government plays an important role in providing essential infrastructure and capital works to meet the State’s increasing service needs and to facilitate improved productivity and efficiency for the State’s industries.
The Government’s capital works program supports a significant amount of economic activity and jobs across Queensland, particularly in the construction industry and sectors providing associated support services. While the key focus of the capital works program is meeting service needs, it does play an important role in creating employment opportunities for Queenslanders.
In 2015-16, the State’s capital works program is estimated to be $10.105 billion (including $1.531 billion in capital grants predominantly to local governments and non-state schools).
The Government will invest $3.931 billion in capital expenditure on roads and transport infrastructure. There will be a continuation of the reconstruction effort following Tropical Cyclone Marcia and other natural disasters of 2013 to 2015. In addition, there will be significant investments in health, education, housing and other services, to address population growth and improve the productivity and prosperity of the State.
The Government is committed to providing a consistent flow of capital works across the State and ensuring Government assets continue to meet the needs of Queenslanders. To help achieve this, capital expenditure will focus on the needs of local communities and support local employment opportunities.
Queensland Treasury estimates that the construction component of the State’s capital works program in 2015-16 will directly support approximately 27,500 full-time equivalent jobs in Queensland. The capital works program is also likely to result in significant flow-on employment impacts in other sectors of the economy.
Table 5.1 outlines the regional impacts of the Government’s 2015-16 capital works program, identifying major projects in the construction phase, total capital expenditure and the estimated employment impacts.
31
Jobs Now, Jobs for the Future
| Table 5.1 | Regional capital works and associated employment impacts |
| | | | | | | | | | | | |
Region | | Key projects1 | | Total capital
purchases and
grants
$’000 | | | Estimated
employment
supported2 | |
Brisbane | | • | | Gateway Motorway North | | | 2,166,067 | | | | 6,000 | |
| | • | | Lawnton to Petrie, Third Track | | |
| | | | |
Ipswich | | • | | New Generation Rollingstock and Wulkuraka Maintenance Centre | | | 484,049 | | | | 1,500 | |
| | • | | Energex Sub Transmission - Ipswich | | |
| | | | |
Wide Bay | | • | | Meandu Mine | | | 572,545 | | | | 1,500 | |
| | • | | Tarong Power Station | | |
| | | | |
Darling Downs | | • | | Toowoomba Second Range Crossing | | | 1,126,554 | | | | 3,000 | |
| | • | | Warrego Highway (Toowoomba - Dalby) | | |
| | | | |
Gold Coast | | • | | Carrara Precinct | | | 1,193,814 | | | | 3,000 | |
| | • | | Coomera To Helensvale Rail Duplication | | |
| | | | |
Mackay | | • | | Peak Downs Highway | | | 350,907 | | | | 1,000 | |
| | • | | Mackay Base Hospital Redevelopment | | |
| | | | |
Outback | | • | | Outback Social Housing | | | 832,633 | | | | 2,500 | |
| | • | | Peninsula Developmental Road (Coen – Weipa) | | |
| | | | |
Cairns | | • | | Cairns Hospital Redevelopment | | | 443,797 | | | | 1,000 | |
| | • | | Cairns Social Housing | | |
| | | | |
Fitzroy | | • | | RG Tanna Coal Terminal Projects | | | 892,897 | | | | 2,500 | |
| | • | | Stanwell Power Station | | |
| | | | |
Sunshine Coast | | • | | Sunshine Coast Public University Hospital | | | 1,499,069 | | | | 4,000 | |
| | • | | Moreton Bay Rail Link, Petrie Station to Kippa-Ring Station | | |
| | | | |
Townsville | | • | | Bruce Highway, Townsville Ring Road (Stage 4) | | | 542,932 | | | | 1,500 | |
| | • | | Townsville Social Housing | | |
Notes:
| 1. | Selected key projects in the construction phase during 2015-16. Total capital purchases and grants include a range of projects not listed. |
| 2. | Estimated direct employment, derived from a conservative estimate of the direct employment impacts of each $1 million spent on the construction component of capital works. In addition to the direct employment supported in the construction industry and the construction services sector, the Government capital works program is also likely to result in significant flow-on employment impacts in other sectors of the economy. |
Source: Queensland Treasury.
32
Jobs Now, Jobs for the Future
| 5.5 | Boosting the delivery of government and social services |
The Government is committed to boosting social service delivery, particularly in areas such as education and health. To provide these services, the Government is increasing the number of frontline jobs across the public sector, in particular more teachers and nurses. Boosting social service delivery will not only direct much needed resources into these valuable areas, but will also directly create hundreds of jobs for Queenslanders.
The Government is implementing a number of programs and initiatives to boost the delivery of government and social services including:
Extra Teachers
To help improve our schools, this Budget delivers the Government’s commitment to boost teacher numbers. The Government is providing additional funding of $152.4 million over three years and ongoing funding of $96.3 million per annum as part of the Government’s election commitment to provide an extra 875 teachers, with 275 specialist teachers directed to high schools.
Every Queensland high school will be eligible to benefit from the employment of an additional senior teacher to specialise in an area of learning or area of need. This will improve the delivery of the necessary skills and learning our children need to be successful in the workforce.
This $248.7 million commitment will help take the pressure off growing class sizes. It is an investment in our State’s future human capital.
Refresh Nursing
The Government is serious about improving patient safety in our public hospitals and establishing safe nurse to patient ratios. To help achieve this, the Government will boost the number of front line nurses in Queensland hospitals and re-invigorate the Queensland nursing and midwifery workforce.
The Government is providing funding of $110.7 million over four years in addition to internal funding to deliver on its Refresh Nursing election commitment to support up to 4,000 new one year graduate nursing places in our Hospital and Health Services.
Nursing Guarantee
The Government is also providing funding of $101.6 million in addition to internal funding over four years to deliver on its election commitment to support 400 Nurse Navigator positions in Hospital and Health Services across Queensland. These positions will work with patients, assisting them to navigate across the health system.
33
Jobs Now, Jobs for the Future
Queensland National Disability Insurance Scheme Launch Site
In keeping with the election commitment, the Government is providing additional funding of $1.9 million in 2015-16 to fund a National Disability Insurance Scheme (NDIS) launch site in Queensland. Additional funds will enable up to 600 people with a disability to progressively commence access to reasonable and necessary services and fund NDIS participant and provider readiness activities for the launch.
The Government will also continue to work closely with the health and community service industry to ensure an appropriately skilled workforce is available to meet the growth in labour demand expected in the social services sector as the NDIS is rolled out across the State.
34
Jobs Now, Jobs for the Future
The policies and initiatives being implemented under Working Queensland will help grow the State’s economy and improve opportunities for Queenslanders to gain employment in the short, medium and longer term.
Given the economic challenges the State faces in the short term and the significant demographic and structural changes expected to impact on the labour market in the longer run, the Queensland Government will play an important ongoing role in helping address these issues.
In line with several key elements of Working Queensland, an important focus of the Government’s further employment policy development will be on creating the economic environment and conditions to encourage business and industry to develop, invest, grow and innovate.
To inform the direction of this policy development, the Government will continue to consult closely with stakeholders and the community on how best to reduce costs and red tape for business, encourage and facilitate private sector investment in key economic and social infrastructure, and improve the productivity, efficiency and competitiveness of the State’s industries.
This consultation will include a focus on creating employment opportunities in rural and regional areas, as well as supporting the growth of emerging and innovative industries.
Hand in hand with policies to enhance the demand for employment, the Government will continue to work with industry, the not-for-profit sector, and employer and employee organisations to ensure Queenslanders have access to the education, training and skills development they need to take advantage of new employment opportunities.
It will also be important the Government’s ongoing policy development includes a strong focus on those job seekers and labour market participants who have historically experienced less favourable employment outcomes. This will include specific policies and programs for
| • | | Queenslanders with a disability |
| • | | Aboriginal and Torres Strait Islanders |
In addition, policy development will focus on
| • | | region-specific employment |
| • | | sector and industry specific employment |
| • | | enhancing workforce participation |
35
Jobs Now, Jobs for the Future
The Government has made a commitment to improve employment outcomes for all Queenslanders. The $1.6 billion package of employment policies and programs included in this Budget will help achieve this aim by boosting the confidence of business to create jobs, increasing the productivity of Queensland’s labour force through skills development, fostering emerging and innovative industries and supporting investment in productive infrastructure.
Leveraging off the Working Queensland initiatives, the Government’s ongoing efforts to work with stakeholders and the community on additional approaches to improve employment demand and ensure an adequately skilled labour supply should help create a significant and sustainable improvement in employment outcomes for all Queenslanders.
36
Queensland Budget 2015-16
Jobs Now, Jobs for the Future - Queensland Government employment plan
www.budget.qld.gov.au
Queensland Budget 2015-16
Jobs Now, Jobs for the Future - Queensland Government employment plan
www.budget.qld.gov.au