EXHIBIT (c)(iii)
Budget Papers of the Co-Registrant for 2018-19.
FORWARD-LOOKING STATEMENTS
This exhibit contains forward-looking statements. Statements that are not historical facts, including statements about the State of Queensland’s (the “State” or “Queensland”) beliefs and expectations, are forward-looking statements. These statements are based on current plans, budgets, estimates and projections and therefore you should not place undue reliance on them. The words “believe”, “may”, “will”, “should”, “estimate”, “continue”, “anticipate”, “intend”, “expect”, “forecast” and similar words are intended to identify forward-looking statements. Forward-looking statements speak only as of the date they are made, and neither the Queensland Treasury Corporation nor the State undertake any obligation to update publicly any of them in light of new information or future events.
Forward-looking statements are based on current plans, estimates and projections and, therefore, undue reliance should not be placed on them. Although the Queensland Treasury Corporation and the State believe that the beliefs and expectations reflected in such forward-looking statements are reasonable, no assurance can be given that such beliefs and expectations will prove to have been correct. Forward-looking statements involve inherent risks and uncertainties. We caution you that actual results may differ materially from those contained in any forward-looking statements.
A number of important factors could cause actual results to differ materially from those expressed in any forward-looking statement. Factors that could cause the actual outcomes to differ materially from those expressed or implied in forward-looking statements include:
| | • | | the international and Australian economies, and in particular the rates of growth (or contraction) of the State’s major trading partners; |
| | • | | the effects, both internationally and in Australia, of any subsequent economic downturn, the effect of ongoing economic, banking and sovereign debt risk, and any stalling of the protracted United States recovery; |
| | • | | increases or decreases in international and Australian domestic interest rates; |
| | • | | changes in the State’s domestic consumption; |
| | • | | changes in the State’s labor force participation and productivity; |
| | • | | downgrades in the credit ratings of the State and Australia; |
| | • | | changes in the rate of inflation in the State; |
| | • | | changes in environmental and other regulation; and |
| | • | | changes in the distribution of revenue from the Commonwealth of Australia Government to the State. |
Queensland Budget 2018-2019
BUDGET SPEECH
Budget Paper No.1
budget.qld.gov.au

2018-19 Queensland Budget Papers
1. Budget Speech
2. Budget Strategy and Outlook
3. Capital Statement
4. Budget Measures
5. Service Delivery Statements
Appropriation Bills
Budget Highlights
The Budget Papers are available online at budget.qld.gov.au
© Crown copyright
All rights reserved
Queensland Government 2018
Excerpts from this publication may be reproduced, with appropriate
acknowledgement, as permitted under the Copyright Act.
Budget Speech
Budget Paper No.1
ISSN 1445-4890 (Print)
ISSN 1445-4904 (Online)

Appropriation Bill 2018
(First reading speech, 12 June 2018)
The Honourable Jackie Trad MP
Deputy Premier
Treasurer
Minister for Aboriginal and Torres Strait Islander Partnerships
Mr Speaker,
I move that the Bill be now read a first time.
I’m proud today to present the Palaszczuk Labor Government’s fourth Budget.
This is a Budget for all of Queensland.
This is a Budget for all Queenslanders.
From baby Elizabeth Mackenzie – the 5 millionth Queenslander born last month – to the traditional owners on the land on which we stand, the Jagera, Yuggera and Turrbul People.
Whether you live in Brisbane or Blackall.
Labor is doing the things we said we’d do.
No surprises – no excuses.
Queenslanders are living through an era of growth and rapid change.
Our population is one of the fastest growing in the nation.
Technology continues to transform the way we live and work.
The Palaszczuk Labor Government will help our communities to navigate the challenges of change and set a course for the opportunities of growth.
1
We will equip our workers on the frontline of a fast-changing world with the skills and support to succeed.
We will encourage innovation and give businesses and industry the confidence to grow.
We will direct every effort to our number one priority – jobs for Queenslanders.
Here’s how.
By delivering the infrastructure, skills and services that our strong, diversified economy needs.
By including everyone in the benefits regardless of who you are or where you live.
That is our strategy for this State.
That is the job for this Government.
That is the plan in the Budget I deliver today.
We begin with the largest capital works program since the 2011 flood recovery.
Building the infrastructure for a productive, strong and sustainable economy.
Supporting growth without compromising our quality of life.
Delivering jobs in construction today and supporting the jobs of the future.
Mr Speaker, this Queensland Government must do the heavy lifting in infrastructure investment because this Federal Government simply will not.
And this Labor Government must keep repairing the damage inflicted by the last LNP Government’s savage cutbacks to frontline services.
More doctors, nurses, teachers, police and firefighters.
The people who work so hard delivering excellent essential services every day.
The professionals who educate our kids, keep Queenslanders healthy and protect our communities from harm.
More infrastructure, better services – this is what we said we would do.
Budget outcome
Mr Speaker, Queensland’s economy has grown by 7.2 per cent in real terms since December quarter 2014.
Today, I can announce that we expect a surplus of $1.512 billion in 2017-18 – more than three times the size of the Mid-Year Fiscal and Economic Review forecast.
The Budget also forecasts operating surpluses over the forward estimates, starting with $148 million in 2018-19.
2
And economic growth is forecast to accelerate from 2.5 per cent in 2016-17 to 3 per cent by 2018-19.
Our responsible budget management is part of this success story, but it would be impossible without our job generating initiatives that build business confidence and open up opportunities for growth and investment.
This is a time of growth – and it is also a time of change.
The Queensland economy continues to successfully shift from the big economic gains of a never before seen resource boom that brought with it massive investment, big infrastructure and jobs and wages growth.
Business investment is rebounding following the construction of the liquefied natural gas infrastructure.
It’s supported by a range of renewable energy projects that will be a key driver of economic growth.
We are rolling out a nation-leading renewable energy industry with an estimated $4.2 billion pipeline of projects underway or financially committed across the State.
This Budget delivers surpluses, builds new infrastructure, grows the State’s skills and expands our services – all to support a growing and changing State.
Creating jobs, delivering infrastructure
Queensland now has the second highest annual employment growth rate in the country.
Employment growth is forecast to strengthen to 23⁄4 per cent over the year to June quarter 2018, the strongest growth in more than a decade.
More than 150,000 jobs have been created since we came to Government. That’s equivalent to almost 4000 new jobs in Queensland every month since January 2015.
These are big numbers – but behind these numbers are people.
Queenslanders who now have a place in our economy and hope for the future.
And in this Budget - through our $45.8 billion infrastructure pipeline over the next four years – Queenslanders will continue to have a place in our economy.
It’s an increase of more than $3 billion on last year’s Budget – directly supporting 38,000 jobs this year alone.
Our plan means tens of thousands of additional jobs each year, and our plan means building the essential infrastructure to meet the needs of our fast-growing State.
From the Cairns Convention Centre to Cross River Rail, the M1 and Bruce Highway upgrades to Rookwood Weir and Townsville Stadium we are delivering the right projects, in the right place, at the right time.
3
Building the economy of the future
Rapid change all around us means Queensland must become a more diverse and productive economy.
Securing our modern industries and creating jobs that will be there for years to come.
To do that, this Budget invests in innovation and anticipates areas of emerging opportunity.
Let’s take the example of the waste disposal levy announced earlier this year.
We will not allow Queensland to be a dumping ground for interstate waste – we all saw this when the LNP’s short-sightedness in removing the levy led to a procession of dump trucks across our border.
But this measure is also an opportunity to invest in new and emerging industries and technology.
And today I am announcing a $100 million down payment over the next three years into a new Resource Recovery Industry Development Program.
This initiative will support innovation and investment in recycling and help new industries that manufacture products using recycled waste and create future jobs.
There’s also the Palaszczuk Government’s flagship Advance Queensland strategy.
Advance Queensland keeps turning good ideas into commercial reality.
We are backing business and industry to help give them an edge in a highly competitive world.
So, in this Budget, we are investing a further $123 million in backing our entrepreneurs, funding industry research fellowships and helping small to medium businesses innovate, grow and create jobs.
And, Mr Speaker, there’s the Industry Attraction Fund.
As well as supporting our home-grown businesses in the path to success we want to attract new businesses and knowledge industries from interstate and overseas.
I want these businesses, their ideas and above all their jobs to call Queensland home.
That’s why this Budget extends the Fund with $40 million over two years towards bringing interstate and international businesses here and helping locally-based businesses expand.
The Business Development Fund, which turns ideas into commercial reality, will also be extended with $40 million over the next two years.
And a further $20 million for the Jobs and Regional Growth Fund brings new funding to $100 million.
We want the new jobs in these new industries and businesses hiring skilled Queensland workers.
So, in this Budget, we are investing $175.5 million to help people return to the workforce through the Back to Work program.
And we will deliver a further $180 million in the Skilling Queenslanders for Work program to deliver more training opportunities and workforce participation.
4
Supporting small business
Like others in this Parliament, I grew up in a family that ran a small business.
My family felt the pressures, the strains, the setbacks, but also reaped the rewards.
I’m proud to be in a Government that backs small business.
We need to give employers the confidence to invest in the workforce they need to succeed.
That’s why today I am announcing that the 50 per cent payroll tax rebate scheme will be extended to June 2019 supporting up to 26,000 apprentices and trainees.
Our Buy Queensland approach also ensures local businesses, jobs and better social outcomes are all front and centre when taxpayer dollars are spent.
The ecoBiz program for small to medium businesses provides increased funding of $3.9 million over four years to help them identify and achieve savings and eco-efficiencies across energy, water and waste.
The challenge of moderate wage growth
Our economic plan – more infrastructure, better skills – will create jobs, lift demand for labour, and help support wages growth in the medium and longer term.
Mr Speaker, I was pleased to see the Fair Work Commission recently decided to increase the national minimum wage by 3.5 per cent.
But while we are more productive than we were just 10 years ago modest wage growth is putting households under strain.
Hard working Queensland families who battle through each day are not keeping up – something we simply can’t ignore.
This has a broader economic impact too.
Modest wage growth constrains growth in household income, one of the key drivers of household consumption.
As a result, employment and businesses suffer.
We need to see stronger private sector wage growth.
This Budget will make a difference.
Supporting growth throughout Queensland
It doesn’t matter where you are you must have the right transport and road infrastructure.
The alternative is more Queenslanders sitting in traffic away from their job or away from their kids – we either allow congestion to build or we build the infrastructure we need.
In a fast-growing state, investing in key infrastructure supports job creation, it boosts business confidence and it delivers the services Queenslanders need to maintain our way of life.
5
Our delivery of the $5.4 billion Cross River Rail project recognises this.
Sadly, the Federal Government and those opposite don’t.
During the five-year construction period, Cross River Rail will support an average of 1,500 jobs each year, and up to 3,000 jobs in the most intensive year of construction.
I am pleased to say that today’s Budget also includes an investment of $21.7 billion over the next four years in the Queensland Transport and Roads Investment Program (QTRIP).
This is the third year in a row the Palaszczuk Government has made a record investment in road and transport infrastructure and is an increase of around $700 million on last year’s commitment.
Supporting regional Queensland
We know that Queensland is the most decentralised state in Australia with some of the country’s largest cities and important economic zones outside the South East corner.
We also know that we don’t have a strong Queensland without Strong Regions.
That’s why 65 per cent of our infrastructure spend this year is outside the Greater Brisbane area.
We will build key infrastructure like Rookwood Weir, Cairns Convention Centre and Townsville Stadium.
Through QTRIP we’re investing more than $800 million for works in our State’s West.
The Works for Queensland program supports job creating maintenance and minor works across our regions in partnership with local Councils.
This Budget provides more than $200 million over three years to extend the fund.
We also commit up to $34.6 million to continue drought relief this year. And more than $19 million over three years for rural and regional programs that support jobs and drive economic development.
Give all our children a great start
This Budget delivers for the economy and jobs, industry and regions.
It is a Budget of the head – but it is also a Budget of the heart.
And at the heart of any Labor Budget is education.
Education is fundamental to every public good that progressive politics values.
Equality of opportunity, fairness, skills for the economy today, rewarding work in the future, human progress and knowledge itself.
None of this is possible without leadership, imagination, investment and reform in schools.
This Budget makes a record education and training investment of more than $14 billion this year.
Since March 2015, we have employed more than 4,700 extra teachers and teacher aides.
6
We said we would employ 3,700 additional teachers over four years.
In this Budget we do it.
We will upgrade and improve schools across the State with a further $308 million to the Building Future Schools fund – bringing the total investment to $808 million.
There will be new high schools at Coomera, Yarrabilba, Ripley and Mango Hill, a new primary school at Ripley and a new special school at Caboolture.
We will also refurbish, upgrade or improve more than 48 state primary and high schools.
We will redevelop TAFE facilities in Townsville, Cairns, Mount Gravatt, Toowoomba, the Gold Coast and the Redlands with an investment of up to $85 million over three years.
Mr Speaker, even before their first day in the classroom, Queensland kids benefit from developing a love of reading from an early age.
As a parent, I know and understand that one of the greatest gifts you can give your child even before they enter the Prep classroom is a love of reading – it sets a child up for life.
But I also know that not every parent has the skills or resources to pass on this gift.
That’s why the First 5 Forever program – which links parents of kids under five to resources at public libraries across the State – matters so much.
So, in this Budget, we invest $20 million over four years to continue the First 5 Forever program’s vital work.
Keeping Queenslanders healthy
This is a Budget for all Queensland, and a Budget for all Queenslanders.
Our people, whatever their age, wherever they live, should be able to get the healthcare they need.
This Budget provides a record $17.3 billion operating Budget for Queensland Health, and $985 million in capital investments to deliver first-class health services and facilities for Queenslanders.
Since March 2015, this Government has been rebuilding frontline health services savaged under the LNP.
We have employed more than 4,800 extra nurses, 1,600 doctors and 370 ambulance officers.
But it’s not just enough to repair the LNP’s damage, we must create excellent and responsive services for Queenslanders when they need it most – when they need hospital care.
We are building better hospitals, health facilities and emergency departments.
… including in Hervey Bay and Gladstone, Roma, Blackall, Kingaroy and Maryborough;
… with planned redevelopments at Logan, Caboolture and Ipswich Hospitals;
7
… and a new adolescent mental health facility at the Prince Charles Hospital in Brisbane.
These investments are working.
Services are improving.
We are making the positive changes to help patients make the most of a modern healthcare system.
We said we would employ an additional 400 nurse navigators to help Queenslanders navigate the often complex system of tertiary health care.
This Budget does just that.
We said we would employ an extra 100 midwives to help birthing mothers with the life changing event of bringing a baby into this world.
This Budget does just that.
Keeping our communities safe
Mr Speaker, our frontline heroes work to keep our communities safe every day and every night.
This Budget gives Queensland more police, domestic violence officers and firefighters.
We said we would add 400 officers to areas of need across Queensland over the next four years.
This Budget does that.
In a world where keeping us safe requires cutting edge support, we are investing in a Police Security and Counter-Terrorism Command, training for 85 new counter terrorism officers and specialists, and building the Counter Terrorism and Community Safety Training Centre at Wacol.
In times of natural disaster, Queenslanders know they can count on our world-renowned emergency service workers.
So, in this Budget, I announce more than $103million to deliver on our election commitment of 100 additional firefighters over the next four years, and new firefighting equipment and upgraded emergency services facilities; this is to ensure that in our disaster-affected State our fire and emergency responses remain second to none.
Protecting the Great Barrier Reef
This Government knows we need to take action now to protect our environment for the future.
The Great Barrier Reef is a natural wonder of staggering beauty.
It is also an invaluable asset when it comes to our future economic prosperity.
The Reef must survive.
We must clean up the water running into the Reef and continually invest in the science and research that will help better protect the ocean.
8
That’s why this Budget makes a record investment of $330 million over five years to protect the Reef.
No greater asset needs our protection than our Great Barrier Reef.
That’s why the Palaszczuk Labor Government banned dumping of dredge spoil in the Caley Valley Wetlands and at sea within the World Heritage Area.
That’s why we’ve created the net-free free fishing zones – in Cairns, Rockhampton and Mackay – to protect sensitive eco-systems and prohibited port development within the Fitzroy River Delta.
That’s why we reinstated our nation-leading laws to stop tree clearing in Great Barrier Reef catchments and right across our State.
And that’s why we established the Great Barrier Reef Water Science Taskforce.
Future funding decisions to save the Great Barrier Reef will be steered by science – not poisoned by politics.
Growing tourism
The preservation of our State’s natural beauty is directly linked to the success of one of our economic powerhouses – tourism.
People from all over the world travel great distances to come here to enjoy our unique experiences and natural encounters that we, Queenslanders, have in our own backyard.
This Budget invests an additional $94.6 million over five years under the Growing Tourism, Growing Tourism Jobs initiative.
This includes more than $48 million for the Attracting Tourism Fund – which provides incentives to attract new international airline routes and cruise ships.
It includes $46 million for the Regional Tourism Infrastructure and Experience Development program and Outback Tourism Infrastructure Fund to help communities grow tourism.
A further $2.2 million over two years will expand and refurbish the Australian Workers Heritage Centre at Barcaldine.
There is no doubt that investment in tourism and events is vital for our future economic success and delivers long term benefits.
Our Commonwealth Games in April this year was so much more than 11 days of sport before a global audience.
It created the impetus for additional Government and private sector investments of more than $2.6 billion.
It will also leave a positive legacy of better transport, and better sports and community facilities that will last for decades.
In Brisbane, right now, we have game-changing developments that will not only generate jobs and support economic growth but fundamentally reshape our capital and position it as a modern, global destination of choice.
9
Queens Wharf, the proposed Eagle Street Pier, Howard Smith Wharves and Brisbane Live projects can build a city that is a beacon of sustainable progress in a modern economy.
We will work with the private sector every step of the way to see these projects to success.
Brisbane’s cultural precinct, already one of the best in the country, will be enhanced even further with $125 million towards a new theatre at the Queensland Performing Arts Centre.
It is the largest arts infrastructure investment since GOMA.
A responsive Government
Mr Speaker, Labor Governments help out those doing it tough.
We understand Queenslanders in need are feeling cost of living pressures.
Government has a responsibility to help and we will do just that.
As part of our commitment to reduce cost of living impacts on households and small business the Budget provides $5.6 billion in concessions – an increase of $200 million on last year.
And Labor Governments right past wrongs.
We will join the National Redress Scheme – a key recommendation of the Royal Commission into Institutional Responses to Child Sexual Abuse.
While no amount of money can ever return a lost childhood, our commitment of more than $500 million will support healing and recovery.
And Mr Speaker, we know we must continue the job of Reconciliation with Australia’s First Nations People and increase our efforts to close the gap in health, education and life outcomes between Indigenous and non-Indigenous Queenslanders.
Fundamental to closing the gap is a roof over your head.
Without that you can’t address poor health or literacy outcomes.
That’s why it was particularly heartless that the Federal Government decided to walk away from a 50-year tradition of funding housing in remote Indigenous communities in Queensland.
We will work hard to close the gap, supporting our Aboriginal and Torres Strait Islander communities.
And that’s why I announce that this Budget will invest $239 million to improve housing options for Aboriginal and Torres Strait Islander Queenslanders.
10
Conclusion
Mr Speaker, whether you are in Biloela or Brisbane, Caloundra or Cunnamulla, Lockhart River or Logan – this Budget delivers for all of Queensland.
We said we would build more infrastructure and deliver better services.
We said we would grow jobs and steer the economy through change.
We said we would deliver for the whole of Queensland and every Queenslander.
We said we had plans for education and health, community safety and communities in need, for the Great Barrier Reef and tourism.
This is a Budget for prosperity.
Today, we deliver for our economy’s future.
This is a Labor Budget.
Today, we deliver fairness.
This is a Queensland Budget.
Today, we deliver for Queenslanders.
I commend the Bill to the House.
11
Queensland Budget 2018-19 Budget Speech Budget Paper No.1
Queensland Budget 2018-19
Budget Speech Budget Paper No.1
budget.qld.gov.au
Queensland Budget 2018-19
BUDGET STRATEGY AND OUTLOOK
Budget Paper No.2
budget.qld.gov.au
2018–19 Queensland Budget Papers
1. Budget Speech
2. Budget Strategy and Outlook
3. Capital Statement
4. Budget Measures
5. Service Delivery Statements
Appropriation Bills
Budget Highlights
The Budget Papers are available online at budget.qld.gov.au
© Crown copyright
All rights reserved
Queensland Government 2018
Excerpts from this publication may be reproduced, with appropriate
acknowledgement, as permitted under the Copyright Act.
Budget Strategy and Outlook
Budget Paper No.2
ISSN 1445-4890 (Print)
ISSN 1445-4904 (Online)
Budget Strategy and Outlook 2018-19
State Budget
2018-19
Budget Strategy and Outlook
Budget Paper No. 2
Budget Strategy and Outlook 2018-19
Contents
| | | | | | |
| |
Overview | | | 1 | |
| | |
1 | | Economic plan – creating jobs and prosperity in a growing Queensland | | | 7 | |
| | |
1.1 | | Key elements of the economic plan | | | 8 | |
1.2 | | Increasing the economic opportunities available to Queenslanders | | | 10 | |
1.3 | | Enhancing the capacity of Queenslanders to access and capitalise on opportunities | | | 18 | |
1.4 | | Ensuring all Queenslanders share in the increased prosperity and quality of life | | | 20 | |
| | |
2 | | Economic performance and outlook | | | 22 | |
| | |
2.1 | | International conditions | | | 23 | |
2.2 | | National conditions | | | 24 | |
2.3 | | Queensland conditions and outlook | | | 24 | |
| | |
3 | | Fiscal strategy and outlook | | | 34 | |
| | |
3.1 | | Context | | | 35 | |
3.2 | | Key fiscal aggregates | | | 35 | |
3.3 | | Fiscal strategies | | | 37 | |
3.4 | | Achievement of fiscal principles | | | 48 | |
| | |
4 | | Revenue | | | 50 | |
| | |
4.1 | | 2017-18 estimated actual | | | 51 | |
4.2 | | 2018-19 revenue by category | | | 52 | |
4.3 | | 2018-19 Budget initiatives | | | 53 | |
4.4 | | Queensland’s revenue trends | | | 54 | |
4.5 | | Taxation revenue | | | 55 | |
Budget Strategy and Outlook 2018-19
| | | | | | |
4.6 | | Grants | | | 60 | |
4.7 | | Royalty revenue | | | 62 | |
4.8 | | Sales of goods and services | | | 66 | |
4.9 | | Interest income | | | 67 | |
4.10 | | Dividend and income tax equivalent income | | | 67 | |
4.11 | | Other revenue | | | 68 | |
| | |
5 | | Expenses | | | 69 | |
| | |
5.1 | | 2017-18 estimated actual | | | 69 | |
5.2 | | 2018-19 Budget and out-years | | | 70 | |
5.3 | | Expenses by operating statement category | | | 71 | |
5.4 | | Operating expenses by purpose | | | 80 | |
5.5 | | Departmental expenses | | | 81 | |
| | |
6 | | Balance sheet and cash flows | | | 84 | |
| | |
6.1 | | Context | | | 84 | |
6.2 | | Balance Sheet | | | 85 | |
6.3 | | Cash flows | | | 91 | |
| | |
7 | | Intergovernmental financial relations | | | 92 | |
| | |
7.1 | | Federal financial arrangements | | | 93 | |
7.2 | | Australian Government funding to the states | | | 95 | |
7.3 | | Australian Government funding to Queensland | | | 96 | |
7.4 | | GST revenue payment | | | 97 | |
7.5 | | Payments to Queensland for specific purposes | | | 99 | |
7.6 | | State-local government financial relations | | | 104 | |
| | |
8 | | Public Non-Financial Corporations Sector | | | 107 | |
| | |
8.1 | | Context | | | 108 | |
Budget Strategy and Outlook 2018-19
| | | | | | |
8.2 | | Finances and Performance | | | 115 | |
| | |
9 | | Uniform Presentation Framework | | | 123 | |
| | |
9.1 | | Context | | | 123 | |
9.2 | | Uniform Presentation Framework financial information | | | 123 | |
9.3 | | Reconciliation of net operating balance to accounting operating result | | | 133 | |
9.4 | | General Government Sector time series | | | 133 | |
9.5 | | Other General Government uniform presentation framework data | | | 135 | |
9.6 | | Contingent liabilities | | | 138 | |
9.7 | | Background and interpretation of uniform presentation framework | | | 139 | |
9.8 | | Sector classification | | | 141 | |
9.9 | | Reporting entities | | | 142 | |
| |
Appendix A: Concessions statement | | | 145 | |
| |
A.1 Concessions summary | | | 147 | |
A.2 Concessions by agency | | | 148 | |
A.3 Concessions by entity – Government-owned Corporations | | | 173 | |
| |
Appendix B: Tax expenditure statement | | | 175 | |
| |
The tax expenditure statement | | | 176 | |
Discussion of individual taxes | | | 178 | |
| |
Appendix C: Revenue and expense assumptions and sensitivity analysis | | | 181 | |
| |
Taxation revenue assumptions and revenue risks | | | 182 | |
Royalty assumptions and revenue risks | | | 183 | |
Sensitivity of expenditure estimates and expenditure risks | | | 184 | |
| |
Appendix D: Fiscal aggregates and indicators | | | 185 | |
Budget Strategy and Outlook 2018-19
Overview
The 2018-19 Budget delivers on the commitments made by the Palaszczuk Government and will deliver the infrastructure to create jobs and the services that our State’s growing population needs.
The key initiatives outlined in the 2018-19 Budget align with the Palaszczuk Government’s clear economic plan to drive economic growth, create more jobs and improve prosperity by:
| • | | increasing the economic opportunities available to Queenslanders |
| • | | enhancing the capacity of Queenslanders to access and capitalise on these opportunities |
| • | | ensuring all Queenslanders share in the prosperity and improved quality of life these opportunities deliver. |
Delivering infrastructure
With the State’s population growing over recent decades to more than five million, the Government’s $45.8 billion capital works program over the four years to 2021-22 will support the ongoing delivery and facilitation of key economic and social infrastructure to meet the needs of Queensland families, businesses and communities.
The Government’s substantial infrastructure investment directly generates significant employment during the construction phase. More importantly, it creates future jobs, encourages private sector investment and increases the productivity, efficiency and competitiveness of the State’s businesses and industries.
The $11.6 billion capital works program in 2018-19 is estimated to directly support more than 38,000 jobs.
Importantly, to meet the needs of Queensland’s growing population, the Government’s 2018-19 capital works program includes a $4.9 billion investment in roads and transport infrastructure. This includes an allocation of $733 million for the Cross River Rail Delivery Authority in 2018-19 to continue to progress the planning, procurement and development associated with the $5.4 billion Cross River Rail project. In addition, $200 million will be spent to widen the Bruce Highway from four to six lanes between Caloundra Road and the Sunshine Motorway and $22 million in 2018-19 will be spent on two new jointly-funded M1 Pacific Motorway projects. These two new projects have a total cost of approximately $1.8 billion.
The 2018-19 capital program also includes significant capital purchases related to health ($985.5 million) and education ($674.3 million), as well as substantial investment in housing, justice and public safety infrastructure. Significant capital investment in the energy and water portfolios in 2018-19, of $2.2 billion and $277 million respectively, will help deliver cost effective, safe, secure and reliable energy and water supply across the State.
Other highlights of the 2018-19 capital program include:
| • | | $534.3 million to continue the Toowoomba Second Range Crossing project |
| • | | $115 million to construct the Mackay Ring Road (Stage 1) |
1
Budget Strategy and Outlook 2018-19
| • | | $125.2 million for new classrooms and other infrastructure in state secondary schools to accommodate six full cohorts in 2020 |
| • | | $94.5 million to further address enrolment growth pressures in state schools as part of the Building Future Schools fund |
| • | | $28.7 million as part of $679 million for the Building Better Hospitals program, to redevelop Logan, Caboolture and Ipswich hospitals, commence planning and business case development for the Wide Bay Burnett region, and refurbish three Cancer Council Queensland lodges |
| • | | $339.1 million towards the construction and upgrade of the social housing stock. |
Across the State, the Government’s investment in public infrastructure will drive transformative change, encourage private investment and make our communities better places to live.
Skill and jobs creation programs
The Palaszczuk Government remains committed to ensuring all Queenslanders have the skills and opportunities to participate and prosper in the State’s economy.
The formation of the Department of Employment, Small Business and Training demonstrates this commitment and creates significant opportunities to achieve policy and service delivery synergies in driving small business growth and enhancing the employment, skills and training opportunities available to Queenslanders.
The $369 million Back to Work initiative is designed to give Queensland employers the confidence to hire eligible jobseekers. Support payments of up to $20,000 are available for eligible employers, with funding committed across regional Queensland and targeted areas of South East Queensland for applications received by 30 June 2020.
The Skilling Queenslanders for Work initiative continues to be a key element of the Government’s focus on employment, training and skills development, with a further $180 million committed over three years in the 2017-18 Mid-Year Fiscal and Economic Review. Through a suite of targeted skills and training programs, this funding supports skills development, training, and job opportunities for unemployed, disengaged or disadvantaged Queenslanders.
Increasing frontline services
This Budget delivers the services that Queenslanders rely on. Since March 2015, an additional 3,634 teachers and 1,135 teacher aides have been employed to provide our children the best possible start. As part of the Government’s focus on ensuring effective and better delivery of health services an additional 1,605 doctors, 4,828 nurses, and 1,488 health practitioners, professionals and technical staff have been employed. An additional 376 ambulance paramedics and 302 police officers have also been employed.
In addition to the increase in frontline services over the last three years, the Palaszczuk Government has committed to employing an additional 3,700 teachers over the next four years at an estimated cost of $1 billion. Further, consistent with its election commitment, the Government will add 3,500 new nurses, midwives and nurse navigators over four years.
The 2018-19 State Budget delivers significant funding for a range of new and ongoing initiatives.
2
Budget Strategy and Outlook 2018-19
These include:
| • | | an additional $171.9 million over four years for 400 police officers in high priority areas and $55.1 million over four years for 85 counter-terrorism officers and operational specialists and to establish a Security and Counter-Terrorism Command. This builds on the investment in the 2017-18 Budget for an additional 30 counter-terrorism police officers and 20 police officers, bringing total additional frontline police and operational specialists in priority areas across the State to 535 |
| • | | funding of $29.5 million over four years for an additional 100 firefighters and 12 fire communication officers to help the community prevent, prepare for, respond to and recover from the impact of fire and emergency events. |
Promoting private sector investment
Driving and facilitating private sector investment is crucial, given the private sector accounts for more than 70% of total investment in the economy and supports 83% of Queensland jobs. Through its flagship Advance Queensland initiative totalling $650 million, the Queensland Government maintains a strong focus on fostering innovation and entrepreneurship to enable Queensland businesses to adapt rapidly to the ever-changing global business environment.
The Palaszczuk Government is also delivering a range of industry attraction and facilitation services to promote private sector investment. The 2018-19 Budget provides additional funding for both the Advanced Queensland Industry Attraction Fund and the Jobs and Regional Growth Fund, bringing the combined total funding for these programs to $255 million.
Protecting the Great Barrier Reef
Queensland’s Great Barrier Reef is not only one of the natural wonders of the world, but one of the major reasons local, interstate and international visitors come to Queensland. More than 18 million visitors travel to the broader Great Barrier Reef region. To support the reef and manage the impacts of climate change, the Palaszczuk Government is investing $330 million over five years to protect our national treasure and ensure it continues to provide economic benefits now and into the future. Protecting the Great Barrier Reef is vital not just for the environment and tourism, but also to meet international commitments.
The 2018-19 State Budget allocates $40 million in new funding to significantly increase our State’s financial contribution to protecting the reef. Part of this $40 million will include $26 million in extra funding over the next four years for the Joint Field Management Program for reef protection measures. This is on top of the more than $35 million already invested in this program. In addition, a further $13.8 million over the next four years will be allocated to extend the Queensland Reef Water Quality Program to support the transition of graziers, and sugarcane and banana growers to improved practices through access to professional advice.
Waste Strategy – Driving business investment, innovation and jobs
The Queensland Government’s comprehensive waste management strategy, underpinned by a waste disposal levy, will be instrumental in changing waste management practices in the State.
By discouraging the interstate transport of waste and encouraging alternatives to disposal of waste to landfill, the waste disposal levy will significantly boost certainty for investment in job-creating reuse, recycling, bioproducts and waste to energy industries.
3
Budget Strategy and Outlook 2018-19
Proceeds from the waste levy will be used for waste programs, environmental priorities and community purposes. In particular, $100 million will be allocated over three years to support Queensland’s resource recovery and recycling industry through the Resource Recovery Industry Development Program. The program will facilitate private sector and local government projects delivering innovative solutions to the problem of waste going to landfill and will create jobs in emerging industries.
In order to avoid direct costs to households from the introduction of the waste levy, the Government will provide an annual advance on levy charges to those local governments that dispose of municipal waste in the levy zone. In 2018-19, $32 million has been provided for this purpose.
A recent independent study has highlighted the significant employment and economic benefits resulting from the waste strategy. The study found that the introduction of a waste levy will promote a reduction of waste generation and increase the diversion of waste to higher-value waste recovery and recycling industries. Combined with other key elements of the waste strategy, the levy will support new jobs in the waste industry over the long-term.
Economic Outlook
Overall growth in the Queensland economy is expected to strengthen to 23⁄4% in 2017-18, reflecting further improvement in domestic demand as business spending has rebounded along with a recovery in coal exports following Severe Tropical Cyclone (STC) Debbie.
Growth in gross state product (GSP) is forecast to accelerate further to 3% in 2018-19, with household consumption gaining some momentum and a contribution to growth from the trade sector as imports ease.
While domestic activity is forecast to strengthen in 2019-20 and support stronger jobs growth, it will also boost imports. Combined with a moderation in export growth, this is expected to constrain the overseas trade sector’s contribution to growth and result in overall growth easing to 23⁄4% in 2019-20. From 2020-21, Queensland GSP is expected to grow by 23⁄4% per annum, consistent with the State’s long-run potential.
While employment growth has eased in early 2018, the stronger than expected gains in late 2017 means growth over the year to June quarter 2018 is estimated to be 23⁄4%, the strongest jobs growth in a decade.
Employment growth is expected to return to more sustainable rates of 11⁄2% in 2018-19 and 13⁄4% in 2019-20, when it will be stronger than that forecast nationally. While designed to help meet the demands of the State’s growing population, the Palaszczuk Government’s $45.8 billion capital works program will also provide considerable support to employment in Queensland across the forecast period.
Additional jobseekers encouraged by stronger employment growth has seen the participation rate rise sharply and the unemployment rate stabilise in the short-term, with the unemployment rate forecast to remain at 61⁄4% in June quarter 2018 and 2019. However, stronger domestic activity is expected to see the unemployment rate fall to 6% by June quarter 2020.
4
Budget Strategy and Outlook 2018-19
| Overview Table 1 | Queensland economic forecasts/projections1 |
| | | | | | | | | | | | | | | | | | | | | | | | |
| | | Actual | | | Est. Act. | | | Forecasts | | | Projections | |
| | | 2016-17 | | | 2017-18 | | | 2018-19 | | | 2019-20 | | | 2020-21 | | | 2021-22 | |
Gross state product2 | | | 2.5 | | | | 23⁄4 | | | | 3 | | | | 23⁄4 | | | | 23⁄4 | | | | 23⁄4 | |
Nominal gross state product | | | 9.3 | | | | 51⁄2 | | | | 4 | | | | 33⁄4 | | | | 41⁄2 | | | | 43⁄4 | |
Employment3 | | | 1.8 | | | | 23⁄4 | | | | 11⁄2 | | | | 13⁄4 | | | | 13⁄4 | | | | 2 | |
Unemployment rate4 | | | 6.2 | | | | 61⁄4 | | | | 61⁄4 | | | | 6 | | | | 6 | | | | 53⁄4 | |
Inflation5 | | | 1.7 | | | | 13⁄4 | | | | 2 | | | | 21⁄2 | | | | 21⁄2 | | | | 21⁄2 | |
Wage Price Index5 | | | 1.9 | | | | 21⁄4 | | | | 21⁄2 | | | | 3 | | | | 3 | | | | 3 | |
Population5 | | | 1.5 | | | | 13⁄4 | | | | 13⁄4 | | | | 13⁄4 | | | | 13⁄4 | | | | 13⁄4 | |
Notes:
| 1. | Unless otherwise stated, all figures are annual percentage change. |
| 2. | Chain volume measure (CVM), 2015-16 reference year. |
| 3. | Through-the-year growth rate to the June quarter (seasonally adjusted). |
| 4. | Seasonally adjusted rate for the June quarter. |
| 5. | Annual percentage change, year-average. |
Sources: ABS 3101.0, 6202.0, 6345.0, 6401.0 and Queensland Treasury.
Fiscal Outlook
The 2018-19 Budget supports the delivery of the Government’s election commitments and provides additional policy measures focussed on supporting the delivery of services to the Queensland community. The election commitments are funded from reprioritisation measures and the targeted revenue measures announced during the 2017 election.
The Government is committed to delivering the services and infrastructure the community needs in a financially sustainable manner. Net operating surpluses are projected in each year of the forward estimates, despite an expectation that revenue will decline in 2018-19 driven by a substantial reduction in funding from the Australian Government. Operating expenses are forecast to grow at a sustainable rate, averaging 2.9% per annum over the five years to 2021-22.
A $45.8 billion capital program over four years, including $33.2 billion in the General Government sector, will deliver infrastructure that supports economic growth, enhances productivity, provides employment opportunities and manages the pressures of strong population growth. This level of investment will be partly funded through borrowings. Even so, General Government borrowings are expected to be lower in each year of the forward estimates than projected in the 2017-18 Budget. In 2021-22, it is expected the General Government borrowings will remain below the peak level reached in 2014-15.
The Government will continue to provide additional funds for infrastructure investment while responsibly managing debt. This is being achieved while retaining strategic assets, such as electricity, port, rail and water businesses, in public ownership.
5
Budget Strategy and Outlook 2018-19
| Overview Table 2 | General Government Sector – key fiscal aggregates1 |
| | | | | | | | | | | | | | | | | | | | | | | | | | | | |
| | | 2016-17
Actual2
$ million | | | 2017-18
MYFER
$ million | | | 2017-18
Est. Act.
$ million | | | 2018-19
Budget
$ million | | | 2019-20
Projection
$ million | | | 2020-21
Projection
$ million | | | 2021-22
Projection
$ million | |
Revenue | | | 56,194 | | | | 56,464 | | | | 58,259 | | | | 57,738 | | | | 58,835 | | | | 59,939 | | | | 62,269 | |
Expenses | | | 53,373 | | | | 55,980 | | | | 56,747 | | | | 57,590 | | | | 58,675 | | | | 59,829 | | | | 61,579 | |
Net operating balance | | | 2,821 | | | | 485 | | | | 1,512 | | | | 148 | | | | 160 | | | | 110 | | | | 690 | |
PNFA3 | | | 4,634 | | | | 4,965 | | | | 4,905 | | | | 5,927 | | | | 7,557 | | | | 7,396 | | | | 7,081 | |
Fiscal balance | | | 536 | | | | (1,681 | ) | | | (604 | ) | | | (3,033 | ) | | | (3,881 | ) | | | (3,400 | ) | | | (2,636 | ) |
Net Worth | | | 194,936 | | | | 198,268 | | | | 199,686 | | | | 202,636 | | | | 205,775 | | | | 208,101 | | | | 210,515 | |
Borrowing | | | 33,260 | | | | 32,502 | | | | 31,367 | | | | 32,311 | | | | 35,861 | | | | 39,588 | | | | 42,290 | |
Borrowing (NFPS)4 | | | 71,904 | | | | 71,222 | | | | 69,501 | | | | 70,871 | | | | 75,214 | | | | 79,750 | | | | 83,093 | |
Notes:
| 1. | Numbers may not add due to rounding. Bracketed numbers represent negative amounts. |
| 2. | Reflects published actuals. |
| 3. | PNFA: Purchases of non-financial assets. |
| 4. | NFPS: Non-financial Public Sector. |
6
Budget Strategy and Outlook 2018-19
| 1 | Economic plan – creating jobs and prosperity in a growing Queensland |
Features
| • | | The Palaszczuk Government’s commitment to improve the quality of life and living standards enjoyed by Queenslanders continues to be underpinned by its clear economic plan to drive economic growth, create more jobs and improve prosperity. |
| • | | The key initiatives outlined in the 2018-19 Budget, including the suite of election commitments, will continue to drive economic growth and create jobs by: |
| | • | | increasing the economic opportunities available to Queenslanders |
| | • | | enhancing the capacity of Queenslanders to access and capitalise on these opportunities |
| | • | | ensuring all Queenslanders share in the prosperity and improved quality of life these opportunities deliver. |
| • | | To create the economic growth and job opportunities needed to support Queensland’s growing population, the Government’s economic plan includes a $45.8 billion investment in productivity-enhancing capital works over the four years to 2021-22. |
| • | | In addition to flagship projects such as the Cross River Rail, Cairns Convention Centre, upgrades to the M1 motorway and Townsville Stadium, a range of other essential regional projects will be fast-tracked through the Growth Area and Regional Infrastructure Investment Fund while building key social infrastructure to support improved health and education outcomes. |
| • | | Ongoing and increased funding for key employment and training programs will help provide Queensland jobseekers, including the State’s youth, with the skills and capabilities to access additional job opportunities. |
| • | | Meanwhile, significant funding for initiatives to further protect the Great Barrier Reef and the environment will ensure current and future generations of Queenslanders continue to enjoy the increased prosperity and quality of life that has attracted almost two million migrants to the State over the past three decades. |
| • | | The $11.6 billion capital works program in 2018-19 outlined in this Budget is estimated to directly support more than 38,000 jobs in 2018-19, as well as support significant ongoing private sector investment and employment over the short, medium and long term. |
7
Budget Strategy and Outlook 2018-19
| 1.1 | Key elements of the economic plan |
The Queensland Government remains committed to creating increased opportunities and prosperity for all Queenslanders. As outlined in each of the Government’s previous budgets since 2015-16, this commitment is underpinned by a clear and comprehensive economic plan to drive economic growth, create more jobs and enhance living standards.
In line with the key objectives of the Government’s economic plan, Queensland has recorded significantly improved economic outcomes in recent years, with economic growth expected to strengthen to 23⁄4% in 2017-18 and strengthen further to 3% in 2018-19. This growth has also directly resulted in increased employment opportunities across the State, with more than 83,500 new jobs created in Queensland over the 12 months to April 2018.
Despite these achievements, an ongoing focus on building the productive capacity and resilience of the State’s traditional, emerging and new industries is critical to maintain this economic momentum and support the ongoing prosperity of Queensland families, communities and regions.
As a modern, open trading economy, Queensland continues to be susceptible in the short to medium term to changes in international economic conditions.
Some key areas of regional Queensland continue to successfully transition to the post mining and LNG investment boom economy, while some regions and industries are still recovering from the impacts of natural disasters and continue to be impacted by drought.
With the State’s population growing over recent decades to more than five million, ongoing delivery and facilitation of key economic and social infrastructure, as well as essential social services, will remain a key element of the Government’s plan to drive ongoing improvements in the quality of life enjoyed by families and communities across the State. Further, longer term global trends, such as climate change, the rapid pace of technological advancements and demographic change, will continue to present both risks and opportunities.
A continued focus on building a strong, resilient and flexible economy and labour force is critical to ensure Queensland businesses, industries and regions are capable of responding to any challenges and capitalising on any opportunities as they arise now and in the future.
The 2018-19 Budget continues to reinforce the Government’s commitment to driving sustainable economic growth and improving employment outcomes.
The $11.6 billion capital works program in 2018-19 outlined in this Budget is estimated to directly support more than 38,000 jobs in 2018-19, as well as support significant ongoing private sector investment and employment over the short, medium and long term. Key elements of the Budget will also help facilitate growth of private sector business investment and the increased participation of Queensland’s youth in employment, education and training.
Given the recent strong jobs growth and increased labour force participation in Queensland, the Government’s economic plan will not only continue to support overall income growth but should also help support wages growth in the medium to longer term, as the demand for labour intensifies and any spare capacity in the labour market is utilised.
8
Budget Strategy and Outlook 2018-19
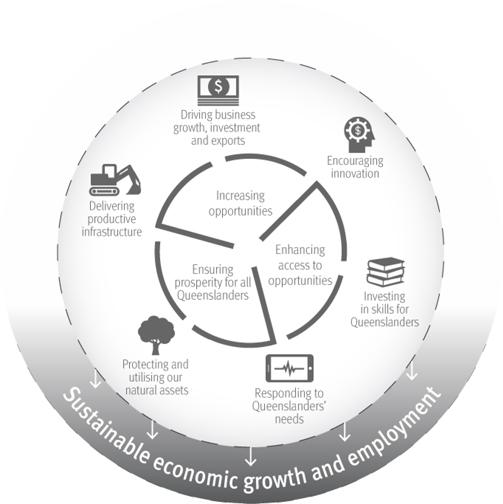
Building on the economic plan outlined in the previous three State budgets, the remainder of this chapter outlines how key initiatives, including new policies and programs outlined in the 2018-19 Budget will contribute to achievement of three key elements of the Government’s economic plan:
| • | | increasing the economic opportunities available to Queenslanders |
| • | | enhancing the capacity of Queenslanders to access and capitalise on these opportunities |
| • | | ensuring all Queenslanders share in the prosperity and improved quality of life these opportunities deliver. |
| Figure 1.1 | Driving jobs and prosperity through the economic plan |
9
Budget Strategy and Outlook 2018-19
| 1.2 | Increasing the economic opportunities available to Queenslanders |
The prosperity and well-being of Queenslanders is closely linked to the economic and employment opportunities that are available to them. The creation of increased opportunities also helps provide the means for individuals and families to fully realise their economic potential through the application of their capabilities, skills and talents.
Given the private sector supports almost five out of every six jobs in Queensland, an essential element of the Government’s economic plan is to drive private sector investment and business growth, thereby supporting and creating new job opportunities.
In particular, the economic plan includes a strong focus on enhancing the employment, education and training opportunities available to Queensland’s youth, ensuring they can take advantage of current job opportunities as well as being better equipped to pursue the jobs of the future.
| 1.2.1 | Delivering productive infrastructure |
The Government plays a key role in creating job opportunities by investing, facilitating, and delivering productive infrastructure, particularly in the context of the State’s growing population.
Infrastructure investment directly generates significant employment across the State during the construction phase. However, even more importantly, it creates future jobs and investment prospects by expanding the long-term productive capacity of the economy and helping make Queensland businesses more productive, efficient and competitive.
As Queensland transitions to a more innovative, diverse and productive economy, it is vital that infrastructure investments maximise opportunities and provide long-term sustainable benefits to Queenslanders.
The Palaszczuk Government is investing $45.8 billion through the capital works program over the four years to 2021-22. The program includes much needed additional investments in roads, rail, water, energy, hospitals, schools and digital infrastructure projects that will meet the demands of our fast-growing state.
The capital works program includes ongoing Government investment in a number of significant projects including Cross River Rail, upgrades to the M1 motorway and the Bruce Highway and the Toowoomba Second Range Crossing project.
Significant funding related to several of these projects has also been committed beyond the forward estimates period to complete delivery of this transformative infrastructure.
The $11.6 billion capital works program in 2018-19 is estimated to directly support more than 38,000 jobs.
The 2018-19 capital program includes a $4.9 billion investment in roads and transport infrastructure, significant capital purchases related to health ($985.5 million) and education ($674.3 million) and significant capital investment in energy and water of $2.2 billion and $277 million respectively.
10
Budget Strategy and Outlook 2018-19
Some key highlights of the 2018-19 capital works program include:
| • | | $733 million to continue to progress the planning, procurement and delivery of the Cross River Rail project |
| • | | $200 million to widen the Bruce Highway from four to six lanes between Caloundra Road and the Sunshine Motorway |
| • | | $534.3 million to continue the Toowoomba Second Range Crossing project |
| • | | $115 million to construct the Mackay Ring Road (Stage 1) |
| • | | $89.2 million towards a new public transport ticketing system |
| • | | $125.2 million for new classrooms and other infrastructure in state secondary schools to accommodate six full cohorts in 2020 |
| • | | $94.5 million to further address enrolment growth pressures in state schools as part of the Building Future Schools fund |
| • | | $339.1 million towards the construction and upgrade of the social housing stock. |
Across the State, the Government’s investment in public infrastructure will drive transformative change, encourage private investment and make our communities better places to live.
Around $5.6 billion of the capital works program in 2018-19 will help deliver key economic and social infrastructure in regional Queensland, estimated to directly support more than 19,000 jobs across Queensland’s important regional economies in 2018-19.
The 2018-19 Budget provides for a $176 million State contribution towards the construction of the Rookwood Weir near Rockhampton. This is in addition to other regionally significant economic infrastructure projects previously announced by the Government.
This Budget also allocates $40 million over 2 years towards the newly established Growth Area and Regional Infrastructure Investment Fund to help fast-track essential regional infrastructure.
Importantly, the Government’s capital works program and the productivity benefits it delivers are not limited to projects historically classified as ‘economic’ infrastructure. Investment in key social infrastructure, such as hospitals and schools, benefits individuals and families by improving health and educational outcomes, thereby increasing the capacity of Queenslanders to participate in the economy and to capitalise on the knowledge-based, high value added jobs of the future.
This Budget features a number of key social infrastructure investments, including a $985.5 million capital program for the health portfolio in 2018-19 to accommodate growing demand for health services, increase service quality and to facilitate innovative and new service delivery models. The Budget allocates an additional $308 million towards Building Future Schools, taking total funding to $808 million. The Government is also allocating $966.3 million over the forward estimates towards the $1.8 billion Queensland Housing Strategy 2017-2027.
Additional funding of $135 million has also been allocated to provide infrastructure grants to non-state schools to meet the needs of Queensland’s growing population.
The Budget also delivers $125 million towards the construction of a $150 million 1,500 to 1,700 seat performing arts venue at the South Bank Cultural Precinct. This project will help attract new visitors and support the development of Queenslanders engaged in the performing arts industry.
11
Budget Strategy and Outlook 2018-19
| Box 1.1 | Population growth – a key driver of economic growth and jobs |
Population growth has been a key driver of economic growth and job creation in Queensland over recent decades. From a population of only two million in May 1974, Queensland’s population has grown to reach five million in May 2018, according to recent population estimates released by the Queensland Government Statistician’s Office.
This represents average annual population growth of 2.1% over that period, compared with only 1.2% growth in the rest of Australia.
Notably, overseas and interstate migration were both major drivers of the State’s stronger growth over recent decades. Net migration of nearly 1.9 million people to Queensland has accounted for around 60% of the State’s population growth since 1974 as shown in Table 1.1.
| Table 1.1 | Components of Queensland population growth |
| | | | | | | | | | | | | | | | | | | | |
| | | | | | Components of change | | | | |
Date | | Queensland
Population | | | Natural
increase | | | Net overseas
migration | | | Net interstate
migration | | | Total
population
growth1 | |
May 1974 | | | 2,000,000 | | | | | | | | | | | | | | | | | |
Feb 1992 | | | 3,000,000 | | | | 387,000 | | | | 183,000 | | | | 406,000 | | | | 1,000,000 | |
May 2006 | | | 4,000,000 | | | | 367,000 | | | | 249,000 | | | | 431,000 | | | | 1,000,000 | |
May 2018 | | | 5,000,000 | | | | 410,000 | | | | 440,000 | | | | 150,000 | | | | 1,000,000 | |
Total increase | | | | | | | 1,164,000 | | | | 872,000 | | | | 987,000 | | | | 3,000,000 | |
Note:
| 1. | Includes intercensal discrepancy |
Source ABS 3101.0, 3105.0.65.001 and Queensland Treasury
Migration is a key driver of economic growth in Queensland:
| • | | migration increases the demand for goods and services, supporting the growth of local businesses and industries, flowing through to increased investment and increased demand for government services |
| • | | it increases the number of people available to work |
| • | | it helps support increased productivity through the increased productivity-enhancing infrastructure required to support the population growth. |
While net interstate migration contributed only 150,000 (15%) to Queensland’s total population growth from 2006 to 2018, the direct result of interstate migration is significant over the period:
| • | | The size of Queensland’s economy (i.e. gross state product) in 2017-18 is around $8.8 billion greater than it otherwise would have been, consisting of: |
| | • | | $5.1 billion in additional household consumption |
12
Budget Strategy and Outlook 2018-19
| | • | | $2.3 billion in additional public and private sector investment |
| | • | | $1.6 billion in additional government consumption |
| | • | | $2.5 billion in additional exports, offset by $2.8 billion in additional imports. |
| • | | The total number of jobs in Queensland in 2017-18 is estimated to be 72,000 greater than it would have been in the absence of interstate migration over this period. |
| • | | The economic benefits of interstate migration were shared across all Queensland industries. However, trade-exposed industries such as mining and manufacturing, and labour-intensive industries such as accommodation and food services, health and retail trade, have tended to benefit more than other industries, reflecting the additional supply of labour available. |
| • | | The additional labour supply and increased workforce participation means, in the short-term, a reduction in the unemployment rate can be limited. |
While population growth has historically been a key factor underpinning economic growth in Queensland, it will also continue to be an important contributor to growth in the future. In particular, as outlined in Chapter 2, the State’s population growth is forecast to strengthen to 13⁄4% in 2018-19 and 2019-20, supported by a strengthening in net interstate migration.
Continued investment in productive infrastructure is important to ensure ongoing provision of essential services to manage the pressures related to a growing population and to ensure Queenslanders continue to benefit from the increased growth and opportunities resulting from the State’s ongoing population growth.
| 1.2.2 | Driving business growth, investment and exports |
Queensland faces ongoing and increasing competition for investment, as capital increasingly becomes more mobile and the global economy becomes more interconnected. Therefore, it is critical that Queensland maintains a competitive business environment which continues to attract and support private investment.
Driving and facilitating private sector investment is crucial, given the private sector accounts for more than 70% of total investment in the economy, in addition to supporting 83% of Queensland jobs.
The Palaszczuk Government is delivering a range of industry attraction and facilitation services to assist industry to establish or expand their operations in Queensland. In the 2018-19 Budget an additional $40 million is provided for the Advance Queensland Industry Attraction Fund and $20 million for the Jobs and Regional Growth Fund, bringing the total funding committed to these programs to $105 million and $150 million, respectively.
A range of initiatives in the 2018-19 Budget will also directly support the growth of key Queensland export sectors, including an additional $94.6 million to support growth of the tourism sector under the Growing Tourism Jobs initiative.
13
Budget Strategy and Outlook 2018-19
Importantly, ongoing regulatory reform is a key component of the Government’s economic plan, with red tape reduction increasing business productivity and competitiveness, incentivising greater private sector investment, thereby, ultimately providing an overall boost to employment and economic growth.
In particular, the Government remains committed to cutting costs for the State’s more than 437,000 small to medium sized businesses (as at 2016-17), which employ around two thirds of all Queensland workers. The Budget provides increased funding of $3.9 million to continue delivering the ecoBiz program that helps small to medium sized businesses identify and achieve financial savings and eco-efficiency across energy, water and waste.
Building on the Government’s regulatory reform efforts focused on small business, including establishment of the Better Regulation Taskforce, the Government is progressing development of a Business Impact Statement tool, as well as the election commitment to establish small business consultation panels. These initiatives will help ensure greater consideration of, and consultation with, small business stakeholders when developing policy and regulation.
| Chart 1.1 | Queensland business investment, private and public sector shares, 2016-17 |
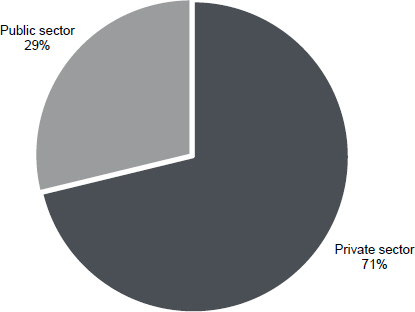
Source: ABS 5206.0 and 8752.0
14
Budget Strategy and Outlook 2018-19
| Box 1.2 | Waste Strategy – driving business investment, innovation and jobs |
On 20 March 2018, the Queensland Government announced the development of a comprehensive waste management strategy underpinned by a waste disposal levy.
The waste disposal levy will be instrumental in changing waste management practices in Queensland. By discouraging the disposal of waste to landfill, it will significantly boost certainty for investment in job-creating reuse, recycling, bioproducts and waste-to-energy industries.
By bringing Queensland into line with other States, the levy will also remove a key incentive for cross-border transport of waste to local landfills.
The waste strategy and levy are being introduced in a period of changing international policies relating to acceptance of recycling material, including China’s decision to tighten quality standards for imported recyclable material.
Key elements of the Queensland Waste Strategy
The levy will commence in the first quarter of 2019 and will apply to 38 local government areas, covering more than 80% of the State’s population. The waste disposal levy will apply to all general waste streams.
The levy will be set at $70 per tonne for general waste, increasing by $5 per annum. Proceeds from the levy will be used for waste programs, environmental priorities and community purposes.
There will be $100 million allocated over three years to support Queensland’s resource recovery and recycling industry through the Resource Recovery Industry Development Program. The program will facilitate private sector and local government projects delivering innovative solutions to the problem of waste going to landfill and create jobs in emerging industries.
The Government will provide an annual advance on levy charges to those local governments that dispose of municipal waste in the levy zone. In 2018-19, $32 million has been provided for this purpose. This will avoid direct costs to households from introduction of the waste levy. Between 2018-19 and 2021-22 it is expected that over 70% of revenue generated through the waste levy will be allocated to advance payments to councils, scheme start-up and operational costs, industry programs and other environmental priorities. Surplus revenue from the levy will benefit the entire Queensland community by providing funding for schools, hospitals, transport infrastructure and frontline services.
Economic and employment impacts
There are significant employment and economic impacts resulting from an effective waste strategy, including a waste levy on landfill disposal.
15
Budget Strategy and Outlook 2018-19
A recent independent study highlighted the relationship between the introduction of a waste levy and other key elements of a waste strategy with increasing waste diversion rates, business investment, innovation and jobs in the recycling sector.
Based on experience in other jurisdictions, both nationally and internationally, there is potential for Queensland to achieve higher recovery rates and derive the associated business investment, innovation and employment benefits.
In particular, the report indicated that the introduction of a waste strategy and waste levy in Queensland should play an important role in enabling these benefits to Queenslanders from higher-order resource recovery opportunities in the future.
The study also found that introduction of a waste levy will promote a reduction in waste generation and increase the diversion of waste to higher-value waste recovery and recycling industries.
The introduction of a levy in Queensland at $70 per tonne, combined with other key elements of the waste strategy, will support new jobs in the waste industry over the long-term.
The report also indicated that the introduction of a waste levy should result in a significant reduction of interstate waste being transported to Queensland.
| 1.2.3 | Encouraging innovation – Advance Queensland |
Innovation is one of the key drivers of growth and job creation by facilitating economic transformation and boosting business competitiveness.
Through its flagship Advance Queensland initiative totalling $650 million, the Queensland Government maintains a strong focus on fostering innovation and entrepreneurship to enable Queensland businesses to adapt rapidly to the ever-changing global business environment. The 2018-19 Budget provides increased funding of $50 million over five years for key Advance Queensland programs, including the Ignite Ideas Fund and Industry Research Fellowships. The funding also includes an extension to ‘The Precinct’, Queensland’s flagship hub for start-ups, the Clem Jones Centre for Ageing and Dementia Research and a range of programs to drive and scale innovation in Queensland.
The 2018-19 Budget also provides increased funding of $40 million over 2 years to the Business Development Fund to support emerging and high growth innovative Queensland businesses to commercialise their ideas by co-investing with experienced venture capital firms and investors.
The Palaszczuk Government’s continued focus on encouraging innovation is yielding tangible benefits. Advance Queensland programs are backing over 3,000 innovators, whose projects will drive over 11,000 jobs. Engagement and involvement across the State has been high, with over 60,000 attendees at Advance Queensland events, 57% of which were held in regional Queensland.
16
Budget Strategy and Outlook 2018-19
Significant achievements to date include:
| • | | providing over 200 small and medium sized businesses with opportunities to commercialise market ready innovative ideas under the Ignite Ideas Fund, helping them grow and compete in a global market |
| • | | attracting over 35 international start-ups to Queensland through the Hot DesQ program |
| • | | developing roadmaps and action plans for a range of industry sectors, including Biofutures and Biomedical and Life Sciences, to promote knowledge-based jobs and the economy of the future |
| • | | establishing the Queensland Genomics Health Alliance to address the challenge of translating genomics data into meaningful clinical care to improve the health of our community. |
| 1.2.4 | Protecting and utilising our natural assets |
Queensland’s natural resource endowments provide significant economic opportunities to Queenslanders and a key plank of the Government’s economic plan has been to ensure appropriate protection and sustainable use of these valuable assets.
Around 80% of Queensland’s land area is utilised for agricultural purposes, and the State’s mineral producers exported coal, LNG and other minerals worth more than $56 billion in the year to March 2018. Meanwhile, Queensland’s comparative strengths in solar, wind and biofuels have also seen significant growth in the renewable energy sector in recent years.
Queensland’s beaches, national parks and Great Barrier Reef continue to attract visitors from across Australia and around the world, who spent 140 million visitor nights in the State in 2017, up 25% since 2011.
Clearly, one of Queensland’s most significant natural resources and tourist attractions is the world renowned Great Barrier Reef. To protect this vital natural asset, the Queensland Government has committed substantial resources to improving water quality in the catchment to improve long-term sustainability. The Queensland Reef Water Quality Program provides a total of $330 million over a five-year investment plan to address all land-based sources of water pollution.
In addition to this prior commitment, the 2018-19 Budget provides $26 million in 2018-19 over the next four years for the Great Barrier Reef Joint Field Management Program, and a total of $13.8 million to help agricultural producers transition to new minimum standards designed to protect the reef.
In line with the Government’s ‘Saving Habitat, Protecting Wildlife and Restoring Land’ commitment, the Government has committed to establishing its flagship Land Restoration Fund (LRF).
The LRF will aim to support and develop Queensland’s emerging carbon farming industry by investing in projects that will deliver not only carbon reduction outcomes, but also other environmental, economic, and social co-benefits for Queenslanders. The Government will act as a cornerstone investor by providing seed capital of $500 million and the LRF will seek to leverage other sources of investment including from private and philanthropic sources.
17
Budget Strategy and Outlook 2018-19
The Fund complements a range of other initiatives being delivered, such as the $50 million Solar Thermal Plant Capital Contribution, to reduce Queensland’s contribution to climate change.
The Government is also implementing a range of policies to ensure our valuable mineral resources are managed sustainably and that their extraction brings economic and employment benefits to Queenslanders. Delivering on its election commitment, the Government has released more than 6,000 square kilometres of land for gas exploration for domestic use only to deliver more gas for domestic consumers to ease pressure on gas-dependent manufacturing industries.
| 1.3 | Enhancing the capacity of Queenslanders to access and capitalise on opportunities |
Ongoing changes in the State’s industry structure, as it continues to transition to a more knowledge intensive and services based economy, combined with technological change and other factors, have seen a significant shift over recent decades in the types of jobs and the skills needed to drive economic activity.
Most notably, strong growth in community and personal service workers has seen that sector’s proportion of total employment double between 1988 and 2018, while professionals now account for around one in every five jobs in Queensland.
| Chart 1.2 | Queensland employment share by occupation |
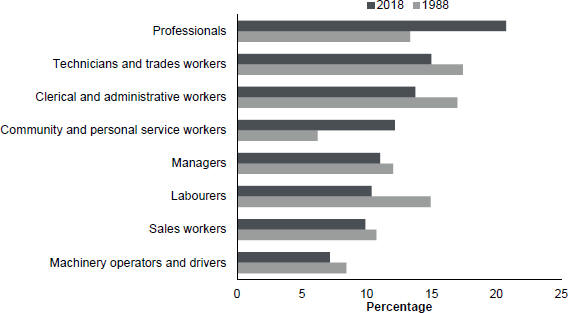
Source: ABS 6291.0.55.003
18
Budget Strategy and Outlook 2018-19
| 1.3.1 | Investing in skills for Queenslanders |
The flexibility and adaptability that the State’s workforce has displayed over many decades will need to continue for Queensland to stay along a path of strong and sustainable growth that delivers higher living standards for all Queenslanders.
In recognition of this challenge, the Government’s economic plan has a strong focus on investing in training opportunities for Queensland workers and jobseekers to gain skills to seamlessly transition into new roles, engage in new types of work and continue contributing to the economy.
This includes training and employment programs targeted at improving short to medium term outcomes, but also extends to broader education focused policies aimed at maximising Queensland’s human capital in the long-run.
The 2018-19 Budget builds on the success of the Back to Work program, which has successfully given Queensland employers the confidence to take on new employees and grow their businesses, through increased funding of $20.5 million to give employers in targeted areas of South East Queensland access to employer support payments with applications open to 30 June 2020.
The Payroll Tax Apprentice and Trainee Rebate is a key initiative which supports the ongoing development of Queenslanders’ skills, particularly for the State’s youth. The rebate assists employers grow their businesses while also helping to build the stock of qualified and skilled Queenslanders.
The 2018-19 Budget includes a commitment of $26 million to extend the higher 50% payroll tax rebate for a further 12 months to June 2019, which is expected to support the hiring of up to 26,000 apprentices and trainees throughout the year.
The State’s disadvantaged jobseekers are another key focus of the Government’s employment and training policy agenda, with the Skilling Queenslanders for Work initiative providing opportunities for tens of thousands of jobseekers in cohorts who have historically faced substantial labour market challenges.
Following increased investment of $180 million in the 2017-18 Mid Year Economic and Fiscal Review, the Government’s six-year investment in Skilling Queenslanders for Work will now total $420 million by 2020-21.
Given the changing nature of skills requirements in the 21st century global economy, it is essential that individuals are equipped with the entrepreneurial and digital skills needed by innovative businesses and emerging industries.
Recognising the importance of early childhood education, the 2018-19 Budget also provides $20 million over four years and $5 million ongoing per annum to continue the First 5 Forever (F5F) Family Literacy Program, providing direct support to parents to build strong early years literacy foundations for children aged five years and below.
19
Budget Strategy and Outlook 2018-19
| 1.4 | Ensuring all Queenslanders share in the increased prosperity and quality of life |
The Queensland Government also plays a number of significant roles in ensuring the benefits of economic growth and the new opportunities created are translated into enhanced wellbeing and prosperity for all Queenslanders.
The Queensland Government continues to react and respond to Queenslanders’ preferences and is attuned to the community’s concerns and needs.
This includes the Government continually striving to improve the effectiveness and efficiency of its delivery of essential services by promoting new and innovative approaches to the procurement of those services.
As such, a range of essential Queensland Government services not only improve the health and safety of Queenslanders, their families and the community, but are also essential in underpinning economic outcomes, by enabling Queenslanders to be more productive and economically engaged through employment, education and training.
As part of the Government’s commitment to reduce cost of living impacts on Queensland households and small businesses, the 2018-19 Budget provides $5.6 billion to help manage household budgets. A number of concessions are focused on supporting pensioners, special needs and disadvantaged members of the community to help reduce the cost of life’s essentials including electricity, water, transport, education and housing. The 2018-19 Budget also provisions around $500 million for Queensland’s participation in the National Redress Scheme for Survivors of Institutional Child Sexual Abuse.
The Government has also made substantial investments to deliver the frontline services that Queenslanders need to ensure the health, education, safety and wellbeing of Queensland communities over recent years.
A record education and training operating budget of $14.1 billion in 2018-19 will continue to deliver quality education to our young Queenslanders and $732 million transformative capital improvements to school and training facilities across the State.
The 2018-19 Budget also provides significant funding to continue to deliver first-class health services to Queenslanders. This includes a record $17.3 billion in operating funding, as well as a $985.5 million health portfolio capital program.
The Palaszczuk Government also remains committed to protecting Queenslanders and keeping the State’s families and communities safe. This Budget delivers significant funding for a range of new and ongoing initiatives across the key public safety agencies, including an additional $171.9 million over four years for 400 police officers in high priority areas and $55.1 million over four years for 85 counter-terrorism officers and operational specialists and to establish a Security and Counter-Terrorism Command. This builds on the investment in the 2017-18 Budget for an additional 30 counter-terrorism police officers and 20 police officers, bringing total additional frontline police and operational specialists in priority areas across the State to 535.
20
Budget Strategy and Outlook 2018-19
The $1.8 billion Queensland Housing Strategy, announced in the 2017-18 Budget, will continue to deliver more social and affordable housing, and transform the way housing services are delivered in Queensland. Meanwhile, Queensland families and communities will continue to benefit from the revitalisation of frontline service delivery in health, education and policing.
The 2018-19 Budget provides a total of $17 million over three years to enact the Government’s election commitment to implement a ‘No Card, No Start’ policy, which will prevent Blue Card applicants from commencing work until their application has been approved and their Blue Card issued.
The Government also recognises that a key element of being a responsive government is ensuring the services it provides are easy to use in the most effective and efficient way possible, and that it meets the standards of service demanded by Queenslanders. To this end, the 2018-19 Budget delivers additional funding of $8.8 million in 2018-19 to continue digital technology and service delivery measures to improve customer service.
The Government’s economic plan also recognises the importance of the interaction between different levels of government to help fund important community projects and programs, improving environmental outcomes and reducing the cost of living. As such, the Budget provides additional funding of $32 million in 2018-19 for advance payments to councils to meet the cost of municipal household waste sent to landfill and to avoid any direct impact on households associated with the introduction of the Waste Disposal Levy in 2019.
The Budget also delivers on the Government’s election commitment to implement more effective funding grants to Local Government by allocating a total of $4.5 million over four years to progress the implementation of the Review of Grants to Local Government: Current and Future State Assessments report. Councils will receive a total of $1.7 billion in grants in 2018-19.
21
Budget Strategy and Outlook 2018-19
| 2 | Economic performance and outlook |
Features
| • | | Growth in Queensland gross state product (GSP) is expected to strengthen to 23⁄4% in 2017-18, largely reflecting a rebound in business investment and a recovery in coal exports following the impacts of Severe Tropical Cyclone (STC) Debbie in 2016-17. |
| • | | Economic growth is forecast to strengthen further to 3% in 2018-19. In 2019-20, while domestic activity should strengthen and support stronger jobs growth, it will also boost imports. Combined with a moderation in export growth, this will constrain the trade sector’s contribution to growth and result in GSP growth easing to 23⁄4%. From 2020-21, GSP is expected to grow 23⁄4% per annum, consistent with the State’s longer run potential. |
| • | | Stronger global economic conditions have boosted industrial production across Queensland’s major trading partners, lifting demand for and prices of several of the State’s key commodity exports. A rebound in coal exports following STC Debbie and the final year of the LNG ramp-up have also supported growth in overseas exports in 2017-18. |
| • | | Growth in household consumption has remained subdued in 2017-18, despite a strong pick up in full-time jobs. Growth is then expected to gradually strengthen over the forecast period. Meanwhile, dwelling investment is on track for a ‘soft landing’, with a slight decline in activity in 2017-18 and 2018-19 before returning to modest growth in 2019-20. |
| • | | Business investment has rebounded strongly in 2017-18, to be a key driver of economic growth. The recovery was initially driven by spending on machinery and equipment, but has since become broader-based, with improved business conditions and ongoing growth in tourism and education exports supporting a recovery in non-dwelling construction. |
| • | | However, largely reflecting the strong ramp up in business investment, overseas import growth is expected to be considerably higher than the growth in overseas exports, resulting in the trade sector detracting from overall growth in 2017-18. |
| • | | From 2018-19 onwards, growth in commodity exports is expected to be modest, while prices, particularly for coal, are expected to decline from current elevated levels. However, with imports expected to ease in 2018-19 following the surge in 2017-18, the trade sector should contribute to growth in 2018-19. |
| • | | Employment growth has been stronger than expected in 2017-18, driven largely by health, construction, transport and education. While growth has eased in early 2018, the strong gains in late 2017 mean growth over the year to June quarter 2018 is estimated to be 23⁄4%. Partially reflecting a lower level of activity in dwelling construction, employment is expected to grow at more sustainable rates of 11⁄2% and 13⁄4% over the next two years. |
| • | | The entry of jobseekers encouraged by greater opportunities has seen the participation rate rise sharply and the unemployment rate stabilise in the short-term, with the unemployment rate forecast to remain at 61⁄4% in June quarter 2018 and 2019. However, stronger domestic activity is expected to see the rate fall to 6% by June quarter 2020. |
22
Budget Strategy and Outlook 2018-19
| 2.1 | International conditions |
Global conditions improved significantly in 2017 and, on balance, the economic prospects of Queensland’s major trading partners are positive over the forecast period. However, while the recent stronger growth is likely to extend into 2018, the pace of growth is expected to moderate in later years.
In addition to monetary policy settings by major central banks remaining accommodative, stronger global trade drove a rebound in industrial production in almost all of Queensland’s major trading partners in 2017. This in turn has led to a strong recovery in mineral and energy prices.
However, the current outlook suggests that coal, iron ore and oil prices will decline to more sustainable levels in the coming year, in line with an anticipated slowing in global industrial production growth following its rebound in 2017.
Meanwhile, a widening interest rate differential between the US and Australia saw the A$ fall back towards the lower end of the 75-80USc range by mid-May 2018. A sustained lower exchange rate will support the incomes and international competitiveness of Queensland exporters. However, higher US interest rates could see funds flow more towards the US and other overseas capital markets.
Growth in the United States, supported by expansionary monetary and fiscal policy, has seen the US labour market at or near full employment and inflation close to the Federal Reserve’s (the Fed) target. While the Fed has continued to reverse some monetary stimulus, the recent fiscal stimulus provided by tax cuts and spending legislation is likely to support growth in the short-term. However, the tight labour market may increase inflationary pressure and cause the Fed to raise interest rates further and faster than anticipated, while any future balance sheet repair required due to the impact on US government debt may offset some of the short-term stimulus.
China’s economy has maintained growth close to 7% in the past three years. The country’s brisk pace of economic and social development has coincided with an ageing population, widening income inequality, high corporate debts and rising pollution. China’s economic growth is expected to ease in the near-term, with trade tensions with the US providing a risk to the outlook.
Japan’s economy has been expanding moderately in recent years, with the country’s exports increasing on the back of stronger global economic growth. Japan’s monetary policy is likely to remain accommodative for some time and, along with spending related to the 2020 Tokyo Olympics, Japan’s economy is likely to grow moderately in the near-term.
Industrial production growth in Korea moderated in 2017, partly due to the appreciation of the Korean Won against the Japanese Yen over the course of 2017. Overall economic growth in Korea is expected to moderate slightly in 2018 and 2019.
India’s economy has seen a rebound in growth, as investment and consumption continue to drive the cyclical recovery. The Reserve Bank of India expects India’s economy to grow by 7.4% in 2018-19, which would likely see India as the world’s fastest growing major economy.
23
Budget Strategy and Outlook 2018-19
The national economy continues to transition towards broad-based growth. Australian Treasury forecasts GDP growth to strengthen to 23⁄4% in 2017-18 and to 3% in both 2018-19 and 2019-20.
A pick-up in household consumption is supported by strengthening wage growth and solid employment outcomes, while dwelling investment is expected to remain elevated by historical standards. Australian Treasury expects business investment to return to growth in 2017-18, driven by a lift in non-mining business investment and a diminishing drag from mining investment.
Goods exports nationally continue to be supported by the expansion of mining capacity, primarily in Western Australia (iron ore and LNG) and the Northern Territory (LNG), while services exports are benefiting from opportunities in the Asian region. Australian Treasury expects employment growth to moderate from current rates and the unemployment rate to ease gradually.
| 2.3 | Queensland conditions and outlook |
Growth in the Queensland economy is expected to strengthen to 23⁄4% in 2017-18, reflecting further improvement in domestic demand (as business spending has rebounded) and a recovery in coal exports following STC Debbie. Economic growth is forecast to accelerate further to 3% in 2018-19, with household consumption gaining momentum and a contribution to growth from the trade sector as imports ease (Chart 2.1).
| Chart 2.1 | Economic growth1, Queensland and Australia |
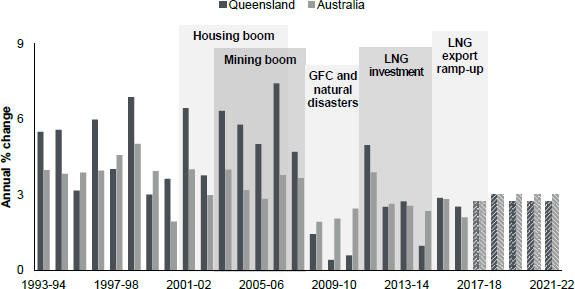
Note:
| 1. | CVM, 2015-16 reference year, 2017-18 onwards are forecasts/projections. |
Sources: ABS 5206.0, Australian Government Budget 2018-19 and Queensland Treasury.
24
Budget Strategy and Outlook 2018-19
Domestic activity is forecast to strengthen in 2019-20, supporting stronger jobs growth, but also boosting imports. When combined with a forecast moderation in exports growth, as some key commodities approach production capacity, this is expected to constrain the trade sector’s contribution to growth in 2019-20 and result in overall growth easing to 23⁄4% in the year. From 2020-21, Queensland GSP is expected to grow by 23⁄4% per annum, consistent with the State’s longer-run potential (Table 2.1).
| Table 2.1 | Queensland economic forecasts/projections1 |
| | | | | | | | | | | | | | | | | | | | | | | | |
| | | Actual | | | Est. Act. | | | Forecasts | | | Projections | |
| | | 2016-17 | | | 2017-18 | | | 2018-19 | | | 2019-20 | | | 2020-21 | | | 2021-22 | |
Gross state product2 | | | 2.5 | | | | 23⁄4 | | | | 3 | | | | 23⁄4 | | | | 23⁄4 | | | | 23⁄4 | |
Nominal gross state product | | | 9.3 | | | | 51⁄2 | | | | 4 | | | | 33⁄4 | | | | 41⁄2 | | | | 43⁄4 | |
Employment3 | | | 1.8 | | | | 23⁄4 | | | | 11⁄2 | | | | 13⁄4 | | | | 13⁄4 | | | | 2 | |
Unemployment rate4 | | | 6.2 | | | | 61⁄4 | | | | 61⁄4 | | | | 6 | | | | 6 | | | | 53⁄4 | |
Inflation5 | | | 1.7 | | | | 13⁄4 | | | | 2 | | | | 21⁄2 | | | | 21⁄2 | | | | 21⁄2 | |
Wage Price Index5 | | | 1.9 | | | | 21⁄4 | | | | 21⁄2 | | | | 3 | | | | 3 | | | | 3 | |
Population5 | | | 1.5 | | | | 13⁄4 | | | | 13⁄4 | | | | 13⁄4 | | | | 13⁄4 | | | | 13⁄4 | |
Notes:
| 1. | Unless otherwise stated, all figures are annual percentage change. |
| 2. | Chain volume measure (CVM), 2015-16 reference year. |
| 3. | Through-the-year growth rate to the June quarter (seasonally adjusted). |
| 4. | Seasonally adjusted rate for the June quarter. |
| 5. | Annual percentage change, year-average. |
Sources: ABS 3101.0, 6202.0, 6345.0, 6401.0 and Queensland Treasury.
Household consumption
Constrained by moderate growth in household incomes, Queensland household consumption grew by 2.4% in 2016-17. While a marked improvement in labour market conditions in 2017-18 has aided a pick-up in overall compensation of employees, wage pressures in the economy remain low and households continue to be cautious about spending.
Further, with the State’s household savings rate in 2016-17 at its lowest since 2003-04, any growth in income will likely be utilised to pay off household debt, rather than translate into increased consumption in the short-term.
With the terms of trade expected to moderate and jobs growth forecast to soften following the exceptionally strong gains in 2017-18, household consumption growth is again forecast to be subdued in 2018-19. Additionally, the slowing in apartment construction is expected to both constrain spending on household goods and furnishings and reduce consumption due to falls in associated construction employment. In later years, consumption growth is forecast to pick up gradually, but remain below the average growth rates recorded prior to the GFC.
25
Budget Strategy and Outlook 2018-19
Dwelling investment
After several years of sustained growth, Queensland’s dwelling investment cycle peaked in 2016-17. Driven by a decline in the construction of attached dwellings (units, apartments, etc.), dwelling investment is forecast to contract in 2017-18 and 2018-19, as the large amount of new apartment supply is absorbed into the market. However, the decline across these years is expected to be moderate relative to previous cycles. Modest growth is expected to return from 2019-20 onwards, as the decline in attached dwelling construction slows and is offset by the construction of new houses and ongoing growth in alterations and additions.
Business investment
Following the LNG construction boom, Queensland business investment fell rapidly in 2014-15 and 2015-16 before stabilising in 2016-17, driven by a return to growth in machinery and equipment investment. Business investment is expected to rebound strongly in 2017-18, driven by growth across all components.
Growth in engineering construction is expected to be supported by investment in renewable energy projects, including wind and solar farms, in 2017-18 and 2018-19. However, with few major resources projects currently committed or under construction, growth in heavy industry investment will likely be subdued in the medium-term.
Non-residential building construction work has risen, strengthened by accommodation and educational facilities amid increased education enrolments and tourism activity. This trend is likely to continue. Elevated vacancy rates mean new investment in office space is likely to be subdued.
Machinery and equipment expenditure has risen solidly, buoyed by increased company profits, low lending rates to businesses and the lower A$ benefiting exporters. Recent strength in employment growth and elevated capacity utilisation rates suggest this component should continue to grow in 2018-19. Overall, business investment is forecast to pick up steadily over the forecast period, consistent with a steady acceleration in non-dwelling construction growth.
Public final demand
Public final demand is forecast to continue to grow strongly. A range of large expenditure programs (such as the National Disability Insurance Scheme) and infrastructure projects, including the Queensland Government’s $11.6 billion capital works program in 2018-19, will underpin this growth.
Overseas exports and imports
A rebound in coal exports following STC Debbie and the final year of the LNG production ramp-up have supported growth in overseas exports in 2017-18. However, the unexpected strong growth in overseas imports will result in net exports detracting from overall growth in 2017-18. In 2018-19, net exports are expected to contribute modestly to growth, but an increase in imports to support domestic growth in 2019-20 will constrain the overseas trade sector’s contribution to growth in that year.
26
Budget Strategy and Outlook 2018-19
Coal export volumes have rebounded in 2017-18, following the loss of 11 million tonnes in April and May 2017 due to STC Debbie. However, this recovery has been tempered somewhat by the impacts of Tropical Cyclone Iris in early April 2018 and maintenance across port and rail infrastructure. Looking ahead, while coal exports volumes are forecast to continue to grow strongly in 2018-19, partly due to a resumption of full operation at the Dalrymple Bay Coal Terminal, the rate of growth will most likely be moderate in later years. Increased industrial production in Asia, particularly Japan and Korea, is expected to underpin demand for hard-coking coal, while new coal fired power stations in Japan will support demand for thermal coal.
Following several price spikes throughout 2016-17 and 2017-18 (due to regulatory supply restrictions in China, STC Debbie and increased demand in China), hard-coking prices are forecast to decline throughout 2018-19, but remain higher than 2015-16 levels. Similarly, thermal coal prices, which have been elevated throughout 2016-17 and 2017-18, are expected to decline in 2018-19, but remain above 2015-16 prices.
LNG export volumes have grown significantly in recent years, as all six LNG production trains on Curtis Island were completed and began exporting. However, reflecting strong domestic demand for gas, LNG exports have plateaued slightly below nameplate capacity and growth is expected to moderate in the coming years. With 2017-18 being the first full year in which all six LNG trains are in production, any further growth in LNG exports will be driven by new gas developments which will also provide additional supply into the eastern domestic gas market.
Metals export volumes are expected to return to growth in 2018, after closures of depleted mines and production cuts. With several new projects and increased production encouraged by a sustained rally in prices, metals exports are forecast to grow solidly in 2018-19 and 2019-20.
| Chart 2.2 | Overseas goods exports, Queensland |
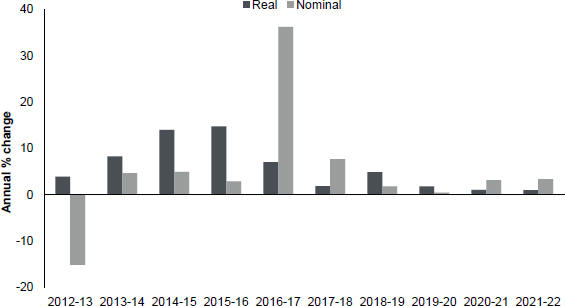
Source: Queensland Treasury.
27
Budget Strategy and Outlook 2018-19
Beef export volumes are expected to return to growth from 2017-18 onwards. With seasonal conditions expected to return to normal, restocking activity is forecast to gradually wane.
Sugar exports are expected to decline in 2017-18 following STC Debbie. Some recovery is expected in the near-term with only modest growth in the medium-term. Cotton exports are forecast to grow further in 2017-18, following a large increase in 2016-17. Other crop exports are forecast to decline substantially in 2017-18, due to large falls in wheat and chickpeas.
With the A$ remaining at a more competitive level for an extended period, tourism exports are expected to grow solidly over the forecast period. However, with national tourism growth being underpinned largely by growth from Chinese and Indian tourists visiting friends and relatives, Queensland tourism is expected to continue to grow more moderately than the southern states.
Queensland’s international education exports have grown strongly in recent years. A competitive A$, rising demand for education from Asia and increasing popularity amongst South American students are all expected to support continued strong growth.
Imports have picked up strongly in the first half of 2017-18 as business investment growth increased the demand for imported capital goods. However, the significant growth in imports has been stronger than the growth in machinery and equipment investment, possibly reflecting pent-up demand as business confidence continues to recover following the GFC.
Following the strong rebound in 2017-18, business investment is forecast to return to more moderate growth from 2018-19, while household consumption is expected to remain subdued over the forecast period. Reflecting these trends, imports are forecast to fall from elevated levels in 2018-19, before returning to modest growth in 2019-20.
Labour market
Employment growth has been stronger than expected in 2017-18. While employment growth has moderated in early 2018, the exceptional gains in late 2017 mean growth over the year to June quarter 2018 is estimated to be 23⁄4%. Employment growth is expected to return to more sustainable rates of 11⁄2% and 13⁄4% respectively over the next two years (Chart 2.3).
The ongoing downturn in labour-intensive residential construction over 2018 and 2019 will be a key factor in the moderation of employment growth from its current high rate, with dwelling investment having considerable flow on effects to household consumption.
Rather than generating a similar reduction in the State’s unemployment rate, much of the recent strength in Queensland employment has been absorbed by increased labour force participation. The strong jobs growth has encouraged jobseekers to re-enter the labour force, seeing the participation rate climbing to its highest rate in three years. As a result, the unemployment rate is forecast to remain at 61⁄4% in the near term (June quarter 2018 and 2019).
With improved business investment, ongoing public spending programs and a slowly strengthening household sector, employment growth is forecast to improve in 2019-20 to be at or slightly above growth in the working age population. As the dwelling investment cycle matures and domestic economic activity strengthens, employment growth is expected to strengthen and the unemployment rate is forecast to move slightly lower later in the forecast period, improving to 6% in June quarter 2020 as spare capacity in the labour market is absorbed.
28
Budget Strategy and Outlook 2018-19
| Chart 2.3 | Employment growth1 and unemployment rate2, Queensland3 |
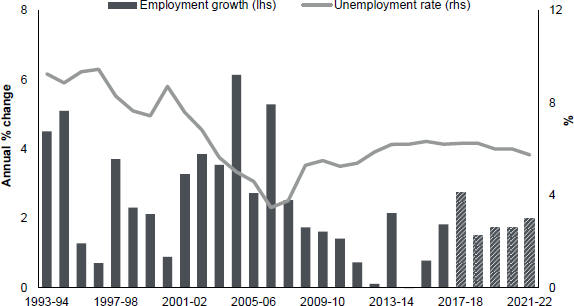
Notes:
| 1. | Through-the-year growth rate to the June quarter (seasonally adjusted). |
| 2. | Seasonally adjusted rate for the June quarter. |
| 3. | 2017-18 onwards are forecasts/projections. |
Sources: ABS 6202.0 and Queensland Treasury.
Regional labour markets
With agriculture, mining and construction accounting for a significant portion of economic activity in regional Queensland, the operating environment of these few industries are crucial to the conditions and outlook for labour market outcomes in regional Queensland.
While farmers continue to face challenging conditions due to widespread drought, those regions exposed to the resources sector have improved. Meanwhile, continued growth in tourism activity has also supported a return to solid employment growth in regional Queensland (Chart 2.4).
As a result, the unemployment rate across many regional centres has declined and the overall gap between regional and South East Queensland has narrowed substantially in 2017-18. After stabilising between 2015 and early 2017, the aggregate unemployment rate in regional Queensland fell 0.6 percentage point (to 7.2%) over the year to April 2018, compared with a 0.1 percentage point increase in the South East (to 5.7%).
Areas such as Mackay and Cairns have shown considerable improvement. Over the year to April 2018, employment has risen in Townsville (up 10,300 persons), Mackay (up 6,900 persons) and Cairns (up 4,900 persons). Meanwhile, these regions’ unemployment rates have fallen by 2.3 percentage points (to 8.5%), 2.0 percentage points (to 3.8%) and 0.8 percentage point (to 6.3%), respectively.
29
Budget Strategy and Outlook 2018-19
The improvement in Cairns is consistent with stronger tourism activity in recent years which has encouraged new investment projects and additional direct flights from China and Japan. Labour market conditions for younger workers in Cairns, closely linked to conditions in the region’s tourism industry and opportunities for lower-skilled workers, have also improved.
Meanwhile, Fitzroy appears to be adjusting following the wind-down in LNG construction investment and lingering impacts of the drought on beef production. Similar to Mackay, coal operations in the Fitzroy region have benefited from higher coal prices.
Labour market outcomes in Townsville have improved over the past year. However, while Townsville is a reasonably diversified economy, it continues to be influenced by prospects in the resources sector, directly through fly-in fly-out workers and indirectly via its processing infrastructure.
Conditions in the diverse Queensland-Outback region also remain challenging. The Outback faces ongoing drought conditions in the south and central west, and elevated levels of unemployment across some Indigenous communities.
| Chart 2.4 | Employment growth1 by region, Queensland |
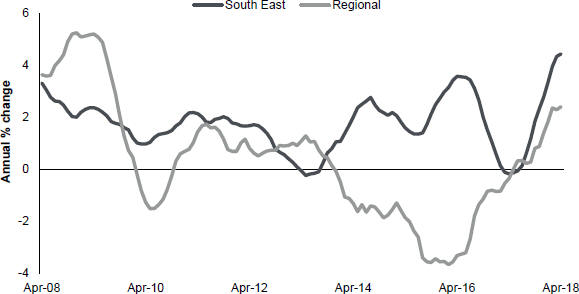
Note:
| 1. | Year-average. South East Queensland is defined as Greater Brisbane, Gold Coast, Sunshine Coast and Toowoomba. |
Source: ABS 6291.0.55.003
30
Budget Strategy and Outlook 2018-19
Prices and wages
Brisbane consumer price growth is expected to remain subdued in 2017-18, with inflation largely due to the scheduled 12.5% annual increase in the Australian Government’s tobacco excise, higher purchasing costs for new dwellings and higher automotive fuel prices. A modest acceleration in inflation is forecast for 2018-19, with a further increase in the tobacco excise and increased new dwelling purchase prices again contributing strongly to increases in the CPI.
Despite nominal wage growth remaining low by historical standards, real wages have continued to rise. As conditions in the domestic economy and spare capacity in the labour market declines, wage growth is expected to improve over the medium-term.
Population
Queensland’s population growth is forecast to average around 13⁄4% in 2017-18 and over the remainder of the forecast period.
Housing affordability has seen a strengthening in net interstate migration from New South Wales, while the end of the Western Australian resources investment boom has seen an increase in net inflows over recent years, after a period of outflows to that state between 2008 and 2015.
Net overseas migration in Queensland has grown strongly but is expected to moderate in 2018, consistent with national policies. However, rising incomes in Asia and the competitive A$ will continue to help drive growth in net overseas migration over the medium-term.
Over the longer term, Queensland Treasury projections show that Queensland’s population, which is estimated to have recently topped 5 million, will reach 6 million by 2029 and 7 million by 2038, with much of this growth anticipated to occur in the south east of the State.
Substantial investment in transport, health and education infrastructure, from both the public and private sectors, will be required to support the productive capacity of this increased population base. The Palaszczuk Government’s $45.8 billion capital works program is designed to help meet the demands of the State’s growing population.
| 2.4 | Risks and opportunities |
Key risks to the international outlook include the timing of monetary policy normalisation in major economies, particularly the US. Further interest rate differentials between the US and Australia may have an adverse flow-on effect to the Australian economy in general, particularly on borrowing costs.
Further, there are still uncertainties surrounding global trade conflicts which may impair demand for key industrial commodities.
Domestically, uncertainty remains around the extent of oversupply in the apartment market, and any concurrent downturn in major southern capitals could exacerbate the downturn in Queensland.
31
Budget Strategy and Outlook 2018-19
There are ongoing uncertainties surrounding changes to coal transport scheduling and any potential response by coal miners, other above-rail providers and ports. The current assessment is that the impact may not be significant, and that the issue is expected to be resolved this year. Overall, coal exports are expected to be higher in 2018-19 compared to last year. Notwithstanding this, the uncertainty provides a risk to the outlook.
More than 50% of the State remains drought declared. While a return to normal seasonal conditions is assumed, if current drought conditions continue, it could negatively impact on agricultural investment, production and exports.
Upside risks include the possibility that business investment may be stronger than currently predicted if company profits continue to remain at high levels or more large scale renewable energy projects are committed. Further, if commodity prices remain relatively high for longer than anticipated, it may rekindle some additional interest in other mining-related investment.
32
Budget Strategy and Outlook 2018-19
| Table 2.2 | Queensland economic forecasts1, by component |
| | | | | | | | | | | | | | | | |
| | | Actual | | | Est. Act. | | | Forecasts | |
| | | 2016-17 | | | 2017-18 | | | 2018-19 | | | 2019-20 | |
Economic output2 | | | | | | | | | | | | | | | | |
Household consumption | | | 2.4 | | | | 2 | | | | 21⁄4 | | | | 21⁄2 | |
Private investment | | | 1.3 | | | | 41⁄2 | | | | 11⁄4 | | | | 21⁄2 | |
Dwelling investment | | | 3.2 | | | | -41⁄4 | | | | -11⁄2 | | | | 1 | |
New and used | | | 4.2 | | | | -71⁄4 | | | | -33⁄4 | | | | -1⁄2 | |
Alterations and additions | | | 1.1 | | | | 3 | | | | 3 | | | | 4 | |
Business investment | | | -1.9 | | | | 103⁄4 | | | | 31⁄4 | | | | 33⁄4 | |
Non-dwelling construction | | | -6.8 | | | | 10 | | | | 11⁄2 | | | | 31⁄2 | |
Machinery and equipment | | | 5.3 | | | | 111⁄2 | | | | 53⁄4 | | | | 4 | |
Private final demand | | | 2.1 | | | | 23⁄4 | | | | 2 | | | | 21⁄2 | |
Public final demand | | | 5.2 | | | | 4 | | | | 33⁄4 | | | | 3 | |
Gross state expenditure | | | 3.0 | | | | 3 | | | | 21⁄4 | | | | 23⁄4 | |
Net overseas exports3 | | | 0.4 | | | | -13⁄4 | | | | 11⁄4 | | | | 0 | |
Overseas exports | | | 6.8 | | | | 21⁄2 | | | | 43⁄4 | | | | 21⁄4 | |
less Overseas imports | | | 5.8 | | | | 12 | | | | -1 | | | | 23⁄4 | |
Gross state product | | | 2.5 | | | | 23⁄4 | | | | 3 | | | | 23⁄4 | |
Nominal gross state product | | | 9.3 | | | | 51⁄2 | | | | 4 | | | | 33⁄4 | |
Other economic measures | | | | | | | | | | | | | | | | |
Employment4 | | | 1.8 | | | | 23⁄4 | | | | 11⁄2 | | | | 13⁄4 | |
Unemployment rate5 | | | 6.2 | | | | 61⁄4 | | | | 61⁄4 | | | | 6 | |
Inflation6 | | | 1.7 | | | | 13⁄4 | | | | 2 | | | | 21⁄2 | |
Wage Price Index6 | | | 1.9 | | | | 21⁄4 | | | | 21⁄2 | | | | 3 | |
Population6 | | | 1.5 | | | | 13⁄4 | | | | 13⁄4 | | | | 13⁄4 | |
Notes:
| 1. | Unless otherwise stated, all figures are annual percentage changes. |
| 2. | CVM, 2015-16 reference year, except nominal GSP. Components not separately reported are other investment (cultivated biological resources, intellectual property products and ownership transfer costs), the balancing item (including interstate trade and inventories) and the statistical discrepancy. |
| 3. | Goods and services, percentage point contribution to growth in gross state product. |
| 4. | Through-the-year growth rate to the June quarter (seasonally adjusted). The comparable growth rates in year average terms are 0.0%, 4%, 11⁄2% and 13⁄4% from 2016-17 through to 2019-20. |
| 5. | Seasonally adjusted rate for the June quarter. |
| 6. | Annual percentage change, year-average. |
Forecast assumptions include: a gradual rise in the RBA cash rate from 2019; a broadly stable A$; oil prices to fall in the near term and then be relatively stable; and a neutral outlook for weather conditions.
Sources: ABS 3101.0, 6202.0, 6345.0, 6401.0 and Queensland Treasury.
33
Budget Strategy and Outlook 2018-19
| 3 | Fiscal strategy and outlook |
Features
| • | | The 2018-19 Budget delivers on the Government’s election commitments, especially in the areas of infrastructure, jobs and skills, and services. |
| • | | A net operating surplus of $1.512 billion is expected for 2017-18. This is $1.027 billion higher than estimated at the 2017-18 Mid Year Fiscal and Economic Review (MYFER), and $1.366 billion higher than the surplus forecast at the time of the 2017-18 Budget. |
| • | | The significant 2017-18 surplus results from short-term factors, particularly higher royalty revenue from coal prices remaining higher for longer than expected, increased Australian Government grants due to a larger Goods and Services Tax (GST) pool and upwards revisions to revenue from dividends and income tax equivalent income. |
| • | | The strong 2017-18 operating surplus will see General Government Sector debt in 2017-18 around $2.4 billion lower than estimated in the 2017-18 Budget. |
| • | | The expected return of coal prices to the medium-term outlook, anticipated reductions to GST revenue and declining dividends and interest income means the fiscal environment beyond 2017-18 remains challenging. |
| • | | A General Government Sector net operating surplus of $148 million is forecast for 2018-19. Net operating surpluses are forecast across the forward estimates, though smaller than estimated at MYFER as a result of anticipated significant reductions in receipts from the Australian Government, particularly GST. |
| • | | The General Government Sector debt to revenue ratio has decreased substantially over the period to 2017-18 in each successive budget since 2014-15. The debt to revenue ratio for 2017-18 has fallen to 54%, primarily as a result of the strong 2017-18 operating surplus, and is significantly lower than the peak of 91% in 2012-13. |
| • | | Queensland’s General Government Sector borrowing costs as a percentage of revenue are now largely in line with that of other states. Government borrowings are funding the investment in productive infrastructure that will grow the state’s economy. |
| • | | Queensland’s net worth (that is, the amount by which the State’s assets exceeds its liabilities) continues to increase. At the same time, the State’s long-term financial liabilities, including accruing superannuation liabilities and WorkCover, continue to be fully funded. |
| • | | Non-financial Public Sector debt will continue to increase over the forward estimates as a result of continued investment in economic infrastructure, however it is forecast to remain below $80 billion in 2020-21, and is almost $1.1 billion lower than forecast at the 2017-18 MYFER. |
34
Budget Strategy and Outlook 2018-19
The Queensland Government is delivering the best possible services and infrastructure to all communities.
The 2018-19 Budget focuses on implementing the 2017 election commitments, managing emerging fiscal pressures and continuing to deliver the Government’s commitment to grow the economy, supporting and creating jobs, and improve health and education outcomes.
The 2017 election commitments will be funded through reprioritisations and revenue measures, consistent with Putting Queenslanders First. In addition, Queensland Treasury will be continuing its work with agencies to find efficiencies in expenditure and ensure effectiveness in programs and service delivery.
Since MYFER, there has been a reduction of around $749 million over the forward estimates in expected GST funding provided by the Australian Government resulting from a decrease in Queensland’s share of the GST. This is despite an increase in GST funding in 2017-18, which is due to an increase in the overall size of the GST pool.
The key fiscal aggregates of the General Government Sector for the 2018-19 Budget are outlined in Table 3.1 and are discussed in detail in this chapter.
| Table 3.1 | General Government Sector – key fiscal aggregates1 |
| | | | | | | | | | | | | | | | | | | | | | | | | | | | |
| | | 2016-17
Actual2
$ million | | | 2017-18
MYFER
$ million | | | 2017-18
Est. Act.
$ million | | | 2018-19
Budget
$ million | | | 2019-20
Projection
$ million | | | 2020-21
Projection
$ million | | | 2021-22
Projection
$ million | |
Revenue | | | 56,194 | | | | 56,464 | | | | 58,259 | | | | 57,738 | | | | 58,835 | | | | 59,939 | | | | 62,269 | |
Expenses | | | 53,373 | | | | 55,980 | | | | 56,747 | | | | 57,590 | | | | 58,675 | | | | 59,829 | | | | 61,579 | |
Net operating balance | | | 2,821 | | | | 485 | | | | 1,512 | | | | 148 | | | | 160 | | | | 110 | | | | 690 | |
PNFA3 | | | 4,634 | | | | 4,965 | | | | 4,905 | | | | 5,927 | | | | 7,557 | | | | 7,396 | | | | 7,081 | |
Fiscal balance | | | 536 | | | | (1,681 | ) | | | (604 | ) | | | (3,033 | ) | | | (3,881 | ) | | | (3,400 | ) | | | (2,636 | ) |
Net Worth | | | 194,936 | | | | 198,268 | | | | 199,686 | | | | 202,636 | | | | 205,775 | | | | 208,101 | | | | 210,515 | |
Borrowing | | | 33,260 | | | | 32,502 | | | | 31,367 | | | | 32,311 | | | | 35,861 | | | | 39,588 | | | | 42,290 | |
Borrowing (NFPS)4 | | | 71,904 | | | | 71,222 | | | | 69,501 | | | | 70,871 | | | | 75,214 | | | | 79,750 | | | | 83,093 | |
Notes:
| 1. | Numbers may not add due to rounding. Bracketed numbers represent negative amounts. |
| 2. | Reflects published actuals. |
| 3. | PNFA: Purchases of non-financial assets. |
| 4. | NFPS: Non-financial Public Sector. |
35
Budget Strategy and Outlook 2018-19
| 3.2.1 | Net operating balance |
Table 3.2 compares the General Government Sector net operating balance forecasts for the 2017-18 Budget and MYFER with 2018-19 Budget forecasts.
| Table 3.2 | General Government Sector – net operating balance forecasts |
| | | | | | | | | | | | | | | | | | | | | | | | |
| | | 2016-17
$ million | | | 2017-18
$ million | | | 2018-19
$ million | | | 2019-20
$ million | | | 2020-21
$ million | | | 2021-22
$ million | |
2017-18 Budget | | | 2,824 | | | | 146 | | | | 117 | | | | 704 | | | | 408 | | | | n.a. | |
2017-18 MYFER | | | 2,821 | | | | 485 | | | | 165 | | | | 307 | | | | 531 | | | | n.a. | |
2018-19 Budget | | | 2,821 | | | | 1,512 | | | | 148 | | | | 160 | | | | 110 | | | | 690 | |
The anticipated 2017-18 net operating surplus of $1.512 billion compares with a forecast surplus of $485 million expected in the 2017-18 MYFER.
Since MYFER, forecast revenue has increased by $1.795 billion in 2017-18, primarily related to:
| • | | royalty revenues being higher than forecast, attributable largely to higher coal prices during 2017-18 |
| • | | increased grants, driven by the larger GST pool |
| • | | increased dividend and income tax equivalent income, supported by increased earnings from electricity generation and network businesses. |
The key drivers for a $767 million increase in expenses since MYFER include provisioning for the anticipated costs of Queensland participating in the National Redress Scheme and the Australian Government’s advance payment of Financial Assistance grants to local governments in 2017-18 for the 2018-19 financial year.
In 2018-19, General Government Sector expenses are estimated to be 1.5% higher than the 2017-18 estimated actual. Factors influencing the higher expenses in 2018-19 include increased activity in Health and Education, additional job creation initiatives, community services initiatives, and advance payments to local councils for the introduction of the new Waste Disposal Levy.
Additional measures, detailed in Budget Paper 4 Budget Measures, support the Government’s ongoing commitment to improve service delivery across the State.
Consistent with the Government’s fiscal principles, net operating surpluses are forecast across the forward estimates. For 2018-19, the estimated General Government Sector operating surplus of $148 million is marginally lower than the $165 million expected at the time of the 2017-18 MYFER.
Table 3.3 provides a breakdown of the movements in the net operating balance since the 2017-18 MYFER.
36
Budget Strategy and Outlook 2018-19
| Table 3.3 | Reconciliation of net operating balance, 2017-18 MYFER to 2018-19 Budget1 |
| | | | | | | | | | | | | | | | |
| | | 2017-18
$ million | | | 2018-19
$ million | | | 2019-20
$ million | | | 2020-21
$ million | |
2017-18 MYFER net operating balance | | | 485 | | | | 165 | | | | 307 | | | | 531 | |
Taxation revisions2 | | | (20 | ) | | | (160 | ) | | | (304 | ) | | | (407 | ) |
Royalty revisions | | | 638 | | | | 1,458 | | | | 1,069 | | | | 555 | |
GST revisions | | | 239 | | | | 151 | | | | (278 | ) | | | (861 | ) |
Measures3 | | | | | | | | | | | | | | | | |
Expense4 | | | (528 | ) | | | (832 | ) | | | (583 | ) | | | (561 | ) |
Revenue | | | — | | | | 116 | | | | 474 | | | | 478 | |
| | | | | | | | | | | | | | | | |
Net | | | (528 | ) | | | (716 | ) | | | (109 | ) | | | (83 | ) |
Net flows from PNFC and PFC entities5 | | | 457 | | | | 186 | | | | 114 | | | | 93 | |
Australian Government funding revisions6 | | | (64 | ) | | | (515 | ) | | | (481 | ) | | | 334 | |
Other parameter adjustments7 | | | 303 | | | | (420 | ) | | | (158 | ) | | | (51 | ) |
2018-19 Budget net operating balance | | | 1,512 | | | | 148 | | | | 160 | | | | 110 | |
Notes:
| 1. | Numbers may not add due to rounding. Numbers indicate the impact on the operating balance. A number in brackets indicates a negative impact on the operating balance. |
| 2. | Represents parameter adjustments to taxation revenue excluding taxation revenue measures. |
| 3. | Reflects the operating balance impact of Government decisions since the 2017-18 MYFER. |
| 4. | Includes anticipated costs of Queensland participating in the National Redress Scheme. |
| 5. | Represents revisions to dividends and tax equivalent payments from, and community service obligations (CSOs) and Transport Service Contract (TSC) payments to, Public Non-financial Corporations and Public Financial Corporations, net of CSO and TSC expense measures. |
| 6. | Represents the net impact of funding provided by the Australian Government primarily for Specific Purpose Payments and National Partnership payments and includes funding for disaster recovery expenses. |
| 7. | Refers to adjustments largely of a non-policy nature, primarily changes in interest paid on borrowings, depreciation, swaps and deferrals. |
| 3.3.1 | State’s operating capacity |
The Palaszczuk Government is committed to the sound management of the State’s finances, while delivering high quality services to all Queenslanders. This includes managing within the State’s means and budgeting for operating surpluses in each year of the forward estimates.
This task is made more challenging by a feature of Australia’s federal system known as vertical fiscal imbalance. This imbalance occurs because the Australian Government collects the majority of the country’s revenue, including GST, but States are responsible for delivering the majority of services to the public, including health and education services.
37
Budget Strategy and Outlook 2018-19
As outlined in Chapter 7, almost half of Queensland’s revenue is from the Australian Government. This means that Queensland’s fiscal position is largely influenced by decisions made by the Australian Government, such as not renewing expiring funding agreements, resulting in a lack of certainty about the funding that will be received each year.
Chart 3.1 shows revenue and expenses growth over five years. Over this period, average annual growth in revenue is expected to be 2.07%, with expenses expected to grow 2.9%.
| Chart 3.1 | General Government Sector revenue and expenses growth |
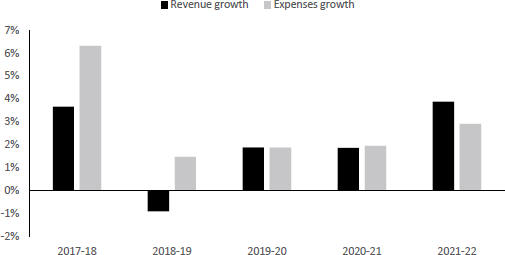
At any given time, issues exist with potentially significant fiscal impacts. However, until issues have been considered by Government or formal agreements are in place, uncertainty exists as to when and if these issues will impact on the net operating balance. Therefore, until greater certainty eventuates, the potential fiscal impacts of such issues are not included in the forward estimates.
Such issues include:
| • | | Share of future GST revenue: The Australian Productivity Commission has completed an inquiry into horizontal fiscal equalisation – the principle underpinning the distribution of GST revenue to the states and territories. At the time of finalising the 2018-19 Budget Papers, states have not been provided with the final report. The recommendations have the potential to significantly change the amount of GST revenue that Queensland receives. |
| • | | Long-term School Funding Agreement: The Australian Government is currently in negotiation with State and Territory governments to renew a new five-year School Funding Agreement from 1 January 2019. The agreement may require Queensland to increase school funding over the coming years, based on a new funding methodology. States and Territories are negotiating the terms of the agreement, including the measurement of the funding methodology and transition period. |
38
Budget Strategy and Outlook 2018-19
| • | | Remote Housing: The National Partnership on Remote Housing focussed on addressing critical housing needs for Aboriginal and Torres Strait Islander people in remote communities to reduce overcrowding and improve living standards. This agreement expires 30 June 2018, and no renewed funding was provided in the 2018-19 Commonwealth Budget. Significant additional investment is required to meet the growing housing needs in remote Indigenous communities. There are also significant costs to the State related to operating and maintaining existing dwellings constructed under the expiring agreement. |
Revenue
An economic environment that supports business and jobs growth, and does not place undue strain on households through policy and taxation settings, is key for any jurisdiction.
To support the delivery of election commitments, the 2017-18 MYFER reflected the Government’s adoption of four modest revenue measures:
| • | | a 0.5% increase in the land tax rate for aggregated holdings above $10 million |
| • | | an increase in the Additional Foreign Acquirer Duty (AFAD) from 3% to 7% |
| • | | an increase of $2 per $100 of dutiable value for vehicles valued above $100,000 |
| • | | a 15% point of consumption betting tax. |
These measures are discussed in further detail in Chapter 4.
The Government will also introduce a Waste Disposal Levy of $70 per tonne from the first quarter of 2019, as part of a comprehensive waste management strategy.
More information on Queensland’s revenue outlook is provided in Chapter 4.
Fiscal principle supporting revenue management
Taxation per capita in Queensland is significantly lower compared to the average of other Australian states and territories, as discussed in Chapter 4. In 2018-19, Queensland’s taxation per capita of $2,808 will be $875 per capita less than the average of the other jurisdictions.
The Government also aims to support businesses and households by ensuring that own-source revenue in the General Government Sector, including user charges and royalties, remains at or below 8.5% of nominal gross state product (GSP), on average, across the forward estimates. Own-source revenue is derived from total State revenue less any grants received from external sources, mainly the Australian Government.
This principle is expected to be met over the forward estimates period, with revenue falling as a percentage of GSP. For 2018-19, General Government own-source revenue is forecast to be 8.2% of nominal GSP. This falls to 7.7% by 2021-22, with an average of 8.0% across the four years.
Expenses
The forward estimates include the Palaszczuk Government’s election commitments, as outlined in Putting Queenslanders First, which total $1.383 billion. All election commitments have been fully funded through revenue measures and over $1 billion in reprioritisation measures (excluding Queensland Health) over the forward estimates. Delivery of these measures will neither be at the cost of public service jobs nor will require the sale of strategic income-earning assets.
39
Budget Strategy and Outlook 2018-19
Between 2016-17 and 2021-22, expenses are forecast to grow at an average annual rate of 2.9% per year. More information on Queensland’s expenditure outlook is provided in Chapter 5.
Fiscal principle supporting expenses management
In the General Government sector, employee expenses equate to approximately 40% of total expenses. Increases in employee expenses reflect changes in the number of public sector employees as well as wages growth.
A key focus is to ensure a balance between delivery of high-quality services, and the discipline that underpins the Government’s commitment to fiscal sustainability.
To manage employee expenses growth, the Palaszczuk Government has adopted a fiscal principle to maintain a sustainable public service by ensuring that overall growth in full-time equivalents (FTE) employees, on average over the forward estimates, does not exceed population growth.
FTEs are estimated to increase by around 3,833 (or 1.71%) in 2018-19, with the majority of the increase being attributable to growth in health and education.
Average FTE growth over the forward estimates period from 2017-18 to 2021-22 is 1.71%. This compares to an estimated Queensland population growth of 13⁄4% annually.
Further details on FTE estimates are provided in Chapter 5, with Table 5.2 providing in-scope agencies and their FTE estimates for 2017-18 and 2018-19.
| 3.3.2 | Infrastructure investment |
The Palaszczuk Government is delivering essential infrastructure and capital works to meet the State’s increasing service needs and to promote increased productivity and efficiency for the State’s industries. The Government also recognises that building infrastructure benefits local communities, strengthens local economies and supports local jobs.
The Palaszczuk Government’s 2017 election commitments outlined $1.404 billion in new capital measures, including:
| • | | $353 million towards Building Better Hospitals |
| • | | over $128 million towards Future Proofing the Bruce |
| • | | $308 million towards Building Future Schools |
| • | | $235 million towards Renewing Our Schools. |
These capital measures will be funded primarily through allocations from the State Infrastructure Fund and through improved cash management practices.
As part of the 2018-19 Budget, the Government has provided further capital funding of just over $900 million for M1 Pacific Motorway upgrades and $176 million towards the Rookwood Weir.
Further information about the Government’s capital program is provided in Chapter 6 and Budget Paper 3 Capital Statement.
40
Budget Strategy and Outlook 2018-19
| Box 3.1 | History of purchases of non-financial assets in Queensland |
As can be seen from Chart 3.2, purchases of non-financial assets (PNFA), across the entire Non-financial Public Sector, which includes the spending by government-owned corporations, increased significantly from 2003-04, peaking at $15.101 billion in 2008-09.
| Chart 3.2 | Purchases of non-financial assets, Non-financial Public Sector |
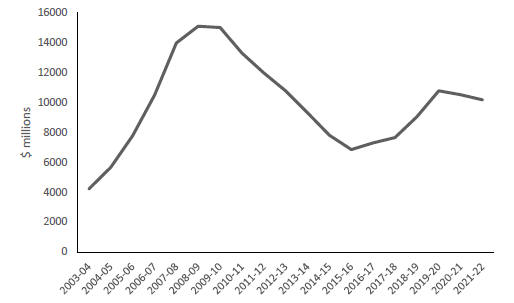
The unprecedented high levels of capital spending were the culmination of many unique circumstances existing at the time. These included:
| • | | responding to the prolonged drought in South East Queensland between 2001 and 2009, resulting in a range of measures, including the Gold Coast Desalination Plant, the Western Corridor Recycled Water Scheme and new dams and weirs, as well as the Government purchase of SEQ council-owned assets which formed the basis of the SEQ Water Grid |
| • | | several large health-related infrastructure projects from 2007-08, peaking in 2011-12, including the construction of Lady Cilento Children’s Hospital, the Sunshine Coast University Hospital, and the Gold Coast University Hospital |
| • | | ramping up of investment in electricity infrastructure from 2004-05 to meet strong growth in demand and ensuring Queenslanders could enjoy improved reliability and safety of supply |
| • | | roadway infrastructure of around $500 million per year in the four years to 2010-11, prior to the divestment of Queensland Motorways Limited |
| • | | Commonwealth stimulus in response to the Global Financial Crisis, which included programs such as Social Housing and the Building the Education Revolution program. |
41
Budget Strategy and Outlook 2018-19
More recently, the State has entered into several finance lease type arrangements, mainly resulting from Public Private Partnerships (PPPs), which are included in the capital program but not fully reflected in purchase of non-financial assets.
Purchases of non-financial assets going forward
Going forward, the Government is, where appropriate, funding its capital program through methods other than direct PNFA. As mentioned above, PPPs, for example, provide alternative financing approaches for the development of new infrastructure or other capital.
The magnitude of spending on PNFA that occurred from the mid-to-late 2000s was brought about by a range of unique circumstances. While the capital program is forecast to increase from its 2015-16 level, it does not return to previous highs.
Chart 3.3 provides an interjurisdictional comparison over time, showing that from 2019-20, Queensland’s capital spending per capita is expected to exceed the average of other states.
| Chart 3.3 | Per capita purchases of non-financial assets, General Government Sector |
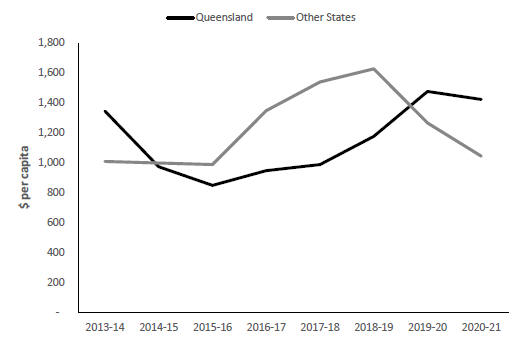
42
Budget Strategy and Outlook 2018-19
Improving delivery of the capital program
The Government has implemented a clear focus on improving the timely delivery of essential infrastructure in Queensland. This has resulted in an improvement in the amount of capital expenditure that is actually delivered, as a proportion of the Budget allocation.
This is demonstrated in Chart 3.4, which identifies that the proportion of budgeted purchases of non-financial assets actually delivered in 2016-17 was the highest in the past five years. Further improvement is anticipated in 2017-18, with more than 90% of budgeted purchases of non-financial assets expected to be delivered.
| Chart 3.4 | Total State purchases of non-financial assets – actual as a proportion of budget |
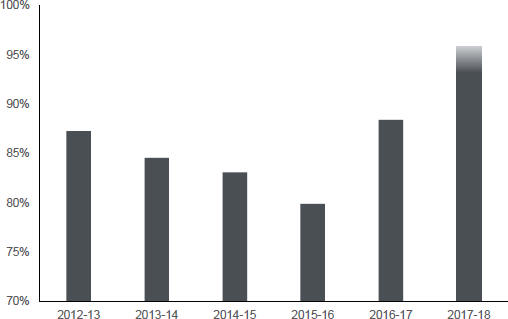
Fiscal principles supporting capital investment management
The Government has adopted two fiscal principles to ensure that there is a consistent flow of capital works and that any new capital investment is funded primarily through recurrent revenues rather than borrowings.
While the value of the total capital program can fluctuate across financial years, the 2018-19 Budget provides for an average General Government Sector PNFA of $6.990 billion across the budget and forward estimates. Total General Government Sector PNFA over the budget and forward estimates are projected at $27.961 billion.
43
Budget Strategy and Outlook 2018-19
Infrastructure funding
The General Government Sector Cash Flow Statement (refer Table 9.7) provides details of the sources of funding for capital investment. It shows that net cash inflows from operating activities equate to 99% of the funding required for the 2017-18 net General Government Sector investments in non-financial assets.
Across 2018-19 to 2021-22, net cash inflows from operating activities are budgeted to average 49.4% of the funding required, primarily reflecting the higher level of capital spending during the period.
The Government is continuing to invest in infrastructure projects that are necessary to support Queensland’s growing population and economy. Borrowings will increase to support the capital program, but are expected to remain below projections in the 2017-18 MYFER due to the stronger than expected 2017-18 operating surplus.
Gross General Government Sector borrowings of $31.367 billion at 30 June 2018 are forecast to be $1.135 billion lower than forecast in the 2017-18 MYFER and $17.054 billion less than forecast at the time of the 2014-15 Budget.
Borrowings
The history of Queensland Government debt over the past decade mirrors that of the Queensland economy. Before 2007, the economic and fiscal policies of the State reflected a transition from a low service level State, to a State with service levels comparable to other major states in Australia. This transition supported a period of sustained growth in the Queensland economy, with many significant infrastructure projects providing enhanced community facilities like schools and hospitals, along with supporting resource development as populations increased significantly across regional Queensland.
While total spending increased over this period as new major social spending programs were introduced, these costs were supported by revenues generated from the housing and mining booms, as well as increases in GST revenues arising from credit expansion. To put this into context, Queensland’s GST revenue alone grew by an average rate of 7.5% per annum across the periods 2001-02 to 2007-08.
In 2007, the global financial crisis (GFC) impacted every major economy in the world, including Queensland. Consumer confidence fell, expectations of a recession rose, and the State’s growing revenue base began to contract.
The Government at the time decided to maintain its economic development program and increase debt. This decision to continue the State’s capital program was aimed at avoiding recession during the GFC. Combined with actions from the Australian Government and the Reserve Bank, along with strong demand from China, the Queensland and Australian economies continued to grow through the GFC.
Avoiding recession also saw Queensland avoid the economic and social effects of very high and sustained unemployment, with the State’s trend unemployment rate remaining below 6% through to late-2012.
Queensland is currently benefiting from the sustained levels of investment that occurred over the past decade, as discussed in Box 3.1.
44
Budget Strategy and Outlook 2018-19
The debt accumulated over this time was not wasted by governments, but was invested for the future benefit of Queensland, much of which is already being realised. This approach is consistent with fiscal sustainability principles which seek to spread the burden of public spending fairly across generations, with public consumption benefiting the current generation being paid for by that generation. This approach ensures intergenerational equity, with the debt associated with an investment repaid over the life of the asset or term of benefit received from the investment.
Chart 3.5 shows the ratio of borrowings to gross state product (GSP), that is, the amount of debt as compared to the state’s total output.
| Chart 3.5 | Borrowings to gross state product ratio |
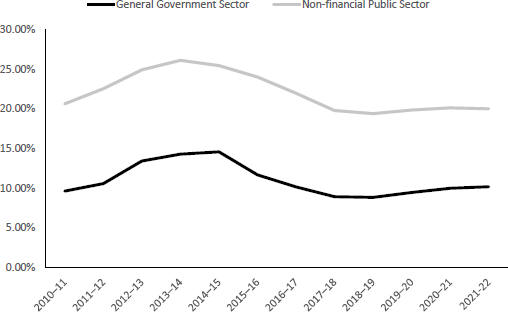
An alternative way of assessing the appropriateness of debt levels is to consider the State’s capacity to service its borrowing costs, that is, interest payments as a proportion of revenue (as shown in Chart 3.6). This concept can be likened to a person assessing their ability to service an interest only loan.
45
Budget Strategy and Outlook 2018-19
| Chart 3.6 | General Government Sector – interest expense to total revenue1 |
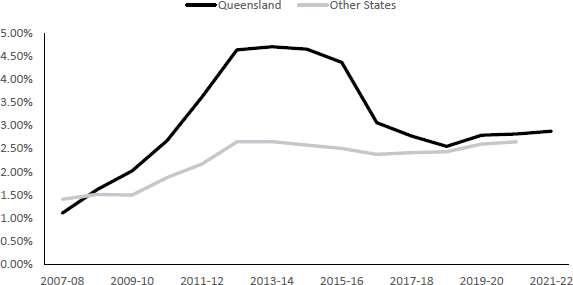
Note:
| 1. | Average for other states not provided for 2021-22 as not all states have released their 2018-19 Budgets. |
Queensland’s ratio is projected to remain relatively flat across the forward estimates, and is only marginally higher than the average in other states.
General Government Sector net worth, which is the difference between assets and liabilities, is $200 billion, and continues to increase across the forward estimates, reflecting the State’s investment in additional assets.
Fiscal principles supporting liabilities management
A primary fiscal principle of the Queensland Government has been to reduce General Government Sector debt, to provide the Government with the capacity to respond to market and environmental shocks.
The debt to revenue measure ratio is the key measure of the sustainability of General Government Sector debt levels. The Government aims to reduce this ratio over time to continue to improve the State’s fiscal sustainability.
The General Government Sector’s debt to revenue ratio has fallen substantially over the period to 2017-18 in each successive budget since 2014-15, as seen in Chart 3.7. The debt to revenue ratio for 2017-18 falls to 54%, significantly lower than the 91% in 2012-13.
Across the forward estimates, the expected moderation in revenue growth, as well as the timing of significant capital projects and associated borrowings, sees a gradual increase in the forecast debt to revenue ratio to 2020-21. On average over the budget and forward estimates, the debt to revenue ratio is 63%, well below the four years to 2019-20 forecast in the 2016-17 Budget.
46
Budget Strategy and Outlook 2018-19
| Chart 3.7 | General Government Sector debt to revenue ratio |
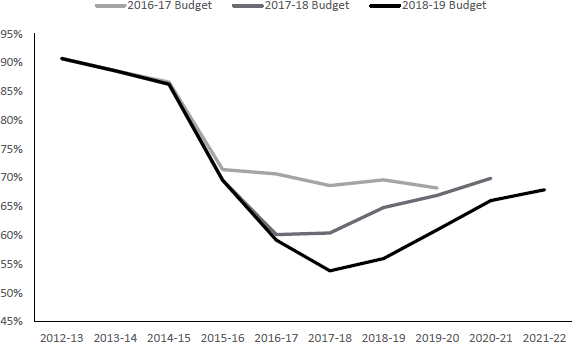
The Government also remains committed to maintaining the long-standing practice of ensuring that the State sets aside assets to meet long-term liabilities such as superannuation and WorkCover, in accordance with actuarial advice.
The State Actuary’s most recent valuations indicate that, as at 30 June 2017, both the defined benefit superannuation scheme and the WorkCover scheme were fully funded.
47
Budget Strategy and Outlook 2018-19
| 3.4 | Achievement of fiscal principles |
Table 3.4 provides a summary of the Government’s progress in meeting its fiscal principles’ targets.
| Table 3.4 | The fiscal principles of the Queensland Government |
| | | | | | | | | | | | |
Principle | | Indicator | |
| | | General Government debt to revenue ratio | |
| | | | | | 2017-18 MYFER
% | | | 2018-19 Budget
% | |
Target ongoing reductions in Queensland’s relative debt burden, as measured by the General Government debt to revenue ratio. | | | 2017-18 | | | | 58 | | | | 54 | |
| | | 2018-19 | | | | 60 | | | | 56 | |
| | | 2019-20 | | | | 63 | | | | 61 | |
| | | 2020-21 | | | | 66 | | | | 66 | |
| | | 2021-22 | | | | n.a. | | | | 68 | |
| |
| | | General Government net operating cash flows as a
proportion of net investments in non-financial assets | |
| | | | | | 2017-18 MYFER
% | | | 2018-19 Budget
% | |
| | | | | | | | | | |
Target net operating surpluses that ensure any new capital investment in the General Government Sector is funded primarily through recurrent revenues rather than borrowing. | | | 2017-18 | | | | 69 | | | | 99 | |
| | | 2018-19 | | | | 49 | | | | 60 | |
| | | 2019-20 | | | | 40 | | | | 40 | |
| | | 2020-21 | | | | 53 | | | | 44 | |
| | | 2021-22 | | | | n.a | | | | 53 | |
| |
| | | General Government purchases of non-financial assets | |
| | | | | | 2017-18 MYFER
$ million | | | 2018-19 Budget
$ million | |
| | | | | | | | | | |
The capital program will be managed to ensure a consistent flow of works to support jobs and the economy and reduce the risk of backlogs emerging. | | | 2017-18 | | | | 4,965 | | | | 4,905 | |
| | | 2018-19 | | | | 6,626 | | | | 5,927 | |
| | | 2019-20 | | | | 7,486 | | | | 7,557 | |
| | | 2020-21 | | | | 6,910 | | | | 7,396 | |
| | | 2021-22 | | | | n.a. | | | | 7,081 | |
48
Budget Strategy and Outlook 2018-19
| | | | | | |
Principle | | Indicator | |
Maintain competitive taxation by ensuring that General Government Sector own-source revenue remains at or below 8.5% of nominal gross state product, on average, across the forward estimates. | | General Government own-source revenue to GSP | | | | |
| | 2018-19 | | | 8.2 | % |
| | Average across the forward estimates | | | 8.0 | % |
Target full funding of long-term liabilities such as superannuation and WorkCover in accordance with actuarial advice. | | As at the last actuarial review (as at June 2017), accruing superannuation liabilities were fully funded. The WorkCover scheme was also fully funded as at 30 June 2017. | | | | |
Maintain a sustainable public service by ensuring that overall growth in full-time equivalents (FTE) employees, on average over the forward estimates, does not exceed population growth. | | FTE growth | | | | |
| | Average across the forward estimates | | | 1.7 | % |
| | Population growth | | | | |
| | Average across the forward estimates | | | 13⁄4 | % |
49
Budget Strategy and Outlook 2018-19
Features
| • | | Total General Government Sector revenue is estimated to be $58.259 billion in 2017-18, $2.065 billion (or 3.7%) higher than in 2016-17 and $2.390 billion (or 4.3%) higher than estimated in the 2017-18 Budget. Higher than budgeted revenue growth in 2017-18 is due to increased revenue from royalties resulting from higher coal prices and increased GST and other revenue from the Australian Government. |
| • | | Australian Government payments to Queensland in 2018-19 are expected to total $27.411 billion, representing a decrease of $694 million compared to payments in 2017-18. |
| • | | Total General Government Sector revenue is estimated to be $57.738 billion in 2018-19. The decrease of $521 million (or 0.9%) from 2017-18 is largely due to reduced Australian Government grants and lower dividend and income tax equivalent income. |
| • | | Total revenue is expected to grow at an average rate of 2.1% over the five years to 2021-22. Revenue growth over this period is supported by average annual growth in taxation of 5.3% and current grants of 3.0% but is also affected by declining royalties as coal prices return to medium-term levels, lower interest income due to a reduction in the portfolio of financial assets held and lower dividends. |
| • | | Queensland will maintain its competitive tax status, with per capita state tax estimated at $2,808 in 2018-19, compared to an average of $3,683 for the other states and territories. Taxation as a proportion of Queensland’s economy will be 3.9% in 2018-19, down from the five-year peak of 4.3% in 2014-15. |
| • | | The Government will introduce a Waste Disposal Levy of $70 per tonne from the first quarter of 2019, as part of a comprehensive waste management strategy. |
| • | | The payroll tax rebate for apprentices and trainees will continue at the increased rate of 50% for an additional 12 months, until 30 June 2019. |
| • | | New revenue measures to fund election commitments were announced in the 2017-18 MYFER and include a 0.5% increase to the land tax rate above $10 million, increased Additional Foreign Acquirer Duty from 3% to 7%, increased duty for premium light passenger vehicles valued above $100,000 and a 15% point of consumption tax on betting operators. |
50
Budget Strategy and Outlook 2018-19
| 4.1 | 2017-18 estimated actual |
General Government Sector revenue in 2017-18 is estimated to be $58.259 billion, which is $2.390 billion (or 4.3%) more than the 2017-18 Budget estimate. Significant variations from the 2017-18 Budget estimates include:
| • | | a $1.012 billion (or 29.2%) increase in revenue from royalties and land rents, mainly resulting from higher coal prices continuing for longer than expected in the 2017-18 Budget |
| • | | a $851 million (or 3.1%) increase in grants, driven by increased GST due to a larger GST pool, and other revenue from the Australian Government, partially offset by lower than anticipated capital grants |
| • | | a $629 million (or 30.6%) increase in dividend and income tax equivalent income, supported by increased earnings from electricity generation and network businesses. Queensland’s ownership of its electricity assets enables the Government to reinvest dividends to improve affordability through the Affordable Energy Plan. |
These increases were partially offset by lower than estimated revenue from sales of goods and services.
| Table 4.1 | General Government Sector revenue1 |
| | | | | | | | | | | | | | | | | | | | | | | | | | | | |
| | | 2016-17
Actual
$ million | | | 2017-18
Budget
$ million | | | 2017-18
Est. Act.
$ million | | | 2018-19
Budget
$ million | | | 2019-20
Projection
$ million | | | 2020-21
Projection
$ million | | | 2021-22
Projection
$ million | |
Taxation revenue | | | 12,919 | | | | 13,298 | | | | 13,284 | | | | 14,155 | | | | 15,184 | | | | 15,951 | | | | 16,722 | |
Sales of goods and services | | | 5,642 | | | | 6,067 | | | | 5,861 | | | | 5,731 | | | | 5,947 | | | | 6,074 | | | | 6,306 | |
Interest income | | | 2,336 | | | | 2,330 | | | | 2,323 | | | | 2,201 | | | | 2,078 | | | | 1,861 | | | | 1,855 | |
Grants revenue | | | | | | | | | | | | | | | | | | | | | | | | | | | | |
Current grants | | | 24,540 | | | | 25,299 | | | | 26,583 | | | | 26,001 | | | | 26,189 | | | | 27,059 | | | | 28,402 | |
Capital grants | | | 2,843 | | | | 2,332 | | | | 1,898 | | | | 1,700 | | | | 1,967 | | | | 2,002 | | | | 1,985 | |
Dividend and income tax equivalent income | | | | | | | | | | | | | | | | | |
Dividends | | | 1,693 | | | | 1,453 | | | | 1,877 | | | | 1,552 | | | | 1,407 | | | | 1,293 | | | | 1,229 | |
Income tax equivalent income | | | 997 | | | | 604 | | | | 809 | | | | 666 | | | | 669 | | | | 617 | | | | 558 | |
Other revenue | | | | | | | | | | | | | | | | | | | | | | | | | | | | |
Royalties and land rents | | | 4,000 | | | | 3,472 | | | | 4,484 | | | | 4,615 | | | | 4,260 | | | | 3,904 | | | | 4,011 | |
Other | | | 1,222 | | | | 1,015 | | | | 1,139 | | | | 1,118 | | | | 1,135 | | | | 1,178 | | | | 1,202 | |
Total revenue | | | 56,194 | | | | 55,869 | | | | 58,259 | | | | 57,738 | | | | 58,835 | | | | 59,939 | | | | 62,269 | |
Note:
| 1. | Numbers may not add due to rounding. |
51
Budget Strategy and Outlook 2018-19
| 4.2 | 2018-19 revenue by category |
General Government Sector revenue in 2018-19 is estimated to be $57.738 billion, $521 million (or 0.9%) lower than the 2017-18 estimated actual revenue of $58.259 billion. The revenue reduction in 2018-19 reflects a range of factors, including:
| • | | Revenue from the Australian Government is expected to be $694 million lower in 2018-19 than in 2017-18, due to a decline in Queensland’s GST revenue sharing relativity and reduced payments for specific purposes. |
| • | | Dividends and income tax equivalent income are forecast to be $469 million lower in 2018-19. Further information on these revenues can be found in Chapter 8. |
Partially offsetting these decreases are moderate growth in taxation revenue (6.6%), supported by growth in the payroll tax and land tax base and new policy measures including the Waste Disposal Levy.
After increasing 11.6% in 2017-18, royalties are expected to increase 2.8% in 2018-19. While coal royalties are expected to decline 6.5% in 2018-19 due to declining hard coking coal prices, this reduction is expected to be offset by increased revenue from petroleum (including LNG) and other minerals. Trends in factors affecting royalty revenue are discussed in section 4.7.
Major sources of General Government Sector revenue in 2018-19 are grants revenue (48.0%) and taxation revenue (24.5%). Table 4.1 details revenue estimates by category, and Chart 4.1 illustrates the composition of General Government Sector revenue.
| Chart 4.1 | Revenue by operating statement category, 2018-191 |
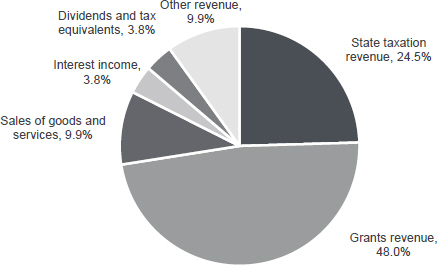
Notes:
| 1. | Numbers may not add due to rounding. |
| 2. | The major component of other revenue is royalties and land rents (8.0% of total revenue) |
52
Budget Strategy and Outlook 2018-19
| 4.3 | 2018-19 Budget initiatives |
| 4.3.1 | Extension of increased payroll tax rebate for apprentices and trainees |
The Government is continuing the payroll tax rebate on the wages of apprentices and trainees at the increased rate of 50% until 30 June 2019. This rebate is in addition to their wages being exempt and will be used as an offset against payroll tax payable on the wages of other employees.
The rebate extension is estimated to reduce revenue by $26 million in 2018-19.
The Government is committed to developing a comprehensive waste management strategy with a key component being the implementation of a Waste Disposal Levy. The levy will improve recycling outcomes and address interstate transportation of waste to Queensland.
The Waste Disposal Levy will commence in the first quarter of 2019 and will initially be set at $70 per tonne (higher for regulated waste) and increase by $5 per tonne per annum.
| 4.3.3 | 2017-18 MYFER measures |
The 2017-18 MYFER outlined new revenue measures, including:
| • | | a 0.5% increase in the land tax rate for aggregated holdings above $10 million |
| • | | an increase in Additional Foreign Acquirer Duty (AFAD) from 3% to 7% |
| • | | an increase of $2 per $100 of dutiable value for premium light passenger vehicles |
| • | | a 15% point of consumption tax on the net wagering revenue of betting operators licenced in Australia from bets placed in Queensland. |
Land tax, AFAD and motor vehicle duty measures will apply from 1 July 2018. The point of consumption betting tax will apply from 1 October 2018, and is discussed further in section 4.5.4.
Further detail on these measures, including expected additional revenue, is included in Budget Paper 4 Budget Measures.
53
Budget Strategy and Outlook 2018-19
| 4.4 | Queensland’s revenue trends |
Chart 4.2 examines the contribution of the key revenue sources of GST, taxation and royalties to revenue growth. GST was the largest driver of growth in 2017-18, due to increases in both the GST pool distributed to states and Queensland’s share of the pool as determined by the Commonwealth Grants Commission. In 2018-19, taxation revenue contributes the largest proportion to growth, with a smaller increase to royalties expected as increasing petroleum royalty revenue is partially offset by decreasing coal royalties. Lower GST revenue is expected in 2018-19 compared to 2017-18, due to Queensland receiving a reduced share of the GST pool.
Total revenue growth, which is mainly driven by these three sources, is estimated to be 2.1% on average over the five years to 2021-22. This is far lower than the 7.6% average growth over the last fifteen years to 2016-17.
| Chart 4.2 | Contribution to growth of key revenues1 |
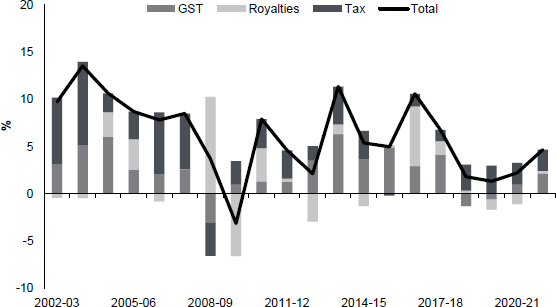
Note:
| 1. | Annual percentage point contribution to growth of the aggregate of three categories (GST, royalties and taxes). Total is the annual % growth in revenues of the aggregate of the three categories. |
Total revenue growth over the forward estimates is mainly driven by moderate taxation revenue growth, averaging 5.3% over the five years to 2021-22, supported by expected growth in major taxes such as payroll tax, transfer duty and land tax, and also by the introduction of the Waste Disposal Levy. Taxation revenue as a proportion of Queensland’s economy will remain stable over this period rising only slightly from 3.9% in 2018-19 to 4.0% in each year to 2021-22, below the recent peak of 4.3% in 2014-15.
Total royalty revenue is expected to decline in 2019-20 and 2020-21 in line with declining coal prices. GST revenue increased by 9.1% in 2017-18, but is expected to decline in 2018-19 and 2019-20 due to Queensland’s share of the GST pool reducing, with modest growth forecast from 2020-21 as the GST pool increases. Over the four years to 2021-22, GST revenue growth is expected to average 0.8% per year.
54
Budget Strategy and Outlook 2018-19
Total revenue from taxation is expected to grow by 6.6% in 2018-19, following an estimated increase of 2.8% in 2017-18. Chart 4.3 indicates the composition of estimated State taxation revenue for 2018-19. The largest sources are payroll tax and transfer duty, which together represent around 52% of the State’s total taxation revenue in 2018-19.
| Chart 4.3 | State taxation by tax category, 2018-191 |
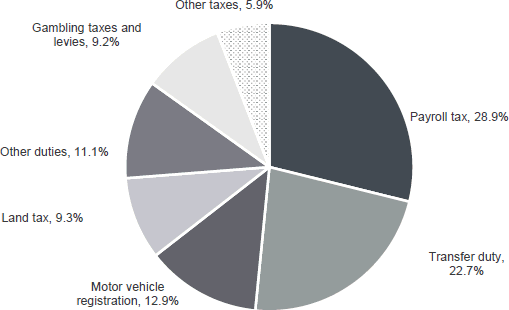
Note:
| 1. | Percentages may not add to 100% due to rounding. ‘Other duties’ includes vehicle registration duty, insurance duty and other minor duties. ‘Other taxes’ includes the Emergency Management Levy, Waste Disposal Levy, guarantee fees and other minor taxes. |
55
Budget Strategy and Outlook 2018-19
Table 4.2 shows the main components of taxation revenue.
| Table 4.2 | State taxation revenue1 |
| | | | | | | | | | | | | | | | | | | | | | | | |
| | | 2016-17
Actual
$ million | | | 2017-18
Est. Act.
$ million | | | 2018-19
Budget
$ million | | | 2019-20
Projection
$ million | | | 2020-21
Projection
$ million | | | 2021-22
Projection
$ million | |
Payroll tax | | | 3,695 | | | | 3,887 | | | | 4,086 | | | | 4,312 | | | | 4,574 | | | | 4,850 | |
Duties | | | | | | | | | | | | | | | | | | | | | | | | |
Transfer | | | 3,278 | | | | 3,090 | | | | 3,214 | | | | 3,396 | | | | 3,578 | | | | 3,768 | |
Vehicle registration | | | 514 | | | | 543 | | | | 592 | | | | 621 | | | | 651 | | | | 682 | |
Insurance2 | | | 854 | | | | 900 | | | | 945 | | | | 992 | | | | 1,042 | | | | 1,094 | |
Other duties3 | | | 37 | | | | 34 | | | | 35 | | | | 37 | | | | 39 | | | | 40 | |
Total duties | | | 4,684 | | | | 4,567 | | | | 4,786 | | | | 5,046 | | | | 5,309 | | | | 5,584 | |
Gambling taxes and levies | | | | | | | | | | | | | | | | | | | | | | | | |
Gaming machine tax | | | 684 | | | | 718 | | | | 750 | | | | 784 | | | | 819 | | | | 819 | |
Health Services Levy | | | 73 | | | | 85 | | | | 93 | | | | 103 | | | | 113 | | | | 124 | |
Lotteries taxes | | | 241 | | | | 258 | | | | 266 | | | | 274 | | | | 282 | | | | 291 | |
Betting taxes4 | | | 10 | | | | 10 | | | | 71 | | | | 96 | | | | 99 | | | | 101 | |
Casino taxes and levies | | | 98 | | | | 103 | | | | 106 | | | | 109 | | | | 113 | | | | 113 | |
Keno tax | | | 20 | | | | 20 | | | | 21 | | | | 21 | | | | 22 | | | | 23 | |
Total gambling taxes and levies | | | 1,127 | | | | 1,194 | | | | 1,307 | | | | 1,388 | | | | 1,448 | | | | 1,471 | |
Other taxes | | | | | | | | | | | | | | | | | | | | | | | | |
Land tax | | | 1,082 | | | | 1,183 | | | | 1,313 | | | | 1,368 | | | | 1,433 | | | | 1,512 | |
Motor vehicle registration | | | 1,681 | | | | 1,755 | | | | 1,829 | | | | 1,892 | | | | 1,961 | | | | 2,032 | |
Emergency Management Levy | | | 484 | | | | 509 | | | | 536 | | | | 559 | | | | 583 | | | | 609 | |
Waste Disposal Levy | | | — | | | | — | | | | 101 | | | | 406 | | | | 408 | | | | 408 | |
Guarantee fees5 | | | 115 | | | | 139 | | | | 150 | | | | 165 | | | | 186 | | | | 206 | |
Other taxes6 | | | 52 | | | | 51 | | | | 48 | | | | 49 | | | | 50 | | | | 51 | |
Total taxation revenue | | | 12,919 | | | | 13,284 | | | | 14,155 | | | | 15,184 | | | | 15,951 | | | | 16,722 | |
Notes:
| 1. | Numbers may not add due to rounding. |
| 2. | Includes duty on accident insurance premiums. |
| 3. | Includes duty on life insurance premiums. |
| 4. | Does not account for allocation of proceeds subject to commercial-in-confidence negotiations, for example, the quantum of compensation to Racing Queensland for impacts from implementation of the betting tax. |
| 5. | Includes competitive neutrality fees charged to government-owned corporations. |
| 6. | Includes the Statutory Insurance Scheme Levy and Nominal Defendant Levy. |
56
Budget Strategy and Outlook 2018-19
| 4.5.1 | Queensland’s competitive tax status |
Taxation can impact on business decisions regarding investment and employment, and also household investment and home ownership. Maintaining the competitiveness of Queensland’s tax system provides a competitive advantage to business and moderates the tax burden for its citizens, and is therefore fundamental to the Government’s commitment to job creation and sustainable development.
One of the Government’s fiscal principles is to maintain competitive taxation by ensuring General Government Sector own-source revenue remains at or below 8.5% of nominal gross state product (GSP), on average, across the forward estimates. Own-source revenue is the total State revenue less any grants received from external sources, mainly the Australian Government. This principle is expected to be met over the forward estimates period, with own-source revenue below 8.5% of GSP. Chapter 3 provides more detail on the Government’s fiscal principles.
As Chart 4.4 shows, taxation per capita in Queensland is significantly lower than the average taxation per capita in the other states and territories. In 2018-19, it is estimated that Queensland’s taxation per capita of $2,808 will be $875 per capita less than the average of other jurisdictions.
| Chart 4.4 | Taxation per capita, 2018-19 |
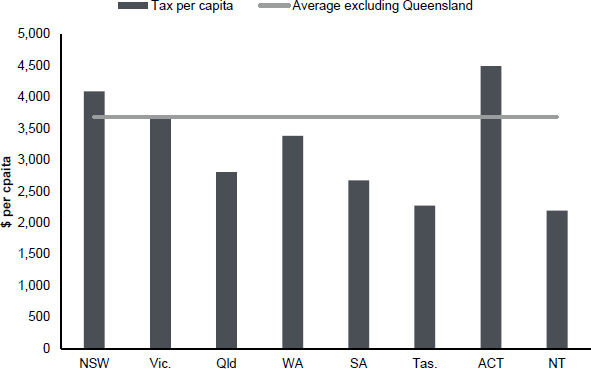
Sources: 2018-19 Budget for all jurisdictions except New South Wales, South Australia and Tasmania where 2017-18 mid-year updates are used. Population estimates from the 2018-19 Commonwealth Budget.
57
Budget Strategy and Outlook 2018-19
Table 4.3 demonstrates that the Queensland tax system remains amongst the most competitive in Australia, using various measures of tax competitiveness.
Queensland’s tax effort, as measured by the Commonwealth Grants Commission, was 14.9% below the national average in 2016-17. A third measure of competitiveness, taxation as a share of GSP, also confirms that Queensland’s taxes are competitive with other states.
| Table 4.3 | Queensland’s tax competitiveness |
| | | | | | | | | | | | | | | | | | | | | | | | | | | | | | | | | | | | |
| | | NSW | | | Vic. | | | Qld | | | WA | | | SA | | | Tas.4 | | | ACT5 | | | NT4 | | | Avg6 | |
Taxation per capita1($) | | | 4,090 | | | | 3,686 | | | | 2,808 | | | | 3,382 | | | | 2,674 | | | | 2,277 | | | | 4,518 | | | | 2,198 | | | | 3,683 | |
Taxation effort2 (%) | | | 103.9 | | | | 105.0 | | | | 85.1 | | | | 102.4 | | | | 102.8 | | | | 89.3 | | | | 97.3 | | | | 84.2 | | | | 100.0 | |
Taxation % of GSP3 (%) | | | 5.4 | | | | 5.3 | | | | 4.0 | | | | 3.4 | | | | 4.3 | | | | 3.8 | | | | 4.4 | | | | 2.3 | | | | 4.9 | |
Notes:
| 1. | 2018-19 data. Sources: 2018-19 Budget for all jurisdictions except New South Wales, South Australia and Tasmania, where 2017-18 mid-year updates are used. Population data from Commonwealth 2018-19 Budget. |
| 2. | 2016-17 data. Source: Commonwealth Grants Commission 2018 Update – total tax revenue effort for assessed taxes (payroll, transfer duty, land tax, insurance duty and motor vehicle taxes). Revenue raising effort ratios are an indicator of the extent to which governments burden their revenue bases. |
| 3. | 2016-17 data. Sources: Australian Bureau of Statistics 5506.0 and ABS 5220.0. |
| 4. | Low taxation per capita primarily reflects the lower revenue raising capacity of those jurisdictions. |
| 5. | Figures include municipal rates. |
| 6. | Weighted average of states and territories, excluding Queensland (aside from taxation effort, which is the average of all states). |
The overall payroll tax rate of 4.75% is the lowest in Australia and the exemption threshold of $1.1 million is the highest threshold of any mainland state. Queensland employers with total yearly Australian taxable wages between $1.1 million and $5.5 million also obtain a partial deduction, with the deduction withdrawn at a rate of $1 in every $4 of taxable wages.
In addition to the wages of eligible apprentices and trainees being exempt from payroll tax, a 25% payroll tax rebate was applied to these wages from 1 July 2015. To offer an added incentive for businesses to employ apprentices and trainees, the rebate was increased to 50% from 1 July 2016 to 30 June 2018. In this Budget, the increased rebate has been extended a further 12 months, and will provide additional support to businesses employing apprentices and trainees to 30 June 2019.
Payroll tax collections are estimated to be $4.086 billion in 2018-19, representing growth of 5.1% on 2017-18. The 2017-18 estimated actual is 1.8% higher than forecast in the 2017-18 Budget, with key sectors such as construction, manufacturing and mining and associated industries contributing to growth for the first time in two years.
The average annual payroll tax growth is forecast to be 5.6% over the five years to 2021-22, compared to the average of 7.8% over the period from 2001-02 to 2016-17.
58
Budget Strategy and Outlook 2018-19
Duties are levied on a range of financial and property transactions. The major duties include transfer, vehicle registration and insurance duties.
Transfer duty
Transfer duty is charged at various rates on the transfer of real and business property. The Queensland Government offers extensive concessions for the transfer of land where the property is purchased as a home. For example, eligible home buyers pay a 1% concessional rate on dutiable values up to $350,000, rather than the normal schedule of rates between 1.5% and 3.5% for those values. If a first home buyer purchases a property up to $500,000 they will pay no duty, with reduced rates available up to $550,000.
Revenue from transfer duty is expected to be 4.0% higher in 2018-19 than in 2017-18. This follows a fall of 5.7% in 2017-18 that was largely due to a reduction in large non-residential transactions. Growth in 2018-19 is expected to be driven by modest growth in residential and non-residential transactions and the 1 July 2018 rate increase for additional foreign acquirer duty.
Over the five years to 2021-22, transfer duty is estimated to grow by 2.8% on average per annum.
Vehicle registration duty
Vehicle registration duty is charged on the dutiable value of a motor vehicle on the transfer or initial registration, with a general rate of 2% to 4% dependent on the number of cylinders or rotors of the vehicle. From 1 July 2018, an additional $2 per $100 of dutiable value will be applied for vehicles valued above $100,000.
Revenue from vehicle registration is expected to grow by 9.1% in 2018-19 following growth of 5.6% in 2017-18, with the higher growth due to the introduction of the premium motor vehicle duty from 1 July 2018.
| 4.5.4 | Gambling taxes and levies |
A range of gambling activities are subject to State taxes and levies. Total gambling tax and levy collections are estimated to grow by 9.5% in 2018-19, and 5.5% on average over the five years to 2021-22, with these growth rates supported by increased revenue from the new point of consumption tax on betting (betting tax).
Responding to changing consumer behaviour facilitated by increased use of online and interactive technologies, a 15% betting tax will apply from 1 October 2018. The revised date for commencement allows for industry preparation for commencement of the tax, post enactment. Forecasts as at the 2017-18 MYFER were based on the betting tax applying to online wagering only and before allocation of proceeds. Some of these allocations are subject to commercial-in-confidence discussions/negotiation.
59
Budget Strategy and Outlook 2018-19
The betting tax will be implemented in line with other states and territories including South Australia, Victoria, and the Australian Capital Territory. As such, the tax will apply to the net wagering revenue of betting operators licensed in Australia from bets placed by customers in Queensland. This change, and the gross revenue amount excluding allocations of proceeds subject to commercial-in-confidence discussions/negotiation, account for the increased gross revenue from this tax since the 2017-18 MYFER.
Smaller betting operators will not incur a betting tax liability as the rate of 15% applies to taxable wagering revenue exceeding an annual tax-free threshold amount of $300,000. No tax will be paid on a betting operator’s revenue up to and including $300,000 in a financial year. Reconciliation against the threshold in the annual return, and refund provisions for any overpayment, will ensure this. In 2018-19 there will be a proportionate reduction of the tax-free threshold to reflect the 1 October commencement. The new point of consumption betting tax replaces the existing place of supply wagering tax that applied only to the sole retail wagering licensee in Queensland.
Land tax is levied on the taxable value of the landowner’s aggregated holdings of freehold land owned in Queensland as at midnight on 30 June each year. The principal place of residence is deducted from the value.
Resident individuals are generally liable for land tax if the total taxable value of the freehold land owned by that person as at 30 June is equal to or greater than $600,000. Companies, trustees and absentees are liable for land tax if the total taxable value of the freehold land owned as at 30 June is equal to or greater than $350,000.
Land tax is estimated to grow by 11% to $1.313 billion in 2018-19, largely due to the new marginal tax rate on land holdings above $10 million from 1 July 2018, along with growth in land values in recent years.
Tax expenditures are reductions in tax revenue that result from the use of the tax system as a policy tool to deliver Government policy objectives. Tax expenditures are provided through a range of concessions, including tax exemptions, reduced tax rates, tax rebates, tax deductions and provisions which defer payment of a tax liability to a future period. Appendix B provides details of tax expenditure arrangements currently provided by the Queensland Government.
Grants revenue is comprised of Australian Government grants, grants from the community and industry, and other miscellaneous grants. The 2.7% decline in grants revenue in 2018-19 is driven by a decline in GST revenue and payments for specific purposes from the Commonwealth.
60
Budget Strategy and Outlook 2018-19
| | | | | | | | | | | | | | | | | | | | | | | | |
| | | 2016-17
Actual
$ million | | | 2017-18
Est. Act.
$ million | | | 2018-19
Budget
$ million | | | 2019-20
Projection
$ million | | | 2020-21
Projection
$ million | | | 2021-22
Projection
$ million | |
Current grants | | | | | | | | | | | | | | | | | | | | | | | | |
GST revenue | | | 13,939 | | | | 15,210 | | | | 14,794 | | | | 14,598 | | | | 14,946 | | | | 15,699 | |
Other Australian Government grants | | | 10,302 | | | | 11,066 | | | | 10,950 | | | | 11,333 | | | | 11,862 | | | | 12,454 | |
Other grants and contributions | | | 299 | | | | 307 | | | | 257 | | | | 258 | | | | 251 | | | | 249 | |
Total current grants | | | 24,540 | | | | 26,583 | | | | 26,001 | | | | 26,189 | | | | 27,059 | | | | 28,402 | |
Capital grants | | | | | | | | | | | | | | | | | | | | | | | | |
Australian Government grants | | | 2,742 | | | | 1,828 | | | | 1,667 | | | | 1,957 | | | | 1,993 | | | | 1,935 | |
Other grants and contributions | | | 101 | | | | 70 | | | | 33 | | | | 10 | | | | 9 | | | | 50 | |
Total capital grants | | | 2,843 | | | | 1,898 | | | | 1,700 | | | | 1,967 | | | | 2,002 | | | | 1,985 | |
Total Australian Government2 | | | 26,983 | | | | 28,105 | | | | 27,411 | | | | 27,888 | | | | 28,802 | | | | 30,088 | |
Total grants revenue | | | 27,383 | | | | 28,481 | | | | 27,701 | | | | 28,156 | | | | 29,062 | | | | 30,387 | |
Notes:
| 1. | Numbers may not add due to rounding. |
| 2. | Queensland Treasury estimates. Differs from Chapter 7 due to the inclusion of direct Australian Government payments to Queensland agencies for Commonwealth own purpose expenditure. |
| 4.6.1 | Australian Government payments |
Australian Government payments to Queensland in 2018-19 are expected to total $27.411 billion, representing a decrease of $694 million compared to payments in 2017-18. This decrease is made up of a $415 million (2.7%) decrease in GST revenue and a $278 million (2.2%) decrease in total payments for capital and other Australian Government grants.
The decline in GST revenue is due to Queensland receiving a reduced share of the GST pool in 2018-19, based on Commonwealth Grants Commission recommendations. The decrease in payments for specific purposes is mainly due to lower national partnership (NP) payments, particularly the cessation of the National Partnership on Remote Housing.
Chapter 7 provides detailed background on federal-state financial arrangements, including Queensland’s share of GST revenue and other Australian Government payments to Queensland.
| 4.6.2 | Other grants and contributions |
Other grants and contributions are funds received from other state and local government agencies, other bodies and individuals. Contributions exclude Australian Government grants and user charges. The main sources of contributions are those received from private enterprise and community groups to fund research projects and community services and contributed assets and goods and services received for a nominal amount.
61
Budget Strategy and Outlook 2018-19
The State earns royalties from the extraction of coal, base and precious metals, bauxite, petroleum and gas, mineral sands and other minerals. Royalties ensure some of the proceeds of the extraction of non-renewable resources are returned to the community. Land rents are also earned from pastoral holdings, and mining and petroleum leases. Royalties and land rents are detailed in Table 4.5.
| Table 4.5 | Royalties and land rents1 |
| | | | | | | | | | | | | | | | | | | | | | | | |
| | | 2016-17
Actual
$ million | | | 2017-18
Est. Act.
$ million | | | 2018-19
Budget
$ million | | | 2019-20
Projection
$ million | | | 2020-21
Projection
$ million | | | 2021-22
Projection
$ million | |
Coal | | | 3,405 | | | | 3,768 | | | | 3,522 | | | | 3,135 | | | | 2,774 | | | | 2,866 | |
Petroleum2 | | | 98 | | | | 188 | | | | 447 | | | | 446 | | | | 438 | | | | 450 | |
Other royalties3 | | | 376 | | | | 371 | | | | 479 | | | | 506 | | | | 515 | | | | 506 | |
Land rents | | | 122 | | | | 157 | | | | 167 | | | | 172 | | | | 178 | | | | 189 | |
Total | | | 4,000 | | | | 4,484 | | | | 4,615 | | | | 4,260 | | | | 3,904 | | | | 4,011 | |
Notes:
| 1. | Numbers may not add due to rounding. |
| 3. | Includes base and precious metals and other minerals royalties. |
The largest factor affecting upwards revisions to royalties since the 2017-18 Budget is the continued strength in the hard coking coal price, resulting in a significant uplift to price assumptions across 2018-19 and a more gradual return to a medium-term price assumption. While royalty revenue estimates in the 2017-18 MYFER were based on an expectation the hard coking coal price would decline from the end of 2017, prices increased further in the first few months of 2018 before declining on average between March and May 2018. Prices are expected to continue to progressively decline to a medium-term price of $US130/t.
There is a high degree of uncertainty associated with estimates of commodity prices, which can have significant impacts on royalty revenue. Risks to coal export volumes also have the potential to impact royalty estimates, though changes to export volumes may in turn impact prices. Specific risk factors are considered in developing forecasts and include the level of exposure of mining operations to the risk of natural disasters and the timing of scheduled maintenance for the rail network and ports. For 2018, the potential for reduced throughput over the Aurizon Network following the economic regulator’s draft decision on the 2017 Draft Access Undertaking is also a consideration, although any impact is not expected to be significant and coal exports are expected to be higher overall in 2018-19. Appendix C outlines the sensitivity of coal royalty estimates to individual changes in price, volume and exchange rate parameters.
62
Budget Strategy and Outlook 2018-19
At the same time, the contribution of royalties to overall revenue growth and volatility is limited by its quantum. Royalties make up 7.7% of total revenue in 2018-19, compared to 24.5% for state taxes and 25.6% for GST.
Royalty revenue exceeded the previous 2008-09 peak for the first time in 2016-17, and increased by a further 11.6% in 2017-18 as coal prices remained strong and petroleum (including LNG) royalties increased.
While royalties are expected to grow modestly in 2018-19, a gradual decline of 3.1% is expected per year on average over the four years to 2021-22. While the coal price is expected to decline 9.9% per year on average as it returns to medium-term levels, total royalties are expected to be supported by growth in other factors, such as coal volumes and stronger petroleum revenue from increased Brent oil prices.
Assumptions underlying the royalty estimates, and the sensitivity of royalty estimates to changes in the assumptions are contained in Appendix C.
Chart 4.5 shows coking coal price forecasts compared to the 2017-18 Budget and average quarterly price from the latest Consensus Economics forecasts. Consensus Economics is a monthly survey of more than 40 energy and metals analysts outlining their price forecasts for a range of commodities. The Australian Government’s 2018-19 Budget assumed that the coking coal spot price would fall over the June and September quarters of 2018 to reach US$120 per tonne by the December 2018 quarter.
Revisions since the 2017-18 Budget are in line with Consensus Economics forecasts in the next few years, with a degree of conservatism in the medium-term.
63
Budget Strategy and Outlook 2018-19
| Chart 4.5 | Coking coal price forecasts by iteration1 |
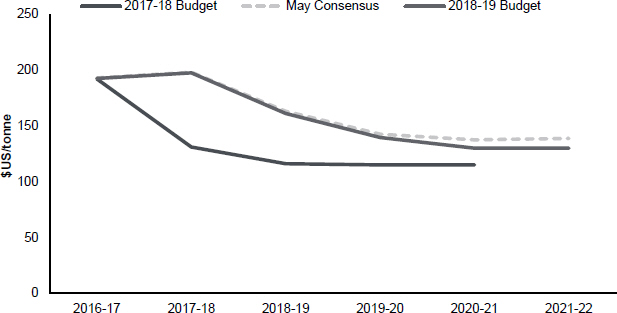
Sources: Queensland State Budget 2017-18 and 2018-19 and Consensus Economics Energy and Metals May 2018.
Hard coking coal prices increased sharply in the second half of 2016, driven by factors such as a program of rationalisation for China’s coal production, as well as logistical bottlenecks and seaborne supply constraints. Across 2017, coal prices remained above the historical average shown in Chart 4.6 but displayed moderate volatility, declining rapidly in the early months of 2017 but increasing again following Severe Tropical Cyclone Debbie. While strengthening global economic conditions are supporting a continued strength in coal prices during 2018, royalty forecasts incorporate a gradual decline in coal prices to $US130/t by 2020-21.
On a year average basis, the premium hard coking coal price is estimated to increase 2.6% in 2017-18 to $US198 per tonne, and is expected to decline 18.5% to $US161 per tonne in 2018-19.
64
Budget Strategy and Outlook 2018-19
| Chart 4.6 | Coking coal price |
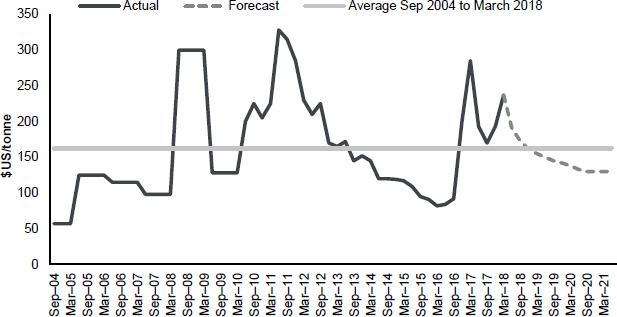
Source: Consensus Economics and Queensland Treasury.
Oil prices factor strongly into royalty forecasts, with most of the LNG produced in Queensland sold under long-term contracts linked to oil prices. Since the 2017-18 Budget, estimates of Brent oil prices have been revised up by 28.8% to $US73 per barrel on average in 2018-19. Prices are expected to moderate from current levels as the impact of temporary factors affecting supply is reduced, leading to smaller royalty increases in 2019-20 and 2020-21. Oil prices are expected to remain steady from 2019-20, consistent with expectations for production and consumption remaining at similar levels. Forecasts of the Brent oil price are detailed in Appendix C and are similar to Consensus Economics forecasts. Forecasts of LNG volumes are similar to the 2017-18 Budget.
Significant growth in LNG exports over the last few years is supporting growth in petroleum royalty forecasts. Efforts to support LNG industry growth in Queensland also has broader benefits including job creation, and in turn supports increased revenue collection by the Australian Government.
Petroleum royalties have been revised up by $253 million in 2018-19 since the 2017-18 Budget, mainly resulting from increased Brent oil prices. The value of coal seam gas, which is largely based on export LNG prices less allowable deductions, has meant that increased oil prices have had a proportionally larger impact on petroleum royalties.
65
Budget Strategy and Outlook 2018-19
Other royalties include revenue from metals mined in Queensland such as copper, lead and zinc and other minerals including bauxite. Revenue from other royalties is expected to grow 29.0% in 2018-19, supported by a stronger outlook for base and precious metals prices. This follows small declines of 1.4% in 2016-17 and 1.2% in 2017-18.
Revenue from land rents derived from mining and petroleum leases and pastoral holdings are expected to grow 6.1% in 2018-19.
| 4.8 | Sales of goods and services |
Sales of goods and services revenue comprises cost recoveries from providing goods or services. Table 4.6 provides a breakdown of the category.
The Government provides concessions in the form of discounts, rebates and subsidies to improve access to and the affordability of a range of services for individuals or families, based on eligibility criteria relating to factors such as age, income and special needs or disadvantage. Appendix A provides details of the concession arrangements provided by the Queensland Government.
| Table 4.6 | Sales of goods and services1 |
| | | | | | | | | | | | | | | | | | | | | | | | |
| | | 2016-17
Actual
$ million | | | 2017-18
Est. Act.
$ million | | | 2018-19
Budget
$ million | | | 2019-20
Projection
$ million | | | 2020-21
Projection
$ million | | | 2021-22
Projection
$ million | |
Fee for service activities | | | 2,370 | | | | 2,377 | | | | 2,135 | | | | 2,221 | | | | 2,199 | | | | 2,202 | |
Public Transport: South East Queensland | | | 356 | | | | 338 | | | | 344 | | | | 353 | | | | 362 | | | | 363 | |
Rent revenue | | | 533 | | | | 577 | | | | 597 | | | | 628 | | | | 661 | | | | 830 | |
Sale of land inventory | | | 65 | | | | 52 | | | | 59 | | | | 66 | | | | 97 | | | | 98 | |
Hospital fees | | | 794 | | | | 859 | | | | 879 | | | | 892 | | | | 907 | | | | 919 | |
Transport and traffic fees | | | 398 | | | | 426 | | | | 448 | | | | 467 | | | | 485 | | | | 504 | |
Other sales of goods and services | | | 1,127 | | | | 1,233 | | | | 1,269 | | | | 1,320 | | | | 1,363 | | | | 1,390 | |
Total | | | 5,642 | | | | 5,861 | | | | 5,731 | | | | 5,947 | | | | 6,074 | | | | 6,306 | |
Note:
| 1. | Numbers may not add due to rounding. |
66
Budget Strategy and Outlook 2018-19
| 4.8.1 | Fee for service activities |
Major items of fee for service activities across the General Government Sector include:
| • | | recoverable works carried out by the Department of Transport and Main Roads and the commercialised arm of the department |
| • | | fees charged by Technical and Further Education (TAFE) colleges |
| • | | fees charged by CITEC to commercial clients for information brokerage services. |
| 4.8.2 | Other sales of goods and services |
As shown in Table 4.6, there are a variety of other types of sales of goods and services. These include revenue from public transport ticketing arrangements, rent or lease of government property, hospital fees, transport and traffic fees, title registration fees and other licences and permits.
Interest income primarily comprises interest earned on investments, including those held for superannuation and insurance purposes.
Interest income is estimated to account for 3.8% of total General Government Sector revenue in 2018-19. Consistent with the 2017-18 Budget, interest income is expected to decline between 2017-18 and 2021-22 due to a reduction in the portfolio of financial assets held for defined benefit superannuation and in the Queensland Government Insurance Fund.
| 4.10 | Dividend and income tax equivalent income |
Dividend and income tax equivalent income accounts for 3.8% of total General Government Sector revenue in 2018-19.
Estimated revenue from dividend and income tax equivalent income in 2017-18 has been revised upwards by $629 million since the 2017-18 Budget, supported by increased earnings from electricity generation and network businesses. In 2018-19, dividend and income tax equivalent income is expected to decline $469 million mainly from the electricity generation and electricity network sectors. Dividend and income tax equivalent income is expected to decline over the four years to 2021-22, driven by reductions in dividend returns from the electricity network, electricity generation and water sectors. Trends in dividends and income tax equivalent income are discussed in more detail in Chapter 8.
67
Budget Strategy and Outlook 2018-19
Other revenue, including royalty revenue, accounts for 9.9% of total General Government Sector revenue in 2018-19. Royalties themselves account for 7.7% of revenue in 2018-19, and are discussed in section 4.7.
The major fines and infringements included in this category are issued by the Department of Transport and Main Roads (DTMR) and Queensland Police Service (QPS), incorporating fixed and mobile camera offences, speeding and tolling offences. Revenue from fines and forfeitures are expected to grow by 11.5% in 2018-19.
| | | | | | | | | | | | | | | | | | | | | | | | |
| | | 2016-17
Actual
$ million | | | 2017-18
Est. Act.
$ million | | | 2018-19
Budget
$ million | | | 2019-20
Projection
$ million | | | 2020-21
Projection
$ million | | | 2021-22
Projection
$ million | |
Royalties and land rents | | | 4,000 | | | | 4,484 | | | | 4,615 | | | | 4,260 | | | | 3,904 | | | | 4,011 | |
Fines and forfeitures | | | 375 | | | | 400 | | | | 446 | | | | 471 | | | | 507 | | | | 520 | |
Revenue not elsewhere classified | | | 847 | | | | 739 | | | | 672 | | | | 664 | | | | 672 | | | | 682 | |
Total | | | 5,222 | | | | 5,623 | | | | 5,733 | | | | 5,395 | | | | 5,083 | | | | 5,212 | |
Note:
| 1. | Numbers may not add due to rounding. |
68
Budget Strategy and Outlook 2018-19
Features
| • | | The 2018-19 Budget continues to target initiatives that drive more inclusive economic growth and job creation, reduce the cost of living pressures and enhance the safety, security and liveability of Queensland communities. |
| • | | Expenses for 2017-18 are estimated to be $56.747 billion, an increase of $3.374 billion (or 6.3%) from 2016-17. The increase is due to growth funding to support ongoing demand for health services and student enrolments, expenditure in relation to the final preparation and delivery of the Gold Coast 2018 Commonwealth Games and establishment of a provision for the anticipated costs of Queensland participating in the National Redress Scheme for Survivors of Institutional Child Sexual Abuse (National Redress Scheme). |
| • | | Total expenses are projected to grow at an average annual rate of 2.9% over the five years to 2021-22. This is a reduction from last year’s budget projected rate of 3.2% over the five years to 2020-21. |
| • | | In 2018-19, General Government Sector expenses are estimated to be $57.590 billion, an expected increase of $843 million (or 1.5%) over the estimated actual for 2017-18. The increase is a result of continued demand growth in education, health and community services. |
| • | | The average growth in employee expenses over the five years to 2021-22 is 4.5% per annum, reflecting growth in full time equivalents (FTEs) and the Government’s wages policy. |
| • | | In 2018-19, the major areas of expenditure are health and education, which together constitute approximately 54.4% of General Government Sector expenses, the highest ever proportional spend on these services. |
This chapter provides an overview of General Government Sector expenses for the estimated actual for 2017-18, forecasts for the 2018-19 Budget year and projections for 2019-20 to 2021-22. The forward estimates are based on the economic projections outlined in Chapter 2.
| 5.1 | 2017-18 estimated actual |
General Government Sector expenses in 2017-18 are estimated to be $56.747 billion, $767 million higher than the 2017-18 Mid Year Fiscal and Economic Review (MYFER) estimate. The increase since MYFER is largely driven by provisioning for the anticipated costs of Queensland participating in the National Redress Scheme for Survivors of Institutional Child Sexual Abuse, and the Australian Government’s advance payment of financial assistance grants to local governments in 2017-18 for the 2018-19 financial year.
69
Budget Strategy and Outlook 2018-19
| 5.2 | 2018-19 Budget and out-years |
| Table 5.1 | General Government Sector expenses1 |
| | | | | | | | | | | | | | | | | | | | | | | | |
| | | 2016-17
Actual
$ million | | | 2017-18
Est. Act.
$ million | | | 2018-19
Budget
$ million | | | 2019-20
Projection
$ million | | | 2020-21
Projection
$ million | | | 2021-22
Projection
$ million | |
Employee expenses | | | 21,258 | | | | 22,838 | | | | 23,807 | | | | 24,645 | | | | 25,541 | | | | 26,466 | |
Superannuation interest costs | | | 514 | | | | 665 | | | | 667 | | | | 717 | | | | 774 | | | | 778 | |
Other superannuation expenses | | | 2,661 | | | | 2,819 | | | | 2,887 | | | | 2,933 | | | | 2,957 | | | | 3,001 | |
Other operating expenses | | | 15,582 | | | | 17,382 | | | | 15,774 | | | | 15,119 | | | | 15,291 | | | | 15,745 | |
Depreciation and amortisation | | | 3,068 | | | | 3,330 | | | | 3,429 | | | | 3,543 | | | | 3,650 | | | | 3,776 | |
Other interest expenses | | | 1,722 | | | | 1,616 | | | | 1,474 | | | | 1,643 | | | | 1,691 | | | | 1,794 | |
Grants expenses | | | 8,568 | | | | 8,096 | | | | 9,552 | | | | 10,075 | | | | 9,926 | | | | 10,019 | |
Total Expenses | | | 53,373 | | | | 56,747 | | | | 57,590 | | | | 58,675 | | | | 59,829 | | | | 61,579 | |
Note:
| 1. | Numbers may not add due to rounding. |
General Government Sector expenses of $57.590 billion in 2018-19 represent an increase of $843 million (or 1.5%) over the 2017-18 estimated actual. Factors influencing the higher expenditure in 2018-19 include:
| • | | delivery of the Government’s election commitments including additional frontline nurses, police and firefighters |
| • | | growth in demand for health services |
| • | | growth in education expenditure reflecting student enrolment growth in Queensland schools, enterprise bargaining outcomes, maintaining secondary curriculum offerings for the half year cohort of students going into senior secondary and review of salary classification of school administration and support staff |
| • | | job creation initiatives including Works for Queensland, Back to Work Packages, Skilling Queenslanders for Work and Jobs and Regional Growth package |
| • | | community services initiatives continuing to improve the child protection system and support of the transition of disability services to the National Disability Insurance Scheme (NDIS) |
| • | | costs associated with the introduction of the new Waste Disposal Levy including implementation costs, advance payments to local councils and industry support funding. |
70
Budget Strategy and Outlook 2018-19
Expenditure largely isolated to 2017-18 for the delivery of Gold Coast 2018 Commonwealth Games and the provision for the anticipated cost of Queensland’s participation in the National Redress Scheme contribute to the observed reduced growth in 2018-19 expenses. Growth in 2018-19 is also impacted by the Australian Government’s advance payment of financial assistance grants in 2017-18 for 2018-19 and the 2018-19 whole-of-Government reprioritisation measures (refer to Budget Paper 4 Budget Measures).
| 5.3 | Expenses by operating statement category |
As outlined in Chart 5.1, the largest expense categories in the General Government Sector in 2018-19 are employee and superannuation expenses (47.4%), followed by other operating expenses (27.4%) that reflect non-labour costs of providing goods and services to government and non-government recipients including consultancies and contractors, transport service contract payments and repairs and maintenance.
| Chart 5.1 | Expenses by operating statement category, 2018-19 |
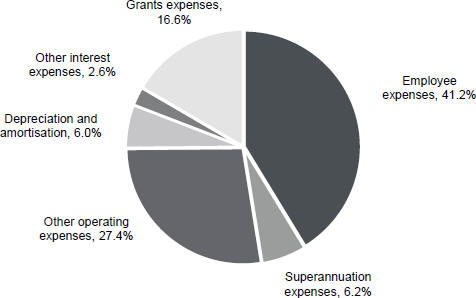
Chart 5.2 identifies the growth in expenses for each operating statement category between the 2017-18 estimated actual and the 2018-19 Budget. The fastest growth is in grant expenses, which primarily reflects the change in service delivery model of disability services with the State progressively transitioning to the National Disability Insurance Scheme (NDIS).
71
Budget Strategy and Outlook 2018-19
| Chart 5.2 | Growth in expenses by operating statement category - 2017-18 estimated actual to 2018-19 Budget |
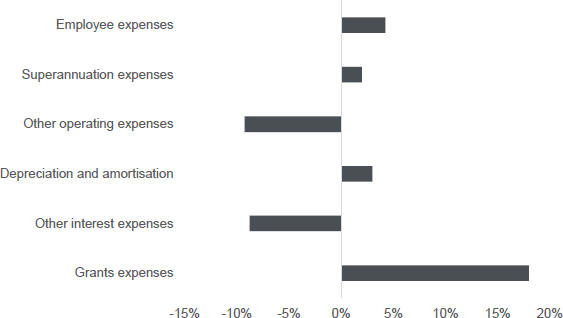
Employee expenses include salaries and wages, annual leave and long service leave.
In 2018-19, employee expenses are expected to be $23.807 billion, $969 million or 4.2% higher than the 2017-18 estimated actual. This reflects both growth in full-time equivalents (FTEs) and the Government’s 2.5% wages policy. Much of the increase in employee expenses in 2018-19 is the key frontline service areas of health and education reflecting increasing demand for health services and student population growth.
Full-time equivalents
During the 2015 election, the Government made commitments to revitalise frontline service delivery. This resulted in FTEs increasing 14,269 (or 7.1%) in 2015-16 and 2016-17, and an estimated further 8,380 (or 3.88%) in 2017-18. Between March 2015 and March 2018:
| • | | teachers increased by 3,634 (or 8.6%) |
| • | | teacher aides increased by 1,135 (or 12.2%) |
| • | | nurses increased by 4,828 (or 17.3%) |
| • | | health practitioners increased by 1,488 (or 15.2%) |
| • | | doctors increased by 1,605 (or 20.3%) |
| • | | ambulance officers increased by 376 (or 10.2%) |
| • | | police officers increased by 302 (or 2.7%). |
72
Budget Strategy and Outlook 2018-19
As at March 2018, 90.5% of public servants were engaged in frontline and frontline support roles. Chart 5.3 shows actual FTEs from 2005-06 to 2016-17 and estimated FTEs from 2017-18 to 2021-22.
| Chart 5.3 | Departmental FTEs |
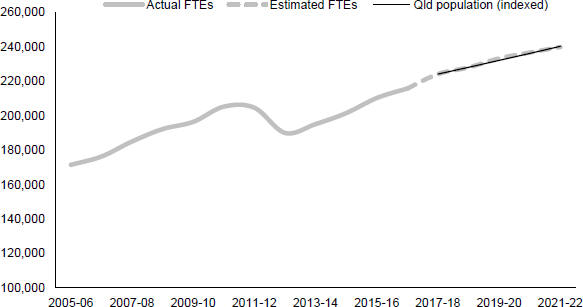
FTE growth is moderating. FTEs are estimated to increase by around 3,833 (or 1.71%) in 2018-19, with the majority of the increase being attributable to growth in health and education. These additional FTEs will continue to reduce the number of patients waiting longer than the recommended time, relieve pressure on class sizes and continue to improve student outcomes.
Given the tight fiscal environment and the fact that employee expenses represent the State’s largest expense category, the Government introduced a new fiscal principle in the 2016-17 Budget to maintain a sustainable public service where overall growth in FTEs, on average over the forward estimates, does not exceed population growth.
The overall average annual growth rate over 2017-18 to 2021-22, based on current estimates, is 1.71%. This compares to an estimated Queensland population growth of 13⁄4% annually. To enable ongoing monitoring, the Queensland Public Service Commission (PSC) will continue to collect agency workforce data on a quarterly basis for analysis and reporting purposes.
73
Budget Strategy and Outlook 2018-19
| Box 5.1 | Better data to drive decision making |
As noted in previous years’ Budget Paper 2 Budget Strategy and Outlook, issues have existed for many years with collecting and reporting information about FTEs in the Queensland public service.
These issues have arisen primarily due to the existence of two methodologies to calculate the number of FTEs, and scope of agencies included within the reported numbers. The Minimum Obligatory Human Resource Information (MOHRI) data is published in quarterly Workforce Profile reports and used primarily for broader human resources planning purposes. The Budget FTE number is used to monitor the actual number of FTEs being paid by an agency.
The PSC, with support from Queensland Treasury, has been working on strategies to reduce inconsistencies and improve the quality of data being reported. This has included restructuring parts of the quarterly Workforce Profile reports so that the data for agencies that are included in Budget Paper 2, Table 5.2 is shown separately from those that are not.
The Government acknowledges that there are still limitations surrounding the use of the MOHRI data. The key limitation of the MOHRI methodology is the inconsistency with how employee expenses are accounted for and monitored in agencies. Further, the complexity of the MOHRI methodology means that data on FTEs is not readily available in a timely fashion.
The Government will improve the quality of information by:
| • | | enhancing data collection, reporting and monitoring of indirect employment, such as the use of labour hire, contractors and consultants |
| • | | working with agencies to improve geographical reporting, including by postcode |
| • | | reviewing the contents of the Workforce Profile reports to assess whether they are meeting the needs of users or whether further opportunities exist to provide tailored reporting, to be reported on by the 2018-19 MYFER |
| • | | reviewing occupational codes to identify whether any additional key occupational groups exist which should be reported upon. |
The Government is also committed to ensuring that public service staff are located where they are needed in the community. Around 32% of FTEs are located outside South East Queensland, consistent with population share. Regional Action Plans show increases in key service delivery occupations across the regions.
The devolved frontline service delivery models used in some agencies continue to present challenges for FTE estimation and monitoring, in particular when funding is provided in such a way that agencies determine how to most efficiently deliver services. Consistent with last year, the 2018-19 Budget FTE estimates build in an allowance for this.
Table 5.2 shows the funded FTE positions by department and is consistent with agency Service Delivery Statements.
74
Budget Strategy and Outlook 2018-19
| Table 5.2 | Funded controlled FTE positions by Department1,2 |
| | | | | | | | | | | | |
| | | 2017-18
Adj. Budget3 | | | 2017-18
Est. Act | | | 2018-19
Budget | |
Aboriginal and Torres Strait Islander Partnerships | | | 315 | | | | 327 | | | | 324 | |
Agriculture and Fisheries | | | 2,089 | | | | 2,131 | | | | 2,128 | |
Child Safety, Youth and Women4 | | | 4,631 | | | | 4,638 | | | | 4,834 | |
Communities, Disability Services and Seniors4,5 | | | 2,675 | | | | 2,676 | | | | 2,241 | |
Education | | | 70,340 | | | | 71,296 | | | | 72,784 | |
Electoral Commission of Queensland | | | 56 | | | | 56 | | | | 60 | |
Employment, Small Business and Training4 | | | 4,538 | | | | 4,517 | | | | 4,432 | |
Environment and Science | | | 3,074 | | | | 3,083 | | | | 3,093 | |
Housing and Public Works | | | 5,510 | | | | 5,512 | | | | 5,541 | |
Innovation, Tourism Industry Development and the Commonwealth Games | | | 193 | | | | 194 | | | | 173 | |
Justice and Attorney-General | | | 3,362 | | | | 3,369 | | | | 3,449 | |
Local Government, Racing and Multicultural Affairs | | | 178 | | | | 181 | | | | 188 | |
Natural Resources, Mines and Energy | | | 2,669 | | | | 2,676 | | | | 2,665 | |
Office of the Inspector-General Emergency Management | | | 22 | | | | 22 | | | | 22 | |
Premier and Cabinet | | | 480 | | | | 478 | | | | 467 | |
Public Safety Business Agency | | | 1,144 | | | | 1,129 | | | | 1,117 | |
Public Service Commission | | | 73 | | | | 73 | | | | 70 | |
Queensland Audit Office | | | 197 | | | | 182 | | | | 182 | |
Queensland Corrective Services4 | | | 4,868 | | | | 5,005 | | | | 5,039 | |
Queensland Fire and Emergency Services | | | 3,280 | | | | 3,280 | | | | 3,321 | |
Queensland Health (total-disaggregation below) | | | 87,396 | | | | 87,610 | | | | 90,095 | |
Queensland Police Service | | | 15,463 | | | | 15,566 | | | | 15,696 | |
Queensland Treasury | | | 975 | | | | 994 | | | | 994 | |
State Development, Manufacturing, Infrastructure and Planning | | | 1,013 | | | | 1,058 | | | | 1,045 | |
The Public Trustee of Queensland | | | 609 | | | | 611 | | | | 615 | |
Transport and Main Roads | | | 7,490 | | | | 7,505 | | | | 7,427 | |
Total | | | 222,639 | | | | 224,169 | | | | 228,002 | |
75
Budget Strategy and Outlook 2018-19
| | | | | | | | | | | | |
| | | 2017-18
Adj. Budget3 | | | 2017-18
Est. Act | | | 2018-19
Budget | |
Queensland Health Disaggregation | | | | | | | | | | | | |
Health | | | 7,415 | | | | 7,497 | | | | 7,645 | |
Queensland Ambulance Service | | | 4,346 | | | | 4,402 | | | | 4,507 | |
Cairns and Hinterland Hospital and Health Service | | | 4,923 | | | | 4,937 | | | | 4,971 | |
Central Queensland Hospital and Health Service | | | 2,890 | | | | 2,980 | | | | 3,052 | |
Central West Hospital and Health Service | | | 373 | | | | 380 | | | | 373 | |
Children’s Health Queensland Hospital and Health Service | | | 3,608 | | | | 3,792 | | | | 3,700 | |
Darling Downs Hospital and Health Service | | | 4,315 | | | | 4,396 | | | | 4,549 | |
Gold Coast Hospital and Health Service | | | 7,482 | | | | 7,635 | | | | 8,063 | |
Mackay Hospital and Health Service | | | 2,160 | | | | 2,286 | | | | 2,312 | |
Metro North Hospital and Health Service | | | 15,750 | | | | 15,832 | | | | 16,165 | |
Metro South Hospital and Health Service | | | 12,604 | | | | 13,275 | | | | 12,882 | |
North West Hospital and Health Service | | | 702 | | | | 716 | | | | 782 | |
South West Hospital and Health Service | | | 777 | | | | 806 | | | | 819 | |
Sunshine Coast Hospital and Health Service | | | 6,540 | | | | 5,970 | | | | 6,400 | |
Torres and Cape Hospital and Health Service | | | 926 | | | | 961 | | | | 943 | |
Townsville Hospital and Health Service | | | 5,180 | | | | 5,381 | | | | 5,401 | |
West Moreton Hospital and Health Service | | | 3,243 | | | | 3,284 | | | | 3,572 | |
Wide Bay Hospital and Health Service | | | 3,049 | | | | 3,080 | | | | 3,132 | |
Funded unallocated FTEs6 | | | 1,113 | | | | — | | | | 827 | |
Total Queensland Health | | | 87,396 | | | | 87,610 | | | | 90,095 | |
Notes:
| 1. | Numbers may not add due to rounding. |
| 2. | Explanation of variations in departmental FTEs can be found in the Service Delivery Statements (SDSs). Departmental totals may include multiple tables from Service Delivery Statements, due to separate FTE tables being provided for Commercialised Business Units. |
| 3. | Adjusted Budget reflects movements of FTEs following Machinery of Government changes only. |
| 4. | Differs from SDSs due to departmental transfers which were not classified as Machinery of Government changes in the SDS. |
| 5. | Decline in FTEs in 2018-19 reflects the transfer of clients with disability to the National Disability Insurance Scheme (NDIS). |
| 6. | Funded unallocated FTEs represents estimates of additional FTEs which have not yet been allocated to particular Hospital and Health Services. |
76
Budget Strategy and Outlook 2018-19
| 5.3.2 | Superannuation expenses |
The superannuation interest cost represents the imputed interest on the Government’s accruing defined benefit superannuation liabilities.
In determining the State’s defined benefit superannuation liabilities, AASB 119 Employee Benefits requires the discounting of future benefit obligations using yield rates on Government bonds net of investment tax. Interest costs are calculated on a net liability approach by applying the discount rate to both the gross liability and superannuation plan assets.
Superannuation interest costs are dependent on the applicable discount rates and increase marginally over the forward estimates as these rates increase. The defined benefit scheme, which is closed to new members and subject to interest rate fluctuations, will decline over time as members leave.
Other superannuation expenses represent employer superannuation contributions to accumulation superannuation and the current service cost of the State’s defined benefit obligation (or the increase in the present value of the defined benefit obligation resulting from employee service in the current period).
| 5.3.3 | Other operating expenses |
Other operating expenses comprise the non-labour costs of providing goods and services, including services to government and non-government organisations, repairs and maintenance, consultancies, contractors, electricity, communications and marketing.
In 2018-19, other operating expenses are expected to be $15.774 billion, a decrease of $1.609 billion or 9.3% lower compared to the 2017-18 estimated actual.
Other operating expenses decline significantly in 2018-19 due to:
| • | | delivery of the Gold Coast 2018 Commonwealth Games in 2017-18 |
| • | | the Government provisioning in 2017-18 for Queensland’s participation in the National Redress Scheme |
| • | | continuing transition of specialist disability services to the NDIS. Queensland’s contributions to the NDIS are reflected as grants expenses. |
Other operating expenses continue to decline in 2019-20 following the final year of transition to the NDIS in 2018-19.
77
Budget Strategy and Outlook 2018-19
| 5.3.4 | Depreciation and amortisation |
Depreciation and amortisation expense is an estimate of the progressive consumption of the State’s assets through normal usage, wear and tear and obsolescence. Growth in this expense category primarily reflects asset revaluations and the increasing investment in State infrastructure.
Depreciation expenses have increased since the 2017-18 MYFER in all years of the forward estimates following revisions for transport and health infrastructure.
| 5.3.5 | Other interest expenses |
Other interest expenses include interest paid on borrowings to acquire capital assets and infrastructure such as roads and government buildings.
Other interest expenses are estimated to decline $142 million in 2018-19 to $1.474 billion compared to $1.616 billion in 2017-18.
Interest costs have fallen significantly since the recent peak of $2.328 billion in 2014-15. The decline in General Government Sector debt servicing costs is due in part to the repatriation of surplus defined benefit superannuation assets and other balance sheet measures.
Current grants include grants and subsidies to the community (such as non-state schools, hospitals, benevolent institutions and local governments) and personal benefit payments. Community Service Obligations (CSOs) are provided where Public Non-financial Corporations (PNFCs) are required to provide non-commercial services or services at non-commercial prices for the benefit of the community (for further details refer to Chapter 8).
Capital grants represent transfers to the PNFC Sector, local governments, not-for-profit institutions and other non-government entities, such as business and households (including the Queensland First Home Owners’ Grant and non-state schools) for capital purposes.
Table 5.3 provides a breakdown of grants by category and recipient type.
78
Budget Strategy and Outlook 2018-19
| Table 5.3 | Grants expenses1 |
| | | | | | | | | | | | |
| | | 2016-17
Actual
$ million | | | 2017-18
Est. Act.
$ million | | | 2018-19
Budget
$ million | |
Current | | | | | | | | | | | | |
Grants to local government | | | 905 | | | | 744 | | | | 603 | |
Grants to private and not-for-profit organisations | | | | | | | | | | | | |
State funding for non-state schools | | | 664 | | | | 688 | | | | 683 | |
Australian Government funding for non-state schools | | | 2,393 | | | | 2,537 | | | | 2,670 | |
Other | | | 1,220 | | | | 1,434 | | | | 1,514 | |
Grants to other sectors of government | | | | | | | | | | | | |
Community service obligations to PNFCs | | | 615 | | | | 499 | | | | 472 | |
Other payments to PNFCs | | | 797 | | | | 37 | | | | 44 | |
Other (includes payments to NDIA) | | | 157 | | | | 411 | | | | 1,653 | |
Other | | | 437 | | | | 305 | | | | 238 | |
Total current grants | | | 7,189 | | | | 6,656 | | | | 7,878 | |
Capital | | | | | | | | | | | | |
Grants to local government | | | 732 | | | | 976 | | | | 1,064 | |
State funding for non-state schools | | | 93 | | | | 93 | | | | 98 | |
Grants to private and not-for-profit organisations | | | 361 | | | | 144 | | | | 359 | |
Payments to PNFCs | | | 29 | | | | 16 | | | | 13 | |
Queensland First Home Owners’ Grants | | | 158 | | | | 201 | | | | 140 | |
Other | | | 6 | | | | 10 | | | | — | |
Total capital grants | | | 1,379 | | | | 1,440 | | | | 1,674 | |
Total current and capital grants | | | 8,568 | | | | 8,096 | | | | 9,552 | |
Note:
| 1. | Numbers may not add due to rounding. |
In 2017-18, total grant expenses are estimated to be $8.096 billion; $472 million lower than 2016-17. This decrease is mainly due to:
| • | | the payment in 2016-17 of the $771 million Electricity Affordability grant to Energy Queensland to remove the costs of the Solar Bonus Scheme from retail electricity prices from 2017-18 to 2019-20 |
| • | | the Australian Government’s payment in 2016-17 of the financial assistance grants to local governments for both 2016-17 and 2017-18. The 2018-19 grant will be paid in 2017-18. |
The effect of these grant payments in 2016-17 were partially offset in 2017-18 by increased funding to non-state schools, grants under the Government’s job creation programs, First Home Owners’ Grants and payments by the State to the National Disability Insurance Agency (NDIA) on the progressive transition to the NDIS.
79
Budget Strategy and Outlook 2018-19
In 2018-19, total grant expenses are estimated to be $9.552 billion, an increase of $1.456 billion from 2017-18. The increase in grants expenses is mainly due to grants to other sectors of government, reflecting the change in service delivery model of disability services with the State progressively transitioning to the NDIS, higher capital grants to local councils under Natural Disaster Relief and Recovery Arrangements, waste strategy measures supported by the waste disposal levy and various election commitment expense measures. The increase in grants expenses in 2018-19 is partly offset by the Australian Government again making advance payment of the 2018-19 financial assistance grants to local councils in 2017-18.
| 5.4 | Operating expenses by purpose |
Chart 5.4 indicates the proportion of expenditure by major purpose classification for the 2018-19 Budget. Health accounts for the largest share of expenses (30.1%) followed by Education (24.3%).
The Australian Bureau of Statistics introduced a revised Classification of the Functions of Government Australia Framework, effective 1 July 2017, which has resulted in some reclassification of expenditure between purposes.
| Chart 5.4 | General Government Sector expenses by purpose, 2018-19 |
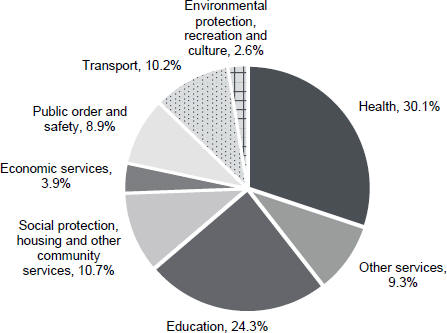
80
Budget Strategy and Outlook 2018-19
Data presented in Tables 5.4 and 5.5 provide a summary drawn from financial statements contained in the Service Delivery Statements (SDS). Further information on the composition of expenses, outputs delivered and factors influencing the movement in expenses can also be obtained from a department’s SDS.
| Table 5.4 | Departmental controlled expense1,2 |
| | | | | | | | |
| | | 2017-18
Est. Act.
$ 000 | | | 2018-19
Budget
$ 000 | |
Aboriginal and Torres Strait Islander Partnerships | | | 90,905 | | | | 86,868 | |
Agriculture and Fisheries | | | 470,493 | | | | 481,707 | |
Child Safety, Youth and Women | | | 801,680 | | | | 1,625,340 | |
Communities, Disability Services and Seniors | | | 2,130,417 | | | | 868,802 | |
Education | | | 9,371,431 | | | | 9,421,193 | |
Electoral Commission of Queensland | | | 58,286 | | | | 48,033 | |
Employment, Small Business and Training | | | 569,445 | | | | 1,074,848 | |
Energy and Water Supply3 | | | 43,796 | | | | — | |
Environment and Science | | | 548,345 | | | | 813,880 | |
Health Consolidated4 | | | 16,865,940 | | | | 17,317,943 | |
Housing and Public Works | | | 2,193,512 | | | | 2,469,903 | |
Innovation, Tourism Industry Development and the Commonwealth Games | | | 372,003 | | | | 222,834 | |
Inspector General Emergency Management | | | 4,876 | | | | 4,887 | |
Justice and Attorney-General | | | 1,081,575 | | | | 602,728 | |
Legislative Assembly | | | 97,415 | | | | 98,193 | |
Local Government, Racing and Multicultural Affairs | | | 484,553 | | | | 436,063 | |
National Parks, Sport and Racing3 | | | 152,700 | | | | — | |
Natural Resources, Mines and Energy | | | 530,990 | | | | 663,388 | |
Office of the Governor | | | 7,126 | | | | 7,174 | |
Office of the Ombudsman | | | 8,677 | | | | 9,205 | |
Premier and Cabinet5 | | | 205,286 | | | | 116,370 | |
Public Safety Business Agency | | | 437,286 | | | | 422,577 | |
Public Service Commission | | | 15,969 | | | | 14,598 | |
Queensland Audit Office | | | 42,667 | | | | 43,821 | |
Queensland Corrective Services | | | 469,406 | | | | 951,883 | |
Queensland Fire and Emergency Services | | | 678,022 | | | | 702,492 | |
Queensland Police Service | | | 2,320,969 | | | | 2,325,591 | |
Queensland Treasury | | | 321,494 | | | | 256,965 | |
Science, Information Technology and Innovation3 | | | 176,127 | | | | — | |
State Development, Manufacturing, Infrastructure and Planning | | | 401,707 | | | | 595,992 | |
The Public Trustee of Queensland | | | 88,154 | | | | 95,362 | |
Transport and Main Roads | | | 5,728,206 | | | | 5,885,706 | |
Total expenses | | | 46,769,458 | | | | 47,664,346 | |
81
Budget Strategy and Outlook 2018-19
Notes:
| 1. | Total expenses by department do not equate to total General Government expenses in Uniform Presentation Framework (UPF) terms reported elsewhere in the Budget Papers as General Government expenses include a wider range of entities including State Government statutory authorities. In addition, transactions eliminated between entities within the General Government Sector are excluded in the preparation of whole-of-Government UPF financial statements. |
| 2. | Explanation of variations in departmental controlled expenses can be found in the Service Delivery Statements. |
| 3. | Ceased 12 December 2017. |
| 4. | This represents Health Consolidated in the Service Delivery Statement, which consolidates Queensland Health controlled, the Hospital and Health Services, and Queensland Ambulance Service. |
| 5. | Excludes Corporate Administration Agency. |
82
Budget Strategy and Outlook 2018-19
| Table 5.5 | Departmental administered expense1, 2 |
| | | | | | | | |
| | | 2017-18
Est. Act.
$ 000 | | | 2018-19
Budget
$ 000 | |
Aboriginal and Torres Strait Islander Partnerships | | | 14,261 | | | | 12,518 | |
Agriculture and Fisheries | | | 27,717 | | | | 40,370 | |
Child Safety, Youth and Women | | | 494,601 | | | | 5,868 | |
Communities, Disability Services and Seniors | | | 811,834 | | | | 1,929,471 | |
Education | | | 3,413,315 | | | | 3,550,845 | |
Energy and Water Supply3 | | | 233,064 | | | | — | |
Environment and Science | | | 71,194 | | | | 139,452 | |
Health | | | 73,784 | | | | 18,748 | |
Housing and Public Works | | | 23,892 | | | | 52,079 | |
Innovation, Tourism Industry Development and the Commonwealth Games | | | 625,534 | | | | 107,889 | |
Justice and Attorney-General | | | 400,860 | | | | 415,442 | |
Local Government, Racing and Multicultural Affairs | | | 750,723 | | | | 247,124 | |
National Parks, Sport and Racing3 | | | 31,688 | | | | — | |
Natural Resources, Mines and Energy | | | 335,764 | | | | 533,012 | |
Premier and Cabinet | | | 137,247 | | | | 123,127 | |
Queensland Police Service | | | | | | | 734 | |
Queensland Treasury | | | 6,002,470 | | | | 6,049,595 | |
Science, Information Technology and Innovation3 | | | 37,433 | | | | — | |
State Development, Manufacturing, Infrastructure and Planning | | | 222,792 | | | | 604,240 | |
The Public Trustee of Queensland | | | 604 | | | | — | |
Total expenses | | | 13,708,777 | | | | 13,830,514 | |
Notes:
| 1. | Total expenses by department does not equate to total General Government expenses in Uniform Presentation Framework (UPF) terms reported elsewhere in the Budget Papers as General Government expenses include a wider range of entities including State Government statutory authorities. In addition transactions eliminated between entities within the General Government Sector are excluded in the preparation of whole-of-Government UPF financial statements. |
| 2. | Explanation of variations in departmental administered expenses can be found in the Service Delivery Statements. |
| 3. | Ceased 12 December 2017. |
83
Budget Strategy and Outlook 2018-19
| 6 | Balance sheet and cash flows |
Features
| • | | Due to a stronger than expected 2017-18 operating surplus, borrowing in 2017-18 is expected to remain below projections in the 2017-18 MYFER and be nearly $2.4 billion lower than projected in the 2017-18 Budget. |
| • | | General Government Sector debt is expected to increase slightly from $31.367 billion in 2017-18 to $32.311 billion in 2018-19. This is $1.6 billion lower than the projection for 2018-19 at the time of the 2017-18 MYFER and over $4 billion lower than 2017-18 budget. |
| • | | The reduction in General Government debt in 2017-18 has provided the Government with the capacity to fund essential infrastructure and capital works over the forward estimates, while General Government debt and Non-financial Public Sector (NFPS) debt remains lower each year than predicted in the 2017-18 Budget. |
| • | | The State’s net worth, the amount by which its assets exceed its liabilities, is forecast to be over $208 billion by 2020-21, $2.35 billion higher than at the time of the 2017-18 MYFER. The increase since the 2017-18 MYFER predominantly reflects lower than expected borrowing as a result of the strong 2017-18 operating surplus. |
| • | | At the time of 2017-18 MYFER, net cash inflows from operating activities for 2017-18 were expected to cover 68.9% of net investments in Non-financial Assets (NFAs) for the General Government Sector. The estimated actual coverage is now expected to be nearly 100%. |
| • | | The total capital program for 2018-19 Budget of $45.769 billion for the period 2018-19 to 2021-22 is comprised of $40.543 billion of Purchases of Non-financial Assets (PNFA), $4.074 billion of capital grant expenses and acquisitions of non-financial assets under finance leases of $1.151 billion. |
The balance sheet shows the projected assets, liabilities and net worth of the General Government Sector as at 30 June each financial year. It is important for the Government to maintain a strong balance sheet to provide it with stability, flexibility and capacity to deal with emerging financial and economic pressures, and to provide a strong foundation for future economic growth.
The cash flow statement shows the expected cash flows of the General Government Sector during each financial year of the forward estimates. The main difference between the accrual operating statement and the cash flow relates to the timing of cash payments and receipts and their recognition in accrual terms and the inclusion of non-cash expenses and revenues. The largest differences between accrual accounting and cash flows are in relation to depreciation and superannuation. Differences due to the timing of receipt or payment of amounts are recorded as either a receivable or payable in the balance sheet.
84
Budget Strategy and Outlook 2018-19
Table 6.1 provides a summary of the key balance sheet aggregates for the General Government Sector.
| Table 6.1 | General Government Sector: summary of budgeted balance sheet1 |
| | | | | | | | | | | | | | | | | | | | | | | | |
| | | 2017-18
Budget
$ million | | | 2017-18
Est. Act.
$ million | | | 2018-19
Budget
$ million | | | 2019-20
Projection
$ million | | | 2020-21
Projection
$ million | | | 2021-22
Projection
$ million | |
Financial assets | | | 60,814 | | | | 61,544 | | | | 59,460 | | | | 58,581 | | | | 58,642 | | | | 58,458 | |
Non-financial assets | | | 212,407 | | | | 210,900 | | | | 214,752 | | | | 219,987 | | | | 224,570 | | | | 229,016 | |
Total assets | | | 273,222 | | | | 272,443 | | | | 274,212 | | | | 278,568 | | | | 283,213 | | | | 287,474 | |
Borrowings | | | 33,758 | | | | 31,367 | | | | 32,311 | | | | 35,861 | | | | 39,588 | | | | 42,290 | |
Advances and deposits | | | 1,544 | | | | 2,231 | | | | 1,816 | | | | 1,533 | | | | 1,367 | | | | 1,384 | |
Superannuation liability | | | 23,355 | | | | 25,294 | | | | 23,414 | | | | 21,334 | | | | 19,946 | | | | 18,877 | |
Other provisions and liabilities | | | 12,642 | | | | 13,865 | | | | 14,034 | | | | 14,065 | | | | 14,211 | | | | 14,407 | |
Total liabilities | | | 71,299 | | | | 72,757 | | | | 71,575 | | | | 72,793 | | | | 75,112 | | | | 76,958 | |
Net worth | | | 201,922 | | | | 199,686 | | | | 202,636 | | | | 205,775 | | | | 208,101 | | | | 210,515 | |
Net financial worth | | | (10,485 | ) | | | (11,213 | ) | | | (12,115 | ) | | | (14,211 | ) | | | (16,470 | ) | | | (18,501 | ) |
Net financial liabilities | | | 33,273 | | | | 34,216 | | | | 35,928 | | | | 38,362 | | | | 40,540 | | | | 42,462 | |
Net debt | | | 1,622 | | | | (267 | ) | | | 2,815 | | | | 7,336 | | | | 11,018 | | | | 13,707 | |
Note:
| 1. | Numbers may not add due to rounding and bracketed numbers represent negative numbers. |
The General Government Sector holds the equity of the State’s public enterprises, principally its shareholding in government-owned corporations (GOCs) but also Public Financial Corporations like Queensland Treasury Corporation (QTC), in much the same manner as the parent or holding company in a group of companies. The estimated investment in public enterprises is included in the General Government Sector’s financial assets.
Financial assets of $61.544 billion are estimated for 2017-18, $730 million higher than originally budgeted for 2017-18. Receivables are $333 million higher than budgeted, which includes dividends from other sectors.
Between 2017-18 and 2019-20, financial assets are projected to decrease by $2.963 billion as investments are repatriated from the actuarially assessed defined benefit superannuation fund and Queensland Government Insurance Fund (QGIF) surpluses. These repatriations, announced in previous budgets, will be used to fund the State Infrastructure Fund and additional priority capital projects as well as reducing debt.
85
Budget Strategy and Outlook 2018-19
Chart 6.1 shows forecast General Government Sector financial assets by category at 30 June 2019. Investments held to meet future liabilities, including superannuation and insurance, comprise the major part of the State’s financial assets.
| Chart 6.1 | Forecast General Government Sector financial assets by category, at 30 June 2019 |
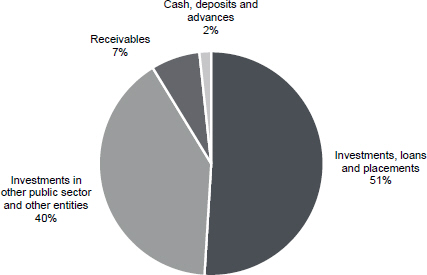
| 6.2.2 | Non-financial assets |
General Government Sector non-financial assets are estimated to total $210.9 billion at 30 June 2018, $1.507 billion lower than forecast at 2017-18 Budget and $281 million higher than in the 2017-18 MYFER.
The decrease since the 2017-18 Budget reflects the flow through of a net downward revaluation at 30 June 2017 primarily for road infrastructure assets. These revaluations were incorporated into the 2017-18 MYFER.
NFAs in 2018-19 are expected to grow by $3.852 billion over the 2017-18 estimated actuals, to be $214.752 billion at 30 June 2019. These assets consist primarily of land and other fixed assets of $207.985 billion, the majority of which are roads, schools, hospitals and other infrastructure used to provide services to Queenslanders. Other non-financial assets of $6.767 billion held by the State include prepayments and deferred income tax assets relating to GOCs.
86
Budget Strategy and Outlook 2018-19
General Government Sector capital expenditure for 2018-19 is forecast to be $7.601 billion, which comprises $5.927 billion of PNFA, and $1.674 billion of capital grant expenses. In addition to these, acquisitions of non-financial assets under finance leases are forecast to be $864 million, bringing the total General Government Sector capital program for 2018-19 to $8.465 billion.
Over the four years to 2021-22, General Government Sector capital expenditure is forecast to be $32.078 billion, which comprises $27.961 billion of PNFA, and $4.117 billion of capital grant expenses. Acquisitions of non-financial assets under finance leases are forecast to be $1.151 billion, bringing the total General Government Sector capital program over the period to $33.229 billion.
General Government Sector PNFA are forecast to increase from $4.905 billion in the 2017-18 estimated actual to $7.081 billion in 2021-22. This increase reflects the Government’s commitment to providing essential infrastructure and capital works to deliver productivity enhancing infrastructure, strengthening local economies and supporting local jobs.
One of the Government’s fiscal principles targets net operating surpluses that ensure General Government Sector PNFA are funded primarily through recurrent revenues rather than borrowing. Forecast net operating cash flows from 2017-18 to 2021-22 of $17.670 billion are funding net investments in NFAs of $31.414 billion. Net cash inflows from operating activities equate to 59.7% of the funding required for the 2018-19 General Government Sector net investments in NFAs, and averages 59.3% across the period 2017-18 to 2021-22.
The State has also entered into a number of finance leases, mainly in relation to Public Private Partnerships, totalling $1.710 billion over the period 2017-18 to 2019-20, including:
| • | | $1.030 billion for New Generation Rollingstock |
| • | | $430 million for the Toowoomba Second Range Crossing |
| • | | $195 million for the Gold Coast Light Rail - Stage 2. |
Generally, at the commencement of finance leases, the non-financial assets and the borrowings of the State increase by an equal amount to reflect the acquisition of the asset from the proponent. There are no cash impacts on the commencement of the lease - the finance lease liabilities are subsequently repaid under the terms of the Public Private Partnership agreement.
Purchases of non-financial assets by the NFPS over the period 2018-19 to 2021-22 are forecast to be $40.543 billion, which is an average of $10.136 billion per annum. With capital grant expenses of $4.074 billion, this brings total capital expenditure to $44.618 billion. In addition to this, acquisitions of non-financial assets under finance leases of $1.151 billion bring the total capital program over the period to $45.769 billion. While its primary aim is to facilitate service delivery to Queenslanders, infrastructure investment makes an important contribution to the economy and is a cornerstone of the Queensland job market, particularly in the construction industry.
87
Budget Strategy and Outlook 2018-19
General Government Sector
Estimated General Government Sector liabilities of $72.757 billion in 2017-18 are $1.458 billion higher than the 2017-18 Budget. The superannuation liability was $1.939 billion higher, mainly from the flow through of actuarial adjustments at 30 June 2017, as well as lower beneficiary payments. Advances received were higher as more GOCs joined the cash management scheme and there was an increase in other liabilities, predominantly the State’s commitment to join the National Redress Scheme for Survivors of Institutional Child Sexual Abuse. Partially offsetting these increases was lower debt than expected at the time of the 2017-18 Budget mainly resulting from improved royalty revenue.
Due to the Government’s commitment to sustainable fiscal management, General Government Sector borrowing is expected to fall $1.893 billion from $33.260 billion in 2016-17 to $31.367 billion in 2017-18.
Total liabilities in the General Government Sector in 2018-19 will reduce by $1.182 billion from the 2017-18 estimated actual, predominantly due to lower superannuation liabilities. Liabilities relating to employee entitlements (principally superannuation and long service leave) are projected to total $29.302 billion at 30 June 2019, a 5.6% decrease on the 2017-18 estimated actual. The State’s defined benefit fund has been closed to new entrants since 2008. Given the age profile of those employees still in that fund, retirements are also increasing. Accordingly, the State’s superannuation liability is now declining over the forward estimates. In addition, an anticipated increase in bond rates across the forward estimates contributes to the expected decline.
General Government Sector borrowings of $32.311 billion are budgeted for 2018-19, $4.082 billion lower than the projection in the 2017-18 Budget and $1.601 billion lower than projected at the time of the 2017-18 MYFER. Borrowings are expected to increase by $10.923 billion between 2017-18 and 2021-22 in support of PNFA’s of $27.961 billion.
The composition of the General Government Sector’s forecast liabilities at 30 June 2019 is illustrated in Chart 6.2.
88
Budget Strategy and Outlook 2018-19
| Chart 6.2 | Forecast General Government Sector liabilities by category, at 30 June 2019 |
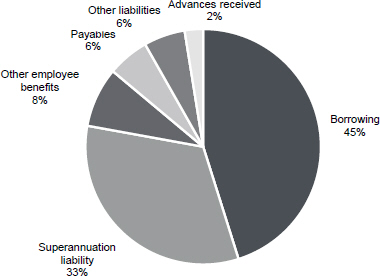
Borrowing in 2018-19 is budgeted to be 45% of total liabilities, compared with 53% in 2014-15, reflecting the reduction in borrowings over this period.
Non-financial Public Sector borrowings
Non-financial Public Sector borrowings of $69.501 billion are expected for 2017-18, $2.488 billion lower than expected at the 2017-18 Budget, and $1.721 billion lower than 2017-18 MYFER.
Non-financial Public Sector borrowings of $79.750 billion are now expected for 2020-21, $1.093 billion lower than expected at the 2017-18 MYFER and $1.398 billion less than the comparable 2017-18 Budget estimate. This largely reflects the Government’s commitment to fiscally responsible infrastructure investment, without substantially increasing debt.
The net financial worth measure is an indicator of financial strength. Net financial worth is defined as financial assets less all existing and accruing liabilities. Financial assets include cash and deposits, advances, financial investments, loans, receivables and equity in public enterprises.
The net financial worth measure is broader than the alternative measure – net debt – which measures only cash, advances and investments on the assets side and borrowings and advances on the liabilities side.
The net financial worth of the General Government Sector for 2017-18 is estimated at negative $11.213 billion, an improvement of $1.138 billion on the 2017-18 MYFER.
89
Budget Strategy and Outlook 2018-19
| 6.2.5 | Net financial liabilities |
Net financial liabilities are total liabilities less financial assets, other than equity investments in other public sector entities. This measure is broader than net debt as it includes other significant liabilities, in addition to borrowings (for example, accrued employee liabilities such as superannuation and long service leave entitlements).
The net financial liabilities of the General Government Sector for 2017-18 are estimated to be $34.216 billion. Net financial liabilities start increasing from 2018-19 mainly as borrowings increase and investments are repatriated from the actuarially assessed defined benefit superannuation fund and QGIF surplus to assist funding of priority infrastructure projects.
The net worth, or equity, of the State is the amount by which the State’s assets exceed its liabilities. This is the value of the investment held on behalf of the people of Queensland by public sector instrumentalities.
Changes in the State’s net worth occur for a number of reasons including:
| • | | operating surpluses (deficits) that increase (decrease) the Government’s equity |
| • | | revaluation of assets and liabilities as required by accounting standards. For example, the Government’s accruing liabilities for employee superannuation and long service leave are determined by actuarial assessments |
| • | | movements in the net worth of the State’s investments in the Public Non-financial Corporations and Public Financial Corporations sectors |
| • | | gains or losses on disposal of assets. Where the selling price of an asset is greater (less) than its value in an agency’s accounts, the resultant profit (loss) affects net worth. |
The net worth of the General Government Sector in 2017-18 is estimated to be $199.686 billion. This is $2.236 billion lower than forecast in the 2017-18 Budget primarily due to downward revaluations of road infrastructure assets at 30 June 2017. From 2017-18, net worth is projected to steadily increase, mainly as a result of the growth in purchases of non-financial assets.
Net debt is the sum of advances received and borrowings less cash and deposits, advances paid and investments, loans and placements.
Net debt for the General Government Sector in 2017-18 is estimated to be negative $267 million, $1.889 billion less than the 2017-18 Budget mainly as a result of improved royalty receipts. Net debt is forecast to increase across the forward estimates to fund priority infrastructure projects.
In the NFPS, net debt is estimated at $34.854 billion in 2017-18, $3.036 billion less than the 2017-18 Budget. Net debt is expected to increase to $39.027 billion in 2018-19 and then grow through to 2021-22 with infrastructure provision partly funded by borrowings and investment drawdowns.
90
Budget Strategy and Outlook 2018-19
| 6.2.8 | New Accounting Standards |
Two new accounting standards will apply to public and private sectors in Australia from 1 July 2019, AASB 16 Leases and AASB 1059 Service Concession Arrangements, that have the potential to significantly impact balance sheets.
Currently, only finance leases are recognised on the balance sheet (and classified as borrowings for GFS purposes). The intention of the new leasing standard is to also bring operating leases onto the balance sheet of lessees. There will therefore no longer be a distinction between finance leases and operating leases for lessees.
Lessees will be required to recognise a right-of-use asset on balance sheet (representing the right to use the underlying leased asset) and a lease liability (representing the obligation to make future lease payments) for all leases except for short-term leases and leases of low-value assets. Social PPPs (such as schools) are already treated as finance leases and included on the State’s balance sheet.
For Service Concession Arrangements, the State, as grantor will recognise an asset and a matching liability which may be classified as a borrowing or unearned revenue (included in other liabilities), depending on the individual contract.
The impact of these new standards will be addressed in the 2019-20 Budget.
The cash flow statement provides the cash surplus (deficit) measure which is comprised of the net cash flows from operating activities plus the net cash flows from investments in non-financial assets (or physical capital).
The estimated General Government Sector cash deficit of $47 million in 2017-18 is $1.875 billion lower than that forecast at the time of the 2017-18 Budget. This is largely due to the higher than expected operating cash flows.
After taking into account PNFA of $5.927 billion, a cash deficit of $2.248 billion is forecast for 2018-19, an improvement of $937 million compared to the 2017-18 MYFER.
Net cash flows from investments in financial assets for policy purposes include net cash flows from disposal or return of equity, net equity injections into government-owned corporations and concessional loans and advances. Cash flows from the return of equity from the PNFC and PFC sectors are the primary driver of net inflows of $1.127 billion over the period 2017-18 to 2021-22.
Net cash flows from investments in financial assets for liquidity purposes represent net investment in financial assets to cover liabilities such as superannuation, other employee entitlements and insurance. The repatriation of surpluses in the actuarially assessed defined benefit superannuation fund and the QGIF flow through this line in the Statement of Cash Flows.
Total General Government Sector PNFA of $5.927 billion are budgeted for 2018-19 and, over the period 2018-19 to 2021-22, PNFA are expected to total $27.961 billion in the General Government Sector.
91
Budget Strategy and Outlook 2018-19
| 7 | Intergovernmental financial relations |
Features
| • | | Queensland’s ability to meet its service delivery and infrastructure responsibilities is dependent on payments from the Australian Government with over 45% of Queensland General Government revenue coming from the Australian Government. |
| • | | Estimated Australian Government funding in 2018-19 for Queensland is $26.776 billion; $14.794 billion in GST revenue and $11.982 billion in payments for specific purposes (National Specific Purpose Payments and National Partnership payments). |
| • | | Queensland’s GST revenue in 2018-19 is $415.2 million lower than that received in 2017-18. Queensland has a reduced GST share because of factors such as strong mining royalties and population growth below the national average in the three years to 2016-17. The Australian Government’s direction to the Commonwealth Grants Commission to exclude selected payments from GST distribution calculations has also negatively impacted Queensland’s share of GST. |
| • | | In 2018-19, $11.982 billion is provided for payments for specific purposes comprising: |
| | • | | $4.557 billion for National Health Reform |
| | • | | $4.408 billion for Quality Schools |
| | • | | $2.034 billion for National Partnership payments, including $1.487 billion for the Infrastructure Investment Program, $158 million for Natural Disaster Relief and Recovery Arrangements (NDRRA) and $88 million for Universal Access to Early Childhood Education |
| | • | | $669.5 million for National Specific Purpose Payments, including $366 million for disability services, and $303.5 million for skills and workforce development |
| | • | | $313.6 million for National Housing and Homelessness. |
| • | | Queensland is currently negotiating a number of agreements with the Australian Government. Three key agreements are the National Health Reform Agreement, Quality Schools Agreement and the National Housing and Homelessness Agreement. |
| • | | Despite repeated requests from states and territories, the Australian Government has not provided greater certainty on the longevity of some funding, preferring instead to provide short-term extensions, or none at all in the case of remote housing, rather than make long-term commitments. The Australian Government also continues to impose stringent conditions in new agreements. This is inconsistent with the principles of the Intergovernmental Agreement on Federal Financial Relations. |
| • | | Similarly, Queensland is particularly challenged by a lack of sufficient funding from the Australian Government towards nationally significant infrastructure projects in Queensland, most notably Cross River Rail. |
92
Budget Strategy and Outlook 2018-19
| 7.1 | Federal financial arrangements |
Federal financial relations in Australia are characterised by different levels of government sharing responsibility for raising revenue and delivering services to communities. State and territory governments’ ability to raise revenue is less than required to meet their service delivery responsibilities. Alongside this, the Australian Government raises more revenue than is required to meet its service delivery responsibilities. This is called vertical fiscal imbalance (VFI), and requires the sharing of revenue between the Commonwealth and states and territories.
In 2016-17, the Australian Government collected the majority of taxation revenues (79.6%), while states and territories (states)1 collected 16.8% and local governments the remaining 3.6%2. National tax reform and other changes since 2000 have led to the Commonwealth having greater capacity to raise revenue compared to states and therefore an increase in VFI. Chart 7.1 shows that states received 35% of their revenue from the Australian Government in 1999-2000, with this forecast to significantly increase to 46.3% in 2018-193.
| Chart 7.1 | General Government revenue sources, all states, 1999-2000 and 2018-191 |
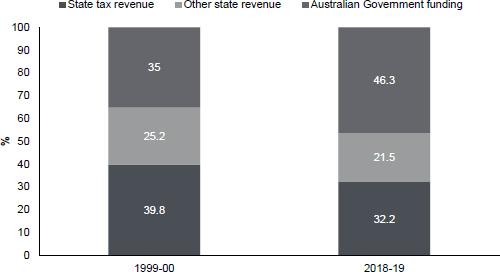
Note:
Sources: ABS Government Finance Statistics Cat No. 5512.0 and state and Australian Government Budget Papers.
| 1 | States refer to states and territories unless otherwise specified. |
| 2 | ABS Government Finance Statistics Cat No. 5506.0 |
| 3 | National aggregates and interstate comparisons in this chapter will use Australian Government estimates for consistency. Queensland specific figures are consistent with Queensland Budget estimates. |
93
Budget Strategy and Outlook 2018-19
In Australia, VFI is addressed through a system of intergovernmental payments from the Australian Government to the states which allows the states to meet their service delivery and infrastructure responsibilities. The Australian Government provides two types of payments:
| • | | general revenue assistance payments such as the GST which are able to be used by states for any purpose (untied funding) |
| • | | payments for specific purposes (tied funding) such as National Specific Purpose Payments (SPPs) and National Partnership payments (NPs) which support specific projects or service areas. |
Without a contribution by the Australian Government, states would not be able to provide essential services and infrastructure.
Another feature of Australian federalism is horizontal fiscal imbalance (HFI). HFI arises from disparities between the states’ capacity to raise revenue and deliver services. Some states can raise higher revenue or deliver services at a lower cost compared to other states. Over time, this can distort capital and labour mobility towards states providing higher level of services.
To address this, GST revenue collected by the Australian Government is distributed to states in a way that ensures each is provided with the fiscal capacity to deliver the same standard of services and infrastructure to their population no matter where they live. This is known as horizontal fiscal equalisation (HFE).
The Commonwealth Grants Commission (CGC) uses the principle of HFE in recommending to the Australian Government how GST revenue should be distributed. The amount each state receives is a function of the amount of GST revenue collected (the GST pool) and the share of revenue recommended by the CGC.
In April 2017, the Australian Government directed the Productivity Commission to review the current HFE system to determine its impact and whether preferable alternatives exist. Further details are provided in Box 7.1.
94
Budget Strategy and Outlook 2018-19
| Box 7.1 | Productivity Commission Inquiry into HFE |
The Productivity Commission’s (PC) inquiry into Australia’s system of HFE commenced on 30 April 2017. This inquiry examines the current system of distributing GST revenue to the states and its impact on productivity, efficiency, economic growth and the incentives for states to undertake fiscal reforms.
The PC released a draft report on 9 October 2017. It found that the current system achieves a high degree of equalisation but has the potential to discourage states from pursuing efficiency-enhancing reform. In response, the PC canvassed several alternative systems for distributing GST revenue. A key element of these alternative systems is that states are not equalised to deliver the same standard of services and infrastructure to their population. In each alternative system, Queensland would receive significantly less GST revenue. Under one system, the PC estimates that Queensland would have received $1.588 billion less GST in 2017-18 compared to the current system. This is equivalent to losing 5,000 teachers, 5,000 nurses, 3,000 police officers and 1,135 firefighters.
In its submission to the PC in December 2017, and at the public inquiry in Brisbane on 5 February 2018, the Queensland Government strongly advocated for the principle of HFE. It also stressed the importance of a system that recognises the different circumstances of each state so that additional funding can be directed to states with unavoidably higher service delivery costs.
The PC final report was provided to the Australian Government on 15 May 2018. At the time of finalising the 2018-19 Budget papers, states have not been provided with the report or the PC final recommendations.
| 7.2 | Australian Government funding to the states |
As discussed in section 7.1, total Australian Government payments to the states are made up of general revenue assistance payments and payments for specific purposes.
Total Australian Government payments for the states in 2018-19 are expected to be $126.751 billion, an increase of $4.312 billion, or 3.5%, from 2017-18.
Within this total, payments to states for specific purposes in 2018-19 are expected to be $58.554 billion, a 1.0% increase from 2017-18. These consist of:
| • | | $21.189 billion in National Health Reform funding |
| • | | $19.518 billion in Quality Schools funding |
| • | | $13.840 billion in National Partnership payments |
| • | | $2.471 billion in National Specific Purpose Payments |
| • | | $1.536 billion in National Housing and Homelessness funding. |
95
Budget Strategy and Outlook 2018-19
| 7.3 | Australian Government funding to Queensland |
Estimated Australian Government funding in 2018-19 for Queensland, included in the 2018-19 Queensland Budget, is $26.776 billion4, a decrease of $523.2 million, or 1.9%, compared with 2017-18.
Australian Government funding is estimated to account for 46.4% of Queensland’s total General Government Sector revenue sources in 2018-19 (shown in Chart 7.2). Australian Government funding has grown significantly as a proportion of Queensland’s total revenue since the introduction of the GST in 2000, consistent with the broader national trend.
| Chart 7.2 | General Government Sector revenue sources, Queensland, 2018-191 |
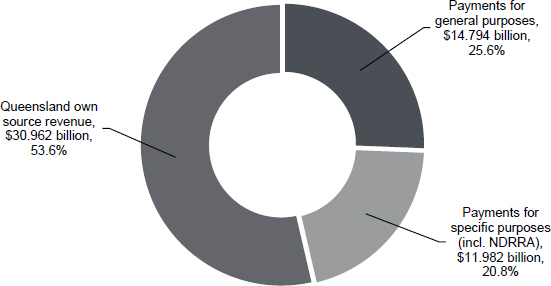
Note:
| 1. | Percentage may not add to 100% due to rounding. |
Source: 2018-19 Commonwealth Budget Paper No. 3 and Queensland Treasury estimates.
| 4 | This figure differs to Chapter 4 Australian Government payments estimates, owing to the exclusion of direct Australian Government payments to Queensland departments for Commonwealth own purpose expenditure. |
96
Budget Strategy and Outlook 2018-19
GST revenue accounts for all general revenue assistance payments Queensland receives. In 2018-19, Queensland expects to receive $14.794 billion of GST revenue, $415.2 million or 2.7% less than the amount received in 2017-18 (see Chart 7.3).
| Chart 7.3 | Estimated GST payments to Queensland, 2013-14 to 2018-191 |
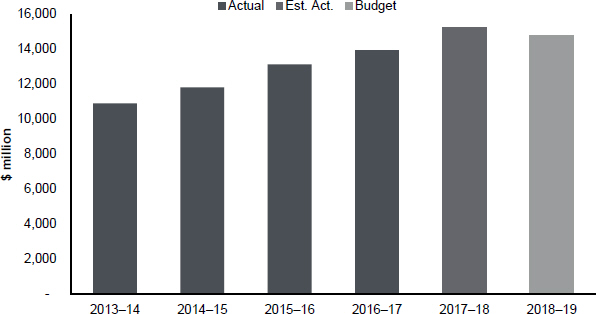
Note
| 1. | Figures include the balancing adjustments which account for differences between the GST paid to states and the final GST pool size and population outcomes in the prior year. |
Sources: 2018-19 Commonwealth Budget Paper No. 3 and Queensland Treasury estimates.
The decrease in GST revenue in 2018-19 reflects the CGC’s recommendation that Queensland receive a lesser share of GST compared to 2017-18. This is expressed as a relativity; the measure of a state’s fiscal capacity compared to other states, after considerations are made for its ability to raise revenue and provide services. A state with a lower relativity is considered to have a higher fiscal capacity and requires a lower share of the GST. In 2018-19, the Australian Government accepted the CGC’s recommended relativity for Queensland of 1.09584, down from 1.18769 in 2017-18.
97
Budget Strategy and Outlook 2018-19
The CGC has recommended a decrease to Queensland’s share of GST for 2018-19 due to the following:
| • | | Queensland’s population growth over the assessment years from 2014-15 to 2016-17 was lower than the national average, leading to a reduction in Queensland’s assessed need for infrastructure investment relative to the rest of Australia |
| • | | Queensland required less GST funding to cover natural disaster expenses compared to years following the major flood and cyclone events between 2011 and 2014 |
| • | | strong commodity prices increased Queensland’s mining revenue which in turn improved the state’s ability to meet its own expenditures |
| • | | Queensland received more than its population share of Commonwealth payments which increased its capacity to provide services. |
Queensland’s GST revenue is also adversely affected by the Australian Government excluding some payments from the GST distribution calculations. These have favoured other states in recent years, for example, funding for the Perth Freight Link paid to Western Australia and payments made to states under the Asset Recycling Initiative. The adverse effect of such payments on Queensland’s GST share last several years before they are no longer relevant to the calculation of the State’s GST share.
The CGC Report on GST Revenue Sharing Relativities (2018 Update) provides detail on the factors that determine Queensland’s GST share. It also provides information on Queensland’s share of GST compared to other states and the reasons underpinning these differences. Table 7.1 shows the relativities and resulting GST distributions for each state and territory for 2018-19.
| Table 7.1 | Recommended relativities and estimated GST shares, 2018-19 |
| | | | | | | | | | | | | | | | | | | | | | | | | | | | | | | | |
| | | NSW | | | Vic. | | | Qld | | | WA | | | SA | | | Tas. | | | ACT | | | NT | |
CGC recommended relativity | | | 0.85517 | | | | 0.98670 | | | | 1.09584 | | | | 0.47287 | | | | 1.47727 | | | | 1.76706 | | | | 1.18070 | | | | 4.25816 | |
GST Share ($ million) | | | 18,442 | | | | 17,261 | | | | 14,794 | | | | 3,315 | | | | 6,887 | | | | 2,488 | | | | 1,328 | | | | 2,805 | |
GST per capita ($) | | | 2,290 | | | | 2,642 | | | | 2,934 | | | | 1,266 | | | | 3,956 | | | | 4,733 | | | | 3,161 | | | | 11,405 | |
Sources: 2018-19 Commonwealth Budget Paper No. 3, Commonwealth Grants Commission Report on GST Revenue Sharing Relativities – 2018 Update.
Currently the CGC is reviewing its method for determining the distribution of GST among the states. Through the 2020 Methodology Review, Queensland aims to ensure the assessment accurately reflects the challenges of delivering services to a large and decentralised state and that the State receives its fair share of GST revenue
The final report for the 2020 Methodology Review will be provided to the Commonwealth and states by 28 February 2020.
98
Budget Strategy and Outlook 2018-19
| 7.5 | Payments to Queensland for specific purposes |
Payments for specific purposes comprise funding for:
| • | | National Housing and Homelessness |
| • | | National Specific Purpose Payments (SPPs) |
| • | | National Partnership (NP) payments. |
Queensland is expected to receive $11.982 billion in payments for specific purposes in 2018-19. This is $107.2 million lower than 2017-18 and is mainly due to the cessation of the National Partnership on Remote Housing in 2017-18.
| Table 7.2 | Estimated Payments to Queensland for Specific Purposes1 |
| | | | | | | | | | | | |
| | | 2016-17
Actual
$ million | | | 2017-18
Est. Act.
$ million | | | 2018-19
Budget
$ million | |
National Specific Purpose Payments | | | 907 | | | | 925 | | | | 670 | |
Skills and workforce development | | | 296 | | | | 299 | | | | 304 | |
Disability services | | | 341 | | | | 353 | | | | 366 | |
Affordable housing2 | | | 269 | | | | 273 | | | | — | |
National Health Reform funding | | | 3,851 | | | | 4,595 | | | | 4,557 | |
Quality Schools funding | | | 3,874 | | | | 4,157 | | | | 4,408 | |
National Housing and Homelessness funding2 | | | — | | | | — | | | | 314 | |
National Partnership Payments (incl. NDRRA) | | | 3,228 | | | | 2,412 | | | | 2,034 | |
Total payments for specific purposes | | | 11,860 | | | | 12,089 | | | | 11,982 | |
Notes:
| 1. | Numbers may not add due to rounding. |
| 2. | From 2018-19, funding under the National Affordable Housing SPP and the National Partnership Agreement on Homelessness is combined under the National Housing and Homelessness Agreement. |
Sources: 2018-19 Commonwealth Budget Paper No. 3 and Queensland Treasury estimates.
In 2018-19, National Health Reform funding accounts for 38% and Quality Schools funding accounts for 36.8% of the total payments for specific purposes respectively. The estimated decrease in National Health Reform funding from 2017-18 to 2018-19 is due to funding for services provided in previous years being recognised in 2017-18. Queensland projections of National Health Reform Funding differ from the projections contained in the 2018-19 Commonwealth Budget. For 2018-19, Commonwealth projections assume higher activity growth than is projected in service agreements between the Queensland Department of Health and Hospital and Health Services. Actual National Health Reform payments may vary from estimates based on actual public hospital activity delivered each year.
99
Budget Strategy and Outlook 2018-19
From 1 July 2018, the new National Housing and Homelessness Agreement (NHHA) will commence. The NHHA combines funding under the National Affordable Housing SPP and continues the homelessness funding under the National Partnership Agreement on Homelessness, which expires on 30 June 2018.
National SPPs, which encompass 5.6% of the total payments for specific purposes, are expected to decrease by 27.6% to $669.5 million in 2018-19 (as shown in Table 7.2). The reduction is due to funding for the National Affordable Housing SPP being merged with homelessness funding, and reported as part of the new NHHA from 2018-19.
NP payments (including NDRRA), which account for 17% of the total payments for specific purposes, are expected to decrease by 15.7% to $2.034 billion in 2018-19 compared to the previous year. This is mainly due to the cessation of the National Partnership on Remote Housing. A significant proportion of these payments is allocated for infrastructure, community services, NDRRA and education (refer to Chart 7.4).
| Chart 7.4 | National Partnership Payments by sector, 2018-191 |
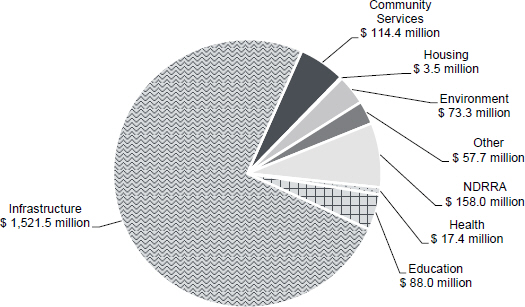
Note:
| 1. | Excludes Australian Government direct funding to local government. |
Sources: 2018-19 Commonwealth Budget Paper No. 3 and Queensland Treasury estimates.
100
Budget Strategy and Outlook 2018-19
In the 2018-19 Commonwealth Budget, the Australian Government announced funding of $5.2 billion for major infrastructure projects in Queensland, with most of the funding allocated outside the forward estimates. This includes:
| • | | a further $3.3 billion for priority upgrades along the Bruce Highway, including Pine Rivers to Caloundra ($880 million) and Cooroy to Curra Section D ($800 million) |
| • | | a contribution of $1 billion to M1 Pacific Motorway projects (Eight Mile Plains to Daisy Hill and Varsity Lakes to Tugun) |
| • | | $390 million for the Beerburrum to Nambour rail upgrade. |
The Commonwealth Budget also provides funding for a number of national infrastructure initiatives that have implications for Queensland. This includes:
| • | | $15 million allocation for the Toowoomba to Brisbane Passenger Rail Business Case under the $250 million Major Projects Business Case Fund |
| • | | $1.5 billion Northern Australia strategic roads package to be shared across Queensland, the Northern Territory and Western Australia |
| • | | $160 million to upgrade sections of the Outback Way, which links Laverton in Western Australia to Winton in Queensland. Funding will be shared across Queensland, the Northern Territory and Western Australia. |
The Australian Government has failed to fund critical infrastructure such as Cross River Rail. Furthermore, it has applied inconsistent funding splits between the Commonwealth contribution compared to Queensland’s contribution (e.g. 80:20 or 50:50) for similar projects, and regularly budgets its contribution well after projects commence and beyond the forward estimates. For example, for the two M1 Pacific Motorway projects, the Australian Government has only committed to 15.5% of its project contribution within the forward estimates.
101
Budget Strategy and Outlook 2018-19
| Box 7.2 | Projections of specific purpose funding to Queensland |
Across the forward estimates, total payments for specific purposes are expected to steadily increase, with average growth of around 4% between 2019-20 and 2021-22.
National Health Reform funding for Queensland is expected to increase by an average of 5.5% per annum from 2019-20. Under the Addendum to the National Health Reform Agreement, the Australian Government will fund 45% of efficient growth in hospital activity subject to a national growth cap of 6.5% per annum. Current estimates are based on this methodology however, funding is subject to Queensland agreeing to the Addendum to the National Health Reform Agreement, including an agreed mechanism for finalising future National Health Reform funding determinations in a timely manner.
Growth in Quality Schools funding for Queensland is expecting to average 6.7% per annum between 2018-19 and 2021-22 as a result of enrolment growth and increased per student funding. In June 2017, legislation was passed by the Australian Government to introduce a new needs-based funding model for schools. Under the new funding model, Queensland is expecting to receive $7.856 billion for state schools and $11.687 billion (including GST) for non-government schools over the forward estimates. Funding for the 2019 to 2023 calendar years is contingent on states agreeing to national and bilateral agreements with the Australian Government by the end of 2018.
Queensland is currently negotiating the bilateral agreement for the new National Housing and Homelessness Agreement (NHHA). Funding is due to commence in 2018-19, and combines funding for the National Affordable Housing SPP with homelessness funding. NHHA funding is expected to be relatively stable across the forward estimates.
Funding for National SPPs is expected to decrease from 2019-20 as the NDIS is fully implemented from the same year, which will redirect the National Disability SPP funding to the NDIS. Funding for the National Skills and Workforce Development SPP is expected to be relatively stable across the forward estimates.
102
Budget Strategy and Outlook 2018-19
The original intent of the Intergovernmental Agreement on Federal Financial Relations was to limit the number of NPs, allowing for funding to flow to states for efficient service delivery and reduce the reporting burden. Over time, the number of time-limited and low-value NPs has increased, reducing budget certainty and raising community expectations for ongoing services.
When agreements expire, states are left with limited opportunities to deal with the expiring NP as the final decision on continued funding is made through the Australian Government’s budget process. The expiry of a number of large NPs over the last few years has brought the risks posed by fixed-term funding arrangements into sharp focus. States have had limited capacity to influence the continuation of expiring agreements and often there is little warning on whether funding will be continued. An early indication as to the continuation, lapse or other treatment of funding under expiring agreements is necessary to enable states to undertake effective service delivery and budgetary planning.
There are 14 agreements due to expire in 2017-18 or 2018-19. Funding will expire in 2017-18 for eight agreements, worth approximately $212 million in 2017-18. There are six agreements where funding expires in 2018-19, worth approximately $126 million in 2017-18.
The 2018-19 Commonwealth Budget provided no advice on renewal and/or funding for the National Partnership on Remote Housing following its expiry in 2017-18. Funding under this agreement improves housing outcomes by providing for new housing, housing refurbishments and housing-related infrastructure in Indigenous communities.
Further, short-term funding was announced for the National Partnership on Universal Access to Early Childhood Education until December 2019. This will be the sixth short-term extension for this agreement. Alongside this, no further funding to states was announced for the National Partnership on the National Quality Agenda for Early Childhood Education and Care following its expiry on 31 December 2018. The Commonwealth has committed to fund the Australian Children’s Education and Care Quality Authority (ACECQA) until 30 June 2020 to administer the National Quality Framework for Early Childhood Education and Care.
When the Australian Government decides to cease funding for expiring agreements, this presents a significant ongoing fiscal risk for states, with impacts on the quality and continuity of much needed services delivered to some of the most vulnerable members of the community.
103
Budget Strategy and Outlook 2018-19
| 7.6 | State-local government financial relations |
In 2018-19, the Queensland Government will provide a total of $1.667 billion in grants to local governments. This includes financial assistance grants paid by the Australian Government through the State to local governments.
The Government is providing funding of $3.2 million over four years to undertake implementation planning to improve and simplify the administration of grants to local government.
The Government is providing funding of $1.3 million in 2018-19 to develop a new grants management system. This is to progress recommendations from the Review of Grants to Local Government: Current and Future State Assessments and is an important initiative to make the interaction of Queensland Government and local governments more efficient and more effective in serving the people of Queensland.
| Table 7.3 | Grants to local governments in Queensland1,2 |
| | | | | | | | |
| | | 2017-18
Est. Act.
$ million | | | 2018-19
Budget
$ million | |
Aboriginal and Torres Strait Islander Partnerships | | | 3 | | | | 7 | |
Environment and Science | | | 38 | | | | 61 | |
Child Safety, Youth and Women | | | 1 | | | | 2 | |
Communities, Disability Services and Seniors | | | 63 | | | | 60 | |
Education | | | 2 | | | | 2 | |
Natural Resources, Mines and Energy | | | 33 | | | | — | |
Housing and Public Works | | | 56 | | | | 81 | |
Innovation, Tourism Industry Development and the Commonwealth Games | | | 31 | | | | 2 | |
Local Government, Racing and Multicultural Affairs3 | | | 865 | | | | 559 | |
Premier and Cabinet | | | 13 | | | | 1 | |
Queensland Ambulance Service | | | 1 | | | | — | |
Queensland Fire and Emergency Services | | | 2 | | | | 2 | |
State Development, Manufacturing, Infrastructure and Planning | | | 382 | | | | 544 | |
Queensland Treasury | | | 1 | | | | 2 | |
Transport and Main Roads | | | 204 | | | | 213 | |
Other4 | | | 26 | | | | 132 | |
Total Queensland Government grants | | | 1,721 | | | | 1,667 | |
Notes:
| 1. | Includes current, capital and asset grants to local government authorities and Aboriginal and Torres Strait Islander councils. Includes Australian Government grants paid through the state to local governments. |
| 2. | Numbers may not add due to rounding. |
| 3. | Decline in 2018-19 reflects prepayment of Financial Assistance Grants by the Australian Government in 2017-18. |
| 4. | Includes grants yet unallocated to government agencies and ceased entities following Machinery of Government changes. |
104
Budget Strategy and Outlook 2018-19
| Box 7.3 | Grants to local governments |
The Queensland Government allocates considerable funding in the State Budget to support local governments across the State. The Queensland Government acknowledges the shared responsibilities in serving the people of Queensland and the important role local governments play. A summary of grant programs available to local governments are listed below.
Grant programs exclusively available to local government
| | | | | | | | |
Program Name | | Description | | Total Funding
(2015-16
onwards) | | Funding Allocated | | Funding Not
Yet Allocated |
| Works for Queensland | | Support local governments in regional areas to undertake job-creating maintenance and minor infrastructure works. | | $600 million | | $400 million | | $200 million |
| Transport Infrastructure Development Scheme | | Provide targeted investment in regional local government transport infrastructure. | | $460 million | | Committed through the Roads and Transport Alliance as annual allocations to 17 formalised groups of councils (Regional Roads and Transport Groups) to prioritise as rolling four-year programs of work. |
| Building our Regions | | Provide funding for critical infrastructure in regional areas to support economic development, including generating jobs. | | $295 million | | $225 million | | $70 million |
| Local Government Grants and Subsidies Program | | Provide funding for priority infrastructure projects that will enhance sustainable and liveable communities. | | $29 million
per annum | | Ongoing funding |
| Coastal Hazard Adaptation Program - QCoast2100 | | Assist coastal local governments to prepare plans and strategies for addressing climate change. | | $12 million | | $4.3 million | | $7.8 million |
| Queensland Water Regional Alliances Program | | Assist regional councils to collaborate and improve efficiencies and administration around water infrastructure. | | $6 million | | $1.8 million | | $4.2 million |
105
Budget Strategy and Outlook 2018-19
In addition to the above grant programs, the Government will be providing additional funding of $38 million over four years from 2018-19 to establish the Disaster Resilience Fund. This fund will be administered by the Queensland Reconstruction Authority (QRA) and will be available to a range of organisations including local governments, to deliver mitigation and resilience projects. The QRA intends to seek matched funding from the Australian Government.
Funding is also made available to local governments under the Natural Disaster Relief and Recovery Arrangements which are a joint funding initiative of the State and Australian Governments to provide disaster relief and recovery payments to help communities recover following the effects of natural disasters.
The Government also understands there are added challenges faced by Indigenous local governments, which are often located in very remote areas of the State, to ensure their communities have access to essential services and critical infrastructure. In response, the Government has allocated substantial additional funding to specifically support Indigenous councils and their communities. A summary of grant programs available to Indigenous councils and their communities are listed below.
Grant programs to support Indigenous councils and their communities
| | | | | | | | |
Program Name | | Description | | Total Funding
(2015-16
onwards) | | Funding
Allocated | | Funding Not
Yet Allocated |
| Indigenous Councils Critical Infrastructure Program | | Contribute water, wastewater and solid waste infrastructure in Indigenous communities. | | $120 million | | $33.2 million | | $86.8 million |
| Major Infrastructure Program | | Deliver environmental health and other infrastructure upgrades within the Torres Strait Island Regional Council, Torres Shire Council and Northern Peninsula Area Regional Council areas. | | $15 million | | $7.5 million | | $7.5 million |
| State Government Financial Aid | | A financial contribution (in lieu of rates) to meet the costs incurred by Indigenous councils in the provision of local government services. | | $33.7 million
per annum | | Ongoing funding indexed by CPI |
| Indigenous Local Government Sustainability Program (2016-18) | | Assist Indigenous councils to increase their capacity, capability and sustainability. | | $8.2 million | | $7.6 million | | $550,000 |
106
Budget Strategy and Outlook 2018-19
| 8 | Public Non-Financial Corporations Sector |
Features
| • | | The Queensland Government businesses operate commercially and efficiently and improve services to Queenslanders. |
| • | | The Government is supporting over $3.130 billion of additional infrastructure investment through the Public Non-Financial Corporations Sector in 2018-19. This includes $2.128 billion on electricity infrastructure, $204.7 million on water infrastructure, $181.2 million on port infrastructure and $587.5 million on rail infrastructure. |
| • | | The Public Non-Financial Corporations Sector is forecast to generate dividends of $1.435 billion in 2018-19. Importantly, dividends generated by the government-owned corporations will be used to fund an Asset Ownership Dividend which provides $50 a year for every household electricity bill over 2017-18 and 2018-19. This initiative forms part of the $2 billion Affordable Energy Plan, providing cost of living relief to Queenslanders. |
| • | | The Government continues to progress core energy policy proposals including the establishment of a clean energy government-owned corporation, progressing the business case for the Burdekin Falls Hydro Power Station and the Renewables 400 auction. Alongside diversifying the State’s energy generation mix to more renewable sources, these projects will help to drive greater competition, putting downward pressure on energy prices in Queensland. |
| • | | Energy Queensland Limited is preparing for the new regulatory control period 2020-25, through which the Australian Energy Regulator will determine allowable revenues for the Ergon Energy and Energex network businesses. |
| • | | In 2018-19, Queensland Rail is implementing a number of rail projects to improve the capacity and efficiency of the network, including the New Generation Rollingstock project, North Coast Line Capacity Improvement Project and European Train Control System – Inner City. |
| • | | The government-owned port corporations will continue to progress key projects in 2018-19 across the State. This includes progressing approvals for the Cairns Shipping Development Project, progressing the detailed business case and seeking approvals to commence works on the Clinton Vessel Interaction Project, progressing the Gladstone Port Master Plan and progressing works for the Channel Capacity Upgrade project at the Port of Townsville. |
| • | | The Rookwood Weir project presents an opportunity to supplement urban water supplies and enhance agricultural and industrial development in the Fitzroy Basin and Gladstone region. The Queensland Government and the Australian Government have both committed matching funding of $176 million ($352 million in total) to ensure the capital costs of the project are fully funded. |
107
Budget Strategy and Outlook 2018-19
A number of industries are covered by the Public Non-Financial Corporations (PNFC) Sector, including energy, rail, ports and water. Queensland’s government-owned corporations (GOCs), declared by regulation to be GOCs under the Government Owned Corporations Act 1993 (GOC Act), make up a large part of the PNFC Sector. Also included in the sector are non-GOC entities, the Queensland Bulk Water Supply Authority (trading as Seqwater), Queensland Rail, local water boards and other public corporations.
GOCs are accountable for their financial performance and are required to be commercial and efficient organisations. These requirements are legislated under the GOC Act.
PNFC Sector entities provide services or commodities like other businesses. The entities incur costs and bear commercial risks in the delivery of their services or products and generate revenue from the sale of these services or products. The aim of these entities is to deliver vital services while achieving a commercial rate of return for the Government.
The returns to Government are used to pay for important community services such as hospitals, education and concession payments. In some cases, part of a PNFC entity’s revenue may arise from community service obligation (CSO) payments from the Government. These payments are used to subsidise a service or commodity provided by the entity, and allow it to be provided to the community at a lower price than it would be on a purely commercial basis. A key example of this is the CSO paid to Energy Queensland Limited to provide electricity in regional Queensland at prices based on the costs of supply in South East Queensland (SEQ), in accordance with the Government’s Uniform Tariff Policy. This ensures that electricity prices in regional Queensland are much lower than would otherwise be the case.
108
Budget Strategy and Outlook 2018-19
| 8.1.1 | Electricity Networks |
The Government owns two electricity network businesses that are responsible for transporting safe and reliable electricity to consumers across the State – Powerlink and Energy Queensland Limited (EQL).
Powerlink
Powerlink is a high-voltage transmission network business that transports electricity long distances from generation plants to the distribution networks and connects Queensland to other states. The electricity is transmitted at high voltages so that large volumes can travel efficiently over long distances.
To ensure mandated reliability levels are maintained as demand grows, Powerlink is obligated to plan and develop the network. Powerlink’s external environment has changed significantly in recent years with changes in consumer demand, market and regulatory changes, increasing complexity within the electricity market and the emergence of renewable energies and other technologies.
Energy Queensland Limited
On 30 June 2016, Energex and Ergon Energy were merged under the parent company, EQL. EQL owns and operates the low-voltage distribution network that transports electricity from Powerlink’s transmission network and distributes it to households and businesses across Queensland. Ergon Energy Network provides the distribution network in regional Queensland and Ergon Energy Retail offers its customers retail services in regional Queensland. Energex provides distribution network services to customers within SEQ.
EQL, through its subsidiary Yurika, is also involved in a range of other service delivery functions including demand management services, large-scale connections, microgrid solutions, the provision of contestable metering services and telecommunications infrastructure. Yurika is focussed on pursuing strategic investments in unregulated markets to provide greater choice to customers and provide EQL an enhanced ability to respond to emerging trends.
When the Government announced the merger of Energex and Ergon Energy under EQL, it was estimated that through the merger and other efficiencies, savings of $562 million were to be generated over five years. These savings will deliver benefits to both Government and electricity consumers, through improved returns from the business, and by putting downward pressure on electricity prices. EQL is on track to reach the savings target by 2019-20.
Network Revenues
Revenues for the network businesses are largely derived from network services that are regulated by the Australian Energy Regulator (AER). The AER determines these revenues on a five-yearly basis, based on the businesses’ proposals and its view of the reasonable benchmark efficient costs for a network business.
109
Budget Strategy and Outlook 2018-19
The AER published Powerlink’s revenue determination in April 2017 for the 2017-22 regulatory control period, which resulted in a significant reduction in allowable revenues for the business. On 31 October 2017, the Energex and Ergon Energy network businesses formally submitted to the AER a request to develop a replacement framework and approach to apply for the next regulatory control period 2020-25. EQL will continue to consult and develop its regulatory proposals over 2018 and 2019 for submission to the AER.
| 8.1.2 | Electricity Generation |
The National Electricity Market (NEM) continues to experience significant change. The Government has and will continue to act to ensure wholesale prices in Queensland remain affordable for customers.
The Powering Queensland Plan includes a number of measures to put downward pressure on wholesale prices, including returning Swanbank E to service, directing Stanwell to alter its bidding strategies, and investigating the establishment of a clean energy generator to boost competition.
Queensland has already seen the benefits of these initiatives, with forward wholesale prices in Queensland remaining the lowest in the NEM and Queensland having the lowest wholesale market spot prices over the recent summer despite record peak demand being exceeded.
CS Energy
CS Energy is a merchant electricity generator that sells electricity in the NEM under the Electricity Act 1994. CS Energy has more than 400 employees, operates three power stations and has a trading portfolio of 4,035MW. CS Energy dispatches over 30 per cent of Queensland’s electricity and slightly over 10 per cent of all electricity supplied to the NEM.
CS Energy’s diverse asset portfolio comprises coal-fired and hydroelectric power stations, electricity trading rights and coal assets. CS Energy owns and operates the Callide B, Kogan Creek and Wivenhoe power stations, and has a 50 per cent interest in the Callide C Power Station, where it provides operations and maintenance services. CS Energy is also a party to the Gladstone Interconnection and Power Pooling Agreement, which entitles it to trade the output of the Gladstone Power Station that exceeds the requirements of the Boyne Island aluminium smelter.
CS Energy’s joint venture with Alinta Energy continues to provide SEQ customers with discounted usage charges. As at early June 2018, almost 180,000 customers have signed up with Alinta Energy. The joint venture has successfully boosted competition in SEQ with many other retailers responding with lower electricity prices.
Stanwell
Stanwell is one of Australia’s largest energy providers, with a diversified portfolio of coal, gas and hydro assets totalling 4,000MW of installed capacity. It employs over 800 staff across Queensland. Stanwell dispatches over 30 per cent of Queensland’s electricity and slightly over 10 per cent of all electricity supplied to the NEM.
110
Budget Strategy and Outlook 2018-19
| Box 8.1 | Clean Energy Leader |
Queensland is in a strong position to deliver reliable, affordable energy with the right mix of baseload and renewable generation capacity. The Government is committed to reaching the 50 per cent Queensland Renewable Energy Target (QRET) by 2030 and providing a two-year cap on electricity price rises to average inflation.
Under its Powering Queensland Plan (PQP), the Government continues to ensure affordable, secure and sustainable energy supply for Queensland homes, businesses and industry. This includes continuing to remove the costs of the Solar Bonus Scheme from customer bills over 2018-19 and 2019-20.
As part of the PQP, the Government committed to investigate the creation of a clean energy generation government-owned corporation (CleanCo). CleanCo will assist in meeting the QRET by 2030, increase competition and help to put downward pressure on wholesale electricity prices, delivering benefits to customers. During 2017-18, the Government established a taskforce to investigate the establishment of CleanCo and will continue to investigate and engage with stakeholders across 2018-19 to deliver on its commitment.
As part of the 2017-18 State Budget, the Government announced the reinvestment of $100 million towards the Burdekin Falls Hydro Power Station and $150 million towards the North Queensland Clean Energy Hub, subject to feasibility investigations. Work continues to progress on these projects to ensure the best possible outcome for Queenslanders.
During 2017-18, the Queensland Government announced the $2 billion Affordable Energy Plan. The Affordable Energy Plan includes a $50 annual Asset Ownership Dividend to provide bill relief for households over 2017-18 and 2018-19. The initiative has been made possible due to Queensland’s ownership of its electricity assets, enabling the Government to reinvest GOC dividends in a concerted effort to improve affordability. The Affordable Energy Plan also provides benefits to large customers. Initiatives such as the Large Customer Assistance Program and the Energy Savers Plus Program Extension look to assist large customers with increasing energy efficiency and electricity savings.
Queensland has experienced significant growth in the renewable energy sector over the previous two years. Queensland has many large-scale renewable projects under construction, forming part of the $4.2 billion worth of committed projects set to deliver approximately 2,200MW of generation capacity by the end of 2019. These works will generate over 3,500 construction jobs, and put Queensland on track to achieve its 50 per cent renewable energy target by 2030.
The Government is also running the Renewables 400 reverse auction to facilitate the next wave of up to 400MW of diversified renewable energy, including up to 100MW of energy storage.
The Queensland Government will spend $97 million over three years to install solar and energy efficiency measures in approximately 800 state schools. The Advancing Clean Energy Schools (ACES) program will help Queensland schools cut their combined power bill by up to 20 per cent and save an estimated $10.2 million per year. The ACES program will also boost Queensland’s progress towards the 50 per cent renewables target by 2030.
111
Budget Strategy and Outlook 2018-19
Queensland Rail is an integrated, publicly-owned rail operator, responsible for the delivery of passenger transport in SEQ, long distance passenger services in rural and regional Queensland and provision of third party access to networks for freight transport across the state.
The majority of Queensland Rail’s services are delivered under a Rail Transport Services Contract (TSC) between the Government, represented by the Department of Transport and Main Roads, and Queensland Rail. The Rail TSC provides funding for rail infrastructure, Citytrain (SEQ passenger services) and Traveltrain (regional passenger services).
In 2018-19, Queensland Rail is implementing a number of rail projects which will improve the capacity and efficiency of the network, including the New Generation Rollingstock project, North Coast Line Capacity Improvement project and European Train Control System (ETCS) – Inner City.
The New Generation Rollingstock project will see a significant increase to the SEQ train fleet to meet growing demand for rail services. ETCS – Inner City is a rail signalling and train protection system which will boost the capacity and safety of the inner-city rail network.
Queensland has a large network of ports along its coastline, ranging from small installations serving local communities to large, world class multi-user and multi-cargo ports, which have public and privately-owned import and export facilities. Apart from the Port of Brisbane, the port authorities responsible for all of Queensland’s ports are owned and run by GOCs. Queensland’s ports are a major component of the State’s supply chain networks and economy, and their efficient and profitable operation is essential for continued economic growth, job creation, and sustainable development in the State.
The port sector’s financial performance is influenced by the condition of the Queensland economy, particularly in terms of demand abroad for Queensland’s natural resources and agricultural products. Queensland ports continue to look to further enhance supply chain efficiency and identify new markets to improve financial outcomes and stimulate the economy.
Key projects that will be progressed in 2018-19 include:
| • | | progressing approvals for the Cairns Shipping Development Project |
| • | | progressing the detailed business case and seeking approvals to commence works on the Clinton Vessel Interaction Project |
| • | | progressing the final Gladstone Port Master Plan and overlay documentation |
| • | | progressing works for the Channel Capacity Upgrade project at the Port of Townsville. |
112
Budget Strategy and Outlook 2018-19
The two largest entities in the Queensland bulk water market are the Queensland Bulk Water Supply Authority (trading as Seqwater) and SunWater Limited (SunWater).
Seqwater
Seqwater is responsible for supplying safe, secure and reliable bulk drinking water for people across SEQ. Its assets and operations spread across a large geographic area from the New South Wales border, to the base of the Toowoomba ranges and as far north as Gympie. Seqwater provides essential flood mitigation services, and manages seven water supply schemes which provide irrigation services.
Seqwater’s revenue primarily comes from bulk water sales, with prices determined by the SEQ bulk water price path. In 2008, a 20-year bulk water price path was developed to phase in affordable price increases to fund the construction of the SEQ Water Grid and transition all Local Government Areas in SEQ to a ‘common price’. During the first 10-years of the price path it was anticipated that bulk water prices would not recover the costs of bulk water supply, which resulted in Seqwater selling bulk water at a loss, with the shortfall funded by borrowings (the resulting debt is known as ‘price path debt’). The following 10-years of the price path will see this debt repaid.
Most Local Government Areas in SEQ reached the common price in 2017-18, with the remaining Local Government Areas of Noosa, the Sunshine Coast, and Redland City to reach the common price by 2020-21.
The Queensland Competition Authority has conducted a Bulk Water Price Review to recommend urban bulk water prices for SEQ to apply from 1 July 2018. The final report was delivered to Government in March 2018.
Seqwater has maintained a positive operating position since the merger with the SEQ Water Grid Manager, LinkWater and the former Seqwater on 1 January 2013. Seqwater continues to set improved operational and capital efficiency targets to deliver value for money for customers.
SunWater
SunWater is the Government’s major bulk water supply business for all regions outside of SEQ. It supplies untreated bulk water to approximately 5,000 customers across the industrial, mining, urban and irrigation customer segments. SunWater provides this through an extensive regional asset base, owning and managing water infrastructure assets with a replacement value of around $13 billion.
Dam safety is a major focus for SunWater as it is for all bulk water suppliers. SunWater commenced a prioritised Dam Safety Improvement Program (DSIP) in 2005 to ensure that dam safety is maintained. The DSIP is regularly reviewed to ensure highest priority projects are addressed first.
113
Budget Strategy and Outlook 2018-19
The DSIP is an essential program to ensure the safety and stability of dams and the ongoing safety of downstream communities, and SunWater must undertake dam safety work to meet its obligations under Queensland dam safety regulations. However, it is also likely to significantly influence SunWater’s financial performance and net flows to the Government over the forward estimates period and beyond.
Key projects that will be progressed in 2018-19 include:
| • | | Fairbairn Dam spillway improvements and rectification works |
| • | | progressing works for the Teemburra Dam safety improvement project |
| • | | strengthening the monoliths ‘D’ and ‘K’ within the primary spillway of Paradise Dam and undertaking secondary spillway improvements |
| • | | progressing works for the Leslie Dam safety improvement project. |
The Rookwood Weir project presents an opportunity to supplement urban water supplies and enhance agricultural and industrial development in the Fitzroy Basin and Gladstone region. The weir could add 76,000 megalitres of water for agricultural production along the Fitzroy River, as well as an eventual back-up supply for Gladstone, Rockhampton and Livingstone Shire. The project is also expected to create 100 jobs in regional Queensland during construction.
Significant steps have been taken through the year toward the construction of Rookwood Weir. During 2017-18, Building Queensland publicly released the detailed business case and Queensland welcomed the Australian Government’s matching commitment to fund half of the construction costs amounting to $176 million.
The State has allocated matching funding across the next four years. This means that the capital costs of $352 million for the project are fully funded.
It is expected that SunWater will be constructing and operating the weir and preparatory activities are already underway.
The Queensland Government continues to engage with the Australian Government to formalise the details of the arrangement and to agree an appropriate split of operational costs for the Rookwood Weir so that construction can begin.
114
Budget Strategy and Outlook 2018-19
| 8.2 | Finances and Performance |
| 8.2.1 | Earnings Before Interest and Tax |
Total forecast PNFC Sector earnings before interest and tax (EBIT) for 2017-18 are estimated to be $4.476 billion, up from $4.053 billion forecast at the time of the 2017-18 State Budget. This increase is primarily due to increases in the electricity network and electricity generation sectors, driven in part by favourable wholesale energy market conditions, higher than budgeted regulated revenue collections, and operational business and procurement savings.
Over the forward estimates, total PNFC Sector EBIT is expected to decrease to $3.621 billion in 2021-22. Relative to 2016-17, EBIT in the energy sector (networks and generation) is estimated to fall by almost 30 per cent by 2018-19 and 38 per cent by 2021-22.
The decrease in electricity generation EBIT over the forward estimates is primarily driven by forecast reductions in wholesale generation revenues as new renewable entrants enter the wholesale market, adding increased competition.
Electricity network EBIT drops from $2.331 billion in 2017-18 to $1.899 billion in 2018-19 in line with a declining forecast of regulated revenue collections. Similarly, movement in electricity network EBIT over the forward estimates is influenced by forecasts of regulated revenue collections for the network businesses.
Water sector EBIT is expected to reach $573 million in 2019-20, largely reflecting the upwards trend associated with the SEQ bulk water price path. Water sector EBIT is revised downwards from 2020-21 in recognition of the increased spend by SunWater associated with dam safety upgrades.
Port sector EBIT is expected to trend steadily upwards over the forward estimates, driven by increased activity and forecast increased tonnage volumes.
| Table 8.1 | Earnings before interest and tax1 |
| | | | | | | | | | | | | | | | | | | | | | | | | | | | |
| | | 2016-17
Actual
$ million | | | 2017-18
Budget
$ million | | | 2017-18
Est. Act.
$ million | | | 2018-19
Budget
$ million | | | 2019-20
Projection
$ million | | | 2020-21
Projection
$ million | | | 2021-22
Projection
$ million | |
Electricity Networks | | | 2,888 | | | | 2,064 | | | | 2,331 | | | | 1,899 | | | | 1,914 | | | | 1,937 | | | | 1,965 | |
Electricity Generation | | | 1,241 | | | | 1,070 | | | | 1,230 | | | | 1,009 | | | | 804 | | | | 695 | | | | 598 | |
Rail | | | 328 | | | | 291 | | | | 304 | | | | 325 | | | | 326 | | | | 365 | | | | 389 | |
Ports | | | 206 | | | | 188 | | | | 178 | | | | 203 | | | | 248 | | | | 251 | | | | 266 | |
Water | | | 470 | | | | 438 | | | | 477 | | | | 556 | | | | 573 | | | | 540 | | | | 414 | |
Other | | | 36 | | | | 1 | | | | (44 | ) | | | (16 | ) | | | (10 | ) | | | (11 | ) | | | (10 | ) |
Total PNFC Sector | | | 5,169 | | | | 4,053 | | | | 4,476 | | | | 3,976 | | | | 3,855 | | | | 3,777 | | | | 3,621 | |
Note:
| 1. | Numbers may not add due to rounding and bracketed numbers represent negative amounts. |
115
Budget Strategy and Outlook 2018-19
Entities in the PNFC Sector utilise debt financing as a source of funds for asset renewal and capital investments, and to maintain an optimum capital structure.
PNFC Sector entities are required to take a prudent and sound approach to the management of debt, including the establishment of borrowing arrangements which are appropriate to the business risk of the organisation. These arrangements take into account the appropriateness of the proposed capital expenditure program, together with the implications of the borrowings for key financial and performance related indicators.
Total forecast PNFC Sector borrowings for 2017-18 are estimated to be $38.135 billion. Forecast borrowings are expected to increase to $40.802 billion by 2021-22. The increase in borrowings over the forward estimates is primarily driven by the rail and electricity network businesses.
Electricity network borrowings are forecast to increase over the forward estimates in line with growth in the regulated asset base. Rail sector borrowings are expected to increase in line with the Queensland Rail capital program.
Port sector borrowings are forecast to steadily increase over the forward estimates to fund new capital works and infrastructure projects, primarily at the Port of Townsville.
Borrowings in the water sector are largely attributable to Seqwater, which holds around $9.4 billion of debt. The debt balance is the result of the large investment in water infrastructure in response to the Millennium Drought and the associated price path. Seqwater’s forecast borrowings are stable across the forward estimates.
The gearing levels of all GOCs continue to be monitored to ensure that they maintain metrics that are at a minimum consistent with an investment grade credit rating.
| | | | | | | | | | | | | | | | | | | | | | | | | | | | |
| | | 2016-17
Actual
$ million | | | 2017-18
Budget
$ million | | | 2017-18
Est. Act.
$ million | | | 2018-19
Budget
$ million | | | 2019-20
Projection
$ million | | | 2020-21
Projection
$ million | | | 2021-22
Projection
$ million | |
Electricity Networks | | | 21,702 | | | | 21,689 | | | | 21,702 | | | | 22,252 | | | | 22,722 | | | | 23,215 | | | | 23,738 | |
Electricity Generation | | | 2,593 | | | | 1,580 | | | | 1,864 | | | | 1,602 | | | | 1,588 | | | | 1,585 | | | | 1,585 | |
Rail | | | 3,310 | | | | 4,061 | | | | 3,498 | | | | 3,617 | | | | 3,902 | | | | 4,200 | | | | 4,439 | |
Ports | | | 1,054 | | | | 997 | | | | 1,064 | | | | 1,086 | | | | 1,142 | | | | 1,175 | | | | 1,198 | |
Water | | | 9,955 | | | | 9,846 | | | | 9,992 | | | | 10,005 | | | | 10,017 | | | | 10,014 | | | | 9,878 | |
Other2 | | | 29 | | | | 57 | | | | 14 | | | | (2 | ) | | | (18 | ) | | | (27 | ) | | | (36 | ) |
Total PNFC Sector | | | 38,644 | | | | 38,231 | | | | 38,135 | | | | 38,560 | | | | 39,353 | | | | 40,162 | | | | 40,802 | |
Notes:
| 1. | Numbers may not add due to rounding and bracketed numbers represent negative amounts. |
| 2. | Includes derivative adjustments for the energy GOC’s. |
116
Budget Strategy and Outlook 2018-19
| 8.2.3 | Returns to Government |
PNFC Sector entities provide returns to Government by way of dividends and current tax equivalent payments.
Dividends
A GOC’s dividend policy is agreed with shareholding Ministers as part of the Statement of Corporate Intent for the relevant period. A Statement of Corporate Intent represents a performance contract between the shareholding Ministers and a GOC board, with the board being accountable to shareholding Ministers for meeting financial and non-financial performance targets and delivering on the outcomes detailed in the Statement of Corporate Intent.
When establishing the dividend policy for the period, a GOC board is expected to ensure it takes into account the return shareholders expect on their investments and the levels of equity required to maintain a preferred capital structure. The final dividend payment is determined in accordance with the GOC Act.
Total forecast PNFC Sector dividends for 2017-18 are estimated to be $1.819 billion, up from the $1.395 billion forecast in the 2017-18 State Budget. This increase in dividends has been driven by increased earnings from the electricity generation and electricity network businesses, which have benefited from favourable wholesale energy market conditions, higher than budgeted regulated revenue collections, and operational business and procurement savings. However, this is a temporary boost.
Importantly, the Government intends to use GOC dividend returns to help fund the $50 annual Asset Ownership Dividend which provides electricity bill relief for households over 2017-18 and 2018-19. The Asset Ownership Dividend forms part of the $2 billion Affordable Energy Plan which includes various initiatives aimed at making energy more affordable for households and businesses.
Lower profits from the GOC sector across the forward estimates are translating into much lower dividends. Relative to 2017-18, dividends are estimated to fall by 21 per cent by 2018-19 and by almost 40 per cent by 2021-22, with PNFC sector dividends projected to decrease to $1.108 billion in 2021-22. This reduction is being driven by the electricity sector, with electricity dividends halving across the forward estimates.
Electricity network dividends are expected to drop from $948 million in 2017-18 to $618 million in 2018-19, and are forecast to continue to decline over the forward estimates. Movements in electricity network dividends are influenced by forecasts of regulated revenue collections for the network businesses.
It is highlighted that the Government directed Energex and Ergon Energy to not appeal the Australian Energy Regulator’s (AER) determination in 2015. In the absence of this decision, the returns from the network sector would have been higher, resulting in a higher dividend baseline.
Electricity generation dividends are expected to decline over the forward estimates in line with the reduction in generation earnings as renewable generation alternatives enter the market.
117
Budget Strategy and Outlook 2018-19
The decline in water sector dividends in 2020-21 and 2021-22 reflects the increased costs associated with dam safety upgrades.
| | | | | | | | | | | | | | | | | | | | | | | | | | | | |
| | | 2016-17
Actual
$ million | | | 2017-18
Budget
$ million | | | 2017-18
Est. Act.
$ million | | | 2018-19
Budget
$ million | | | 2019-20
Projection
$ million | | | 2020-21
Projection
$ million | | | 2021-22
Projection
$ million | |
Electricity Networks | | | 1,083 | | | | 716 | | | | 948 | | | | 618 | | | | 554 | | | | 507 | | | | 471 | |
Electricity Generation | | | 383 | | | | 463 | | | | 645 | | | | 535 | | | | 457 | | | | 387 | | | | 320 | |
Rail | | | 101 | | | | 92 | | | | 100 | | | | 134 | | | | 150 | | | | 162 | | | | 176 | |
Ports | | | 72 | | | | 86 | | | | 80 | | | | 94 | | | | 126 | | | | 127 | | | | 136 | |
Water | | | 8 | | | | 28 | | | | 36 | | | | 55 | | | | 36 | | | | 5 | | | | 5 | |
Other | | | — | | | | 10 | | | | 10 | | | | — | | | | — | | | | — | | | | — | |
Total PNFC Sector | | | 1,647 | | | | 1,395 | | | | 1,819 | | | | 1,435 | | | | 1,323 | | | | 1,188 | | | | 1,108 | |
Note:
| 1. | Numbers may not add due to rounding. |
Tax Equivalent Payments
Tax equivalent payments (TEPs) are paid by the PNFC Sector entities to recognise the benefits derived from not being liable to pay Australian Government tax. The primary objective of the payment is to promote competitive neutrality, through a uniform application of income tax laws between the government-owned entities and their privately held counterparts.
Total forecast PNFC Sector TEPs for 2017-18 are estimated to be $770 million, up from the projected $572 million in the 2017-18 State Budget. This is largely driven by the increased profitability experienced by the electricity generation and electricity network sectors.
As TEPs generally move in line with earnings, TEPs are forecast to decrease from $770 million in 2017-18 to $499 million in 2021-22.
118
Budget Strategy and Outlook 2018-19
| Table 8.4 | Tax equivalent payments1 |
| | | | | | | | | | | | | | | | | | | | | | | | | | | | |
| | | 2016-17
Actual
$ million | | | 2017-18
Budget
$ million | | | 2017-18
Est. Act.
$ million | | | 2018-19
Budget
$ million | | | 2019-20
Projection
$ million | | | 2020-21
Projection
$ million | | | 2021-22
Projection
$ million | |
Electricity Networks | | | 556 | | | | 324 | | | | 417 | | | | 290 | | | | 265 | | | | 244 | | | | 229 | |
Electricity Generation | | | 190 | | | | 154 | | | | 249 | | | | 236 | | | | 234 | | | | 215 | | | | 164 | |
Rail | | | 29 | | | | 39 | | | | 44 | | | | 47 | | | | 37 | | | | 32 | | | | 29 | |
Ports | | | 47 | | | | 37 | | | | 41 | | | | 51 | | | | 66 | | | | 66 | | | | 69 | |
Water | | | 19 | | | | 11 | | | | 13 | | | | 3 | | | | 18 | | | | 2 | | | | 3 | |
Other | | | 3 | | | | 7 | | | | 5 | | | | 5 | | | | 5 | | | | 5 | | | | 5 | |
Total PNFC Sector | | | 844 | | | | 572 | | | | 770 | | | | 630 | | | | 626 | | | | 564 | | | | 499 | |
Note:
| 1. | Numbers may not add due to rounding. |
Competitive Neutrality Fees
In accordance with the National Competition Policy principles, GOCs are expected to operate on the basis that they do not experience significant advantages or disadvantages by virtue of their Government ownership. One of the most significant advantages available to GOCs is the ability to borrow funds at a lower rate than private sector competitors on the basis of the State Government’s credit strength.
In order to account for this advantage, the Competition Principles Agreement requires a notional charge to be applied to a GOC’s cost of debt. A competitive neutrality fee (CNF) is thus applied to all borrowings and financial arrangements in the nature of debt obligations. In general, changes in CNF payments reflect movements in borrowing amounts, interest rate spreads and the entity’s stand-alone credit rating.
Total forecast PNFC Sector CNF payments for 2017-18 are estimated to be $139 million, $11 million higher than the $128 million forecast in the 2017-18 State Budget. CNF payments are forecast to increase from $139 million in 2017-18 to $206 million in 2021-22.
119
Budget Strategy and Outlook 2018-19
| Table 8.5 | Competitive neutrality fee payments1 |
| | | | | | | | | | | | | | | | | | | | | | | | | | | | |
| | | 2016-17
Actual
$ million | | | 2017-18
Budget
$ million | | | 2017-18
Est. Act.
$ million | | | 2018-19
Budget
$ million | | | 2019-20
Projection
$ million | | | 2020-21
Projection
$ million | | | 2021-22
Projection
$ million | |
Electricity Networks | | | 48 | | | | 59 | | | | 69 | | | | 84 | | | | 102 | | | | 122 | | | | 141 | |
Electricity Generation | | | 21 | | | | 22 | | | | 20 | | | | 17 | | | | 15 | | | | 16 | | | | 16 | |
Rail | | | 33 | | | | 32 | | | | 34 | | | | 32 | | | | 33 | | | | 34 | | | | 35 | |
Ports | | | 9 | | | | 11 | | | | 12 | | | | 11 | | | | 11 | | | | 11 | | | | 11 | |
Water | | | 4 | | | | 5 | | | | 5 | | | | 5 | | | | 5 | | | | 5 | | | | 5 | |
Total PNFC Sector | | | 115 | | | | 128 | | | | 139 | | | | 150 | | | | 166 | | | | 187 | | | | 206 | |
Note:
| 1. | Numbers may not add due to rounding. |
| 8.2.4 | Community Service Obligation and Rail Transport Services Contract Payments |
The Government sometimes directs or requires its businesses to perform activities that are not in the entity’s commercial interest (for example, offering services at a reduced price to benefit the community). In these situations, the Government will often provide a Community Service Obligation (CSO) payment to the entity for the cost of delivering the service.
Transport Services Contract (TSC) payments are made to Queensland Rail to provide rail passenger services at non-commercial (subsidised) prices for the commuter and tourism markets.
In line with the Queensland Government’s Uniform Tariff Policy, a CSO payment is provided to Energy Queensland Limited to compensate the retail subsidiary for the increased costs of operating in regional Queensland. This subsidy is provided to ensure that Queenslanders, regardless of their geographic location, pay a similar price for their electricity.
Seqwater and SunWater own and operate water supply schemes, where irrigation prices for some schemes are set below the level necessary to recover the cost of supplying water to irrigators. The Government provides a CSO to offset the reduced revenue and to ensure that increases in water prices paid by rural irrigation customers to recover costs are gradual.
Total forecast PNFC Sector CSO and TSC payments for 2017-18 are estimated to be $2.142 billion, slightly lower than the $2.209 billion forecast at the time of the 2017-18 State Budget.
In 2018-19, it is estimated that the Government will provide CSO and TSC payments to PNFC Sector entities of $2.270 billion. This is forecast to increase to $2.501 billion in 2021-22, largely driven by the TSC. The increase in the TSC is due to a mix of factors such as changes in patronage, escalation of service delivery costs and forecast growth in services.
The CSO for the water sector will be determined from 2019-20, following the Queensland Competition Authority’s review of irrigation prices.
120
Budget Strategy and Outlook 2018-19
| Table 8.6 | Community service obligation payments and Transport Services Contracts1 |
| | | | | | | | | | | | | | | | | | | | | | | | | | | | |
| | | 2016-17
Actual
$ million | | | 2017-18
Budget
$ million | | | 2017-18
Est. Act.
$ million | | | 2018-19
Budget
$ million | | | 2019-20
Projection
$ million | | | 2020-21
Projection
$ million | | | 2021-22
Projection
$ million | |
Electricity Networks | | | 603 | | | | 488 | | | | 488 | | | | 462 | | | | 498 | | | | 493 | | | | 515 | |
Rail | | | 1,576 | | | | 1,710 | | | | 1,643 | | | | 1,797 | | | | 1,822 | | | | 1,903 | | | | 1,985 | |
Water | | | 13 | | | | 11 | | | | 11 | | | | 11 | | | | — | | | | — | | | | — | |
Total PNFC Sector | | | 2,191 | | | | 2,209 | | | | 2,142 | | | | 2,270 | | | | 2,320 | | | | 2,397 | | | | 2,501 | |
Note:
| 1. | Numbers may not add due to rounding. |
Net flows represent the net value of flows to and from the PNFC Sector. This includes the positive effect of dividends and tax equivalent payments less the negative effect of CSO and TSC payments.
In contrast to the forecast in the 2017-18 State Budget, net flows to Government are expected to be positive in 2017-18, driven by upwards revisions in dividends and TEPs, particularly in the electricity sector (networks and generation).
Net flows are expected to be negative over the forward estimates. Key contributors to the deteriorating net flow position include the increasing TSC payment and declining dividend projections for the energy generation and electricity network sectors.
| Table 8.7 | Net flows to the General Government Sector from PNFC Sector entities1 |
| | | | | | | | | | | | | | | | | | | | | | | | | | | | |
| | | 2016-17
Actual
$ million | | | 2017-18
Budget
$ million | | | 2017-18
Est. Act.
$ million | | | 2018-19
Budget
$ million | | | 2019-20
Projection
$ million | | | 2020-21
Projection
$ million | | | 2021-22
Projection
$ million | |
Total PNFC Sector | | | 299 | | | | (242 | ) | | | 447 | | | | (204 | ) | | | (371 | ) | | | (644 | ) | | | (894 | ) |
Note:
| 1. | Numbers may not add due to rounding. Bracketed numbers represent a net flow from the General Government Sector to the PNFC Sector. |
121
Budget Strategy and Outlook 2018-19
The levels and weightings of GOC debt and equity are managed by the Government to maintain an optimal and efficient capital structure. Corporations may have different target capital structures for different business entities or to support expected capital programs and projects.
Total forecast PNFC Sector equity movements for 2017-18 are estimated to be an equity reduction of $60 million.
Equity movements across the forward estimates are primarily influenced by the electricity networks sector. These equity movements reflect changes to ensure an efficient level of gearing is maintained for Energy Queensland Limited and Powerlink.
In 2018-19, Port of Townsville will receive an equity injection of $60 million to undertake works associated with the Channel Capacity Upgrade project.
In 2018-19, Queensland Rail will receive an equity injection of $460 million in relation to the Moreton Bay Rail Link project, which was constructed by the Department of Transport and Main Roads but will be transferred to Queensland Rail as the rail operator.
In 2019-20, SunWater will receive an equity injection of $100 million to undertake essential dam safety upgrades at Burdekin Falls Dam, and to develop a detailed business case for improvement, to ensure the dam continues to meet current best practice standards.
| Table 8.8 | Equity movements1 |
| | | | | | | | | | | | | | | | | | | | | | | | | | | | |
| | | 2016-17
Actual
$ million | | | 2017-18
Budget
$ million | | | 2017-18
Est. Act.
$ million | | | 2018-19
Budget
$ million | | | 2019-20
Projection
$ million | | | 2020-21
Projection
$ million | | | 2021-22
Projection
$ million | |
Electricity Networks | | | (160 | ) | | | (20 | ) | | | (50 | ) | | | (110 | ) | | | (190 | ) | | | (545 | ) | | | (510 | ) |
Electricity Generation | | | — | | | | — | | | | — | | | | — | | | | — | | | | — | | | | — | |
Rail | | | — | | | | 18 | | | | (5 | ) | | | 460 | | | | — | | | | — | | | | — | |
Ports | | | (110 | ) | | | — | | | | — | | | | 60 | | | | — | | | | — | | | | — | |
Water | | | — | | | | — | | | | (5 | ) | | | (4 | ) | | | 100 | | | | — | | | | — | |
Other | | | 10 | | | | — | | | | — | | | | — | | | | — | | | | — | | | | — | |
Total PNFC Sector | | | (260 | ) | | | (1 | ) | | | (60 | ) | | | 406 | | | | (90 | ) | | | (545 | ) | | | (510 | ) |
Note:
| 1. | Numbers may not add due to rounding. Bracketed numbers represent equity returns from the PNFC Sector to the General Government Sector. |
122
Budget Strategy and Outlook 2018-19
| 9 | Uniform Presentation Framework |
This chapter contains detailed financial statements for the Queensland Public Sector prepared under the Uniform Presentation Framework (UPF) of reporting as required under the Australian Loan Council arrangements.
The UPF was reviewed following the release in October 2007 of the Australian Accounting Standards Board’s (AASB) accounting standard, AASB 1049 Whole of Government and General Government Sector Financial Reporting. The standard aims to harmonise Government Finance Statistics (GFS) and Generally Accepted Accounting Principles (GAAP) with the objective of improving the clarity and transparency of government financial statements.
In addition, the chapter provides:
| • | | a reconciliation of the General Government Sector net operating balance to the accounting operating result |
| • | | a time series for the General Government Sector using the revised UPF |
| • | | details of General Government Sector grant revenue and expenses |
| • | | details of General Government Sector dividend and income tax equivalent income |
| • | | data on General Government Sector expenses and purchases of non-financial assets by function |
| • | | details of taxation revenue collected by the General Government Sector |
| • | | details of contingent liabilities |
| • | | background information on the revised UPF and disclosure differences arising from it, including the conceptual basis, sector definitions and a list of reporting entities. |
| 9.2 | Uniform Presentation Framework financial information |
The tables on the following pages present operating statements, balance sheets and cash flow statements prepared on a harmonised basis for the General Government, Public Non-financial Corporations (PNFC) and Non-financial Public Sectors.
Under the UPF requirements, budgeted financial information for the Public Financial Corporations sector is not included.
123
Budget Strategy and Outlook 2018-19
| Table 9.1 | General Government Sector Operating Statement1 |
| | | | | | | | | | | | | | | | | | | | | | | | | | | | | | | | |
| | | | | | | 2016-17
Outcome
$ million | | | 2017-18
Budget
$ million | | | 2017-18
Est. Act.
$ million | | | 2018-19
Budget
$ million | | | 2019-20
Projection
$ million | | | 2020-21
Projection
$ million | | | 2021-22
Projection
$ million | |
| | Revenue from Transactions | | | | | | | | | | | | | | | | | | | | | | | | | | | | |
| | Taxation revenue | | | 12,919 | | | | 13,298 | | | | 13,284 | | | | 14,155 | | | | 15,184 | | | | 15,951 | | | | 16,722 | |
| | Grants revenue | | | 27,383 | | | | 27,631 | | | | 28,481 | | | | 27,701 | | | | 28,156 | | | | 29,062 | | | | 30,387 | |
| | Sales of goods and services | | | 5,642 | | | | 6,067 | | | | 5,861 | | | | 5,731 | | | | 5,947 | | | | 6,074 | | | | 6,306 | |
| | Interest income | | | 2,336 | | | | 2,330 | | | | 2,323 | | | | 2,201 | | | | 2,078 | | | | 1,861 | | | | 1,855 | |
| | Dividend and income tax equivalent income | | | 2,690 | | | | 2,057 | | | | 2,686 | | | | 2,217 | | | | 2,075 | | | | 1,910 | | | | 1,787 | |
| | Other revenue | | | 5,222 | | | | 4,487 | | | | 5,623 | | | | 5,733 | | | | 5,395 | | | | 5,083 | | | | 5,212 | |
| | Total Revenue from Transactions | | | 56,194 | | | | 55,869 | | | | 58,259 | | | | 57,738 | | | | 58,835 | | | | 59,939 | | | | 62,269 | |
| | | | | | | | |
Less | | Expenses from Transactions | | | | | | | | | | | | | | | | | | | | | | | | | | | | |
| | Employee expenses | | | 21,258 | | | | 22,420 | | | | 22,838 | | | | 23,807 | | | | 24,645 | | | | 25,541 | | | | 26,466 | |
| | Superannuation expenses | | | | | | | | | | | | | | | | | | | | | | | | | | | | |
| | Superannuation interest cost | | | 514 | | | | 600 | | | | 665 | | | | 667 | | | | 717 | | | | 774 | | | | 778 | |
| | Other superannuation expenses | | | 2,661 | | | | 2,753 | | | | 2,819 | | | | 2,887 | | | | 2,933 | | | | 2,957 | | | | 3,001 | |
| | Other operating expenses | | | 15,582 | | | | 17,037 | | | | 17,382 | | | | 15,774 | | | | 15,119 | | | | 15,291 | | | | 15,745 | |
| | Depreciation and amortisation | | | 3,068 | | | | 3,093 | | | | 3,330 | | | | 3,429 | | | | 3,543 | | | | 3,650 | | | | 3,776 | |
| | Other interest expenses | | | 1,722 | | | | 1,706 | | | | 1,616 | | | | 1,474 | | | | 1,643 | | | | 1,691 | | | | 1,794 | |
| | Grants expenses | | | 8,568 | | | | 8,114 | | | | 8,096 | | | | 9,552 | | | | 10,075 | | | | 9,926 | | | | 10,019 | |
| | Total Expenses from Transactions | | | 53,373 | | | | 55,723 | | | | 56,747 | | | | 57,590 | | | | 58,675 | | | | 59,829 | | | | 61,579 | |
| | | | | | | | |
Equals | | Net Operating Balance | | | 2,821 | | | | 146 | | | | 1,512 | | | | 148 | | | | 160 | | | | 110 | | | | 690 | |
| | | | | | | | |
Plus | | Other economic flows - included in operating result | | | 381 | | | | (75 | ) | | | (91 | ) | | | 85 | | | | 202 | | | | 483 | | | | 398 | |
| | | | | | | | |
Equals | | Operating Result | | | 3,202 | | | | 71 | | | | 1,421 | | | | 233 | | | | 363 | | | | 593 | | | | 1,088 | |
| | | | | | | | |
Plus | | Other economic flows - other movements in equity | | | (176 | ) | | | 3,785 | | | | 3,329 | | | | 2,717 | | | | 2,776 | | | | 1,733 | | | | 1,326 | |
| | | | | | | | |
Equals | | Comprehensive Result - Total Change In Net Worth | | | 3,027 | | | | 3,856 | | | | 4,750 | | | | 2,950 | | | | 3,139 | | | | 2,326 | | | | 2,414 | |
| | | | | | | | |
| | KEY FISCAL AGGREGATES | | | | | | | | | | | | | | | | | | | | | | | | | | | | |
| | | | | | | | |
| | Net Operating Balance | | | 2,821 | | | | 146 | | | | 1,512 | | | | 148 | | | | 160 | | | | 110 | | | | 690 | |
| | | | | | | | |
Less | | Net Acquisition of Non-financial Assets | | | | | | | | | | | | | | | | | | | | | | | | | | | | |
| | Purchases of non-financial assets | | | 4,634 | | | | 5,123 | | | | 4,905 | | | | 5,927 | | | | 7,557 | | | | 7,396 | | | | 7,081 | |
| | Less | | Sales of non-financial assets | | | 389 | | | | 392 | | | | 227 | | | | 345 | | | | 373 | | | | 343 | | | | 165 | |
| | Less | | Depreciation | | | 3,068 | | | | 3,093 | | | | 3,330 | | | | 3,429 | | | | 3,543 | | | | 3,650 | | | | 3,776 | |
| | Plus | | Change in inventories | | | 5 | | | | 73 | | | | 32 | | | | (4 | ) | | | (67 | ) | | | (74 | ) | | | 6 | |
| | Plus | | Other movements in non-financial assets | | | 1,103 | | | | 797 | | | | 735 | | | | 1,032 | | | | 467 | | | | 180 | | | | 180 | |
| | Equals | | Total Net Acquisition of Non-financial Assets | | | 2,285 | | | | 2,508 | | | | 2,115 | | | | 3,181 | | | | 4,042 | | | | 3,510 | | | | 3,326 | |
| | | | | | | | |
Equals | | Fiscal Balance | | | 536 | | | | (2,363 | ) | | | (604 | ) | | | (3,033 | ) | | | (3,881 | ) | | | (3,400 | ) | | | (2,636 | ) |
Note:
| 1. | Numbers may not add due to rounding and bracketed numbers represent negative amounts. |
124
Budget Strategy and Outlook 2018-19
| Table 9.2 | Public Non-financial Corporations Sector Operating Statement1 |
| | | | | | | | | | | | | | | | | | | | | | | | | | | | | | | | |
| | | | | | | 2016-17
Outcome
$ million | | | 2017-18
Budget
$ million | | | 2017-18
Est. Act.
$ million | | | 2018-19
Budget
$ million | | | 2019-20
Projection
$ million | | | 2020-21
Projection
$ million | | | 2021-22
Projection
$ million | |
| | | | | | | | |
| | Revenue from Transactions | | | | | | | | | | | | | | | | | | | | | | | | | | | | |
| | Grants revenue | | | 1,491 | | | | 647 | | | | 610 | | | | 632 | | | | 640 | | | | 636 | | | | 659 | |
| | Sales of goods and services | | | 12,712 | | | | 10,950 | | | | 12,141 | | | | 11,718 | | | | 11,627 | | | | 11,944 | | | | 12,131 | |
| | Interest income | | | 45 | | | | 37 | | | | 63 | | | | 52 | | | | 50 | | | | 58 | | | | 59 | |
| | Dividend and income tax equivalent income | | | 15 | | | | 14 | | | | 13 | | | | 13 | | | | 13 | | | | 13 | | | | 13 | |
| | Other revenue | | | 381 | | | | 300 | | | | 477 | | | | 318 | | | | 298 | | | | 250 | | | | 259 | |
| | Total Revenue from Transactions | | | 14,644 | | | | 11,948 | | | | 13,303 | | | | 12,733 | | | | 12,628 | | | | 12,900 | | | | 13,121 | |
| | | | | | | | |
Less | | Expenses from Transactions | | | | | | | | | | | | | | | | | | | | | | | | | | | | |
| | Employee expenses | | | 1,654 | | | | 1,925 | | | | 1,909 | | | | 1,981 | | | | 2,030 | | | | 2,034 | | | | 2,077 | |
| | Superannuation expenses | | | | | | | | | | | | | | | | | | | | | | | | | | | | |
| | Superannuation interest cost | | | (4 | ) | | | — | | | | — | | | | — | | | | — | | | | — | | | | — | |
| | Other superannuation expenses | | | 241 | | | | 155 | | | | 151 | | | | 164 | | | | 169 | | | | 173 | | | | 177 | |
| | Other operating expenses | | | 4,286 | | | | 3,388 | | | | 4,275 | | | | 4,032 | | | | 3,784 | | | | 3,996 | | | | 4,102 | |
| | Depreciation and amortisation | | | 2,382 | | | | 2,575 | | | | 2,470 | | | | 2,618 | | | | 2,708 | | | | 2,749 | | | | 2,828 | |
| | Other interest expenses | | | 2,030 | | | | 1,952 | | | | 1,881 | | | | 1,908 | | | | 1,988 | | | | 2,078 | | | | 2,155 | |
| | Grants expenses | | | 791 | | | | 21 | | | | 27 | | | | 22 | | | | 22 | | | | 23 | | | | 23 | |
| | Other property expenses | | | 849 | | | | 578 | | | | 773 | | | | 637 | | | | 632 | | | | 571 | | | | 506 | |
| | Total Expenses from Transactions | | | 12,229 | | | | 10,594 | | | | 11,486 | | | | 11,361 | | | | 11,332 | | | | 11,625 | | | | 11,866 | |
| | | | | | | | |
Equals | | Net Operating Balance | | | 2,415 | | | | 1,354 | | | | 1,817 | | | | 1,372 | | | | 1,296 | | | | 1,275 | | | | 1,255 | |
| | | | | | | | |
Plus | | Other economic flows - included in operating result | | | (176 | ) | | | 57 | | | | (58 | ) | | | (29 | ) | | | (52 | ) | | | (144 | ) | | | (289 | ) |
| | | | | | | | |
Equals | | Operating Result | | | 2,239 | | | | 1,412 | | | | 1,759 | | | | 1,343 | | | | 1,244 | | | | 1,131 | | | | 966 | |
| | | | | | | | |
Plus | | Other economic flows - other movements in equity | | | (1,572 | ) | | | 60 | | | | (1,120 | ) | | | (532 | ) | | | (905 | ) | | | (1,211 | ) | | | (1,076 | ) |
| | | | | | | | |
Equals | | Comprehensive Result - Total Change In Net Worth | | | 666 | | | | 1,472 | | | | 639 | | | | 810 | | | | 338 | | | | (80 | ) | | | (110 | ) |
| | | | | | | | |
| | KEY FISCAL AGGREGATES | | | | | | | | | | | | | | | | | | | | | | | | | | | | |
| | | | | | | | |
| | Net Operating Balance | | | 2,415 | | | | 1,354 | | | | 1,817 | | | | 1,372 | | | | 1,296 | | | | 1,275 | | | | 1,255 | |
| | | | | | | | |
Less | | Net Acquisition of Non-financial Assets | | | | | | | | | | | | | | | | | | | | | | | | | | | | |
| | Purchases of non-financial assets | | | 2,708 | | | | 2,866 | | | | 2,751 | | | | 3,130 | | | | 3,229 | | | | 3,126 | | | | 3,097 | |
| | Less | | Sales of non-financial assets | | | 71 | | | | 46 | | | | 46 | | | | 11 | | | | 8 | | | | 8 | | | | 6 | |
| | Less | | Depreciation | | | 2,382 | | | | 2,575 | | | | 2,470 | | | | 2,618 | | | | 2,708 | | | | 2,749 | | | | 2,828 | |
| | Plus | | Change in inventories | | | 4 | | | | 3 | | | | (44 | ) | | | 35 | | | | (0 | ) | | | 4 | | | | 9 | |
| | Plus | | Other movements in non-financial assets | | | 68 | | | | 68 | | | | 73 | | | | 68 | | | | 69 | | | | 70 | | | | 71 | |
| | Equals | | Total Net Acquisition of Non-financial Assets | | | 327 | | | | 316 | | | | 263 | | | | 604 | | | | 582 | | | | 443 | | | | 343 | |
| | | | | | | | |
Equals | | Fiscal Balance | | | 2,088 | | | | 1,038 | | | | 1,554 | | | | 767 | | | | 713 | | | | 832 | | | | 913 | |
Note:
| 1. | Numbers may not add due to rounding and bracketed numbers represent negative amounts. |
125
Budget Strategy and Outlook 2018-19
| Table 9.3 | Non-financial Public Sector Operating Statement1 |
| | | | | | | | | | | | | | | | | | | | | | | | | | | | | | | | | | |
| | | | | | | | | 2016-17
Outcome
$ million | | | 2017-18
Budget
$ million | | | 2017-18
Est. Act.
$ million | | | 2018-19
Budget
$ million | | | 2019-20
Projection
$ million | | | 2020-21
Projection
$ million | | | 2021-22
Projection
$ million | |
| | | | | | | | |
| | Revenue from Transactions | | | | | | | | | | | | | | | | | | | | | | | | | | | | |
| | Taxation revenue | | | 12,685 | | | | 13,062 | | | | 13,040 | | | | 13,892 | | | | 14,902 | | | | 15,645 | | | | 16,394 | |
| | Grants revenue | | | 27,415 | | | | 27,722 | | | | 28,519 | | | | 27,788 | | | | 28,244 | | | | 29,151 | | | | 30,477 | |
| | Sales of goods and services | | | 16,545 | | | | 15,025 | | | | 16,082 | | | | 15,353 | | | | 15,433 | | | | 15,778 | | | | 16,128 | |
| | Interest income | | | 2,381 | | | | 2,367 | | | | 2,342 | | | | 2,219 | | | | 2,099 | | | | 1,893 | | | | 1,887 | |
| | Dividend and income tax equivalent income | | | 215 | | | | 103 | | | | 109 | | | | 164 | | | | 139 | | | | 170 | | | | 193 | |
| | Other revenue | | | 5,598 | | | | 4,786 | | | | 6,098 | | | | 6,051 | | | | 5,693 | | | | 5,333 | | | | 5,471 | |
| | Total Revenue from Transactions | | | 64,840 | | | | 63,066 | | | | 66,192 | | | | 65,467 | | | | 66,510 | | | | 67,970 | | | | 70,550 | |
| | | | | | | | |
Less | | Expenses from Transactions | | | | | | | | | | | | | | | | | | | | | | | | | | | | |
| | Employee expenses | | | 22,809 | | | | 24,249 | | | | 24,655 | | | | 25,688 | | | | 26,571 | | | | 27,469 | | | | 28,434 | |
| | Superannuation expenses | | | | | | | | | | | | | | | | | | | | | | | | | | | | |
| | Superannuation interest cost | | | 510 | | | | 600 | | | | 665 | | | | 667 | | | | 717 | | | | 774 | | | | 778 | |
| | Other superannuation expenses | | | 2,902 | | | | 2,908 | | | | 2,970 | | | | 3,051 | | | | 3,102 | | | | 3,129 | | | | 3,178 | |
| | Other operating expenses | | | 18,042 | | | | 18,428 | | | | 19,728 | | | | 17,703 | | | | 16,755 | | | | 17,040 | | | | 17,530 | |
| | Depreciation and amortisation | | | 5,450 | | | | 5,668 | | | | 5,800 | | | | 6,047 | | | | 6,251 | | | | 6,399 | | | | 6,604 | |
| | Other interest expenses | | | 3,637 | | | | 3,530 | | | | 3,313 | | | | 3,198 | | | | 3,437 | | | | 3,558 | | | | 3,717 | |
| | Grants expenses | | | 7,900 | | | | 7,579 | | | | 7,550 | | | | 9,029 | | | | 9,545 | | | | 9,402 | | | | 9,473 | |
| | Total Expenses from Transactions | | | 61,251 | | | | 62,961 | | | | 64,682 | | | | 65,383 | | | | 66,377 | | | | 67,772 | | | | 69,713 | |
| | | | | | | | |
Equals | | Net Operating Balance | | | 3,589 | | | | 105 | | | | 1,510 | | | | 84 | | | | 133 | | | | 197 | | | | 837 | |
| | | | | | | | |
Plus | | Other economic flows - included in operating result | | | 45 | | | | (37 | ) | | | (199 | ) | | | (54 | ) | | | (39 | ) | | | (207 | ) | | | (401 | ) |
| | | | | | | | |
Equals | | Operating Result | | | 3,634 | | | | 67 | | | | 1,311 | | | | 31 | | | | 93 | | | | (9 | ) | | | 436 | |
| | | | | | | | |
Plus | | Other economic flows - other movements in equity | | | (608 | ) | | | 3,789 | | | | 3,439 | | | | 2,920 | | | | 3,045 | | | | 2,335 | | | | 1,979 | |
| | | | | | | | |
Equals | | Comprehensive Result - Total Change In Net Worth | | | 3,027 | | | | 3,856 | | | | 4,750 | | | | 2,950 | | | | 3,139 | | | | 2,326 | | | | 2,414 | |
| | | | | | | | |
| | KEY FISCAL AGGREGATES | | | | | | | | | | | | | | | | | | | | | | | | | | | | |
| | | | | | | | |
| | Net Operating Balance | | | 3,589 | | | | 105 | | | | 1,510 | | | | 84 | | | | 133 | | | | 197 | | | | 837 | |
| | | | | | | | |
Less | | Net Acquisition of Non-financial Assets | | | | | | | | | | | | | | | | | | | | | | | | | | | | |
| | Purchases of non-financial assets | | | 7,305 | | | | 7,989 | | | | 7,656 | | | | 9,057 | | | | 10,786 | | | | 10,523 | | | | 10,177 | |
| | Less | | | | Sales of non-financial assets | | | 460 | | | | 438 | | | | 273 | | | | 356 | | | | 381 | | | | 351 | | | | 171 | |
| | Less | | | | Depreciation | | | 5,450 | | | | 5,668 | | | | 5,800 | | | | 6,047 | | | | 6,251 | | | | 6,399 | | | | 6,604 | |
| | Plus | | | | Change in inventories | | | 10 | | | | 77 | | | | (12 | ) | | | 31 | | | | (67 | ) | | | (69 | ) | | | 15 | |
| | Plus | | | | Other movements in non-financial assets | | | 1,171 | | | | 865 | | | | 809 | | | | 1,100 | | | | 536 | | | | 251 | | | | 252 | |
| | Equals | | | | Total Net Acquisition of Non-financial Assets | | | 2,576 | | | | 2,825 | | | | 2,379 | | | | 3,785 | | | | 4,624 | | | | 3,953 | | | | 3,668 | |
| | | | | | | | |
Equals | | Fiscal Balance | | | 1,013 | | | | (2,720 | ) | | | (869 | ) | | | (3,701 | ) | | | (4,491 | ) | | | (3,756 | ) | | | (2,831 | ) |
Note:
| 1. | Numbers may not add due to rounding and bracketed numbers represent negative amounts. |
126
Budget Strategy and Outlook 2018-19
| Table 9.4 | General Government Sector Balance Sheet1 |
| | | | | | | | | | | | | | | | | | | | | | | | | | | | |
| | | 2016-17
Outcome
$ million | | | 2017-18
Budget
$ million | | | 2017-18
Est. Act.
$ million | | | 2018-19
Budget
$ million | | | 2019-20
Projection
$ million | | | 2020-21
Projection
$ million | | | 2021-22
Projection
$ million | |
| | | | | | | |
Assets | | | | | | | | | | | | | | | | | | | | | | | | | | | | |
Financial Assets | | | | | | | | | | | | | | | | | | | | | | | | | | | | |
Cash and deposits | | | 1,069 | | | | 548 | | | | 579 | | | | 303 | | | | 285 | | | | 228 | | | | 338 | |
Advances paid | | | 678 | | | | 831 | | | | 630 | | | | 703 | | | | 695 | | | | 751 | | | | 812 | |
Investments, loans and placements | | | 33,633 | | | | 32,301 | | | | 32,655 | | | | 30,306 | | | | 29,078 | | | | 28,957 | | | | 28,817 | |
Receivables | | | 4,926 | | | | 4,190 | | | | 4,523 | | | | 4,182 | | | | 4,218 | | | | 4,480 | | | | 4,375 | |
Equity | | | | | | | | | | | | | | | | | | | | | | | | | | | | |
Investments in other public sector entities | | | 21,866 | | | | 22,787 | | | | 23,002 | | | | 23,812 | | | | 24,151 | | | | 24,071 | | | | 23,961 | |
Investments - other | | | 154 | | | | 156 | | | | 154 | | | | 154 | | | | 154 | | | | 154 | | | | 154 | |
Total Financial Assets | | | 62,327 | | | | 60,814 | | | | 61,544 | | | | 59,460 | | | | 58,581 | | | | 58,642 | | | | 58,458 | |
| | | | | | | |
Non-financial Assets | | | | | | | | | | | | | | | | | | | | | | | | | | | | |
Land and other fixed assets | | | 200,632 | | | | 205,439 | | | | 203,721 | | | | 207,985 | | | | 212,987 | | | | 217,425 | | | | 221,688 | |
Other non-financial assets | | | 6,921 | | | | 6,969 | | | | 7,179 | | | | 6,767 | | | | 6,999 | | | | 7,146 | | | | 7,328 | |
Total Non-financial Assets | | | 207,553 | | | | 212,407 | | | | 210,900 | | | | 214,752 | | | | 219,987 | | | | 224,570 | | | | 229,016 | |
| | | | | | | |
Total Assets | | | 269,879 | | | | 273,222 | | | | 272,443 | | | | 274,212 | | | | 278,568 | | | | 283,213 | | | | 287,474 | |
| | | | | | | |
Liabilities | | | | | | | | | | | | | | | | | | | | | | | | | | | | |
Payables | | | 4,372 | | | | 4,089 | | | | 4,015 | | | | 4,088 | | | | 4,181 | | | | 4,217 | | | | 4,252 | |
Superannuation liability | | | 26,123 | | | | 23,355 | | | | 25,294 | | | | 23,414 | | | | 21,334 | | | | 19,946 | | | | 18,877 | |
Other employee benefits | | | 5,608 | | | | 5,510 | | | | 5,749 | | | | 5,888 | | | | 5,878 | | | | 6,036 | | | | 6,271 | |
Deposits held | | | 3 | | | | 3 | | | | 2 | | | | 2 | | | | 2 | | | | 2 | | | | 2 | |
Advances received | | | 1,831 | | | | 1,541 | | | | 2,229 | | | | 1,814 | | | | 1,531 | | | | 1,365 | | | | 1,382 | |
Borrowing | | | 33,260 | | | | 33,758 | | | | 31,367 | | | | 32,311 | | | | 35,861 | | | | 39,588 | | | | 42,290 | |
Other liabilities | | | 3,747 | | | | 3,044 | | | | 4,100 | | | | 4,059 | | | | 4,005 | | | | 3,957 | | | | 3,883 | |
Total Liabilities | | | 74,943 | | | | 71,299 | | | | 72,757 | | | | 71,575 | | | | 72,793 | | | | 75,112 | | | | 76,958 | |
| | | | | | | |
Net Worth | | | 194,936 | | | | 201,922 | | | | 199,686 | | | | 202,636 | | | | 205,775 | | | | 208,101 | | | | 210,515 | |
| | | | | | | | | | | | | | | | | | | | | | | | | | | | |
Net Financial Worth | | | (12,617 | ) | | | (10,485 | ) | | | (11,213 | ) | | | (12,115 | ) | | | (14,211 | ) | | | (16,470 | ) | | | (18,501 | ) |
Net Financial Liabilities | | | 34,483 | | | | 33,273 | | | | 34,216 | | | | 35,928 | | | | 38,362 | | | | 40,540 | | | | 42,462 | |
Net Debt | | | (287 | ) | | | 1,622 | | | | (267 | ) | | | 2,815 | | | | 7,336 | | | | 11,018 | | | | 13,707 | |
Note:
| 1. | Numbers may not add due to rounding and bracketed numbers represent negative amounts. |
127
Budget Strategy and Outlook 2018-19
| Table 9.5 | Public Non-financial Corporations Sector Balance Sheet1 |
| | | | | | | | | | | | | | | | | | | | | | | | | | | | |
| | | 2016-17
Outcome
$ million | | | 2017-18
Budget
$ million | | | 2017-18
Est. Act.
$ million | | | 2018-19
Budget
$ million | | | 2019-20
Projection
$ million | | | 2020-21
Projection
$ million | | | 2021-22
Projection
$ million | |
| | | | | | | |
Assets | | | | | | | | | | | | | | | | | | | | | | | | | | | | |
Financial Assets | | | | | | | | | | | | | | | | | | | | | | | | | | | | |
Cash and deposits | | | 1,464 | | | | 524 | | | | 698 | | | | 465 | | | | 489 | | | | 593 | | | | 542 | |
Advances paid | | | 1,370 | | | | 1,073 | | | | 1,762 | | | | 1,360 | | | | 1,157 | | | | 1,011 | | | | 1,045 | |
Investments, loans and placements | | | 749 | | | | 395 | | | | 578 | | | | 547 | | | | 507 | | | | 470 | | | | 473 | |
Receivables | | | 1,581 | | | | 1,610 | | | | 1,585 | | | | 1,432 | | | | 1,487 | | | | 1,628 | | | | 1,574 | |
Equity | | | | | | | | | | | | | | | | | | | | | | | | | | | | |
Investments - other | | | 302 | | | | 280 | | | | 240 | | | | 240 | | | | 240 | | | | 240 | | | | 240 | |
Total Financial Assets | | | 5,465 | | | | 3,882 | | | | 4,863 | | | | 4,043 | | | | 3,881 | | | | 3,941 | | | | 3,874 | |
| | | | | | | |
Non-financial Assets | | | | | | | | | | | | | | | | | | | | | | | | | | | | |
Land and other fixed assets | | | 61,138 | | | | 62,730 | | | | 62,132 | | | | 63,882 | | | | 65,133 | | | | 66,181 | | | | 66,975 | |
Other non-financial assets | | | 1,472 | | | | 1,112 | | | | 1,193 | | | | 1,203 | | | | 1,207 | | | | 1,224 | | | | 1,277 | |
Total Non-financial Assets | | | 62,610 | | | | 63,842 | | | | 63,326 | | | | 65,085 | | | | 66,340 | | | | 67,405 | | | | 68,251 | |
| | | | | | | |
Total Assets | | | 68,075 | | | | 67,724 | | | | 68,188 | | | | 69,128 | | | | 70,221 | | | | 71,346 | | | | 72,126 | |
| | | | | | | |
Liabilities | | | | | | | | | | | | | | | | | | | | | | | | | | | | |
Payables | | | 3,411 | | | | 2,809 | | | | 3,366 | | | | 2,890 | | | | 2,690 | | | | 2,942 | | | | 2,963 | |
Superannuation liability | | | (332 | ) | | | (155 | ) | | | (324 | ) | | | (316 | ) | | | (308 | ) | | | (300 | ) | | | (292 | ) |
Other employee benefits | | | 761 | | | | 767 | | | | 752 | | | | 746 | | | | 752 | | | | 757 | | | | 763 | |
Deposits held | | | 17 | | | | 23 | | | | 17 | | | | 17 | | | | 17 | | | | 17 | | | | 17 | |
Advances received | | | 7 | | | | 7 | | | | 7 | | | | 6 | | | | 5 | | | | 5 | | | | 4 | |
Borrowing | | | 38,644 | | | | 38,231 | | | | 38,135 | | | | 38,560 | | | | 39,353 | | | | 40,162 | | | | 40,802 | |
Other liabilities | | | 7,691 | | | | 7,470 | | | | 7,722 | | | | 7,901 | | | | 8,050 | | | | 8,182 | | | | 8,396 | |
Total Liabilities | | | 50,200 | | | | 49,151 | | | | 49,675 | | | | 49,805 | | | | 50,559 | | | | 51,764 | | | | 52,653 | |
| | | | | | | |
Net Worth | | | 17,875 | | | | 18,573 | | | | 18,513 | | | | 19,323 | | | | 19,662 | | | | 19,582 | | | | 19,472 | |
| | | | | | | | | | | | | | | | | | | | | | | | | | | | |
Net Financial Worth | | | (44,735 | ) | | | (45,269 | ) | | | (44,812 | ) | | | (45,761 | ) | | | (46,679 | ) | | | (47,823 | ) | | | (48,779 | ) |
Net Debt | | | 35,087 | | | | 36,268 | | | | 35,121 | | | | 36,212 | | | | 37,222 | | | | 38,111 | | | | 38,763 | |
Note:
| 1. | Numbers may not add due to rounding and bracketed numbers represent negative amounts. |
128
Budget Strategy and Outlook 2018-19
| Table 9.6 | Non-financial Public Sector Balance Sheet1 |
| | | | | | | | | | | | | | | | | | | | | | | | | | | | |
| | | 2016-17
Outcome
$ million | | | 2017-18
Budget
$ million | | | 2017-18
Est. Act.
$ million | | | 2018-19
Budget
$ million | | | 2019-20
Projection
$ million | | | 2020-21
Projection
$ million | | | 2021-22
Projection
$ million | |
| | | | | | | |
Assets | | | | | | | | | | | | | | | | | | | | | | | | | | | | |
Financial Assets | | | | | | | | | | | | | | | | | | | | | | | | | | | | |
Cash and deposits | | | 2,533 | | | | 1,073 | | | | 1,277 | | | | 768 | | | | 774 | | | | 821 | | | | 880 | |
Advances paid | | | 695 | | | | 842 | | | | 616 | | | | 682 | | | | 668 | | | | 725 | | | | 786 | |
Investments, loans and placements | | | 34,382 | | | | 32,696 | | | | 33,234 | | | | 30,852 | | | | 29,586 | | | | 29,427 | | | | 29,290 | |
Receivables | | | 4,597 | | | | 4,005 | | | | 3,949 | | | | 3,808 | | | | 3,952 | | | | 4,177 | | | | 4,207 | |
Equity | | | | | | | | | | | | | | | | | | | | | | | | | | | | |
Investments in other public sector entities | | | 3,993 | | | | 4,216 | | | | 4,490 | | | | 4,490 | | | | 4,490 | | | | 4,490 | | | | 4,490 | |
Investments - other | | | 456 | | | | 436 | | | | 393 | | | | 394 | | | | 394 | | | | 394 | | | | 394 | |
Total Financial Assets | | | 46,655 | | | | 43,267 | | | | 43,959 | | | | 40,994 | | | | 39,863 | | | | 40,033 | | | | 40,048 | |
| | | | | | | |
Non-financial Assets | | | | | | | | | | | | | | | | | | | | | | | | | | | | |
Land and other fixed assets | | | 261,769 | | | | 268,168 | | | | 265,853 | | | | 271,866 | | | | 278,120 | | | | 283,605 | | | | 288,662 | |
Other non-financial assets | | | 1,408 | | | | 1,451 | | | | 1,594 | | | | 1,014 | | | | 1,094 | | | | 1,073 | | | | 1,025 | |
Total Non-financial Assets | | | 263,177 | | | | 269,619 | | | | 267,447 | | | | 272,880 | | | | 279,214 | | | | 284,678 | | | | 289,687 | |
| | | | | | | |
Total Assets | | | 309,832 | | | | 312,885 | | | | 311,406 | | | | 313,874 | | | | 319,077 | | | | 324,711 | | | | 329,735 | |
| | | | | | | |
Liabilities | | | | | | | | | | | | | | | | | | | | | | | | | | | | |
Payables | | | 5,892 | | | | 5,155 | | | | 5,243 | | | | 5,193 | | | | 5,139 | | | | 5,250 | | | | 5,497 | |
Superannuation liability | | | 25,791 | | | | 23,200 | | | | 24,971 | | | | 23,098 | | | | 21,026 | | | | 19,646 | | | | 18,585 | |
Other employee benefits | | | 6,369 | | | | 6,277 | | | | 6,501 | | | | 6,634 | | | | 6,629 | | | | 6,793 | | | | 7,034 | |
Deposits held | | | 20 | | | | 26 | | | | 19 | | | | 19 | | | | 19 | | | | 19 | | | | 19 | |
Advances received | | | 486 | | | | 485 | | | | 460 | | | | 439 | | | | 352 | | | | 333 | | | | 315 | |
Borrowing | | | 71,904 | | | | 71,989 | | | | 69,501 | | | | 70,871 | | | | 75,214 | | | | 79,750 | | | | 83,093 | |
Other liabilities | | | 4,433 | | | | 3,831 | | | | 5,024 | | | | 4,982 | | | | 4,921 | | | | 4,820 | | | | 4,676 | |
Total Liabilities | | | 114,896 | | | | 110,963 | | | | 111,720 | | | | 111,237 | | | | 113,302 | | | | 116,611 | | | | 119,220 | |
| | | | | | | |
Net Worth | | | 194,936 | | | | 201,922 | | | | 199,686 | | | | 202,636 | | | | 205,775 | | | | 208,101 | | | | 210,515 | |
| | | | | | | | | | | | | | | | | | | | | | | | | | | | |
Net Financial Worth | | | (68,241 | ) | | | (67,697 | ) | | | (67,760 | ) | | | (70,243 | ) | | | (73,439 | ) | | | (76,577 | ) | | | (79,172 | ) |
Net Financial Liabilities | | | 72,234 | | | | 71,912 | | | | 72,250 | | | | 74,733 | | | | 77,928 | | | | 81,067 | | | | 83,662 | |
Net Debt | | | 34,800 | | | | 37,890 | | | | 34,854 | | | | 39,027 | | | | 44,558 | | | | 49,129 | | | | 52,471 | |
Note:
| 1. | Numbers may not add due to rounding and bracketed numbers represent negative amounts. |
129
Budget Strategy and Outlook 2018-19
| Table 9.7 | General Government Sector Cash Flow Statement1 |
| | | | | | | | | | | | | | | | | | | | | | | | | | | | |
| | | 2016-17
Outcome2
$ million | | | 2017-18
Budget2
$ million | | | 2017-18
Est. Act.
$ million | | | 2018-19
Budget
$ million | | | 2019-20
Projection
$ million | | | 2020-21
Projection
$ million | | | 2021-22
Projection
$ million | |
| | | | | | | |
Cash Receipts from Operating Activities | | | | | | | | | | | | | | | | | | | | | | | | | | | | |
Taxes received | | | 12,940 | | | | 13,296 | | | | 13,282 | | | | 14,153 | | | | 15,183 | | | | 15,949 | | | | 16,721 | |
Grants and subsidies received | | | 27,174 | | | | 27,628 | | | | 28,529 | | | | 27,712 | | | | 28,153 | | | | 29,059 | | | | 30,384 | |
Sales of goods and services | | | 6,116 | | | | 6,165 | | | | 5,966 | | | | 5,947 | | | | 6,158 | | | | 6,292 | | | | 6,520 | |
Interest receipts | | | 2,337 | | | | 2,328 | | | | 2,321 | | | | 2,199 | | | | 2,076 | | | | 1,859 | | | | 1,852 | |
Dividends and income tax equivalents | | | 1,929 | | | | 2,309 | | | | 2,532 | | | | 2,619 | | | | 2,185 | | | | 2,068 | | | | 1,975 | |
Other receipts | | | 6,477 | | | | 5,595 | | | | 6,867 | | | | 7,007 | | | | 6,681 | | | | 6,323 | | | | 6,350 | |
Total Operating Receipts | | | 56,973 | | | | 57,320 | | | | 59,497 | | | | 59,637 | | | | 60,435 | | | | 61,550 | | | | 63,803 | |
| | | | | | | |
Cash Payments for Operating Activities | | | | | | | | | | | | | | | | | | | | | | | | | | | | |
Payments for employees | | | (24,278 | ) | | | (26,099 | ) | | | (26,375 | ) | | | (27,701 | ) | | | (28,911 | ) | | | (29,736 | ) | | | (30,746 | ) |
Payments for goods and services | | | (17,005 | ) | | | (18,661 | ) | | | (18,691 | ) | | | (17,635 | ) | | | (16,960 | ) | | | (17,115 | ) | | | (17,607 | ) |
Grants and subsidies | | | (8,325 | ) | | | (8,045 | ) | | | (8,186 | ) | | | (9,492 | ) | | | (10,030 | ) | | | (9,870 | ) | | | (9,974 | ) |
Interest paid | | | (1,700 | ) | | | (1,706 | ) | | | (1,614 | ) | | | (1,474 | ) | | | (1,645 | ) | | | (1,692 | ) | | | (1,795 | ) |
Other payments | | | (5 | ) | | | | | | | | | | | | | | | (1 | ) | | | (1 | ) | | | (3 | ) |
Total Operating Payments | | | (51,313 | ) | | | (54,511 | ) | | | (54,866 | ) | | | (56,303 | ) | | | (57,546 | ) | | | (58,414 | ) | | | (60,123 | ) |
| | | | | | | |
Net Cash Inflows from Operating Activities | | | 5,660 | | | | 2,809 | | | | 4,631 | | | | 3,334 | | | | 2,889 | | | | 3,136 | | | | 3,680 | |
| | | | | | | |
Cash Flows from Investments in Non-Financial Assets | | | | | | | | | | | | | | | | | | | | | | | | | | | | |
Purchases of non-financial assets | | | (4,634 | ) | | | (5,123 | ) | | | (4,905 | ) | | | (5,927 | ) | | | (7,557 | ) | | | (7,396 | ) | | | (7,081 | ) |
Sales of non-financial assets | | | 389 | | | | 392 | | | | 227 | | | | 345 | | | | 373 | | | | 343 | | | | 165 | |
Net Cash Flows from Investments in Non-financial Assets | | | (4,244 | ) | | | (4,731 | ) | | | (4,678 | ) | | | (5,582 | ) | | | (7,185 | ) | | | (7,053 | ) | | | (6,916 | ) |
| | | | | | | |
Net Cash Flows from Investments in Financial Assets for Policy Purposes | | | 954 | | | | 460 | | | | 515 | | | | (53 | ) | | | 41 | | | | 167 | | | | 457 | |
| | | | | | | |
Net Cash Flows from Investments in Financial Assets for Liquidity Purposes | | | (2,615 | ) | | | 1,268 | | | | (1,054 | ) | | | 2,877 | | | | 4,734 | | | | 817 | | | | 153 | |
| | | | | | | |
Receipts from Financing Activities | | | | | | | | | | | | | | | | | | | | | | | | | | | | |
Advances received (net) | | | 1,315 | | | | 210 | | | | 403 | | | | (410 | ) | | | (277 | ) | | | (176 | ) | | | 25 | |
Borrowing (net) | | | (1,118 | ) | | | (176 | ) | | | (353 | ) | | | (393 | ) | | | (221 | ) | | | 3,053 | | | | 2,711 | |
Deposits received (net) | | | 14 | | | | — | | | | 46 | | | | (47 | ) | | | — | | | | — | | | | — | |
Net Cash Flows from Financing Activities | | | 211 | | | | 33 | | | | 96 | | | | (851 | ) | | | (498 | ) | | | 2,877 | | | | 2,735 | |
| | | | | | | |
Net Increase/(Decrease) in Cash held | | | (35 | ) | | | (161 | ) | | | (491 | ) | | | (275 | ) | | | (19 | ) | | | (56 | ) | | | 109 | |
| | | | | | | |
Net cash from operating activities | | | 5,660 | | | | 2,809 | | | | 4,631 | | | | 3,334 | | | | 2,889 | | | | 3,136 | | | | 3,680 | |
Net cash flows from investments in non-financial assets | | | (4,244 | ) | | | (4,731 | ) | | | (4,678 | ) | | | (5,582 | ) | | | (7,185 | ) | | | (7,053 | ) | | | (6,916 | ) |
Surplus/(Deficit) | | | 1,416 | | | | (1,922 | ) | | | (47 | ) | | | (2,248 | ) | | | (4,295 | ) | | | (3,917 | ) | | | (3,236 | ) |
| | | | | | | |
Derivation of ABS GFS Cash Surplus/Deficit | | | | | | | | | | | | | | | | | | | | | | | | | | | | |
Cash surplus/(deficit) | | | 1,416 | | | | (1,922 | ) | | | (47 | ) | | | (2,248 | ) | | | (4,295 | ) | | | (3,917 | ) | | | (3,236 | ) |
Acquisitions under finance leases and similar arrangements | | | (758 | ) | | | (618 | ) | | | (559 | ) | | | (864 | ) | | | (287 | ) | | | — | | | | — | |
ABS GFS Cash Surplus/(Deficit) Including Finance Leases and Similar Arrangements | | | 658 | | | | (2,540 | ) | | | (606 | ) | | | (3,112 | ) | | | (4,582 | ) | | | (3,917 | ) | | | (3,236 | ) |
Notes:
| 1. | Numbers may not add due to rounding and bracketed numbers represent negative amounts. |
| 2. | With the implementation of the latest GFS Manual (AGFS15), the 2016-17 Outcomes and 2017-18 Budget cash flow categories have been restated above to ensure comparability. |
130
Budget Strategy and Outlook 2018-19
| Table 9.8 | Public Non-financial Corporations Sector Cash Flow Statement1 |
| | | | | | | | | | | | | | | | | | | | | | | | | | | | |
| | | 2016-17
Outcome2
$ million | | | 2017-18
Budget2
$ million | | | 2017-18
Est. Act.
$ million | | | 2018-19
Budget
$ million | | | 2019-20
Projection
$ million | | | 2020-21
Projection
$ million | | | 2021-22
Projection
$ million | |
| | | | | | | |
Cash Receipts from Operating Activities | | | | | | | | | | | | | | | | | | | | | | | | | | | | |
Grants and subsidies received | | | 1,451 | | | | 623 | | | | 585 | | | | 585 | | | | 605 | | | | 601 | | | | 624 | |
Sales of goods and services | | | 14,187 | | | | 12,268 | | | | 13,374 | | | | 13,113 | | | | 12,749 | | | | 12,998 | | | | 13,396 | |
Interest receipts | | | 44 | | | | 37 | | | | 63 | | | | 52 | | | | 50 | | | | 58 | | | | 59 | |
Dividends and income tax equivalents | | | 15 | | | | 14 | | | | 13 | | | | 13 | | | | 13 | | | | 13 | | | | 13 | |
Other receipts | | | 335 | | | | 257 | | | | 394 | | | | 215 | | | | 224 | | | | 174 | | | | 179 | |
Total Operating Receipts | | | 16,032 | | | | 13,198 | | | | 14,429 | | | | 13,977 | | | | 13,641 | | | | 13,844 | | | | 14,270 | |
| | | | | | | |
Cash Payments for Operating Activities | | | | | | | | | | | | | | | | | | | | | | | | | | | | |
Payments for employees | | | (1,874 | ) | | | (2,072 | ) | | | (2,062 | ) | | | (2,143 | ) | | | (2,185 | ) | | | (2,194 | ) | | | (2,239 | ) |
Payments for goods and services | | | (5,290 | ) | | | (4,192 | ) | | | (4,890 | ) | | | (4,610 | ) | | | (4,307 | ) | | | (4,553 | ) | | | (4,545 | ) |
Grants and subsidies | | | (20 | ) | | | (289 | ) | | | (281 | ) | | | (264 | ) | | | (269 | ) | | | (52 | ) | | | (23 | ) |
Interest paid | | | (2,054 | ) | | | (1,960 | ) | | | (1,900 | ) | | | (1,910 | ) | | | (1,987 | ) | | | (2,081 | ) | | | (2,154 | ) |
Other payments | | | (1,577 | ) | | | (1,071 | ) | | | (1,260 | ) | | | (1,172 | ) | | | (1,164 | ) | | | (1,148 | ) | | | (1,148 | ) |
Total Operating Payments | | | (10,815 | ) | | | (9,584 | ) | | | (10,392 | ) | | | (10,098 | ) | | | (9,913 | ) | | | (10,028 | ) | | | (10,110 | ) |
| | | | | | | |
Net Cash Inflows from Operating Activities | | | 5,217 | | | | 3,614 | | | | 4,037 | | | | 3,879 | | | | 3,729 | | | | 3,816 | | | | 4,161 | |
| | | | | | | |
Cash Flows from Investments in Non-Financial Assets | | | | | | | | | | | | | | | | | | | | | | | | | | | | |
Purchases of non-financial assets | | | (2,708 | ) | | | (2,866 | ) | | | (2,751 | ) | | | (3,130 | ) | | | (3,229 | ) | | | (3,126 | ) | | | (3,097 | ) |
Sales of non-financial assets | | | 71 | | | | 46 | | | | 46 | | | | 11 | | | | 8 | | | | 8 | | | | 6 | |
Net Cash Flows from Investments in Non-financial Assets | | | (2,637 | ) | | | (2,820 | ) | | | (2,704 | ) | | | (3,119 | ) | | | (3,221 | ) | | | (3,118 | ) | | | (3,090 | ) |
| | | | | | | |
Net Cash Flows from Investments in Financial Assets for Policy Purposes | | | (2,100 | ) | | | (252 | ) | | | (473 | ) | | | 284 | | | | 41 | | | | (79 | ) | | | (569 | ) |
| | | | | | | |
Net Cash Flows from Investments in Financial Assets for Liquidity Purposes | | | 116 | | | | — | | | | (8 | ) | | | (3 | ) | | | (4 | ) | | | (4 | ) | | | (5 | ) |
| | | | | | | |
Receipts from Financing Activities | | | | | | | | | | | | | | | | | | | | | | | | | | | | |
Advances received (net) | | | (1 | ) | | | (1 | ) | | | (1 | ) | | | (1 | ) | | | (1 | ) | | | (1 | ) | | | (1 | ) |
Borrowing (net) | | | 768 | | | | 122 | | | | 41 | | | | 471 | | | | 815 | | | | 814 | | | | 642 | |
Dividends paid | | | (747 | ) | | | (1,646 | ) | | | (1,658 | ) | | | (1,805 | ) | | | (1,435 | ) | | | (1,324 | ) | | | (1,188 | ) |
Deposits received (net) | | | (3 | ) | | | — | | | | — | | | | — | | | | — | | | | — | | | | — | |
Other financing (net) | | | (692 | ) | | | 18 | | | | 1 | | | | 60 | | | | 100 | | | | — | | | | — | |
Net Cash Flows from Financing Activities | | | (675 | ) | | | (1,506 | ) | | | (1,617 | ) | | | (1,275 | ) | | | (521 | ) | | | (510 | ) | | | (546 | ) |
| | | | | | | |
Net Increase/(Decrease) in Cash held | | | (79 | ) | | | (965 | ) | | | (766 | ) | | | (233 | ) | | | 25 | | | | 104 | | | | (50 | ) |
| | | | | | | |
Net cash from operating activities | | | 5,217 | | | | 3,614 | | | | 4,037 | | | | 3,879 | | | | 3,729 | | | | 3,816 | | | | 4,161 | |
Net cash flows from investments in non-financial assets | | | (2,637 | ) | | | (2,820 | ) | | | (2,704 | ) | | | (3,119 | ) | | | (3,221 | ) | | | (3,118 | ) | | | (3,090 | ) |
Dividends paid | | | (747 | ) | | | (1,646 | ) | | | (1,658 | ) | | | (1,805 | ) | | | (1,435 | ) | | | (1,324 | ) | | | (1,188 | ) |
Surplus/(Deficit) | | | 1,834 | | | | (853 | ) | | | (326 | ) | | | (1,045 | ) | | | (927 | ) | | | (626 | ) | | | (117 | ) |
| | | | | | | |
Derivation of ABS GFS Cash Surplus/Deficit | | | | | | | | | | | | | | | | | | | | | | | | | | | | |
Cash surplus/(deficit) | | | 1,834 | | | | (853 | ) | | | (326 | ) | | | (1,045 | ) | | | (927 | ) | | | (626 | ) | | | (117 | ) |
ABS GFS Cash Surplus/(Deficit) Including Finance Leases and Similar Arrangements | | | 1,834 | | | | (853 | ) | | | (326 | ) | | | (1,045 | ) | | | (927 | ) | | | (626 | ) | | | (117 | ) |
Notes:
| 1. | Numbers may not add due to rounding and bracketed numbers represent negative amounts. |
| 2. | With the implementation of the latest GFS Manual (AGFS15), the 2016-17 Outcomes and 2017-18 Budget cash flow categories have been restated above to ensure comparability. |
131
Budget Strategy and Outlook 2018-19
| Table 9.9 | Non-financial Public Sector Cash Flow Statement1 |
| | | | | | | | | | | | | | | | | | | | | | | | | | | | |
| | | 2016-17
Outcome2
$ million | | | 2017-18
Budget2
$ million | | | 2017-18
Est. Act.
$ million | | | 2018-19
Budget
$ million | | | 2019-20
Projection
$ million | | | 2020-21
Projection
$ million | | | 2021-22
Projection
$ million | |
| | | | | | | |
Cash Receipts from Operating Activities | | | | | | | | | | | | | | | | | | | | | | | | | | | | |
Taxes received | | | 12,682 | | | | 13,061 | | | | 13,039 | | | | 13,891 | | | | 14,901 | | | | 15,644 | | | | 16,393 | |
Grants and subsidies received | | | 27,201 | | | | 27,708 | | | | 28,556 | | | | 27,788 | | | | 28,230 | | | | 29,137 | | | | 30,464 | |
Sales of goods and services | | | 18,454 | | | | 16,085 | | | | 17,069 | | | | 16,609 | | | | 16,391 | | | | 16,671 | | | | 17,223 | |
Interest receipts | | | 2,381 | | | | 2,365 | | | | 2,340 | | | | 2,217 | | | | 2,097 | | | | 1,891 | | | | 1,885 | |
Dividends and income tax equivalents | | | 157 | | | | 94 | | | | 179 | | | | 166 | | | | 126 | | | | 150 | | | | 179 | |
Other receipts | | | 6,805 | | | | 5,851 | | | | 7,259 | | | | 7,222 | | | | 6,905 | | | | 6,498 | | | | 6,529 | |
Total Operating Receipts | | | 67,680 | | | | 65,164 | | | | 68,442 | | | | 67,892 | | | | 68,650 | | | | 69,991 | | | | 72,672 | |
| | | | | | | |
Cash Payments for Operating Activities | | | | | | | | | | | | | | | | | | | | | | | | | | | | |
Payments for employees | | | (26,050 | ) | | | (28,075 | ) | | | (28,344 | ) | | | (29,743 | ) | | | (30,993 | ) | | | (31,824 | ) | | | (32,877 | ) |
Payments for goods and services | | | (20,329 | ) | | | (20,504 | ) | | | (21,302 | ) | | | (19,789 | ) | | | (18,745 | ) | | | (19,043 | ) | | | (19,452 | ) |
Grants and subsidies | | | (6,920 | ) | | | (7,791 | ) | | | (7,908 | ) | | | (9,247 | ) | | | (9,771 | ) | | | (9,398 | ) | | | (9,451 | ) |
Interest paid | | | (3,616 | ) | | | (3,539 | ) | | | (3,331 | ) | | | (3,202 | ) | | | (3,438 | ) | | | (3,563 | ) | | | (3,717 | ) |
Other payments | | | (670 | ) | | | (479 | ) | | | (548 | ) | | | (503 | ) | | | (520 | ) | | | (535 | ) | | | (522 | ) |
Total Operating Payments | | | (57,585 | ) | | | (60,387 | ) | | | (61,432 | ) | | | (62,484 | ) | | | (63,467 | ) | | | (64,363 | ) | | | (66,020 | ) |
| | | | | | | |
Net Cash Inflows from Operating Activities | | | 10,095 | | | | 4,776 | | | | 7,010 | | | | 5,408 | | | | 5,183 | | | | 5,628 | | | | 6,653 | |
| | | | | | | |
Cash Flows from Investments in Non-Financial Assets | | | | | | | | | | | | | | | | | | | | | | | | | | | | |
Purchases of non-financial assets | | | (7,305 | ) | | | (7,989 | ) | | | (7,656 | ) | | | (9,057 | ) | | | (10,786 | ) | | | (10,523 | ) | | | (10,177 | ) |
Sales of non-financial assets | | | 460 | | | | 438 | | | | 273 | | | | 356 | | | | 381 | | | | 351 | | | | 171 | |
Net Cash Flows from Investments in Non-financial Assets | | | (6,845 | ) | | | (7,551 | ) | | | (7,383 | ) | | | (8,701 | ) | | | (10,405 | ) | | | (10,171 | ) | | | (10,006 | ) |
| | | | | | | |
Net Cash Flows from Investments in Financial Assets for Policy Purposes | | | (42 | ) | | | 457 | | | | 465 | | | | (104 | ) | | | (15 | ) | | | (59 | ) | | | (79 | ) |
| | | | | | | |
Net Cash Flows from Investments in Financial Assets for Liquidity Purposes | | | (2,499 | ) | | | 1,268 | | | | (1,063 | ) | | | 2,873 | | | | 4,730 | | | | 813 | | | | 148 | |
| | | | | | | |
Receipts from Financing Activities | | | | | | | | | | | | | | | | | | | | | | | | | | | | |
Advances received (net) | | | (30 | ) | | | (22 | ) | | | (21 | ) | | | (16 | ) | | | (81 | ) | | | (30 | ) | | | (10 | ) |
Borrowing (net) | | | (350 | ) | | | (54 | ) | | | (312 | ) | | | 78 | | | | 594 | | | | 3,867 | | | | 3,353 | |
Deposits received (net) | | | 11 | | | | — | | | | 46 | | | | (47 | ) | | | — | | | | — | | | | — | |
Other financing (net) | | | (452 | ) | | | — | | | | 1 | | | | — | | | | — | | | | — | | | | — | |
Net Cash Flows from Financing Activities | | | (821 | ) | | | (76 | ) | | | (286 | ) | | | 15 | | | | 513 | | | | 3,837 | | | | 3,343 | |
| | | | | | | |
Net Increase/(Decrease) in Cash held | | | (113 | ) | | | (1,126 | ) | | | (1,256 | ) | | | (509 | ) | | | 6 | | | | 48 | | | | 59 | |
| | | | | | | |
Net cash from operating activities | | | 10,095 | | | | 4,776 | | | | 7,010 | | | | 5,408 | | | | 5,183 | | | | 5,628 | | | | 6,653 | |
Net cash flows from investments in non-financial assets | | | (6,845 | ) | | | (7,551 | ) | | | (7,383 | ) | | | (8,701 | ) | | | (10,405 | ) | | | (10,171 | ) | | | (10,006 | ) |
Surplus/(Deficit) | | | 3,249 | | | | (2,775 | ) | | | (373 | ) | | | (3,293 | ) | | | (5,222 | ) | | | (4,543 | ) | | | (3,353 | ) |
| | | | | | | |
Derivation of ABS GFS Cash Surplus/Deficit | | | | | | | | | | | | | | | | | | | | | | | | | | | | |
Cash surplus/(deficit) | | | 3,249 | | | | (2,775 | ) | | | (373 | ) | | | (3,293 | ) | | | (5,222 | ) | | | (4,543 | ) | | | (3,353 | ) |
Acquisitions under finance leases and similar arrangements | | | (758 | ) | | | (618 | ) | | | (559 | ) | | | (864 | ) | | | (287 | ) | | | — | | | | — | |
ABS GFS Cash Surplus/(Deficit) Including Finance Leases and Similar Arrangements | | | 2,492 | | | | (3,393 | ) | | | (932 | ) | | | (4,157 | ) | | | (5,509 | ) | | | (4,543 | ) | | | (3,353 | ) |
Notes:
| 1. | Numbers may not add due to rounding and bracketed numbers represent negative amounts. |
| 2. | With the implementation of the latest GFS Manual (AGFS15), the 2016-17 Outcomes and 2017-18 Budget cash flow categories have been restated above to ensure comparability. |
132
Budget Strategy and Outlook 2018-19
| 9.3 | Reconciliation of net operating balance to accounting operating result |
The primary difference between the net operating balance and the accounting operating result calculated under Australian Accounting Standards is that valuation adjustments are excluded from the net operating balance.
Data presented in Table 9.10 provides a reconciliation of the General Government Sector net operating balance to the accounting operating result.
| Table 9.10 | Reconciliation of UPF net operating balance to accounting operating result1 |
| | | | | | | | | | | | |
| | | 2017-18
Budget
$ million | | | 2017-18
Est. Act.
$ million | | | 2018-19
Budget
$ million | |
| | | |
Net operating balance General Government sector (Table 9.1) | | | 146 | | | | 1,512 | | | | 148 | |
| | | |
Remeasurement/valuation adjustments | | | | | | | | | | | | |
Bad debts and amortisation | | | (89 | ) | | | (93 | ) | | | (96 | ) |
Deferred tax equivalents | | | 64 | | | | 16 | | | | (1 | ) |
Dividends from network GOCs under Debt Action Plan (treated as return of equity for UPF) | | | 20 | | | | 50 | | | | 110 | |
Market value adjustments on financial assets and liabilities | | | 17 | | | | 31 | | | | 11 | |
Revaluation of provisions | | | 66 | | | | 12 | | | | 87 | |
Decommissioned infrastructure assets and land under roads | | | (143 | ) | | | (12 | ) | | | (12 | ) |
Gain/(loss) on assets sold/written off/impaired | | | (9 | ) | | | (96 | ) | | | (12 | ) |
| | | |
Accounting operating result General Government sector | | | 71 | | | | 1,421 | | | | 233 | |
Note:
| 1. | Numbers may not add due to rounding and bracketed numbers represent negative amounts. |
| 9.4 | General Government Sector time series |
Data presented in Table 9.11 provides a time series from 2005-06 to 2016-17 for the General Government Sector on the key fiscal aggregates used by the Government to measure financial performance. These aggregates have been backcast (as far as possible) to comply with AASB 1049 Whole of Government and General Government Sector Financial Reporting.
133
Budget Strategy and Outlook 2018-19
Table 9.11 General Government Sector time series1
| | | | | | | | | | | | | | | | | | | | | | | | | | | | | | | | | | | | | | | | | | | | | | | | |
| | | 2005-06
Actual
$ million | | | 2006-07
Actual
$ million | | | 2007-08
Actual
$ million | | | 2008-09
Actual
$ million | | | 2009-10
Actual
$ million | | | 2010-11
Actual
$ million | | | 2011-12
Actual
$ million | | | 2012-13
Actual
$ million | | | 2013-14
Actual
$ million | | | 2014-15
Actual
$ million | | | 2015-16
Actual
$ million | | | 2016-17
Actual
$ million | |
| | | | | | | | | | | | |
Revenue from Transactions | | | | | | | | | | | | | | | | | | | | | | | | | | | | | | | | | | | | | | | | | | | | | | | | |
Taxation revenue | | | 7,396 | | | | 8,484 | | | | 9,546 | | | | 8,866 | | | | 9,375 | | | | 9,981 | | | | 10,608 | | | | 10,937 | | | | 11,840 | | | | 12,598 | | | | 12,547 | | | | 12,919 | |
Grant revenue | | | 13,590 | | | | 14,378 | | | | 15,510 | | | | 17,481 | | | | 20,205 | | | | 20,338 | | | | 22,652 | | | | 18,322 | | | | 21,740 | | | | 23,583 | | | | 23,740 | | | | 27,383 | |
Sales of goods and services | | | 2,641 | | | | 2,909 | �� | | | 3,357 | | | | 3,648 | | | | 3,961 | | | | 4,172 | | | | 5,002 | | | | 5,087 | | | | 5,039 | | | | 5,443 | | | | 5,712 | | | | 5,642 | |
Interest income | | | 3,414 | | | | 3,338 | | | | (275 | ) | | | 1,482 | | | | 2,204 | | | | 2,368 | | | | 2,485 | | | | 2,644 | | | | 2,460 | | | | 2,470 | | | | 2,543 | | | | 2,336 | |
Dividend and income tax equivalent income | | | 1,059 | | | | 858 | | | | 1,244 | | | | 1,180 | | | | 949 | | | | 1,232 | | | | 1,112 | | | | 1,351 | | | | 1,975 | | | | 2,554 | | | | 2,661 | | | | 2,690 | |
Other revenue | | | 1,983 | | | | 2,032 | | | | 2,041 | | | | 4,421 | | | | 3,033 | | | | 3,921 | | | | 3,942 | | | | 3,415 | | | | 3,650 | | | | 3,322 | | | | 3,577 | | | | 5,222 | |
Total Revenue | | | 30,084 | | | | 31,999 | | | | 31,424 | | | | 37,078 | | | | 39,727 | | | | 42,013 | | | | 45,801 | | | | 41,755 | | | | 46,705 | | | | 49,970 | | | | 50,780 | | | | 56,194 | |
| | | | | | | | | | | | |
Expenses from Transactions | | | | | | | | | | | | | | | | | | | | | | | | | | | | | | | | | | | | | | | | | | | | | | | | |
Employee expenses | | | 10,615 | | | | 11,731 | | | | 13,175 | | | | 14,310 | | | | 15,566 | | | | 16,826 | | | | 18,250 | | | | 18,130 | | | | 17,816 | | | | 18,592 | | | | 20,045 | | | | 21,258 | |
Superannuation expenses | | | | | | | | | | | | | | | | | | | | | | | | | | | | | | | | | | | | | | | | | | | | | | | | |
Superannuation interest costs | | | 840 | | | | 1,154 | | | | 816 | | | | 858 | | | | 1,320 | | | | 1,240 | | | | 1,216 | | | | 923 | | | | 963 | | | | 878 | | | | 767 | | | | 514 | |
Other superannuation expenses | | | 1,367 | | | | 1,513 | | | | 1,865 | | | | 2,012 | | | | 2,051 | | | | 2,171 | | | | 2,301 | | | | 2,420 | | | | 2,277 | | | | 2,319 | | | | 2,507 | | | | 2,661 | |
Other operating expenses | | | 5,236 | | | | 6,138 | | | | 6,646 | | | | 7,300 | | | | 7,568 | | | | 8,646 | | | | 9,497 | | | | 12,817 | | | | 13,108 | | | | 14,539 | | | | 14,811 | | | | 15,582 | |
Depreciation and amortisation | | | 1,678 | | | | 1,764 | | | | 1,851 | | | | 2,496 | | | | 2,501 | | | | 2,507 | | | | 2,777 | | | | 2,902 | | | | 3,060 | | | | 3,137 | | | | 2,921 | | | | 3,068 | |
Other interest expenses | | | 174 | | | | 180 | | | | 347 | | | | 599 | | | | 803 | | | | 1,125 | | | | 1,659 | | | | 1,940 | | | | 2,200 | | | | 2,328 | | | | 2,220 | | | | 1,722 | |
Grant expenses | | | 6,467 | | | | 7,565 | | | | 8,329 | | | | 9,525 | | | | 9,790 | | | | 10,963 | | | | 10,327 | | | | 7,182 | | | | 6,792 | | | | 7,758 | | | | 6,841 | | | | 8,568 | |
Total Expenses | | | 26,378 | | | | 30,046 | | | | 33,030 | | | | 37,099 | | | | 39,599 | | | | 43,479 | | | | 46,028 | | | | 46,312 | | | | 46,217 | | | | 49,551 | | | | 50,112 | | | | 53,373 | |
| | | | | | | | | | | | |
Net Operating Balance | | | 3,707 | | | | 1,953 | | | | (1,606 | ) | | | (21 | ) | | | 128 | | | | (1,466 | ) | | | (226 | ) | | | (4,558 | ) | | | 488 | | | | 420 | | | | 668 | | | | 2,821 | |
| | | | | | | | | | | | |
OTHER KEY AGGREGATES | | | | | | | | | | | | | | | | | | | | | | | | | | | | | | | | | | | | | | | | | | | | | | | | |
| | | | | | | | | | | | |
Purchases of non-financial assets | | | 3,196 | | | | 4,412 | | | | 5,725 | | | | 6,772 | | | | 8,959 | | | | 8,237 | | | | 7,971 | | | | 7,001 | | | | 6,323 | | | | 4,635 | | | | 4,044 | | | | 4,634 | |
| | | | | | | | | | | | |
Net acquisition of non-financial assets | | | 1,234 | | | | 2,157 | | | | 3,680 | | | | 4,349 | | | | 6,665 | | | | 5,583 | | | | 5,241 | | | | 3,389 | | | | 3,087 | | | | 992 | | | | 1,164 | | | | 2,285 | |
| | | | | | | | | | | | |
Fiscal Balance | | | 2,472 | | | | (204 | ) | | | (5,286 | ) | | | (4,371 | ) | | | (6,537 | ) | | | (7,049 | ) | | | (5,467 | ) | | | (7,947 | ) | | | (2,599 | ) | | | (572 | ) | | | (497 | ) | | | 536 | |
| | | | | | | | | | | | |
Cash Surplus/(Deficit) | | | 4,649 | | | | 2,360 | | | | (4,924 | ) | | | (2,866 | ) | | | (5,341 | ) | | | (5,880 | ) | | | (4,951 | ) | | | (8,585 | ) | | | (3,213 | ) | | | (105 | ) | | | 866 | | | | 1,416 | |
| | | | | | | | | | | | |
Net Worth | | | 104,446 | | | | 118,532 | | | | 193,838 | | | | 184,277 | | | | 175,588 | | | | 177,875 | | | | 170,745 | | | | 172,963 | | | | 166,492 | | | | 171,933 | | | | 188,099 | | | | 194,936 | |
| | | | | | | | | | | | |
Net Debt | | | (23,203 | ) | | | (26,622 | ) | | | (22,586 | ) | | | (19,251 | ) | | | (13,354 | ) | | | (9,542 | ) | | | (5,720 | ) | | | 2,399 | | | | 5,208 | | | | 5,749 | | | | 653 | | | | (287 | ) |
| | | | | | | | | | | | |
Borrowing | | | 2,084 | | | | 2,267 | | | | 6,328 | | | | 10,308 | | | | 15,916 | | | | 24,593 | | | | 29,517 | | | | 37,878 | | | | 41,368 | | | | 43,105 | | | | 35,486 | | | | 33,260 | |
| | | | | | | | | | | | |
Borrowing (NFPS) | | | 17,314 | | | | 23,971 | | | | 30,856 | | | | 42,645 | | | | 51,713 | | | | 53,708 | | | | 61,542 | | | | 69,086 | | | | 72,637 | | | | 75,233 | | | | 72,922 | | | | 71,904 | |
Note:
| 1. | Numbers may not add due to rounding and bracketed numbers represent negative amounts. |
Source: Report on State Finances for Queensland 2005-06 to 2016-17. (Numbers have been recast for changes to UPF presentation.)
134
Budget Strategy and Outlook 2018-19
| 9.5 | Other General Government uniform presentation framework data |
Data in the following tables is presented in accordance with the UPF.
Data presented in Tables 9.12 and 9.13 provide details of General Government Sector current and capital grant revenue and expenses.
| Table 9.12 | General Government Sector grant revenue1 |
| | | | | | | | |
| | | 2017-18
Est. Act.
$ million | | | 2018-19
Budget
$ million | |
| | |
Current grant revenue | | | | | | | | |
Current grants from the Commonwealth | | | | | | | | |
General purpose grants | | | 15,240 | | | | 14,799 | |
Specific purpose grants | | | 7,970 | | | | 7,987 | |
Specific purpose grants for on-passing | | | 3,019 | | | | 2,918 | |
Total current grants from the Commonwealth | | | 26,229 | | | | 25,704 | |
Other contributions and grants | | | 354 | | | | 296 | |
Total current grant revenue | | | 26,583 | | | | 26,001 | |
| | |
Capital grant revenue | | | | | | | | |
Capital grants from the Commonwealth | | | | | | | | |
Specific purpose grants | | | 1,826 | | | | 1,659 | |
Specific purpose grants for on-passing | | | — | | | | 5 | |
Total capital grants from the Commonwealth | | | 1,826 | | | | 1,664 | |
Other contributions and grants | | | 72 | | | | 36 | |
Total capital grant revenue | | | 1,898 | | | | 1,700 | |
Total grant revenue | | | 28,481 | | | | 27,701 | |
Note:
| 1. | Numbers may not add due to rounding. |
135
Budget Strategy and Outlook 2018-19
| Table 9.13 | General Government Sector grant expenses1 |
| | | | | | | | |
| | | 2017-18
Est. Act.
$ million | | | 2018-19
Budget
$ million | |
| | |
Current grant expense | | | | | | | | |
Private and Not-for-profit sector | | | 2,107 | | | | 2,181 | |
Private and Not-for-profit sector on-passing | | | 2,553 | | | | 2,687 | |
Local Government | | | 271 | | | | 362 | |
Local Government on-passing | | | 473 | | | | 241 | |
Grants to other sectors of Government | | | 947 | | | | 2,169 | |
Other | | | 304 | | | | 238 | |
Total current grant expense | | | 6,656 | | | | 7,878 | |
| | |
Capital grant expense | | | | | | | | |
Private and Not-for-profit sector | | | 237 | | | | 458 | |
Local Government | | | 976 | | | | 1,059 | |
Local Government on-passing | | | — | | | | 5 | |
Grants to other sectors of Government | | | 16 | | | | 13 | |
Other | | | 211 | | | | 140 | |
Total capital grant expense | | | 1,440 | | | | 1,674 | |
Total grant expense | | | 8,096 | | | | 9,552 | |
Note:
| 1. | Numbers may not add due to rounding. |
| 9.5.2 | Dividends and income tax equivalent income |
Table 9.14 provides details of the source of dividend and income tax equivalent income in the General Government Sector.
| Table 9.14 | General Government Sector dividend and income tax equivalent income1 |
| | | | | | | | |
| | | 2017-18
Est. Act.
$ million | | | 2018-19
Budget
$ million | |
Dividend and Income Tax Equivalent income from PNFC sector | | | 2,589 | | | | 2,066 | |
Dividend and Income Tax Equivalent income from PFC sector | | | 97 | | | | 151 | |
Total Dividend and Income Tax Equivalent income | | | 2,686 | | | | 2,217 | |
Note:
| 1. | Numbers may not add due to rounding. |
136
Budget Strategy and Outlook 2018-19
| 9.5.3 | Expenses by function |
Data presented in Table 9.15 provides details of General Government Sector expenses by function. The Australian Bureau of Statistics introduced a revised Classification of the Function of Government Australian Framework (COFOG-A) which has resulted in some re-classification of expenditure between purposes (see 9.6.1).
| Table 9.15 | General Government Sector expenses by function1 |
| | | | | | | | | | | | | | | | | | | | | | | | |
| | | 2017-18
Budget2
$ million | | | 2017-18
Est. Act.
$ million | | | 2018-19
Budget
$ million | | | 2019-20
Projection
$ million | | | 2020-21
Projection
$ million | | | 2021-22
Projection
$ million | |
| | | | | | |
General public services | | | 5,115 | | | | 5,419 | | | | 5,368 | | | | 5,412 | | | | 5,287 | | | | 5,259 | |
Public order and safety | | | 5,139 | | | | 5,023 | | | | 5,154 | | | | 5,231 | | | | 5,345 | | | | 5,505 | |
Economic affairs | | | 2,160 | | | | 2,221 | | | | 2,241 | | | | 2,165 | | | | 2,114 | | | | 2,017 | |
Environmental protection | | | 609 | | | | 726 | | | | 631 | | | | 726 | | | | 716 | | | | 734 | |
Housing and community amenities | | | 295 | | | | 224 | | | | 275 | | | | 373 | | | | 364 | | | | 268 | |
Health | | | 16,478 | | | | 17,005 | | | | 17,347 | | | | 17,980 | | | | 18,513 | | | | 19,173 | |
Recreation, culture and religion | | | 1,458 | | | | 1,535 | | | | 842 | | | | 741 | | | | 763 | | | | 746 | |
Education | | | 13,660 | | | | 13,536 | | | | 14,006 | | | | 14,634 | | | | 15,314 | | | | 15,906 | |
Social protection | | | 5,056 | | | | 5,425 | | | | 5,865 | | | | 5,439 | | | | 5,452 | | | | 5,930 | |
Transport | | | 5,752 | | | | 5,633 | | | | 5,861 | | | | 5,975 | | | | 5,961 | | | | 6,042 | |
| | | | | | |
Total Expenses | | | 55,723 | | | | 56,747 | | | | 57,590 | | | | 58,675 | | | | 59,829 | | | | 61,579 | |
Notes:
| 1. | Numbers may not add due to rounding. |
| 2. | 2017-18 Budget has been restated to comply with COFOG-A. |
| 9.5.4 | Purchases of non-financial assets by function |
Data presented in Table 9.16 provides details of General Government Sector purchases of non-financial assets by function as per COFOG-A.
| Table 9.16 | General Government Sector purchases of non-financial assets by function1 |
| | | | | | | | | | | | | | | | | | | | | | | | |
| | | 2017-18
Budget2
$ million | | | 2017-18
Est. Act.
$ million | | | 2018-19
Budget
$ million | | | 2019-20
Projection
$ million | | | 2020-21
Projection
$ million | | | 2021-22
Projection
$ million | |
| | | | | | |
General public services | | | 217 | | | | 127 | | | | 373 | | | | 249 | | | | 45 | | | | 38 | |
Public order and safety | | | 552 | | | | 415 | | | | 555 | | | | 522 | | | | 265 | | | | 245 | |
Economic affairs | | | 37 | | | | 32 | | | | 47 | | | | 33 | | | | 29 | | | | 28 | |
Environmental protection | | | 28 | | | | 58 | | | | 67 | | | | 29 | | | | 19 | | | | 20 | |
Housing and community amenities | | | 21 | | | | 26 | | | | 78 | | | | 90 | | | | 132 | | | | 83 | |
Health | | | 984 | | | | 598 | | | | 1,099 | | | | 1,046 | | | | 907 | | | | 623 | |
Recreation, culture and religion | | | 81 | | | | 52 | | | | 161 | | | | 173 | | | | 77 | | | | 39 | |
Education | | | 643 | | | | 589 | | | | 711 | | | | 993 | | | | 599 | | | | 664 | |
Social protection | | | 460 | | | | 322 | | | | 384 | | | | 319 | | | | 291 | | | | 298 | |
Transport | | | 2,100 | | | | 2,685 | | | | 2,451 | | | | 4,104 | | | | 5,032 | | | | 5,042 | |
| | | | | | |
Total Purchases | | | 5,123 | | | | 4,905 | | | | 5,927 | | | | 7,557 | | | | 7,396 | | | | 7,081 | |
Notes:
| 1. | Numbers may not add due to rounding. |
| 2. | 2017-18 Budget has been restated to comply with COFOG-A. |
137
Budget Strategy and Outlook 2018-19
Data presented in Table 9.17 provides details of taxation revenue collected by the General Government Sector.
| Table 9.17 | General Government Sector taxes1 |
| | | | | | | | |
| | | 2017-18
Est. Act.
$ million | | | 2018-19
Budget
$ million | |
| | |
Taxes on employers’ payroll and labour force | | | 3,887 | | | | 4,086 | |
| | |
Taxes on property | | | | | | | | |
Land taxes | | | 1,183 | | | | 1,313 | |
Stamp duties on financial and capital transactions | | | 3,090 | | | | 3,214 | |
Other | | | 682 | | | | 822 | |
| | |
Taxes on the provision of goods and services | | | | | | | | |
Taxes on gambling | | | 1,194 | | | | 1,307 | |
Taxes on insurance | | | 951 | | | | 992 | |
| | |
Taxes on use of goods and performance of activities | | | | | | | | |
Motor vehicle taxes | | | 2,297 | | | | 2,421 | |
| | |
Total Taxation Revenue | | | 13,284 | | | | 14,155 | |
Note:
| 1. | Numbers may not add due to rounding. |
| 9.6 | Contingent liabilities |
Contingent liabilities represent items that are not included in the Budget as significant uncertainty exists as to whether the Government would sacrifice future economic benefits in respect of these items. Nevertheless, such contingencies need to be recognised and managed wherever possible in terms of their potential impact on the Government’s financial position in the future.
The State’s quantifiable and non-quantifiable contingent liabilities are detailed in the 2016-17 Report on State Finances – whole-of-government financial statements (note 43).
A summary of the State’s quantifiable contingent liabilities as at 30 June 2017 is provided in Table 9.18.
138
Budget Strategy and Outlook 2018-19
| Table 9.18 | Contingent liabilities |
| | | | |
| | | 2016-17
$ million | |
Nature of contingent liability | | | | |
| |
Guarantees and indemnities | | | 10,421 | |
Other | | | 328 | |
| |
Total | | | 10,748 | |
| 9.7 | Background and interpretation of uniform presentation framework |
As mentioned in the introduction to this chapter, the UPF was reviewed in 2007 following the release of the AASB accounting standard, AASB 1049 Whole of Government and General Government Sector Financial Reporting.
This standard aims to harmonise GFS and GAAP with the objective of improving the clarity and transparency of government financial statements.
| 9.7.1 | Accrual Government Finance Statistics framework |
The GFS reporting framework, developed by the Australian Bureau of Statistics (ABS), is based on international statistics standards (the International Monetary Fund Manual on Government Finance Statistics and the United Nations System of National Accounts). This allows comprehensive assessments to be made of the economic impact of government.
The accrual GFS framework is based on an integrated recording of stocks and flows. Stocks refers to a unit’s holdings of assets and liabilities at a point in time, whilst flows represent the movement in the stock of assets and liabilities between two points in time. Flows comprise two separate types, transactions and other economic flows. Transactions come about as a result of mutually agreed interactions between units or within a single unit. Other economic flows would include revaluations and destruction or discovery of assets that do not result from a transaction.
In GFS operating statements, other economic flows, being outside of the control of government, are excluded and do not affect the net operating balance or fiscal balance.
Effective 1 July 2017, the ABS has updated its framework to incorporate changes outlined in the IMF’s latest manual. The ABS’s new framework (AGFS15) has required changes to the economic types of stocks and flows, and the classification of flows by function (classification of the functions of government – Australia, or COFOG-A).
In implementing AGFS15, Queensland Treasury has revised some of the classifications of operating cashflows in the Cashflow Statement. The 2016-17 Outcome and 2017-18 Budget have been restated to facilitate comparability. The key aggregates have not changed.
139
Budget Strategy and Outlook 2018-19
Adopting COFOG-A has resulted in some changes to the broad categories of function. As far as possible, the 2017-18 Budget has been restated to reflect these changes.
| 9.7.2 | Generally Accepted Accounting Principles |
In addition to the GFS framework, public sector entities were previously required to report at year end against AAS 31 Financial Reporting by Government, which meant complying with the Accounting Standards issued by the AASB.
| 9.7.3 | Harmonisation under AASB 1049 |
This dual reporting regime caused confusion for financial report users and the Financial Reporting Council asked the AASB to develop a framework harmonising GAAP and GFS and to issue an Australian accounting standard for a single set of government reports.
In the development of the AASB 1049, the AASB adopted the following approaches:
| • | | adoption of GAAP definition, recognition and measurement principles in almost all cases |
| • | | amending presentation requirements to encompass a comprehensive result that retains GAAP classification system but overlays it with a transaction and other economic flows classification system based on GFS |
| • | | expanding the disclosure requirements to incorporate key fiscal aggregates required by GFS. |
| 9.7.4 | Revisions to the Uniform Presentation Framework |
Following the introduction of AASB 1049, the Australian, state and territory governments consider that the UPF will continue to be an important framework for ensuring comparability of financial information across jurisdictions. The UPF shall continue to apply to financial statements produced by government in budgets, mid-year budget updates and final budget outcome reports, whereas the accounting standard applies only to outcome reports.
Therefore, rather than replacing the UPF with the accounting standard, the framework was updated to align with AASB 1049. Australia, state and territory governments agreed that the updated framework would continue to provide a common core of comparable financial information in their budget papers and comparable data amongst jurisdictions while maintaining at least the current level of transparency.
Aligning the framework with the AASB 1049 was not intended to create a UPF that complies with all the reporting requirements of AASB 1049. For example, the UPF does not include the same level of detail in relation to disclosure requirements as AASB 1049. Instead, the revised UPF allows jurisdictions to utilise the framework as the base set of statements and add additional relevant information in order to comply with AASB 1049.
140
Budget Strategy and Outlook 2018-19
GFS data is presented by institutional sector, distinguishing between the General Government Sector and the PNFC sector.
Budget reporting focuses on the General Government Sector, which provides regulatory services, and goods and services of a non-market nature that are provided at less than cost or at no cost. These services are largely financed by general revenue (Australian Government grants and state taxation). This service comprises government departments, their commercialised business units/shared service providers and certain statutory bodies.
The PNFC Sector comprises bodies that provide mainly market goods and services that are of a non-regulatory and non-financial nature. PNFCs are financed through sales to consumers of their goods and services and may be supplemented by explicit government subsidy to satisfy community service obligations. In general, PNFCs are legally distinguishable from the governments that own them. Examples of PNFCs include the energy entities and Queensland Rail.
Together, the General Government Sector and the PNFC Sector comprise the Non-financial Public Sector.
Further discussion of the GFS framework of reporting, including definitions of GFS terms, can be obtained from the webpage of the ABS at www.abs.gov.au.
141
Budget Strategy and Outlook 2018-19
The reporting entities included in the General Government and PNFC Sectors in these Budget papers are provided below.
Departments
Aboriginal and Torres Strait Islander Partnerships
Agriculture and Fisheries
Child Safety, Youth and Women
Communities, Disability Services and Seniors
Education
Electoral Commission of Queensland
Employment, Small Business and Training
Environment and Science
Housing and Public Works
Innovation, Tourism Industry Development and the Commonwealth Games
Justice and Attorney-General
Legislative Assembly
Local Government, Racing and Multicultural Affairs
Natural Resources, Mines and Energy
Office of Industrial Relations
Office of the Governor
Office of the Inspector-General Emergency Management
Office of the Ombudsman
Premier and Cabinet
Public Safety Business Agency
Public Service Commission
Queensland Audit Office
Queensland Corrective Services
Queensland Fire and Emergency Services
Queensland Health
Queensland Police Service
Queensland Treasury
Sport and Recreation
State Development, Manufacturing, Infrastructure and Planning
The Public Trustee of Queensland
Transport and Main Roads
Commercialised Business Units
Building and Asset Services
CITEC
Economic Development Queensland
QFleet
RoadTek
Shared Service Providers
Corporate Administration Agency
Queensland Shared Services
142
Budget Strategy and Outlook 2018-19
Statutory Authorities
Anti-Discrimination Commission
Board of the Queensland Museum
Crime and Corruption Commission
Cross River Rail Delivery Authority
Gold Coast 2018 Commonwealth Games Corporation
Gold Coast Waterways Authority
Hospital and Health Services
Cairns and Hinterland
Central Queensland
Central West
Children’s Health Queensland
Darling Downs
Gold Coast
Mackay
North West
South West
Sunshine Coast
Torres and Cape
Townsville
West Moreton
Wide Bay
Legal Aid Queensland
Library Board of Queensland
Motor Accident Insurance Commission
Nominal Defendant
Office of the Information Commissioner
Office of the Health Ombudsman
Prostitution Licensing Authority
Queensland Agricultural Training Colleges
Queensland Art Gallery Board of Trustees
Queensland Building and Construction Commission
Queensland Curriculum and Assessment Authority
Queensland Family and Child Commission
Queensland Mental Health Commission
Queensland Performing Arts Trust
Queensland Racing Integrity Commission
Queensland Reconstruction Authority
Queensland Rural and Industry Development Authority
Residential Tenancies Authority
South Bank Corporation
TAFE Queensland
The Council of the Queensland Institute of Medical Research
Tourism and Events Queensland
Trade and Investment Queensland
143
Budget Strategy and Outlook 2018-19
| 9.9.2 | Public Non-financial Corporations |
Brisbane Port Holdings Pty Ltd
CS Energy Limited
DBCT Holdings Pty Ltd
Energy Queensland
Far North Queensland Ports Corporation Limited
Gladstone Area Water Board
Gladstone Ports Corporation Limited
Mount Isa Water Board
North Queensland Bulk Ports Corporation Limited
Port of Townsville Limited
Powerlink Queensland
Queensland Bulk Water Supply Authority (Seqwater)
Queensland Lottery Corporation Pty Ltd
Queensland Rail
Queensland Treasury Holdings Pty Ltd
Stadiums Queensland
Stanwell Corporation Limited
SunWater Limited
144
Budget Strategy and Outlook 2018-19
| Appendix A: | Concessions statement |
Context
The Queensland Government provides a wide range of concessions across a variety of services and products. In addition to targeted discounts, rebates and subsidies for Queenslanders based on eligibility criteria relating to factors such as age, income and special needs or disadvantage, broader concession arrangements are in place to reduce the price paid by all consumers in areas such as transport, electricity and water.
The majority of Queenslanders benefit from at least one concession and in many cases may benefit from multiple concessions each year. For example, aged pensioners are eligible for a number of Queensland Government concessions, such as discounts on their council rates, water, gas and electricity bills, vehicle registration fees as well as subsidised optometry and dental services.
Further information on the eligibility requirements and benefits of a range of Government concessions can be found at: https://campaigns.premiers.qld.gov.au/smart-savings/.
Focus
This statement highlights the cost and nature of concessions provided by the Queensland Government. It covers both concessions that are direct Budget outlays (for example, fee subsidy payments), and concessions that are revenue foregone through fees and charges that are set at a lower rate than applies to the wider community or, in the case of broader concessions, the full cost of service provision.
Sections A.2 and A.3 set out the individual concessions by agency and government-owned corporation respectively, sorted in descending order. The total value of these concessions is estimated to be $5.584 billion in 2018-19. This represents a significant Government and taxpayer commitment to improving the accessibility and affordability of a diverse range of services, and reducing the price paid by consumers of those services to ease cost of living pressures.
Explanation of scope
For the purposes of this document, concessions include:
| • | | discounts, rebates and subsidies to improve access to, and the affordability of, a range of services for individuals or families based on eligibility criteria relating to factors such as age, income and special needs or disadvantage |
| • | | concessional prices for Government services, where the price charged to all consumers is less than the full cost of service provision. |
145
Budget Strategy and Outlook 2018-19
Both General Government and Public Non-financial Corporations (PNFC) Sector concessions are included. Where a payment is made from a General Government Sector agency to a PNFC entity for a concession arrangement, the expenditure is reported against the General Government Sector agency only to avoid double counting. To be included in this statement, concessions must meet the minimum materiality threshold of estimated expenditure or revenue foregone of $50,000 in 2018-19.
Varying methods have been used to estimate the cost of concessions depending on the nature of the concessions, including:
| • | | direct Budget outlay cost (for example, direct subsidy or rebate payments or Government’s contribution in the case of items such as rental subsidies) |
| • | | revenue foregone (for example, concessional fees and charges) |
| • | | cost of goods and services provided. |
For the purposes of illustration, the document often uses averages to demonstrate the potential value of the concession to consumers. However, averages are not reflective of individual circumstances, meaning the actual dollar value of the concession to consumers may vary from person to person.
The Concessions Statement does not include Tax Expenditures (for example, tax exemptions, reduced tax rates, tax rebates and deductions). Information on Tax Expenditures can be found in Appendix B – Tax expenditure statement.
146
Budget Strategy and Outlook 2018-19
| Table A.1.1 | Concession by entity1 |
| | | | | | | | |
Concession by entity | | 2017-18
Est. Act.
$ million | | | 2018-19
Estimate
$ million | |
Agency | | | | | | | | |
Department of Agriculture and Fisheries | | | 32.4 | | | | 43.6 | |
Department of Communities, Disability Services and Seniors | | | 366.3 | | | | 383.8 | |
Department of Education | | | 124.8 | | | | 131.6 | |
Department of Employment, Small Business and Training | | | 429.7 | | | | 453.1 | |
Department of Environment and Science | | | 8.8 | | | | 7.1 | |
Department of Housing and Public Works | | | 450.7 | | | | 461.6 | |
Department of Justice and Attorney-General | | | 91.2 | | | | 93.1 | |
Department of Natural Resources, Mines and Energy | | | 825.8 | | | | 795.6 | |
Department of Transport and Main Roads | | | 2,601.1 | | | | 2,796.7 | |
Queensland Fire and Emergency Services | | | 9.7 | | | | 10.2 | |
Queensland Health | | | 295.5 | | | | 281.7 | |
Total Agency | | | 5,236.1 | | | | 5,458.1 | |
| | |
Government-owned corporations | | | | | | | | |
Energy Queensland | | | 22.0 | | | | 22.9 | |
Far North Queensland Ports Corporation Limited | | | 0.8 | | | | 0.8 | |
Gladstone Ports Corporation Limited | | | 55.5 | | | | 43.1 | |
North Queensland Bulk Ports Corporation Limited | | | 1.6 | | | | 1.7 | |
Port of Townsville Limited | | | 5.7 | | | | 5.8 | |
Queensland Rail Limited | | | 1.7 | | | | 1.9 | |
SunWater Limited | | | 48.5 | | | | 49.4 | |
Total Government-owned corporations | | | 135.8 | | | | 125.6 | |
| | |
Total all entities | | | 5,371.9 | | | | 5,583.7 | |
Note:
| 1. | Numbers may not add due to rounding. |
147
Budget Strategy and Outlook 2018-19
| Table A.2.1 | Department of Agriculture and Fisheries |
| | | | | | | | |
Concession | | 2017-18
Est. Act.
$ million | | | 2018-19
Estimate
$ million | |
Primary Industry Productivity Enhancement Scheme (PIPES) | | | 21.2 | | | | 20.3 | |
Drought Relief Assistance Scheme1 | | | 10.0 | | | | 20.0 | |
Vessel Tracking Rebate Scheme2 | | | 0.1 | | | | 1.7 | |
Farm Management Grant3 | | | 1.1 | | | | 1.6 | |
Total | | | 32.4 | | | | 43.6 | |
Notes:
| 1. | The 2017-18 estimated actual is lower than previously anticipated due to improved climatic conditions across the State. In 2018-19 the Government is providing funding of up to $20 million, held centrally, for the continuation of the Drought Relief Assistance Scheme. |
| 2. | The variance is due to the commencement of the scheme (June 2018) and an anticipated increased take up of the scheme during 2018-19. |
| 3. | The variance is due to an anticipated increased take up of the grants in 2018-19, as a result of the expansion of a targeted communications strategy. |
Primary Industry Productivity Enhancement Scheme (PIPES)
PIPES is administered by the Queensland Rural and Industry Development Authority (QRIDA) and provides concessional rates of interest on loans to eligible primary producers in need of financial assistance. First Start Loans and Sustainability Loans of up to $2 million and $1.3 million respectively support applicants to enter primary production and to improve productivity and sustainability. The average concessional interest rate for new lending is 3.24%. The amounts shown in the above table represent the fair values of the interest rate concessions pertaining to loans issued in each of the financial years shown.
Drought Relief Assistance Scheme
The Drought Relief Assistance Scheme provides freight subsidies and emergency water infrastructure rebates to support producers and communities that have been affected by drought conditions across the State. Freight subsidies of up to 50% and emergency water infrastructure rebates of up to 50% are available to eligible applicants, up to a maximum of between $20,000 and $40,000 per property, per financial year.
Vessel Tracking Rebate Scheme
The Queensland Sustainable Fisheries Strategy 2017-2027 requires vessel tracking on all commercial fishing boats by 2020 to assist in the management of Queensland Fisheries. This initiative is designed to assist commercial fishers by providing rebates up to prescribed amounts, to offset the cost of purchasing and installing approved vessel tracking units.
148
Budget Strategy and Outlook 2018-19
Farm Management Grant
The Farm Management Grant aims to assist eligible Queensland primary producers, or their relatives, to offset the costs of professional advice associated with succession planning. The grant provides rebates of up to 50% of the amount paid for professional advice, up to a maximum of $2,500 per financial year.
| Table A.2.2 | Department of Communities, Disability Services and Seniors |
| | | | | | | | |
Concession | | 2017-18
Est. Act.
$ million | | | 2018-19
Estimate
$ million | |
Electricity Rebate Scheme1,2 | | | 181.0 | | | | 195.5 | |
Electricity Asset Ownership Dividend | | | 100.0 | | | | 100.0 | |
Pensioner Rate Subsidy Scheme | | | 53.0 | | | | 53.6 | |
South East Queensland Pensioner Water Subsidy Scheme | | | 18.0 | | | | 18.2 | |
Home Energy Emergency Assistance Scheme | | | 8.1 | | | | 10.0 | |
Electricity Life Support Concession Scheme2 | | | 2.3 | | | | 2.3 | |
Reticulated Natural Gas Rebate Scheme | | | 2.5 | | | | 2.6 | |
Medical Cooling and Heating Electricity Concession Scheme2 | | | 1.5 | | | | 1.6 | |
Total | | | 366.3 | | | | 383.8 | |
Notes:
| 1. | The variance is due to the estimated growth in recipients, particularly Health Care Card holders. |
| 2. | Electricity price linked rebates are adjusted annually according to the Queensland Competition Authority’s (QCA) price determination for general household electricity tariff (Tariff 11). For 2018-19, the QCA determined Tariff 11 will decrease by 1.3%. However, existing rebate values will not be decreased and will continue to apply in 2018-19. |
Electricity Rebate Scheme
The Electricity Rebate Scheme provides a rebate of up to approximately $341 per annum, to assist with the cost of domestic electricity supply to the home of eligible holders of a Pensioner Concession Card, a Queensland Seniors Card or a Department of Veterans’ Affairs Gold Card (and receive a War Widow/er Pension or special rate Totally or Permanently Incapacitated Pension).
Additionally, the rebate was extended to Commonwealth Health Care Card Holders and asylum seekers from 1 January 2017, allowing an estimated 157,000 additional Queensland families to access the rebate.
149
Budget Strategy and Outlook 2018-19
Electricity Asset Ownership Dividend
The Electricity Asset Ownership Dividend is providing Queensland households with a $50 electricity rebate in 2017-18 and 2018-19. This initiative is funded from the dividends of Queensland’s government-owned corporations and forms part of the $2 billion Affordable Energy Plan.
Pensioner Rate Subsidy Scheme
The Pensioner Rate Subsidy Scheme offers a 20% subsidy (up to a maximum of $200 per annum) to lessen the impact of local government rates and charges on pensioners, thereby assisting them to continue to live in their own homes.
South East Queensland Pensioner Water Subsidy Scheme
The South East Queensland (SEQ) Pensioner Water Subsidy Scheme provides a subsidy of up to $120 per annum to eligible pensioner property owners in the SEQ Water Grid to lessen the impact of water prices. This subsidy is in addition to the Pensioner Rate Subsidy Scheme.
Home Energy Emergency Assistance Scheme
The Home Energy Emergency Assistance Scheme provides emergency assistance of up to $720 once in a two year period to assist low income households experiencing a short-term financial crisis and who are unable to pay their current electricity and/or reticulated natural gas account. It is not a requirement for the claimant to hold a concession card.
Electricity Life Support Concession Scheme
The Electricity Life Support Concession Scheme is aimed at assisting seriously ill people who use home based life support systems by providing a rebate of up to approximately $694 per annum for users of oxygen concentrators and a rebate of up to approximately $465 per annum for users of kidney dialysis machines to meet their electricity costs. The concession is paid quarterly and is subject to the patient being medically assessed in accordance with Queensland Health eligibility criteria.
Reticulated Natural Gas Rebate Scheme
The Reticulated Natural Gas Rebate Scheme provides a rebate of up to approximately $73 per annum to assist with the cost of reticulated natural gas supplied to the home of eligible holders of a Pensioner Concession Card, Queensland Seniors Card or a Department of Veterans’ Affairs Gold Card (and receive the War Widow/er Pension or special rate Totally or Permanently Incapacitated Pension).
Medical Cooling and Heating Electricity Concession Scheme
The Medical Cooling and Heating Electricity Concession Scheme provides a rebate of up to approximately $341 per annum for eligible concession card holders with a medical condition who have dependence on air conditioning to regulate body temperature.
150
Budget Strategy and Outlook 2018-19
| Table A.2.3 | Department of Education |
| | | | | | | | |
Concession | | 2017-18
Est. Act.
$ million | | | 2018-19
Estimate
$ million | |
Textbook and Resource Allowance1 | | | 57.9 | | | | 61.2 | |
School Transport Assistance for Students with Disabilities1 | | | 40.7 | | | | 43.7 | |
Living Away from Home Allowance Scheme2 | | | 8.3 | | | | 8.4 | |
Tuition Fee Exemptions/Waivers - Dependants of International Students2 | | | 6.8 | | | | 7.0 | |
Non-Government Schools Transport Assistance Scheme2 | | | 6.0 | | | | 6.2 | |
Dalby State High School - Bunya Campus Residential Facility | | | 2.7 | | | | 2.7 | |
Spinifex State College - Mount Isa Student Residential Facility | | | 1.1 | | | | 1.1 | |
Distance Education - Information and Communication Technology Subsidy Scheme | | | 0.8 | | | | 0.8 | |
Distance Education - Non-Government Student Fee Subsidy | | | 0.5 | | | | 0.5 | |
Total | | | 124.8 | | | | 131.6 | |
Notes:
| 1. | The variance is due to a combination of indexation and student enrolment growth. |
| 2. | The variance is due to indexation. |
Textbook and Resource Allowance
The Textbook and Resource Allowance is available for all parents/caregivers of secondary school age students attending State and approved non-government schools, to assist with the cost of textbooks and learning resources. Parents generally sign over this allowance to the school to reduce the fees associated with participating in the school’s textbook and resource scheme. In 2018, the rates per annum are $125 for students in Years 7 to 10 and $271 for students in Years 11 and 12.
School Transport Assistance for Students with Disabilities
School Transport Assistance for Students with Disabilities is provided for eligible students to attend State school programs that meet their individual education needs. This transport assistance includes the provision of taxis or specialised contracted minibuses, payment of fares on regular buses or trains, or an allowance for parents who drive their children to school. The benefit level is to a maximum of $400 per week, per student, however in exceptional circumstances higher amounts may be approved. A separate scheme is in place for students with disabilities attending non-government schools (refer ‘Non-Government Schools Transport Assistance Scheme’).
The Department of Education is working with the Department of Transport and Main Roads (DTMR) to establish a long-term solution for the delivery of school transport assistance for students with disabilities under the National Disability Insurance Scheme (NDIS).
151
Budget Strategy and Outlook 2018-19
Living Away from Home Allowance Scheme
The Living Away from Home Allowance Scheme provides financial assistance to support Queensland families and targets geographically isolated families. The scheme meets the costs of children who are required to live away from home to attend schools. This concession is available to Queensland students attending both state and non-government schools. The benefits available for eligible students in 2018 are:
| • | | Remote Area Allowance – assistance of $2,354 per annum is available to students attending campuses of the Australian Agricultural College Corporation in lieu of Year 11 and 12. |
| • | | Remote Area Tuition Allowance – primary students up to $3,744 per annum and secondary students up to $5,391 per annum. |
| • | | Remote Area Travel Allowance – available where the distance from the family home to the boarding location is at least 50km. Benefit levels depend on the distance travelled, and range from $142 to a maximum of $1,727 per annum. |
| • | | Remote Area Disability Supplement – available to students with disabilities who incur additional costs associated with living away from home to attend school. Benefits are up to $7,659 per student per annum. |
Tuition Fee Exemptions/Waivers – Dependants of International Students
This concession is available for dependants of international students. It allows students who meet the approved exemption criteria, and wish to enrol their child in Preparatory Year (Prep) to Year 12 of schooling, to be exempt from paying dependant tuition fees. The exemption only applies for the duration of the main temporary visa holder’s (parent) course of study in Queensland. A dependant student (Prep to Year 12) of a temporary visa holder may also be eligible for a tuition fee waiver in certain circumstances, including financial hardship. The estimated average amount exempted or waived per student is $7,818 for the 2018-19 financial year.
Non-Government Schools Transport Assistance Scheme
The Non-Government Schools Transport Assistance Scheme assists families by providing funding towards the transport costs of students attending non-government schools outside of the Brisbane City Council area. Under the scheme, reimbursement is provided for transport expenses above a set weekly threshold amount. In 2018, the threshold is $33 per week for families, or $25 for families with a Health Care Card, Pensioner or Department of Veterans’ Affairs Pensioner Card.
The program also assists families of students with disabilities who attend a non-government school. The level of assistance provided is dependent on the type of transport needed and travel assistance already provided by DTMR. For families using taxis, assistance is capped at $300 per week.
The Department of Education is working with DTMR to establish a long-term solution for the delivery of school transport assistance for students with disabilities under the NDIS.
152
Budget Strategy and Outlook 2018-19
Dalby State High School – Bunya Campus Residential Facility
The Dalby State High School – Bunya Campus Residential Facility provides affordable residential accommodation for secondary school students in a boarding facility. The concession particularly targets secondary school students from rural and remote communities, however, any secondary age student is eligible. Students accommodated at the residential facility are enrolled at Dalby State High School and participate in agricultural education programs.
Spinifex State College – Mount Isa Student Residential Facility
The Spinifex State College – Mount Isa Student Residential Facility provides an affordable residential facility in Mount Isa for students from the north-western area of the State whose home community does not provide secondary schooling. The funding meets the cost of wages for the residential college, increasing the affordability of the accommodation rates charged to students.
Distance Education – Information and Communication Technology Subsidy Scheme
The Distance Education – Information and Communication Technology Subsidy Scheme provides assistance to students enrolled in a school of distance education that are geographically isolated or in the medical category.
The scheme provides $250 per annum to assist with purchasing, replacing or upgrading computer hardware for students in the distance/geographically isolated and medical categories, and $500 per annum to assist students in the distance/geographically isolated category to meet the costs of broadband internet access and download charges for the home classroom. Eligible students also receive access to free software licences.
Distance Education – Non-Government Student Fee Subsidy
The Distance Education – Non-Government Student Fee Subsidy is available to students who are enrolled in non-government schools and also choose to access distance education subjects. It provides an average annual subsidy of approximately $1,343 per distance education subject enrolment.
This subsidises approximately 50% of the total average cost per annum of providing a subject through distance education for non-government school students. The concession contributes towards the State continuing to make distance education available to non-government schools, ensuring the widest possible subject choice for students, while recovering a proportion of the teaching and overhead costs.
153
Budget Strategy and Outlook 2018-19
| Table A.2.4 | Department of Employment, Small Business and Training |
| | | | | | | | |
Concession | | 2017-18
Est. Act.
$ million | | | 2018-19
Estimate
$ million | |
User Choice - Apprentice and Trainee Training Subsidy1 | | | 191.5 | | | | 202.0 | |
Vocation Education and Training (VET) - Certificate 3 Guarantee Tuition Fee Subsidy1 | | | 172.8 | | | | 182.1 | |
VET - Higher Level Skills Tuition Fee Subsidy1 | | | 63.4 | | | | 67.0 | |
Travel and Accommodation Subsidy | | | 2.0 | | | | 2.0 | |
Total | | | 429.7 | | | | 453.1 | |
Note:
| 1. | The variance is due to the anticipated increase in activity due to the demand driven nature of the programs. |
User Choice – Apprentice and Trainee Training Subsidy
The User Choice – Apprentice and Trainee Training Subsidy program provides government funding towards the costs of training and assessment for eligible Queensland apprentices and trainees or complementary pathways leading to apprenticeship and traineeship outcomes. The subsidy is available to public and private registered training organisations (pre-approved as pre-qualified suppliers) to subsidise tuition fees to reduce the cost of required accredited, entry level training for apprentices and trainees. The program provides greater flexibility for apprentices, trainees and their employers to select a preferred registered training organisation and to negotiate the type of training to meet their specific needs.
The value of this subsidy for each qualification ranges from $1,140 to $50,720 depending on the eligibility and qualification subsidised. The average subsidy value is $9,007.
Vocation Education and Training (VET) – Certificate 3 Guarantee Tuition Fee Subsidy
The Vocational Education and Training (VET) Certificate 3 Guarantee Tuition Fee Subsidy provides a government subsidy to allow eligible Queenslanders to obtain their first post-school Certificate III qualification to help them gain a job or to improve their employment status. The subsidy is available to private and public registered training organisations (pre-approved as pre-qualified suppliers) to subsidise tuition fees paid by students undertaking eligible vocation education and training qualifications (primarily Certificate III qualifications).
The value of this subsidy for each qualification ranges from $440 to $6,260 depending on the eligibility and qualification subsidised. The average subsidy value is $2,836.
154
Budget Strategy and Outlook 2018-19
VET – Higher Level Skills Tuition Fee Subsidy
The VET Higher Level Skills Tuition Fee Subsidy provides a government subsidy to eligible students and employers to undertake a priority Certificate IV, diploma or advanced diploma or industry endorsed skill set. This program will help individuals gain employment in a critical occupation, career advancement in a priority industry or transition to university to continue their studies. The subsidy is available to private and public registered training organisations (pre-approved as pre-qualified suppliers) to subsidise tuition fees paid by students undertaking eligible vocational education and training qualifications at Certificate IV or above.
The value of this subsidy for each qualification ranges from $1,105 to $8,190 depending on the eligibility and qualification subsidised. The average subsidy value is $4,078.
Travel and Accommodation Subsidy
The Travel and Accommodation Subsidy provides financial assistance to Queensland apprentices and trainees for travel expenses incurred in attending off the job training at a registered training organisation. To be eligible, apprentices must attend the closest registered training organisation that offers the required qualification and travel a minimum of 100 kilometres (km) return from their usual place of residence to the registered training organisation. The subsidy provides for:
| • | | return land travel to the registered training organisation of 15 cents per km for distances between 100-649 km, increasing to 19 cents per km for distances between 650-1,400 km |
| • | | cost of ferry travel if necessary |
| • | | a return economy air ticket to the location of the registered training organisation if necessary |
| • | | accommodation assistance of $28 per day for overnight stay within Queensland and $68 for interstate travellers, if it is necessary to live away from their usual place of residence to attend training. |
155
Budget Strategy and Outlook 2018-19
| Table A.2.5 | Department of Environment and Science |
| | | | | | | | |
Concession | | 2017-18
Est. Act.
$ million | | | 2018-19
Estimate
$ million | |
Queensland Performing Arts Trust - Arts concessional entry fees | | | 2.0 | | | | 2.0 | |
Tour fee and access permit concessions | | | 1.6 | | | | 1.6 | |
Queensland Museum - Arts concessional entry fees | | | 1.5 | | | | 1.5 | |
Queensland Performing Arts Trust - Venue hire rebates | | | 0.6 | | | | 0.6 | |
State Library of Queensland - Venue hire rebates | | | 0.5 | | | | 0.5 | |
Arts Queensland - Discount on property lease rentals1 | | | 0.7 | | | | 0.4 | |
Arts Queensland - Venue hire rebates | | | 0.3 | | | | 0.3 | |
Queensland Art Gallery - Arts concessional entry fees2 | | | 1.6 | | | | 0.2 | |
Total | | | 8.8 | | | | 7.1 | |
Notes:
| 1. | The decrease from 2017-18 estimated actual to 2018-19 budget is mainly due to a reduction in the market rental assessment for Judith Wright Centre of Contemporary Arts budgeting a 5% vacancy rate in 2018-19 and the planned six months closure of Centre of Contemporary Arts, Cairns for renovation. |
| 2. | Decrease in concessions in 2018-19 is due to the major exhibition in 2018-19 (The 9th Asia Pacific Triennial of Contemporary Art) being a free exhibition. Overall concession in previous year was higher as a result of better than expected attendance at Marvel: Creating the Cinematic Universe and a greater than expected proportion of concession holders. |
Queensland Performing Arts Trust – Arts concessional entry fees
Concessional entry fees are offered for specific Queensland Performing Arts Trust productions and to provide support for other not-for-profit theatre companies to enable tickets to be sold at concessional prices. The level of concession provided varies depending on the number and size of events being held each year.
Tour fee and access permit concessions
Tour fee, access permit and camping fee concessions are available in specified protected areas including David Fleay Wildlife Park, Mon Repos Conservation Park, St Helena Island National Park, Walk-About Creek Wildlife Centre, Fort Lytton National Park, Cooloola Recreation Area, Moreton Island and Fraser Island.
Queensland Museum – Arts concessional entry fees
Queensland Museum provides concessional entry fees to seniors, students, children, families and a variety of concession card holders for ticketed exhibitions at Queensland Museum and Sciencentre and for general entry to Cobb & Co Museum Toowoomba, The Workshops Rail Museum Ipswich and Museum of Tropical Queensland Townsville. Concessions are also provided to targeted groups, such as schools, to encourage visits to museums. The level of concession provided varies depending on the venue and the event.
156
Budget Strategy and Outlook 2018-19
Queensland Performing Arts Trust – Venue hire rebates
Venue hire rebates are offered to Government funded cultural organisations, charitable organisations, government departments and educational institutions. Organisations currently receiving discounts are Queensland Symphony Orchestra, Opera Queensland, Queensland Theatre Company and Queensland Ballet.
State Library of Queensland – Venue hire rebates
State Library of Queensland provides venue hire concessions to targeted community and non-profit groups including cultural and charitable organisations and educational institutions in order to support events and programs directly linked to State Library of Queensland’s services, programs and activities.
Arts Queensland – Discount on property lease rentals
Property lease rentals are provided to arts and cultural organisations at a discount from market rental rates at the Judith Wright Centre of Contemporary Arts and the Cairns Centre of Contemporary Arts. Discounts range from 20% to 100% of the market rate (dependent on location) of the commercial office space. Further discounts on specialist rehearsal and gallery space are given as negotiated at the time of entering the lease and dependent on the individual arts or cultural organisation and its funding.
Arts Queensland – Venue hire rebates
Venue hire rebates support Queensland Government funded arts organisations and professional artists to develop and present new work at the Judith Wright Centre of Contemporary Arts and the Cairns Centre of Contemporary Arts.
Queensland Art Gallery – Arts concessional entry fees
Queensland Art Gallery’s ticket prices are set to ensure that they are affordable and to maximise attendance, with additional concessions provided to seniors, students, children, families and a variety of concession card holders. The purpose of the Queensland Art Gallery Arts concessional entry fees concession is to contribute to the cultural, social and intellectual development of Queenslanders, and encourage diverse audiences.
157
Budget Strategy and Outlook 2018-19
| Table A.2.6 | Department of Housing and Public Works |
| | | | | | | | |
Concession | | 2017-18
Est. Act.
$ million | | | 2018-19
Estimate
$ million | |
Government managed housing rental rebate1 | | | 396.4 | | | | 406.1 | |
National Rental Affordability Scheme2 | | | 28.4 | | | | 29.3 | |
Home Assist Secure2 | | | 19.0 | | | | 19.0 | |
Non-residential buildings - subsidised rents | | | 5.6 | | | | 5.9 | |
Rental Bond Loans | | | 1.0 | | | | 1.0 | |
Queensland Recreation Centres - Concessional usage rates | | | 0.3 | | | | 0.3 | |
Non-government managed housing3 | | | — | | | | — | |
Total | | | 450.7 | | | | 461.6 | |
Notes:
| 1. | The variance is primarily due to lower forecast growth in tenant rental income. |
| 2. | The variance is due to the expected increase in the indexation rate for the 2018-19 scheme. |
| 3. | The value of this concession arrangement cannot be easily quantified. |
Government managed housing rental rebate
The Government managed housing rental rebate targets low income families and individuals and represents the difference between the rents that would be payable in the private market and rent that is charged by Government based on household income.
Assistance is provided to approximately 53,000 households. The estimated average yearly subsidy per household for 2018-19 is $7,623.
National Rental Affordability Scheme
The National Rental Affordability Scheme (NRAS) is an Australian Government initiative, delivered in partnership with the Queensland Government, to increase the supply of new affordable rental housing. The scheme provides financial incentives to investors to build well located dwellings and rent them to eligible low to moderate income households, at a discounted rate at least 20% below market rent.
Under the scheme, the concession to the tenant is provided by the property owner. Due to the nature of the arrangement, the overall value of the concession to the tenant cannot be quantified. In 2018-19, the Government has allocated $29.3 million for the payment of financial incentives to NRAS investors who are then required to discount rents to tenants.
158
Budget Strategy and Outlook 2018-19
Home Assist Secure
Home Assist Secure provides free safety related information and referrals, and subsidised assistance to eligible clients unable to undertake or pay for critical maintenance services without assistance. To be considered for assistance, home owners or tenants over the age of 60 or of any age with a disability must hold a Pensioner Concession Card and be unable to complete the work themselves. In addition, they must be unable to access assistance from other services. Subsidised assistance can be undertaken for maintenance, repairs and minor modifications where the total cost for any one job or service does not exceed $1,500. Labour costs (up to $500 per household per year) for the assistance provided are subsidised by Home Assist Secure while the balance of the costs (including all materials) are met by the client.
Home Assist Secure targets home owners and those in rental housing who are over 60 years of age or have a disability, and who require assistance to remain living in their home. In 2018-19, $19 million in grants to Home Assist Secure providers will be issued to ensure the ongoing delivery of assistance to those in greatest need. It is estimated that over 47,500 households will be assisted.
Non-residential buildings – subsidised rents
Accommodation is provided to 40 community, education, arts and not-for-profit organisations in Government owned non-residential buildings. Tenures for the occupancies are by way of leases, licences or month to month arrangements. Rents paid by the organisations are often below independently assessed market rent levels. Subsidised rental arrangements are provided to 24 properties comprising a total floor area of approximately 25,038 square metres. The total subsidy is calculated by deducting the actual amount paid by the occupants from the total estimated annual market rent for the office space.
Rental Bond Loans
The Government provides interest-free rental bond loans equivalent to a maximum amount of four weeks rent to people who cannot afford to pay a full bond to move into private rental accommodation; reducing the need for more costly, subsidised housing assistance. The interest-free bond loan targets low-income households and can stabilise tenancies, prevent households from entering the cycle of homelessness and engaging with fringe, high interest credit providers. The concession represents the interest saving for the client on the bond loan. In 2018-19, $27.7 million in bond loans will be advanced to an estimated 24,000 clients.
Queensland Recreation Centres – Concessional usage rates
Concessional usage rates are offered to students and children 17 years and under, for the use of Queensland Recreation Centres at Currimundi and Tallebudgera. These concessional rates provide a discount of between 3.25% to 18% of the full charge to approximately 34,000 recipients.
159
Budget Strategy and Outlook 2018-19
Non-government managed housing
The Government provides contributions to social housing providers, including capital grants, granted land or properties, or recurrent funding, to assist in increasing housing affordability and access to social housing. Due to the nature of the arrangement, the overall value of the concession provided by the Government cannot be easily quantified.
Rents charged for social housing managed by the providers are based on 25% of a household’s assessable income or the market rent, whichever is lower, which may substantially reduce accommodation costs for eligible individuals and families.
| Table A.2.7 | Department of Justice and Attorney-General |
| | | | | | | | |
Concession | | 2017-18
Est. Act.
$ million | | | 2018-19
Estimate
$ million | |
Public Trustee of Queensland - Concessions | | | 36.2 | | | | 37.7 | |
Court Services - Civil Court | | | 22.8 | | | | 24.2 | |
Queensland Civil and Administrative Tribunal1 | | | 19.4 | | | | 18.7 | |
Blue Card - Volunteer Applicants | | | 10.6 | | | | 10.3 | |
Body Corporate and Community Management - Dispute Resolution | | | 2.2 | | | | 2.2 | |
Total | | | 91.2 | | | | 93.1 | |
Note:
| 1. | The variance is mainly due to the decrease in the Tribunal’s rental expenses in 2018-19. |
Public Trustee of Queensland – Concessions
The Public Trustee of Queensland (the Public Trustee) is a self-funding organisation and uses a scale of fees which is designed to reflect a fair cost for the services provided.
The Public Trustee has established a safety net limit on the annual fees payable by certain clients which provides for a rebate of fees for some clients with limited assets. The rebate is applied to clients such as financial administration clients with impaired capacity, or estate administration clients of limited means. The Public Trustee also provides Will making services at no cost for all Queenslanders.
In addition, the Public Trustee provides funding to the Public Guardian and financial assistance under the Civil Law Legal Aid Scheme administered by Legal Aid Queensland, to enable these organisations to provide services to the people of Queensland.
160
Budget Strategy and Outlook 2018-19
Court Services – Civil Court
The Supreme, District and Magistrates Courts hear civil disputes between two or more parties (people or organisations) where one party sues the other, usually to obtain compensation, or seek some other remedy. These disputes may involve anything from defamation to outstanding debts. Civil Court Fees are prescribed under the Uniform Civil Procedure (Fees) Regulation 2009 for proceedings commenced in civil matters and are set below full cost recovery to ensure that civil remedies are accessible to all Queenslanders.
Queensland Civil and Administrative Tribunal
The Queensland Civil and Administrative Tribunal (QCAT) is an independent tribunal which makes decisions and resolves disputes across a wide range of jurisdictions for the community. Fees for these services are below cost recovery to ensure services are accessible, fair and inexpensive. QCAT provides human rights services with no application fees for matters in guardianship and administration of adults, children and young people and anti-discrimination.
Blue Card – Volunteer Applicants
Individuals providing child-related services or conducting child-related activities in regulated service environments are required to undergo an assessment of their police and relevant disciplinary information, and if approved, are issued with a blue card. A blue card is valid for three years unless cancelled or suspended earlier. The application fee for a blue card is $90.25 (as at 1 July 2018). Since the inception of the blue card system in 2001, Government has met the cost of blue card assessment for volunteer applicants.
Body Corporate and Community Management – Dispute Resolution
The Office of the Commissioner for Body Corporate and Community Management provides a dispute resolution service to parties unable to resolve disputes themselves. The service consists of conciliation, with the aim of achieving a voluntary agreement, and adjudication, which results in a formal order. The service is delivered below full cost recovery so as to not restrict access to justice due to affordability reasons.
161
Budget Strategy and Outlook 2018-19
| Table A.2.8 | Department of Natural Resources, Mines and Energy |
| | | | | | | | |
Concession | | 2017-18
Est. Act.
$ million | | | 2018-19
Estimate
$ million | |
Energy Queensland - Uniform Tariff Policy (excluding Isolated Systems)1 | | | 441.1 | | | | 413.5 | |
Energy Queensland - Uniform Tariff Policy for Isolated Systems | | | 47.1 | | | | 48.3 | |
Powering Queensland Plan - Electricity Affordability Package | | | 287.4 | | | | 284.2 | |
Affordable Energy Plan - Solar & Storage Interest Free Loans Scheme2 | | | — | | | | 13.7 | |
Affordable Energy Plan - Energy Savers Program | | | — | | | | 4.0 | |
Affordable Energy Plan - Energy Savvy Families3 | | | 0.2 | | | | 3.8 | |
Affordable Energy Plan - Energy Efficiency Appliance Rebate4 | | | 19.8 | | | | — | |
Extending existing drought relief arrangements - Electricity Charge Scheme5 | | | 12.0 | | | | 10.4 | |
Cloncurry Pipeline Water Supply Subsidy | | | 6.1 | | | | 6.2 | |
Extending existing drought relief arrangements - Water Licence Fee Waiver and Land Rental Rebates | | | 4.2 | | | | 4.2 | |
Origin Energy - Uniform Tariff Policy | | | 2.7 | | | | 2.8 | |
SunWater Rural Irrigation Water Price Subsidy6 | | | 3.1 | | | | 2.4 | |
Seqwater Bulk Water Rural Irrigation Water Price Subsidy | | | 2.1 | | | | 2.1 | |
Total | | | 825.8 | | | | 795.6 | |
Notes:
| 1. | The variance between 2017-18 estimated actual and 2018-19 budget is due to Energy Queensland assuming a lower Ergon Energy distribution charge relative to the Energex charges. This is consistent with the Australian Energy Regulator’s decision for the two distribution businesses. |
| 2. | This concession will commence in June 2018. |
| 3. | This initiative provides digital electricity meters to eligible low-income families in regional Queensland to help them gain a greater understanding of when and how they use their electricity. |
| 4. | The program commenced 1 January 2018 and closes 3 June 2018. |
| 5. | The concessions can vary depending on the shires that are drought declared and the number of eligible customers. |
| 6. | The decrease in the Community Service Obligation (CSO) for 2018-19 is largely due to the price path arrangements leading to a reduction in the concession required. |
Energy Queensland – Uniform Tariff Policy (excluding Isolated Systems)
The Energy Queensland – Uniform Tariff Policy (excluding Isolated Systems) ensures that, where possible, all Queensland non-market electricity customers of a similar type pay a similar price for electricity regardless of where they live. As the notified prices do not reflect the full cost of electricity supply for most remote and regional Queenslanders, a subsidy is provided. The community service obligation (CSO) payment to the regional retailer Energy Queensland covers the difference between the revenue earned by charging customers notified prices and the actual costs in the regional areas (due to differences in network costs and energy losses).
162
Budget Strategy and Outlook 2018-19
Energy Queensland – Uniform Tariff Policy for Isolated Systems
The Energy Queensland – Uniform Tariff Policy for Isolated Systems ensures that, where possible, all Queensland non-market electricity customers of a similar type pay a similar price for electricity regardless of where they live. Energy Queensland owns and operates 33 isolated power stations which supply electricity to remote and isolated Queensland communities. Energy Queensland retails electricity to these customers at the notified prices, and the Government provides funding to the retailer to cover the difference between the revenue earned and the cost of supplying electricity to these customers.
Powering Queensland Plan – Electricity Affordability Package
The Powering Queensland Plan provided one-off funding in 2016-17 of $771 million to support the stabilisation of electricity prices for Queensland consumers, by funding the removal of costs of the Solar Bonus Scheme from electricity prices for three years from 1 July 2017 and directing Energy Queensland to remove costs from network charges. This will place downward pressure on electricity prices for the typical household, and provide an average saving of $51 for households and $90 for small businesses, compared with the increase which would have occurred without Government intervention. It is estimated that the benefit to Queenslanders in 2018-19 as a result of this measure will be $284.2 million.
Affordable Energy Plan – Solar & Storage Interest Free Loans Scheme
This scheme is designed to assist households and small businesses address electricity affordability by providing upfront capital to those who otherwise would not have access to funds to invest in rooftop solar and battery energy storage technology.
Affordable Energy Plan – Energy Savers Program
The $20 million Business Energy Savers Program, an initiative under the Affordable Energy Plan, provides free energy audits for agricultural customers and large business customers, and co-contributions to fund energy efficiency upgrades. It includes a 3 year extension of the existing Energy Savers Plus Program (for agricultural businesses) and the Large Customer Adjustment Program (for large electricity users).
Under the expanded Energy Savers Plus Program, 200 additional audits for agricultural customers will be completed. In addition to this, co-contribution grants of up to $20,000 will be made available to assist businesses in implementing the recommendations from the audit.
Under the expanded Large Customer Adjustment Program an additional 30 audits of large customers will be completed and co-contributions capped at up to $250,000 will be made available to help encourage the business to implement the audit recommendations.
Affordable Energy Plan – Energy Savvy Families
Under this plan, $4 million has been provided over two years to enable the provision of digital electricity meters as well as providing educational material and information to low income families in regional Queensland to help them better understand and manage their energy use.
163
Budget Strategy and Outlook 2018-19
Affordable Energy Plan – Energy Efficiency Appliance Rebate
The program was designed to assist Queensland households improve their energy efficiency through providing a rebate to help purchase high energy efficient appliances. The program commenced on 1 January 2018 and closed 3 June 2018.
The rebates applied to purchases on or after 1 January 2018 for the following household appliances:
| • | | $200 for a 4 star or higher energy rated washing machine |
| • | | $250 for a 4 star or higher energy rated refrigerator |
| • | | $300 for a 4 star or higher energy rated air conditioner. |
There was a limit of 1 rebate application per household.
Extending existing drought relief arrangements – Electricity Charge Scheme
Drought Relief Arrangements provide relief to farming customers from fixed charges for electricity accounts that are used to pump water for farm or irrigation purposes during periods of drought. The concessions can vary depending on the shires that are drought declared and the number of eligible customers.
Cloncurry Pipeline Water Supply Subsidy
North West Queensland Water Pipeline Limited (NWQWP), a SunWater Limited (SunWater) subsidiary, owns and operates the Cloncurry Pipeline between the Ernest Henry Mine and Cloncurry. The pipeline guarantees Cloncurry Shire Council’s long-term water supply and supports industrial development in the region. As the construction and operation of the Cloncurry Water Pipeline is a non-commercial investment, the Government provides funding to NWQWP to ensure that SunWater receives a return on its investment in the pipeline.
Extending existing drought relief arrangements – Water Licence Fee Waiver and Land Rental Rebates
As part of the Government’s drought assistance package, the annual water licence fee of $82 will be waived for 2018-19 for landholders in Local Government Areas (LGA) that are drought declared and other properties that are individually drought declared. The estimate is dependent on drought declarations and the demand for drought assistance.
Category 11 Grazing and Primary Production landholders under the Land Act 1994 will also be eligible to a rent rebate in 2018-19. The rebate is available to lessees, other than those on minimum rent that are in a drought declared LGA and to individually drought declared properties. In addition to this rebate, drought declared landholders will be granted a hardship deferral for required rent payments.
164
Budget Strategy and Outlook 2018-19
Origin Energy – Uniform Tariff Policy
The Origin Energy – Uniform Tariff Policy ensures that, where possible, all Queensland non-market electricity customers of a similar type pay the similar price for electricity regardless of where they live. Origin Energy retails electricity to approximately 5,450 Queensland non-market customers in the Goondiwindi, Texas and Inglewood areas who are supplied electricity through the New South Wales Essential Energy distribution network.
The Government provides a rebate to these customers, via a CSO payment to Origin Energy, to ensure they pay no more for electricity than similar customers in Queensland. Therefore, the CSO amount depends on the relative difference between Queensland and New South Wales retail electricity tariffs for non-market customers.
SunWater Rural Irrigation Water Price Subsidy
SunWater owns and operates water supply schemes across regional Queensland. As the owner of SunWater, the Government decides how much to recover of SunWater’s costs through irrigation prices. Currently, SunWater’s irrigation water prices for some schemes are set below the level necessary to recover the cost of supplying water to the irrigators. Government funding is provided to SunWater to offset the reduced revenue and to ensure that increases in water prices paid by rural irrigation customers to recover costs are gradual.
Seqwater Bulk Water Rural Irrigation Water Price Subsidy
Seqwater owns and operates water supply schemes across SEQ which also supply bulk water services to rural irrigation customers. Currently Seqwater’s rural irrigation prices for some schemes are set below the level necessary to recover the cost of supplying water to the irrigators. Government funding is provided to Seqwater to offset the reduced revenue and to ensure that increases in water prices paid by rural irrigation customers to recover costs are gradual.
Urban Water Price Path
As foreshadowed in the 2017-18 State Budget, the concessional period for the South East Queensland urban bulk water price path, which commenced in 2008, is ending as prices in South East Queensland converge to a common rate reflective of the actual cost of supply. Accordingly the Urban Water Price Path is not included in the 2018–19 Concession Statement and is not anticipated to be included in future years.
165
Budget Strategy and Outlook 2018-19
| Table A.2.9 | Department of Transport and Main Roads |
| | | | | | | | |
Concession | | 2017-18
Est. Act.
$ million | | | 2018-19
Estimate
$ million | |
General Public Transport Concessions (South East Queensland)1 | | | 1,289.2 | | | | 1,440.1 | |
Rail Network and Infrastructure Funding | | | 591.9 | | | | 618.3 | |
General Public Transport Concessions (Regional Queensland) | | | 238.8 | | | | 246.7 | |
Vehicle and boat registration concessions | | | 168.6 | | | | 177.5 | |
School Transport Assistance Scheme | | | 133.8 | | | | 138.1 | |
TransLink Transport Concessions (South East Queensland) | | | 74.3 | | | | 75.6 | |
Rail Concession Scheme | | | 36.5 | | | | 37.4 | |
Livestock and Regional Freight Contracts | | | 33.2 | | | | 34.7 | |
Other transport concessions (Regional Queensland) and taxi subsidies2 | | | 25.1 | | | | 20.9 | |
Designated Public Transport Concessions for Seniors Card Holders | | | 3.8 | | | | 3.8 | |
Practical Driving Test | | | 3.5 | | | | 3.6 | |
Commercial ship registration and licensing3 | | | 2.4 | | | | — | |
Total | | | 2,601.1 | | | | 2,796.7 | |
Notes:
| 1. | The increase in 2018-19 is due to annual cost indexation, increased finance lease costs and availability and operator payments associated with the acquisition of New Generation Rollingstock. |
| 2. | This concession is estimated to decrease in 2018-19 as the current concessions associated with the Taxi Subsidy Scheme will transition to the NDIS funding model. |
| 3. | The reduction in the amount of concession is due to the Australian Maritime Safety Authority (AMSA) increasing its effort in regulating domestic commercial vessels while Maritime Safety Queensland has correspondingly reduced its efforts in this area. From 2018-19, AMSA will provide service delivery as national regulator to the commercial domestic vessel fleet and will also set and collect fees. |
General Public Transport Concessions (South East Queensland)
The General Public Transport Concessions (South East Queensland) represents the direct funding contribution that Government makes towards the cost of operating public transport services within South East Queensland. This contribution effectively reduces the ticket price paid by all public transport users on bus, rail and ferry services, increasing the affordability of these services.
Rail Network and Infrastructure Funding
Rail network and infrastructure funding ensures that the State supported rail network is safe, reliable and fit for purpose. The contract also provides funding to Queensland Rail to support major capital projects and related asset strategies. The funding provided via this contract directly benefits customers of the State supported rail network, including both freight and passengers. Without this funding, rail access charges (including public transport fares) would be significantly higher for all users of the rail network.
166
Budget Strategy and Outlook 2018-19
General Public Transport Concessions (Regional Queensland)
The General Public Transport Concessions (Regional Queensland) represents the financial contribution that Government provides across a range of transport services in regional Queensland. The impact of this contribution benefits all public transport users through reduced transport fares. This concession covers:
| • | | TravelTrain (excluding the ‘Rail Concession Scheme’ for eligible pensioners, veterans and seniors) |
| • | | subsidies for Kuranda Scenic Railway |
| • | | subsidies for Heritage Rail Services |
| • | | subsidies for regional bus and ferry operators (excluding concessional top up amounts and School Transport Assistance Scheme related amounts) |
| • | | subsidies for the Rail XPT Service (Sydney-Brisbane) and Savannahlander (Atherton Tableland) |
| • | | subsidies for air services to remote and rural communities within the State |
| • | | subsidies for long distance coach services to rural/remote communities within the State. |
Vehicle and boat registration concessions
Registration concessions for light and heavy motor vehicles and recreational boats are provided to holders of the Pensioner Concession Card, Queensland Seniors Card and to those assessed by the Department of Veterans’ Affairs as meeting the necessary degree of incapacity or impairment. The concession is aimed at improving access to travel for pensioners, seniors and persons with a disability by providing a reduced rate of registration fees. For most eligible card holders, a concession for a family 4-cylinder vehicle would reduce the 12 month registration charge from $321.35 to $160.65. For a recreational boat up to and including 4.5 metres in length, the concession reduces the registration charge from $86.75 to $43.35 (based on registration charges at 1 July 2018).
A Special Interest Vehicle (SIV) registration concession is offered for motor vehicles that have low use associated with vintage and historic and street rod car club events. A 12 month registration for a 6-cylinder SIV concession reduces registration from $508.85 to $90.55. A concession is also available for specific purposes such as water, mineral or oil exploration and bee keeping. Other motor vehicle and recreational boat registration concessions are also provided to primary producers, local governments, charitable and community service organisations, and people living in remote areas without access to the wider road network.
School Transport Assistance Scheme
The School Transport Assistance Scheme assists students that do not have a school in their local area or who are from defined low income groups with travel costs. The scheme provides funding to reduce the cost of travelling to school on bus, rail and/or ferry services, with allowances for private vehicle transport in certain circumstances. A typical concession would be to fully fund the cost of travel from home to the nearest State primary or high school where no local primary or high school is available (for example, from Bargara to Bundaberg High School).
167
Budget Strategy and Outlook 2018-19
TransLink Transport Concessions (South East Queensland)
The TransLink Transport Concessions (South East Queensland) are provided by the Government to ensure access and mobility for Queenslanders who require assistance because of age, disability or fixed low income. Passengers entitled to receive public transport concessions include holders of a Pensioner Concession Card, Veterans’ Affairs Gold Card, Seniors Card (all states and territories), Companion Card, Vision Impairment Travel Pass, Total Permanent Incapacitated (TPI) Veteran Travel Pass, children, as well as secondary and tertiary students. In addition to these existing groups, concession groups now include Newstart and Youth Allowance (Job Seeker) recipients and asylum seekers. In February 2018, White Card Holders joined the groups eligible for public transport concessions. Under the new 2018 fares, for a peak one zone journey using a go card, the concession will reduce an adult fare from $3.25 to $1.63.
Rail Concession Scheme
The Queensland Rail Concession Scheme improves the affordability of long distance and urban rail services for eligible pensioners, veterans, seniors and current/past rail employees with 25 years of service. Assistance for long distance rail services is provided through discounted fares and free travel vouchers. For TravelTrain (long distance rail) services, depending on the service, the concession may be for free travel for up to four trips per year for Queensland pensioners (subject to availability of seats and payment of an administration fee).
Livestock and Regional Freight Contracts
The Livestock and Regional Freight Contracts provide funding to support the movement of cattle (via rail only) and freight (via road and rail) to and from regional areas of Queensland. The funding provided directly benefits the cattle industry and enables regional Queensland communities to maintain employment and directly benefits those communities who are reliant on rail freight services by reducing the cost of these freight services for users.
Other transport concessions (Regional Queensland) and taxi subsidies
Other transport concessions (Regional Queensland) and taxi subsidies are provided by the Government to ensure access and mobility for Queenslanders who require assistance because of age, disability or fixed low income. Passengers entitled to receive public transport concessions include holders of a Pensioner Concession Card, Veterans’ Affairs Gold Card, Seniors Card (all states and territories), Companion Card, Vision Impairment Travel Pass, TPI Veteran Travel Pass, children, as well as secondary and tertiary students. In addition to these existing groups, new concession groups are to include Newstart and Youth Allowance (Job Seeker) recipients and asylum seekers. In February 2018, White Card holders were also added to these existing groups. The Taxi Subsidy Scheme aims to improve the mobility of persons with severe disabilities by providing a 50% concession fare up to a maximum subsidy of $25 per trip.
Concessions associated with the Taxi Subsidy Scheme are transitioning to the NDIS funding model.
168
Budget Strategy and Outlook 2018-19
Designated Public Transport Concessions for Seniors Card Holders
Designated Public Transport Concessions for Seniors Card Holders allows visitors from interstate, who hold a state or territory Seniors Card, to access public transport concessions within Queensland and is fully funded by the Queensland Government.
Practical Driving Test
As part of the State’s driver licensing arrangements, applicants for new licences are required to undertake a practical driving test. The total cost to pre-book driver examinations and to perform the practical driver assessment is not fully recovered by the fee charged ($52.68 (ex GST) as at 1 July 2018), providing a direct concession to applicants.
Commercial ship registration and licensing
The commercial ship registration and licensing concession is ceasing as the regulation of domestic commercial vessels operations is now the responsibility of the Australian Maritime Safety Authority (AMSA). For 2017-18, the commercial vessel safety program including inspection and ship operator competency audits is funded from commercial ship registration and licensing revenue. The commercial ship registration and licensing concession represents the difference between the cost of supporting the safety of commercial vessels in Queensland waters and revenue collected via commercial registration and compliance fees. The concession represents a benefit to commercial ship owners and operators.
| Table A.2.10 | Queensland Fire and Emergency Services |
| | | | | | | | |
Concession | | 2017-18
Est. Act.
$ million | | | 2018-19
Estimate
$ million | |
Emergency Management Levy Concession | | | 9.7 | | | | 10.2 | |
Total | | | 9.7 | | | | 10.2 | |
Emergency Management Levy Concession
The Emergency Management Levy applies to all prescribed properties within Queensland. The levy provides a funding base for emergency services including emergency management, fire and rescue services. Owners of prescribed properties who are in receipt of an Australian Government pension are eligible to receive a discount of 20% on the levy payable for a property that is their principal place of residence. In addition, community organisation owners of specified properties are exempt from payment of the levy.
169
Budget Strategy and Outlook 2018-19
| Table A.2.11 | Queensland Health |
| | | | | | | | |
Concession | | 2017-18
Est. Act.
$ million | | | 2018-19
Estimate
$ million | |
Oral Health Scheme1 | | | 149.2 | | | | 151.8 | |
Patient Travel Subsidy Scheme2 | | | 81.8 | | | | 84.8 | |
Medical Aids Subsidy Scheme3 | | | 40.4 | | | | 29.6 | |
Spectacle Supply Scheme | | | 9.3 | | | | 9.3 | |
Community Aids Equipment, Assistive Technologies Initiative and Vehicle Options Subsidy Scheme4 | | | 14.8 | | | | 6.2 | |
Total | | | 295.5 | | | | 281.7 | |
Notes:
| 1. | The $2.6 million increase from the 2017-18 estimated actual to the 2018-19 estimate is due to additional state funding in 2018-19 for Hospital and Health Services’ oral health services. |
| 2. | The Patient Travel Subsidy Scheme allocation is calculated on historical utilisation rates. The increase of $3.0 million from the 2017-18 estimated actual to the 2018-19 estimate is due to expected population growth and higher utilisation of the Scheme. |
| 3. | The variance is due to funding for this activity being progressively transferred to the National Disability Insurance Scheme (NDIS). |
| 4. | The variance is due to funding for this activity being progressively transferred to NDIS. The $6.2 million estimate is to address commitments carrying across from 2017-18 and residual application in 2018-19. |
Oral Health Scheme
The Oral Health Scheme provides free dental care to eligible clients and their dependants who possess a current Health Care Card, Pensioner Concession Card, Queensland Seniors Card or Commonwealth Seniors Card. The average value of a course of treatment for eligible clients is approximately $600 for general care, $1,800 for treatment involving dentures, and $265 for emergency dental care. In rural and remote areas where no private dental practitioner exists, access to dental care for the general public is provided at a concessional rate, generally 15% to 20% less than average private dental fees.
Patient Travel Subsidy Scheme
The Patient Travel Subsidy Scheme (PTSS) provides financial assistance to patients who need to access specialist medical services which are not available within their local area. The PTSS provides a subsidy towards the cost of travel and accommodation for patients and, in some cases, an approved escort.
Patients will receive fully subsidised commercial transport if arranged by Queensland Health, or will be subsidised at the economy/government discount rate (less GST). Alternatively a subsidy of 30 cents per kilometre is paid where a private vehicle is used. The accommodation subsidy is $60 per person per night for the period the patient is required to be away from home for medical reasons and when they are not in hospital, and for their escort, if approved. A subsidy of $10 per person per night is payable to patients and approved escorts who stay in private accommodation.
170
Budget Strategy and Outlook 2018-19
Medical Aids Subsidy Scheme
The Medical Aids Subsidy Scheme (MASS) provides access to funding assistance for the provision of a range of aids and equipment to eligible Queensland residents with permanent and stabilised conditions or disabilities. Aids and equipment are provided primarily to assist people to live at home therefore avoiding premature or inappropriate residential care or hospitalisation.
Subsidies vary based on service category and clinical criteria and are provided to assist with the costs of communication aids, continence aids, daily living aids, medical grade footwear, mobility aids, orthoses and oxygen. The scheme will provide over 72,000 occasions of service to approximately 48,000 clients during 2018-19.
The National Disability Insurance Scheme (NDIS) is currently being rolled out in Queensland. MASS clients who are NDIS eligible are being transitioned to the scheme with associated funding progressively cashed out to the NDIS.
Spectacle Supply Scheme
The Spectacle Supply Scheme provides eligible Queensland residents with free access to a comprehensive range of basic spectacles every two years including bifocals and trifocals. Applicants must be holders of eligible concession cards and be deemed by a prescriber to have a clinical need for spectacles.
The scheme provides around 75,000 items to approximately 72,000 clients (some clients require more than one pair of spectacles due to clinical need). The average cost of services provided to applicants is approximately $124 per item, including the costs of administering the scheme through the Medical Aids Subsidy Scheme.
171
Budget Strategy and Outlook 2018-19
Community Aids Equipment, Assistive Technologies Initiative and Vehicle Options Subsidy Scheme
The Community Aids Equipment and Assistive Technologies Initiative (CAEATI) and Vehicle Options Subsidy Scheme (VOSS) provide financial assistance to eligible Queensland residents to support them to be more independent, participate further in social and economic opportunities in the community and contribute to a better quality of life.
CAEATI funding is capped at $10,000 per client over a three year period. CAEATI includes aids, equipment and assistive technologies for postural support, communication support, community mobility and active participation.
VOSS funding is capped at $10,000 per client over a five year period. VOSS provides subsidies for a range of vehicle access options, including the subsidy of driving lessons on a suitably modified vehicle, modifications to a vehicle, purchase of a suitably modified vehicle or vehicle suitable for modification.
To receive funding through either of these schemes, an individual must be assessed as eligible for specialist disability support under the Disability Support Act 2006. Queensland resident eligibility is determined during the intake process, and confirmed as part of the assessment process.
The National Disability Insurance Scheme (NDIS) is currently being rolled out in Queensland. CAEATI and VOSS clients who are NDIS eligible are being transitioned to the scheme with associated funding progressively cashed out to the NDIS.
172
Budget Strategy and Outlook 2018-19
A.3 Concessions by entity – Government-owned Corporations
| Table A.3.1 | Energy Queensland |
| | | | | | | | |
Concession | | 2017-18
Est. Act.
$ million | | | 2018-19
Estimate
$ million | |
Regulated Service Charges - Energex | | | 17.1 | | | | 17.2 | |
Regulated Service Charges - Ergon | | | 4.9 | | | | 5.7 | |
Total | | | 22.0 | | | | 22.9 | |
Regulated Service Charges – Energex
Under Schedule 8 of the Electricity Regulation 2006, charges for a range of services provided by Energex Limited (Energex) to energy retailers, for example disconnection and reconnection of supply, are capped. The maximum amount Energex is able to charge for these services is, on average, less than the value which the Australian Energy Regulator ascribes to the provision of these services by Energex, resulting in a concession provided to energy retailers and in turn households.
Regulated Service Charges – Ergon
Under Schedule 8 of the Electricity Regulation 2006, service charges for a range of services provided by Ergon Energy Corporation Limited (Ergon Energy) to energy retailers, for example disconnection and reconnection of supply, are capped. The maximum amount Ergon Energy is able to charge for these services is, on average, less than the value which the Australian Energy Regulator ascribes to the provision of these services by Ergon Energy, resulting in a concession provided to energy retailers and in turn households.
| Table A.3.2 | Gladstone Ports Corporation Limited |
| | | | | | | | |
Concession | | 2017-18
Est. Act.
$ million | | | 2018-19
Estimate
$ million | |
Concessional Port Charges1 | | | 52.0 | | | | 39.8 | |
Total | | | 52.0 | | | | 39.8 | |
Note:
| 1. | The variance is due to some uncommercial legacy contracts expiring and being replaced with new contracts at market rates. |
173
Budget Strategy and Outlook 2018-19
Concessional Port Charges
The Gladstone Ports Corporation Limited (GPC) is subject to a number of long-term major industry contracts where port charges are significantly lower than market rates. These historical contracts were entered into to support various industries and government initiatives from time to time. The amounts shown are estimates of the revenue foregone by GPC as a result of being unable to charge commercial rates.
| Table A.3.3 | SunWater Limited |
| | | | | | | | |
Concession | | 2017-18
Est. Act.
$ million | | | 2018-19
Estimate
$ million | |
Water Supply Contracts | | | 48.5 | | | | 49.4 | |
Total | | | 48.5 | | | | 49.4 | |
Water Supply Contracts
SunWater Limited has a number of historic non-commercial water supply contracts that benefit specific entities, predominantly local government authorities. The future treatment of these water supply contracts is currently being considered by Government. The amount shown represents the difference between revenue and expenses under a fully costed allocation model.
SunWater and local governments have agreed to work together to negotiate new arrangements for water supply over the next 18 months. The amount shown represents the difference between revenue and expenses under a fully costed allocation model.
| Table A.3.4 | Concessional Leases (Industry, Commercial and Community) by entity |
| | | | | | | | |
Concession | | 2017-18
Est. Act.
$ million | | | 2018-19
Estimate
$ million | |
Port of Townsville Limited | | | 5.7 | | | | 5.8 | |
Gladstone Ports Corporation Limited | | | 3.5 | | | | 3.3 | |
Queensland Rail Limited | | | 1.7 | | | | 1.9 | |
North Queensland Bulk Ports Corporation Limited | | | 1.6 | | | | 1.7 | |
Far North Queensland Ports Corporation Limited | | | 0.8 | | | | 0.8 | |
Total | | | 13.3 | | | | 13.5 | |
Concessional Leases (Industry, Commercial and Community)
The above Government Owned Corporation entities provide leases to various community organisations, local councils, Government departments and industry participants at below commercial rates. The amounts shown are estimates of the revenue foregone by not charging commercial rates.
174
Budget Strategy and Outlook 2018-19
| Appendix B: | Tax expenditure statement |
Context
Governments employ a range of policy tools to achieve social and economic objectives. These include the use of direct budgetary outlays, regulatory mechanisms and taxation. This Tax Expenditure Statement (TES) details revenue foregone as a result of Government decisions relating to the provision of tax exemptions or concessions. The TES is designed to improve transparency in the use of tax expenditures and increase public understanding of the fiscal process.
Tax expenditures are reductions in tax revenue that result from the use of the taxation system as a policy tool to deliver Government policy objectives. Tax expenditures are provided through a range of measures, including:
| • | | the application of reduced tax rates to certain groups or sectors of the community |
| • | | provisions which defer payment of a tax liability to a future period. |
Labelling an exemption or concession as a tax expenditure does not necessarily imply any judgement as to its appropriateness. It merely makes the amount of the exemption or concession explicit and thereby facilitates its scrutiny as part of the annual Budget process.
Methodology
Revenue foregone approach
The method used almost exclusively by governments to quantify the value of their tax expenditures is the revenue foregone approach. This method estimates the revenue foregone through use of the concession by applying the benchmark rate of taxation to the volume of activities or assets affected by the concession. One of the deficiencies of the revenue foregone approach is that the effect on taxpayer behaviour resulting from the removal of the particular tax expenditure is not factored into the estimate. Consequently, the aggregation of costings for individual tax expenditure items presented in the TES will not necessarily provide an accurate estimate of the total level of assistance provided through tax expenditures.
Measuring tax expenditures requires the identification of:
| • | | concessionally taxed components of the benchmark tax base such as a specific activity or class of taxpayer |
| • | | a benchmark tax rate to apply to the concessionally taxed components of the tax base. |
175
Budget Strategy and Outlook 2018-19
Defining the tax benchmark
The most important step in the preparation of a TES is the establishment of a benchmark for each tax included in the statement. The benchmark provides a basis against which each tax concession can be evaluated. The aim of the benchmark is to determine which concessions are tax expenditures as opposed to structural elements of the tax. The key features of a tax benchmark are:
| • | | any specific accounting conventions applicable to the tax |
| • | | the deductibility of compulsory payments |
| • | | any provisions to facilitate administration |
| • | | provisions relating to any fiscal obligations. |
By definition, tax expenditures are those tax concessions not included as part of the tax benchmark.
Identification of benchmark revenue bases and rates requires a degree of judgement and is not definitive. Furthermore, data limitations mean that the tax expenditures are approximations and are not exhaustive. This statement does not include estimates of revenue foregone from exemptions or concessions provided to Government agencies. Very small exemptions or concessions are also excluded.
The tax expenditure statement
This year’s statement includes estimates of tax expenditures in 2016-17 and 2017-18 for payroll tax, land tax, duties and gambling taxes. A summary of the major tax expenditures valued on the basis of revenue foregone is presented in Table B.1. Not all expenditures can be quantified at this time. Accordingly, the total value of tax expenditures should be considered as indicative only.
176
Budget Strategy and Outlook 2018-19
| Table B.1 | Tax expenditure summary1 |
| | | | | | | | |
| | | 2016-172
$ million | | | 2017-18
$ million | |
Payroll Tax | | | | | | | | |
Exemption threshold | | | 1,392 | | | | 1,384 | |
Deduction scheme | | | 342 | | | | 361 | |
Section 14 exemptions | | | | | | | | |
Local Government | | | 143 | | | | 148 | |
Education | | | 192 | | | | 196 | |
Hospitals | | | 393 | | | | 425 | |
Total Payroll Tax | | | 2,462 | | | | 2,513 | |
Land Tax | | | | | | | | |
Liability thresholds3 | | | 726 | | | | 744 | |
Graduated land tax scale | | | 666 | | | | 868 | |
Primary production deduction | | | 86 | | | | 88 | |
Part 6 Divisions 2 and 3 exemptions not included elsewhere4 | | | 140 | | | | 142 | |
Land developers’ concession | | | 12 | | | | 13 | |
Total Land Tax | | | 1,630 | | | | 1,855 | |
Duties | | | | | | | | |
Transfer duty on residential property | | | | | | | | |
Home concession | | | 406 | | | | 406 | |
First home concession | | | 222 | | | | 221 | |
First home vacant land | | | 30 | | | | 31 | |
Insurance duty | | | | | | | | |
WorkCover | | | 57 | | | | 62 | |
Health insurance | | | 420 | | | | 437 | |
Total Duties | | | 1,134 | | | | 1,157 | |
Taxes on Gambling | | | | | | | | |
Gaming machine taxes | | | 114 | | | | 122 | |
Casino taxes | | | 8 | | | | 9 | |
Total Gambling Tax | | | 122 | | | | 131 | |
Total | | | 5,348 | | | | 5,656 | |
Notes:
| 1. | Numbers may not add due to rounding. |
| 2. | 2016-17 estimates may have been revised since the 2017-18 Budget. |
| 3. | Land tax is payable only on the value of taxable land above a threshold which depends on the ownership structure. |
| 4. | Applicable, but not limited, to religious bodies, public benevolent institutions and other exempt charitable institutions. |
177
Budget Strategy and Outlook 2018-19
Discussion of individual taxes
Payroll tax
The benchmark tax base for payroll tax is assumed to be all taxable wages, salaries and supplements (including employer superannuation contributions) paid in Queensland, as defined in the Payroll Tax Act 1971. The benchmark tax rate for payroll tax is assumed to be the statutory rate applying in each financial year.
Payroll tax exemption threshold
Employers who employ in Queensland with an annual Australian payroll of $1.1 million or less are exempt from payroll tax. On the basis of 2016-17 average weekly earnings, this threshold corresponded to approximately 13 full-time equivalent employees. This exemption is designed to assist small and medium sized businesses.
Deduction scheme
Employers who employed in Queensland with Australian payrolls between $1.1 million and $5.5 million benefited from a deduction of $1.1 million, which reduced by $1 for every $4 by which the annual payroll exceeded $1.1 million. The deduction is pro-rated for interstate wages. There was no deduction for employers or groups that had an annual payroll in excess of $5.5 million.
Section 14 exemptions
A number of organisations are provided with exemptions from payroll tax under Section 14 of the Payroll Tax Act 1971. The activities for which estimates have been calculated are wages paid by public hospitals, non-tertiary private educational institutions and local governments (excluding commercial activities).
Land tax
The benchmark tax base is assumed to be all freehold land within Queensland, excluding residential land used as a principal place of residence and land owned by individuals with a value for that year below the threshold. The benchmark tax rate for land tax is assumed to be the top rate of land tax applicable in Queensland in each financial year.
Liability thresholds
Land tax is payable on the value of taxable land equal to or above a threshold which depends on the land’s ownership. The threshold for companies, trusts and absentees is $350,000 and for resident individuals the threshold is $600,000.
Land owned by resident individuals as their principal place of residence is excluded from the estimate. The exemption from paying below a minimum amount is not included as a tax expenditure as it is regarded as the application of an administration threshold.
178
Budget Strategy and Outlook 2018-19
Graduated land tax scale
A graduated (concessional) scale of land tax rates is applicable to land with a taxable value of less than $5 million for resident individuals and companies, trustees and absentees.
The benchmark rates used for estimating the tax expenditures were 1.75% for individuals and 2.0% for companies, trustees and absentees.
Primary production deduction
The taxable value of land owned by a resident individual, trustee or some absentees and companies does not include all or part of their land that is used for the business of agriculture, pasturage or dairy farming.
Part 6 Divisions 2 and 3 exemptions (not elsewhere included)
A number of land tax exemptions are granted in Part 6 Divisions 2 and 3 of the Land Tax Act 2010 to eligible organisations. These include, but are not limited to, public benevolent institutions, religious institutions and other exempt charitable institutions, retirement villages, trade unions and showgrounds.
Land developers’ concession
Land tax payable by land developers is calculated on the basis that the unimproved value of (undeveloped) land subdivided in the previous financial year and which remains unsold at 30 June of that year is 60% of the Valuer-General’s value. This concession is outlined in Section 30 of the Land Tax Act 2010.
Duties
Home concession
A concessional rate of duty applies to purchases of a principal place of residence. A 1% concessional rate applies on dutiable values up to $350,000, rather than the normal schedule of rates between 1.5% and 3.5%. For properties valued over $350,000, the scheduled rates of transfer duty apply on the excess.
First home concession
Where a purchaser has not previously owned a residence in Queensland or elsewhere, the purchaser of a home receives a more generous concession on duty. This concession comprises a rebate in addition to the home concession on properties (this concession may not be applicable if the purchase price is less than the full market value of the property). The size of the rebate depends on the value of the property. A full concession is provided to purchases of a first principal place of residence valued up to $500,000.
179
Budget Strategy and Outlook 2018-19
First home vacant land concession
A first home concession is available for the purchase of certain vacant land up to the value of $400,000, with a full concession available on certain vacant land up to the value of $250,000.
Insurance duty
The benchmark tax base is assumed to be all premiums for general insurance policies (not for life insurance). The benchmark tax scale is assumed to be the scale that actually applied in each financial year.
Gambling taxes
Gaming machine tax concessions for licensed clubs
The benchmark tax base is assumed to be all gaming machines operated by licensed clubs and hotels in Queensland. The benchmark tax rate is assumed to be the highest marginal tax rate (as is applied to hotels) that actually applied in each financial year.
A progressive tax rate scale applies to gaming machines operated by licensed clubs. The tax rate is calculated monthly on the gaming machine taxable metered win and the top tax rate is only applied to the portion of gaming machine revenue where the monthly metered win exceeds $1.4 million for any licensed club.
Casino tax concessions
The benchmark tax base is assumed to be all casinos operating in Queensland. The benchmark tax rate is assumed to be the highest tax rate that is actually applied in each financial year.
A tax rate of 20% of gross revenue applies for standard transactions in the Brisbane and Gold Coast casinos. A concessional tax rate of 10% applies for gross revenue from standard transactions in the Cairns and Townsville casinos. The tax rate applicable to gaming machines in casinos is 30% of gross revenue in the Brisbane and Gold Coast casinos and 20% in the Cairns and Townsville casinos.
In addition, concessional rates of 10% also apply for revenue from high rollers table game play in all casinos. A goods and services tax (GST) credit is provided to casinos that approximates a reduction in the above tax rates of 9.09%
180
Budget Strategy and Outlook 2018-19
| Appendix C: | Revenue and expense assumptions and sensitivity analysis |
The Queensland Budget, like those of other jurisdictions, is based in part on assumptions made about parameters that are uncertain, both internal and external to the State, which can impact directly on economic and fiscal forecasts.
This appendix outlines the assumptions underlying the revenue and expense estimates and analyses the sensitivity of the estimates to changes in the economic and other assumptions. This analysis is provided to enhance the level of transparency and accountability of the Government.
The forward estimates in the Budget are framed on a no policy change basis. That is, the expenditure and revenue policies in place at the time of the Budget (including those announced in the Budget) are applied consistently throughout the forward estimates period.
The following discussion provides details of some of the key assumptions, estimates and risks associated with revenue and expenditure and, where a direct link can be established, the indicative impact on forecasts resulting from a movement in those variables.
| Table C.1 | Taxation and royalty revenue1 |
| | | | | | | | | | | | | | | | | | | | | | | | |
| | | 2016-17
Actual
$ million | | | 2017-18
Est. Act.
$ million | | | 2018-19
Budget
$ million | | | 2019-20
Projection
$ million | | | 2020-21
Projection
$ million | | | 2021-22
Projection
$ million | |
Payroll tax | | | 3,695 | | | | 3,887 | | | | 4,086 | | | | 4,312 | | | | 4,574 | | | | 4,850 | |
Transfer duty | | | 3,278 | | | | 3,090 | | | | 3,214 | | | | 3,396 | | | | 3,578 | | | | 3,768 | |
Other duties | | | 1,405 | | | | 1,477 | | | | 1,572 | | | | 1,650 | | | | 1,731 | | | | 1,816 | |
Gambling taxes and levies | | | 1,127 | | | | 1,194 | | | | 1,307 | | | | 1,388 | | | | 1,448 | | | | 1,471 | |
Land tax | | | 1,082 | | | | 1,183 | | | | 1,313 | | | | 1,368 | | | | 1,433 | | | | 1,512 | |
Motor vehicle registration | | | 1,681 | | | | 1,755 | | | | 1,829 | | | | 1,892 | | | | 1,961 | | | | 2,032 | |
Other taxes | | | 651 | | | | 699 | | | | 834 | | | | 1,179 | | | | 1,227 | | | | 1,273 | |
Total taxation revenue | | | 12,919 | | | | 13,284 | | | | 14,155 | | | | 15,184 | | | | 15,951 | | | | 16,722 | |
Royalties | | | | | | | | | | | | | | | | | | | | | | | | |
Coal | | | 3,405 | | | | 3,768 | | | | 3,522 | | | | 3,135 | | | | 2,774 | | | | 2,866 | |
Petroleum2 | | | 98 | | | | 188 | | | | 447 | | | | 446 | | | | 438 | | | | 450 | |
Other royalties3 | | | 376 | | | | 371 | | | | 479 | | | | 506 | | | | 515 | | | | 506 | |
Land rents | | | 122 | | | | 157 | | | | 167 | | | | 172 | | | | 178 | | | | 189 | |
Total royalties and land rents | | | 4,000 | | | | 4,484 | | | | 4,615 | | | | 4,260 | | | | 3,904 | | | | 4,011 | |
Notes:
| 1. | Numbers may not add due to rounding. |
| 2. | Includes impact of liquefied natural gas (LNG). |
| 3. | Includes base and precious metal and other mineral royalties. |
181
Budget Strategy and Outlook 2018-19
Taxation revenue assumptions and revenue risks
The rate of growth in tax revenues is dependent on a range of factors that are linked to the rate of growth in economic activity in the State. Some taxes are closely related to activity in specific sectors of the economy, whilst others are broadly related to the general rate of economic growth, employment, inflation and wages. A change in the level of economic activity, resulting from economic growth differing from forecast levels, would impact upon a broad range of taxation receipts.
Wages and employment growth – payroll tax collections
Wages and employment growth have a direct impact on payroll tax collections. The Budget assumptions are for an increase in wages of 21⁄2 and an increase in employment of 11⁄2% in 2018-19. The composition of the payroll tax base is also important as businesses in fast growing sectors such as tourism, retail and hospitality are often outside the tax base because they are below the threshold. A one percentage point variation in either Queensland wages growth or employment would change payroll tax collections by approximately $41 million in 2018-19.
Transfer duty estimates
Transfer duty collections in 2018-19 are expected to increase by 4.0% on the 2017-18 estimated actual with restrained growth in the residential sector being supported by stronger growth in large non-residential transactions and revenue from the additional foreign acquirer duty measure. Across the forward estimates period, moderate growth is expected in both residential and non-residential transfer duty as sentiment in both markets begins to improve.
A one percentage point variation in either the average value of property transactions or the volume of transactions would change transfer duty collections by approximately $32 million in 2018-19.
182
Budget Strategy and Outlook 2018-19
Royalty assumptions and revenue risks
| Table C.2 | Coal royalty assumptions |
| | | | | | | | | | | | | | | | | | | | |
| | | 2017-18 | | | 2018-19 | | | 2019-20 | | | 2020-21 | | | 2021-22 | |
| | | Est. Act.
$ million | | | Budget
$ million | | | Projection
$ million | | | Projection
$ million | | | Projection
$ million | |
Tonnages - crown export1 | | | 212 | | | | 222 | | | | 233 | | | | 236 | | | | 242 | |
Exchange rate US$ per A$2 | | | 0.78 | | | | 0.75 | | | | 0.75 | | | | 0.75 | | | | 0.75 | |
Year average coal prices (US$ per tonne)3 | | | | | | | | | | | | | | | | | | | | |
Hard coking | | | 198 | | | | 161 | | | | 140 | | | | 130 | | | | 130 | |
Semi-soft | | | 142 | | | | 128 | | | | 110 | | | | 101 | | | | 101 | |
Thermal | | | 87 | | | | 89 | | | | 79 | | | | 75 | | | | 75 | |
Year average oil price | | | | | | | | | | | | | | | | | | | | |
Brent (US$ per barrel) | | | 62 | | | | 73 | | | | 67 | | | | 66 | | | | 67 | |
Notes:
| 1. | Excludes coal produced for domestic consumption and coal where royalties are not paid to the Government, i.e. private royalties. 2018-19 estimate for domestic coal volume is approximately 26.1 Mt and private coal is 11.2 Mt. |
| 3. | Price for highest quality coking and thermal coal. Lower quality coal can be sold below this price with indicative average prices for 2018-19 as follows: Hard coking US$151 and thermal US$83. |
Royalty Assumptions
Table C.2 provides the 2018-19 Budget assumptions regarding coal royalties, which represent the bulk of Queensland’s royalty revenue.
Exchange rate and commodity prices and volumes – royalties estimates
Estimates of mining royalties are sensitive to movements in the A$-US$ exchange rate and commodity prices and volumes. Contracts for the supply of commodities are generally written in US dollars. Accordingly, a change in the exchange rate impacts on the Australian dollar price of commodities and therefore expected royalties collections.
Coal
For each one cent movement in the A$-US$ exchange rate, the impact on royalty revenue would be approximately $66 million in 2018-19.
A 1% variation in export coking and thermal coal volumes would lead to a change in royalty revenue of approximately $32 million. A 1Mt variation would lead to a change in royalty revenue of approximately $14 million.
183
Budget Strategy and Outlook 2018-19
A 1% variation in the average price of export coal would lead to a change in royalty revenue of approximately $50 million.
Parameters influencing Australian Government GST payments to Queensland
The Queensland Budget incorporates estimates of GST revenue grants to Queensland based on Australian Government estimates of national GST collections and Queensland Treasury assumptions of Queensland’s share. The estimates of collections are primarily determined by the value of consumption subject to GST.
Since the Australian Government payments are based on the amount actually collected, it is Queensland’s Budget that bears the risks of fluctuations in GST collections. As with all other tax estimates, there is a risk of lower collections than estimated if economic growth and consumption are weaker than expected.
Due to the complexities associated with the GST base, the information provided in the Australian Government Budget Papers is not sufficient to prepare indicative forecasts of the sensitivity of GST estimates to key variables.
Sensitivity of expenditure estimates and expenditure risks
Public sector wage costs
Salaries and wages form a large proportion of General Government Sector operating expenses. Increases in salaries and wages are negotiated through enterprise bargaining agreements.
The 2018-19 Budget and forward estimates reflect wage increases as per existing agreements and the Government’s wages policy where outcomes are yet to be finalised.
A general 1% increase in wage outcomes in one year would increase expenses by around $240 million in that year. The impact would compound and be much larger in the later years.
Interest rates
The General Government Sector has a total debt servicing cost estimated at $1.474 billion in 2018-19. The current average duration of General Government Sector debt is just over 5.5 years. The majority of General Government Sector debt is held under fixed interest rates and therefore the impact of interest rate variations on debt servicing costs in 2018-19 would be relatively modest, with the impact occurring progressively across the forward estimates.
Actuarial estimates of superannuation and long service leave
Liabilities for superannuation and long service leave are estimated by the State Actuary with reference to, among other things, assumed rates of investment returns, salary growth, inflation and discount rate. These liabilities are therefore subject to changes in these parameters. Similarly, the long service leave liabilities are subject to the risk that the actual rates of employee retention will vary from those assumed in the liability calculation.
184
Budget Strategy and Outlook 2018-19
| Appendix D: | Fiscal aggregates and indicators |
Table D.1 Key Fiscal Aggregates1
| | | | | | | | | | | | | | | | | | | | | | | | | | | | | | | | | | | | | | | | | | | | | | | | |
| | | 2010-11 | | | 2011-12 | | | 2012-13 | | | 2013-14 | | | 2014-15 | | | 2015-16 | | | 2016-17 | | | 2017-18 | | | 2018-19 | | | 2019-20 | | | 2020-21 | | | 2021-22 | |
| | | Actual | | | Actual | | | Actual | | | Actual | | | Actual | | | Actual | | | Actual | | | Revised | | | Budget | | | Projection | | | Projection | | | Projection | |
| | | $ million | | | $ million | | | $ million | | | $ million | | | $ million | | | $ million | | | $ million | | | $ million | | | $ million | | | $ million | | | $ million | | | $ million | |
General Government | | | | | | | | | | | | | | | | | | | | | | | | | | | | | | | | | | | | | | | | | | | | | | | | |
Total revenue | | | 42,013 | | | | 45,801 | | | | 41,755 | | | | 46,705 | | | | 49,970 | | | | 50,780 | | | | 56,194 | | | | 58,259 | | | | 57,738 | | | | 58,835 | | | | 59,939 | | | | 62,269 | |
Tax revenue | | | 9,981 | | | | 10,608 | | | | 10,937 | | | | 11,840 | | | | 12,598 | | | | 12,547 | | | | 12,919 | | | | 13,284 | | | | 14,155 | | | | 15,184 | | | | 15,951 | | | | 16,722 | |
Total expenses | | | 43,479 | | | | 46,028 | | | | 46,313 | | | | 46,217 | | | | 49,551 | | | | 50,112 | | | | 53,369 | | | | 56,747 | | | | 57,590 | | | | 58,675 | | | | 59,829 | | | | 61,579 | |
Employee expenses | | | 16,826 | | | | 18,250 | | | | 18,130 | | | | 17,816 | | | | 18,592 | | | | 20,045 | | | | 21,258 | | | | 22,838 | | | | 23,807 | | | | 24,645 | | | | 25,541 | | | | 26,466 | |
Net operating balance | | | (1,466 | ) | | | (226 | ) | | | (4,558 | ) | | | 488 | | | | 420 | | | | 668 | | | | 2,825 | | | | 1,512 | | | | 148 | | | | 160 | | | | 110 | | | | 690 | |
Capital purchases | | | 8,237 | | | | 7,971 | | | | 7,001 | | | | 6,323 | | | | 4,635 | | | | 4,044 | | | | 4,634 | | | | 4,905 | | | | 5,927 | | | | 7,557 | | | | 7,396 | | | | 7,081 | |
Net capital purchases | | | 5,583 | | | | 5,241 | | | | 3,389 | | | | 3,087 | | | | 992 | | | | 1,164 | | | | 2,285 | | | | 2,119 | | | | 3,183 | | | | 4,044 | | | | 3,512 | | | | 3,331 | |
Fiscal balance | | | (7,049 | ) | | | (5,467 | ) | | | (7,947 | ) | | | (2,599 | ) | | | (572 | ) | | | (497 | ) | | | 540 | | | | (604 | ) | | | (3,033 | ) | | | (3,881 | ) | | | (3,400 | ) | | | (2,636 | ) |
Borrowings | | | 24,594 | | | | 29,518 | | | | 37,879 | | | | 41,369 | | | | 43,105 | | | | 35,486 | | | | 33,260 | | | | 31,367 | | | | 32,311 | | | | 35,861 | | | | 39,588 | | | | 42,290 | |
Net debt | | | (9,542 | ) | | | (5,720 | ) | | | 2,399 | | | | 5,208 | | | | 5,749 | | | | 653 | | | | (335 | ) | | | (267 | ) | | | 2,815 | | | | 7,336 | | | | 11,018 | | | | 13,707 | |
| | | | | | | | | | | | |
Non-Financial Public Sector | | | | | | | | | | | | | | | | | | | | | | | | | | | | | | | | | | | | | | | | | | | | | | | | |
Total revenue | | | 49,040 | | | | 52,307 | | | | 49,181 | | | | 53,502 | | | | 56,178 | | | | 57,393 | | | | 64,840 | | | | 66,192 | | | | 65,467 | | | | 66,510 | | | | 67,970 | | | | 70,550 | |
Capital purchases | | | 13,306 | | | | 11,980 | | | | 10,774 | | | | 9,313 | | | | 7,811 | | | | 6,852 | | | | 7,305 | | | | 7,656 | | | | 9,057 | | | | 10,786 | | | | 10,523 | | | | 10,177 | |
Borrowings | | | 53,708 | | | | 61,542 | | | | 69,086 | | | | 72,637 | | | | 75,233 | | | | 72,922 | | | | 71,904 | | | | 69,501 | | | | 70,871 | | | | 75,214 | | | | 79,750 | | | | 83,093 | |
Notes:
| 1. | Bracketed numbers represent negative amounts. |
185
Budget Strategy and Outlook 2018-19
Table D.2 Key Fiscal Indicators1
| | | | | | | | | | | | | | | | | | | | | | | | | | | | | | | | | | | | | | | | | | | | | | | | |
| | | 2010-11 | | | 2011-12 | | | 2012-13 | | | 2013-14 | | | 2014-15 | | | 2015-16 | | | 2016-17 | | | 2017-18 | | | 2018-19 | | | 2019-20 | | | 2020-21 | | | 2021-22 | |
| | | Actual | | | Actual | | | Actual | | | Actual | | | Actual | | | Actual | | | Actual | | | Revised | | | Budget | | | Projection | | | Projection | | | Projection | |
| | | % | | | % | | | % | | | % | | | % | | | % | | | % | | | % | | | % | | | % | | | % | | | % | |
General Government | | | | | | | | | | | | | | | | | | | | | | | | | | | | | | | | | | | | | | | | | | | | | | | | |
Revenue/GSP | | | 16.2 | | | | 16.5 | | | | 14.8 | | | | 16.1 | | | | 16.9 | | | | 16.7 | | | | 17.2 | | | | 16.6 | | | | 15.8 | | | | 15.5 | | | | 15.1 | | | | 15.0 | |
Tax/GSP | | | 3.8 | | | | 3.8 | | | | 3.9 | | | | 4.1 | | | | 4.3 | | | | 4.1 | | | | 4.0 | | | | 3.8 | | | | 3.9 | | | | 4.0 | | | | 4.0 | | | | 4.0 | |
Own source revenue/GSP | | | 8.3 | | | | 8.2 | | | | 8.2 | | | | 8.6 | | | | 8.9 | | | | 8.9 | | | | 8.8 | | | | 8.5 | | | | 8.2 | | | | 8.1 | | | | 7.8 | | | | 7.7 | |
Expenses/GSP | | | 16.7 | | | | 16.5 | | | | 16.4 | | | | 16.0 | | | | 16.8 | | | | 16.5 | | | | 16.3 | | | | 16.2 | | | | 15.8 | | | | 15.5 | | | | 15.1 | | | | 14.8 | |
Employee expenses/GSP | | | 6.5 | | | | 6.6 | | | | 6.4 | | | | 6.2 | | | | 6.3 | | | | 6.6 | | | | 6.5 | | | | 6.5 | | | | 6.5 | | | | 6.5 | | | | 6.5 | | | | 6.4 | |
Net operating balance/GSP | | | (0.6 | ) | | | (0.1 | ) | | | (1.6 | ) | | | 0.2 | | | | 0.1 | | | | 0.2 | | | | 0.9 | | | | 0.4 | | | | 0.0 | | | | 0.0 | | | | 0.0 | | | | 0.2 | |
Capital purchases/GSP | | | 3.2 | | | | 2.9 | | | | 2.5 | | | | 2.2 | | | | 1.6 | | | | 1.3 | | | | 1.4 | | | | 1.4 | | | | 1.6 | | | | 2.0 | | | | 1.9 | | | | 1.7 | |
Net cash inflows from operating activities/Net cash flows from investments in non-financial assets | | | 26.3 | | | | 36.3 | | | | (40.8 | ) | | | 45.9 | | | | 97.5 | | | | 122.9 | | | | 133.5 | | | | 99.0 | | | | 59.7 | | | | 40.2 | | | | 44.5 | | | | 53.2 | |
Fiscal balance/GSP | | | (2.7 | ) | | | (2.0 | ) | | | (2.8 | ) | | | (0.9 | ) | | | (0.2 | ) | | | (0.2 | ) | | | 0.2 | | | | (0.2 | ) | | | (0.8 | ) | | | (1.0 | ) | | | (0.9 | ) | | | (0.6 | ) |
Borrowings/GSP | | | 9.5 | | | | 10.6 | | | | 13.4 | | | | 14.3 | | | | 14.6 | | | | 11.7 | | | | 10.2 | | | | 8.9 | | | | 8.9 | | | | 9.5 | | | | 10.0 | | | | 10.2 | |
Borrowings/revenue | | | 58.5 | | | | 64.4 | | | | 90.7 | | | | 88.6 | | | | 86.3 | | | | 69.9 | | | | 59.2 | | | | 53.8 | | | | 56.0 | | | | 61.0 | | | | 66.0 | | | | 67.9 | |
| | | | | | | | | | | | |
Revenue growth | | | 13.3 | | | | 9.0 | | | | (8.8 | ) | | | 11.9 | | | | 7.0 | | | | 1.6 | | | | 10.7 | | | | 3.7 | | | | (0.9 | ) | | | 1.9 | | | | 1.9 | | | | 3.9 | |
Tax growth | | | 12.6 | | | | 6.3 | | | | 3.1 | | | | 8.3 | | | | 6.4 | | | | (0.4 | ) | | | 3.0 | | | | 2.8 | | | | 6.6 | | | | 7.3 | | | | 5.0 | | | | 4.8 | |
Expenses growth | | | 17.2 | | | | 5.9 | | | | 0.6 | | | | (0.2 | ) | | | 7.2 | | | | 1.1 | | | | 6.5 | | | | 6.3 | | | | 1.5 | | | | 1.9 | | | | 2.0 | | | | 2.9 | |
Employee expenses growth | | | 17.6 | | | | 8.5 | | | | (0.7 | ) | | | (1.7 | ) | | | 4.4 | | | | 7.8 | | | | 6.1 | | | | 7.4 | | | | 4.2 | | | | 3.5 | | | | 3.6 | | | | 3.6 | |
| | | | | | | | | | | | |
Non-Financial Public Sector | | | | | | | | | | | | | | | | | | | | | | | | | | | | | | | | | | | | | | | | | | | | | | | | |
Capital purchases/GSP | | | 5.1 | | | | 4.3 | | | | 3.8 | | | | 3.2 | | | | 2.6 | | | | 2.3 | | | | 2.2 | | | | 2.2 | | | | 2.5 | | | | 2.8 | | | | 2.7 | | | | 2.5 | |
Borrowings/GSP | | | 20.7 | | | | 22.1 | | | | 24.5 | | | | 25.1 | | | | 25.5 | | | | 24.0 | | | | 22.0 | | | | 19.8 | | | | 19.4 | | | | 19.9 | | | | 20.1 | | | | 20.0 | |
Borrowings/revenue | | | 109.5 | | | | 117.7 | | | | 140.5 | | | | 135.8 | | | | 133.9 | | | | 127.1 | | | | 110.9 | | | | 105.0 | | | | 108.3 | | | | 113.1 | | | | 117.3 | | | | 117.8 | |
Net financial liabilities2/revenue | | | 112.3 | | | | 132.1 | | | | 157.1 | | | | 148.7 | | | | 140.7 | | | | 144.0 | | | | 128.5 | | | | 124.0 | | | | 129.4 | | | | 132.4 | | | | 135.2 | | | | 134.3 | |
Notes:
| 1. | Bracketed numbers represent negative amounts. |
| 2. | UPF definition, which is equal to total financial assets less investments in other public sector entities less total liabilities. |
186
Queensland Budget 2018-19 Budget Strategy and Outlook Budget Paper No.2
Queensland Budget 2018-19
Budget Strategy and Outlook Budget Paper No.2
budget.qld.gov.au
Queensland Budget 2018-19
CAPITAL STATEMENT
Budget Paper No. 3
budget.qld.gov.au
2018-19 Queensland Budget Papers
1. Budget Speech
2. Budget Strategy and Outlook
3. Capital Statement
4. Budget Measures
5. Service Delivery Statements
Appropriation Bills
Budget Highlights
The Budget Papers are available online at budget.qld.gov.au
© Crown copyright
All rights reserved
Queensland Government 2018
Excerpts from this publication may be reproduced, with appropriate
acknowledgement, as permitted under the Copyright Act.
Capital Statement
Budget Paper No.3
ISSN 1445-4890 (Print)
ISSN 1445-4904 (Online)
Capital Statement 2018-19

State Budget
2018-19
Capital Statement
Budget Paper No. 3
Capital Statement 2018-19
Contents
| | | | | | |
| 1 | | Approach and highlights | | | 1 | |
| |
| Features | | | 1 | |
| | |
| 1.1 | | Introduction | | | 2 | |
| 1.2 | | Capital planning and prioritisation | | | 3 | |
| 1.3 | | Innovative funding and financing | | | 4 | |
| 1.4 | | Key projects | | | 9 | |
| 1.5 | | Highlights by asset class | | | 14 | |
| | |
| 2 | | 2018-19 Capital program overview | | | 22 | |
| | |
| 2.1 | | Introduction | | | 22 | |
| 2.2 | | Capital purchases | | | 23 | |
| 2.3 | | Capital grants | | | 27 | |
| | |
| 3 | | Capital outlays by entity | | | 31 | |
| | |
| 3.1 | | Aboriginal and Torres Strait Islander Partnerships | | | 31 | |
| 3.2 | | Agriculture and Fisheries | | | 32 | |
| 3.3 | | Child Safety, Youth and Women | | | 35 | |
| 3.4 | | Communities, Disability Services and Seniors | | | 38 | |
| 3.5 | | Education | | | 41 | |
| 3.6 | | Electoral Commission of Queensland | | | 52 | |
| 3.7 | | Employment, Small Business and Training | | | 53 | |
| 3.8 | | Environment and Science | | | 55 | |
| 3.9 | | Housing and Public Works | | | 60 | |
| 3.10 | | Innovation, Tourism Industry Development and the Commonwealth Games | | | 67 | |
| 3.11 | | Justice and Attorney-General | | | 69 | |
| 3.12 | | Legislative Assembly of Queensland | | | 72 | |
| 3.13 | | Local Government, Racing and Multicultural Affairs | | | 73 | |
| 3.14 | | Natural Resources, Mines and Energy | | | 75 | |
Capital Statement 2018-19
| | | | | | |
| 3.15 | | Premier and Cabinet | | | 91 | |
| 3.16 | | Public Safety Business Agency | | | 92 | |
| 3.17 | | Queensland Corrective Services | | | 98 | |
| 3.18 | | Queensland Fire and Emergency Services | | | 100 | |
| 3.19 | | Queensland Health | | | 102 | |
| 3.20 | | Queensland Police Service | | | 113 | |
| 3.21 | | Queensland Treasury | | | 114 | |
| 3.22 | | State Development, Manufacturing, Infrastructure and Planning | | | 116 | |
| 3.23 | | Transport and Main Roads | | | 120 | |
| | | | | | |
| Appendix A: | | Entities included in capital outlays 2018-19 | | | 140 | |
| | |
| Appendix B: | | Key concepts and coverage | | | 143 | |
| | |
| Appendix C: | | Capital purchases by entity by region 2018-19 | | | 144 | |
Capital Statement 2018-19
Features
| • | | The Palaszczuk Government is delivering a significant capital works program, including both productivity-enhancing economic infrastructure and essential social infrastructure, to support Queensland’s growing population. |
| • | | With the State’s population having grown to more than five million, the Palaszczuk Government’s infrastructure program will generate jobs, drive economic growth, enhance the productive capacity of the State’s business and industries, and improve the quality of life enjoyed by Queensland families and communities. |
| • | | Over the forward estimates period, the Palaszczuk Government has allocated a total of $45.769 billion to fund essential infrastructure and capital works to build the State’s cities and support the growth of Queensland’s regional economies. |
| • | | In 2018-19, the Palaszczuk Government will deliver a $11.583 billion capital program, up from $10.171 billion allocated for the 2017-18 capital program in last year’s Budget. |
| • | | To meet the needs of Queensland’s growing population, the Government’s 2018-19 capital works program includes a $4.950 billion investment in roads and transport infrastructure. |
| • | | Key transport funding in 2018-19 includes: $147.3 million towards M1 Pacific Motorway upgrades; $534.3 million towards the Toowoomba Second Range Crossing; $200 million to duplicate the Bruce Highway from four to six lanes, from Caloundra Road to the Sunshine Motorway; and $733 million for the Cross River Rail Delivery Authority to continue to progress the planning, procurement and development associated with the $5.409 billion Cross River Rail project. |
| • | | Capital purchases for the health portfolio total $985.5 million in 2018-19, including $84.8 million as part of the Enhancing Regional Hospitals program and $53.3 million as part of the Rural and Regional Infrastructure package. |
| • | | The education portfolio will make $674.3 million of capital purchases in 2018-19, including $125.2 million for new classrooms and infrastructure in state secondary schools to accommodate the six full cohorts in 2020 and $94.5 million as part of the $808 million Building Future Schools Fund. |
| • | | The energy and water portfolios will make capital purchases of $2.178 billion and $277 million respectively in 2018-19 to deliver cost effective, safe, secure and reliable energy and water supply across the State. |
| • | | The Budget also includes significant investments to support the delivery of priority justice and public safety services in Queensland communities in 2018-19, including $107 million out of a total $241 million to provide 348 additional cells at Capricornia Correctional Centre and $55 million in 2018-19 to refurbish, upgrade or replace police facilities across the State. |
1
Capital Statement 2018-19
| • | | Key capital investments in social housing in 2018-19 include $339.1 million to construct new dwellings and upgrade existing properties and $103.6 million of capital grants to assist non-government organisations to construct and upgrade social housing dwellings. |
| • | | A key element of the Government’s capital program is providing grants to local governments to ensure they can deliver the essential infrastructure needed to support communities across Queensland. The Government’s 2018-19 capital grants program of $1.661 billion includes $147.8 million for Works for Queensland, providing councils with the resources to deliver small priority infrastructure projects throughout the State. |
| • | | The Government is providing $9.5 million of additional disaster resilience spending in 2018-19 ($38 million over four years), recognising the importance of building the resilience of local communities to ensure they recover more quickly after a disaster and ensure essential services and transport links are maintained. |
| • | | The Government has implemented a clear focus on improving the timely delivery of essential infrastructure for Queensland. This has resulted in an improvement in the amount of capital expenditure delivered, with the proportion of budgeted capital purchases actually delivered in 2016-17 being the highest in the past five years. Further improvement is anticipated in 2017-18, with more than 90 per cent of budgeted capital purchases expected to be delivered, compared with the average of 85 per cent for the past five years from 2012-13 to 2016-17. |
The arrival of the five millionth Queenslander in May 2018 highlighted the challenges and opportunities that the State faces with a growing population. The 2018-19 capital statement outlines how the Queensland Government will meet these challenges by building new infrastructure, including new schools and hospitals and better transport networks, which will help Queenslanders and local businesses succeed.
In addition to meeting the challenges of a growing population and maintaining world-class essential services, the Government’s vision for infrastructure is about generating jobs and building a strong and sustainable modern economy for all Queenslanders. Whether it’s sports stadiums, schools or hospitals, infrastructure will support the social and economic activity of future Queenslanders.
Projects such as the Western Roads Upgrade Supplement, Bruce Highway and M1 Pacific Motorway upgrades, and Cross River Rail will provide the vital transport links which will be the catalyst to unlock communities and expand economic activity across the State. Infrastructure assessment by Building Queensland ensures the right infrastructure is being built at the right time and with quantifiable returns. The Government’s detailed infrastructure strategy is outlined in the regularly updated State Infrastructure Plan.
The Government’s substantial infrastructure investment directly generates significant employment during construction. It is estimated that the $11.583 billion capital works program in 2018-19 will directly support more than 38,000 jobs, equating to around 33,000 full time equivalent jobs.
2
Capital Statement 2018-19
In addition to the more immediate construction-related jobs generated through the capital works program, the resulting infrastructure will support and create future jobs, by attracting and encouraging private sector investment, increasing the productivity, efficiency and competitiveness of the State’s businesses and industries, and expanding the long-term productive capacity of the economy.
| 1.2 | Capital planning and prioritisation |
| 1.2.1 | State Infrastructure Plan |
The State Infrastructure Plan (SIP) provides a clear vision for planning, investment and delivery of infrastructure in Queensland. The SIP underpins the Government’s commitment to support jobs and the economy, by ensuring the State is investing in the right infrastructure, in the right place and at the right time. The implementation of the SIP is led by the Department of State Development, Manufacturing, Infrastructure and Planning.
The SIP is designed to provide confidence and certainty to industry, local government and the community by confirming the Government’s investment program over the next four years.
SIP Part A, released in March 2016, sets out the Government’s medium-term agenda. This forms the basis of the regularly updated SIP Part B which details the current investment program. The 2018 SIP Part B update will align with the 2018-19 State Budget and reflect the Government’s current capital investment program. The update will continue to give the private sector and all levels of government confidence to invest in the State. The update is a critical tool to align and integrate national, state, regional and local infrastructure planning.
Building Queensland is a statutory body that provides independent, expert advice on major infrastructure to Queensland Government departments, government-owned corporations and nominated statutory authorities. Established under the Building Queensland Act 2015, its core functions are to develop and independently prioritise the State’s infrastructure proposals.
Building Queensland leads the development of detailed business cases with an estimated capital cost of delivery over $100 million and assists with proposals between $50 million and $100 million. Building Queensland also develops the Infrastructure Pipeline Report to assist the Government in determining the projects that will best address the State’s infrastructure priorities. The Infrastructure Pipeline Report provides transparency of key Government proposals under development.
Detailed business cases completed by Building Queensland include the following projects:
| • | | Beerburrum to Nambour Rail Upgrade |
| • | | Bruce Highway: Cairns Southern Access Corridor Stage 3 (Edmonton to Gordonvale) |
| • | | Bruce Highway: Cairns Southern Access Corridor Stage 4 (Kate Street to Aumuller Street) |
| • | | Bruce Highway: Caboolture/Bribie Island Road to Steve Irwin Way |
| • | | Bruce Highway: Maroochy Interchange Upgrade |
3
Capital Statement 2018-19
| • | | European Train Control System |
| • | | Lower Fitzroy River Infrastructure Project |
| • | | Public Safety Regional Radio Communications |
| • | | Arthur Gorrie Correctional Centre |
| • | | The Smithfield Transport Corridor Upgrade |
| • | | Townsville Eastern Access Rail Corridor |
| 1.2.3 | Queensland Transport and Investment Program (QTRIP) |
QTRIP is an annually published program of works that outlines the Department of Transport and Main Roads’ current and planned investments in road and transport infrastructure over the next four years. It includes roads, railways, active transport, marine infrastructure and public transport solutions. The strategic intent of QTRIP 2018-19 to 2021-22 is shaped by the SIP Part A and the Transport Coordination Plan 2017-2027.
QTRIP is developed in accordance with funding allocations identified by the Queensland and Australian Governments, which align to both governments’ policy objectives. QTRIP 2018-19 to 2021-22 four-year total is now $21.7 billion, an increase of approximately $700 million compared to QTRIP 2017-18 to 2020-21.
| 1.3 | Innovative funding and financing |
| 1.3.1 | State Infrastructure Fund |
The $2.2 billion State Infrastructure Fund (SIF) was established to boost infrastructure investment, increase business confidence and fund priorities in both the SIP and Building Queensland’s Infrastructure Pipeline. Components of the SIF include:
| • | | $200 million for the Priority Economic Works and Productivity Program. Funding has been allocated to the Department of Transport and Main Roads to deliver six high priority transport projects. Located around Queensland, these projects will be progressively delivered through to December 2020. |
| • | | $180 million for the Significant Regional Infrastructure Projects Program, now delivering 25 significant social and economic infrastructure projects or programs in key regional centres across Queensland. All projects are forecast for completion by the end of June 2019. |
| • | | $30 million for the Maturing the Infrastructure Pipeline Program, which comprises $20 million from the SIF and $10 million from the 2017-18 State Budget. This program facilitates councils to progress projects through the infrastructure planning pipeline so that required infrastructure can be identified, planned, funded and built sooner. This program has enabled maturity assessments of all 141 ‘proposals raised through consultation’ and will support 92 ‘future opportunities’ identified in the 2016 SIP Part B, which inform both state and local government infrastructure planning and budgetary processes. |
Further, during 2017-18, the Department of State Development, Manufacturing, Infrastructure and Planning undertook needs analysis and options assessment for an additional 40 infrastructure projects submitted by 22 local governments. The remainder of the initial $20 million SIF allocation and the additional $10 million now funds a new local government infrastructure grant program. This will support local governments to undertake either strategic planning for infrastructure, or business cases and/or detailed design for infrastructure proposals.
4
Capital Statement 2018-19
| • | | $800 million allocated towards the delivery of Cross River Rail and a further $50 million to establish the Cross River Rail Delivery Authority. These initial allocations for Queensland’s number one infrastructure project align with the Government’s priorities to attract investment, build infrastructure and foster innovation. |
| • | | $200 million for round one of the Works for Queensland program approved in 2016-17. This stage of the program prioritised regional areas outside South East Queensland which are experiencing higher unemployment rates. The program is delivering jobs through priority maintenance and minor infrastructure works for 65 local governments across Queensland. |
The 2017-18 State Budget allocated an additional $200 million over two years for a second Works for Queensland funding round, which was then supplemented by a further $200 million during 2017-18. This brings the total program funding over the five-year period from 2016-17 to 2020-21 to $600 million.
Table 1 shows the programs which are receiving funding through the SIF.
| Table 1 | State Infrastructure Fund |
| | | | |
Program | | Total
$ million | |
Maturing the Infrastructure Pipeline Program (MIPP)1 | | | 20 | |
Priority Economic Works and Productivity Program2 | | | 200 | |
Significant Regional Infrastructure Projects Program | | | 180 | |
Works for Queensland Round One3 | | | 200 | |
Cross River Rail4 | | | 850 | |
Pacific Motorway (Mudgeeraba - Varsity Lakes) | | | 44 | |
Smithfield Bypass | | | 69 | |
Centenary Motorway Upgrade package | | | 48 | |
Tourism infrastructure | | | 50 | |
Woodford | | | 1 | |
Bruce Highway | | | 128.5 | |
M1 Action Plan | | | 55 | |
Building Better Hospitals5 | | | 352.6 | |
Unallocated | | | 1.9 | |
| | | | |
State Infrastructure Fund total | | | 2,200 | |
| | | | |
| 1. | A further $10 million was added to the MIPP as part of the 2017-18 State Budget, but this is not being funded through SIF. |
| 2. | $100 million reallocated to the Bruce Highway and M1 Action Plan projects. |
| 3. | A further $200 million was added to the Works for Queensland program as part of the 2017-18 State Budget, but this is not being funded through SIF. |
| 4. | SIF contribution to the $5.409 billion Cross River Rail project. |
| 5. | SIF contribution to the $679 million Building Better Hospitals commitment. |
| 1.3.2 | Market-Led Proposals |
Market-Led Proposals (MLPs) were introduced in the 2015-16 Budget as part of the Government’s plan to create jobs and stimulate the economy. An MLP is a submission from the private sector seeking a commercial arrangement with Government to provide a service or infrastructure that will meet a community need.
5
Capital Statement 2018-19
MLPs are intended to provide benefits to Government and the Queensland community. They are preferably “low risk – low cost” to Government and must present a clear case for direct negotiation as an alternative to seeking value for money through a competitive process.
The Government needs to be satisfied that no other proposal addressing the same need – or proposing a similar outcome – is under active consideration by the State and that the proposal is a genuine commercial proposition.
Projects which are wholly, or largely, privately funded and of economic or social significance to Queensland or a region, such as those that support a large number of jobs or will generate significant economic activity beyond the project, are highly regarded.
As a result of the recent machinery-of-government changes, MLPs are now administered by the Department of State Development, Manufacturing, Infrastructure and Planning.
Criteria for success
A proposal must meet the following assessment criteria for initial consideration:
| • | | Satisfy a community need and align with Government’s priorities. |
| • | | Demonstrate that the public interest is best served by Government negotiating directly with the proponent, rather than by engaging in a competitive process. |
| • | | Deliver a value-for-money outcome to the State, which can be determined in the absence of a competitive market. |
| • | | Have a proponent with the financial and technical capacity, capability, and experience to deliver the outcome successfully. |
If progressed to detailed proposal, this will be assessed to determine that:
| • | | There is an allocation of costs and risks between the proponent and the Government that is acceptable to the State. |
| • | | The proposal is technically, commercially, and practically feasible. |
A successful MLP will result in the Government contracting directly with a proponent rather than offering the opportunity to the market through a competitive process.
MLPs – Approved proposals
Two MLPs have reached contractual close and are in delivery phase:
Logan Motorway Enhancement Project
Transurban Queensland (TQ), which operates and maintains the Logan, Gateway and Gateway Extension motorways under a long-term agreement with the State, was the first proponent in Queensland to progress to contract award under the Queensland Government’s MLP framework.
TQ’s $512 million enhancement to the Logan and Gateway Extension motorways will provide a range of improvements to the motorways and surrounding roads to improve driver safety, reduce travel times, relieve traffic congestion and enhance connectivity with other major road networks.
The project is expected to support around 1,300 jobs during the two-and-a-half-year construction period and generate around $1 billion (present value) in economic benefits over 30 years.
6
Capital Statement 2018-19
TQ will fully finance the costs of the works and will predominantly fund the project through moderate toll increases for trucks using the Logan and Gateway motorways. There will also be a new toll facility for motorists if they choose to use new south-facing ramps at Compton Road to access and exit the Gateway Extension Motorway.
The project is expected to be completed in mid-2019.
Brisbane International Cruise Terminal
The Port of Brisbane Pty Ltd (PBPL) is capitalising on its experience, capabilities and location to build and operate a new $158 million cruise ship terminal on government land across the river from the existing freight port.
The terminal will cater to the new generation of mega cruise ships, which are unable to access existing infrastructure upstream of the Gateway Bridge. This will provide for an expansion of the cruise ship market in Queensland, stimulating the economy and bringing more tourists to the State.
Over its two-and-a-half-year construction period, the project is expected to support an average of 245 jobs a year and, once operational, safeguard up to 1,250 existing cruise industry jobs and support a further 49 jobs a year.
PBPL has programmed a completion date of April 2020.
MLPs – Projects in the detailed proposal stage
A further five proposals have been assessed as meeting the MLP criteria and have progressed to Stage 2: Detailed planning.
| 1.3.3 | Public-private partnerships |
The Queensland Government is engaged in a range of public-private partnerships (PPPs) that often involve the private sector constructing an asset, which is then leased to the public sector.
Whilst a PPP transfers construction and maintenance risk to the private sector, given the arrangement has the public sector effectively retaining the risks and rewards of ownership of an asset, the Government’s financial statements recognise an acquisition under a finance lease and a corresponding finance lease liability. The liability for the proportion of expenditure related to financing and ongoing costs is treated as a borrowing in the State’s balance sheet.
Acquisitions under finance leases and finance lease liabilities are typically recognised once construction has been completed and the lease commences, rather than recognising expenditure and associated borrowings across the construction period as occurs under traditional delivery.
In 2018-19, the value of acquisitions under finance leases is $864 million. Given the significant value of acquisition under finance leases in 2018-19, it is important that this method of infrastructure delivery is recognised as part of the Capital Statement.
Cross River Rail, the Queensland Government’s highest priority infrastructure project, is being delivered through several works packages with a PPP for the Tunnels, Stations and Development Package currently in procurement. This approach optimises risk allocation and provides opportunities for the private sector to provide innovation in relation to the delivery and maintenance of tunnels, stations and over station development to improve outcomes.
7
Capital Statement 2018-19
| 1.3.4 | Other infrastructure investment facilitated by the State |
Building our Regions
Building our Regions is a $445 million targeted regional infrastructure program for local government projects. The purpose of the program is to provide funding for critical infrastructure in regional areas of the State that meet the specific needs of communities and supports economic development, including generating jobs.
Of this funding, $150 million was allocated to the Transport Infrastructure Development Scheme (TIDS) to increase the funding delivered through TIDS to regional local governments. These funds are managed by the Department of Transport and Main Roads.
The remaining $295 million has been allocated to the Department of State Development, Manufacturing, Infrastructure and Planning. Of this, the program has allocated almost $225 million across 174 projects, with a further $70 million available under Round 4. Projects that have been shortlisted at the expression of interest stage in Round 4 are expected to be announced mid-2018. Councils will then be invited to submit a detailed application for shortlisted projects.
Works for Queensland
The Works for Queensland program supports local governments outside South East Queensland by funding job-creating maintenance and minor infrastructure projects relating to assets owned or controlled by local governments.
The 2017-18 State Budget allocated an additional $200 million over two years for a second Works for Queensland funding round, which was then supplemented by a further $200 million during 2017-18. This brings the total program funding over the five-year period from 2016-17 to 2020-21 to $600 million.
In 2018-19, $147.8 million will be delivered from these additional funds.
Disaster Resilience Program
Queensland is prone to natural disasters and, while rebuilding after a disaster is important, increasing resilience of our infrastructure to lessen the impacts of natural disasters means that communities can recover more quickly after a natural disaster strikes. Therefore, a critical element of the Government’s infrastructure investment is improving existing infrastructure to improve the resilience of the State’s communities.
To help foster this enhanced resilience, $9.5 million is allocated in 2018-19 to the Disaster Resilience Fund, a State-funded program delivering $38 million over four years and administered by the Queensland Reconstruction Authority, to support delivery of disaster-mitigation projects and initiatives that build resilience to natural disasters.
8
Capital Statement 2018-19
This section provides an overview of key Queensland Government infrastructure projects and capital works programs.
Bruce Highway upgrades
Many Queenslanders are dependent on the Bruce Highway for their livelihood and lifestyle. With the Bruce Highway connecting cities and towns over a distance of almost 1,700 kilometres from Brisbane to Cairns, it is essential to maintain and upgrade the Bruce Highway to ensure freight, travel and commuter traffic is safe and efficient.
The Queensland Government will continue to work with the Australian Government to deliver the Bruce Highway Upgrade Program, aimed at improving safety, flood resilience and capacity along its length. Projects are regularly being added to the program’s scope of works, delivering greater benefits for Queensland motorists and businesses.
M1 Pacific Motorway upgrades
A safe, efficient and reliable M1 Pacific Motorway plays an important role in driving productivity and competitiveness across South East Queensland. The Government is delivering several major projects underway on the M1, including the Pacific Motorway/Gateway Motorway Merge project and the Mudgeeraba to Varsity Lakes project, both of which are due for completion in 2020.
In addition, as part of the 2018-19 Budgets, the Queensland and Australian Governments have committed funding for two key projects on the M1 Pacific Motorway: Tugun to Varsity Lakes and Eight Mile Plains to Daisy Hill.
The 10 kilometre section of the M1 Pacific Motorway between Varsity Lakes and Tugun on the Queensland and New South Wales border carries approximately 85,000 vehicles per day, including around 7,500 heavy vehicles. Business case development for the widening of the section from four to six lanes will continue during 2018-19. The indicative total estimated cost for the project of $1.030 billion is subject to review through business case development.
The section of the M1 Pacific Motorway between Eight Mile Plains to Daisy Hill carries in the order of 150,000 vehicles per day, including approximately 12,000 heavy vehicles. Building Queensland is developing a detailed business case for this stretch of the M1 Pacific Motorway, investigating the widening from six to eight lanes, at a total estimated cost of $749 million.
Toowoomba Second Range Crossing
The Toowoomba Second Range Crossing (TSRC) project is a $1.606 billion, 41 kilometre bypass route to the north of Toowoomba, running from the Warrego Highway at Helidon in the east to the Gore Highway at Athol in the west, via Charlton. The project is being jointly funded by the Queensland and Australian Governments on a 20:80 basis.
The project will support up to 1,800 full-time jobs during construction and is expected to improve road and driver safety, reduce travel time across the Range by up to 40 minutes for heavy commercial vehicles and relieve pressure on local roads by redirecting trucks away from Toowoomba’s CBD.
9
Capital Statement 2018-19
In 2015, the Nexus consortium was awarded the contract to deliver the TSRC and will be responsible for its design, construction, financing, operation and maintenance for a period of 25 years following completion, which is expected in 2019. The contract was structured as an availability-based Public Private Partnership, with the State providing upfront funding contributions during the construction stage and ongoing service payments over the 25 year operation and maintenance stage, with the latter dependent on performance.
The TSRC will be a toll road and its use will be mandated for heavy vehicles without a Toowoomba destination.
North Queensland Stadium (NQ Stadium)
The $250 million NQ Stadium project will deliver an iconic, 25,000-seat stadium in Townsville in time for the 2020 NRL season.
The NQ Stadium is a joint project of the Queensland Government, Australian Government, and Townsville City Council and is supported by both the National Rugby League and the North Queensland Cowboys. The stadium forms part of the Townsville City Deal signed in December 2016.
The NQ Stadium is expected to support up to 750 jobs during the construction phase as well as on-going jobs in hospitality, new tourism opportunities and major events. The stadium will also be a catalyst for urban renewal and regeneration for Townsville’s inner city and waterfront.
Construction work has commenced.
Building Better Hospitals
As part of its Building Better Hospitals commitment, the Government will invest $679 million to redevelop three of South East Queensland’s busiest hospitals in Logan, Caboolture and Ipswich, commence planning and business case development for the Wide Bay region and refurbish three Cancer Council Queensland lodges. This investment will help to deliver the critical infrastructure needed to meet the increase in current and future demand for hospitals and other healthcare services in these fast-growing areas.
In rural and regional Queensland, the Government will continue to deliver a range of hospital expansions and upgrades through the Enhancing Regional Hospitals Program, the Advancing Queensland’s Health Infrastructure Program, and the Rural and Regional Infrastructure package.
Building Future Schools and Renewing our Schools
The Government has increased the $500 million Building Future Schools Fund by an additional $308 million, to cater for enrolment growth in high population growth areas. Through the now $808 million Building Future Schools Fund, the Government will build seven new secondary schools, a new special school in the Caboolture area and a new primary school at Ripley. The Government will also begin planning for four additional primary schools, two special schools and a new state high school in growth regions across the State.
For existing state high schools, the Government’s Renewing Our Schools Program will provide an additional $235 million over four years to 2021-22 to substantially refurbish 17 state high schools across the State.
10
Capital Statement 2018-19
Queen’s Wharf Brisbane
The Queen’s Wharf Brisbane development is a private investment of $3.5 billion in the urban renewal of the former government precinct, located on the Brisbane River, that was offered to the market by the Queensland Government, to create an iconic world class tourism offering.
The successful proponent, Destination Brisbane Consortium, will deliver five new premium hotels, three residential towers, in excess of 100 food and beverage and retail outlets, around 12 football fields (11 hectares) of enhanced public open space, the adaptive re-use of heritage buildings in the precinct and the construction of a pedestrian bridge to South Bank.
Consistent with the Government’s focus on job creation, the project will provide significant economic development opportunities for Queensland by supporting more than 2,000 jobs during construction and 8,000 ongoing jobs.
Demolition of the old government office buildings has been completed with excavation works now underway. The integrated resort is expected to open in 2022.
| 1.4.2 | Procurement and planning phase |
The Government is committed to the following projects and is currently undertaking procurement and planning works in order to deliver critical infrastructure for Queenslanders.
Cross River Rail
Cross River Rail is a 10.2 kilometre rail line from Dutton Park to Bowen Hills, with 5.9 kilometres of tunnel under the Brisbane River and CBD. Cross River Rail will see four new high capacity and two upgraded stations developed at Boggo Road, Woolloongabba, Albert Street, Roma Street, Dutton Park and the Exhibition showgrounds.
This second rail river crossing will deliver additional trains more often, ease congestion, improve network reliability and increase accessibility to the Brisbane CBD. The Government recognises the significant potential of this infrastructure to boost jobs and economic growth, and add value to commercial and residential development sites across the region. The Government is committed to maximising the benefits that can be achieved through integrated transport and land use development.
The Cross River Rail project’s total cost of delivery is forecast to be $5.409 billion over the period 2016-17 to 2023-24. The Queensland Government is fully funding the delivery of Cross River Rail and has provided the necessary funding, whilst continuing to call on the Australian Government to provide a contribution that reflects the national importance of this project.
During the 2017-18 financial year, the Cross River Rail project has progressed to the early works and procurement phase, with delivery and procurement overseen by the Cross River Rail Delivery Authority. Contractors have been shortlisted for the two major works packages – the Tunnel, Stations and Development PPP and the Rail, Integration and Systems alliance.
In this Budget, $733 million is allocated in 2018-19 for the Delivery Authority to continue to progress the planning, procurement and development associated with the Cross River Rail project. The Government has also continued its commitment to fully fund the Cross River Rail project, with the allocation of $914 million in 2021-22, bringing total funding to $3.726 billion to the end of the forward estimates. A further $1.683 billion will be allocated in future budgets, over the period to 2023-24, to finalise delivery of the project.
11
Capital Statement 2018-19
European Train Control System (ETCS) – Inner City
Implementation of ETCS through the centre of Brisbane’s train network will improve safety and provide capacity to run additional rail services. ETCS – Inner City is critical to facilitate the Cross River Rail project and meet passenger demand while it is being delivered.
The Government has allocated $634.4 million in its capital works program for delivery of ETCS between Milton and Northgate stations. The procurement of ETCS – Inner City has progressed in 2017-18, with the current Early Contractor Involvement procurement process expected to enable contract award in late 2018.
Rookwood Weir
The Rookwood Weir project presents an opportunity to supplement urban water supplies and enhance agricultural and industrial development in the Fitzroy Basin and Gladstone region. The weir could add 76,000 megalitres of water for agricultural production along the Fitzroy River and augment urban and industrial supply for Gladstone, Rockhampton and Livingstone Shire.
Significant steps have been taken throughout the year toward the construction of Rookwood Weir. During 2017-18, Building Queensland publicly released the detailed business case. The Queensland Government has allocated $176 million of funding across the next four years and has welcomed the Australian Government’s matching commitment. This means the capital costs of $352 million for the project are fully funded.
The Queensland Government continues to engage with the Australian Government to formalise the details of the arrangement and to agree on an appropriate split of operational costs for the Rookwood Weir so that procurement can commence in 2018. This would allow construction to commence in 2019.
New Performing Arts Venue at the Queensland Performing Arts Centre
The Queensland Government has committed to deliver a new $150 million state-of-the-art theatre for Brisbane, investing $125 million over four years from 2018-19.
This investment in a new theatre follows the recommendations of the detailed business case for a 1,500 to 1,700 seat theatre at the Playhouse Green site, to be operated by the Queensland Performing Arts Centre (QPAC), which will contribute $25 million to the new venue.
QPAC, which schedules over 1,000 performances annually to which 1.3 million people attended in 2017, is nearing full capacity with a strong forward program of bookings to 2022 and beyond.
The unique opportunity exists to invest in QPAC’s growth to create Queensland’s largest performing arts centre, with five outstanding venues that will further bolster Queensland’s cultural vibrancy, support our local arts sector and drive cultural tourism.
With QPAC operating the new theatre, it can program across all venues to ensure Queensland companies are supported by the best sized theatre and season duration, while also meeting growing demand for musicals.
A national design competition will be undertaken to deliver an outstanding architectural solution for the new theatre. The addition of this new theatre will see QPAC become Australia’s largest performing arts centre with the potential to welcome an additional 300,000 visitors each year when fully operational from 2022.
12
Capital Statement 2018-19
Brisbane Live
Brisbane Live proposes the establishment of a world class integrated entertainment and transport precinct at Roma Street, including a 17,000-seat entertainment arena, to be developed in conjunction with the precinct redevelopment for Cross River Rail.
An allocation of $5 million in 2018-19 will enable the Cross River Rail Delivery Authority to progress the Brisbane Live proposal as part of its precinct planning for Roma Street. Building Queensland will undertake an independent business case assessment of the proposal, with support from the Delivery Authority.
Port of Townsville Channel Capacity Upgrade
The Port of Townsville Limited (POTL) is proposing to widen the existing Platypus Channel and Sea Channel connection to the Port to allow larger vessels safe access, at an estimated cost of $193 million. The Queensland Government is investing $75 million into the project and is seeking matching funding from the Australian Government, with POTL funding $43 million.
As well as widening the channels, associated works include construction of rock walls and revetments to form receiving ponds for the beneficial re-use of dredge material, establishing a quarry to supply marine-grade armour rock required for rock walls and revetments, and installing navigation aids aligned with the new channel configuration. The POTL intends to beneficially re-use capital dredge material consistent with the Sustainable Ports Development Act 2015.
North Coast Line – Beerburrum to Nambour Rail Project
The Queensland Government is providing $160.8 million over four years towards the Beerburrum to Nambour rail duplication project to address the infrastructure and capacity constraints on this section of the North Coast Line. Detailed design will commence in 2018-19, with construction to be delivered in stages based on further negotiations with the Australian Government. The Australian Government has provided an initial $390 million over five years towards the project.
New Public Transport Ticketing System
The State has provided $371.1 million for a new public transport ticketing system that will be delivered across public transport over the next four years. The system will add new customer facing functionality including payment by contactless debit and credit cards, mobile phones and wearables in addition to go card and paper tickets.
13
Capital Statement 2018-19
| 1.5 | Highlights by asset class |
This section provides highlights by asset class for the 2018-19 capital program. The asset classes are based on the SIP.
In 2018-19, the total capital program for transport is forecast to be $4.950 billion including total capital grants of $239.3 million. This includes the Department of Transport and Main Roads, Queensland Rail, Far North Queensland Ports Corporation Limited, Gladstone Ports Corporation Limited, North Queensland Bulk Ports Corporation Limited, Port of Townsville Limited, RoadTek, the Gold Coast Waterways Authority and the Cross River Rail Delivery Authority. The Department of Transport and Main Roads will spend $89.2 million in 2018-19 for the new public transport ticketing system.
Roads
Highlights of the 2018-19 roads capital program include:
| • | | $147.3 million towards M1 Pacific Motorway upgrades, including: |
| | • | | $70 million to construct additional lanes on the Pacific Motorway between Mudgeeraba and Varsity Lakes, in partnership with the Australian Government, at a total estimated cost of $197.5 million. |
| | • | | $50 million to upgrade the Pacific Motorway/Gateway Motorway Merge, in partnership with the Australian Government, at a total estimated cost of $190 million. |
| | • | | $17 million to upgrade approximately nine kilometres of the Pacific Motorway between Eight Mile Plains and Daisy Hill to reduce congestion and travel times, in partnership with the Australian Government, at a total estimated cost of $749 million. |
| | • | | $5 million for the widening of the section from four to six lanes between Varsity Lakes and Tugun, at a total estimated cost of $1.030 billion. |
| • | | $200 million to duplicate the Bruce Highway from four to six lanes, Caloundra Road to the Sunshine Motorway, at a total estimated cost of $812.9 million, in partnership with the Australian Government. |
| • | | $115 million to construct the Mackay Ring Road (Stage 1), at a total estimated cost of $497.4 million, in partnership with the Australian Government. |
| • | | $45 million to widen the Gateway Motorway North to six lanes, at a total cost of $1.143 billion, in partnership with the Australian Government. |
| • | | $44.1 million to widen the seal and to apply wide centre line treatment at various locations on the Warrego Highway between Dalby and Miles, at a total cost of $63.6 million. |
| • | | $40 million to duplicate from two to four lanes on the section of the Bruce Highway (Rockhampton Northern Access) between Rockhampton-Yeppoon Road intersection and Terranova Drive, North of Rockhampton, at a total cost of $121 million, in partnership with the Australian Government. |
| • | | $534.3 million to continue the Toowoomba Second Range Crossing project, a bypass route to the north of Toowoomba, approximately 41 kilometres in length, running from the Warrego Highway at Helidon to the Gore Highway at Athol, via Charlton, at a total cost of $1.606 billion, in partnership with the Australian Government. |
14
Capital Statement 2018-19
| • | | $70 million of infrastructure development grants to local governments including Aboriginal and Torres Strait Islander community assistance. |
| • | | $68 million to provide a three kilometre upgrade of the Ipswich Motorway between Granard Road, Rocklea and Oxley Road, Oxley at a total cost of $400 million, in partnership with the Australian Government. |
Rail
The 2018-19 rail capital program totals $1.807 billion. Highlights of the program include:
| • | | $733 million to continue to progress the planning, procurement, and development associated with the Cross River Rail project. |
| • | | $472.3 million to continue delivery of 75 new six-car sets and services over a 32-year period for the New Generation Rollingstock to meet growing demand for rail services in South East Queensland, as well as further $35.3 million to support the delivery of the New Generation Rollingstock into service. |
| • | | $237.4 million for network investment including track infrastructure, civil structures, signalling and other network assets. |
| • | | $88.8 million for rail operations investment including rollingstock overhauls, operational facilities, and other rail operations assets. |
| • | | $43.3 million to upgrade (or improve) station accessibility at various train stations including Strathpine, Boondall, Morayfield, Southbank, Dakabin, Cannon Hill, Buranda, Fairfield, Albion, East Ipswich and Loganlea Stations, at a total estimated cost of $230.9 million. |
| • | | $35.4 million to implement the European Train Control System – Inner City, at a total estimated cost of $634.4 million. |
| • | | $21.9 million to upgrade the capacity of the North Coast Rail Line to increase productivity and efficiency of freight transport, at a total estimated cost of $82.7 million. |
| • | | $19.6 million to improve customer experience, maintain service continuity and build network resilience on the Townsville – Mount Isa Rail Line. |
| • | | $14.7 million to revitalise and modernise Brisbane’s Central Station to improve the customer experience and cater for future growth, at a total estimated cost of $65.9 million. |
| • | | $14.4 million out of the Queensland Government’s contribution of $160.8 million towards the Beerburrum to Nambour rail duplication project to address the infrastructure and capacity constraints on this section of the North Coast Line. |
Ports
The 2018-19 ports capital program totals $181.2 million. Highlights of the program include:
| • | | $83.5 million towards ongoing development of the Port of Gladstone and additional works at the Port of Bundaberg and the Port of Rockhampton, including $35.6 million towards continuing upgrades at the RG Tanna Coal Terminal at the Port of Gladstone, at a total cost of $220.3 million. |
| • | | $75.1 million towards ongoing development at the ports of Townsville and Lucinda, including $44.3 million of a Queensland Government contribution of $75 million to continue preparatory and initial works to widen Townsville’s shipping channel to allow larger vessels to access the Port of Townsville, at a total project cost of $193.5 million. |
15
Capital Statement 2018-19
| • | | $15 million to continue port planning and development initiatives to meet industry requirements for export facilities at North Queensland ports. |
| • | | $7.5 million towards new and continuing development of ports in Far North Queensland, including $2 million to continue to develop the Tingira Street Precinct in Cairns, at a total cost of $17.9 million. |
The 2018-19 energy capital program is $2.178 billion. The capital program supports the Government’s commitment to deliver cost-effective, safe, secure and reliable energy.
Highlights of the energy portfolio’s 2018-19 capital program include:
| • | | $1.461 billion of capital purchases by Energy Queensland Limited as a part of its commitment to providing a safe, secure and highly reliable electricity supply to all Queensland customers that is both cost effective and dependable. This includes $29 million in 2018-19 to continue work on the multi-stage SunCoast Power Project to increase network capacity and improve reliability on the Sunshine Coast. |
| • | | $232.7 million of capital purchases by Powerlink, Queensland’s high voltage electricity transmission entity, predominantly focused on refit or replacement of aged equipment and assets. This includes the $8.7 million refit in 2018-19 of the Collinsville-Proserpine Transmission Line in North Queensland, to ensure continued reliable supply of electricity. |
| • | | $225.5 million of capital purchases by CS Energy, reflecting its continued commitment to ongoing reliability and efficiency of generation plant at its power station sites. This includes $104.6 million in 2018-19 to improve the Callide Power Station and $90.5 million in 2018-19 to improve the Kogan Creek Power Station. |
| • | | $208.6 million of capital purchases by Stanwell Corporation, which primarily relates to replacement, refurbishment and upgrades to plant and equipment at the various Queensland power station sites, such as the planned $39.9 million major overhaul of the Tarong Power Station in 2018-19. |
| • | | Up to $50 million to support the development of concentrated solar thermal with storage projects to provide clean and baseload power. |
The 2018-19 water capital program is $277 million. The capital program supports the Government’s commitment to deliver cost-effective, safe, secure and reliable water supply.
Highlights of the water portfolio’s 2018-19 capital program include:
| • | | $147.2 million of capital purchases by Seqwater to continue a safe, secure and reliable water supply for South East Queensland, as well as providing essential flood mitigation services and managing catchment health. |
| • | | $66 million to commence construction of Rookwood Weir to supplement urban water supplies and enhance agricultural and industrial development in the Fitzroy Basin and Gladstone region to provide drought contingency supplies, out of a $352 million total capital spend. |
16
Capital Statement 2018-19
| • | | $25.6 million of capital purchases by SunWater with a focus on the continuation of a reliable bulk water supply for regional Queensland and ensuring SunWater’s dams are enhanced to meet the extreme weather events that the State can experience. |
| • | | $31.8 million of capital purchases by the Gladstone Area Water Board and Mount Isa Water Board to continue effective operations of the water boards’ property, plant and equipment. |
Total capital purchases in 2018-19 for the health portfolio are $985.5 million. The 2018-19 capital program includes investment in health infrastructure, capital works and purchases across a broad range of areas including hospitals, ambulance stations and vehicles, health technology, research and scientific services, mental health services, staff accommodation and information and communication technology.
Highlights of the 2018-19 capital program for the health portfolio include:
| • | | $84.8 million as part of the Enhancing Regional Hospitals Program, to continue upgrades to the Hervey Bay and Gladstone Emergency Departments, repurpose the Caloundra Health Service and redevelop the Roma Hospital. |
| • | | $80 million under the Priority Capital Program to be distributed across Hospital and Health Services and Health Support Queensland for a range of capital works projects to enhance, refurbish or replace existing infrastructure and to sustain and improve business and service level continuity. |
| • | | $53.3 million to continue delivery of projects as part of the Rural and Regional Infrastructure package, including redevelopment of Blackall Hospital, Sarina Hospital, Kingaroy Hospital and Townsville Hospital Clinical Services, construction of a new Cairns Mental Health Unit, Mer (Murray) Island Building and staff accommodation across the State, and delivery of a Maryborough Hospital Emergency Department and Specialist Outpatients Department. |
| • | | $28.7 million as part of the $679 million Building Better Hospitals program, to redevelop Logan (including a new maternity ward), Caboolture and Ipswich hospitals, commence planning and business case development for the Wide Bay region and refurbish three Cancer Council Queensland lodges. |
| • | | $28.1 million to establish a new Adolescent Extended Treatment Facility at The Prince Charles Hospital, two new Adolescent Step Up Step Down units in Brisbane, and to refurbish two Adolescent Day Program spaces at Logan and the Gold Coast, at a total estimated cost of $68.2 million. |
| • | | $26.6 million as part of the Advancing Queensland’s Health Infrastructure Program, at a total estimated cost of $230 million. The program facilitates essential upgrades to health facilities and supporting infrastructure across Queensland, including repurposing of the Nambour General Hospital, redevelopment of Atherton Hospital Emergency Department and operating theatres and redevelopment of the Thursday Island Hospital. |
| • | | $15.1 million for the Queensland Ambulance Service to invest in vehicles and stretchers including commissioning 85 new and replacement ambulance vehicles and continuing the rollout of power-assisted stretchers. |
17
Capital Statement 2018-19
| 1.5.5 | Education and Training |
The education portfolio will make capital purchases of $674.3 million in 2018-19. This includes the construction and refurbishment of school educational facilities, early childhood education and care services.
Total capital purchases for the training portfolio, including the Department of Employment, Small Business and Training and TAFE Queensland, are $57.4 million in 2018-19.
Highlights of the education and training capital programs include:
| • | | $125.2 million as part of the $250 million for new classrooms and other infrastructure in state secondary schools to accommodate the six full cohorts in 2020. |
| • | | $122.5 million to undertake new stages for recently opened schools and provide additional classrooms at existing schools in growth areas throughout the State. |
| • | | $98.5 million in capital grants to the non-state schooling sector and student hostels. |
| • | | $94.5 million as part of the $808 million Building Future Schools Fund to deliver world class learning environments for students and address enrolment growth pressures in state schools. |
| • | | $84.2 million to replace and enhance facilities at existing schools. |
| • | | $47 million as part of $97 million in total funding for the Advancing Clean Energy Schools program to upgrade and install solar and energy efficiency measures in state schools. |
| • | | $30 million out of the up to $85 million over three years, committed as part of the election commitment for the Advancing Our Training Infrastructure initiative to redevelop, refurbish and expand key high-need TAFE facilities. |
| • | | $17.3 million to renew and grow Queensland’s training assets required for delivery of priority skills training that supports workforce and economic development. |
| • | | $15 million as part of $235 million in total funding for the Renewing Our Schools program to substantially refurbish and upgrade 17 schools across the State. |
| • | | $8 million as part of $25.6 million in total funding to conduct upgrades and renewal works at 31 state schools. |
The 2018-19 capital program features a range of projects designed to facilitate improvements in the State’s digital infrastructure.
Highlights across Government include:
| • | | $164.2 million to be invested in 2018-19 prioritised information and communication technology categories to ensure continued efficiency of the Queensland Health system. This will include investment in core infrastructure to support digital hospitals, replacement and enhancement of core clinical systems to support frontline health service provision and decision making at the point of care. |
| • | | $22.6 million to help deliver a modern statewide Laboratory Information System, at a total estimated cost of $60.9 million. |
18
Capital Statement 2018-19
| • | | $8.9 million to support Queensland Ambulance Service information and communication technology. |
| • | | $8.5 million to acquire new and/or replace state-of-the-art scientific equipment by the Queensland Institute of Medical Research. |
| • | | $8.4 million to expand and upgrade existing audio visual capacity in the justice system, which includes video conferencing and in-custody court appearances. |
| • | | $8.3 million to implement an online Blue Card application system. |
| • | | $2 million to design and plan a single TAFE Queensland IT network and Wi-Fi upgrade. |
| 1.5.7 | Justice and Public Safety |
The 2018-19 Budget provides significant investment in capital purchases to support the delivery of essential justice and public safety services to Queensland communities.
Highlights of the 2018-19 justice and public safety capital program include:
| • | | $55 million to refurbish, upgrade or replace police facilities across the State. |
| • | | $44.3 million for replacement and new urban and rural fire appliances. |
| • | | $31.8 million to continue to replace rotary-wing aircraft, which deliver aeromedical retrieval and transfer services and perform search and rescue and disaster response operations. |
| • | | $30 million for new and replacement police service vehicles. |
| • | | $29.8 million to replace or upgrade urban and rural fire and emergency and state emergency services facilities across Queensland. |
| ��� | | $19 million to support the transition of 17 year olds into the Youth Justice system (including for zonal fencing and an additional 12 beds at the Cleveland Youth Detention Centre), at a total estimated cost of $26 million. |
| • | | $13.9 million to upgrade courthouses at Rockhampton, Beenleigh and Townsville, at a total estimated cost of $32 million. |
| • | | $10.6 million to continue construction of the Counter-Terrorism and Community Safety Training Centre at Wacol, at a total estimated cost of $46.7 million. |
In addition, $167.8 million of capital purchases will be provided in 2018-19 primarily for prison infrastructure, perimeter security upgrades, correctional centre enhancements and security management system upgrades. These capital purchases include:
| • | | $107 million to provide an additional 348 cells at Capricornia Correctional Centre, at a total estimated cost of $241 million. |
| • | | $20.5 million to continue upgrading perimeter security at a number of correctional centres, at a total estimated cost of $76.6 million. |
| • | | $3.7 million to redevelop the Borallon Training and Correctional Centre, at a total estimated cost of $126.9 million. |
19
Capital Statement 2018-19
| 1.5.8 | Arts, Culture and Recreation |
Significant investment is provided in 2018-19 for arts, culture and recreation. Highlights of this investment include:
| • | | $120 million to develop the North Queensland Stadium. |
| • | | $37.3 million under the Get Playing Places and Spaces and Get Playing Plus programs and other various grants to provide for new or upgraded sport and recreation infrastructure and participation projects to support Queensland children and healthy communities. |
| • | | $26.6 million in 2018-19 to support sport and recreation clubs at the grassroots through the delivery of infrastructure projects including the Underwood Sports Park, the University of the Sunshine Coast Stadium and the Zillmere Sports Centre. |
| • | | $15.6 million out of a total estimated cost of $44 million to complete construction of the Queensland State Netball Centre, in partnership with the Australian Government. |
| • | | $13.5 million to redevelop the Mon Repos Turtle Centre. |
| • | | $9.5 million to meet the Queensland Government’s contribution toward the $35 million refurbishment of the Thomas Dixon Centre and to manage costs and associated works required to maintain and preserve the heritage-listed centre. |
| • | | The Government is providing additional funding of $8 million over two years, held centrally, to the Rockhampton Regional Council for the construction of the new Rockhampton Art Gallery, subject to the confirmation of a $10 million contribution from the Australian Government. |
| • | | $7.5 million to support ecotourism opportunities and tourism recovery in the Whitsunday Islands National Park. |
| • | | $5.8 million for the Great Keppel Island Recovery Package to deliver major tourism infrastructure improvements such as power and water connections to the mainland. |
| • | | $5 million to build a new $150 million performing arts venue at the Queensland Performing Arts Centre, benefitting Queensland artists and audiences. |
| • | | $5 million capital grant towards the construction of the Cairns Performing Arts Centre. |
| • | | $4.9 million to address critical infrastructure upgrade works at the Queensland Museum and installation of two further cooling towers within the Central Energy Plant at the Queensland Cultural Centre, South Bank. |
| • | | $4.7 million to enhance critical infrastructure to support ecotourism activities at Glasshouse Mountain National Park, Noosa National Park and D’Aguilar National Park. |
Social housing is provided by the Queensland Government and non-government organisations to assist people who are unable to secure and sustain accommodation in the private market. The Government’s capital investment in social housing in 2018-19 includes:
| • | | $339.1 million towards construction of new dwellings and upgrades to existing social housing properties. |
| • | | $103.6 million of capital grants to assist non-government organisations and Aboriginal and Torres Strait Islander communities to construct and upgrade social housing dwellings. |
20
Capital Statement 2018-19
This capital investment includes $124.2 million for social housing in Aboriginal and Torres Strait Islander communities to deliver social housing dwellings, upgrade existing housing, and support transfer of social housing for home ownership on Indigenous land. Delivery of social housing in Aboriginal and Torres Strait Islander communities may need to be amended in recognition of the end of the National Partnership on Remote Housing funding, pending further negotiations with the Australian Government.
Under the Queensland Housing Strategy 2017-2027, the Department of Housing and Public Works delivers a range of programs that support the supply and improvement of social housing dwellings. In particular, the Housing Construction Jobs Program will fund the commencement of up to 599 social housing dwellings in 2018-19.
21
Capital Statement 2018-19
| 2 | 2018-19 Capital program overview |
Over the forward estimates period, the Queensland Government has allocated $45.769 billion to provide essential infrastructure and capital works across the State, contributing to the ongoing transformation of the State’s cities and supporting ongoing growth of regional economies.
In 2018-19, the Palaszczuk Government will deliver a $11.583 billion capital program, up from $10.171 billion allocated for the 2017-18 capital program in last year’s Budget The capital works program in 2018-19 is estimated to directly support more than 38,000 jobs, equating to around 33,000 full time equivalent jobs.
The 2018-19 capital program is comprised of $9.922 billion of purchases of non-financial assets (PNFA) and acquisitions of non-financial assets under finance leases and $1.661 billion of capital grants expenses.
The 2018-19 Budget also highlights the Government’s commitment to deliver critical infrastructure to meet the needs of Queenslanders throughout all regions of the State. The capital program in regional Queensland will be $5.597 billion in 2018-19, up from $4.811 billion in 2017-18 in last year’s Budget.
Around 65 per cent of the total capital program in 2018-19 will be spent outside of Greater Brisbane (Brisbane, Logan and Ipswich).
An important component of the Government’s capital program is undertaken through the Public Non-financial Corporations (PNFC) sector (that is, commercial entities of government, including government-owned corporations). Capital purchases by the PNFC sector in 2018-19 will comprise 27.1 per cent of the total capital program, reflecting major investments in port and rail infrastructure, as well as in the energy sector.
The Government has implemented a clear focus on improving the timely delivery of essential infrastructure for Queensland. This has resulted in an improvement in the amount of capital expenditure delivered, with the proportion of budgeted capital purchases actually delivered in 2016-17 being the highest in the past five years. Further improvement is anticipated in 2017-18, with more than 90 per cent of budgeted capital purchases expected to be delivered, compared with the average of 85 per cent for the past five years from 2012-13 to 2016-17.
22
Capital Statement 2018-19
| 2 | Capital Statement 2018-19 |
The Queensland Government is investing to provide essential infrastructure and capital works to meet the increasing service needs of Queenslanders and promote increased productivity and efficiency for the State’s industries.
The 2018-19 capital program is comprised of $9.922 billion of PNFA and acquisitions of non-financial assets under finance leases.
Capital purchases by purpose in 2018-19 are shown in Chart 1. Transport continues to account for the largest share of purchases, followed by energy, health and community services, and education and training.
| Chart 1 | Capital purchases by purpose 2018-19 |
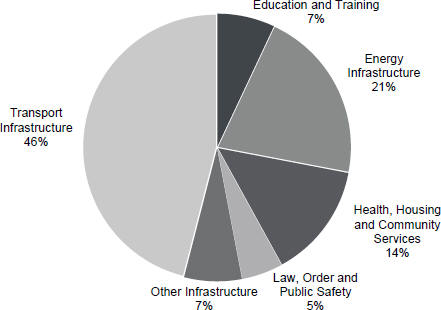
23
Capital Statement 2018-19
Table 2 shows capital purchases by Queensland Government entity, including the 2017-18 year (estimated actual) and the Budget for 2018-19. Transport and Main Roads has the largest proportion of total capital purchases.
| Table 2 | Capital purchases for 2018-19 by Queensland Government entity1,2 |
| | | | | | | | |
Entity | | 2017-18
Est. Actual
$‘000 | | | 2018-19
Budget
$‘000 | |
Aboriginal and Torres Strait Islander Partnerships | | | 495 | | | | 6,473 | |
Agriculture and Fisheries | | | 20,875 | | | | 23,191 | |
Child Safety, Youth and Women | | | 27,511 | | | | 49,589 | |
Communities, Disability Services and Seniors | | | 14,247 | | | | 17,001 | |
Education | | | 626,954 | | | | 674,301 | |
Electoral Commission of Queensland | | | 3,083 | | | | 3,381 | |
Employment, Small Business and Training | | | 34,231 | | | | 57,400 | |
Environment and Science | | | 62,468 | | | | 102,391 | |
Housing and Public Works | | | 460,008 | | | | 459,662 | |
Innovation, Tourism Industry Development and the Commonwealth Games | | | 2,180 | | | | 196 | |
Justice and Attorney-General | | | 98,463 | | | | 75,728 | |
Legislative Assembly of Queensland | | | 6,798 | | | | 9,214 | |
Local Government, Racing and Multicultural Affairs | | | 18,855 | | | | 3,290 | |
Natural Resources, Mines and Energy | | | | | | | | |
Natural Resources, Mines and Energy | | | 16,009 | | | | 90,996 | |
Energy Generation | | | 251,236 | | | | 434,030 | |
Energy Transmission and Distribution | | | 1,566,777 | | | | 1,693,844 | |
Water Distribution and Supply | | | 217,099 | | | | 204,658 | |
Premier and Cabinet | | | 3,232 | | | | 1,047 | |
Public Safety Business Agency3 | | | 240,015 | | | | 254,082 | |
Queensland Corrective Services | | | 46,994 | | | | 167,752 | |
Queensland Fire and Emergency Services | | | 6,200 | | | | 5,750 | |
Queensland Health | | | 798,792 | | | | 985,479 | |
Queensland Police Service | | | 24,448 | | | | 20,124 | |
Queensland Treasury | | | | | | | | |
Queensland Treasury | | | 13,712 | | | | 6,125 | |
Cross River Rail Delivery Authority | | | 129,204 | | | | 733,000 | |
State Development, Manufacturing, Infrastructure and Planning | | | 131,849 | | | | 232,853 | |
Transport and Main Roads | | | | | | | | |
Transport and Main Roads | | | 3,117,653 | | | | 3,208,813 | |
Queensland Rail | | | 582,404 | | | | 587,472 | |
Port Authorities | | | 115,385 | | | | 181,246 | |
Other Agencies4 | | | 24,783 | | | | 1,596 | |
Other Adjustments5 | | | (97,029 | ) | | | 280,825 | |
Anticipated Contingency Reserve6 | | | (350,000 | ) | | | (650,000 | ) |
Total Capital Purchases | | | 8,214,931 | | | | 9,921,509 | |
24
Capital Statement 2018-19
| | | | | | | | |
Total Capital Purchases Breakdown | | 2017-18
Est. Actual
$‘000 | | | 2018-19
Budget
$‘000 | |
Consisting of: | | | | | | | | |
Purchases of non-financial assets per Non-financial Public Sector Cash Flow Statement (BP2 Table 9.9) | | | 7,655,729 | | | | 9,057,206 | |
New finance leases | | | 559,202 | | | | 864,303 | |
Total Capital Purchases | | | 8,214,931 | | | | 9,921,509 | |
Notes
| 1. | Includes all associated statutory bodies. |
| 2. | Numbers may not add due to rounding. |
| 3. | The Public Safety Business Agency is a capital purchaser for Queensland Fire and Emergency Services, Queensland Police Service and the Office of the Inspector-General Emergency Management. |
| 4. | Includes other Government entities with non-material capital programs. |
| 5. | Representing Inter-agency eliminations, movements in capital payable and receivable, funds held centrally and other accounting adjustments to align with Uniform Presentation Framework Statements. |
| 6. | Contingency recognises that on a whole-of-Government basis, there is likely to be under spending, resulting in a carryover of capital allocations. |
25
Capital Statement 2018-19
Table 3 shows capital purchases by Regional Action Plan (RAP) region and statistical area. Around $4.506 billion of total capital purchases are allocated to regional Queensland (Central Queensland, Darling Downs, Far North Queensland, Mackay – Whitsunday, Outback Queensland, Townsville and Wide Bay) in 2018-19, up from $3.760 billion in 2017-18 in last year’s Budget.
Around 62 per cent of capital purchases in 2018-19 will be spent outside of Greater Brisbane (Brisbane, Logan and Ipswich).
| Table 3 | Capital purchases by RAP region and statistical area for 2018-191,2 |
| | | | | | | | | | | | | | |
Regional Action Plan Region | | Capital
Purchases
$‘000 | | | Statistical Area | | Capital
Purchases
$‘000 | |
Brisbane | | | 2,536,477 | | | | 301 | | | Brisbane East | | | 158,097 | |
| | | | | | | 302 | | | Brisbane North | | | 339,651 | |
| | | | | | | 303 | | | Brisbane South | | | 370,569 | |
| | | | | | | 304 | | | Brisbane West | | | 186,363 | |
| | | | | | | 305 | | | Inner Brisbane | | | 1,481,797 | |
Ipswich3 | | | 925,006 | | | | 310 | | | Ipswich | | | 925,006 | |
Wide Bay | | | 488,365 | | | | 319 | | | Wide Bay | | | 488,365 | |
Darling Downs | | | 1,154,155 | | | | 307 | | | Darling Downs Maranoa | | | 394,937 | |
| | | | | | | 317 | | | Toowoomba | | | 759,218 | |
Gold Coast | | | 583,487 | | | | 309 | | | Gold Coast | | | 583,487 | |
Logan | | | 298,341 | | | | 311 | | | Logan Beaudesert | | | 298,341 | |
Mackay-Whitsunday | | | 452,750 | | | | 312 | | | Mackay | | | 452,750 | |
Outback Queensland4 | | | 243,000 | | | | 315 | | | Outback | | | 344,005 | |
Far North Queensland4 | | | 512,927 | | | | 306 | | | Cairns | | | 411,922 | |
Central Queensland | | | 918,233 | | | | 308 | | | Fitzroy | | | 918,233 | |
Sunshine Coast and Moreton Bay | | | 1,072,539 | | | | 316 | | | Sunshine Coast | | | 722,842 | |
| | | | | | | 313 | | | Moreton Bay North | | | 183,612 | |
| | | | | | | 314 | | | Moreton Bay South | | | 166,085 | |
Townsville | | | 736,229 | | | | 318 | | | Townsville | | | 736,229 | |
Total Capital Purchases | | | | | | | | | | | | | 9,921,509 | |
Notes
| 1. | Numbers may not add due to rounding. |
| 2. | The Anticipated Contingency Reserve and other adjustments have been spread across statistical areas proportionate to capital spends. |
| 3. | Capital purchases allocated to the Ipswich region include capital purchases related to the New Generation Rollingstock project, consistent with the approach adopted in previous State budgets. |
| 4. | $101 million of capital purchases in the Outback statistical area belongs to the Far North Queensland region. |
26
Capital Statement 2018-19
The Queensland Government provides grants for capital purposes to a range of organisations and private individuals.
Capital grants to local governments (LG), non-government organisations (NGOs) and individuals are illustrated in Chart 2 below. Capital grants are expected to be $1.661 billion in 2018-19, the largest of which are capital grants to local governments for transport.
| Chart 2 | Capital grants by purpose and recipient |
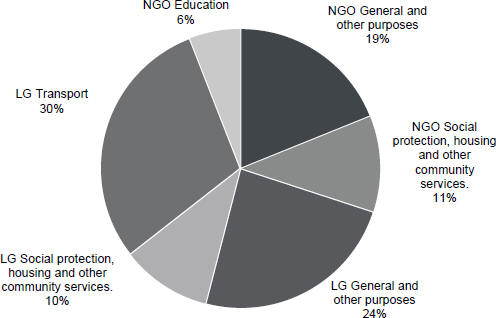
27
Capital Statement 2018-19
Table 4 shows the planned expenditure on capital grants by Queensland Government entity for 2018-19. State Development, Manufacturing, Infrastructure and Planning has the highest amount of capital grants.
Table 4 Expenditure on capital grants by Queensland Government entity for 2018-191,2
| | | | | | | | |
Entity | | 2017-18
Est. Actual
$‘000 | | | 2018-19
Budget
$‘000 | |
Aboriginal and Torres Strait Islander Partnerships | | | 12,653 | | | | 13,607 | |
Agriculture and Fisheries | | | 3,292 | | | | 1,679 | |
Child Safety, Youth and Women | | | 400 | | | | 500 | |
Communities, Disability Services and Seniors | | | 2,754 | | | | 3,138 | |
Education | | | 92,675 | | | | 98,501 | |
Environment and Science | | | 9,508 | | | | 6,965 | |
Housing and Public Works | | | 68,780 | | | | 182,518 | |
Innovation, Tourism Industry Development and the Commonwealth Games | | | 10,932 | | | | 34,484 | |
Local Government, Racing and Multicultural Affairs | | | 328,617 | | | | 316,692 | |
Natural Resources, Mines and Energy | | | — | | | | 50,000 | |
Premier and Cabinet | | | 5,000 | | | | 1,015 | |
Queensland Fire and Emergency Services | | | 897 | | | | 897 | |
Queensland Treasury | | | 210,897 | | | | 139,725 | |
State Development, Manufacturing, Infrastructure and Planning | | | 365,376 | | | | 487,301 | |
Transport and Main Roads | | | 231,964 | | | | 239,338 | |
Other Adjustments3 | | | 80,273 | | | | 84,909 | |
Total Capital Grants | | | 1,424,018 | | | | 1,661,269 | |
Notes
| 1. | Includes associated statutory bodies. |
| 2. | Numbers may not add due to rounding. |
| 3. | Includes assets transferred, funds held centrally and other technical accounting adjustments. |
28
Capital Statement 2018-19
Table 5 shows expenditure on capital grants by RAP region and statistical area. Around $1.091 billion of total capital grants are allocated to regional Queensland (Central Queensland, Darling Downs, Far North Queensland, Mackay – Whitsunday, Outback Queensland, Townsville and Wide Bay) in 2018-19, up from $1.051 billion in 2017-18 in last year’s Budget.
Around 79 per cent of capital grants in 2018-19 will be spent outside of Greater Brisbane (Brisbane, Logan and Ipswich).
| Table 5 | Capital grants by RAP region and statistical area for 2018-191,2 |
| | | | | | | | | | | | | | |
Regional Action Plan Region | | Grants
$‘000 | | | Statistical Area | | Grants
$‘000 | |
Brisbane | | | 187,895 | | | | 301 | | | Brisbane East | | | 33,571 | |
| | | | | | | 302 | | | Brisbane North | | | 33,207 | |
| | | | | | | 303 | | | Brisbane South | | | 47,270 | |
| | | | | | | 304 | | | Brisbane West | | | 25,937 | |
| | | | | | | 305 | | | Inner Brisbane | | | 47,910 | |
Ipswich | | | 88,686 | | | | 310 | | | Ipswich | | | 88,686 | |
Wide Bay | | | 103,344 | | | | 319 | | | Wide Bay | | | 103,344 | |
Darling Downs | | | 91,480 | | | | 307 | | | Darling Downs Maranoa | | | 54,202 | |
| | | | | | | 317 | | | Toowoomba | | | 37,278 | |
Gold Coast | | | 96,886 | | | | 309 | | | Gold Coast | | | 96,886 | |
Logan | | | 65,152 | | | | 311 | | | Logan Beaudesert | | | 65,152 | |
Mackay-Whitsunday | | | 153,395 | | | | 312 | | | Mackay | | | 153,395 | |
Outback Queensland3 | | | 244,939 | | | | 315 | | | Outback | | | 365,722 | |
Far North Queensland3 | | | 266,786 | | | | 306 | | | Cairns | | | 146,003 | |
Central Queensland | | | 125,928 | | | | 308 | | | Fitzroy | | | 125,928 | |
Sunshine Coast and Moreton Bay | | | 131,707 | | | | 316 | | | Sunshine Coast | | | 61,820 | |
| | | | | | | 313 | | | Moreton Bay North | | | 38,817 | |
| | | | | | | 314 | | | Moreton Bay South | | | 31,070 | |
Townsville | | | 105,071 | | | | 318 | | | Townsville | | | 105,071 | |
Total Capital Grants | | | | | | | | | | | | | 1,661,269 | |
Notes
| 1. | Numbers may not add due to rounding. |
| 2. | The adjustments referred to in Table 4 have been spread across statistical areas proportionate to allocation of Grants. |
| 3. | $120.8 million of capital grants in the Outback statistical area belongs to the Far North Queensland region. |
Chart 3 shows the distribution of the total 2018-19 capital program (capital purchases and capital grants) across the geographical regions of Queensland, as classified for Budget Paper 3 purposes.
29
Capital Statement 2018-19
| Chart 3 | Map of capital program by Queensland regions |
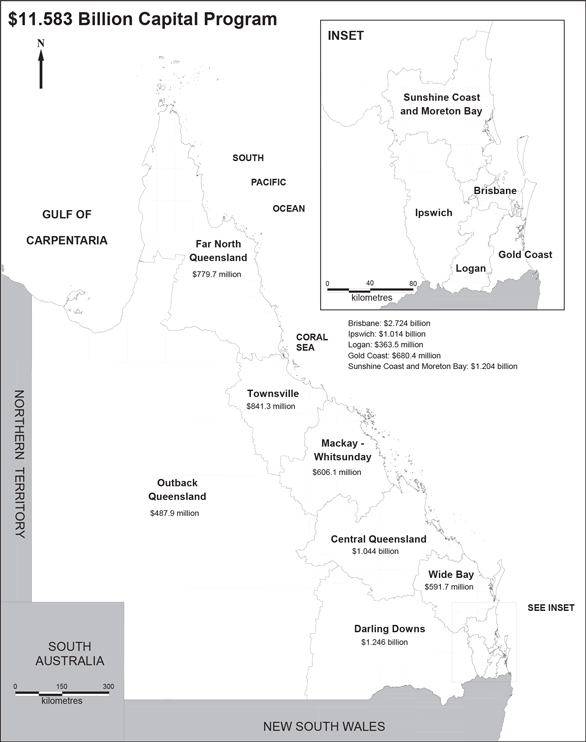
Note: Boundaries are based on ASGS 2011
30
Capital Statement 2018-19
| 3 | Capital outlays by entity |
| 3.1 | ABORIGINAL AND TORRES STRAIT ISLANDER PARTNERSHIPS |
Department of Aboriginal and Torres Strait Islander Partnerships
Total capital purchases for the Department of Aboriginal and Torres Strait Islander Partnerships are estimated to be $6.5 million in 2018-19. Total capital grants for the department are estimated to be $13.6 million in 2018-19.
Program Highlights (Property, Plant and Equipment)
| • | | $6 million to acquire land to support the Cape York Peninsula Tenure Resolution Program, which returns ownership and management of land on Cape York to traditional owners. |
| • | | $473,000 for other property, plant and equipment. |
Program Highlights (Capital Grants)
| • | | $13.6 million to develop infrastructure in remote and discrete Aboriginal and Torres Strait Islander communities, including $4 million for Splash parks in the Cape York Communities of Pormpuraaw, Napranum and Mapoon, and $1.2 million for the Kowanyama Men’s Shed and Women’s Meeting Place. |
| | | | | | | | | | | | | | | | | | | | |
| Aboriginal and Torres Strait Islander Partnerships | |
Project | | Statistical
Area | | | Total
Estimated
Cost
$‘000 | | | Expenditure
to
30-06-18
$‘000 | | | Budget
2018-19
$‘000 | | | Post
2018-19
$‘000 | |
DEPARTMENT OF ABORIGINAL AND TORRES STRAIT ISLANDER PARTNERSHIPS | | | | | | | | | | | | | | | | | | | | |
| | | | | |
Property, Plant and Equipment | | | | | | | | | | | | | | | | | | | | |
Cape York Peninsula Tenure Resolution Program land acquisitions | | | 315 | | | | 6,000 | | | | | | | | 6,000 | | | | | |
Other property, plant and equipment | | | Various | | | | | | | | | | | | 473 | | | | Ongoing | |
| | | | | | | | | | | | | | | | | | | | |
Total Property, Plant and Equipment | | | | | | | | | | | | | | | 6,473 | | | | | |
| | | | | | | | | | | | | | | | | | | | |
| | | | | |
Capital Grants | | | | | | | | | | | | | | | | | | | | |
Indigenous land and infrastructure programs | | | Various | | | | 117,261 | | | | 103,654 | | | | 13,607 | | | | | |
| | | | | | | | | | | | | | | | | | | | |
Total Capital Grants | | | | | | | | | | | | | | | 13,607 | | | | | |
| | | | | | | | | | | | | | | | | | | | |
| | | | | | | | | | | | | | | | | | | | |
| | | | | | | | | | | | | | | | | | | | |
TOTAL ABORIGINAL AND TORRES STRAIT ISLANDER PARTNERSHIPS (PPE) | | | | | | | | | | | | | | | 6,473 | | | | | |
| | | | | | | | | | | | | | | | | | | | |
| | | | | | | | | | | | | | | | | | | | |
| | | | | | | | | | | | | | | | | | | | |
TOTAL ABORIGINAL AND TORRES STRAIT ISLANDER PARTNERSHIPS (CG) | | | | | | | | | | | | | | | 13,607 | | | | | |
| | | | | | | | | | | | | | | | | | | | |
31
Capital Statement 2018-19
| 3.2 | AGRICULTURE AND FISHERIES |
Department of Agriculture and Fisheries
Capital purchases and grants for the Department of Agriculture and Fisheries, reporting to the Minister for Agricultural Industry Development and Fisheries are $22.1 million for 2018-19. The department’s capital program is focused on developing and upgrading research facilities to deliver outcomes for agriculture, biosecurity, fisheries and forestry.
The department has facilities located throughout rural and regional Queensland. These require continual minor works, mechanical items and plant and equipment upgrades to keep them operating effectively.
Program Highlights (Property, Plant and Equipment)
| • | | $5.5 million to continue upgrades to the department’s research and operational facilities through the Research Facilities Development, Scientific Equipment and Minor Works Programs. |
| • | | $3 million to upgrade and refurbish existing facilities at Toowoomba, which will enhance service delivery and improve operational efficiencies. |
| • | | $2.5 million to provide new and replacement heavy plant and equipment including trucks, tractors, irrigators, all-terrain vehicles and other machinery. |
| • | | $1.1 million to continue to replace vessels and marine equipment for fisheries research and regulatory functions. |
| • | | $1 million to commence restoration of the heritage listed Jimna Fire Tower located outside Kilcoy. |
| • | | $406,000 for leasehold fitout replacements to the Ecosciences and Health and Food Sciences precincts. |
Program Highlights (Capital Grants)
| • | | $879,000 to the Royal Society for the Prevention of Cruelty to Animals (RSPCA) Queensland to upgrade facilities in North Queensland. |
| • | | $500,000 to the Queensland Country Women’s Association (QCWA) to preserve heritage halls in rural and regional Queensland. |
| • | | $300,000 to the Paws and Claws animal welfare organisation to assist with the purchase of land for relocation of its current shelter facilities. |
32
Capital Statement 2018-19
Queensland Racing Integrity Commission
Capital purchases for the Queensland Racing Integrity Commission, reporting to the Minister for Local Government, Minister for Racing and Minister for Multicultural Affairs are $2.8 million for 2018-19. The capital program is focused upon laboratory upgrades to support core services provided to the Queensland racing industry.
| | | | | | | | | | | | | | | | | | |
| Agriculture and Fisheries | |
Project | | Statistical
Area | | Total
Estimated
Cost
$‘000 | | | Expenditure
to
30-06-18
$‘000 | | | Budget
2018-19
$‘000 | | | Post
2018-19
$‘000 | |
DEPARTMENT OF AGRICULTURE AND FISHERIES | | | | | | | | | | | | | |
| | | | | |
Property, Plant and Equipment | | | | | | | | | | | | | | | | | | |
Upgrade and Refurbishment of Existing Facilities at Toowoomba | | 317 | | | 7,350 | | | | 3,202 | | | | 2,950 | | | | 1,198 | |
Computer Equipment | | 305 | | | | | | | | | | | 4,965 | | | | Ongoing | |
Heavy Plant and Equipment | | Various | | | | | | | | | | | 2,500 | | | | Ongoing | |
Scientific Equipment | | Various | | | | | | | | | | | 2,500 | | | | Ongoing | |
Minor Works | | Various | | | | | | | | | | | 2,000 | | | | Ongoing | |
Vessels and Marine Equipment | | Various | | | | | | | | | | | 1,100 | | | | Ongoing | |
Research Facilities Development | | Various | | | | | | | | | | | 1,000 | | | | Ongoing | |
Jimna Fire Tower Restoration Project | | 313 | | | 1,500 | | | | | | | | 1,000 | | | | 500 | |
Portfolio Activity Reporting Information System Software | | 305 | | | 600 | | | | | | | | 600 | | | | | |
Software Purchases and Development | | 305 | | | | | | | | | | | 200 | | | | Ongoing | |
Ecosciences and Health and Food Sciences Precincts Fitout Replacement Program | | Various | | | | | | | | | | | 406 | | | | Ongoing | |
Other Property, Plant and Equipment | | Various | | | | | | | | | | | 1,156 | | | | Ongoing | |
| | | | | | | | | | | | | | | | | | |
Total Property, Plant and Equipment | | | | | | | | | | | | | 20,377 | | | | | |
| | | | | | | | | | | | | | | | | | |
| | | | | |
Capital Grants | | | | | | | | | | | | | | | | | | |
Royal Society for the Prevention of Cruelty to Animals Capital Grant | | Various | | | 3,000 | | | | 2,121 | | | | 879 | | | | | |
Queensland Country Women’s Association Heritage Halls Capital Grant | | 307 | | | 1,000 | | | | 500 | | | | 500 | | | | | |
Paws and Claws Capital Grant | | 306 | | | 300 | | | | | | | | 300 | | | | | |
| | | | | | | | | | | | | | | | | | |
Total Capital Grants | | | | | | | | | | | | | 1,679 | | | | | |
| | | | | | | | | | | | | | | | | | |
33
Capital Statement 2018-19
| | | | | | | | | | | | | | | | | | | | |
| Agriculture and Fisheries | |
Project | | Statistical
Area | | | Total
Estimated
Cost
$‘000 | | | Expenditure
to
30-06-18
$‘000 | | | Budget
2018-19
$‘000 | | | Post
2018-19
$‘000 | |
QUEENSLAND RACING INTEGRITY COMMISSION | | | | | | | | | | | | | |
| | | | | |
Property, Plant and Equipment | | | | | | | | | | | | | | | | | | | | |
Racing Science Centre Laboratory Technology Upgrades | | | 305 | | | | 8,717 | | | | 2,711 | | | | 2,814 | | | | 3,192 | |
| | | | | | | | | | | | | | | | | | | | |
Total Property, Plant and Equipment | | | | | | | | | | | | | | | 2,814 | | | | | |
| | | | | | | | | | | | | | | | | | | | |
| | | | | | | | | | | | | | | | | | | | |
| | | | | | | | | | | | | | | | | | | | |
TOTAL AGRICULTURE AND FISHERIES (PPE) | | | | | | | | | | | | | | | 23,191 | | | | | |
| | | | | | | | | | | | | | | | | | | | |
| | | | | | | | | | | | | | | | | | | | |
| | | | | | | | | | | | | | | | | | | | |
TOTAL AGRICULTURE AND FISHERIES (CG) | | | | | | | | | | | | | | | 1,679 | | | | | |
| | | | | | | | | | | | | | | | | | | | |
34
Capital Statement 2018-19
| 3.3 | CHILD SAFETY, YOUTH AND WOMEN |
Department of Child Safety, Youth and Women
Total capital purchases for the Department of Child Safety, Youth and Women are $49.6 million in 2018-19. Total capital grants for the portfolio are $500,000. These funds provide the infrastructure and systems to support children, young people and families to be safe and help prevent and respond to crime, violence, abuse and neglect.
Program Highlights (Property, Plant and Equipment)
| • | | $4.1 million to undertake a range of upgrades to Child Safety Service Centres to accommodate an additional 292 child protection staff, commencing from 2017-18. |
| • | | $2 million to continue compliance works and building upgrades to residential care facilities. |
| • | | $19 million of a total of $26 million to support the transition of 17 year olds into the Youth Justice system, including an allocation of $13.1 million in 2018-19 for further zonal fencing and an additional 12 beds at the Cleveland Youth Detention Centre. |
| • | | $7.2 million of a total of $32.8 million to upgrade the security management system at the Brisbane Youth Detention Centre. |
| • | | $5.2 million to conduct ongoing program renewal, maintenance and minor works of Youth Justice facilities. |
| • | | $1.3 million to continue the development of a whole-of-government Our Child information and communication technology system to improve information sharing across agencies with regards to children missing from out-of-home care. |
| • | | $8.1 million to enhance and develop information systems for the following key programs: |
| | • | | The Social Investment Program which will support the department’s social procurement spend and improve contract management system functionality for future outcome-based investment. |
| | • | | The Destination Information Initiative which will deliver smarter, simpler, better management of electronic information and documents. |
| | • | | The Child and Family Services Information and Communication Technology Program which is implementing solutions to support Child and Family Reform initiatives. |
35
Capital Statement 2018-19
Program Highlights (Capital Grants)
| • | | $500,000 for the Daniel Morcombe Foundation to construct a counselling centre at Palmwoods. The centre aims to educate children and young people about safety in a physical and online environment, prevent sexual abuse and support those children and young people who have been victims of crime. |
| | | | | | | | | | | | | | | | | | | | |
| Child Safety, Youth and Women | |
Project | | Statistical
Area | | | Total
Estimated
Cost
$‘000 | | | Expenditure
to
30-06-18
$‘000 | | | Budget
2018-19
$‘000 | | | Post
2018-19
$‘000 | |
DEPARTMENT OF CHILD SAFETY, YOUTH AND WOMEN | | | | | | | | | | | | | | | | | | | | |
| | | | | |
Property, Plant and Equipment | | | | | | | | | | | | | | | | | | | | |
Child and Family Services | | | | | | | | | | | | | | | | | | | | |
Restoring Child Protection - Child Safety Service Centres | | | Various | | | | 8,248 | | | | 1,275 | | | | 4,124 | | | | 2,849 | |
Residential Care Upgrades | | | Various | | | | | | | | | | | | 1,990 | | | | Ongoing | |
| | | | | | | | | | | | | | | | | | | | |
Sub-total Child and Family Services | �� | | | | | | | | | | | | | | 6,114 | | | | | |
| | | | | | | | | | | | | | | | | | | | |
| | | | | |
Youth Justice | | | | | | | | | | | | | | | | | | | | |
Transition of 17 year olds to the youth justice system | | | Various | | | | 25,986 | | | | 6,999 | | | | 18,987 | | | | | |
Brisbane Youth Detention Centre - Security Management System Upgrade | | | 310 | | | | 32,809 | | | | 18,953 | | | | 7,206 | | | | 6,650 | |
Youth Justice Facilities | | | Various | | | | | | | | | | | | 5,158 | | | | Ongoing | |
| | | | | | | | | | | | | | | | | | | | |
Sub-total Youth Justice | | | | | | | | | | | | | | | 31,351 | | | | | |
| | | | | | | | | | | | | | | | | | | | |
| | | | | |
Other Property, Plant and Equipment | | | | | | | | | | | | | | | | | | | | |
Office Accommodation | | | Various | | | | | | | | | | | | 1,251 | | | | Ongoing | |
Information Technology Infrastructure Replacement | | | Various | | | | | | | | | | | | 1,375 | | | | Ongoing | |
Missing Child Interagency System (Our Child) Project | | | Various | | | | 2,620 | | | | 1,271 | | | | 1,349 | | | | | |
Information Systems Enhancements | | | Various | | | | | | | | | | | | 8,149 | | | | Ongoing | |
| | | | | | | | | | | | | | | | | | | | |
Sub-total Other Property, Plant and Equipment | | | | | | | | | | | | | | | 12,124 | | | | | |
| | | | | | | | | | | | | | | | | | | | |
Total Property, Plant and Equipment | | | | | | | | | | | | | | | 49,589 | | | | | |
| | | | | | | | | | | | | | | | | | | | |
36
Capital Statement 2018-19
| | | | | | | | | | | | | | | | | | | | |
| Child Safety, Youth and Women | |
Project | | Statistical
Area | | | Total
Estimated
Cost
$‘000 | | | Expenditure
to
30-06-18
$‘000 | | | Budget
2018-19
$‘000 | | | Post
2018-19
$‘000 | |
Capital Grants | | | | | | | | | | | | | | | | | | | | |
| | | | | |
Daniel Morcombe Foundation | | | 316 | | | | 900 | | | | 400 | | | | 500 | | | | | |
| | | | | | | | | | | | | | | | | | | | |
Total Capital Grants | | | | | | | | | | | | | | | 500 | | | | | |
| | | | | | | | | | | | | | | | | | | | |
| | | | | | | | | | | | | | | | | | | | |
| | | | | | | | | | | | | | | | | | | | |
TOTAL CHILD SAFETY, YOUTH AND WOMEN (PPE) | | | | | | | | | | | | | | | 49,589 | | | | | |
| | | | | | | | | | | | | | | | | | | | |
TOTAL CHILD SAFETY, YOUTH AND WOMEN (CG) | | | | | | | | | | | | | | | 500 | | | | | |
| | | | | | | | | | | | | | | | | | | | |
37
Capital Statement 2018-19
| 3.4 | COMMUNITIES, DISABILITY SERVICES AND SENIORS |
Department of Communities, Disability Services and Seniors
Total capital purchases for the Department of Communities, Disability Services and Seniors are $17 million in 2018-19. Total capital grants for the portfolio are $3.1 million. These funds provide for integrated community services and strengthen and protect the well-being of Queenslanders, particularly those who are vulnerable and most in need.
Program Highlights (Property, Plant and Equipment)
| • | | $12.7 million to continue the upgrade and construction program for multipurpose community and neighbourhood centres, including $1.9 million for building upgrades, rectifications and compliance works, $3 million for the construction of the Moranbah Youth and Community Centre at a total cost of $3.2 million, as part of a capital and operating funding agreement with BHP Billiton Mitsubishi Alliance, $6 million for the construction of centres at Inala and East Murgon, and $1.7 million to acquire land for new centres at Bowen and Wilsonton and for the design development of the Kallangur and Yarrabilba/Jimboomba centres and the Thursday Island Community Hub. |
| • | | $3.3 million to continue infrastructure upgrades, rectification works and construction of purpose-built accommodation as part of a targeted response for people with an intellectual or cognitive disability who exhibit extremely challenging behaviours. |
Program Highlights (Capital Grants)
| • | | $1.7 million for the Elderly Parent Carer Innovation Initiative which is aimed at assisting elderly parent carers to secure accommodation for their adult son or daughter with a disability when they can no longer care for them. This program has invested in projects to create new living arrangements that include use of accessible housing designs and assistive technologies to enable adults with disabilities to live a rich and valued life in their communities. |
| • | | $1.3 million to purchase and modify properties for people with high and complex needs providing safe and sustainable long term accommodation in Cairns and Brisbane. |
38
Capital Statement 2018-19
| | | | | | | | | | | | | | | | | | | | |
| Communities, Disability Services and Seniors | |
Project | | Statistical
Area | | | Total
Estimated
Cost
$‘000 | | | Expenditure
to
30-06-18
$‘000 | | | Budget
2018-19
$‘000 | | | Post
2018-19
$‘000 | |
DEPARTMENT OF COMMUNITIES, DISABILITY SERVICES AND SENIORS | | | | | | | | | | | | | | | | | | | | |
| | | | | |
Property, Plant and Equipment | | | | | | | | | | | | | | | | | | | | |
Community Services | | | | | | | | | | | | | | | | | | | | |
Neighbourhood and Community Centre Upgrades | | | | | | | | | | | | | | | | | | | | |
General Property Upgrades | | | Various | | | | | | | | | | | | 500 | | | | Ongoing | |
Mackay Neighbourhood Centre Upgrade | | | 312 | | | | 1,200 | | | | 1,180 | | | | 20 | | | | | |
Nambour Neighbourhood Centre Upgrade | | | 316 | | | | 750 | | | | | | | | 280 | | | | 470 | |
New Farm Neighbourhood Centre Upgrade | | | 305 | | | | 1,050 | | | | 200 | | | | 850 | | | | | |
Lockyer Neighbourhood Centre Upgrade | | | 317 | | | | 250 | | | | | | | | 250 | | | | | |
Neighbourhood and Community Centre Land Acquisition and Construction | | | | | | | | | | | | | | | | | | | | |
Moranbah Youth and Community Centre | | | 312 | | | | 3,200 | | | | 180 | | | | 3,020 | | | | | |
Inala Community Centre Replacement | | | 310 | | | | 3,500 | | | | 375 | | | | 3,125 | | | | | |
East Murgon Neighbourhood Centre Replacement | | | 319 | | | | 3,100 | | | | 220 | | | | 2,880 | | | | | |
Bowen Neighbourhood Centre | | | 312 | | | | 2,600 | | | | | | | | 640 | | | | 1,960 | |
Yarrabilba/Jimboomba Neighbourhood Centre | | | 311 | | | | 3,600 | | | | | | | | 100 | | | | 3,500 | |
Wilsonton Neighbourhood Centre | | | 307 | | | | 600 | | | | | | | | 600 | | | | | |
Kallangur Area Neighbourhood Centre | | | 314 | | | | 4,100 | | | | 600 | | | | 130 | | | | 3,370 | |
Thursday Island Community Hub | | | 315 | | | | 4,600 | | | | 535 | | | | 265 | | | | 3,800 | |
| | | | | | | | | | | | | | | | | | | | |
Sub-total Community Services | | | | | | | | | | | | | | | 12,660 | | | | | |
| | | | | | | | | | | | | | | | | | | | |
| | | | | |
Disability Services | | | | | | | | | | | | | | | | | | | | |
Bracken Ridge Redevelopment | | | 302 | | | | 2,757 | | | | 900 | | | | 1,857 | | | | | |
General Property Upgrades | | | Various | | | | | | | | | | | | 1,480 | | | | Ongoing | |
| | | | | | | | | | | | | | | | | | | | |
Sub-total Disability Services | | | | | | | | | | | | | | | 3,337 | | | | | |
| | | | | | | | | | | | | | | | | | | | |
| | | | | |
Other Property, Plant and Equipment | | | | | | | | | | | | | | | | | | | | |
Office Accommodation | | | Various | | | | | | | | | | | | 1,004 | | | | Ongoing | |
| | | | | | | | | | | | | | | | | | | | |
Sub-total Other Property, Plant and Equipment | | | | | | | | | | | | | | | 1,004 | | | | | |
| | | | | | | | | | | | | | | | | | | | |
| | | | | | | | | | | | | | | | | | | | |
| | | | | | | | | | | | | | | | | | | | |
Total Property, Plant and Equipment | | | | | | | | | | | | | | | 17,001 | | | | | |
| | | | | | | | | | | | | | | | | | | | |
39
Capital Statement 2018-19
| | | | | | | | | | | | | | | | | | | | |
| Communities, Disability Services and Seniors | |
Project | | Statistical
Area | | | Total
Estimated
Cost
$‘000 | | | Expenditure
to
30-06-18
$‘000 | | | Budget
2018-19
$‘000 | | | Post
2018-19
$‘000 | |
Capital Grants | | | | | | | | | | | | | | | | | | | | |
| | | | | |
Community Services | | | | | | | | | | | | | | | | | | | | |
Atherton Community Centre | | | 306 | | | | 250 | | | | 137 | | | | 113 | | | | | |
| | | | | | | | | | | | | | | | | | | | |
Sub-total Community Services | | | | | | | | | | | | | | | 113 | | | | | |
| | | | | | | | | | | | | | | | | | | | |
| | | | | |
Disability Services | | | | | | | | | | | | | | | | | | | | |
Elderly Parent Carer Innovation Initiative | | | | | | | | | | | | | | | | | | | | |
Brisbane West | | | 304 | | | | 751 | | | | 300 | | | | 451 | | | | | |
Brisbane East | | | 301 | | | | 843 | | | | 422 | | | | 421 | | | | | |
Darling Downs - Maranoa | | | 307 | | | | 438 | | | | 394 | | | | 44 | | | | | |
Sunshine Coast | | | 316 | | | | 1,000 | | | | 200 | | | | 800 | | | | | |
Supported Accommodation | | | | | | | | | | | | | | | | | | | | |
Cairns | | | 306 | | | | 800 | | | | 80 | | | | 720 | | | | | |
Brisbane North | | | 302 | | | | 736 | | | | 147 | | | | 589 | | | | | |
| | | | | | | | | | | | | | | | | | | | |
Sub-total Disability Services | | | | | | | | | | | | | | | 3,025 | | | | | |
| | | | | | | | | | | | | | | | | | | | |
| | | | | | | | | | | | | | | | | | | | |
| | | | | | | | | | | | | | | | | | | | |
Total Capital Grants | | | | | | | | | | | | | | | 3,138 | | | | | |
| | | | | | | | | | | | | | | | | | | | |
| | | | | | | | | | | | | | | | | | | | |
| | | | | | | | | | | | | | | | | | | | |
TOTAL COMMUNITIES, DISABILITY SERVICES AND SENIORS (PPE) | | | | | | | | | | | | | | | 17,001 | | | | | |
| | | | | | | | | | | | | | | | | | | | |
| | | | | | | | | | | | | | | | | | | | |
| | | | | | | | | | | | | | | | | | | | |
TOTAL COMMUNITIES, DISABILITY SERVICES AND SENIORS (CG) | | | | | | | | | | | | | | | 3,138 | | | | | |
| | | | | | | | | | | | | | | | | | | | |
40
Capital Statement 2018-19
Total capital purchases for the Education portfolio (including the Department of Education and related entities) are $674.3 million in 2018-19. Total capital grants for the portfolio are $98.5 million in 2018-19.
The Education portfolio was impacted by machinery-of-government changes, effective from December 2017. These include the transfer of the training and skills function to the new Department of Employment, Small Business and Training and receipt of the Office of Industrial Relations from Queensland Treasury.
Department of Education
The 2018-19 capital purchases of $668.4 million includes the capital works program of $616 million for the construction and refurbishment of school educational facilities and early childhood education and care services. Capital works planning targets government priorities through consideration of population growth and shifts, changes in educational needs and addressing high-priority needs for student and staff health and safety.
Program Highlights (Property, Plant and Equipment)
| • | | $125.2 million in capital expenditure as part of the $250 million for new classrooms and other infrastructure in state secondary schools to accommodate the six full cohorts in 2020. |
| • | | $122.5 million in capital expenditure to undertake new stages for recently opened schools and provide additional classrooms at existing schools in growth areas throughout the State. |
| • | | $94.5 million in capital expenditure as part of the $808 million Building Future Schools Fund to deliver world class learning environments for students and address enrolment growth pressures in state schools. |
| • | | $84.2 million in capital expenditure to replace and enhance facilities at existing schools. |
| • | | $47 million as part of $97 million in total funding for the Advancing Clean Energy Schools program to upgrade and install solar and energy efficiency measures in state schools. |
| • | | $15 million as part of $235 million in total funding under the Renewing Our Schools program to substantially refurbish and upgrade 17 high schools across the State. |
| • | | $8 million in capital expenditure as part of $25.6 million in total funding to deliver renewal works at 31 state schools. |
41
Capital Statement 2018-19
| • | | $4.5 million to continue refurbishment and enhancement of existing early childhood education and care facilities. |
Program Highlights (Capital Grants)
| • | | $98.5 million is provided in 2018-19 to the non-state schooling sector and student hostels. |
Queensland Curriculum and Assessment Authority
The 2018-19 capital purchases of $5.9 million includes the redevelopment of the Queensland Curriculum and Assessment Authority’s (QCAA) information and communication technology systems to support the transition process and fundamental elements of the new senior assessment system. The new, centralised web-based solution will use contemporary technologies to deliver essential business functionality for QCAA and schools that includes:
| • | | access to syllabus documents, along with supporting resources and assessment, |
| • | | support for new school-based assessment processes implemented across the state, |
| • | | management of external assessment processes (including test development, special provisions for students, and marker management and assessment administration), |
| • | | management of schools, student enrolments, subject enrolments, student results, vocational education and training registration and results, calculation of subject results and certification processes, |
| • | | school access to student performance datasets, and |
| • | | student access to curriculum, assessment and results information. |
42
Capital Statement 2018-19
| | | | | | | | | | | | | | | | | | | | |
| Education | |
Project | | Statistical
Area | | | Total
Estimated
Cost
$‘000 | | | Expenditure
to
30-06-18
$‘000 | | | Budget
2018-19
$‘000 | | | Post
2018-19
$‘000 | |
DEPARTMENT OF EDUCATION | | | | | | | | | | | | | | | | | | | | |
| | | | | |
Property, Plant and Equipment | | | | | | | | | | | | | | | | | | | | |
Capital Works Program | | | | | | | | | | | | | | | | | | | | |
Education Capital Works Program | | | | | | | | | | | | | | | | | | | | |
New Secondary School in Fortitude Valley - Stage 1 | | | 305 | | | | 73,371 | | | | 4,662 | | | | 41,931 | | | | 26,778 | |
New Secondary School in Calliope - Stage 1 | | | 308 | | | | 22,860 | | | | 360 | | | | 13,500 | | | | 9,000 | |
New Secondary School in Coomera / Pimpama | | | 309 | | | | 45,000 | | | | | | | | 9,450 | | | | 35,550 | |
New Secondary School in North Lakes / Mango Hill | | | 314 | | | | 45,000 | | | | | | | | 9,450 | | | | 35,550 | |
New Secondary School in Ripley Valley - Providence | | | 310 | | | | 45,000 | | | | | | | | 9,450 | | | | 35,550 | |
New Secondary School in Yarrabilba | | | 311 | | | | 45,000 | | | | | | | | 9,450 | | | | 35,550 | |
New Primary School in Ripley Valley - Providence | | | 310 | | | | 31,500 | | | | | | | | 5,778 | | | | 25,722 | |
New Special School in Caboolture | | | 313 | | | | 20,700 | | | | | | | | 3,600 | | | | 17,100 | |
Albany Creek State High School - Additional classrooms | | | 314 | | | | 3,788 | | | | 52 | | | | 1,121 | | | | 2,615 | |
Alexandra Hills State High School - Additional classrooms | | | 301 | | | | 3,788 | | | | 52 | | | | 1,121 | | | | 2,615 | |
Augusta State School - Additional classrooms | | | 310 | | | | 4,230 | | | | | | | | 1,080 | | | | 3,150 | |
Bardon State School - School pick-up area | | | 305 | | | | 804 | | | | | | | | 402 | | | | 402 | |
Baringa State Primary School - New school | | | 316 | | | | 29,361 | | | | 22,040 | | | | 3,817 | | | | 3,504 | |
Beenleigh Special School - Additional classrooms | | | 311 | | | | 3,600 | | | | | | | | 900 | | | | 2,700 | |
Beenleigh State High School - Additional classrooms | | | 311 | | | | 7,284 | | | | 161 | | | | 7,123 | | | | | |
Branyan Road State School - Additional classrooms | | | 319 | | | | 2,250 | | | | 450 | | | | 1,800 | | | | | |
Bray Park State High School - Multi-purpose hall | | | 314 | | | | 2,734 | | | | 1,803 | | | | 931 | | | | | |
43
Capital Statement 2018-19
| | | | | | | | | | | | | | | | | | |
| Education | |
Project | | Statistical
Area | | Total
Estimated
Cost
$‘000 | | | Expenditure
to
30-06-18
$‘000 | | | Budget
2018-19
$‘000 | | | Post
2018-19
$‘000 | |
Bremer State High School - Additional classrooms | | 310 | | | 7,373 | | | | 173 | | | | 7,200 | | | | | |
Bribie Island State High School - Additional classrooms | | 313 | | | 9,232 | | | | 52 | | | | 1,669 | | | | 7,511 | |
Brightwater State School - Additional classrooms | | 316 | | | 6,030 | | | | 270 | | | | 1,350 | | | | 4,410 | |
Brisbane State High School - Additional classrooms | | 305 | | | 2,662 | | | | 52 | | | | 2,610 | | | | | |
Broadbeach State School - Additional classrooms | | 309 | | | 7,200 | | | | 180 | | | | 1,620 | | | | 5,400 | |
Bulimba State School - Repair pool facilities | | 305 | | | 402 | | | | | | | | 402 | | | | | |
Caboolture State High School - Additional classrooms | | 313 | | | 8,872 | | | | 52 | | | | 1,604 | | | | 7,216 | |
Cairns State High School - Refurbish classrooms | | 306 | | | 1,800 | | | | | | | | 900 | | | | 900 | |
Caravonica State School - Multi-purpose hall | | 306 | | | 3,619 | | | | 3,120 | | | | 499 | | | | | |
Cavendish Road State High School - Additional classrooms | | 303 | | | 7,612 | | | | 52 | | | | 1,377 | | | | 6,183 | |
Cavendish Road State High School - Multi-purpose hall | | 303 | | | 4,992 | | | | 1,585 | | | | 3,407 | | | | | |
Centenary Heights State High School - New Performing Arts Centre and classroom refurbishments | | 317 | | | 9,224 | | | | 314 | | | | 8,910 | | | | | |
Centenary State High School - Additional classrooms | | 304 | | | 7,612 | | | | 52 | | | | 1,377 | | | | 6,183 | |
Chancellor State College - Additional classrooms (secondary) | | 316 | | | 10,872 | | | | 840 | | | | 10,032 | | | | | |
Chancellor State College - Additional classrooms (primary) | | 316 | | | 4,315 | | | | 324 | | | | 3,991 | | | | | |
Chinchilla State High School - Multi-purpose hall | | 307 | | | 3,619 | | | | 3,287 | | | | 332 | | | | | |
Cleveland District State High School - Additional classrooms | | 301 | | | 13,185 | | | | 63 | | | | 2,381 | | | | 10,741 | |
Cleveland District State High School - Multi-purpose hall | | 301 | | | 4,825 | | | | 4,520 | | | | 305 | | | | | |
44
Capital Statement 2018-19
| | | | | | | | | | | | | | | | | | |
| Education | |
Project | | Statistical
Area | | Total
Estimated
Cost
$‘000 | | | Expenditure
to
30-06-18
$‘000 | | | Budget
2018-19
$‘000 | | | Post
2018-19
$‘000 | |
Coolum State High School - Additional classrooms | | 316 | | | 5,092 | | | | 52 | | | | 1,350 | | | | 3,690 | |
Currimundi Special School - Additional classrooms | | 316 | | | 9,540 | | | | 8,061 | | | | 1,479 | | | | | |
Dalby State School - Additional classrooms and administration block | | 307 | | | 3,600 | | | | 777 | | | | 2,823 | | | | | |
Eagle Junction State School - Upgrade pool facilities | | 305 | | | 664 | | | | 73 | | | | 591 | | | | | |
Eagleby South State School - Additional classrooms | | 311 | | | 3,600 | | | | | | | | 900 | | | | 2,700 | |
Eimeo Road State School - Additional classrooms | | 312 | | | 6,435 | | | | 6,159 | | | | 276 | | | | | |
Eimeo Road State School - Air-conditioning replacement | | 312 | | | 1,313 | | | | 38 | | | | 1,275 | | | | | |
Ferny Grove State High School - Additional classrooms | | 304 | | | 12,202 | | | | 52 | | | | 1,620 | | | | 10,530 | |
Flagstone State Community College - Additional classrooms | | 311 | | | 3,558 | | | | 1,286 | | | | 2,272 | | | | | |
Forest Lake State High School - Additional classrooms | | 310 | | | 4,552 | | | | 52 | | | | 826 | | | | 3,674 | |
Glenala State High School - Additional classrooms | | 310 | | | 3,788 | | | | 52 | | | | 689 | | | | 3,047 | |
Gooburrum State School - Additional classrooms | | 319 | | | 2,700 | | | | 540 | | | | 2,160 | | | | | |
Goodna State School - Additional classrooms | | 310 | | | 4,875 | | | | 2,005 | | | | 2,870 | | | | | |
Gordonvale State High School - Indoor sports facility | | 306 | | | 3,620 | | | | 2,839 | | | | 781 | | | | | |
Griffin State School - Additional classrooms | | 314 | | | 9,450 | | | | 90 | | | | 1,710 | | | | 7,650 | |
Harristown State High School - Additional classrooms | | 317 | | | 11,960 | | | | 891 | | | | 11,069 | | | | | |
Heatley Secondary College - Air-conditioning replacement | | 318 | | | 2,850 | | | | 900 | | | | 1,950 | | | | | |
Helensvale State High School - Additional classrooms | | 309 | | | 10,055 | | | | 2,792 | | | | 7,263 | | | | | |
45
Capital Statement 2018-19
| | | | | | | | | | | | | | | | | | |
| Education | |
Project | | Statistical
Area | | Total
Estimated
Cost
$‘000 | | | Expenditure
to
30-06-18
$‘000 | | | Budget
2018-19
$‘000 | | | Post
2018-19
$‘000 | |
Highfields State Secondary College - Additional classrooms | | 317 | | | 7,937 | | | | 2,357 | | | | 5,580 | | | | | |
Home Hill State School - Air-conditioning replacement | | 318 | | | 1,013 | | | | 38 | | | | 975 | | | | | |
Indooroopilly State High School - Additional classrooms | | 304 | | | 15,262 | | | | 52 | | | | 2,754 | | | | 12,456 | |
Indooroopilly State School - Additional classrooms | | 304 | | | 7,650 | | | | 180 | | | | 1,800 | | | | 5,670 | |
Ipswich State High School - Performing arts centre | | 310 | | | 7,618 | | | | 670 | | | | 6,948 | | | | | |
James Nash State High School - Additional classrooms | | 319 | | | 4,552 | | | | 52 | | | | 826 | | | | 3,674 | |
Kawana Waters State College - Additional classrooms | | 316 | | | 3,022 | | | | 52 | | | | 891 | | | | 2,079 | |
Kedron State High School - Additional classrooms | | 305 | | | 4,552 | | | | 52 | | | | 826 | | | | 3,674 | |
Kedron State School - Additional classrooms | | 302 | | | 5,400 | | | | 333 | | | | 2,790 | | | | 2,277 | |
Kelvin Grove State College - Additional classrooms | | 305 | | | 2,662 | | | | 52 | | | | 2,610 | | | | | |
Kelvin Grove State College - Indoor sports facility | | 305 | | | 4,825 | | | | 280 | | | | 3,409 | | | | 1,136 | |
Kelvin Grove State College - Queensland Ballet facility | | 305 | | | 9,000 | | | | 360 | | | | 2,340 | | | | 6,300 | |
Kepnock State High School - Multi-purpose hall | | 319 | | | 3,619 | | | | 1,788 | | | | 1,831 | | | | | |
Kingaroy State High School - Multi-purpose hall | | 319 | | | 3,619 | | | | 3,355 | | | | 264 | | | | | |
Kirwan State High School - Multi-purpose hall | | 318 | | | 5,469 | | | | 3,811 | | | | 1,658 | | | | | |
Laidley State High School - Additional classrooms | | 310 | | | 8,782 | | | | 52 | | | | 1,588 | | | | 7,142 | |
Lowood State High School - Additional classrooms | | 310 | | | 2,258 | | | | 52 | | | | 662 | | | | 1,544 | |
MacGregor State High School - Manual arts facility | | 303 | | | 3,965 | | | | 2,759 | | | | 1,206 | | | | | |
MacGregor State School - School pick-up area | | 303 | | | 522 | | | | 64 | | | | 458 | | | | | |
46
Capital Statement 2018-19
| | | | | | | | | | | | | | | | | | |
| Education | |
Project | | Statistical
Area | | Total
Estimated
Cost
$‘000 | | | Expenditure
to
30-06-18
$‘000 | | | Budget
2018-19
$‘000 | | | Post
2018-19
$‘000 | |
Mackay Northern Beaches State High School - Performing arts centre | | 312 | | | 8,808 | | | | 1,414 | | | | 7,394 | | | | | |
Mackenzie State Special School - Additional classrooms | | 303 | | | 3,600 | | | | | | | | 900 | | | | 2,700 | |
Mango Hill State School - Additional classrooms | | 314 | | | 2,700 | | | | | | | | 2,700 | | | | | |
Mansfield State High School - Additional classrooms (Building 1) | | 303 | | | 6,500 | | | | 974 | | | | 5,526 | | | | | |
Mansfield State High School - Additional classrooms (Building 2) | | 303 | | | 8,578 | | | | 262 | | | | 1,800 | | | | 6,516 | |
Mansfield State High School - Multi-purpose hall | | 303 | | | 4,826 | | | | 3,962 | | | | 864 | | | | | |
Mansfield State School - Hall extension | | 303 | | | 708 | | | | | | | | 306 | | | | 402 | |
Mareeba State School - Additional classrooms | | 306 | | | 4,625 | | | | 3,885 | | | | 740 | | | | | |
Maroochydore State High School - Additional classrooms | | 316 | | | 3,562 | | | | 52 | | | | 1,350 | | | | 2,160 | |
Marsden State High School - Additional classrooms | | 311 | | | 2,250 | | | | | | | | 450 | | | | 1,800 | |
Meridan State College - Additional classrooms | | 316 | | | 4,012 | | | | 52 | | | | 729 | | | | 3,231 | |
Milton State School - Additional classrooms | | 305 | | | 7,239 | | | | | | | | 1,713 | | | | 5,526 | |
Mitchelton Special School - Additional classrooms | | 304 | | | 5,490 | | | | | | | | 450 | | | | 5,040 | |
Moranbah State High School - Multi-purpose hall | | 312 | | | 4,021 | | | | 80 | | | | 1,206 | | | | 2,735 | |
Mount Gravatt State High School - Additional classrooms | | 303 | | | 2,258 | | | | 52 | | | | 662 | | | | 1,544 | |
Mount Ommaney Special School - Additional classrooms | | 304 | | | 2,700 | | | | 450 | | | | 2,250 | | | | | |
Mountain Creek State High School - Additional classrooms | | 316 | | | 17,653 | | | | 733 | | | | 16,920 | | | | | |
Murrumba State Secondary College - Additional classrooms | | 314 | | | 11,700 | | | | | | | | 900 | | | | 10,800 | |
47
Capital Statement 2018-19
| | | | | | | | | | | | | | | | | | |
| Education | |
Project | | Statistical
Area | | Total
Estimated
Cost
$���000 | | | Expenditure
to
30-06-18
$‘000 | | | Budget
2018-19
$‘000 | | | Post
2018-19
$‘000 | |
Nambour Special School - Additional classrooms | | 316 | | | 5,480 | | | | 4,753 | | | | 727 | | | | | |
Nerang State High School - Upgrade classrooms and oval | | 309 | | | 402 | | | | | | | | 402 | | | | | |
North Lakes State College - Additional classrooms | | 314 | | | 11,072 | | | | 5,260 | | | | 5,812 | | | | | |
North Rockhampton State High School - Refurbish classrooms | | 308 | | | 2,010 | | | | | | | | 804 | | | | 1,206 | |
North Shore State School - New school | | 318 | | | 41,831 | | | | 27,608 | | | | 6,295 | | | | 7,928 | |
Northern Beaches State High School - Additional classrooms | | 318 | | | 6,082 | | | | 52 | | | | 1,102 | | | | 4,928 | |
Ormeau State School - Additional classrooms | | 309 | | | 4,950 | | | | | | | | 1,350 | | | | 3,600 | |
Ormeau Woods State High School - Additional classrooms | | 309 | | | 7,808 | | | | 1,284 | | | | 6,524 | | | | | |
Pacific Pines State High School - Additional classrooms | | 309 | | | 7,162 | | | | 52 | | | | 1,296 | | | | 5,814 | |
Pacific Pines State School - Upgrade resource centre | | 309 | | | 724 | | | | | | | | 402 | | | | 322 | |
Palm Beach-Currumbin State High School - Additional classrooms | | 309 | | | 8,288 | | | | 52 | | | | 1,499 | | | | 6,737 | |
Park Ridge State High School - Additional classrooms | | 311 | | | 6,019 | | | | 141 | | | | 1,102 | | | | 4,776 | |
Picnic Creek State School - New school | | 309 | | | 31,042 | | | | 24,512 | | | | 3,258 | | | | 3,272 | |
Pimlico State High School - Additional classrooms | | 318 | | | 3,022 | | | | 52 | | | | 891 | | | | 2,079 | |
Pimpama State Primary College - Additional classrooms | | 309 | | | 5,220 | | | | | | | | 1,350 | | | | 3,870 | |
Pimpama State School - Additional classrooms | | 309 | | | 4,950 | | | | 450 | | | | 4,500 | | | | | |
Pimpama State School - Multi-purpose hall | | 309 | | | 5,309 | | | | 3,354 | | | | 1,955 | | | | | |
Pimpama State Secondary College - Additional classrooms and performing arts centre | | 309 | | | 16,524 | | | | 7,372 | | | | 9,152 | | | | | |
48
Capital Statement 2018-19
| | | | | | | | | | | | | | | | | | |
| Education | |
Project | | Statistical
Area | | Total
Estimated
Cost
$‘000 | | | Expenditure
to
30-06-18
$‘000 | | | Budget
2018-19
$‘000 | | | Post
2018-19
$‘000 | |
Planning for Inner City South High School | | 305 | | | 2,700 | | | | 540 | | | | 2,160 | | | | | |
Proserpine State High School - Additional classrooms | | 312 | | | 5,813 | | | | 52 | | | | 1,121 | | | | 4,640 | |
Queensland Academy for Science, Mathematics and Technology - Additional classrooms | | 305 | | | 2,700 | | | | 450 | | | | 2,250 | | | | | |
Richlands East State School - Additional classrooms | | 310 | | | 3,285 | | | | 906 | | | | 2,379 | | | | | |
Rochedale State High School - Additional classrooms | | 303 | | | 3,519 | | | | 112 | | | | 648 | | | | 2,759 | |
Southport State High School - Additional classrooms | | 309 | | | 8,905 | | | | 131 | | | | 1,620 | | | | 7,154 | |
Springfield Central State High School - Multi-purpose hall | | 310 | | | 7,234 | | | | 3,527 | | | | 3,707 | | | | | |
Stretton State College - Additional classrooms (secondary) | | 303 | | | 7,153 | | | | 65 | | | | 1,296 | | | | 5,792 | |
Stretton State College - Additional classrooms (primary) | | 303 | | | 13,950 | | | | 90 | | | | 3,600 | | | | 10,260 | |
Sunnybank Hills State School - Additional classrooms | | 303 | | | 9,450 | | | | 90 | | | | 1,890 | | | | 7,470 | |
Sunnybank Special School - Additional classrooms | | 303 | | | 4,937 | | | | 2,661 | | | | 2,276 | | | | | |
Sunshine Beach State High School - Additional classrooms | | 316 | | | 5,318 | | | | 52 | | | | 1,580 | | | | 3,686 | |
Tamborine Mountain State High School - Additional classrooms | | 309 | | | 12,202 | | | | 52 | | | | 2,203 | | | | 9,947 | |
The Gap State High School - Additional classrooms | | 304 | | | 8,072 | | | | 916 | | | | 7,156 | | | | | |
The Willows State School - Shade structures | | 318 | | | 322 | | | | | | | | 322 | | | | | |
Toolooa State High School - Additional classrooms | | 308 | | | 3,788 | | | | 52 | | | | 1,121 | | | | 2,615 | |
Toowong State School - Hall extension | | 305 | | | 442 | | | | | | | | 442 | | | | | |
Trinity Bay State High School - Additional classrooms | | 306 | | | 6,847 | | | | 52 | | | | 1,239 | | | | 5,556 | |
49
Capital Statement 2018-19
| | | | | | | | | | | | | | | | | | |
| Education | |
Project | | Statistical
Area | | Total
Estimated
Cost
$‘000 | | | Expenditure
to
30-06-18
$‘000 | | | Budget
2018-19
$‘000 | | | Post
2018-19
$‘000 | |
Trinity Bay State High School - Multi-purpose hall | | 306 | | | 4,415 | | | | 3,332 | | | | 1,083 | | | | | |
Varsity College - Additional classrooms | | 309 | | | 1,762 | | | | 52 | | | | 1,710 | | | | | |
Wavell State High School - Performing arts centre | | 302 | | | 5,559 | | | | 4,907 | | | | 652 | | | | | |
West End State School - Additional classrooms | | 305 | | | 4,501 | | | | 203 | | | | 4,298 | | | | | |
Windaroo Valley State High School - Additional classrooms | | 311 | | | 3,788 | | | | 52 | | | | 1,121 | | | | 2,615 | |
Windsor State School - Site works | | 305 | | | 643 | | | | 52 | | | | 591 | | | | | |
Wulguru State School - Security fencing | | 318 | | | 402 | | | | | | | | 402 | | | | | |
Wynnum State High School - Additional classrooms | | 301 | | | 3,030 | | | | 105 | | | | 2,925 | | | | | |
Yarrabilba State School - New school | | 311 | | | 37,556 | | | | 24,787 | | | | 6,031 | | | | 6,738 | |
Yeppoon State High School - Additional classrooms | | 308 | | | 3,788 | | | | 52 | | | | 1,121 | | | | 2,615 | |
Long Jump Track | | Various | | | 1,287 | | | | | | | | 1,287 | | | | | |
Advancing Clean Energy Schools | | Various | | | 97,000 | | | | 2,000 | | | | 47,000 | | | | 48,000 | |
School Infrastructure | | Various | | | | | | | | | | | 24,000 | | | | Ongoing | |
Enhancement capital contribution Public Private Partnerships | | Various | | | | | | | | | | | 34,467 | | | | Ongoing | |
Renewing Our Schools | | Various | | | 235,000 | | | | | | | | 15,000 | | | | 220,000 | |
Land Acquisition | | Various | | | | | | | | | | | 31,170 | | | | Ongoing | |
School Subsidy Scheme | | Various | | | | | | | | | | | 6,300 | | | | Ongoing | |
General and Minor Works | | Various | | | | | | | | | | | 47,875 | | | | Ongoing | |
| | | | | | | | | | | | | | | | | | |
Sub-total Education Capital Works Program | | | | | | | | | | | | | 611,514 | | | | | |
| | | | | | | | | | | | | | | | | | |
| | | | | |
Early Childhood Education and Care Capital Works Program | | | | | | | | | | | | | | | | | | |
Tara Shire State College - Early Years Service | | 307 | | | 3,838 | | | | 201 | | | | 3,637 | | | | | |
Yarrabilba State School - Integrated Child Services Community Hub | | 311 | | | 3,600 | | | | 3,000 | | | | 600 | | | | | |
50
Capital Statement 2018-19
| | | | | | | | | | | | | | | | | | |
| Education | |
Project | | Statistical
Area | | Total
Estimated
Cost
$‘000 | | | Expenditure
to
30-06-18
$‘000 | | | Budget
2018-19
$‘000 | | | Post
2018-19
$‘000 | |
General and Minor Works (Early Childhood Education and Care) | | Various | | | | | | | | | | | 213 | | | | Ongoing | |
| | | | | | | | | | | | | | | | | | |
Sub-total Early Childhood Education and Care Capital Works Program | | | | | | | | | | | | | 4,450 | | | | | |
| | | | | | | | | | | | | | | | | | |
| | | | | | | | | | | | | | | | | | |
| | | | | | | | | | | | | | | | | | |
Sub-total Capital Works Program | | | | | | | | | | | | | 615,964 | | | | | |
| | | | | | | | | | | | | | | | | | |
| | | | | |
Plant and Equipment | | | | | | | | | | | | | | | | | | |
Education Plant and Equipment | | Various | | | | | | | | | | | 50,778 | | | | Ongoing | |
Office of Industrial Relations Plant and Equipment | | Various | | | | | | | | | | | 1,646 | | | | Ongoing | |
| | | | | | | | | | | | | | | | | | |
Sub-total Plant and Equipment | | | | | | | | | | | | | 52,424 | | | | | |
| | | | | | | | | | | | | | | | | | |
| | | | | | | | | | | | | | | | | | |
| | | | | | | | | | | | | | | | | | |
| | | | | |
Total Property, Plant and Equipment | | | | | | | | | | | | | 668,388 | | | | | |
| | | | | | | | | | | | | | | | | | |
| | | | | |
Capital Grants | | | | | | | | | | | | | | | | | | |
Capital Grants | | Various | | | | | | | | | | | 98,501 | | | | Ongoing | |
| | | | | | | | | | | | | | | | | | |
Total Capital Grants | | | | | | | | | | | | | 98,501 | | | | | |
| | | | | | | | | | | | | | | | | | |
| | | | | |
QUEENSLAND CURRICULUM AND ASSESSMENT AUTHORITY | | | | | | | | | | | | | | | | | | |
| | | | | |
Property, Plant and Equipment | | | | | | | | | | | | | | | | | | |
Enrolment and Assessment of Senior Learners System | | 305 | | | 3,699 | | | | 2,998 | | | | 701 | | | | | |
Contact Management System | | 305 | | | 1,832 | | | | 1,625 | | | | 207 | | | | | |
Endorsed Assessment System | | 305 | | | 1,097 | | | | 542 | | | | 444 | | | | 111 | |
Assessor, Invigilator and Marker Management System | | 305 | | | 1,104 | | | | 183 | | | | 568 | | | | 353 | |
VET Portal | | 305 | | | 1,344 | | | | 1,175 | | | | 156 | | | | 13 | |
Syllabus Online | | 305 | | | 1,505 | | | | 656 | | | | 849 | | | | | |
Confirmation Online System | | 305 | | | 1,654 | | | | 304 | | | | 675 | | | | 675 | |
External Assessment System | | 305 | | | 568 | | | | | | | | 568 | | | | | |
Online Learning - Professional Development and Accreditation | | 305 | | | 1,069 | | | | 284 | | | | 460 | | | | 325 | |
QCAA Portal | | 305 | | | 3,030 | | | | 236 | | | | 800 | | | | 1,994 | |
Other Plant and Equipment | | 305 | | | | | | | | | | | 485 | | | | Ongoing | |
| | | | | | | | | | | | | | | | | | |
Total Property, Plant and Equipment | | | | | | | | | | | | | 5,913 | | | | | |
| | | | | | | | | | | | | | | | | | |
| | | | | | | | | | | | | | | | | | |
| | | | | | | | | | | | | | | | | | |
TOTAL EDUCATION (PPE) | | | | | | | | | | | | | 674,301 | | | | | |
| | | | | | | | | | | | | | | | | | |
| | | | | | | | | | | | | | | | | | |
| | | | | | | | | | | | | | | | | | |
TOTAL EDUCATION (CG) | | | | | | | | | | | | | 98,501 | | | | | |
| | | | | | | | | | | | | | | | | | |
51
Capital Statement 2018-19
| 3.6 | ELECTORAL COMMISSION OF QUEENSLAND |
Electoral Commission of Queensland
$3.3 million of $6.3 million to replace the Commission’s Strategic Elections Management System has been allocated in 2018-19. A further $79,000 has been allocated to replace plant and equipment.
| | | | | | | | | | | | | | | | | | | | |
| Electoral Commission of Queensland | |
Project | | Statistical
Area | | | Total
Estimated
Cost
$‘000 | | | Expenditure
to
30-06-18
$‘000 | | | Budget
2018-19
$‘000 | | | Post
2018-19
$‘000 | |
ELECTORAL COMMISSION OF QUEENSLAND | | | | | | | | | | | | | | | | | | | | |
| | | | | |
Property, Plant and Equipment | | | | | | | | | | | | | | | | | | | | |
Plant and Equipment | | | 305 | | | | | | | | | | | | 79 | | | | Ongoing | |
Strategic Election Management System (SEMS) Replacement Project | | | 305 | | | | 6,306 | | | | 3,004 | | | | 3,302 | | | | | |
| | | | | | | | | | | | | | | | | | | | |
Total Property, Plant and Equipment | | | | | | | | | | | | | | | 3,381 | | | | | |
| | | | | | | | | | | | | | | | | | | | |
| | | | | | | | | | | | | | | | | | | | |
| | | | | | | | | | | | | | | | | | | | |
TOTAL ELECTORAL COMMISSION OF QUEENSLAND (PPE) | | | | | | | | | | | | | | | 3,381 | | | | | |
| | | | | | | | | | | | | | | | | | | | |
52
Capital Statement 2018-19
| 3.7 | EMPLOYMENT, SMALL BUSINESS AND TRAINING |
Total capital purchases for the Employment, Small Business and Training portfolio, including TAFE Queensland, are $57.4 million in 2018-19.
Department of Employment, Small Business and Training
The 2018-19 capital purchases for the Department of Employment, Small Business and Training of $47.5 million includes $30 million as part of the Advancing Our Training Infrastructure initiative to deliver up to $85 million across several training sites as part of the long-term plan to revitalise the State’s infrastructure portfolio. A further $17.3 million is allocated to advance needed capital works for State-owned training assets.
Program Highlights (Property, Plant and Equipment)
| • | | $30 million out of the up to $85 million over three years committed as part of the election commitment for the Advancing Our Training Infrastructure initiative to redevelop, refurbish and expand key high-need TAFE facilities. |
| • | | $17.3 million to renew and grow Queensland’s training assets to enable delivery of priority skills training that supports workforce and economic development. |
| | | | | | | | | | | | | | | | | | | | |
| Employment, Small Business and Training | |
Project | | Statistical
Area | | | Total
Estimated
Cost
$‘000 | | | Expenditure
to
30-06-18
$‘000 | | | Budget
2018-19
$‘000 | | | Post
2018-19
$‘000 | |
DEPARTMENT OF EMPLOYMENT, SMALL BUSINESS AND TRAINING | | | | | | | | | | | | | | | | | | | | |
| | | | | |
Property, Plant and Equipment | | | | | | | | | | | | | | | | | | | | |
Advancing our Training Infrastructure - Pimlico | | | 318 | | | | 26,000 | | | | | | | | 26,000 | | | | | |
Advancing our Training Infrastructure - Toowoomba | | | 317 | | | | 4,000 | | | | | | | | 4,000 | | | | | |
Training Assets - Property Management Program | | | Various | | | | | | | | | | | | 1,500 | | | | Ongoing | |
Training Assets - Emergent Replacement | | | Various | | | | | | | | | | | | 1,000 | | | | Ongoing | |
Training Assets - Asset Replacement Program | | | Various | | | | | | | | | | | | 5,500 | | | | Ongoing | |
Training Assets - Renewal and Reinvigoration | | | Various | | | | | | | | | | | | 9,250 | | | | Ongoing | |
Plant and Equipment | | | 305 | | | | 250 | | | | | | | | 250 | | | | | |
| | | | | | | | | | | | | | | | | | | | |
Total Property, Plant and Equipment | | | | | | | | | | | | | | | 47,500 | | | | | |
| | | | | | | | | | | | | | | | | | | | |
53
Capital Statement 2018-19
| | | | | | | | | | | | | | | | | | | | |
| Employment, Small Business and Training | |
Project | | Statistical
Area | | | Total
Estimated
Cost
$‘000 | | | Expenditure
to
30-06-18
$‘000 | | | Budget
2018-19
$‘000 | | | Post
2018-19
$‘000 | |
TAFE QUEENSLAND | | | | | | | | | | | | | | | | | | | | |
| | | | | |
Property, Plant and Equipment | | | | | | | | | | | | | | | | | | | | |
Plant and Equipment | | | Various | | | | | | | | | | | | 5,500 | | | | Ongoing | |
Minor Capital Projects and Acquisitions | | | Various | | | | | | | | | | | | 400 | | | | Ongoing | |
Product Development | | | Various | | | | | | | | | | | | 2,000 | | | | Ongoing | |
One Network and Wi-Fi Upgrade | | | Various | | | | | | | | | | | | 2,000 | | | | Ongoing | |
| | | | | | | | | | | | | | | | | | | | |
Total Property, Plant and Equipment | | | | | | | | | | | | | | | 9,900 | | | | | |
| | | | | | | | | | | | | | | | | | | | |
| | | | | | | | | | | | | | | | | | | | |
| | | | | | | | | | | | | | | | | | | | |
TOTAL EMPLOYMENT, SMALL BUSINESS AND TRAINING (PPE) | | | | | | | | | | | | | | | 57,400 | | | | | |
| | | | | | | | | | | | | | | | | | | | |
54
Capital Statement 2018-19
| 3.8 | ENVIRONMENT AND SCIENCE |
In 2018-19 the capital program amounts to $109.4 million for the Environment and Science portfolio including its statutory bodies and shared service provider.
Department of Environment and Science
The capital program for the Department of Environment and Science for 2018-19 is $102 million, including $95 million for capital purchases and $7 million for capital grants. The capital purchases reflect the department’s contribution to protecting and sustainably managing Queensland’s environment and natural, cultural and heritage value, as well as promoting the development of, and engagement with science, heritage and the arts. A further $4 million in contingent capital grants is planned.
Program Highlights (Property, Plant and Equipment)
| • | | $13.5 million towards the redevelopment of the Mon Repos Turtle Centre. |
| • | | $7.5 million to support ecotourism opportunities and tourism recovery in the Whitsunday Islands National Park. |
| • | | $6.7 million for priority infrastructure projects across State owned arts and cultural facilities, delivered through the Arts Infrastructure Investment Fund. |
| • | | $5.3 million towards the replacement of a major vessel to support the Great Barrier Reef Joint Field Management Program – Intergovernmental Commitment. |
| • | | $5 million to build a new performing arts venue at the Queensland Performing Arts Centre, benefitting Queensland artists and audiences. |
| • | | $4.9 million for the development of systems to enhance environmental regulatory capability and improve engagement with the community. |
| • | | $4.9 million to address critical infrastructure upgrades works at the Queensland Museum and installation of two further cooling towers within the Central Energy Plant at the Queensland Cultural Centre, South Bank. |
| • | | $4.7 million to enhance critical infrastructure to support ecotourism activities at Glasshouse Mountain National Park, Noosa National Park and D’Aguilar National Park. |
| • | | $4.2 million to renew and replace large critical infrastructure items across the Queensland Cultural Centre. |
| • | | $2.5 million for visitor access and park management facilities and equipment on North Stradbroke Island (Minjerribah), jointly managed with the Quandamooka Yoolooburrabee Aboriginal Corporation. |
55
Capital Statement 2018-19
Program Highlights (Capital Grants)
| • | | $5 million towards the construction of the Cairns Performing Arts Centre. |
| • | | $4 million as part of $10 million in total State funding to the Rockhampton Regional Council to construct the new Rockhampton Art Gallery is held centrally subject to the confirmation of a $10 million contribution from the Australian Government. |
| • | | $1 million towards the infrastructure upgrade of facilities at Woodfordia, the site of the Woodford Folk Festival. |
| • | | $600,000 provided to upgrade Queensland Museum’s South Bank storage area. |
| • | | $300,000 towards renewing and upgrading the Bille Brown Studio, home of the Queensland Theatre Company. |
| • | | $65,000 towards addressing high priority capital projects at the Queensland Maritime Museum. |
Library Board of Queensland
The Library Board of Queensland will invest $2.1 million in purchasing heritage and reference collections, intangible assets in the form of digital collections, as well as replacement of information technology equipment.
Program Highlights (Property, Plant and Equipment)
| • | | $837,000 to replace information technology equipment. |
| • | | $547,000 to acquire new items for the digital collection. |
| • | | $349,000 to acquire new items for the information collection. |
| • | | $336,000 to acquire new items for the heritage collection. |
Queensland Museum
The Queensland Museum will invest $2.3 million in permanent galleries, State Collection storage and acquisitions as well as the life cycle replacement and renewal of equipment.
Program Highlights (Property, Plant and Equipment)
| • | | $1.2 million for permanent galleries, commemorating the centenary of the ANZAC and to provide a cutting edge interactive hub for science, technology, engineering and mathematics (STEM). |
| • | | $559,000 invested in information technology primarily for the life cycle replacement of assets and upgrades across the museum network. |
56
Capital Statement 2018-19
| • | | $318,000 invested in storage facilities for the State Collection. |
| • | | $175,000 invested in life cycle capital replacements, mainly motor vehicles. |
| • | | $20,000 to acquire new items for the State Collection. |
Queensland Art Gallery
The Queensland Art Gallery will invest $2.1 million in acquiring art for the Gallery’s collection as well as life cycle replacement of other property, plant and equipment assets.
Program Highlights (Property, Plant and Equipment)
| • | | $1.8 million to acquire art for the Gallery’s collection. |
| • | | $300,000 to replace other property, plant and equipment. |
Queensland Performing Arts Trust
The Queensland Performing Arts Trust will invest $1 million in the lifecycle replacement of operational property, plant and equipment assets such as theatre equipment and food and beverage equipment.
| | | | | | | | | | | | | | | | | | | | |
| Environment and Science | |
Project | | Statistical
Area | | | Total
Estimated
Cost
$‘000 | | | Expenditure
to
30-06-18
$‘000 | | | Budget
2018-19
$‘000 | | | Post
2018-19
$‘000 | |
DEPARTMENT OF ENVIRONMENT AND SCIENCE | | | | | | | | | | | | | | | | | | | | |
| | | | | |
Property, Plant and Equipment | | | | | | | | | | | | | | | | | | | | |
Buildings and Infrastructure | | | | | | | | | | | | | | | | | | | | |
Mon Repos Turtle Centre redevelopment | | | 319 | | | | 17,360 | | | | 3,070 | | | | 13,465 | | | | 825 | |
Whitsunday Islands National Park | | | 312 | | | | 12,143 | | | | 1,113 | | | | 7,530 | | | | 3,500 | |
D’Aguilar National Park | | | 314 | | | | 3,000 | | | | 100 | | | | 1,400 | | | | 1,500 | |
Glasshouse Mountain National Park | | | 316 | | | | 3,030 | | | | 920 | | | | 1,610 | | | | 500 | |
Noosa National Park | | | 316 | | | | 2,240 | | | | 505 | | | | 1,735 | | | | | |
Management and access facilities - Parks and forests | | | Various | | | | | | | | | | | | 10,226 | | | | Ongoing | |
Recreation and visitor facilities - Parks and forests | | | Various | | | | | | | | | | | | 10,099 | | | | Ongoing | |
North Stradbroke Island (Minjerribah) | | | 301 | | | | | | | | | | | | 2,450 | | | | Ongoing | |
Great Barrier Reef moorings | | | 306 | | | | 2,375 | | | | 1,820 | | | | 555 | | | | | |
Arts Infrastructure Investment Fund | | | Various | | | | 15,500 | | | | 1,350 | | | | 6,650 | | | | 7,500 | |
57
Capital Statement 2018-19
| | | | | | | | | | | | | | | | | | | | |
| Environment and Science | |
Project | | Statistical
Area | | | Total
Estimated
Cost
$‘000 | | | Expenditure
to
30-06-18
$‘000 | | | Budget
2018-19
$‘000 | | | Post
2018-19
$‘000 | |
Queensland Cultural Centre critical infrastructure works program | | | 305 | | | | 22,856 | | | | 18,700 | | | | 4,156 | | | | | |
Queensland Cultural Centre critical infrastructure asset renewal | | | 305 | | | | 8,450 | | | | | | | | 4,928 | | | | 3,522 | |
Queensland Cultural Centre - Future energy efficiency | | | 305 | | | | 9,000 | | | | | | | | 1,800 | | | | 7,200 | |
Critical infrastructure asset renewal and equipment replacement at QPAC | | | 305 | | | | 3,300 | | | | | | | | 1,500 | | | | 1,800 | |
New Performing Arts Venue at QPAC | | | 305 | | | | 125,000 | | | | | | | | 5,000 | | | | 120,000 | |
Plant and Equipment | | | | | | | | | | | | | | | | | | | | |
General plant and equipment | | | Various | | | | | | | | | | | | 10,798 | | | | Ongoing | |
National Parks major vessel replacement—Reef Heron | | | 308 | | | | 6,009 | | | | 759 | | | | 5,250 | | | | | |
Systems Development | | | | | | | | | | | | | | | | | | | | |
Systems for Environmental Regulation | | | Various | | | | 7,878 | | | | 3,000 | | | | 4,878 | | | | | |
General systems development | | | Various | | | | | | | | | | | | 970 | | | | Ongoing | |
| | | | | | | | | | | | | | | | | | | | |
Total Property, Plant and Equipment | | | | | | | | | | | | | | | 95,000 | | | | | |
| | | | | | | | | | | | | | | | | | | | |
| | | | | |
Capital Grants | | | | | | | | | | | | | | | | | | | | |
Cairns Performing Arts Centre | | | 306 | | | | 15,000 | | | | 10,000 | | | | 5,000 | | | | | |
Upgrade of Queensland Museum’s South Bank storage area | | | 305 | | | | 2,300 | | | | 1,700 | | | | 600 | | | | | |
Woodfordia infrastructure upgrade | | | 313 | | | | 2,000 | | | | 1,000 | | | | 1,000 | | | | | |
Queensland Maritime Museum | | | 305 | | | | 308 | | | | 158 | | | | 65 | | | | 85 | |
Bille Brown Studio Upgrade | | | 305 | | | | 2,000 | | | | 1,700 | | | | 300 | | | | | |
| | | | | | | | | | | | | | | | | | | | |
Total Capital Grants | | | | | | | | | | | | | | | 6,965 | | | | | |
| | | | | | | | | | | | | | | | | | | | |
| | | | | |
LIBRARY BOARD OF QUEENSLAND | | | | | | | | | | | | | | | | | | | | |
| | | | | |
Property, Plant and Equipment | | | | | | | | | | | | | | | | | | | | |
Heritage Collection additions | | | 305 | | | | | | | | | | | | 336 | | | | Ongoing | |
Asset replacement program | | | 305 | | | | | | | | | | | | 837 | | | | Ongoing | |
Information Collection additions | | | 305 | | | | | | | | | | | | 349 | | | | Ongoing | |
Digital Collection additions | | | 305 | | | | | | | | | | | | 547 | | | | Ongoing | |
| | | | | | | | | | | | | | | | | | | | |
Total Property, Plant and Equipment | | | | | | | | | | | | | | | 2,069 | | | | | |
| | | | | | | | | | | | | | | | | | | | |
58
Capital Statement 2018-19
| | | | | | | | | | | | | | | | | | | | |
| Environment and Science | |
Project | | Statistical
Area | | | Total
Estimated
Cost
$‘000 | | | Expenditure
to
30-06-18
$‘000 | | | Budget
2018-19
$‘000 | | | Post
2018-19
$‘000 | |
QUEENSLAND MUSEUM | | | | | | | | | | | | | | | | | | | | |
| | | | | |
Property, Plant and Equipment | | | | | | | | | | | | | | | | | | | | |
Permanent galleries | | | 305 | | | | 1,200 | | | | | | | | 1,200 | | | | | |
Information Technology | | | 305 | | | | | | | | | | | | 559 | | | | Ongoing | |
Collection storage facilities | | | 305 | | | | 318 | | | | | | | | 318 | | | | | |
Life cycle capital replacement | | | 305 | | | | | | | | | | | | 175 | | | | Ongoing | |
Collection acquisition | | | 305 | | | | | | | | | | | | 20 | | | | Ongoing | |
| | | | | | | | | | | | | | | | | | | | |
Total Property, Plant and Equipment | | | | | | | | | | | | | | | 2,272 | | | | | |
| | | | | | | | | | | | | | | | | | | | |
| | | | | |
QUEENSLAND ART GALLERY | | | | | | | | | | | | | | | | | | | | |
| | | | | |
Property, Plant and Equipment | | | | | | | | | | | | | | | | | | | | |
Acquisition of art works for the Gallery | | | 305 | | | | | | | | | | | | 1,750 | | | | Ongoing | |
Ongoing replacement of plant and equipment | | | 305 | | | | | | | | | | | | 300 | | | | Ongoing | |
| | | | | | | | | | | | | | | | | | | | |
Total Property, Plant and Equipment | | | | | | | | | | | | | | | 2,050 | | | | | |
| | | | | | | | | | | | | | | | | | | | |
| | | | | |
QUEENSLAND PERFORMING ARTS TRUST | | | | | | | | | | | | | | | | | | | | |
| | | | | |
Property, Plant and Equipment | | | | | | | | | | | | | | | | | | | | |
Property, plant and equipment | | | 305 | | | | | | | | | | | | 1,000 | | | | Ongoing | |
| | | | | | | | | | | | | | | | | | | | |
Total Property, Plant and Equipment | | | | | | | | | | | | | | | 1,000 | | | | | |
| | | | | | | | | | | | | | | | | | | | |
| | | | | | | | | | | | | | | | | | | | |
| | | | | | | | | | | | | | | | | | | | |
TOTAL ENVIRONMENT AND SCIENCE (PPE) | | | | | | | | | | | | | | | 102,391 | | | | | |
| | | | | | | | | | | | | | | | | | | | |
| | | | | | | | | | | | | | | | | | | | |
| | | | | | | | | | | | | | | | | | | | |
TOTAL ENVIRONMENT AND SCIENCE (CG) | | | | | | | | | | | | | | | 6,965 | | | | | |
| | | | | | | | | | | | | | | | | | | | |
Notes:
| | The Library Board of Queensland will invest $2.1 million in purchasing heritage and reference collections, intangible assets in the form of digital collections, as well as replacement of information technology equipment |
| | The Queensland Performing Arts Trust will invest $1 million in the life cycle replacement of operational property, plant and equipment assets such as theatre equipment and food and beverage equipment. |
59
Capital Statement 2018-19
| 3.9 | HOUSING AND PUBLIC WORKS |
Total capital purchases for the Housing and Public Works portfolio, including its statutory bodies, are $459.7 million in 2018-19, with capital grants of $182.5 million. Capital purchases for the statutory bodies include $36.3 million for Stadiums Queensland and $5.2 million for the Queensland Building and Construction Commission.
Under the Queensland Housing Strategy, the department delivers a range of programs that support the supply and improvement of social housing dwellings. In particular, the Housing Construction Jobs Program will fund the construction commencement target of up to 599 social housing dwellings through 519 commencements of property, plant and equipment and 80 commencements of capital grants. This may need to be amended in recognition of the end of the National Partnership on Remote Housing funding, pending further negotiations with the Australian Government.
Department of Housing and Public Works
Program Highlights (Property, Plant and Equipment)
| • | | $270.1 million to deliver 423 social housing dwellings, commence construction of up to 519 social housing dwellings and upgrade existing social housing dwellings through the Housing Construction Jobs Program and the Queensland Housing Strategy. |
| • | | $7.2 million to continue to develop 40 dwellings for the Townsville Youth Foyer. |
| • | | $61.7 million for social housing in Aboriginal and Torres Strait Islander communities (including $24 million from the expiring National Partnership on Remote Housing) to deliver 75 social housing dwellings, upgrade existing social housing and purchase eight dwellings for use as temporary accommodation to support the transfer of social housing to home ownership on Aboriginal and Torres Strait Islander land. |
| • | | $47.5 million for the provision of government-employee housing to support the attraction and retention of government employees in locations of high need where there is no alternative accommodation in rural and remote Queensland. This includes completing the construction of 22 residences in rural and remote communities to provide new accommodation for government employees. |
| • | | $9.5 million to meet the Queensland Government’s contribution toward the $35 million refurbishment of the Thomas Dixon Centre, and to manage costs and associated works required to maintain and preserve the heritage listed centre. |
60
Capital Statement 2018-19
| • | | $4.5 million delivery of capital works program for the Gold Coast Recreation Centre. |
Program Highlights (Capital Grants)
| • | | $41.2 million to deliver 143 social housing dwellings, commence construction of up to 80 social housing dwellings through the Housing Construction Jobs Program and commence 49 dwellings and upgrades for Indigenous communities, and housing and domestic violence services. |
| • | | $62.5 million for social housing in Aboriginal and Torres Strait Islander communities (including $18.8 million funding from the expiring National Partnership on Remote Housing) to deliver a further 18 social housing dwellings, undertake infrastructure development, upgrade existing social housing and undertake upgrades to support the transfer of social housing to home ownership on Aboriginal and Torres Strait Islander land. |
| • | | $37.3 million the under Get Playing Places and Spaces and Get Playing Plus programs and other various capital grants to provide for new or upgraded sport and recreation infrastructure and participation projects to support Queensland children and healthy communities. |
| • | | $15 million under the Female Facilities Program to assist sport and recreation organisations and local governments to develop functional and inclusive female change rooms and facilities. |
| • | | $26.6 million in 2018-19 to support sport and recreation clubs at the grassroots through the delivery of infrastructure projects including the Underwood Sports Park, the University of the Sunshine Coast Stadium and the Zillmere Sports Centre. |
CITEC
CITEC has capital purchases of $3.6 million in 2018-19, comprising $2.5 million for hardware replacement and $1.1 million for critical software enhancements relating to information brokerage.
Queensland Shared Services
Queensland Shared Services has capital purchases of $5 million in 2018-19, including $4.8 million for optimisation projects and initiatives.
Queensland Building and Construction Commission
Queensland Building and Construction Commission has capital purchases of $5.2 million in 2018-19 to fit-out a new leased office, implement strategic projects to improve effectiveness and efficiency in delivering services, and replace ageing property, plant and equipment to reduce expenditure on maintenance.
61
Capital Statement 2018-19
Stadiums Queensland
Stadiums Queensland has capital purchases of $36.3 million in 2018-19 representing the investment required to maintain Queensland’s major sporting and entertainment facilities to a standard appropriate for the conduct of national and international events and community sports activity. This includes $8 million in 2018-19 towards security upgrades for safe and secure venues in Queensland.
| | | | | | | | | | | | | | | | | | |
| Housing and Public Works | |
Project | | Statistical
Area | | Total
Estimated
Cost
$‘000 | | | Expenditure
to
30-06-18
$‘000 | | | Budget
2018-19
$‘000 | | | Post
2018-19
$‘000 | |
DEPARTMENT OF HOUSING AND PUBLIC WORKS | | | | | | | | | | | | | | | | | | |
| | | | | |
Property, Plant and Equipment | | | | | | | | | | | | | | | | | | |
Housing and Homelessness Services | | | | | | | | | | | | | | | | | | |
Construction | | | | | | | | | | | | | | | | | | |
Brisbane - East | | 301 | | | | | | | | | | | 5,491 | | | | Ongoing | |
Brisbane - North | | 302 | | | | | | | | | | | 12,023 | | | | Ongoing | |
Brisbane - South | | 303 | | | | | | | | | | | 9,920 | | | | Ongoing | |
Brisbane - West | | 304 | | | | | | | | | | | 5,900 | | | | Ongoing | |
Brisbane Inner City | | 305 | | | | | | | | | | | 16,978 | | | | Ongoing | |
Cairns | | 306 | | | | | | | | | | | 25,451 | | | | Ongoing | |
Central Queensland | | 308 | | | | | | | | | | | 2,896 | | | | Ongoing | |
Gold Coast | | 309 | | | | | | | | | | | 10,172 | | | | Ongoing | |
Ipswich | | 310 | | | | | | | | | | | 17,841 | | | | Ongoing | |
Logan - Beaudesert | | 311 | | | | | | | | | | | 18,653 | | | | Ongoing | |
Moreton Bay - North | | 313 | | | | | | | | | | | 13,868 | | | | Ongoing | |
Moreton Bay - South | | 314 | | | | | | | | | | | 1,566 | | | | Ongoing | |
Queensland - Outback | | 315 | | | | | | | | | | | 5,440 | | | | Ongoing | |
Sunshine Coast | | 316 | | | | | | | | | | | 11,491 | | | | Ongoing | |
Toowoomba | | 317 | | | | | | | | | | | 1,279 | | | | Ongoing | |
Townsville | | 318 | | | | | | | | | | | 20,850 | | | | Ongoing | |
Wide Bay | | 319 | | | | | | | | | | | 1,315 | | | | Ongoing | |
| | | | | | | | | | | | | | | | | | |
Sub-total Construction | | | | | | | | | | | | | 181,134 | | | | | |
| | | | | | | | | | | | | | | | | | |
Upgrades | | | | | | | | | | | | | | | | | | |
Brisbane - East | | 301 | | | | | | | | | | | 4,429 | | | | Ongoing | |
Brisbane - North | | 302 | | | | | | | | | | | 4,560 | | | | Ongoing | |
Brisbane - South | | 303 | | | | | | | | | | | 6,734 | | | | Ongoing | |
Brisbane - West | | 304 | | | | | | | | | | | 1,704 | | | | Ongoing | |
Brisbane Inner City | | 305 | | | | | | | | | | | 4,552 | | | | Ongoing | |
62
Capital Statement 2018-19
| | | | | | | | | | | | | | | | | | | | |
| Housing and Public Works | |
Project | | Statistical
Area | | | Total
Estimated
Cost
$‘000 | | | Expenditure
to
30-06-18
$‘000 | | | Budget
2018-19
$‘000 | | | Post
2018-19
$‘000 | |
Cairns | | | 306 | | | | | | | | | | | | 25,896 | | | | Ongoing | |
Darling Downs - Maranoa | | | 307 | | | | | | | | | | | | 1,675 | | | | Ongoing | |
Central Queensland | | | 308 | | | | | | | | | | | | 7,261 | | | | Ongoing | |
Gold Coast | | | 309 | | | | | | | | | | | | 4,750 | | | | Ongoing | |
Ipswich | | | 310 | | | | | | | | | | | | 5,228 | | | | Ongoing | |
Logan - Beaudesert | | | 311 | | | | | | | | | | | | 3,894 | | | | Ongoing | |
Mackay | | | 312 | | | | | | | | | | | | 4,350 | | | | Ongoing | |
Moreton Bay - North | | | 313 | | | | | | | | | | | | 3,096 | | | | Ongoing | |
Moreton Bay - South | | | 314 | | | | | | | | | | | | 949 | | | | Ongoing | |
Queensland - Outback | | | 315 | | | | | | | | | | | | 18,131 | | | | Ongoing | |
Sunshine Coast | | | 316 | | | | | | | | | | | | 4,881 | | | | Ongoing | |
Toowoomba | | | 317 | | | | | | | | | | | | 3,245 | | | | Ongoing | |
Townsville | | | 318 | | | | | | | | | | | | 11,511 | | | | Ongoing | |
Wide Bay | | | 319 | | | | | | | | | | | | 6,921 | | | | Ongoing | |
| | | | | | | | | | | | | | | | | | | | |
Sub-total Upgrades | | | | | | | | | | | | | | | 123,767 | | | | | |
| | | | | | | | | | | | | | | | | | | | |
| | | | | |
Purchase of Existing Properties | | | | | | | | | | | | | | | | | | | | |
Queensland - Outback | | | 315 | | | | | | | | | | | | 2,500 | | | | Ongoing | |
Statewide | | | Various | | | | | | | | | | | | 2,500 | | | | Ongoing | |
| | | | | | | | | | | | | | | | | | | | |
Sub-total Purchase of Existing Properties | | | | | | | | | | | | | | | 5,000 | | | | | |
| | | | | | | | | | | | | | | | | | | | |
| | | | | |
Land | | | | | | | | | | | | | | | | | | | | |
Brisbane Inner City | | | 305 | | | | | | | | | | | | 5,711 | | | | Ongoing | |
Cairns | | | 306 | | | | | | | | | | | | 846 | | | | Ongoing | |
Central Queensland | | | 308 | | | | | | | | | | | | 1,001 | | | | Ongoing | |
Gold Coast | | | 309 | | | | | | | | | | | | 3,671 | | | | Ongoing | |
Ipswich | | | 310 | | | | | | | | | | | | 6,360 | | | | Ongoing | |
Logan - Beaudesert | | | 311 | | | | | | | | | | | | 3,831 | | | | Ongoing | |
Moreton Bay - North | | | 313 | | | | | | | | | | | | 1,606 | | | | Ongoing | |
Sunshine Coast | | | 316 | | | | | | | | | | | | 3,141 | | | | Ongoing | |
Toowoomba | | | 317 | | | | | | | | | | | | 681 | | | | Ongoing | |
Townsville | | | 318 | | | | | | | | | | | | 1,427 | | | | Ongoing | |
Wide Bay | | | 319 | | | | | | | | | | | | 382 | | | | Ongoing | |
Statewide | | | Various | | | | | | | | | | | | 500 | | | | Ongoing | |
| | | | | | | | | | | | | | | | | | | | |
Sub-total Land | | | | | | | | | | | | | | | 29,157 | | | | | |
| | | | | | | | | | | | | | | | | | | | |
Other Plant and Equipment | | | Various | | | | | | | | | | | | 4,559 | | | | Ongoing | |
| | | | | | | | | | | | | | | | | | | | |
Sub-total Housing and Homelessness Services | | | | | | | | | | | | | | | 343,617 | | | | | |
| | | | | | | | | | | | | | | | | | | | |
| | | | | |
Public Works | | | | | | | | | | | | | | | | | | | | |
Brisbane - Boggo Road Precinct Redevelopment | | | 303 | | | | 42,067 | | | | 39,191 | | | | 1,876 | | | | 1,000 | |
63
Capital Statement 2018-19
| | | | | | | | | | | | | | | | | | | | |
| Housing and Public Works | |
Project | | Statistical
Area | | | Total
Estimated
Cost
$‘000 | | | Expenditure
to
30-06-18
$‘000 | | | Budget
2018-19
$‘000 | | | Post
2018-19
$‘000 | |
Brisbane - Thomas Dixon Centre Refurbishment | | | 305 | | | | 13,500 | | | | | | | | 9,500 | | | | 4,000 | |
Building Works and Capital Replacements | | | Various | | | | | | | | | | | | 500 | | | | Ongoing | |
Government Employee Housing | | | Various | | | | | | | | | | | | 32,271 | | | | Ongoing | |
Government Employee Housing Construction - Aurukun | | | 315 | | | | 22,600 | | | | 7,355 | | | | 15,245 | | | | | |
Other Property, Plant and Equipment | | | Various | | | | | | | | | | | | 2,084 | | | | Ongoing | |
Sport and Recreation - Queensland Recreation Centres | | | Various | | | | 14,914 | | | | | | | | 4,456 | | | | 10,458 | |
| | | | | | | | | | | | | | | | | | | | |
Sub-total Public Works | | | | | | | | | | | | | | | 65,932 | | | | | |
| | | | | | | | | | | | | | | | | | | | |
| | | | | | | | | | | | | | | | | | | | |
| | | | | | | | | | | | | | | | | | | | |
Total Property, Plant and Equipment | | | | | | | | | | | | | | | 409,549 | | | | | |
| | | | | | | | | | | | | | | | | | | | |
| | | | | |
Capital Grants | | | | | | | | | | | | | | | | | | | | |
Housing and Homelessness Services | | | | | | | | | | | | | | | | | | | | |
Brisbane - North Capital Grants | | | 302 | | | | | | | | | | | | 773 | | | | Ongoing | |
Brisbane Inner City Capital Grants | | | 305 | | | | | | | | | | | | 1,737 | | | | Ongoing | |
Cairns Capital Grants | | | 306 | | | | | | | | | | | | 23,998 | | | | Ongoing | |
Central Queensland Capital Grants | | | 308 | | | | | | | | | | | | 52 | | | | Ongoing | |
Gold Coast Capital Grants | | | 309 | | | | | | | | | | | | 6,144 | | | | Ongoing | |
Ipswich Capital Grants | | | 310 | | | | | | | | | | | | 7,910 | | | | Ongoing | |
Logan - Beaudesert Capital Grants | | | 311 | | | | | | | | | | | | 5,472 | | | | Ongoing | |
Moreton Bay - North Capital Grants | | | 313 | | | | | | | | | | | | 785 | | | | Ongoing | |
Queensland - Outback Capital Grants | | | 315 | | | | | | | | | | | | 39,985 | | | | Ongoing | |
Sunshine Coast Capital Grants | | | 316 | | | | | | | | | | | | 1,650 | | | | Ongoing | |
Townsville Capital Grants | | | 318 | | | | | | | | | | | | 2,329 | | | | Ongoing | |
Wide Bay Capital Grants | | | 319 | | | | | | | | | | | | 7,205 | | | | Ongoing | |
Statewide Capital Grants | | | Various | | | | | | | | | | | | 5,584 | | | | Ongoing | |
| | | | | | | | | | | | | | | | | | | | |
Sub-total Housing and Homelessness Services | | | | | | | | | | | | | | | 103,624 | | | | | |
| | | | | | | | | | | | | | | | | | | | |
| | | | | |
Public Works (Sport and Recreation) | | | | | | | | | | | | | | | | | | | | |
Get Playing Plus | | | Various | | | | 60,580 | | | | 40,304 | | | | 17,276 | | | | 3,000 | |
Get Playing Places and Spaces round 4-7 | | | Various | | | | 53,850 | | | | 29,245 | | | | 16,400 | | | | 8,205 | |
Female Facilities Program | | | Various | | | | 15,000 | | | | | | | | 15,000 | | | | | |
Grant Funding Boost | | | Various | | | | 10,432 | | | | | | | | 7,982 | | | | 2,450 | |
Zillmere Sports Centre | | | 302 | | | | 5,500 | | | | | | | | 2,500 | | | | 3,000 | |
64
Capital Statement 2018-19
| | | | | | | | | | | | | | | | | | |
| Housing and Public Works | |
Project | | Statistical
Area | | Total
Estimated
Cost
$‘000 | | | Expenditure
to
30-06-18
$‘000 | | | Budget
2018-19
$‘000 | | | Post
2018-19
$‘000 | |
Underwood Sports Park | | 311 | | | 9,110 | | | | | | | | 9,110 | | | | | |
University of the Sunshine Coast Stadium | | 316 | | | 7,000 | | | | | | | | 7,000 | | | | | |
Various capital grants | | Various | | | 7,352 | | | | 726 | | | | 3,626 | | | | 3,000 | |
| | | | | | | | | | | | | | | | | | |
Sub-total Public Works (Sport and Recreation) | | | | | | | | | | | | | 78,894 | | | | | |
| | | | | | | | | | | | | | | | | | |
| | | | | | | | | | | | | | | | | | |
| | | | | | | | | | | | | | | | | | |
Total Capital Grants | | | | | | | | | | | | | 182,518 | | | | | |
| | | | | | | | | | | | | | | | | | |
| | | | | |
CITEC | | | | | | | | | | | | | | | | | | |
| | | | | |
Property, Plant and Equipment | | | | | | | | | | | | | | | | | | |
Hardware Replacement - ICT | | 305 | | | | | | | | | | | 2,500 | | | | Ongoing | |
Software Enhancements - Information Brokerage | | 305 | | | | | | | | | | | 1,100 | | | | Ongoing | |
| | | | | | | | | | | | | | | | | | |
Total Property, Plant and Equipment | | | | | | | | | | | | | 3,600 | | | | | |
| | | | | | | | | | | | | | | | | | |
| | | | | |
QUEENSLAND SHARED SERVICES | | | | | | | | | | | | | | | | | | |
| | | | | |
Property, Plant and Equipment | | | | | | | | | | | | | | | | | | |
Optimisation projects and initiatives | | 305 | | | | | | | | | | | 4,784 | | | | Ongoing | |
Asset Replacement | | 305 | | | | | | | | | | | 200 | | | | Ongoing | |
| | | | | | | | | | | | | | | | | | |
Total Property, Plant and Equipment | | | | | | | | | | | | | 4,984 | | | | | |
| | | | | | | | | | | | | | | | | | |
| | | | | |
QUEENSLAND BUILDING AND CONSTRUCTION COMMISSION | | | | | | | | | | | | | | | | | | |
| | | | | |
Property, Plant and Equipment | | | | | | | | | | | | | | | | | | |
Leasehold Restoration | | 303 | | | 2,000 | | | | | | | | 2,000 | | | | | |
Software Development | | 303 | | | 1,777 | | | | | | | | 1,777 | | | | | |
Other Property, Plant and Equipment | | Various | | | 1,435 | | | | | | | | 1,435 | | | | | |
| | | | | | | | | | | | | | | | | | |
Total Property, Plant and Equipment | | | | | | | | | | | | | 5,212 | | | | | |
| | | | | | | | | | | | | | | | | | |
65
Capital Statement 2018-19
| | | | | | | | | | | | | | | | | | |
| Housing and Public Works | |
Project | | Statistical
Area | | Total
Estimated
Cost
$‘000 | | | Expenditure
to
30-06-18
$‘000 | | | Budget
2018-19
$‘000 | | | Post
2018-19
$‘000 | |
STADIUMS QUEENSLAND | | | | | | | | | | | | | | | | | | |
| | | | | |
Property, Plant and Equipment | | | | | | | | | | | | | | | | | | |
Annual capital and maintenance program | | Various | | | | | | | | | | | 12,726 | | | | Ongoing | |
Queensland State Netball Centre | | 303 | | | 44,000 | | | | 28,409 | | | | 15,591 | | | | | |
Safe, secure sporting and entertainment facilities | | Various | | | 8,300 | | | | 300 | | | | 8,000 | | | | | |
| | | | | | | | | | | | | | | | | | |
Total Property, Plant and Equipment | | | | | | | | | | | | | 36,317 | | | | | |
| | | | | | | | | | | | | | | | | | |
| | | | | | | | | | | | | | | | | | |
| | | | | | | | | | | | | | | | | | |
TOTAL HOUSING AND PUBLIC WORKS (PPE) | | | | | | | | | | | | | 459,662 | | | | | |
| | | | | | | | | | | | | | | | | | |
| | | | | | | | | | | | | | | | | | |
| | | | | | | | | | | | | | | | | | |
TOTAL HOUSING AND PUBLIC WORKS (CG) | | | | | | | | | | | | | 182,518 | | | | | |
| | | | | | | | | | | | | | | | | | |
66
Capital Statement 2018-19
| 3.10 | INNOVATION, TOURISM INDUSTRY DEVELOPMENT AND THE COMMONWEALTH GAMES |
Department of Innovation, Tourism Industry Development and the Commonwealth Games
Total capital outlays for the Innovation, Tourism Industry Development and the Commonwealth Games portfolio are $34.7 million in 2018-19.
Program Highlights (Property, Plant and Equipment)
The property, plant and equipment in the Department of Innovation, Tourism Industry Development and the Commonwealth Games in 2018-19 is $196,000, including:
| • | | $172,000 to upgrade the Carrara Stadium. |
Program Highlights (Capital Grants)
The capital grants in the Department of Innovation, Tourism Industry Development and the Commonwealth Games in 2018-19 are $34.5 million, including:
| • | | $12.4 million to the Regional Tourism Infrastructure and Experience Development Program to assist communities to grow tourism by developing new and improved tourism experiences which includes the facilitation of outback tourism infrastructure projects. |
| • | | $10 million for the Great Barrier Reef Island Rejuvenation Package to help industry rejuvenate Great Barrier Reef Island resorts and offer world-class experiences to visitors. |
| • | | $5.8 million for the Great Keppel Island Recovery Package to deliver major tourism infrastructure improvements such as power and water connections to the mainland. |
| • | | $3.1 million to finalise works on Gold Coast 2018 Commonwealth Games venues to enable ongoing public and community use of the facilities for post-games events. Venues include the Gold Coast Hockey Centre, Belmont Shooting Centre, Carrara Sports and Leisure Centre and the Carrara Indoor Stadium. |
| • | | $2.2 million to help refurbish and extend the premises and exhibits at the Australian Workers Heritage Centre and Wanpa-rda Matilda Outback Education Centre at Barcaldine. |
| • | | $524,000 to Mount Inkerman Nature Tourism Development for roadworks, car parking and other infrastructure upgrades. |
| • | | $413,000 to the Mackay Tourism Visitor Information Centre to deliver a new Visitor Information Centre at Sarina, repositioned on the highway. |
67
Capital Statement 2018-19
| | | | | | | | | | | | | | | | | | |
| Innovation, Tourism Industry Development and the Commonwealth Games | |
Project | | Statistical
Area | | Total
Estimated
Cost
$‘000 | | | Expenditure
to
30-06-18
$‘000 | | | Budget
2018-19
$‘000 | | | Post
2018-19
$‘000 | |
DEPARTMENT OF INNOVATION, TOURISM INDUSTRY DEVELOPMENT AND THE COMMONWEALTH GAMES | | | | | | | | | | | | | | | | | | |
| | | | | |
Property, Plant and Equipment | | | | | | | | | | | | | | | | | | |
Carrara Stadium | | 309 | | | 5,509 | | | | 5,337 | | | | 172 | | | | | |
Other Plant Property and Equipment - Office Equipment | | 305 | | | 24 | | | | | | | | 24 | | | | | |
| | | | | | | | | | | | | | | | | | |
Total Property, Plant and Equipment | | | | | | | | | | | | | 196 | | | | | |
| | | | | | | | | | | | | | | | | | |
| | | | | |
Capital Grants | | | | | | | | | | | | | | | | | | |
Great Barrier Reef Island Rejuvenation Package | | Various | | | 16,500 | | | | | | | | 10,000 | | | | 6,500 | |
Great Keppel Island Recovery Package | | 308 | | | 23,350 | | | | | | | | 5,770 | | | | 17,580 | |
Regional Tourism Infrastructure and Experience Development Program | | 315 | | | 39,600 | | | | | | | | 12,400 | | | | 27,200 | |
Australian Workers Heritage Centre and Wanpa-rda Matilda Outback Education Centre | | 315 | | | 2,200 | | | | | | | | 2,200 | | | | | |
Mount Inkerman Nature Tourism Development | | 318 | | | 541 | | | | 17 | | | | 524 | | | | | |
Mackay Tourism Visitor Information Centre | | 312 | | | 1,300 | | | | 887 | | | | 413 | | | | | |
Other Capital Grants | | 305 | | | 29 | | | | | | | | 29 | | | | | |
Gold Coast Hockey Centre | | 309 | | | 16,572 | | | | 15,272 | | | | 1,300 | | | | | |
Belmont Shooting Centre | | 301 | | | 17,845 | | | | 17,585 | | | | 260 | | | | | |
Carrara Sports and Leisure Centre | | 309 | | | 103,304 | | | | 103,084 | | | | 220 | | | | | |
Carrara Indoor Stadium | | 309 | | | 8,108 | | | | 7,958 | | | | 150 | | | | | |
Gold Coast Aquatic Centre | | 309 | | | 41,391 | | | | 41,250 | | | | 141 | | | | | |
Nerang Mountain Biking Trails | | 309 | | | 2,741 | | | | 2,641 | | | | 100 | | | | | |
Coomera Sport and Leisure Centre | | 309 | | | 39,421 | | | | 39,411 | | | | 10 | | | | | |
Other Games Projects | | 309 | | | 1,229 | | | | 262 | | | | 967 | | | | | |
| | | | | | | | | | | | | | | | | | |
Total Capital Grants | | | | | | | | | | | | | 34,484 | | | | | |
| | | | | | | | | | | | | | | | | | |
| | | | | | | | | | | | | | | | | | |
| | | | | | | | | | | | | | | | | | |
TOTAL INNOVATION, TOURISM INDUSTRY DEVELOPMENT AND THE COMMONWEALTH GAMES (PPE) | | | | | | | | | | | | | 196 | | | | | |
| | | | | | | | | | | | | | | | | | |
| | | | | | | | | | | | | | | | | | |
| | | | | | | | | | | | | | | | | | |
TOTAL INNOVATION, TOURISM INDUSTRY DEVELOPMENT AND THE COMMONWEALTH GAMES (CG) | | | | | | | | | | | | | 34,484 | | | | | |
| | | | | | | | | | | | | | | | | | |
68
Capital Statement 2018-19
| 3.11 | JUSTICE AND ATTORNEY-GENERAL |
The 2018-19 capital acquisitions for Justice and Attorney-General (including the Department of Justice and Attorney-General, Public Trustee of Queensland, Legal Aid Queensland and the Crime and Corruption Commission) are $75.7 million.
Department of Justice and Attorney-General
The Department of Justice and Attorney-General capital acquisitions for 2018-19 of $44.5 million will primarily focus on the upgrade of courthouses, the expansion and upgrade of the existing audio visual capacity in the justice system, the implementation of an online Blue Card application system and a program of minor works in courthouses.
Program Highlights (Property, Plant and Equipment)
| • | | $6.5 million of $12 million to upgrade the Rockhampton courthouse. |
| • | | $3.7 million of $11 million to upgrade the Beenleigh courthouse. |
| • | | $3.7 million of $9 million to upgrade the Townsville courthouse. |
| • | | $8.4 million to expand and upgrade existing audio visual capacity in the justice system, which includes video conferencing and in-custody court appearances. |
| • | | $9.4 million to continue the ongoing program of minor works in courthouses. |
| • | | $8.3 million of $9.8 million to implement an online Blue Card application system. |
Public Trustee of Queensland
For 2018-19 the capital budget is $21.7 million. This capital expenditure will enable the Public Trustee to continue to provide a wide range of efficient services to the Queensland community, as well as continuing to maintain appropriate workplace health and safety standards for clients and staff. In addition it will support the delivery of the digital business transformation program of works.
Program Highlights (Property, Plant and Equipment)
| • | | $6.7 million to improve buildings and refurbish existing offices throughout the State. |
| • | | $1.6 million to fit out offices and invest in information and communication technology network infrastructure. |
| • | | The Public Trustee will also invest $13.3 million in digitisation projects and the business transformation program of works. |
69
Capital Statement 2018-19
Legal Aid Queensland
Legal Aid Queensland’s 2018-19 capital expenditure program is $3.1 million. Legal Aid Queensland will invest $2.8 million on major property, plant and equipment projects, including to refurbish the Mount Isa and Brisbane offices.
A further $325,000 will be invested to replace some of Legal Aid Queensland’s motor vehicles and minor property, plant and equipment.
Crime and Corruption Commission
The Crime and Corruption Commission will spend $6.4 million on its capital purchases in 2018-19.
Program Highlights (Property, Plant and Equipment)
| • | | $2.6 million to replace computer and other information technology equipment. |
| • | | $1.7 million to continue to develop a new Integrated Case Management System. |
| • | | $1.3 million to enhance the processing of digital evidence and to provide a contemporary information security platform. |
| • | | $770,000 to replace vehicles. |
| | | | | | | | | | | | | | | | | | |
| Justice and Attorney-General | |
Project | | Statistical
Area | | Total
Estimated
Cost
$‘000 | | | Expenditure
to
30-06-18
$‘000 | | | Budget
2018-19
$‘000 | | | Post
2018-19
$‘000 | |
DEPARTMENT OF JUSTICE AND ATTORNEY-GENERAL | | | | | | | | | | | | | | | | | | |
| | | | | |
Property, Plant and Equipment | | | | | | | | | | | | | | | | | | |
Justice Services | | | | | | | | | | | | | | | | | | |
Rockhampton Courthouse Upgrade | | 308 | | | 12,000 | | | | 464 | | | | 6,536 | | | | 5,000 | |
Beenleigh Courthouse Upgrade | | 311 | | | 11,000 | | | | 300 | | | | 3,700 | | | | 7,000 | |
Townsville Courthouse Upgrade | | 318 | | | 9,000 | | | | 350 | | | | 3,650 | | | | 5,000 | |
Other acquisitions of property, plant and equipment | | Various | | | | | | | | | | | 8,458 | | | | Ongoing | |
Courthouses, Minor Capital Works | | Various | | | | | | | | | | | 9,446 | | | | Ongoing | |
Queensland Courts Information Systems | | 305 | | | | | | | | | | | 925 | | | | Ongoing | |
| | | | | | | | | | | | | | | | | | |
Sub-total Justice Services | | | | | | | | | | | | | 32,715 | | | | | |
| | | | | | | | | | | | | | | | | | |
Other Departmental | | | | | | | | | | | | | | | | | | |
Implementation of online Blue Card application system | | 305 | | | 9,790 | | | | | | | | 8,320 | | | | 1,470 | |
70
Capital Statement 2018-19
| | | | | | | | | | | | | | | | | | |
| Justice and Attorney-General | |
Project | | Statistical
Area | | Total
Estimated
Cost
$‘000 | | | Expenditure
to
30-06-18
$‘000 | | | Budget
2018-19
$‘000 | | | Post
2018-19
$‘000 | |
Minor Capital Works - Software | | 305 | | | | | | | | | | | 2,065 | | | | Ongoing | |
Leashold Improvements | | Various | | | | | | | | | | | 531 | | | | Ongoing | |
Other acquisitions of property, plant and equipment | | Various | | | | | | | | | | | 881 | | | | Ongoing | |
| | | | | | | | | | | | | | | | | | |
Sub-total Other Departmental | | | | | | | | | | | | | 11,797 | | | | | |
| | | | | | | | | | | | | | | | | | |
| | | | | | | | | | | | | | | | | | |
| | | | | | | | | | | | | | | | | | |
Total Property, Plant and Equipment | | | | | | | | | | | | | 44,512 | | | | | |
| | | | | | | | | | | | | | | | | | |
| | | | | |
PUBLIC TRUSTEE OF QUEENSLAND | | | | | | | | | | | | | | | | | | |
| | | | | |
Property, Plant and Equipment | | | | | | | | | | | | | | | | | | |
Business Transformation Program of Works | | 305 | | | | | | | | | | | 13,333 | | | | Ongoing | |
Building Improvements - Head Office | | 305 | | | | | | | | | | | 4,651 | | | | Ongoing | |
Building Improvements - Regional Offices | | Various | | | | | | | | | | | 2,066 | | | | Ongoing | |
Plant and Equipment Upgrades | | Various | | | | | | | | | | | 1,611 | | | | Ongoing | |
| | | | | | | | | | | | | | | | | | |
Total Property, Plant and Equipment | | | | | | | | | | | | | 21,661 | | | | | |
| | | | | | | | | | | | | | | | | | |
| | | | | |
LEGAL AID QUEENSLAND | | | | | | | | | | | | | | | | | | |
| | | | | |
Property, Plant and Equipment | | | | | | | | | | | | | | | | | | |
Brisbane Head Office Refurbishment | | 305 | | | 1,711 | | | | 100 | | | | 1,611 | | | | | |
Brisbane Leasehold Improvement | | 305 | | | 895 | | | | | | | | 895 | | | | | |
Mount Isa Office Refurbishment | | 315 | | | 285 | | | | | | | | 285 | | | | | |
Minor Works - Regional and Brisbane | | Various | | | 100 | | | | | | | | 100 | | | | | |
Motor Vehicle Replacements | | 305 | | | 445 | | | | 220 | | | | 225 | | | | | |
| | | | | | | | | | | | | | | | | | |
Total Property, Plant and Equipment | | | | | | | | | | | | | 3,116 | | | | | |
| | | | | | | | | | | | | | | | | | |
| | | | | |
CRIME AND CORRUPTION COMMISSION | | | | | | | | | | | | | | | | | | |
| | | | | |
Property, Plant and Equipment | | | | | | | | | | | | | | | | | | |
Computer and Other Equipment | | 305 | | | 2,633 | | | | | | | | 2,633 | | | | | |
Computer Software (Program Unify) | | 305 | | | 1,691 | | | | | | | | 1,691 | | | | | |
Digital Investigative Services | | 305 | | | 1,295 | | | | | | | | 1,295 | | | | | |
Vehicle Replacement | | 305 | | | 770 | | | | | | | | 770 | | | | | |
Leasehold Improvements | | 305 | | | 50 | | | | | | | | 50 | | | | | |
| | | | | | | | | | | | | | | | | | |
Total Property, Plant and Equipment | | | | | | | | | | | | | 6,439 | | | | | |
| | | | | | | | | | | | | | | | | | |
| | | | | | | | | | | | | | | | | | |
| | | | | | | | | | | | | | | | | | |
TOTAL JUSTICE AND ATTORNEY-GENERAL (PPE) | | | | | | | | | | | | | 75,728 | | | | | |
| | | | | | | | | | | | | | | | | | |
71
Capital Statement 2018-19
| 3.12 | LEGISLATIVE ASSEMBLY OF QUEENSLAND |
Legislative Assembly of Queensland
The total planned 2018-19 capital expenditure for the Legislative Assembly of Queensland is $9.2 million. Significant capital expenditure in the parliamentary precinct includes the completion of the Parliament House fire protection system and the upgrade of Parliament House data cabling infrastructure. Other capital expenditure includes the completion of the parliamentary precinct CCTV security upgrade and the ongoing replacement of corporate information technology infrastructure and other plant and equipment. In 2018-19, a number of existing Members’ electorate offices will also be relocated to address changes arising from the 2017 Electoral Boundary Redistribution and other compliance and risk issues.
| | | | | | | | | | | | | | | | | | |
| Legislative Assembly of Queensland | |
Project | | Statistical
Area | | Total
Estimated
Cost
$‘000 | | | Expenditure
to
30-06-18
$‘000 | | | Budget
2018-19
$‘000 | | | Post
2018-19
$‘000 | |
LEGISLATIVE ASSEMBLY OF QUEENSLAND | | | | | | | | | | | | | | | | | | |
| | | | | |
Property, Plant and Equipment | | | | | | | | | | | | | | | | | | |
Parliament House fire protection system | | 305 | | | 9,615 | | | | 5,621 | | | | 3,994 | | | | | |
Parliament House data cabling | | 305 | | | 300 | | | | | | | | 300 | | | | | |
CCTV security upgrade | | 305 | | | 1,465 | | | | 1,200 | | | | 265 | | | | | |
Information technology network infrastructure | | 305 | | | | | | | | | | | 500 | | | | Ongoing | |
Other property, plant and equipment | | 305 | | | | | | | | | | | 1,355 | | | | Ongoing | |
Electorate office accommodation program | | Various | | | | | | | | | | | 2,800 | | | | Ongoing | |
| | | | | | | | | | | | | | | | | | |
Total Property, Plant and Equipment | | | | | | | | | | | | | 9,214 | | | | | |
| | | | | | | | | | | | | | | | | | |
| | | | | | | | | | | | | | | | | | |
| | | | | | | | | | | | | | | | | | |
TOTAL LEGISLATIVE ASSEMBLY OF QUEENSLAND (PPE) | | | | | | | | | | | | | 9,214 | | | | | |
| | | | | | | | | | | | | | | | | | |
72
Capital Statement 2018-19
| 3.13 | LOCAL GOVERNMENT, RACING AND MULTICULTURAL AFFAIRS |
Department of Local Government, Racing and Multicultural Affairs
In 2018-19, the Department of Local Government, Racing and Multicultural Affairs has capital purchases of $3.3 million and capital grants of $316.7 million.
Program Highlights (Property, Plant and Equipment)
| • | | $1 million to safeguard the security of the Northern Peninsula Area Water Supply System through the replacement of existing asbestos cement pipelines. |
| • | | $1.3 million to develop a new grants management system to improve and simplify the administration of grants to local governments. |
| • | | $965,000 for Indigenous infrastructure projects which aim to improve environmental health conditions for people living in major communities in Indigenous council areas. |
Program Highlights (Capital Grants)
| • | | $147.8 million for the Works for Queensland program to support local governments in regional Queensland undertake job-creating maintenance and minor infrastructure works. |
| • | | $50 million for the Indigenous Councils Critical Infrastructure Program for water, wastewater and solid waste infrastructure in Indigenous communities and to develop options for a long-term infrastructure program in Indigenous communities including the role of Indigenous councils. |
| • | | $41.7 million for the Local Government Grants and Subsidies Program which provides funding for priority infrastructure projects to meet identified community needs and to support projects that will enhance sustainable and liveable communities. |
| • | | $51.4 million under the Racing Infrastructure Fund to assist the Queensland racing industry improve racing infrastructure across the State. |
| • | | $10.5 million for the Whitsunday Coast Airport Terminal Expansion Project to remediate the existing runway surface and to upgrade the terminal to meet domestic demand. |
| • | | $4.5 million to upgrade the Torres Shire Council’s drinking-water-treatment infrastructure including water filtration and other related infrastructure on Thursday Island and Horn Island. |
73
Capital Statement 2018-19
| | | | | | | | | | | | | | | | | | | | |
| Local Government, Racing and Multicultural Affairs | |
Project | | Statistical
Area | | | Total
Estimated
Cost
$‘000 | | | Expenditure
to
30-06-18
$‘000 | | | Budget
2018-19
$‘000 | | | Post
2018-19
$‘000 | |
DEPARTMENT OF LOCAL GOVERNMENT, RACING AND MULTICULTURAL AFFAIRS | | | | | | | | | | | | | | | | | | | | |
| | | | | |
Property, Plant and Equipment | | | | | | | | | | | | | | | | | | | | |
Northern Peninsula Area Water Supply System - Replacement of Asbestos Cement Pipelines | | | 315 | | | | 5,000 | | | | | | | | 1,000 | | | | 4,000 | |
Implementing More Effective Funding Grants to Local Government | | | Various | | | | 1,300 | | | | | | | | 1,300 | | | | | |
Other Indigenous Infrastructure | | | 315 | | | | 1,068 | | | | 103 | | | | 965 | | | | | |
Other Property, Plant and Equipment | | | Various | | | | | | | | | | | | 25 | | | | Ongoing | |
| | | | | | | | | | | | | | | | | | | | |
Total Property, Plant and Equipment | | | | | | | | | | | | | | | 3,290 | | | | | |
| | | | | | | | | | | | | | | | | | | | |
| | | | | |
Capital Grants | | | | | | | | | | | | | | | | | | | | |
Works for Queensland | | | Various | | | | 600,000 | | | | 302,189 | | | | 147,811 | | | | 150,000 | |
Indigenous Councils Critical Infrastructure Program | | | Various | | | | 120,000 | | | | 40,000 | | | | 50,000 | | | | 30,000 | |
Local Government Grants and Subsidies Program | | | Various | | | | | | | | | | | | 41,676 | | | | Ongoing | |
Whitsunday Coast Airport Terminal Expansion Project | | | 312 | | | | 15,000 | | | | 4,500 | | | | 10,500 | | | | | |
Torres Shire Council Water Treatment Infrastructure Upgrade | | | 315 | | | | 12,000 | | | | | | | | 4,500 | | | | 7,500 | |
National Insurance Affordability Initiative - Australian Government | | | 307 | | | | 17,000 | | | | 12,020 | | | | 4,980 | | | | | |
Major Infrastructure Program - Stage 6 | | | 315 | | | | 15,000 | | | | 7,500 | | | | 3,750 | | | | 3,750 | |
Kowanyama Aboriginal Shire Council Economic Growth and Jobs Initiative | | | 315 | | | | 1,100 | | | | | | | | 1,100 | | | | | |
Kuranda Skyrail and Infrastructure Levy | | | 306 | | | | | | | | | | | | 744 | | | | Ongoing | |
Racing Infrastructure Fund | | | Various | | | | 120,217 | | | | 18,744 | | | | 51,431 | | | | 50,042 | |
Other Capital Grants | | | 308 | | | | 400 | | | | 200 | | | | 200 | | | | | |
| | | | | | | | | | | | | | | | | | | | |
Total Capital Grants | | | | | | | | | | | | | | | 316,692 | | | | | |
| | | | | | | | | | | | | | | | | | | | |
| | | | | | | | | | | | | | | | | | | | |
| | | | | | | | | | | | | | | | | | | | |
TOTAL LOCAL GOVERNMENT, RACING AND MULTICULTURAL AFFAIRS (PPE) | | | | | | | | | | | | | | | 3,290 | | | | | |
| | | | | | | | | | | | | | | | | | | | |
| | | | | | | | | | | | | | | | | | | | |
| | | | | | | | | | | | | | | | | | | | |
TOTAL LOCAL GOVERNMENT, RACING AND MULTICULTURAL AFFAIRS (CG) | | | | | | | | | | | | | | | 316,692 | | | | | |
| | | | | | | | | | | | | | | | | | | | |
74
Capital Statement 2018-19
| 3.14 | NATURAL RESOURCES, MINES AND ENERGY |
The Natural Resources, Mines and Energy portfolio includes the Department of Natural Resources, Mines and Energy, statutory bodies reporting to the Minister for Natural Resources, Mines and Energy, and energy and water supply government-owned corporations. The portfolio’s capital program for 2018-19 is $2.474 billion.
Department of Natural Resources, Mines and Energy
Total capital purchases for the Department of Natural Resources, Mines and Energy are estimated to be $91 million in 2018-19. Total capital grants for the department are estimated to be $50 million in 2018-19.
Program Highlights (Property, Plant and Equipment)
| • | | $66 million to construct the Rookwood Weir to provide drought contingency supplies. |
| • | | $5 million to meet dam safety requirements at the Glen Niven Dam. |
Program Highlights (Capital Grants)
| • | | Up to $50 million to support the development of concentrated solar thermal with storage projects to provide clean and baseload power. |
CS Energy Limited
Total capital expenditure planned for 2018-19 is $225.5 million. This reflects CS Energy’s continued commitment to ongoing reliability and efficiency of generation plant at its power station sites.
Program Highlights (Property, Plant and Equipment)
| • | | $104.6 million to improve the Callide Power Station, including $87.9 million for overhaul work. |
| • | | $8.6 million to develop and refurbish the Kogan Creek Mine. |
| • | | $90.5 million to improve the Kogan Creek Power Station, including $52.2 million for overhaul work. |
| • | | $4.8 million to improve the Wivenhoe Power Station, including $2.4 million for overhaul work. |
| • | | $17 million to improve business systems at Brisbane head office. |
75
Capital Statement 2018-19
Stanwell Corporation Limited
Stanwell Corporation’s planned capital purchases for 2018-19 are $208.6 million, which primarily relates to replacement, refurbishment and upgrades to plant and equipment at the various Queensland power station sites.
Program Highlights (Property, Plant and Equipment)
| • | | $69.8 million to overhaul Tarong Power Station, including $39.9 million for the major overhaul, $12.1 million to overhaul the high and intermediate pressure turbines and $17.8 million for various small projects. |
| • | | $54 million to overhaul the Stanwell Power Station, including $19.7 million for the major overhaul, $17.9 million to upgrade the control system, $5.2 million for the unit cooling water mid life condenser re-tube and $11.2 million for various small projects. |
| • | | $31.9 million to overhaul Meandu Mine, including $7 million for the dragline overhauls, $3.5 million for Coal Handling Preparation Plant replacements and upgrades, $3.8 million for the mine development area, $2.3 million for ash storage project and $15.3 million for various small projects |
| • | | $23 million to overhaul Swanbank, including $20.3 million for the Swanbank Power Station major overhaul and $2.7 million for various small projects. |
| • | | $21.2 million to upgrade information technology, including $15.3 million for hardware and software upgrades and $5.9 million for upgrades and replacements of major ICT systems. |
| • | | $5 million to develop future gas supply to Swanbank Power Station. |
Energy Queensland
Energy Queensland Limited’s planned capital expenditure for 2018-19 of $1.461 billion forms part of its commitment to providing a safe, secure and highly reliable electricity supply to all Queensland customers that is both cost effective and dependable, by continuing a focus on efficiencies, asset management, and network capability.
The capital program aims to improve and reinforce electricity supplies across Queensland to meet customer needs, especially to cover peak electricity demand periods, and to support the increased use of residential solar power, storage batteries, electric vehicles, and air-conditioners.
Program Highlights (Property, Plant and Equipment)
| • | | $29 million to continue work on the multi-stage SunCoast Power Project to increase network capacity and improve reliability on the Sunshine Coast. |
76
Capital Statement 2018-19
| • | | $15.9 million to upgrade the Mackay Tennyson Street Substation to improve network performance. |
| • | | $2.2 million to continue to redevelop the Bundall Substation to increase network capacity and improve reliability. |
| • | | $2.6 million to upgrade the Labrador Substation to improve network performance. |
| • | | $2.6 million to upgrade the Clayfield Substation to improve network performance. |
| • | | $1.5 million to upgrade the Palm Beach Substation to improve network performance. |
| • | | $1.1 million to upgrade the Caboolture West Substation to improve network performance. |
| • | | $345,000 to upgrade the Amamoor Substation to improve network performance. |
Powerlink Queensland
Powerlink Queensland is the high voltage electricity transmission entity for Queensland. Powerlink’s planned capital expenditure for 2018-19 is $232.7 million and is predominantly focused on refit or replacement of aged equipment and assets to ensure continued reliable supply of electricity.
Program Highlights (Property, Plant and Equipment)
| • | | $8.7 million to refit the Collinsville-Proserpine transmission line in North Queensland. |
| • | | $7 million to replace assets at the Gin Gin Substation, near Bundaberg. |
| • | | $4.2 million to install a new transformer at Calvale and reconfigure the 132kV network to ensure continued reliability of supply to the Fitzroy area. |
| • | | $3.6 million to replace primary plant and secondary systems at the Mackay Substation. |
| • | | $3.6 million to replace secondary systems at the Rocklea Substation in Brisbane. |
| • | | $2.4 million to replace secondary systems at the Calvale and Callide B substations in the Fitzroy area. |
| • | | $2.6 million to replace secondary systems at the Nebo Substation near Mackay. |
SunWater Limited
SunWater’s planned capital purchases for 2018-19 total $25.6 million. This will focus on the continuation of a reliable bulk water supply for regional Queensland and ensuring SunWater’s dams are enhanced to meet the extreme weather events that the State can experience.
77
Capital Statement 2018-19
Program Highlights (Property, Plant and Equipment)
| • | | $9.1 million to repair, maintain, renew and enhance existing water infrastructure assets and water supply schemes across regional Queensland, as part of SunWater’s annual program of works. |
| • | | $1.2 million to improve Beardmore Dam, with planned construction to extend the existing channel structure a further 40 metres downstream to safeguard against future extreme weather events. |
| • | | $345,000 to finalise and establish the Emergency Management Response Plan associated with the continued improvement of SunWater’s dedicated flood control room, including specific computer and communications systems fit out and associated software. |
| • | | $3.6 million to pursue business development opportunities such as hydro-electric power, solar energy and raising of Burdekin Falls Dam to increase capacity. |
| • | | $6.2 million to establish and fit out a new office location in Brisbane. |
| • | | $640,000 to develop software and hardware involving the renewal and replacement of computer equipment and security enhancements to SunWater’s business and data networks. |
| • | | $4.5 million for plant and equipment, including capital expenditure associated with vehicles, trailers, pumps, and valves, required for SunWater’s operations, and minor works. |
Gladstone Area Water Board
The Gladstone Area Water Board (GAWB) has planned capital of $22.8 million for 2018-19. The capital program is focused on continuing effective and safe operations of GAWB’s property, plant and equipment.
Program Highlights (Property, Plant and Equipment)
| • | | $3.6 million to maintain the offline standby storage and repump station, provide 14 days of raw water supply independent of critical infrastructure at Awoonga Dam, mitigate risk and facilitate planned maintenance of critical infrastructure. |
| • | | $829,000 to replace flowmeters and purchase new mobile emergency generators to provide backup power supply for critical infrastructure in relation to the mobile emergency electrical generation units project. |
| • | | $547,000 to maintain East End Reservoir, including works designed to replace the roof, both internal and external ladders, carry out repairs to the construction joints and undertake patch repairs to the concrete walls and anchor blocks of the reservoir. |
78
Capital Statement 2018-19
| • | | $750,000 to provide a condition assessment of South Trees Pipe and to install cathodic protection on South Trees Bridge to protect against corrosion of the bridge supports that carry critical pipelines. |
Mount Isa Water Board
Total planned capital expenditure for the Mount Isa Water Board (MIWB) for 2018-19 is $9 million. The capital program is focused on the continuing cost-effective, reliable, and safe operation of MIWB’s plant, property and equipment.
Program Highlights (Property, Plant and Equipment)
| • | | $2 million for the Mount Isa Terminal Reservoir storage tanks project, which will see completion of the construction of new portable storage tanks to replace the aged South Tank, eliminating water losses, improving water supply reliability and addressing water quality assurance requirements. |
| • | | $1 million to commence procurement of pipe material for the renewal of selected sections of Moondarra to Mount Isa Terminal Reservoir pipeline, particularly those aged and high-risk segments downstream of Lake Moondarra Booster Station. |
| • | | $1.7 million to continue renewal of the high-voltage yards and electro-mechanical equipment in the Lake Julius power system, particularly the commencement of restoration and improvement works on the existing Hilton take-off yard. |
Seqwater
Planned capital purchases for Seqwater in 2018-19 are $147.2 million. The capital program is focused on the continuation of a safe, secure and reliable water supply for South East Queensland, as well as providing essential flood mitigation services and managing catchment health.
Seqwater has facilities located throughout South East Queensland. These require minor works and renewals, as well as upgrades and compliance driven works to ensure effective operation.
Program Highlights (Property, Plant and Equipment)
| • | | $1 million to continue planning works for the Lake MacDonald Dam safety upgrade to comply with dam safety regulations. |
| • | | $10 million for the Sideling Creek Dam safety upgrade to comply with dam safety regulations. |
| • | | $1.5 million to continue to refurbish and upgrade 20 filters at the Mount Crosby East Bank Water Treatment Plant to maintain and improve capacity and reliability. |
79
Capital Statement 2018-19
| • | | $1.7 million to refurbish the Somerset Hydro Electrical Plant to allow the plant to resume operations and provide renewable energy. |
| • | | $13 million to upgrade and improve the Leslie Harrison Dam to comply with dam safety regulations. |
| • | | $3 million to continue the planning for the proposed pipeline connection for Beaudesert to the water grid to secure long-term water supply. |
| | | | | | | | | | | | | | | | | | | | |
| Natural Resources, Mines and Energy | |
Project | | Statistical
Area | | | Total
Estimated
Cost
$‘000 | | | Expenditure
to
30-06-18
$‘000 | | | Budget
2018-19
$‘000 | | | Post
2018-19
$‘000 | |
DEPARTMENT OF NATURAL RESOURCES, MINES AND ENERGY | | | | | | | | | | | | | | | | | | | | |
| | | | | |
Property, Plant and Equipment | | | | | | | | | | | | | | | | | | | | |
Rookwood Weir | | | 308 | | | | 352,000 | | | | | | | | 66,000 | | | | 286,000 | |
Glen Niven Dam | | | 307 | | | | 5,000 | | | | | | | | 5,000 | | | | | |
Strategic Resources Exploration Program | | | Various | | | | 7,125 | | | | 1,995 | | | | 2,422 | | | | 2,708 | |
Coal Mine Workers’ Health Scheme | | | Various | | | | 4,018 | | | | 916 | | | | 2,630 | | | | 472 | |
Financial Assurance Framework Reform Program | | | 305 | | | | 3,975 | | | | 1,384 | | | | 2,591 | | | | | |
Stock Route network | | | Various | | | | | | | | | | | | 800 | | | | Ongoing | |
Systems development | | | 305 | | | | | | | | | | | | 3,075 | | | | Ongoing | |
Other property, plant and equipment | | | Various | | | | | | | | | | | | 7,166 | | | | Ongoing | |
Water Monitoring network | | | Various | | | | | | | | | | | | 1,312 | | | | Ongoing | |
| | | | | | | | | | | | | | | | | | | | |
Total Property, Plant and Equipment | | | | | | | | | | | | | | | 90,996 | | | | | |
| | | | | | | | | | | | | | | | | | | | |
| | | | | |
Capital Grants | | | | | | | | | | | | | | | | | | | | |
Solar Thermal Plant contribution | | | Various | | | | 50,000 | | | | | | | | 50,000 | | | | | |
| | | | | | | | | | | | | | | | | | | | |
Total Capital Grants | | | | | | | | | | | | | | | 50,000 | | | | | |
| | | | | | | | | | | | | | | | | | | | |
| | | | | |
CS ENERGY LIMITED | | | | | | | | | | | | | | | | | | | | |
| | | | | |
Property, Plant and Equipment | | | | | | | | | | | | | | | | | | | | |
Callide Power Station enhancements, overhauls and refurbishment | | | 308 | | | | 104,596 | | | | | | | | 104,596 | | | | | |
Kogan Creek Power Station enhancements, overhauls and refurbishment | | | 307 | | | | 90,515 | | | | | | | | 90,515 | | | | | |
Kogan Creek Mine developments and refurbishment | | | 307 | | | | 8,614 | | | | | | | | 8,614 | | | | | |
80
Capital Statement 2018-19
| | | | | | | | | | | | | | | | | | |
| Natural Resources, Mines and Energy | |
Project | | Statistical
Area | | Total
Estimated
Cost
$‘000 | | | Expenditure
to
30-06-18
$‘000 | | | Budget
2018-19
$‘000 | | | Post
2018-19
$‘000 | |
Wivenhoe Power Station enhancements, overhauls and refurbishment | | 310 | | | 4,752 | | | | | | | | 4,752 | | | | | |
Upgrade of corporate information systems to support the business | | 305 | | | 17,001 | | | | | | | | 17,001 | | | | | |
| | | | | | | | | | | | | | | | | | |
Total Property, Plant and Equipment | | | | | | | | | | | | | 225,478 | | | | | |
| | | | | | | | | | | | | | | | | | |
| | | | | |
STANWELL CORPORATION LIMITED | | | | | | | | | | | | | | | | | | |
| | | | | |
Property, Plant and Equipment | | | | | | | | | | | | | | | | | | |
Swanbank Power Station | | | | | | | | | | | | | | | | | | |
Swanbank Power Station Gas Supply Strategy | | 307 | | | | | | | | | | | 5,000 | | | | Ongoing | |
Swanbank Power Station - Overhauls | | 310 | | | | | | | | | | | 20,250 | | | | Ongoing | |
Swanbank Power Station - Minor works | | 310 | | | | | | | | | | | 2,708 | | | | Ongoing | |
Barron Gorge Power Station - Minor works | | 306 | | | | | | | | | | | 293 | | | | Ongoing | |
Kareeya Power Station - Minor works | | 306 | | | | | | | | | | | 1,682 | | | | Ongoing | |
Koombooloomba Power Station - Minor works | | 306 | | | | | | | | | | | 1,499 | | | | Ongoing | |
Mica Creek Power Station | | | | | | | | | | | | | | | | | | |
Mica Creek Power Station - Minor works | | 315 | | | | | | | | | | | 257 | | | | Ongoing | |
Meandu Mine | | | | | | | | | | | | | | | | | | |
Meandu Mine - Coal handling preparation plant replacements and upgrades | | 319 | | | | | | | | | | | 3,450 | | | | Ongoing | |
Meandu Mine - Development Program | | 319 | | | | | | | | | | | 3,809 | | | | Ongoing | |
Dragline overhaul at Meandu Mine | | 319 | | | | | | | | | | | 7,000 | | | | Ongoing | |
Meandu Mine - Asset refurbishments | | 319 | | | | | | | | | | | 17,595 | | | | Ongoing | |
Stanwell Power Station | | | | | | | | | | | | | | | | | | |
Stanwell Power Station - Other sustaining projects | | 308 | | | | | | | | | | | 11,249 | | | | Ongoing | |
Stanwell Power Station - Control system upgrade | | 308 | | | | | | | | | | | 17,930 | | | | Ongoing | |
Stanwell Power Station - Mid life condenser retube | | 308 | | | | | | | | | | | 5,173 | | | | Ongoing | |
81
Capital Statement 2018-19
| | | | | | | | | | | | | | | | | | | | |
| Natural Resources, Mines and Energy | |
Project | | Statistical
Area | | | Total
Estimated
Cost
$‘000 | | | Expenditure
to
30-06-18
$‘000 | | | Budget
2018-19
$‘000 | | | Post
2018-19
$‘000 | |
Stanwell Power Station - Overhauls | | | 308 | | | | | | | | | | | | 19,668 | | | | Ongoing | |
Tarong Power Station | | | | | | | | | | | | | | | | | | | | |
Tarong Power Station - High and intermediate pressure turbine overhauls | | | 319 | | | | | | | | | | | | 12,070 | | | | Ongoing | |
Tarong Power Station - Other sustaining projects | | | 319 | | | | | | | | | | | | 17,810 | | | | Ongoing | |
Tarong Power Station - Overhauls | | | 319 | | | | | | | | | | | | 39,943 | | | | Ongoing | |
Other Capital Projects | | | | | | | | | | | | | | | | | | | | |
Hardware and software upgrades | | | Various | | | | | | | | | | | | 15,300 | | | | Ongoing | |
Enterprise program of works | | | Various | | | | | | | | | | | | 5,866 | | | | Ongoing | |
| | | | | | | | | | | | | | | | | | | | |
Total Property, Plant and Equipment | | | | | | | | | | | | | | | 208,552 | | | | | |
| | | | | | | | | | | | | | | | | | | | |
| | | | | |
ENERGY QUEENSLAND | | | | | | | | | | | | | | | | | | | | |
| | | | | |
Property, Plant and Equipment | | | | | | | | | | | | | | | | | | | | |
Standard Control Services | | | | | | | | | | | | | | | | | | | | |
Augmentation | | | | | | | | | | | | | | | | | | | | |
Dysart Substation upgrade | | | 312 | | | | 12,839 | | | | 1,172 | | | | 4,512 | | | | 7,155 | |
Moranbah Substation upgrade | | | 312 | | | | 6,764 | | | | 6,547 | | | | 217 | | | | | |
Network initiated capacity augmentation - Brisbane | | | Various | | | | 44,856 | | | | | | | | 44,856 | | | | | |
Network initiated capacity augmentation - Gold Coast | | | 309 | | | | 20,157 | | | | | | | | 20,157 | | | | | |
Network initiated capacity augmentation - Ipswich | | | 310 | | | | 15,700 | | | | | | | | 15,700 | | | | | |
Network initiated capacity augmentation - Sunshine Coast | | | 316 | | | | 23,379 | | | | | | | | 23,379 | | | | | |
Other regulated customer initiated capital work - augmentation | | | Various | | | | 77,433 | | | | | | | | 77,433 | | | | | |
Real Time Capacity Architecture | | | Various | | | | 2,172 | | | | 1,884 | | | | 288 | | | | | |
Safety Net Implementation | | | Various | | | | 7,324 | | | | 6,604 | | | | 720 | | | | | |
SunCoast Power Project | | | 316 | | | | 89,339 | | | | 33,975 | | | | 29,023 | | | | 26,341 | |
Yarranlea Substation upgrade | | | 307 | | | | 8,138 | | | | 2,314 | | | | 888 | | | | 4,936 | |
| | | | | | | | | | | | | | | | | | | | |
Sub-total Augmentation | | | | | | | | | | | | | | | 217,173 | | | | | |
| | | | | | | | | | | | | | | | | | | | |
82
Capital Statement 2018-19
| | | | | | | | | | | | | | | | | | | | |
| Natural Resources, Mines and Energy | |
Project | | Statistical
Area | | | Total
Estimated
Cost
$‘000 | | | Expenditure
to
30-06-18
$‘000 | | | Budget
2018-19
$‘000 | | | Post
2018-19
$‘000 | |
Replacements | | | | | | | | | | | | | | | | | | | | |
Amamoor Substation upgrade | | | 319 | | | | 2,877 | | | | 2,532 | | | | 345 | | | | | |
Barcaldine Substation upgrade | | | 315 | | | | 3,410 | | | | 1,170 | | | | 2,237 | | | | 3 | |
Bromelton Substation upgrade | | | 311 | | | | 2,670 | | | | 2,385 | | | | 285 | | | | | |
Bundall Substation upgrade | | | 309 | | | | 9,838 | | | | 7,598 | | | | 2,240 | | | | | |
Caboolture West - Replace transformers and relays | | | 313 | | | | 13,687 | | | | 12,571 | | | | 1,116 | | | | | |
Charters Towers Substation upgrade | | | 318 | | | | 3,930 | | | | 1,368 | | | | 1,894 | | | | 668 | |
Chermside Substation upgrade | | | 302 | | | | 5,594 | | | | 68 | | | | 611 | | | | 4,915 | |
Circuit Breaker Replacement Program | | | Various | | | | 3,635 | | | | 2,150 | | | | 1,484 | | | | 1 | |
Clayfield Substation upgrade | | | 305 | | | | 8,006 | | | | 811 | | | | 2,583 | | | | 4,612 | |
Conductor Clearance Program | | | Various | | | | 46,020 | | | | | | | | 46,020 | | | | | |
Conductor Clearance to Structure | | | Various | | | | 18,237 | | | | 8,118 | | | | 10,119 | | | | | |
Emerald Cornet Substation upgrade | | | 308 | | | | 3,477 | | | | 448 | | | | 2,010 | | | | 1,019 | |
Glenore Grove Substation upgrade | | | 310 | | | | 5,805 | | | | 71 | | | | 286 | | | | 5,448 | |
Grantham Substation upgrade | | | 317 | | | | 2,456 | | | | 2,157 | | | | 299 | | | | | |
Hemmant Substation upgrade | | | 301 | | | | 8,957 | | | | 5,046 | | | | 3,787 | | | | 124 | |
Hendra - Clayfield underground feeder | | | 305 | | | | 11,742 | | | | 125 | | | | 76 | | | | 11,541 | |
Hendra - Nundah underground feeder | | | 302 | | | | 8,398 | | | | 96 | | | | 133 | | | | 8,169 | |
Hendra Substation upgrade | | | 305 | | | | 2,046 | | | | 67 | | | | 262 | | | | 1,717 | |
Herring Lagoon Substation upgrade | | | 301 | | | | 3,165 | | | | 1,033 | | | | 2,094 | | | | 38 | |
Howard Substation upgrade | | | 319 | | | | 8,194 | | | | 246 | | | | 1,788 | | | | 6,160 | |
Inala Substation upgrade | | | 310 | | | | 3,990 | | | | 1,308 | | | | 2,460 | | | | 222 | |
Kenmore Substation upgrade | | | 304 | | | | 3,073 | | | | 454 | | | | 2,412 | | | | 207 | |
Kilcoy Substation upgrade | | | 313 | | | | 10,795 | | | | 140 | | | | 467 | | | | 10,188 | |
Labrador Substation upgrade | | | 309 | | | | 16,879 | | | | 13,994 | | | | 2,576 | | | | 309 | |
Lawnton Substation upgrade | | | 314 | | | | 3,995 | | | | 3,578 | | | | 417 | | | | | |
Lota Substation upgrade | | | 301 | | | | 3,913 | | | | 2,412 | | | | 1,315 | | | | 186 | |
Low Voltage Small Copper replacement (Stage 2 and 3) | | | Various | | | | 98,484 | | | | 24,172 | | | | 21,456 | | | | 52,856 | |
83
Capital Statement 2018-19
| | | | | | | | | | | | | | | | | | |
| Natural Resources, Mines and Energy | |
Project | | Statistical
Area | | Total
Estimated
Cost
$‘000 | | | Expenditure
to
30-06-18
$‘000 | | | Budget
2018-19
$‘000 | | | Post
2018-19
$‘000 | |
Mackay Tennyson Street Substation upgrade | | 312 | | | 21,655 | | | | 4,805 | | | | 15,904 | | | | 946 | |
Meeandah - Whinstanes underground feeder | | 302 | | | 8,692 | | | | 48 | | | | 187 | | | | 8,457 | |
Miami Substation upgrade | | 309 | | | 3,459 | | | | 2,641 | | | | 818 | | | | | |
Network initiated replacement works - Brisbane | | Various | | | 100,276 | | | | | | | | 100,276 | | | | | |
Network initiated replacement works - Gold Coast | | 309 | | | 31,045 | | | | | | | | 31,045 | | | | | |
Network initiated replacement works - Ipswich | | 310 | | | 24,141 | | | | | | | | 24,141 | | | | | |
Network initiated replacement works - Sunshine Coast | | 316 | | | 32,072 | | | | | | | | 32,072 | | | | | |
Network initiated replacement works - Wide Bay | | 319 | | | 3,253 | | | | | | | | 3,253 | | | | | |
Other regulated customer initiated capital work - replacements | | Various | | | 200,842 | | | | | | | | 200,842 | | | | | |
Palm Beach Substation upgrade | | 309 | | | 15,333 | | | | 13,835 | | | | 1,487 | | | | 11 | |
Protection replacement | | Various | | | 10,229 | | | | 4,291 | | | | 3,100 | | | | 2,838 | |
Queensport-Bulimba underground feeder | | 305 | | | 5,513 | | | | 4,922 | | | | 586 | | | | 5 | |
Redcliffe Substation upgrade | | 313 | | | 7,871 | | | | 234 | | | | 512 | | | | 7,125 | |
Richlands Substation upgrade | | 310 | | | 4,386 | | | | 57 | | | | 400 | | | | 3,929 | |
South Pine to Hays Inlet - Replace overhead earth wire with optical fibre | | 314 | | | 4,863 | | | | 2,356 | | | | 2,507 | | | | | |
Surfers Paradise Substation upgrade | | 309 | | | 8,461 | | | | 55 | | | | 634 | | | | 7,772 | |
Toolara Forest Substation upgrade | | 319 | | | 5,415 | | | | 2,058 | | | | 2,007 | | | | 1,350 | |
Toowong Substation upgrade | | 305 | | | 3,757 | | | | 1,244 | | | | 1,935 | | | | 578 | |
Zillmere Substation upgrade | | 302 | | | 3,211 | | | | 3,128 | | | | 83 | | | | | |
| | | | | | | | | | | | | | | | | | |
Sub-total Replacements | | | | | | | | | | | | | 532,561 | | | | | |
| | | | | | | | | | | | | | | | | | |
| | | | | |
Connections | | | | | | | | | | | | | | | | | | |
Connections - Brisbane | | Various | | | 51,693 | | | | | | | | 51,693 | | | | | |
Connections - Gold Coast | | 309 | | | 8,993 | | | | | | | | 8,993 | | | | | |
Connections - Ipswich | | 310 | | | 6,257 | | | | | | | | 6,257 | | | | | |
Connections - Sunshine Coast | | 316 | | | 7,155 | | | | | | | | 7,155 | | | | | |
84
Capital Statement 2018-19
| | | | | | | | | | | | | | | | | | | | |
| Natural Resources, Mines and Energy | |
Project | | Statistical
Area | | | Total
Estimated
Cost
$‘000 | | | Expenditure
to
30-06-18
$‘000 | | | Budget
2018-19
$‘000 | | | Post
2018-19
$‘000 | |
Other regulated customer initiated capital work (standard control services) | | | Various | | | | 86,799 | | | | | | | | 86,799 | | | | | |
| | | | | | | | | | | | | | | | | | | | |
Sub-total Connections | | | | | | | | | | | | | | | 160,897 | | | | | |
| | | | | | | | | | | | | | | | | | | | |
| | | | | | | | | | | | | | | | | | | | |
| | | | | | | | | | | | | | | | | | | | |
Sub-total Standard Control Services | | | | | | | | | | | | | | | 910,631 | | | | | |
| | | | | | | | | | | | | | | | | | | | |
| | | | | |
Non-System Capital Expenditure | | | | | | | | | | | | | | | | | | | | |
Cairns - Bunda Street | | | 306 | | | | 5,402 | | | | | | | | 5,402 | | | | | |
Cairns Depot development | | | 306 | | | | 3,271 | | | | 1,358 | | | | 1,913 | | | | | |
Information and communication technologies | | | 305 | | | | 20,280 | | | | 3,200 | | | | 3,000 | | | | 14,080 | |
Information and communication technologies | | | Various | | | | 42,129 | | | | 8,815 | | | | 2,795 | | | | 30,519 | |
Property - Minor Program for 2018-19 | | | Various | | | | 58,059 | | | | | | | | 58,059 | | | | | |
Property and buildings | | | Various | | | | 27,983 | | | | | | | | 27,983 | | | | | |
Proserpine redevelopment | | | 312 | | | | 3,641 | | | | | | | | 3,641 | | | | | |
Searle Street Maryborough redevelopment | | | 319 | | | | 3,144 | | | | 148 | | | | 2,996 | | | | | |
Tools and equipment | | | 305 | | | | 1,935 | | | | | | | | 1,935 | | | | | |
Tools and equipment | | | Various | | | | 6,065 | | | | | | | | 6,065 | | | | | |
Vehicles - Energex | | | 305 | | | | 28,800 | | | | | | | | 28,800 | | | | | |
Vehicles - Ergon Energy | | | Various | | | | 30,200 | | | | | | | | 30,200 | | | | | |
| | | | | | | | | | | | | | | | | | | | |
Sub-total Non-System Capital Expenditure | | | | | | | | | | | | | | | 172,789 | | | | | |
| | | | | | | | | | | | | | | | | | | | |
| | | | | |
Alternative Control Services | | | | | | | | | | | | | | | | | | | | |
Customer initiated works - Gold Coast | | | 309 | | | | 7,177 | | | | | | | | 7,177 | | | | | |
Customer initiated works - Wide Bay/Burnett | | | 319 | | | | 572 | | | | | | | | 572 | | | | | |
Customer initiated works - Brisbane | | | Various | | | | 74,736 | | | | | | | | 74,736 | | | | | |
Customer initiated works - Ipswich | | | 310 | | | | 6,068 | | | | | | | | 6,068 | | | | | |
Customer initiated works - Sunshine Coast | | | 316 | | | | 1,412 | | | | | | | | 1,412 | | | | | |
Other regulated customer initiated capital work (alternative control services) | | | Various | | | | 58,651 | | | | | | | | 58,651 | | | | | |
| | | | | | | | | | | | | | | | | | | | |
Sub-total Alternative Control Services | | | | | | | | | | | | | | | 148,616 | | | | | |
| | | | | | | | | | | | | | | | | | | | |
85
Capital Statement 2018-19
| | | | | | | | | | | | | | | | | | | | |
| Natural Resources, Mines and Energy | |
Project | | Statistical
Area | | | Total
Estimated
Cost
$‘000 | | | Expenditure
to
30-06-18
$‘000 | | | Budget
2018-19
$‘000 | | | Post
2018-19
$‘000 | |
Non-Regulated Capital Expenditure | | | | | | | | | | | | | | | | | | | | |
Aurukun generator replacement | | | 315 | | | | 12 | | | | 10 | | | | 2 | | | | | |
Embedded Generators - Energex | | | 305 | | | | 455 | | | | | | | | 455 | | | | | |
Energy meters in isolated communities | | | 315 | | | | 7,305 | | | | 7,125 | | | | 180 | | | | | |
Environment Related Projects - Torres Strait | | | 315 | | | | 2,125 | | | | 1,708 | | | | 417 | | | | | |
Isolated Systems augmentation and upgrades | | | Various | | | | 13,302 | | | | | | | | 1,170 | | | | 12,132 | |
Multiple Site Line reconductor program | | | 315 | | | | 1,064 | | | | | | | | 316 | | | | 748 | |
Other isolated capital work | | | Various | | | | 19,072 | | | | 202 | | | | 18,870 | | | | | |
Unregulated metering and metering dynamics | | | 305 | | | | 46,084 | | | | | | | | 46,084 | | | | | |
Infrastructure services | | | Various | | | | 30,393 | | | | | | | | 30,393 | | | | | |
| | | | | | | | | | | | | | | | | | | | |
Sub-total Non-Regulated Capital Expenditure | | | | | | | | | | | | | | | 97,887 | | | | | |
| | | | | | | | | | | | | | | | | | | | |
| | | | | |
ICT Capital Expenditure | | | | | | | | | | | | | | | | | | | | |
Digital Office Capital Expenditure - Energex | | | 305 | | | | 63,280 | | | | | | | | 63,280 | | | | | |
Digital Office Capital Expenditure - Ergon Energy | | | Various | | | | 55,441 | | | | | | | | 55,441 | | | | | |
Ergon Energy Retail capital expenditure | | | 305 | | | | 12,500 | | | | | | | | 12,500 | | | | | |
| | | | | | | | | | | | | | | | | | | | |
Sub-total ICT Capital Expenditure | | | | | | | | | | | | | | | 131,221 | | | | | |
| | | | | | | | | | | | | | | | | | | | |
| | | | | | | | | | | | | | | | | | | | |
| | | | | | | | | | | | | | | | | | | | |
Total Property, Plant and Equipment | | | | | | | | | | | | | | | 1,461,144 | | | | | |
| | | | | | | | | | | | | | | | | | | | |
| | | | | |
POWERLINK QUEENSLAND | | | | | | | | | | | | | | | | | | | | |
| | | | | |
Property, Plant and Equipment | | | | | | | | | | | | | | | | | | | | |
Callide A / Calvale 132 kilovolt network reinvestment | | | 308 | | | | 22,500 | | | | 11,212 | | | | 4,200 | | | | 7,088 | |
Collinsville to Proserpine transmission line refit | | | 312 | | | | 34,300 | | | | 14,687 | | | | 8,700 | | | | 10,913 | |
Mackay Substation replacement | | | 312 | | | | 24,500 | | | | 16,670 | | | | 3,600 | | | | 4,230 | |
Rocklea Substation secondary systems replacement | | | 303 | | | | 21,100 | | | | 14,046 | | | | 3,600 | | | | 3,454 | |
Stanwell Substation secondary systems replacement | | | 308 | | | | 19,300 | | | | 17,844 | | | | 1,200 | | | | 256 | |
Nebo Substation primary plant replacement | | | 312 | | | | 22,500 | | | | 14,369 | | | | 1,000 | | | | 7,131 | |
86
Capital Statement 2018-19
| | | | | | | | | | | | | | | | | | |
| Natural Resources, Mines and Energy | |
Project | | Statistical
Area | | Total
Estimated
Cost
$‘000 | | | Expenditure
to
30-06-18
$‘000 | | | Budget
2018-19
$‘000 | | | Post
2018-19
$‘000 | |
Calvale and Callide B Substation secondary systems replacement | | 308 | | | 21,800 | | | | 8,869 | | | | 2,400 | | | | 10,531 | |
Nebo secondary systems replacement | | 312 | | | 21,000 | | | | 7,056 | | | | 2,600 | | | | 11,344 | |
Gin Gin Substation rebuild | | 319 | | | 22,800 | | | | 5,209 | | | | 7,000 | | | | 10,591 | |
Total non prescribed transmission network connections | | Various | | | | | | | | | | | 55,100 | | | | Ongoing | |
Total Other Projects | | Various | | | | | | | | | | | 143,300 | | | | Ongoing | |
| | | | | | | | | | | | | | | | | | |
Total Property, Plant and Equipment | | | | | | | | | | | | | 232,700 | | | | | |
| | | | | | | | | | | | | | | | | | |
| | | | | |
SUNWATER LIMITED | | | | | | | | | | | | | | | | | | |
| | | | | |
Property, Plant and Equipment | | | | | | | | | | | | | | | | | | |
Callide water supply refurbishment and enhancement | | 308 | | | | | | | | | | | 882 | | | | Ongoing | |
Emerald irrigation and water supply refurbishment and enhancement | | 308 | | | | | | | | | | | 361 | | | | Ongoing | |
Paradise Dam water supply refurbishment and enhancement | | 319 | | | | | | | | | | | 319 | | | | Ongoing | |
Beardmore Dam - Thuraggi channel repair | | 307 | | | | | | | | | | | 1,230 | | | | Ongoing | |
Eton irrigation and water supply refurbishment and enhancement | | 312 | | | | | | | | | | | 570 | | | | Ongoing | |
Eungella pipeline refurbishment and enhancement | | 312 | | | | | | | | | | | 304 | | | | Ongoing | |
Mareeba irrigation and water supply refurbishment and enhancement | | 315 | | | | | | | | | | | 714 | | | | Ongoing | |
Minor works | | Various | | | 2,602 | | | | | | | | 2,602 | | | | | |
Plant and equipment | | Various | | | 1,875 | | | | | | | | 1,875 | | | | | |
Software development and hardware | | Various | | | 640 | | | | | | | | 640 | | | | | |
Blackwater pipeline refurbishment and enhancement | | 308 | | | | | | | | | | | 299 | | | | Ongoing | |
Bowen Broken water supply refurbishment and enhancement | | 312 | | | | | | | | | | | 428 | | | | Ongoing | |
Bundaberg irrigation and water supply refurbishment and enhancement | | 319 | | | | | | | | | | | 1,197 | | | | Ongoing | |
Burdekin irrigation and water supply refurbishment and enhancement | | 318 | | | | | | | | | | | 1,328 | | | | Ongoing | |
87
Capital Statement 2018-19
| | | | | | | | | | | | | | | | | | | | |
| Natural Resources, Mines and Energy | |
Project | | Statistical
Area | | | Total
Estimated
Cost
$‘000 | | | Expenditure
to
30-06-18
$‘000 | | | Budget
2018-19
$‘000 | | | Post
2018-19
$‘000 | |
Burdekin Moranbah Pipeline refurbishment and enhancement | | | 312 | | | | | | | | | | | | 497 | | | | Ongoing | |
Awoonga-Callide pipeline refurbishment and enhancement | | | 308 | | | | | | | | | | | | 467 | | | | Ongoing | |
Burdekin water supply refurbishment and enhancement | | | 318 | | | | | | | | | | | | 392 | | | | Ongoing | |
Business development opportunities | | | 305 | | | | 3,620 | | | | | | | | 3,620 | | | | | |
Stanwell pipeline refurbishment and enhancement | | | 308 | | | | | | | | | | | | 835 | | | | Ongoing | |
SunWater office relocation | | | 305 | | | | 6,232 | | | | | | | | 6,232 | | | | | |
Tarong pipeline refurbishment and enhancement | | | 319 | | | | | | | | | | | | 485 | | | | Ongoing | |
Emergency flood management response plan | | | 305 | | | | | | | | | | | | 345 | | | | Ongoing | |
| | | | | | | | | | | | | | | | | | | | |
Total Property, Plant and Equipment | | | | | | | | | | | | | | | 25,622 | | | | | |
| | | | | | | | | | | | | | | | | | | | |
| | | | | |
GLADSTONE AREA WATER BOARD | | | | | | | | | | | | | | | | | | | | |
| | | | | |
Property, Plant and Equipment | | | | | | | | | | | | | | | | | | | | |
Hatchery Relocation Project | | | 308 | | | | 6,522 | | | | 218 | | | | 2,950 | | | | 3,354 | |
Connection to Gladstone Regional Council Kirkwood Reservoir | | | 308 | | | | 7,003 | | | | 267 | | | | 1,272 | | | | 5,464 | |
Automation projects | | | 308 | | | | 2,655 | | | | 724 | | | | 1,931 | | | | | |
Offline Storage and Repump Station | | | 308 | | | | 33,757 | | | | 30,130 | | | | 3,627 | | | | | |
Mobile emergency electrical generation units, Flowmeter replacements | | | 308 | | | | 1,193 | | | | 364 | | | | 829 | | | | | |
Condition assessment of South Trees Pipe | | | 308 | | | | 1,250 | | | | 500 | | | | 750 | | | | | |
Supervisory control and data acquisition telemetry network review | | | 308 | | | | 1,365 | | | | 428 | | | | 937 | | | | | |
Additional corrosion protection Curtis Island | | | 308 | | | | 689 | | | | 141 | | | | 548 | | | | | |
East End Reservoir various works | | | 308 | | | | 1,790 | | | | 1,243 | | | | 547 | | | | | |
Sewerage Treatment Plant replacement and irrigation area | | | 308 | | | | 1,261 | | | | 662 | | | | 599 | | | | | |
Minor works | | | 308 | | | | 14,727 | | | | 5,904 | | | | 8,823 | | | | | |
| | | | | | | | | | | | | | | | | | | | |
Total Property, Plant and Equipment | | | | | | | | | | | | | | | 22,813 | | | | | |
| | | | | | | | | | | | | | | | | | | | |
88
Capital Statement 2018-19
| | | | | | | | | | | | | | | | | | | | |
| Natural Resources, Mines and Energy | |
Project | | Statistical
Area | | | Total
Estimated
Cost
$‘000 | | | Expenditure
to
30-06-18
$‘000 | | | Budget
2018-19
$‘000 | | | Post
2018-19
$‘000 | |
MOUNT ISA WATER BOARD | | | | | | | | | | | | | | | | | | | | |
| | | | | |
Property, Plant and Equipment | | | | | | | | | | | | | | | | | | | | |
Road access improvement | | | 315 | | | | 773 | | | | 137 | | | | 636 | | | | | |
Critical spares procurement | | | 315 | | | | 937 | | | | 337 | | | | 600 | | | | | |
Lake Moondarra Booster Pump Station oil circuit breaker replacement | | | 315 | | | | 354 | | | | 248 | | | | 106 | | | | | |
Asset enhancements | | | 315 | | | | | | | | | | | | 219 | | | | Ongoing | |
Asset renewals | | | 315 | | | | | | | | | | | | 483 | | | | Ongoing | |
Other asset replacements and enhancements | | | 315 | | | | | | | | | | | | 66 | | | | Ongoing | |
Power reliability Moondarra system | | | 315 | | | | 1,289 | | | | 1,074 | | | | 215 | | | | | |
Power reliability Hilton - Lake Julius | | | 315 | | | | 7,763 | | | | 1,011 | | | | 1,742 | | | | 5,010 | |
Lake Julius power pole replacement | | | 315 | | | | | | | | | | | | 280 | | | | Ongoing | |
Mount Isa Terminal Reservoir storage tanks | | | 315 | | | | 2,887 | | | | 891 | | | | 1,996 | | | | | |
Operations and Maintenance asset requirements | | | 315 | | | | 1,292 | | | | 833 | | | | 143 | | | | 316 | |
Upgrade maintenance access to pump stations | | | 315 | | | | 512 | | | | 85 | | | | 178 | | | | 249 | |
Chlorine dose equipment upgrade | | | 315 | | | | 3,602 | | | | | | | | 364 | | | | 3,238 | |
Fire supression | | | 315 | | | | 310 | | | | | | | | 310 | | | | | |
Mount Isa City Council supply - Diesel backup | | | 315 | | | | 1,302 | | | | | | | | 157 | | | | 1,145 | |
Moondarra to Mount Isa Terminal Reservoir pipeline upgrade | | | 315 | | | | 2,881 | | | | | | | | 1,000 | | | | 1,881 | |
Control systems supervisory control and data acquisition upgrade | | | 315 | | | | 1,068 | | | | | | | | 532 | | | | 536 | |
| | | | | | | | | | | | | | | | | | | | |
Total Property, Plant and Equipment | | | | | | | | | | | | | | | 9,027 | | | | | |
| | | | | | | | | | | | | | | | | | | | |
| | | | | |
SEQWATER | | | | | | | | | | | | | | | | | | | | |
| | | | | |
Property, Plant and Equipment | | | | | | | | | | | | | | | | | | | | |
Lake MacDonald Dam upgrade - Stage 2 | | | 316 | | | | 8,559 | | | | 7,514 | | | | 1,045 | | | | | |
Sideling Creek Dam Safety upgrade - Stage 1 | | | 314 | | | | 18,000 | | | | 1,957 | | | | 10,000 | | | | 6,043 | |
Mount Crosby East Bank Water Treatment Plant filtration upgrade | | | 310 | | | | 34,171 | | | | 1,678 | | | | 1,500 | | | | 30,993 | |
89
Capital Statement 2018-19
| | | | | | | | | | | | | | | | | | | | |
| Natural Resources, Mines and Energy | |
Project | | Statistical
Area | | | Total
Estimated
Cost
$‘000 | | | Expenditure
to
30-06-18
$‘000 | | | Budget
2018-19
$‘000 | | | Post
2018-19
$‘000 | |
Somerset Hydro refurbishment | | | 310 | | | | 12,620 | | | | 10,671 | | | | 1,699 | | | | 250 | |
Beaudesert Water Supply Zone upgrade | | | 311 | | | | 3,082 | | | | 82 | | | | 3,000 | | | | | |
Leslie Harrison Dam safety upgrade | | | 301 | | | | 24,572 | | | | 2,072 | | | | 13,000 | | | | 9,500 | |
Other infrastructure capital works | | | Various | | | | | | | | | | | | 99,315 | | | | Ongoing | |
Non-infrastructure capital works | | | Various | | | | | | | | | | | | 5,344 | | | | Ongoing | |
Fleet renewal | | | Various | | | | | | | | | | | | 1,700 | | | | Ongoing | |
Information and Communication Technology Capital Program | | | Various | | | | | | | | | | | | 10,593 | | | | Ongoing | |
| | | | | | | | | | | | | | | | | | | | |
Total Property, Plant and Equipment | | | | | | | | | | | | | | | 147,196 | | | | | |
| | | | | | | | | | | | | | | | | | | | |
| | | | | | | | | | | | | | | | | | | | |
| | | | | | | | | | | | | | | | | | | | |
TOTAL NATURAL RESOURCES, MINES AND ENERGY (PPE) | | | | | | | | | | | | | | | 2,423,528 | | | | | |
| | | | | | | | | | | | | | | | | | | | |
| | | | | | | | | | | | | | | | | | | | |
| | | | | | | | | | | | | | | | | | | | |
TOTAL NATURAL RESOURCES, MINES AND ENERGY (CG) | | | | | | | | | | | | | | | 50,000 | | | | | |
| | | | | | | | | | | | | | | | | | | | |
90
Capital Statement 2018-19
Department of the Premier and Cabinet
The Department of the Premier and Cabinet (including Ministerial Offices and Office of the Leader of the Opposition) has planned a capital program of $2.1 million in 2018-19.
Program Highlights (Property, Plant and Equipment)
| • | | $597,000 to upgrade multiple information and communication technology systems. This includes replacing the Joiners, Leavers and Movers System, upgrading the Performance Information Management System and enhancing the Queensland Integrated Legislation Lifecycle System. |
| • | | $450,000 to replace the Ministerial Firewall which forms part of the Ministerial Offices and Office of the Leader of the Opposition security platform. |
Program Highlights (Capital Grants)
| • | | $1 million as part of $12 million in total State funding to Screen Queensland to fit out a commercial property for screen production purposes. |
| | | | | | | | | | | | | | | | | | | | |
| Premier and Cabinet | |
Project | | Statistical
Area | | | Total
Estimated
Cost
$‘000 | | | Expenditure
to
30-06-18
$‘000 | | | Budget
2018-19
$‘000 | | | Post
2018-19
$‘000 | |
DEPARTMENT OF THE PREMIER AND CABINET | | | | | | | | | |
| | | | | |
Property, Plant and Equipment | | | | | | | | | | | | | | | | | | | | |
Information and Communication Technology Systems Upgrade | | | 305 | | | | 652 | | | | 55 | | | | 597 | | | | | |
Ministerial Offices and Office of the Leader of the Opposition Firewall | | | 305 | | | | 450 | | | | | | | | 450 | | | | | |
| | | | | | | | | | | | | | | | | | | | |
Total Property, Plant and Equipment | | | | | | | | | | | | | | | 1,047 | | | | | |
| | | | | | | | | | | | | | | | | | | | |
| | | | | |
Capital Grants | | | | | | | | | | | | | | | | | | | | |
Screen Production Facility | | | 301 | | | | 1,015 | | | | | | | | 1,015 | | | | | |
| | | | | | | | | | | | | | | | | | | | |
Total Capital Grants | | | | | | | | | | | | | | | 1,015 | | | | | |
| | | | | | | | | | | | | | | | | | | | |
| | | | | | | | | | | | | | | | | | | | |
| | | | | | | | | | | | | | | | | | | | |
TOTAL PREMIER AND CABINET (PPE) | | | | | | | | | | | | | | | 1,047 | | | | | |
| | | | | | | | | | | | | | | | | | | | |
| | | | | | | | | | | | | | | | | | | | |
| | | | | | | | | | | | | | | | | | | | |
TOTAL PREMIER AND CABINET (CG) | | | | | | | | | | | | | | | 1,015 | | | | | |
| | | | | | | | | | | | | | | | | | | | |
91
Capital Statement 2018-19
| 3.16 | PUBLIC SAFETY BUSINESS AGENCY |
The 2018-19 Public Safety Business Agency capital program of $254.1 million supports the delivery of essential frontline public safety services to Queensland communities.
The program will fund capital works, vehicles, information technology and other essential equipment for the Queensland Police Service, Queensland Fire and Emergency Services and the Office of the Inspector-General Emergency Management.
Queensland Fire and Emergency Services
In 2018-19, $82.3 million is provided for fire and emergency services facilities, urban and rural fire appliances, information and communications systems and equipment including:
| • | | $4.3 million to commence replacement of the auxiliary fire and rescue stations at El Arish, Esk, Gracemere, Kilkivan, Wooroolin and Yarraman. |
| • | | $3.8 million to complete replacement of the auxiliary fire and rescue stations at Childers, Rathdowney and Richmond and an upgrade at Dirranbandi. |
| • | | $2.5 million to complete an upgrade of the permanent fire and rescue stations at Loganlea, Mount Ommaney and West Logan. |
| • | | $3 million to commence replacement of the permanent fire and rescue stations at Bracken Ridge and Chandler and a new station at Pimpama. |
| • | | $250,000 to commence the upgrade of the rural fire station at Logan Village to service the community of Yarrabilba and surrounds. |
| • | | $800,000 to complete an upgrade of the permanent fire and rescue station and communications centre at Rockhampton. |
| • | | $442,000 to complete a Rural Fire Service and State Emergency Service (SES) facility at Howard, collocated with a replacement police station. |
| • | | $2.1 million to complete an upgrade of the Horn Island collocated Rural Fire Service and SES facility. |
| • | | $3 million to commence infrastructure works for the south western region headquarters and replacement of the permanent station at Charlton. |
| • | | $50,000 to commence a new emergency services facility at Maleny. |
| • | | $2.1 million to complete an upgrade of the mixed permanent-auxiliary fire and rescue station at Mount Isa and to commence replacement of the combined area office and the Rural Fire Service and SES facility at Mount Isa. |
92
Capital Statement 2018-19
| • | | $2 million to commence the Cairns fire communications centre upgrade and $500,000 to complete the Charleville area office refurbishment. |
| • | | $400,000 to commence the Weipa emergency and disaster centre. |
| • | | $2.5 million for strategic land acquisitions and Rural Operations land purchases. |
| • | | $44.3 million for replacement and new urban and rural fire appliances. |
| • | | $4.6 million for minor capital works across the State including upgrades of fire and rescue station amenities. |
| • | | $5.8 million for operational, information and communications systems and equipment. |
Queensland Police Service
In 2018-19, $123.3 million is provided for Queensland Police Service facilities, information and communication technology and other essential equipment including:
| • | | $10.6 million to continue the new Counter-Terrorism and Community Safety Training Centre at Wacol. |
| • | | $19.3 million to commence construction of a warehouse facility at Wacol. |
| • | | $5.2 million to continue to refurbish heritage buildings at Wacol. |
| • | | $11.7 million to complete the replacement police station and district headquarters at Caboolture. |
| • | | $3.7 million to continue to upgrade the West End police station. |
| • | | $2.4 million to commence construction of a new police facility at Arundel. |
| • | | $1.3 million to complete the replacement police station at Kilcoy. |
| • | | $724,000 to complete a replacement police station at Howard, collocated with a Rural Fire Service and SES facility and a replacement police station at Bowen. |
| • | | $900,000 to continue the planning and design of replacement police stations or alternate police facilities at Beaudesert, Caboolture, Coolum, Mount Morgan, Nambour and Pormpuraaw, the new station at Highfields and to upgrade the stations at Aurukun and Atherton. |
| • | | $400,000 to upgrade the Logan Village Neighbourhood Police Beat to service the Yarrabilba community and surrounds. |
| • | | $30 million for new and replacement police service vehicles. |
| • | | $5.4 million for new and replacement police service vessels. |
93
Capital Statement 2018-19
| • | | $21.2 million for operational, information and communications systems and equipment including the Public Safety Network. |
| • | | $9.4 million for minor capital works including Newtown Neighbourhood Police Beat and $1.2 million for other plant and equipment across the State. |
Public Safety Business Agency - Other Departmental Capital
| • | | $31.8 million to replace rotary-wing aircraft, which deliver aeromedical retrieval and transfer services and perform search and rescue and disaster response operations. |
| • | | $7.4 million to maintain aircraft. |
| • | | $8.9 million to support Queensland Ambulance Service information and communication technology. |
| • | | $300,000 for other departmental information systems development. |
| | | | | | | | | | | | | | | | | | | | |
| Public Safety Business Agency | |
Project | | Statistical
Area | | | Total
Estimated
Cost
$‘000 | | | Expenditure
to
30-06-18
$‘000 | | | Budget
2018-19
$‘000 | | | Post
2018-19
$‘000 | |
PUBLIC SAFETY BUSINESS AGENCY | | | | | | | | | | | | | | | | | | | | |
| | | | | |
Property, Plant and Equipment | | | | | | | | | | | | | | | | | | | | |
Queensland Fire and Emergency Services | | | | | | | | | | | | | | | | | | | | |
Buildings | | | | | | | | | | | | | | | | | | | | |
Bracken Ridge replacement permanent station | | | 302 | | | | 6,000 | | | | | | | | 1,500 | | | | 4,500 | |
Cairns communications centre upgrade | | | 306 | | | | 2,500 | | | | | | | | 2,000 | | | | 500 | |
Chandler replacement permanent station | | | 301 | | | | 4,000 | | | | | | | | 1,000 | | | | 3,000 | |
Charleville area office refurbishment | | | 315 | | | | 1,200 | | | | 700 | | | | 500 | | | | | |
Charlton regional headquarters upgrade and firecom infrastructure | | | 317 | | | | 7,000 | | | | | | | | 2,000 | | | | 5,000 | |
Charlton replacement permanent station | | | 317 | | | | 3,600 | | | | | | | | 1,000 | | | | 2,600 | |
Childers replacement auxiliary station | | | 319 | | | | 3,731 | | | | 3,372 | | | | 359 | | | | | |
Dirranbandi auxiliary station upgrade | | | 307 | | | | 800 | | | | 300 | | | | 500 | | | | | |
94
Capital Statement 2018-19
| | | | | | | | | | | | | | | | | | |
| Public Safety Business Agency | |
Project | | Statistical
Area | | Total
Estimated
Cost
$‘000 | | | Expenditure
to
30-06-18
$‘000 | | | Budget
2018-19
$‘000 | | | Post
2018-19
$‘000 | |
El Arish replacement auxiliary station | | 306 | | | 1,800 | | | | | | | | 900 | | | | 900 | |
Esk replacement auxiliary station | | 310 | | | 1,800 | | | | | | | | 800 | | | | 1,000 | |
Gracemere replacement auxiliary station | | 308 | | | 2,100 | | | | | | | | 100 | | | | 2,000 | |
Horn Island collocated rural fire and SES facility upgrade | | 315 | | | 2,800 | | | | 690 | | | | 2,110 | | | | | |
Howard rural fire and SES facility, collocated with police station | | 319 | | | 4,762 | | | | 4,320 | | | | 442 | | | | | |
Kilkivan replacement auxiliary station | | 319 | | | 1,800 | | | | | | | | 900 | | | | 900 | |
Loganlea permanent station upgrade | | 311 | | | 500 | | | | | | | | 500 | | | | | |
Maleny emergency services1 facility | | 316 | | | 2,500 | | | | | | | | 50 | | | | 2,450 | |
Mount Isa replacement combined area office | | 315 | | | 2,500 | | | | 500 | | | | 2,000 | | | | | |
Mount Isa rural fire and SES facility upgrade | | 315 | | | 4,000 | | | | | | | | 100 | | | | 3,900 | |
Mount Ommaney permanent station upgrade | | 304 | | | 1,500 | | | | 50 | | | | 1,450 | | | | | |
Pimpama new permanent station | | 309 | | | 3,000 | | | | | | | | 500 | | | | 2,500 | |
Rathdowney replacement auxiliary station | | 311 | | | 1,900 | | | | 200 | | | | 1,700 | | | | | |
Richmond replacement auxiliary station | | 315 | | | 2,200 | | | | 987 | | | | 1,213 | | | | | |
Rockhampton permanent station upgrade and communications centre | | 308 | | | 4,553 | | | | 3,753 | | | | 800 | | | | | |
Weipa emergency and disaster centre | | 315 | | | 1,200 | | | | | | | | 400 | | | | 800 | |
West Logan permanent station upgrade | | 311 | | | 500 | | | | | | | | 500 | | | | | |
Wooroolin replacement auxiliary station | | 319 | | | 1,400 | | | | | | | | 800 | | | | 600 | |
Yarrabilba rural fire station2 upgrade and new facility | | 311 | | | 4,250 | | | | | | | | 250 | | | | 4,000 | |
95
Capital Statement 2018-19
| | | | | | | | | | | | | | | | | | |
| Public Safety Business Agency | |
Project | | Statistical
Area | | Total
Estimated
Cost
$‘000 | | | Expenditure
to
30-06-18
$‘000 | | | Budget
2018-19
$‘000 | | | Post
2018-19
$‘000 | |
Yarraman replacement auxiliary station | | 307 | | | 1,500 | | | | | | | | 800 | | | | 700 | |
Minor works | | Various | | | | | | | | | | | 4,600 | | | | Ongoing | |
Land | | | | | | | | | | | | | | | | | | |
Strategic land acquisitions | | Various | | | | | | | | | | | 2,400 | | | | Ongoing | |
Rural Operations land purchases | | Various | | | | | | | | | | | 100 | | | | Ongoing | |
Plant and Equipment | | | | | | | | | | | | | | | | | | |
Rural fire appliances | | Various | | | | | | | | | | | 15,305 | | | | Ongoing | |
Urban fire appliances | | Various | | | | | | | | | | | 29,014 | | | | Ongoing | |
Communications equipment | | Various | | | | | | | | | | | 5,503 | | | | Ongoing | |
Other plant and equipment | | Various | | | | | | | | | | | 250 | | | | Ongoing | |
| | | | | | | | | | | | | | | | | | |
Sub-total Queensland Fire and Emergency Services | | | | | | | | | | | | | 82,346 | | | | | |
| | | | | | | | | | | | | | | | | | |
| | | | | |
Queensland Police Service | | | | | | | | | | | | | | | | | | |
Buildings | | | | | | | | | | | | | | | | | | |
Arundel new facility | | 309 | | | 11,500 | | | | | | | | 2,400 | | | | 9,100 | |
Atherton station upgrade | | 306 | | | 6,190 | | | | 190 | | | | 100 | | | | 5,900 | |
Aurukun station and watchhouse upgrade | | 315 | | | 6,700 | | | | 200 | | | | 100 | | | | 6,400 | |
Beaudesert replacement station | | 311 | | | 5,890 | | | | 390 | | | | 100 | | | | 5,400 | |
Bowen replacement station | | 312 | | | 8,305 | | | | 7,914 | | | | 391 | | | | | |
Caboolture replacement station and district headquarters | | 313 | | | 15,800 | | | | 4,113 | | | | 11,687 | | | | | |
Caboolture refurbishment of old station and watchhouse | | 313 | | | 6,553 | | | | 143 | | | | 100 | | | | 6,310 | |
Coolum replacement station | | 316 | | | 2,700 | | | | | | | | 100 | | | | 2,600 | |
Highfields new station | | 317 | | | 2,770 | | | | 129 | | | | 100 | | | | 2,541 | |
Howard replacement station, collocated with rural fire and SES facility | | 319 | | | 3,901 | | | | 3,568 | | | | 333 | | | | | |
Kilcoy replacement station | | 313 | | | 2,100 | | | | 752 | | | | 1,348 | | | | | |
Logan Village Neighbourhood Police Beat upgrade | | 311 | | | 400 | | | | | | | | 400 | | | | | |
Mount Morgan replacement station | | 308 | | | 2,100 | | | | 100 | | | | 100 | | | | 1,900 | |
Nambour replacement station | | 316 | | | 9,040 | | | | 140 | | | | 100 | | | | 8,800 | |
Pormpuraaw replacement station and watchhouse | | 315 | | | 8,200 | | | | 230 | | | | 100 | | | | 7,870 | |
Wacol Counter-Terrorism and Community Training Centre | | 310 | | | 46,700 | | | | 1,400 | | | | 10,600 | | | | 34,700 | |
96
Capital Statement 2018-19
| | | | | | | | | | | | | | | | | | | | |
| Public Safety Business Agency | |
Project | | Statistical
Area | | | Total
Estimated
Cost
$‘000 | | | Expenditure
to
30-06-18
$‘000 | | | Budget
2018-19
$‘000 | | | Post
2018-19
$‘000 | |
Wacol heritage buildings refurbishment | | | 310 | | | | 5,860 | | | | 169 | | | | 5,200 | | | | 491 | |
Wacol warehouse facility | | | 310 | | | | 26,000 | | | | 1,050 | | | | 19,280 | | | | 5,670 | |
West End station upgrade | | | 305 | | | | 4,300 | | | | 50 | | | | 3,740 | | | | 510 | |
Air conditioning plant replacement program | | | Various | | | | | | | | | | | | 4,000 | | | | Ongoing | |
Closed circuit camera upgrades in various watchhouses | | | Various | | | | | | | | | | | | 2,000 | | | | Ongoing | |
Minor works | | | Various | | | | | | | | | | | | 3,350 | | | | Ongoing | |
Plant and Equipment | | | | | | | | | | | | | | | | | | | | |
Information and communication technology | | | Various | | | | | | | | | | | | 12,131 | | | | Ongoing | |
Public Safety Network | | | 305 | | | | | | | | | | | | 9,045 | | | | Ongoing | |
Vehicle replacement and growth | | | Various | | | | | | | | | | | | 29,951 | | | | Ongoing | |
Vessel management program | | | Various | | | | | | | | | | | | 5,360 | | | | Ongoing | |
Other plant and equipment | | | Various | | | | | | | | | | | | 1,200 | | | | Ongoing | |
| | | | | | | | | | | | | | | | | | | | |
Sub-total Queensland Police Service | | | | | | | | | | | | | | | 123,316 | | | | | |
| | | | | | | | | | | | | | | | | | | | |
| | | | | |
Other Departmental | | | | | | | | | | | | | | | | | | | | |
Rotary-wing aircraft replacement | | | Various | | | | 43,094 | | | | 11,277 | | | | 31,817 | | | | | |
Aircraft maintenance | | | Various | | | | | | | | | | | | 7,421 | | | | Ongoing | |
Queensland Ambulance Service information systems development | | | Various | | | | | | | | | | | | 8,882 | | | | Ongoing | |
Other departmental information systems development | | | Various | | | | | | | | | | | | 300 | | | | Ongoing | |
| | | | | | | | | | | | | | | | | | | | |
Sub-total Other Departmental | | | | | | | | | | | | | | | 48,420 | | | | | |
| | | | | | | | | | | | | | | | | | | | |
| | | | | | | | | | | | | | | | | | | | |
| | | | | | | | | | | | | | | | | | | | |
Total Property, Plant and Equipment | | | | | | | | | | | | | | | 254,082 | | | | | |
| | | | | | | | | | | | | | | | | | | | |
| | | | | | | | | | | | | | | | | | | | |
| | | | | | | | | | | | | | | | | | | | |
TOTAL PUBLIC SAFETY BUSINESS AGENCY (PPE) | | | | | | | | 254,082 | | | | | |
| | | | | | | | | | | | | | | | | | | | |
Notes:
| 1. | Part of the $3 million commitment for a new complex for emergency services in Maleny. $1 million for this project is included in Strategic land acquisitions, offset by $500,000 for property disposal. |
| 2. | Part of the $5 million commitment for equipped fire and emergency services for the community of Yarrabilba and surrounds. $750,000 for this project is included in Urban fire appliances. |
97
Capital Statement 2018-19
| 3.17 | QUEENSLAND CORRECTIVE SERVICES |
Queensland Corrective Services
Queensland Corrective Services’s capital purchases for 2018-19 of $167.8 million will primarily focus on prison infrastructure, perimeter security upgrades and correctional centre enhancements.
Program Highlights (Property, Plant and Equipment)
| • | | $107 million of $241 million to provide an additional 348 cells at Capricornia Correctional Centre. |
| • | | $3.7 million of $126.9 million for the Borallon Training and Correctional Centre redevelopment. |
| • | | $20.5 million of $76.6 million to continue upgrading the perimeter security at a number of correctional centres as part of Stage 2 of the Perimeter Security Upgrade Program. |
| • | | $1.5 million to complete the $6 million Brisbane Women’s Correctional Centre enhancement project. |
| • | | $3.5 million of $8 million to complete the Woodford Correctional Centre enhancement project. |
| • | | $2.5 million to complete various prison infrastructure enhancement projects. |
| • | | $18.6 million to acquire other property, plant and equipment. |
| | | | | | | | | | | | | | | | | | | | |
| Queensland Corrective Services | |
Project | | Statistical
Area | | | Total
Estimated
Cost
$‘000 | | | Expenditure
to
30-06-18
$‘000 | | | Budget
2018-19
$‘000 | | | Post
2018-19
$‘000 | |
QUEENSLAND CORRECTIVE SERVICES | | | | | | | | | | | | | | | | | | | | |
| | | | | |
Property, Plant and Equipment | | | | | | | | | | | | | | | | | | | | |
Queensland Corrective Services | | | | | | | | | | | | | | | | | | | | |
Major Works - Correctional Centres | | | | | | | | | | | | | | | | | | | | |
Capricornia Correctional Centre Expansion | | | 308 | | | | 241,000 | | | | 13,403 | | | | 107,000 | | | | 120,597 | |
Borallon Training and Correctional Centre | | | 310 | | | | 126,900 | | | | 114,233 | | | | 3,667 | | | | 9,000 | |
Perimeter Security Upgrade Program - Stage 2 | | | Various | | | | 76,579 | | | | 53,243 | | | | 20,536 | | | | 2,800 | |
98
Capital Statement 2018-19
| | | | | | | | | | | | | | | | | | | | |
| Queensland Corrective Services | |
Project | | Statistical
Area | | | Total
Estimated
Cost
$‘000 | | | Expenditure
to
30-06-18
$‘000 | | | Budget
2018-19
$‘000 | | | Post
2018-19
$‘000 | |
High Security Expansion for Women | | | 310 | | | | 16,000 | | | | 502 | | | | 10,498 | | | | 5,000 | |
| | | | | | | | | | | | | | | | | | | | |
Sub-total Major Works - Correctional Centres | | | | | | | | | | | | | | | 141,701 | | | | | |
| | | | | | | | | | | | | | | | | | | | |
| | | | | |
Correctional Centre Enhancements | | | | | | | | | | | | | | | | | | | | |
Brisbane Women’s Correctional Centre | | | 310 | | | | 6,000 | | | | 4,520 | | | | 1,480 | | | | | |
Woodford Correctional Centre | | | 313 | | | | 8,011 | | | | 4,542 | | | | 3,469 | | | | | |
Prison Infrastructure | | | Various | | | | 14,436 | | | | 11,900 | | | | 2,536 | | | | | |
| | | | | | | | | | | | | | | | | | | | |
Sub-total Correctional Centre Enhancements | | | | | | | | | | | | | | | 7,485 | | | | | |
| | | | | | | | | | | | | | | | | | | | |
| | | | | |
Other acquisitions of property, plant and equipment | | | Various | | | | | | | | | | | | 18,566 | | | | Ongoing | |
| | | | | | | | | | | | | | | | | | | | |
Sub-total Queensland Corrective Services | | | | | | | | | | | | | | | 167,752 | | | | | |
| | | | | | | | | | | | | | | | | | | | |
| | | | | | | | | | | | | | | | | | | | |
| | | | | | | | | | | | | | | | | | | | |
Total Property, Plant and Equipment | | | | | | | | | | | | | | | 167,752 | | | | | |
| | | | | | | | | | | | | | | | | | | | |
| | | | | | | | | | | | | | | | | | | | |
| | | | | | | | | | | | | | | | | | | | |
TOTAL QUEENSLAND CORRECTIVE SERVICES (PPE) | | | | | | | | | | | | | | | 167,752 | | | | | |
| | | | | | | | | | | | | | | | | | | | |
99
Capital Statement 2018-19
| 3.18 | QUEENSLAND FIRE AND EMERGENCY SERVICES |
Queensland Fire and Emergency Services
Most new and ongoing capital initiatives to support Queensland Fire and Emergency Services (QFES) operational capability are delivered by the Public Safety Business Agency. This includes fire and emergency services facilities, fire appliances and communications equipment.
QFES continues to be responsible for delivering operational equipment and information systems development to support the provision of fire and rescue and emergency management services throughout Queensland.
In 2018-19, QFES will invest $5.8 million in capital purchases and $897,000 in capital grants.
Program Highlights (Property, Plant and Equipment)
| • | | $4 million for operational equipment, which may include protective clothing such as: fully encapsulated gas suits and equipment to service them, specialist and field-portable scientific analysis and detection equipment, and compressors for self-contained breathing apparatus. Equipment purchases may also include motorised swiftwater rescue craft, battery-powered rescue equipment, accommodation shelters and satellite communications hardware for deployable disaster response. |
| • | | $1.5 million for additions and upgrades to information systems. |
| • | | $250,000 for State Emergency Service (SES) on-boarding to the Government Wireless Network in South East Queensland, to support volunteers and local government and enhance an integrated emergency response. |
Program Highlights (Capital Grants)
| • | | $712,000 for State Emergency Service capital grants. |
| • | | $185,000 for Rural Fire Brigade capital grants. |
100
Capital Statement 2018-19
| | | | | | | | | | | | | | | | | | | | |
| Queensland Fire and Emergency Services | |
Project | | Statistical
Area | | | Total
Estimated
Cost
$‘000 | | | Expenditure
to
30-06-18
$‘000 | | | Budget
2018-19
$‘000 | | | Post
2018-19
$‘000 | |
QUEENSLAND FIRE AND EMERGENCY SERVICES | | | | | | | | | | | | | | | | | | | | |
| | | | | |
Property, Plant and Equipment | | | | | | | | | | | | | | | | | | | | |
Operational equipment | | | Various | | | | | | | | | | | | 4,000 | | | | Ongoing | |
Information systems development | | | Various | | | | | | | | | | | | 1,500 | | | | Ongoing | |
SES on-boarding to the Government Wireless Network | | | Various | | | | 500 | | | | | | | | 250 | | | | 250 | |
| | | | | | | | | | | | | | | | | | | | |
Total Property, Plant and Equipment | | | | | | | | | | | | | | | 5,750 | | | | | |
| | | | | | | | | | | | | | | | | | | | |
| | | | | |
Capital Grants | | | | | | | | | | | | | | | | | | | | |
Rural fire brigades | | | Various | | | | | | | | | | | | 185 | | | | Ongoing | |
State Emergency Service | | | Various | | | | | | | | | | | | 712 | | | | Ongoing | |
| | | | | | | | | | | | | | | | | | | | |
Total Capital Grants | | | | | | | | | | | | | | | 897 | | | | | |
| | | | | | | | | | | | | | | | | | | | |
| | | | | | | | | | | | | | | | | | | | |
| | | | | | | | | | | | | | | | | | | | |
TOTAL QUEENSLAND FIRE AND EMERGENCY SERVICES (PPE) | | | | | | | | | | | | 5,750 | | | | | |
| | | | | | | | | | | | | | | | | | | | |
| | | | | | | | | | | | | | | | | | | | |
| | | | | | | | | | | | | | | | | | | | |
TOTAL QUEENSLAND FIRE AND EMERGENCY SERVICES (CG) | | | | | | | | | | | | 897 | | | | | |
| | | | | | | | | | | | | | | | | | | | |
101
Capital Statement 2018-19
The Queensland public healthcare system comprises the Department of Health, Queensland Ambulance Service (QAS) and 16 independent Hospital and Health Services. The total capital program in 2018-19 for Queensland Health and the Council of the Queensland Institute of Medical Research (QIMR) is $985.5 million.
Queensland Health and Hospital and Health Services
The Queensland Health capital investment program works to ensure staff, patients and communities have access to contemporary health infrastructure that supports the delivery of health services. Health infrastructure that is fit for purpose and ensures value for money underpins the delivery of quality frontline services for patients and better health care in the community. The department takes a strategic view to ensure health infrastructure, healthcare technology and information communication technology (ICT) strengthen our public health system to meet the growing demand for world class facilities and services.
Program Highlights (Property, Plant and Equipment)
In 2018-19, Queensland Health will continue to invest in health infrastructure, capital works and purchases across a broad range of areas including hospitals, ambulance stations and vehicles, health technology, ICT, research and scientific services, mental health services and staff accommodation.
Hospital and health facility project highlights in 2018-19 will include:
| • | | $80 million under the Priority Capital Program to be distributed across Hospital and Health Services and Health Support Queensland for a range of capital works projects to enhance, refurbish or replace existing infrastructure and to sustain and improve business and service level continuity. The program seeks to address legislative compliance (including fire safety and food safety), essential services (including electricity, water supply and sewerage), major plant and systems (including air-conditioners, chillers, lifts and infrastructure call systems) and major building elements (including foundations, floors, walls and roofs). |
| • | | $84.8 million as part of the Enhancing Regional Hospitals Program, to continue to deliver upgrades to the Hervey Bay and Gladstone Emergency Departments, to repurpose the Caloundra Health Service and to redevelop the Roma Hospital. |
| • | | $28.7 million as part of the Building Better Hospitals program, to redevelop Logan (including a new maternity ward), Caboolture and Ipswich hospitals and to commence planning and business case development for the Wide Bay region. The $679 million total funding also includes $5 million to refurbish three Cancer Council Queensland lodges. |
102
Capital Statement 2018-19
| • | | $1 million to commence construction of a new 42-bed residential drug rehabilitation and treatment facility in Rockhampton to improve access to specialist alcohol and other drug services for people living in Central Queensland. |
| • | | $1.4 million to fit out and purchase equipment for the new cardiac catheterisation laboratory at Cairns Hospital. |
| • | | $2.4 million to deliver a Magnetic Resonance Imaging (MRI) machine at Townsville Hospital. |
| • | | $4 million to deliver a Computed Tomography (CT) scanner for Mareeba Hospital. |
| • | | $3 million for the Children’s Health Queensland Imaging Informatics Program. |
| • | | $3 million for the Gold Coast Medical Imaging Informatics Solution. |
| • | | $53.3 million to continue to deliver projects as part of the Rural and Regional Infrastructure Package, including: to redevelop Blackall Hospital, Sarina Hospital, Kingaroy Hospital and Townsville Hospital Clinical Services, to construct a new Cairns Mental Health Unit, Mer (Murray) Island Building and staff accommodation across the State, and deliver a Maryborough Hospital Emergency Department and Specialist Outpatients Department. |
| • | | $16.6 million to continue delivery of projects funded under the Significant Regional Infrastructure Projects Program. Projects include: the refurbishment of the Boulia Community Hospital, the refurbishment and expansion of the Townsville Hospital Paediatric Unit, the construction of a new primary healthcare centre on Palm Island and three new Step Up Step Down mental health facilities in Bundaberg, Gladstone and Mackay. |
| • | | $28.1 million to establish a new Adolescent Extended Treatment Facility at the Prince Charles Hospital, two new Adolescent Step Up Step Down units in Brisbane and to refurbish two Adolescent Day Program spaces at Logan and the Gold Coast. |
| • | | $34.5 million to continue ongoing staged works as part of the Sunshine Coast University Hospital. |
| • | | $15.7 million to construct the new Rockhampton Hospital carpark. The facility will include 597 parking bays and will be designed to enable the construction of additional levels and parking bays to meet the future needs of the Rockhampton Hospital. |
103
Capital Statement 2018-19
| • | | $26.6 million as part of the $230 million Advancing Queensland’s Health Infrastructure Program. The program facilitates essential upgrades to health facilities and supporting infrastructure across Queensland, including repurposing of the Nambour General Hospital, redevelopment of the Atherton Hospital Emergency Department and operating theatres, and redevelopment of the Thursday Island Hospital. The program will also support the development of a new health precinct for the southern corridor of Cairns and short-term carpark solutions at Caboolture and Logan Hospitals. |
In 2018-19, $164.2 million will be invested in the prioritised ICT categories to ensure continued efficiency of the Queensland Health system. This will include investment in core infrastructure to support digital hospitals, and replacement and enhancement of core clinical systems to support frontline health service provision and decision making at the point of care. Investment will also continue in core business systems to support corporate and business services systems to enhance Queensland Health’s ability to accurately, cost effectively and seamlessly store and share data across the continuum of care.
$162.9 million will be allocated by Hospital and Health Services for capital projects across Queensland in 2018-19. Projects include:
| • | | $1.7 million for the Toowoomba Hospital MRI facility. |
| • | | $1.9 million to relocate the 16-bed Monash Lodge Aged Care facility to the Clermont Multi-Purpose Health Service site, and kitchen improvements. |
| • | | $1.7 million for water treatment management at the Mackay Base Hospital, Proserpine Hospital, Bowen Hospital, Collinsville Multi-Purpose Health Service, Clermont Multi-Purpose Health Service, Moranbah Hospital and Dysart Hospital. |
| • | | $19 million for ICT projects across the Metro North Hospital and Health Service. |
| • | | $3.7 million to expand the nuclear medicine hot-laboratory at the Royal Brisbane and Women’s Hospital. |
| • | | $5 million to continue to construct a new 184-bed Specialist and Ambulatory Care Centre at the Royal Brisbane and Women’s Hospital. |
| • | | $16.6 million to extend existing ICT services, and develop new ICT services at the Sunshine Coast University Hospital. |
104
Capital Statement 2018-19
Queensland Ambulance Service
In 2018-19, the QAS will invest $32.5 million in capital purchases to support essential frontline services to provide the highest possible quality pre-hospital emergency and non-emergency care and services to the community. In implementing its capital program, the QAS will review opportunities for co-location with health services, thus improving the close linkages and working relationships between public hospitals, as well as other emergency management infrastructure. Highlights of the capital program include:
| • | | $15.1 million for vehicles and stretchers, including to commission 85 new and replacement ambulance vehicles and to continue the rollout of power assisted stretchers. |
| • | | $2.5 million for ambulance facilities, including to plan and progress new stations at Hervey Bay, Drayton and Yarrabilba and replace stations at Kirwan and Mareeba. |
| • | | $200,000 to plan an upgrade for the Gold Coast Operations Centre. |
| • | | $2.2 million to refurbish the Rockhampton Station and Operations Centre and redevelop the Cairns Station and Operations Centre. |
| • | | $5.5 million for minor works at various existing stations to improve functionality and amenities and prolong useful life. |
| • | | $1.5 million to acquire strategically located land to accommodate future expansion of services in identified growth areas. |
| • | | $866,000 for ICT including software development projects and capital grants programs to enhance patient care and service delivery. |
Council of the Queensland Institute of Medical Research
The QIMR capital program in 2018-19 will invest $8.5 million to acquire new and/or replace state-of-the-art scientific equipment.
105
Capital Statement 2018-19
| | | | | | | | | | | | | | | | | | | | |
| Queensland Health | |
Project | | Statistical
Area | | | Total
Estimated
Cost
$‘000 | | | Expenditure
to
30-06-18
$‘000 | | | Budget
2018-19
$‘000 | | | Post
2018-19
$‘000 | |
QUEENSLAND HEALTH AND HOSPITAL AND HEALTH SERVICES | | | | | | | | | | | | | |
| | | | | |
Property, Plant and Equipment1 | | | | | | | | | | | | | | | | | | | | |
Hospital and Health Services | | | | | | | | | | | | | | | | | | | | |
Advancing Queensland’s Health Infrastructure Program | | | Various | | | | 230,000 | | | | 18,753 | | | | 26,607 | | | | 184,640 | |
Aurukun Primary Health Care Centre Redevelopment | | | 315 | | | | 6,653 | | | | 5,111 | | | | 806 | | | | 736 | |
Building Better Hospitals2 | | | Various | | | | 674,000 | | | | 3,000 | | | | 28,700 | | | | 642,300 | |
Cairns Hospital Cardiac3 Catheterisation Laboratory | | | 306 | | | | 2,800 | | | | | | | | 1,400 | | | | 1,400 | |
Cairns Hybrid Theatre | | | 306 | | | | 3,681 | | | | 681 | | | | 3,000 | | | | | |
Cape York Staff Accommodation-Kowanyama Enhancing Regional Hospitals | | | 315 | | | | 3,404 | | | | 977 | | | | 2,427 | | | | | |
Caloundra Health Service Refurbishment | | | 316 | | | | 17,000 | | | | 11,117 | | | | 5,883 | | | | | |
Gladstone Hospital Emergency Department | | | 308 | | | | 42,000 | | | | 4,762 | | | | 26,826 | | | | 10,412 | |
Hervey Bay Hospital Emergency Department | | | 319 | | | | 42,460 | | | | 30,556 | | | | 11,904 | | | | | |
Roma Hospital Redevelopment | | | 307 | | | | 90,400 | | | | 9,525 | | | | 40,144 | | | | 40,731 | |
Lady Cilento Children’s Hospital Resilience Project | | | 305 | | | | 8,647 | | | | 4,961 | | | | 2,777 | | | | 909 | |
Master Planning Studies | | | Various | | | | | | | | | | | | 6,930 | | | | Ongoing | |
Mornington Island Staff Accommodation | | | 315 | | | | 2,000 | | | | 200 | | | | 1,800 | | | | | |
Princess Alexandra Hospital Cladding Project | | | 303 | | | | 45,545 | | | | 7,366 | | | | 13,179 | | | | 25,000 | |
Princess Alexandra Hospital Rehabilitation Unit | | | 303 | | | | 3,000 | | | | | | | | 3,000 | | | | | |
Priority Capital Program | | | Various | | | | | | | | | | | | 80,000 | | | | Ongoing | |
Redcliffe Hospital Carpark | | | 313 | | | | 36,780 | | | | | | | | 7,508 | | | | 29,272 | |
Redland Hospital Upgrade | | | 301 | | | | 1,730 | | | | | | | | 375 | | | | 1,355 | |
Rockhampton Hospital Carpark | | | 308 | | | | 25,500 | | | | 5,691 | | | | 15,664 | | | | 4,145 | |
Rockhampton Drug Rehabilitation and Treatment Facility | | | 308 | | | | 9,500 | | | | | | | | 1,000 | | | | 8,500 | |
Rural and Regional Infrastructure Package | | | | | | | | | | | | | | | | | | | | |
Blackall Hospital Redevelopment | | | 315 | | | | 17,900 | | | | 361 | | | | 1,230 | | | | 16,309 | |
106
Capital Statement 2018-19
| | | | | | | | | | | | | | | | | | |
| Queensland Health | |
Project | | Statistical
Area | | Total
Estimated
Cost
$‘000 | | | Expenditure
to
30-06-18
$‘000 | | | Budget
2018-19
$‘000 | | | Post
2018-19
$‘000 | |
Cairns Hospital Mental Health Unit | | 306 | | | 70,000 | | | | 595 | | | | 1,174 | | | | 68,231 | |
Kingaroy Hospital Redevelopment | | 319 | | | 62,000 | | | | 8,000 | | | | 20,000 | | | | 34,000 | |
Maryborough Hospital Emergency Department | | 319 | | | 5,000 | | | | 767 | | | | 2,350 | | | | 1,883 | |
Maryborough Hospital Specialist Outpatients Refurbishment | | 319 | | | 5,000 | | | | 352 | | | | 4,648 | | | | | |
Mer (Murray) Island Building Replacement | | 315 | | | 7,000 | | | | 403 | | | | 425 | | | | 6,172 | |
Sarina Hospital Redevelopment | | 312 | | | 16,500 | | | | 111 | | | | 5,463 | | | | 10,926 | |
Townsville Hospital Clinical Services Redevelopment | | 318 | | | 10,400 | | | | 418 | | | | 9,982 | | | | | |
Staff accommodation program | | Various | | | 13,000 | | | | 2,204 | | | | 8,069 | | | | 2,727 | |
Significant Regional Infrastructure Projects Program | | | | | | | | | | | | | | | | | | |
Boulia Community Hospital Refurbishment | | 315 | | | 2,000 | | | | 306 | | | | 1,694 | | | | | |
Townsville Hospital Paediatrics Unit | | 318 | | | 6,600 | | | | 6,500 | | | | 100 | | | | | |
Palm Island Primary Health Care Centre | | 318 | | | 16,500 | | | | 7,518 | | | | 7,741 | | | | 1,241 | |
Adult Step Up Step Down Facility - Bundaberg | | 319 | | | 4,822 | | | | 3,412 | | | | 1,261 | | | | 149 | |
Adult Step Up Step Down Facility - Gladstone | | 308 | | | 4,727 | | | | 3,019 | | | | 1,708 | | | | | |
Adult Step Up Step Down Facility - Mackay | | 312 | | | 4,929 | | | | 809 | | | | 4,120 | | | | | |
South East Queensland - Adolescent Mental Health Facilities | | Various | | | 68,237 | | | | 6,567 | | | | 28,063 | | | | 33,607 | |
South East Queensland - Planning for Growth | | | | | | | | | | | | | | | | | | |
Caboolture Hospital Emergency Department Expansion | | 313 | | | 19,600 | | | | 10,809 | | | | 8,791 | | | | | |
Logan, Caboolture and Ipswich Hospital Business Cases and Preparatory Work | | Various | | | 9,000 | | | | 5,868 | | | | 3,132 | | | | | |
Sunshine Coast University4 Hospital | | 316 | | | 1,872,151 | | | | 1,763,819 | | | | 34,511 | | | | 73,821 | |
Townsville Hospital Expansion | | 318 | | | 334,000 | | | | 328,506 | | | | 5,494 | | | | | |
107
Capital Statement 2018-19
| | | | | | | | | | | | | | | | | | |
| Queensland Health | |
Project | | Statistical
Area | | Total
Estimated
Cost
$‘000 | | | Expenditure
to
30-06-18
$‘000 | | | Budget
2018-19
$‘000 | | | Post
2018-19
$‘000 | |
Townsville Hospital Adult Acute Mental Health Inpatient Unit | | 318 | | | 2,775 | | | | | | | | 2,775 | | | | | |
University of Queensland Oral Health Centre at Herston | | 305 | | | 4,699 | | | | 375 | | | | 3,040 | | | | 1,284 | |
Project Finalisation | | Various | | | 1,901 | | | | | | | | 1,901 | | | | | |
Other Acquistions of Property, Plant and Equipment | | | | | | | | | | | | | | | | |
Building Works Capital Project Management | | Various | | | | | | | | | | | 850 | | | | Ongoing | |
Capital Program Land Acquisition | | Various | | | 2,000 | | | | | | | | 2,000 | | | | | |
Children’s Health Queensland Imaging Informatics Program | | 305 | | | 5,900 | | | | | | | | 2,976 | | | | 2,924 | |
Finance System Replacement | | Various | | | 105,000 | | | | 80,000 | | | | 25,000 | | | | | |
Gold Coast Medical Imaging Informatics Solution | | 309 | | | 12,800 | | | | 1,308 | | | | 2,976 | | | | 8,516 | |
Health Technology Equipment Replacement Program | | Various | | | | | | | | | | | 61,397 | | | | Ongoing | |
Laboratory Information Systems | | Various | | | 60,905 | | | | 13,876 | | | | 22,581 | | | | 24,448 | |
Mareeba Hospital Computed Tomography (CT) Scanner | | 306 | | | 5,000 | | | | | | | | 4,000 | | | | 1,000 | |
Queensland Health External Cladding Taskforce Project | | Various | | | 4,545 | | | | 643 | | | | 3,902 | | | | | |
Regional eHealth | | Various | | | 34,950 | | | | 11,804 | | | | 20,656 | | | | 2,490 | |
State-wide General Chemistry and Immunoassay Replacement and Automation Project | | Various | | | 16,511 | | | | 8,941 | | | | 7,570 | | | | | |
Townsville Hospital Magnetic Resonance Imaging (MRI) machine | | 318 | | | 4,700 | | | | | | | | 2,350 | | | | 2,350 | |
Minor Capital Projects and5 Acquisitions | | Various | | | | | | | | | | | 23,159 | | | | Ongoing | |
Project Finalisation - Other Acquisitions of Property, Plant and Equipment | | Various | | | 360 | | | | | | | | 360 | | | | | |
| | | | | | | | | | | | | | | | | | |
Sub-total Other Acquistions of Property, Plant and Equipment | | | | | | | | 179,777 | | | | | |
| | | | | | | | | | | | | | | | | | |
| | | | |
Information Communication and Technology | | | | | | | | | | | | | | | | |
Information Technology Equipment | | Various | | | | | | | | | | | 36,724 | | | | Ongoing | |
Information Communication and Technology | | Various | | | | | | | | | | | 127,449 | | | | Ongoing | |
| | | | | | | | | | | | | | | | | | |
Sub-total Information Communication and Technology | | | | | | | | | | | 164,173 | | | | | |
| | | | | | | | | | | | | | | | | | |
108
Capital Statement 2018-19
| | | | | | | | | | | | | | | | | | | | |
| Queensland Health | |
Project | | Statistical
Area | | | Total
Estimated
Cost
$‘000 | | | Expenditure
to
30-06-18
$‘000 | | | Budget
2018-19
$‘000 | | | Post
2018-19
$‘000 | |
Cairns and Hinterland | | | | | | | | | | | | | | | | | | | | |
Health Technology Equipment | | | 306 | | | | | | | | | | | | 3,698 | | | | Ongoing | |
Minor Capital Projects and Acquisitions | | | 306 | | | | | | | | | | | | 3,096 | | | | Ongoing | |
| | | | | | | | | | | | | | | | | | | | |
Sub-total Cairns and Hinterland | | | | | | | | | | | | | | | 6,794 | | | | | |
| | | | | | | | | | | | | | | | | | | | |
| | | | | |
Central Queensland | | | | | | | | | | | | | | | | | | | | |
Health Technology Equipment | | | 308 | | | | | | | | | | | | 2,500 | | | | Ongoing | |
Minor Capital Projects and Acquisitions | | | 308 | | | | | | | | | | | | 2,274 | | | | Ongoing | |
| | | | | | | | | | | | | | | | | | | | |
Sub-total Central Queensland | | | | | | | | | | | | | | | 4,774 | | | | | |
| | | | | | | | | | | | | | | | | | | | |
| | | | | |
Central West | | | | | | | | | | | | | | | | | | | | |
Health Technology Equipment | | | 315 | | | | | | | | | | | | 579 | | | | Ongoing | |
Minor Capital Projects and Acquisitions | | | 315 | | | | | | | | | | | | 510 | | | | Ongoing | |
| | | | | | | | | | | | | | | | | | | | |
Sub-total Central West | | | | | | | | | | | | | | | 1,089 | | | | | |
| | | | | | | | | | | | | | | | | | | | |
| | | | | |
Childrens Health Queensland | | | | | | | | | | | | | | | | | | | | |
Health Technology Equipment | | | 305 | | | | | | | | | | | | 2,198 | | | | Ongoing | |
Minor Capital Projects and Acquisitions | | | 305 | | | | | | | | | | | | 1,668 | | | | Ongoing | |
| | | | | | | | | | | | | | | | | | | | |
Sub-total Childrens Health Queensland | | | | | | | | | | | | | | | 3,866 | | | | | |
| | | | | | | | | | | | | | | | | | | | |
| | | | | |
Darling Downs | | | | | | | | | | | | | | | | | | | | |
Health Technology Equipment | | | 307 | | | | | | | | | | | | 3,210 | | | | Ongoing | |
Minor Capital Projects and Acquisitions | | | 307 | | | | | | | | | | | | 3,518 | | | | Ongoing | |
Toowoomba Magnetic Resonance Imaging (MRI) Facility | | | 317 | | | | 8,350 | | | | 6,646 | | | | 1,704 | | | | | |
| | | | | | | | | | | | | | | | | | | | |
Sub-total Darling Downs | | | | | | | | | | | | | | | 8,432 | | | | | |
| | | | | | | | | | | | | | | | | | | | |
| | | | | |
Gold Coast | | | | | | | | | | | | | | | | | | | | |
Health Technology Equipment | | | 309 | | | | | | | | | | | | 4,326 | | | | Ongoing | |
Minor Capital Projects and Acquisitions | | | 309 | | | | | | | | | | | | 3,543 | | | | Ongoing | |
| | | | | | | | | | | | | | | | | | | | |
Sub-total Gold Coast | | | | | | | | | | | | | | | 7,869 | | | | | |
| | | | | | | | | | | | | | | | | | | | |
109
Capital Statement 2018-19
| | | | | | | | | | | | | | | | | | | | |
| Queensland Health | |
Project | | Statistical
Area | | | Total
Estimated
Cost
$‘000 | | | Expenditure
to
30-06-18
$‘000 | | | Budget
2018-19
$‘000 | | | Post
2018-19
$‘000 | |
Mackay | | | | | | | | | | | | | | | | | | | | |
Health Technology Equipment | | | 312 | | | | | | | | | | | | 1,284 | | | | Ongoing | |
Minor Capital Projects and Acquisitions | | | 312 | | | | | | | | | | | | 1,489 | | | | Ongoing | |
Clermont Monash Lodge | | | 312 | | | | 2,000 | | | | 51 | | | | 1,949 | | | | | |
Proserpine Simulation Laboratory | | | 312 | | | | 100 | | | | | | | | 100 | | | | | |
Water Treatment | | | 312 | | | | 2,140 | | | | 432 | | | | 1,708 | | | | | |
| | | | | | | | | | | | | | | | | | | | |
Sub-total Mackay | | | | | | | | | | | | | | | 6,530 | | | | | |
| | | | | | | | | | | | | | | | | | | | |
| | | | | |
Metro North | | | | | | | | | | | | | | | | | | | | |
Health Technology Equipment | | | 302 | | | | | | | | | | | | 16,142 | | | | Ongoing | |
Minor Capital Projects and Acquisitions | | | 302 | | | | | | | | | | | | 14,364 | | | | Ongoing | |
Acute Bed Capacity at Redcliffe Hospital | | | 313 | | | | 8,136 | | | | 7,560 | | | | 576 | | | | | |
Information Communication Technology | | | 302 | | | | 67,333 | | | | 48,333 | | | | 19,000 | | | | | |
Step Up Step Down Facility - Nundah | | | 302 | | | | 5,024 | | | | 4,799 | | | | 225 | | | | | |
Royal Brisbane and Women’s Hospital Nuclear Medicine Hot-Laboratory Expansion | | | 305 | | | | 6,110 | | | | 1,984 | | | | 3,662 | | | | 464 | |
Royal Brisbane and Women’s Hospital Specialist and Ambulatory Care Centre | | | 305 | | | | 9,717 | | | | 4,717 | | | | 5,000 | | | | | |
| | | | | | | | | | | | | | | | | | | | |
Sub-total Metro North | | | | | | | | | | | | | | | 58,969 | | | | | |
| | | | | | | | | | | | | | | | | | | | |
| | | | | |
Metro South | | | | | | | | | | | | | | | | | | | | |
Health Technology Equipment | | | 303 | | | | | | | | | | | | 9,446 | | | | Ongoing | |
Minor Capital Projects and Acquisitions | | | 303 | | | | | | | | | | | | 3,859 | | | | Ongoing | |
| | | | | | | | | | | | | | | | | | | | |
Sub-total Metro South | | | | | | | | | | | | | | | 13,305 | | | | | |
| | | | | | | | | | | | | | | | | | | | |
| | | | | |
North West | | | | | | | | | | | | | | | | | | | | |
Health Technology Equipment | | | 315 | | | | | | | | | | | | 524 | | | | Ongoing | |
Minor Capital Projects and Acquisitions | | | 315 | | | | | | | | | | | | 869 | | | | Ongoing | |
| | | | | | | | | | | | | | | | | | | | |
Sub-total North West | | | | | | | | | | | | | | | 1,393 | | | | | |
| | | | | | | | | | | | | | | | | | | | |
110
Capital Statement 2018-19
| | | | | | | | | | | | | | | | | | | | |
| Queensland Health | |
Project | | Statistical
Area | | | Total
Estimated
Cost
$‘000 | | | Expenditure
to
30-06-18
$‘000 | | | Budget
2018-19
$‘000 | | | Post
2018-19
$‘000 | |
South West | | | | | | | | | | | | | | | | | | | | |
Health Technology Equipment | | | 315 | | | | | | | | | | | | 880 | | | | Ongoing | |
Minor Capital Projects and Acquisitions | | | 315 | | | | | | | | | | | | 882 | | | | Ongoing | |
| | | | | | | | | | | | | | | | | | | | |
Sub-total South West | | | | | | | | | | | | | | | 1,762 | | | | | |
| | | | | | | | | | | | | | | | | | | | |
| | | | | |
Sunshine Coast | | | | | | | | | | | | | | | | | | | | |
Health Technology Equipment | | | 316 | | | | | | | | | | | | 3,176 | | | | Ongoing | |
Minor Capital Projects and Acquisitions | | | 316 | | | | | | | | | | | | 6,049 | | | | Ongoing | |
Sunshine Coast University Hospital Group 4 ICT Project | | | 316 | | | | 33,107 | | | | 16,501 | | | | 16,606 | | | | | |
| | | | | | | | | | | | | | | | | | | | |
Sub-total Sunshine Coast | | | | | | | | | | | | | | | 25,831 | | | | | |
| | | | | | | | | | | | | | | | | | | | |
| | | | | |
Torres and Cape | | | | | | | | | | | | | | | | | | | | |
Health Technology Equipment | | | 315 | | | | | | | | | | | | 783 | | | | Ongoing | |
Minor Capital Projects and Acquisitions | | | 315 | | | | | | | | | | | | 1,434 | | | | Ongoing | |
Capital Projects | | | 315 | | | | 936 | | | | | | | | 936 | | | | | |
| | | | | | | | | | | | | | | | | | | | |
Sub-total Torres and Cape | | | | | | | | | | | | | | | 3,153 | | | | | |
| | | | | | | | | | | | | | | | | | | | |
| | | | | |
Townsville | | | | | | | | | | | | | | | | | | | | |
Health Technology Equipment | | | 318 | | | | | | | | | | | | 5,580 | | | | Ongoing | |
Minor Capital Projects and Acquisitions | | | 318 | | | | | | | | | | | | 4,763 | | | | Ongoing | |
| | | | | | | | | | | | | | | | | | | | |
Sub-total Townsville | | | | | | | | | | | | | | | 10,343 | | | | | |
| | | | | | | | | | | | | | | | | | | | |
| | | | | |
West Moreton | | | | | | | | | | | | | | | | | | | | |
Health Technology Equipment | | | 310 | | | | | | | | | | | | 1,717 | | | | Ongoing | |
Minor Capital Projects and Acquisitions | | | 310 | | | | | | | | | | | | 2,537 | | | | Ongoing | |
| | | | | | | | | | | | | | | | | | | | |
Sub-total West Moreton | | | | | | | | | | | | | | | 4,254 | | | | | |
| | | | | | | | | | | | | | | | | | | | |
| | | | | |
Wide Bay | | | | | | | | | | | | | | | | | | | | |
Health Technology Equipment | | | 319 | | | | | | | | | | | | 2,458 | | | | Ongoing | |
Minor Capital Projects and Acquisitions | | | 319 | | | | | | | | | | | | 2,125 | | | | Ongoing | |
| | | | | | | | | | | | | | | | | | | | |
Sub-total Wide Bay | | | | | | | | | | | | | | | 4,583 | | | | | |
| | | | | | | | | | | | | | | | | | | | |
| | | | | |
Queensland Ambulance Service | | | | | | | | | | | | | | | | | | | | |
Cairns Ambulance Station and Operations Centre Redevelopment | | | 306 | | | | 5,600 | | | | 150 | | | | 900 | | | | 4,550 | |
111
Capital Statement 2018-19
| | | | | | | | | | | | | | | | | | | | |
| Queensland Health | |
Project | | Statistical
Area | | | Total
Estimated
Cost
$‘000 | | | Expenditure
to
30-06-18
$‘000 | | | Budget
2018-19
$‘000 | | | Post
2018-19
$‘000 | |
Drayton New Ambulance Station | | | 317 | | | | 4,600 | | | | 20 | | | | 1,200 | | | | 3,380 | |
Gold Coast Ambulance Operations Centre Redevelopment | | | 309 | | | | 6,200 | | | | | | | | 200 | | | | 6,000 | |
Hervey Bay New Ambulance Station | | | 319 | | | | 4,600 | | | | 10 | | | | 300 | | | | 4,290 | |
Kirwan Replacement Ambulance Station | | | 318 | | | | 5,000 | | | | 10 | | | | 350 | | | | 4,640 | |
Mareeba Replacement Ambulance Station | | | 306 | | | | 1,800 | | | | | | | | 400 | | | | 1,400 | |
Rockhampton Ambulance Station and Operations Centre Redevelopment | | | 308 | | | | 5,000 | | | | 120 | | | | 1,300 | | | | 3,580 | |
Yarrabilba New Ambulance Station | | | 311 | | | | 4,600 | | | | | | | | 200 | | | | 4,400 | |
Minor Works | | | Various | | | | | | | | | | | | 5,500 | | | | Ongoing | |
Strategic Land Acquisitions | | | Various | | | | | | | | | | | | 1,500 | | | | Ongoing | |
Ambulance Vehicles | | | Various | | | | | | | | | | | | 15,107 | | | | Ongoing | |
Information Systems Development | | | Various | | | | | | | | | | | | 866 | | | | Ongoing | |
Operation Equipment | | | Various | | | | | | | | | | | | 4,700 | | | | Ongoing | |
| | | | | | | | | | | | | | | | | | | | |
Sub-total Queensland Ambulance Service | | | | | | | | | | | | | | | 32,523 | | | | | |
| | | | | | | | | | | | | | | | | | | | |
| | | | | | | | | | | | | | | | | | | | |
| | | | | | | | | | | | | | | | | | | | |
Total Property, Plant and Equipment | | | | | | | | | | | | | | | 977,022 | | | | | |
| | | | | | | | | | | | | | | | | | | | |
| | | | | |
COUNCIL OF THE QUEENSLAND INSTITUTE OF MEDICAL RESEARCH | | | | | | | | | | | | | | | | | | | | |
| | | | | |
Property, Plant and Equipment | | | | | | | | | | | | | | | | | | | | |
Other scientific equipment | | | 305 | | | | | | | | | | | | 8,457 | | | | Ongoing | |
| | | | | | | | | | | | | | | | | | | | |
Total Property, Plant and Equipment | | | | | | | | | | | | | | | 8,457 | | | | | |
| | | | | | | | | | | | | | | | | | | | |
| | | | | | | | | | | | | | | | | | | | |
| | | | | | | | | | | | | | | | | | | | |
TOTAL QUEENSLAND HEALTH (PPE) | | | | | | | | | | | | | | | 985,479 | | | | | |
| | | | | | | | | | | | | | | | | | | | |
Notes:
| 1. | Total Estimated Cost may include both non-capital and capital components of project expenditure. |
| 2. | Total funding for the Building Better Hospitals package is $679 million, including a $5 million grant for the refurbishment of Cancer Council Queensland Lodges. Detailed Business Cases for the redevelopment of Logan Hospital, Caboolture Hospital and Ipswich Hospital are currently being developed by Building Queensland. |
| 3. | The $2.8 million total estimated cost represents a State contribution of $1.4 million with a further $1.4 million provided by Far North Queensland Hospital Foundation. |
| 4. | The Sunshine Coast University Hospital opened in March 17 upon the completion of Stage 1. The remaining expenditure relates to ongoing works as part of Stages 2 and 3. The $1.872 billion total estimated cost includes the Sunshine Coast Health Institute (SCHI) fit-out capital cost. Those elements of the total SCHI fit-out capital cost that relate to the proposed (non-Queensland Health) SCHI tenants will be funded directly via capital contributions from those tenants. |
| 5. | Amount is net of non capital component of project expenditure. |
112
Capital Statement 2018-19
| 3.20 | QUEENSLAND POLICE SERVICE |
Queensland Police Service
Most new and ongoing capital initiatives to support the Queensland Police Service (QPS) operational capability are provided by the Public Safety Business Agency. This includes police facilities, motor vehicles, vessels and information and communication technology.
The QPS continues to be responsible for delivering operational equipment to maintain quality frontline services. In 2018-19, the QPS will invest $20.1 million in capital purchases.
Program Highlights (Property, Plant and Equipment)
| • | | $5.5 million for Camera Detected Offence Program equipment. |
| • | | $3.9 million for mobile capability and to develop new applications for QPS QLiTE mobile tablet devices. |
| • | | $10.7 million for other plant and equipment, including to replace operational assets. |
| | | | | | | | | | | | | | | | | | | | |
| Queensland Police Service | |
Project | | Statistical
Area | | | Total
Estimated
Cost
$‘000 | | | Expenditure
to 30-06-18
$‘000 | | | Budget
2018-19
$‘000 | | | Post
2018-19
$‘000 | |
QUEENSLAND POLICE SERVICE | | | | | | | | | | | | | | | | | | | | |
| | | | | |
Property, Plant and Equipment | | | | | | | | | | | | | | | | | | | | |
Camera Detected Offence Program | | | Various | | | | | | | | | | | | 5,482 | | | | Ongoing | |
Mobile capability | | | Various | | | | | | | | | | | | 3,920 | | | | Ongoing | |
Other plant and equipment | | | Various | | | | | | | | | | | | 10,722 | | | | Ongoing | |
| | | | | | | | | | | | | | | | | | | | |
Total Property, Plant and Equipment | | | | | | | | | | | | | | | 20,124 | | | | | |
| | | | | | | | | | | | | | | | | | | | |
| | | | | | | | | | | | | | | | | | | | |
| | | | | | | | | | | | | | | | | | | | |
TOTAL QUEENSLAND POLICE SERVICE (PPE) | | | | | | | | | | | | | | | 20,124 | | | | | |
| | | | | | | | | | | | | | | | | | | | |
113
Capital Statement 2018-19
Queensland Treasury
Queensland Treasury’s capital purchases for 2018-19 will be $6.1 million. Total capital grants for the department are $139.7 million.
Program Highlights (Property, Plant and Equipment)
| • | | $5.7 million to implement the Office of State Revenue Transformation Program. This will enable the delivery of an upgraded informaton and communication technology platform and support improved revenue management services into the future. |
| • | | $400,000 to implement the Financial Assurance Framework reforms. This will enable delivery of an informaton and communication technology system to support the operation of the Financial Provisioning Scheme. |
Program Highlights (Capital Grants)
| • | | $139.7 million through the Queensland First Home Owners’ Grant to assist first home buyers to enter the housing market. |
Cross River Rail Delivery Authority
In 2018-19, the Cross River Rail Delivery Authority has budgeted capital expenditure totalling $733 million to continue to progress the planning, procurement, and development associated with the Cross River Rail project.
| | | | | | | | | | | | | | | | | | | | |
| Queensland Treasury | |
Project | | Statistical
Area | | | Total
Estimated
Cost
$‘000 | | | Expenditure
to
30-06-18
$‘000 | | | Budget
2018-19
$‘000 | | | Post
2018-19
$‘000 | |
QUEENSLAND TREASURY | | | | | | | | | | | | | | | | | | | | |
| | | | | |
Property, Plant and Equipment | | | | | | | | | | | | | | | | | | | | |
Office of State Revenue Transformation Program | | | 305 | | | | 17,739 | | | | 11,453 | | | | 5,725 | | | | 561 | |
Financial Assurance Framework Reform | | | 305 | | | | 1,500 | | | | 1,100 | | | | 400 | | | | | |
| | | | | | | | | | | | | | | | | | | | |
Total Property, Plant and Equipment | | | | | | | | | | | | | | | 6,125 | | | | | |
| | | | | | | | | | | | | | | | | | | | |
| | | | | |
Capital Grants | | | | | | | | | | | | | | | | | | | | |
Queensland First Home Owners’ Grant | | | Various | | | | | | | | | | | | 139,725 | | | | Ongoing | |
| | | | | | | | | | | | | | | | | | | | |
Total Capital Grants | | | | | | | | | | | | | | | 139,725 | | | | | |
| | | | | | | | | | | | | | | | | | | | |
114
Capital Statement 2018-19
| | | | | | | | | | | | | | | | | | | | |
| Queensland Treasury | |
Project | | Statistical
Area | | | Total
Estimated
Cost
$‘000 | | | Expenditure
to
30-06-18
$‘000 | | | Budget
2018-19
$‘000 | | | Post
2018-19
$‘000 | |
| | | | |
CROSS RIVER RAIL DELIVERY AUTHORITY | | | | | | | | | | | | | | | | | |
| | | | | |
Property, Plant and Equipment | | | | | | | | | | | | | | | | | | | | |
Cross River Rail | | | 305 | | | | 5,409,000 | | | | 132,869 | | | | 733,000 | | | | 4,543,131 | |
| | | | | | | | | | | | | | | | | | | | |
Total Property, Plant and Equipment | | | | | | | | | | | | | | | 733,000 | | | | | |
| | | | | | | | | | | | | | | | | | | | |
| | | | | | | | | | | | | | | | | | | | |
| | | | | | | | | | | | | | | | | | | | |
TOTAL QUEENSLAND TREASURY (PPE) | | | | | | | | | | | | 739,125 | | | | | |
| | | | | | | | | | | | | | | | | | | | |
| | | | | | | | | | | | | | | | | | | | |
| | | | | | | | | | | | | | | | | | | | |
TOTAL QUEENSLAND TREASURY (CG) | | | | | | | | | | | | 139,725 | | | | | |
| | | | | | | | | | | | | | | | | | | | |
115
Capital Statement 2018-19
| 3.22 | STATE DEVELOPMENT, MANUFACTURING, INFRASTRUCTURE AND PLANNING |
In 2018-19, the State Development, Manufacturing, Infrastructure and Planning portfolio, including Economic Development Queensland, South Bank Corporation and the Queensland Reconstruction Authority, has capital purchases of $232.9 million and capital grants of $487.3 million.
Department of State Development, Manufacturing, Infrastructure and Planning
The Department of State Development, Manufacturing, Infrastructure and Planning has capital purchases of $135.5 million and capital grants of $106 million in 2018-19 to support economic development in Queensland.
Program Highlights (Property, Plant and Equipment)
| • | | $120 million to develop the North Queensland Stadium. |
Program Highlights (Capital Grants)
| • | | $79 million through the Building our Regions program to fund critical infrastructure in regional areas. |
| • | | $25.4 million through the Royalties for the Regions program to support regional communities. |
Economic Development Queensland
In 2018-19, Economic Development Queensland has capital purchases of $73.2 million.
Program Highlights (Property, Plant and Equipment)
| • | | $16 million for the Yeerongpilly Green Transit Oriented Development. |
| • | | $16 million for the urban renewal development at Northshore Hamilton. |
| • | | $13.4 million for the Carseldine Urban Village development. |
| • | | $4.6 million for the Willowbank Industrial Development. |
| • | | $6.3 million for The Village Townsville residential development in the Oonoonba Priority Development Area. |
| • | | $5 million for the proposed Cairns Regional Industrial Estate development. |
| • | | $3.5 million for the Salisbury Plains Industrial Precinct. |
116
Capital Statement 2018-19
South Bank Corporation
In 2018-19, South Bank Corporation has capital works totalling $24.1 million to maintain and enhance the South Bank Parklands, the Corporation’s commercial assets and the Brisbane Convention and Exhibition Centre.
Queensland Reconstruction Authority
In 2018-19, the Queensland Reconstruction Authority has capital grants of $381.3 million.
Program Highlights (Capital Grants)
| • | | $339 million for Natural Disaster Relief and Recovery Arrangements (NDRRA), will be paid to Local Government Authorities for reconstruction, betterment and other projects relating to natural disaster events between 2016 and 2018. Up to 75% is funded by the Australian Government with the remainder funded by the Queensland Government. |
| • | | $13.2 million for the Natural Disaster Resilience Program 2017-18 to support the resilience of Queensland communities to natural disasters, funded jointly by the Australian Government and Queensland Government. |
| • | | $9.5 million for the Disaster Resilience Fund, a State-funded program delivering $38 million over four years to support delivery of disaster-mitigation projects and initiatives that build resilience to natural disasters. |
| • | | $12.4 million to fix damage around Mackay after Severe Tropical Cyclone Debbie. This includes $8.9 million to revitalise Bluewater Trail and Queens Park and $3.6 million ($4.6 million over two years) for beach restoration and mitigation. |
| • | | $4.5 million ($5 million over two years) to Whitsunday Regional Council to reconstruct the council administration building, including the local disaster coordination centre. |
117
Capital Statement 2018-19
| | | | | | | | | | | | | | | | | | | | |
| State Development, Manufacturing, Infrastructure and Planning | |
Project | | Statistical
Area | | | Total
Estimated
Cost
$‘000 | | | Expenditure
to
30-06-18
$‘000 | | | Budget
2018-19
$‘000 | | | Post
2018-19
$‘000 | |
DEPARTMENT OF STATE DEVELOPMENT, MANUFACTURING, INFRASTRUCTURE AND PLANNING | | | | | | | | | | | | | | | | | | | | |
| | | | | |
Property, Plant and Equipment | | | | | | | | | | | | | | | | | | | | |
Other Plant and Equipment | | | Various | | | | | | | | | | | | 50 | | | | Ongoing | |
North Queensland Stadium | | | 318 | | | | 248,900 | | | | 46,091 | | | | 120,000 | | | | 82,809 | |
Gladstone State Development Area | | | 308 | | | | 65,653 | | | | 63,073 | | | | 2,580 | | | | | |
Grants Management System | | | Various | | | | 1,702 | | | | 1,120 | | | | 582 | | | | | |
State Development Area (SDA) Acquisitions | | | 318 | | | | 12,329 | | | | | | | | 12,329 | | | | | |
| | | | | | | | | | | | | | | | | | | | |
Total Property, Plant and Equipment | | | | | | | | | | | | | | | 135,541 | | | | | |
| | | | | | | | | | | | | | | | | | | | |
| | | | | |
Capital Grants | | | | | | | | | | | | | | | | | | | | |
Building our Regions | | | Various | | | | 284,906 | | | | 115,591 | | | | 78,959 | | | | 90,356 | |
Royalties for the Regions | | | Various | | | | 89,144 | | | | 61,735 | | | | 25,409 | | | | 2,000 | |
Roma Street Parklands | | | 305 | | | | | | | | | | | | 1,681 | | | | Ongoing | |
| | | | | | | | | | | | | | | | | | | | |
Total Capital Grants | | | | | | | | | | | | | | | 106,049 | | | | | |
| | | | | | | | | | | | | | | | | | | | |
| | | | | |
ECONOMIC DEVELOPMENT QUEENSLAND | | | | | | | | | | | | | | | | | | | | |
| | | | | |
Property, Plant and Equipment | | | | | | | | | | | | | | | | | | | | |
Willowbank Industrial Development | | | 310 | | | | 73,719 | | | | 16,729 | | | | 4,590 | | | | 52,400 | |
The Village Townsville | | | 318 | | | | 135,219 | | | | 87,387 | | | | 6,296 | | | | 41,536 | |
Northshore Hamilton | | | 302 | | | | 327,169 | | | | 47,846 | | | | 15,992 | | | | 263,331 | |
Yeerongpilly Green Transit Oriented Development | | | 303 | | | | 71,426 | | | | 32,220 | | | | 15,984 | | | | 23,222 | |
Carseldine Urban Village | | | 302 | | | | 32,477 | | | | 7,203 | | | | 13,387 | | | | 11,887 | |
Townsville Regional Industrial Estate | | | 318 | | | | 7,075 | | | | 4,175 | | | | 300 | | | | 2,600 | |
Salisbury Plains Industrial Precinct | | | 312 | | | | 6,567 | | | | 1,817 | | | | 3,500 | | | | 1,250 | |
Sunshine Coast Industrial Precinct - Stage 2 | | | 316 | | | | 15,750 | | | | | | | | 250 | | | | 15,500 | |
Cairns Regional Industrial Estate | | | 306 | | | | 10,000 | | | | | | | | 5,000 | | | | 5,000 | |
Mackay Regional Industrial Estate | | | 312 | | | | 6,300 | | | | | | | | 3,000 | | | | 3,300 | |
Clinton Industrial Development | | | 308 | | | | 11,262 | | | | 512 | | | | 500 | | | | 10,250 | |
Mica Creek Services | | | 315 | | | | 600 | | | | 400 | | | | 200 | | | | | |
Gladstone State Development Area | | | 308 | | | | 14,658 | | | | 6,458 | | | | 1,150 | | | | 7,050 | |
Gold Coast Health and Knowledge Precinct | | | 309 | | | | 29,413 | | | | 17,973 | | | | 3,032 | | | | 8,408 | |
| | | | | | | | | | | | | | | | | | | | |
Total Property, Plant and Equipment | | | | | | | | | | | | | | | 73,181 | | | | | |
| | | | | | | | | | | | | | | | | | | | |
118
Capital Statement 2018-19
| | | | | | | | | | | | | | | | | | | | |
| State Development, Manufacturing, Infrastructure and Planning | |
Project | | Statistical
Area | | | Total
Estimated
Cost
$‘000 | | | Expenditure
to
30-06-18
$‘000 | | | Budget
2018-19
$‘000 | | | Post
2018-19
$‘000 | |
SOUTH BANK CORPORATION | | | | | | | | | | | | | | | | | | | | |
| | | | | |
Property, Plant and Equipment | | | | | | | | | | | | | | | | | | | | |
Parklands Enhancement and replacement | | | 305 | | | | | | | | | | | | 6,182 | | | | Ongoing | |
Brisbane Convention and Exhibition Centre | | | 305 | | | | | | | | | | | | 4,854 | | | | Ongoing | |
Investment Properties - Other Ehancements and replacements | | | 305 | | | | | | | | | | | | 1,380 | | | | Ongoing | |
Vulnerability | | | 305 | | | | 1,000 | | | | | | | | 1,000 | | | | | |
Riverside Open Space | | | 305 | | | | 15,680 | | | | 5,380 | | | | 10,300 | | | | | |
Car Park upgrades and replacement | | | 305 | | | | 415 | | | | | | | | 415 | | | | | |
| | | | | | | | | | | | | | | | | | | | |
Total Property, Plant and Equipment | | | | | | | | | | | | | | | 24,131 | | | | | |
| | | | | | | | | | | | | | | | | | | | |
| | | | | |
QUEENSLAND RECONSTRUCTION AUTHORITY | | | | | | | | | | | | | | | | | | | | |
| | | | | |
Capital Grants | | | | | | | | | | | | | | | | | | | | |
Airlie Beach Foreshore Revitalisation Project | | | 312 | | | | 2,657 | | | | | | | | 2,657 | | | | | |
Mackay Bluewater Trail and Queens Park Revitalisation | | | 312 | | | | 8,864 | | | | | | | | 8,864 | | | | | |
Disaster Resilience Fund | | | Various | | | | 38,000 | | | | | | | | 9,500 | | | | 28,500 | |
Whitsunday Regional Council admin building | | | 312 | | | | 5,000 | | | | | | | | 4,500 | | | | 500 | |
Mackay Beach restoration and mitigation | | | 312 | | | | 4,562 | | | | | | | | 3,562 | | | | 1,000 | |
Natural Disaster Relief & Recovery Arrangements (Local Government Authorities) | | | Various | | | | 1,013,177 | | | | 395,903 | | | | 338,955 | | | | 278,319 | |
Natural Disaster Resilience Program (joint funded with the Australian Government) | | | Various | | | | 13,214 | | | | | | | | 13,214 | | | | | |
| | | | | | | | | | | | | | | | | | | | |
Total Capital Grants | | | | | | | | | | | | | | | 381,252 | | | | | |
| | | | | | | | | | | | | | | | | | | | |
| | | | | | | | | | | | | | | | | | | | |
| | | | | | | | | | | | | | | | | | | | |
TOTAL STATE DEVELOPMENT, MANUFACTURING, INFRASTRUCTURE AND PLANNING (PPE) | | | | | | | | | | | | | | | 232,853 | | | | | |
| | | | | | | | | | | | | | | | | | | | |
| | | | | | | | | | | | | | | | | | | | |
| | | | | | | | | | | | | | | | | | | | |
TOTAL STATE DEVELOPMENT, MANUFACTURING, INFRASTRUCTURE AND PLANNING (CG) | | | | | | | | | | | | | | | 487,301 | | | | | |
| | | | | | | | | | | | | | | | | | | | |
119
Capital Statement 2018-19
| 3.23 | TRANSPORT AND MAIN ROADS |
In 2018-19, the total capital program for the Transport and Main Roads portfolio is $4.217 billion, including capital grants of $239.3 million. The portfolio includes the Department of Transport and Main Roads, Queensland Rail, Far North Queensland Ports Corporation Limited, Gladstone Ports Corporation Limited, North Queensland Bulk Ports Corporation Limited, Port of Townsville Limited, RoadTek and the Gold Coast Waterways Authority.
Department of Transport and Main Roads
In 2018-19, the capital program totals $3.425 billion towards infrastructure investment across the State. The Queensland Government is committed to delivering an integrated, safe and efficient transport system that connects regional Queenslanders and other communities throughout the State.
Program Highlights (Property, Plant and Equipment)
| • | | $534.3 million to continue the Toowoomba Second Range Crossing project, a bypass route to the north of Toowoomba, approximately 41 kilometres in length, running from the Warrego Highway at Helidon to the Gore Highway at Athol, via Charlton, at a total cost of $1.606 billion, in partnership with the Australian Government. |
| • | | $472.3 million to continue delivery of 75 new six car sets and services over a 32-year period for the New Generation Rollingstock to meet the growing demand for rail services in South East Queensland. |
| • | | $200 million to duplicate the Bruce Highway from four to six lanes, Caloundra Road to the Sunshine Motorway, at a total estimated cost of $812.9 million, in partnership with the Australian Government. |
| • | | $115 million to construct the Mackay Ring Road (Stage 1), at a total estimated cost of $497.4 million, in partnership with the Australian Government. |
| • | | $89.2 million for the new statewide public transport ticketing system. |
| • | | $70 million to construct additional lanes on the Pacific Motorway between Mudgeeraba and Varsity Lakes, in partnership with the Australian Government. |
| • | | $68 million to provide a three kilometre upgrade of the Ipswich Motorway between Granard Road, Rocklea and Oxley Road, Oxley at a total cost of $400 million, in partnership with the Australian Government. |
| • | | $50 million to upgrade the Pacific Motorway/Gateway Motorway Merge, in partnership with the Australian Government. |
120
Capital Statement 2018-19
| • | | $45 million to widen the Gateway Motorway North to six lanes, at a total cost of $1.143 billion, in partnership with the Australian Government. |
| • | | $44.1 million to widen the seal and to apply wide centre line treatment at various locations on the Warrego Highway between Dalby and Miles, at a total cost of $63.6 million. |
| • | | $40 million to duplicate from two to four lanes on the section of the Bruce Highway (Rockhampton Northern Access) between Rockhampton-Yeppoon Road intersection and Terranova Drive, north of Rockhampton, at a total cost of $121 million, in partnership with the Australian Government. |
| • | | $37.7 million to construct bridges and approaches on the Bruce Highway (Haughton River Floodplain) south of Giru between Horseshoe Lagoon and Palm Creek, at a total cost of $514.3 million, in partnership with the Australian Government. |
| • | | $28.3 million to widen from four to six lanes on the section of the Bruce Highway (Cairns Southern Access Corridor Stage 4) from Kate Street to Aumuller Street near the Port of Cairns and wharf precinct, at a total cost of $104.1 million, in partnership with the Australian Government. |
| • | | $27 million to realign the Peak Downs Highway at Eton Range, at a total cost of $189.3 million, in partnership with the Australian Government. |
| • | | $24.2 million to undertake restoration works on the Marlborough - Sarina Road at Sarina Range in response to the impacts of Severe Tropical Cyclone Debbie, at a total cost of $49.2 million |
| • | | $17.5 million to construct Smithfield Bypass between the Captain Cook Highway at Yorkeys Knob Road Roundabout and McGregor Road Roundabout at a total cost of $152 million. |
| • | | $17.3 million to extend the three-metre wide V1 cycleway from Birdwoood Road, Holland Park to Gaza Road, Tarragindi, at a total cost of $45 million. |
| • | | $17 million to upgrade approximately nine kilometres of the Pacific Motorway between Eight Mile Plains and Daisy Hill to reduce congestion and travel times, in partnership with the Australian Government. |
| • | | $15.2 million to duplicate from two to four lanes on the Bruce Highway (Cairns Southern Access Corridor Stage 3) from Collinson Creek in Edmonton as far as the vicinity of Wrights Creek near Gordonvale, at a total cost of $481 million, in partnership with the Australian Government. |
121
Capital Statement 2018-19
| • | | $14.4 million out of the Queensland Government’s contribution of $160.8 million towards the Beerburrum to Nambour rail duplication project to address the infrastructure and capacity constraints on this section of the North Coast Line. Detailed design will commence in 2018-19, with construction to be delivered in stages based on further negotiations with the Australian Government. The Australian Government has provided an initial $390 million over five years towards this measure. |
| • | | $13 million to seal sections of the Kennedy Developmental Road between Hughenden and The Lynd (Hann Highway), at a total cost of $50 million, in partnership with the Australian Government. |
| • | | $10.9 million to duplicate from two to four lanes on a section of the Capricorn Highway between Rockhampton and Gracemere, at a total cost of $75 million, in partnership with the Australian Government. |
Program Highlights (Capital Grants)
| • | | $70 million of infrastructure development grants to local governments including Aboriginal and Torres Strait Islander community assistance. |
| • | | $20.2 million to develop the cycle network throughout Queensland. |
| • | | $18 million for the Queensland School Bus Upgrade Scheme to provide funding to eligible school bus operators to assist with the purchase of new buses or buses that are less than five years old. |
| • | | $2 million towards school transport-related infrastructure upgrades, including vehicle turnaround or parking facilities and stop, drop and go areas. The Queensland Government has committed $20 million over four years to this program. |
Gold Coast Waterways Authority
In 2018-19, the Gold Coast Waterways Authority has allocated $8 million to improve management of, and provide better access to, the Gold Coast waterways, canals and rivers.
Program Highlights (Property, Plant and Equipment)
| • | | $4.9 million to improve access and safety by dredging navigation channels and to improve accessibility and quality of waterways information. |
| • | | $2.7 million to provide infrastructure and assets such as ongoing improvements to Doug Jennings Park facilities, upgrading the Sand Bypass Jetty Deck and implementing an innovative renewable energy solution at the Gold Coast Seaway Sand Bypass System. |
| • | | $380,000 to provide boating infrastructure such as boat ramp and pontoon upgrades. |
122
Capital Statement 2018-19
Queensland Rail Limited
In 2018-19, $587.5 million is allocated towards capital purchases for Queensland Rail.
Program Highlights (Property, Plant and Equipment)
$188.4 million is provided towards projects that will grow or enhance the Queensland Rail network including:
| • | | $43.3 million to upgrade (or improve) station accessibility at various train stations including Strathpine, Boondall, Morayfield, Southbank, Dakabin, Cannon Hill, Buranda, Fairfield, Albion, East Ipswich and Loganlea stations. |
| • | | $35.4 million to implement the European Train Control System – Inner City. |
| • | | $35.3 million to continue investment to support the delivery of the New Generation Rollingstock into service. |
| • | | $21.9 million to upgrade the capacity of the North Coast Rail Line to increase productivity and efficiency of freight transport. |
| • | | $14.7 million to revitalise and modernise Brisbane’s Central Station to improve the customer experience and cater for future growth. |
| • | | $12.4 million to upgrade park and ride facilities at Salisbury, Darra, Lawnton, Lindum, Geebung, Virginia and Springfield Central train stations. |
| • | | $9.5 million to continue track and tunnel upgrades between Brisbane and Toowoomba to cater for growing demand. |
| • | | $4.1 million to upgrade 1.9 kilometres of rail track on the Yeppoon Rail Line. |
$399.1 million to replace, renew and upgrade rail infrastructure, rollingstock, buildings, facilities, and other supporting assets including:
| • | | $237.4 million to invest in the network including track infrastructure, civil structures, signalling and other network assets. |
| • | | $88.8 million to invest in rail operations including rollingstock overhauls, operational facilities, and other rail operations assets. |
| • | | $53.3 million for business enabling investment on corporate, property and ICT works across Queensland. |
| • | | $19.6 million to improve customer experience, maintain service continuity and build network resilience on the Townsville – Mount Isa Rail Line. |
123
Capital Statement 2018-19
Far North Queensland Ports Corporation Limited
In 2018-19, Far North Queensland Ports Corporation Limited has allocated $7.5 million to undertake new and continue existing development of its ports in Far North Queensland.
Program Highlights (Property, Plant and Equipment)
| • | | $2 million to continue the development of the Tingira Street Precinct in Cairns, at a total cost of $17.9 million. |
Gladstone Ports Corporation Limited
In 2018-19, Gladstone Ports Corporation Limited has allocated $83.5 million to continue development of the Port of Gladstone, and additional works at the Port of Bundaberg and the Port of Rockhampton.
Program Highlights (Property, Plant and Equipment)
| • | | $35.6 million to continue upgrades at the RG Tanna Coal Terminal at the Port of Gladstone, at a total cost of $220.3 million. |
| • | | $3.5 million to commence land reclamation and drainage works at Fisherman’s Landing, at a total cost of $32 million. |
| • | | $2.8 million to commence road infrastructure and concrete remediation works at Barney Point, at a total cost of $12.3 million. |
North Queensland Bulk Ports Corporation Limited
In 2018-19, North Queensland Bulk Ports Corporation Limited has allocated $15.1 million to continue port planning and development initiatives to meet industry requirements for export facilities.
Program Highlights (Property, Plant and Equipment)
| • | | $5.9 million to relocate Mackay Tug Berth Facilities to provide a permanent fit-for-purpose berthing facility which is fully designed for the safe berthing of the tugs currently in operation and which can suit the potential future larger tug fleet, at a total cost of $6.5 million. |
Port of Townsville Limited
In 2018-19, Port of Townsville Limited has allocated $75.1 million to continue development at the Port of Townsville, and additional works at the Port of Lucinda.
Program Highlights (Property, Plant and Equipment)
| • | | $44.3 million to continue preparatory and initial works to widen the shipping channels for access by larger vessels, at a total cost of $193.5 million. This is Stage 1 of the Townsville Port Expansion Project. |
124
Capital Statement 2018-19
| • | | $18.6 million to commence acquisition of Berth 4 cranes and development of associated cargo terminal areas to cater for future trade growth, at a total cost of $27.3 million. |
| | | | | | | | | | | | | | | | | | | | |
| Transport and Main Roads | |
Project | | Statistical
Area | | | Total
Estimated
Cost
$‘000 | | | Expenditure
to
30-06-18
$‘000 | | | Budget
2018-19
$‘000 | | | Post
2018-19
$‘000 | |
DEPARTMENT OF TRANSPORT AND MAIN ROADS | | | | | | | | | | | | | |
| | | | | |
Property, Plant and Equipment | | | | | | | | | | | | | | | | | | | | |
Central West District | | | | | | | | | | | | | | | | | | | | |
Landsborough Highway1 (Longreach - Winton), Dingo Creek - Darr River, pavement strengthening and widening | | | 315 | | | | 24,980 | | | | 2,100 | | | | 6,350 | | | | 16,530 | |
Clermont - Alpha Road, pave and2 seal | | | 315 | | | | 8,710 | | | | 2,050 | | | | 5,970 | | | | 690 | |
Diamantina Developmental Road2 (Boulia - Dajarra), pavement rehabilitation and widening | | | 315 | | | | 5,030 | | | | 250 | | | | 4,200 | | | | 580 | |
Richmond - Winton Road, pave2 and seal | | | 315 | | | | 4,700 | | | | 340 | | | | 3,940 | | | | 420 | |
Landsborough Highway3 (Augathella - Kynuna), pavement strengthening and widening | | | 315 | | | | 2,280 | | | | 150 | | | | 2,130 | | | | | |
Other Central West Construction | | | 315 | | | | 32,453 | | | | | | | | 32,453 | | | | | |
| | | | | | | | | | | | | | | | | | | | |
Sub-total Central West District | | | | | | | | | | | | | | | 55,043 | | | | | |
| | | | | | | | | | | | | | | | | | | | |
| | | | | |
Darling Downs District | | | | | | | | | | | | | | | | | | | | |
Toowoomba Second Range4 Crossing | | | 317 | | | | 1,606,250 | | | | 650,068 | | | | 534,290 | | | | 421,892 | |
Warrego Highway (Dalby - Miles),5 widening and apply wide centre line treatment | | | 307 | | | | 63,640 | | | | 1,053 | | | | 44,138 | | | | 18,449 | |
Warrego Highway (Dalby - Miles),5 Overtaking Lanes | | | 307 | | | | 35,000 | | | | 7,812 | | | | 20,188 | | | | 7,000 | |
Warrego Highway, Oakey - Miles,5 Safety Upgrade | | | 307 | | | | 40,000 | | | | 15,514 | | | | 19,786 | | | | 4,700 | |
Warrego Highway, Chinchilla Rail5 Crossing Upgrade | | | 307 | | | | 16,000 | | | | 1,521 | | | | 14,479 | | | | | |
125
Capital Statement 2018-19
| | | | | | | | | | | | | | | | | | |
| Transport and Main Roads | |
Project | | Statistical
Area | | Total
Estimated
Cost
$‘000 | | | Expenditure
to
30-06-18
$‘000 | | | Budget
2018-19
$‘000 | | | Post
2018-19
$‘000 | |
Warrego Highway, Dalby Eastern5 Access Upgrade | | 307 | | | 56,000 | | | | 35,227 | | | | 12,890 | | | | 7,883 | |
Warrego Highway, Condamine5 Street - Watt Street, Dalby Western Access Upgrade (Stage 1) | | 307 | | | 59,000 | | | | 38,410 | | | | 8,429 | | | | 12,161 | |
Warrego Highway, Drillham -5 Jackson Widening Upgrade | | 307 | | | 11,000 | | | | 3,149 | | | | 7,251 | | | | 600 | |
New England Highway Cycleway, Bridge street, Toowoomba CBD - Ruthven street, Highfields, construct cycleway | | 317 | | | 7,500 | | | | 500 | | | | 7,000 | | | | | |
Warrego Highway, Miles Western5 Access Upgrade | | 307 | | | 10,743 | | | | 3,060 | | | | 5,307 | | | | 2,376 | |
Other Darling Downs Construction | | 307 | | | 17,978 | | | | | | | | 17,978 | | | | | |
| | | | | | | | | | | | | | | | | | |
Sub-total Darling Downs District | | | | | | | | | | | | | 691,736 | | | | | |
| | | | | | | | | | | | | | | | | | |
| | | | | |
Far North District | | | | | | | | | | | | | | | | | | |
Bruce Highway (Innisfail - Cairns), Cairns Southern Access Corridor Stage 4, Kate Street to Aumuller Street, widen four to six lanes | | 306 | | | 104,070 | | | | 6,378 | | | | 28,286 | | | | 69,406 | |
Smithfield Bypass, construct6 bypass to a sealed standard | | 306 | | | 152,000 | | | | 5,352 | | | | 17,500 | | | | 129,148 | |
Bruce Highway (Innisfail - Cairns), Cairns Southern Access Corridor Stage 3, Edmonton to Gordonvale, duplicate two to four lanes | | 306 | | | 481,000 | | | | 6,082 | | | | 15,150 | | | | 459,768 | |
Peninsula Developmental Road7 (Coen - Weipa), Stage 2, Telecom Tower to Archer River, pave and seal | | 315 | | | 11,400 | | | | 1,593 | | | | 9,807 | | | | | |
Peninsula Developmental Road7 (Coen - Weipa), Stage 2, Piccaninny Black Soil, pave and seal | | 315 | | | 8,906 | | | | 2,048 | | | | 6,858 | | | | | |
Peninsula Developmental Road7 (Laura - Coen), Stage 2, South of Duck Holes Creek, pave and seal | | 315 | | | 10,540 | | | | 4,219 | | | | 6,321 | | | | | |
126
Capital Statement 2018-19
| | | | | | | | | | | | | | | | | | |
| Transport and Main Roads | |
Project | | Statistical
Area | | Total
Estimated
Cost
$‘000 | | | Expenditure
to
30-06-18
$‘000 | | | Budget
2018-19
$‘000 | | | Post
2018-19
$‘000 | |
Peninsula Developmental Road7 (Laura - Coen), Stage 2, 10 Mile Creek, pave and seal | | 315 | | | 6,730 | | | | 4,112 | | | | 2,618 | | | | | |
Cape York Region Package, other7 works | | 315 | | | 172,651 | | | | 168,060 | | | | 4,436 | | | | 155 | |
Burke Developmental Road2 (Normanton - Dimbulah), pavement widening | | 315 | | | 7,460 | | | | 2,176 | | | | 5,284 | | | | | |
Captain Cook Highway (Cairns - Mossman), widen pavement | | 306 | | | 22,807 | | | | 527 | | | | 4,008 | | | | 18,272 | |
Bruce Highway (Innisfail - Cairns), Innisfail, upgrade Ash and Pine Street Intersections | | 306 | | | 6,108 | | | | 98 | | | | 3,556 | | | | 2,454 | |
Bruce Highway (Innisfail - Cairns), northbound overtaking lane | | 306 | | | 4,865 | | | | 920 | | | | 2,000 | | | | 1,945 | |
Other Far North Construction | | 306 | | | 55,763 | | | | | | | | 55,763 | | | | | |
| | | | | | | | | | | | | | | | | | |
Sub-total Far North District | | | | | | | | | | | | | 161,587 | | | | | |
| | | | | | | | | | | | | | | | | | |
| | | | | |
Fitzroy District | | | | | | | | | | | | | | | | | | |
Bruce Highway (Rockhampton - St Lawrence), Rockhampton Northern Access Upgrade, Stage 1 | | 308 | | | 121,000 | | | | 17,300 | | | | 40,000 | | | | 63,700 | |
Capricorn Highway duplication1 (Rockhampton - Gracemere) | | 308 | | | 74,990 | | | | 500 | | | | 10,900 | | | | 63,590 | |
Capricorn Highway (Rockhampton - Emerald), Gracemere - Emerald, overtaking lanes | | 308 | | | 19,000 | | | | | | | | 10,000 | | | | 9,000 | |
Bruce Highway (Benaraby - Rockhampton), Benaraby to Calliope River, Safety Works | | 308 | | | 36,610 | | | | 1,750 | | | | 9,585 | | | | 25,275 | |
Rockhampton Road Train Access2,8 (Stage 1) | | 308 | | | 30,000 | | | | 10,000 | | | | 9,000 | | | | 11,000 | |
Bajool - Port Alma Road,1 pavement widening and safety upgrades | | 308 | | | 14,500 | | | | 2,000 | | | | 8,750 | | | | 3,750 | |
Bruce Highway (Gin Gin - Benaraby), Bororen to Rodds Bay Road, Safety Works | | 308 | | | 14,290 | | | | 1,018 | | | | 8,529 | | | | 4,743 | |
Capricorn Highway, Valentine9 Creek Bridge Replacement | | 308 | | | 8,299 | | | | 438 | | | | 7,661 | | | | 200 | |
127
Capital Statement 2018-19
| | | | | | | | | | | | | | | | | | |
| Transport and Main Roads | |
Project | | Statistical
Area | | Total
Estimated
Cost
$‘000 | | | Expenditure
to
30-06-18
$‘000 | | | Budget
2018-19
$‘000 | | | Post
2018-19
$‘000 | |
Gladstone - Benaraby Road, various safety treatments | | 308 | | | 20,400 | | | | 1,500 | | | | 7,500 | | | | 11,400 | |
Bruce Highway (Gin Gin - Benaraby), north of Granite Creek southbound, construct overtaking lane | | 308 | | | 6,703 | | | | 489 | | | | 5,403 | | | | 811 | |
Bruce Highway (Gin Gin - Benaraby), Daisy Dell southbound, construct overtaking lane | | 308 | | | 4,358 | | | | 740 | | | | 3,308 | | | | 310 | |
Other Fitzroy Construction | | 308 | | | 58,487 | | | | | | | | 58,487 | | | | | |
| | | | | | | | | | | | | | | | | | |
Sub-total Fitzroy District | | | | | | | | | | | | | 179,123 | | | | | |
| | | | | | | | | | | | | | | | | | |
| | | | | |
Mackay Whitsunday District | | | | | | | | | | | | | | | | | | |
Mackay Ring Road, construct new two lane road | | 312 | | | 497,375 | | | | 104,105 | | | | 115,000 | | | | 278,270 | |
Peak Downs Highway, Eton Range Realignment | | 312 | | | 189,264 | | | | 78,382 | | | | 27,000 | | | | 83,882 | |
Marlborough - Sarina Road, Sarina Range, Natural Disaster Relief and Recovery Arrangements Restoration, remediate batter slopes | | 312 | | | 49,157 | | | | 9,660 | | | | 24,241 | | | | 15,256 | |
Peak Downs Highway (Clermont -1 Nebo), Wuthung Road to Caval Ridge, pavement widening and strengthening | | 312 | | | 35,000 | | | | 258 | | | | 4,000 | | | | 30,742 | |
Bowen Developmental Road1 (Collinsville - Belyando Crossing), Rockingham Creek to Mount Coolon, pave and seal; | | 312 | | | 28,750 | | | | 239 | | | | 4,000 | | | | 24,511 | |
Mackay - Slade Point Road, Vines Creek Bridges Replacement | | 312 | | | 28,046 | | | | 15,851 | | | | 3,800 | | | | 8,395 | |
Bruce Highway (St Lawrence - Mackay), Sarina Northern Access, construct roundabout | | 312 | | | 14,363 | | | | 1,990 | | | | 2,000 | | | | 10,373 | |
Other Mackay Whitsunday Construction | | 312 | | | 50,658 | | | | | | | | 50,658 | | | | | |
| | | | | | | | | | | | | | | | | | |
Sub-total Mackay Whitsunday District | | | | | | | | | | | | | 230,699 | | | | | |
| | | | | | | | | | | | | | | | | | |
128
Capital Statement 2018-19
| | | | | | | | | | | | | | | | | | | | |
| Transport and Main Roads | |
Project | | Statistical
Area | | | Total
Estimated
Cost
$‘000 | | | Expenditure
to
30-06-18
$‘000 | | | Budget
2018-19
$‘000 | | | Post
2018-19
$‘000 | |
Metropolitan District | | | | | | | | | | | | | | | | | | | | |
Ipswich Motorway, Rocklea to8 Darra (Stage 1), upgrade | | | 310 | | | | 400,000 | | | | 72,071 | | | | 68,000 | | | | 259,929 | |
Gateway Motorway North, upgrade to six lanes | | | 302 | | | | 1,142,727 | | | | 776,464 | | | | 45,000 | | | | 321,263 | |
New Generation Rollingstock4 | | | 310 | | | | 4,155,705 | | | | 667,706 | | | | 472,323 | | | | 3,015,676 | |
Veloway 1 (V1), Stage E, Birdwood Road to Gaza Road, construct cycleway | | | 303 | | | | 45,000 | | | | 604 | | | | 17,307 | | | | 27,089 | |
Centenary Motorway, Sumners6 Road Interchange Upgrade | | | 304 | | | | 65,000 | | | | 2,550 | | | | 14,934 | | | | 47,516 | |
North Brisbane Bikeway, Stages 2, 3 and 4, Somerset Street to Rigby Street and Rigby Street to Price Street, design and construct cycle facilities | | | 305 | | | | 17,180 | | | | 4,145 | | | | 5,740 | | | | 7,295 | |
Eight Mile Plains Bus Station Park ‘n’ Ride Upgrade | | | 303 | | | | 4,500 | | | �� | 350 | | | | 2,350 | | | | 1,800 | |
Other Metropolitan Construction | | | Various | | | | 66,410 | | | | | | | | 66,410 | | | | | |
| | | | | | | | | | | | | | | | | | | | |
Sub-total Metropolitan District | | | | | | | | | | | | | | | 692,064 | | | | | |
| | | | | | | | | | | | | | | | | | | | |
| | | | | |
Northern District | | | | | | | | | | | | | | | | | | | | |
Bruce Highway (Ayr - Townsville), Haughton River Floodplain, construct bridges and approaches | | | 318 | | | | 514,335 | | | | 17,749 | | | | 37,670 | | | | 458,916 | |
Garbutt - Upper Ross Road,8 Riverway Drive, duplication | | | 318 | | | | 43,756 | | | | 23,184 | | | | 14,881 | | | | 5,691 | |
Gregory Developmental Road,3 Charters Towers to The Lynd, widening | | | 318 | | | | 42,280 | | | | 13,505 | | | | 14,785 | | | | 13,990 | |
Flinders Highway (Townsville -1 Charters Towers), pavement strengthening and rehabilitation (Package 1) | | | 318 | | | | 17,000 | | | | 1,839 | | | | 8,030 | | | | 7,131 | |
Townsville Connection Road,9 Bowen Road Bridge, construct | | | 318 | | | | 6,663 | | | | | | | | 6,663 | | | | | |
Bruce Highway (Townsville - Ingham), Hechts Road to Yuruga Road, pavement widening | | | 318 | | | | 9,170 | | | | 361 | | | | 6,439 | | | | 2,370 | |
129
Capital Statement 2018-19
| | | | | | | | | | | | | | | | | | |
| Transport and Main Roads | |
Project | | Statistical
Area | | Total
Estimated
Cost
$‘000 | | | Expenditure
to
30-06-18
$‘000 | | | Budget
2018-19
$‘000 | | | Post
2018-19
$‘000 | |
Bruce Highway (Townsville - Ingham), Cattle Creek and Frances Creek, upgrade bridges | | 318 | | | 118,900 | | | | 67,207 | | | | 6,433 | | | | 45,260 | |
Bruce Highway (Townsville - Ingham), Deep Creek - Bluewater Creek, pavement widening | | 318 | | | 7,500 | | | | 1,279 | | | | 4,359 | | | | 1,862 | |
Gregory Developmental Road,2 Sardine Creek to Boomerang Creek, widen and seal | | 318 | | | 5,790 | | | | 880 | | | | 3,808 | | | | 1,102 | |
Other Northern Construction | | 318 | | | 33,314 | | | | | | | | 33,314 | | | | | |
| | | | | | | | | | | | | | | | | | |
Sub-total Northern District | | | | | | | | | | | | | 136,382 | | | | | |
| | | | | | | | | | | | | | | | | | |
| | | | | |
North Coast District | | | | | | | | | | | | | | | | | | |
Bruce Highway, Caloundra Road to Sunshine Motorway | | 316 | | | 812,948 | | | | 280,652 | | | | 200,000 | | | | 332,296 | |
Bruce Highway safety barrier installation | | Various | | | 79,790 | | | | 13,450 | | | | 42,503 | | | | 23,837 | |
North Coast Line - Beerburrum to10 Nambour Rail Upgrade | | 316 | | | 550,791 | | | | | | | | 14,407 | | | | 536,384 | |
Burpengary - Caboolture Road and Beerburrum Road, improve intersections | | 313 | | | 28,800 | | | | 700 | | | | 8,000 | | | | 20,100 | |
Kawana Way (Sunshine Motorway8 - Nicklin Way), Sunshine Coast University Hospital, roundabout upgrades | | 316 | | | 22,000 | | | | 15,997 | | | | 4,803 | | | | 1,200 | |
Caboolture Connection Road, upgrade signals and intersection improvements | | 313 | | | 7,555 | | | | 1,053 | | | | 3,669 | | | | 2,833 | |
Mount Glorious Road and Samford - Mount Glorious Road, improve intersections | | 314 | | | 11,300 | | | | 200 | | | | 2,500 | | | | 8,600 | |
Brisbane - Woodford Road, Dixon Street, improve intersection | | 314 | | | 3,000 | | | | 726 | | | | 2,274 | | | | | |
Other North Coast Construction | | 316 | | | 120,887 | | | | | | | | 120,887 | | | | | |
| | | | | | | | | | | | | | | | | | |
Sub-total North Coast District | | | | | | | | | | | | | 399,043 | | | | | |
| | | | | | | | | | | | | | | | | | |
130
Capital Statement 2018-19
| | | | | | | | | | | | | | | | | | | | |
| Transport and Main Roads | |
Project | | Statistical
Area | | | Total
Estimated
Cost
$‘000 | | | Expenditure
to
30-06-18
$‘000 | | | Budget
2018-19
$‘000 | | | Post
2018-19
$‘000 | |
North West District | | | | | | | | | | | | | | | | | | | | |
Kennedy Developmental Road1 (Hann Highway), The Lynd - Hughenden, sealing | | | 315 | | | | 50,000 | | | | 18,000 | | | | 13,000 | | | | 19,000 | |
Wills Developmental Road (Julia9 Creek - Burketown), Beames Brook Bridge, new two lane concrete bridge | | | 315 | | | | 5,977 | | | | 1,190 | | | | 4,787 | | | | | |
Barkly Highway (Cloncurry - Mount1 Isa), intersection upgrades | | | 315 | | | | 6,200 | | | | 430 | | | | 4,000 | | | | 1,770 | |
Flinders Highway (Charters1 Towers - Hughenden), culvert upgrades | | | 315 | | | | 14,408 | | | | 6,335 | | | | 3,252 | | | | 4,821 | |
Cloncurry - Dajarra Road, sealing2 | | | 315 | | | | 3,220 | | | | 50 | | | | 2,880 | | | | 290 | |
Other North West Construction | | | 315 | | | | 22,422 | | | | | | | | 22,422 | | | | | |
| | | | | | | | | | | | | | | | | | | | |
Sub-total North West District | | | | | | | | | | | | | | | 50,341 | | | | | |
| | | | | | | | | | | | | | | | | | | | |
| | | | | |
South Coast District | | | | | | | | | | | | | | | | | | | | |
Pacific Motorway (Mudgeeraba -8,11 Varsity Lakes) extra lanes | | | 309 | | | | 197,500 | | | | 31,456 | | | | 70,000 | | | | 96,044 | |
Pacific Motorway (Rochedale8,12 South), Miles Platting Road to Rochedale Road (Gateway Merge) | | | 311 | | | | 190,000 | | | | 23,147 | | | | 50,000 | | | | 116,853 | |
Pacific Motorway, Eight Mile Plains13 to Daisy Hill | | | 311 | | | | 749,000 | | | | | | | | 17,000 | | | | 732,000 | |
Pacific Motorway, Varsity Lakes6,13 to Tugun | | | 309 | | | | 1,030,000 | | | | | | | | 5,000 | | | | 1,025,000 | |
Mount Lindesay Highway (Brisbane - Beaudesert), Greenbank Road, North Maclean, improve intersection | | | 311 | | | | 20,000 | | | | 4,000 | | | | 16,000 | | | | | |
Gold Coast - Springbrook Road, Natural Disaster Relief and Recovery Arrangements, remediate batter slopes | | | 309 | | | | 21,149 | | | | 7,265 | | | | 13,884 | | | | | |
Waterford - Tamborine Road14 (Logan Village), upgrade between Anzac Avenue to Hotz Road | | | 311 | | | | 39,500 | | | | 26,165 | | | | 13,335 | | | | | |
131
Capital Statement 2018-19
| | | | | | | | | | | | | | | | | | |
| Transport and Main Roads | |
Project | | Statistical
Area | | Total
Estimated
Cost
$‘000 | | | Expenditure
to
30-06-18
$‘000 | | | Budget
2018-19
$‘000 | | | Post
2018-19
$‘000 | |
Lamington National Park Road, Natural Disaster Relief and Recovery Arrangements Restoration, rehabilitate pavement | | 309 | | | 15,490 | | | | 7,136 | | | | 8,354 | | | | | |
Nerang - Murwillumbah Road, Natural Disaster Relief and Recovery Arrangements Restoration, remediate batter slopes | | 309 | | | 10,267 | | | | 2,000 | | | | 5,898 | | | | 2,369 | |
Greenbank Bus Park ‘n’ Ride Upgrade | | 311 | | | 21,000 | | | | 50 | | | | 4,250 | | | | 16,700 | |
Beechmont Road, Natural Disaster Relief and Recovery Arrangments Restoration, remediate batter slopes | | 309 | | | 5,745 | | | | 1,804 | | | | 3,941 | | | | | |
Beaudesert - Beenleigh Road, installation of safety treatments | | 311 | | | 5,880 | | | | 2,170 | | | | 3,710 | | | | | |
Other South Coast Construction | | 309 | | | 56,344 | | | | | | | | 56,344 | | | | | |
| | | | | | | | | | | | | | | | | | |
Sub-total South Coast District | | | | | | | | | | | | | 267,716 | | | | | |
| | | | | | | | | | | | | | | | | | |
| | | | | |
South West District | | | | | | | | | | | | | | | | | | |
Carnarvon Highway, St George -15 Surat, pavement widening | | 307 | | | 16,500 | | | | 7,848 | | | | 8,652 | | | | | |
Other South West Construction | | 315 | | | 26,617 | | | | | | | | 26,617 | | | | | |
| | | | | | | | | | | | | | | | | | |
Sub-total South West District | | | | | | | | | | | | | 35,269 | | | | | |
| | | | | | | | | | | | | | | | | | |
| | | | | |
State Wide District | | | | | | | | | | | | | | | | | | |
Transport Corridor Acquisition Fund | | Various | | | | | | | | | | | 40,000 | | | | Ongoing | |
Maritime Safety Minor Works | | Various | | | | | | | | | | | 6,823 | | | | Ongoing | |
Western Roads Upgrade Supplement | | Various | | | 5,000 | | | | | | | | 5,000 | | | | | |
Additional Electric Charging6 Stations Program | | Various | | | 2,500 | | | | | | | | 200 | | | | 2,300 | |
Other Statewide Construction | | Various | | | 6,582 | | | | | | | | 6,582 | | | | | |
| | | | | | | | | | | | | | | | | | |
Sub-total State Wide District | | | | | | | | | | | | | 58,605 | | | | | |
| | | | | | | | | | | | | | | | | | |
132
Capital Statement 2018-19
| | | | | | | | | | | | | | | | | | | | |
| Transport and Main Roads | |
Project | | Statistical
Area | | | Total
Estimated
Cost
$‘000 | | | Expenditure
to
30-06-18
$‘000 | | | Budget
2018-19
$‘000 | | | Post
2018-19
$‘000 | |
Wide Bay Burnett District | | | | | | | | | | | | | | | | | | | | |
Bruce Highway Intersection Upgrades (Fleming Road to Fishermans Pocket Road, Chatsworth) | | | 319 | | | | 12,000 | | | | 750 | | | | 9,000 | | | | 2,250 | |
Pialba-Burrum Heads Road and Scrub Hill Road and Wide Bay Drive, intersection signalisation | | | 319 | | | | 26,000 | | | | 10,300 | | | | 8,700 | | | | 7,000 | |
Bruce Highway (Gympie - Maryborough), construct overtaking lanes | | | 319 | | | | 13,320 | | | | 615 | | | | 5,685 | | | | 7,020 | |
Bruce Highway (Gin Gin - Benaraby), Gin Gin, widening and intersection upgrades | | | 319 | | | | 8,230 | | | | 150 | | | | 4,200 | | | | 3,880 | |
Bruce Highway (Maryborough - Gin Gin), Hebbards Road - North South Road, Apple Tree Creek, widening and rehabilitation | | | 319 | | | | 15,454 | | | | 9,365 | | | | 3,500 | | | | 2,589 | |
Bruce Highway (Maryborough - Gin Gin), construct overtaking lanes | | | 319 | | | | 4,037 | | | | 200 | | | | 3,407 | | | | 430 | |
Burnett Highway (Gayndah -9 Monto), Eidsvold, Three Moon Creek, timber bridge replacement | | | 319 | | | | 15,575 | | | | 209 | | | | 3,125 | | | | 12,241 | |
Bruce Highway, (Gin Gin - Benaraby), Carman Road - Langbeckers Nurseries, widen and overlay | | | 319 | | | | 8,563 | | | | 2,820 | | | | 2,828 | | | | 2,915 | |
Miva Road, Dickabram Rail Bridge Rehabilitation | | | 319 | | | | 8,000 | | | | 3,720 | | | | 1,780 | | | | 2,500 | |
Other Wide Bay Burnett Construction | | | 319 | | | | 58,215 | | | | | | | | 58,215 | | | | | |
| | | | | | | | | | | | | | | | | | | | |
Sub-total Wide Bay Burnett District | | | | | | | | | | | | | | | 100,440 | | | | | |
| | | | | | | | | | | | | | | | | | | | |
133
Capital Statement 2018-19
| | | | | | | | | | | | | | | | | | | | |
| Transport and Main Roads | |
Project | | Statistical
Area | | | Total
Estimated
Cost
$‘000 | | | Expenditure
to
30-06-18
$‘000 | | | Budget
2018-19
$‘000 | | | Post
2018-19
$‘000 | |
Other Property, Plant and Equipment | | | | | | | | | | | | | | | | | | | | |
Corporate Buildings | | | Various | | | | | | | | | | | | 4,000 | | | | Ongoing | |
Information Technology | | | Various | | | | | | | | | | | | 23,223 | | | | Ongoing | |
Plant and Equipment | | | Various | | | | | | | | | | | | 11,354 | | | | Ongoing | |
New Public Transport Ticketing System | | | Various | | | | 371,060 | | | | | | | | 89,198 | | | | 281,862 | |
| | | | | | | | | | | | | | | | | | | | |
Sub-total Other Property, Plant and Equipment | | | | | | | | | | | | | | | 127,775 | | | | | |
| | | | | | | | | | | | | | | | | | | | |
| | | | | | | | | | | | | | | | | | | | |
| | | | | | | | | | | | | | | | | | | | |
Total Property, Plant and Equipment | | | | | | | | | | | | | | | 3,185,823 | | | | | |
| | | | | | | | | | | | | | | | | | | | |
| | | | | |
Capital Grants | | | | | | | | | | | | | | | | | | | | |
Transport Infrastructure Development Scheme | | | Various | | | | | | | | | | | | 70,000 | | | | Ongoing | |
Bridges Renewal Program9 | | | Various | | | | 71,247 | | | | 38,277 | | | | 22,440 | | | | 10,530 | |
Cycle Program | | | Various | | | | | | | | | | | | 20,233 | | | | Ongoing | |
Cape York Region Package7 | | | 315 | | | | 50,344 | | | | 31,298 | | | | 19,046 | | | | | |
Queensland School Bus Upgrade | | | Various | | | | | | | | | | | | 17,988 | | | | Ongoing | |
Strategic Off-Network - Road Projects | | | Various | | | | 63,201 | | | | 34,527 | | | | 13,020 | | | | 15,654 | |
Black Spot Program | | | Various | | | | | | | | | | | | 12,178 | | | | Ongoing | |
Passenger Transport Facilities Program | | | Various | | | | 92,443 | | | | 34,693 | | | | 7,857 | | | | 49,893 | |
Pasha Road (Moranbah), pave and seal sections | | | 312 | | | | 16,000 | | | | | | | | 6,000 | | | | 10,000 | |
School Transport Infrastructure Program | | | Various | | | | 20,000 | | | | | | | | 2,000 | | | | 18,000 | |
Regional Roads Infrastructure Package | | | Various | | | | 8,302 | | | | 2,148 | | | | 1,145 | | | | 5,009 | |
Transport and Tourism Connections | | | 315 | | | | 10,000 | | | | 5,689 | | | | 200 | | | | 4,111 | |
Other Capital Grants | | | Various | | | | 47,231 | | | | | | | | 47,231 | | | | | |
| | | | | | | | | | | | | | | | | | | | |
Total Capital Grants | | | | | | | | | | | | | | | 239,338 | | | | | |
| | | | | | | | | | | | | | | | | | | | |
| | | | | |
GOLD COAST WATERWAYS AUTHORITY | | | | | | | | | | | | | | | | | | | | |
| | | | | |
Property, Plant and Equipment | | | | | | | | | | | | | | | | | | | | |
Navigation Access and Safety | | | 309 | | | | 12,255 | | | | 2,010 | | | | 4,880 | | | | 5,365 | |
Boating Infrastructure Program | | | 309 | | | | 2,922 | | | | 292 | | | | 380 | | | | 2,250 | |
Plant, Equipment and Minor Works | | | 309 | | | | 10,180 | | | | 2,615 | | | | 2,730 | | | | 4,835 | |
| | | | | | | | | | | | | | | | | | | | |
Total Property, Plant and Equipment | | | | | | | | | | | | | | | 7,990 | | | | | |
| | | | | | | | | | | | | | | | | | | | |
134
Capital Statement 2018-19
| | | | | | | | | | | | | | | | | | |
| Transport and Main Roads | |
Project | | Statistical
Area | | Total
Estimated
Cost
$‘000 | | | Expenditure
to
30-06-18
$‘000 | | | Budget
2018-19
$‘000 | | | Post
2018-19
$‘000 | |
ROADTEK | | | | | | | | | | | | | | | | | | |
| | | | | |
Property, Plant and Equipment | | | | | | | | | | | | | | | | | | |
Hire Plant | | Various | | | | | | | | | | | 15,000 | | | | Ongoing | |
| | | | | | | | | | | | | | | | | | |
Total Property, Plant and Equipment | | | | | | | | | | | | | 15,000 | | | | | |
| | | | | | | | | | | | | | | | | | |
| | | | | |
QUEENSLAND RAIL LIMITED | | | | | | | | | | | | | | | | | | |
| | | | | |
Property, Plant and Equipment | | | | | | | | | | | | | | | | | | |
Growth | | | | | | | | | | | | | | | | | | |
European Train Control System Level 2 - Inner City Works | | 305 | | | 634,380 | | | | 26,462 | | | | 35,429 | | | | 572,489 | |
New Generation Rollingstock - Power Distribution | | Various | | | 49,076 | | | | 15,548 | | | | 26,648 | | | | 6,880 | |
New Generation Rollingstock - Station Compatibility | | Various | | | 16,427 | | | | 13,047 | | | | 3,380 | | | | | |
New Generation Rollingstock - Business Systems | | 305 | | | 41,820 | | | | 39,210 | | | | 2,610 | | | | | |
Other New Generation Rollingstock - Operational Readiness Projects | | Various | | | 2,674 | | | | | | | | 2,674 | | | | | |
North Coast Line Capacity Improvement Project (Passing Loops) | | Various | | | 82,734 | | | | 5,514 | | | | 21,886 | | | | 55,334 | |
Toowoomba Range Capacity and Clearance Upgrades | | 317 | | | 47,460 | | | | 37,914 | | | | 9,546 | | | | | |
Yeppoon Rail Line Upgrade | | 308 | | | 4,100 | | | | | | | | 4,100 | | | | | |
Other Rail Projects16 | | Various | | | | | | | | | | | 11,798 | | | | Ongoing | |
Central Train Station Renewal | | 305 | | | 51,822 | | | | 4,434 | | | | 7,491 | | | | 39,897 | |
Other Central Train Station Upgrades | | 305 | | | 14,032 | | | | | | | | 7,168 | | | | 6,864 | |
Strathpine and Boondall Train Station Upgrades | | Various | | | 48,065 | | | | 5,170 | | | | 17,622 | | | | 25,273 | |
Morayfield Train Station Upgrade | | 313 | | | 22,311 | | | | 2,074 | | | | 8,976 | | | | 11,261 | |
Southbank Train Station Upgrade | | 305 | | | 10,042 | | | | 1,882 | | | | 8,160 | | | | | |
Dakabin Train Station Upgrade | | 314 | | | 39,000 | | | | 120 | | | | 2,953 | | | | 35,927 | |
Cannon Hill Train Station Upgrade | | 303 | | | 18,000 | | | | 30 | | | | 1,540 | | | | 16,430 | |
Buranda Train Station Upgrade | | 303 | | | 25,000 | | | | 70 | | | | 1,230 | | | | 23,700 | |
Fairfield Train Station Upgrade | | 303 | | | 16,000 | | | | | | | | 400 | | | | 15,600 | |
135
Capital Statement 2018-19
| | | | | | | | | | | | | | | | | | | | |
| Transport and Main Roads | |
Project | | Statistical
Area | | | Total
Estimated
Cost
$‘000 | | | Expenditure
to
30-06-18
$‘000 | | | Budget
2018-19
$‘000 | | | Post
2018-19
$‘000 | |
Albion Train Station Upgrade | | | 305 | | | | 16,000 | | | | 45 | | | | 395 | | | | 15,560 | |
East Ipswich Train Station Upgrade | | | 310 | | | | 17,500 | | | | | | | | 50 | | | | 17,450 | |
Loganlea Train Station Upgrade | | | 311 | | | | 19,000 | | | | | | | | 30 | | | | 18,970 | |
Other Train Station Upgrades | | | Various | | | | | | | | | | | | 1,919 | | | | Ongoing | |
Salisbury Train Station Park ‘n’17 Ride | | | 303 | | | | 14,500 | | | | 50 | | | | 4,050 | | | | 10,400 | |
Darra Train Station Park ‘n’ Ride17 | | | 310 | | | | 8,770 | | | | 50 | | | | 3,000 | | | | 5,720 | |
Lawnton Train Station Park ‘n’17 Ride | | | 314 | | | | 10,400 | | | | 3,200 | | | | 1,912 | | | | 5,288 | |
Lindum Train Station Park ‘n’ Ride17 | | | 301 | | | | 5,000 | | | | 100 | | | | 1,338 | | | | 3,562 | |
Geebung Train Station Park ‘n’17 Ride | | | 302 | | | | 3,100 | | | | 100 | | | | 862 | | | | 2,138 | |
Virginia Train Station Park ‘n’ Ride17 | | | 302 | | | | 2,300 | | | | 100 | | | | 663 | | | | 1,537 | |
Springfield Central Train Station17 Park ‘n’ Ride | | | 310 | | | | 44,500 | | | | | | | | 550 | | | | 43,950 | |
| | | | | | | | | | | | | | | | | | | | |
Sub-total Growth | | | | | | | | | | | | | | | 188,380 | | | | | |
| | | | | | | | | | | | | | | | | | | | |
Network | | | | | | | | | | | | | | | | | | | | |
Below Rail Operational18 Performance | | | Various | | | | | | | | | | | | 212,913 | | | | Ongoing | |
Below Rail Cost Optimisation18 | | | Various | | | | | | | | | | | | 24,465 | | | | Ongoing | |
Townsville - Mount Isa Rail Line | | | Various | | | | | | | | | | | | 19,599 | | | | Ongoing | |
| | | | | | | | | | | | | | | | | | | | |
Sub-total Network | | | | | | | | | | | | | | | 256,977 | | | | | |
| | | | | | | | | | | | | | | | | | | | |
Rail Operations | | | | | | | | | | | | | | | | | | | | |
Above Rail Operational19 Performance | | | Various | | | | | | | | | | | | 84,094 | | | | Ongoing | |
Above Rail Cost Optimisation19 | | | Various | | | | | | | | | | | | 4,746 | | | | Ongoing | |
| | | | | | | | | | | | | | | | | | | | |
Sub-total Rail Operations | | | | | | | | | | | | | | | 88,840 | | | | | |
| | | | | | | | | | | | | | | | | | | | |
Business Enabling | | | | | | | | | | | | | | | | | | | | |
Safety Program | | | Various | | | | | | | | | | | | 10,270 | | | | Ongoing | |
ICT Program | | | Various | | | | | | | | | | | | 6,653 | | | | Ongoing | |
Workforce Productivity Program | | | Various | | | | | | | | | | | | 3,920 | | | | Ongoing | |
Other Enabling Program | | | Various | | | | | | | | | | | | 32,432 | | | | Ongoing | |
| | | | | | | | | | | | | | | | | | | | |
Sub-total Business Enabling | | | | | | | | | | | | | | | 53,275 | | | | | |
| | | | | | | | | | | | | | | | | | | | |
| | | | | | | | | | | | | | | | | | | | |
| | | | | | | | | | | | | | | | | | | | |
Total Property, Plant and Equipment | | | | | | | | | | | | | | | 587,472 | | | | | |
| | | | | | | | | | | | | | | | | | | | |
136
Capital Statement 2018-19
| | | | | | | | | | | | | | | | | | | | |
| Transport and Main Roads | |
Project | | Statistical
Area | | | Total
Estimated
Cost
$‘000 | | | Expenditure
to
30-06-18
$‘000 | | | Budget
2018-19
$‘000 | | | Post
2018-19
$‘000 | |
FAR NORTH QUEENSLAND PORTS CORPORATION LIMITED | | | | | | | | | | | | | | | | | | | | |
| | | | | |
Property, Plant and Equipment | | | | | | | | | | | | | | | | | | | | |
Marlin Marina Reconfiguration and Expansion | | | 306 | | | | 4,443 | | | | 1,843 | | | | 1,500 | | | | 1,100 | |
Tingira Street Subdivision Development | | | 306 | | | | 17,913 | | | | 3,263 | | | | 2,000 | | | | 12,650 | |
Horn Island Cargo Wharf Access Road | | | 315 | | | | 1,700 | | | | | | | | 1,700 | | | | | |
Plant, Equipment and Minor Works | | | 306 | | | | | | | | | | | | 2,346 | | | | Ongoing | |
| | | | | | | | | | | | | | | | | | | | |
Total Property, Plant and Equipment | | | | | | | | | | | | | | | 7,546 | | | | | |
| | | | | | | | | | | | | | | | | | | | |
| | | | | |
GLADSTONE PORTS CORPORATION LIMITED | | | | | | | | | | | | | | | | | | | | |
| | | | | |
Property, Plant and Equipment | | | | | | | | | | | | | | | | | | | | |
RG Tanna Coal Terminal Projects | | | | | | | | | | | | | | | | | | | | |
Process Control Systems, Stockpile Management and Upgrades | | | 308 | | | | 126,363 | | | | 11,889 | | | | 26,764 | | | | 87,710 | |
Conveyor Life Extension | | | 308 | | | | 86,945 | | | | 6,666 | | | | 6,234 | | | | 74,045 | |
Capacity Maximisation | | | 308 | | | | 7,000 | | | | 3,880 | | | | 2,595 | | | | 525 | |
Auckland Point Projects | | | 308 | | | | 38,400 | | | | 100 | | | | 2,400 | | | | 35,900 | |
Barney Point Projects | | | 308 | | | | 12,250 | | | | | | | | 2,760 | | | | 9,490 | |
Port of Bundaberg Projects | | | 319 | | | | 3,180 | | | | | | | | 1,900 | | | | 1,280 | |
Fisherman’s Landing Projects | | | 308 | | | | 32,035 | | | | | | | | 3,485 | | | | 28,550 | |
Marine Pilot Services Projects | | | 308 | | | | 7,330 | | | | 2,006 | | | | 1,294 | | | | 4,030 | |
Information Systems Projects | | | 308 | | | | 38,455 | | | | | | | | 13,050 | | | | 25,405 | |
Port Services Projects | | | 308 | | | | 81,928 | | | | 19,400 | | | | 15,078 | | | | 47,450 | |
Port Alma Projects | | | 308 | | | | 2,500 | | | | | | | | 500 | | | | 2,000 | |
Quarry Projects | | | 308 | | | | 4,260 | | | | | | | | 1,260 | | | | 3,000 | |
Marina Projects | | | 308 | | | | 1,020 | | | | | | | | 500 | | | | 520 | |
Plant, Equipment and Minor Works | | | 308 | | | | 18,964 | | | | 208 | | | | 5,665 | | | | 13,091 | |
| | | | | | | | | | | | | | | | | | | | |
Total Property, Plant and Equipment | | | | | | | | | | | | | | | 83,485 | | | | | |
| | | | | | | | | | | | | | | | | | | | |
| | | | | |
NORTH QUEENSLAND BULK PORTS CORPORATION LIMITED | | | | | | | | | | | | | | | | | | | | |
| | | | | |
Property, Plant and Equipment | | | | | | | | | | | | | | | | | | | | |
Mackay Tug Berth Facilities Stage 1 | | | 312 | | | | 6,511 | | | | 615 | | | | 5,896 | | | | | |
Mackay Northern Access Road | | | 312 | | | | 2,712 | | | | 212 | | | | 1,500 | | | | 1,000 | |
137
Capital Statement 2018-19
| | | | | | | | | | | | | | | | | | |
| Transport and Main Roads | |
Project | | Statistical
Area | | Total
Estimated
Cost
$‘000 | | | Expenditure
to
30-06-18
$‘000 | | | Budget
2018-19
$‘000 | | | Post
2018-19
$‘000 | |
Middle Breakwater Common User Pipe Supports Replacement | | 312 | | | 6,210 | | | | 210 | | | | 1,500 | | | | 4,500 | |
Louisa Creek Acquisition Program | | 312 | | | 6,020 | | | | 760 | | | | 1,052 | | | | 4,208 | |
Mackay Wharf 1 Deck Concrete Sealing | | 312 | | | 932 | | | | 182 | | | | 750 | | | | | |
Mackay Water Network Enhancements | | 312 | | | 4,130 | | | | 505 | | | | 655 | | | | 2,970 | |
Wharf 5 Approaches | | 312 | | | 7,750 | | | | | | | | 250 | | | | 7,500 | |
Hay Point Port Development General | | 312 | | | 4,534 | | | | 904 | | | | 1,890 | | | | 1,740 | |
Mackay Port Development General | | 312 | | | 32,722 | | | | 3,835 | | | | 1,399 | | | | 27,488 | |
Abbot Point Port Development General | | 312 | | | 8,223 | | | | 863 | | | | 80 | | | | 7,280 | |
Business Improvement (Information Technology) | | 312 | | | 1,730 | | | | 380 | | | | 150 | | | | 1,200 | |
| | | | | | | | | | | | | | | | | | |
Total Property, Plant and Equipment | | | | | | | | | | | | | 15,122 | | | | | |
| | | | | | | | | | | | | | | | | | |
| | | | | |
PORT OF TOWNSVILLE LIMITED | | | | | | | | | | | | | | | | | | |
| | | | | |
Property, Plant and Equipment | | | | | | | | | | | | | | | | | | |
Berth 4 Cranes and Cargo Terminal Area | | 318 | | | 27,296 | | | | 415 | | | | 18,564 | | | | 8,317 | |
Channel Capacity Upgrade | | 318 | | | 193,460 | | | | 6,096 | | | | 44,326 | | | | 143,038 | |
Road Network Upgrades | | 318 | | | 10,100 | | | | 250 | | | | 3,250 | | | | 6,600 | |
Wharf Facilities Upgrades | | 318 | | | 11,486 | | | | 36 | | | | 1,000 | | | | 10,450 | |
Plant, Equipment and Minor Works | | 318 | | | | | | | | | | | 7,953 | | | | Ongoing | |
| | | | | | | | | | | | | | | | | | |
Total Property, Plant and Equipment | | | | | | | | | | | | | 75,093 | | | | | |
| | | | | | | | | | | | | | | | | | |
| | | | | | | | | | | | | | | | | | |
| | | | | | | | | | | | | | | | | | |
TOTAL TRANSPORT AND MAIN ROADS (PPE) | | | | | | | | | | | | | 3,977,531 | | | | | |
| | | | | | | | | | | | | | | | | | |
| | | | | | | | | | | | | | | | | | |
| | | | | | | | | | | | | | | | | | |
TOTAL TRANSPORT AND MAIN ROADS (CG) | | | | | | | | | | | | | 239,338 | | | | | |
| | | | | | | | | | | | | | | | | | |
Notes:
| 1. | Part of the Northern Australia Roads Program. |
| 2. | Part of the Northern Australia Beef Roads Program. |
| 3. | Funding for this project is for pre-construction activities only. |
| 4. | This project is being delivered under a Public Private Partnership arrangement (PPP). |
| 5. | Part of the $635 million Warrego Highway Upgrade Package to upgrade the Warrego Highway between Toowoomba and Miles. |
| 6. | Part of the State Infrastructure Fund. |
| 7. | Part of the $260.5 million Cape York Region Package. |
| 8. | Part of the State Infrastructure Fund - Priority Economic Works and Productivity Program. |
138
Capital Statement 2018-19
| 9. | Part of the Bridges Renewal Program. |
| 10. | Indicative total project cost subject to confirmation. Project timing, potential staging and funding arrangements subject to negotiations with the Australia Government. |
| 11. | Indicative total project cost to be confirmed. Australian Government contribution capped at $110 million, with the Queensland Government to fund the balance. Queensland Government contribution includes $44 million from the State Infrastructure Fund. |
| 12. | Indicative total project cost to be confirmed. Australian Government contribution capped at $115 million, with the Queensland Government to fund the balance. Queensland Government contribution includes $42 million from the State Infrastructure Fund - Priority Economic Works and Productivity Program. |
| 13. | Indicative total project cost subject to business case development. Project timing and funding arrangements subject to negotiations with the Australia Government. |
| 14. | This is a developer funded project. |
| 15. | Part of the Australian Government’s Heavy Vehicle Safety and Productivity Program. |
| 16. | Projects other than European Train Control System, New Generation Rollingstock - Operational Readiness, Central and other train station upgrades that will grow and enhance the Queensland Rail Network. They are mainly related to infrastructure and civil works. |
| 17. | The project is jointly delivered by Queensland Rail and Department of Transport and Main Roads. |
| 18. | Below Rail includes track infrastructure. |
| 19. | Above Rail includes stations, platforms and rollingstock. |
All Projects - Total estimated cost is inclusive of both non-capital and capital components of project expenditure.
139
Capital Statement 2018-19
Appendices
| Appendix A: | Entities included in capital outlays 2018-19 |
Aboriginal and Torres Strait Islander Partnerships
Department of Aboriginal and Torres Strait Islander Partnerships
Agriculture and Fisheries
Department of Agriculture and Fisheries
Queensland Racing Integrity Commission
Child Safety, Youth and Women
Department of Child Safety, Youth and Women
Communities, Disability Services and Seniors
Department of Communities, Disability Services and Seniors
Education
Department of Education
Queensland Curriculum and Assessment Authority
Electoral Commission of Queensland
Employment, Small Business and Training
Department of Employment, Small Business and Training
TAFE Queensland
Environment and Science
Department of Environment and Science
Library Board of Queensland
Queensland Museum
Queensland Art Gallery
Queensland Performing Arts Trust
Housing and Public Works
Department of Housing and Public Works
CITEC
Queensland Shared Services
Queensland Building and Construction Commission
Stadiums Queensland
140
Capital Statement 2018-19
Innovation, Tourism Industry Development and the Commonwealth Games
Department of Innovation, Tourism Industry Development and the Commonwealth Games
Justice and Attorney General
Department of Justice and Attorney General
Public Trustee of Queensland
Legal Aid Queensland
Crime and Corruption Commission
Legislative Assembly of Queensland
Local Government, Racing and Multicultural Affairs
Department of Local Government, Racing and Multicultural Affairs
Natural Resources, Mines and Energy
Department of Natural Resources, Mines and Energy
CS Energy Limited
Stanwell Corporation Limited
Energy Queensland
Powerlink Queensland
SunWater Limited
Gladstone Area Water Board
Mount Isa Water Board
Seqwater
Premier and Cabinet
Department of the Premier and Cabinet
Public Safety Business Agency
Queensland Corrective Services
Queensland Fire and Emergency Services
Queensland Health
Queensland Health and Hospital and Health Services
Council of the Queensland Institute of Medical Research
Queensland Police Service
Queensland Treasury
Queensland Treasury
Cross River Rail Delivery Authority
141
Capital Statement 2018-19
State Development, Manufacturing, Infrastructure and Planning
Department of State Development, Manufacturing, Infrastructure and Planning
Economic Development Queensland
South Bank Corporation
Queensland Reconstruction Authority
Transport and Main Roads
Department of Transport and Main Roads
Gold Coast Waterways Authority
Queensland Rail Limited
Far North Queensland Ports Corporation
Gladstone Ports Corporation
North Queensland Bulk Ports Corporation
Port of Townsville Limited
RoadTek
142
Capital Statement 2018-19
| Appendix B: | Key concepts and coverage |
Coverage of the capital statement
Under accrual output budgeting, capital is the stock of assets including property, plant and equipment and intangible assets that any agency owns and/or controls and uses in the delivery of services, as well as capital grants made to other entities. The following definitions are applicable throughout this document:
| • | | capital purchases – property, plant and equipment outlays as per the financial statements excluding asset sales, depreciation and revaluations |
| • | | capital grants – capital grants to other entities and individuals (excluding grants to other government departments and statutory bodies). |
Capital contingency
Consistent with the approach adopted in previous years, a capital contingency reserve has been included. This reserve recognises that while agencies budget to fully use their capital works allocation, circumstances such as project lead-in times, project management constraints, unexpected weather conditions and capacity constraints such as the supply of labour and materials may prevent full usage. On a whole-of-government basis, there is likely to be underspending, resulting in a carry-over of capital allocations.
Estimated jobs supported by capital works
The $11.583 billion capital works program in 2018-19 is estimated to directly support more than 38,000 jobs, equating to around 33,000 full-time equivalent jobs. The estimate of jobs supported by the Government’s capital works program in 2018-19 is based on Queensland Treasury’s Guidelines for estimating the full-time equivalent (FTE) jobs directly supported by the construction component of the capital works program.
The estimate of jobs supported by the capital works program is presented both in terms of FTEs and total jobs. Further, in some cases, jobs estimates quoted for specific projects throughout the Capital Statement and in other Budget papers may reflect other approaches, including proponent’s estimates or project specific information, rather than the methodology in the Queensland Treasury Guidelines for estimating jobs supported by capital works.
143
Capital Statement 2018-19
| Appendix C: | Capital purchases by entity by region 2018-19 |
| | | | | | | | | | | | | | | | | | | | | | | | |
| | | Brisbane | |
| | | East | | | North | | | South | | | West | | | Inner City | | | Sub total | |
Entity2 | | $‘000 | | | $‘000 | | | $‘000 | | | $‘000 | | | $‘000 | | | $‘000 | |
| | | | | | |
Aboriginal and Torres Strait Islander Partnerships | | | — | | | | — | | | | — | | | | — | | | | 284 | | | | 284 | |
| | | | | | |
Agriculture and Fisheries | | | 1,146 | | | | 30 | | | | 1,000 | | | | — | | | | 8,585 | | | | 10,761 | |
| | | | | | |
Child Safety, Youth and Women | | | 2,214 | | | | 1,809 | | | | 2,977 | | | | 1,589 | | | | 2,185 | | | | 10,774 | |
| | | | | | |
Communities, Disability Services and Seniors | | | 143 | | | | 1,989 | | | | 218 | | | | 116 | | | | 1,010 | | | | 3,476 | |
| | | | | | |
Education | | | 17,748 | | | | 13,505 | | | | 42,825 | | | | 26,142 | | | | 111,646 | | | | 211,866 | |
| | | | | | |
Electoral Commission of Queensland | | | — | | | | — | | | | — | | | | — | | | | 3,381 | | | | 3,381 | |
| | | | | | |
Employment, Small Business and Training | | | 1,285 | | | | 1,173 | | | | 1,936 | | | | 1,018 | | | | 1,741 | | | | 7,153 | |
| | | | | | |
Environment and Science | | | 4,514 | | | | 1,884 | | | | 3,110 | | | | 1,636 | | | | 27,170 | | | | 38,314 | |
| | | | | | |
Housing and Public Works | | | 15,551 | | | | 21,126 | | | | 45,170 | | | | 11,466 | | | | 55,235 | | | | 148,548 | |
| | | | | | |
Innovation, Tourism Industry Development and the Commonwealth Games | | | — | | | | — | | | | — | | | | — | | | | 24 | | | | 24 | |
| | | | | | |
Justice and Attorney-General | | | 915 | | | | 884 | | | | 1,377 | | | | 724 | | | | 40,994 | | | | 44,894 | |
| | | | | | |
Legislative Assembly of Queensland | | | 131 | | | | 121 | | | | 200 | | | | 105 | | | | 6,568 | | | | 7,125 | |
| | | | | | |
Local Government, Racing and Multicultural Affairs | | | 62 | | | | 56 | | | | 93 | | | | 49 | | | | 71 | | | | 331 | |
| | | | | | |
Natural Resources, Mines and Energy | | | 38,882 | | | | 100,753 | | | | 101,238 | | | | 68,935 | | | | 321,629 | | | | 631,437 | |
| | | | | | |
Premier and Cabinet | | | — | | | | — | | | | — | | | | — | | | | 1,047 | | | | 1,047 | |
| | | | | | |
Public Safety Business Agency3 | | | 8,737 | | | | 8,567 | | | | 11,664 | | | | 7,584 | | | | 21,766 | | | | 58,318 | |
| | | | | | |
Queensland Corrective Services | | | 1,967 | | | | 1,799 | | | | 2,969 | | | | 1,561 | | | | 2,286 | | | | 10,582 | |
| | | | | | |
Queensland Fire and Emergency Services | | | 271 | | | | 248 | | | | 410 | | | | 216 | | | | 316 | | | | 1,461 | |
| | | | | | |
Queensland Health | | | 25,069 | | | | 72,284 | | | | 66,707 | | | | 19,578 | | | | 58,439 | | | | 242,077 | |
| | | | | | |
Queensland Police Service | | | 953 | | | | 869 | | | | 1,435 | | | | 755 | | | | 1,105 | | | | 5,117 | |
| | | | | | |
Queensland Treasury | | | — | | | | — | | | | — | | | | — | | | | 739,125 | | | | 739,125 | |
| | | | | | |
State Development, Manufacturing, Infrastructure and Planning | | | 30 | | | | 29,406 | | | | 16,029 | | | | 24 | | | | 24,166 | | | | 69,655 | |
| | | | | | |
Transport and Main Roads | | | 44,287 | | | | 95,717 | | | | 84,886 | | | | 51,740 | | | | 108,073 | | | | 384,703 | |
| | | | | | |
Other Agencies4 | | | 75 | | | | 69 | | | | 114 | | | | 60 | | | | 88 | | | | 406 | |
| | | | | | |
Anticipated Contingency Reserve and Other Adjustments5 | | | | | | | | | | | | | | | | | | | | | | | | |
| | | | | | |
Funds Allocated | | | 158,097 | | | | 339,651 | | | | 370,569 | | | | 186,363 | | | | 1,481,797 | | | | 2,536,477 | |
Notes
| 1. | Numbers may not add due to rounding and allocations of adjustments. |
| 2. | Includes all associated statutory bodies. |
| 3. | The Public Safety Business Agency is a capital purchaser for Queensland Fire and Emergency Services, Queensland Police Service and the Office of the Inspector-General Emergency Management. |
| 4. | Includes other Government entities with non-material capital programs. |
| 5. | The Anticipated Contingency Reserve and other adjustments have been spread across statistical areas proportionate to capital spends. |
144
Capital Statement 2018-19
| | | | | | | | | | | | | | | | | | | | | | | | |
| | | Ipswich | | | Wide Bay | | | Darling Downs | | | Gold Coast | |
| | | | | | | | | DD Maranoa | | | Toowoomba | | | Sub total | | | | |
Entity2 | | $‘000 | | | $‘000 | | | $‘000 | | | $‘000 | | | $‘000 | | | $‘000 | |
| | | | | | |
Aboriginal and Torres Strait Islander Partnerships | | | — | | | | — | | | | — | | | | — | | | | — | | | | — | |
| | | | | | |
Agriculture and Fisheries | | | — | | | | 1,050 | | | | 1,000 | | | | 4,050 | | | | 5,050 | | | | 120 | |
| | | | | | |
Child Safety, Youth and Women | | | 9,971 | | | | 2,721 | | | | 1,103 | | | | 1,303 | | | | 2,406 | | | | 4,873 | |
| | | | | | |
Communities, Disability Services and Seniors | | | 3,327 | | | | 3,061 | | | | 681 | | | | 345 | | | | 1,026 | | | | 356 | |
| | | | | | |
Education | | | 59,483 | | | | 20,764 | | | | 12,872 | | | | 32,897 | | | | 45,769 | | | | 83,554 | |
| | | | | | |
Electoral Commission of Queensland | | | — | | | | — | | | | — | | | | — | | | | — | | | | — | |
| | | | | | |
Employment, Small Business and Training | | | 1,901 | | | | 1,618 | | | | 708 | | | | 4,855 | | | | 5,563 | | | | 3,263 | |
| | | | | | |
Environment and Science | | | 3,053 | | | | 16,065 | | | | 1,139 | | | | 1,374 | | | | 2,513 | | | | 5,243 | |
| | | | | | |
Housing and Public Works | | | 32,699 | | | | 11,447 | | | | 2,903 | | | | 6,716 | | | | 9,619 | | | | 26,666 | |
| | | | | | |
Innovation, Tourism Industry Development and the Commonwealth Games | | | — | | | | — | | | | — | | | | — | | | | — | | | | 172 | |
| | | | | | |
Justice and Attorney-General | | | 1,397 | | | | 1,273 | | | | 504 | | | | 999 | | | | 1,503 | | | | 3,847 | |
| | | | | | |
Legislative Assembly of Queensland | | | 196 | | | | 167 | | | | 73 | | | | 88 | | | | 161 | | | | 337 | |
| | | | | | |
Local Government, Racing and Multicultural Affairs | | | 91 | | | | 82 | | | | 34 | | | | 46 | | | | 80 | | | | 156 | |
| | | | | | |
Natural Resources, Mines and Energy | | | 132,279 | | | | 213,253 | | | | 145,256 | | | | 134,400 | | | | 279,656 | | | | 122,024 | |
| | | | | | |
Premier and Cabinet | | | — | | | | — | | | | — | | | | — | | | | — | | | | — | |
| | | | | | |
Public Safety Business Agency3 | | | 47,331 | | | | 12,584 | | | | 5,570 | | | | 8,253 | | | | 13,823 | | | | 22,563 | |
| | | | | | |
Queensland Corrective Services | | | 18,560 | | | | 2,482 | | | | 1,087 | | | | 1,312 | | | | 2,399 | | | | 5,005 | |
| | | | | | |
Queensland Fire and Emergency Services | | | 403 | | | | 343 | | | | 150 | | | | 181 | | | | 331 | | | | 691 | |
| | | | | | |
Queensland Health | | | 40,799 | | | | 76,161 | | | | 60,498 | | | | 19,349 | | | | 79,847 | | | | 73,797 | |
| | | | | | |
Queensland Police Service | | | 1,409 | | | | 1,199 | | | | 525 | | | | 634 | | | | 1,159 | | | | 2,419 | |
| | | | | | |
Queensland Treasury | | | — | | | | — | | | | — | | | | — | | | | — | | | | — | |
| | | | | | |
State Development, Manufacturing, Infrastructure and Planning | | | 4,634 | | | | 38 | | | | 16 | | | | 20 | | | | 36 | | | | 3,108 | |
| | | | | | |
Transport and Main Roads | | | 601,780 | | | | 142,134 | | | | 175,471 | | | | 570,596 | | | | 746,067 | | | | 246,812 | |
| | | | | | |
Other Agencies4 | | | 112 | | | | 95 | | | | 42 | | | | 50 | | | | 92 | | | | 192 | |
| | | | | | |
Anticipated Contingency Reserve and Other Adjustments5 | | | | | | | | | | | | | | | | | | | | | | | | |
| | | | | | |
Funds Allocated | | | 925,006 | | | | 488,365 | | | | 394,937 | | | | 759,218 | | | | 1,154,155 | | | | 583,487 | |
Notes
| 1. | Numbers may not add due to rounding and allocations of adjustments. |
| 2. | Includes all associated statutory bodies. |
| 3. | The Public Safety Business Agency is a capital purchaser for Queensland Fire and Emergency Services, Queensland Police Service and the Office of the Inspector-General Emergency Management. |
| 4. | Includes other Government entities with non-material capital programs. |
| 5. | The Anticipated Contingency Reserve and other adjustments have been spread across statistical areas proportionate to capital spends. |
145
Capital Statement 2018-19
| | | | | | | | | | | | | | | | | | | | | | | | |
| | | Logan –
Beaudesert | | | Mackay -
Whitsunday | | | Outback and Far North
Queensland | | | Central | |
| | | | | | | | | Outback | | | Cairns | | | Sub total | | | Queensland
Fitzroy | |
Entity2 | | $‘000 | | | $‘000 | | | $‘000 | | | $‘000 | | | $‘000 | | | $‘000 | |
| | | | | | |
Aboriginal and Torres Strait Islander Partnerships | | | — | | | | — | | | | 6,095 | | | | 47 | | | | 6,142 | | | | — | |
| | | | | | |
Agriculture and Fisheries | | | — | | | | 80 | | | | 1,200 | | | | 1,150 | | | | 2,350 | | | | 210 | |
| | | | | | |
Child Safety, Youth and Women | | | 2,757 | | | | 1,556 | | | | 1,296 | | | | 2,337 | | | | 3,633 | | | | 2,014 | |
| | | | | | |
Communities, Disability Services and Seniors | | | 301 | | | | 3,794 | | | | 320 | | | | 152 | | | | 472 | | | | 147 | |
| | | | | | |
Education | | | 45,766 | | | | 20,170 | | | | 4,123 | | | | 17,479 | | | | 21,602 | | | | 28,146 | |
| | | | | | |
Electoral Commission of Queensland | | | — | | | | — | | | | — | | | | — | | | | — | | | | — | |
| | | | | | |
Employment, Small Business and Training | | | 1,843 | | | | 1,037 | | | | 480 | | | | 1,377 | | | | 1,857 | | | | 1,352 | |
| | | | | | |
Environment and Science | | | 2,962 | | | | 9,196 | | | | 772 | | | | 2,767 | | | | 3,539 | | | | 7,422 | |
| | | | | | |
Housing and Public Works | | | 29,558 | | | | 6,135 | | | | 42,149 | | | | 54,570 | | | | 96,719 | | | | 13,516 | |
| | | | | | |
Innovation, Tourism Industry Development and the Commonwealth Games | | | — | | | | — | | | | — | | | | — | | | | — | | | | — | |
| | | | | | |
Justice and Attorney-General | | | 5,012 | | | | 807 | | | | 627 | | | | 1,009 | | | | 1,636 | | | | 7,548 | |
| | | | | | |
Legislative Assembly of Queensland | | | 190 | | | | 107 | | | | 50 | | | | 142 | | | | 192 | | | | 139 | |
| | | | | | |
Local Government, Racing and Multicultural Affairs | | | 88 | | | | 50 | | | | 1,988 | | | | 71 | | | | 2,059 | | | | 70 | |
| | | | | | |
Natural Resources, Mines and Energy | | | 19,108 | | | | 102,613 | | | | 59,170 | | | | 105,533 | | | | 164,703 | | | | 392,262 | |
| | | | | | |
Premier and Cabinet | | | — | | | | — | | | | — | | | | — | | | | — | | | | — | |
| | | | | | |
Public Safety Business Agency3 | | | 14,557 | | | | 6,640 | | | | 9,418 | | | | 11,294 | | | | 20,712 | | | | 9,146 | |
| | | | | | |
Queensland Corrective Services | | | 2,827 | | | | 1,591 | | | | 737 | | | | 2,111 | | | | 2,848 | | | | 109,074 | |
| | | | | | |
Queensland Fire and Emergency Services | | | 390 | | | | 220 | | | | 102 | | | | 292 | | | | 394 | | | | 286 | |
| | | | | | |
Queensland Health | | | 35,648 | | | | 36,056 | | | | 35,348 | | | | 54,465 | | | | 89,813 | | | | 77,271 | |
| | | | | | |
Queensland Police Service | | | 1,366 | | | | 769 | | | | 356 | | | | 1,020 | | | | 1,376 | | | | 1,002 | |
| | | | | | |
Queensland Treasury | | | — | | | | — | | | | — | | | | — | | | | — | | | | — | |
| | | | | | |
State Development, Manufacturing, Infrastructure and Planning | | | 43 | | | | 6,524 | | | | 211 | | | | 5,032 | | | | 5,243 | | | | 4,261 | |
| | | | | | |
Transport and Main Roads | | | 146,918 | | | | 272,191 | | | | 192,335 | | | | 166,320 | | | | 358,655 | | | | 298,455 | |
| | | | | | |
Other Agencies4 | | | 108 | | | | 61 | | | | 28 | | | | 81 | | | | 109 | | | | 79 | |
| | | | | | |
Anticipated Contingency Reserve and Other Adjustments5 | | | | | | | | | | | | | | | | | | | | | | | | |
| | | | | | |
Funds Allocated | | | 298,341 | | | | 452,750 | | | | 344,005 | | | | 411,922 | | | | 755,927 | | | | 918,233 | |
Notes
| 1. | Numbers may not add due to rounding and allocations of adjustments. |
| 2. | Includes all associated statutory bodies. |
| 3. | The Public Safety Business Agency is a capital purchaser for Queensland Fire and Emergency Services, Queensland Police Service and the Office of the Inspector-General Emergency Management. |
| 4. | Includes other Government entities with non-material capital programs. |
| 5. | The Anticipated Contingency Reserve and other adjustments have been spread across statistical areas proportionate to capital spends. |
146
Capital Statement 2018-19
| | | | | | | | | | | | | | | | | | | | | | | | |
| | | Sunshine Coast and Moreton Bay | | | Townsville | | | Totals1 | |
| | | Sunshine | | | Moreton | | | Moreton | | | | | | | | | | |
| | | Coast | | | Bay North | | | Bay South | | | Sub total | | | | | | | |
Entity2 | | $‘000 | | | $‘000 | | | $‘000 | | | $‘000 | | | $‘000 | | | $‘000 | |
| | | | | | |
Aboriginal and Torres Strait Islander Partnerships | | | — | | | | — | | | | — | | | | — | | | | 47 | | | | 6,473 | |
| | | | | | |
Agriculture and Fisheries | | | 1,150 | | | | 1,000 | | | | 20 | | | | 2,170 | | | | 1,400 | | | | 23,191 | |
| | | | | | |
Child Safety, Youth and Women | | | 2,916 | | | | 2,026 | | | | 1,654 | | | | 6,596 | | | | 2,288 | | | | 49,589 | |
| | | | | | |
Communities, Disability Services and Seniors | | | 493 | | | | 148 | | | | 251 | | | | 892 | | | | 149 | | | | 17,001 | |
| | | | | | |
Education | | | 61,081 | | | | 18,567 | | | | 32,198 | | | | 111,846 | | | | 25,335 | | | | 674,301 | |
| | | | | | |
Electoral Commission of Queensland | | | — | | | | — | | | | — | | | | — | | | | — | | | | 3,381 | |
| | | | | | |
Employment, Small Business and Training | | | 1,966 | | | | 1,363 | | | | 1,116 | | | | 4,445 | | | | 27,368 | | | | 57,400 | |
| | | | | | |
Environment and Science | | | 6,503 | | | | 2,190 | | | | 3,193 | | | | 11,886 | | | | 2,198 | | | | 102,391 | |
| | | | | | |
Housing and Public Works | | | 23,021 | | | | 20,918 | | | | 4,443 | | | | 48,382 | | | | 36,373 | | | | 459,662 | |
| | | | | | |
Innovation, Tourism Industry Development and the Commonwealth Games | | | — | | | | — | | | | — | | | | — | | | | — | | | | 196 | |
| | | | | | |
Justice and Attorney-General | | | 1,398 | | | | 970 | | | | 794 | | | | 3,162 | | | | 4,649 | | | | 75,728 | |
| | | | | | |
Legislative Assembly of Queensland | | | 203 | | | | 141 | | | | 115 | | | | 459 | | | | 141 | | | | 9,214 | |
| | | | | | |
Local Government, Racing and Multicultural Affairs | | | 94 | | | | 65 | | | | 53 | | | | 212 | | | | 71 | | | | 3,290 | |
| | | | | | |
Natural Resources, Mines and Energy | | | 130,733 | | | | 6,488 | | | | 36,797 | | | | 174,018 | | | | 192,175 | | | | 2,423,528 | |
| | | | | | |
Premier and Cabinet | | | — | | | | — | | | | — | | | | — | | | | — | | | | 1,047 | |
| | | | | | |
Public Safety Business Agency3 | | | 12,093 | | | | 21,347 | | | | 6,723 | | | | 40,163 | | | | 8,245 | | | | 254,082 | |
| | | | | | |
Queensland Corrective Services | | | 3,015 | | | | 5,559 | | | | 1,711 | | | | 10,285 | | | | 2,099 | | | | 167,752 | |
| | | | | | |
Queensland Fire and Emergency Services | | | 416 | | | | 289 | | | | 236 | | | | 941 | | | | 290 | | | | 5,750 | |
| | | | | | |
Queensland Health | | | 104,023 | | | | 43,083 | | | | 21,457 | | | | 168,563 | | | | 65,447 | | | | 985,479 | |
| | | | | | |
Queensland Police Service | | | 1,457 | | | | 1,010 | | | | 827 | | | | 3,294 | | | | 1,014 | | | | 20,124 | |
| | | | | | |
Queensland Treasury | | | — | | | | — | | | | — | | | | — | | | | — | | | | 739,125 | |
| | | | | | |
State Development, Manufacturing, Infrastructure and Planning | | | 296 | | | | 32 | | | | 26 | | | | 354 | | | | 138,957 | | | | 232,853 | |
| | | | | | |
Transport and Main Roads | | | 398,765 | | | | 65,168 | | | | 60,585 | | | | 524,518 | | | | 255,298 | | | | 3,977,531 | |
| | | | | | |
Other Agencies4 | | | 116 | | | | 80 | | | | 66 | | | | 262 | | | | 80 | | | | 1,596 | |
| | | | | | |
Anticipated Contingency Reserve and Other Adjustments5 | | | | | | | | | | | | | | | | | | | | | | | (369,175 | ) |
| | | | | | |
Funds Allocated | | | 722,842 | | | | 183,612 | | | | 166,085 | | | | 1,072,539 | | | | 736,229 | | | | 9,921,509 | |
Notes
| 1. | Numbers may not add due to rounding and allocations of adjustments. |
| 2. | Includes all associated statutory bodies. |
| 3. | The Public Safety Business Agency is a capital purchaser for Queensland Fire and Emergency Services, Queensland Police Service and the Office of the Inspector-General Emergency Management. |
| 4. | Includes other Government entities with non-material capital programs. |
| 5. | The Anticipated Contingency Reserve and other adjustments have been spread across statistical areas proportionate to capital spends. |
147
Queensland Budget 2018-19 Capital Statement Budget Paper No. 3
Queensland Budget 2018-19
Capital Statement Budget Paper No.3
budget.qld.gov.au
Queensland Budget 2018-19
BUDGET MEASURES
Budget Paper No.4
budget.qld.gov.au
2018-19 Queensland Budget Papers
1. Budget Speech
2. Budget Strategy and Outlook
3. Capital Statement
4. Budget Measures
5. Service Delivery Statements
Appropriation Bills
Budget Highlights
The Budget Papers are available online at budget.qld.gov.au
© Crown copyright
All rights reserved
Queensland Government 2018
Excerpts from this publication may be reproduced, with appropriate
acknowledgement, as permitted under the Copyright Act.
Budget Measures
Budget Paper No.4
ISSN 1445-4890 (Print)
ISSN 1445-4904 (Online)
Budget Measures 2018-19

State Budget
2018-19
Budget Measures
Budget Paper No. 4
Budget Measures 2018-19
Contents
| | | | | | |
| 1 | | Overview | | | 1 | |
| | |
| 1.1 | | Introduction | | | 3 | |
| 1.2 | | Explanation of scope and terms | | | 4 | |
| 1.3 | | Overview | | | 6 | |
| 1.4 | | Government indexation policy | | | 10 | |
| 1.5 | | Funding of election commitments | | | 10 | |
| | |
| 2 | | Expense Measures | | | 28 | |
| | |
| | Introduction | | | 28 | |
| | Department of Aboriginal and Torres Strait Islander Partnerships | | | 29 | |
| | Department of Agriculture and Fisheries | | | 31 | |
| | Department of Child Safety, Youth and Women | | | 35 | |
| | Department of Communities, Disability Services and Seniors | | | 38 | |
| | Department of Education | | | 41 | |
| | Department of Employment, Small Business and Training | | | 43 | |
| | Department of Environment and Science | | | 46 | |
| | Department of Housing and Public Works | | | 55 | |
| | Department of Innovation, Tourism Industry Development and the Commonwealth Games | | | 60 | |
| | Department of Justice and Attorney-General | | | 63 | |
| | Department of Local Government, Racing and Multicultural Affairs | | | 70 | |
| | Department of Natural Resources, Mines and Energy | | | 75 | |
| | Department of State Development, Manufacturing, Infrastructure and Planning | | | 78 | |
| | Department of the Premier and Cabinet | | | 85 | |
| | Department of Transport and Main Roads | | | 87 | |
| | Electoral Commission of Queensland | | | 93 | |
| | Legislative Assembly of Queensland | | | 94 | |
| | Public Safety Business Agency | | | 95 | |
Budget Measures 2018-19
| | | | | | |
| | Public Service Commission | | | 96 | |
| | Queensland Corrective Services | | | 97 | |
| | Queensland Fire and Emergency Services | | | 100 | |
| | Queensland Health | | | 101 | |
| | Queensland Police Service | | | 105 | |
| | Queensland Treasury | | | 109 | |
| | |
| 3 | | Capital Measures | | | 111 | |
| | |
| | Introduction | | | 111 | |
| | Department of Agriculture and Fisheries | | | 112 | |
| | Department of Child Safety, Youth and Women | | | 113 | |
| | Department of Communities, Disability Services and Seniors | | | 114 | |
| | Department of Education | | | 115 | |
| | Department of Employment, Small Business and Training | | | 117 | |
| | Department of Environment and Science | | | 118 | |
| | Department of Housing and Public Works | | | 121 | |
| | Department of Innovation, Tourism Industry Development and the Commonwealth Games | | | 122 | |
| | Department of Justice and Attorney-General | | | 123 | |
| | Department of Local Government, Racing and Multicultural Affairs | | | 124 | |
| | Department of Natural Resources, Mines and Energy | | | 125 | |
| | Department of State Development, Manufacturing, Infrastructure and Planning | | | 126 | |
| | Department of Transport and Main Roads | | | 127 | |
| | Legislative Assembly of Queensland | | | 134 | |
| | Public Safety Business Agency | | | 136 | |
| | Queensland Corrective Services | | | 137 | |
| | Queensland Fire and Emergency Services | | | 138 | |
| | Queensland Health | | | 139 | |
| | Queensland Police Service | | | 141 | |
| | Queensland Treasury | | | 143 | |
Budget Measures 2018-19
| | | | | | |
| | |
| 4 | | Revenue Measures | | | 144 | |
| | |
| | Introduction | | | 144 | |
| | Department of Agriculture and Fisheries | | | 145 | |
| | Department of Education | | | 146 | |
| | Department of Environment and Science | | | 147 | |
| | Department of Natural Resources, Mines and Energy | | | 148 | |
| | Department of Transport and Main Roads | | | 149 | |
| | Queensland Treasury | | | 151 | |
Budget Measures 2018-19
Features
| • | | This Budget Paper presents a consolidation of expense, capital and revenue measures reflecting decisions since the 2017-18 Budget. |
| • | | The 2018-19 Budget measures will support infrastructure, skills and services to promote jobs and build our cities and regional Queensland for the future. |
| • | | The Budget will provide infrastructure to cater to our growing population of five million, drive transformative change, encouraging private investment and making our communities better places to live. |
| • | | Delivering on our election commitments, the Government has provided increased funding of $570.8 million over six years to enhance public hospital capacity and services in the south east Queensland growth corridor, including funding for the redevelopments at the Logan, Caboolture and Ipswich hospitals and to commence planning for the Wide Bay region. Total funding included in the Building Better Hospitals package is $679 million. |
| • | | The Government is also providing increased funding of $554.5 million over four years to support frontline staff, improve health services and meet the ongoing growth in demand for health and ambulance services. |
| • | | Delivering on our election commitment, the Government is providing additional funding of $308 million over six years from 2018-19, bringing total funding to $808 million across seven years to deliver world class learning environments for students and to address enrolment growth pressures through the Building Future Schools Fund. |
| • | | Additional State Government funding of $897.5 million is provided for planning and upgrades to the M1 Pacific Motorway, namely the Varsity Lakes to Tugun and Eight Mile Plains to Daisy Hill upgrades, under 50:50 funding arrangements with the Australian Government. |
| • | | The Government is providing increased funding of $176 million over four years to support the construction of the Rookwood Weir on the Fitzroy River which is being matched by the Australian Government capital contribution of $176 million. This will provide drought contingency supplies for Rockhampton, Gladstone and Yeppoon and support agriculture. |
| • | | The Government has provided increased funding of $50 million from 2017-18 to continue funding programs under the Advance Queensland initiative. Measures funded will include expansion of ‘The Precinct’, the State’s flagship hub for start-ups and support for the Clem Jones Centre for Ageing and Dementia Research, and a range of programs to drive and scale innovation in Queensland including driving the development of key technologies like artificial intelligence, big data, drones and robotics in Queensland industry and programs focussing on innovation and the digital economy in our regions, bringing total funding for this program to $650 million. |
1
Budget Measures 2018-19
| • | | In order to address cost of living pressures, the Electricity Asset Ownership Dividend provides additional funding of $200 million over two years from 2017-18 to deliver electricity bill relief for Queensland households through a $50 electricity rebate in 2017-18 and 2018-19. This initiative is funded from the dividends of Queensland’s Government-owned corporations and forms part of the Government’s $2 billion Affordable Energy Plan. |
| • | | Back to Work has increased funding of $155 million over four years from 2017-18 to extend the regional program to 30 June 2020 to continue to provide employer support payments to employers hiring eligible unemployed jobseekers in regional Queensland. |
| • | | Skilling Queenslanders for Work has increased funding of $180 million over three years from 2018-19 to boost the initiative to fund more apprenticeships and increase workforce participation through a suite of targeted skills and training programs. |
| • | | The Government is providing increased funding of $40 million over four years from 2018-19 and $10.4 million per annum ongoing towards management of the Great Barrier Reef including $26 million over four years and $10.4 million per annum ongoing for the Great Barrier Reef Joint Field Management Program to protect and maintain marine and island ecosystems in the Great Barrier Reef, and $13.8 million over four years from 2018-19 to extend the Queensland Reef Water Quality Program. This will bring total funding to $330 million over five years. |
| • | | The Government is providing increased funding of $4 million over two years to establish a scientific program to support an enhanced Statewide Landcover and Trees Study (SLATS) to identify and report on the condition and extent of regrowth vegetation and inform habitat conservation. |
| • | | The Government is introducing a Waste Disposal Levy of $70 per tonne (higher for regulated waste) increasing $5 per annum, commencing in the first quarter of 2019. The levy will meet the costs of avoiding direct impacts on households and provide funding for industry programs and other environmental priorities of Government. |
| • | | This will include providing additional funding of $100 million over three years for the Resource Recovery Industry Development Program and $32 million in 2018-19 for advance payments to councils to meet the cost of municipal household waste sent to landfill and to avoid any direct impact on households associated with the introduction of the Waste Disposal Levy in the first quarter of 2019. |
| • | | The Government is providing additional funding of $38 million over four years to establish the Disaster Resilience Fund (DRF). The DRF funds local governments, State agencies and non-government organisations to deliver mitigation and resilience projects. |
| • | | The Government has committed to deliver a new $150 million state of the art theatre for Brisbane, investing $125 million over four years from 2018-19. |
| • | | To provide enhanced performance facilities for Queensland Ballet, the Government is providing $14 million over two years towards the refurbishment of the Thomas Dixon Centre. |
2
Budget Measures 2018-19
The purpose of this document is to provide a consolidated view of policy decisions with budgetary impacts made by the Government since the 2017-18 Budget.
This document complements other Budget Papers, in particular Budget Paper No. 2 Budget Strategy and Outlook, Budget Paper No. 3 Capital Statement and the Service Delivery Statements.
This paper includes only new policy decisions and does not detail the full amount of additional funding being provided to agencies to deliver services and infrastructure. Other adjustments, including those that are parameter based and where the funding formula remains unchanged, are similarly excluded.
This paper also sets out the costing of election commitments as published prior to the Election conducted in November 2017.
The total funding impact of new measures is summarised in Tables 1.2 to 1.4 at the conclusion of this chapter.
For details on the total funding available to agencies, refer to agencies’ Service Delivery Statements.
3
Budget Measures 2018-19
| 1.2 | Explanation of scope and terms |
The following is a description of the scope and terms applied in this document.
This document includes measures with the following features:
| • | | Sector. Only Queensland General Government sector agencies are included. Measures involving Government-owned corporations or other Public Non-financial Corporations sector agencies are within scope only if the measures are being funded directly by the General Government sector or if there is a flow through effect (for example, Community Service Obligations). |
| • | | Timeframe. Measures based on decisions made by the Government since the 2017-18 Budget. |
| • | | Type. Measures with budgetary impacts, in particular: |
(i) expense and capital measures with service delivery, capital enhancement, grant or subsidy impacts on the community; and
(ii) revenue measures involving a significant change in revenue policy, including changes in the tax rate.
| • | | Initiatives of a technical nature or non-policy based adjustments, such as parameter based funding adjustments, are not included if the formula to calculate these adjustments has not changed, as they do not reflect changes in Government policy. The main focus is on measures reflecting policy decisions that impact directly on the community through service delivery or other means. |
| • | | Materiality. Minor measures or measures with non-significant community impact are not included in this document. |
Tables in this document are presented on a net funding basis.
| • | | Net funding refers to the impact that the funding of the measure has on appropriations from the Consolidated Fund or centrally held funds to the relevant General Government agency. The tables do not include funding directed to the measure from existing agency resources or other sources. |
| • | | Amounts refer to additional funding being provided to agencies for a particular program or project, as a result of decisions by Government since the 2017-18 Budget. The amount provided for a measure may differ from other Budget papers, such as Budget Paper No. 3 Capital Statement, that may refer to total funding. |
4
Budget Measures 2018-19
| • | | Where a measure involves material expenditure or revenue collections by more than one department, the measure is reported under each department involved. The addition of each individual department’s portion of a particular measure may not equate to the reported total whole-of-Government figure due to the omission of some departments’ portions that did not meet Budget Paper 4’s materiality threshold (i.e. $250,000 over five years). |
| • | | Amounts included in the tables relating to revenue measures represent the impact of the measure on Government revenue (with a positive amount representing additional revenue). |
Tables 1.2 to 1.4 identify expense, capital and revenue measures separately, categorised as follows:
| • | | up to and including 2017-18 Mid-Year Fiscal and Economic Review (MYFER) (which includes 2017 Election Commitments); and |
| • | | since the 2017-18 MYFER. |
5
Budget Measures 2018-19
The following section presents selected measures relating to decisions taken since the 2017-18 Budget.
| 1.3.1 | Delivering infrastructure |
The 2018-19 Budget invests $45.8 billion in infrastructure over the forward estimates including projects such as the Cairns Convention Centre, Cross River Rail, the M1 and Bruce Highway upgrades, Rookwood Weir and Townsville Stadium, representing the biggest capital works program since 2012-13 which was elevated by disaster recovery efforts.
Measures from across Government that will deliver infrastructure for Queensland that will drive the economy, deliver better services and support tens of thousands of Queensland jobs every year include:
| • | | M1 Pacific Motorway: additional funding of $897.5 million is provided for planning and upgrades to the M1 Pacific Motorway |
| • | | Future Proofing the Bruce: additional funding $10 million over two years to develop a 15-year vision and initial Action Plan to identify and prioritise projects to be delivered as part of upgrades to the Bruce Highway and $253.5 million over three years to delivery priority Bruce Highway upgrade projects |
| • | | Building Future Schools Fund: additional funding of $308 million over six years from 2018-19, bringing total funding to $808 million across seven years to deliver world class learning environments for students |
| • | | Rookwood Weir: increased funding of $176 million over four years to support the construction of the Rookwood Weir on the Fitzroy River, which is being matched by the Australian Government capital contribution of $176 million and providing drought contingency supplies for Rockhampton, Gladstone and Yeppoon |
| • | | New Performing Arts Venue at the Queensland Performing Arts Centre: the Government has committed to deliver a new $150 million state of the art theatre for Brisbane, investing $125 million over four years from 2018-19 to build the new performing arts venue at the Queensland Performing Arts Centre, benefiting Queensland artists and audiences |
| • | | Growth Area and Regional Infrastructure Investment Fund: additional funding of $40 million over two years from 2018-19, held centrally, to invest in infrastructure that improves prosperity and liveability for Queenslanders living in outer urban and regional Queensland |
| • | | Beerburrum to Nambour Rail: the Government is providing funding of $160.8 million over four years towards the Beerburrum to Nambour rail duplication project. The Australian Government has provided an initial $390 million over five years towards this measure. |
6
Budget Measures 2018-19
| 1.3.2 | Skills for Queensland jobs |
Measures from across Government that will enhance access to training and jobs for Queenslanders include:
| • | | Skilling Queenslanders for Work: increased funding of $180 million over three years from 2018-19 to boost the initiative to fund more apprenticeships and increase workforce participation through a suite of targeted skills and training programs |
| • | | Back to Work: increased funding of $155 million over four years from 2017-18 to extend the regional program to 30 June 2020 to continue to provide employer support payments to employers hiring eligible unemployed jobseekers in regional Queensland |
| • | | Expansion of the Jobs and Regional Growth Fund: increased funding of $20 million for the Jobs and Regional Growth Fund to help facilitate private sector projects which create employment and economic growth opportunities in regional Queensland by focussing on regions with higher than average unemployment |
| • | | Driving Queensland Agriculture and Rural Jobs Growth: additional funding of $19.2 million over three years to support Queensland agriculture and rural jobs. |
| 1.3.3 | Industry Attraction and Support |
In April 2018, more than a billion people around the world saw the action of the Gold Coast 2018 Commonwealth Games, the biggest event staged in Queensland’s history.
Government and private sector investments valued at approximately $2.6 billion leave a legacy of upgraded transport, sporting and community facilities for use by local communities for the years and decades to come. Griffith University modelling predicts, after taking into account Government’s $1.5 billion investment, the Games will have contributed $2 billion to Gross State Product for the State.
Tourism is a $25 billion industry for Queensland and the 2018-19 Budget includes a range of support to help ensure the State remains a destination of choice for interstate and international visitors. This includes continued funding for Tourism and Events Queensland to attract more visitors through marketing, events and experience development as well as $94.6 million over five years to progress programs under the Growing Tourism, Growing Tourism Jobs initiative including:
| • | | Attracting Tourism Fund: additional funding of $48.6 million to provide incentives to attract new and international airline routes and cruise ships to Queensland |
| • | | Regional Tourism Infrastructure and Experience Development Program: additional funding of $46 million to assist communities to grow tourism by developing new and improved tourism experiences, such as the Wangetti Trail in the State’s Far North, and develop tourism industry capability, including facilitation of outback tourism projects. |
Other initiatives include $26.2 million over four years to attract future major events as part of the Advancing Tourism program, additional funding of $25 million over three years to establish a Reef Resort Rejuvenation Fund to deliver infrastructure for the Great Barrier Reef islands with projects focused on cleaning, greening and growing and $2.2 million to expand the Australian
Workers Heritage Centre at Barcaldine.
7
Budget Measures 2018-19
| 1.3.4 | Protecting the Great Barrier Reef |
To support the reef and manage the impacts of climate change, the Government is investing $330 million over five years. A number of initiatives are outlined in the 2018-19 Budget, including:
| • | | Great Barrier Reef - Joint Field Management Program: increased funding of $26 million over four years and $10.4 million per annum ongoing to protect and maintain marine and island ecosystems in the Great Barrier Reef |
| • | | Great Barrier Reef - Water Quality: increased funding of $13.8 million over four years to extend the Queensland Reef Water Quality Program |
| • | | Climate Change Implementing Queensland’s Response: increased funding of $5.6 million over four years to enhance and strengthen delivery of the Queensland Climate Change Response which will include continued development and implementation of the Government Adaptation Action Plan |
| • | | Enhanced Statewide Landcover and Trees Study: increased funding of $4 million over two years to establish a scientific program to support an enhanced Statewide Landcover and Trees Study to identify and report on the condition and extent of regrowth vegetation and inform habitat conservation. |
In a globally competitive market we need to ensure we are well positioned to grow opportunities for business and industry through innovation and the commercialisation of ideas. Through its flagship Advance Queensland initiative totalling $650 million, the Queensland Government maintains a strong focus on fostering innovation and entrepreneurship to enable Queensland businesses to adapt rapidly to the ever-changing global business environment.
Measures from across Government that will support Queenslanders to participate and succeed in the modern economy include:
| • | | Advance Queensland Foundations for the Future: increased funding of $73 million over four years for the Advance Queensland initiative including $30 million for Ignite Ideas which is helping Queensland startups and small and medium enterprises to succeed |
| • | | Advance Queensland Increase: increased funding of $50 million over five years to continue funding programs including expansion of ‘The Precinct’, the State’s flagship hub for start-ups, support for the Clem Jones Centre for Ageing and Dementia Research, and a range of programs to drive and scale innovation in Queensland |
| • | | Advance Queensland Industry Attraction Fund: $40 million over two years has been provided in the 2018-19 Budget to extend the Advance Queensland Industry Attraction Fund, bringing total funding to $105 million, which will continue to attract interstate and overseas businesses considering moving to Queensland, or Queensland-based businesses interested in expanding. |
8
Budget Measures 2018-19
| 1.3.6 | Supporting Queensland businesses |
Queensland is home to more than 426,000 small businesses which are at the centre of almost every industry sector across the State. The Government has a series of programs and initiatives developed with the aim of providing Queensland businesses the opportunity to grow, support increased job intake and boost the State’s economy. Buy Queensland, introduced in September 2017, prioritises local businesses, jobs and better social outcomes. Since Buy Queensland came into effect, 84% of Queensland Government contracts awarded through QTenders have gone to Queensland businesses.
Measures in the 2018-19 Budget that support Queensland businesses include:
| • | | Business Development Fund: increased funding of $40 million over two years to continue to support the growth of angel and venture capital funding available to Queensland businesses, thereby strengthening Queensland’s entrepreneurial and start-up eco-system |
| • | | EcoBiz Program for Small to Medium Enterprises: increased funding of $3.9 million over four years to continue delivering the ecoBiz program that helps small to medium sized businesses identify and achieve financial savings and eco-efficiency across energy, water and waste |
| • | | Security of Payment for Subcontractors in the Building and Construction Industry: additional funding of $4.6 million over three years including $3.1 million to promote public awareness of the Government’s project bank account reforms to improve security of payment for subcontractors in the building and construction industry. |
9
Budget Measures 2018-19
| 1.4 | Government Indexation Policy |
In order to relieve cost of living pressures, the Queensland Government will move to a CPI-based escalation of fees and charges and the penalty unit from 2019-20 that will replace the previous Government’s policy of an indexation rate of 3.5% per annum which was introduced in 2012-13. From 2019-20 onwards, the CPI is projected to increase by 2.5% per annum, consistent with the mid-point of the Reserve Bank of Australia’s target band. This measure results in a reduction in revenue of $25 million in 2019-20 and $53 million in 2020-21. This change means fees and charges subject to the Government indexation policy, including motor vehicle registration fees, transport and traffic fees and the Emergency Management Levy will only rise at the rate of inflation.
| 1.5 | Funding of election commitments |
Consistent with its measured and responsible management of the State’s finances, the Government offset the cost of its election commitments through a range of measures as outlined in Table 1.1 below.
The total cost of election commitments is defined as where additional funding from the Consolidated Fund has been appropriated to agencies or a funding contingency has been set up centrally. This excludes any costs associated with election commitments that are funded through other means or funded internally by agencies.
Where a decision has been taken since the election, to approve additional funding or reprioritise existing funding for a measure, or a revenue forecast has been revised, the funding shown for a measure in Tables 1.2, 1.3 or 1.4 may not be consistent with the totals set out in Table 1.1.
10
Budget Measures 2018-19
| Table 1.1 | 2017 Election Commitments |
| | | | | | | | | | | | | | | | | | | | |
| | | 2017-18 | | | 2018-19 | | | 2019-20 | | | 2020-21 | | | Total | |
| | | $ million | | | $ million | | | $ million | | | $ million | | | $ million | |
Total cost of election commitments - Recurrent commitments | | | 122.5 | | | | 435.7 | | | | 436.0 | | | | 388.9 | | | | 1,383.0 | |
Savings and Reprioritisation - Additional Foreign Acquirer Duty increase to 7% | | | — | | | | 33.0 | | | | 33.0 | | | | 33.0 | | | | 99.0 | |
Land Tax increase to rate on holdings above $10 million by 2.25% | | | — | | | | 71.0 | | | | 76.0 | | | | 80.0 | | | | 227.0 | |
Motor Vehicle Duty ($2 increase per $100 of dutiable value over $100,000) | | | — | | | | 24.0 | | | | 25.2 | | | | 26.5 | | | | 75.8 | |
Point of Consumption Betting Tax (15% of net wagering revenue) | | | — | | | | 30.0 | | | | 30.0 | | | | 30.0 | | | | 90.0 | |
Reprioritisation 1% (excluding Health)1 | | | 153.4 | | | | 290.4 | | | | 284.3 | | | | 288.8 | | | | 1,016.9 | |
| | | | | | | | | | | | | | | | | | | | |
Total Savings and Reprioritisation | | | 153.4 | | | | 448.4 | | | | 448.6 | | | | 458.2 | | | | 1,508.7 | |
| | | | | | | | | | | | | | | | | | | | |
| | | | | |
Change to Operating Position | | | 30.9 | | | | 12.8 | | | | 12.6 | | | | 69.4 | | | | 125.7 | |
| | | | | | | | | | | | | | | | | | | | |
| | | | | |
Capital commitments | | | 31.7 | | | | 359.1 | | | | 489.6 | | | | 523.9 | | | | 1,404.3 | |
Capital Funding sources and savings | | | 851.0 | | | | 120.3 | | | | 193.8 | | | | 375.0 | | | | 1,540.1 | |
| | | | | | | | | | | | | | | | | | | | |
Net impact on borrowing of capital expenditure and savings measures | | | (819.3 | ) | | | 238.8 | | | | 295.8 | | | | 148.9 | | | | (135.8 | ) |
| | | | | | | | | | | | | | | | | | | | |
| 1. | The Government has implemented a whole-of-Government reprioritisation program to contribute to whole-of-Government priorities. There will be no forced or voluntary redundancy programs in response to reprioritisation measures. |
Note: Totals may not add exactly due to rounding
11
Budget Measures 2018-19
| Table 1.2: | Expense measures since the 2017-18 Budget |
| | | | | | | | | | | | | | | | | | | | |
| | | 2017-18 | | | 2018-19 | | | 2019-20 | | | 2020-21 | | | 2021-22 | |
Expense measures up to and including MYFER | | $‘000 | | | $‘000 | | | $‘000 | | | $‘000 | | | $‘000 | |
| | | | | |
Whole-of-Government Measures | | | | | | | | | | | | | | | | | | | | |
Whole-of-Government reprioritisation | | | (153,399 | ) | | | (290,013 | ) | | | — | | | | — | | | | — | |
| | | | | | | | | | | | | | | | | | | | |
Portfolio Total | | | (153,399 | ) | | | (290,013 | ) | | | — | | | | — | | | | — | |
| | | | | | | | | | | | | | | | | | | | |
| | | | | |
Department of Aboriginal and Torres Strait Islander Partnerships | | | | | | | | | | | | | | | | | | | | |
Cape York Splash Parks1 | | | 4,000 | | | | — | | | | — | | | | — | | | | — | |
Kupai Omasker1 | | | 1,000 | | | | — | | | | — | | | | — | | | | — | |
| | | | | | | | | | | | | | | | | | | | |
Portfolio Total | | | 5,000 | | | | — | | | | — | | | | — | | | | — | |
| | | | | | | | | | | | | | | | | | | | |
| | | | | |
Department of Agriculture and Fisheries | | | | | | | | | | | | | | | | | | | | |
Driving Queensland Agriculture and Rural Jobs Growth | | | — | | | | 7,400 | | | | 7,400 | | | | 4,400 | | | | — | |
10 Year Plan for the National Red Imported Fire Ant Eradication Program in South East Queensland | | | 2,358 | | | | 2,453 | | | | 2,551 | | | | 2,651 | | | | 2,754 | |
Supporting Queensland`s Dairy Producers | | | 360 | | | | 260 | | | | 50 | | | | — | | | | — | |
Panama Disease Tropical Race 4 Program1 | | | 2,751 | | | | 223 | | | | 265 | | | | — | | | | — | |
Bundaberg Fruit Fly Trial | | | 400 | | | | — | | | | — | | | | — | | | | — | |
Paws and Claws Capital Grant | | | — | | | | — | | | | — | | | | — | | | | — | |
| | | | | | | | | | | | | | | | | | | | |
Portfolio Total | | | 5,869 | | | | 10,336 | | | | 10,266 | | | | 7,051 | | | | 2,754 | |
| | | | | | | | | | | | | | | | | | | | |
| | | | | |
Department of Child Safety, Youth and Women | | | | | | | | | | | | | | | | | | | | |
Transition to Success | | | — | | | | 2,500 | | | | — | | | | — | | | | — | |
| | | | | | | | | | | | | | | | | | | | |
Portfolio Total | | | — | | | | 2,500 | | | | — | | | | — | | | | — | |
| | | | | | | | | | | | | | | | | | | | |
| | | | | |
Department of Communities, Disability Services and Seniors | | | | | | | | | | | | | | | | | | | | |
Electricity Asset Ownership Dividend | | | 100,000 | | | | 100,000 | | | | — | | | | — | | | | — | |
Disability Advocates | | | — | | | | 750 | | | | 4,693 | | | | 4,047 | | | | — | |
School Breakfast Program | | | 250 | | | | 250 | | | | 250 | | | | 250 | | | | — | |
Supporting Veterans - Online Portal | | | — | | | | 100 | | | | 100 | | | | — | | | | — | |
| | | | | | | | | | | | | | | | | | | | |
Portfolio Total | | | 100,250 | | | | 101,100 | | | | 5,043 | | | | 4,297 | | | | — | |
| | | | | | | | | | | | | | | | | | | | |
| | | | | |
Department of Education | | | | | | | | | | | | | | | | | | | | |
New Senior Assessment and Tertiary Entrance Systems | | | 3,046 | | | | 7,752 | | | | 6,166 | | | | 2,156 | | | | 2,156 | |
Instrumental Music Program1 | | | — | | | | 3,110 | | | | 4,890 | | | | 6,960 | | | | — | |
Implementation of the Labour Hire Licensing Act 20171 | | | 2,064 | | | | 2,156 | | | | 2,221 | | | | 2,288 | | | | — | |
| | | | | | | | | | | | | | | | | | | | |
Portfolio Total | | | 5,110 | | | | 13,018 | | | | 13,277 | | | | 11,404 | | | | 2,156 | |
| | | | | | | | | | | | | | | | | | | | |
| | | | | |
Department of Employment, Small Business and Training | | | | | | | | | | | | | | | | | | | | |
Back to Work - Extension | | | 20,000 | | | | 45,000 | | | | 45,000 | | | | 45,000 | | | | — | |
Back to Work - Mature Aged Worker Boost | | | 5,000 | | | | — | | | | — | | | | — | | | | — | |
Skilling Queenslanders for Work | | | — | | | | 20,000 | | | | 80,000 | | | | 80,000 | | | | — | |
Supporting Queensland’s Dairy Producers | | | 250 | | | | 40 | | | | — | | | | — | | | | — | |
| | | | | | | | | | | | | | | | | | | | |
Portfolio Total | | | 25,250 | | | | 65,040 | | | | 125,000 | | | | 125,000 | | | | — | |
| | | | | | | | | | | | | | | | | | | | |
12
Budget Measures 2018-19
| | | | | | | | | | | | | | | | | | | | |
| | | 2017-18 | | | 2018-19 | | | 2019-20 | | | 2020-21 | | | 2021-22 | |
Expense measures up to and including MYFER | | $‘000 | | | $‘000 | | | $‘000 | | | $‘000 | | | $‘000 | |
| | | | | |
Department of Environment and Science | | | | | | | | | | | | | | | | | | | | |
Queensland Cultural Centre - Electricity Supplementation and Future Energy Efficiency | | | 1,744 | | | | 1,800 | | | | — | | | | — | | | | — | |
Government Action on North Stradbroke Island (Minjerribah) | | | 1,352 | | | | 1,280 | | | | 1,350 | | | | 1,350 | | | | 1,350 | |
National Parks Harsh Environment Fire Vehicles | | | — | | | | 804 | | | | — | | | | — | | | | — | |
Protected Area Estate | | | 153 | | | | 102 | | | | 155 | | | | 125 | | | | 130 | |
Panama Disease Tropical Race 4 Program | | | 100 | | | | 100 | | | | 100 | | | | — | | | | — | |
Climate Change - Implementing Queensland’s Response1 | | | — | | | | — | | | | — | | | | — | | | | — | |
Container Refund Scheme | | | 1,500 | | | | — | | | | — | | | | — | | | | — | |
Heritage Property - Urgent Remedial Conservation Works | | | — | | | | — | | | | — | | | | — | | | | — | |
Protected Area Estate - Acquisition | | | — | | | | — | | | | — | | | | — | | | | — | |
Reef Island Decarbonisation | | | 1,730 | | | | — | | | | — | | | | — | | | | — | |
Waste Investigation | | | 846 | | | | — | | | | — | | | | — | | | | — | |
Woodfordia Infrastructure Upgrade | | | 1,000 | | | | — | | | | — | | | | — | | | | — | |
| | | | | | | | | | | | | | | | | | | | |
Portfolio Total | | | 8,425 | | | | 4,086 | | | | 1,605 | | | | 1,475 | | | | 1,480 | |
| | | | | | | | | | | | | | | | | | | | |
| | | | | |
Department of Housing and Public Works | | | | | | | | | | | | | | | | | | | | |
Sports Grant Funding Boost | | | — | | | | 7,982 | | | | 2,450 | | | | — | | | | — | |
Underwood Sports Park | | | 4,110 | | | | 5,000 | | | | — | | | | — | | | | — | |
Safe, secure sporting and entertainment facilities | | | 5,800 | | | | 2,500 | | | | — | | | | — | | | | — | |
Zillmere Sports Centre | | | 500 | | | | 2,000 | | | | 3,000 | | | | — | | | | — | |
Security of Payment for Subcontractors in the Building and Construction Industry | | | 2,620 | | | | 1,000 | | | | 1,000 | | | | — | | | | — | |
Building and Asset Services Apprenticeship Program and Compliance with the Queensland Government Building and Construction Training Policy | | | 1,000 | | | | 800 | | | | 800 | | | | — | | | | — | |
Non Conforming Building Products Audit Taskforce | | | 4,462 | | | | 393 | | | | — | | | | — | | | | — | |
University of the Sunshine Coast Stadium | | | 7,000 | | | | — | | | | — | | | | — | | | | — | |
| | | | | | | | | | | | | | | | | | | | |
Portfolio Total | | | 25,492 | | | | 19,675 | | | | 7,250 | | | | — | | | | — | |
| | | | | | | | | | | | | | | | | | | | |
| | | | | |
Department of Innovation, Tourism Industry Development and the Commonwealth Games | | | | | | | | | | | | | | | | | | | | |
Making Queensland Australia’s Events Capital | | | — | | | | 7,500 | | | | 12,000 | | | | 16,500 | | | | — | |
Growing Tourism, Growing Tourism Jobs1 | | | 9,000 | | | | 18,200 | | | | 24,700 | | | | 32,700 | | | | — | |
Advance Queensland Foundations of the Future | | | — | | | | 15,900 | | | | 16,000 | | | | 18,000 | | | | 23,150 | |
Great Barrier Reef Island Rejuvenation Package | | | 5,000 | | | | 10,000 | | | | 10,000 | | | | — | | | | — | |
Major Events Funding1 | | | 10,715 | | | | 4,850 | | | | 5,276 | | | | 5,314 | | | | — | |
| | | | | | | | | | | | | | | | | | | | |
Portfolio Total | | | 24,715 | | | | 56,450 | | | | 67,976 | | | | 72,514 | | | | 23,150 | |
| | | | | | | | | | | | | | | | | | | | |
| | | | | |
Department of Local Government, Racing and Multicultural Affairs | | | | | | | | | | | | | | | | | | | | |
Works for Queensland | | | — | | | | 50,000 | | | | 75,000 | | | | 75,000 | | | | — | |
Support for Country Racing | | | 11,600 | | | | 12,600 | | | | 13,600 | | | | 17,600 | | | | — | |
Celebrating Multicultural Queensland Grants Program | | | — | | | | 1,000 | | | | 1,000 | | | | 1,000 | | | | — | |
Show Society Grants Program1 | | | 50 | | | | 80 | | | | 120 | | | | 150 | | | | — | |
Ayr Nature-Based Playground | | | 1,500 | | | | — | | | | — | | | | — | | | | — | |
Beautiful Bowen | | | 5,000 | | | | — | | | | — | | | | — | | | | — | |
13
Budget Measures 2018-19
| | | | | | | | | | | | | | | | | | | | |
| | | 2017-18 | | | 2018-19 | | | 2019-20 | | | 2020-21 | | | 2021-22 | |
Expense measures up to and including MYFER | | $‘000 | | | $‘000 | | | $‘000 | | | $‘000 | | | $‘000 | |
| | | | | |
Mount Archer Master Plan | | | 400 | | | | — | | | | — | | | | — | | | | — | |
Support for Refugees and Asylum Seekers1 | | | 700 | | | | — | | | | — | | | | — | | | | — | |
| | | | | | | | | | | | | | | | | | | | |
Portfolio Total | | | 19,250 | | | | 63,680 | | | | 89,720 | | | | 93,750 | | | | — | |
| | | | | | | | | | | | | | | | | | | | |
| | | | | |
Department of Natural Resources, Mines and Energy | | | | | | | | | | | | | | | | | | | | |
Solar Thermal Plant Capital Contribution | | | — | | | | 50,000 | | | | — | | | | — | | | | — | |
Affordable Energy Plan | | | 18,200 | | | | 27,000 | | | | 24,800 | | | | — | | | | — | |
Coal Mine Workers’ Health Scheme | | | 7,565 | | | | 9,468 | | | | — | | | | — | | | | — | |
Gas Action Plan | | | 3,181 | | | | 936 | | | | 300 | | | | — | | | | — | |
Extending Existing Drought Relief Arrangements1 | | | — | | | | — | | | | — | | | | — | | | | — | |
Government Action on North Stradbroke Island (Minjerribah) | | | — | | | | — | | | | — | | | | — | | | | — | |
| | | | | | | | | | | | | | | | | | | | |
Portfolio Total | | | 28,946 | | | | 87,404 | | | | 25,100 | | | | — | | | | — | |
| | | | | | | | | | | | | | | | | | | | |
| | | | | |
Department of State Development, Manufacturing, Infrastructure and Planning | | | | | | | | | | | | | | | | | | | | |
Building our Regions | | | — | | | | 35,000 | | | | 17,500 | | | | 17,500 | | | | — | |
Queensland Made | | | 4,000 | | | | 10,000 | | | | 13,000 | | | | 13,000 | | | | — | |
Queensland Reconstruction Authority Bluewater Trail and Queens Park Revitalisation | | | — | | | | 8,864 | | | | — | | | | — | | | | — | |
Government Action on North Stradbroke Island (Minjerribah) - Economic Transition Strategy | | | 1,500 | | | | 3,250 | | | | — | | | | — | | | | — | |
Strong and Sustainable Resources | | | 200 | | | | 2,300 | | | | — | | | | — | | | | — | |
Government Action on North Stradbroke Island (Minjerribah) - One Mile Infrastructure Works | | | — | | | | 500 | | | | 500 | | | | — | | | | — | |
Advance Queensland Industry Attraction Fund | | | — | | | | — | | | | — | | | | — | | | | — | |
Expansion of the Jobs and Regional Growth Fund | | | — | | | | — | | | | — | | | | — | | | | — | |
Government Action on North Stradbroke Island (Minjerribah) - Bushfire Management Plans | | | 900 | | | | — | | | | — | | | | — | | | | — | |
Made in Queensland | | | 5,000 | | | | — | | | | 10,000 | | | | 5,000 | | | | — | |
| | | | | | | | | | | | | | | | | | | | |
Portfolio Total | | | 11,600 | | | | 59,914 | | | | 41,000 | | | | 35,500 | | | | — | |
| | | | | | | | | | | | | | | | | | | | |
| | | | | |
Department of the Premier and Cabinet | | | | | | | | | | | | | | | | | | | | |
Screen Queensland Production Attraction Strategy | | | 10,000 | | | | 10,000 | | | | — | | | | — | | | | — | |
| | | | | | | | | | | | | | | | | | | | |
Portfolio Total | | | 10,000 | | | | 10,000 | | | | — | | | | — | | | | — | |
| | | | | | | | | | | | | | | | | | | | |
| | | | | |
Department of Transport and Main Roads | | | | | | | | | | | | | | | | | | | | |
Eastern Transitway1 | | | 2,000 | | | | 12,000 | | | | 8,000 | | | | — | | | | — | |
Station Upgrades and Park‘n’Ride facilities | | | 1,860 | | | | 9,570 | | | | 21,290 | | | | 32,460 | | | | 42,459 | |
Bus Driver Wage Parity in Cairns and Sunshine Coast | | | 2,082 | | | | 1,466 | | | | — | | | | — | | | | — | |
Queensland Walking Strategy1 | | | 400 | | | | 700 | | | | 1,000 | | | | 400 | | | | — | |
Beams Road Overpass Investigation1 | | | 400 | | | | — | | | | — | | | | — | | | | — | |
Future Proofing the Bruce | | | — | | | | — | | | | 5,000 | | | | 5,000 | | | | — | |
M1 Pacific Motorway - Eight Mile Plains to Logan Motorway Planning | | | — | | | | — | | | | 8,000 | | | | 8,000 | | | | — | |
New Generation Rollingstock Business Operating Model | | | 9,250 | | | | — | | | | — | | | | — | | | | — | |
| | | | | | | | | | | | | | | | | | | | |
Portfolio Total | | | 15,992 | | | | 23,736 | | | | 43,290 | | | | 45,860 | | | | 42,459 | |
| | | | | | | | | | | | | | | | | | | | |
14
Budget Measures 2018-19
| | | | | | | | | | | | | | | | | | | | |
| | | 2017-18 | | | 2018-19 | | | 2019-20 | | | 2020-21 | | | 2021-22 | |
Expense measures up to and including MYFER | | $‘000 | | | $‘000 | | | $‘000 | | | $‘000 | | | $‘000 | |
| | | | | |
Legislative Assembly of Queensland | | | | | | | | | | | | | | | | | | | | |
2017 Electoral Boundary Redistribution and Election1 | | | 292 | | | | 480 | | | | 480 | | | | 480 | | | | 480 | |
Parliamentary Annexe Lift Upgrade Program | | | 60 | | | | 60 | | | | 60 | | | | 60 | | | | 60 | |
| | | | | | | | | | | | | | | | | | | | |
Portfolio Total | | | 352 | | | | 540 | | | | 540 | | | | 540 | | | | 540 | |
| | | | | | | | | | | | | | | | | | | | |
| | | | | |
Queensland Corrective Services | | | | | | | | | | | | | | | | | | | | |
Borallon Training and Correctional Centre - Final Stage Recommissioning | | | 600 | | | | 6,941 | | | | 6,941 | | | | 6,941 | | | | 6,941 | |
| | | | | | | | | | | | | | | | | | | | |
Portfolio Total | | | 600 | | | | 6,941 | | | | 6,941 | | | | 6,941 | | | | 6,941 | |
| | | | | | | | | | | | | | | | | | | | |
| | | | | |
Queensland Fire and Emergency Services | | | | | | | | | | | | | | | | | | | | |
Additional Firefighters | | | — | | | | 3,590 | | | | 6,070 | | | | 8,670 | | | | 11,202 | |
Non Conforming Building Products Audit Task Force | | | 504 | | | | 50 | | | | — | | | | — | | | | — | |
| | | | | | | | | | | | | | | | | | | | |
Portfolio Total | | | 504 | | | | 3,640 | | | | 6,070 | | | | 8,670 | | | | 11,202 | |
| | | | | | | | | | | | | | | | | | | | |
| | | | | |
Queensland Health | | | | | | | | | | | | | | | | | | | | |
Specialist Outpatient Strategy | | | — | | | | 77,360 | | | | 77,360 | | | | — | | | | — | |
Nurse Navigators | | | — | | | | — | | | | 53,904 | | | | 55,663 | | | | — | |
Midwives | | | 13,700 | | | | 14,100 | | | | 14,400 | | | | 14,800 | | | | — | |
Deadly Choices Healthy Lifestyle Program | | | 8,000 | | | | 8,000 | | | | — | | | | — | | | | — | |
Rockhampton Drug Treatment and Rehabilitation Facility | | | — | | | | — | | | | 1,480 | | | | 3,320 | | | | | |
Building Better Hospitals - Cancer Council Queensland Lodges | | | — | | | | 5,000 | | | | — | | | | — | | | | — | |
Queensland Ambulance Service - Classification Structure | | | 33,980 | | | | 57,997 | | | | 100,087 | | | | 107,630 | | | | 107,630 | |
| | | | | | | | | | | | | | | | | | | | |
Portfolio Total | | | 55,680 | | | | 162,457 | | | | 247,231 | | | | 181,413 | | | | 107,630 | |
| | | | | | | | | | | | | | | | | | | | |
| | | | | |
Queensland Police Service | | | | | | | | | | | | | | | | | | | | |
Increased Counter-Terrorism Capability | | | 5,466 | | | | 15,695 | | | | 16,158 | | | | 16,531 | | | | 16,910 | |
Police Officers | | | — | | | | 12,574 | | | | 31,817 | | | | 51,998 | | | | 73,155 | |
Tackling Alcohol Fuelled Violence - Safe Night Precincts | | | 2,500 | | | | 5,000 | | | | 5,000 | | | | 5,000 | | | | 2,500 | |
GPS Tracking of Defendants on Bail | | | 749 | | | | 2,572 | | | | — | | | | — | | | | — | |
Additional QLiTE Devices | | | — | | | | 1,950 | | | | 1,970 | | | | 2,000 | | | | — | |
| | | | | | | | | | | | | | | | | | | | |
Portfolio Total | | | 8,715 | | | | 37,791 | | | | 54,945 | | | | 75,529 | | | | 92,565 | |
| | | | | | | | | | | | | | | | | | | | |
| | | | | |
Queensland Treasury | | | | | | | | | | | | | | | | | | | | |
Extension to First Home Owners’ Grant | | | 19,600 | | | | 32,000 | | | | — | | | | — | | | | — | |
Move Up In The World - Attracting Business Investment and Migration to Queensland | | | 1,000 | | | | — | | | | — | | | | — | | | | — | |
| | | | | | | | | | | | | | | | | | | | |
Portfolio Total | | | 20,600 | | | | 32,000 | | | | — | | | | — | | | | — | |
| | | | | | | | | | | | | | | | | | | | |
| | | | | |
Total impact on Expense up to and including MYFER | | | 218,951 | | | | 470,295 | | | | 745,254 | | | | 669,944 | | | | 290,877 | |
15
Budget Measures 2018-19
| | | | | | | | | | | | | | | | | | | | |
| | | 2017-18 | | | 2018-19 | | | 2019-20 | | | 2020-21 | | | 2021-22 | |
Expense measures since 2017-18 MYFER | | $‘000 | | | $‘000 | | | $‘000 | | | $‘000 | | | $‘000 | |
| | | | | |
Department of Aboriginal and Torres Strait Islander Partnerships | | | | | | | | | | | | | | | | | | | | |
Cape York Splash Parks2 | | | (4,000 | ) | | | 4,000 | | | | — | | | | — | | | | — | |
Work History Research and Legal Services | | | — | | | | 3,301 | | | | 301 | | | | 110 | | | | — | |
Kowanyama Men’s Shed and Women’s Meeting Place | | | — | | | | 1,476 | | | | 388 | | | | 403 | | | | 416 | |
Kupai Omasker2 | | | (800 | ) | | | 597 | | | | 203 | | | | — | | | | — | |
Aurukun Women’s Initiative | | | — | | | | — | | | | — | | | | — | | | | — | |
| | | | | | | | | | | | | | | | | | | | |
Portfolio Total | | | (4,800 | ) | | | 9,374 | | | | 892 | | | | 513 | | | | 416 | |
| | | | | | | | | | | | | | | | | | | | |
| | | | | |
Department of Agriculture and Fisheries | | | | | | | | | | | | | | | | | | | | |
Panama Disease Tropical Race 4 Program2 | | | — | | | | 2,058 | | | | — | | | | — | | | | — | |
Shark Control Program | | | — | | | | 316 | | | | 457 | | | | 548 | | | | 731 | |
Restoration of Waaje Fire Tower | | | — | | | | 300 | | | | 200 | | | | — | | | | — | |
Extending Existing Drought Relief Arrangements | | | — | | | | — | | | | — | | | | — | | | | — | |
| | | | | | | | | | | | | | | | | | | | |
Portfolio Total | | | — | | | | 2,674 | | | | 657 | | | | 548 | | | | 731 | |
| | | | | | | | | | | | | | | | | | | | |
| | | | | |
Department of Child Safety, Youth and Women | | | | | | | | | | | | | | | | | | | | |
Youth Justice - Youth Detention Capacity and Planning | | | 216 | | | | 10,384 | | | | — | | | | — | | | | — | |
Youth Justice - Reducing Remand of Children and Young People in Custody | | | — | | | | 2,469 | | | | 6,471 | | | | 2,712 | | | | — | |
Supporting Children and Young People with Complex and Challenging Behaviours | | | 20,000 | | | | 20,000 | | | | — | | | | — | | | | — | |
Replacement of Integrated Client Management System | | | — | | | | 4,300 | | | | — | | | | — | | | | — | |
Office of the Child and Family Official Solicitor | | | — | | | | 3,320 | | | | — | | | | — | | | | — | |
Domestic and Family Violence Response - Specialist Domestic and Family Violence Courts | | | | | | | 274 | | | | 463 | | | | 463 | | | | 463 | |
National Redress Scheme | | | — | | | | — | | | | — | | | | — | | | | — | |
| | | | | | | | | | | | | | | | | | | | |
Portfolio Total | | | 20,216 | | | | 40,747 | | | | 6,934 | | | | 3,175 | | | | 463 | |
| | | | | | | | | | | | | | | | | | | | |
| | | | | |
Department of Communities, Disability Services and Seniors | | | | | | | | | | | | | | | | | | | | |
Community Nursing and Allied Health Services | | | — | | | | 10,000 | | | | — | | | | — | | | | — | |
Tackling Alcohol Fuelled Violence Program - Safe Night Precinct Support Services | | | — | | | | 3,324 | | | | — | | | | — | | | | — | |
National Disability Insurance Scheme - National Clearance Database | | | — | | | | 917 | | | | 180 | | | | 136 | | | | | |
| | | | | | | | | | | | | | | | | | | | |
Portfolio Total | | | — | | | | 14,241 | | | | 180 | | | | 136 | | | | — | |
| | | | | | | | | | | | | | | | | | | | |
| | | | | |
Department of Education | | | | | | | | | | | | | | | | | | | | |
Non-State School Capital Grants | | | — | | | | 45,000 | | | | 45,000 | | | | 45,000 | | | | — | |
Implementation of the Labour Hire Licensing Act 20172 | | | — | | | | — | | | | — | | | | — | | | | 2,357 | |
Youth Justice - Assessment of Education Needs at Brisbane and Townsville Courts | | | — | | | | — | | | | — | | | | — | | | | — | |
Instrumental Music Program2 | | | — | | | | (2,019 | ) | | | (1,976 | ) | | | (2,159 | ) | | | 5,610 | |
| | | | | | | | | | | | | | | | | | | | |
Portfolio Total | | | — | | | | 42,981 | | | | 43,024 | | | | 42,841 | | | | 7,967 | |
| | | | | | | | | | | | | | | | | | | | |
16
Budget Measures 2018-19
| | | | | | | | | | | | | | | | | | | | |
| | | 2017-18 | | | 2018-19 | | | 2019-20 | | | 2020-21 | | | 2021-22 | |
Expense measures since 2017-18 MYFER | | $‘000 | | | $‘000 | | | $‘000 | | | $‘000 | | | $‘000 | |
| | | | | |
Department of Employment, Small Business and Training | | | | | | | | | | | | | | | | | | | | |
Back to Work - South East Queensland | | | — | | | | 15,100 | | | | 10,250 | | | | 6,150 | | | | — | |
Creating your Future Job | | | — | | | | 1,000 | | | | — | | | | — | | | | — | |
Enhancing how Government and Small Business Participate in Regulatory Reform | | | — | | | | 350 | | | | 250 | | | | 250 | | | | 250 | |
| | | | | | | | | | | | | | | | | | | | |
Portfolio Total | | | — | | | | 16,450 | | | | 10,500 | | | | 6,400 | | | | 250 | |
| | | | | | | | | | | | | | | | | | | | |
| | | | | |
Department of Environment and Science | | | | | | | | | | | | | | | | | | | | |
Waste Disposal Levy - Advance Payments to Councils | | | — | | | | 31,975 | | | | — | | | | — | | | | — | |
Waste Disposal Levy - Implementation and operational costs | | | 200 | | | | 15,000 | | | | 6,180 | | | | 6,365 | | | | 6,556 | |
State Library of Queensland - First 5 Forever Reading Program | | | — | | | | 5,000 | | | | 5,000 | | | | 5,000 | | | | 5,000 | |
Great Barrier Reef - Joint Field Management Program Intergovernmental Agreement Commitment | | | — | | | | 4,058 | | | | 3,900 | | | | 7,650 | | | | 10,400 | |
Great Barrier Reef - Water Quality | | | — | | | | 2,591 | | | | 5,889 | | | | 3,200 | | | | 2,160 | |
Queensland Performing Arts Centre | | | — | | | | 2,000 | | | | 2,000 | | | | 2,000 | | | | 2,000 | |
Vegetation Management - Enhanced Statewide Landcover and Trees Study | | | — | | | | 1,998 | | | | 1,985 | | | | — | | | | — | |
Continuation of Compliance and Rehabilitation Action | | | — | | | | 1,859 | | | | — | | | | — | | | | — | |
Climate Change - Implementing Queensland’s Response2 | | | — | | | | 1,300 | | | | 1,500 | | | | 1,500 | | | | 1,300 | |
EcoBiz Program for Small to Medium Enterprises - Continued Delivery | | | — | | | | 943 | | | | 971 | | | | 1,000 | | | | 1,031 | |
Springvale Station Nature Refuge Management | | | — | | | | 509 | | | | 717 | | | | 746 | | | | 756 | |
Queensland Conservation Council - Increased Support | | | — | | | | 350 | | | | 350 | | | | 350 | | | | 350 | |
Queensland Art Gallery/ Gallery of Modern Art Exhibitions | | | — | | | | — | | | | — | | | | 3,000 | | | | 3,000 | |
Rockhampton Art Gallery | | | — | | | | — | | | | — | | | | — | | | | — | |
| | | | | | | | | | | | | | | | | | | | |
Portfolio Total | | | 200 | | | | 67,583 | | | | 28,492 | | | | 30,811 | | | | 32,553 | |
| | | | | | | | | | | | | | | | | | | | |
| | | | | |
Department of Housing and Public Works | | | | | | | | | | | | | | | | | | | | |
Responsive Government - Service Transformation | | | — | | | | 8,820 | | | | — | | | | — | | | | — | |
Embedding Procurement Reform | | | — | | | | 535 | | | | 535 | | | | 535 | | | | 535 | |
Thomas Dixon Centre Refurbishment | | | — | | | | 500 | | | | — | | | | — | | | | — | |
Local Sporting Infrastructure | | | — | | | | — | | | | — | | | | — | | | | — | |
Youth Justice - Youth and Family Head Leases | | | — | | | | — | | | | — | | | | — | | | | — | |
| | | | | | | | | | | | | | | | | | | | |
Portfolio Total | | | — | | | | 9,855 | | | | 535 | | | | 535 | | | | 535 | |
| | | | | | | | | | | | | | | | | | | | |
| | | | | |
Department of Innovation, Tourism Industry Development and the Commonwealth Games | | | | | | | | | | | | | | | | | | | | |
Continuation of the Funding Guarantee for Tourism and Events Queensland | | | — | | | | — | | | | — | | | | — | | | | 46,875 | |
Advance Queensland Increase | | | 18,000 | | | | 8,000 | | | | 8,000 | | | | 8,000 | | | | 8,000 | |
Growing Tourism, Growing Tourism Jobs2 | | | — | | | | 2,500 | | | | 2,500 | | | | 2,500 | | | | 2,500 | |
Australian Workers Heritage Centre | | | 500 | | | | 1,700 | | | | — | | | | — | | | | — | |
Major Events Funding2 | | | (1,335 | ) | | | 400 | | | | 250 | | | | — | | | | — | |
| | | | | | | | | | | | | | | | | | | | |
Portfolio Total | | | 17,165 | | | | 12,600 | | | | 10,750 | | | | 10,500 | | | | 57,375 | |
| | | | | | | | | | | | | | | | | | | | |
| | | | | |
Department of Justice and Attorney-General | | | | | | | | | | | | | | | | | | | | |
Blue Card Services Efficiency Savings | | | — | | | | 5,000 | | | | — | | | | — | | | | — | |
Blue Card Services ‘No Card, No Start’ | | | — | | | | 3,050 | | | | 2,775 | | | | 1,420 | | | | | |
Queensland Courts and Justice Services | | | — | | | | 10,000 | | | | — | | | | — | | | | — | |
17
Budget Measures 2018-19
| | | | | | | | | | | | | | | | | | | | |
| | | 2017-18 | | | 2018-19 | | | 2019-20 | | | 2020-21 | | | 2021-22 | |
Expense measures since 2017-18 MYFER | | $‘000 | | | $‘000 | | | $‘000 | | | $‘000 | | | $‘000 | |
| | | | | |
Victim Assist Queensland | | | — | | | | 5,700 | | | | 5,700 | | | | — | | | | — | |
Gambling Help Service System | | | — | | | | 5,277 | | | | 5,295 | | | | 5,314 | | | | 5,333 | |
Office of the Director of Public Prosecutions | | | — | | | | 5,000 | | | | — | | | | — | | | | — | |
Director of Child Protection Litigation | | | — | | | | 4,630 | | | | — | | | | — | | | | — | |
Crime and Corruption Commission - Digital Investigative and Information Security Services | | | — | | | | 3,374 | | | | 3,593 | | | | 3,792 | | | | 3,897 | |
Recording and Transcription Services | | | — | | | | 2,881 | | | | 6,494 | | | | 4,646 | | | | — | |
Office of the Public Guardian and Queensland Civil and Administrative Tribunal | | | — | | | | 2,500 | | | | — | | | | — | | | | — | |
Tackling Alcohol Fuelled Violence Program - Safe Night Precincts | | | — | | | | 2,042 | | | | — | | | | — | | | | — | |
Queensland Sentencing Advisory Council | | | — | | | | 1,851 | | | | 1,638 | | | | 1,677 | | | | 1,717 | |
Crime and Corruption Commission - Investigative Capability | | | — | | | | 1,792 | | | | 1,832 | | | | 1,872 | | | | 1,913 | |
Specialist Courts - Murri Court and Court Link | | | — | | | | 1,703 | | | | 2,408 | | | | 2,482 | | | | 2,527 | |
Aurukun Restorative Justice Program | | | — | | | | 910 | | | | — | | | | — | | | | — | |
Office of the Information Commissioner | | | — | | | | 598 | | | | 613 | | | | 628 | | | | 644 | |
Queensland Family and Child Commission | | | — | | | | 396 | | | | — | | | | — | | | | — | |
Domestic and Family Violence Response - Specialist Domestic and Family | | | — | | | | — | | | | — | | | | — | | | | — | |
Violence Courts | | | — | | | | 264 | | | | 459 | | | | 463 | | | | 468 | |
Coroners Court of Queensland | | | — | | | | 258 | | | | — | | | | — | | | | — | |
Anti-Discrimination Commission Queensland - Human Rights Act for Queensland | | | — | | | | 244 | | | | 834 | | | | 604 | | | | 616 | |
| | | | | | | | | | | | | | | | | | | | |
Portfolio Total | | | — | | | | 57,470 | | | | 31,641 | | | | 22,898 | | | | 17,115 | |
| | | | | | | | | | | | | | | | | | | | |
| | | | | |
Department of Local Government, Racing and Multicultural Affairs | | | | | | | | | | | | | | | | | | | | |
Torres Shire Water Treatment Infrastructure Upgrade | | | — | | | | 4,500 | | | | 7,500 | | | | — | | | | — | |
Building Integrity and Sustainability in Local Government | | | — | | | | 3,967 | | | | 3,360 | | | | 3,382 | | | | 3,416 | |
Torres Strait and Palm Island Car and Waste Metal Removal | | | — | | | | 2,500 | | | | 2,500 | | | | — | | | | — | |
Implementing More Effective Funding Grants to Local Government | | | — | | | | 1,700 | | | | 500 | | | | 500 | | | | 500 | |
Kowanyama Aboriginal Shire Council Economic Growth and Jobs Initiative | | | — | | | | 1,100 | | | | — | | | | — | | | | — | |
State Government Financial Aid - Indexation | | | — | | | | 759 | | | | 1,536 | | | | 2,334 | | | | 3,241 | |
Show Society Grants Program2 | | | (50 | ) | | | 53 | | | | 13 | | | | (16 | ) | | | — | |
Support for Refugees and Asylum Seekers2 | | | — | | | | — | | | | — | | | | — | | | | — | |
Torres Strait Islands Seawalls and Coastal Inundation Mitigation Upgrades | | | — | | | | — | | | | — | | | | — | | | | — | |
| | | | | | | | | | | | | | | | | | | | |
Portfolio Total | | | (50 | ) | | | 14,579 | | | | 15,409 | | | | 6,200 | | | | 7,157 | |
| | | | | | | | | | | | | | | | | | | | |
| | | | | |
Department of Natural Resources, Mines and Energy | | | | | | | | | | | | | | | | | | | | |
Coal Seam Gas Compliance Unit | | | — | | | | 3,369 | | | | — | | | | — | | | | — | |
Queensland Water Regional Alliance Program | | | — | | | | 1,050 | | | | 1,050 | | | | 1,050 | | | | 1,050 | |
Extending Existing Drought Relief Arrangements2 | | | — | | | | — | | | | — | | | | — | | | | — | |
Linc Energy Mine Site | | | — | | | | — | | | | — | | | | — | | | | — | |
| | | | | | | | | | | | | | | | | | | | |
Portfolio Total | | | — | | | | 4,419 | | | | 1,050 | | | | 1,050 | | | | 1,050 | |
| | | | | | | | | | | | | | | | | | | | |
| | | | | |
Department of State Development, Manufacturing, Infrastructure and Planning | | | | | | | | | | | | | | | | | | | | |
Resource Recovery Industry Development Program | | | — | | | | 30,000 | | | | 50,000 | | | | 20,000 | | | | — | |
Queensland Reconstruction Authority Disaster Resilience Fund | | | — | | | | 9,500 | | | | 9,500 | | | | 9,500 | | | | 9,500 | |
Advancing Queensland’s Biofuture (Biofutures Acceleration Program II) | | | — | | | | 5,000 | | | | — | | | | — | | | | — | |
18
Budget Measures 2018-19
| | | | | | | | | | | | | | | | | | | | |
| | | 2017-18 | | | 2018-19 | | | 2019-20 | | | 2020-21 | | | 2021-22 | |
Expense measures since 2017-18 MYFER | | $‘000 | | | $‘000 | | | $‘000 | | | $‘000 | | | $‘000 | |
| | | | | |
Queensland Reconstruction Authority Whitsunday Regional Council Administration Building | | | — | | | | 4,500 | | | | 500 | | | | — | | | | — | |
Queensland Reconstruction Authority Beach Restoration and Mitigation | | | — | | | | 3,562 | | | | 1,000 | | | | — | | | | — | |
Queensland Reconstruction Authority Disaster Recovery Services Donation Management | | | — | | | | 400 | | | | 400 | | | | 400 | | | | — | |
Gasfields Commission Queensland Implementation of Government recommendations arising from the Scott Review | | | — | | | | — | | | | — | | | | — | | | | — | |
Hydrogen Industry and Energy Opportunity | | | — | | | | — | | | | — | | | | — | | | | — | |
| | | | | | | | | | | | | | | | | | | | |
Portfolio Total | | | — | | | | 52,962 | | | | 61,400 | | | | 29,900 | | | | 9,500 | |
| | | | | | | | | | | | | | | | | | | | |
| | | | | |
Department of the Premier and Cabinet | | | | | | | | | | | | | | | | | | | | |
Screen Production Facility | | | — | | | | 3,829 | | | | 2,724 | | | | 2,724 | | | | 2,724 | |
Continuation of the Events Sponsorship Fund | | | — | | | | 3,500 | | | | 3,500 | | | | 3,500 | | | | — | |
Ministerial Offices | | | — | | | | 2,769 | | | | 1,250 | | | | 3,299 | | | | 3,299 | |
Regional Office Initiative | | | — | | | | 709 | | | | 941 | | | | 964 | | | | — | |
Supporting Veterans - Grants | | | — | | | | 500 | | | | 500 | | | | 500 | | | | — | |
| | | | | | | | | | | | | | | | | | | | |
Portfolio Total | | | — | | | | 11,307 | | | | 8,915 | | | | 10,987 | | | | 6,023 | |
| | | | | | | | | | | | | | | | | | | | |
| | | | | |
Department of Transport and Main Roads | | | | | | | | | | | | | | | | | | | | |
Rail Transport Services | | | — | | | | 225,985 | | | | 221,828 | | | | 291,514 | | | | 364,670 | |
Derelict Vessels Enforcement Program | | | — | | | | 5,000 | | | | 5,000 | | | | 5,000 | | | | 5,000 | |
National Marine Safety Regulator | | | — | | | | 4,860 | | | | 3,830 | | | | 2,840 | | | | 1,620 | |
Camera Detected Offence Program | | | — | | | | 2,689 | | | | 4,967 | | | | 4,831 | | | | 5,385 | |
New Public Transport Ticketing System | | | — | | | | 2,000 | | | | 2,500 | | | | 3,500 | | | | — | |
School Transport Infrastructure Program | | | — | | | | 2,000 | | | | 5,000 | | | | 6,500 | | | | 6,500 | |
Passenger Transport Infrastructure Investment Program (PTIIP) supplement | | | — | | | | 1,000 | | | | 5,500 | | | | 6,500 | | | | 7,000 | |
Beams Road Overpass Investigation 2 | | | (380 | ) | | | 150 | | | | 230 | | | | — | | | | — | |
Bus Driver Safety | | | — | | | | — | | | | — | | | | — | | | | — | |
Mooloolah River Interchange | | | — | | | | — | | | | — | | | | — | | | | — | |
Transport Infrastructure Development Scheme | | | — | | | | — | | | | — | | | | — | | | | — | |
Queensland Walking Strategy2 | | | (400 | ) | | | (200 | ) | | | — | | | | 600 | | | | — | |
Eastern Transitway2 | | | (1,800 | ) | | | (10,200 | ) | | | — | | | | 12,000 | | | | — | |
| | | | | | | | | | | | | | | | | | | | |
Portfolio Total | | | (2,580 | ) | | | 233,284 | | | | 248,855 | | | | 333,285 | | | | 390,175 | |
| | | | | | | | | | | | | | | | | | | | |
| | | | | |
Electoral Commission of Queensland | | | | | | | | | | | | | | | | | | | | |
Prohibited Donor Scheme | | | — | | | | 526 | | | | 311 | | | | 318 | | | | 324 | |
| | | | | | | | | | | | | | | | | | | | |
Portfolio Total | | | — | | | | 526 | | | | 311 | | | | 318 | | | | 324 | |
| | | | | | | | | | | | | | | | | | | | |
| | | | | |
Legislative Assembly of Queensland | | | | | | | | | | | | | | | | | | | | |
2017 Electoral Boundary Redistribution and Election2 | | | 3,092 | | | | 2,292 | | | | 2,292 | | | | 2,292 | | | | 2,292 | |
| | | | | | | | | | | | | | | | | | | | |
Portfolio Total | | | 3,092 | | | | 2,292 | | | | 2,292 | | | | 2,292 | | | | 2,292 | |
| | | | | | | | | | | | | | | | | | | | |
| | | | | |
Public Safety Business Agency | | | | | | | | | | | | | | | | | | | | |
Queensland Government Air Aircraft Maintenance and Compliance | | | — | | | | 2,899 | | | | — | | | | — | | | | — | |
Public Safety Regional Radio Communications | | | — | | | | — | | | | — | | | | — | | | | — | |
| | | | | | | | | | | | | | | | | | | | |
Portfolio Total | | | — | | | | 2,899 | | | | — | | | | — | | | | — | |
| | | | | | | | | | | | | | | | | | | | |
19
Budget Measures 2018-19
| | | | | | | | | | | | | | | | | | | | |
| | | 2017-18 | | | 2018-19 | | | 2019-20 | | | 2020-21 | | | 2021-22 | |
Expense measures since 2017-18 MYFER | | $‘000 | | | $‘000 | | | $‘000 | | | $‘000 | | | $‘000 | |
| | | | | |
Public Service Commission | | | | | | | | | | | | | | | | | | | | |
Integrity Commissioner’s Expanded Advisory and Public Awareness Role | | | — | | | | 331 | | | | 350 | | | | 366 | | | | 382 | |
| | | | | | | | | | | | | | | | | | | | |
Portfolio Total | | | — | | | | 331 | | | | 350 | | | | 366 | | | | 382 | |
| | | | | | | | | | | | | | | | | | | | |
| | | | | |
Queensland Corrective Services | | | | | | | | | | | | | | | | | | | | |
Probation and Parole Service Funding | | | — | | | | 6,500 | | | | 2,900 | | | | — | | | | — | |
Correctional Centre Health Services | | | — | | | | 2,862 | | | | — | | | | — | | | | — | |
Expansion of the Bail Support Program | | | — | | | | 1,222 | | | | 1,253 | | | | 1,456 | | | | | |
Tackling Alcohol Fuelled Violence Program - Safe Night Precinct Support Services | | | — | | | | 1,154 | | | | — | | | | — | | | | — | |
Aurukun Prisoner Reintegration Program | | | — | | | | 512 | | | | — | | | | — | | | | — | |
Domestic and Family Violence Response - Specialist Domestic and Family Violence Courts | | | — | | | | 443 | | | | 453 | | | | 464 | | | | 416 | |
| | | | | | | | | | | | | | | | | | | | |
Portfolio Total | | | — | | | | 12,693 | | | | 4,606 | | | | 1,920 | | | | 416 | |
| | | | | | | | | | | | | | | | | | | | |
| | | | | |
Queensland Fire and Emergency Services | | | | | | | | | | | | | | | | | | | | |
State Emergency Service on-boarding to the Government Wireless Network in South East Queensland | | | — | | | | 3,000 | | | | 4,000 | | | | 1,350 | | | | 950 | |
| | | | | | | | | | | | | | | | | | | | |
Portfolio Total | | | — | | | | 3,000 | | | | 4,000 | | | | 1,350 | | | | 950 | |
| | | | | | | | | | | | | | | | | | | | |
| | | | | |
Queensland Health | | | | | | | | | | | | | | | | | | | | |
Operational Growth Funding | | | — | | | | 152,722 | | | | 62,916 | | | | 11,651 | | | | 327,182 | |
Sunshine Coast University Hospital | | | — | | | | 25,481 | | | | 28,544 | | | | 29,184 | | | | 30,022 | |
Community Helicopter Providers | | | — | | | | 7,612 | | | | — | | | | — | | | | — | |
Correctional Centre Health Services | | | — | | | | 5,090 | | | | — | | | | — | | | | — | |
Youth Justice - Specialist Mental Health Youth Forensic Assessment | | | — | | | | — | | | | — | | | | — | | | | — | |
| | | | | | | | | | | | | | | | | | | | |
Portfolio Total | | | — | | | | 190,905 | | | | 91,460 | | | | 40,835 | | | | 357,204 | |
| | | | | | | | | | | | | | | | | | | | |
| | | | | |
Queensland Police Service | | | | | | | | | | | | | | | | | | | | |
Camera Detected Offence Program | | | — | | | | 794 | | | | 1,240 | | | | 1,690 | | | | 2,247 | |
National Disability Insurance Scheme - National Clearance Database | | | — | | | | 400 | | | | — | | | | — | | | | — | |
Domestic and Family Violence Response - Specialist Domestic and Family Violence Courts | | | — | | | | 263 | | | | 878 | | | | 899 | | | | 919 | |
| | | | | | | | | | | | | | | | | | | | |
Portfolio Total | | | — | | | | 1,457 | | | | 2,118 | | | | 2,589 | | | | 3,166 | |
| | | | | | | | | | | | | | | | | | | | |
| | | | | |
Queensland Treasury | | | | | | | | | | | | | | | | | | | | |
Expansion of the Jobs and Regional Growth Fund | | | — | | | | 20,000 | | | | — | | | | — | | | | — | |
Camera Detected Offence Program | | | — | | | | 1,703 | | | | 2,406 | | | | 2,622 | | | | 2,843 | |
| | | | | | | | | | | | | | | | | | | | |
Portfolio Total | | | — | | | | 21,703 | | | | 2,406 | | | | 2,622 | | | | 2,843 | |
| | | | | | | | | | | | | | | | | | | | |
| | | | | |
Total impact on Expense since 2017-18 MYFER | | | 33,243 | | | | 826,332 | | | | 576,777 | | | | 552,071 | | | | 898,887 | |
| | | | | |
Total impact on Expense since the 2017-18 Budget | | | 252,194 | | | | 1,296,627 | | | | 1,322,031 | | | | 1,222,015 | | | | 1,189,764 | |
| 1. | Further funding for this measure can be found in the Post Mid-Year Fiscal and Economic Review section of this table. |
| 2. | Further funding for this measure can be found in the Mid-Year Fiscal and Economic Review section of this table. |
20
Budget Measures 2018-19
| Table 1.3: | Capital measures since the 2017-18 Budget |
| | | | | | | | | | | | | | | | | | | | |
Capital measures up to and including MYFER | | 2017-18
$‘000 | | | 2018-19
$‘000 | | | 2019-20
$‘000 | | | 2020-21
$‘000 | | | 2021-22
$‘000 | |
| | | | | |
Department of Communities, Disability Services and Seniors | | | | | | | | | | | | | | | | | | | | |
Supporting Veterans - The Oasis Townsville Defence Hub1 | | | 2,600 | | | | — | | | | — | | | | — | | | | — | |
| | | | | | | | | | | | | | | | | | | | |
Portfolio Total | | | 2,600 | | | | — | | | | — | | | | — | | | | — | |
| | | | | | | | | | | | | | | | | | | | |
| | | | | |
Department of Education | | | | | | | | | | | | | | | | | | | | |
Building Future Schools Fund1 | | | — | | | | 62,420 | | | | 131,980 | | | | 22,080 | | | | 51,520 | |
Renewing our Schools1 | | | — | | | | 58,750 | | | | 58,750 | | | | 58,750 | | | | 58,750 | |
Advancing Clean Energy Schools | | | 2,000 | | | | 47,000 | | | | 48,000 | | | | — | | | | — | |
School Renewal | | | — | | | | 10,000 | | | | 15,600 | | | | — | | | | — | |
Implementation of the Labour Hire Licensing Act 2017 | | | 716 | | | | — | | | | — | | | | — | | | | — | |
Yarrabilba State School Integrated Children’s Services Community Hub | | | 3,600 | | | | — | | | | — | | | | — | | | | — | |
| | | | | | | | | | | | | | | | | | | | |
Portfolio Total | | | 6,316 | | | | 178,170 | | | | 254,330 | | | | 80,830 | | | | 110,270 | |
| | | | | | | | | | | | | | | | | | | | |
| | | | | |
Department of Employment, Small Business and Training | | | | | | | | | | | | | | | | | | | | |
Advancing Our Training Infrastructure | | | — | | | | 30,000 | | | | 30,000 | | | | 25,000 | | | | — | |
| | | | | | | | | | | | | | | | | | | | |
Portfolio Total | | | — | | | | 30,000 | | | | 30,000 | | | | 25,000 | | | | — | |
| | | | | | | | | | | | | | | | | | | | |
| | | | | |
Department of Environment and Science | | | | | | | | | | | | | | | | | | | | |
Government Action on North Stradbroke Island (Minjerribah) | | | 1,690 | | | | 113 | | | | — | | | | — | | | | — | |
Protected Area Estate - Acquisition | | | — | | | | — | | | | — | | | | — | | | | — | |
Protected Area Estate - Expansion | | | 6,200 | | | | — | | | | — | | | | — | | | | — | |
| | | | | | | | | | | | | | | | | | | | |
Portfolio Total | | | 7,890 | | | | 113 | | | | — | | | | — | | | | — | |
| | | | | | | | | | | | | | | | | | | | |
| | | | | |
Department of Innovation, Tourism Industry Development and the Commonwealth Games | | | | | | | | | | | | | | | | | | | | |
Great Keppel Island Recovery Package | | | 5,000 | | | | 10,000 | | | | 10,000 | | | | — | | | | — | |
| | | | | | | | | | | | | | | | | | | | |
Portfolio Total | | | 5,000 | | | | 10,000 | | | | 10,000 | | | | — | | | | — | |
| | | | | | | | | | | | | | | | | | | | |
| | | | | |
Department of State Development, Manufacturing, Infrastructure and Planning | | | | | | | | | | | | | | | | | | | | |
Growth Area and Regional Infrastructure Investment Fund | | | — | | | | — | | | | — | | | | — | | | | — | |
| | | | | | | | | | | | | | | | | | | | |
Portfolio Total | | | — | | | | — | | | | — | | | | — | | | | — | |
| | | | | | | | | | | | | | | | | | | | |
| | | | | |
Department of Transport and Main Roads | | | | | | | | | | | | | | | | | | | | |
M1 Pacific Motorway - Varsity Lakes to Tugun1 | | | — | | | | 2,000 | | | | 6,000 | | | | 22,000 | | | | 72,000 | |
Marine Infrastructure Fund1 | | | — | | | | 14,900 | | | | 15,100 | | | | — | | | | — | |
Smithfield Bypass | | | 4,222 | | | | 13,982 | | | | 25,330 | | | | 25,466 | | | | — | |
Northern Transitway1 | | | 6,100 | | | | 10,000 | | | | 29,900 | | | | 7,000 | | | | — | |
Roads Renewal Fund1 | | | — | | | | 10,000 | | | | 10,000 | | | | 15,000 | | | | — | |
Stafford and South Pine Road Intersection Upgrade1 | | | — | | | | 10,000 | | | | 10,000 | | | | 6,000 | | | | — | |
Centenary Motorway Upgrade | | | 2,000 | | | | 5,000 | | | | 20,000 | | | | 21,000 | | | | — | |
Mt Lindesay Highway (Johanna St intersection)1 | | | — | | | | 5,000 | | | | 10,000 | | | | 5,000 | | | | — | |
Station Upgrades including Park’n’Ride facilities1 | | | 550 | | | | 3,000 | | | | 8,000 | | | | 13,950 | | | | — | |
Future Proofing The Bruce | | | — | | | | — | | | | 30,500 | | | | 98,000 | | | | 125,000 | |
21
Budget Measures 2018-19
| | | | | | | | | | | | | | | | | | | | |
Capital measures up to and including MYFER | | 2017-18
$‘000 | | | 2018-19
$‘000 | | | 2019-20
$‘000 | | | 2020-21
$‘000 | | | 2021-22
$‘000 | |
| | | | | |
Gold Coast Train Stations | | | — | | | | — | | | | — | | | | 25,000 | | | | 50,000 | |
Mount Isa to Townsville Rail Line | | | — | | | | — | | | | — | | | | 10,000 | | | | 40,000 | |
| | | | | | | | | | | | | | | | | | | | |
Portfolio Total | | | 12,872 | | | | 73,882 | | | | 164,830 | | | | 248,416 | | | | 287,000 | |
| | | | | | | | | | | | | | | | | | | | |
| | | | | |
Legislative Assembly of Queensland | | | | | | | | | | | | | | | | | | | | |
2017 Electoral Boundary Redistribution and Election1 | | | 775 | | | | — | | | | — | | | | — | | | | — | |
Parliamentary Annexe Lift Upgrade Program | | | 1,205 | | | | — | | | | — | | | | — | | | | — | |
| | | | | | | | | | | | | | | | | | | | |
Portfolio Total | | | 1,980 | | | | — | | | | — | | | | — | | | | — | |
| | | | | | | | | | | | | | | | | | | | |
| | | | | |
Queensland Health | | | | | | | | | | | | | | | | | | | | |
Building Better Hospitals1 | | | 11,000 | | | | 52,280 | | | | 87,270 | | | | 202,000 | | | | — | |
Rockhampton Drug Treatment and Rehabilitation Facility | | | 1,500 | | | | 2,600 | | | | 5,400 | | | | — | | | | — | |
Redland Hospital | | | 1,730 | | | | — | | | | — | | | | — | | | | — | |
| | | | | | | | | | | | | | | | | | | | |
Portfolio Total | | | 14,230 | | | | 54,880 | | | | 92,670 | | | | 202,000 | | | | — | |
| | | | | | | | | | | | | | | | | | | | |
| | | | | |
Queensland Police Service | | | | | | | | | | | | | | | | | | | | |
Police Officers | | | — | | | | 600 | | | | 600 | | | | 600 | | | | 600 | |
Increased Counter-Terrorism Capability | | | 1,260 | | | | — | | | | — | | | | — | | | | — | |
| | | | | | | | | | | | | | | | | | | | |
Portfolio Total | | | 1,260 | | | | 600 | | | | 600 | | | | 600 | | | | 600 | |
| | | | | | | | | | | | | | | | | | | | |
| | | | | |
Total impact on Capital up to and including MYFER | | | 52,148 | | | | 347,645 | | | | 552,430 | | | | 556,846 | | | | 397,870 | |
22
Budget Measures 2018-19
| | | | | | | | | | | | | | | | | | | | |
Capital measures since 2017-18 MYFER | | 2017-18
$‘000 | | | 2018-19
$‘000 | | | 2019-20
$‘000 | | | 2020-21
$‘000 | | | 2021-22
$‘000 | |
| | | | | |
Department of Agriculture and Fisheries | | | | | | | | | | | | | | | | | | | | |
Restoration of Jimna Fire Tower | | | — | | | | 1,000 | | | | 500 | | | | — | | | | — | |
| | | | | | | | | | | | | | | | | | | | |
Portfolio Total | | | — | | | | 1,000 | | | | 500 | | | | — | | | | — | |
| | | | | | | | | | | | | | | | | | | | |
| | | | | |
Department of Child Safety, Youth and Women | | | | | | | | | | | | | | | | | | | | |
Information and Communication Technology (ICT) Infrastructure Investment | | | — | | | | 2,800 | | | | — | | | | — | | | | — | |
| | | | | | | | | | | | | | | | | | | | |
Portfolio Total | | | — | | | | 2,800 | | | | — | | | | — | | | | — | |
| | | | | | | | | | | | | | | | | | | | |
| | | | | |
Department of Communities, Disability Services and Seniors | | | | | | | | | | | | | | | | | | | | |
Supporting Veterans - The Oasis Townsville Defence Hub2 | | | — | | | | — | | | | — | | | | — | | | | — | |
| | | | | | | | | | | | | | | | | | | | |
Portfolio Total | | | — | | | | — | | | | — | | | | — | | | | — | |
| | | | | | | | | | | | | | | | | | | | |
| | | | | |
Department of Education | | | | | | | | | | | | | | | | | | | | |
Building Future Schools Fund2 | | | — | | | | (32,420 | ) | | | 32,420 | | | | — | | | | — | |
Renewing our Schools2 | | | — | | | | (43,750 | ) | | | 11,250 | | | | 11,250 | | | | 21,250 | |
| | | | | | | | | | | | | | | | | | | | |
Portfolio Total | | | — | | | | (76,170 | ) | | | 43,670 | | | | 11,250 | | | | 21,250 | |
| | | | | | | | | | | | | | | | | | | | |
| | | | | |
Department of Environment and Science | | | | | | | | | | | | | | | | | | | | |
New Performing Arts Venue at the Queensland Performing Arts Centre | | | — | | | | 5,000 | | | | 50,000 | | | | 50,000 | | | | 20,000 | |
Queensland Cultural Centre - Critical Infrastructure Asset Renewal | | | — | | | | 4,928 | | | | 3,522 | | | | — | | | | — | |
Queensland Cultural Centre - Electricity Supplementation and Future Energy Efficiency | | | — | | | | 1,800 | | | | 3,150 | | | | 4,050 | | | | — | |
Critical Infrastructure Asset Renewal and Equipment Replacement at the Queensland Performing Arts Centre | | | — | | | | 1,500 | | | | 1,800 | | | | — | | | | — | |
National Parks Harsh Environment Fire Vehicles | | | — | | | | 200 | | | | — | | | | — | | | | — | |
| | | | | | | | | | | | | | | | | | | | |
Portfolio Total | | | — | | | | 13,428 | | | | 58,472 | | | | 54,050 | | | | 20,000 | |
| | | | | | | | | | | | | | | | | | | | |
| | | | | |
Department of Housing and Public Works | | | | | | | | | | | | | | | | | | | | |
Thomas Dixon Centre Refurbishment | | | — | | | | 9,500 | | | | 4,000 | | | | — | | | | — | |
| | | | | | | | | | | | | | | | | | | | |
Portfolio Total | | | — | | | | 9,500 | | | | 4,000 | | | | — | | | | — | |
| | | | | | | | | | | | | | | | | | | | |
| | | | | |
Department of Justice and Attorney-General | | | | | | | | | | | | | | | | | | | | |
Blue Card Services ‘No Card, No Start’ | | | — | | | | 2,520 | | | | 709 | | | | — | | | | — | |
Crime and Corruption Commission - Digital Investigative and Information Security Services | | | — | | | | 1,295 | | | | 354 | | | | — | | | | — | |
Anti-Discrimination Commission Queensland - Human Rights Act for Queensland | | | — | | | | 100 | | | | 100 | | | | — | | | | — | |
| | | | | | | | | | | | | | | | | | | | |
Portfolio Total | | | — | | | | 3,915 | | | | 1,163 | | | | — | | | | — | |
| | | | | | | | | | | | | | | | | | | | |
| | | | | |
Department of Local Government, Racing and Multicultural Affairs | | | | | | | | | | | | | | | | | | | | |
Implementing More Effective Funding Grants to Local Government | | | — | | | | 1,300 | | | | — | | | | — | | | | — | |
Northern Peninsula Area Water Supply System - Replacement of Asbestos Cement Pipelines | | | — | | | | 1,000 | | | | 1,000 | | | | 1,000 | | | | 1,000 | |
| | | | | | | | | | | | | | | | | | | | |
Portfolio Total | | | — | | | | 2,300 | | | | 1,000 | | | | 1,000 | | | | 1,000 | |
| | | | | | | | | | | | | | | | | | | | |
23
Budget Measures 2018-19
| | | | | | | | | | | | | | | | | | | | |
Capital measures since 2017-18 MYFER | | 2017-18
$‘000 | | | 2018-19
$‘000 | | | 2019-20
$‘000 | | | 2020-21
$‘000 | | | 2021-22
$‘000 | |
| | | | | |
Department of Natural Resources, Mines and Energy | | | | | | | | | | | | | | | | | | | | |
Rookwood Weir | | | — | | | | 66,000 | | | | 83,000 | | | | 126,000 | | | | 77,000 | |
Glen Niven Dam | | | — | | | | 2,500 | | | | — | | | | — | | | | — | |
Linc Energy Mine Site | | | — | | | | — | | | | — | | | | — | | | | — | |
| | | | | | | | | | | | | | | | | | | | |
Portfolio Total | | | — | | | | 68,500 | | | | 83,000 | | | | 126,000 | | | | 77,000 | |
| | | | | | | | | | | | | | | | | | | | |
| | | | | |
Department of Transport and Main Roads | | | | | | | | | | | | | | | | | | | | |
M1 Pacific Motorway - Eight Mile Plains to Daisy Hill | | | — | | | | 17,000 | | | | 28,500 | | | | 70,000 | | | | 201,000 | |
M1 Pacific Motorway - Varsity Lakes to Tugun2 | | | — | | | | 3,000 | | | | 9,000 | | | | 48,000 | | | | 148,000 | |
New Public Transport Ticketing System | | | — | | | | 89,198 | | | | 104,427 | | | | 87,891 | | | | 89,544 | |
Beerburrum to Nambour Rail | | | — | | | | 14,407 | | | | 59,470 | | | | 143,963 | | | | 142,951 | |
Western Roads Upgrade Supplement | | | — | | | | 5,000 | | | | — | | | | — | | | | — | |
Station Upgrades including Park’n’Ride facilities2 | | | (150 | ) | | | 3,600 | | | | (3,695 | ) | | | 245 | | | | — | |
M1 Action Plan - Oxenford (Exit 57) Interchange Upgrade | | | — | | | | 3,000 | | | | 12,000 | | | | 10,000 | | | | — | |
Camera Detected Offence Program | | | — | | | | 2,000 | | | | 2,350 | | | | 67,350 | | | | 55,350 | |
Gold Coast Seaway Sand Bypass System - Jetty Deck Upgrade | | | — | | | | 1,500 | | | | 1,850 | | | | — | | | | — | |
Construction of Petrie Roundabout Project | | | — | | | | | | | | 10,500 | | | | 12,000 | | | | — | |
Mt Lindesay Highway (Johanna St intersection)2 | | | 200 | | | | (3,200 | ) | | | 2,000 | | | | 1,000 | | | | — | |
Northern Transitway2 | | | (5,900 | ) | | | (4,200 | ) | | | (19,900 | ) | | | 23,000 | | | | 7,000 | |
Stafford and South Pine Road Intersection Upgrade2 | | | 250 | | | | (7,750 | ) | | | 5,000 | | | | 2,500 | | | | — | |
Roads Renewal Fund2 | | | — | | | | (9,000 | ) | | | (1,000 | ) | | | (5,000 | ) | | | 15,000 | |
Marine Infrastructure Fund2 | | | — | | | | (10,300 | ) | | | 10,300 | | | | — | | | | — | |
| | | | | | | | | | | | | | | | | | | | |
Portfolio Total | | | (5,600 | ) | | | 104,255 | | | | 220,802 | | | | 460,949 | | | | 658,845 | |
| | | | | | | | | | | | | | | | | | | | |
| | | | | |
Legislative Assembly of Queensland | | | | | | | | | | | | | | | | | | | | |
Parliament House Fire Protection System | | | — | | | | 3,994 | | | | — | | | | — | | | | — | |
2017 Electoral Boundary Redistribution and Election2 | | | — | | | | 1,000 | | | | — | | | | — | | | | — | |
Infrastructure and Accommodation Critical Works Program | | | 200 | | | | 1,000 | | | | 400 | | | | — | | | | — | |
| | | | | | | | | | | | | | | | | | | | |
Portfolio Total | | | 200 | | | | 5,994 | | | | 400 | | | | — | | | | — | |
| | | | | | | | | | | | | | | | | | | | |
| | | | | |
Public Safety Business Agency | | | | | | | | | | | | | | | | | | | | |
Queensland Government Air Aircraft Maintenance and Compliance | | | — | | | | 3,728 | | | | — | | | | — | | | | — | |
| | | | | | | | | | | | | | | | | | | | |
Portfolio Total | | | — | | | | 3,728 | | | | — | | | | — | | | | — | |
| | | | | | | | | | | | | | | | | | | | |
| | | | | |
Queensland Corrective Services | | | | | | | | | | | | | | | | | | | | |
Capricornia Correctional Centre | | | — | | | | 22,000 | | | | 19,000 | | | | — | | | | — | |
Minor Capital Works | | | — | | | | 5,500 | | | | 5,000 | | | | — | | | | — | |
| | | | | | | | | | | | | | | | | | | | |
Portfolio Total | | | — | | | | 27,500 | | | | 24,000 | | | | — | | | | — | |
| | | | | | | | | | | | | | | | | | | | |
| | | | | |
Queensland Fire and Emergency Services | | | | | | | | | | | | | | | | | | | | |
Queensland Fire and Emergency Services Facility - Maleny | | | — | | | | 1,050 | | | | 1,000 | | | | 1,450 | | | | (500 | ) |
Queensland Fire and Emergency Services Facilities - Yarrabilba and surrounds | | | — | | | | 1,000 | | | | 1,000 | | | | 3,000 | | | | — | |
| | | | | | | | | | | | | | | | | | | | |
Portfolio Total | | | — | | | | 2,050 | | | | 2,000 | | | | 4,450 | | | | (500 | ) |
| | | | | | | | | | | | | | | | | | | | |
24
Budget Measures 2018-19
| | | | | | | | | | | | | | | | | | | | |
Capital measures since 2017-18 MYFER | | 2017-18
$‘000 | | | 2018-19
$‘000 | | | 2019-20
$‘000 | | | 2020-21
$‘000 | | | 2021-22
$‘000 | |
| | | | | |
Queensland Health | | | | | | | | | | | | | | | | | | | | |
Building Better Hospitals2 | | | — | | | | — | | | | — | | | | — | | | | 185,700 | |
Health Technology Equipment Replacement Program | | | — | | | | 50,000 | | | | — | | | | — | | | | — | |
Redcliffe Hospital Carpark | | | — | | | | 7,508 | | | | 24,098 | | | | 5,174 | | | | — | |
Youth Justice - Specialist Mental Health Youth Forensic Assessment | | | — | | | | — | | | | — | | | | — | | | | — | |
| | | | | | | | | | | | | | | | | | | | |
Portfolio Total | | | — | | | | 57,508 | | | | 24,098 | | | | 5,174 | | | | 185,700 | |
| | | | | | | | | | | | | | | | | | | | |
| | | | | |
Queensland Police Service | | | | | | | | | | | | | | | | | | | | |
Camera Detected Offence Program | | | — | | | | 950 | | | | 2,150 | | | | 1,150 | | | | 1,900 | |
National Disability Insurance Scheme - National Clearance Database | | | — | | | | 100 | | | | — | | | | — | | | | — | |
| | | | | | | | | | | | | | | | | | | | |
Portfolio Total | | | — | | | | 1,050 | | | | 2,150 | | | | 1,150 | | | | 1,900 | |
| | | | | | | | | | | | | | | | | | | | |
| | | | | |
Queensland Treasury | | | | | | | | | | | | | | | | | | | | |
Business Development Fund | | | — | | | | 20,000 | | | | 20,000 | | | | — | | | | — | |
| | | | | | | | | | | | | | | | | | | | |
Portfolio Total | | | — | | | | 20,000 | | | | 20,000 | | | | — | | | | — | |
| | | | | | | | | | | | | | | | | | | | |
| | | | | |
Total impact on Capital since 2017-18 MYFER | | | (5,400 | ) | | | 247,358 | | | | 485,255 | | | | 664,023 | | | | 965,195 | |
| | | | | |
Total impact on Capital since the 2017-18 Budget | | | 46,748 | | | | 595,003 | | | | 1,037,685 | | | | 1,220,869 | | | | 1,363,065 | |
| | | | | |
Less Australian Government funding | | | | | | | 34,000 | | | | 101,500 | | | | 173,000 | | | | 222,500 | |
| | | | | |
Net of Measures funded by Australian Government | | | 46,748 | | | | 561,003 | | | | 936,185 | | | | 1,047,869 | | | | 1,140,565 | |
| 1. | Further funding for this measure can be found in the Post Mid-Year Fiscal and Economic Review section of this table. |
| 2. | Further funding for this measure can be found in the Mid-Year Fiscal and Economic Review section of this table. |
25
Budget Measures 2018-19
| Table 1.4: | Revenue measures since the 2017-18 Budget |
| | | | | | | | | | | | | | | | | | | | |
Revenue measures up to and including MYFER | | 2017-18
$‘000 | | | 2018-19
$‘000 | | | 2019-20
$‘000 | | | 2020-21
$‘000 | | | 2021-22
$‘000 | |
| | | | | |
Department of Education | | | | | | | | | | | | | | | | | | | | |
Implementation of the Labour Hire Licensing Act 20171 | | | 3,071 | | | | 3,071 | | | | 3,071 | | | | 3,071 | | | | — | |
| | | | | | | | | | | | | | | | | | | | |
Portfolio Total | | | 3,071 | | | | 3,071 | | | | 3,071 | | | | 3,071 | | | | — | |
| | | | | | | | | | | | | | | | | | | | |
| | | | | |
Department of Transport and Main Roads | | | | | | | | | | | | | | | | | | | | |
Reduced Registration for Historic Motorcycles | | | — | | | | (100 | ) | | | (100 | ) | | | (100 | ) | | | (100 | ) |
Transport Concessions for Veterans | | | (228 | ) | | | (488 | ) | | | (527 | ) | | | (567 | ) | | | (608 | ) |
| | | | | | | | | | | | | | | | | | | | |
Portfolio Total | | | (228 | ) | | | (588 | ) | | | (627 | ) | | | (667 | ) | | | (708 | ) |
| | | | | | | | | | | | | | | | | | | | |
| | | | | |
Queensland Treasury | | | | | | | | | | | | | | | | | | | | |
Point of Consumption Betting Tax1 | | | — | | | | 30,000 | | | | 30,000 | | | | 30,000 | | | | 30,000 | |
Land Tax increase to rate on holdings above $10 million by 0.5 percentage points | | | — | | | | 71,000 | | | | 76,000 | | | | 80,000 | | | | 84,400 | |
Additional Foreign Acquirer Duty increase to 7% | | | — | | | | 33,000 | | | | 33,000 | | | | 33,000 | | | | 33,000 | |
Premium Motor Vehicle Duty | | | — | | | | 24,020 | | | | 25,250 | | | | 26,490 | | | | 27,870 | |
| | | | | | | | | | | | | | | | | | | | |
Portfolio Total | | | — | | | | 158,020 | | | | 164,250 | | | | 169,490 | | | | 175,270 | |
| | | | | | | | | | | | | | | | | | | | |
| | | | | |
Total impact on Revenue up to and including MYFER | | | 2,843 | | | | 160,503 | | | | 166,694 | | | | 171,894 | | | | 174,562 | |
26
Budget Measures 2018-19
| | | | | | | | | | | | | | | | | | | | |
Revenue measures since 2017-18 MYFER | | 2017-18
$‘000 | | | 2018-19
$‘000 | | | 2019-20
$‘000 | | | 2020-21
$‘000 | | | 2021-22
$‘000 | |
| | | | | |
Department of Agriculture and Fisheries | | | | | | | | | | | | | | | | | | | | |
Veterinary Surgeons Regulation 2016 | | | — | | | | 201 | | | | 208 | | | | 215 | | | | 223 | |
Queensland Racing Integrity Commission (QRIC) - Reducing Red Tape through a New Licence Model | | | — | | | | (125 | ) | | | (125 | ) | | | (125 | ) | | | (122 | ) |
| | | | | | | | | | | | | | | | | | | | |
Portfolio Total | | | — | | | | 76 | | | | 83 | | | | 90 | | | | 101 | |
| | | | | | | | | | | | | | | | | | | | |
| | | | | |
Department of Education | | | | | | | | | | | | | | | | | | | | |
Homestay Regional Fees for International Students Program and Study Tours | | | — | | | | 311 | | | | 328 | | | | 349 | | | | 370 | |
Implementation of the Labour Hire Licensing Act 20172 | | | — | | | | | | | | | | | | | | | | 3,071 | |
| | | | | | | | | | | | | | | | | | | | |
Portfolio Total | | | — | | | | 311 | | | | 328 | | | | 349 | | | | 3,441 | |
| | | | | | | | | | | | | | | | | | | | |
| | | | | |
Department of Environment and Science | | | | | | | | | | | | | | | | | | | | |
Waste Disposal Levy | | | — | | | | 100,724 | | | | 405,657 | | | | 408,004 | | | | 407,831 | |
| | | | | | | | | | | | | | | | | | | | |
Portfolio Total | | | — | | | | 100,724 | | | | 405,657 | | | | 408,004 | | | | 407,831 | |
| | | | | | | | | | | | | | | | | | | | |
| | | | | |
Department of Natural Resources, Mines and Energy | | | | | | | | | | | | | | | | | | | | |
Extending existing drought relief arrangements | | | — | | | | — | | | | — | | | | — | | | | — | |
| | | | | | | | | | | | | | | | | | | | |
Portfolio Total | | | — | | | | — | | | | — | | | | — | | | | — | |
| | | | | | | | | | | | | | | | | | | | |
| | | | | |
Department of Transport and Main Roads | | | | | | | | | | | | | | | | | | | | |
Hazard Perception Test Fee | | | — | | | | — | | | | 1,330 | | | | 1,369 | | | | 1,408 | |
Learner Licence Discount for Photo Identification Card (PIC) Holders | | | — | | | | (26 | ) | | | (66 | ) | | | (141 | ) | | | (149 | ) |
Heavy Vehicle Plate Fee | | | — | | | | (147 | ) | | | (152 | ) | | | (157 | ) | | | (162 | ) |
| | | | | | | | | | | | | | | | | | | | |
Portfolio Total | | | — | | | | (173 | ) | | | 1,112 | | | | 1,071 | | | | 1,097 | |
| | | | | | | | | | | | | | | | | | | | |
| | | | | |
Queensland Treasury | | | | | | | | | | | | | | | | | | | | |
Point of Consumption Betting Tax2 | | | — | | | | 40,950 | | | | 66,323 | | | | 68,501 | | | | 71,184 | |
Payroll Tax Apprentice and Trainee Rebate | | | — | | | | (26,000 | ) | | | — | | | | — | | | | — | |
| | | | | | | | | | | | | | | | | | | | |
Portfolio Total | | | — | | | | 14,950 | | | | 66,323 | | | | 68,501 | | | | 71,184 | |
| | | | | | | | | | | | | | | | | | | | |
| | | | | |
Total impact on Revenue since 2017-18 MYFER | | | — | | | | 115,888 | | | | 473,503 | | | | 478,015 | | | | 483,654 | |
| | | | | |
Total impact on Revenue since the 2017-18 Budget | | | 2,843 | | | | 276,391 | | | | 640,197 | | | | 649,909 | | | | 658,216 | |
| 1. | Further funding for this measure can be found in the Post Mid-Year Fiscal and Economic Review section of this table. |
| 2. | Further funding for this measure can be found in the Mid-Year Fiscal and Economic Review section of this table. |
27
Budget Measures 2018-19
Introduction
The following tables present the relevant portfolio expense measures relating to decisions taken since the 2017-18 Budget. This does not represent the full amount of additional funding provided to agencies since the 2017-18 Budget. For further explanation, refer to Explanation of Scope and Terms in Chapter 1.
28
Budget Measures 2018-19
Department of Aboriginal and Torres Strait Islander Partnerships
| | | | | | | | | | | | | | | | | | | | |
| | | 2017-18
$‘000 | | | 2018-19
$‘000 | | | 2019-20
$‘000 | | | 2020-21
$‘000 | | | 2021-22
$‘000 | |
Cape York Splash Parks | | | — | | | | 4,000 | | | | — | | | | — | | | | — | |
Delivering on our election commitments, the Government is providing additional funding of $4 million in 2018-19 to build splash parks at Pormpuraaw, Napranum and Mapoon.
| | | | | | | | | | | | | | | | | | | | |
| | | 2017-18
$‘000 | | | 2018-19
$‘000 | | | 2019-20
$‘000 | | | 2020-21
$‘000 | | | 2021-22
$‘000 | |
Work History Research and Legal Services | | | — | | | | 3,301 | | | | 301 | | | | 110 | | | | — | |
The Government is providing additional funding of $3.7 million over three years to support work history research and legal services.
| | | | | | | | | | | | | | | | | | | | |
| | | 2017-18
$‘000 | | | 2018-19
$‘000 | | | 2019-20
$‘000 | | | 2020-21
$‘000 | | | 2021-22
$‘000 | |
Kowanyama Men’s Shed and Women’s Meeting Place | | | — | | | | 1,476 | | | | 388 | | | | 403 | | | | 416 | |
The Government is providing additional funding of $2.7 million over four years and $416,000 per annum ongoing to establish a Men’s Shed and a Women’s Meeting Place for the Kowanyama community.
29
Budget Measures 2018-19
| | | | | | | | | | | | | | | | | | | | |
| | | 2017-18
$‘000 | | | 2018-19
$‘000 | | | 2019-20
$‘000 | | | 2020-21
$‘000 | | | 2021-22
$‘000 | |
Kupai Omasker | | | 200 | | | | 597 | | | | 203 | | | | — | | | | — | |
Delivering on our election commitments, the Government has provided additional funding of $1 million over three years to engage with Queensland’s Torres Strait Islander community on how traditional Torres Strait Islander child rearing practices can be recognised in law. The consultation process will include the engagement of eminent persons.
| | | | | | | | | | | | | | | | | | | | |
| | | 2017-18
$‘000 | | | 2018-19
$‘000 | | | 2019-20
$‘000 | | | 2020-21
$‘000 | | | 2021-22
$‘000 | |
Aurukun Women’s Initiative | | | — | | | | — | | | | — | | | | — | | | | — | |
The Government is continuing to support the Aurukun community with the department internally funding $195,000 in 2018-19 for the Aurukun Women’s Initiative.
This forms part of the Government’s overall package of $1.6 million to continue the Aurukun Four Point Plan in 2018-19 to address safety and support the community. Further funding can be found in the Department of Justice and Attorney-General and Queensland Corrective Service sections of this chapter.
30
Budget Measures 2018-19
Department of Agriculture and Fisheries
| | | | | | | | | | | | | | | | | | | | |
| | | 2017-18
$‘000 | | | 2018-19
$‘000 | | | 2019-20
$‘000 | | | 2020-21
$‘000 | | | 2021-22
$‘000 | |
Driving Queensland Agriculture and Rural Jobs Growth | | | — | | | | 7,400 | | | | 7,400 | | | | 4,400 | | | | — | |
Delivering on our election commitments, the Government is providing additional funding of $19.2 million over three years to support Queensland agriculture and rural jobs. This includes additional funding for the Rural Jobs Initiative ($3 million), Rural Economic Development Grants Scheme ($10 million), Queensland Feral Pest Initiative ($5 million), Pulse Storage Research, Development and Extension ($1 million) and a study into stamp duty on agricultural insurance products ($200,000).
| | | | | | | | | | | | | | | | | | | | |
| | | 2017-18
$‘000 | | | 2018-19
$‘000 | | | 2019-20
$‘000 | | | 2020-21
$‘000 | | | 2021-22
$‘000 | |
10 Year Plan for the National Red Imported Fire Ant Eradication Program in South East Queensland | | | 2,358 | | | | 2,453 | | | | 2,551 | | | | 2,651 | | | | 2,754 | |
Funding of $28.2 million over 10 years from 2017-18 for the National Red Imported Fire Ant Eradication Program (NRIFAEP) has been allocated to the department. This funding had been held centrally subject to finalisation of the National Cost Sharing Agreement, which has now occurred.
Funding of $15.1 million over 10 years has also been internally reprioritised by the department, bringing Queensland’s total contribution to the NRIFAEP to $43.3 million over 10 years.
The National Cost Sharing Agreement is a total of $411.4 million over 10 years, with contributions from the Australian Government and other States and Territories.
31
Budget Measures 2018-19
| | | | | | | | | | | | | | | | | | | | |
| | | 2017-18
$‘000 | | | 2018-19
$‘000 | | | 2019-20
$‘000 | | | 2020-21
$‘000 | | | 2021-22
$‘000 | |
Panama Disease Tropical Race 4 Program | | | 2,751 | | | | 2,281 | | | | 265 | | | | — | | | | — | |
The Government has provided increased funding of $5.3 million over three years to support the continuation of the Panama Disease Tropical Race 4 Program following detection of the disease in Queensland and for a feral pig control initiative to further contain the disease. Further funding can be found in the Department of Environment and Science section of this chapter.
| | | | | | | | | | | | | | | | | | | | |
| | | 2017-18
$‘000 | | | 2018-19
$‘000 | | | 2019-20
$‘000 | | | 2020-21
$‘000 | | | 2021-22
$‘000 | |
Shark Control Program | | | — | | | | 316 | | | | 457 | | | | 548 | | | | 731 | |
The Government is providing increased funding of $2.1 million over four years and $731,000 per annum ongoing to help meet growing costs of the Shark Control Program which protects swimmers on Queensland beaches.
This measure forms part of the larger departmental Shark Control Program, with total funding of $16.1 million over four years and $4.2 million per annum ongoing.
| | | | | | | | | | | | | | | | | | | | |
| | | 2017-18
$‘000 | | | 2018-19
$‘000 | | | 2019-20
$‘000 | | | 2020-21
$‘000 | | | 2021-22
$‘000 | |
Restoration of Waaje Fire Tower | | | — | | | | 300 | | | | 200 | | | | — | | | | — | |
The Government is providing additional funding of $500,000 over two years to restore the Waaje Fire Tower that is listed on the Queensland Heritage Register.
32
Budget Measures 2018-19
| | | | | | | | | | | | | | | | | | | | |
| | | 2017-18
$‘000 | | | 2018-19
$‘000 | | | 2019-20
$‘000 | | | 2020-21
$‘000 | | | 2021-22
$‘000 | |
Supporting Queensland`s Dairy Producers | | | 360 | | | | 260 | | | | 50 | | | | — | | | | — | |
The Government has provided additional funding of $670,000 over three years to the Queensland Dairy Organisation to assist producers and small local milk processors to improve their marketing and labelling campaigns, and to facilitate greater producer participation in the Queensland Dairy Accounting Scheme which provides insights to dairy farmers on profitability, solvency and efficiency.
This is part of a total funding package of $960,000 for marketing strategies to help consumers make better-informed decisions when they buy milk. Further funding can be found in the Department of Employment, Small Business and Training section of this chapter.
| | | | | | | | | | | | | | | | | | | | |
| | | 2017-18
$‘000 | | | 2018-19
$‘000 | | | 2019-20
$‘000 | | | 2020-21
$‘000 | | | 2021-22
$‘000 | |
Bundaberg Fruit Fly Trial | | | 400 | | | | — | | | | — | | | | — | | | | — | |
Delivering on our election commitments, the Government has provided additional funding of $400,000 in 2017-18 to help eradicate fruit fly from the Bundaberg region.
| | | | | | | | | | | | | | | | | | | | |
| | | 2017-18
$‘000 | | | 2018-19
$‘000 | | | 2019-20
$‘000 | | | 2020-21
$‘000 | | | 2021-22
$‘000 | |
Extending Existing Drought Relief Arrangements | | | — | | | | — | | | | — | | | | — | | | | — | |
The Government is providing increased funding of up to $20 million in 2018-19, held centrally, for the continuation of the Drought Relief Assistance Scheme. This funding provides freight subsidies and emergency water infrastructure rebates to support producers and communities that have been affected by drought across the State.
The Drought Assistance Package is a total of up to $34.6 million in 2018-19 to support drought affected communities across the State. Further details can be found in the Department of Natural Resources, Mines and Energy section of this chapter and Chapter 4 Revenue Measures.
33
Budget Measures 2018-19
| | | | | | | | | | | | | | | | | | | | |
| | | 2017-18
$���000 | | | 2018-19
$‘000 | | | 2019-20
$‘000 | | | 2020-21
$‘000 | | | 2021-22
$‘000 | |
Paws and Claws Capital Grant | | | — | | | | — | | | | — | | | | — | | | | — | |
Funding of $300,000 has been internally reprioritised in 2017-18 by the department to Paws and Claws as a contribution towards the cost of a new animal refuge and boarding facility.
34
Budget Measures 2018-19
Department of Child Safety, Youth and Women
| | | | | | | | | | | | | | | | | | | | |
| | | 2017-18
$‘000 | | | 2018-19
$‘000 | | | 2019-20
$‘000 | | | 2020-21
$‘000 | | | 2021-22
$‘000 | |
Youth Justice - Youth Detention Capacity and Planning | | | 216 | | | | 10,384 | | | | — | | | | — | | | | — | |
The Government has provided additional funding of $10.6 million over two years for additional frontline and frontline support positions to enhance operations of Queensland’s two youth detention centres, and the development of a strategic business case to plan for future detention centre capacity.
This forms part of the Government’s total funding of $40.7 million over four years ($22.3 million new funding and $18.4 million reprioritised funding) for youth justice support measures. Further details can be found in this section, the Department of Education, Department of Housing and Public Works and Queensland Health sections of this chapter and the Queensland Health section of Chapter 3 Capital Measures.
| | | | | | | | | | | | | | | | | | | | |
| | | 2017-18
$‘000 | | | 2018-19
$‘000 | | | 2019-20
$‘000 | | | 2020-21
$‘000 | | | 2021-22
$‘000 | |
Youth Justice - Reducing Remand of Children and Young People in Custody | | | — | | | | 2,469 | | | | 6,471 | | | | 2,712 | | | | — | |
The Government is providing increased funding of $11.7 million over three years and $11.3 million over four years has been internally reprioritised by the department for services and initiatives to reduce remand of children and young people in custody while maintaining community safety, including extension of bail support and advocacy to support young people to meet their bail conditions, continuation of restorative justice and court ordered conferencing.
This forms part of the Government’s total funding of $40.7 million over four years ($22.3 million new funding and $18.4 million reprioritised funding) for youth justice support measures. Further details can be found in this section, the Department of Education, Department of Housing and Public Works and Queensland Health sections of this chapter and the Queensland Health section of Chapter 3 Capital Measures.
35
Budget Measures 2018-19
| | | | | | | | | | | | | | | | | | | | |
| | | 2017-18
$‘000 | | | 2018-19
$‘000 | | | 2019-20
$‘000 | | | 2020-21
$‘000 | | | 2021-22
$‘000 | |
Supporting Children and Young People with Complex and Challenging Behaviours | | | 20,000 | | | | 20,000 | | | | — | | | | — | | | | — | |
The Government has provided increased funding of $40 million over two years to support children and young people in care with complex and challenging behaviours.
| | | | | | | | | | | | | | | | | | | | |
| | | 2017-18
$‘000 | | | 2018-19
$‘000 | | | 2019-20
$‘000 | | | 2020-21
$‘000 | | | 2021-22
$‘000 | |
Replacement of Integrated Client Management System | | | — | | | | 4,300 | | | | — | | | | — | | | | — | |
The Government is providing increased funding of $4.3 million in 2018-19 to continue developing a contemporary and customer-centric client information and case management solution.
| | | | | | | | | | | | | | | | | | | | |
| | | 2017-18
$‘000 | | | 2018-19
$‘000 | | | 2019-20
$‘000 | | | 2020-21
$‘000 | | | 2021-22
$‘000 | |
Office of the Child and Family Official Solicitor | | | — | | | | 3,320 | | | | — | | | | — | | | | — | |
The Government is providing increased funding of $3.3 million in 2018-19 for additional staff in the Office of the Child and Family Official Solicitor to provide early, independent legal advice to child safety workers about child protection matters, and work collaboratively with staff in service centres and the independent Director of Child Protection Litigation to manage child protection order applications and proceedings.
Details of funding for the Director of Child Protection Litigation can be found in the Department of Justice and Attorney-General section of this chapter.
36
Budget Measures 2018-19
| | | | | | | | | | | | | | | | | | | | |
| | | 2017-18
$‘000 | | | 2018-19
$‘000 | | | 2019-20
$‘000 | | | 2020-21
$‘000 | | | 2021-22
$‘000 | |
Transition to Success | | | — | | | | 2,500 | | | | — | | | | — | | | | — | |
The Government is providing increased funding of $2.5 million in 2018-19 to continue the Transition to Success program, aimed at reducing recidivism and increasing participation in education and vocational activities.
| | | | | | | | | | | | | | | | | | | | |
| | | 2017-18
$‘000 | | | 2018-19
$‘000 | | | 2019-20
$‘000 | | | 2020-21
$‘000 | | | 2021-22
$‘000 | |
Domestic and Family Violence Response - Specialist Domestic and Family Violence Courts | | | — | | | | 274 | | | | 463 | | | | 463 | | | | 463 | |
The Government is providing increased funding of $1.7 million over four years and $463,000 per annum ongoing to support the expansion of the Townsville Specialist Domestic and Family Violence (DFV) Court (including circuit courts in Mount Isa and Palm Island) to include criminal DFV matters.
Total funding for the expansion of the Townsville Specialist DFV Court is $8.1 million over four years, and $2.3 million per annum ongoing. Further funding can be found in the Department of Justice and Attorney-General, Queensland Corrective Services and Queensland Police Service sections of this chapter.
| | | | | | | | | | | | | | | | | | | | |
| | | 2017-18
$‘000 | | | 2018-19
$‘000 | | | 2019-20
$‘000 | | | 2020-21
$‘000 | | | 2021-22
$‘000 | |
National Redress Scheme | | | — | | | | — | | | | — | | | | — | | | | — | |
The Government has provisioned approximately $500 million for redress payments to survivors of institutional child sexual abuse and to facilitate their access to counselling and psychological support as part of Queensland’s participation in the National Redress Scheme for Survivors of Institutional Child Sexual Abuse (National Redress Scheme). Participation in a National Redress Scheme was a key recommendation of the Royal Commission into Institutional Responses to Child Sexual Abuse.
The National Redress Scheme will also provide eligible applicants the option to receive a direct personal response from the institution responsible for providing the redress.
37
Budget Measures 2018-19
Department of Communities, Disability Services and Seniors
| | | | | | | | | | | | | | | | | | | | |
| | | 2017-18
$‘000 | | | 2018-19
$‘000 | | | 2019-20
$‘000 | | | 2020-21
$‘000 | | | 2021-22
$‘000 | |
Electricity Asset Ownership Dividend | | | 100,000 | | | | 100,000 | | | | — | | | | — | | | | — | |
The Queensland Government has provided additional funding of $200 million over two years to deliver electricity bill relief for Queensland households through a $50 electricity rebate in 2017-18 and 2018-19. This initiative is funded from the dividends of Queensland’s Government-owned corporations.
The Electricity Asset Ownership Dividend forms part of the $2 billion Affordable Energy Plan, aimed at ensuring electricity price rises for typical household and small business customers remain below inflation on average over the next two years.
| | | | | | | | | | | | | | | | | | | | |
| | | 2017-18
$‘000 | | | 2018-19
$‘000 | | | 2019-20
$‘000 | | | 2020-21
$‘000 | | | 2021-22
$‘000 | |
Community Nursing and Allied Health Services | | | — | | | | 10,000 | | | | — | | | | — | | | | — | |
The Government is providing increased funding of $10 million in 2018-19 to maintain existing community nursing and allied health services for National Disability Insurance Scheme (NDIS) participants whose NDIS plans do not include these services.
| | | | | | | | | | | | | | | | | | | | |
| | | 2017-18
$‘000 | | | 2018-19
$‘000 | | | 2019-20
$‘000 | | | 2020-21
$‘000 | | | 2021-22
$‘000 | |
Tackling Alcohol Fuelled Violence Program - Safe Night Precinct Support Services | | | — | | | | 3,324 | | | | — | | | | — | | | | — | |
The Government is providing increased funding of $3.3 million in 2018-19 to continue the delivery of Safe Night Precinct Support Services which provide early intervention to ensure people affected by excessive alcohol consumption receive necessary assistance and are not exposed to risk or harm as a result of their condition.
This forms part of the Government’s Tackling Alcohol Fuelled Violence Program. Further funding can be found in the Queensland Corrective Services, Queensland Police Service and Department of Justice and Attorney-General sections of this chapter.
38
Budget Measures 2018-19
| | | | | | | | | | | | | | | | | | | | |
| | | 2017-18
$‘000 | | | 2018-19
$‘000 | | | 2019-20
$‘000 | | | 2020-21
$‘000 | | | 2021-22
$‘000 | |
National Disability Insurance Scheme - National Clearance Database | | | — | | | | 917 | | | | 180 | | | | 136 | | | | — | |
The Government is providing additional funding of $1.2 million over three years for Queensland’s contribution to the National Disability Insurance Scheme (NDIS) National Clearance Database. From 1 July 2019, this database will contain a register of cleared and excluded workers from all jurisdictions, reducing the potential for providers to employ workers who pose an unacceptable risk of harm to NDIS participants.
Total funding associated with the National Clearance Database is $1.7 million over three years. Further funding can be found in the Queensland Police Service section of this chapter and Chapter 3 Capital Measures.
| | | | | | | | | | | | | | | | | | | | |
| | | 2017-18
$‘000 | | | 2018-19
$‘000 | | | 2019-20
$‘000 | | | 2020-21
$‘000 | | | 2021-22
$‘000 | |
Disability Advocates | | | — | | | | 750 | | | | 4,693 | | | | 4,047 | | | | — | |
Delivering on our election commitments, the Government is providing funding of $9.5 million over three years for disability advocacy support services, including additional funding of $750,000 in 2018-19 for the Queenslanders with Disability Network to provide peer-to-peer advocacy for people with disability who are yet to enter the National Disability Insurance Scheme (NDIS) and increased funding of $8.7 million over two years to 2020-21 to assist disability advocacy services after the State fully transitions to NDIS.
| | | | | | | | | | | | | | | | | | | | |
| | | 2017-18
$‘000 | | | 2018-19
$‘000 | | | 2019-20
$‘000 | | | 2020-21
$‘000 | | | 2021-22
$‘000 | |
School Breakfast Program | | | 250 | | | | 250 | | | | 250 | | | | 250 | | | | — | |
Delivering on our election commitments, the Government has provided increased funding of $1 million over four years to Foodbank Queensland to expand the School Breakfast Program to additional schools across the State.
39
Budget Measures 2018-19
| | | | | | | | | | | | | | | | | | | | |
| | | 2017-18
$‘000 | | | 2018-19
$‘000 | | | 2019-20
$‘000 | | | 2020-21
$‘000 | | | 2021-22
$‘000 | |
Supporting Veterans - Online Portal | | | — | | | | 100 | | | | 100 | | | | — | | | | — | |
Delivering on our election commitments, the Government is providing additional funding of $200,000 over two years for an online portal to assist ex-Australian Defence Force personnel to access information and support.
This forms part of the Government’s total funding package of $4.3 million for the Supporting Veterans initiative. Further funding can be found in the Department of the Premier and Cabinet section of this chapter, and in the Department of Communities, Disability Services and Seniors section of Chapter 3 Capital Measures.
40
Budget Measures 2018-19
Department of Education
| | | | | | | | | | | | | | | | | | | | |
| | | 2017-18
$‘000 | | | 2018-19
$‘000 | | | 2019-20
$‘000 | | | 2020-21
$‘000 | | | 2021-22
$‘000 | |
Non-State School Capital Grants | | | — | | | | 45,000 | | | | 45,000 | | | | 45,000 | | | | — | |
Delivering on our election commitments, the Government is providing additional funding of $135 million over three years in capital grants to the non-state schooling sector to support infrastructure to meet the needs of Queensland’s growing student population.
| | | | | | | | | | | | | | | | | | | | |
| | | 2017-18
$‘000 | | | 2018-19
$‘000 | | | 2019-20
$‘000 | | | 2020-21
$‘000 | | | 2021-22
$‘000 | |
New Senior Assessment and Tertiary Entrance Systems | | | 3,046 | | | | 7,752 | | | | 6,166 | | | | 2,156 | | | | 2,156 | |
The Government has provided additional funding of $21.3 million over five years and $2.2 million per annum ongoing to complete the redevelopment of the Queensland Curriculum and Assessment Authority’s information and communication technology infrastructure. This will support the new Queensland Certificate of Education which commences in 2019.
| | | | | | | | | | | | | | | | | | | | |
| | | 2017-18
$‘000 | | | 2018-19
$‘000 | | | 2019-20
$‘000 | | | 2020-21
$‘000 | | | 2021-22
$‘000 | |
Implementation of the Labour Hire Licensing Act 2017 | | | 2,064 | | | | 2,156 | | | | 2,221 | | | | 2,288 | | | | 2,357 | |
Delivering on our election commitments, the Government has provided additional funding of $11.1 million over five years and $2.4 million per annum ongoing to implement the Labour Hire Licensing Act. This addresses labour hire worker exploitation through a mandatory business licensing scheme covering labour hire providers operating in Queensland. The capital component of this measure can be found in Chapter 3 Capital Measures. The revenue component of this measure can be found in Chapter 4 Revenue Measures.
41
Budget Measures 2018-19
| | | | | | | | | | | | | | | | | | | | |
| | | 2017-18
$‘000 | | | 2018-19
$‘000 | | | 2019-20
$‘000 | | | 2020-21
$‘000 | | | 2021-22
$‘000 | |
Instrumental Music Program | | | — | | | | 1,091 | | | | 2,914 | | | | 4,801 | | | | 5,610 | |
Delivering on our election commitments, the Government is providing additional funding of $14.4 million over four years (including an allocation of $1.5 million for non-state schools through the basket nexus funding arrangements) for additional instrumental music teachers and musical instruments for schools as part of the World Class Education election commitment.
| | | | | | | | | | | | | | | | | | | | |
| | | 2017-18
$‘000 | | | 2018-19
$‘000 | | | 2019-20
$‘000 | | | 2020-21
$‘000 | | | 2021-22
$‘000 | |
Youth Justice - Assessment of Education Needs at Brisbane and Townsville Courts | | | — | | | | — | | | | — | | | | — | | | | — | |
Funding of $1.5 million over three years from 2018-19 is being internally reprioritised by the department to support re-engagement of young people in the youth justice system with education and support services.
This forms part of the Government’s total funding of $40.7 million over four years ($22.3 million new funding and $18.4 million reprioritised funding) for youth justice support measures. Further details can be found in the Department of Child Safety, Youth and Women, Department of Housing and Public Works and Queensland Health sections of this chapter and the Queensland Health section of Chapter 3 Capital Measures.
42
Budget Measures 2018-19
Department of Employment, Small Business and Training
| | | | | | | | | | | | | | | | | | | | |
| | | 2017-18
$‘000 | | | 2018-19
$‘000 | | | 2019-20
$‘000 | | | 2020-21
$‘000 | | | 2021-22
$‘000 | |
Back to Work - Extension | | | 20,000 | | | | 45,000 | | | | 45,000 | | | | 45,000 | | | | — | |
Delivering on our election commitments, the Government has provided increased funding of $155 million over four years to extend the Back to Work regional program to continue to provide employer support payments to employers hiring eligible unemployed jobseekers in regional Queensland, with applications open until 30 June 2020.
| | | | | | | | | | | | | | | | | | | | |
| | | 2017-18
$‘000 | | | 2018-19
$‘000 | | | 2019-20
$‘000 | | | 2020-21
$‘000 | | | 2021-22
$‘000 | |
Back to Work - South East Queensland | | | — | | | | 15,100 | | | | 10,250 | | | | 6,150 | | | | — | |
The Government is providing increased funding of $11 million to respond to high demand and support Back to Work in South East Queensland, so applications can continue to be accepted to 30 June 2018. Further, increased funding of $20.5 million over three years to continue Back to Work in areas of South East Queensland with significant labour market challenges, with applications open until 30 June 2020.
| | | | | | | | | | | | | | | | | | | | |
| | | 2017-18
$‘000 | | | 2018-19
$‘000 | | | 2019-20
$‘000 | | | 2020-21
$‘000 | | | 2021-22
$‘000 | |
Back to Work - Mature Aged Worker Boost | | | 5,000 | | | | — | | | | — | | | | — | | | | — | |
Delivering on our election commitments, the Government has provided increased funding of $5 million in 2017-18 to introduce a Back to Work Mature Aged Worker Boost from 1 January 2018 until 30 June 2018 for mature-aged jobseekers aged 55 years and over. Under the Boost, employers who employ an eligible unemployed mature-aged jobseeker are eligible for payments of up to $20,000. Funding will also support delivery of the Government’s commitment to appoint a Mature Aged Ambassador and establish associated awards for employers.
43
Budget Measures 2018-19
| | | | | | | | | | | | | | | | | | | | |
| | | 2017-18
$‘000 | | | 2018-19
$‘000 | | | 2019-20
$‘000 | | | 2020-21
$‘000 | | | 2021-22
$‘000 | |
Skilling Queenslanders for Work | | | — | | | | 20,000 | | | | 80,000 | | | | 80,000 | | | | — | |
Delivering on our election commitments, the Government is providing increased funding of $180 million over three years to boost the Skilling Queenslanders for Work initiative to fund more apprenticeships and increase workforce participation through a range of targeted skills and training programs.
| | | | | | | | | | | | | | | | | | | | |
| | | 2017-18
$‘000 | | | 2018-19
$‘000 | | | 2019-20
$‘000 | | | 2020-21
$‘000 | | | 2021-22
$‘000 | |
Creating your Future Job | | | — | | | | 1,000 | | | | — | | | | — | | | | — | |
The Government is providing additional funding of $1 million in 2018-19 for a trial program designed to deliver targeted skills and specialist business advice and mentoring support to Queenslanders who want to create their own future job.
| | | | | | | | | | | | | | | | | | | | |
| | | 2017-18
$‘000 | | | 2018-19
$‘000 | | | 2019-20
$‘000 | | | 2020-21
$‘000 | | | 2021-22
$‘000 | |
Enhancing how Government and Small Business Participate in Regulatory Reform | | | — | | | | 350 | | | | 250 | | | | 250 | | | | 250 | |
The Government is providing additional funding of $1.1 million over four years for delivery of the Business Impact Statement commitment, including the establishment of the small business consultation panels.
44
Budget Measures 2018-19
| | | | | | | | | | | | | | | | | | | | |
| | | 2017-18
$‘000 | | | 2018-19
$‘000 | | | 2019-20
$‘000 | | | 2020-21
$‘000 | | | 2021-22
$‘000 | |
Supporting Queensland’s Dairy Producers | | | 250 | | | | 40 | | | | — | | | | — | | | | — | |
The Government has provided additional funding of $290,000 over two years to assist small processors and farmers to diversify their product range, and better develop their markets with improved branding and marketing.
This is part of a total funding package of $960,000 for marketing strategies to help consumers make better-informed decisions when they buy milk. Further funding can be found in the Department of Agriculture and Fisheries section of this chapter.
45
Budget Measures 2018-19
Department of Environment and Science
| | | | | | | | | | | | | | | | | | | | |
| | | 2017-18
$‘000 | | | 2018-19
$‘000 | | | 2019-20
$‘000 | | | 2020-21
$‘000 | | | 2021-22
$‘000 | |
Waste Disposal Levy - Advance Payments to Councils | | | — | | | | 31,975 | | | | — | | | | — | | | | — | |
The Government is providing additional funding of $32 million in 2018-19 for advance payments to councils to meet the cost of municipal household waste sent to landfill and to avoid any direct impact on households associated with the introduction of the Waste Disposal Levy in the first quarter of 2019. Future year payments will be based on actual levy costs incurred.
Waste levy revenue will also provide for waste industry programs and other environmental priorities of Government. Further details can be found in this section, the Department of Local Government, Racing and Multicultural Affairs and Department of State Development, Manufacturing, Infrastructure and Planning sections of this chapter and Chapter 4 Revenue Measures.
| | | | | | | | | | | | | | | | | | | | |
| | | 2017-18
$‘000 | | | 2018-19
$‘000 | | | 2019-20
$‘000 | | | 2020-21
$‘000 | | | 2021-22
$‘000 | |
Waste Disposal Levy - Implementation and operational costs | | | 200 | | | | 15,000 | | | | 6,180 | | | | 6,365 | | | | 6,556 | |
The Government has provided additional funding of $34.3 million over five years and $6.6 million per annum ongoing for the implementation of the Waste Disposal Levy in the first quarter of 2019 and its ongoing operation.
Further details can be found in this section, the Department of Local Government, Racing and Multicultural Affairs and Department of State Development, Manufacturing, Infrastructure and Planning sections of this chapter and Chapter 4 Revenue Measures.
46
Budget Measures 2018-19
| | | | | | | | | | | | | | | | | | | | |
| | | 2017-18
$‘000 | | | 2018-19
$‘000 | | | 2019-20
$‘000 | | | 2020-21
$‘000 | | | 2021-22
$‘000 | |
State Library of Queensland - First 5 Forever Reading Program | | | — | | | | 5,000 | | | | 5,000 | | | | 5,000 | | | | 5,000 | |
The Government is providing additional funding of $5 million per annum to continue the development of strong emergent literacy foundations and life-long learning capabilities for all Queensland children up to five years, by directly connecting parents and primary caregivers to a range of resources at public libraries across the State.
| | | | | | | | | | | | | | | | | | | | |
| | | 2017-18
$‘000 | | | 2018-19
$‘000 | | | 2019-20
$‘000 | | | 2020-21
$‘000 | | | 2021-22
$‘000 | |
Great Barrier Reef - Joint Field Management Program Intergovernmental Agreement Commitment | | | — | | | | 4,058 | | | | 3,900 | | | | 7,650 | | | | 10,400 | |
The Government is providing increased funding of $26 million over four years and $10.4 million per annum ongoing for the Great Barrier Reef Joint Field Management Program to protect and maintain marine and island ecosystems in the Great Barrier Reef.
| | | | | | | | | | | | | | | | | | | | |
| | | 2017-18
$‘000 | | | 2018-19
$‘000 | | | 2019-20
$‘000 | | | 2020-21
$‘000 | | | 2021-22
$‘000 | |
Great Barrier Reef - Water Quality | | | — | | | | 2,591 | | | | 5,889 | | | | 3,200 | | | | 2,160 | |
The Government is providing increased funding of $13.8 million over four years, including $10.1 million to support the cane, grazing and banana industries in Great Barrier Reef catchments to improve water quality.
47
Budget Measures 2018-19
| | | | | | | | | | | | | | | | | | | | |
| | | 2017-18
$‘000 | | | 2018-19
$‘000 | | | 2019-20
$‘000 | | | 2020-21
$‘000 | | | 2021-22
$‘000 | |
Queensland Performing Arts Centre | | | — | | | | 2,000 | | | | 2,000 | | | | 2,000 | | | | 2,000 | |
The Government is providing additional funding of $8 million over four years to support the Queensland Performing Arts Centre in extending its programming reach across the State, investing further in Aboriginal and Torres Strait Islander performing arts and developing a musical theatre incubator.
| | | | | | | | | | | | | | | | | | | | |
| | | 2017-18
$‘000 | | | 2018-19
$‘000 | | | 2019-20
$‘000 | | | 2020-21
$‘000 | | | 2021-22
$‘000 | |
Vegetation Management - Enhanced Statewide Landcover and Trees Study | | | — | | | | 1,998 | | | | 1,985 | | | | — | | | | — | |
The Government is providing increased funding of $4 million over two years to establish a scientific program to support an enhanced Statewide Landcover and Trees Study (SLATS) to identify and report on the condition and extent of regrowth vegetation and inform habitat conservation.
The department will work in collaboration with the Department of Natural Resources, Mines and Energy to deliver the program.
| | | | | | | | | | | | | | | | | | | | |
| | | 2017-18
$‘000 | | | 2018-19
$‘000 | | | 2019-20
$‘000 | | | 2020-21
$‘000 | | | 2021-22
$‘000 | |
Continuation of Compliance and Rehabilitation Action | | | — | | | | 1,859 | | | | — | | | | — | | | | — | |
The Government is providing increased funding of $1.9 million in 2018-19 to continue to manage allegations of serious environmental harm and to undertake further remediation of surface and groundwater impacted by by-products of Underground Coal Gasification.
48
Budget Measures 2018-19
| | | | | | | | | | | | | | | | | | | | |
| | | 2017-18
$‘000 | | | 2018-19
$‘000 | | | 2019-20
$‘000 | | | 2020-21
$‘000 | | | 2021-22
$‘000 | |
Queensland Cultural Centre - Electricity Supplementation and Future Energy Efficiency | | | 1,744 | | | | 1,800 | | | | — | | | | — | | | | — | |
The Government has provided additional funding of $3.5 million over two years to provide for electricity supplementation at the Queensland Cultural Centre, South Bank. The capital component of this measure can be found in Chapter 3 Capital Measures.
| | | | | | | | | | | | | | | | | | | | |
| | | 2017-18
$‘000 | | | 2018-19
$‘000 | | | 2019-20
$‘000 | | | 2020-21
$‘000 | | | 2021-22
$‘000 | |
Climate Change - Implementing Queensland’s Response | | | — | | | | 1,300 | | | | 1,500 | | | | 1,500 | | | | 1,300 | |
The Government is providing increased funding of $5.6 million over four years to enhance and strengthen delivery of the Queensland Government endorsed Queensland Climate Change Response. Funding will enable continued development and implementation of the Government Adaptation Action Plan including the Queensland Climate Resilient Council program and the sectors and systems program, and support significant adaptation risk projects such as sea level rise in the Torres Strait and other island communities.
| | | | | | | | | | | | | | | | | | | | |
| | | 2017-18
$‘000 | | | 2018-19
$‘000 | | | 2019-20
$‘000 | | | 2020-21
$‘000 | | | 2021-22
$‘000 | |
Government Action on North Stradbroke Island (Minjerribah) | | | 1,352 | | | | 1,280 | | | | 1,350 | | | | 1,350 | | | | 1,350 | |
The Government has provided increased funding of $6.7 million over five years and $1.4 million per annum ongoing to expand the protected area over North Stradbroke Island (Minjerribah) as part of joint management arrangements with traditional owners.
Further funding can be found in the Department of Natural Resources, Mines and Energy and Department of State Development, Manufacturing, Infrastructure and Planning sections of this chapter and Chapter 3 Capital Measures.
49
Budget Measures 2018-19
| | | | | | | | | | | | | | | | | | | | |
| | | 2017-18
$‘000 | | | 2018-19
$‘000 | | | 2019-20
$‘000 | | | 2020-21
$‘000 | | | 2021-22
$‘000 | |
EcoBiz Program for Small to Medium Enterprises - Continued Delivery | | | — | | | | 943 | | | | 971 | | | | 1,000 | | | | 1,031 | |
The Government is providing increased funding of $3.9 million over four years to continue delivering the ecoBiz program that helps small to medium sized businesses identify and achieve financial savings and eco-efficiency across energy, water and waste.
| | | | | | | | | | | | | | | | | | | | |
| | | 2017-18
$‘000 | | | 2018-19
$‘000 | | | 2019-20
$‘000 | | | 2020-21
$‘000 | | | 2021-22
$‘000 | |
National Parks Harsh Environment Fire Vehicles | | | — | | | | 804 | | | | — | | | | — | | | | — | |
The Government is providing increased funding of $804,000 in 2018-19 towards the operation of vehicles in harsh environments in Queensland’s Protected Area Estate to ensure the continued safety of staff, property and the community. The capital component of this measure can be found in Chapter 3 Capital Measures.
| | | | | | | | | | | | | | | | | | | | |
| | | 2017-18
$‘000 | | | 2018-19
$‘000 | | | 2019-20
$‘000 | | | 2020-21
$‘000 | | | 2021-22
$‘000 | |
Springvale Station Nature Refuge Management | | | — | | | | 509 | | | | 717 | | | | 746 | | | | 756 | |
The Government is providing increased funding of $2.7 million over four years to support the ongoing land management needs for Springvale Station Nature Refuge. This funding is critical to achieving conservation objectives for biodiversity values, including habitat for threatened species and a high diversity of terrestrial regional ecosystems.
50
Budget Measures 2018-19
| | | | | | | | | | | | | | | | | | | | |
| | | 2017-18
$‘000 | | | 2018-19
$‘000 | | | 2019-20
$‘000 | | | 2020-21
$‘000 | | | 2021-22
$‘000 | |
Queensland Conservation Council - Increased Support | | | — | | | | 350 | | | | 350 | | | | 350 | | | | 350 | |
The Government is providing increased funding of $1.8 million over five years from 2018-19 to support the Queensland Conservation Council and nine regional conservation councils meet ongoing operational expenses. This increase in funding will assist each recipient group to continue and improve the services they provide to their representative communities, as well as improve their ability to represent these communities on local environmental conservation issues.
| | | | | | | | | | | | | | | | | | | | |
| | | 2017-18
$‘000 | | | 2018-19
$‘000 | | | 2019-20
$‘000 | | | 2020-21
$‘000 | | | 2021-22
$‘000 | |
Protected Area Estate | | | 153 | | | | 102 | | | | 155 | | | | 125 | | | | 130 | |
The Government has provided increased funding of $665,000 over five years and $130,000 per annum ongoing for operational management costs associated with additional property of high conservation value which is to be added to the Queensland Protected Area Estate. The capital component of this measure can be found in Chapter 3 Capital Measures.
| | | | | | | | | | | | | | | | | | | | |
| | | 2017-18
$‘000 | | | 2018-19
$‘000 | | | 2019-20
$‘000 | | | 2020-21
$‘000 | | | 2021-22
$‘000 | |
Panama Disease Tropical Race 4 Program | | | 100 | | | | 100 | | | | 100 | | | | — | | | | — | |
The Government has provided increased funding of $300,000 over three years for the management of Panama disease. Further funding can be found in the Department of Agriculture and Fisheries section of this chapter.
51
Budget Measures 2018-19
| | | | | | | | | | | | | | | | | | | | |
| | | 2017-18
$‘000 | | | 2018-19
$‘000 | | | 2019-20
$‘000 | | | 2020-21
$‘000 | | | 2021-22
$‘000 | |
Container Refund Scheme | | | 1,500 | | | | — | | | | — | | | | — | | | | — | |
The Government has provided increased funding of $1.5 million in 2017-18 to assist in the establishment of collection point infrastructure across the State, as part of implementing the Container Refund Scheme.
| | | | | | | | | | | | | | | | | | | | |
| | | 2017-18
$‘000 | | | 2018-19
$‘000 | | | 2019-20
$‘000 | | | 2020-21
$‘000 | | | 2021-22
$‘000 | |
Heritage Property - Urgent Remedial Conservation Works | | | — | | | | — | | | | — | | | | — | | | | — | |
The Government is providing additional funding of $6.1 million over three years, held centrally pending negotiations about future management, which includes $5.8 million in 2018-19 for urgent remedial conservation works to heritage property to ensure the protection and structural integrity of State heritage buildings.
| | | | | | | | | | | | | | | | | | | | |
| | | 2017-18
$‘000 | | | 2018-19
$‘000 | | | 2019-20
$‘000 | | | 2020-21
$‘000 | | | 2021-22
$‘000 | |
Protected Area Estate - Acquisition | | | — | | | | — | | | | — | | | | — | | | | — | |
The Government is providing increased funding of $1.3 million over four years and $339,000 per annum ongoing, held centrally, to support critical infrastructure upgrades and maintenance costs associated with the proposed purchase of properties of high conservation value for inclusion in the Queensland Protected Area Estate. The capital component of this measure can be found in Chapter 3 Capital Measures.
52
Budget Measures 2018-19
| | | | | | | | | | | | | | | | | | | | |
| | | 2017-18
$‘000 | | | 2018-19
$‘000 | | | 2019-20
$‘000 | | | 2020-21
$‘000 | | | 2021-22
$‘000 | |
Queensland Art Gallery/Gallery of Modern Art Exhibitions | | | — | | | | — | | | | — | | | | 3,000 | | | | 3,000 | |
The Government will provide additional funding of $6 million over two years from 2020-21 to secure, promote, develop and deliver high profile, exclusive “blockbuster” and major exhibitions which are principal drivers of visitation and economic benefit.
| | | | | | | | | | | | | | | | | | | | |
| | | 2017-18
$‘000 | | | 2018-19
$‘000 | | | 2019-20
$‘000 | | | 2020-21
$‘000 | | | 2021-22
$‘000 | |
Reef Island Decarbonisation | | | 1,730 | | | | — | | | | — | | | | — | | | | — | |
Delivering on our election commitments, the Government has provided additional funding of $1.7 million in 2017-18 to assist the Great Barrier Reef Islands to cut their emissions by developing business cases for solar, wind and gas generation.
| | | | | | | | | | | | | | | | | | | | |
| | | 2017-18
$‘000 | | | 2018-19
$‘000 | | | 2019-20
$‘000 | | | 2020-21
$‘000 | | | 2021-22
$‘000 | |
Rockhampton Art Gallery | | | — | | | | — | | | | — | | | | — | | | | — | |
The Government is providing increased funding of $8 million over two years, held centrally, to the Rockhampton Regional Council for the construction of the new Rockhampton Art Gallery, subject to the confirmation of a $10 million contribution from the Australian Government. This brings total State funding for this measure to $10 million, following the provision of $2 million for initial planning in the 2017-18 Queensland Budget.
53
Budget Measures 2018-19
| | | | | | | | | | | | | | | | | | | | |
| | | 2017-18
$‘000 | | | 2018-19
$‘000 | | | 2019-20
$‘000 | | | 2020-21
$‘000 | | | 2021-22
$‘000 | |
Waste Investigation | | | 846 | | | | — | | | | — | | | | — | | | | — | |
The Government has provided increased funding of $846,000 in 2017-18 to fund a Waste Investigation by the Honourable Peter Lyons into the transportation of waste into Queensland from interstate sources.
| | | | | | | | | | | | | | | | | | | | |
| | | 2017-18
$‘000 | | | 2018-19
$‘000 | | | 2019-20
$‘000 | | | 2020-21
$‘000 | | | 2021-22
$‘000 | |
Woodfordia Infrastructure Upgrade | | | 1,000 | | | | — | | | | — | | | | — | | | | — | |
Delivering on our election commitments, the Government has provided additional funding of $1 million in 2017-18 for an infrastructure upgrade of facilities at Woodfordia, the site of the Woodford Folk Festival. The department has internally reprioritised $1 million which brings total funding to $2 million.
54
Budget Measures 2018-19
Department of Housing and Public Works
| | | | | | | | | | | | | | | | | | | | |
| | | 2017-18
$‘000 | | | 2018-19
$‘000 | | | 2019-20
$‘000 | | | 2020-21
$‘000 | | | 2021-22
$‘000 | |
Responsive Government - Service Transformation | | | — | | | | 8,820 | | | | — | | | | — | | | | — | |
The Government is providing increased funding of $8.8 million in 2018-19 to continue to provide digital technology and service design capabilities to improve customer services, bringing total funding to $16.9 million.
| | | | | | | | | | | | | | | | | | | | |
| | | 2017-18
$‘000 | | | 2018-19
$‘000 | | | 2019-20
$‘000 | | | 2020-21
$‘000 | | | 2021-22
$‘000 | |
Sports Grant Funding Boost | | | — | | | | 7,982 | | | | 2,450 | | | | — | | | | — | |
The Government is providing additional funding of $10.4 million over two years to support a number of community infrastructure development projects to increase the opportunity for Queenslanders to participate in sport and active recreation.
| | | | | | | | | | | | | | | | | | | | |
| | | 2017-18
$‘000 | | | 2018-19
$‘000 | | | 2019-20
$‘000 | | | 2020-21
$‘000 | | | 2021-22
$‘000 | |
Underwood Sports Park | | | 4,110 | | | | 5,000 | | | | — | | | | — | | | | — | |
Delivering on our election commitments, the Government has provided additional funding of $9.1 million over two years as part of a comprehensive redevelopment of the Underwood Park sports precinct.
55
Budget Measures 2018-19
| | | | | | | | | | | | | | | | | | | | |
| | | 2017-18
$‘000 | | | 2018-19
$‘000 | | | 2019-20
$‘000 | | | 2020-21
$‘000 | | | 2021-22
$‘000 | |
Safe, secure sporting and entertainment facilities | | | 5,800 | | | | 2,500 | | | | — | | | | — | | | | — | |
The Government has provided additional funding of $8.3 million over two years to assist with the security upgrades to Stadiums Queensland venues throughout Queensland. The security measures will identify security-related improvements and enhancements to include perimeter barriers, alarm monitoring, surveillance capability, entry searches and staff training.
| | | | | | | | | | | | | | | | | | | | |
| | | 2017-18
$‘000 | | | 2018-19
$‘000 | | | 2019-20
$‘000 | | | 2020-21
$‘000 | | | 2021-22
$‘000 | |
Zillmere Sports Centre | | | 500 | | | | 2,000 | | | | 3,000 | | | | — | | | | — | |
Delivering on our election commitments, the Government has provided additional funding of $5.5 million over three years to redevelop a Government-owned building into an indoor sports complex at Zillmere.
| | | | | | | | | | | | | | | | | | | | |
| | | 2017-18
$‘000 | | | 2018-19
$‘000 | | | 2019-20
$‘000 | | | 2020-21
$‘000 | | | 2021-22
$‘000 | |
Security of Payment for Subcontractors in the Building and Construction Industry | | | 2,620 | | | | 1,000 | | | | 1,000 | | | | — | | | | — | |
The Government has provided additional funding of $4.6 million over three years. This includes $3.1 million to promote public awareness of the Government’s project bank account reforms to improve security of payment for subcontractors in the building and construction industry and, delivering on our election commitment, $1.5 million for the Queensland Building and Construction Commission to undertake a full business architecture review, including development of an IT solution to improve efficiency in delivering existing services and effectively implementing building policy reforms.
56
Budget Measures 2018-19
| | | | | | | | | | | | | | | | | | | | |
| | | 2017-18
$‘000 | | | 2018-19
$‘000 | | | 2019-20
$‘000 | | | 2020-21
$‘000 | | | 2021-22
$‘000 | |
Building and Asset Services Apprenticeship Program and Compliance with the Queensland Government Building and Construction Training Policy | | | 1,000 | | | | 800 | | | | 800 | | | | — | | | | — | |
Delivering on our election commitments, the Government has provided additional funding of $2.6 million over three years to re-establish and implement the Building and Asset Services apprenticeship program, and to enhance compliance with the Queensland Government Building and Construction Training policy.
| | | | | | | | | | | | | | | | | | | | |
| | | 2017-18
$‘000 | | | 2018-19
$‘000 | | | 2019-20
$‘000 | | | 2020-21
$‘000 | | | 2021-22
$‘000 | |
Embedding Procurement Reform | | | — | | | | 535 | | | | 535 | | | | 535 | | | | 535 | |
The Government is providing additional funding of $535,000 per annum from 2018-19 to strengthen the procurement compliance, coordination and referral function to ensure contractual commitments made by suppliers are upheld.
| | | | | | | | | | | | | | | | | | | | |
| | | 2017-18
$‘000 | | | 2018-19
$‘000 | | | 2019-20
$‘000 | | | 2020-21
$‘000 | | | 2021-22
$‘000 | |
Thomas Dixon Centre Refurbishment | | | — | | | | 500 | | | | — | | | | — | | | | — | |
The Government is providing additional funding of $500,000 in 2018-19 to expedite design works for the refurbishment of the Thomas Dixon Centre to provide enhanced performance facilities for Queensland Ballet.
This is part of an overall package of $14 million over two years towards the refurbishment of the Thomas Dixon Centre. The capital component of this measure can be found in Chapter 3 Capital Measures.
57
Budget Measures 2018-19
| | | | | | | | | | | | | | | | | | | | |
| | | 2017-18
$‘000 | | | 2018-19
$‘000 | | | 2019-20
$‘000 | | | 2020-21
$‘000 | | | 2021-22
$‘000 | |
Non Conforming Building Products Audit Taskforce | | | 4,462 | | | | 393 | | | | — | | | | — | | | | — | |
The Government has provided additional funding of $4.9 million over two years for the Non-Conforming Building Products Audit Taskforce. An additional $1.6 million has been internally reprioritised by the department in 2017-18 to fund this measure.
The funding will allow the Taskforce to undertake assessments of Government Buildings as well as develop self-assessment processes and systems for use by private sector building owners.
This forms part of the Government’s overall package of $7.6 million over two years to support taskforce operations in assessing the critical safety risks posed by combustible cladding on Government and non-Government buildings throughout Queensland. Further funding can be found in the Queensland Fire and Emergency Services section of this chapter.
| | | | | | | | | | | | | | | | | | | | |
| | | 2017-18
$‘000 | | | 2018-19
$‘000 | | | 2019-20
$‘000 | | | 2020-21
$‘000 | | | 2021-22
$‘000 | |
Local Sporting Infrastructure | | | — | | | | — | | | | — | | | | — | | | | — | |
The Government is providing additional funding of $15 million, held centrally, to support the development of local sporting infrastructure. Some proposals will require matching contributions from other levels of government.
| | | | | | | | | | | | | | | | | | | | |
| | | 2017-18
$‘000 | | | 2018-19
$‘000 | | | 2019-20
$‘000 | | | 2020-21
$‘000 | | | 2021-22
$‘000 | |
University of the Sunshine Coast Stadium | | | 7,000 | | | | — | | | | — | | | | — | | | | — | |
Delivering on our election commitments, the Government has provided additional funding of $7 million in 2017-18 to complete the refurbishment of the University of the Sunshine Coast Stadium, which will expand the indoor seating capacity and provide additional amenities.
58
Budget Measures 2018-19
| | | | | | | | | | | | | | | | | | | | |
| | | 2017-18
$‘000 | | | 2018-19
$‘000 | | | 2019-20
$‘000 | | | 2020-21
$‘000 | | | 2021-22
$‘000 | |
Youth Justice - Youth and Family Head Leases | | | — | | | | — | | | | — | | | | — | | | | — | |
Funding of $623,000 over three years from 2018-19 is being internally reprioritised by the department to improve housing responses to young people in the youth justice system and their families at risk of homelessness.
This forms part of the Government’s total funding of $40.7 million over four years ($22.3 million new funding and $18.4 million reprioritised funding) for youth justice support measures. Further details can be found in the Department of Child Safety, Youth and Women, Department of Education, and Queensland Health sections of this chapter and the Queensland Health section of Chapter 3 Capital Measures.
59
Budget Measures 2018-19
Department of Innovation, Tourism Industry Development and the Commonwealth Games
| | | | | | | | | | | | | | | | | | | | |
| | | 2017-18
$‘000 | | | 2018-19
$‘000 | | | 2019-20
$‘000 | | | 2020-21
$‘000 | | | 2021-22
$‘000 | |
Making Queensland Australia’s Events Capital | | | — | | | | 7,500 | | | | 12,000 | | | | 16,500 | | | | — | |
Delivering on our election commitments, the Government is providing increased funding of $36 million over three years to attract more major events to Queensland. This investment will drive growth of major events throughout Queensland making it Australia’s Events Capital.
| | | | | | | | | | | | | | | | | | | | |
| | | 2017-18
$‘000 | | | 2018-19
$‘000 | | | 2019-20
$‘000 | | | 2020-21
$‘000 | | | 2021-22
$‘000 | |
Continuation of the Funding Guarantee for Tourism and Events Queensland | | | — | | | | — | | | | — | | | | — | | | | 46,875 | |
The Government will provide increased funding of $46.9 million in 2021-22 to continue the restoration of funding to Tourism and Events Queensland (TEQ). This will allow TEQ to carry out its core functions including promoting Queensland destinations and driving tourism growth.
| | | | | | | | | | | | | | | | | | | | |
| | | 2017-18
$‘000 | | | 2018-19
$‘000 | | | 2019-20
$‘000 | | | 2020-21
$‘000 | | | 2021-22
$‘000 | |
Growing Tourism, Growing Tourism Jobs | | | 9,000 | | | | 20,700 | | | | 27,200 | | | | 35,200 | | | | 2,500 | |
Delivering on our election commitments, the Government has provided additional funding of $94.6 million over five years to progress initiatives under the Growing Tourism, Growing Tourism Jobs initiative. This includes $48.6 million for the Attracting Tourism Fund to provide incentives to attract new international airline routes and cruise ships to Queensland.
It also includes $46 million for a new Regional Tourism Infrastructure and Experience Development program to assist communities to grow tourism by developing new and improved tourism experiences or products and develop tourism industry capability, including facilitation of outback tourism projects.
60
Budget Measures 2018-19
| | | | | | | | | | | | | | | | | | | | |
| | | 2017-18
$‘000 | | | 2018-19
$‘000 | | | 2019-20
$‘000 | | | 2020-21
$‘000 | | | 2021-22
$‘000 | |
Advance Queensland Foundations of the Future | | | — | | | | 15,900 | | | | 16,000 | | | | 18,000 | | | | 23,150 | |
Delivering on our election commitments, the Government is providing increased funding of $73 million over four years for the Advance Queensland initiative including $30 million for Ignite Ideas which is helping Queensland startups and small and medium enterprises to succeed and $26 million for Industry Research Fellowships which support collaboration between researchers and industry to solve some of the State’s biggest challenges.
This measure is incorporated into Government’s $650 million Advance Queensland initiative to foster innovation and entrepreneurialism, capitalise on our natural advantages, and help raise Queensland’s profile as an attractive investment destination.
| | | | | | | | | | | | | | | | | | | | |
| | | 2017-18
$‘000 | | | 2018-19
$‘000 | | | 2019-20
$‘000 | | | 2020-21
$‘000 | | | 2021-22
$‘000 | |
Great Barrier Reef Island Rejuvenation Package | | | 5,000 | | | | 10,000 | | | | 10,000 | | | | — | | | | — | |
Delivering on our election commitments, the Government has provided additional funding of $25 million over three years to establish a Reef Resort Rejuvenation Fund to deliver infrastructure for Great Barrier Reef islands. The fund will prioritise projects focused on growing, greening and cleaning.
| | | | | | | | | | | | | | | | | | | | |
| | | 2017-18
$‘000 | | | 2018-19
$‘000 | | | 2019-20
$‘000 | | | 2020-21
$‘000 | | | 2021-22
$‘000 | |
Advance Queensland Increase | | | 18,000 | | | | 8,000 | | | | 8,000 | | | | 8,000 | | | | 8,000 | |
The Government has provided increased funding of $50 million over five years to continue funding programs under the Advance Queensland initiative. Measures funded will include expansion of ‘The Precinct’, the State’s flagship hub for start-ups; support for the Clem Jones Centre for Ageing and Dementia Research; and a range of programs to drive and scale innovation in Queensland including driving the development of key technologies such as artificial intelligence, big data, drones and robotics in Queensland industry and programs focussing on innovation and the digital economy in our regions.
61
Budget Measures 2018-19
| | | | | | | | | | | | | | | | | | | | |
| | | 2017-18
$‘000 | | | 2018-19
$‘000 | | | 2019-20
$‘000 | | | 2020-21
$‘000 | | | 2021-22
$‘000 | |
Major Events Funding | | | 9,380 | | | | 5,250 | | | | 5,526 | | | | 5,314 | | | | — | |
The Government has provided additional funding of $26.2 million over four years to secure major events for Queensland. This funding supports the Advancing Tourism 2016-20: Growing Queensland Jobs Strategy by attracting and growing events as one of the key strategies to capitalise on Queensland’s growing tourism industry and increase market share.
The funding also includes reprioritisation from savings of $650,000 over two years from 2018-19, towards tourism projects which will build on the legacy of the Gold Coast 2018 Commonwealth Games and, delivering on our election commitment, support preparation of a business case for staging supercars racing at Rockhampton.
| | | | | | | | | | | | | | | | | | | | |
| | | 2017-18
$‘000 | | | 2018-19
$‘000 | | | 2019-20
$‘000 | | | 2020-21
$‘000 | | | 2021-22
$‘000 | |
Australian Workers Heritage Centre | | | 500 | | | | 1,700 | | | | — | | | | — | | | | — | |
The Government has provided additional funding of $2.2 million over two years to meet the costs of upgrades at the Australian Workers’ Heritage Centre including refurbishment and extension of premises and exhibits.
62
Budget Measures 2018-19
Department of Justice and Attorney-General
| | | | | | | | | | | | | | | | | | | | |
| | | 2017-18
$‘000 | | | 2018-19
$‘000 | | | 2019-20
$‘000 | | | 2020-21
$‘000 | | | 2021-22
$‘000 | |
Blue Card Services ‘No Card, No Start’ | | | — | | | | 3,050 | | | | 2,775 | | | | 1,420 | | | | — | |
Delivering on our election commitments, the Government is providing additional funding of $7.2 million over three years to implement an online Blue Card application system as part of the Government’s ‘No Card, No Start’ initiative. The capital component of this measure can be found in Chapter 3 Capital Measures.
| | | | | | | | | | | | | | | | | | | | |
| | | 2017-18
$‘000 | | | 2018-19
$‘000 | | | 2019-20
$‘000 | | | 2020-21
$‘000 | | | 2021-22
$‘000 | |
Blue Card Services Efficiency Savings | | | — | | | | 5,000 | | | | — | | | | — | | | | — | |
The Government is providing increased funding of $5 million in 2018-19 for savings not realised from Blue Card Services by the former Government as part of the commitment to protect jobs and maintain the integrity of the Blue Card System. This will enable Blue Card Services to continue current staffing and capability levels.
| | | | | | | | | | | | | | | | | | | | |
| | | 2017-18
$‘000 | | | 2018-19
$‘000 | | | 2019-20
$‘000 | | | 2020-21
$‘000 | | | 2021-22
$‘000 | |
Queensland Courts and Justice Services | | | — | | | | 10,000 | | | | — | | | | — | | | | — | |
The Government is providing increased funding of $10 million in 2018-19 to respond to increased criminal, domestic and family violence matters in Queensland Courts, dangerous sexual offender matters and other justice system initiatives.
63
Budget Measures 2018-19
| | | | | | | | | | | | | | | | | | | | |
| | | 2017-18
$‘000 | | | 2018-19
$‘000 | | | 2019-20
$‘000 | | | 2020-21
$‘000 | | | 2021-22
$‘000 | |
Victim Assist Queensland | | | — | | | | 5,700 | | | | 5,700 | | | | — | | | | — | |
The Government is providing increased funding of $11.4 million over two years to provide financial support to victims of crime.
| | | | | | | | | | | | | | | | | | | | |
| | | 2017-18
$‘000 | | | 2018-19
$‘000 | | | 2019-20
$‘000 | | | 2020-21
$‘000 | | | 2021-22
$‘000 | |
Gambling Help Service System | | | — | | | | 5,277 | | | | 5,295 | | | | 5,314 | | | | 5,333 | |
The Government is providing increased funding of $21.2 million over four years and $5.3 million per annum ongoing to continue to provide counselling and support services for people adversely affected by problem gambling.
| | | | | | | | | | | | | | | | | | | | |
| | | 2017-18
$‘000 | | | 2018-19
$‘000 | | | 2019-20
$‘000 | | | 2020-21
$‘000 | | | 2021-22
$‘000 | |
Office of the Director of Public Prosecutions | | | — | | | | 5,000 | | | | — | | | | — | | | | — | |
The Government is providing increased funding of $5 million in 2018-19 to respond to increased workload within the Office of the Director of Public Prosecutions.
| | | | | | | | | | | | | | | | | | | | |
| | | 2017-18
$‘000 | | | 2018-19
$‘000 | | | 2019-20
$‘000 | | | 2020-21
$‘000 | | | 2021-22
$‘000 | |
Director of Child Protection Litigation | | | — | | | | 4,630 | | | | — | | | | — | | | | — | |
The Government is providing increased funding of $4.6 million in 2018-19 for additional staff for the Director of Child Protection Litigation. This funding will support the management of child protection order applications and proceedings by the Director of Child Protection Litigation, including working with the Office of the Child and Family Official Solicitor.
Details of funding for the Office of the Child and Family Official Solicitor can be found in the Department of Child Safety, Youth and Women section of this chapter.
64
Budget Measures 2018-19
| | | | | | | | | | | | | | | | | | | | |
| | | 2017-18
$‘000 | | | 2018-19
$‘000 | | | 2019-20
$‘000 | | | 2020-21
$‘000 | | | 2021-22
$‘000 | |
Crime and Corruption Commission - Digital Investigative and Information Security Services | | | — | | | | 3,374 | | | | 3,593 | | | | 3,792 | | | | 3,897 | |
The Government is providing additional funding of $14.7 million over four years and $3.9 million per annum ongoing to enhance the processing of digital evidence and to provide for a contemporary information security platform. The capital component of this measure can be found in Chapter 3 Capital Measures.
| | | | | | | | | | | | | | | | | | | | |
| | | 2017-18
$‘000 | | | 2018-19
$‘000 | | | 2019-20
$‘000 | | | 2020-21
$‘000 | | | 2021-22
$‘000 | |
Recording and Transcription Services | | | — | | | | 2,881 | | | | 6,494 | | | | 4,646 | | | | — | |
The Government is providing increased funding of $14 million over three years for the continued delivery of recording and transcription services within Queensland Courts.
| | | | | | | | | | | | | | | | | | | | |
| | | 2017-18
$‘000 | | | 2018-19
$‘000 | | | 2019-20
$‘000 | | | 2020-21
$‘000 | | | 2021-22
$‘000 | |
Office of the Public Guardian and Queensland Civil and Administrative Tribunal | | | — | | | | 2,500 | | | | — | | | | — | | | | — | |
The Government is providing additional funding of $2.5 million in 2018-19 for the Office of the Public Guardian and the Queensland Civil and Administrative Tribunal to meet immediate demand pressures related to the rollout of the National Disability Insurance Scheme.
65
Budget Measures 2018-19
| | | | | | | | | | | | | | | | | | | | |
| | | 2017-18
$‘000 | | | 2018-19
$‘000 | | | 2019-20
$‘000 | | | 2020-21
$‘000 | | | 2021-22
$‘000 | |
Tackling Alcohol Fuelled Violence Program - Safe Night Precincts | | | — | | | | 2,042 | | | | — | | | | — | | | | — | |
The Government is providing increased funding of $2 million in 2018-19 to continue inspections of licensed venues during peak trading periods and to monitor the industry’s progress on implementing and complying with the Tackling Alcohol Fuelled Violence policy.
This forms part of the Government’s Tackling Alcohol Fuelled Violence Program. Further details of this funding can be found in the Queensland Corrective Services, Queensland Police Service and Department of Communities, Disability Services and Seniors sections of this chapter.
| | | | | | | | | | | | | | | | | | | | |
| | | 2017-18
$‘000 | | | 2018-19
$‘000 | | | 2019-20
$‘000 | | | 2020-21
$‘000 | | | 2021-22
$‘000 | |
Queensland Sentencing Advisory Council | | | — | | | | 1,851 | | | | 1,638 | | | | 1,677 | | | | 1,717 | |
The Government is providing increased funding of $6.9 million over four years and $1.7 million per annum ongoing for the continued delivery of the Queensland Sentencing Advisory Council which educates the community about the justice system and sentencing, collates statistical information about sentencing, and researches the effectiveness of sentencing practices in reducing crime.
| | | | | | | | | | | | | | | | | | | | |
| | | 2017-18
$‘000 | | | 2018-19
$‘000 | | | 2019-20
$‘000 | | | 2020-21
$‘000 | | | 2021-22
$‘000 | |
Crime and Corruption Commission - Investigative Capability | | | — | | | | 1,792 | | | | 1,832 | | | | 1,872 | | | | 1,913 | |
The Government is providing additional funding of $7.4 million over four years and $1.9 million per annum ongoing for additional frontline investigators to combat major crime and corruption.
66
Budget Measures 2018-19
| | | | | | | | | | | | | | | | | | | | |
| | | 2017-18
$‘000 | | | 2018-19
$‘000 | | | 2019-20
$‘000 | | | 2020-21
$‘000 | | | 2021-22
$‘000 | |
Specialist Courts - Murri Court and Court Link | | | — | | | | 1,703 | | | | 2,408 | | | | 2,482 | | | | 2,527 | |
The Government is providing increased funding of $9.1 million over four years and $2.5 million per annum ongoing to support the continued delivery of the Murri Court and expansion of Court Link services to Southport, Mount Isa and Ipswich.
| | | | | | | | | | | | | | | | | | | | |
| | | 2017-18
$‘000 | | | 2018-19
$‘000 | | | 2019-20
$‘000 | | | 2020-21
$‘000 | | | 2021-22
$‘000 | |
Aurukun Restorative Justice Program | | | — | | | | 910 | | | | — | | | | — | | | | — | |
The Government is providing increased funding of $910,000 in 2018-19 to support the continued delivery of the Restorative Justice Program in Aurukun.
This forms part of the Government’s overall package of $1.6 million to continue the Aurukun Four Point Plan in 2018-19 to address safety and support the community. Further funding can be found in the Department of Aboriginal and Torres Strait Islander Partnerships and Queensland Corrective Services sections of this chapter.
| | | | | | | | | | | | | | | | | | | | |
| | | 2017-18
$‘000 | | | 2018-19
$‘000 | | | 2019-20
$‘000 | | | 2020-21
$‘000 | | | 2021-22
$‘000 | |
Office of the Information Commissioner | | | — | | | | 598 | | | | 613 | | | | 628 | | | | 644 | |
The Government is providing increased funding of $2.5 million over four years and $644,000 per annum ongoing for additional review officers.
67
Budget Measures 2018-19
| | | | | | | | | | | | | | | | | | | | |
| | | 2017-18
$‘000 | | | 2018-19
$‘000 | | | 2019-20
$‘000 | | | 2020-21
$‘000 | | | 2021-22
$‘000 | |
Queensland Family and Child Commission | | | — | | | | 396 | | | | — | | | | — | | | | — | |
The Government is providing additional funding of $396,000 in 2018-19 to address online child safety and child exploitation, and to empower children and young people to have a voice and contribute to discussion about issues affecting them and their future.
| | | | | | | | | | | | | | | | | | | | |
| | | 2017-18
$‘000 | | | 2018-19
$‘000 | | | 2019-20
$‘000 | | | 2020-21
$‘000 | | | 2021-22
$‘000 | |
Domestic and Family Violence Response - Specialist Domestic and Family Violence Courts | | | — | | | | 264 | | | | 459 | | | | 463 | | | | 468 | |
The Government is providing additional funding of $1.7 million over four years and $468,000 per annum ongoing to expand the Townsville Specialist Domestic and Family Violence (DFV) Court (including circuit courts in Mount Isa and Palm Island) to include criminal DFV matters.
Total funding for the expansion of the Townsville Specialist DFV Court is $8.1 million over four years and $2.3 million per annum ongoing. Further funding can be found in the Queensland Police Service, Queensland Corrective Services, and the Department of Child Safety, Youth and Women sections of this chapter.
| | | | | | | | | | | | | | | | | | | | |
| | | 2017-18
$‘000 | | | 2018-19
$‘000 | | | 2019-20
$‘000 | | | 2020-21
$‘000 | | | 2021-22
$‘000 | |
Coroners Court of Queensland | | | — | | | | 258 | | | | — | | | | — | | | | — | |
The Government is providing increased funding of $258,000 in 2018-19 to support the coronial inquest into deaths at Dreamworld.
68
Budget Measures 2018-19
| | | | | | | | | | | | | | | | | | | | |
| | | 2017-18
$‘000 | | | 2018-19
$‘000 | | | 2019-20
$‘000 | | | 2020-21
$‘000 | | | 2021-22
$‘000 | |
Anti-Discrimination Commission Queensland - Human Rights Act for Queensland | | | — | | | | 244 | | | | 834 | | | | 604 | | | | 616 | |
Delivering on our election commitments, the Government is providing additional funding of $2.3 million over four years and $616,000 per annum ongoing to the Anti-Discrimination Commission to support the operation and administration of a Human Rights Act for Queensland. The capital component of this measure can be found in Chapter 3 Capital Measures.
69
Budget Measures 2018-19
Department of Local Government, Racing and Multicultural Affairs
| | | | | | | | | | | | | | | | | | | | |
| | | 2017-18
$‘000 | | | 2018-19
$‘000 | | | 2019-20
$‘000 | | | 2020-21
$‘000 | | | 2021-22
$‘000 | |
Works for Queensland | | | — | | | | 50,000 | | | | 75,000 | | | | 75,000 | | | | — | |
Delivering on our election commitments, the Government is providing increased funding of $200 million over three years to extend the Works for Queensland program, which will continue to support job-creating maintenance and minor infrastructure works across regional Queensland, bringing the total funding of this program to $600 million over five years from 2016-17.
| | | | | | | | | | | | | | | | | | | | |
| | | 2017-18
$‘000 | | | 2018-19
$‘000 | | | 2019-20
$‘000 | | | 2020-21
$‘000 | | | 2021-22
$‘000 | |
Support for Country Racing | | | 11,600 | | | | 12,600 | | | | 13,600 | | | | 17,600 | | | | — | |
Delivering on our election commitments, the Government has provided increased funding of $55.4 million over four years to support country racing clubs including, funding for racing club infrastructure across the State. This measure brings total funding for country racing to $70.4 million over four years.
| | | | | | | | | | | | | | | | | | | | |
| | | 2017-18
$‘000 | | | 2018-19
$‘000 | | | 2019-20
$‘000 | | | 2020-21
$‘000 | | | 2021-22
$‘000 | |
Torres Shire Water Treatment Infrastructure Upgrade | | | — | | | | 4,500 | | | | 7,500 | | | | — | | | | — | |
The Government is providing additional funding of up to $12 million over two years to upgrade Torres Shire Council’s drinking water treatment infrastructure including water filtration and other related infrastructure on Thursday Island and Horn Island.
The adjacent Hammond Island will also benefit from the upgrade as its drinking water is sourced primarily from Torres Shire Council via a pipeline.
70
Budget Measures 2018-19
| | | | | | | | | | | | | | | | | | | | |
| | | 2017-18
$‘000 | | | 2018-19
$‘000 | | | 2019-20
$‘000 | | | 2020-21
$‘000 | | | 2021-22
$‘000 | |
Building Integrity and Sustainability in Local Government | | | — | | | | 3,967 | | | | 3,360 | | | | 3,382 | | | | 3,416 | |
The Government is providing additional funding of $14.1 million over four years to enhance the integrity and sustainability of the local government system by establishing an independent body to consider councillor conduct complaints and improve governance practices.
| | | | | | | | | | | | | | | | | | | | |
| | | 2017-18
$‘000 | | | 2018-19
$‘000 | | | 2019-20
$‘000 | | | 2020-21
$‘000 | | | 2021-22
$‘000 | |
Torres Strait and Palm Island Car and Waste Metal Removal | | | — | | | | 2,500 | | | | 2,500 | | | | — | | | | — | |
The Government is providing additional funding of $5 million over two years to remove waste metal build-up including vehicle stockpiles from communities located in the Torres Strait Island Regional Council, Palm Island Aboriginal Shire Council and Torres Shire Council areas. The $2.5 million funding allocation in 2019-20 is to be met by revenue collected from the Waste Disposal Levy.
Further details can be found in the Department of Environment and Science and Department of State Development, Manufacturing, Infrastructure and Planning sections of this chapter and the Department of Environment and Science section of Chapter 4 Revenue Measures.
| | | | | | | | | | | | | | | | | | | | |
| | | 2017-18
$‘000 | | | 2018-19
$‘000 | | | 2019-20
$‘000 | | | 2020-21
$‘000 | | | 2021-22
$‘000 | |
Implementing More Effective Funding Grants to Local Government | | | — | | | | 1,700 | | | | 500 | | | | 500 | | | | 500 | |
The Government is providing additional funding of $3.2 million over four years to undertake implementation planning to improve and simplify the administration of grants to local government. This measure progresses the recommendations from the Review of Grants to Local Government: Current and future state assessments. The capital component of this measure can be found in Chapter 3 Capital Measures.
71
Budget Measures 2018-19
| | | | | | | | | | | | | | | | | | | | |
| | | 2017-18
$‘000 | | | 2018-19
$‘000 | | | 2019-20
$‘000 | | | 2020-21
$‘000 | | | 2021-22
$‘000 | |
Kowanyama Aboriginal Shire Council Economic Growth and Jobs Initiative | | | — | | | | 1,100 | | | | — | | | | — | | | | — | |
The Government is providing additional funding of $1.1 million in 2018-19 to fund the purchase of appropriate heavy equipment necessary to establish a road and construction unit within the Kowanyama Aboriginal Shire Council.
| | | | | | | | | | | | | | | | | | | | |
| | | 2017-18
$‘000 | | | 2018-19
$‘000 | | | 2019-20
$‘000 | | | 2020-21
$‘000 | | | 2021-22
$‘000 | |
Celebrating Multicultural Queensland Grants Program | | | — | | | | 1,000 | | | | 1,000 | | | | 1,000 | | | | — | |
Delivering on our election commitments, the Government is providing increased funding of $3 million over three years to support community initiatives which promote a harmonious, welcoming and inclusive community.
| | | | | | | | | | | | | | | | | | | | |
| | | 2017-18
$‘000 | | | 2018-19
$‘000 | | | 2019-20
$‘000 | | | 2020-21
$‘000 | | | 2021-22
$‘000 | |
State Government Financial Aid - Indexation | | | — | | | | 759 | | | | 1,536 | | | | 2,334 | | | | 3,241 | |
The Government is providing additional funding of $7.9 million over four years to align future indexation of funding provided under the State Government Financial Aid program, with the mid-point of the Reserve Bank of Australia’s inflation target.
| | | | | | | | | | | | | | | | | | | | |
| | | 2017-18
$‘000 | | | 2018-19
$‘000 | | | 2019-20
$‘000 | | | 2020-21
$‘000 | | | 2021-22
$‘000 | |
Show Society Grants Program | | | — | | | | 133 | | | | 133 | | | | 134 | | | | — | |
Delivering on our election commitments, the Government is providing increased funding of $400,000 over three years for the Show Society Grants Program which supports Queensland Show Societies conduct annual agricultural shows and to upgrade and maintain existing showground facilities.
72
Budget Measures 2018-19
| | | | | | | | | | | | | | | | | | | | |
| | | 2017-18
$‘000 | | | 2018-19
$‘000 | | | 2019-20
$‘000 | | | 2020-21
$‘000 | | | 2021-22
$‘000 | |
Ayr Nature-Based Playground | | | 1,500 | | | | — | | | | — | | | | — | | | | — | |
Delivering on our election commitments, the Government has provided increased funding of $1.5 million in 2017-18 for further development of a nature-based playground at Ayr.
| | | | | | | | | | | | | | | | | | | | |
| | | 2017-18
$‘000 | | | 2018-19
$‘000 | | | 2019-20
$‘000 | | | 2020-21
$‘000 | | | 2021-22
$‘000 | |
Beautiful Bowen | | | 5,000 | | | | — | | | | — | | | | — | | | | — | |
Delivering on our election commitments, the Government has provided additional funding of $5 million in 2017-18 for the Whitsunday Regional Council’s Beautiful Bowen Project. This project will improve the streetscapes and tourism infrastructure in Bowen to attract more domestic and international tourists.
| | | | | | | | | | | | | | | | | | | | |
| | | 2017-18
$‘000 | | | 2018-19
$‘000 | | | 2019-20
$‘000 | | | 2020-21
$‘000 | | | 2021-22
$‘000 | |
Mount Archer Master Plan | | | 400 | | | | — | | | | — | | | | — | | | | — | |
Delivering on our election commitments, the Government has provided additional funding of $400,000 in 2017-18 to build a new open-air amphitheatre at Mount Archer.
| | | | | | | | | | | | | | | | | | | | |
| | | 2017-18
$‘000 | | | 2018-19
$‘000 | | | 2019-20
$‘000 | | | 2020-21
$‘000 | | | 2021-22
$‘000 | |
Support for Refugees and Asylum Seekers | | | 700 | | | | — | | | | — | | | | — | | | | — | |
The Government has provided additional funding of $700,000 in 2017-18 and reprioritised funding of $3.6 million over two years from 2018-19, to provide total funding of $4.3 million over three years, to deliver assistance to vulnerable refugees and asylum seekers in Queensland including financial and material aid, housing assistance and other support.
73
Budget Measures 2018-19
| | | | | | | | | | | | | | | | | | | | |
| | | 2017-18
$‘000 | | | 2018-19
$‘000 | | | 2019-20
$‘000 | | | 2020-21
$‘000 | | | 2021-22
$‘000 | |
Torres Strait Islands Seawalls and Coastal Inundation Mitigation Upgrades | | | — | | | | — | | | | — | | | | — | | | | — | |
The Government is providing additional funding of $20 million over three years from 2018-19, held centrally, pending an Australian Government commitment to match funding. This measure will continue inundation mitigation works on five outer Torres Strait Islands, which will protect infrastructure and communities on these islands from rising sea levels and the impacts of coastal inundation.
74
Budget Measures 2018-19
Department of Natural Resources, Mines and Energy
| | | | | | | | | | | | | | | | | | | | |
| | | 2017-18
$‘000 | | | 2018-19
$‘000 | | | 2019-20
$‘000 | | | 2020-21
$‘000 | | | 2021-22
$‘000 | |
Solar Thermal Plant Capital Contribution | | | — | | | | 50,000 | | | | — | | | | — | | | | — | |
Delivering on our election commitments, the Government is providing additional funding of $50 million in 2018-19 as a capital grant to support the development of concentrated solar thermal with storage projects to provide clean baseload power.
| | | | | | | | | | | | | | | | | | | | |
| | | 2017-18
$‘000 | | | 2018-19
$‘000 | | | 2019-20
$‘000 | | | 2020-21
$‘000 | | | 2021-22
$‘000 | |
Affordable Energy Plan | | | 18,200 | | | | 27,000 | | | | 24,800 | | | | — | | | | — | |
The Government has provided additional funding of $70 million over three years which forms part of the Affordable Energy Plan to reduce and better manage Queenslanders’ energy use and costs. This supports customers with energy savings, increases access to solar and batteries and incorporates a business energy savers program.
| | | | | | | | | | | | | | | | | | | | |
| | | 2017-18
$‘000 | | | 2018-19
$‘000 | | | 2019-20
$‘000 | | | 2020-21
$‘000 | | | 2021-22
$‘000 | |
Coal Mine Workers’ Health Scheme | | | 7,565 | | | | 9,468 | | | | — | | | | — | | | | — | |
The Government has provided increased funding of $17 million over two years for the Coal Mine Workers’ Health Scheme to take action to ensure the regulatory framework for safety and health in the resources sector is contemporary and effective.
75
Budget Measures 2018-19
| | | | | | | | | | | | | | | | | | | | |
| | | 2017-18
$‘000 | | | 2018-19
$‘000 | | | 2019-20
$‘000 | | | 2020-21
$‘000 | | | 2021-22
$‘000 | |
Coal Seam Gas Compliance Unit | | | — | | | | 3,369 | | | | — | | | | — | | | | — | |
The Government is providing additional funding of $3.4 million in 2018-19 for the continued support of community engagement and resource industry compliance activities for the petroleum and gas, coal and mineral sectors.
| | | | | | | | | | | | | | | | | | | | |
| | | 2017-18
$‘000 | | | 2018-19
$‘000 | | | 2019-20
$‘000 | | | 2020-21
$‘000 | | | 2021-22
$‘000 | |
Queensland Water Regional Alliance Program | | | — | | | | 1,050 | | | | 1,050 | | | | 1,050 | | | | 1,050 | |
The Government is providing additional funding of $4.2 million over four years to retain and expand the Queensland Water Regional Alliance Program. The program is managed by the Local Government Association of Queensland and represents an effective mechanism to develop regional economies of scale to realise the four dimensions of water - security, reliability of supply, water quality and appropriate water pricing.
| | | | | | | | | | | | | | | | | | | | |
| | | 2017-18
$‘000 | | | 2018-19
$‘000 | | | 2019-20
$‘000 | | | 2020-21
$‘000 | | | 2021-22
$‘000 | |
Gas Action Plan | | | 3,181 | | | | 936 | | | | 300 | | | | — | | | | — | |
Delivering on our election commitments, the Government has provided additional funding of $4.4 million over three years to promote the development of the gas sector and bring supply to market through the Gas Action Plan.
76
Budget Measures 2018-19
| | | | | | | | | | | | | | | | | | | | |
| | | 2017-18
$‘000 | | | 2018-19
$‘000 | | | 2019-20
$‘000 | | | 2020-21
$‘000 | | | 2021-22
$‘000 | |
Extending Existing Drought Relief Arrangements | | | — | | | | — | | | | — | | | | — | | | | — | |
The Government is providing funding of up to $10.4 million in 2018-19, held centrally, as part of the extension of drought relief arrangements to continue to provide relief to farming customers from fixed charges for electricity accounts that are used to pump water for farm or irrigation purposes during periods of drought.
The Drought Assistance Package is a total of up to $34.6 million in 2018-19 to support drought affected communities across the State. Further details can be found in the Department of Agriculture and Fisheries section of this chapter and in the Department of Natural Resources, Mines and Energy section of Chapter 4 Revenue Measures.
| | | | | | | | | | | | | | | | | | | | |
| | | 2017-18
$‘000 | | | 2018-19
$‘000 | | | 2019-20
$‘000 | | | 2020-21
$‘000 | | | 2021-22
$‘000 | |
Government Action on North Stradbroke Island (Minjerribah) | | | — | | | | — | | | | — | | | | — | | | | — | |
Funding of $3.9 million over two years from 2017-18 has been internally reprioritised by the department to coordinate action on North Stradbroke Island (Minjerribah). This supports the rehabilitation of sand mining areas and improves employment and economic opportunities beyond sand mining.
Further funding can be found in the Department of Environment and Science and Department of State Development, Manufacturing, Infrastructure and Planning sections of this chapter and in the Department of Environment and Science section of Chapter 3 Capital Measures.
| | | | | | | | | | | | | | | | | | | | |
| | | 2017-18
$‘000 | | | 2018-19
$‘000 | | | 2019-20
$‘000 | | | 2020-21
$‘000 | | | 2021-22
$‘000 | |
Linc Energy Mine Site | | | — | | | | — | | | | — | | | | — | | | | — | |
Funding of $7.1 million is being internally reprioritised to 2018-19 by the department to provide ongoing site security, management and remediation of infrastructure works at the Linc site.
The capital component of this measure related to the Department of Natural Resources, Mines and Energy can be found in Chapter 3 Capital Measures.
77
Budget Measures 2018-19
Department of State Development, Manufacturing, Infrastructure and Planning
| | | | | | | | | | | | | | | | | | | | |
| | | 2017-18
$‘000 | | | 2018-19
$‘000 | | | 2019-20
$‘000 | | | 2020-21
$‘000 | | | 2021-22
$‘000 | |
Building our Regions | | | — | | | | 35,000 | | | | 17,500 | | | | 17,500 | | | | — | |
Delivering on our election commitments, the Government is providing increased funding of $70 million over three years for Round 4 of Building our Regions to deliver critical infrastructure for the regions. Total funding for the Building Our Regions - Regional Infrastructure Fund is $445 million over six years, from 2015-16 to 2020-21.
The purpose of the program is to provide funding for critical infrastructure in regional areas of the State that meet the specific needs of regional communities and supports economic development, including generating jobs.
| | | | | | | | | | | | | | | | | | | | |
| | | 2017-18
$‘000 | | | 2018-19
$‘000 | | | 2019-20
$‘000 | | | 2020-21
$‘000 | | | 2021-22
$‘000 | |
Resource Recovery Industry Development Program | | | — | | | | 30,000 | | | | 50,000 | | | | 20,000 | | | | — | |
The Government is providing additional funding of $100 million over three years to support Queensland’s resource recovery and recycling industry through the Resource Recovery Industry Development Program. The department will work with local governments and private sector enterprises to help them find innovative and cost effective solutions to the problem of waste going to landfill.
This measure will be funded by revenue collected from the Waste Disposal Levy. Further details can be found in the Department of Environment and Science and Department of Local Government, Racing and Multicultural Affairs sections of this chapter and the Department of Environment and Science section of Chapter 4 Revenue Measures.
78
Budget Measures 2018-19
| | | | | | | | | | | | | | | | | | | | |
| | | 2017-18
$‘000 | | | 2018-19
$‘000 | | | 2019-20
$‘000 | | | 2020-21
$‘000 | | | 2021-22
$‘000 | |
Queensland Made | | | 4,000 | | | | 10,000 | | | | 13,000 | | | | 13,000 | | | | — | |
Delivering on our election commitments, the Government has provided additional funding of $30 million over four years from 2017-18 to 2020-21 to establish manufacturing hubs in Cairns, Townsville and Rockhampton and $10 million over four years from 2017-18 to 2020-21 for defence supply chain logistics hubs in Townsville and Ipswich.
| | | | | | | | | | | | | | | | | | | | |
| | | 2017-18
$‘000 | | | 2018-19
$‘000 | | | 2019-20
$‘000 | | | 2020-21
$‘000 | | | 2021-22
$‘000 | |
Queensland Reconstruction Authority Disaster Resilience Fund | | | — | | | | 9,500 | | | | 9,500 | | | | 9,500 | | | | 9,500 | |
The Government is providing additional funding of $38 million over four years to establish the Disaster Resilience Fund (DRF). The DRF funds local governments, State agencies and non-government organisations to deliver mitigation and resilience projects.
The Queensland Reconstruction Authority (QRA) leads disaster recovery as well as mitigation and resilience policy on behalf of the Queensland Government.
| | | | | | | | | | | | | | | | | | | | |
| | | 2017-18
$‘000 | | | 2018-19
$‘000 | | | 2019-20
$‘000 | | | 2020-21
$‘000 | | | 2021-22
$‘000 | |
Queensland Reconstruction Authority Bluewater Trail and Queens Park Revitalisation | | | — | | | | 8,864 | | | | — | | | | — | | | | — | |
The Government is providing additional funding of $8.9 million in 2018-19 for the Bluewater Trail and Queens Park revitalisation in Mackay. The program is being managed by the Queensland Reconstruction Authority.
79
Budget Measures 2018-19
| | | | | | | | | | | | | | | | | | | | |
| | | 2017-18
$‘000 | | | 2018-19
$‘000 | | | 2019-20
$‘000 | | | 2020-21
$‘000 | | | 2021-22
$‘000 | |
Advancing Queensland’s Biofuture (Biofutures Acceleration Program II) | | | — | | | | 5,000 | | | | — | | | | — | | | | — | |
The Government is providing increased funding of $5 million in 2018-19 for Waste to Energy projects facilities, which turn urban waste into renewable energy and bioproducts.
This funding will be used to support the testing and establishment of small-scale innovative technologies suitable for deployment in regional areas promoting a wide range of energy products derived from waste materials.
| | | | | | | | | | | | | | | | | | | | |
| | | 2017-18
$‘000 | | | 2018-19
$‘000 | | | 2019-20
$‘000 | | | 2020-21
$‘000 | | | 2021-22
$‘000 | |
Queensland Reconstruction Authority Whitsunday Regional Council Administration Building | | | — | | | | 4,500 | | | | 500 | | | | — | | | | — | |
The Government is providing additional funding of $5 million over two years to Whitsunday Regional Council for reconstruction of the council administration building, including the local disaster coordination centre.
| | | | | | | | | | | | | | | | | | | | |
| | | 2017-18
$‘000 | | | 2018-19
$‘000 | | | 2019-20
$‘000 | | | 2020-21
$‘000 | | | 2021-22
$‘000 | |
Queensland Reconstruction Authority Beach Restoration and Mitigation | | | — | | | | 3,562 | | | | 1,000 | | | | — | | | | — | |
The Government is providing additional funding of $4.6 million over two years to determine best long-term solutions to help prevent erosion prior to sand replenishment at Midge Point and Lambert Beach and the construction of new rock groynes on St Helen’s Beach.
80
Budget Measures 2018-19
| | | | | | | | | | | | | | | | | | | | |
| | | 2017-18
$‘000 | | | 2018-19
$‘000 | | | 2019-20
$‘000 | | | 2020-21
$‘000 | | | 2021-22
$‘000 | |
Government Action on North Stradbroke Island (Minjerribah) - Economic Transition Strategy | | | 1,500 | | | | 3,250 | | | | — | | | | — | | | | — | |
The Government has provided increased funding of $4.8 million over two years towards projects to develop the North Stradbroke Island Economic Transition Strategy. The Strategy will address the impacts of the cessation of sand mining on North Stradbroke Island (Minjerribah) in 2019.
Further funding can be found in the Department of Environment and Science and Department of Natural Resources, Mines and Energy sections of this chapter and in the Department of Environment and Science section of Chapter 3 Capital Measures.
| | | | | | | | | | | | | | | | | | | | |
| | | 2017-18
$‘000 | | | 2018-19
$‘000 | | | 2019-20
$‘000 | | | 2020-21
$‘000 | | | 2021-22
$‘000 | |
Strong and Sustainable Resources | | | 200 | | | | 2,300 | | | | — | | | | — | | | | — | |
The Government has provided additional funding of $2.5 million over two years to implement and administer the requirements of the Strong and Sustainable Resource Communities Act 2017. The object of this Act is to implement a ‘locals first’ program, legislating against the use of a 100% fly-in, fly-out (FIFO) workforce for the operation of mines located near a regional community.
| | | | | | | | | | | | | | | | | | | | |
| | | 2017-18
$‘000 | | | 2018-19
$‘000 | | | 2019-20
$‘000 | | | 2020-21
$‘000 | | | 2021-22
$‘000 | |
Government Action on North Stradbroke Island (Minjerribah) - One Mile Infrastructure Works | | | — | | | | 500 | | | | 500 | | | | — | | | | — | |
The Government is providing increased funding of $1 million over two years for urgent Infrastructure works at One Mile.
This project is part of a suite of projects with Quandamooka Yoolooburrabee Aboriginal Corporation for Government Action on North Stradbroke Island (Minjerribah). Further funding can be found in the Department of Environment and Science and Department of Natural Resources, Mines and Energy sections of this chapter and in the Department of Environment and Science section of Chapter 3 Capital Measures.
81
Budget Measures 2018-19
| | | | | | | | | | | | | | | | | | | | |
| | | 2017-18
$‘000 | | | 2018-19
$‘000 | | | 2019-20
$‘000 | | | 2020-21
$‘000 | | | 2021-22
$‘000 | |
Queensland Reconstruction Authority Disaster Recovery Services Donation Management | | | — | | | | 400 | | | | 400 | | | | 400 | | | | — | |
The Government is providing increased funding of $1.2 million over three years to coordinate an arrangement with service providers to register and match donations with community needs resulting from disaster events, on behalf of the Queensland Government.
| | | | | | | | | | | | | | | | | | | | |
| | | 2017-18
$‘000 | | | 2018-19
$‘000 | | | 2019-20
$‘000 | | | 2020-21
$‘000 | | | 2021-22
$‘000 | |
Advance Queensland Industry Attraction Fund | | | — | | | | — | | | | — | | | | — | | | | — | |
The Government has provided increased funding of $65 million over four years from 2017-18, held centrally, to the Advance Queensland Industry Attraction Fund. This increase, which includes a $40 million extension over 2 years, brings the total funding to $105 million.
This fund is focused on achieving the Queensland Government’s objectives of employment creation, regional growth and encouraging innovation. It will seek to further diversify economic activity by harnessing growth in emerging industries and value adding to existing industries.
| | | | | | | | | | | | | | | | | | | | |
| | | 2017-18
$‘000 | | | 2018-19
$‘000 | | | 2019-20
$‘000 | | | 2020-21
$‘000 | | | 2021-22
$‘000 | |
Expansion of the Jobs and Regional Growth Fund | | | — | | | | — | | | | — | | | | — | | | | — | |
The Government is providing increased funding of $20 million in 2018-19, held centrally, to assist businesses and projects that will generate economic development and employment opportunities in regional Queensland. This increase brings the total funding to $150 million over three years from 2016-17.
Queensland Treasury and the Department of State Development, Manufacturing, Infrastructure and Planning are jointly responsible for the fund. This initiative can also be found in the Queensland Treasury section of this chapter.
82
Budget Measures 2018-19
| | | | | | | | | | | | | | | | | | | | |
| | | 2017-18
$‘000 | | | 2018-19
$‘000 | | | 2019-20
$‘000 | | | 2020-21
$‘000 | | | 2021-22
$‘000 | |
Gasfields Commission Queensland Implementation of Government recommendations arising from the Scott Review | | | — | | | | — | | | | — | | | | — | | | | — | |
Funding of $400,000 in 2018-19 has been internally reprioritised by the department to assist with implementing recommendations arising from the Independent Review of the Gasfields Commission Queensland and Associated Matters.
The funding will assist the Government to meet commitments arising from the Review to secure gas supply through proactive communications and engagement strategy.
| | | | | | | | | | | | | | | | | | | | |
| | | 2017-18
$‘000 | | | 2018-19
$‘000 | | | 2019-20
$‘000 | | | 2020-21
$‘000 | | | 2021-22
$‘000 | |
Government Action on North Stradbroke Island (Minjerribah) - Bushfire Management Plans | | | 900 | | | | — | | | | — | | | | — | | | | — | |
The Government has provided increased funding of $900,000 in 2017-18 to work in collaboration with the Quandamooka Yoolooburrabee Aboriginal Corporation to develop bushfire management plans for townships on North Stradbroke Island (Minjerribah).
This project is part of a suite of projects for Government Action on North Stradbroke Island (Minjerribah). This project will be managed by the Queensland Reconstruction Authority. Further funding can be found in the Department of Environment and Science and Department of Natural Resources, Mines and Energy sections of this chapter and in the Department of Environment and Science section of Chapter 3 Capital Measures.
83
Budget Measures 2018-19
| | | | | | | | | | | | | | | | | | | | |
| | | 2017-18
$‘000 | | | 2018-19
$‘000 | | | 2019-20
$‘000 | | | 2020-21
$‘000 | | | 2021-22
$‘000 | |
Hydrogen Industry and Energy Opportunity | | | — | | | | — | | | | — | | | | — | | | | — | |
Funding of $750,000 in 2018-19 has been internally reprioritised by the department to support the investigation of local opportunities, capability and capacity to produce and supply hydrogen at a competitive price to alternative energy sources.
| | | | | | | | | | | | | | | | | | | | |
| | | 2017-18
$‘000 | | | 2018-19
$‘000 | | | 2019-20
$‘000 | | | 2020-21
$‘000 | | | 2021-22
$‘000 | |
Made in Queensland | | | 5,000 | | | | — | | | | 10,000 | | | | 5,000 | | | | — | |
Delivering on our election commitments, the Government has provided increased funding of $20 million over three years to the Made in Queensland grants program. This increase brings the total funding to $40 million over four years from 2017-18 to support the manufacturing sector to become more internationally competitive, increase productivity and adopt new processes and technologies.
84
Budget Measures 2018-19
Department of the Premier and Cabinet
| | | | | | | | | | | | | | | | | | | | |
| | | 2017-18
$‘000 | | | 2018-19
$‘000 | | | 2019-20
$‘000 | | | 2020-21
$‘000 | | | 2021-22
$‘000 | |
Screen Queensland Production Attraction Strategy | | | 10,000 | | | | 10,000 | | | | — | | | | — | | | | — | |
Delivering on our election commitments, the Government has provided increased funding of $20 million over two years, with total funding of $50 million over four years from 2015-16, to grow a pipeline of large-scale film and high-end television productions in Queensland. This measure includes $200,000 to develop a Far North Queensland screen production strategic plan.
| | | | | | | | | | | | | | | | | | | | |
| | | 2017-18
$‘000 | | | 2018-19
$‘000 | | | 2019-20
$‘000 | | | 2020-21
$‘000 | | | 2021-22
$‘000 | |
Screen Production Facility | | | — | | | | 3,829 | | | | 2,724 | | | | 2,724 | | | | 2,724 | |
The Government is providing additional funding of $12 million over four years for Screen Queensland to establish a screen production facility in Brisbane. The 2018-19 funding includes a $1 million capital grant to fit out the property.
| | | | | | | | | | | | | | | | | | | | |
| | | 2017-18
$‘000 | | | 2018-19
$‘000 | | | 2019-20
$‘000 | | | 2020-21
$‘000 | | | 2021-22
$‘000 | |
Continuation of the Events Sponsorship Fund | | | — | | | | 3,500 | | | | 3,500 | | | | 3,500 | | | | — | |
The Government is providing increased funding of $10.5 million over three years, with total funding of $14.5 million over five years from 2016-17. This will support the continued operation of the Events Sponsorship Fund to drive economic and community benefits through the attraction, leveraging and delivery of high value events.
85
Budget Measures 2018-19
| | | | | | | | | | | | | | | | | | | | |
| | | 2017-18
$‘000 | | | 2018-19
$‘000 | | | 2019-20
$‘000 | | | 2020-21
$‘000 | | | 2021-22
$‘000 | |
Ministerial Offices | | | — | | | | 2,769 | | | | 1,250 | | | | 3,299 | | | | 3,299 | |
The Government is providing increased funding of $10.6 million over four years to provide support to Ministerial Offices.
| | | | | | | | | | | | | | | | | | | | |
| | | 2017-18
$‘000 | | | 2018-19
$‘000 | | | 2019-20
$‘000 | | | 2020-21
$‘000 | | | 2021-22
$‘000 | |
Regional Office Initiative | | | — | | | | 709 | | | | 941 | | | | 964 | | | | — | |
The Government is providing increased funding of $2.6 million over three years to continue stakeholder engagement, increase the Government’s regional presence and deliver on its commitment to build strong regional economies and communities.
| | | | | | | | | | | | | | | | | | | | |
| | | 2017-18
$‘000 | | | 2018-19
$‘000 | | | 2019-20
$‘000 | | | 2020-21
$‘000 | | | 2021-22
$‘000 | |
Supporting Veterans - Grants | | | �� — | | | | 500 | | | | 500 | | | | 500 | | | | — | |
Delivering on our election commitments, the Government is providing additional funding of $1.5 million over three years for a grants program for veterans’ groups and other organisations for the creation, upkeep and renovation of monuments, memorials and other public sites recognising veterans’ achievements.
This forms part of the Government’s $4.3 million Supporting Veterans initiative. Further funding can be found in the Department of Communities, Disability Services and Seniors section of this chapter and in the Department of Communities, Disability Services and Seniors section of Chapter 3 Capital Measures.
86
Budget Measures 2018-19
Department of Transport and Main Roads
| | | | | | | | | | | | | | | | | | | | |
| | | 2017-18
$‘000 | | | 2018-19
$‘000 | | | 2019-20
$‘000 | | | 2020-21
$‘000 | | | 2021-22
$‘000 | |
Rail Transport Services | | | — | | | | 225,985 | | | | 221,828 | | | | 291,514 | | | | 364,670 | |
The Government is providing increased funding of $1.104 billion over four years for the contract extension commencing 1 July 2018 for the provision of rail transport services.
| | | | | | | | | | | | | | | | | | | | |
| | | 2017-18
$‘000 | | | 2018-19
$‘000 | | | 2019-20
$‘000 | | | 2020-21
$‘000 | | | 2021-22
$‘000 | |
Station Upgrades and Park’n’Ride facilities | | | 1,860 | | | | 9,570 | | | | 21,290 | | | | 32,460 | | | | 42,459 | |
Delivering on our election commitments, the Government has provided increased funding of $107.6 million over five years to support rail station upgrades and expansion of park’n’ride facilities.
| | | | | | | | | | | | | | | | | | | | |
| | | 2017-18
$‘000 | | | 2018-19
$‘000 | | | 2019-20
$‘000 | | | 2020-21
$‘000 | | | 2021-22
$‘000 | |
Derelict Vessels Enforcement Program | | | — | | | | 5,000 | | | | 5,000 | | | | 5,000 | | | | 5,000 | |
The Government is providing additional funding of $20 million over four years to address the number of derelict vessels accumulating along Queensland’s coastline that are a concern to waterway users and the general public and pose environmental safety and amenity issues.
87
Budget Measures 2018-19
| | | | | | | | | | | | | | | | | | | | |
| | | 2017-18
$‘000 | | | 2018-19
$‘000 | | | 2019-20
$‘000 | | | 2020-21
$‘000 | | | 2021-22
$‘000 | |
National Marine Safety Regulator | | | — | | | | 4,860 | | | | 3,830 | | | | 2,840 | | | | 1,620 | |
The Government is providing additional funding of $13.8 million over five years from 2018-19 to ensure that the transfer of full service delivery responsibilities for the administration of the safety of domestic commercial vessels on 1 July 2018 to the Australian Government is undertaken in a sustainable manner decreasing the impact on commercial operators based in Queensland.
| | | | | | | | | | | | | | | | | | | | |
| | | 2017-18
$‘000 | | | 2018-19
$‘000 | | | 2019-20
$‘000 | | | 2020-21
$‘000 | | | 2021-22
$‘000 | |
Camera Detected Offence Program | | | — | | | | 2,689 | | | | 4,967 | | | | 4,831 | | | | 5,385 | |
The Government is providing increased funding of $17.9 million over four years for road safety education and awareness programs and to improve the safety of the sections of state-controlled roads where accidents happen most frequently.
The Government is providing total increased funding of $166.6 million over four years across departments as part of the Camera Detected Offence Program. Further funding can be found in the Queensland Police Service and Queensland Treasury sections of this chapter. The capital component of this measure can be found in the Department of Transport and Main Roads and Queensland Police Service sections of Chapter 3 Capital Measures.
| | | | | | | | | | | | | | | | | | | | |
| | | 2017-18
$‘000 | | | 2018-19
$‘000 | | | 2019-20
$‘000 | | | 2020-21
$‘000 | | | 2021-22
$‘000 | |
New Public Transport Ticketing System | | | — | | | | 2,000 | | | | 2,500 | | | | 3,500 | | | | — | |
The Government is providing $8 million over three years for trials and pilots associated with implementing the new public transport ticketing system in Queensland. Further funding can be found in Chapter 3 Capital Measures.
88
Budget Measures 2018-19
| | | | | | | | | | | | | | | | | | | | |
| | | 2017-18
$‘000 | | | 2018-19
$‘000 | | | 2019-20
$‘000 | | | 2020-21
$‘000 | | | 2021-22
$‘000 | |
School Transport Infrastructure Program | | | — | | | | 2,000 | | | | 5,000 | | | | 6,500 | | | | 6,500 | |
The Government is providing additional funding of $20 million over four years to establish a School Transport Infrastructure Program. This program will operate in conjunction with local councils and will provide funding towards school transport-related infrastructure upgrades, including vehicle turnaround or parking facilities, and stop drop and go areas. It is intended that funding would be matched 50:50 by councils, effectively delivering a $40 million total funding pool over the life of the program.
| | | | | | | | | | | | | | | | | | | | |
| | | 2017-18
$‘000 | | | 2018-19
$‘000 | | | 2019-20
$‘000 | | | 2020-21
$‘000 | | | 2021-22
$‘000 | |
Eastern Transitway | | | 200 | | | | 1,800 | | | | 8,000 | | | | 12,000 | | | | — | |
Delivering on our election commitments, the Government has provided additional funding of $22 million over four years to deliver the Eastern Transitway with upgrades to five major intersections, located at Cavendish Road, Bennetts Road, Boundary Road, Gallipoli Road and Creek Road, which will include bus priority measures on Old Cleveland Road.
| | | | | | | | | | | | | | | | | | | | |
| | | 2017-18
$‘000 | | | 2018-19
$‘000 | | | 2019-20
$‘000 | | | 2020-21
$‘000 | | | 2021-22
$‘000 | |
Bus Driver Wage Parity in Cairns and Sunshine Coast | | | 2,082 | | | | 1,466 | | | | — | | | | — | | | | — | |
The Government has provided additional funding of $3.5 million over two years to meet the cost of wage claims for Sunshine Coast and Cairns bus drivers through to the end of calendar year 2018.
89
Budget Measures 2018-19
| | | | | | | | | | | | | | | | | | | | |
| | | 2017-18
$‘000 | | | 2018-19
$‘000 | | | 2019-20
$‘000 | | | 2020-21
$‘000 | | | 2021-22
$‘000 | |
Passenger Transport Infrastructure Investment Program (PTIIP) supplement | | | — | | | | 1,000 | | | | 5,500 | | | | 6,500 | | | | 7,000 | |
The Government is providing increased funding of $20 million over four years to increase the provision of shaded structures, such as shelters, at key passenger transport facilities to provide requisite levels of customer amenity where need exists.
| | | | | | | | | | | | | | | | | | | | |
| | | 2017-18
$‘000 | | | 2018-19
$‘000 | | | 2019-20
$‘000 | | | 2020-21
$‘000 | | | 2021-22
$‘000 | |
Queensland Walking Strategy | | | — | | | | 500 | | | | 1,000 | | | | 1,000 | | | | — | |
Delivering on our election commitments, the Government is providing additional funding of $2.5 million over three years to develop and implement a Queensland Walking Strategy that is focused on getting people to walk as a mode of transport.
| | | | | | | | | | | | | | | | | | | | |
| | | 2017-18
$‘000 | | | 2018-19
$‘000 | | | 2019-20
$‘000 | | | 2020-21
$‘000 | | | 2021-22
$‘000 | |
Beams Road Overpass Investigation | | | 20 | | | | 150 | | | | 230 | | | | — | | | | — | |
Delivering on our election commitments, the Government has provided additional funding of $400,000 over three years for a feasibility study into an overpass at the Beams Road level crossing at Carseldine.
| | | | | | | | | | | | | | | | | | | | |
| | | 2017-18
$‘000 | | | 2018-19
$‘000 | | | 2019-20
$‘000 | | | 2020-21
$‘000 | | | 2021-22
$‘000 | |
Bus Driver Safety | | | — | | | | — | | | | — | | | | — | | | | — | |
Funding of $7 million over two years from 2017-18 has been internally reallocated by the department for bus driver safety initiatives. This includes funding for a grants program to roll out driver security barriers on high risk services, installation of anti-shatter film in the remaining 50% of the urban fleet and a comprehensive public awareness campaign.
90
Budget Measures 2018-19
| | | | | | | | | | | | | | | | | | | | |
| | | 2017-18
$‘000 | | | 2018-19
$‘000 | | | 2019-20
$‘000 | | | 2020-21
$‘000 | | | 2021-22
$‘000 | |
Future Proofing the Bruce | | | — | | | | — | | | | 5,000 | | | | 5,000 | | | | — | |
Delivering on our election commitments, the Government will provide additional funding of $10 million over two years to develop a 15-year vision and initial Action Plan to identify and prioritise projects to be delivered as part of upgrades to the Bruce Highway. The capital component of this initiative can be found in Chapter 3 Capital Measures.
| | | | | | | | | | | | | | | | | | | | |
| | | 2017-18
$‘000 | | | 2018-19
$‘000 | | | 2019-20
$‘000 | | | 2020-21
$‘000 | | | 2021-22
$‘000 | |
M1 Pacific Motorway - Eight Mile Plains to Logan Motorway Planning | | | — | | | | — | | | | 8,000 | | | | 8,000 | | | | — | |
Delivering on our election commitments, the Government will provide additional funding of $16 million over two years to develop a business case for future upgrades of the M1 corridor between Eight Mile Plains and the Logan Motorway.
This brings total additional funding for planning and upgrades to the M1 Pacific Motorway to $897.5 million. Further funding for the M1 Pacific Motorway can be found in Chapter 3 Capital Measures.
| | | | | | | | | | | | | | | | | | | | |
| | | 2017-18
$‘000 | | | 2018-19
$‘000 | | | 2019-20
$‘000 | | | 2020-21
$‘000 | | | 2021-22
$‘000 | |
Mooloolah River Interchange | | | — | | | | — | | | | — | | | | — | | | | — | |
Funding of $7.5 million over two years from 2018-19 has been internally reallocated by the department to complete planning and business case development for the Mooloolah River Interchange (MRI) project. The MRI project is located at Mooloolaba on a key section of the state-controlled road network, connecting the Sunshine Motorway and Nicklin Way on the Sunshine Coast.
91
Budget Measures 2018-19
| | | | | | | | | | | | | | | | | | | | |
| | | 2017-18
$‘000 | | | 2018-19
$‘000 | | | 2019-20
$‘000 | | | 2020-21
$‘000 | | | 2021-22
$‘000 | |
New Generation Rollingstock Business Operating Model | | | 9,250 | | | | — | | | | — | | | | — | | | | — | |
The Government has provided additional funding of $9.3 million in 2017-18 for rail transport service contract expenses to support the business operating model for the introduction of the New Generation Rollingstock fleet.
| | | | | | | | | | | | | | | | | | | | |
| | | 2017-18
$‘000 | | | 2018-19
$‘000 | | | 2019-20
$‘000 | | | 2020-21
$‘000 | | | 2021-22
$‘000 | |
Transport Infrastructure Development Scheme | | | — | | | | — | | | | — | | | | — | | | | — | |
An additional $30 million has been reallocated internally by the department in 2021-22 for the Transport Infrastructure Development Scheme (TIDS). TIDS is the grants program through which the department provides funding to local government for targeted investment in transport-related infrastructure.
92
Budget Measures 2018-19
Electoral Commission of Queensland
| | | | | | | | | | | | | | | | | | | | |
| | | 2017-18
$‘000 | | | 2018-19
$‘000 | | | 2019-20
$‘000 | | | 2020-21
$‘000 | | | 2021-22
$‘000 | |
Prohibited Donor Scheme | | | — | | | | 526 | | | | 311 | | | | 318 | | | | 324 | |
The Government is providing funding of $1.5 million over four years to support the implementation of a prohibited donors scheme.
93
Budget Measures 2018-19
Legislative Assembly of Queensland
| | | | | | | | | | | | | | | | | | | | |
| | | 2017-18
$‘000 | | | 2018-19
$‘000 | | | 2019-20
$‘000 | | | 2020-21
$‘000 | | | 2021-22
$‘000 | |
2017 Electoral Boundary Redistribution and Election | | | 3,384 | | | | 2,772 | | | | 2,772 | | | | 2,772 | | | | 2,772 | |
The Government has provided additional funding of $14.5 million over five years and $2.8 million per annum ongoing to meet costs associated with the 2017 Electoral Boundary Redistribution and the State election in 2017. The capital component of this measure can be found in Chapter 3 Capital Measures.
| | | | | | | | | | | | | | | | | | | | |
| | | 2017-18
$‘000 | | | 2018-19
$‘000 | | | 2019-20
$‘000 | | | 2020-21
$‘000 | | | 2021-22
$‘000 | |
Parliamentary Annexe Lift Upgrade Program | | | 60 | | | | 60 | | | | 60 | | | | 60 | | | | 60 | |
The Government has provided increased funding of $60,000 per annum from 2017-18 to maintain and operate the upgraded Parliamentary Annexe low-rise lifts and service lift. The capital component of this measure can be found in Chapter 3 Capital Measures.
94
Budget Measures 2018-19
Public Safety Business Agency
| | | | | | | | | | | | | | | | | | | | |
| | | 2017-18
$‘000 | | | 2018-19
$‘000 | | | 2019-20
$‘000 | | | 2020-21
$‘000 | | | 2021-22
$‘000 | |
Queensland Government Air Aircraft Maintenance and Compliance | | | — | | | | 2,899 | | | | — | | | | — | | | | — | |
The Government is providing additional funding of $2.9 million in 2018-19 to ensure Queensland Government Air’s (QGAir) fleet continues to be compliant with Civil Aviation Safety Authority requirements. This funding enables QGAir to continue to support the emergency helicopter network across the State for search and rescue, natural disasters, police and aeromedical operations and provide fixed wing transport services for police, government and organ transfer. The capital component of this measure can be found in Chapter 3 Capital Measures.
| | | | | | | | | | | | | | | | | | | | |
| | | 2017-18
$‘000 | | | 2018-19
$‘000 | | | 2019-20
$‘000 | | | 2020-21
$‘000 | | | 2021-22
$‘000 | |
Public Safety Regional Radio Communications | | | — | | | | — | | | | — | | | | — | | | | — | |
The Government will provide additional funding of $26.9 million, held centrally, to ensure Queensland Fire and Emergency Services complies with Australian Communications and Media Authority requirements.
95
Budget Measures 2018-19
Public Service Commission
| | | | | | | | | | | | | | | | | | | | |
| | | 2017-18
$‘000 | | | 2018-19
$‘000 | | | 2019-20
$‘000 | | | 2020-21
$‘000 | | | 2021-22
$‘000 | |
Integrity Commissioner’s Expanded Advisory and Public Awareness Role | | | — | | | | 331 | | | | 350 | | | | 366 | | | | 382 | |
The Government is providing increased funding of $1.4 million over four years and $382,000 per annum ongoing to assist with the significant expansion of the Integrity Commissioner’s jurisdiction. The Queensland Government has supported recommendations in the Belcarra Report, and the most recent Strategic Review of the functions of the Integrity Commissioner, to reduce barriers and significantly broaden the range of persons who can seek the Integrity Commissioner’s advice.
96
Budget Measures 2018-19
Queensland Corrective Services
| | | | | | | | | | | | | | | | | | | | |
| | | 2017-18
$‘000 | | | 2018-19
$‘000 | | | 2019-20
$‘000 | | | 2020-21
$‘000 | | | 2021-22
$‘000 | |
Borallon Training and Correctional Centre - Final Stage Recommissioning | | | 600 | | | | 6,941 | | | | 6,941 | | | | 6,941 | | | | 6,941 | |
The Government has provided increased funding of $28.4 million over five years and $6.9 million per annum ongoing for the final stage recommissioning and operation of the Borallon Training and Correctional Centre.
| | | | | | | | | | | | | | | | | | | | |
| | | 2017-18
$‘000 | | | 2018-19
$‘000 | | | 2019-20
$‘000 | | | 2020-21
$‘000 | | | 2021-22
$‘000 | |
Probation and Parole Service Funding | | | — | | | | 6,500 | | | | 2,900 | | | | — | | | | — | |
The Government is providing increased funding of $9.4 million over two years to maintain probation and parole staffing levels.
| | | | | | | | | | | | | | | | | | | | |
| | | 2017-18
$‘000 | | | 2018-19
$‘000 | | | 2019-20
$‘000 | | | 2020-21
$‘000 | | | 2021-22
$‘000 | |
Correctional Centre Health Services | | | — | | | | 2,862 | | | | — | | | | — | | | | — | |
The Government is providing additional funding of $2.9 million in 2018-19 to improve service delivery for prisoners with a disability or mental illness.
97
Budget Measures 2018-19
| | | | | | | | | | | | | | | | | | | | |
| | | 2017-18
$‘000 | | | 2018-19
$‘000 | | | 2019-20
$‘000 | | | 2020-21
$‘000 | | | 2021-22
$‘000 | |
Expansion of the Bail Support Program | | | — | | | | 1,222 | | | | 1,253 | | | | 1,456 | | | | — | |
The Government is providing increased funding of $3.9 million over three years to expand the bail support program. The program is designed to reduce re-offending while on bail, increase court appearance and provide a viable alternative to remand.
| | | | | | | | | | | | | | | | | | | | |
| | | 2017-18
$‘000 | | | 2018-19
$‘000 | | | 2019-20
$‘000 | | | 2020-21
$‘000 | | | 2021-22
$‘000 | |
Tackling Alcohol Fuelled Violence Program - Safe Night Precinct Support Services | | | — | | | | 1,154 | | | | — | | | | — | | | | — | |
The Government is providing increased funding of $1.2 million in 2018-19 to continue supervised community service projects implemented within Safe Night Precincts across Queensland.
This forms part of the Government’s Tackling Alcohol Fuelled Violence Program. Further details of this funding can be found in the Queensland Police Service, Department of Communities, Disability Services and Seniors and Department of Justice and Attorney-General sections of this chapter.
| | | | | | | | | | | | | | | | | | | | |
| | | 2017-18
$‘000 | | | 2018-19
$‘000 | | | 2019-20
$‘000 | | | 2020-21
$‘000 | | | 2021-22
$‘000 | |
Aurukun Prisoner Reintegration Program | | | — | �� | | | 512 | | | | — | | | | — | | | | — | |
The Government is providing increased funding of $512,000 in 2018-19 to continue the prisoner reintegration program in Aurukun.
This forms part of the Government’s overall package of $1.6 million to continue the Aurukun Four Point Plan in 2018-19 to address safety and support the community. Further funding can be found in the Department of Aboriginal and Torres Strait Islander Partnerships and Department of Justice and Attorney-General sections of this chapter.
98
Budget Measures 2018-19
| | | | | | | | | | | | | | | | | | | | |
| | | 2017-18
$‘000 | | | 2018-19
$‘000 | | | 2019-20
$‘000 | | | 2020-21
$‘000 | | | 2021-22
$‘000 | |
Domestic and Family Violence Response - Specialist Domestic and Family Violence Courts | | | — | | | | 443 | | | | 453 | | | | 464 | | | | 416 | |
The Government is providing additional funding of $1.8 million over four years and $416,000 per annum ongoing, to expand the Townsville Specialist Domestic and Family Violence (DFV) Court (including circuit courts in Mount Isa and Palm Island) to include criminal domestic and family violence matters.
Total funding for the expansion of the Townsville Specialist DFV Court is $8.1 million over four years and $2.3 million per annum ongoing. Further funding can be found in the Department of Justice and Attorney-General, Queensland Police Service and the Department of Child Safety, Youth and Women sections of this chapter.
99
Budget Measures 2018-19
Queensland Fire and Emergency Services
| | | | | | | | | | | | | | | | | | | | |
| | | 2017-18
$‘000 | | | 2018-19
$‘000 | | | 2019-20
$‘000 | | | 2020-21
$‘000 | | | 2021-22
$‘000 | |
Additional Firefighters | | | — | | | | 3,590 | | | | 6,070 | | | | 8,670 | | | | 11,202 | |
Delivering on our election commitments, the Government is providing additional funding of $29.5 million over four years and $11.2 million per annum ongoing for an additional 100 firefighters and 12 fire communication officers to help the community prevent, prepare for, respond to and recover from the impact of fire and emergency events.
| | | | | | | | | | | | | | | | | | | | |
| | | 2017-18
$‘000 | | | 2018-19
$‘000 | | | 2019-20
$‘000 | | | 2020-21
$‘000 | | | 2021-22
$‘000 | |
State Emergency Service on-boarding to the Government Wireless Network in South East Queensland | | | — | | | | 3,000 | | | | 4,000 | | | | 1,350 | | | | 950 | |
The Government is providing additional funding of $15 million over 10 years to enable the State Emergency Service (SES) on-boarding to the Government Wireless Network in South East Queensland, to support volunteers and local government and enhance an integrated emergency response.
| | | | | | | | | | | | | | | | | | | | |
| | | 2017-18
$‘000 | | | 2018-19
$‘000 | | | 2019-20
$‘000 | | | 2020-21
$‘000 | | | 2021-22
$‘000 | |
Non Conforming Building Products Audit Task Force | | | 504 | | | | 50 | | | | — | | | | — | | | | — | |
The Government has provided additional funding of $554,000 over two years to support the Queensland Fire and Emergency Services’ role on the Non Conforming Building Products Audit Taskforce. An additional $359,000 has also been internally reprioritised by the department in 2017-18 to fund this measure, bringing total funding to $913,000.
This forms part of the Government’s total funding package of $7.6 million over two years to support taskforce operations in assessing the critical safety risks posed by combustible cladding on Government and non-Government buildings throughout Queensland. Further funding can be found in the Department of Housing and Public Works section of this chapter.
100
Budget Measures 2018-19
Queensland Health
| | | | | | | | | | | | | | | | | | | | |
| | | 2017-18
$‘000 | | | 2018-19
$‘000 | | | 2019-20
$‘000 | | | 2020-21
$‘000 | | | 2021-22
$‘000 | |
Specialist Outpatient Strategy | | | — | | | | 77,360 | | | | 77,360 | | | | — | | | | — | |
Delivering on our election commitments, the Government is providing increased funding of $154.7 million over two years to extend the Specialist Outpatient Strategy, to ensure patients continue to have timely access to specialist outpatient appointments.
| | | | | | | | | | | | | | | | | | | | |
| | | 2017-18
$‘000 | | | 2018-19
$‘000 | | | 2019-20
$‘000 | | | 2020-21
$‘000 | | | 2021-22
$‘000 | |
Nurse Navigators | | | — | | | | — | | | | 53,904 | | | | 55,663 | | | | — | |
Delivering on our election commitments, the Government will provide increased funding of $109.6 million over two years to increase the number of Nurse Navigators in Hospital and Health Services to 400. Nurse Navigators ensure patients with chronic illnesses find the care most appropriate to their needs, and play a vital role in coordinating clinical services and reducing preventable admissions to hospitals.
| | | | | | | | | | | | | | | | | | | | |
| | | 2017-18
$‘000 | | | 2018-19
$‘000 | | | 2019-20
$‘000 | | | 2020-21
$‘000 | | | 2021-22
$‘000 | |
Midwives | | | 13,700 | | | | 14,100 | | | | 14,400 | | | | 14,800 | | | | — | |
Delivering on our election commitments, the Government has provided additional funding of $57 million over four years to employ an additional 100 midwives across Queensland to strengthen maternity services.
101
Budget Measures 2018-19
| | | | | | | | | | | | | | | | | | | | |
| | | 2017-18
$‘000 | | | 2018-19
$‘000 | | | 2019-20
$‘000 | | | 2020-21
$‘000 | | | 2021-22
$‘000 | |
Deadly Choices Healthy Lifestyle Program | | | 8,000 | | | | 8,000 | | | | — | | | | — | | | | — | |
Delivering on our election commitments, the Government has provided increased funding of $16 million over two years to further expand the Deadly Choices Healthy Lifestyle Program. This program aims to empower Aboriginal and Torres Strait Islander people to make healthy choices for themselves and their families to stop smoking, eat healthy food and exercise daily.
| | | | | | | | | | | | | | | | | | | | |
| | | 2017-18
$‘000 | | | 2018-19
$‘000 | | | 2019-20
$‘000 | | | 2020-21
$‘000 | | | 2021-22
$‘000 | |
Rockhampton Drug Treatment and Rehabilitation Facility | | | — | | | | — | | | | 1,480 | | | | 3,320 | | | | — | |
Delivering on our election commitments, the Government will provide additional funding of $4.8 million over two years for a new 42-bed residential drug rehabilitation and treatment facility in Rockhampton. The capital component of this measure can be found in Chapter 3 Capital Measures.
| | | | | | | | | | | | | | | | | | | | |
| | | 2017-18
$‘000 | | | 2018-19
$‘000 | | | 2019-20
$‘000 | | | 2020-21
$‘000 | | | 2021-22
$‘000 | |
Building Better Hospitals - Cancer Council Queensland Lodges | | | — | | | | 5,000 | | | | — | | | | — | | | | — | |
Delivering on our election commitments, the Government is providing additional funding of $5 million in 2018-19 to work in partnership with the Cancer Council Queensland to refurbish the accommodation lodges for cancer patients in Townsville, Toowoomba and Herston, Brisbane. Total funding included in the Building Better Hospitals package is $679 million. The capital component of this measure can be found in Chapter 3 Capital Measures.
102
Budget Measures 2018-19
| | | | | | | | | | | | | | | | | | | | |
| | | 2017-18
$‘000 | | | 2018-19
$‘000 | | | 2019-20
$‘000 | | | 2020-21
$‘000 | | | 2021-22
$‘000 | |
Operational Growth Funding | | | — | | | | 152,722 | | | | 62,916 | | | | 11,651 | | | | 327,182 | |
The Government is providing increased funding of $554.5 million over four years to support the ongoing growth in demand for health and ambulance services.
| | | | | | | | | | | | | | | | | | | | |
| | | 2017-18
$‘000 | | | 2018-19
$‘000 | | | 2019-20
$‘000 | | | 2020-21
$‘000 | | | 2021-22
$‘000 | |
Queensland Ambulance Service - Classification Structure | | | 33,980 | | | | 57,997 | | | | 100,087 | | | | 107,630 | | | | 107,630 | |
The Government has provided additional funding of $192.1 million over three years from 2017-18 and $107.6 million per annum ongoing from 2020-21 to implement a new, contemporary classification and remuneration structure for Queensland Ambulance Service employees.
| | | | | | | | | | | | | | | | | | | | |
| | | 2017-18
$‘000 | | | 2018-19
$‘000 | | | 2019-20
$‘000 | | | 2020-21
$‘000 | | | 2021-22
$‘000 | |
Sunshine Coast University Hospital | | | — | | | | 25,481 | | | | 28,544 | | | | 29,184 | | | | 30,022 | |
The Government is providing additional funding of $113.2 million over four years to meet operating costs associated with the Sunshine Coast University Hospital.
| | | | | | | | | | | | | | | | | | | | |
| | | 2017-18
$‘000 | | | 2018-19
$‘000 | | | 2019-20
$‘000 | | | 2020-21
$‘000 | | | 2021-22
$‘000 | |
Community Helicopter Providers | | | — | | | | 7,612 | | | | — | | | | — | | | | — | |
The Government is providing additional funding of $7.6 million in 2018-19, with an ongoing indexed annual provision for this amount to be held centrally, for community helicopter providers to support Queensland’s Emergency Helicopter Network services.
103
Budget Measures 2018-19
| | | | | | | | | | | | | | | | | | | | |
| | | 2017-18
$‘000 | | | 2018-19
$‘000 | | | 2019-20
$‘000 | | | 2020-21
$‘000 | | | 2021-22
$‘000 | |
Correctional Centre Health Services | | | — | | | | 5,090 | | | | — | | | | — | | | | — | |
The Government is providing additional funding of $5.1 million in 2018-19 to support more clinical staff to meet increasing demand for health services in Queensland correctional facilities.
| | | | | | | | | | | | | | | | | | | | |
| | | 2017-18
$‘000 | | | 2018-19
$‘000 | | | 2019-20
$‘000 | | | 2020-21
$‘000 | | | 2021-22
$‘000 | |
Youth Justice - Specialist Mental Health Youth Forensic Assessment | | | — | | | | — | | | | — | | | | — | | | | — | |
Funding of $4.7 million over three years from 2018-19 is being internally reprioritised by the department to improve mental health assessments of young people in the youth justice system.
This forms part of the Government’s total funding of $40.7 million over four years ($22.3 million new funding and $18.4 million reprioritised funding) for youth justice support measures. Further details can be found in the Department of Child Safety, Youth and Women, Department of Education, and Department of Housing and Public Works sections of this chapter and the Queensland Health section of Chapter 3 Capital Measures.
104
Budget Measures 2018-19
Queensland Police Service
| | | | | | | | | | | | | | | | | | | | |
| | | 2017-18
$‘000 | | | 2018-19
$‘000 | | | 2019-20
$‘000 | | | 2020-21
$‘000 | | | 2021-22
$‘000 | |
Increased Counter-Terrorism Capability | | | 5,466 | | | | 15,695 | | | | 16,158 | | | | 16,531 | | | | 16,910 | |
Delivering on our election commitments, the Government has provided additional funding of $53.8 million over four years from 2017-18 and $16.9 million per annum ongoing from 2021-22 for 85 counter terrorism officers and specialists and the establishment of a Security and Counter-Terrorism Command.
This forms part of the Government’s commitment to an additional 535 frontline police and operational specialists in priority areas across the State, which includes 30 counter-terrorism police officers and 20 police officers announced in the 2017-18 Budget. Further details can be found in this section and Chapter 3 Capital Measures.
| | | | | | | | | | | | | | | | | | | | |
| | | 2017-18
$‘000 | | | 2018-19
$‘000 | | | 2019-20
$‘000 | | | 2020-21
$‘000 | | | 2021-22
$‘000 | |
Police Officers | | | — | | | | 12,574 | | | | 31,817 | | | | 51,998 | | | | 73,155 | |
Delivering on our election commitments, the Government is providing additional funding of $169.5 million over four years and $81.5 million per annum ongoing from 2022-23 for 400 police officers in high priority areas across the State.
This forms part of the Government’s commitment to an additional 535 frontline police and operational specialists in priority areas across the State, which includes 30 counter-terrorism police officers and 20 police officers announced in the 2017-18 Budget. Further details can be found in this section and Chapter 3 Capital Measures.
105
Budget Measures 2018-19
| | | | | | | | | | | | | | | | | | | | |
| | | 2017-18
$‘000 | | | 2018-19
$‘000 | | | 2019-20
$‘000 | | | 2020-21
$‘000 | | | 2021-22
$‘000 | |
Tackling Alcohol Fuelled Violence - Safe Night Precincts | | | 2,500 | | | | 5,000 | | | | 5,000 | | | | 5,000 | | | | 2,500 | |
Delivering on our election commitments, the Government has provided increased funding of $20 million over five years to continue to support the presence of police officers in Safe Night Precincts.
This forms part of the Government’s Tackling Alcohol Fuelled Violence Program. Further details of this funding can be found in the Queensland Corrective Services, Department of Communities, Disability Services and Seniors and Department of Justice and Attorney-General sections of this chapter.
| | | | | | | | | | | | | | | | | | | | |
| | | 2017-18
$‘000 | | | 2018-19
$‘000 | | | 2019-20
$‘000 | | | 2020-21
$‘000 | | | 2021-22
$‘000 | |
GPS Tracking of Defendants on Bail | | | 749 | | | | 2,572 | | | | — | | | | — | | | | — | |
The Government has provided additional funding of $3.3 million over two years to provide courts the capacity to impose a condition under the Bail Act 1980 for an electronic tracking device to be worn by defendants released on bail.
| | | | | | | | | | | | | | | | | | | | |
| | | 2017-18
$‘000 | | | 2018-19
$‘000 | | | 2019-20
$‘000 | | | 2020-21
$‘000 | | | 2021-22
$‘000 | |
Additional QLiTE Devices | | | — | | | | 1,950 | | | | 1,970 | | | | 2,000 | | | | — | |
Delivering on our election commitments, the Government is providing increased funding of $5.9 million over three years to provide frontline police officers with an additional 1,400 QLiTE mobile tablet devices.
106
Budget Measures 2018-19
| | | | | | | | | | | | | | | | | | | | |
| | | 2017-18
$‘000 | | | 2018-19
$‘000 | | | 2019-20
$‘000 | | | 2020-21
$‘000 | | | 2021-22
$‘000 | |
Camera Detected Offence Program | | | — | | | | 794 | | | | 1,240 | | | | 1,690 | | | | 2,247 | |
The Government is providing increased funding of $6 million over four years and $2.2 million per annum ongoing to reduce incidents of road trauma.
The Government is providing total increased funding of $166.6 million over four years across departments as part of the Camera Detected Offence Program. Further funding can be found in the Department of Transport and Main Roads and Queensland Treasury sections of this chapter. The capital component of this measure can be found in the Queensland Police Service and Department of Transport and Main Roads sections of Chapter 3 Capital Measures.
| | | | | | | | | | | | | | | | | | | | |
| | | 2017-18
$‘000 | | | 2018-19
$‘000 | | | 2019-20
$‘000 | | | 2020-21
$‘000 | | | 2021-22
$‘000 | |
National Disability Insurance Scheme - National Clearance Database | | | — | | | | 400 | | | | — | | | | — | | | | — | |
The Government is providing additional funding of $400,000 in 2018-19 for the development of a Queensland Police Service electronic interface with the National Clearance Database for the National Disability Insurance Scheme (NDIS). From 1 July 2019, this database will contain a register of cleared and excluded workers from all jurisdictions, reducing the potential for providers to employ workers who pose an unacceptable risk of harm to NDIS participants.
Total funding associated with the National Clearance Database is $1.7 million over three years. Further funding can be found in the Department of Communities, Disability Services and Seniors section of this chapter and the Queensland Police Service section of Chapter 3 Capital Measures.
107
Budget Measures 2018-19
| | | | | | | | | | | | | | | | | | | | |
| | | 2017-18
$‘000 | | | 2018-19
$‘000 | | | 2019-20
$‘000 | | | 2020-21
$‘000 | | | 2021-22
$‘000 | |
Domestic and Family Violence Response - Specialist Domestic and Family Violence Courts | | | — | | | | 263 | | | | 878 | | | | 899 | | | | 919 | |
The Government is providing additional funding of $3 million over four years and $919,000 per annum ongoing to support the expansion of the Townsville Specialist Domestic and Family Violence (DFV) Court (including circuit courts in Mount Isa and Palm Island) to include criminal DFV matters.
Total funding for the expansion of the Townsville Specialist DFV Court is $8.1 million over four years and $2.3 million per annum ongoing. Further funding can be found in the Department of Justice and Attorney-General, Queensland Corrective Services and the Department of Child Safety, Youth and Women sections of this chapter.
108
Budget Measures 2018-19
Queensland Treasury
| | | | | | | | | | | | | | | | | | | | |
| | | 2017-18
$‘000 | | | 2018-19
$‘000 | | | 2019-20
$‘000 | | | 2020-21
$‘000 | | | 2021-22
$‘000 | |
Expansion of the Jobs and Regional Growth Fund | | | — | | | | 20,000 | | | | — | | | | — | | | | — | |
The Government is providing increased funding of $20 million in 2018-19 for the Jobs and Regional Growth Fund to continue the Jobs and Regional Growth Package. The fund will help facilitate private sector projects which create employment and economic growth opportunities in regional Queensland by focussing on regions with higher than average unemployment. This increase brings the total funding to $150 million over three years from 2016-17.
Queensland Treasury and the Department of State Development, Manufacturing, Infrastructure and Planning are jointly responsible for the fund. This initiative can also be found in the Department of State Development, Manufacturing, Infrastructure and Planning section of this chapter.
| | | | | | | | | | | | | | | | | | | | |
| | | 2017-18
$‘000 | | | 2018-19
$‘000 | | | 2019-20
$‘000 | | | 2020-21
$‘000 | | | 2021-22
$‘000 | |
Camera Detected Offence Program | | | — | | | | 1,703 | | | | 2,406 | | | | 2,622 | | | | 2,843 | |
The Government is providing increased funding of $9.6 million over four years to reduce incidents of road trauma.
The Government is providing total increased funding of $166.6 million over four years across departments as part of the Camera Detected Offence Program. Further funding can be found in the Queensland Police Service and Department of Transport and Main Roads sections of this chapter. The capital component of this measure can be found in the Queensland Police Service and Department of Transport and Main Roads sections of Chapter 3 Capital Measures.
109
Budget Measures 2018-19
| | | | | | | | | | | | | | | | | | | | |
| | | 2017-18
$‘000 | | | 2018-19
$‘000 | | | 2019-20
$‘000 | | | 2020-21
$‘000 | | | 2021-22
$‘000 | |
Extension to First Home Owners’ Grant | | | 19,600 | | | | 32,000 | | | | — | | | | — | | | | — | |
Delivering on our election commitments, the Government has provided increased funding of $51.6 million over two years to extend the temporary increase in the Queensland First Home Owners’ Grant from $15,000 to $20,000 for six months between 1 January 2018 and 30 June 2018 inclusive, for the purchase or construction of new dwellings valued at less than $750,000.
| | | | | | | | | | | | | | | | | | | | |
| | | 2017-18
$‘000 | | | 2018-19
$‘000 | | | 2019-20
$‘000 | | | 2020-21
$‘000 | | | 2021-22
$‘000 | |
Move Up In The World - Attracting Business Investment and Migration to Queensland | | | 1,000 | | | | — | | | | — | | | | — | | | | — | |
The Government has provided additional funding of $1 million in 2017-18 for the Move Up In The World campaign. This is a targeted communication campaign to encourage interstate business investment and migration to Queensland for the Government’s priority industries.
110
Budget Measures 2018-19
Introduction
The following tables present the relevant portfolio capital measures relating to decisions taken since the 2017-18 Budget. This does not represent the full amount of additional funding provided to agencies since the 2017-18 Budget. For further explanation, refer to Explanation of Scope and Terms in Chapter 1.
111
Budget Measures 2018-19
Department of Agriculture and Fisheries
| | | | | | | | | | | | | | | | | | | | |
| | | 2017-18
$‘000 | | | 2018-19
$‘000 | | | 2019-20
$‘000 | | | 2020-21
$‘000 | | | 2021-22
$‘000 | |
Restoration of Jimna Fire Tower | | | — | | | | 1,000 | | | | 500 | | | | — | | | | — | |
The Government is providing additional funding of $1.5 million over two years to restore the Jimna fire tower that is listed on the Queensland Heritage Register.
112
Budget Measures 2018-19
Department of Child Safety, Youth and Women
| | | | | | | | | | | | | | | | | | | | |
| | | 2017-18
$‘000 | | | 2018-19
$‘000 | | | 2019-20
$‘000 | | | 2020-21
$‘000 | | | 2021-22
$‘000 | |
Information and Communication Technology (ICT) Infrastructure Investment | | | — | | | | 2,800 | | | | — | | | | — | | | | — | |
The Government is providing increased funding of $2.8 million in 2018-19 to continue the Social Investment ICT Program and Child and Family Services Information and Communication Technology Program.
113
Budget Measures 2018-19
Department of Communities, Disability Services and Seniors
| | | | | | | | | | | | | | | | | | | | |
| | | 2017-18
$‘000 | | | 2018-19
$‘000 | | | 2019-20
$‘000 | | | 2020-21
$‘000 | | | 2021-22
$‘000 | |
Supporting Veterans - The Oasis Townsville Defence Hub | | | 2,600 | | | | — | | | | — | | | | — | | | | — | |
Delivering on our election commitments, the Government has provided additional funding of $2.6 million in 2017-18 to refurbish a government-owned building for The Oasis Townsville to provide a one-stop shop for welfare support and employment transition services to ex-Australian Defence Force personnel and their families.
This forms part of the Government’s total funding package of $4.3 million for the Supporting Veterans initiative. Further funding can be found in the Department of Communities, Disability Services and Seniors and the Department of the Premier and Cabinet sections of Chapter 2 Expense Measures.
114
Budget Measures 2018-19
Department of Education
| | | | | | | | | | | | | | | | | | | | |
| | | 2017-18
$‘000 | | | 2018-19
$‘000 | | | 2019-20
$‘000 | | | 2020-21
$‘000 | | | 2021-22
$‘000 | |
Advancing Clean Energy Schools | | | 2,000 | | | | 47,000 | | | | 48,000 | | | | — | | | | — | |
Delivering on our election commitments, the Government has provided additional funding of $97 million over three years for solar and energy efficiency measures for clean energy schools.
| | | | | | | | | | | | | | | | | | | | |
| | | 2017-18
$‘000 | | | 2018-19
$‘000 | | | 2019-20
$‘000 | | | 2020-21
$‘000 | | | 2021-22
$‘000 | |
Building Future Schools Fund | | | — | | | | 30,000 | | | | 164,400 | | | | 22,080 | | | | 51,520 | |
Delivering on our election commitments, the Government is providing additional funding of $308 million over six years from 2018-19, bringing total funding to $808 million across seven years to deliver world class learning environments for students and to address enrolment growth pressures in state schools.
| | | | | | | | | | | | | | | | | | | | |
| | | 2017-18
$‘000 | | | 2018-19
$‘000 | | | 2019-20
$‘000 | | | 2020-21
$‘000 | | | 2021-22
$‘000 | |
Renewing our Schools | | | — | | | | 15,000 | | | | 70,000 | | | | 70,000 | | | | 80,000 | |
The Government is providing additional funding of $235 million over four years to substantially refurbish and upgrade 17 high schools across the State, with each school to receive at least $10 million.
115
Budget Measures 2018-19
| | | | | | | | | | | | | | | | | | | | |
| | | 2017-18
$‘000 | | | 2018-19
$‘000 | | | 2019-20
$‘000 | | | 2020-21
$‘000 | | | 2021-22
$‘000 | |
School Renewal | | | — | | | | 10,000 | | | | 15,600 | | | | — | | | | — | |
The Government is providing additional funding of $25.6 million over two years to deliver renewal works at 31 state schools.
| | | | | | | | | | | | | | | | | | | | |
| | | 2017-18
$‘000 | | | 2018-19
$‘000 | | | 2019-20
$‘000 | | | 2020-21
$‘000 | | | 2021-22
$‘000 | |
Implementation of the Labour Hire Licensing Act 2017 | | | 716 | | | | — | | | | — | | | | — | | | | — | |
Delivering on our election commitments, the Government has provided additional funding of $716,000 in 2017-18 for the implementation of an online licensing system to manage the mandatory business licensing scheme associated with the Labour Hire Licensing Act. The expense component of this measure can be found in Chapter 2 Expense Measures. The revenue component of this measure can be found in Chapter 4 Revenue Measures.
| | | | | | | | | | | | | | | | | | | | |
| | | 2017-18
$‘000 | | | 2018-19
$‘000 | | | 2019-20
$‘000 | | | 2020-21
$‘000 | | | 2021-22
$‘000 | |
Yarrabilba State School Integrated Children’s Services Community Hub | | | 3,600 | | | | — | | | | — | | | | — | | | | — | |
The Government has provided additional funding of $3.6 million in 2017-18 to meet the needs of the rapidly growing community of Yarrabilba. When it is completed in August 2018, the Hub will offer child and maternal health services, children’s activities such as playgroups and consulting rooms for visiting specialists.
116
Budget Measures 2018-19
Department of Employment, Small Business and Training
| | | | | | | | | | | | | | | | | | | | |
| | | 2017-18
$‘000 | | | 2018-19
$‘000 | | | 2019-20
$‘000 | | | 2020-21
$‘000 | | | 2021-22
$‘000 | |
Advancing Our Training Infrastructure | | | — | | | | 30,000 | | | | 30,000 | | | | 25,000 | | | | — | |
Delivering on our election commitments, the Government is providing additional funding of up to $85 million over three years in the redevelopment, refurbishment and expansion of six identified high-need TAFE facilities. Funding is provided for training sites at Pimlico, Cairns, Mount Gravatt and Toowoomba, and other training infrastructure within the regions of the Gold Coast and Redlands.
117
Budget Measures 2018-19
Department of Environment and Science
| | | | | | | | | | | | | | | | | | | | |
| | | 2017-18
$‘000 | | | 2018-19
$‘000 | | | 2019-20
$‘000 | | | 2020-21
$‘000 | | | 2021-22
$‘000 | |
New Performing Arts Venue at the Queensland Performing Arts Centre | | | — | | | | 5,000 | | | | 50,000 | | | | 50,000 | | | | 20,000 | |
The Government is providing additional funding of $125 million over four years to build a new performing arts venue at the Queensland Performing Arts Centre, benefitting Queensland artists and audiences.
| | | | | | | | | | | | | | | | | | | | |
| | | 2017-18
$‘000 | | | 2018-19
$‘000 | | | 2019-20
$‘000 | | | 2020-21
$‘000 | | | 2021-22
$‘000 | |
Queensland Cultural Centre - Critical Infrastructure Asset Renewal | | | — | | | | 4,928 | | | | 3,522 | | | | — | | | | — | |
The Government is providing additional funding of $8.5 million over two years to provide critical infrastructure upgrade works at the Queensland Museum and to install two further cooling towers within the central energy plant at the Queensland Cultural Centre, South Bank.
| | | | | | | | | | | | | | | | | | | | |
| | | 2017-18
$‘000 | | | 2018-19
$‘000 | | | 2019-20
$‘000 | | | 2020-21
$‘000 | | | 2021-22
$‘000 | |
Queensland Cultural Centre - Electricity Supplementation and Future Energy Efficiency | | | — | | | | 1,800 | | | | 3,150 | | | | 4,050 | | | | — | |
The Government is providing additional funding of $9 million over three years to implement sustainability and energy efficiency measures at the Queensland Cultural Centre, South Bank, to improve energy performance whilst lowering energy consumption and greenhouse gas emissions. The expense component of this measure can be found in Chapter 2 Expense Measures.
118
Budget Measures 2018-19
| | | | | | | | | | | | | | | | | | | | |
| | | 2017-18
$‘000 | | | 2018-19
$‘000 | | | 2019-20
$‘000 | | | 2020-21
$‘000 | | | 2021-22
$‘000 | |
Critical Infrastructure Asset Renewal and Equipment Replacement at the Queensland Performing Arts Centre | | | — | | | | 1,500 | | | | 1,800 | | | | — | | | | — | |
The Government is providing additional funding of $3.3 million over two years to address urgent and unavoidable critical infrastructure works at the Queensland Performing Arts Centre.
| | | | | | | | | | | | | | | | | | | | |
| | | 2017-18
$‘000 | | | 2018-19
$‘000 | | | 2019-20
$‘000 | | | 2020-21
$‘000 | | | 2021-22
$‘000 | |
National Parks Harsh Environment Fire Vehicles | | | — | | | | 200 | | | | — | | | | — | | | | — | |
The Government is providing increased funding of $200,000 in 2018-19 towards accessory fitouts for vehicles operating in harsh environments in Queensland’s Protected Area Estate to ensure the continued safety of staff, property and the community. The expenses component of this measure can be found in Chapter 2 Expense Measures.
| | | | | | | | | | | | | | | | | | | | |
| | | 2017-18
$‘000 | | | 2018-19
$‘000 | | | 2019-20
$‘000 | | | 2020-21
$‘000 | | | 2021-22
$‘000 | |
Government Action on North Stradbroke Island (Minjerribah) | | | 1,690 | | | | 113 | | | | — | | | | — | | | | — | |
The Government has provided increased funding of $1.8 million over two years for the expansion of the protected area over North Stradbroke Island (Minjerribah) as part of joint management arrangements with traditional owners to construct visitor and management infrastructure.
The expense components of this measure can be found in the Department of Environment and Science, Department of Natural Resources, Mines and Energy and Department of State Development, Manufacturing, Infrastructure and Planning sections of Chapter 2 Expense Measures.
119
Budget Measures 2018-19
| | | | | | | | | | | | | | | | | | | | |
| | | 2017-18
$‘000 | | | 2018-19
$‘000 | | | 2019-20
$‘000 | | | 2020-21
$‘000 | | | 2021-22
$‘000 | |
Protected Area Estate - Acquisition | | | — | | | | — | | | | — | | | | — | | | | — | |
The Government is providing additional funding of $9.5 million in 2018-19, held centrally to support acquisition of properties of high conservation value to be added to Queensland’s Protected Area Estate. The Government is also providing additional funding of $155,000 in 2019-20, held centrally to provide new infrastructure at acquired properties. The expense component of this measure can be found in Chapter 2 Expense Measures.
| | | | | | | | | | | | | | | | | | | | |
| | | 2017-18
$‘000 | | | 2018-19
$‘000 | | | 2019-20
$‘000 | | | 2020-21
$‘000 | | | 2021-22
$‘000 | |
Protected Area Estate - Expansion | | | 6,200 | | | | — | | | | — | | | | — | | | | — | |
The Government has provided increased funding of $6.2 million in 2017-18 to acquire property of high conservation value and undertake track works, signage infrastructure and fire break construction necessary for its addition to the Queensland Protected Area Estate. The expense component of this measure can be found in Chapter 2 Expense Measures.
120
Budget Measures 2018-19
Department of Housing and Public Works
| | | | | | | | | | | | | | | | | | | | |
| | | 2017-18
$‘000 | | | 2018-19
$‘000 | | | 2019-20
$‘000 | | | 2020-21
$‘000 | | | 2021-22
$‘000 | |
Thomas Dixon Centre Refurbishment | | | — | | | | 9,500 | | | | 4,000 | | | | — | | | | — | |
The Government is providing additional funding of $8 million over two years towards the $35 million expansion of the Thomas Dixon Centre, to provide enhanced performance facilities for Queensland Ballet. The Government is also allocating an additional $5.5 million to manage costs and associated works required to maintain and preserve the heritage listed centre.
This is part of an overall package of $14 million over two years towards the refurbishment of the Thomas Dixon Centre. The expense component of this measure can be found in Chapter 2 Expense Measures.
121
Budget Measures 2018-19
Department of Innovation, Tourism Industry Development and the Commonwealth Games
| | | | | | | | | | | | | | | | | | | | |
| | | 2017-18
$‘000 | | | 2018-19
$‘000 | | | 2019-20
$‘000 | | | 2020-21
$‘000 | | | 2021-22
$‘000 | |
Great Keppel Island Recovery Package | | | 5,000 | | | | 10,000 | | | | 10,000 | | | | — | | | | — | |
Delivering on our election commitments, the Government has provided additional funding of $25 million over three years for a Great Keppel Island Recovery Package to deliver major tourism infrastructure improvements such as power and water connections to the mainland.
122
Budget Measures 2018-19
Department of Justice and Attorney-General
| | | | | | | | | | | | | | | | | | | | |
| | | 2017-18
$‘000 | | | 2018-19
$‘000 | | | 2019-20
$‘000 | | | 2020-21
$‘000 | | | 2021-22
$‘000 | |
Blue Card Services ‘No Card, No Start’ | | | — | | | | 2,520 | | | | 709 | | | | — | | | | — | |
Delivering on our election commitments, the Government is providing additional funding of $3.2 million over two years to implement an online Blue Card application system as part of the Government’s ‘No Card, No Start’ initiative. Funding of $6.6 million over two years will also be reprioritised by the department internally to fund this measure, bringing total funding to $9.8 million over two years. The expense component of this measure can be found in Chapter 2 Expense Measures.
| | | | | | | | | | | | | | | | | | | | |
| | | 2017-18
$‘000 | | | 2018-19
$‘000 | | | 2019-20
$‘000 | | | 2020-21
$‘000 | | | 2021-22
$‘000 | |
Crime and Corruption Commission - Digital Investigative and Information Security Services | | | — | | | | 1,295 | | | | 354 | | | | — | | | | — | |
The Government is providing additional funding of $1.6 million over two years to enhance the processing of digital evidence and to provide for a contemporary information security platform. The expense component of this measure can be found in Chapter 2 Expense Measures.
| | | | | | | | | | | | | | | | | | | | |
| | | 2017-18
$‘000 | | | 2018-19
$‘000 | | | 2019-20
$‘000 | | | 2020-21
$‘000 | | | 2021-22
$‘000 | |
Anti-Discrimination Commission Queensland - Human Rights Act for Queensland | | | — | | | | 100 | | | | 100 | | | | — | | | | — | |
Delivering on our election commitments, the Government is providing additional funding of $200,000 over two years for office and system enhancements required to support the operation and administration of a Human Rights Act. The expense component of this measure can be found in Chapter 2 Expense Measures.
123
Budget Measures 2018-19
Department of Local Government, Racing and Multicultural Affairs
| | | | | | | | | | | | | | | | | | | | |
| | | 2017-18
$‘000 | | | 2018-19
$‘000 | | | 2019-20
$‘000 | | | 2020-21
$‘000 | | | 2021-22
$‘000 | |
Implementing More Effective Funding Grants to Local Government | | | — | | | | 1,300 | | | | — | | | | — | | | | — | |
The Government is providing additional funding of $1.3 million in 2018-19 to develop a new grants management system to improve and simplify the administration of grants to local government. This measure progresses the recommendations from the Review of Grants to Local Government: Current and future state assessments. The expense component of this measure can be found in Chapter 2 Expense Measures.
| | | | | | | | | | | | | | | | | | | | |
| | | 2017-18
$‘000 | | | 2018-19
$‘000 | | | 2019-20
$‘000 | | | 2020-21
$‘000 | | | 2021-22
$‘000 | |
Northern Peninsula Area Water Supply System - Replacement of Asbestos Cement Pipelines | | | — | | | | 1,000 | | | | 1,000 | | | | 1,000 | | | | 1,000 | |
The Government is providing additional funding of $5 million over five years to safeguard the security of the Northern Peninsula Area Water Supply System through the replacement of existing asbestos cement pipelines.
124
Budget Measures 2018-19
Department of Natural Resources, Mines and Energy
| | | | | | | | | | | | | | | | | | | | |
| | | 2017-18
$‘000 | | | 2018-19
$‘000 | | | 2019-20
$‘000 | | | 2020-21
$‘000 | | | 2021-22
$‘000 | |
Rookwood Weir | | | — | | | | 66,000 | | | | 83,000 | | | | 126,000 | | | | 77,000 | |
The Government is providing increased funding of $176 million over four years, which is being matched by the Australian Government capital contribution of $176 million to support the construction of the Rookwood Weir on the Fitzroy River. This will provide drought contingency supplies for Rockhampton, Gladstone and Yeppoon and support agriculture.
| | | | | | | | | | | | | | | | | | | | |
| | | 2017-18
$‘000 | | | 2018-19
$‘000 | | | 2019-20
$‘000 | | | 2020-21
$‘000 | | | 2021-22
$‘000 | |
Glen Niven Dam | | | — | | | | 2,500 | | | | — | | | | — | | | | — | |
The Government is providing additional funding of $2.5 million in 2018-19 to upgrade the Glen Niven Dam to meet dam safety requirements. The department has also internally reprioritised funding of $2.5 million, bringing total funding to $5 million.
| | | | | | | | | | | | | | | | | | | | |
| | | 2017-18
$‘000 | | | 2018-19
$‘000 | | | 2019-20
$‘000 | | | 2020-21
$‘000 | | | 2021-22
$‘000 | |
Linc Energy Mine Site | | | — | | | | — | | | | — | | | | — | | | | — | |
Funding of $1.6 million is being internally reprioritised to 2018-19 by the department to provide ongoing site security, management and remediation of infrastructure works at the Linc site. Further funding can be found in Chapter 2 Expense Measures.
125
Budget Measures 2018-19
Department of State Development, Manufacturing, Infrastructure and Planning
| | | | | | | | | | | | | | | | | | | | |
| | | 2017-18
$‘000 | | | 2018-19
$‘000 | | | 2019-20
$‘000 | | | 2020-21
$‘000 | | | 2021-22
$‘000 | |
Growth Area and Regional Infrastructure Investment Fund | | | — | | | | — | | | | — | | | | — | | | | — | |
The Government is providing additional funding of $40 million over two years from 2018-19, held centrally, to invest in infrastructure that improves prosperity and liveability for Queenslanders living in outer urban and regional Queensland. A core focus of the program is accelerating new, or upgrading existing infrastructure that leads and supports growth and productivity.
126
Budget Measures 2018-19
Department of Transport and Main Roads
| | | | | | | | | | | | | | | | | | | | |
| | | 2017-18
$‘000 | | | 2018-19
$‘000 | | | 2019-20
$‘000 | | | 2020-21
$‘000 | | | 2021-22
$‘000 | |
M1 Pacific Motorway - Eight Mile Plains to Daisy Hill | | | — | | | | 17,000 | | | | 28,500 | | | | 70,000 | | | | 201,000 | |
The Government is providing additional funding of $366.5 million over five years towards delivering the $749 million Eight Mile Plains to Daisy Hill project. The Australian Government has committed $100 million to 2021-22.
This brings total additional State Government funding for new jointly-funded planning and upgrades on the M1 Pacific Motorway to $897.5 million. Further funding for the planning of future upgrades to the M1 Pacific Motorway can be found in Chapter 2 Expense Measures.
| | | | | | | | | | | | | | | | | | | | |
| | | 2017-18
$‘000 | | | 2018-19
$‘000 | | | 2019-20
$‘000 | | | 2020-21
$‘000 | | | 2021-22
$‘000 | |
M1 Pacific Motorway - Varsity Lakes to Tugun | | | — | | | | 5,000 | | | | 15,000 | | | | 70,000 | | | | 220,000 | |
The Government is providing additional funding of $515 million over five years (including $206 million as part of an election commitment) towards delivering the $1.03 billion Varsity Lakes to Tugun upgrade. The Australian Government has committed $55 million to 2021-22.
This brings total additional State Government funding for new jointly-funded planning and upgrades on the M1 Pacific Motorway to $897.5 million. Further funding for the planning of future upgrades to the M1 Pacific Motorway can be found in Chapter 2 Expense Measures.
127
Budget Measures 2018-19
| | | | | | | | | | | | | | | | | | | | |
| | | 2017-18
$‘000 | | | 2018-19
$‘000 | | | 2019-20
$‘000 | | | 2020-21
$‘000 | | | 2021-22
$‘000 | |
New Public Transport Ticketing System | | | — | | | | 89,198 | | | | 104,427 | | | | 87,891 | | | | 89,544 | |
The Government is providing $371.1 million over four years to develop the new public transport public ticketing system in Queensland. Further funding can be found in Chapter 2 Expense Measures.
| | | | | | | | | | | | | | | | | | | | |
| | | 2017-18
$‘000 | | | 2018-19
$‘000 | | | 2019-20
$‘000 | | | 2020-21
$‘000 | | | 2021-22
$‘000 | |
Beerburrum to Nambour Rail | | | — | | | | 14,407 | | | | 59,470 | | | | 143,963 | | | | 142,951 | |
The Government is providing additional funding of $160.8 million over four years towards the Beerburrum to Nambour rail duplication project. The Australian Government has provided an initial $390 million over five years towards this measure.
| | | | | | | | | | | | | | | | | | | | |
| | | 2017-18
$‘000 | | | 2018-19
$‘000 | | | 2019-20
$‘000 | | | 2020-21
$‘000 | | | 2021-22
$‘000 | |
Smithfield Bypass | | | 4,222 | | | | 13,982 | | | | 25,330 | | | | 25,466 | | | | — | |
The Government has provided additional funding of $69 million over four years from the State Infrastructure Fund for the Smithfield Bypass. This will bring total funding for the project to $152 million. The Smithfield Bypass will deliver a new 3.8 kilometre-long road running parallel with the Captain Cook Highway to provide an alternative route between the McGregor Road intersection and Yorkeys Knob Road intersection.
| | | | | | | | | | | | | | | | | | | | |
| | | 2017-18
$‘000 | | | 2018-19
$‘000 | | | 2019-20
$‘000 | | | 2020-21
$‘000 | | | 2021-22
$‘000 | |
Station Upgrades including Park ’n’ Ride facilities | | | 400 | | | | 6,600 | | | | 4,305 | | | | 14,195 | | | | — | |
Delivering on our election commitments, the Government has provided increased funding of $25.5 million over four years to significantly expand park’n’ride capacity at Greenbank and Eight Mile Plains bus stations.
128
Budget Measures 2018-19
| | | | | | | | | | | | | | | | | | | | |
| | | 2017-18
$‘000 | | | 2018-19
$‘000 | | | 2019-20
$‘000 | | | 2020-21
$‘000 | | | 2021-22
$‘000 | |
Northern Transitway | | | 200 | | | | 5,800 | | | | 10,000 | | | | 30,000 | | | | 7,000 | |
Delivering on our election commitments, the Government has provided additional funding of $53 million over five years for the Northern Transitway to deliver continuous dedicated bus lanes during peak hours from Chermside to Kedron - while retaining all existing lanes.
| | | | | | | | | | | | | | | | | | | | |
| | | 2017-18
$‘000 | | | 2018-19
$‘000 | | | 2019-20
$‘000 | | | 2020-21
$‘000 | | | 2021-22
$‘000 | |
Centenary Motorway Upgrade | | | 2,000 | | | | 5,000 | | | | 20,000 | | | | 21,000 | | | | — | |
The Government has provided additional funding of $48 million over four years from the State Infrastructure Fund for the Centenary Motorway upgrade bringing total funding to $65 million. The Sumners Road Interchange upgrade will include the installation of traffic signals at two intersections to replace existing roundabouts and construction of a new two lane eastbound bridge, with active transport options including cycle lanes, shared paths and crossings.
| | | | | | | | | | | | | | | | | | | | |
| | | 2017-18
$‘000 | | | 2018-19
$‘000 | | | 2019-20
$‘000 | | | 2020-21
$‘000 | | | 2021-22
$‘000 | |
Western Roads Upgrade Supplement | | | — | | | | 5,000 | | | | — | | | | — | | | | — | |
The Government is providing additional funding of $5 million in 2018-19 for upgrades to roads in western Queensland to assist local governments to maintain local workforces. This is in addition to the $140.6 million budgeted in the department’s 2018-19 capital program.
129
Budget Measures 2018-19
| | | | | | | | | | | | | | | | | | | | |
| | | 2017-18
$‘000 | | | 2018-19
$‘000 | | | 2019-20
$‘000 | | | 2020-21
$‘000 | | | 2021-22
$‘000 | |
Marine Infrastructure Fund | | | — | | | | 4,600 | | | | 25,400 | | | | — | | | | — | |
Delivering on our election commitments, the Government is providing increased funding of $30 million over two years to boost the Marine Infrastructure Fund. Projects will include boat ramps, barge landings, floating walkways and channel deepening.
| | | | | | | | | | | | | | | | | | | | |
| | | 2017-18
$‘000 | | | 2018-19
$‘000 | | | 2019-20
$‘000 | | | 2020-21
$‘000 | | | 2021-22
$‘000 | |
M1 Action Plan - Oxenford (Exit 57) Interchange Upgrade | | | — | | | | 3,000 | | | | 12,000 | | | | 10,000 | | | | — | |
Delivering on our election commitments, the Government is providing additional funding of $25 million over three years for the upgrade of the Oxenford (Exit 57) interchange on the Pacific Motorway.
| | | | | | | | | | | | | | | | | | | | |
| | | 2017-18
$‘000 | | | 2018-19
$‘000 | | | 2019-20
$‘000 | | | 2020-21
$‘000 | | | 2021-22
$‘000 | |
Stafford and South Pine Road Intersection Upgrade | | | 250 | | | | 2,250 | | | | 15,000 | | | | 8,500 | | | | — | |
Delivering on our election commitments, the Government has provided additional funding of $26 million over four years to widen the Everton Park Link Road to four lanes between South Pine Road, north of Kedron Brook and Stafford Road, east of Mountbridge Street.
| | | | | | | | | | | | | | | | | | | | |
| | | 2017-18
$‘000 | | | 2018-19
$‘000 | | | 2019-20
$‘000 | | | 2020-21
$‘000 | | | 2021-22
$‘000 | |
Camera Detected Offence Program | | | — | | | | 2,000 | | | | 2,350 | | | | 67,350 | | | | 55,350 | |
The Government is providing increased funding of $127.1 million over four years to improve the safety of the sections of state-controlled roads where accidents happen most frequently.
The Government is providing total increased funding of $166.6 million over four years across departments as part of the Camera Detected Offence Program. Further funding can be found in the Queensland Police Service section of this chapter. The expense component of this measure can be found in the Department of Transport and Main Roads, Queensland Police Service and Queensland Treasury sections of Chapter 2 Expense Measures.
130
Budget Measures 2018-19
| | | | | | | | | | | | | | | | | | | | |
| | | 2017-18
$‘000 | | | 2018-19
$‘000 | | | 2019-20
$‘000 | | | 2020-21
$‘000 | | | 2021-22
$‘000 | |
Mt Lindesay Highway (Johanna St intersection) | | | 200 | | | | 1,800 | | | | 12,000 | | | | 6,000 | | | | — | |
Delivering on our election commitments, the Government has provided additional funding of $20 million over four years to widen the Mount Lindesay Highway to four lanes from Camp Cable Road through to the Johanna/Tamborine Street intersection. These works will also raise the road for flood proofing.
| | | | | | | | | | | | | | | | | | | | |
| | | 2017-18
$‘000 | | | 2018-19
$‘000 | | | 2019-20
$‘000 | | | 2020-21
$‘000 | | | 2021-22
$‘000 | |
Gold Coast Seaway Sand Bypass System - Jetty Deck Upgrade | | | — | | | | 1,500 | | | | 1,850 | | | | — | | | | — | |
The Government is providing additional funding of $3.4 million over two years to upgrade the existing jetty deck to allow modern cranes to operate within appropriate safety standards and enable the continued maintenance of the Gold Coast Seaway Sand Bypass System.
| | | | | | | | | | | | | | | | | | | | |
| | | 2017-18
$‘000 | | | 2018-19
$‘000 | | | 2019-20
$‘000 | | | 2020-21
$‘000 | | | 2021-22
$‘000 | |
Roads Renewal Fund | | | — | | | | 1,000 | | | | 9,000 | | | | 10,000 | | | | 15,000 | |
Delivering on our election commitments, the Government is providing additional funding of $35 million over four years for the Roads Renewal Fund. Projects include fixing the Ruthven Street and North Street intersection at North Toowoomba and installation of traffic lights and slip lanes at the intersection of Peachester Road and Old Gympie Road outside the Beerwah State School.
131
Budget Measures 2018-19
| | | | | | | | | | | | | | | | | | | | |
| | | 2017-18
$‘000 | | | 2018-19
$‘000 | | | 2019-20
$‘000 | | | 2020-21
$‘000 | | | 2021-22
$‘000 | |
Construction of Petrie Roundabout Project | | | — | | | | — | | | | 10,500 | | | | 12,000 | | | | — | |
The Government will provide increased funding of $22.5 million over two years to upgrade the intersection of Anzac Avenue, Dayboro Road and Gympie Road (the Petrie Roundabout). This brings total funding for the Petrie Roundabout to $30 million over two years.
| | | | | | | | | | | | | | | | | | | | |
| | | 2017-18
$‘000 | | | 2018-19
$‘000 | | | 2019-20
$‘000 | | | 2020-21
$‘000 | | | 2021-22
$‘000 | |
Future Proofing The Bruce | | | — | | | | — | | | | 30,500 | | | | 98,000 | | | | 125,000 | |
Delivering on our election commitments, the Government will provide additional funding of $253.5 million over three years for priority projects to be delivered for Bruce Highway upgrades. The expense component of this initiative can be found in Chapter 2 Expense Measures.
| | | | | | | | | | | | | | | | | | | | |
| | | 2017-18
$‘000 | | | 2018-19
$‘000 | | | 2019-20
$‘000 | | | 2020-21
$‘000 | | | 2021-22
$‘000 | |
Gold Coast Train Stations | | | — | | | | — | | | | — | | | | 25,000 | | | | 50,000 | |
The Government will provide additional funding of $120 million over three years to build three new train stations at Pimpama, Helensvale North and Worongary-Merrimac. The three new stations will allow more Gold Coast residents to benefit from the 3,150 extra peak-hour seats being provided by increased rail services on the Gold Coast rail line, which will help take pressure off the M1 motorway. Planning work for these stations will be progressed in 2018-19 at an estimated cost of $3 million.
132
Budget Measures 2018-19
| | | | | | | | | | | | | | | | | | | | |
| | | 2017-18
$‘000 | | | 2018-19
$‘000 | | | 2019-20
$‘000 | | | 2020-21
$‘000 | | | 2021-22
$‘000 | |
Mount Isa to Townsville Rail Line | | | — | | | | — | | | | — | | | | 10,000 | | | | 40,000 | |
Delivering on our election commitments, the Government will provide increased funding of $50 million over two years, taking total funding to $380 million over the next five years, to help repair and maintain the Townsville to Mount Isa rail line.
133
Budget Measures 2018-19
Legislative Assembly of Queensland
| | | | | | | | | | | | | | | | | | | | |
| | | 2017-18
$‘000 | | | 2018-19
$‘000 | | | 2019-20
$‘000 | | | 2020-21
$‘000 | | | 2021-22
$‘000 | |
Parliament House Fire Protection System | | | — | | | | 3,994 | | | | — | | | | — | | | | — | |
The Government is providing increased funding of $4 million in 2018-19 to fund completion of a fire protection system in the heritage listed Parliament House building.
| | | | | | | | | | | | | | | | | | | | |
| | | 2017-18
$‘000 | | | 2018-19
$‘000 | | | 2019-20
$‘000 | | | 2020-21
$‘000 | | | 2021-22
$‘000 | |
2017 Electoral Boundary Redistribution and Election | | | 775 | | | | 1,000 | | | | — | | | | — | | | | — | |
The Government has provided additional funding of $1.8 million over two years for office accommodation costs associated with the 2017 Electoral Boundary Redistribution. The expense component of this measure can be found in Chapter 2 Expense Measures.
| | | | | | | | | | | | | | | | | | | | |
| | | 2017-18
$‘000 | | | 2018-19
$‘000 | | | 2019-20
$‘000 | | | 2020-21
$‘000 | | | 2021-22
$‘000 | |
Infrastructure and Accommodation Critical Works Program | | | 200 | | | | 1,000 | | | | 400 | | | | — | | | | — | |
The Government has provided additional funding of $1.6 million over three years to complete relocation of existing leased electorate offices across Queensland which are presenting high-risk non-compliance issues in relation to building access and security.
134
Budget Measures 2018-19
| | | | | | | | | | | | | | | | | | | | |
| | | 2017-18
$‘000 | | | 2018-19
$‘000 | | | 2019-20
$‘000 | | | 2020-21
$‘000 | | | 2021-22
$‘000 | |
Parliamentary Annexe Lift Upgrade Program | | | 1,205 | | | | — | | | | — | | | | — | | | | — | |
The Government has provided increased funding of $1.2 million in 2017-18 to complete the upgrade of the Parliamentary Annexe low-rise lifts and service lift. The expense component of this measure can be found in Chapter 2 Expense Measures.
135
Budget Measures 2018-19
Public Safety Business Agency
| | | | | | | | | | | | | | | | | | | | |
| | | 2017-18
$‘000 | | | 2018-19
$‘000 | | | 2019-20
$‘000 | | | 2020-21
$‘000 | | | 2021-22
$‘000 | |
Queensland Government Air Aircraft Maintenance and Compliance | | | — | | | | 3,728 | | | | — | | | | — | | | | — | |
The Government is providing additional funding of $3.7 million in 2018-19 for mandatory maintenance of Queensland Government Air’s (QGAir) rotary and fixed wing aircraft. This funding enables QGAir to continue to support the emergency helicopter network across the State for search and rescue, natural disasters, police and aeromedical operations and provide fixed wing transport services for police, government and organ transfer. The expense component of this measure can be found in Chapter 2 Expense Measures.
136
Budget Measures 2018-19
Queensland Corrective Services
| | | | | | | | | | | | | | | | | | | | |
| | | 2017-18
$‘000 | | | 2018-19
$‘000 | | | 2019-20
$‘000 | | | 2020-21
$‘000 | | | 2021-22
$‘000 | |
Capricornia Correctional Centre | | | — | | | | 22,000 | | | | 19,000 | | | | — | | | | — | |
The Government is providing increased funding of $41 million over two years to increase the already planned expansion of Capricornia Correctional Centre by 84 cells to a total of 348 cells. Total capital funding for the project amounts to $241 million over five years.
| | | | | | | | | | | | | | | | | | | | |
| | | 2017-18
$‘000 | | | 2018-19
$‘000 | | | 2019-20
$‘000 | | | 2020-21
$‘000 | | | 2021-22
$‘000 | |
Minor Capital Works | | | — | | | | 5,500 | | | | 5,000 | | | | — | | | | — | |
The Government is providing increased funding of $10.5 million over two years to upgrade and maintain infrastructure within correctional centres.
137
Budget Measures 2018-19
Queensland Fire and Emergency Services
| | | | | | | | | | | | | | | | | | | | |
| | | 2017-18
$‘000 | | | 2018-19
$‘000 | | | 2019-20
$‘000 | | | 2020-21
$‘000 | | | 2021-22
$‘000 | |
Queensland Fire and Emergency Services Facility - Maleny | | | — | | | | 1,050 | | | | 1,000 | | | | 1,450 | | | | (500 | ) |
Delivering on our election commitments, the Government is providing an additional $3 million for the construction of a new fire and emergency services facility in Maleny. This will provide a fit for purpose facility that will enable Queensland Fire and Emergency Services to provide responsive services to the growing Maleny and Sunshine Coast Hinterland community.
| | | | | | | | | | | | | | | | | | | | |
| | | 2017-18
$‘000 | | | 2018-19
$‘000 | | | 2019-20
$‘000 | | | 2020-21
$‘000 | | | 2021-22
$‘000 | |
Queensland Fire and Emergency Services Facilities - Yarrabilba and surrounds | | | — | | | | 1,000 | | | | 1,000 | | | | 3,000 | | | | — | |
Delivering on our election commitments, the Government is providing additional funding of $5 million over three years for equipped fire and emergency services facilities to service the community of Yarrabilba and surrounds. The initiative will enable the upgrade of the existing facility in Logan Village and the completion of a new facility at Yarrabilba.
138
Budget Measures 2018-19
Queensland Health
| | | | | | | | | | | | | | | | | | | | |
| | | 2017-18
$‘000 | | | 2018-19
$‘000 | | | 2019-20
$‘000 | | | 2020-21
$‘000 | | | 2021-22
$‘000 | |
Building Better Hospitals | | | 11,000 | | | | 52,280 | | | | 87,270 | | | | 202,000 | | | | 185,700 | |
Delivering on our election commitments, the Government has provided increased funding of $570.8 million over six years, including $32.5 million in 2022-23, to enhance public hospital capacity and services in the south east Queensland growth corridor, including for redevelopments at the Logan, Caboolture and Ipswich hospitals and to commence planning for the Wide Bay region.
Total funding included in the Building Better Hospitals package is $679 million. This includes $103.2 million that was provided in the 2017-18 Budget for detailed planning and preparatory works for the Logan Caboolture and Ipswich hospitals, and $5 million for the refurbishment of Cancer Council Queensland Lodges. The expense component of this measure can be found in Chapter 2 Expense Measures.
| | | | | | | | | | | | | | | | | | | | |
| | | 2017-18
$‘000 | | | 2018-19
$‘000 | | | 2019-20
$‘000 | | | 2020-21
$‘000 | | | 2021-22
$‘000 | |
Rockhampton Drug Treatment and Rehabilitation Facility | | | 1,500 | | | | 2,600 | | | | 5,400 | | | | — | | | | — | |
Delivering on our election commitments, the Government has provided additional funding of $9.5 million over three years for a new 42-bed residential drug rehabilitation and treatment facility in Rockhampton. The expense component of this measure can be found in Chapter 2 Expense Measures.
139
Budget Measures 2018-19
| | | | | | | | | | | | | | | | | | | | |
| | | 2017-18
$‘000 | | | 2018-19
$‘000 | | | 2019-20
$‘000 | | | 2020-21
$‘000 | | | 2021-22
$‘000 | |
Redland Hospital | | | 1,730 | | | | — | | | | — | | | | — | | | | — | |
Delivering on our election commitments, the Government has provided additional funding of $1.7 million in 2017-18 to upgrade the Redland Hospital, including a new water birthing suite and an expansion of the emergency department.
| | | | | | | | | | | | | | | | | | | | |
| | | 2017-18
$‘000 | | | 2018-19
$‘000 | | | 2019-20
$‘000 | | | 2020-21
$‘000 | | | 2021-22
$‘000 | |
Health Technology Equipment Replacement Program | | | — | | | | 50,000 | | | | — | | | | — | | | | — | |
The Government is providing increased funding of $50 million in 2018-19 to support the replacement of essential medical equipment under the Health Technology Equipment Replacement Program, such as computed tomography (CT) scanners, magnetic resonance imaging (MRI) scanners and surgical equipment.
| | | | | | | | | | | | | | | | | | | | |
| | | 2017-18
$‘000 | | | 2018-19
$‘000 | | | 2019-20
$‘000 | | | 2020-21
$‘000 | | | 2021-22
$‘000 | |
Redcliffe Hospital Carpark | | | — | | | | 7,508 | | | | 24,098 | | | | 5,174 | | | | — | |
The Government is providing additional funding of $36.8 million over three years to build a new four-storey, 604-bay carpark at Redcliffe Hospital to improve car parking access for patients, carers and their families.
| | | | | | | | | | | | | | | | | | | | |
| | | 2017-18
$‘000 | | | 2018-19
$‘000 | | | 2019-20
$‘000 | | | 2020-21
$‘000 | | | 2021-22
$‘000 | |
Youth Justice - Specialist Mental Health Youth Forensic Assessment | | | — | | | | — | | | | — | | | | — | | | | — | |
Funding of $330,000 in 2018-19 is being internally reprioritised by the department to improve mental health assessments of young people in the youth justice system.
This forms part of the Government’s total funding of $40.7 million over four years ($22.3 million new funding and $18.4 million reprioritised funding) for youth justice support measures. Further details can be found in the Department of Child Safety, Youth and Women, Department of Education, Department of Housing and Public Works and Queensland Health sections of Chapter 2 Expense Measures.
140
Budget Measures 2018-19
Queensland Police Service
| | | | | | | | | | | | | | | | | | | | |
| | | 2017-18
$‘000 | | | 2018-19
$‘000 | | | 2019-20
$‘000 | | | 2020-21
$‘000 | | | 2021-22
$‘000 | |
Camera Detected Offence Program | | | — | | | | 950 | | | | 2,150 | | | | 1,150 | | | | 1,900 | |
The Government is providing increased funding of $6.2 million over four years and $700,000 per annum ongoing to reduce incidents of road trauma.
The Government is providing total increased funding of $166.6 million over four years across departments as part of the Camera Detected Offence Program. Further funding can be found in the Department of Transport and Main Roads section of this chapter. The expense component of this measure can be found in the Queensland Police Service, Department of Transport and Main Roads and Queensland Treasury sections of Chapter 2 Expense Measures.
| | | | | | | | | | | | | | | | | | | | |
| | | 2017-18
$‘000 | | | 2018-19
$‘000 | | | 2019-20
$‘000 | | | 2020-21
$‘000 | | | 2021-22
$‘000 | |
Police Officers | | | — | | | | 600 | | | | 600 | | | | 600 | | | | 600 | |
Delivering on our election commitments, the Government is providing additional funding of $2.4 million over four years to purchase additional vehicles to maintain a 24-hour policing presence. The expense component of this measure can be found in Chapter 2 Expense Measures.
| | | | | | | | | | | | | | | | | | | | |
| | | 2017-18
$‘000 | | | 2018-19
$‘000 | | | 2019-20
$‘000 | | | 2020-21
$‘000 | | | 2021-22
$‘000 | |
National Disability Insurance Scheme - National Clearance Database | | | — | | | | 100 | | | | — | | | | — | | | | — | |
The Government is providing additional funding of $100,000 in 2018-19 for the development of a Queensland Police Service electronic interface with the National Clearance Database for the National Disability Insurance Scheme (NDIS). From 1 July 2019, this database will contain a register of cleared and excluded workers from all jurisdictions, reducing the potential for providers to employ workers who pose an unacceptable risk of harm to NDIS participants.
Total funding associated with the National Clearance Database is $1.7 million over three years. Further funding can be found in the Department of Communities, Disability Services and Seniors and Queensland Police Service sections of Chapter 2 Expense Measures.
141
Budget Measures 2018-19
| | | | | | | | | | | | | | | | | | | | |
| | | 2017-18
$‘000 | | | 2018-19
$‘000 | | | 2019-20
$‘000 | | | 2020-21
$‘000 | | | 2021-22
$‘000 | |
Increased Counter-Terrorism Capability | | | 1,260 | | | | — | | | | — | | | | — | | | | — | |
Delivering on our election commitments, the Government has provided additional funding of $1.3 million in 2017-18 to purchase 22 vehicles and specialist tactical equipment. The expense component of this measure can be found in Chapter 2 Expense Measures.
142
Budget Measures 2018-19
Queensland Treasury
| | | | | | | | | | | | | | | | | | | | |
| | | 2017-18
$‘000 | | | 2018-19
$‘000 | | | 2019-20
$‘000 | | | 2020-21
$‘000 | | | 2021-22
$‘000 | |
Business Development Fund | | | — | | | | 20,000 | | | | 20,000 | | | | — | | | | — | |
The Government is providing increased funding of $40 million over two years to continue to support the growth of angel and venture capital funding available to Queensland businesses, thereby strengthening Queensland’s entrepreneurial and start-up eco-system. The fund will continue to support the growth of innovative businesses and the creation of high-value jobs, as well as attracting both interstate and international investment in Queensland.
143
Budget Measures 2018-19
Introduction
The following tables present the relevant portfolio revenue measures relating to decisions taken since the 2017-18 Budget. For further explanation, refer to Explanation of Scope and Terms in Chapter 1.
144
Budget Measures 2018-19
Department of Agriculture and Fisheries
| | | | | | | | | | | | | | | | | | | | |
| | | 2017-18
$‘000 | | | 2018-19
$‘000 | | | 2019-20
$‘000 | | | 2020-21
$‘000 | | | 2021-22
$‘000 | |
Veterinary Surgeons Regulation 2016 | | | — | | | | 201 | | | | 208 | | | | 215 | | | | 223 | |
The Government is increasing fees under the Veterinary Surgeons Regulation 2016 for specialist veterinarians, retired veterinarians and new graduates to achieve both full cost recovery and better service delivery by the Veterinary Surgeons Board of Queensland.
| | | | | | | | | | | | | | | | | | | | |
| | | 2017-18
$‘000 | | | 2018-19
$‘000 | | | 2019-20
$‘000 | | | 2020-21
$‘000 | | | 2021-22
$‘000 | |
Queensland Racing Integrity Commission (QRIC) - Reducing Red Tape through a New Licence Model | | | — | | | | (125 | ) | | | (125 | ) | | | (125 | ) | | | (122 | ) |
The Government is moving from an annual to a three year licensing model for trainers across the three codes of racing (greyhounds, thoroughbreds and harness).
The new licensing model will provide greater standardisation, more convenience for participants and allow for improved integrity standards.
145
Budget Measures 2018-19
Department of Education
| | | | | | | | | | | | | | | | | | | | |
| | | 2017-18
$‘000 | | | 2018-19
$‘000 | | | 2019-20
$‘000 | | | 2020-21
$‘000 | | | 2021-22
$‘000 | |
Implementation of the Labour Hire Licensing Act 2017 | | | 3,071 | | | | 3,071 | | | | 3,071 | | | | 3,071 | | | | 3,071 | |
The Government has introduced a new, tier-dependent fee of $1,000, $3,000 or $5,000 for labour hire providers operating in Queensland when they apply, renew or restore a licence under the Labour Hire Licensing Act. The expense component of this measure can be found in Chapter 2 Expense Measures. The capital component of this measure can be found in Chapter 3 Capital Measures.
| | | | | | | | | | | | | | | | | | | | |
| | | 2017-18
$‘000 | | | 2018-19
$‘000 | | | 2019-20
$‘000 | | | 2020-21
$‘000 | | | 2021-22
$‘000 | |
Homestay Regional Fees for International Students Program and Study Tours | | | — | | | | 311 | | | | 328 | | | | 349 | | | | 370 | |
The Government is aligning the weekly fee for homestay accommodation provided to international students studying in regional Queensland from $241 in 2018 to $302 in 2019 to match the metropolitan homestay fee. Based on forecasted 2019 enrolments for both the International Students Programs and Study tours, it is estimated that the increase in homestay fees will deliver an approximate additional $311,000 revenue in 2018-19. The increase in the homestay fee will be fully passed on to regional Queensland families.
146
Budget Measures 2018-19
Department of Environment and Science
| | | | | | | | | | | | | | | | | | | | |
| | | 2017-18
$‘000 | | | 2018-19
$‘000 | | | 2019-20
$‘000 | | | 2020-21
$‘000 | | | 2021-22
$‘000 | |
Waste Disposal Levy | | | — | | | | 100,724 | | | | 405,657 | | | | 408,004 | | | | 407,831 | |
The Government is introducing a Waste Disposal Levy of $70 per tonne (higher for regulated waste) increasing $5 per annum, commencing in the first quarter of 2019. Introducing a waste levy was a key recommendation of the recent investigation into the transport of waste into Queensland.
Proceeds from the waste levy will be used for waste programs, environmental priorities and community purposes. In particular, $100 million will be allocated over three years to support Queensland’s resource recovery and recycling industry through the Resource Recovery Industry Development Program. The program will facilitate private sector and local government projects delivering innovative solutions to the problem of waste going to landfill and create jobs in emerging industries.
The Government will provide an annual advance on levy charges to those local governments that dispose of municipal waste in the levy zone. In 2018-19, $32 million has been provided for this purpose. This will avoid direct costs to households from introduction of the waste levy.
The revenue figures shown above represent gross revenue. The spending associated with the Resource Recovery Industry Development Program and Advance Payments to Councils has not been factored into the figures shown for this measure.
Between 2018-19 and 2021-22 it is expected that over 70% of revenue generated through the waste levy will be allocated to Advance payments to councils, scheme start up and operational costs, industry programs and other environmental priorities. Surplus revenue from the levy will benefit the entire Queensland community by providing funding for schools, hospitals, transport infrastructure and frontline services.
Further details can be found in the Department of Environment and Science, Department of Local Government, Racing and Multicultural Affairs and Department of State Development, Infrastructure and Planning sections of Chapter 2 Expense Measures.
147
Budget Measures 2018-19
Department of Natural Resources, Mines and Energy
| | | | | | | | | | | | | | | | | | | | |
| | | 2017-18
$‘000 | | | 2018-19
$‘000 | | | 2019-20
$‘000 | | | 2020-21
$‘000 | | | 2021-22
$‘000 | |
Extending existing drought relief arrangements | | | — | | | | — | | | | — | | | | — | | | | — | |
The Government is providing fee and rental relief of up to $4.2 million in 2018-19 as part of the extension of drought relief arrangements. This includes rebates for land rental and the waiving of water licence fees for drought affected landholders and lessees. The estimate is dependent on drought declarations and the demand for drought assistance.
The Drought Assistance Package is a total of up to $34.6 million in 2018-19 to support drought affected communities across the State. Funding can be found in the Department of Agriculture and Fisheries, and Department of Natural Resources, Mines and Energy sections of Chapter 2 Expense Measures.
148
Budget Measures 2018-19
Department of Transport and Main Roads
| | | | | | | | | | | | | | | | | | | | |
| | | 2017-18
$‘000 | | | 2018-19
$‘000 | | | 2019-20
$‘000 | | | 2020-21
$‘000 | | | 2021-22
$‘000 | |
Hazard Perception Test Fee | | | — | | | | — | | | | 1,330 | | | | 1,369 | | | | 1,408 | |
The Government will introduce a one off charge of $37.05 for entry into the hazard perception test (HPT) environment until the customer has successfully completed the test. This represents an increase for the motor vehicle HPT and a new charge for the introduction of HPT for motorcycles. A person will not be able to obtain a P1 licence and drive unsupervised until they have passed the HPT. This should improve road safety outcomes and the delivery of a nationally uniform test may have road safety benefits for a group of licensed riders that are over represented in the road toll.
| | | | | | | | | | | | | | | | | | | | |
| | | 2017-18
$‘000 | | | 2018-19
$‘000 | | | 2019-20
$‘000 | | | 2020-21
$‘000 | | | 2021-22
$‘000 | |
Learner Licence Discount for Photo Identification Card (PIC) Holders | | | — | | | | (26) | | | | (66) | | | | (141) | | | | (149) | |
The Government is introducing a $40 discount off the learner licence fee for any person who applies for a Queensland learner licence and already holds a Photo Identification Card (PIC). This means a person with a PIC would only be required to pay $126.10 instead of $166.10 for a three year learner licence.
| | | | | | | | | | | | | | | | | | | | |
| | | 2017-18
$‘000 | | | 2018-19
$‘000 | | | 2019-20
$‘000 | | | 2020-21
$‘000 | | | 2021-22
$‘000 | |
Reduced Registration for Historic Motorcycles | | | — | | | | (100) | | | | (100) | | | | (100) | | | | (100) | |
The Government is reducing registration fees for vintage motorcycle owners by approximately 70%. The reduced registration fees are to be implemented for eligible motorcycles from 1 July 2018.
149
Budget Measures 2018-19
| | | | | | | | | | | | | | | | | | | | |
| | | 2017-18
$‘000 | | | 2018-19
$‘000 | | | 2019-20
$‘000 | | | 2020-21
$‘000 | | | 2021-22
$‘000 | |
Heavy Vehicle Plate Fee | | | — | | | | (147 | ) | | | (152 | ) | | | (157 | ) | | | (162 | ) |
The Government is introducing a national heavy vehicle number plate that will enable the efficient movement of heavy vehicles across Australia and will require a consistent fee. It has been determined that from 1 July 2018, the national heavy vehicle plate fee will be $25. Given the current plate fee in Queensland is $29.20, the expected negative revenue impact of introducing a $25 fee for the national heavy vehicle plate would be approximately $618,000 over four years.
| | | | | | | | | | | | | | | | | | | | |
| | | 2017-18
$‘000 | | | 2018-19
$‘000 | | | 2019-20
$‘000 | | | 2020-21
$‘000 | | | 2021-22
$‘000 | |
Transport Concessions for Veterans | | | (228 | ) | | | (488 | ) | | | (527 | ) | | | (567 | ) | | | (608 | ) |
Delivering on our election commitments, the Government has provided half-price public transport for veterans by expanding the current transport discount to the 19,000 Department of Veterans’ Affairs (DVA) white card holders under 64 - those who have war or service related injuries or disease.
150
Budget Measures 2018-19
Queensland Treasury
| | | | | | | | | | | | | | | | | | | | |
| | | 2017-18
$‘000 | | | 2018-19
$‘000 | | | 2019-20
$‘000 | | | 2020-21
$‘000 | | | 2021-22
$‘000 | |
Point of Consumption Betting Tax | | | — | | | | 70,950 | | | | 96,323 | | | | 98,501 | | | | 101,184 | |
Less: Non-discretionary allocation of proceeds1 | | | — | | | | — | | | | — | | | | — | | | | — | |
| | | | | | | | | | | | | | | | | | | | |
Until allocation of proceeds | | | — | | | | 70,950 | | | | 96,323 | | | | 98,501 | | | | 101,184 | |
| | | | | | | | | | | | | | | | | | | | |
| 1. | Some allocations are subject to commercial-in-confidence discussions/negotiation, including the quantum of the commitments to compensation payments to Racing Queensland for impacts from the implementation of the point of consumption betting tax. |
The Government is introducing a point of consumption betting tax from 1 October 2018 (betting tax).
While this 2017-18 Mid-Year Fiscal and Economic Review (MYFER) measure applied to online wagering only, the betting tax will now apply to all betting operators licensed in Australia and will be imposed at a rate of 15% of net wagering revenue earned from bets placed by customers in Queensland. This primarily accounts for the changed forecast since the 2017-18 MYFER.
Smaller betting operators may not incur a betting tax liability as the rate of 15% applies to taxable wagering revenue exceeding an annual tax-free threshold amount of $300,000. No tax will be paid on a betting operator’s revenue up to and including $300,000 in a financial year. Reconciliation against the threshold in the annual return, and refund provisions for any overpayment, will ensure this.
Government is consulting with the racing industry and other stakeholders in the lead up to the 1 October implementation regarding appropriate measures to be funded from the point of consumption betting tax revenues including support for the industry, delivery of initiatives to enhance responsible gambling and community programs.
| | | | | | | | | | | | | | | | | | | | |
| | | 2017-18
$‘000 | | | 2018-19
$‘000 | | | 2019-20
$‘000 | | | 2020-21
$‘000 | | | 2021-22
$‘000 | |
Payroll Tax Apprentice and Trainee Rebate | | | — | | | | (26,000 | ) | | | — | | | | — | | | | — | |
The Government is extending until 30 June 2019 the 50% payroll tax rebate on the exempt wages of apprentices and trainees. This is part of Government commitments to address youth unemployment and building Queensland’s skills base, particularly in regional Queensland.
151
Budget Measures 2018-19
| | | | | | | | | | | | | | | | | | | | |
| | | 2017-18
$‘000 | | | 2018-19
$‘000 | | | 2019-20
$‘000 | | | 2020-21
$‘000 | | | 2021-22
$‘000 | |
Land Tax increase to rate on holdings above $10 million by 0.5 percentage points | | | — | | | | 71,000 | | | | 76,000 | | | | 80,000 | | | | 84,400 | |
The Government is increasing the rate of land tax by 0.5 percentage points for owners of land who have aggregated landholdings with a taxable value above $10 million. From the 2018-19 financial year onwards, an increased rate of 2.25% for resident individuals and 2.5% for companies, trustees and absentees will apply to the portion of an owner’s taxable landholdings that exceeds $10 million.
| | | | | | | | | | | | | | | | | | | | |
| | | 2017-18
$‘000 | | | 2018-19
$‘000 | | | 2019-20
$‘000 | | | 2020-21
$‘000 | | | 2021-22
$‘000 | |
Additional Foreign Acquirer Duty increase to 7% | | | — | | | | 33,000 | | | | 33,000 | | | | 33,000 | | | | 33,000 | |
The Government is increasing the rate of Additional Foreign Acquirer Duty (AFAD) from 3% to 7%. AFAD is an additional amount of duty payable on relevant transactions that are liable for transfer duty, landholder duty or corporate trustee duty which involve a foreign person directly or indirectly acquiring certain Queensland residential land. The increased rate will apply to liabilities arising on or after 1 July 2018.
| | | | | | | | | | | | | | | | | | | | |
| | | 2017-18
$‘000 | | | 2018-19
$‘000 | | | 2019-20
$‘000 | | | 2020-21
$‘000 | | | 2021-22
$‘000 | |
Premium Motor Vehicle Duty | | | — | | | | 24,020 | | | | 25,250 | | | | 26,490 | | | | 27,870 | |
The Government is increasing the amount of vehicle registration duty payable on vehicles valued above $100,000 by $2 per $100 of dutiable value (excludes heavy vehicles). The premium motor vehicle duty will apply from 1 July 2018.
152
Queensland Budget 2018-19 Budget Measures Budget Paper No.4

Queensland Budget 2018-19
Budget Measures Budget Paper No.4
budget.qld.gov.au