UNITED STATES
SECURITIES AND EXCHANGE COMMISSION
WASHINGTON, D.C. 20549
FORM N-CSR
CERTIFIED SHAREHOLDER REPORT OF REGISTERED MANAGEMENT
INVESTMENT COMPANIES
Investment Company Act file number 811-5867
Oppenheimer Multi-State Municipal Trust
(Exact name of registrant as specified in charter)
6803 South Tucson Way, Centennial, Colorado 80112-3924
(Address of principal executive offices) (Zip code)
Cynthia Lo Bessette
OFI Global Asset Management, Inc.
225 Liberty Street, New York, New York 10281-1008
(Name and address of agent for service)
Registrant’s telephone number, including area code: (303) 768-3200
Date of fiscal year end: July 31
Date of reporting period: 7/31/2017
Item 1. Reports to Stockholders.
Table of Contents
Class A Shares
AVERAGE ANNUAL TOTAL RETURNS AT 7/31/17
| | | | | | |
| | | Class A Shares of the Fund | | |
| | | Without Sales Charge | | With Sales Charge | | Bloomberg Barclays
Municipal Bond Index |
| 1-Year | | -3.01% | | -7.62% | | 0.26% |
| 5-Year | | 1.62 | | 0.64 | | 3.10 |
| 10-Year | | 2.69 | | 2.19 | | 4.60 |
Performance data quoted represents past performance, which does not guarantee future results. The investment return and principal value of an investment in the Fund will fluctuate so that an investor’s shares, when redeemed, may be worth more or less than their original cost. Fund returns include changes in share price, reinvested distributions, and a 4.75% maximum applicable sales charge except where “without sales charge” is indicated. Current performance may be lower or higher than the performance quoted. Returns do not consider capital gains or income taxes on an individual’s investment. For performance data current to the most recent month-end, visit oppenheimerfunds.com or call 1.800.CALL OPP (225.5677).
Our Twitter handle is @RochesterFunds.
|
| 2 OPPENHEIMER ROCHESTER NEW JERSEY MUNICIPAL FUND |
Fund Performance Discussion
Oppenheimer Rochester New Jersey Municipal Fund continued to generate attractive levels of tax-free income during the most recent reporting period. As of July 31, 2017, the Class A shares provided a distribution yield at net asset value (NAV) of 3.72%. This Fund’s Class A shares had the fifth highest distribution yield in Lipper’s New Jersey Municipal Debt Funds category, which included a total of 47 share classes. Falling bond prices caused the Fund’s NAV to decline this reporting period, and its total return was negative as of July 31, 2017.
MARKET OVERVIEW
During this reporting period, U.S. equities rallied and yields on AAA-rated municipal bonds and Treasury securities improved. The price declines in the municipal bond market, which were most notable immediately after Election Day, depressed the total return of this Fund’s benchmark, which is a widely used index of the performance of the general muni market.
On June 14, 2017, the Fed Funds target rate was raised by one-quarter of 1 percentage point to a range of 1.00% to 1.25%, and the Federal Reserve Open Market Committee (FOMC) signaled plans for one more rate
The average distribution yield in Lipper’s New Jersey Municipal Debt Funds category was 3.17% at the end of this reporting period. At 3.72%, the distribution yield at NAV for this Fund’s Class A shares was 55 basis points higher than the category average.
increase in 2017. Citing continued U.S. economic growth and job market strength, the Fed also announced it would begin to reduce its $4.5 trillion holdings of bonds and other securities later this year.
| | | | |
YIELDS & DISTRIBUTIONS FOR CLASS A SHARES | | | | |
| Dividend Yield w/o sales charge | | | 3.72% | |
| Dividend Yield with sales charge | | | 3.54 | |
| Standardized Yield | | | 1.88 | |
| Taxable Equivalent Yield | | | 3.67 | |
| Last distribution (7/25/17) | | $ | 0.028 | |
| Total distributions (8/1/16 to 7/31/17) | | $ | 0.403 | |
| |
Endnotes for this discussion begin on page 16 of this report. | | | | |
|
| 3 OPPENHEIMER ROCHESTER NEW JERSEY MUNICIPAL FUND |
At the July 26, 2017 meeting, the FOMC announced its decision to maintain the target range for the Fed Funds rate to the range that had been set in June. According to the Fed’s press release, the FOMC “expects that economic conditions will evolve in a manner that will warrant gradual increases” to the Fed Funds rate. Additionally, the “balance sheet normalization program” for reducing its holdings will begin “relatively soon, provided the economy evolves broadly as anticipated.”
The benchmark interest rate was raised in December 2016 and in March 2017, each time by one-quarter of 1 percentage point. At a press conference after the March 2017 meeting, Chairman Janet Yellen said “The simple message is—the economy is doing well. The unemployment rate has moved way down, and many more people are feeling optimistic about their labor prospects.”
From December 2008 until December 2015, the key rate was held to a range of zero to 0.25%.
We remind investors that a change in the Fed Funds rate does not automatically translate into a change in longer-term interest rates, which are determined by the marketplace. During this reporting period, the muni market’s reactions to the Fed’s moves did not appear to be especially significant or lasting. This Fund’s portfolio managers do not adjust their investment style in response to Fed actions.
The yield curve for high-grade municipal bonds was higher at the end of this reporting period than on July 29, 2016, the last business day of the previous reporting period. The median yield on 30-year, AAA-rated muni bonds stood at 2.89% on July 31, 2017, up 62 basis points from July 29, 2016. The median yield on 10-year, AAA-rated muni bonds was 2.07% on July 31, 2017, up 62 basis points from the July 2016 date, and the median yield on 1-year, AAA-rated muni bonds was 0.85%, up 40 basis points from the July 2016 date.
The Treasury yield curve also was higher at the end of the reporting period than on July 29, 2016. While the Treasury yield curve maintained its shape – moving up uniformly – the muni yield curve steepened as the yields on longer-term munis rose more than the yields on shorter-term munis. While a steepening yield curve reflects investors’ expectations for a stronger economy and, perhaps, rising inflation, we note that high-grade munis with maturities of 15 years or more continued to offer taxpayers in all federal tax brackets more favorable after-tax yields than Treasury securities with comparable maturities; Treasury bonds are backed by the full faith and credit of the U.S. government.
This reporting period was also characterized by credit spread tightening, which occurs when the difference between yields on low-rated municipal bonds and higher-rated bonds decreases. As credit spreads tighten, investments in BBB-rated, lower-rated and
|
| 4 OPPENHEIMER ROCHESTER NEW JERSEY MUNICIPAL FUND |
unrated securities typically outperform municipal securities with higher credit ratings.
On July 5, 2017, after a 4-day government shutdown, Gov. Chris Christie signed the state’s $34.6 billion budget for fiscal year 2018. The spending plan includes the largest pension payment in state history at $2.5 billion. Public schools will receive more than $13 billion including $25 million for preschool expansion and $25 million for special education. In addition, the budget includes funding for prisoner re-entry programs, nursing homes and assisted living facilities, and legal services as well as cost-of-living increases for direct-care workers.
New Jersey’s pension funds will benefit significantly from a new law that mandates irrevocable contributions from the state’s lottery for the next 30 years. The state’s lottery has been valued at $13.5 billion; over 30 years, its net revenues are estimated to total about $37 billion. As a result the funded ratio of the state’s combined retirement systems has increased and the unfunded accrued liability was reduced.
In June 2017, a $1.1 billion tax-exempt bond sale to complete the long-stalled American Dream Meadowlands development took place amid uncertainty about the future viability of indoor shopping malls. Developer Triple Five Group also secured $1.6 billion in private construction loans in late May to jump-start the completion of the mega-mall next to MetLife Stadium in East Rutherford.
Earlier in the reporting period, New Jersey rejected a 5-year recovery plan proposed by Atlantic City, and a week later the state’s Local Finance Board unanimously approved a state takeover of the city’s finances. This decision allows the state to restructure outstanding debt, renegotiate municipal contracts and sell city assets for the next 5 years.
In May 2017, Atlantic City sold $69.8 million in bonds at a 4.66% interest rate to cover a tax settlement with the Borgata Hotel Casino & Spa. Proceeds from the bond sale will be used to pay $72 million to the Borgato. Over the years, the Borgato had success appealing its property tax assessments. A negotiated settlement, reached in February 2017, reduced the payment by $86 million. In June 2017, Moody’s Investors Services changed its outlook for Atlantic County (home to Atlantic City) to stable, from negative.
As of July 31, 2017, New Jersey’s general obligation (G.O.) bonds were rated A3 by Moody’s, and A-minus by S&P and Fitch Ratings. G.O.s are backed by the full faith and taxing authority of the state or local government that issues them.
The Commonwealth of Puerto Rico remained in the headlines throughout this reporting period, and more detailed information about the developments discussed below can be found on our online PR Roundup (oppenheimerfunds.com/puerto-rico).
|
| 5 OPPENHEIMER ROCHESTER NEW JERSEY MUNICIPAL FUND |
In August 2016, the Obama administration announced the seven members of the federal oversight board established by the Puerto Rico Oversight, Management and Economic Stability Act (PROMESA), which was enacted in June 2016.
At the outset of this reporting period, the Rochester complex received 100% of the payments owed on holdings backed by Puerto Rico’s sales and use tax (COFINA bonds) and 100% of the payments owed on its Municipal Finance Authority holdings. The Government Development Bank of Puerto Rico (GDB), the Public Finance Corporation (PFC) and the Puerto Rico Infrastructure and Finance Authority (PRIFA) did not make their August 1, 2016 payments, and the Commonwealth also failed to make an interest payment of $1.3 million on its G.O. debt.
In September 2016, S&P downgraded several senior unsecured GDB bonds GDB after the GDB failed to make August 1 and September 1, 2016 interest payments.
In early September 2016, Francisco Besosa, a U.S. District Court judge, said he would not halt a lawsuit in which plaintiffs allege that Gov. Alejandro García Padilla violated PROMESA by declaring a moratorium on payments of constitutionally backed debt.
The fiscal plan presented to the federal oversight board on October 14 by then-Gov. Padilla was immediately challenged by Carlos Garcia, a member of the oversight board. He
took issue with the government’s assessment of its fiscal situation.
Ricardo Rosselló Nevares, who was elected governor of the Commonwealth in November 2016, began his term in office by signing several executive orders related to fiscal and economic conditions in the Commonwealth, including a measure that required reductions in the operating expenses of all government agencies. Gov. Rosselló also ordered the use of zero-base budgets beginning with fiscal 2018 (which began July 1, 2017) and the creation of an entity to expedite the approvals of permits and certifications for infrastructure projects.
On January 3, 2017, PREPA made its $192.5 million interest payment in full. Also in early January, subsidiaries of the insurer Assured Guaranty made payments of $39 million and $5 million on G.O. debt and Public Building Authority debt, respectively. The Commonwealth, as expected, failed to pay $358 million of interest on its G.O. bonds on January 3.
In the first month of his administration, Gov. Rosselló tried to secure some changes to deadlines set forth in PROMESA. The federal oversight board was amenable but imposed certain conditions, including a commitment not to take more loans to provide short-term liquidity. Simultaneously, the federal oversight board told Gov. Rosselló that his plan had to make spending cuts and certain revenue increases.
|
| 6 OPPENHEIMER ROCHESTER NEW JERSEY MUNICIPAL FUND |
Also in January 2017, the governor signed an extension through December 2021 to a tax on foreign corporations. The Act 154 tax, originally slated to expire at the end of 2017, has historically been a significant source of government revenue. The governor also signed a new measure, the Puerto Rico Financial Emergency and Fiscal Responsibility Act, to replace the Debt Moratorium Act, which had given the former governor the power to suspend debt payments.
Full coupon payments were made on February 1, 2017, on COFINAs as well as bonds issued by the Puerto Rico Industrial Development Company, PRASA (the Commonwealth’s aqueduct and sewer authority), and PRHTA (its highways and transportation authority). However, the GDB, PFC and PRIFA failed to make certain payments on that date.
In February 2017, Gov. Rosselló discussed his 10-year fiscal plan. The plan called for cuts in government spending and for funds to be set aside for future debt service obligations, but it did not meet the federal oversight board’s requirement that certain fiscal adjustments be made to close the fiscal 2019 budget gap. The federal oversight board called for emergency spending cuts on March 8 based on concerns about the Commonwealth’s liquidity and the need to reduce spending immediately; shortly thereafter, the board approved an amended plan and established a number of milestones for the Rosselló administration.
In other developments related to the fiscal plan, the federal fiscal 2018 budget proposal
that President Trump announced in May 2017 calls for $1.59 billion to fund Medicaid in Puerto Rico, an increase of $1.24 billion versus the previous Medicaid cap for the Commonwealth. Puerto Rico officials did not adjust the Commonwealth’s fiscal plan, which assumes the federal government’s Medicaid allocation is zero.
Despite the portfolio management team’s multi-year efforts to reach negotiated settlements with various issuers in Puerto Rico, the federal oversight board in May 2017 commenced proceedings under Title III of PROMESA, similar to a Chapter 9 bankruptcy, for the Commonwealth, the Puerto Rico Sales Tax Financing Corporation (issuer of COFINA bonds), the PRHTA and the Employee Retirement System. The commencement of these proceedings effectively blocked various lawsuits that had been filed soon after the May 1 expiration of the stay of litigation, which had been included in PROMESA and subsequently extended.
The Commonwealth held a vote regarding statehood in June. Those who voted in the nonbinding referendum were overwhelmingly in favor of changing the Commonwealth’s status to U.S. statehood, but less than one-quarter of the electorate voted.
The Puerto Rico Electric Power Authority (PREPA) and its forbearing bondholders, including Oppenheimer Rochester, worked throughout this reporting period to finalize a restructuring support agreement (RSA) whose terms were agreed on in September 2015.
|
| 7 OPPENHEIMER ROCHESTER NEW JERSEY MUNICIPAL FUND |
In December 2016, PREPA and its forbearing bondholders agreed to extend the RSA until March 31, 2017; further extensions pushed the RSA’s expiration until the end of June 2017.
PREPA allowed the nearly finalized RSA to terminate in late June 2017, even though the forbearing creditors had offered to extend the agreement again. On July 2, 2017, the federal oversight board commenced PREPA’s Title III proceeding; the utility did not make its July 3 payments of principal and interest.
In Title III, the unresolved issues among debtors and creditors will proceed along separate tracks: mediation and litigation. While court-facilitated mediation may be an effective and efficient process, investors should be aware that protracted litigation remains a very real possibility. These developments affect current dividend distribution calculations for funds with holdings subject to Title III. The Title III proceedings are being overseen by U.S. District Judge Laura Taylor Swain, who was selected by the Chief Justice of the U.S. Supreme Court, John Roberts.
In late June 2017, the federal oversight board approved its own consolidated budget and earmarked more than $900 million for debt-service obligations. The new budget came as a response to the governor’s proposed $9.56 billion general fund budget, which had been released in May and had called for a 6.3% increase in spending but very limited money
available for debt service, inconsistent with the requirements of PROMESA.
In mid-July 2017, the federal oversight board approved a restructuring plan for the GDB, giving bondholders between 55% and 75% of the face value of their debt; the size of the “haircut” depends on the interest rate of the newly issued debt. In late July, the mayor of San Juan announced intentions to challenge this plan as a means to protect the city’s GDB deposits. (This Fund does not hold GDB debt; the Oppenheimer Rochester funds’ holdings of GDB debt represent less than one-hundredth of 1% of the assets of a single fund, Oppenheimer Rochester Limited Term California Municipal Fund.)
Please note: Shortly after the end of this reporting cycle, the Puerto Rico Legislature and the federal oversight board approved a budget for fiscal year 2018, ordered 5% spending cuts and announced plans to conduct a “comprehensive investigation” of the Commonwealth’s debt. Puerto Rico’s cash position as of June 30, 2017 was $1.5 billion higher than Judge Swain had been told it would be, according to figures released in early August, raising new questions about why the Commonwealth claimed it could not make debt payments.
Tax collections in July, the first month of the fiscal 2018, were $20 million to $30 million ahead of budget, according to Puerto Rico’s treasury secretary; in fiscal 2017, tax collections exceeded forecasts by 2.6%, or $235 million. The unemployment rate in July
|
| 8 OPPENHEIMER ROCHESTER NEW JERSEY MUNICIPAL FUND |

dropped to 9.8%, which was lower than it had been since early 2008. Also in early August, the Commonwealth’s Supreme Court denied the governor’s request to keep his initial draft budget (submitted to the board in late April) and other documents under wraps.
At an August 9 hearing, Judge Swain approved an agreement establishing a procedure to resolve, by December 15, the debt dispute between Puerto Rico and certain
COFINA bondholders. Debt restructurings for GDB securities, which were approved by the Puerto Rico Legislature two days later, have yet to receive approval from the U.S. District Court.
In September, two hurricanes – Irma and Maria – caused damage on Puerto Rico. Irma passed to the north of the Commonwealth, but Maria made landfall and damage from it was extensive.
|
| 9 OPPENHEIMER ROCHESTER NEW JERSEY MUNICIPAL FUND |

|
| 10 OPPENHEIMER ROCHESTER NEW JERSEY MUNICIPAL FUND |
FUND PERFORMANCE
Oppenheimer Rochester New Jersey Municipal Fund held more than 190 securities as of July 31, 2017. The Fund was invested in a broad range of sectors, providing shareholders with a diversity of holdings that we believe would be difficult and costly to replicate in an individual portfolio.
During this reporting period, a rally in U.S. equities and persistent low interest rates put pressure on the dividends of many fixed income investments. This Fund’s Class A dividend, which was 3.5 cents per share at the outset of this reporting period, was reduced to 3.4 cents per share beginning with the December 2016 payout, to 3.3 cents per share beginning with the April 2017 payout and to 2.8 cents per share in July 2017. In all, the Fund distributed 40.3 cents per Class A share this reporting period. Shareholders should note that market conditions during this reporting period did not affect the Fund’s overall investment goals or cause it to pay any capital gain distributions.
While this Fund is managed to deliver competitive levels of tax-free income and yield-driven total returns over the long term, market conditions can cause it at times to underperform the overall market and its own benchmark, the Bloomberg Barclays Municipal Bond Index; that was the case this reporting period. The Fund had a highly ranked distribution yield at NAV, as noted earlier, and a taxable equivalent yield of 3.67% this reporting period. The value of the team’s approach to investing in bonds from
a wide variety of sectors was evident this reporting period, as many sectors delivered strong performance.
Four of the Fund’s eight largest sectors were the strongest performers this reporting period. High-yielding tobacco bonds, which are backed by proceeds from the landmark 1998 Master Settlement Agreement (MSA), constituted the Fund’s largest sector as of July 31, 2017 and were ranked first in terms of favorable contribution to performance. The marine/aviations facilities sector, the Fund’s seventh largest sector, was the second strongest performer this reporting period. Many of the Fund’s investments in the marine/aviation facilities sector are high-grade bonds that are backed by valuable collateral. Other leading contributors to performance were the securities in the Fund’s fourth largest sector (hospital/healthcare) and its eighth largest (adult living facilities). Research-based security selection continued to be a factor in the strong performance of these sectors. Securities in the adult living facilities sector tend to perform well in densely populated geographies with strong real estate values and in more rural areas with stable home prices. The sewer utilities sector, one of this Fund’s smallest as of July 31, 2017, was the fourth strongest contributor to the Fund’s performance this reporting period; the only security in this sector at the end of the reporting period was a bond issued by PRASA.
Of the Fund’s 27 sectors, eight detracted from the Fund’s total return during the reporting period. The Fund’s second largest sector,
|
| 11 OPPENHEIMER ROCHESTER NEW JERSEY MUNICIPAL FUND |
transportation infrastructure, was a slight detractor from the Fund’s performance. The G.O. and the sales tax sectors – the Fund’s third and fifth largest, respectively – were adversely affected by developments in Puerto Rico as were the PREPA securities in this Fund’s electric utilities sector (as discussed above). Also detracting from the Fund’s performance were the government appropriation and municipal leases sectors, among others.
In aggregate, the Fund’s substantial investments in securities issued in the Commonwealth of Puerto Rico detracted from performance this reporting period. (As discussed above, the Commonwealth continued to experience significant financial difficulties this reporting period; the Fund’s current dividend distribution calculations reflect adjustments based on the failure of various Commonwealth issuers to make their debt-service payments on time and in full.) The securities are exempt from federal, state and local income taxes, and the Fund’s holdings include the aforementioned G.O. bonds and securities from many different sectors. Most of the Fund’s investments in securities issued in Puerto Rico are supported by taxes and other revenues and are designed to help finance electric utilities, highways and education, among other entities.
Investors should note that some of this Fund’s investments in securities issued in Puerto Rico – including some of the G.O.s and sales tax revenue bonds – are insured. A complete listing of securities held by this
Fund can be found in this report’s Statement of Investments.
INVESTMENT STRATEGY
The Rochester investment team focuses exclusively on municipal bonds, and this Fund invests primarily in investment-grade municipal securities. It may invest up to 25% of its total assets in below-investment grade securities, or “junk” bonds; the percentage of assets is measured at the time of purchase as is the credit quality of the securities. Additionally, the credit quality is based on Nationally Recognized Statistical Rating Organization (“NRSRO”) ratings or, if no NRSRO rating, on internal ratings. As of July 31, 2017, market movements or rating changes of municipal bonds, notably the Fund’s investments in Puerto Rico paper, caused the Fund’s below-investment-grade holdings to exceed this threshold. As a result, no further purchases of below-investment-grade bonds will be made until the Fund’s holdings of these types of bonds is once again below 25% of total assets.
While market conditions can and do fluctuate, the Fund’s portfolio management team adheres to a consistent investment approach based on its belief that tax-free yield can help investors achieve their long-term financial objectives. The team does not manage its funds based on predictions of interest rate changes. Further details about the Rochester team’s investment approach can be found on our landing page, oppenheimerfunds. com/rochesterway.
|
| 12 OPPENHEIMER ROCHESTER NEW JERSEY MUNICIPAL FUND |
In closing, we believe that the structure and sector composition of this Fund and the team’s use of time-tested strategies will
continue to benefit fixed income investors through interest rate and economic cycles.
| | |
 | | 
Scott S. Cottier, CFA Senior Vice President, Senior Portfolio Manager and Team Leader |
| | |
 | | 
Troy E. Willis, CFA, J.D. Senior Vice President, Senior Portfolio Manager and Team Leader |
On behalf of the rest of the Rochester portfolio managers: Mark R. DeMitry, Michael L. Camarella, Charles S. Pulire and Elizabeth S. Mossow.
|
| 13 OPPENHEIMER ROCHESTER NEW JERSEY MUNICIPAL FUND |
Top Holdings and Allocations
TOP TEN CATEGORIES
| | | | |
| Tobacco Master Settlement Agreement | | | 14.4 | % |
| Transportation Infrastructure | | | 9.0 | |
| General Obligation | | | 8.8 | |
| Hospital/Healthcare | | | 6.4 | |
| Sales Tax Revenue | | | 6.3 | |
| Higher Education | | | 5.6 | |
| Marine/Aviation Facilities | | | 5.1 | |
| Highways/Commuter Facilities | | | 4.7 | |
| U.S. Government Obligations | | | 4.5 | |
| Government Appropriation | | | 4.0 | |
Portfolio holdings and allocations are subject to change. Percentages are as of July 31, 2017 and are based on total assets.
CREDIT ALLOCATION
| | | | | | | | | | | | | | | |
| | | NRSRO-
Rated | | Sub-
Adviser-
Rated | | Total |
| AAA | | | | 3.5 | % | | | | 1.3 | % | | | | 4.8 | % |
| AA | | | | 12.1 | | | | | 0.0 | | | | | 12.1 | |
| A | | | | 28.7 | | | | | 0.0 | | | | | 28.7 | |
| BBB | | | | 20.2 | | | | | 0.5 | | | | | 20.7 | |
| BB or lower | | | | 32.2 | | | | | 1.5 | | | | | 33.7 | |
| Total | | | | 96.7 | % | | | | 3.3 | % | | | | 100.0 | % |
The percentages above are based on the market value of the securities as of July 31, 2017 and are subject to change. OppenheimerFunds, Inc. determines the credit allocation of the Fund’s assets using ratings by nationally recognized statistical rating organizations (NRSROs), such as S&P Global Ratings (S&P). For any security rated by an NRSRO other than S&P, the sub-adviser, OppenheimerFunds, Inc., converts that security’s rating to the equivalent S&P rating. If two or more NRSROs have assigned a rating to a security, the highest rating is used. For securities not rated by an NRSRO, the sub-adviser uses its own credit analysis to assign ratings in categories similar to those of S&P. The use of similar categories is not an indication that the sub-adviser’s credit analysis process is consistent or comparable with any NRSRO’s process were that NRSRO to rate the same security.
For the purposes of this Credit Allocation table, securities rated within the NRSROs’ four highest categories—AAA, AA, A and BBB—are investment-grade securities. For further details, please consult the Fund’s prospectus or Statement of Additional Information.
|
| 14 OPPENHEIMER ROCHESTER NEW JERSEY MUNICIPAL FUND |
Performance
DISTRIBUTION YIELDS
As of 7/31/17
| | | | | | | | | | |
| | | Without Sales
Charge | | With Sales
Charge |
| Class A | | | | 3.72 | % | | | | 3.54 | % |
| Class B | | | | 3.08 | | | | | N/A | |
| Class C | | | | 3.11 | | | | | N/A | |
| Class Y | | | | 3.93 | | | | | N/A | |
STANDARDIZED YIELDS
| | | | | | |
| For the 30 Days Ended 7/31/17 |
| Class A | | | 1.88 | % | | |
| Class B | | | 1.30 | | | |
| Class C | | | 1.31 | | | |
| Class Y | | | 2.20 | | | |
TAXABLE EQUIVALENT YIELDS
| | | | | | |
| As of 7/31/17 |
| Class A | | | 3.67 | % | | |
| Class B | | | 2.54 | | | |
| Class C | | | 2.56 | | | |
| Class Y | | | 4.30 | | | |
AVERAGE ANNUAL TOTAL RETURNS WITHOUT SALES CHARGE AS OF 7/31/17
| | | | | | | | | | | | | | | | | | | | |
| | | Inception Date | | | 1-Year | | | 5-Year | | | 10-Year | | | Since Inception | |
| Class A (ONJAX) | | | 3/1/94 | | | | -3.01 | % | | | 1.62 | % | | | 2.69 | % | | | 4.46 | % |
| Class B (ONJBX) | | | 3/1/94 | | | | -3.72 | | | | 0.84 | | | | 2.19 | | | | 4.26 | |
| Class C (ONJCX) | | | 8/29/95 | | | | -3.70 | | | | 0.88 | | | | 1.92 | | | | 3.78 | |
| Class Y (ONJYX) | | | 11/29/10 | | | | -2.83 | | | | 1.79 | | | | N/A | | | | 4.20 | |
AVERAGE ANNUAL TOTAL RETURNS WITH SALES CHARGE AS OF 7/31/17
| | | | | | | | | | | | | | | | | | | | |
| | | Inception Date | | | 1-Year | | | 5-Year | | | 10-Year | | | Since Inception | |
| Class A (ONJAX) | | | 3/1/94 | | | | -7.62 | % | | | 0.64 | % | | | 2.19 | % | | | 4.25 | % |
| Class B (ONJBX) | | | 3/1/94 | | | | -8.37 | | | | 0.52 | | | | 2.19 | | | | 4.26 | |
| Class C (ONJCX) | | | 8/29/95 | | | | -4.63 | | | | 0.88 | | | | 1.92 | | | | 3.78 | |
| Class Y (ONJYX) | | | 11/29/10 | | | | -2.83 | | | | 1.79 | | | | N/A | | | | 4.20 | |
|
| 15 OPPENHEIMER ROCHESTER NEW JERSEY MUNICIPAL FUND |
COMPARISON OF CHANGE IN VALUE OF $10,000 HYPOTHETICAL INVESTMENTS IN:
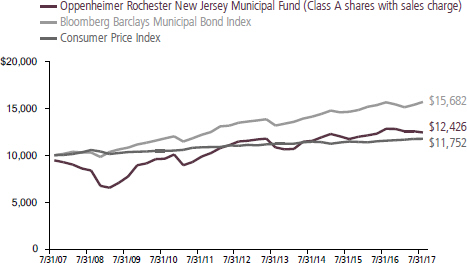
Performance data quoted represents past performance, which does not guarantee future results. The investment return and principal value of an investment in the Fund will fluctuate so that an investor’s shares, when redeemed, may be worth more or less than their original cost. Current performance may be lower or higher than the performance quoted. Returns do not consider capital gains or income taxes on an individual’s investments. For performance data current to the most recent month-end, visit oppenheimerfunds.com or call 1.800. CALL OPP (225.5677). Fund returns include changes in share price, reinvested distributions, and the applicable sales charge: for Class A shares, the current maximum initial sales charge of 4.75%; for Class B shares, the contingent deferred sales charge of 5% (1-year) and 2% (5-year); and for Class C, the contingent deferred sales charge of 1% for the 1-year period. There is no sales charge for Class Y shares. Because Class B shares convert to Class A shares 72 months after purchase, the 10-year return for Class B shares uses Class A performance for the period after conversion.
The Fund’s performance is compared to the performance of the Bloomberg Barclays Municipal Bond Index, an index of a broad range of investment-grade municipal bonds that measures the performance of the general municipal bond market. The Fund’s performance is also compared to the Consumer Price Index, a non-securities index that measures changes in the inflation rate. Indices are unmanaged and cannot be purchased by investors. While index comparisons may be useful to provide a benchmark for the Fund’s performance, it must be noted that the Fund’s investments are not limited to the investments comprising the indices. Index performance includes reinvestment of income, but does not reflect transaction costs, fees, expenses or taxes. Index performance is shown for illustrative purposes only as a benchmark for the Fund’s performance, and does not predict or depict performance of the Fund. The Fund’s performance reflects the effects of the Fund’s business and operating expenses.
Distribution yields for Class A shares are based on dividends of $0.028 for the 28-day accrual period ended July 25, 2017. The yield without sales charge for Class A shares is calculated by dividing annualized dividends by the Class A net asset value (NAV) on July 25, 2017; for the yield with charge, the denominator is the Class A maximum offering price on that date. Distribution yields for Class B, C and Y are annualized based on dividends of $0.0233,
|
| 16 OPPENHEIMER ROCHESTER NEW JERSEY MUNICIPAL FUND |
$0.0234 and $0.0297, respectively, for the 28-day accrual period ended July 25, 2017 and on the corresponding net asset values on that date.
Standardized yield is based on an SEC-standardized formula designed to approximate the Fund’s annualized hypothetical current income from securities less expenses for the 30-day period ended July 31, 2017 and that date’s maximum offering price (for Class A shares) or net asset value (for all other share classes). Each result is compounded semiannually and annualized. Falling share prices artificially increase yields.
The average distribution yield in this Fund’s Lipper category was calculated based on the distributions and the final NAVs of the reporting period for the funds in each category. The average yield at NAV in Lipper’s New Jersey Municipal Debt Funds category is based on 47 NAVs, one for each class of each fund in the category; a fund can have up to 4 classes. Lipper yields do not include sales charges, which – if included – would reduce results.
Taxable equivalent yield is based on the standardized yield and the 2017 top federal and New Jersey tax rate of 48.8%. Calculations factor in the 3.8% tax on unearned income under the Patient Protection and Affordable Care Act, as applicable. A portion of the Fund’s distributions may be subject to tax; distributions may also increase an investor’s exposure to the alternative minimum tax. Capital gains distributions are taxable as capital gains. Tax treatments of the Fund’s distributions and capital gains may vary by state; investors should consult a tax advisor to determine if the Fund is appropriate for them. Each result is compounded semiannually and annualized. Falling share prices artificially increase yields. This Report must be preceded or accompanied by a Fund prospectus.
Investments in “tobacco bonds,” which are backed by the proceeds a state or territory receives from the 1998 national litigation settlement with tobacco manufacturers, may be vulnerable to economic and/or legislative events that affect issuers in a particular municipal market sector. Annual payments by MSA-participating manufacturers, for example, hinge on many factors, including annual domestic cigarette shipments, inflation and the relative market share of non-participating manufacturers. To date, we believe consumption figures remain within an acceptable range of the assumptions used to structure MSA bonds. Future MSA payments could be reduced if consumption were to fall more rapidly than originally forecast.
The median yields for AAA-rated municipal securities are provided by Municipal Market Advisors (MMA) and are based on its benchmark of general obligation bonds structured with a 5% coupon and a 10-year par call. The MMA benchmark is constructed using yields from a group of active primary and secondary market makers and other municipal market participants.
The Fund’s investment strategy and focus can change over time. The mention of specific fund holdings does not constitute a recommendation by OppenheimerFunds, Inc. or its affiliates.
Before investing in any of the Oppenheimer funds, investors should carefully consider a fund’s investment objectives, risks, charges and expenses. Fund prospectuses and summary prospectuses contain this and other information about the funds, and may be obtained by asking your financial advisor, visiting oppenheimerfunds.com, or calling 1.800.CALL OPP (225.5677). Read prospectuses and summary prospectuses carefully before investing.
|
| 17 OPPENHEIMER ROCHESTER NEW JERSEY MUNICIPAL FUND |
Shares of Oppenheimer funds are not deposits or obligations of any bank, are not guaranteed by any bank, are not insured by the FDIC or any other agency and involve investment risks, including the possible loss of the principal amount invested.
|
| 18 OPPENHEIMER ROCHESTER NEW JERSEY MUNICIPAL FUND |
Fund Expenses
Fund Expenses. As a shareholder of the Fund, you incur two types of costs: (1) transaction costs, which may include sales charges (loads) on purchase payments and/or contingent deferred sales charges on redemptions; and (2) ongoing costs, including management fees; distribution and service fees; and other Fund expenses. These examples are intended to help you understand your ongoing costs (in dollars) of investing in the Fund and to compare these costs with the ongoing costs of investing in other mutual funds.
The examples are based on an investment of $1,000.00 invested at the beginning of the period and held for the entire 6-month period ended July 31, 2017.
Actual Expenses. The first section of the table provides information about actual account values and actual expenses. You may use the information in this section for the class of shares you hold, together with the amount you invested, to estimate the expense that you paid over the period. Simply divide your account value by $1,000.00 (for example, an $8,600.00 account value divided by $1,000.00 = 8.60), then multiply the result by the number in the first section under the heading entitled “Expenses Paid During 6 Months Ended July 31, 2017” to estimate the expenses you paid on your account during this period.
Hypothetical Example for Comparison Purposes. The second section of the table provides information about hypothetical account values and hypothetical expenses based on the Fund’s actual expense ratio for each class of shares, and an assumed rate of return of 5% per year for each class before expenses, which is not the Fund’s actual return. The hypothetical account values and expenses may not be used to estimate the actual ending account balance or expenses you paid for the period. You may use this information to compare the ongoing costs of investing in the Fund and other funds. To do so, compare this 5% hypothetical example for the class of shares you hold with the 5% hypothetical examples that appear in the shareholder reports of the other funds.
Please note that the expenses shown in the table are meant to highlight your ongoing costs only and do not reflect any transactional costs, such as front-end or contingent deferred sales charges (loads). Therefore, the “hypothetical” section of the table is useful in comparing ongoing costs only, and will not help you determine the relative total costs of owning different funds. In addition, if these transactional costs were included, your costs would have been higher.
|
| 19 OPPENHEIMER ROCHESTER NEW JERSEY MUNICIPAL FUND |
| | | | | | | | |
| Actual | | Beginning Account Value February 1, 2017 | | Ending Account Value July 31, 2017 | | Expenses Paid During 6 Months Ended July 31, 2017 | | |
| Class A | | $ 1,000.00 | | $ 989.40 | | $ 5.64 | | |
| Class B | | 1,000.00 | | 986.00 | | 9.15 | | |
| Class C | | 1,000.00 | | 987.10 | | 9.06 | | |
| Class Y | | 1,000.00 | | 991.50 | | 4.60 | | |
| | | |
Hypothetical (5% return before expenses) | | | | | | |
| Class A | | 1,000.00 | | 1,019.14 | | 5.72 | | |
| Class B | | 1,000.00 | | 1,015.62 | | 9.29 | | |
| Class C | | 1,000.00 | | 1,015.72 | | 9.19 | | |
| Class Y | | 1,000.00 | | 1,020.18 | | 4.67 | | |
Expenses are equal to the Fund’s annualized expense ratio for that class, multiplied by the average account value over the period, multiplied by 181/365 (to reflect the one-half year period). Those annualized expense ratios, excluding indirect expenses from affiliated funds, based on the 6-month period ended July 31, 2017 are as follows:
| | | | |
| Class | | Expense Ratios | |
| Class A | | | 1.14 | % |
| Class B | | | 1.85 | |
| Class C | | | 1.83 | |
| Class Y | | | 0.93 | |
|
| 20 OPPENHEIMER ROCHESTER NEW JERSEY MUNICIPAL FUND |
STATEMENT OF INVESTMENTS July 31, 2017
| | | | | | | | | | | | | | |
Principal
Amount | | | | Coupon | | | Maturity | | | Value | |
| Municipal Bonds and Notes—109.7% | | | | | | | | | |
| New Jersey—73.8% | | | | | | | | | |
| $1,250,000 | | Atlantic City, NJ GO1 | | | 5.000 | % | | | 03/01/2042 | | | $ | 1,402,050 | |
| 1,000,000 | | Atlantic County, NJ Improvement Authority (Stockton University)1 | | | 5.000 | | | | 07/01/2034 | | | | 1,136,570 | |
| 1,000,000 | | Camden County, NJ Improvement Authority (Cooper Health System)1 | | | 5.000 | | | | 02/15/2033 | | | | 1,100,470 | |
| 1,000,000 | | Camden County, NJ Improvement Authority (Cooper Health System)1 | | | 5.000 | | | | 02/15/2034 | | | | 1,098,620 | |
| 1,000,000 | | Camden County, NJ Improvement Authority (Cooper Health System)1 | | | 5.000 | | | | 02/15/2035 | | | | 1,097,390 | |
| 2,000,000 | | Casino Reinvestment Devel. Authority of NJ1 | | | 5.000 | | | | 11/01/2031 | | | | 2,184,500 | |
| 1,665,000 | | Casino Reinvestment Devel. Authority of NJ1 | | | 5.250 | | | | 01/01/2024 | | | | 1,698,067 | |
| 3,000,000 | | Casino Reinvestment Devel. Authority of NJ1 | | | 5.250 | | | | 11/01/2039 | | | | 3,084,390 | |
| 3,000,000 | | Casino Reinvestment Devel. Authority of NJ1 | | | 5.250 | | | | 11/01/2044 | | | | 3,064,110 | |
| 395,000 | | Casino Reinvestment Devel. Authority of NJ (Hotel Room Fee)1 | | | 5.000 | | | | 01/01/2025 | | | | 401,498 | |
| 175,000 | | Casino Reinvestment Devel. Authority of NJ (Hotel Room Fee)1 | | | 5.250 | | | | 01/01/2018 | | | | 175,483 | |
| 760,000 | | Casino Reinvestment Devel. Authority of NJ (Hotel Room Fee)1 | | | 5.250 | | | | 01/01/2022 | | | | 773,444 | |
| 1,000,000 | | Casino Reinvestment Devel. Authority of NJ (Luxury Tax)1 | | | 5.000 | | | | 11/01/2028 | | | | 1,109,330 | |
| 140,000 | | Essex County, NJ Improvement Authority (Newark)1 | | | 5.125 | | | | 04/01/2029 | | | | 140,176 | |
| 250,000 | | Essex County, NJ Improvement Authority (Newark)1 | | | 6.250 | | | | 11/01/2030 | | | | 265,665 | |
| 140,000 | | Garden State Preservation Trust, NJ Open Space & Farmland Preservation | | | 3.565 | 2 | | | 11/01/2026 | | | | 106,890 | |
| 1,000,000 | | Gloucester County, NJ Improvement Authority (Rowan University)1 | | | 5.000 | | | | 11/01/2030 | | | | 1,182,910 | |
| 1,000,000 | | Hudson County, NJ Improvement Authority1 | | | 6.000 | | | | 01/01/2040 | | | | 1,091,410 | |
| 1,500,000 | | Hudson County, NJ Improvement Authority (Lincoln Park Golf Course)1 | | | 5.000 | | | | 06/01/2035 | | | | 1,628,775 | |
| 1,250,000 | | Hudson County, NJ Improvement Authority (Lincoln Park Golf Course)1 | | | 5.000 | | | | 06/01/2038 | | | | 1,354,462 | |
| 2,655,000 | | Hudson County, NJ Improvement Authority (Lincoln Park Golf Course)1 | | | 5.500 | | | | 06/01/2041 | | | | 3,000,654 | |
| 315,000 | | Middlesex County, NJ Improvement Authority (Heldrich Center Hotel) | | | 5.000 | | | | 01/01/2020 | | | | 304,359 | |
| 1,100,000 | | Middlesex County, NJ Improvement Authority (Heldrich Center Hotel) | | | 5.125 | | | | 01/01/2037 | | | | 819,577 | |
| 20,000 | | Middlesex County, NJ Improvement Authority (South Plainfield Urban Renewal)1 | | | 5.500 | | | | 09/01/2030 | | | | 20,061 | |
| 10,000 | | Neptune City, NJ Hsg. Authority1 | | | 6.000 | | | | 04/01/2019 | | | | 10,023 | |
| 445,000 | | New Brunswick, NJ Parking Authority1 | | | 5.000 | | | | 09/01/2027 | | | | 502,360 | |
| 605,000 | | New Brunswick, NJ Parking Authority1 | | | 5.000 | | | | 09/01/2029 | | | | 678,556 | |
| 430,000 | | Newark, NJ GO1 | | | 5.000 | | | | 07/15/2029 | | | | 460,182 | |
| 3,000,000 | | Newark, NJ GO1 | | | 5.000 | | | | 07/15/2029 | | | | 3,210,570 | |
| 315,000 | | Newark, NJ Hsg. Authority (Port Newark Marine Terminal Rental)1 | | | 5.000 | | | | 01/01/2032 | | | | 369,495 | |
| 5,000,000 | | Newark, NJ Hsg. Authority (Secured Police Facility)1 | | | 5.000 | | | | 12/01/2038 | | | | 5,758,050 | |
|
| 21 OPPENHEIMER ROCHESTER NEW JERSEY MUNICIPAL FUND |
STATEMENT OF INVESTMENTS Continued
| | | | | | | | | | | | | | |
Principal
Amount | | | | Coupon | | | Maturity | | | Value | |
| New Jersey (Continued) | | | | | | | | | |
| $300,000 | | NJ Building Authority1 | | | 5.000 | % | | | 06/15/2027 | | | $ | 347,289 | |
| 200,000 | | NJ Building Authority1 | | | 5.000 | | | | 06/15/2027 | | | | 250,374 | |
| 400,000 | | NJ Building Authority1 | | | 5.000 | | | | 06/15/2028 | | | | 500,748 | |
| 600,000 | | NJ Building Authority1 | | | 5.000 | | | | 06/15/2028 | | | | 686,928 | |
| 300,000 | | NJ Building Authority1 | | | 5.000 | | | | 06/15/2029 | | | | 340,998 | |
| 200,000 | | NJ Building Authority1 | | | 5.000 | | | | 06/15/2029 | | | | 250,374 | |
| 2,095,000 | | NJ EDA1 | | | 5.000 | | | | 06/15/2028 | | | | 2,246,070 | |
| 750,000 | | NJ EDA1 | | | 5.000 | | | | 06/15/2029 | | | | 800,768 | |
| 3,000,000 | | NJ EDA1 | | | 5.000 | | | | 06/15/2035 | | | | 3,089,340 | |
| 3,000,000 | | NJ EDA1 | | | 5.000 | | | | 06/15/2036 | | | | 3,087,330 | |
| 3,100,000 | | NJ EDA (Cranes Mill)1 | | | 5.100 | | | | 06/01/2027 | | | | 3,102,418 | |
| 85,000 | | NJ EDA (Dept. of Human Services)1 | | | 6.250 | | | | 07/01/2024 | | | | 86,563 | |
| 1,525,000 | | NJ EDA (Drew University)1 | | | 5.250 | | | | 07/01/2021 | | | | 1,711,706 | |
| 4,525,000 | | NJ EDA (Hamilton Care)1 | | | 6.650 | | | | 11/01/2037 | | | | 4,634,007 | |
| 3,050,000 | | NJ EDA (Harrogate)1 | | | 5.875 | | | | 12/01/2026 | | | | 3,049,970 | |
| 10,000 | | NJ EDA (Hillcrest Health Service) | | | 7.243 | 2 | | | 01/01/2018 | | | | 9,953 | |
| 90,000 | | NJ EDA (Metromall Urban Renewal)1 | | | 6.500 | | | | 04/01/2031 | | | | 90,125 | |
| 100,000 | | NJ EDA (Motor Vehicle Surcharges)1 | | | 5.000 | | | | 07/01/2023 | | | | 101,364 | |
| 60,000 | | NJ EDA (Motor Vehicle Surcharges)1 | | | 5.000 | | | | 07/01/2029 | | | | 60,818 | |
| 195,000 | | NJ EDA (Motor Vehicle Surcharges)1 | | | 5.000 | | | | 07/01/2034 | | | | 197,139 | |
| 4,980,000 | | NJ EDA (Motor Vehicle Surcharges)1 | | | 5.250 | | | | 07/01/2031 | | | | 5,066,453 | |
| 260,000 | | NJ EDA (Motor Vehicle Surcharges)1 | | | 5.250 | | | | 07/01/2033 | | | | 264,753 | |
| 2,500,000 | | NJ EDA (MSU Student Hsg.)1 | | | 5.750 | | | | 06/01/2031 | | | | 2,705,475 | |
| 135,000 | | NJ EDA (Municipal Rehabilitation)1 | | | 5.000 | | | | 04/01/2028 | | | | 135,387 | |
| 5,320,000 | | NJ EDA (New Jersey American Water Company)1 | | | 5.600 | | | | 11/01/2034 | | | | 5,793,001 | |
| 4,350,000 | | NJ EDA (New Jersey American Water Company)1 | | | 5.700 | | | | 10/01/2039 | | | | 4,699,784 | |
| 50,000 | | NJ EDA (New Jersey Transit Corp.)1 | | | 5.750 | | | | 12/15/2017 | | | | 50,173 | |
| 15,000 | | NJ EDA (New Jersey Transit Corp.)1 | | | 5.750 | | | | 12/15/2017 | | | | 15,052 | |
| 800,000 | | NJ EDA (Newark Downtown District Management Corp.)1 | | | 5.125 | | | | 06/15/2027 | | | | 801,360 | |
| 1,400,000 | | NJ EDA (Newark Downtown District Management Corp.)1 | | | 5.125 | | | | 06/15/2037 | | | | 1,401,764 | |
| 650,000 | | NJ EDA (Paterson Charter School Science & Technology)1 | | | 6.000 | | | | 07/01/2032 | | | | 654,628 | |
| 1,900,000 | | NJ EDA (Paterson Charter School Science & Technology)1 | | | 6.100 | | | | 07/01/2044 | | | | 1,901,482 | |
| 1,500,000 | | NJ EDA (Paterson Charter School)1 | | | 5.000 | | | | 07/01/2032 | | | | 1,370,010 | |
| 2,500,000 | | NJ EDA (Paterson Charter School)1 | | | 5.300 | | | | 07/01/2044 | | | | 2,228,000 | |
| 500,000 | | NJ EDA (Provident Group-Kean Properties)1 | | | 5.000 | | | | 07/01/2037 | | | | 544,630 | |
| 850,000 | | NJ EDA (Rutgers University)1 | | | 5.000 | | | | 06/15/2038 | | | | 960,407 | |
| 1,000,000 | | NJ EDA (School Facilities)1 | | | 5.250 | | | | 09/01/2026 | | | | 1,055,840 | |
| 50,000 | | NJ EDA (St. Barnabas Medical Center) | | | 6.743 | 2 | | | 07/01/2018 | | | | 49,559 | |
| 65,000 | | NJ EDA (St. Barnabas Medical Center) | | | 6.827 | 2 | | | 07/01/2021 | | | | 61,400 | |
| 25,000 | | NJ EDA (St. Barnabas Medical Center) | | | 7.147 | 2 | | | 07/01/2020 | | | | 24,031 | |
| 110,000 | | NJ EDA (State Office Buildings)1 | | | 5.000 | | | | 06/15/2020 | | | | 110,328 | |
| 3,200,000 | | NJ EDA (Team Academy Charter School)1 | | | 6.000 | | | | 10/01/2043 | | | | 3,553,888 | |
| 10,000,000 | | NJ EDA (The Goethals Bridge Replacement)1 | | | 5.375 | | | | 01/01/2043 | | | | 11,191,400 | |
| 1,500,000 | | NJ EDA (UMM Energy Partners)1 | | | 5.000 | | | | 06/15/2037 | | | | 1,558,665 | |
| 1,250,000 | | NJ EDA (UMM Energy Partners)1 | | | 5.125 | | | | 06/15/2043 | | | | 1,297,338 | |
|
| 22 OPPENHEIMER ROCHESTER NEW JERSEY MUNICIPAL FUND |
| | | | | | | | | | | | | | |
Principal
Amount | | | | Coupon | | | Maturity | | | Value | |
| New Jersey (Continued) | | | | | | | | | |
| $125,000 | | NJ Educational Facilities Authority (Drew University)1 | | | 5.250 | % | | | 07/01/2019 | | | $ | 133,295 | |
| 2,735,000 | | NJ Educational Facilities Authority (Georgian Court University)1 | | | 5.000 | | | | 07/01/2033 | | | | 2,739,048 | |
| 875,000 | | NJ Educational Facilities Authority (Georgian Court University)1 | | | 5.250 | | | | 07/01/2027 | | | | 877,520 | |
| 2,115,000 | | NJ Educational Facilities Authority (Higher Education)1 | | | 5.000 | | | | 06/15/2026 | | | | 2,253,448 | |
| 120,000 | | NJ Educational Facilities Authority (Kean University)1 | | | 5.250 | | | | 09/01/2029 | | | | 128,537 | |
| 870,000 | | NJ Educational Facilities Authority (New Jersey City University)1 | | | 5.000 | | | | 07/01/2030 | | | | 1,025,356 | |
| 5,000 | | NJ Educational Facilities Authority (Public Library)1 | | | 5.000 | | | | 09/01/2022 | | | | 5,015 | |
| 30,000 | | NJ Educational Facilities Authority (Richard Stockton College)1 | | | 5.125 | | | | 07/01/2028 | | | | 31,167 | |
| 1,000,000 | | NJ Educational Facilities Authority (Rider University)1 | | | 5.000 | | | | 07/01/2037 | | | | 1,059,500 | |
| 2,025,000 | | NJ Educational Facilities Authority (Stockton University)1 | | | 5.000 | | | | 07/01/2041 | | | | 2,214,479 | |
| 5,000,000 | | NJ GO3 | | | 5.000 | | | | 06/01/2027 | | | | 5,772,100 | |
| 5,000,000 | | NJ GO3 | | | 5.000 | | | | 06/01/2028 | | | | 5,772,100 | |
| 3,000,000 | | NJ Health Care Facilities Financing Authority (Barnabas Health)1 | | | 5.000 | | | | 07/01/2044 | | | | 3,318,870 | |
| 5,085,000 | | NJ Health Care Facilities Financing Authority (Catholic Health East)1 | | | 5.000 | | | | 11/15/2033 | | | | 5,573,211 | |
| 750,000 | | NJ Health Care Facilities Financing Authority (Hebrew Old Age Center of Atlantic City)1 | | | 5.300 | | | | 11/01/2026 | | | | 743,453 | |
| 450,000 | | NJ Health Care Facilities Financing Authority (Hebrew Old Age Center of Atlantic City)1 | | | 5.375 | | | | 11/01/2036 | | | | 419,220 | |
| 65,000 | | NJ Health Care Facilities Financing Authority (Hospital Asset Transformation)1 | | | 5.250 | | | | 10/01/2038 | | | | 68,316 | |
| 230,000 | | NJ Health Care Facilities Financing Authority (Hospital Asset Transformation)1 | | | 5.250 | | | | 10/01/2038 | | | | 235,014 | |
| 3,480,000 | | NJ Health Care Facilities Financing Authority (IH/ IMCW/IMCtr Obligated Group)1 | | | 5.000 | | | | 07/01/2046 | | | | 3,876,755 | |
| 1,500,000 | | NJ Health Care Facilities Financing Authority (Kennedy Health System)1 | | | 5.000 | | | | 07/01/2031 | | | | 1,645,500 | |
| 500,000 | | NJ Health Care Facilities Financing Authority (SJHS/SJH&MC Obligated Group)1 | | | 5.000 | | | | 07/01/2036 | | | | 549,770 | |
| 10,000,000 | | NJ Health Care Facilities Financing Authority (SJHS/SJH&MC/GPD/GPDH/SJRC/HviewA/HsideA/Hhouse/SJHlth/200HPC/SJWC/SJWHF Obligated Group)1 | | | 6.625 | | | | 07/01/2038 | | | | 10,526,100 | |
| 1,960,000 | | NJ Health Care Facilities Financing Authority (St. Luke’s Warren Hospital)1 | | | 5.000 | | | | 08/15/2034 | | | | 2,173,875 | |
| 2,000,000 | | NJ Health Care Facilities Financing Authority (University Hospital)1 | | | 5.000 | | | | 07/01/2046 | | | | 2,248,460 | |
| 125,000 | | NJ Health Care Facilities Financing Authority (Virtua Health/Virtua Memorial Hospital Burlington County Obligated Group)1 | | | 5.750 | | | | 07/01/2033 | | | | 135,581 | |
| 1,975,000 | | NJ Higher Education Assistance Authority1 | | | 5.500 | | | | 12/01/2025 | | | | 2,178,919 | |
| 60,000 | | NJ Higher Education Assistance Authority1 | | | 5.750 | | | | 12/01/2029 | | | | 65,737 | |
| 10,025,000 | | NJ Higher Education Student Assistance Authority (Student Loans)1 | | | 6.125 | | | | 06/01/2030 | | | | 10,311,815 | |
|
| 23 OPPENHEIMER ROCHESTER NEW JERSEY MUNICIPAL FUND |
STATEMENT OF INVESTMENTS Continued
| | | | | | | | | | | | | | |
Principal
Amount | | | | Coupon | | | Maturity | | | Value | |
| New Jersey (Continued) | | | | | | | | | |
| $3,285,000 | | NJ Hsg. & Mtg. Finance Agency (Single Family Hsg.)3 | | | 4.625 | % | | | 10/01/2027 | | | $ | 3,289,820 | |
| 915,000 | | NJ Hsg. & Mtg. Finance Agency (Single Family Hsg.)3 | | | 5.000 | | | | 10/01/2037 | | | | 922,061 | |
| 20,000 | | NJ Hsg. & Mtg. Finance Agency, Series AA1 | | | 6.150 | | | | 10/01/2023 | | | | 20,686 | |
| 15,000 | | NJ Hsg. & Mtg. Finance Agency, Series AA1 | | | 6.375 | | | | 10/01/2028 | | | | 15,459 | |
| 9,580,000 | | NJ Tobacco Settlement Financing Corp.1 | | | 5.000 | | | | 06/01/2041 | | | | 9,194,118 | |
| 10,980,000 | | NJ Tobacco Settlement Financing Corp. | | | 5.477 | 2 | | | 06/01/2041 | | | | 3,002,920 | |
| 2,000,000 | | NJ Transportation Trust Fund Authority1 | | | 5.000 | | | | 06/15/2031 | | | | 2,039,240 | |
| 1,625,000 | | NJ Transportation Trust Fund Authority1 | | | 5.000 | | | | 06/15/2038 | | | | 1,682,021 | |
| 5,000,000 | | NJ Transportation Trust Fund Authority1 | | | 5.500 | | | | 06/15/2041 | | | | 5,194,500 | |
| 9,500,000 | | NJ Transportation Trust Fund Authority1 | | | 5.875 | | | | 12/15/2038 | | | | 9,936,810 | |
| 4,518,000 | | NJ Transportation Trust Fund Authority1 | | | 6.000 | | | | 06/15/2035 | | | | 4,924,349 | |
| 5,000,000 | | NJ Turnpike Authority1 | | | 5.000 | | | | 01/01/2034 | | | | 5,744,600 | |
| 5,000,000 | | NJ Turnpike Authority1 | | | 5.000 | | | | 01/01/2038 | | | | 5,641,550 | |
| 1,000,000 | | NJ Turnpike Authority1,4 | | | 5.000 | | | | 01/01/2040 | | | | 1,174,260 | |
| 6,330,000 | | Rutgers State University NJ3 | | | 5.000 | | | | 05/01/2029 | | | | 7,302,556 | |
| 5,380,000 | | Rutgers State University NJ3 | | | 5.000 | | | | 05/01/2030 | | | | 6,170,537 | |
| 4,000,000 | | Rutgers State University NJ3 | | | 5.000 | | | | 05/01/2038 | | | | 4,509,480 | |
| 1,350,000 | | South Jersey, NJ Port Corp. (Marine Terminal)1 | | | 5.000 | | | | 01/01/2039 | | | | 1,388,705 | |
| 3,650,000 | | South Jersey, NJ Transportation Authority1 | | | 5.000 | | | | 11/01/2039 | | | | 3,998,940 | |
| 55,000 | | Union County, NJ Improvement Authority (Linden Airport)1 | | | 5.000 | | | | 03/01/2028 | | | | 55,147 | |
| 5,000 | | Wanaque Valley, NJ Regional Sewerage Authority1 | | | 5.750 | | | | 09/01/2018 | | | | 5,094 | |
| 40,000 | | West Milford Township, NJ (Municipal Utilities Authority)1 | | | 5.375 | | | | 08/01/2031 | | | | 40,091 | |
| | | | | | | | | | | | | 253,704,292 | |
| | | | | | | | | | | | | | | |
| New York—5.4% | | | | | | | | | | | | |
| 2,689,000 | | Port Authority NY/NJ (JFK International Air Terminal)1 | | | 5.750 | | | | 12/01/2022 | | | | 2,720,892 | |
| 8,685,000 | | Port Authority NY/NJ (JFK International Air Terminal)1 | | | 5.750 | | | | 12/01/2025 | | | | 8,788,004 | |
| 5,100,000 | | Port Authority NY/NJ (JFK International Air Terminal)1 | | | 6.500 | | | | 12/01/2028 | | | | 5,183,436 | |
| 1,705,000 | | Port Authority NY/NJ (KIAC)1 | | | 6.750 | | | | 10/01/2019 | | | | 1,733,746 | |
| | | | | | | | | | | | | 18,426,078 | |
| | | | | | | | | | | | | | | |
| U.S. Possessions—30.5% | | | | | | | | | | | | |
| 10,000 | | Guam Hsg. Corp. (Single Family Mtg.)1 | | | 5.750 | | | | 09/01/2031 | | | | 10,470 | |
| 125,000 | | Guam Power Authority, Series A1 | | | 5.000 | | | | 10/01/2024 | | | | 142,657 | |
| 250,000 | | Guam Power Authority, Series A1 | | | 5.000 | | | | 10/01/2030 | | | | 280,462 | |
| 3,365,000 | | Northern Mariana Islands Commonwealth, Series A1 | | | 5.000 | | | | 06/01/2030 | | | | 2,879,700 | |
| 2,105,000 | | Northern Mariana Islands Ports Authority, Series A1 | | | 6.250 | | | | 03/15/2028 | | | | 1,847,180 | |
| 2,525,000 | | Puerto Rico Aqueduct & Sewer Authority | | | 6.000 | | | | 07/01/2038 | | | | 2,124,787 | |
| 3,355,000 | | Puerto Rico Children’s Trust Fund (TASC)1 | | | 5.375 | | | | 05/15/2033 | | | | 3,384,356 | |
| 17,900,000 | | Puerto Rico Children’s Trust Fund (TASC)1 | | | 5.500 | | | | 05/15/2039 | | | | 17,753,220 | |
| 19,195,000 | | Puerto Rico Children’s Trust Fund (TASC)1 | | | 5.625 | | | | 05/15/2043 | | | | 18,936,059 | |
| 2,150,000 | | Puerto Rico Commonwealth GO5 | | | 5.250 | | | | 07/01/2037 | | | | 1,220,125 | |
| 8,350,000 | | Puerto Rico Commonwealth GO5 | | | 5.750 | | | | 07/01/2036 | | | | 4,738,625 | |
| 3,205,000 | | Puerto Rico Commonwealth GO5 | | | 5.750 | | | | 07/01/2041 | | | | 1,818,837 | |
| 5,000,000 | | Puerto Rico Commonwealth GO5 | | | 6.000 | | | | 07/01/2029 | | | | 2,837,500 | |
| 6,085,000 | | Puerto Rico Commonwealth GO5 | | | 6.000 | | | | 07/01/2039 | | | | 3,453,237 | |
|
| 24 OPPENHEIMER ROCHESTER NEW JERSEY MUNICIPAL FUND |
| | | | | | | | | | | | | | |
Principal
Amount | | | | Coupon | | | Maturity | | | Value | |
| U.S. Possessions (Continued) | | | | | | | | | |
| $3,000,000 | | Puerto Rico Commonwealth GO5 | | | 6.500 | % | | | 07/01/2040 | | | $ | 1,702,500 | |
| 168,097 | | Puerto Rico Electric Power Authority5 | | | 10.000 | | | | 07/01/2019 | | | | 102,914 | |
| 168,096 | | Puerto Rico Electric Power Authority5 | | | 10.000 | | | | 07/01/2019 | | | | 102,913 | |
| 165,099 | | Puerto Rico Electric Power Authority5 | | | 10.000 | | | | 01/01/2021 | | | | 101,168 | |
| 165,099 | | Puerto Rico Electric Power Authority5 | | | 10.000 | | | | 07/01/2021 | | | | 101,197 | |
| 55,033 | | Puerto Rico Electric Power Authority5 | | | 10.000 | | | | 01/01/2022 | | | | 33,777 | |
| 55,033 | | Puerto Rico Electric Power Authority5 | | | 10.000 | | | | 07/01/2022 | | | | 33,777 | |
| 1,700,000 | | Puerto Rico Electric Power Authority, Series A5 | | | 5.000 | | | | 07/01/2029 | | | | 1,037,000 | |
| 1,990,000 | | Puerto Rico Electric Power Authority, Series A5 | | | 5.000 | | | | 07/01/2042 | | | | 1,213,900 | |
| 45,000 | | Puerto Rico Electric Power Authority, Series A5 | | | 5.050 | | | | 07/01/2042 | | | | 27,450 | |
| 3,000,000 | | Puerto Rico Electric Power Authority, Series A5 | | | 7.000 | | | | 07/01/2043 | | | | 1,830,000 | |
| 3,000,000 | | Puerto Rico Electric Power Authority, Series AAA5 | | | 5.250 | | | | 07/01/2028 | | | | 1,830,000 | |
| 5,000,000 | | Puerto Rico Electric Power Authority, Series AAA5 | | | 5.250 | | | | 07/01/2030 | | | | 3,050,000 | |
| 550,000 | | Puerto Rico Electric Power Authority, Series AAA5 | | | 5.250 | | | | 07/01/2031 | | | | 335,500 | |
| 50,000 | | Puerto Rico Electric Power Authority, Series CCC5 | | | 5.000 | | | | 07/01/2021 | | | | 30,500 | |
| 90,000 | | Puerto Rico Electric Power Authority, Series CCC5 | | | 5.000 | | | | 07/01/2025 | | | | 54,900 | |
| 100,000 | | Puerto Rico Electric Power Authority, Series TT5 | | | 5.000 | | | | 07/01/2023 | | | | 61,000 | |
| 80,000 | | Puerto Rico Electric Power Authority, Series TT5 | | | 5.000 | | | | 07/01/2037 | | | | 48,800 | |
| 750,000 | | Puerto Rico Highway & Transportation Authority, FGIC6 | | | 5.750 | | | | 07/01/2020 | | | | 479,062 | |
| 575,000 | | Puerto Rico Infrastructure5 | | | 5.000 | | | | 07/01/2027 | | | | 41,688 | |
| 4,750,000 | | Puerto Rico Infrastructure5 | | | 5.000 | | | | 07/01/2037 | | | | 344,375 | |
| 2,610,000 | | Puerto Rico Infrastructure7 | | | 5.000 | | | | 07/01/2041 | | | | 189,225 | |
| 975,000 | | Puerto Rico Infrastructure, AMBAC | | | 6.995 | 2 | | | 07/01/2035 | | | | 360,184 | |
| 3,000,000 | | Puerto Rico Infrastructure, FGIC6 | | | 7.046 | 2 | | | 07/01/2042 | | | | 449,970 | |
| 400,000 | | Puerto Rico Infrastructure (Mepsi Campus)5 | | | 6.500 | | | | 10/01/2037 | | | | 198,156 | |
| 100,000 | | Puerto Rico ITEMECF (Ana G. Mendez University)1 | | | 5.000 | | | | 04/01/2027 | | | | 98,593 | |
| 930,000 | | Puerto Rico ITEMECF (Ana G. Mendez University)1 | | | 5.000 | | | | 03/01/2036 | | | | 846,998 | |
| 100,000 | | Puerto Rico ITEMECF (Ana G. Mendez University)1 | | | 5.125 | | | | 04/01/2032 | | | | 95,379 | |
| 100,000 | | Puerto Rico ITEMECF (Ana G. Mendez University)1 | | | 5.375 | | | | 04/01/2042 | | | | 93,706 | |
| 175,000 | | Puerto Rico ITEMECF (Cogeneration Facilities) | | | 6.625 | | | | 06/01/2026 | | | | 165,398 | |
| 1,000,000 | | Puerto Rico ITEMECF (Polytechnic University), ACA1 | | | 5.000 | | | | 08/01/2032 | | | | 952,320 | |
| 2,000,000 | | Puerto Rico Municipal Finance Agency, Series A, AGC1 | | | 5.250 | | | | 08/01/2020 | | | | 2,029,860 | |
| 305,000 | | Puerto Rico Public Buildings Authority5 | | | 5.250 | | | | 07/01/2033 | | | | 159,363 | |
| 5,000,000 | | Puerto Rico Public Buildings Authority7 | | | 5.250 | | | | 07/01/2042 | | | | 2,556,250 | |
| 1,000,000 | | Puerto Rico Public Buildings Authority7 | | | 5.625 | | | | 07/01/2039 | | | | 527,500 | |
| 1,000,000 | | Puerto Rico Public Buildings Authority, NPFGC1 | | | 6.000 | | | | 07/01/2028 | | | | 1,031,310 | |
| 1,530,000 | | Puerto Rico Public Buildings Authority, Series D5 | | | 5.250 | | | | 07/01/2036 | | | | 799,425 | |
| 5,235,000 | | Puerto Rico Public Finance Corp., Series B5 | | | 6.000 | | | | 08/01/2026 | | | | 143,963 | |
| 9,850,000 | | Puerto Rico Sales Tax Financing Corp., Series A5 | | | 5.375 | | | | 08/01/2039 | | | | 2,647,188 | |
| 2,500,000 | | Puerto Rico Sales Tax Financing Corp., Series A5 | | | 5.500 | | | | 08/01/2021 | | | | 671,875 | |
| 4,850,000 | | Puerto Rico Sales Tax Financing Corp., Series A5 | | | 5.500 | | | | 08/01/2022 | | | | 1,303,438 | |
| 10,935,000 | | Puerto Rico Sales Tax Financing Corp., Series A5 | | | 5.500 | | | | 08/01/2042 | | | | 2,938,781 | |
| 6,675,000 | | Puerto Rico Sales Tax Financing Corp., Series A, NPFGC | | | 5.898 | 2 | | | 08/01/2041 | | | | 1,646,522 | |
| 325,000 | | Puerto Rico Sales Tax Financing Corp., Series A5 | | | 6.375 | | | | 08/01/2039 | | | | 87,344 | |
| 6,800,000 | | Puerto Rico Sales Tax Financing Corp., Series A5 | | | 6.500 | | | | 08/01/2044 | | | | 1,827,500 | |
| 14,000,000 | | Puerto Rico Sales Tax Financing Corp., Series C5 | | | 5.750 | | | | 08/01/2057 | | | | 8,662,500 | |
| 1,100,000 | | V.I. Tobacco Settlement Financing Corp. | | | 6.497 | 2 | | | 05/15/2035 | | | | 177,694 | |
|
| 25 OPPENHEIMER ROCHESTER NEW JERSEY MUNICIPAL FUND |
STATEMENT OF INVESTMENTS Continued
| | | | | | | | | | | | | | |
Principal
Amount | | | | Coupon | | | Maturity | | | Value | |
| U.S. Possessions (Continued) | | | | | | | | | |
| $3,100,000 | | V.I. Tobacco Settlement Financing Corp. | | | 7.622 | %2 | | | 05/15/2035 | | | $ | 309,070 | |
| | | | | | | | | | | | | 104,959,148 | |
| | | | |
| | | | | | | | | | | | | | | |
| Total Investments, at Value (Cost $418,823,607)—109.7% | | | | | | | | 377,089,518 | |
| Net Other Assets (Liabilities)—(9.7) | | | | | | | | (33,229,264 | ) |
| Net Assets—100.0% | | | | | | | $ | 343,860,254 | |
| | | | | | | | | |
Footnotes to Statement of Investments
1. All or a portion of the security position has been segregated for collateral to cover borrowings. See Note 9 of the accompanying Notes.
2. Zero coupon bond reflects effective yield on the original acquisition date.
3. Security represents the underlying municipal bond with respect to an inverse floating rate security held by the Fund. The bond was purchased by the Fund and subsequently transferred to a trust, which issued the related inverse floating rate security. See Note 4 of the accompanying Notes.
4. All or a portion of the security position is when-issued or delayed delivery to be delivered and settled after period end. See Note 4 of the accompanying Notes.
5. This security is not accruing income because its issuer has missed or is expected to miss interest and/or principal payments. The rate shown is the contractual interest rate. See Note 4 of the accompanying Notes.
6. The issuer of this security has missed or is expected to miss interest and/or principal payments on this security. The security is insured and is accruing partial income at a rate anticipated to be recovered through the insurer. The rate shown is the contractual interest rate.
7. This security is accruing partial income at an anticipated effective rate based on expected interest and/or principal payments. The rate shown is the contractual interest rate.
To simplify the listings of securities, abbreviations are used per the table below:
| | |
| 200HPC | | 200 Hospital Plaza Corp. |
| ACA | | American Capital Access |
| AGC | | Assured Guaranty Corp. |
| AMBAC | | AMBAC Indemnity Corp. |
| EDA | | Economic Devel. Authority |
| FGIC | | Financial Guaranty Insurance Co. |
| GO | | General Obligation |
| GPD | | Genesis Property Development |
| GPDH | | Genesis Property Development Holding |
| Hhouse | | Harbor House |
| HsideA | | Harborside Apartments |
| HviewA | | Harborview Apartments |
| IH | | Inspira Health |
| IMCtr | | Inspira Medical Center |
| IMCW | | Inspira Medical Center Woodbury |
| ITEMECF | | Industrial, Tourist, Educational, Medical and Environmental Community Facilities |
| JFK | | John Fitzgerald Kennedy |
| MSU | | Montclair State University |
| NPFGC | | National Public Finance Guarantee Corp. |
| NY/NJ | | New York/New Jersey |
| SJH&MC | | St. Joseph’s Health and Medical Center |
| SJHlth | | St. Joseph’s Healthcare |
|
| 26 OPPENHEIMER ROCHESTER NEW JERSEY MUNICIPAL FUND |
To simplify the listings of securities, abbreviations are used per the table below: (Continued)
| | |
| SJHS | | St. Joseph Health System |
| SJRC | | St. Joseph’s Regional Cardiology |
| SJWC | | St. Joseph’s Wayne Cardiology |
| SJWHF | | St. Joseph’s Wayne Hospital Foundation |
| TASC | | Tobacco Settlement Asset-Backed Bonds |
| V.I. | | United States Virgin Islands |
See accompanying Notes to Financial Statements.
|
| 27 OPPENHEIMER ROCHESTER NEW JERSEY MUNICIPAL FUND |
STATEMENT OF ASSETS AND LIABILITIES July 31, 2017
| | | | |
| |
| Assets | | | | |
| Investments, at value (cost $418,823,607)—see accompanying statement of investments | | $ | 377,089,518 | |
| |
| Cash | | | 552,332 | |
| |
| Receivables and other assets: | | | | |
| Investments sold | | | 4,403,210 | |
| Interest | | | 2,879,479 | |
| Shares of beneficial interest sold | | | 131,576 | |
| Other | | | 128,393 | |
| | | | |
| Total assets | | | 385,184,508 | |
| | | | |
| |
| Liabilities | | | | |
| Payables and other liabilities: | | | | |
| Payable for borrowings (See Note 9) | | | 19,600,000 | |
| Payable for short-term floating rate notes issued (See Note 4) | | | 18,875,000 | |
| Shares of beneficial interest redeemed | | | 1,228,966 | |
| Investments purchased on a when-issued or delayed delivery basis | | | 1,165,990 | |
| Dividends | | | 220,362 | |
| Trustees’ compensation | | | 71,273 | |
| Distribution and service plan fees | | | 57,736 | |
| Interest expense on borrowings | | | 17,253 | |
| Shareholder communications | | | 6,976 | |
| Other | | | 80,698 | |
| | | | |
| Total liabilities | | | 41,324,254 | |
| | | | |
| |
| Net Assets | | $ | 343,860,254 | |
| | | | |
| | | | |
| |
| Composition of Net Assets | | | | |
| Paid-in capital | | $ | 525,449,055 | |
| |
| Accumulated net investment income | | | 540,374 | |
| |
| Accumulated net realized loss on investments | | | (140,395,086) | |
| |
| Net unrealized depreciation on investments | | | (41,734,089) | |
| | | | |
| Net Assets | | $ | 343,860,254 | |
| | | | |
|
| 28 OPPENHEIMER ROCHESTER NEW JERSEY MUNICIPAL FUND |
| | | | |
| |
| Net Asset Value Per Share | | | | |
Class A Shares: | | | | |
| Net asset value and redemption price per share (based on net assets of $207,957,978 and 23,043,075 shares of beneficial interest outstanding) | | | $9.02 | |
| |
| Maximum offering price per share (net asset value plus sales charge of 4.75% of offering price) | | | $9.47 | |
| |
| |
Class B Shares: | | | | |
| Net asset value, redemption price (excludes applicable contingent deferred sales charge) and offering price per share (based on net assets of $1,676,788 and 185,193 shares of beneficial interest outstanding) | | | $9.05 | |
| |
| |
Class C Shares: | | | | |
| Net asset value, redemption price (excludes applicable contingent deferred sales charge) and offering price per share (based on net assets of $97,516,790 and 10,791,795 shares of beneficial interest outstanding) | | | $9.04 | |
| |
| |
Class Y Shares: | | | | |
| Net asset value, redemption price and offering price per share (based on net assets of $36,708,698 and 4,062,900 shares of beneficial interest outstanding) | | | $9.04 | |
See accompanying Notes to Financial Statements.
|
| 29 OPPENHEIMER ROCHESTER NEW JERSEY MUNICIPAL FUND |
STATEMENT
OF OPERATIONS For the Year Ended July 31, 2017
| | | | |
| |
| Investment Income | | | | |
| Interest | | $ | 19,452,289 | |
| |
| Expenses | | | | |
| Management fees | | | 2,143,841 | |
| |
| Distribution and service plan fees: | | | | |
| Class A | | | 409,610 | |
| Class B | | | 19,737 | |
| Class C | | | 1,012,590 | |
| |
| Transfer and shareholder servicing agent fees: | | | | |
| Class A | | | 231,462 | |
| Class B | | | 2,193 | |
| Class C | | �� | 112,562 | |
| Class Y | | | 32,551 | |
| |
| Shareholder communications: | | | | |
| Class A | | | 14,213 | |
| Class B | | | 487 | |
| Class C | | | 7,700 | |
| Class Y | | | 3,120 | |
| |
| Borrowing fees | | | 386,501 | |
| |
| Interest expense and fees on short-term floating rate notes issued (See Note 4) | | | 233,966 | |
| |
| Interest expense on borrowings | | | 109,114 | |
| |
| Trustees’ compensation | | | 5,774 | |
| |
| Custodian fees and expenses | | | 2,257 | |
| |
| Other | | | 175,092 | |
| | | | |
| Total expenses | | | 4,902,770 | |
| |
| Net Investment Income | | | 14,549,519 | |
| |
| Realized and Unrealized Gain (Loss) | | | | |
| Net realized gain on investment transactions | | | 762,842 | |
| |
| Net change in unrealized appreciation/depreciation on investment transactions | | | (27,232,735) | |
| |
| Net Decrease in Net Assets Resulting from Operations | | $ | (11,920,374) | |
| | | | |
See accompanying Notes to Financial Statements.
|
| 30 OPPENHEIMER ROCHESTER NEW JERSEY MUNICIPAL FUND |
STATEMENTS OF CHANGES IN NET ASSETS
| | | | | | | | |
| | | Year Ended
July 31, 2017 | | | Year Ended
July 31, 2016 | |
| |
| Operations | | | | | | | | |
| Net investment income | | $ | 14,549,519 | | | $ | 17,872,233 | |
| |
| Net realized gain | | | 762,842 | | | | 2,490,401 | |
| |
| Net change in unrealized appreciation/depreciation | | | (27,232,735) | | | | 14,840,351 | |
| | | | |
| Net increase (decrease) in net assets resulting from operations | | | (11,920,374) | | | | 35,202,985 | |
| | | | | | | | |
| |
| Dividends and/or Distributions to Shareholders | | | | | | | | |
| Dividends from net investment income: | | | | | | | | |
| Class A | | | (9,969,457) | | | | (12,974,635) | |
| Class B | | | (77,318) | | | | (147,184) | |
| Class C | | | (4,031,761) | | | | (5,310,058) | |
| Class Y | | | (1,454,078) | | | | (1,219,633) | |
| | | | |
| | | (15,532,614) | | | | (19,651,510) | |
| | | | | | | | |
| |
| Beneficial Interest Transactions | | | | | | | | |
| Net increase (decrease) in net assets resulting from beneficial interest transactions: | | | | | | | | |
| Class A | | | (32,878,334) | | | | (16,003,401) | |
| Class B | | | (1,052,793) | | | | (1,680,867) | |
| Class C | | | (18,824,104) | | | | (11,680,065) | |
| Class Y | | | 10,270,816 | | | | 4,246,954 | |
| | | | |
| | | (42,484,415) | | | | (25,117,379) | |
| | | | | | | | |
| |
| Net Assets | | | | | | | | |
| Total decrease | | | (69,937,403) | | | | (9,565,904) | |
| |
| Beginning of period | | | 413,797,657 | | | | 423,363,561 | |
| | | | |
| End of period (including accumulated net investment income of $540,374 and $1,495,545, respectively) | | $ | 343,860,254 | | | $ | 413,797,657 | |
| | | | |
See accompanying Notes to Financial Statements.
|
| 31 OPPENHEIMER ROCHESTER NEW JERSEY MUNICIPAL FUND |
STATEMENT OF CASH FLOWS For the Year Ended July 31, 2017
| | | | |
| |
| Cash Flows from Operating Activities | | | | |
| Net decrease in net assets from operations | | $ | (11,920,374) | |
| |
| Adjustments to reconcile net decrease in net assets from operations to net cash provided by operating activities: | | | | |
Purchase of investment securities | | | (35,083,079) | |
Proceeds from disposition of investment securities | | | 59,797,183 | |
Short-term investment securities, net | | | (1,230,938) | |
Premium amortization | | | 1,749,548 | |
Discount accretion | | | (1,970,706) | |
Net realized gain on investment transactions | | | (762,842) | |
Net change in unrealized appreciation/depreciation on investment transactions | | | 27,232,735 | |
| Change in assets: | | | | |
Decrease in other assets | | | 10,133 | |
Decrease in interest receivable | | | 1,868,646 | |
Increase in receivable for securities sold | | | (3,188,104) | |
| Change in liabilities: | | | | |
Increase in other liabilities | | | 46,840 | |
Increase in payable for securities purchased | | | 1,165,990 | |
| | | | |
| Net cash provided by operating activities | | | 37,715,032 | |
| | | | |
| |
| Cash Flows from Financing Activities | | | | |
| Proceeds from borrowings | | | 88,800,000 | |
| Payments on borrowings | | | (74,300,000) | |
| Proceeds on short-term floating rate notes issued | | | 4,745,000 | |
| Proceeds from shares sold | | | 52,779,918 | |
| Payments on shares redeemed | | | (107,297,729) | |
| Cash distributions paid | | | (2,457,490) | |
| | | | |
| Net cash used in financing activities | | | (37,730,301) | |
| |
| Net decrease in cash | | | (15,269) | |
| |
| Cash, beginning balance | | | 567,601 | |
| | | | |
| Cash, ending balance | | $ | 552,332 | |
| | | | |
Supplemental disclosure of cash flow information:
Noncash financing activities not included herein consist of reinvestment of dividends and distributions of $13,108,682.
Cash paid for interest on borrowings—$94,042.
Cash paid for interest on short-term floating rate notes issued—$233,966.
See accompanying Notes to Financial Statements.
|
| 32 OPPENHEIMER ROCHESTER NEW JERSEY MUNICIPAL FUND |
FINANCIAL HIGHLIGHTS
| | | | | | | | | | | | | | | | | | |
| Class A | | Year Ended
July 31, 2017 | | | Year Ended
July 31, 2016 | | | Year Ended
July 31, 2015 | | | Year Ended
July 31, 2014 | | | Year Ended
July 31, 2013 |
|
| Per Share Operating Data | | | | | | | | | | | | | | | | | | |
| Net asset value, beginning of period | | | $9.70 | | | | $9.34 | | | | $9.67 | | | | $9.60 | | | $10.68 |
|
| Income (loss) from investment operations: | | | | | | | | | | | | | | | | | | |
| Net investment income1 | | | 0.38 | | | | 0.43 | | | | 0.48 | | | | 0.52 | | | 0.50 |
| Net realized and unrealized gain (loss) | | | (0.66) | | | | 0.40 | | | | (0.31) | | | | 0.07 | | | (1.05) |
| | | |
| Total from investment operations | | | (0.28) | | | | 0.83 | | | | 0.17 | | | | 0.59 | | | (0.55) |
|
| Dividends and/or distributions to shareholders: | | | | | | | | | | | | | | | | | | |
| Dividends from net investment income | | | (0.40) | | | | (0.47) | | | | (0.50) | | | | (0.52) | | | (0.53) |
|
| Net asset value, end of period | | | $9.02 | | | | $9.70 | | | | $9.34 | | | | $9.67 | | | $9.60 |
| | | |
| | | | | | | | | | | | | | | | | | |
|
| Total Return, at Net Asset Value2 | | | (3.01)% | | | | 9.25% | | | | 1.64% | | | | 6.40% | | | (5.43)% |
| | | | | | | | | | | | | | | | | | |
|
| Ratios/Supplemental Data | | | | | | | | | | | | | | | | | | |
| Net assets, end of period (in thousands) | | | $207,958 | | | | $257,608 | | | | $263,873 | | | | $306,172 | | | $368,177 |
|
| Average net assets (in thousands) | | | $231,289 | | | | $260,521 | | | | $301,779 | | | | $326,496 | | | $425,664 |
|
| Ratios to average net assets:3 | | | | | | | | | | | | | | | | | | |
| Net investment income | | | 4.05% | | | | 4.55% | | | | 4.89% | | | | 5.58% | | | 4.80% |
| Expenses excluding specific expenses listed below | | | 0.90% | | | | 0.87% | | | | 0.87% | | | | 0.83% | | | 0.76% |
| Interest and fees from borrowings | | | 0.13% | | | | 0.22% | | | | 0.23% | | | | 0.15% | | | 0.11% |
| Interest and fees on short-term floating rate notes issued4 | | | 0.06% | | | | 0.04% | | | | 0.07% | | | | 0.08% | | | 0.06% |
| | | |
| Total expenses | | | 1.09% | | | | 1.13% | | | | 1.17% | | | | 1.06% | | | 0.93% |
| Expenses after payments, waivers and/or reimbursements and reduction to custodian expenses | | | 1.09% | | | | 1.13% | | | | 1.17% | | | | 1.06%5 | | | 0.91% |
|
| Portfolio turnover rate | | | 9% | | | | 11% | | | | 7% | | | | 30% | | | 24% |
1. Per share amounts calculated based on the average shares outstanding during the period.
2. Assumes an initial investment on the business day before the first day of the fiscal period, with all dividends and distributions reinvested in additional shares on the reinvestment date, and redemption at the net asset value calculated on the last business day of the fiscal period. Sales charges are not reflected in the total returns. Total returns are not annualized for periods less than one full year. Returns do not reflect the deduction of taxes that a shareholder would pay on fund distributions or the redemption of fund shares.
3. Annualized for periods less than one full year.
4. Interest and fee expense relates to the Fund’s liability for short-term floating rate notes issued in conjunction with inverse floating rate security transactions.
5. Waiver was less than 0.005%.
See accompanying Notes to Financial Statements.
|
| 33 OPPENHEIMER ROCHESTER NEW JERSEY MUNICIPAL FUND |
FINANCIAL HIGHLIGHTS Continued
| | | | | | | | | | | | | | | | | | |
| Class B | | Year Ended
July 31, 2017 | | | Year Ended
July 31, 2016 | | | Year Ended
July 31, 2015 | | | Year Ended
July 31, 2014 | | | Year Ended
July 31, 2013 |
|
| Per Share Operating Data | | | | | | | | | | | | | | | | | | |
| Net asset value, beginning of period | | | $9.72 | | | | $9.36 | | | | $9.69 | | | | $9.62 | | | $10.70 |
|
| Income (loss) from investment operations: | | | | | | | | | | | | | | | | | | |
| Net investment income1 | | | 0.32 | | | | 0.36 | | | | 0.41 | | | | 0.45 | | | 0.42 |
| Net realized and unrealized gain (loss) | | | (0.66) | | | | 0.40 | | | | (0.31) | | | | 0.06 | | | (1.06) |
| | | |
| Total from investment operations | | | (0.34) | | | | 0.76 | | | | 0.10 | | | | 0.51 | | | (0.64) |
|
| Dividends and/or distributions to shareholders: | | | | | | | | | | | | | | | | | | |
| Dividends from net investment income | | | (0.33) | | | | (0.40) | | | | (0.43) | | | | (0.44) | | | (0.44) |
|
| Net asset value, end of period | | | $9.05 | | | | $9.72 | | | | $9.36 | | | | $9.69 | | | $9.62 |
| | | |
| | | | | | | | | | | | | | | | | | |
|
| Total Return, at Net Asset Value2 | | | (3.72)% | | | | 8.51% | | | | 0.86% | | | | 5.55% | | | (6.24)% |
| | | | | | | | | | | | | | | | | | |
|
| Ratios/Supplemental Data | | | | | | | | | | | | | | | | | | |
| Net assets, end of period (in thousands) | | | $1,677 | | | | $2,885 | | | | $4,444 | | | | $6,351 | | | $10,331 |
|
| Average net assets (in thousands) | | | $2,187 | | | | $3,495 | | | | $5,540 | | | | $7,822 | | | $15,007 |
|
| Ratios to average net assets:3 | | | | | | | | | | | | | | | | | | |
| Net investment income | | | 3.42% | | | | 3.84% | | | | 4.13% | | | | 4.81% | | | 3.96% |
| Expenses excluding specific expenses listed below | | | 1.64% | | | | 1.63% | | | | 1.63% | | | | 1.63% | | | 1.61% |
| Interest and fees from borrowings | | | 0.13% | | | | 0.22% | | | | 0.23% | | | | 0.15% | | | 0.11% |
| Interest and fees on short-term floating rate notes issued4 | | | 0.06% | | | | 0.04% | | | | 0.07% | | | | 0.08% | | | 0.06% |
| | | |
| Total expenses | | | 1.83% | | | | 1.89% | | | | 1.93% | | | | 1.86% | | | 1.78% |
| Expenses after payments, waivers and/or reimbursements and reduction to custodian expenses | | | 1.83% | | | | 1.89% | | | | 1.93% | | | | 1.86%5 | | | 1.76% |
|
| Portfolio turnover rate | | | 9% | | | | 11% | | | | 7% | | | | 30% | | | 24% |
1. Per share amounts calculated based on the average shares outstanding during the period.
2. Assumes an initial investment on the business day before the first day of the fiscal period, with all dividends and distributions reinvested in additional shares on the reinvestment date, and redemption at the net asset value calculated on the last business day of the fiscal period. Sales charges are not reflected in the total returns. Total returns are not annualized for periods less than one full year. Returns do not reflect the deduction of taxes that a shareholder would pay on fund distributions or the redemption of fund shares.
3. Annualized for periods less than one full year.
4. Interest and fee expense relates to the Fund’s liability for short-term floating rate notes issued in conjunction with inverse floating rate security transactions.
5. Waiver was less than 0.005%.
See accompanying Notes to Financial Statements.
|
| 34 OPPENHEIMER ROCHESTER NEW JERSEY MUNICIPAL FUND |
| | | | | | | | | | | | | | | | | | |
| Class C | | Year Ended
July 31, 2017 | | | Year Ended
July 31, 2016 | | | Year Ended
July 31, 2015 | | | Year Ended
July 31, 2014 | | | Year Ended
July 31, 2013 |
|
| Per Share Operating Data | | | | | | | | | | | | | | | | | | |
| Net asset value, beginning of period | | | $9.71 | | | | $9.35 | | | | $9.68 | | | | $9.61 | | | $10.69 |
|
| Income (loss) from investment operations: | | | | | | | | | | | | | | | | | | |
| Net investment income1 | | | 0.31 | | | | 0.36 | | | | 0.40 | | | | 0.45 | | | 0.42 |
| Net realized and unrealized gain (loss) | | | (0.64) | | | | 0.40 | | | | (0.30) | | | | 0.06 | | | (1.05) |
| | | |
| Total from investment operations | | | (0.33) | | | | 0.76 | | | | 0.10 | | | | 0.51 | | | (0.63) |
|
| Dividends and/or distributions to shareholders: | | | | | | | | | | | | | | | | | | |
| Dividends from net investment income | | | (0.34) | | | | (0.40) | | | | (0.43) | | | | (0.44) | | | (0.45) |
|
| Net asset value, end of period | | | $9.04 | | | | $9.71 | | | | $9.35 | | | | $9.68 | | | $9.61 |
| | | |
| | | | | | | | | | | | | | | | | | |
|
| Total Return, at Net Asset Value2 | | | (3.70)% | | | | 8.54% | | | | 0.87% | | | | 5.60% | | | (6.15)% |
| | | | | | | | | | | | | | | | | | |
|
| Ratios/Supplemental Data | | | | | | | | | | | | | | | | | | |
| Net assets, end of period (in thousands) | | | $97,517 | | | | $124,488 | | | | $131,468 | | | | $142,154 | | | $173,766 |
|
| Average net assets (in thousands) | | | $112,466 | | | | $125,656 | | | | $142,243 | | | | $150,721 | | | $194,185 |
|
| Ratios to average net assets:3 | | | | | | | | | | | | | | | | | | |
| Net investment income | | | 3.36% | | | | 3.80% | | | | 4.06% | | | | 4.83% | | | 4.04% |
| Expenses excluding specific expenses listed below | | | 1.62% | | | | 1.61% | | | | 1.62% | | | | 1.59% | | | 1.52% |
| Interest and fees from borrowings | | | 0.13% | | | | 0.22% | | | | 0.23% | | | | 0.15% | | | 0.11% |
| Interest and fees on short-term floating rate notes issued4 | | | 0.06% | | | | 0.04% | | | | 0.07% | | | | 0.08% | | | 0.06% |
| | | |
| Total expenses | | | 1.81% | | | | 1.87% | | | | 1.92% | | | | 1.82% | | | 1.69% |
| Expenses after payments, waivers and/or reimbursements and reduction to custodian expenses | | | 1.81% | | | | 1.87% | | | | 1.92% | | | | 1.82%5 | | | 1.67% |
|
| Portfolio turnover rate | | | 9% | | | | 11% | | | | 7% | | | | 30% | | | 24% |
1. Per share amounts calculated based on the average shares outstanding during the period.
2. Assumes an initial investment on the business day before the first day of the fiscal period, with all dividends and distributions reinvested in additional shares on the reinvestment date, and redemption at the net asset value calculated on the last business day of the fiscal period. Sales charges are not reflected in the total returns. Total returns are not annualized for periods less than one full year. Returns do not reflect the deduction of taxes that a shareholder would pay on fund distributions or the redemption of fund shares.
3. Annualized for periods less than one full year.
4. Interest and fee expense relates to the Fund’s liability for short-term floating rate notes issued in conjunction with inverse floating rate security transactions.
5. Waiver was less than 0.005%.
See accompanying Notes to Financial Statements.
|
| 35 OPPENHEIMER ROCHESTER NEW JERSEY MUNICIPAL FUND |
FINANCIAL HIGHLIGHTS Continued
| | | | | | | | | | | | | | | | | | |
| Class Y | | Year Ended
July 31, 2017 | | | Year Ended
July 31, 2016 | | | Year Ended
July 31, 2015 | | | Year Ended
July 31, 2014 | | | Year Ended
July 31, 2013 |
|
| Per Share Operating Data | | | | | | | | | | | | | | | | | | |
| Net asset value, beginning of period | | | $9.71 | | | | $9.35 | | | | $9.68 | | | | $9.60 | | | $10.69 |
|
| Income (loss) from investment operations: | | | | | | | | | | | | | | | | | | |
| Net investment income1 | | | 0.38 | | | | 0.44 | | | | 0.49 | | | | 0.54 | | | 0.52 |
| Net realized and unrealized gain (loss) | | | (0.63) | | | | 0.40 | | | | (0.30) | | | | 0.07 | | | (1.07) |
| | | |
| Total from investment operations | | | (0.25) | | | | 0.84 | | | | 0.19 | | | | 0.61 | | | (0.55) |
|
| Dividends and/or distributions to shareholders: | | | | | | | | | | | | | | | | | | |
| Dividends from net investment income | | | (0.42) | | | | (0.48) | | | | (0.52) | | | | (0.53) | | | (0.54) |
|
| Net asset value, end of period | | | $9.04 | | | | $9.71 | | | | $9.35 | | | | $9.68 | | | $9.60 |
| | | |
| | | | | | | | | | | | | | | | | | |
|
| Total Return, at Net Asset Value2 | | | (2.83)% | | | | 9.51% | | | | 1.79% | | | | 6.66% | | | (5.40)% |
| | | | | | | | | | | | | | | | | | |
|
| Ratios/Supplemental Data | | | | | | | | | | | | | | | | | | |
| Net assets, end of period (in thousands) | | | $36,708 | | | | $28,817 | | | | $23,579 | | | | $23,842 | | | $23,351 |
|
| Average net assets (in thousands) | | | $32,570 | | | | $23,906 | | | | $25,005 | | | | $20,998 | | | $25,821 |
|
| Ratios to average net assets:3 | | | | | | | | | | | | | | | | | | |
| Net investment income | | | 4.10% | | | | 4.66% | | | | 5.02% | | | | 5.71% | | | 4.94% |
| Expenses excluding specific expenses listed below | | | 0.73% | | | | 0.71% | | | | 0.72% | | | | 0.69% | | | 0.62% |
| Interest and fees from borrowings | | | 0.13% | | | | 0.22% | | | | 0.23% | | | | 0.15% | | | 0.11% |
| Interest and fees on short-term floating rate notes issued4 | | | 0.06% | | | | 0.04% | | | | 0.07% | | | | 0.08% | | | 0.06% |
| | | |
| Total expenses | | | 0.92% | | | | 0.97% | | | | 1.02% | | | | 0.92% | | | 0.79% |
| Expenses after payments, waivers and/or reimbursements and reduction to custodian expenses | | | 0.92% | | | | 0.97% | | | | 1.02% | | | | 0.92%5 | | | 0.77% |
|
| Portfolio turnover rate | | | 9% | | | | 11% | | | | 7% | | | | 30% | | | 24% |
1. Per share amounts calculated based on the average shares outstanding during the period.
2. Assumes an initial investment on the business day before the first day of the fiscal period, with all dividends and distributions reinvested in additional shares on the reinvestment date, and redemption at the net asset value calculated on the last business day of the fiscal period. Sales charges are not reflected in the total returns. Total returns are not annualized for periods less than one full year. Returns do not reflect the deduction of taxes that a shareholder would pay on fund distributions or the redemption of fund shares.
3. Annualized for periods less than one full year.
4. Interest and fee expense relates to the Fund’s liability for short-term floating rate notes issued in conjunction with inverse floating rate security transactions.
5. Waiver was less than 0.005%.
See accompanying Notes to Financial Statements.
|
| 36 OPPENHEIMER ROCHESTER NEW JERSEY MUNICIPAL FUND |
NOTES TO FINANCIAL STATEMENTS July 31, 2017
1. Organization
Oppenheimer Rochester New Jersey Municipal Fund (the “Fund”) is a separate series of Oppenheimer Multi-State Municipal Trust, a non-diversified, open-end management investment company registered under the Investment Company Act of 1940 (“1940 Act”), as amended. The Fund’s investment objective is to seek tax-free income. The Fund’s investment adviser is OFI Global Asset Management, Inc. (“OFI Global” or the “Manager”), a wholly-owned subsidiary of OFI (“OFI” or the “Sub-Adviser”). The Manager has entered into a sub-advisory agreement with OFI.
The Fund offers Class A, Class C and Class Y shares, and previously offered Class B shares for new purchase through June 29, 2012. Subsequent to that date, no new purchases of Class B shares are permitted, however reinvestment of dividend and/or capital gain distributions and exchanges of Class B shares into and from other Oppenheimer funds are allowed. Class A shares are sold at their offering price, which is normally net asset value plus a front-end sales charge. Class C shares are sold, and Class B shares were sold, without a front-end sales charge but may be subject to a contingent deferred sales charge (“CDSC”). Class Y shares are sold to certain institutional investors or intermediaries without either a front-end sales charge or a CDSC, however, the intermediaries may impose charges on their accountholders who beneficially own Class Y shares. All classes of shares have identical rights and voting privileges with respect to the Fund in general and exclusive voting rights on matters that affect that class alone. Earnings, net assets and net asset value per share may differ due to each class having its own expenses, such as transfer and shareholder servicing agent fees and shareholder communications, directly attributable to that class. Class A, B and C shares have separate distribution and/or service plans under which they pay fees. Class Y shares do not pay such fees. Class B shares will automatically convert to Class A shares 72 months after the date of purchase.
The following is a summary of significant accounting policies followed in the Fund’s preparation of financial statements in accordance with accounting principles generally accepted in the United States (“U.S. GAAP”).
2. Significant Accounting Policies
Security Valuation. All investments in securities are recorded at their estimated fair value, as described in Note 3.
Allocation of Income, Expenses, Gains and Losses. Income, expenses (other than those attributable to a specific class), gains and losses are allocated on a daily basis to each class of shares based upon the relative proportion of net assets represented by such class. Operating expenses directly attributable to a specific class are charged against the operations of that class.
Dividends and Distributions to Shareholders. Dividends and distributions to shareholders, which are determined in accordance with income tax regulations and may differ from U.S. GAAP, are recorded on the ex-dividend date. Income distributions, if any,
|
| 37 OPPENHEIMER ROCHESTER NEW JERSEY MUNICIPAL FUND |
NOTES TO FINANCIAL STATEMENTS Continued
2. Significant Accounting Policies (Continued)
are declared daily and paid monthly. Capital gain distributions, if any, are declared and paid annually or at other times as deemed necessary by the Manager.
Investment Income. Interest income is recognized on an accrual basis. Discount and premium, which are included in interest income on the Statement of Operations, are amortized or accreted daily.
Custodian Fees. “Custodian fees and expenses” in the Statement of Operations may include interest expense incurred by the Fund on any cash overdrafts of its custodian account during the period. Such cash overdrafts may result from the effects of failed trades in portfolio securities and from cash outflows resulting from unanticipated shareholder redemption activity. The Fund pays interest to its custodian on such cash overdraft at a rate equal to the Prime Rate plus 0.35%. The “Reduction to custodian expenses” line item, if applicable, represents earnings on cash balances maintained by the Fund during the period. Such interest expense and other custodian fees may be paid with these earnings.
Security Transactions. Security transactions are recorded on the trade date. Realized gains and losses on securities sold are determined on the basis of identified cost.
Indemnifications. The Fund’s organizational documents provide current and former Trustees and officers with a limited indemnification against liabilities arising in connection with the performance of their duties to the Fund. In the normal course of business, the Fund may also enter into contracts that provide general indemnifications. The Fund’s maximum exposure under these arrangements is unknown as this would be dependent on future claims that may be made against the Fund. The risk of material loss from such claims is considered remote.
Federal Taxes. The Fund intends to comply with provisions of the Internal Revenue Code applicable to regulated investment companies and to distribute substantially all of its investment company taxable income, including any net realized gain on investments not offset by capital loss carryforwards, if any, to shareholders. Therefore, no federal income or excise tax provision is required. The Fund files income tax returns in U.S. federal and applicable state jurisdictions. The statute of limitations on the Fund’s tax return filings generally remains open for the three preceding fiscal reporting period ends. The Fund has analyzed its tax positions for the fiscal year ended July 31, 2017, including open tax years, and does not believe there are any uncertain tax positions requiring recognition in the Fund’s financial statements.
The tax components of capital shown in the following table represent distribution requirements the Fund must satisfy under the income tax regulations, losses the Fund may be able to offset against income and gains realized in future years and unrealized appreciation or depreciation of securities and other investments for federal income tax purposes.
|
| 38 OPPENHEIMER ROCHESTER NEW JERSEY MUNICIPAL FUND |
2. Significant Accounting Policies (Continued)
| | | | | | | | | | | | |
Undistributed Net Investment Income | | Undistributed Long-Term Gain | | | Accumulated Loss Carryforward1,2,3,4 | | | Net Unrealized Depreciation Based on cost of Securities and Other Investments for Federal Income Tax Purposes | |
| |
| $7,117,620 | | | $— | | | | $140,391,178 | | | | $41,488,812 | |
1. At period end, the Fund had $140,391,178 of net capital loss carryforward available to offset future realized capital gains, if any, and thereby reduce future taxable gain distributions. Details of the capital loss carryforwards are included in the table below. Capital loss carryovers with no expiration, if any, must be utilized prior to those with expiration dates.
| | | | |
| Expiring | | | |
| |
| 2018 | | $ | 22,257,929 | |
| No expiration | | | 118,133,249 | |
| | | | |
| Total | | $ | 140,391,178 | |
| | | | |
2. During the reporting period, the Fund utilized $735,561 of capital loss carryforward to offset capital gains realized in that fiscal year.
3. During the previous reporting period, the Fund utilized $2,518,218 of capital loss carryforward to offset capital gains realized in that fiscal year.
4. During the reporting period, $18,113,753 of unused capital loss carryforward expired.
Net investment income (loss) and net realized gain (loss) may differ for financial statement and tax purposes. The character of dividends and distributions made during the fiscal year from net investment income or net realized gains are determined in accordance with federal income tax requirements, which may differ from the character of net investment income or net realized gains presented in those financial statements in accordance with U.S. GAAP. Also, due to timing of dividends and distributions, the fiscal year in which amounts are distributed may differ from the fiscal year in which the income or net realized gain was recorded by the Fund.
Accordingly, the following amounts have been reclassified for the reporting period. Net assets of the Fund were unaffected by the reclassifications.
| | | | | | | | |
Reduction to Paid-in Capital | | Increase to
Accumulated Net Investment Income | | | Reduction to Accumulated Net Realized Loss on Investments | |
| |
| $18,113,753 | | | $27,924 | | | | $18,085,829 | |
The tax character of distributions paid during the reporting periods:
| | | | | | | | |
| | | Year Ended July 31, 2017 | | | Year Ended July 31, 2016 | |
| |
| Distributions paid from: | | | | | | | | |
| Exempt-interest dividends | | $ | 15,041,090 | | | $ | 19,233,950 | |
| Ordinary income | | | 491,524 | | | | 417,560 | |
| | | | |
| Total | | $ | 15,532,614 | | | $ | 19,651,510 | |
| | | | |
|
| 39 OPPENHEIMER ROCHESTER NEW JERSEY MUNICIPAL FUND |
NOTES TO FINANCIAL STATEMENTS Continued
2. Significant Accounting Policies (Continued)
The aggregate cost of securities and other investments and the composition of unrealized appreciation and depreciation of securities and other investments for federal income tax purposes at period end are noted in the following table. The primary difference between book and tax appreciation or depreciation of securities and other investments, if applicable, is attributable to the tax deferral of losses or tax realization of financial statement unrealized gain or loss.
| | | | |
| Federal tax cost of securities | | $ | 399,860,982 | 1 |
| | | | |
| Gross unrealized appreciation | | $ | 14,848,956 | |
| Gross unrealized depreciation | | | (56,337,768 | ) |
| | | | |
| Net unrealized depreciation | | $ | (41,488,812 | ) |
| | | | |
1. The Federal tax cost of securities does not include cost of $18,717,348, which has otherwise been recognized for financial reporting purposes, related to bonds placed into trusts in conjunction with certain investment transactions. See the Inverse Floating Rate Securities note in Note 4.
Use of Estimates. The preparation of financial statements in conformity with U.S. GAAP requires management to make estimates and assumptions that affect the reported amounts of assets and liabilities and disclosure of contingent assets and liabilities at the date of the financial statements and the reported amounts of increases and decreases in net assets from operations during the reporting period. Actual results could differ from those estimates.
Recent Accounting Pronouncement. In October 2016, the Securities and Exchange Commission (“SEC”) adopted amendments to rules under the Investment Company Act of 1940 (“final rules”) intended to modernize the reporting and disclosure of information by registered investment companies. The final rules amend Regulation S-X and require funds to provide standardized, enhanced derivative disclosure in fund financial statements in a format designed for individual investors. The amendments to Regulation S-X also update the disclosures for other investments and investments in, and advances to affiliates and amend the rules regarding the general form and content of fund financial statements. The compliance date for the amendments to Regulation S-X is for reporting periods ended after August 1, 2017. The implementation of the rules will not have a material impact on the Fund’s financial statements.
3. Securities Valuation
The Fund calculates the net asset value of its shares as of 4:00 P.M. Eastern time, on each day the New York Stock Exchange (the “Exchange”) is open for trading, except in the case of a scheduled early closing of the Exchange, in which case the Fund will calculate net asset value of the shares as of the scheduled early closing time of the Exchange.
The Fund’s Board has adopted procedures for the valuation of the Fund’s securities and has delegated the day-to-day responsibility for valuation determinations under those procedures to the Manager. The Manager has established a Valuation Committee which is responsible for determining a fair valuation for any security for which market quotations are not readily
|
| 40 OPPENHEIMER ROCHESTER NEW JERSEY MUNICIPAL FUND |
3. Securities Valuation (Continued)
available. The Valuation Committee’s fair valuation determinations are subject to review, approval and ratification by the Fund’s Board at its next regularly scheduled meeting covering the calendar quarter in which the fair valuation was determined.
Valuation Methods and Inputs
Securities are valued primarily using unadjusted quoted market prices, when available, as supplied by third party pricing services or broker-dealers.
The following methodologies are used to determine the market value or the fair value of the types of securities described below:
Corporate and government debt securities (of U.S. or foreign issuers) and municipal debt securities, short-term notes, mortgage-backed securities, collateralized mortgage obligations, and asset-backed securities are valued at the mean between the bid and asked prices utilizing evaluated prices obtained from third party pricing services or broker-dealers who may use matrix pricing methods to determine the evaluated prices. Pricing services generally price debt securities assuming orderly transactions of an institutional “round lot” size, but some trades may occur in smaller, “odd lot” sizes, sometimes at lower prices than institutional round lot trades. Standard inputs generally considered by third-party pricing vendors include reported trade data, broker-dealer price quotations, benchmark yields, issuer spreads on comparable securities, the credit quality, yield, maturity, as well as other appropriate factors.
Securities for which market quotations are not readily available or a significant event has occurred that would materially affect the value of the security, the security is fair valued either (i) by a standardized fair valuation methodology applicable to the security type or the significant event as previously approved by the Valuation Committee and the Fund’s Board or (ii) as determined in good faith by the Manager’s Valuation Committee. The Valuation Committee considers all relevant facts that are reasonably available, through either public information or information available to the Manager, when determining the fair value of a security. Those standardized fair valuation methodologies include, but are not limited to, valuing securities at the last sale price or initially at cost and subsequently adjusting the value based on: changes in company specific fundamentals, changes in an appropriate securities index, or changes in the value of similar securities which may be further adjusted for any discounts related to security-specific resale restrictions. When possible, such methodologies use observable market inputs such as unadjusted quoted prices of similar securities, observable interest rates, currency rates and yield curves. The methodologies used for valuing securities are not necessarily an indication of the risks associated with investing in those securities nor can it be assured that the Fund can obtain the fair value assigned to a security if it were to sell the security.
Classifications
Each investment asset or liability of the Fund is assigned a level at measurement date based on the significance and source of the inputs to its valuation. Various data inputs may be used in determining the value of each of the Fund’s investments as of the reporting period end. These data inputs are categorized in the following hierarchy under applicable financial
|
| 41 OPPENHEIMER ROCHESTER NEW JERSEY MUNICIPAL FUND |
NOTES TO FINANCIAL STATEMENTS Continued
3. Securities Valuation (Continued)
accounting standards:
1) Level 1-unadjusted quoted prices in active markets for identical assets or liabilities (including securities actively traded on a securities exchange)
2) Level 2-inputs other than unadjusted quoted prices that are observable for the asset or liability (such as unadjusted quoted prices for similar assets and market corroborated inputs such as interest rates, prepayment speeds, credit risks, etc.)
3) Level 3-significant unobservable inputs (including the Manager’s own judgments about assumptions that market participants would use in pricing the asset or liability).
The inputs used for valuing securities are not necessarily an indication of the risks associated with investing in those securities.
The table below categorizes amounts that are included in the Fund’s Statement of Assets and Liabilities at period end based on valuation input level:
| | | | | | | | | | | | | | | | |
| | | Level 1— Unadjusted Quoted Prices | | | Level 2— Other Significant Observable Inputs | | | Level 3— Significant Unobservable Inputs | | | Value | |
| |
| Assets Table | | | | | | | | | | | | | | | | |
| Investments, at Value: | | | | | | | | | | | | | | | | |
| Municipal Bonds and Notes | | | | | | | | | | | | | | | | |
New Jersey | | $ | — | | | $ | 253,704,292 | | | $ | — | | | $ | 253,704,292 | |
New York | | | — | | | | 18,426,078 | | | | — | | | | 18,426,078 | |
U.S. Possessions | | | — | | | | 104,959,148 | | | | — | | | | 104,959,148 | |
| | | | |
| Total Assets | | $ | — | | | $ | 377,089,518 | | | $ | — | | | $ | 377,089,518 | |
| | | | |
Forward currency exchange contracts and futures contracts, if any, are reported at their unrealized appreciation/depreciation at measurement date, which represents the change in the contract’s value from trade date. All additional assets and liabilities included in the above table are reported at their market value at measurement date.
4. Investments and Risks
Inverse Floating Rate Securities. The Fund invests in inverse floating rate securities that pay interest at a rate that varies inversely with short-term interest rates. Because inverse floating rate securities are leveraged instruments, the value of an inverse floating rate security will change more significantly in response to changes in interest rates and other market fluctuations than the market value of a conventional fixed-rate municipal security of similar maturity and credit quality, including the municipal bond underlying an inverse floating rate security.
An inverse floating rate security is created as part of a financial transaction referred to as a
“tender option bond” transaction. In most cases, in a tender option bond transaction the Fund sells a fixed-rate municipal bond (the “underlying municipal bond”) to a trust (the “Trust”). The Trust then issues and sells short-term floating rate securities with a fixed principal amount representing a senior interest in the underlying municipal bond to third parties and a residual,
|
| 42 OPPENHEIMER ROCHESTER NEW JERSEY MUNICIPAL FUND |
4. Investments and Risks (Continued)
subordinate interest in the underlying municipal bond (referred to as an “inverse floating rate security”) to the Fund. The interest rate on the short-term floating rate securities resets periodically, usually weekly, to a prevailing market rate and holders of these securities are granted the option to tender their securities back to the Trust for repurchase at their principal amount plus accrued interest thereon (the “purchase price”) periodically, usually daily or weekly. A remarketing agent for the Trust is required to attempt to re-sell any tendered short-term floating rate securities to new investors for the purchase price. If the remarketing agent is unable to successfully re-sell the tendered short-term floating rate securities, a liquidity provider to the Trust must contribute cash to the Trust to ensure that the tendering holders receive the purchase price of their securities on the repurchase date.
Because holders of the short-term floating rate securities are granted the right to tender their securities to the Trust for repurchase at frequent intervals for the purchase price, with such payment effectively guaranteed by the liquidity provider, the securities generally bear short-term rates of interest commensurate with money market instruments. When interest is paid on the underlying municipal bond to the Trust, such proceeds are first used to pay the Trust’s administrative expenses and accrued interest to holders of the short-term floating rate securities, with any remaining amounts being paid to the Fund, as the holder of the inverse floating rate security. Accordingly, the amount of such interest on the underlying municipal bond paid to the Fund is inversely related to the rate of interest on the short-term floating rate securities. Additionally, because the principal amount of the short-term floating rate securities is fixed and is not adjusted in response to changes in the market value of the underlying municipal bond, any change in the market value of the underlying municipal bond is reflected entirely in a change to the value of the inverse floating rate security.
Typically, the terms of an inverse floating rate security grant certain rights to the Fund, as holder. For example, the Fund typically has the right upon request to require that the Trust compel a tender of the short-term floating rate securities to facilitate the Fund’s acquisition of the underlying municipal bond. Following such a request, the Fund pays the Trust the purchase price of the short-term floating rate securities and a specified portion of any market value gain on the underlying municipal bond since its deposit into the Trust, which the Trust uses to redeem the short-term floating rate securities. The Trust then distributes the underlying municipal bond to the Fund. Through the exercise of this right, the Fund can voluntarily terminate or “collapse” the Trust, terminate its investment in the related inverse floating rate security and obtain the underlying municipal bond. Additionally, the Fund also typically has the right to exchange with the Trust (i) a principal amount of short-term floating rate securities held by the Fund for a corresponding additional principal amount of the inverse floating rate security or (ii) a principal amount of the inverse floating rate security held by the Fund for a corresponding additional principal amount of short-term floating rate securities (which are typically then sold to other investors). Through the exercise of this right, the Fund may increase (or decrease) the principal amount of short-term floating rate securities outstanding, thereby increasing (or decreasing) the amount of leverage provided by the short-term floating rate securities to the Fund’s investment exposure to the underlying municipal bond.
The Fund’s investments in inverse floating rate securities involve certain risks. As short-term
|
| 43 OPPENHEIMER ROCHESTER NEW JERSEY MUNICIPAL FUND |
NOTES TO FINANCIAL STATEMENTS Continued
4. Investments and Risks (Continued)
interest rates rise, an inverse floating rate security produces less current income (and, in extreme cases, may pay no income) and as short-term interest rates fall, an inverse floating rate security produces more current income. Thus, if short-term interest rates rise after the issuance of the inverse floating rate security, any yield advantage is reduced or eliminated. All inverse floating rate securities entail some degree of leverage represented by the outstanding principal amount of the related short-term floating rate securities, relative to the par value of the underlying municipal bond. The value of, and income earned on, an inverse floating rate security that has a higher degree of leverage will fluctuate more significantly in response to changes in interest rates and to changes in the market value of the related underlying municipal bond than that of an inverse floating rate security with a lower degree of leverage, and is more likely to be eliminated entirely under adverse market conditions. Changes in the value of an inverse floating rate security will also be more significant than changes in the market value of the related underlying municipal bond because the leverage provided by the related short-term floating rate securities increases the sensitivity of an inverse floating rate security to changes in interest rates and to the market value of the underlying municipal bond. An inverse floating rate security can be expected to underperform fixed-rate municipal bonds when the difference between long-term and short-term interest rates is decreasing (or is already small) or when long-term interest rates are rising, but can be expected to outperform fixed-rate municipal bonds when the difference between long-term and short-term interest rates is increasing (or is already large) or when long-term interest rates are falling. Additionally, a tender option bond transaction typically provides for the automatic termination or “collapse” of a Trust upon the occurrence of certain adverse events, usually referred to as “mandatory tender events” or “tender option termination events.” These events may include, among others, a credit ratings downgrade of the underlying municipal bond below a specified level, a decrease in the market value of the underlying municipal bond below a specified amount, a bankruptcy of the liquidity provider or the inability of the remarketing agent to resell to new investors short-term floating rate securities that have been tendered for repurchase by holders thereof. Following the occurrence of such an event, the underlying municipal bond is generally sold for current market value and the proceeds distributed to holders of the short-term floating rate securities and inverse floating rate security, with the holder of the inverse floating rate security (the Fund) generally receiving the proceeds of such sale only after the holders of the short-term floating rate securities have received proceeds equal to the purchase price of their securities (and the liquidity provider is generally required to contribute cash to the Trust only in an amount sufficient to ensure that the holders of the short-term floating rate securities receive the purchase price of their securities in connection with such termination of the Trust). Following the occurrence of such events, the Fund could potentially lose the entire amount of its investment in the inverse floating rate security.
Finally, the Fund may enter into shortfall/reimbursement agreements with the liquidity provider of certain tender option bond transactions in connection with certain inverse floating rate securities held by the Fund. These agreements commit the Fund to reimburse the liquidity provider to the extent that the liquidity provider must provide cash to a Trust, including following the termination of a Trust resulting from the occurrence of a “mandatory tender
|
| 44 OPPENHEIMER ROCHESTER NEW JERSEY MUNICIPAL FUND |
4. Investments and Risks (Continued)
event.” In connection with the occurrence of such an event and the termination of the Trust triggered thereby, the shortfall/reimbursement agreement will make the Fund liable for the amount of the negative difference, if any, between the liquidation value of the underlying municipal bond and the purchase price of the short-term floating rate securities issued by the Trust. Under the standard terms of a tender option bond transaction, absent such a shortfall/ reimbursement agreement, the Fund, as holder of the inverse floating rate security, would not be required to make such a reimbursement payment to the liquidity provider. The Manager monitors the Fund’s potential exposure with respect to these agreements on a daily basis and intends to take action to terminate the Fund’s investment in related inverse floating rate securities, if it deems it appropriate to do so.
When the Fund creates an inverse floating rate security in a tender option bond transaction by selling an underlying municipal bond to a Trust, the transaction is considered a secured borrowing for financial reporting purposes. As a result of such accounting treatment, the Fund includes the underlying municipal bond on its Statement of Investments and as an asset on its Statement of Assets and Liabilities (but does not separately include the related inverse floating rate security on either). The Fund also includes a liability on its Statement of Assets and Liabilities equal to the outstanding principal amount and accrued interest on the related short-term floating rate securities issued by the Trust. Interest on the underlying municipal bond is recorded as investment income on the Fund’s Statement of Operations, while interest payable on the related short-term floating rate securities is recorded as interest expense. At period end, municipal bond holdings with a value of $33,738,654 shown on the Fund’s Statement of Investments are held by such Trusts and serve as the underlying municipal bonds for the related $18,875,000 in short-term floating rate securities issued and outstanding at that date.
At period end, the inverse floating rate securities associated with tender option bond transactions accounted for as secured borrowings were as follows:
| | | | | | | | | | | | | | |
Principal
Amount | | Inverse Floater1 | | Coupon Rate2 | | | Maturity Date | | | Value | |
| |
| $ 2,500,000 | | NJ GO Tender Option Bond Series 2017-XF0553-1 Trust | | | 7.006% | | | | 6/1/27 | | | $ | 3,294,050 | |
| 2,500,000 | | NJ GO Tender Option Bond Series 2017-XF0553-2 Trust | | | 7.006 | | | | 6/1/28 | | | | 3,250,150 | |
| 1,645,000 | | NJ Hsg. & Mtg. Finance Agency (Single Family Hsg.) Tender Option Bond
Series 2015-XF0015 Trust | | | 6.438 | | | | 10/1/27 | | | | 1,649,820 | |
| 460,000 | | NJ Hsg. & Mtg. Finance Agency (Single Family Hsg.) Tender Option Bond
Series 2015-XF0015-2 Trust | | | 7.065 | | | | 10/1/37 | | | | 467,061 | |
| 1,585,000 | | Rutgers State University NJ Tender Option Bond Series 2015-XF2105 Trust | | | 12.931 | | | | 5/1/29 | | | | 2,557,556 | |
| 1,345,000 | | Rutgers State University NJ Tender Option Bond Series 2015-XF2105-2 Trust | | | 12.950 | | | | 5/1/30 | | | | 2,135,537 | |
| 1,000,000 | | Rutgers State University NJ Tender Option Bond Series 2015-XF2105-3 Trust | | | 12.950 | | | | 5/1/38 | | | | 1,509,480 | |
| | | | | | | | | | | | | | |
| | | | | | | | | | | | $ | 14,863,654 | |
| | | | | | | | | | | | | | |
|
| 45 OPPENHEIMER ROCHESTER NEW JERSEY MUNICIPAL FUND |
NOTES TO FINANCIAL STATEMENTS Continued
4. Investments and Risks (Continued)
1. For a list of abbreviations used in the Inverse Floater table see the Portfolio Abbreviations table at the end of the Statement of Investments.
2. Represents the current interest rate for the inverse floating rate security.
The Fund may also purchase an inverse floating rate security created as part of a tender option bond transaction not initiated by the Fund when a third party, such as a municipal issuer or financial institution, transfers an underlying municipal bond to a Trust. For financial reporting purposes, the Fund includes the inverse floating rate security related to such transaction on its Statement of Investments and as an asset on its Statement of Assets and Liabilities, and interest on the security is recorded as investment income on the Fund’s Statement of Operations.
The Fund may invest in inverse floating rate securities with any degree of leverage (as measured by the outstanding principal amount of related short-term floating rate securities). However, the Fund may only expose up to 20% of its total assets to the effects of leverage from its investments in inverse floating rate securities. This limitation is measured by comparing the aggregate principal amount of the short-term floating rate securities that are related to the inverse floating rate securities held by the Fund to the total assets of the Fund. The Fund’s exposure to the effects of leverage from its investments in inverse floating rate securities amounts to $18,875,000 or 4.90% of its total assets at period end.
Securities on a When-Issued or Delayed Delivery Basis. The Fund may purchase securities on a “when-issued” basis, and may purchase or sell securities on a “delayed delivery” basis. “When-issued” or “delayed delivery” refers to securities whose terms and indenture are available and for which a market exists, but which are not available for immediate delivery. Delivery and payment for securities that have been purchased by the Fund on a when-issued basis normally takes place within six months and possibly as long as two years or more after the trade date. During this period, such securities do not earn interest, are subject to market fluctuation and may increase or decrease in value prior to their delivery. The purchase of securities on a when-issued basis may increase the volatility of the Fund’s net asset value to the extent the Fund executes such transactions while remaining substantially fully invested. When the Fund engages in when-issued or delayed delivery transactions, it relies on the buyer or seller, as the case may be, to complete the transaction. Their failure to do so may cause the Fund to lose the opportunity to obtain or dispose of the security at a price and yield it considers advantageous. The Fund may also sell securities that it purchased on a when-issued basis or forward commitment prior to settlement of the original purchase.
At period end, the Fund had purchased securities issued on a delayed delivery basis as follows:
| | | | |
| | | When-Issued or
Delayed Delivery
Basis Transactions | |
| |
| Purchased securities | | | $1,165,990 | |
|
| 46 OPPENHEIMER ROCHESTER NEW JERSEY MUNICIPAL FUND |
4. Investments and Risks (Continued)
Credit Risk. The Fund invests in high-yield, non-investment-grade bonds, which may be subject to a greater degree of credit risk. Credit risk relates to the ability of the issuer to meet interest or principal payments or both as they become due. The Fund may acquire securities that have missed an interest payment, and is not obligated to dispose of securities whose issuers or underlying obligors subsequently miss an interest payment.
In June 2016, Congress passed the Puerto Rico Oversight, Management, and Economic Stability Act (“PROMESA”). PROMESA established a federally-appointed fiscal oversight board (the “Oversight Board”) to oversee Puerto Rico’s financial operations and allows the Oversight Board to file cases on behalf of the Commonwealth of Puerto Rico or one of its instrumentalities to restructure debt and other obligations of the relevant entity in a “Title III” proceeding. Title III incorporates many provisions of the federal Bankruptcy Code for U.S. territories, and incorporates legal mechanisms for a litigation stay and restructuring of pension and debt obligations, among other provisions. In early May 2017, Title III petitions were filed for the Commonwealth of Puerto Rico and the Puerto Rico Sales Tax Financing Corporation (“COFINA”), two of the largest issuers of Puerto Rico debt. Title III petitions for Puerto Rico Highways & Transportation Authority (“PRHTA”) and Puerto Rico Electric Power Authority (“PREPA”) were subsequently filed in mid-May and early July, respectively. Title III petitions for additional Puerto Rican instrumentalities are expected to be filed. These restructuring proceedings create uncertainty as to the treatment of claims of varying degrees of seniority and the levels and priorities of payment from the affected entities.
Information concerning securities not accruing interest at period end is as follows:
| | | | | | | | |
| Cost | | | $91,898,195 | | | | | |
| Market Value | | | $45,591,216 | | | | | |
| Market Value as % of Net Assets | | | 13.26% | | | | | |
Concentration Risk. The Fund invests a large percentage of its total assets in obligations of issuers within its respective state and U.S. territories. Risks may arise from geographic concentration in any state, commonwealth or territory, such as Puerto Rico, the U.S. Virgin Islands, Guam or the Northern Mariana Islands. Certain economic, regulatory or political developments occurring in the state, commonwealth or territory such as ongoing developments in Puerto Rico may impair the ability of certain issuers of municipal securities to pay principal and interest on their obligations.
5. Market Risk Factors
The Fund’s investments in securities and/or financial derivatives may expose the Fund to various market risk factors:
Commodity Risk. Commodity risk relates to the change in value of commodities or commodity indexes as they relate to increases or decreases in the commodities market. Commodities are physical assets that have tangible properties. Examples of these types of assets are crude oil, heating oil, metals, livestock, and agricultural products.
Credit Risk. Credit risk relates to the ability of the issuer of debt to meet interest and
|
| 47 OPPENHEIMER ROCHESTER NEW JERSEY MUNICIPAL FUND |
NOTES TO FINANCIAL STATEMENTS Continued
5. Market Risk Factors (Continued)
principal payments, or both, as they come due. In general, lower-grade, higher-yield debt securities are subject to credit risk to a greater extent than lower-yield, higher-quality securities.
Equity Risk. Equity risk relates to the change in value of equity securities as they relate to increases or decreases in the general market.
Foreign Exchange Rate Risk. Foreign exchange rate risk relates to the change in the U.S. dollar value of a security held that is denominated in a foreign currency. The U.S. dollar value of a foreign currency denominated security will decrease as the dollar appreciates against the currency, while the U.S. dollar value will increase as the dollar depreciates against the currency.
Interest Rate Risk. Interest rate risk refers to the fluctuations in value of fixed-income securities resulting from the inverse relationship between price and yield. For example, an increase in general interest rates will tend to reduce the market value of already issued fixed-income investments, and a decline in general interest rates will tend to increase their value. In addition, debt securities with longer maturities, which tend to have higher yields, are subject to potentially greater fluctuations in value from changes in interest rates than obligations with shorter maturities.
Volatility Risk. Volatility risk refers to the magnitude of the movement, but not the direction of the movement, in a financial instrument’s price over a defined time period. Large increases or decreases in a financial instrument’s price over a relative time period typically indicate greater volatility risk, while small increases or decreases in its price typically indicate lower volatility risk.
6. Shares of Beneficial Interest
The Fund has authorized an unlimited number of no par value shares of beneficial interest of each class. Transactions in shares of beneficial interest were as follows:
| | | | | | | | | | | | | | | | |
| | | Year Ended July 31, 2017 | | | Year Ended July 31, 2016 | |
| | | Shares | | | Amount | | | Shares | | | Amount | |
| Class A | | | | | | | | | | | | | | | | |
| Sold | | | 2,501,657 | | | $ | 23,393,526 | | | | 3,556,353 | | | $ | 33,535,045 | |
| Dividends and/or distributions reinvested | | | 899,783 | | | | 8,406,903 | | | | 1,147,742 | | | | 10,833,920 | |
| Redeemed | | | (6,922,609) | | | | (64,678,763) | | | | (6,395,485) | | | | (60,372,366) | |
| Net decrease | | | (3,521,169) | | | $ | (32,878,334) | | | | (1,691,390) | | | $ | (16,003,401) | |
| | | | | | | | | | | | | | | | |
| | | | | | | | | | | | | | | | | |
| Class B | | | | | | | | | | | | | | | | |
| Sold | | | 166 | | | $ | 1,509 | | | | 7,446 | | | $ | 70,399 | |
| Dividends and/or distributions reinvested | | | 7,818 | | | | 73,424 | | | | 13,888 | | | | 131,357 | |
| Redeemed | | | (119,541) | | | | (1,127,726) | | | | (199,204) | | | | (1,882,623) | |
| Net decrease | | | (111,557) | | | $ | (1,052,793) | | | | (177,870) | | | $ | (1,680,867) | |
| | | | | | | | | | | | | | | | |
|
| 48 OPPENHEIMER ROCHESTER NEW JERSEY MUNICIPAL FUND |
6. Shares of Beneficial Interest (Continued)
| | | | | | | | | | | | | | | | |
| | | Year Ended July 31, 2017 | | | Year Ended July 31, 2016 | |
| | | Shares | | | Amount | | | Shares | | | Amount | |
| Class C | | | | | | | | | | | | | | | | |
| Sold | | | 677,554 | | | $ | 6,313,913 | | | | 993,527 | | | $ | 9,389,985 | |
| Dividends and/or distributions reinvested | | | 354,830 | | | | 3,318,598 | | | | 447,407 | | | | 4,227,603 | |
| Redeemed | | | (3,062,135) | | | | (28,456,615) | | | | (2,680,931) | | | | (25,297,653) | |
| Net decrease | | | (2,029,751) | | | $ | (18,824,104) | | | | (1,239,997) | | | $ | (11,680,065) | |
| | | | | | | | | | | | | | | | |
| | | | | | | | | | | | | | | | | |
| Class Y | | | | | | | | | | | | | | | | |
| Sold | | | 2,435,390 | | | $ | 22,697,741 | | | | 1,230,343 | | | $ | 11,650,668 | |
| Dividends and/or distributions reinvested | | | 140,507 | | | | 1,309,757 | | | | 104,867 | | | | 992,069 | |
| Redeemed | | | (1,480,370) | | | | (13,736,682) | | | | (890,241) | | | | (8,395,783) | |
| Net increase | | | 1,095,527 | | | $ | 10,270,816 | | | | 444,969 | | | $ | 4,246,954 | |
| | | | | | | | | | | | | | | | |
7. Purchases and Sales of Securities
The aggregate cost of purchases and proceeds from sales of securities, other than short-term obligations, for the reporting period were as follows:
| | | | | | | | |
| | | Purchases | | | Sales | |
| Investment securities | | $ | 35,083,079 | | | $ | 59,797,183 | |
8. Fees and Other Transactions with Affiliates
Management Fees. Under the investment advisory agreement, the Fund pays the Manager a management fee based on the daily net assets of the Fund at an annual rate as shown in the following table:
| | | | |
| Fee Schedule | | | |
| Up to $200 million | | | 0.60% | |
| Next $100 million | | | 0.55 | |
| Next $200 million | | | 0.50 | |
| Next $250 million | | | 0.45 | |
| Next $250 million | | | 0.40 | |
| Over $1 billion | | | 0.35 | |
The Fund’s effective management fee for the reporting period was 0.57% of average annual net assets before any applicable waivers.
Sub-Adviser Fees. The Manager has retained the Sub-Adviser to provide the day-to-day portfolio management of the Fund. Under the Sub-Advisory Agreement, the Manager pays the Sub-Adviser an annual fee in monthly installments, equal to a percentage of the investment management fee collected by the Manager from the Fund, which shall be calculated after any investment management fee waivers. The fee paid to the Sub-Adviser is paid by the Manager, not by the Fund.
Transfer Agent Fees. OFI Global (the “Transfer Agent”) serves as the transfer and
|
| 49 OPPENHEIMER ROCHESTER NEW JERSEY MUNICIPAL FUND |
NOTES TO FINANCIAL STATEMENTS Continued
8. Fees and Other Transactions with Affiliates (Continued)
shareholder servicing agent for the Fund. The Fund pays the Transfer Agent a fee based on annual net assets, which shall be calculated after any applicable fee waivers. Fees incurred and average net assets for each class with respect to these services are detailed in the Statement of Operations and Financial Highlights, respectively.
Sub-Transfer Agent Fees. The Transfer Agent has retained Shareholder Services, Inc., a wholly-owned subsidiary of OFI (the “Sub-Transfer Agent”), to provide the day-to-day transfer agent and shareholder servicing of the Fund. Under the Sub-Transfer Agency Agreement, the Transfer Agent pays the Sub-Transfer Agent an annual fee in monthly installments, equal to a percentage of the transfer agent fee collected by the Transfer Agent from the Fund, which shall be calculated after any applicable fee waivers. The fee paid to the Sub-Transfer Agent is paid by the Transfer Agent, not by the Fund.
Trustees’ Compensation. The Fund has adopted an unfunded retirement plan (the “Plan”) for the Fund’s Independent Trustees. Benefits are based on years of service and fees paid to each Trustee during their period of service. The Plan was frozen with respect to adding new participants effective December 31, 2006 (the “Freeze Date”) and existing Plan Participants as of the Freeze Date will continue to receive accrued benefits under the Plan. Active
Independent Trustees as of the Freeze Date have each elected a distribution method with respect to their benefits under the Plan. During the reporting period, the Fund’s projected benefit obligations, payments to retired Trustees and accumulated liability were as follows:
| | | | |
| Projected Benefit Obligations Increased | | $ | — | |
| Payments Made to Retired Trustees | | | 4,286 | |
| Accumulated Liability as of July 31, 2017 | | | 30,983 | |
The Fund’s Board of Trustees (“Board”) has adopted a compensation deferral plan for Independent Trustees that enables Trustees to elect to defer receipt of all or a portion of the annual compensation they are entitled to receive from the Fund. For purposes of determining the amount owed to the Trustee under the plan, deferred amounts are treated as though equal dollar amounts had been invested in shares of the Fund or in other Oppenheimer funds selected by the Trustee. The Fund purchases shares of the funds selected for deferral by the Trustee in amounts equal to his or her deemed investment, resulting in a Fund asset equal to the deferred compensation liability. Such assets are included as a component of “Other” within the asset section of the Statement of Assets and Liabilities. Deferral of Trustees’ fees under the plan will not affect the net assets of the Fund and will not materially affect the Fund’s assets, liabilities or net investment income per share. Amounts will be deferred until distributed in accordance with the compensation deferral plan.
Distribution and Service Plan (12b-1) Fees. Under its General Distributor’s Agreement with the Fund, OppenheimerFunds Distributor, Inc. (the “Distributor”) acts as the Fund’s principal underwriter in the continuous public offering of the Fund’s classes of shares.
|
| 50 OPPENHEIMER ROCHESTER NEW JERSEY MUNICIPAL FUND |
8. Fees and Other Transactions with Affiliates (Continued)
Service Plan for Class A Shares. The Fund has adopted a Service Plan (the “Plan”) for Class A shares pursuant to Rule 12b-1 under the 1940 Act. Under the Plan, the Fund reimburses the Distributor for a portion of its costs incurred for services provided to accounts that hold Class A shares. Reimbursement is made periodically at an annual rate of up to 0.15% of the daily net assets of Class A shares of the Fund. Effective April 3, 2017, this rate changed to 0.25%. The Distributor currently uses all of those fees to pay dealers, brokers, banks and other financial institutions periodically for providing personal service and maintenance of accounts of their customers that hold Class A shares. Any unreimbursed expenses the Distributor incurs with respect to Class A shares in any fiscal year cannot be recovered in subsequent periods. Fees incurred by the Fund under the Plan are detailed in the Statement of Operations.
Distribution and Service Plans for Class B and Class C Shares. The Fund has adopted Distribution and Service Plans (the “Plans”) for Class B and Class C shares pursuant to Rule 12b-1 under the 1940 Act to compensate the Distributor for distributing those share classes, maintaining accounts and providing shareholder services. Under the Plans, the Fund pays the Distributor an annual asset-based sales charge of 0.75% on Class B and Class C shares’ daily net assets. The Fund also pays a service fee under the Plans at an annual rate of 0.15% of daily net assets. The Plans continue in effect from year to year only if the Fund’s Board of Trustees votes annually to approve their continuance at an in person meeting called for that purpose. Fees incurred by the Fund under the Plans are detailed in the Statement of Operations.
Sales Charges. Front-end sales charges and CDSC do not represent expenses of the Fund. They are deducted from the proceeds of sales of Fund shares prior to investment or from redemption proceeds prior to remittance, as applicable. The sales charges retained by the Distributor from the sale of shares and the CDSC retained by the Distributor on the redemption of shares is shown in the following table for the period indicated.
| | | | | | | | | | | | | | | | | | | | |
| Year Ended | | Class A
Front-End
Sales Charges
Retained by
Distributor | | | Class A
Contingent
Deferred
Sales Charges
Retained by
Distributor | | | Class B
Contingent
Deferred
Sales Charges
Retained by
Distributor | | | Class C
Contingent
Deferred
Sales Charges
Retained by
Distributor | | | Class Y
Contingent
Deferred
Sales Charges
Retained by
Distributor | |
| July 31, 2017 | | | $26,059 | | | | $185 | | | | $2,067 | | | | $3,278 | | | | $— | |
9. Borrowings and Other Financing
Borrowings. The Fund can borrow money from banks in amounts up to one third of its total assets (including the amount borrowed) less all liabilities and indebtedness other than borrowings (meaning that the value of those assets must be at least 300% of the amount borrowed). The Fund can use those borrowings for investment-related purposes such as purchasing portfolio securities. The Fund also may borrow to meet redemption obligations or
|
| 51 OPPENHEIMER ROCHESTER NEW JERSEY MUNICIPAL FUND |
NOTES TO FINANCIAL STATEMENTS Continued
9. Borrowings and Other Financing (Continued)
for temporary and emergency purposes. When the Fund invests borrowed money in portfolio securities, it is using a speculative investment technique known as leverage and changes in the value of the Fund’s investments will have a larger effect on its share price than if it did not borrow because of the effect of leverage.
The Fund can also use the borrowings for other investment-related purposes, including in connection with the Fund’s inverse floater investments as discussed in Note 4. The Fund may use the borrowings to reduce the leverage amount of, or unwind or “collapse” trusts that issued “inverse floaters” owned by the Fund, or in circumstances in which the Fund has entered into a shortfall and forbearance agreement with the sponsor of the inverse floater trust to meet the Fund’s obligation to reimburse the sponsor of the inverse floater for the difference between the liquidation value of the underlying bond and the amount due to holders of the short-term floating rate notes issued by the Trust. See the discussion in Note 4 (Inverse Floating Rate Securities) for additional information.
The Fund will pay interest and may pay other fees in connection with loans. If the Fund does borrow, it will be subject to greater expenses than funds that do not borrow. The interest on borrowed money and the other fees incurred in conjunction with loans are an expense that might reduce the Fund’s yield and return. Expenses incurred by the Fund with respect to interest on borrowings and commitment fees are disclosed separately or as other expenses on the Statement of Operations.
The Fund entered into a Revolving Credit and Security Agreement (the “Agreement”) with conduit lenders and Citibank N.A. which enables it to participate with certain other Oppenheimer funds in a committed, secured borrowing facility that permits borrowings of up to $2.5 billion, collectively, by the Oppenheimer Rochester Funds. To secure the loan, the Fund pledges investment securities in accordance with the terms of the Agreement. Securities held in collateralized accounts to cover these borrowings are noted in the Statement of Investments. Interest is charged to the Fund, based on its borrowings, at current commercial paper issuance rates (1.1825% at period end). The Fund pays additional fees monthly to its lender on its outstanding borrowings to manage and administer the facility and is allocated its pro-rata share of an annual structuring fee and ongoing commitment fees both of which are based on the total facility size. Total fees and interest that are included in expenses on the Fund’s Statement of Operations related to its participation in the borrowing facility during the reporting period equal 0.10% of the Fund’s average net assets on an annualized basis. The Fund has the right to prepay such loans and terminate its participation in the conduit loan facility at any time upon prior notice.
At period end, the Fund had borrowings outstanding at an interest rate of 1.1825%.
Details of the borrowings for the reporting period are as follows:
| | | | |
| Average Daily Loan Balance | | $ | 11,745,753 | |
| Average Daily Interest Rate | | | 0.891 | % |
| Fees Paid | | $ | 269,400 | |
| Interest Paid | | $ | 94,042 | |
Reverse Repurchase Agreements. The Fund may engage in reverse repurchase
|
| 52 OPPENHEIMER ROCHESTER NEW JERSEY MUNICIPAL FUND |
9. Borrowings and Other Financing (Continued)
agreements. A reverse repurchase agreement is the sale of one or more securities to a counterparty at an agreed-upon purchase price with the simultaneous agreement to repurchase those securities on a future date at a higher repurchase price. The repurchase price represents the repayment of the purchase price and interest accrued thereon over the term of the repurchase agreement. The cash received by the Fund in connection with a reverse repurchase agreement may be used for investment-related purposes such as purchasing portfolio securities or for other purposes such as those described in the preceding “Borrowings” note.
The Fund entered into a Committed Repurchase Transaction Facility (the “Facility”) with J.P. Morgan Securities LLC (the “counterparty”) which enables it to participate with certain other Oppenheimer funds in a committed reverse repurchase agreement facility that permits aggregate outstanding reverse repurchase agreements of up to $750 million, collectively. Interest is charged to the Fund on the purchase price of outstanding reverse repurchase agreements at current LIBOR rates plus an applicable spread. The Fund is also allocated its pro-rata share of an annual structuring fee based on the total Facility size and ongoing commitment fees based on the total unused amount of the Facility. The Fund retains the economic exposure to fluctuations in the value of securities subject to reverse repurchase agreements under the Facility and therefore these transactions are considered secured borrowings for financial reporting purposes. The Fund also continues to receive the economic benefit of interest payments received on securities subject to reverse repurchase agreements, in the form of a direct payment from the counterparty. These payments are included in interest income on the Statement of Operations. Total fees and interest related to the Fund’s participation in the Facility during the reporting period are included in expenses on the Fund’s Statement of Operations and equal 0.03% of the Fund’s average net assets on an annualized basis.
The securities subject to reverse repurchase agreements under the Facility are valued on a daily basis. To the extent this value, after adjusting for certain margin requirements of the Facility, exceeds the cash proceeds received, the Fund may request the counterparty to return securities equal in margin value to this excess. To the extent that the cash proceeds received exceed the margin value of the securities subject to the transaction, the counterparty may request additional securities from the Fund. The Fund has the right to declare each Wednesday as the repurchase date for any outstanding reverse repurchase agreement upon delivery of advanced notification and may also recall any security subject to such a transaction by substituting eligible securities of equal or greater margin value according to the Facility’s terms.
The Fund executed no transactions under the Facility during the reporting period.
Details of reverse repurchase agreement transactions for the reporting period are as follows:
10. Subsequent Event
Since the reporting period end there have been two hurricanes that impacted Puerto Rico and
|
| 53 OPPENHEIMER ROCHESTER NEW JERSEY MUNICIPAL FUND |
NOTES TO FINANCIAL STATEMENTS Continued
10. Subsequent Event (Continued)
the U.S. Virgin Islands causing significant damages. While the full impact of these storms is uncertain, subsequent to fiscal year end and through financial statement issuance date, the change in market value of the Fund’s investments in Puerto Rico and the U.S. Virgin Islands had a negative impact on the Fund’s net assets by less than 2.5%.
|
| 54 OPPENHEIMER ROCHESTER NEW JERSEY MUNICIPAL FUND |
REPORT OF INDEPENDENT REGISTERED PUBLIC ACCOUNTING FIRM
The Board of Trustees and Shareholders of Oppenheimer Multi-State Municipal Trust:
We have audited the accompanying statement of assets and liabilities of Oppenheimer Rochester New Jersey Municipal Fund (the Fund), a separate series of Oppenheimer Multi-State Municipal Trust, including the statement of investments, as of July 31, 2017, and the related statements of operations and cash flows for the year then ended, the statements of changes in net assets for each of the years in the two-year period then ended, and the financial highlights for each of the years in the five-year period then ended. These financial statements and financial highlights are the responsibility of the Fund’s management. Our responsibility is to express an opinion on these financial statements and financial highlights based on our audits.
We conducted our audits in accordance with the standards of the Public Company Accounting Oversight Board (United States). Those standards require that we plan and perform the audit to obtain reasonable assurance about whether the financial statements and financial highlights are free of material misstatement. An audit includes examining, on a test basis, evidence supporting the amounts and disclosures in the financial statements. Our procedures included confirmation of securities owned as of July 31, 2017, by correspondence with the custodian, and brokers, or by other appropriate auditing procedures where replies from brokers were not received. An audit also includes assessing the accounting principles used and significant estimates made by management, as well as evaluating the overall financial statement presentation. We believe that our audits provide a reasonable basis for our opinion.
In our opinion, the financial statements and financial highlights referred to above present fairly, in all material respects, the financial position of Oppenheimer Rochester New Jersey Municipal Fund as of July 31, 2017, the results of its operations and cash flows for the year then ended, the changes in its net assets for each of the years in the two-year period then ended, and the financial highlights for each of the years in the five-year period then ended, in conformity with U.S. generally accepted accounting principles.
KPMG LLP
Denver, Colorado
September 28, 2017
|
| 55 OPPENHEIMER ROCHESTER NEW JERSEY MUNICIPAL FUND |
FEDERAL INCOME TAX INFORMATION Unaudited
In early 2017, if applicable, shareholders of record received information regarding all dividends and distributions paid to them by the Fund during calendar year 2016.
None of the dividends paid by the Fund during the reporting period are eligible for the corporate dividend-received deduction. 96.84% of the dividends were derived from interest on municipal bonds and are not subject to federal income taxes. To the extent a shareholder is subject to any state or local tax laws, some or all of the dividends received may be taxable.
The foregoing information is presented to assist shareholders in reporting distributions received from the Fund to the Internal Revenue Service. Because of the complexity of the federal regulations which may affect your individual tax return and the many variations in state and local tax regulations, we recommend that you consult your tax advisor for specific guidance.
|
| 56 OPPENHEIMER ROCHESTER NEW JERSEY MUNICIPAL FUND |
PORTFOLIO PROXY VOTING POLICIES AND GUIDELINES;
UPDATES TO STATEMENTS OF INVESTMENTS Unaudited
The Fund has adopted Portfolio Proxy Voting Policies and Guidelines under which the Fund votes proxies relating to securities (“portfolio proxies”) held by the Fund. A description of the Fund’s Portfolio Proxy Voting Policies and Guidelines is available (i) without charge, upon request, by calling the Fund toll-free at 1.800.CALL OPP (225.5677), (ii) on the Fund’s website at www.oppenheimerfunds.com, and (iii) on the SEC’s website at www.sec.gov. In addition, the Fund is required to file Form N-PX, with its complete proxy voting record for the 12 months ended June 30th, no later than August 31st of each year. The Fund’s voting record is available (i) without charge, upon request, by calling the Fund toll-free at 1.800.CALL OPP (225.5677), and (ii) in the Form N-PX filing on the SEC’s website at www.sec.gov.
The Fund files its complete schedule of portfolio holdings with the SEC for the first quarter and the third quarter of each fiscal year on Form N-Q. The Fund’s Form N-Q filings are available on the SEC’s website at www.sec.gov. Those forms may be reviewed and copied at the SEC’s Public Reference Room in Washington, D.C. Information on the operation of the Public Reference Room may be obtained by calling 1-800-SEC-0330.
Householding—Delivery of Shareholder Documents
This is to inform you about OppenheimerFunds’ “householding” policy. If more than one member of your household maintains an account in a particular fund, OppenheimerFunds will mail only one copy of the fund’s prospectus (or, if available, the fund’s summary prospectus), annual and semiannual report and privacy policy. The consolidation of these mailings, called householding, benefits your fund through reduced mailing expense, and benefits you by reducing the volume of mail you receive from OppenheimerFunds. Householding does not affect the delivery of your account statements.
Please note that we will continue to household these mailings for as long as you remain an OppenheimerFunds shareholder, unless you request otherwise. If you prefer to receive multiple copies of these materials, please call us at 1.800.CALL-OPP (225-5677). You may also notify us in writing or via email. We will begin sending you individual copies of the prospectus (or, if available, the summary prospectus), reports and privacy policy within 30 days of receiving your request to stop householding.
|
| 57 OPPENHEIMER ROCHESTER NEW JERSEY MUNICIPAL FUND |
DISTRIBUTION SOURCES Unaudited
For any distribution that took place over the last six months of the Fund’s reporting period, the table below details on a per-share basis the percentage of the Fund’s total distribution payment amount that was derived from the following sources: net income, net profit from the sale of securities, and other capital sources. Other capital sources represent a return of capital. A return of capital may occur, for example, when some or all of the money that you invested in the Fund is paid back to you. A return of capital distribution does not necessarily reflect the Fund’s investment performance and should not be confused with “yield” or “income.” You should not draw any conclusions about each Fund’s investment performance from the amounts of these distributions. This information is based upon income and capital gains using generally accepted accounting principles as of the date of each distribution. Because the Fund is actively managed, the relative amount of the Fund’s total distributions derived from various sources over the calendar year may change. Please note that this information should not be used for tax reporting purposes as the tax character of distributable income may differ from the amounts used for this notification. You will receive IRS tax forms in the first quarter of each calendar year detailing the actual amount of the taxable and non-taxable portion of distributions paid to you during the tax year.
For the most current information, please go to oppenheimerfunds.com. Select your Fund, then the ’Detailed’ tab; where ‘Dividends’ are shown, the Fund’s latest pay date will be followed by the sources of any distribution, updated daily.
| | | | | | | | | | | | | | | | |
| Fund Name | | Pay Date | | | Net Income | | | Net Profit
from Sale | | | Other Capital Sources | |
| |
Oppenheimer Rochester New Jersey Municipal Fund | | | 2/21/17 | | | | 89.5% | | | | 0.3% | | | | 10.2% | |
| |
Oppenheimer Rochester New Jersey Municipal Fund | | | 5/23/17 | | | | 85.7% | | | | 0.0% | | | | 14.3% | |
| |
Oppenheimer Rochester New Jersey Municipal Fund | | | 6/27/17 | | | | 14.4% | | | | 0.0% | | | | 85.6% | |
| |
Oppenheimer Rochester New Jersey Municipal Fund | | | 7/25/17 | | | | 43.9% | | | | 0.0% | | | | 56.1% | |
| |
|
| 58 OPPENHEIMER ROCHESTER NEW JERSEY MUNICIPAL FUND |
TRUSTEES AND OFFICERS Unaudited
| | |
Name, Position(s) Held with the Fund, Length of Service, Year of Birth | | Principal Occupation(s) During the Past 5 Years; Other Trusteeships/Directorships Held; Number of
Portfolios in the Fund Complex Currently Overseen |
| |
| INDEPENDENT TRUSTEES | | The address of each Trustee in the chart below is 6803 S. Tucson Way, Centennial, Colorado 80112-3924. Each Trustee serves for an indefinite term, or until his or her resignation, retirement, death or removal. |
| |
Brian F. Wruble, Chairman of the Board of Trustees (since 2007) and Trustee (since 2005) Year of Birth: 1943 | | Governor of Community Foundation of the Florida Keys (non-profit) (since July 2012); Director of TCP Capital, Inc. (since November 2015); Chairman Emeritus of the Board of Trustees (since August 2011), Chairman of the Board of Trustees (August 2007-August 2011), Trustee of the Board of Trustees (since August 1991) of The Jackson Laboratory (non-profit); Member of Zurich Insurance Group’s Investment Management Advisory Council (insurance) (October 2004-February 2017); Treasurer (since 2007) and Trustee (since May 1992) of the Institute for Advanced Study (non-profit educational institute); Director of Special Value Opportunities Fund, LLC (registered investment company) (affiliate of the Sub- Adviser’s parent company) (September 2004-June 2015); General Partner of Odyssey Partners, L.P. (hedge fund) (September 1995-December 2007); Special Limited Partner of Odyssey Investment Partners, LLC (private equity investment) (January 1999-September 2004). Oversees 57 portfolios in the OppenheimerFunds complex. Mr. Wruble has served on the Boards of certain Oppenheimer funds since April 2001, during which time he has become familiar with the Fund’s (and other Oppenheimer funds’) financial, accounting, regulatory and investment matters and has contributed to the Boards’ deliberations. |
| |
Beth Ann Brown, Trustee (since 2016) Year of Birth: 1968 | | Advisor, Board of Advisors of Caron Engineering Inc. (since December 2014); Independent Consultant (since September 2012); held the following positions at Columbia Management Investment Advisers LLC: Head of Intermediary Distribution (2008-2012), Managing Director, Strategic Relations (2005-2008), Managing Director, Head of National Accounts (2004-2005); Senior Vice President, National Account Manager (2002-2004), Senior Vice President, Key Account Manager (1999-2002) and Vice President, Key Account Manager (1996-1999) of Liberty Funds Distributor, Inc.; President and Director, of Acton Shapleigh Youth Conservation Corps (non -profit) (2012-2015); and Vice President and Director of Grahamtastic Connection (non-profit) (since May 2013). Oversees 57 portfolios in the OppenheimerFunds complex. Ms. Brown has served on the Boards of certain Oppenheimer funds since January 2016, during which time she has become familiar with the Fund’s (and other Oppenheimer funds’) financial, accounting, regulatory and investment matters and has contributed to the Boards’ deliberations. |
| |
Edmund P. Giambastiani, Jr., Trustee (since 2013) Year of Birth: 1948 | | Advisory Board Member of the Maxwell School of Citizenship and Public Affairs of Syracuse University (since April 2012); Director of Mercury Defense Systems Inc. (information technology) (August 2011-February 2013); Trustee of the U.S. Naval Academy Foundation Athletic & Scholarship Program (since November 2010); Advisory Board Member of the Massachusetts Institute of Technology Lincoln Laboratory (federally-funded research development center) (since May 2010); Director of The Boeing Company (aerospace and defense) (since October 2009); Trustee of MITRE Corporation (federally-funded research development center) (since September 2008); Independent Director of QinetiQ Group Plc (defense technology and security) (February 2008-August 2011); Chairman of Monster Worldwide, Inc. (on-line career services) (March 2015-November 2016), |
|
| 59 OPPENHEIMER ROCHESTER NEW JERSEY MUNICIPAL FUND |
TRUSTEES AND OFFICERS Unaudited / Continued
| | |
Edmund P. Giambastiani, Jr., Continued | | Director of Monster Worldwide, Inc. (on-line career services) (February 2008-June 2011); Lead Director (June 2011-March 2015); Chairman of Alenia North America, Inc. (military and defense products) (January 2008-October 2009); Director of SRA International, Inc. (information technology and services) (January 2008-July 2011); President of Giambastiani Group LLC (national security and energy consulting) (since October 2007); United States Navy, career nuclear submarine officer (June 1970-October 2007), Vice Chairman of the Joint Chiefs of Staff (2005-October 2007), Supreme Allied Commander of NATO Commander Transformation (2003-2005), Commander, U.S. Joint Forces Command (2002-2005). Since his retirement from the U.S. Navy in October 2007, Admiral Giambastiani has also served on numerous U.S. Government advisory boards, investigations and task forces for the Secretaries of Defense, State and Interior and the Central Intelligence Agency. He recently completed serving as a federal commissioner on the Military Compensation and Retirement Modernization Commission. Oversees 57 portfolios in the OppenheimerFunds complex. Admiral Giambastiani has served on the Boards of certain Oppenheimer funds since February 2013, during which time he has become familiar with the Fund’s (and other Oppenheimer funds’) financial, accounting, regulatory and investment matters and has contributed to the Boards’ deliberations. For purposes of this report, Admiral Giambastiani is identified as a Trustee. |
| |
Elizabeth Krentzman, Trustee (since 2014) Year of Birth: 1959 | | Director of Cartica Management, LLC Funds (private investment funds) (since 2017); Trustee of University of Florida Law Center Association, Inc. (since 2016); Member of University of Florida Law Advisory Board, Washington, DC Alumni Group (since 2015); Advisory Board Member of the Securities and Exchange Commission Historical Society (since 2007); held the following positions at Deloitte & Touche LLP: Principal and Chief Regulatory Advisor for Asset Management Services (2007 - 2014) and U.S. Mutual Fund Leader (2011 - 2014); General Counsel of the Investment Company Institute (trade association) (June 2004 - April 2007); held the following positions at Deloitte & Touche LLP: National Director of the Investment Management Regulatory Consulting Practice (1997 - 2004), Principal (2003 - 2004), Director (1998 - 2003) and Senior Manager (1997 - 1998); Assistant Director of the Division of Investment Management - Office of Disclosure and Investment Adviser Regulation of the U.S. Securities and Exchange Commission (1996 - 1997) and various positions with the Division of Investment Management – Office of Regulatory Policy (1991 - 1996) of the U.S. Securities and Exchange Commission; Associate at Ropes & Gray LLP (1987 – 1991). Oversees 57 portfolios in the OppenheimerFunds complex. Ms. Krentzman has served on the Boards of certain Oppenheimer funds since August 2014, during which time she has become familiar with the Fund’s (and other Oppenheimer funds’) financial, accounting, regulatory and investment matters and has contributed to the Boards’ deliberations. |
| |
Mary F. Miller, Trustee (since 2004) Year of Birth: 1942 | | Trustee of International House (not-for-profit) (since June 2007); Trustee of the American Symphony Orchestra (not-for-profit) (October 1998-November 2011); and Senior Vice President and General Auditor of American Express Company (financial services company) (July 1998-February 2003). Oversees 57 portfolios in the OppenheimerFunds complex. Ms. Miller has served on the Boards of certain Oppenheimer funds since August 2004, during which time she has become familiar with the Fund’s (and other Oppenheimer funds’) financial, accounting, regulatory and investment matters and has contributed to the Boards’ deliberations. |
|
| 60 OPPENHEIMER ROCHESTER NEW JERSEY MUNICIPAL FUND |
| | |
Joel W. Motley, Trustee (since 2002) Year of Birth: 1952 | | Director of Office of Finance Federal Home Loan Bank (since September 2016); Director of Greenwall Foundation (since October 2013); Member of Board and Investment Committee of The Greenwall Foundation (since April 2013); Member of the Vestry of Trinity Wall Street (since April 2012); Director of Southern Africa Legal Services Foundation (since March 2012); Board Member of Pulitzer Center for Crisis Reporting (non-profit journalism) (since March 2011); Managing Director of Public Capital Advisors, LLC (privately-held financial advisor) (since January 2006); Managing Director of Carmona Motley, Inc. (privately-held financial advisor) (since January 2002); Director of Columbia Equity Financial Corp. (privately-held financial advisor) (2002-2007); Managing Director of Carmona Motley Hoffman Inc. (privately-held financial advisor) (January 1998-December 2001); Member of the Finance and Budget Committee of the Council on Foreign Relations, Member of the Investment Committee and Board of Human Rights Watch (since July 2000) and Member of the Investment Committee and Board of Historic Hudson Valley (since February 2010). Oversees 57 portfolios in the OppenheimerFunds complex. Mr. Motley has served on the Boards of certain Oppenheimer funds since October 2002, during which time he has become familiar with the Fund’s (and other Oppenheimer funds’) financial, accounting, regulatory and investment matters and has contributed to the Boards’ deliberations. |
| |
Joanne Pace, Trustee (since 2013) Year of Birth: 1958 | | Advisory Board Director of Massey Quick and Company, LLC (since October 2014); Board Director of Horizon Blue Cross Blue Shield of New Jersey (since November 2012); Advisory Board Director of The Alberleen Group LLC (since March, 2012); Board Member (since January 2015), Board Member of 100 Women in Hedge Funds (non-profit) (since January 2015); Advisory Council Member of Morgan Stanley Children’s Hospital (non-profit) (since May, 2012); Senior Advisor of SECOR Asset Management, LP (2010-2011); Managing Director and Chief Operating Officer of Morgan Stanley Investment Management (2006-2010); Partner and Chief Operating Officer of FrontPoint Partners, LLC (hedge fund) (2005-2006); held the following positions at Credit Suisse: Managing Director (2003-2005); Global Head of Human Resources and member of Executive Board and Operating Committee (2004-2005), Global Head of Operations and Product Control (2003- 2004); held the following positions at Morgan Stanley: Managing Director (1997- 2003), Controller and Principal Accounting Officer (1999-2003); Chief Financial Officer (temporary assignment) for the Oversight Committee, Long Term Capital Management (1998-1999). Lead Independent Director and Chair of the Audit and Nominating Committee of The Global Chartist Fund, LLC of Oppenheimer Asset Management (2011-2012); Board Director of Managed Funds Association (2008- 2010); Board Director of Morgan Stanley Foundation (2007-2010) and Investment Committee Chair (2008-2010). Oversees 57 portfolios in the OppenheimerFunds complex. Ms. Pace has served on the Boards of certain Oppenheimer funds since November 2012, including as an Advisory Board Member for certain Oppenheimer funds, during which time she has become familiar with the Fund’s (and other Oppenheimer funds’) financial, accounting, regulatory and investment matters and has contributed to the Board’s deliberations. For purposes of this report, Ms. Pace is identified as a Trustee. |
|
| 61 OPPENHEIMER ROCHESTER NEW JERSEY MUNICIPAL FUND |
TRUSTEES AND OFFICERS Unaudited / Continued
| | |
Daniel Vandivort, Trustee (since 2014) Year of Birth: 1954 | | Chairman and Lead Independent Director/Trustee (March 2010-September 2014), Chairman of the Audit Committee (March 2009-September 2014) and Director/ Trustee (December 2008-September 2014) of the Board of Directors/Trustees of Value Line Funds; Trustee, Board of Trustees of Huntington Disease Foundation of America (since January 2015 and June 2007-December 2013) and Treasurer, Chairman of the Audit and Finance Committee (since January 2016); Trustee, Board of Trustees, RIM Retirement Savings Plan (2005-2007); President and Chief Investment Officer, Robeco Investment Management, formerly known as Weiss Peck and Greer (January 2005-June 2007); Member, Management Committee of Robeco Investment Management (2001-2007); Chairman and Trustee of the Board of Trustees of Weiss, Peck and Greer Funds (2004-2005); Managing Director and Head of Fixed Income, Weiss, Peck and Greer (November 1994-January 2005); Managing Director and Head of Fixed Income, CS First Boston Investment Management (January 1992-November 1994); Director, Global Product Development, First Boston Asset Management (November 1989 to January 1992); Vice President, Fixed Income Sales, First Boston Corp. (May 1984-November 1989). Oversees 57 portfolios in the OppenheimerFunds complex. Mr. Vandivort has served on the Boards of certain Oppenheimer funds since 2014, during which time he has become familiar with the Fund’s (and other Oppenheimer funds’) financial, accounting, regulatory and investment matters and has contributed to the Boards’ deliberations. |
| | | |
INTERESTED TRUSTEE AND OFFICER | | Mr. Steinmetz is an “Interested Trustee” because he is affiliated with the Manager and the Sub-Adviser by virtue of his positions as Chairman of the Sub-Adviser and officer and director of the Manager. Both as a Trustee and as an officer, Mr. Steinmetz serves for an indefinite term, or until his resignation, retirement, death or removal. Mr. Steinmetz’s address is 225 Liberty Street, New York, New York 10281-1008. |
| |
Arthur P. Steinmetz, Trustee (since 2015), President and Principal Executive Officer (since 2014) Year of Birth: 1958 | | Chairman of the Sub-Adviser (since January 2015); CEO and Chairman of the Manager (since July 2014), President of the Manager (since May 2013), a Director of the Manager (since January 2013), Director of the Sub-Adviser (since July 2014), President, Management Director and CEO of Oppenheimer Acquisition Corp. (the Sub-Adviser’s parent holding company) (since July 2014), and President and Director of OFI SteelPath, Inc. (since January 2013). Chief Investment Officer of the OppenheimerFunds advisory entities from (January 2013-December 2013); Executive Vice President of the Manager (January 2013-May 2013); Chief Investment Officer of the Sub-Adviser (October 2010-December 2012); Chief Investment Officer, Fixed-Income, of the Sub-Adviser (April 2009-October 2010); Executive Vice President of the Sub-Adviser (October 2009-December 2012); Director of Fixed Income of the Sub-Adviser (January 2009-April 2009); and a Senior Vice President of the Sub-Adviser (March 1993-September 2009). An officer of 101 portfolios in the OppenheimerFunds complex. |
| OTHER OFFICERS OF THE FUND | | The addresses of the Officers in the chart below are as follows: for Messrs. Cottier, Willis, DeMitry, Camarella, Pulire, Stein, Mss. Mossow, Lo Bessette, Foxson and Picciotto, 225 Liberty Street, New York, New York 10281-1008, for Mr. Petersen, 6803 S. Tucson Way, Centennial, Colorado 80112-3924. Each Officer serves for an indefinite term or until his or her resignation, retirement, death or removal. |
| OTHER OFFICERS OF THE FUND | | The addresses of the Officers in the chart below are as follows: for Messrs. Cottier, Willis, DeMitry, Camarella, Pulire, Stein, Mss. Mossow, Lo Bessette, Foxson and Picciotto, 225 Liberty Street, New York, New York 10281-1008, for Mr. Petersen, 6803 S. Tucson Way, Centennial, Colorado 80112-3924. Each Officer serves for an indefinite term or until his or her resignation, retirement, death or removal. |
| |
Scott S. Cottier, Vice President (since 2005) Year of Birth: 1971 | | Senior Vice President of the Sub-Adviser (since January 2017) and a Senior Portfolio Manager (since September 2002). Vice President of the Sub-Adviser (September 2002-January 2017). Portfolio Manager and trader at Victory Capital Management (1999-2002). Team Leader, a Senior Portfolio Manager, an officer and a trader for the Fund and other Oppenheimer funds. |
|
| 62 OPPENHEIMER ROCHESTER NEW JERSEY MUNICIPAL FUND |
| | |
Troy E. Willis, Vice President (since 2005) Year of Birth: 1972 | | Senior Vice President of the Sub-Adviser (since January 2017) and a Senior Portfolio Manager (since January 2006); Vice President of the Sub-Adviser (July 2009-January 2017); Assistant Vice President of the Sub-Adviser (July 2005- June 2009). Portfolio Manager of the Sub-Adviser (June 2002-December 2005). Corporate Attorney for Southern Resource Group (June 1999-July 2001). Team Leader, a Senior Portfolio Manager, an officer and a trader for the Fund and other Oppenheimer funds. |
| |
Mark R. DeMitry, Vice President (since 2009) Year of Birth: 1976 | | Vice President of the Sub-Adviser and a Senior Portfolio Manager (since July 2009); Associate Portfolio Manager of the Fund (September 2006- June 2009). Research Analyst of the Sub-Adviser (June 2003-September 2006) and a Credit Analyst of the Sub-Adviser (July 2001-May 2003). Senior Portfolio Manager, an officer and a trader for the Fund and other Oppenheimer funds. |
| |
Michael L. Camarella. Vice President (since 2009) Year of Birth: 1976 | | Vice President of the Sub-Adviser and a Senior Portfolio Manager (since January 2011); Assistant Vice President of the Sub-Adviser (July 2009-December 2010); Associate Portfolio Manager of the Sub-Adviser (January 2008-December 2010). Research Analyst of the Sub-Adviser (April 2006-December 2007) and a Credit Analyst of the Sub-Adviser (June 2003-March 2006). Senior Portfolio Manager, an officer and a trader for the Fund and other Oppenheimer funds. |
| |
Charles S. Pulire, Vice President (since 2011) Year of Birth: 1977 | | Vice President of the Sub-Adviser and a Senior Portfolio Manager (since February 2013); Assistant Vice President of the Sub-Adviser (December 2010-January 2013); Research Analyst of the Manager (February 2008-November 2010); Credit Analyst of the Sub-Adviser (May 2006-January 2008). Senior Portfolio Manager, an officer and a trader for the Fund and other Oppenheimer funds. |
| |
Elizabeth S. Mossow, Vice President (since 2016) Year of Birth: 1978 | | Vice President of the Sub-Adviser (since January 2016) and Senior Portfolio Manager of the Sub-Adviser (since January 2017); Portfolio Manager of the Sub- Adviser (January 2016-January 2017); Assistant Vice President of the Sub-Adviser (January 2011-January 2016). Associate Portfolio Manager (June 2013-January 2016). Research Analyst of the Sub-Adviser (June 2011-June 2013) and was a Credit Analyst of the Sub-Adviser (May 2007-May 2011). Portfolio Manager, an officer and a trader for the Fund and other Oppenheimer funds. |
| |
Richard A. Stein, Vice President (since 2007) Year of Birth: 1957 | | Director of the Rochester Credit Analysis team (since March 2004); Senior Vice President of the Sub-Adviser (since June 2011) and a Vice President of the Sub- Adviser (November 1997-May 2011); heads up the Rochester Credit Analysis team (since May 1993). |
| |
Cynthia Lo Bessette, Secretary and Chief Legal Officer (since 2016) Year of Birth: 1969 | | Executive Vice President, General Counsel and Secretary of the Manager (since February 2016); Senior Vice President and Deputy General Counsel of the Manager (March 2015-February 2016); Chief Legal Officer of the Sub-Adviser and the Distributor (since February 2016); Vice President, General Counsel and Secretary of Oppenheimer Acquisition Corp. (since February 2016); General Counsel of OFI SteelPath, Inc., VTL Associates, LLC and Index Management Solutions, LLC (since February 2016); Chief Legal Officer of OFI Global Institutional, Inc., HarbourView Asset Management Corporation, OFI Global Trust Company, Oppenheimer Real Asset Management, Inc., OFI Private Investments Inc., Shareholder Services, Inc. and Trinity Investment Management Corporation (since February 2016); Corporate Counsel (February 2012-March 2015) and Deputy Chief Legal Officer (April 2013-March 2015) of Jennison Associates LLC; Assistant General Counsel (April 2008-September 2009) and Deputy General Counsel (October 2009-February 2012) of Lord Abbett & Co. LLC. An officer of 101 portfolios in the OppenheimerFunds complex. |
|
| 63 OPPENHEIMER ROCHESTER NEW JERSEY MUNICIPAL FUND |
TRUSTEES AND OFFICERS Unaudited / Continued
| | |
Jennifer Foxson, Vice President and Chief Business Officer (since 2014) Year of Birth: 1969 | | Senior Vice President of OppenheimerFunds Distributor, Inc. (since June 2014); Vice President of OppenheimerFunds Distributor, Inc. (April 2006-June 2014); Vice President of the Sub-Adviser (January 1998-March 2006); Assistant Vice President of the Sub-Adviser (October 1991-December 1998). An officer of 101 portfolios in the OppenheimerFunds complex. |
| |
Mary Ann Picciotto, Chief Compliance Officer and Chief Anti-Money Laundering Officer (since 2014) Year of Birth: 1973 | | Senior Vice President and Chief Compliance Officer of the Manager (since March 2014); Chief Compliance Officer of the Sub-Adviser, OFI SteelPath, Inc., OFI Global Trust Company, OFI Global Institutional, Inc., Oppenheimer Real Asset Management, Inc., OFI Private Investments, Inc., Harborview Asset Management Corporation, Trinity Investment Management Corporation, and Shareholder Services, Inc. (since March 2014); Managing Director of Morgan Stanley Investment Management Inc. and certain of its various affiliated entities; Chief Compliance Officer of various Morgan Stanley Funds (May 2010-January 2014); Chief Compliance Officer of Morgan Stanley Investment Management Inc. (April 2007-January 2014). An officer of 101 portfolios in the OppenheimerFunds complex. |
| |
Brian S. Petersen, Treasurer and Principal Financial & Accounting Officer (since 2016) Year of Birth: 1970 | | Senior Vice President of the Manager (since January 2017); Vice President of the Manager (January 2013-January 2017); Vice President of the Sub-Adviser (February 2007-December 2012); Assistant Vice President of the Sub-Adviser (August 2002- 2007). An officer of 101 portfolios in the OppenheimerFunds complex. |
The Fund’s Statement of Additional Information contains additional information about the Fund’s Trustees and Officers and is available without charge upon request by calling 1.800.CALL OPP (225.5677).
|
| 64 OPPENHEIMER ROCHESTER NEW JERSEY MUNICIPAL FUND |
OPPENHEIMER ROCHESTER NEW JERSEY MUNICIPAL FUND
| | |
| Manager | | OFI Global Asset Management, Inc. |
| |
| Sub-Adviser | | OppenheimerFunds, Inc. |
| |
| Distributor | | OppenheimerFunds Distributor, Inc. |
| |
| Transfer and Shareholder | | OFI Global Asset Management, Inc. |
| Servicing Agent | | |
| |
| Sub-Transfer Agent | | Shareholder Services, Inc. |
| | DBA OppenheimerFunds Services |
| |
| Independent Registered | | KPMG LLP |
| Public Accounting Firm | | |
© 2017 OppenheimerFunds, Inc. All rights reserved.
|
| 65 OPPENHEIMER ROCHESTER NEW JERSEY MUNICIPAL FUND |
PRIVACY POLICY NOTICE
As an Oppenheimer fund shareholder, you are entitled to know how we protect your personal information and how we limit its disclosure.
Information Sources
We obtain nonpublic personal information about our shareholders from the following sources:
| ● | | Applications or other forms |
| ● | | When you create a user ID and password for online account access |
| ● | | When you enroll in eDocs Direct,SM our electronic document delivery service |
| ● | | Your transactions with us, our affiliates or others |
| ● | | Technologies on our website, including: “cookies” and web beacons, which are used to collect data on the pages you visit and the features you use. |
If you visit oppenheimerfunds.com and do not log on to the secure account information areas, we do not obtain any personal information about you. When you do log on to a secure area, we do obtain your user ID and password to identify you. We also use this information to provide you with products and services you have requested, to inform you about products and services that you may be interested in and assist you in other ways.
We do not collect personal information through our website unless you willingly provide it to us, either directly by email or in those areas of the website that request information. In order to update your personal information (including your mailing address, email address and phone number) you must first log on and visit your user profile.
If you have set your browser to warn you before accepting cookies, you will receive the warning message with each cookie. You can refuse cookies by turning them off in your browser. However, doing so may limit your access to certain sections of our website.
We use cookies to help us improve and manage our website. For example, cookies help us recognize new versus repeat visitors to the site, track the pages visited, and enable some special features on the website. This data helps us provide a better service for our website visitors.
Protection of Information
We do not disclose any non-public personal information (such as names on a customer list) about current or former customers to anyone, except as permitted by law.
Disclosure of Information
Copies of confirmations, account statements and other documents reporting activity in your fund accounts are made available to your financial advisor (as designated by you). We may also use details about you and your investments to help us, our financial service affiliates, or firms that jointly market their financial products and services with ours, to better serve your investment needs or suggest educational material that may be of interest to you. If this requires us to provide you with an opportunity to “opt in” or “opt out” of such information sharing with a firm not affiliated with us, you will receive notification on how to do so, before any such sharing takes place.
Right of Refusal
We will not disclose your personal information to unaffiliated third parties (except as permitted by law), unless we first offer you a reasonable opportunity to refuse or “opt out” of such disclosure.
|
| 66 OPPENHEIMER ROCHESTER NEW JERSEY MUNICIPAL FUND |
Internet Security and Encryption
In general, the email services provided by our website are encrypted and provide a secure and private means of communication with us. To protect your own privacy, confidential and/or personal information should only be communicated via email when you are advised that you are using a secure website. As a security measure, we do not include personal or account information in non-secure emails, and we advise you not to send such information to us in non-secure emails. Instead, you may take advantage of the secure features of our website to encrypt your email correspondence. To do this, you will need to use a browser that supports Secure Sockets Layer (SSL) protocol.
| ● | | All transactions, including redemptions, exchanges and purchases, are secured by SSL and 256-bit encryption. SSL is used to establish a secure connection between your PC and OppenheimerFunds’ server. It transmits information in an encrypted and scrambled format. |
| ● | | Encryption is achieved through an electronic scrambling technology that uses a “key” to code and then decode the data. Encryption acts like the cable converter box you may have on your television set. It scrambles data with a secret code so that no one can make sense of it while it is being transmitted. When the data reaches its destination, the same software unscrambles the data. |
| ● | | You can exit the secure area by either closing your browser, or for added security, you can use the Log Out button before you close your browser. |
Other Security Measures
We maintain physical, electronic and procedural safeguards to protect your personal account information. Our employees and agents have access to that information only so that they may offer you products or provide services, for example, when responding to your account questions.
How You Can Help
You can also do your part to keep your account information private and to prevent unauthorized transactions. If you obtain a user ID and password for your account, safeguard that information. Also, take special precautions when accessing your account on a computer used by others.
Who We Are
This joint notice describes the privacy policies of the Oppenheimer funds, OppenheimerFunds, Inc., each of its investment adviser subsidiaries, OppenheimerFunds Distributor, Inc. and OFI Global Trust Co. It applies to all Oppenheimer fund accounts you presently have, or may open in the future, using your Social Security number—whether or not you remain a shareholder of our funds. This notice was last updated November 2016. In the event it is updated or changed, we will post an updated notice on our website at oppenheimerfunds.com. If you have any questions about this privacy policy, write to us at P.O. Box 5270, Denver, CO 80217-5270, email us by clicking on the Contact Us section of our website at oppenheimerfunds.com or call us at 1.800.CALL OPP (225.5677).
|
| 67 OPPENHEIMER ROCHESTER NEW JERSEY MUNICIPAL FUND |
THIS PAGE INTENTIONALLY LEFT BLANK.
|
| 68 OPPENHEIMER ROCHESTER NEW JERSEY MUNICIPAL FUND |
THIS PAGE INTENTIONALLY LEFT BLANK.
|
| 69 OPPENHEIMER ROCHESTER NEW JERSEY MUNICIPAL FUND |
THIS PAGE INTENTIONALLY LEFT BLANK.
|
| 70 OPPENHEIMER ROCHESTER NEW JERSEY MUNICIPAL FUND |
THIS PAGE INTENTIONALLY LEFT BLANK.
|
| 71 OPPENHEIMER ROCHESTER NEW JERSEY MUNICIPAL FUND |

OppenheimerFunds®
The Right Way
to Invest
Visit us at oppenheimerfunds.com for 24-hr access to account information and transactions or call us at 800.CALL OPP (800.225.5677) for 24-hr automated information and automated transactions. Representatives also available Mon–Fri 8am-8pm ET.
| | |
Visit Us oppenheimerfunds.com Call Us 800 225 5677 | | |
Follow Us 
| | Oppenheimer funds are distributed by OppenheimerFunds Distributor, Inc. 225 Liberty Street, New York, NY 10281-1008 © 2017 OppenheimerFunds Distributor, Inc. All rights reserved. RA0395.001.0717 September 26, 2017 |
| | | | | | | | |
| | Annual Report | | | 7/31/2017 | | | |
| | | | | |
| | 
| | | | | | |
| | Oppenheimer Rochester ® Pennsylvania Municipal Fund | | | | | | |
| | | | | | | | |
| | | | | | | | |
| | | | | | | | |
Table of Contents
Class A Shares
AVERAGE ANNUAL TOTAL RETURNS AT 7/31/17
| | | | | | |
| | | Class A Shares of the Fund | | |
| | | Without Sales Charge | | With Sales Charge | | Bloomberg Barclays
Municipal Bond Index |
| 1-Year | | 2.96% | | -1.93% | | 0.26% |
| 5-Year | | 3.77 | | 2.76 | | 3.10 |
| 10-Year | | 3.89 | | 3.39 | | 4.60 |
Performance data quoted represents past performance, which does not guarantee future results. The investment return and principal value of an investment in the Fund will fluctuate so that an investor’s shares, when redeemed, may be worth more or less than their original cost. Fund returns include changes in share price, reinvested distributions, and a 4.75% maximum applicable sales charge except where “without sales charge” is indicated. Current performance may be lower or higher than the performance quoted. Returns do not consider capital gains or income taxes on an individual’s investment. For performance data current to the most recent month-end, visit oppenheimerfunds.com or call 1.800.CALL OPP (225.5677).
Our Twitter handle is @RochesterFunds.
|
| 2 OPPENHEIMER ROCHESTER PENNSYLVANIA MUNICIPAL FUND |
Fund Performance Discussion
Oppenheimer Rochester Pennsylvania Municipal Fund continued to generate attractive levels of tax-free income during the most recent reporting period. As of July 31, 2017, the Class A shares provided a distribution yield at net asset value (NAV) of 4.80% and a yield-driven, 12-month total return of 2.96% at NAV. Over the same period, the Fund’s benchmark, the Bloomberg Barclays Municipal Bond Index, provided a total return of 0.26%. Tax-free income comprised 100% of the total return this reporting period.
MARKET OVERVIEW
During this reporting period, U.S. equities rallied and yields on AAA-rated municipal bonds and Treasury securities improved. The price declines in the municipal bond market, which were most notable immediately after Election Day, depressed the total return of this Fund’s benchmark, which is a widely used index of the performance of the general muni market.
On June 14, 2017, the Fed Funds target rate was raised by one-quarter of 1 percentage point to a range of 1.00% to 1.25%, and the
| | |
The average distribution yield in Lipper’s Pennsylvania Municipal Debt Funds category was 3.24% at the end of this reporting period. At 4.80%, the distribution yield at NAV for this Fund’s Class A shares was 156 basis points higher than the category average. | | |
Federal Reserve Open Market Committee (FOMC) signaled plans for one more rate increase in 2017. Citing continued U.S. economic growth and job market strength,
| | | | |
YIELDS & DISTRIBUTIONS FOR CLASS A SHARES | | | | |
| Dividend Yield w/o sales charge | | | 4.80% | |
| Dividend Yield with sales charge | | | 4.58 | |
| Standardized Yield | | | 2.91 | |
| Taxable Equivalent Yield | | | 5.32 | |
| Last distribution (7/25/17) | | $ | 0.042 | |
| Total distributions (8/1/16 to 7/31/17) | | $ | 0.544 | |
Endnotes for this discussion begin on page 16 of this report.
|
| 3 OPPENHEIMER ROCHESTER PENNSYLVANIA MUNICIPAL FUND |
the Fed also announced it would begin to reduce its $4.5 trillion holdings of bonds and other securities later this year.
Federal Reserve Open Market Committee (FOMC) signaled plans for one more rate increase in 2017. Citing continued U.S. economic growth and job market strength, the Fed also announced it would begin to reduce its $4.5 trillion holdings of bonds and other securities later this year.
At the July 26, 2017 meeting, the FOMC announced its decision to maintain the target range for the Fed Funds rate to the range that had been set in June. According to the Fed’s press release, the FOMC “expects that economic conditions will evolve in a manner that will warrant gradual increases” to the Fed Funds rate. Additionally, the “balance sheet normalization program” for reducing its holdings will begin “relatively soon, provided the economy evolves broadly as anticipated.”
The benchmark interest rate was raised in December 2016 and in March 2017, each time by one-quarter of 1 percentage point. At a press conference after the March 2017 meeting, Chairman Janet Yellen said “The simple message is—the economy is doing well. The unemployment rate has moved way down, and many more people are feeling optimistic about their labor prospects.”
From December 2008 until December 2015, the key rate was held to a range of zero to 0.25%.
We remind investors that a change in the Fed Funds rate does not automatically translate into a change in longer-term interest rates, which are determined by the marketplace. During this reporting period, the muni market’s reactions to the Fed’s moves did not appear to be especially significant or lasting. This Fund’s portfolio managers do not adjust their investment style in response to Fed actions.
The yield curve for high-grade municipal bonds was higher at the end of this reporting period than on July 29, 2016, the last business day of the previous reporting period. The median yield on 30-year, AAA-rated muni bonds stood at 2.89% on July 31, 2017, up 62 basis points from July 29, 2016. The median yield on 10-year, AAA-rated muni bonds was 2.07% on July 31, 2017, up 62 basis points from the July 2016 date, and the median yield on 1-year, AAA-rated muni bonds was 0.85%, up 40 basis points from the July 2016 date.
The Treasury yield curve also was higher at the end of the reporting period than on July 29, 2016. While the Treasury yield curve maintained its shape – moving up uniformly – the muni yield curve steepened as the yields on longer-term munis rose more than the yields on shorter-term munis. While a steepening yield curve reflects investors’ expectations for a stronger economy and, perhaps, rising inflation, we note that high-grade munis with maturities of 15 years or more continued to offer taxpayers in all federal tax brackets more favorable
|
| 4 OPPENHEIMER ROCHESTER PENNSYLVANIA MUNICIPAL FUND |
after-tax yields than Treasury securities with comparable maturities; Treasury bonds are backed by the full faith and credit of the U.S. government.
This reporting period was also characterized by credit spread tightening, which occurs when the difference between yields on low-rated municipal bonds and higher-rated bonds decreases. As credit spreads tighten, investments in BBB-rated, lower-rated and unrated securities typically outperform municipal securities with higher credit ratings.
On June 30, 2017, the Pennsylvania House and Senate passed a $32 billion budget that raised state spending by $500 million. Gov. Tom Wolf allowed the budget to become law without his signature, as lawmakers were unable to agree on how to pay for $2 billion of the spending plan. With business tax receipts down, revenues are growing by 1 percent while expenses are growing by 4 percent. As of July 31, 2017, hundreds of millions of dollars in aid to universities was still awaiting the passage of a revenue plan.
In June 2017, Gov. Wolf signed a pension overhaul compromise bill that will enable future state hires to choose between a traditional benefit plan and a hybrid that has a 401(k)-style component. The change will affect new employees beginning in 2019. Officials have said that the move could save Pennsylvania $5 billion to $20 billion over 30 years, depending on investment performance.
S&P Global Ratings (S&P) changed its rating on the general obligation (G.O.) debt of the City of Scranton to BB-plus, from BB. S&P cited the city’s improved budget flexibility and liquidity, stemming largely from the sale of a sewer system; the transaction enabled Scranton to retire more than $40 million of high-coupon debt. The city also suspended its cost-of-living-adjustments and said it intends to apply a portion of sewer sale proceeds to pension funding.
The Pennsylvania Turnpike Commission (PTC) approved a 6 percent toll increase for both E-Z Pass and cash customers, effective January 8, 2017. The toll increase will be applied to the debt-service obligations of the PTC’s revenue-backed bonds.
Philadelphia International Airport is slated to receive nearly $900 million in infrastructure improvements under an agreement forged by city officials and airline carriers. The project features $396 million in maintenance and repairs for the airport, which is owned by the City of Philadelphia. A total of $197 million for a new air traffic control tower is being contributed by American Airlines. It is estimated that the airport generates $225 million in tax revenue for Pennsylvania and $78 million for Philadelphia annually.
In October 2016, the School Reform Commission of Philadelphia approved resolutions to restructure $1.5 billion of existing bond debt, for a savings of roughly $140 million. The District converted some of its bonds with flexible interest rates into
|
| 5 OPPENHEIMER ROCHESTER PENNSYLVANIA MUNICIPAL FUND |
fixed-interest-rate bonds and negotiated lower interest rates for others. The resolutions also authorized the sale of $250 million in new bonds.
In December 2016, Pennsylvania came to market with $613 million in G.O. bonds. The bonds, which have a 25-year maturity and a 5% coupon, sold at a yield of 5.18%.
As of July 31, 2017, Pennsylvania’s G.O. bonds were rated Aa3 by Moody’s Investors Service and AA-minus by S&P and by Fitch Ratings. G.O.s are backed by the full faith and taxing authority of the state or local government that issues them.
The Commonwealth of Puerto Rico remained in the headlines throughout this reporting period, and more detailed information about the developments discussed below can be found on our online PR Roundup (oppenheimerfunds.com/puerto-rico).
In August 2016, the Obama administration announced the seven members of the federal oversight board established by the Puerto Rico Oversight, Management and Economic Stability Act (PROMESA), which was enacted in June 2016.
At the outset of this reporting period, the Rochester complex received 100% of the payments owed on holdings backed by Puerto Rico’s sales and use tax (COFINA bonds) and 100% of the payments owed on its Municipal Finance Authority holdings. The Government Development Bank of Puerto Rico (GDB),
the Public Finance Corporation (PFC) and the Puerto Rico Infrastructure and Finance Authority (PRIFA) did not make their August 1, 2016 payments, and the Commonwealth also failed to make an interest payment of $1.3 million on its G.O. debt.
In September 2016, S&P downgraded several senior unsecured GDB bonds GDB after the GDB failed to make August 1 and September 1, 2016 interest payments.
In early September 2016, Francisco Besosa, a U.S. District Court judge, said he would not halt a lawsuit in which plaintiffs allege that Gov. Alejandro García Padilla violated PROMESA by declaring a moratorium on payments of constitutionally backed debt.
The fiscal plan presented to the federal oversight board on October 14 by then-Gov. Padilla was immediately challenged by Carlos Garcia, a member of the oversight board. He took issue with the government’s assessment of its fiscal situation.
Ricardo Rosselló Nevares, who was elected governor of the Commonwealth in November 2016, began his term in office by signing several executive orders related to fiscal and economic conditions in the Commonwealth, including a measure that required reductions in the operating expenses of all government agencies. Gov. Rosselló also ordered the use of zero-base budgets beginning with fiscal 2018 (which began July 1, 2017) and the creation of an entity to expedite the
|
| 6 OPPENHEIMER ROCHESTER PENNSYLVANIA MUNICIPAL FUND |
approvals of permits and certifications for infrastructure projects.
On January 3, 2017, PREPA made its $192.5 million interest payment in full. Also in early January, subsidiaries of the insurer Assured Guaranty made payments of $39 million and $5 million on G.O. debt and Public Building Authority debt, respectively. The Commonwealth, as expected, failed to pay $358 million of interest on its G.O. bonds on January 3.
In the first month of his administration, Gov. Rosselló tried to secure some changes to deadlines set forth in PROMESA. The federal oversight board was amenable but imposed certain conditions, including a commitment not to take more loans to provide short-term liquidity. Simultaneously, the federal oversight board told Gov. Rosselló that his plan had to make spending cuts and certain revenue increases.
Also in January 2017, the governor signed an extension through December 2021 to a tax on foreign corporations. The Act 154 tax, originally slated to expire at the end of 2017, has historically been a significant source of government revenue. The governor also signed a new measure, the Puerto Rico Financial Emergency and Fiscal Responsibility Act, to replace the Debt Moratorium Act, which had given the former governor the power to suspend debt payments.
Full coupon payments were made on February 1, 2017, on COFINAs as well as bonds issued
by the Puerto Rico Industrial Development Company, PRASA (the Commonwealth’s aqueduct and sewer authority), and PRHTA (its highways and transportation authority). However, the GDB, PFC and PRIFA failed to make certain payments on that date.
In February 2017, Gov. Rosselló discussed his 10-year fiscal plan. The plan called for cuts in government spending and for funds to be set aside for future debt service obligations, but it did not meet the federal oversight board’s requirement that certain fiscal adjustments be made to close the fiscal 2019 budget gap. The federal oversight board called for emergency spending cuts on March 8 based on concerns about the Commonwealth’s liquidity and the need to reduce spending immediately; shortly thereafter, the board approved an amended plan and established a number of milestones for the Rosselló administration.
In other developments related to the fiscal plan, the federal fiscal 2018 budget proposal that President Trump announced in May 2017 calls for $1.59 billion to fund Medicaid in Puerto Rico, an increase of $1.24 billion versus the previous Medicaid cap for the Commonwealth. Puerto Rico officials did not adjust the Commonwealth’s fiscal plan, which assumes the federal government’s Medicaid allocation is zero.
Despite the portfolio management team’s multi-year efforts to reach negotiated settlements with various issuers in Puerto Rico, the federal oversight board in May 2017 commenced proceedings under Title III of
|
| 7 OPPENHEIMER ROCHESTER PENNSYLVANIA MUNICIPAL FUND |
PROMESA, similar to a Chapter 9 bankruptcy, for the Commonwealth, the Puerto Rico Sales Tax Financing Corporation (issuer of COFINA bonds), the PRHTA and the Employee Retirement System. The commencement of these proceedings effectively blocked various lawsuits that had been filed soon after the May 1 expiration of the stay of litigation, which had been included in PROMESA and subsequently extended.
The Commonwealth held a vote regarding statehood in June. Those who voted in the nonbinding referendum were overwhelmingly in favor of changing the Commonwealth’s status to U.S. statehood, but less than one-quarter of the electorate voted.
The Puerto Rico Electric Power Authority (PREPA) and its forbearing bondholders, including Oppenheimer Rochester, worked throughout this reporting period to finalize a restructuring support agreement (RSA) whose terms were agreed on in September 2015. In December 2016, PREPA and its forbearing bondholders agreed to extend the RSA until March 31, 2017; further extensions pushed the RSA’s expiration until the end of June 2017.
PREPA allowed the nearly finalized RSA to terminate in late June 2017, even though the forbearing creditors had offered to extend the agreement again. On July 2, 2017, the federal oversight board commenced PREPA’s Title III proceeding; the utility did not make its July 3 payments of principal and interest.
In Title III, the unresolved issues among debtors and creditors will proceed along separate tracks: mediation and litigation. While court-facilitated mediation may be an effective and efficient process, investors should be aware that protracted litigation remains a very real possibility. These developments affect current dividend distribution calculations for funds with holdings subject to Title III. The Title III proceedings are being overseen by U.S. District Judge Laura Taylor Swain, who was selected by the Chief Justice of the U.S. Supreme Court, John Roberts.
In late June 2017, the federal oversight board approved its own consolidated budget and earmarked more than $900 million for debt-service obligations. The new budget came as a response to the governor’s proposed $9.56 billion general fund budget, which had been released in May and had called for a 6.3% increase in spending but very limited money available for debt service, inconsistent with the requirements of PROMESA.
In mid-July 2017, the federal oversight board approved a restructuring plan for the GDB, giving bondholders between 55% and 75% of the face value of their debt; the size of the “haircut” depends on the interest rate of the newly issued debt. In late July, the mayor of San Juan announced intentions to challenge this plan as a means to protect the city’s GDB deposits. (This Fund does not hold GDB debt; the Oppenheimer Rochester funds’ holdings of GDB debt represent less than one-hundredth of 1% of the assets of a single
|
| 8 OPPENHEIMER ROCHESTER PENNSYLVANIA MUNICIPAL FUND |
| | | | | | | | | | |
| | | The Rochester Portfolio Managers | | | | |
| |  | |  | |  | |  | | |
| | | | | |
| | Scott Cottier, CFA Team Leader and Senior Portfolio Manager | | Troy Willis, JD, CFA Team Leader and Senior Portfolio Manager | | Mark DeMitry, CFA Senior Portfolio Manager | | Michael Camarella, CFA Senior Portfolio Manager | | |
| | | | | |
| |  | |  | | | | | | |
| | | | | |
| | Charlie Pulire, CFA Senior Portfolio Manager | | Elizabeth Mossow, CFA Senior Portfolio Manager | | | | | | |
fund, Oppenheimer Rochester Limited Term California Municipal Fund.)
Please note: Shortly after the end of this reporting cycle, the Puerto Rico Legislature and the federal oversight board approved a budget for fiscal year 2018, ordered 5% spending cuts and announced plans to conduct a “comprehensive investigation” of the Commonwealth’s debt. Puerto Rico’s cash position as of June 30, 2017 was $1.5 billion higher than Judge Swain had been told
it would be, according to figures released in early August, raising new questions about why the Commonwealth claimed it could not make debt payments.
Tax collections in July, the first month of the fiscal 2018, were $20 million to $30 million ahead of budget, according to Puerto Rico’s treasury secretary; in fiscal 2017, tax collections exceeded forecasts by 2.6%, or $235 million. The unemployment rate in July dropped to 9.8%, which was lower than it
|
| 9 OPPENHEIMER ROCHESTER PENNSYLVANIA MUNICIPAL FUND |
The Rochester Credit Research Team
| | | | | | | | | | |
| |  | |  | |  | |  | | |
| | | | | |
| | Rich Stein, CFA Director of Credit Research | | Chris Weiler, CFA Senior Credit Analyst | | Bob Bertucci, CFA Senior Credit Analyst | | Angela Uttaro Senior Credit Analyst | | |
| | | | | |
| |  | |  | |  | |  | | |
| | | | | |
| | Matt Torpey, CFA Senior Credit Analyst | | René Vecka, CFA Senior Credit Analyst | | Jon Hagen, CFA Senior Credit Analyst | | Alen Kreso, CFA Senior Credit Analyst | | |
| | | | | |
| |  | |  | |  | | | | |
 |
| | Chris Meteyer, CFA Senior Credit Analyst | | Clara Sanguinetti Credit Analyst | | Chad Osterhout Credit Analyst | | | | |
|
| 10 OPPENHEIMER ROCHESTER PENNSYLVANIA MUNICIPAL FUND |
had been since early 2008. Also in early August, the Commonwealth’s Supreme Court denied the governor’s request to keep his initial draft budget (submitted to the board in late April) and other documents under wraps.
At an August 9 hearing, Judge Swain approved an agreement establishing a procedure to resolve, by December 15, the debt dispute between Puerto Rico and certain COFINA bondholders. Debt restructurings for GDB securities, which were approved by the Puerto Rico Legislature two days later, have yet to receive approval from the U.S. District Court.
In September, two hurricanes – Irma and Maria – caused damage on Puerto Rico. Irma passed to the north of the Commonwealth, but Maria made landfall and damage from it was extensive.
FUND PERFORMANCE
Oppenheimer Rochester Pennsylvania Municipal Fund held more than 275 securities as of July 31, 2017. The Fund was invested in a broad range of sectors, providing shareholders with a diversity of holdings that we believe would be difficult and costly to replicate in an individual portfolio.
During this reporting period, a rally in U.S. equities and persistent low interest rates put pressure on the dividends of many fixed income investments. This Fund’s Class A dividend, which was 4.6 cents per share at the outset of this reporting period, was
reduced to 4.2 cents per share beginning with the June 2017 payout. In all, the Fund distributed 54.4 cents per Class A share this reporting period. Shareholders should note that market conditions during this reporting period did not affect the Fund’s overall investment goals or cause it to pay any capital gain distributions.
Five of the Fund’s seven largest sectors were the largest contributors to the Fund’s performance during this reporting period. The Fund’s outperformance at NAV versus its benchmark this reporting period was primarily driven by its holdings of tobacco bonds. These high-yielding securities, which are backed by proceeds from the landmark 1998 Master Settlement Agreement (MSA), constituted the Fund’s largest sector as of July 31, 2017. Other leading contributors to performance were the securities in Fund’s second through fourth largest sectors: higher education, education and U.S. government obligations, respectively. Research-based security selection continued to be a factor in the strong performance of these sectors. U.S. government obligations are pre-refunded securities; in a pre-refunding, new securities with lower coupon rates are sold by a municipality to pay off debt that has higher interest rates. The proceeds from the new issuance are escrowed in U.S. Treasury bonds and earmarked to pay off the previously issued bonds. Two smaller sectors were also among the leading contributors to performance this reporting period: the energy equipment sector and the sewer utilities sector. Each of these sectors had less than 1% of the Fund’s total assets
|
| 11 OPPENHEIMER ROCHESTER PENNSYLVANIA MUNICIPAL FUND |
as of July 31, 2017, and each had a single security issued in Puerto Rico.
Of the Fund’s 24 sectors, six detracted from the Fund’s total return during the reporting period.
The G.O. and the sales tax sectors – the Fund’s fifth and tenth largest, respectively – were adversely affected by developments in Puerto Rico as were the PREPA securities in this Fund’s electric utilities sector (as discussed above). Also detracting from the Fund’s performance were the government appropriation and resource recovery sectors, among others.
In aggregate, the Fund’s substantial investments in securities issued in the Commonwealth of Puerto Rico contributed favorably to performance this reporting period. (As discussed above, the Commonwealth continued to experience significant financial difficulties this reporting period; the Fund’s current dividend distribution calculations reflect adjustments based on the failure of various Commonwealth issuers to make their debt-service payments on time and in full.) The securities are exempt from federal, state and local income taxes, and the Fund’s holdings include the aforementioned G.O. and tobacco bonds and securities from many different sectors. Most of the Fund’s investments in securities issued in Puerto Rico are supported by taxes and other revenues and are designed to help finance electric utilities, highways and education, among other entities.
Investors should note that some of this Fund’s investments in securities issued in Puerto Rico – including some of the G.O.s and sales tax revenue bonds – are insured. A complete listing of securities held by this Fund can be found in this report’s Statement of Investments.
INVESTMENT STRATEGY
The Rochester investment team focuses exclusively on municipal bonds, and this Fund invests primarily in investment-grade municipal securities. It may invest up to 25% of its total assets in below-investment grade securities, or “junk” bonds; the percentage of assets is measured at the time of purchase as is the credit quality of the securities. Additionally, the credit quality is based on Nationally Recognized Statistical Rating Organization (“NRSRO”) ratings or, if no NRSRO rating, on internal ratings. As of July 31, 2017, market movements or rating changes of municipal bonds, notably the Fund’s investments in Puerto Rico paper, caused the Fund’s below-investment-grade holdings to exceed this threshold. As a result, no further purchases of below-investment-grade bonds will be made until the Fund’s holdings of these types of bonds is once again below 25% of total assets.
While market conditions can and do fluctuate, the Fund’s portfolio management team adheres to a consistent investment approach based on its belief that tax-free yield can help investors achieve their long-term financial objectives. The team does not manage its
|
| 12 OPPENHEIMER ROCHESTER PENNSYLVANIA MUNICIPAL FUND |
funds based on predictions of interest rate changes. Further details about the Rochester team’s investment approach can be found on our landing page, oppenheimerfunds.
com/rochesterway.
In closing, we believe that the structure and sector composition of this Fund and the team’s use of time-tested strategies will continue to benefit fixed income investors through interest rate and economic cycles.
| | | | | | |
 | | 
Scott S. Cottier, CFA Senior Vice President, Senior Portfolio Manager and Team Leader | |  | | 
Troy E. Willis, CFA, J.D. Senior Vice President, Senior Portfolio Manager and Team Leader |
On behalf of the rest of the Rochester portfolio management team: Mark R. DeMitry, Michael L. Camarella, Charles S. Pulire and Elizabeth S. Mossow.
|
| 13 OPPENHEIMER ROCHESTER PENNSYLVANIA MUNICIPAL FUND |
Top Holdings and Allocations
TOP TEN CATEGORIES
| | | | |
| Tobacco Master Settlement Agreement | | | 15.0 | % |
| Higher Education | | | 12.0 | |
| Education | | | 11.7 | |
| U.S. Government Obligations | | | 11.6 | |
| General Obligation | | | 6.4 | |
| Housing - Student | | | 5.5 | |
| Hospital/Healthcare | | | 4.9 | |
| Highways/Commuter Facilities | | | 4.7 | |
| Electric Utilities | | | 3.8 | |
| Sales Tax Revenue | | | 3.6 | |
Portfolio holdings and allocations are subject to change. Percentages are as of July 31, 2017 and are based on total assets.
CREDIT ALLOCATION
| | | | | | | | | | | | |
| | | NRSRO-
Rated | | | Sub-
Adviser-
Rated | | | Total | |
| AAA | | | 0.0% | | | | 6.2% | | | | 6.2% | |
| AA | | | 12.5 | | | | 0.0 | | | | 12.5 | |
| A | | | 23.4 | | | | 0.0 | | | | 23.4 | |
| BBB | | | 18.2 | | | | 4.8 | | | | 23.0 | |
| BB or lower | | | 24.2 | | | | 10.7 | | | | 34.9 | |
| Total | | | 78.3% | | | | 21.7% | | | | 100.0% | |
The percentages above are based on the market value of the securities as of July 31, 2017 and are subject to change. OppenheimerFunds, Inc. determines the credit allocation of the Fund’s assets using ratings by nationally recognized statistical rating organizations (NRSROs), such as S&P Global Ratings (S&P). For any security rated by an NRSRO other than S&P, the sub-adviser, OppenheimerFunds, Inc., converts that security’s rating to the equivalent S&P rating. If two or more NRSROs have assigned a rating to a security, the highest rating is used. For securities not rated by an NRSRO, the sub-adviser uses its own credit analysis to assign ratings in categories similar to those of S&P. The use of similar categories is not an indication that the sub-adviser’s credit analysis process is consistent or comparable with any NRSRO’s process were that NRSRO to rate the same security.
For the purposes of this Credit Allocation table, securities rated within the NRSROs’ four highest categories—AAA, AA, A and BBB—are investment-grade securities. For further details, please consult the Fund’s prospectus or Statement of Additional Information.
|
| 14 OPPENHEIMER ROCHESTER PENNSYLVANIA MUNICIPAL FUND |
Performance
DISTRIBUTION YIELDS
As of 7/31/17
| | | | |
| | | Without Sales
Charge | | With Sales
Charge |
| Class A | | 4.80% | | 4.58% |
| Class B | | 4.21 | | N/A |
| Class C | | 4.22 | | N/A |
| Class Y | | 5.03 | | N/A |
STANDARDIZED YIELDS
| | | | |
| For the 30 Days Ended 7/31/17 |
| Class A | | 2.91% | | |
| Class B | | 2.40 | | |
| Class C | | 2.39 | | |
| Class Y | | 3.28 | | |
TAXABLE EQUIVALENT YIELDS
| | | | |
| As of 7/31/17 |
| Class A | | 5.32% | | |
| Class B | | 4.39 | | |
| Class C | | 4.37 | | |
| Class Y | | 6.00 | | |
AVERAGE ANNUAL TOTAL RETURNS WITHOUT SALES CHARGE AS OF 7/31/17
| | | | | | | | | | |
| | | Inception Date | | 1-Year | | 5-Year | | 10-Year | | Since Inception |
| Class A (OPATX) | | 9/18/89 | | 2.96% | | 3.77% | | 3.89% | | 5.64% |
| Class B (OPABX) | | 5/3/93 | | 2.22 | | 2.97 | | 3.39 | | 4.87 |
| Class C (OPACX) | | 8/29/95 | | 2.23 | | 3.00 | | 3.12 | | 4.39 |
| Class Y (OPAYX) | | 11/29/10 | | 3.14 | | 3.92 | | N/A | | 5.70 |
AVERAGE ANNUAL TOTAL RETURNS WITH SALES CHARGE AS OF 7/31/17
| | | | | | | | | | |
| | | Inception Date | | 1-Year | | 5-Year | | 10-Year | | Since Inception |
| Class A (OPATX) | | 9/18/89 | | -1.93% | | 2.76% | | 3.39% | | 5.54% |
| Class B (OPABX) | | 5/3/93 | | -2.67 | | 2.65 | | 3.39 | | 4.87 |
| Class C (OPACX) | | 8/29/95 | | 1.26 | | 3.00 | | 3.12 | | 4.39 |
| Class Y (OPAYX) | | 11/29/10 | | 3.14 | | 3.92 | | N/A | | 5.70 |
|
| 15 OPPENHEIMER ROCHESTER PENNSYLVANIA MUNICIPAL FUND |
COMPARISON OF CHANGE IN VALUE OF $10,000 HYPOTHETICAL INVESTMENTS IN:
| | |
| | 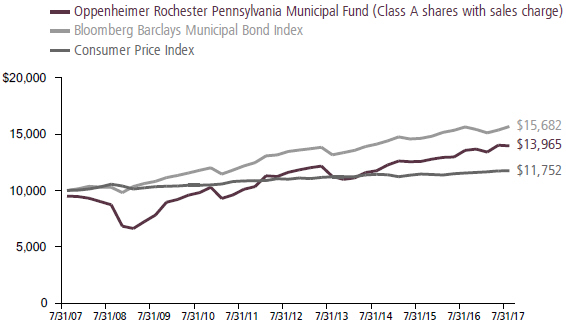
|
Performance data quoted represents past performance, which does not guarantee future results. The investment return and principal value of an investment in the Fund will fluctuate so that an investor’s shares, when redeemed, may be worth more or less than their original cost. Current performance may be lower or higher than the performance quoted. Returns do not consider capital gains or income taxes on an individual’s investments. For performance data current to the most recent month-end, visit oppenheimerfunds.com or call 1.800. CALL OPP (225.5677). Fund returns include changes in share price, reinvested distributions, and the applicable sales charge: for Class A shares, the current maximum initial sales charge of 4.75%; for Class B shares, the contingent deferred sales charge of 5% (1-year) and 2% (5-year); and for Class C, the contingent deferred sales charge of 1% for the 1-year period. There is no sales charge for Class Y shares. Because Class B shares convert to Class A shares 72 months after purchase, the 10-year return for Class B shares uses Class A performance for the period after conversion.
The Fund’s performance is compared to the performance of the Bloomberg Barclays Municipal Bond Index, an index of a broad range of investment-grade municipal bonds that measures the performance of the general municipal bond market. The Fund’s performance is also compared to the Consumer Price Index, a non-securities index that measures changes in the inflation rate. Indices are unmanaged and cannot be purchased by investors. While index comparisons may be useful to provide a benchmark for the Fund’s performance, it must be noted that the Fund’s investments are not limited to the investments comprising the indices. Index performance includes reinvestment of income, but does not reflect transaction costs, fees, expenses or taxes. Index performance is shown for illustrative purposes only as a benchmark for the Fund’s performance, and does not predict or depict performance of the Fund. The Fund’s performance reflects the effects of the Fund’s business and operating expenses.
Distribution yields for Class A shares are based on dividends of $0.042 for the 28-day accrual period ended July 25, 2017. The yield without sales charge for Class A shares is calculated by dividing annualized dividends by the Class A net asset value (NAV) on July 25, 2017; for the yield with charge, the denominator is the Class A maximum offering price on that
|
| 16 OPPENHEIMER ROCHESTER PENNSYLVANIA MUNICIPAL FUND |
date. Distribution yields for Class B, C and Y are annualized based on dividends of $0.0367, $0.0367 and $0.0440, respectively, for the 28-day accrual period ended July 25, 2017 and on the corresponding net asset values on that date.
Standardized yield is based on an SEC-standardized formula designed to approximate the Fund’s annualized hypothetical current income from securities less expenses for the 30-day period ended July 31, 2017 and that date’s maximum offering price (for Class A shares) or net asset value (for all other share classes). Each result is compounded semiannually and annualized. Falling share prices artificially increase yields.
The average distribution yield in this Fund’s Lipper category was calculated based on the distributions and the final NAVs of the reporting period for the funds in each category. The average yield at NAV in Lipper’s Pennsylvania Municipal Debt Funds category is based on 57 NAVs, one for each class of each fund in the category; a fund can have up to 4 classes. Lipper yields do not include sales charges, which – if included – would reduce results.
Taxable equivalent yield is based on the standardized yield and the 2017 top federal and Pennsylvania tax rate of 45.3%. Calculations factor in the 3.8% tax on unearned income under the Patient Protection and Affordable Care Act, as applicable. A portion of the Fund’s distributions may be subject to tax; distributions may also increase an investor’s exposure to the alternative minimum tax. Capital gains distributions are taxable as capital gains. Tax treatments of the Fund’s distributions and capital gains may vary by state; investors should consult a tax advisor to determine if the Fund is appropriate for them. Each result is compounded semiannually and annualized. Falling share prices artificially increase yields. This Report must be preceded or accompanied by a Fund prospectus.
Investments in “tobacco bonds,” which are backed by the proceeds a state or territory receives from the 1998 national litigation settlement with tobacco manufacturers, may be vulnerable to economic and/or legislative events that affect issuers in a particular municipal market sector. Annual payments by MSA-participating manufacturers, for example, hinge on many factors, including annual domestic cigarette shipments, inflation and the relative market share of non-participating manufacturers. To date, we believe consumption figures remain within an acceptable range of the assumptions used to structure MSA bonds. Future MSA payments could be reduced if consumption were to fall more rapidly than originally forecast.
The median yields for AAA-rated municipal securities are provided by Municipal Market Advisors (MMA) and are based on its benchmark of general obligation bonds structured with a 5% coupon and a 10-year par call. The MMA benchmark is constructed using yields from a group of active primary and secondary market makers and other municipal market participants.
The Fund’s investment strategy and focus can change over time. The mention of specific fund holdings does not constitute a recommendation by OppenheimerFunds, Inc. or its affiliates.
Before investing in any of the Oppenheimer funds, investors should carefully consider a fund’s investment objectives, risks, charges and expenses. Fund prospectuses and summary prospectuses contain this and other information about the funds, and may be obtained by asking your financial advisor, visiting oppenheimerfunds.com, or calling 1.800.CALL OPP (225.5677). Read prospectuses and summary prospectuses carefully before investing.
|
| 17 OPPENHEIMER ROCHESTER PENNSYLVANIA MUNICIPAL FUND |
Shares of Oppenheimer funds are not deposits or obligations of any bank, are not guaranteed by any bank, are not insured by the FDIC or any other agency and involve investment risks, including the possible loss of the principal amount invested.
|
| 18 OPPENHEIMER ROCHESTER PENNSYLVANIA MUNICIPAL FUND |
Fund Expenses
Fund Expenses. As a shareholder of the Fund, you incur two types of costs: (1) transaction costs, which may include sales charges (loads) on purchase payments and/or contingent deferred sales charges on redemptions; and (2) ongoing costs, including management fees; distribution and service fees; and other Fund expenses. These examples are intended to help you understand your ongoing costs (in dollars) of investing in the Fund and to compare these costs with the ongoing costs of investing in other mutual funds.
The examples are based on an investment of $1,000.00 invested at the beginning of the period and held for the entire 6-month period ended July 31, 2017.
Actual Expenses. The first section of the table provides information about actual account values and actual expenses. You may use the information in this section for the class of shares you hold, together with the amount you invested, to estimate the expense that you paid over the period. Simply divide your account value by $1,000.00 (for example, an $8,600.00 account value divided by $1,000.00 = 8.60), then multiply the result by the number in the first section under the heading entitled “Expenses Paid During 6 Months Ended July 31, 2017” to estimate the expenses you paid on your account during this period.
Hypothetical Example for Comparison Purposes. The second section of the table provides information about hypothetical account values and hypothetical expenses based on the Fund’s actual expense ratio for each class of shares, and an assumed rate of return of 5% per year for each class before expenses, which is not the Fund’s actual return. The hypothetical account values and expenses may not be used to estimate the actual ending account balance or expenses you paid for the period. You may use this information to compare the ongoing costs of investing in the Fund and other funds. To do so, compare this 5% hypothetical example for the class of shares you hold with the 5% hypothetical examples that appear in the shareholder reports of the other funds.
Please note that the expenses shown in the table are meant to highlight your ongoing costs only and do not reflect any transactional costs, such as front-end or contingent deferred sales charges (loads). Therefore, the “hypothetical” section of the table is useful in comparing ongoing costs only, and will not help you determine the relative total costs of owning different funds. In addition, if these transactional costs were included, your costs would have been higher.
|
| 19 OPPENHEIMER ROCHESTER PENNSYLVANIA MUNICIPAL FUND |
| | | | | | | | |
| Actual | | Beginning Account Value February 1, 2017 | | Ending Account Value July 31, 2017 | | Expenses Paid During 6 Months Ended
July 31, 2017 | | |
| Class A | | $ 1,000.00 | | $ 1,041.60 | | $ 5.18 | | |
| Class B | | 1,000.00 | | 1,038.00 | | 8.68 | | |
| Class C | | 1,000.00 | | 1,038.10 | | 8.68 | | |
| Class Y | | 1,000.00 | | 1,042.60 | | 4.06 | | |
| | | |
Hypothetical (5% return before expenses) | | | | | | |
| Class A | | 1,000.00 | | 1,019.74 | | 5.12 | | |
| Class B | | 1,000.00 | | 1,016.31 | | 8.58 | | |
| Class C | | 1,000.00 | | 1,016.31 | | 8.58 | | |
| Class Y | | 1,000.00 | | 1,020.83 | | 4.02 | | |
Expenses are equal to the Fund’s annualized expense ratio for that class, multiplied by the average account value over the period, multiplied by 181/365 (to reflect the one-half year period). Those annualized expense ratios, excluding indirect expenses from affiliated funds, based on the 6-month period ended July 31, 2017 are as follows:
| | | | |
| Class | | Expense Ratios | |
| Class A | | | 1.02 | % |
| Class B | | | 1.71 | |
| Class C | | | 1.71 | |
| Class Y | | | 0.80 | |
|
| 20 OPPENHEIMER ROCHESTER PENNSYLVANIA MUNICIPAL FUND |
STATEMENT OF INVESTMENTS July 31, 2017
| | | | | | | | | | | | | | | | |
Principal Amount | | | | | Coupon | | | Maturity | | | Value | |
| | Municipal Bonds and Notes—102.6% | | | | | | | | | |
| | Pennsylvania—73.6% | | | | | | | | | |
| | $80,000 | | | Allegheny County, PA HDA (Jefferson Regional Medical Center) | | | 5.125% | | | | 05/01/2025 | | | $ | 80,164 | |
| | 1,125,000 | | | Allegheny County, PA HDA (Jefferson Regional Medical Center) | | | 5.125 | | | | 05/01/2029 | | | | 1,121,625 | |
| | 35,000 | | | Allegheny County, PA HDA (UPMC Health System) | | | 5.375 | | | | 08/15/2029 | | | | 37,637 | |
| | 160,000 | | | Allegheny County, PA HDA (UPMC Health System) | | | 5.500 | | | | 08/15/2034 | | | | 172,266 | |
| | 1,310,000 | | | Allegheny County, PA HEBA (Carlow University) | | | 6.000 | | | | 11/01/2021 | | | | 1,425,791 | |
| | 1,125,000 | | | Allegheny County, PA HEBA (Carlow University) | | | 6.750 | | | | 11/01/2031 | | | | 1,256,602 | |
| | 1,000,000 | | | Allegheny County, PA HEBA (Chatham University) | | | 5.000 | | | | 09/01/2035 | | | | 1,070,470 | |
| | 2,250,000 | | | Allegheny County, PA HEBA (Robert Morris University) | | | 5.500 | | | | 10/15/2030 | | | | 2,448,472 | |
| | 3,650,000 | | | Allegheny County, PA HEBA (Robert Morris University) | | | 5.750 | | | | 10/15/2040 | | | | 3,987,150 | |
| | 2,500,000 | | | Allegheny County, PA HEBA (Robert Morris University) | | | 5.900 | | | | 10/15/2028 | | | | 2,623,775 | |
| | 5,000 | | | Allegheny County, PA HEBA (Robert Morris University) | | | 6.000 | | | | 05/01/2028 | | | | 5,697 | |
| | 2,000,000 | | | Allegheny County, PA HEBA (Robert Morris University) | | | 6.000 | | | | 10/15/2038 | | | | 2,122,680 | |
| | 1,200,000 | | | Allegheny County, PA IDA (Propel Charter School-East) | | | 6.375 | | | | 08/15/2035 | | | | 1,274,940 | |
| | 900,000 | | | Allegheny County, PA IDA (Propel Charter School-Montour) | | | 6.750 | | | | 08/15/2035 | | | | 967,707 | |
| | 1,500,000 | | | Allegheny County, PA IDA (Propel Charter School-Sunrise) | | | 6.000 | | | | 07/15/2038 | | | | 1,594,875 | |
| | 1,000,000 | | | Allegheny County, PA IDA (ReR/RRSW/RRDC Obligated Group) | | | 5.000 | | | | 09/01/2021 | | | | 1,001,440 | |
| | 1,225,000 | | | Allegheny County, PA IDA (ReR/RRSW/RRDC Obligated Group) | | | 5.100 | | | | 09/01/2026 | | | | 1,226,139 | |
| | 550,000 | | | Allegheny County, PA IDA (ReR/RRSW/RRDC Obligated Group) | | | 5.125 | | | | 09/01/2031 | | | | 550,346 | |
| | 330,000 | | | Allegheny County, PA IDA (School Facility Devel.)1 | | | 5.900 | | | | 08/15/2026 | | | | 347,536 | |
| | 12,450,000 | | | Allegheny County, PA Redevel. Authority (Pittsburgh Mills) | | | 5.600 | | | | 07/01/2023 | | | | 12,249,181 | |
| | 1,605,000 | | | Allegheny County, PA Residential Finance Authority (Broadview Manor Apartments) | | | 5.950 | | | | 01/20/2043 | | | | 1,646,698 | |
| | 1,240,000 | | | Allegheny County, PA Residential Finance Authority (Independence House Apartments) | | | 6.100 | | | | 01/20/2043 | | | | 1,273,071 | |
| | 1,610,000 | | | Allegheny County, PA Residential Finance Authority (Versailles Apartments) | | | 6.160 | | | | 01/20/2043 | | | | 1,653,373 | |
| | 13,000,000 | | | Berks County, PA Municipal Authority (Reading Hospital & Medical Center)2 | | | 5.500 | | | | 11/01/2031 | | | | 14,141,790 | |
| | 3,000,000 | | | Bethlehem, PA Area School District | | | 5.000 | | | | 08/01/2035 | | | | 3,395,460 | |
| | 1,750,000 | | | Bethlehem, PA GO | | | 6.500 | | | | 12/01/2032 | | | | 2,103,360 | |
| | 560,000 | | | Butler County, PA IDA (Greenview Gardens Apartments) | | | 6.000 | | | | 07/01/2023 | | | | 561,103 | |
| | 1,760,000 | | | Butler County, PA IDA (Greenview Gardens Apartments) | | | 6.250 | | | | 07/01/2033 | | | | 1,762,499 | |
| | 2,865,000 | | | Cambridge, PA Area Joint Authority | | | 6.000 | | | | 12/01/2037 | | | | 2,986,476 | |
| | 950,000 | | | Centre County, PA Hospital Authority (Mt. Nittany Medical Center) | | | 6.250 | | | | 11/15/2041 | | | | 1,150,839 | |
| | 2,000,000 | | | Centre County, PA Hospital Authority (Mt. Nittany Medical Center) | | | 7.000 | | | | 11/15/2046 | | | | 2,483,460 | |
| | 30,000 | | | Charleroi, PA Area School Authority | | | 6.000 | | | | 10/01/2017 | | | | 30,117 | |
|
| 21 OPPENHEIMER ROCHESTER PENNSYLVANIA MUNICIPAL FUND |
STATEMENT OF INVESTMENTS Continued
| | | | | | | | | | | | | | |
Principal Amount | | | | Coupon | | | Maturity | | | Value | |
| Pennsylvania (Continued) | | | | | | | | | | | | |
| $2,000,000 | | Chester County, PA H&EFA (Immaculata University) | | | 7.000% | | | | 11/01/2041 | | | $ | 2,185,340 | |
| 2,000,000 | | Chester County, PA H&EFA (Main Line Health System) | | | 5.000 | | | | 10/01/2052 | | | | 2,284,040 | |
| 1,000,000 | | Chester County, PA IDA (West Chester University Student Hsg.) | | | 5.000 | | | | 08/01/2035 | | | | 1,059,440 | |
| 1,000,000 | | Clairton, PA Municipal Authority | | | 5.000 | | | | 12/01/2037 | | | | 1,095,010 | |
| 1,220,000 | | Clarion County, PA IDA (Clarion University Foundation) | | | 5.000 | | | | 07/01/2024 | | | | 1,359,263 | |
| 1,310,000 | | Clarion County, PA IDA (Clarion University Foundation) | | | 5.000 | | | | 07/01/2034 | | | | 1,394,940 | |
| 2,430,000 | | Clarion County, PA IDA (Clarion University of Pennsylvania Hsg.) | | | 5.000 | | | | 07/01/2029 | | | | 2,641,240 | |
| 3,500,000 | | Clarion County, PA IDA (Clarion University of Pennsylvania Hsg.) | | | 5.000 | | | | 07/01/2033 | | | | 3,746,645 | |
| 260,000 | | Cumberland County, PA Municipal Authority (Diakon Lutheran Social Ministries) | | | 6.250 | | | | 01/01/2024 | | | | 277,927 | |
| 1,000,000 | | Cumberland County, PA Municipal Authority (Dickinson College) | | | 5.000 | | | | 05/01/2031 | | | | 1,166,690 | |
| 775,000 | | Cumberland County, PA Municipal Authority (Dickinson College) | | | 5.000 | | | | 05/01/2032 | | | | 900,271 | |
| 4,000,000 | | Delaware County, PA Authority (Cabrini University) | | | 5.000 | | | | 07/01/2047 | | | | 4,402,080 | |
| 3,965,000 | | Delaware County, PA Authority (Eastern University) | | | 5.250 | | | | 10/01/2032 | | | | 3,812,347 | |
| 85,000 | | Delaware County, PA Authority (MAS/MCMCSPA/ MHH/MHP/MHSSPA Obligated Group) | | | 5.375 | | | | 11/15/2023 | | | | 87,742 | |
| 1,160,000 | | Delaware County, PA Authority (Neumann College) | | | 6.000 | | | | 10/01/2025 | | | | 1,228,417 | |
| 280,000 | | Delaware County, PA Authority (Neumann College) | | | 6.000 | | | | 10/01/2030 | | | | 296,514 | |
| 1,000,000 | | Delaware County, PA Authority (Neumann College) | | | 6.125 | | | | 10/01/2034 | | | | 1,060,430 | |
| 650,000 | | Delaware County, PA Authority (Neumann College) | | | 6.250 | | | | 10/01/2038 | | | | 690,215 | |
| 1,150,000 | | Delaware County, PA Authority (Neumann University) | | | 5.000 | | | | 10/01/2025 | | | | 1,256,985 | |
| 1,425,000 | | Delaware County, PA Authority (Neumann University) | | | 5.000 | | | | 10/01/2031 | | | | 1,570,835 | |
| 2,305,000 | | Delaware County, PA Authority (Neumann University) | | | 5.000 | | | | 10/01/2035 | | | | 2,506,803 | |
| 1,250,000 | | Delaware County, PA Authority (Neumann University) | | | 5.250 | | | | 10/01/2031 | | | | 1,352,000 | |
| 820,000 | | East Hempfield Township, PA IDA (Millersville University Student Services) | | | 5.000 | | | | 07/01/2030 | | | | 891,963 | |
| 1,000,000 | | East Hempfield Township, PA IDA (Millersville University Student Services) | | | 5.000 | | | | 07/01/2030 | | | | 1,072,880 | |
| 1,060,000 | | East Hempfield Township, PA IDA (Millersville University Student Services) | | | 5.000 | | | | 07/01/2035 | | | | 1,134,253 | |
| 1,250,000 | | East Hempfield Township, PA IDA (Millersville University Student Services) | | | 5.000 | | | | 07/01/2035 | | | | 1,324,013 | |
| 2,750,000 | | East Hempfield Township, PA IDA (Millersville University Student Services) | | | 5.000 | | | | 07/01/2047 | | | | 2,906,255 | |
| 500,000 | | Easton, PA Area School District | | | 5.200 | | | | 04/01/2028 | | | | 514,455 | |
| 75,000 | | Erie, PA City School District | | | 5.250 | | | | 03/01/2039 | | | | 75,197 | |
| 7,840,000 | | Erie, PA Higher Education Building Authority (Gannon University) | | | 5.000 | | | | 05/01/2038 | | | | 8,294,406 | |
| 1,000,000 | | Erie, PA Higher Education Building Authority (Gannon University) | | | 5.375 | | | | 05/01/2030 | | | | 1,061,560 | |
| 2,565,000 | | Erie, PA Higher Education Building Authority (Gannon University) | | | 5.500 | | | | 05/01/2040 | | | | 2,725,261 | |
| 905,000 | | Erie, PA Higher Education Building Authority (Mercyhurst College) | | | 5.350 | | | | 03/15/2028 | | | | 949,110 | |
|
| 22 OPPENHEIMER ROCHESTER PENNSYLVANIA MUNICIPAL FUND |
| | | | | | | | | | | | | | |
Principal
Amount | | | | Coupon | | | Maturity | | | Value | |
| Pennsylvania (Continued) | | | | | | | | | | | | |
| $3,000,000 | | Erie, PA Higher Education Building Authority (Mercyhurst College) | | | 5.500% | | | | 03/15/2038 | | | $ | 3,151,230 | |
| 2,095,000 | | Fayette County, PA Redevel. Authority (Fayette Crossing) | | | 7.000 | | | | 09/01/2019 | | | | 2,156,551 | |
| 6,150,000 | | Horsham, PA Industrial and Commercial Devel. Authority (Pennsylvania LTC) | | | 6.000 | | | | 12/01/2037 | | | | 6,208,487 | |
| 2,100,000 | | Lackawanna County, PA GO | | | 6.000 | | | | 09/15/2032 | | | | 2,292,969 | |
| 848,396 | | Lehigh County, PA GPA (Kidspeace Obligated Group) | | | 6.000 | | | | 11/01/2018 | | | | 849,295 | |
| 3,600,000 | | Lehigh County, PA GPA (Kidspeace Obligated Group) | | | 6.000 | | | | 11/01/2023 | | | | 3,595,536 | |
| 2,747,774 | | Lehigh County, PA GPA (Kidspeace)3 | | | 0.000 4 | | | | 02/01/2044 | | | | 1,039,648 | |
| 2,721,970 | | Lehigh County, PA GPA (Kidspeace)3 | | | 7.500 | | | | 02/01/2044 | | | | 27 | |
| 3,527,895 | | Lehigh County, PA GPA (Kidspeace/KC/KNCONY/KCH/ KMAKNC/KNCONM/IRSch Obligated Group) | | | 7.500 | | | | 02/01/2044 | | | | 3,574,040 | |
| 1,590,000 | | Luzerne County, PA GO | | | 6.750 | | | | 11/01/2023 | | | | 1,761,354 | |
| 500,000 | | Luzerne County, PA GO | | | 7.000 | | | | 11/01/2026 | | | | 554,165 | |
| 5,000,000 | | Luzerne County, PA IDA | | | 7.750 | | | | 12/15/2027 | | | | 5,217,300 | |
| 5,000,000 | | Montgomery County, PA HEHA (Holy Redeemer Health System/Holy Redeemer Physician & Ambulatory Obligated Group) | | | 5.000 | | | | 10/01/2036 | | | | 5,464,550 | |
| 5,425,000 | | Montgomery County, PA IDA (ARLC/LVE/ATI/ASCS/ AMS Obligated Group) | | | 5.000 | | | | 11/15/2036 | | | | 6,019,851 | |
| 10,915,000 | | Montgomery County, PA IDA (New Regional Medical) | | | 5.375 | | | | 08/01/2038 | | | | 12,313,648 | |
| 300,000 | | Montgomery County, PA IDA (Philadelphia Presbyterian Homes) | | | 6.500 | | | | 12/01/2025 | | | | 342,648 | |
| 4,500,000 | | Northampton County, PA General Purpose Authority (Lafayette College) | | | 5.000 | | | | 11/01/2047 | | | | 5,239,215 | |
| 2,860,000 | | Northampton County, PA General Purpose Authority (Moravian College) | | | 5.000 | | | | 07/01/2031 | | | | 3,140,852 | |
| 1,500,000 | | Northampton County, PA IDA (Morningstar Senior Living) | | | 5.000 | | | | 07/01/2027 | | | | 1,567,665 | |
| 14,826,610 | | Northampton County, PA IDA (Northampton Generating)3,5 | | | 5.000 | | | | 12/31/2023 | | | | 4,445,018 | |
| 1,446,670 | | Northampton County, PA IDA (Northampton Generating)3,5 | | | 5.000 | | | | 12/31/2023 | | | | 433,712 | |
| 16,000,000 | | PA Commonwealth Financing Authority | | | 5.000 | | | | 06/01/2032 | | | | 17,442,080 | |
| 2,000,000 | | PA Commonwealth Financing Authority | | | 5.000 | | | | 06/01/2035 | | | | 2,269,100 | |
| 39,737,908 | | PA EDFA (Bionol Clearfield)6 | | | 8.500 | | | | 07/01/2015 | | | | 6,925,523 | |
| 3,000,000 | | PA EDFA (Forum) | | | 5.000 | | | | 03/01/2029 | | | | 3,356,430 | |
| 3,000,000 | | PA EDFA (Philadelphia Biosolids Facility) | | | 6.250 | | | | 01/01/2032 | | | | 3,189,480 | |
| 4,315,000 | | PA Geisinger Authority Health System | | | 5.000 | | | | 02/15/2045 | | | | 4,960,567 | |
| 9,000,000 | | PA GO2 | | | 5.000 | | | | 06/01/2022 | | | | 10,463,670 | |
| 115,000 | | PA GO | | | 5.000 | | | | 06/01/2022 | | | | 133,702 | |
| 4,055,000 | | PA GO | | | 5.000 | | | | 07/01/2022 | | | | 4,723,183 | |
| 100,000 | | PA HEFA (California University of Pennsylvania Student Assoc.) | | | 5.000 | | | | 07/01/2028 | | | | 100,053 | |
| 95,000 | | PA HEFA (California University of Pennsylvania Student Assoc.)1 | | | 6.750 | | | | 09/01/2020 | | | | 95,239 | |
| 3,115,000 | | PA HEFA (California University of Pennsylvania Student Assoc.) | | | 6.750 | | | | 09/01/2032 | | | | 3,118,208 | |
|
| 23 OPPENHEIMER ROCHESTER PENNSYLVANIA MUNICIPAL FUND |
STATEMENT OF INVESTMENTS Continued
| | | | | | | | | | | | | | |
Principal
Amount | | | | Coupon | | | Maturity | | | Value | |
| Pennsylvania (Continued) | | | | | | | | | | | | |
| $55,000 | | PA HEFA (California University of Pennsylvania Student Assoc.) | | | 6.800% | | | | 09/01/2025 | | | $ | 55,124 | |
| 1,245,000 | | PA HEFA (Delaware Valley College of Science & Agriculture) | | | 5.000 | | | | 11/01/2027 | | | | 1,259,803 | |
| 535,000 | | PA HEFA (Delaware Valley College of Science & Agriculture) | | | 5.000 | | | | 11/01/2042 | | | | 525,172 | |
| 10,000 | | PA HEFA (Drexel University College of Medicine) | | | 5.000 | | | | 05/01/2037 | | | | 10,105 | |
| 6,285,000 | | PA HEFA (Edinboro University Foundation) | | | 5.750 | | | | 07/01/2028 | | | | 6,565,248 | |
| 3,000,000 | | PA HEFA (Edinboro University Foundation) | | | 5.800 | | | | 07/01/2030 | | | | 3,402,210 | |
| 9,000,000 | | PA HEFA (Edinboro University Foundation) | | | 5.875 | | | | 07/01/2038 | | | | 9,411,570 | |
| 8,225,000 | | PA HEFA (Edinboro University Foundation) | | | 6.000 | | | | 07/01/2042 | | | | 8,610,506 | |
| 3,500,000 | | PA HEFA (Edinboro University Foundation) | | | 6.000 | | | | 07/01/2043 | | | | 3,989,265 | |
| 1,300,000 | | PA HEFA (Gwynedd Mercy College) | | | 5.375 | | | | 05/01/2042 | | | | 1,385,813 | |
| 750,000 | | PA HEFA (Indiana University Foundation) | | | 5.000 | | | | 07/01/2041 | | | | 815,040 | |
| 2,650,000 | | PA HEFA (La Salle University) | | | 5.000 | | | | 05/01/2029 | | | | 2,892,793 | |
| 250,000 | | PA HEFA (La Salle University) | | | 5.000 | | | | 05/01/2037 | | | | 251,088 | |
| 50,000 | | PA HEFA (Pennsylvania State University) | | | 5.000 | | | | 03/01/2022 | | | | 50,155 | |
| 1,400,000 | | PA HEFA (Shippensburg University Student Services) | | | 5.000 | | | | 10/01/2035 | | | | 1,477,392 | |
| 3,000,000 | | PA HEFA (Shippensburg University) | | | 6.000 | | | | 10/01/2031 | | | | 3,304,170 | |
| 7,000,000 | | PA HEFA (Shippensburg University) | | | 6.250 | | | | 10/01/2043 | | | | 7,745,640 | |
| 1,750,000 | | PA HEFA (St. Francis University) | | | 6.000 | | | | 11/01/2031 | | | | 1,913,310 | |
| 2,250,000 | | PA HEFA (St. Francis University) | | | 6.250 | | | | 11/01/2041 | | | | 2,480,085 | |
| 100,000 | | PA HEFA (Student Association) | | | 6.750 | | | | 09/01/2023 | | | | 100,139 | |
| 4,515,000 | | PA HEFA (University of Pennsylvania Health System) | | | 5.750 | | | | 08/15/2041 | | | | 5,342,193 | |
| 60,000 | | PA HEFA (University of the Arts) | | | 5.500 | | | | 03/15/2020 | | | | 60,169 | |
| 3,050,000 | | PA HEFA (University of the Arts) | | | 5.625 | | | | 03/15/2025 | | | | 3,056,985 | |
| 1,685,000 | | PA HEFA (University of the Arts) | | | 5.750 | | | | 03/15/2030 | | | | 1,688,252 | |
| 1,000,000 | | PA HEFA (University Properties Student Hsg.) | | | 5.000 | | | | 07/01/2031 | | | | 1,096,350 | |
| 1,000,000 | | PA HEFA (Ursinus College) | | | 5.000 | | | | 01/01/2029 | | | | 1,096,660 | |
| 1,000,000 | | PA HEFA (Widener University) | | | 5.000 | | | | 07/15/2038 | | | | 1,089,620 | |
| 5,000,000 | | PA Public School Building Authority (Harrisburg Area Community College) | | | 5.000 | | | | 10/01/2031 | | | | 5,484,450 | |
| 3,500,000 | | PA Public School Building Authority (School District of Philadelphia) | | | 5.000 | | | | 04/01/2027 | | | | 3,753,330 | |
| 4,410,000 | | PA Public School Building Authority (School District of Philadelphia) | | | 5.000 | | | | 04/01/2028 | | | | 4,710,453 | |
| 3,000,000 | | PA Public School Building Authority (School District of Philadelphia) | | | 5.000 | | | | 04/01/2029 | | | | 3,190,410 | |
| 250,000 | | PA Public School Building Authority (School District of Philadelphia) | | | 5.000 | | | | 04/01/2030 | | | | 264,268 | |
| 2,250,000 | | PA Public School Building Authority (School District of Philadelphia) | | | 5.000 | | | | 04/01/2031 | | | | 2,369,768 | |
| 4,780,000 | | PA Public School Building Authority (School District of Philadelphia) | | | 5.000 | | | | 04/01/2032 | | | | 5,021,868 | |
| 1,000,000 | | PA Southcentral General Authority (Hanover Hospital) | | | 5.000 | | | | 12/01/2029 | | | | 1,123,380 | |
| 12,940,000 | | PA Southcentral General Authority (Wellspan Health Obligated Group)2 | | | 6.000 | | | | 06/01/2029 | | | | 13,656,995 | |
| 3,750,000 | | PA State Public School Building Authority (Philadelphia School District) | | | 5.000 | | | | 06/01/2027 | | | | 4,266,750 | |
|
| 24 OPPENHEIMER ROCHESTER PENNSYLVANIA MUNICIPAL FUND |
| | | | | | | | | | | | | | |
Principal
Amount | | | | Coupon | | | Maturity | | | Value | |
| Pennsylvania (Continued) | | | | | | | | | | | | |
| $8,795,000 | | PA State Public School Building Authority (Philadelphia School District) | | | 5.000% | | | | 06/01/2032 | | | $ | 9,930,698 | |
| 5,000,000 | | PA State Public School Building Authority (Philadelphia School District) | | | 5.000 | | | | 06/01/2036 | | | | 5,436,750 | |
| 10,000,000 | | PA Turnpike Commission | | | 0.000 4 | | | | 12/01/2038 | | | | 12,351,800 | |
| 1,750,000 | | PA Turnpike Commission | | | 5.000 | | | | 06/01/2030 | | | | 2,018,048 | |
| 500,000 | | PA Turnpike Commission | | | 5.000 | | | | 12/01/2030 | | | | 583,220 | |
| 1,000,000 | | PA Turnpike Commission | | | 5.000 | | | | 12/01/2031 | | | | 1,162,870 | |
| 2,000,000 | | PA Turnpike Commission | | | 5.000 | | | | 12/01/2032 | | | | 2,263,580 | |
| 5,750,000 | | PA Turnpike Commission | | | 5.000 | | | | 12/01/2040 | | | | 6,517,338 | |
| 4,100,000 | | PA Turnpike Commission | | | 5.500 4 | | | | 12/01/2034 | | | | 4,578,552 | |
| 900,000 | | PA Turnpike Commission | | | 5.500 4 | | | | 12/01/2034 | | | | 1,031,688 | |
| 5,000,000 | | PA Turnpike Commission | | | 5.500 | | | | 12/01/2042 | | | | 5,936,850 | |
| 2,820,000 | | PA Turnpike Commission | | | 6.000 4 | | | | 12/01/2034 | | | | 3,275,684 | |
| 570,000 | | PA Turnpike Commission | | | 6.000 4 | | | | 12/01/2034 | | | | 662,716 | |
| 610,000 | | PA Turnpike Commission | | | 6.000 4 | | | | 12/01/2034 | | | | 709,223 | |
| 2,000,000 | | PA West Shore Area Hospital Authority
(Holy Spirit Hospital of the Sisters of Christian Charity) | | | 5.625 | | | | 01/01/2032 | | | | 2,280,440 | |
| 1,835,000 | | PA West Shore Area Hospital Authority
(Holy Spirit Hospital of the Sisters of Christian Charity) | | | 6.500 | | | | 01/01/2041 | | | | 2,168,731 | |
| 1,430,000 | | Pennsylvania State University | | | 5.000 | | | | 09/01/2041 | | | | 1,673,858 | |
| 2,500,000 | | Pennsylvania State University | | | 5.000 | | | | 09/01/2047 | | | | 2,947,725 | |
| 5,000,000 | | Philadelphia, PA Airport | | | 5.000 | | | | 06/15/2032 | | | | 5,013,800 | |
| 2,440,000 | | Philadelphia, PA Airport, Series A | | | 5.000 | | | | 06/15/2018 | | | | 2,447,588 | |
| 2,500,000 | | Philadelphia, PA Authority for Industrial Devel. (Architecture & Design Charter School) | | | 6.125 | | | | 03/15/2043 | | | | 2,632,450 | |
| 450,000 | | Philadelphia, PA Authority for Industrial Devel. (Discovery Charter School) | | | 5.875 | | | | 04/01/2032 | | | | 467,123 | |
| 500,000 | | Philadelphia, PA Authority for Industrial Devel. (Discovery Charter School) | | | 6.250 | | | | 04/01/2042 | | | | 522,830 | |
| 1,000,000 | | Philadelphia, PA Authority for Industrial Devel. (Global Leadership Academy) | | | 5.750 | | | | 11/15/2030 | | | | 1,040,530 | |
| 500,000 | | Philadelphia, PA Authority for Industrial Devel. (Global Leadership Academy) | | | 6.375 | | | | 11/15/2040 | | | | 528,715 | |
| 2,040,000 | | Philadelphia, PA Authority for Industrial Devel.
(International Apartments Temple University) | | | 5.375 | | | | 06/15/2030 | | | | 2,136,859 | |
| 4,000,000 | | Philadelphia, PA Authority for Industrial Devel.
(International Apartments Temple University) | | | 5.625 | | | | 06/15/2042 | | | | 4,203,360 | |
| 1,640,000 | | Philadelphia, PA Authority for Industrial Devel. (Richard Allen Prep Charter School) | | | 6.250 | | | | 05/01/2033 | | | | 1,640,804 | |
| 1,105,000 | | Philadelphia, PA Authority for Industrial Devel. (Stapeley Germantown) | | | 5.125 | | | | 01/01/2021 | | | | 1,094,635 | |
| 2,000,000 | | Philadelphia, PA Authority for Industrial Devel. (Tacony Academy Charter School) | | | 6.750 | | | | 06/15/2033 | | | | 2,239,120 | |
| 3,090,000 | | Philadelphia, PA Authority for Industrial Devel. (Tacony Academy Charter School) | | | 7.000 | | | | 06/15/2043 | | | | 3,484,562 | |
| 9,230,000 | | Philadelphia, PA Authority for Industrial Devel. (TJU/TJUHS/TJUH/JUP/AHlth/AHlthF/
AMH/LHosp/AriaH/AHSys Obligated Group) | | | 5.000 | | | | 09/01/2047 | | | | 10,457,221 | |
|
| 25 OPPENHEIMER ROCHESTER PENNSYLVANIA MUNICIPAL FUND |
STATEMENT OF INVESTMENTS Continued
| | | | | | | | | | | | | | |
Principal
Amount | | | | Coupon | | | Maturity | | | Value | |
| Pennsylvania (Continued) | | | | | | | | | | | | |
| $2,915,000 | | Philadelphia, PA Authority for Industrial Devel. Senior | | | | | | | | | | | | |
| | | Living (Presbyterian Homes Germantown) | | | 5.625% | | | | 07/01/2035 | | | $ | 2,918,323 | |
| 3,500,000 | | Philadelphia, PA GO1 | | | 5.000 | | | | 08/01/2035 | | | | 4,033,785 | |
| 6,260,000 | | Philadelphia, PA GO | | | 6.500 | | | | 08/01/2041 | | | | 7,269,675 | |
| 770,000 | | Philadelphia, PA H&HEFA (Centralized Comprehensive Human Services) | | | 7.250 | | | | 01/01/2021 | | | | 760,752 | |
| 250,000 | | Philadelphia, PA Hsg. Authority | | | 5.000 | | | | 12/01/2021 | | | | 252,095 | |
| 1,300,000 | | Philadelphia, PA Hsg. Authority | | | 5.000 | | | | 05/01/2039 | | | | 1,460,979 | |
| 2,415,000 | | Philadelphia, PA Hsg. Authority | | | 5.000 | | | | 05/01/2042 | | | | 2,716,175 | |
| 1,000,000 | | Philadelphia, PA Municipal Authority | | | 6.500 | | | | 04/01/2034 | | | | 1,091,630 | |
| 25,000 | | Philadelphia, PA Parking Authority | | | 5.125 | | | | 02/15/2018 | | | | 25,080 | |
| 20,000 | | Philadelphia, PA Parking Authority, Series A | | | 5.250 | | | | 02/15/2029 | | | | 20,064 | |
| 80,000 | | Philadelphia, PA Redevel. Authority (Multifamily Hsg.)1 | | | 5.450 | | | | 02/01/2023 | | | | 80,676 | |
| 10,000,000 | | Philadelphia, PA School District | | | 5.000 | | | | 09/01/2028 | | | | 11,427,100 | |
| 10,000,000 | | Philadelphia, PA School District | | | 5.000 | | | | 09/01/2029 | | | | 11,331,500 | |
| 2,000,000 | | Philadelphia, PA School District | | | 5.000 | | | | 09/01/2032 | | | | 2,247,380 | |
| 5,000 | | Philadelphia, PA School District | | | 6.000 | | | | 09/01/2038 | | | | 5,273 | |
| 45,000 | | Philadelphia, PA School District | | | 6.000 | | | | 09/01/2038 | | | | 47,454 | |
| 1,630,000 | | Philadelphia, PA School District | | | 6.000 | | | | 09/01/2038 | | | | 1,718,884 | |
| 5,000 | | Philadelphia, PA School District | | | 6.000 | | | | 09/01/2038 | | | | 5,273 | |
| 1,895,000 | | Philadelphia, PA Water & Wastewater | | | 5.000 | | | | 10/01/2052 | | | | 2,156,245 | |
| 2,380,000 | | Philadelphia, PA Water & Wastewater | | | 5.250 | | | | 10/01/2052 | | | | 2,797,000 | |
| 2,730,000 | | Pittsburgh, PA Urban Redevel. Authority (Marian Plaza) | | | 6.130 | | | | 01/20/2043 | | | | 2,803,819 | |
| 4,000,000 | | Pottsville, PA Hospital Authority (Lehigh Valley Health Network) | | | 5.000 | | | | 07/01/2041 | | | | 4,505,040 | |
| 900,000 | | Reading, PA Hsg. Auth (Goggle Works Apts.) | | | 5.625 | | | | 06/01/2042 | | | | 935,613 | |
| 2,895,000 | | Reading, PA Hsg. Auth (Goggle Works Apts.) | | | 5.875 | | | | 06/01/2052 | | | | 3,016,706 | |
| 1,500,000 | | Reading, PA School District1 | | | 5.000 | | | | 03/01/2037 | | | | 1,719,075 | |
| 1,500,000 | | Reading, PA School District1 | | | 5.000 | | | | 03/01/2038 | | | | 1,716,435 | |
| 6,450,000 | | Susquehanna, PA Area Regional Airport Authority | | | 6.500 | | | | 01/01/2038 | | | | 6,570,873 | |
| 6,600,000 | | Washington County, PA Redevel. Authority (Victory Centre) | | | 5.450 | | | | 07/01/2035 | | | | 6,601,320 | |
| 2,000,000 | | Westmoreland County, PA Municipal Authority | | | 5.000 | | | | 08/15/2038 | | | | 2,284,580 | |
| 2,600,000 | | Wilkes-Barre, PA Area School District | | | 5.000 | | | | 08/01/2034 | | | | 2,938,702 | |
| 2,125,000 | | Wilkes-Barre, PA Area School District | | | 5.000 | | | | 08/01/2036 | | | | 2,390,795 | |
| | | | | | | | | | | | | 557,026,460 | |
| U.S. Possessions—29.0% | | | | | | | | | | | | |
| 700,000 | | Guam Hsg. Corp. (Single Family Mtg.) | | | 5.750 | | | | 09/01/2031 | | | | 732,907 | |
| 185,000 | | Guam Power Authority, Series A | | | 5.000 | | | | 10/01/2023 | | | | 212,476 | |
| 235,000 | | Guam Power Authority, Series A | | | 5.000 | | | | 10/01/2024 | | | | 268,196 | |
| 420,000 | | Guam Power Authority, Series A | | | 5.000 | | | | 10/01/2030 | | | | 471,177 | |
| 670,000 | | Northern Mariana Islands Commonwealth, Series A | | | 5.000 | | | | 10/01/2022 | | | | 643,367 | |
| 1,240,000 | | Northern Mariana Islands Ports Authority, Series A | | | 6.250 | | | | 03/15/2028 | | | | 1,088,125 | |
| 915,000 | | Northern Mariana Islands Ports Authority, Series A | | | 6.600 | | | | 03/15/2028 | | | | 888,794 | |
| 3,000,000 | | Puerto Rico Aqueduct & Sewer Authority | | | 5.125 | | | | 07/01/2037 | | | | 2,412,180 | |
| 810,000 | | Puerto Rico Aqueduct & Sewer Authority | | | 5.250 | | | | 07/01/2029 | | | | 661,900 | |
| 1,460,000 | | Puerto Rico Aqueduct & Sewer Authority | | | 5.750 | | | | 07/01/2037 | | | | 1,192,002 | |
|
| 26 OPPENHEIMER ROCHESTER PENNSYLVANIA MUNICIPAL FUND |
| | | | | | | | | | | | | | |
Principal
Amount | | | | Coupon | | | Maturity | | | Value | |
| U.S. Possessions (Continued) | | | | | | | | | | | | |
| $1,005,000 | | Puerto Rico Aqueduct & Sewer Authority | | | 6.000% | | | | 07/01/2047 | | | $ | 837,245 | |
| 2,250,000 | | Puerto Rico Aqueduct & Sewer Authority | | | 6.125 4 | | | | 07/01/2024 | | | | 1,932,795 | |
| 37,070,000 | | Puerto Rico Children’s Trust Fund (TASC) | | | 5.500 | | | | 05/15/2039 | | | | 36,766,026 | |
| 29,590,000 | | Puerto Rico Children’s Trust Fund (TASC) | | | 5.625 | | | | 05/15/2043 | | | | 29,190,831 | |
| 53,320,000 | | Puerto Rico Children’s Trust Fund (TASC) | | | 7.153 7 | | | | 05/15/2050 | | | | 6,095,542 | |
| 926,500,000 | | Puerto Rico Children’s Trust Fund (TASC) | | | 7.622 7 | | | | 05/15/2057 | | | | 36,226,150 | |
| 2,000,000 | | Puerto Rico Commonwealth GO6 | | | 5.000 | | | | 07/01/2020 | | | | 1,135,000 | |
| 3,000,000 | | Puerto Rico Commonwealth GO6 | | | 5.125 | | | | 07/01/2028 | | | | 1,702,500 | |
| 2,500,000 | | Puerto Rico Commonwealth GO6 | | | 5.375 | | | | 07/01/2033 | | | | 1,418,750 | |
| 5,000,000 | | Puerto Rico Commonwealth GO6 | | | 5.500 | | | | 07/01/2026 | | | | 2,837,500 | |
| 7,360,000 | | Puerto Rico Commonwealth GO6 | | | 5.500 | | | | 07/01/2039 | | | | 4,176,800 | |
| 9,000,000 | | Puerto Rico Commonwealth GO6 | | | 5.750 | | | | 07/01/2036 | | | | 5,107,500 | |
| 3,000,000 | | Puerto Rico Commonwealth GO6 | | | 5.750 | | | | 07/01/2041 | | | | 1,702,500 | |
| 15,000 | | Puerto Rico Commonwealth GO, NPFGC | | | 6.000 | | | | 07/01/2027 | | | | 15,479 | |
| 790,000 | | Puerto Rico Commonwealth GO6 | | | 6.000 | | | | 07/01/2028 | | | | 448,325 | |
| 13,500,000 | | Puerto Rico Commonwealth GO6 | | | 8.000 | | | | 07/01/2035 | | | | 8,100,000 | |
| 403,060 | | Puerto Rico Electric Power Authority6 | | | 10.000 | | | | 07/01/2019 | | | | 246,765 | |
| 403,059 | | Puerto Rico Electric Power Authority6 | | | 10.000 | | | | 07/01/2019 | | | | 246,765 | |
| 336,338 | | Puerto Rico Electric Power Authority6 | | | 10.000 | | | | 01/01/2021 | | | | 206,098 | |
| 336,339 | | Puerto Rico Electric Power Authority6 | | | 10.000 | | | | 07/01/2021 | | | | 206,159 | |
| 112,113 | | Puerto Rico Electric Power Authority6 | | | 10.000 | | | | 01/01/2022 | | | | 68,809 | |
| 112,113 | | Puerto Rico Electric Power Authority6 | | | 10.000 | | | | 07/01/2022 | | | | 68,809 | |
| 4,920,000 | | Puerto Rico Electric Power Authority, Series A6 | | | 5.000 | | | | 07/01/2029 | | | | 3,001,200 | |
| 3,325,000 | | Puerto Rico Electric Power Authority, Series A6 | | | 5.000 | | | | 07/01/2042 | | | | 2,028,250 | |
| 3,000,000 | | Puerto Rico Electric Power Authority, Series A6 | | | 6.750 | | | | 07/01/2036 | | | | 1,830,000 | |
| 1,435,000 | | Puerto Rico Electric Power Authority, Series AAA6 | | | 5.250 | | | | 07/01/2024 | | | | 875,350 | |
| 1,510,000 | | Puerto Rico Electric Power Authority, Series AAA6 | | | 5.250 | | | | 07/01/2025 | | | | 921,100 | |
| 5,540,000 | | Puerto Rico Electric Power Authority, Series AAA6 | | | 5.250 | | | | 07/01/2027 | | | | 3,379,400 | |
| 1,760,000 | | Puerto Rico Electric Power Authority, Series AAA6 | | | 5.250 | | | | 07/01/2030 | | | | 1,073,600 | |
| 3,505,000 | | Puerto Rico Electric Power Authority, Series AAA6 | | | 5.250 | | | | 07/01/2031 | | | | 2,138,050 | |
| 3,000,000 | | Puerto Rico Electric Power Authority, Series CCC6 | | | 5.250 | | | | 07/01/2027 | | | | 1,830,000 | |
| 6,000,000 | | Puerto Rico Electric Power Authority, Series SS, NPFGC | | | 5.000 | | | | 07/01/2025 | | | | 6,067,440 | |
| 1,450,000 | | Puerto Rico Electric Power Authority, Series TT6 | | | 5.000 | | | | 07/01/2032 | | | | 884,500 | |
| 1,670,000 | | Puerto Rico Electric Power Authority, Series WW6 | | | 5.000 | | | | 07/01/2028 | | | | 1,018,700 | |
| 2,445,000 | | Puerto Rico Electric Power Authority, Series XX6 | | | 5.250 | | | | 07/01/2040 | | | | 1,491,450 | |
| 725,000 | | Puerto Rico Electric Power Authority, Series ZZ6 | | | 5.000 | | | | 07/01/2022 | | | | 442,250 | |
| 1,000,000 | | Puerto Rico Highway & Transportation Authority6 | | | 5.300 | | | | 07/01/2035 | | | | 590,980 | |
| 10,000 | | Puerto Rico Highway & Transportation Authority, Series A6 | | | 5.000 | | | | 07/01/2038 | | | | 2,462 | |
| 325,000 | | Puerto Rico Highway & Transportation Authority, Series H6 | | | 5.000 | | | | 07/01/2028 | | | | 80,031 | |
| 270,000 | | Puerto Rico Infrastructure3 | | | 5.000 | | | | 07/01/2041 | | | | 19,575 | |
| 1,400,000 | | Puerto Rico Infrastructure (Mepsi Campus)6 | | | 6.500 | | | | 10/01/2037 | | | | 693,546 | |
| 200,000 | | Puerto Rico ITEMECF (Ana G. Mendez University) | | | 5.000 | | | | 04/01/2027 | | | | 197,186 | |
| 1,250,000 | | Puerto Rico ITEMECF (Ana G. Mendez University) | | | 5.000 | | | | 03/01/2036 | | | | 1,138,438 | |
| 125,000 | | Puerto Rico ITEMECF (Ana G. Mendez University) | | | 5.125 | | | | 04/01/2032 | | | | 119,224 | |
| 185,000 | | Puerto Rico ITEMECF (Ana G. Mendez University) | | | 5.375 | | | | 04/01/2042 | | | | 173,356 | |
|
| 27 OPPENHEIMER ROCHESTER PENNSYLVANIA MUNICIPAL FUND |
STATEMENT OF INVESTMENTS Continued
| | | | | | | | | | | | | | |
Principal
Amount | | | | Coupon | | | Maturity | | | Value | |
| U.S. Possessions (Continued) | | | | | | | | | | | | |
| $190,000 | | Puerto Rico ITEMECF (IEP/HESL/HECR Obligated Group) | | | 5.750% | | | | 06/01/2019 | | | $ | 151,981 | |
| 1,265,000 | | Puerto Rico Public Buildings Authority6 | | | 6.000 | | | | 07/01/2019 | | | | 679,937 | |
| 2,070,000 | | Puerto Rico Public Buildings Authority3 | | | 6.000 | | | | 07/01/2041 | | | | 1,102,275 | |
| 1,500,000 | | Puerto Rico Public Buildings Authority6 | | | 6.500 | | | | 07/01/2030 | | | | 810,000 | |
| 1,000,000 | | Puerto Rico Public Buildings Authority3 | | | 6.750 | | | | 07/01/2036 | | | | 535,000 | |
| 3,000,000 | | Puerto Rico Public Buildings Authority6 | | | 10.000 | | | | 07/01/2034 | | | | 1,582,500 | |
| 1,015,000 | | Puerto Rico Public Buildings Authority, Series D6 | | | 5.250 | | | | 07/01/2036 | | | | 530,338 | |
| 5,725,000 | | Puerto Rico Public Finance Corp., Series B6 | | | 5.500 | | | | 08/01/2031 | | | | 157,438 | |
| 5,000,000 | | Puerto Rico Sales Tax Financing Corp., Series A6 | | | 5.375 | | | | 08/01/2039 | | | | 1,343,750 | |
| 7,385,000 | | Puerto Rico Sales Tax Financing Corp., Series A6 | | | 5.500 | | | | 08/01/2037 | | | | 1,984,719 | |
| 950,000 | | Puerto Rico Sales Tax Financing Corp., Series A6 | | | 5.500 | | | | 08/01/2042 | | | | 255,313 | |
| 5,000,000 | | Puerto Rico Sales Tax Financing Corp., Series A6 | | | 5.750 | | | | 08/01/2037 | | | | 1,343,750 | |
| 5,000,000 | | Puerto Rico Sales Tax Financing Corp., Series A6 | | | 6.375 | | | | 08/01/2039 | | | | 1,343,750 | |
| 3,000,000 | | Puerto Rico Sales Tax Financing Corp., Series A6 | | | 6.500 | | | | 08/01/2044 | | | | 806,250 | |
| 30,000,000 | | Puerto Rico Sales Tax Financing Corp., Series A6 | | | 7.276 7 | | | | 08/01/2034 | | | | 2,281,200 | |
| 18,015,000 | | Puerto Rico Sales Tax Financing Corp., Series C6 | | | 5.711 7 | | | | 08/01/2038 | | | | 1,145,934 | |
| 22,130,000 | | Puerto Rico Sales Tax Financing Corp., Series C6 | | | 5.750 | | | | 08/01/2057 | | | | 13,692,938 | |
| 5,500,000 | | Puerto Rico Sales Tax Financing Corp., Series C6 | | | 6.000 | | | | 08/01/2039 | | | | 1,478,125 | |
| 1,000,000 | | Puerto Rico Sales Tax Financing Corp., Series C6 | | | 6.000 | | | | 08/01/2042 | | | | 268,750 | |
| 3,235,000 | | University of Puerto Rico, Series P | | | 5.000 | | | | 06/01/2030 | | | | 1,617,500 | |
| 1,300,000 | | University of Puerto Rico, Series Q | | | 5.000 | | | | 06/01/2030 | | | | 650,000 | |
| 2,500,000 | | V.I. Public Finance Authority, Series C | | | 5.000 | | | | 10/01/2039 | | | | 1,826,150 | |
| 17,450,000 | | V.I. Tobacco Settlement Financing Corp. | | | 6.247 7 | | | | 05/15/2035 | | | | 3,311,138 | |
| 2,195,000 | | V.I. Tobacco Settlement Financing Corp. | | | 6.497 7 | | | | 05/15/2035 | | | | 354,580 | |
| 4,150,000 | | V.I. Tobacco Settlement Financing Corp. | | | 6.872 7 | | | | 05/15/2035 | | | | 621,048 | |
| 7,000,000 | | V.I. Tobacco Settlement Financing Corp. | | | 7.622 7 | | | | 05/15/2035 | | | | 697,900 | |
| 1,715,000 | | V.I. Tobacco Settlement Financing Corp. (TASC) | | | 5.000 | | | | 05/15/2031 | | | | 1,704,916 | |
| | | | | | | | | | | | | 219,580,740 | |
| Total Investments, at Value (Cost $871,248,933)—102.6% | | | | | | | | | | | 776,607,200 | |
| Net Other Assets (Liabilities)—(2.6) | | | | | | | | | | | (19,482,838 | ) |
| Net Assets—100.0% | | | | | | | | | | $ | 757,124,362 | |
| | | | | | | | | | | | | | |
Footnotes to Statement of Investments
1. All or a portion of the security position is when-issued or delayed delivery to be delivered and settled after period end. See Note 4 of the accompanying Notes.
2. Security represents the underlying municipal bond with respect to an inverse floating rate security held by the Fund. The bond was purchased by the Fund and subsequently transferred to a trust, which issued the related inverse floating rate security. See Note 4 of the accompanying Notes.
3. This security is accruing partial income at an anticipated effective rate based on expected interest and/or principal payments. The rate shown is the contractual interest rate.
4. Denotes a step bond: a zero coupon bond that converts to a fixed or variable interest rate at a designated future date.
5. Interest or dividend is paid-in-kind, when applicable.
6. This security is not accruing income because its issuer has missed or is expected to miss interest and/or principal payments. The rate shown is the contractual interest rate. See Note 4 of the accompanying Notes.
|
| 28 OPPENHEIMER ROCHESTER PENNSYLVANIA MUNICIPAL FUND |
Footnotes to Statement of Investments (Continued)
7. Zero coupon bond reflects effective yield on the original acquisition date.
To simplify the listings of securities, abbreviations are used per the table below:
| | |
| ACTS | | Adult Communities Total Services, Inc. |
| AHlth | | Abington Health |
| AHlthF | | Abington Health Foundation |
| AHSys | | Aria Health System |
| AMH | | Abington Memorial Hospital |
| AMS | | ACTS Management Services, Inc. |
| AriaH | | Aria Health |
| ARLC | | ACTS Retirement-Life Communities, Inc. |
| ASCS | | ACTS Signature Community Services, Inc. |
| ATI | | Azalea Trace, Inc. |
| EDFA | | Economic Devel. Finance Authority |
| GO | | General Obligation |
| GPA | | General Purpose Authority |
| H&EFA | | Health and Educational Facilities Authority |
| H&HEFA | | Hospitals and Higher Education Facilities Authority |
| HDA | | Hospital Devel. Authority |
| HEBA | | Higher Education Building Authority |
| HECR | | Hospital Episcopal Cristo Redentor |
| HEFA | | Higher Education Facilities Authority |
| HEHA | | Higher Education and Health Authority |
| HESL | | Hospital Episcopal San Lucas |
| IDA | | Industrial Devel. Agency |
| IEP | | Iglesia Episcopal Puertorriquena |
| IRSch | | Iron Range School |
| ITEMECF | | Industrial, Tourist, Educational, Medical and Environmental Community Facilities |
| JUP | | Jefferson University Physicians |
| KC | | Kidspeace Corporation |
| KCH | | Kidspeace Childrens Hospital |
| KMAKNC | | Kidspeace Mesabi Academy |
| KNCONM | | Kidspeace National Centers of North America |
| KNCONY | | Kidspeace National Centers of New York |
| LHosp | | Landsdale Hospital |
| LVE | | Lanier Village Estates, Inc. |
| MAS | | Mercy Adult Services |
| MCMCSPA | | Mercy Catholic Medical Center of Southeastern Pennsylvania |
| MHH | | Mercy Haverford Foundation |
| MHP | | Mercy Health Plan |
| MHSSPA | | Mercy Health System of Southeastern Pennsylvania |
| NPFGC | | National Public Finance Guarantee Corp. |
| ReR | | Residential Resources |
| RRDC | | Residential Resources Devel. Corp. |
| RRSW | | Residential Resources Southwest |
| TASC | | Tobacco Settlement Asset-Backed Bonds |
| TJU | | Thomas Jefferson University |
| TJUH | | Thomas Jefferson University Hospital |
| TJUHS | | TJUH System |
| UPMC | | University of Pittsburgh Medical Center |
|
| 29 OPPENHEIMER ROCHESTER PENNSYLVANIA MUNICIPAL FUND |
STATEMENT OF INVESTMENTS Continued
To simplify the listings of securities, abbreviations are used per the table below: (Continued)
| | |
| V.I. | | United States Virgin Islands |
See accompanying Notes to Financial Statements.
|
| 30 OPPENHEIMER ROCHESTER PENNSYLVANIA MUNICIPAL FUND |
STATEMENT OF ASSETS AND LIABILITIES July 31, 2017
| | | | |
| Assets | | | | |
Investments, at value (cost $871,248,933)—see accompanying statement of investments | | $ | 776,607,200 | |
Cash | | | 674,232 | |
Receivables and other assets: | | | | |
Interest | | | 7,422,293 | |
Investments sold on a when-issued or delayed delivery basis | | | 6,119,726 | |
Shares of beneficial interest sold | | | 593,734 | |
Other | | | 262,658 | |
| | | | |
Total assets | | | 791,679,843 | |
| Liabilities | | | | |
Payables and other liabilities: | | | | |
Payable for short-term floating rate notes issued (See Note 4) | | | 25,460,000 | |
Investments purchased on a when-issued or delayed delivery basis | | | 7,376,480 | |
Shares of beneficial interest redeemed | | | 725,416 | |
Dividends | | | 633,395 | |
Distribution and service plan fees | | | 132,606 | |
Trustees’ compensation | | | 127,512 | |
Shareholder communications | | | 6,560 | |
Interest expense on borrowings | | | 369 | |
Other | | | 93,143 | |
| | | | |
Total liabilities | | | 34,555,481 | |
| Net Assets | | $ | 757,124,362 | |
| | | | |
| | | | |
| Composition of Net Assets | | | | |
Paid-in capital | | $ | 941,311,443 | |
Accumulated net investment loss | | | (1,280,355) | |
Accumulated net realized loss on investments | | | (88,264,993) | |
Net unrealized depreciation on investments | | | (94,641,733) | |
| | | | |
| Net Assets | | $ | 757,124,362 | |
| | | | |
|
| 31 OPPENHEIMER ROCHESTER PENNSYLVANIA MUNICIPAL FUND |
STATEMENT OF ASSETS AND LIABILITIES Continued
| | | | |
| Net Asset Value Per Share | | | | |
Class A Shares: | | | | |
| |
| Net asset value and redemption price per share (based on net assets of $500,339,885 and 47,913,219 shares of beneficial interest outstanding) | | $ | 10.44 | |
Maximum offering price per share (net asset value plus sales charge of 4.75% of offering price) | | $ | 10.96 | |
| |
Class B Shares: | | | | |
| Net asset value, redemption price (excludes applicable contingent deferred sales charge) and offering price per share (based on net assets of $2,703,407 and 259,061 shares of beneficial interest outstanding) | | $ | 10.44 | |
| |
Class C Shares: | | | | |
| Net asset value, redemption price (excludes applicable contingent deferred sales charge) and offering price per share (based on net assets of $199,497,005 and 19,153,690 shares of beneficial interest outstanding) | | $ | 10.42 | |
| |
Class Y Shares: | | | | |
| |
| Net asset value, redemption price and offering price per share (based on net assets of $54,584,065 and 5,224,153 shares of beneficial interest outstanding) | | $ | 10.45 | |
See accompanying Notes to Financial Statements.
|
| 32 OPPENHEIMER ROCHESTER PENNSYLVANIA MUNICIPAL FUND |
STATEMENT OF OPERATIONS For the Year Ended July 31, 2017
| | | | |
| Investment Income | | | | |
Interest | | $ | 41,997,892 | |
| Expenses | | | | |
Management fees | | | 3,928,108 | |
Distribution and service plan fees: | | | | |
Class A | | | 911,821 | |
Class B | | | 35,385 | |
Class C | | | 1,886,722 | |
Transfer and shareholder servicing agent fees: | | | | |
Class A | | | 509,710 | |
Class B | | | 3,931 | |
Class C | | | 209,907 | |
Class Y | | | 39,862 | |
Shareholder communications: | | | | |
Class A | | | 16,882 | |
Class B | | | 279 | |
Class C | | | 8,140 | |
Class Y | | | 1,570 | |
Borrowing fees | | | 724,058 | |
Interest expense and fees on short-term floating rate notes issued (See Note 4) | | | 452,010 | |
Interest expense on borrowings | | | 122,911 | |
Trustees’ compensation | | | 11,693 | |
Custodian fees and expenses | | | 4,805 | |
Other | | | 257,752 | |
| | | | |
Total expenses | | | 9,125,546 | |
Net Investment Income | | | 32,872,346 | |
| Realized and Unrealized Loss | | | | |
Net realized loss on investments | | | (9,483,626) | |
| |
Net change in unrealized appreciation/depreciation on investment transactions | | | (1,942,210) | |
| Net Increase in Net Assets Resulting from Operations | | $ | 21,446,510 | |
| | | | |
See accompanying Notes to Financial Statements.
|
| 33 OPPENHEIMER ROCHESTER PENNSYLVANIA MUNICIPAL FUND |
STATEMENTS OF CHANGES IN NET ASSETS
| | | | | | | | |
| | | Year Ended
July 31, 2017 | | | Year Ended
July 31, 2016 | |
| Operations | | | | | | | | |
Net investment income | | $ | 32,872,346 | | | $ | 42,728,226 | |
Net realized loss | | | (9,483,626) | | | | (11,884,369) | |
Net change in unrealized appreciation/depreciation | | | (1,942,210) | | | | 26,543,186 | |
| | | | |
Net increase in net assets resulting from operations | | | 21,446,510 | | | | 57,387,043 | |
| Dividends and/or Distributions to Shareholders | | | | | | | | |
Dividends from net investment income: | | | | | | | | |
Class A | | | (26,488,471) | | | | (30,999,892) | |
Class B | | | (175,422) | | | | (384,932) | |
Class C | | | (9,427,119) | | | | (11,134,209) | |
Class Y | | | (2,143,487) | | | | (1,674,134) | |
| | | | |
| | | (38,234,499) | | | | (44,193,167) | |
| Beneficial Interest Transactions | | | | | | | | |
Net increase (decrease) in net assets resulting from beneficial interest transactions: | | | | | | | | |
Class A | | | (14,663,846) | | | | (34,894,701) | |
Class B | | | (2,888,195) | | | | (5,479,741) | |
Class C | | | (16,468,612) | | | | (9,147,900) | |
Class Y | | | 24,874,445 | | | | 730,375 | |
| | | | |
| | | (9,146,208) | | | | (48,791,967) | |
| Net Assets | | | | | | | | |
Total decrease | | | (25,934,197) | | | | (35,598,091) | |
| |
Beginning of period | | | 783,058,559 | | | | 818,656,650 | |
| | | | |
| End of period (including accumulated net investment income (loss) of $(1,280,355) and $4,994,389, respectively) | | $ | 757,124,362 | | | $ | 783,058,559 | |
| | | | |
See accompanying Notes to Financial Statements.
|
| 34 OPPENHEIMER ROCHESTER PENNSYLVANIA MUNICIPAL FUND |
STATEMENT OF CASH FLOWS For the Year Ended July 31, 2017
| | | | |
| Cash Flows from Operating Activities | | | | |
Net increase in net assets from operations | | $ | 21,446,510 | |
Adjustments to reconcile net increase in net assets from operations to net cash provided by operating activities: | | | | |
Purchase of investment securities | | | (156,530,753) | |
Proceeds from disposition of investment securities | | | 195,802,968 | |
Short-term investment securities, net | | | 823,531 | |
Premium amortization | | | 3,428,235 | |
Discount accretion | | | (9,586,458) | |
Net realized loss on investments | | | 9,483,626 | |
Net change in unrealized appreciation/depreciation on investment transactions | | | 1,942,210 | |
Change in assets: | | | | |
Decrease in other assets | | | 9,786 | |
Decrease in interest receivable | | | 2,002,818 | |
Increase in receivable for securities sold | | | (3,377,960) | |
Change in liabilities: | | | | |
Increase in other liabilities | | | 47,802 | |
Increase in payable for securities purchased | | | 3,825,460 | |
| | | | |
Net cash provided by operating activities | | | 69,317,775 | |
| Cash Flows from Financing Activities | | | | |
Proceeds from borrowings | | | 134,800,000 | |
Payments on borrowings | | | (147,000,000) | |
Payments on short-term floating rate notes issued | | | (9,935,000) | |
Proceeds from shares sold | | | 109,693,300 | |
Payments on shares redeemed | | | (151,435,470) | |
Cash distributions paid | | | (5,296,399) | |
| | | | |
Net cash used in financing activities | | | (69,173,569) | |
Net increase in cash | | | 144,206 | |
Cash, beginning balance | | | 530,026 | |
| | | | |
Cash, ending balance | | $ | 674,232 | |
| | | | |
Supplemental disclosure of cash flow information:
Noncash financing activities not included herein consist of reinvestment of dividends and distributions of $32,885,370.
Cash paid for interest on borrowings—$124,040.
Cash paid for interest on short-term floating rate notes issued—$452,010.
See accompanying Notes to Financial Statements.
|
| 35 OPPENHEIMER ROCHESTER PENNSYLVANIA MUNICIPAL FUND |
FINANCIAL HIGHLIGHTS
| | | | | | | | | | | | | | | | | | | | |
| Class A | | Year Ended
July 31, 2017 | | | Year Ended
July 31, 2016 | | | Year Ended
July 31, 2015 | | | Year Ended
July 31, 2014 | | | Year Ended
July 31, 2013 | |
| |
| Per Share Operating Data | | | | | | | | | | | | | | | | | | | | |
| Net asset value, beginning of period | | | $10.67 | | | | $10.49 | | | | $10.38 | | | | $10.53 | | | | $11.47 | |
| |
| Income (loss) from investment operations: | | | | | | | | | | | | | | | | | | | | |
| Net investment income1 | | | 0.47 | | | | 0.59 | | | | 0.63 | | | | 0.67 | | | | 0.61 | |
| Net realized and unrealized gain (loss) | | | (0.16) | | | | 0.20 | | | | 0.09 | | | | (0.22) | | | | (0.94) | |
| | | | |
| Total from investment operations | | | 0.31 | | | | 0.79 | | | | 0.72 | | | | 0.45 | | | | (0.33) | |
| |
| Dividends and/or distributions to shareholders: | | | | | | | | | | | | | | | | | | | | |
| Dividends from net investment income | | | (0.54) | | | | (0.61) | | | | (0.61) | | | | (0.60) | | | | (0.61) | |
| |
| Net asset value, end of period | | | $10.44 | | | | $10.67 | | | | $10.49 | | | | $10.38 | | | | $10.53 | |
| | | | |
| | | | | | | | | | | | | | | | | | | | |
| Total Return, at Net Asset Value2 | | | 2.96% | | | | 7.84% | | | | 6.98% | | | | 4.57% | | | | (3.13)% | |
| | | | | |
| | | | | | | | | | | | | | | | | | | | |
| Ratios/Supplemental Data | | | | | | | | | | | | | | | | | | | | |
| Net assets, end of period (in thousands) | | | $500,340 | | | | $526,247 | | | | $552,146 | | | | $586,870 | | | | $737,142 | |
| |
| Average net assets (in thousands) | | | $509,600 | | | | $537,284 | | | | $589,000 | | | | $624,096 | | | | $812,430 | |
| |
| Ratios to average net assets:3 | | | | | | | | | | | | | | | | | | | | |
| Net investment income | | | 4.50% | | | | 5.59% | | | | 5.93% | | | | 6.60% | | | | 5.32% | |
| Expenses excluding specific expenses listed below | | | 0.83% | | | | 0.80% | | | | 0.77% | | | | 0.76% | | | | 0.69% | |
| Interest and fees from borrowings | | | 0.11% | | | | 0.11% | | | | 0.11% | | | | 0.14% | | | | 0.09% | |
| Interest and fees on short-term floating rate notes issued4 | | | 0.06% | | | | 0.06% | | | | 0.07% | | | | 0.13% | | | | 0.11% | |
| | | | |
| Total expenses | | | 1.00% | | | | 0.97% | | | | 0.95% | | | | 1.03% | | | | 0.89% | |
| Expenses after payments, waivers and/or reimbursements and reduction to custodian expenses | | | 1.00% | | | | 0.97% | | | | 0.95% | | | | 1.03%5 | | | | 0.88% | |
| |
| Portfolio turnover rate | | | 20% | | | | 6% | | | | 12% | | | | 6% | | | | 10% | |
|
| 36 OPPENHEIMER ROCHESTER PENNSYLVANIA MUNICIPAL FUND |
1. Per share amounts calculated based on the average shares outstanding during the period.
2. Assumes an initial investment on the business day before the first day of the fiscal period, with all dividends and distributions reinvested in additional shares on the reinvestment date, and redemption at the net asset value calculated on the last business day of the fiscal period. Sales charges are not reflected in the total returns. Total returns are not annualized for periods less than one full year. Returns do not reflect the deduction of taxes that a shareholder would pay on fund distributions or the redemption of fund shares.
3. Annualized for periods less than one full year.
4. Interest and fee expense related to the Fund’s liability for short-term floating rate notes issued in conjunction with inverse floating rate security transactions.
5. Waiver was less than 0.005%.
See accompanying Notes to Financial Statements.
|
| 37 OPPENHEIMER ROCHESTER PENNSYLVANIA MUNICIPAL FUND |
FINANCIAL HIGHLIGHTS Continued
| | | | | | | | | | | | | | | | | | | | |
| Class B | | Year Ended
July 31, 2017 | | | Year Ended
July 31, 2016 | | | Year Ended
July 31, 2015 | | | Year Ended
July 31, 2014 | | | Year Ended
July 31, 2013 | |
| |
| Per Share Operating Data | | | | | | | | | | | | | | | | | | | | |
| Net asset value, beginning of period | | | $10.66 | | | | $10.49 | | | | $10.37 | | | | $10.52 | | | | $11.47 | |
| |
| Income (loss) from investment operations: | | | | | | | | | | | | | | | | | | | | |
| Net investment income1 | | | 0.41 | | | | 0.51 | | | | 0.55 | | | | 0.59 | | | | 0.51 | |
| Net realized and unrealized gain (loss) | | | (0.16) | | | | 0.19 | | | | 0.10 | | | | (0.22) | | | | (0.95) | |
| | | | |
| Total from investment operations | | | 0.25 | | | | 0.70 | | | | 0.65 | | | | 0.37 | | | | (0.44) | |
| |
| Dividends and/or distributions to shareholders: | | | | | | | | | | | | | | | | | | | | |
| Dividends from net investment income | | | (0.47) | | | | (0.53) | | | | (0.53) | | | | (0.52) | | | | (0.51) | |
| |
| Net asset value, end of period | | | $10.44 | | | | $10.66 | | | | $10.49 | | | | $10.37 | | | | $10.52 | |
| | | | |
| | | | | | | | | | | | | | | | | | | | |
| Total Return, at Net Asset Value2 | | | 2.22% | | | | 7.04% | | | | 6.27% | | | | 3.75% | | | | (4.03)% | |
| | | | | |
| | | | | | | | | | | | | | | | | | | | |
| Ratios/Supplemental Data | | | | | | | | | | | | | | | | | | | | |
| Net assets, end of period (in thousands) | | | $2,703 | | | | $5,686 | | | | $11,078 | | | | $16,828 | | | | $26,479 | |
| |
| Average net assets (in thousands) | | | $3,917 | | | | $7,651 | | | | $14,523 | | | | $20,693 | | | | $35,453 | |
| |
| Ratios to average net assets:3 | | | | | | | | | | | | | | | | | | | | |
| Net investment income | | | 3.95% | | | | 4.89% | | | | 5.14% | | | | 5.82% | | | | 4.47% | |
| Expenses excluding specific expenses listed below | | | 1.56% | | | | 1.55% | | | | 1.53% | | | | 1.56% | | | | 1.53% | |
| Interest and fees from borrowings | | | 0.11% | | | | 0.11% | | | | 0.11% | | | | 0.14% | | | | 0.09% | |
| Interest and fees on short-term floating rate notes issued4 | | | 0.06% | | | | 0.06% | | | | 0.07% | | | | 0.13% | | | | 0.11% | |
| | | | |
| Total expenses | | | 1.73% | | | | 1.72% | | | | 1.71% | | | | 1.83% | | | | 1.73% | |
| Expenses after payments, waivers and/or reimbursements and reduction to custodian expenses | | | 1.73% | | | | 1.72% | | | | 1.71% | | |
| 1.83%5
|
| | | 1.72% | |
| |
| Portfolio turnover rate | | | 20% | | | | 6% | | | | 12% | | | | 6% | | | | 10% | |
|
| 38 OPPENHEIMER ROCHESTER PENNSYLVANIA MUNICIPAL FUND |
1. Per share amounts calculated based on the average shares outstanding during the period.
2. Assumes an initial investment on the business day before the first day of the fiscal period, with all dividends and distributions reinvested in additional shares on the reinvestment date, and redemption at the net asset value calculated on the last business day of the fiscal period. Sales charges are not reflected in the total returns. Total returns are not annualized for periods less than one full year. Returns do not reflect the deduction of taxes that a shareholder would pay on fund distributions or the redemption of fund shares.
3. Annualized for periods less than one full year.
4. Interest and fee expense related to the Fund’s liability for short-term floating rate notes issued in conjunction with inverse floating rate security transactions.
5. Waiver was less than 0.005%.
See accompanying Notes to Financial Statements.
|
| 39 OPPENHEIMER ROCHESTER PENNSYLVANIA MUNICIPAL FUND |
FINANCIAL HIGHLIGHTS Continued
| | | | | | | | | | | | | | | | | | | | |
| Class C | | Year Ended
July 31, 2017 | | | Year Ended
July 31, 2016 | | | Year Ended
July 31, 2015 | | | Year Ended
July 31, 2014 | | | Year Ended
July 31, 2013 | |
| |
| Per Share Operating Data | | | | | | | | | | | | | | | | | | | | |
| Net asset value, beginning of period | | | $10.64 | | | | $10.47 | | | | $10.36 | | | | $10.51 | | | | $11.45 | |
| |
| Income (loss) from investment operations: | | | | | | | | | | | | | | | | | | | | |
| Net investment income1 | | | 0.40 | | | | 0.51 | | | | 0.55 | | | | 0.60 | | | | 0.52 | |
| Net realized and unrealized gain (loss) | | | (0.15) | | | | 0.19 | | | | 0.09 | | | | (0.22) | | | | (0.94) | |
| | | | |
| Total from investment operations | | | 0.25 | | | | 0.70 | | | | 0.64 | | | | 0.38 | | | | (0.42) | |
| |
| Dividends and/or distributions to shareholders: | | | | | | | | | | | | | | | | | | | | |
| Dividends from net investment income | | | (0.47) | | | | (0.53) | | | | (0.53) | | | | (0.53) | | | | (0.52) | |
| |
| Net asset value, end of period | | | $10.42 | | | | $10.64 | | | | $10.47 | | | | $10.36 | | | | $10.51 | |
| | | | |
| | | | | | | | | | | | | | | | | | | | |
| Total Return, at Net Asset Value2 | | | 2.23% | | | | 7.06% | | | | 6.19% | | | | 3.79% | | | | (3.88)% | |
| | | | | |
| | | | | | | | | | | | | | | | | | | | |
| Ratios/Supplemental Data | | | | | | | | | | | | | | | | | | | | |
| Net assets, end of period (in thousands) | | | $199,497 | | | | $220,769 | | | | $226,296 | | | | $236,269 | | | | $304,243 | |
| |
| Average net assets (in thousands) | | | $209,822 | | | | $221,129 | | | | $239,680 | | | | $255,808 | | | | $342,161 | |
| |
| Ratios to average net assets:3 | | | | | | | | | | | | | | | | | | | | |
| Net investment income | | | 3.79% | | | | 4.84% | | | | 5.17% | | | | 5.84% | | | | 4.55% | |
| Expenses excluding specific expenses listed below | | | 1.56% | | | | 1.55% | | | | 1.52% | | | | 1.52% | | | | 1.46% | |
| Interest and fees from borrowings | | | 0.11% | | | | 0.11% | | | | 0.11% | | | | 0.14% | | | | 0.09% | |
| Interest and fees on short-term floating rate notes issued4 | | | 0.06% | | | | 0.06% | | | | 0.07% | | | | 0.13% | | | | 0.11% | |
| | | | |
| Total expenses | | | 1.73% | | | | 1.72% | | | | 1.70% | | | | 1.79% | | | | 1.66% | |
| Expenses after payments, waivers and/or reimbursements and reduction to custodian expenses | | | 1.73% | | | | 1.72% | | | | 1.70% | | | | 1.79%5 | | | | 1.65% | |
| |
| Portfolio turnover rate | | | 20% | | | | 6% | | | | 12% | | | | 6% | | | | 10% | |
|
| 40 OPPENHEIMER ROCHESTER PENNSYLVANIA MUNICIPAL FUND |
1. Per share amounts calculated based on the average shares outstanding during the period.
2. Assumes an initial investment on the business day before the first day of the fiscal period, with all dividends and distributions reinvested in additional shares on the reinvestment date, and redemption at the net asset value calculated on the last business day of the fiscal period. Sales charges are not reflected in the total returns. Total returns are not annualized for periods less than one full year. Returns do not reflect the deduction of taxes that a shareholder would pay on fund distributions or the redemption of fund shares.
3. Annualized for periods less than one full year.
4. Interest and fee expense related to the Fund’s liability for short-term floating rate notes issued in conjunction with inverse floating rate security transactions.
5. Waiver was less than 0.005%.
See accompanying Notes to Financial Statements.
|
| 41 OPPENHEIMER ROCHESTER PENNSYLVANIA MUNICIPAL FUND |
FINANCIAL HIGHLIGHTS Continued
| | | | | | | | | | | | | | | | | | | | |
| Class Y | | Year Ended
July 31, 2017 | | | Year Ended
July 31, 2016 | | | Year Ended
July 31, 2015 | | | Year Ended
July 31, 2014 | | | Year Ended
July 31, 2013 | |
| |
| Per Share Operating Data | | | | | | | | | | | | | | | | | | | | |
| Net asset value, beginning of period | | | $10.68 | | | | $10.50 | | | | $10.38 | | | | $10.53 | | | | $11.48 | |
| |
| Income (loss) from investment operations: | | | | | | | | | | | | | | | | | | | | |
| Net investment income1 | | | 0.47 | | | | 0.60 | | | | 0.65 | | | | 0.69 | | | | 0.62 | |
| Net realized and unrealized gain (loss) | | | (0.14) | | | | 0.20 | | | | 0.10 | | | | (0.22) | | | | (0.94) | |
| | | | |
| Total from investment operations | | | 0.33 | | | | 0.80 | | | | 0.75 | | | | 0.47 | | | | (0.32) | |
| |
| Dividends and/or distributions to shareholders: | | | | | | | | | | | | | | | | | | | | |
| Dividends from net investment income | | | (0.56) | | | | (0.62) | | | | (0.63) | | | | (0.62) | | | | (0.63) | |
| |
| Net asset value, end of period | | | $10.45 | | | | $10.68 | | | | $10.50 | | | | $10.38 | | | | $10.53 | |
| | | | |
| | | | | | | | | | | | | | | | | | | | |
| Total Return, at Net Asset Value2 | | | 3.14% | | | | 7.99% | | | | 7.23% | | | | 4.72% | | | | (3.08)% | |
| | | | | |
| | | | | | | | | | | | | | | | | | | | |
| Ratios/Supplemental Data | | | | | | | | | | | | | | | | | | | | |
| Net assets, end of period (in thousands) | | | $54,584 | | | | $30,357 | | | | $29,137 | | | | $26,322 | | | | $32,754 | |
| |
| Average net assets (in thousands) | | | $39,973 | | | | $28,378 | | | | $30,378 | | | | $28,437 | | | | $34,321 | |
| |
| Ratios to average net assets:3 | | | | | | | | | | | | | | | | | | | | |
| Net investment income | | | 4.53% | | | | 5.73% | | | | 6.07% | | | | 6.75% | | | | 5.46% | |
| Expenses excluding specific expenses listed below | | | 0.65% | | | | 0.65% | | | | 0.62% | | | | 0.62% | | | | 0.55% | |
| Interest and fees from borrowings | | | 0.11% | | | | 0.11% | | | | 0.11% | | | | 0.14% | | | | 0.09% | |
| Interest and fees on short-term floating rate notes issued4 | | | 0.06% | | | | 0.06% | | | | 0.07% | | | | 0.13% | | | | 0.11% | |
| | | | |
| Total expenses | | | 0.82% | | | | 0.82% | | | | 0.80% | | | | 0.89% | | | | 0.75% | |
| Expenses after payments, waivers and/or reimbursements and reduction to custodian expenses | | | 0.82% | | | | 0.82% | | | | 0.80% | | | | 0.89% | | | | 0.74% | |
| |
| Portfolio turnover rate | | | 20% | | | | 6% | | | | 12% | | | | 6% | | | | 10% | |
|
| 42 OPPENHEIMER ROCHESTER PENNSYLVANIA MUNICIPAL FUND |
1. Per share amounts calculated based on the average shares outstanding during the period.
2. Assumes an initial investment on the business day before the first day of the fiscal period, with all dividends and distributions reinvested in additional shares on the reinvestment date, and redemption at the net asset value calculated on the last business day of the fiscal period. Sales charges are not reflected in the total returns. Total returns are not annualized for periods less than one full year. Returns do not reflect the deduction of taxes that a shareholder would pay on fund distributions or the redemption of fund shares.
3. Annualized for periods less than one full year.
4. Interest and fee expense related to the Fund’s liability for short-term floating rate notes issued in conjunction with inverse floating rate security transactions.
See accompanying Notes to Financial Statements.
|
| 43 OPPENHEIMER ROCHESTER PENNSYLVANIA MUNICIPAL FUND |
NOTES TO FINANCIAL STATEMENTS July 31, 2017
1. Organization
Oppenheimer Rochester Pennsylvania Municipal Fund (the “Fund”) is a separate series of Oppenheimer Multi-State Municipal Trust, a diversified open-end management investment company registered under the Investment Company Act of 1940 (“1940 Act”), as amended. The Fund’s investment objective is to seek tax-free income. The Fund’s investment adviser is OFI Global Asset Management, Inc. (“OFI Global” or the “Manager”), a wholly-owned subsidiary of OppenheimerFunds, Inc. (“OFI” or the “Sub-Adviser”). The Manager has entered into a sub-advisory agreement with OFI.
The Fund offers Class A, Class C and Class Y shares, and previously offered Class B shares for new purchase through June 29, 2012. Subsequent to that date, no new purchases of Class B shares are permitted, however reinvestment of dividend and/or capital gain distributions and exchanges of Class B shares into and from other Oppenheimer funds are allowed. Class A shares are sold at their offering price, which is normally net asset value plus a front-end sales charge. Class C shares are sold, and Class B shares were sold, without a front-end sales charge but may be subject to a contingent deferred sales charge (“CDSC”). Class Y shares are sold to certain institutional investors or intermediaries without either a front-end sales charge or a CDSC, however, the intermediaries may impose charges on their accountholders who beneficially own Class Y shares. All classes of shares have identical rights and voting privileges with respect to the Fund in general and exclusive voting rights on matters that affect that class alone. Earnings, net assets and net asset value per share may differ due to each class having its own expenses, such as transfer and shareholder servicing agent fees and shareholder communications, directly attributable to that class. Class A, B and C shares have separate distribution and/or service plans under which they pay fees. Class Y shares do not pay such fees. Class B shares will automatically convert to Class A shares 72 months after the date of purchase.
The following is a summary of significant accounting policies followed in the Fund’s preparation of financial statements in accordance with accounting principles generally accepted in the United States (“U.S. GAAP”).
2. Significant Accounting Policies
Security Valuation. All investments in securities are recorded at their estimated fair value, as described in Note 3.
Allocation of Income, Expenses, Gains and Losses. Income, expenses (other than those attributable to a specific class), gains and losses are allocated on a daily basis to each class of shares based upon the relative proportion of net assets represented by such class. Operating expenses directly attributable to a specific class are charged against the operations of that class.
Dividends and Distributions to Shareholders. Dividends and distributions to shareholders, which are determined in accordance with income tax regulations and may differ from U.S. GAAP, are recorded on the ex-dividend date. Income distributions, if any,
|
| 44 OPPENHEIMER ROCHESTER PENNSYLVANIA MUNICIPAL FUND |
2. Significant Accounting Policies (Continued)
are declared daily and paid monthly. Capital gain distributions, if any, are declared and paid annually or at other times as deemed necessary by the Manager.
Investment Income. Interest income is recognized on an accrual basis. Discount and premium, which are included in interest income on the Statement of Operations, are amortized or accreted daily.
Custodian Fees. “Custodian fees and expenses” in the Statement of Operations may include interest expense incurred by the Fund on any cash overdrafts of its custodian account during the period. Such cash overdrafts may result from the effects of failed trades in portfolio securities and from cash outflows resulting from unanticipated shareholder redemption activity. The Fund pays interest to its custodian on such cash overdraft at a rate equal to the Prime Rate plus 0.35%. The “Reduction to custodian expenses” line item, if applicable, represents earnings on cash balances maintained by the Fund during the period. Such interest expense and other custodian fees may be paid with these earnings.
Security Transactions. Security transactions are recorded on the trade date. Realized gains and losses on securities sold are determined on the basis of identified cost.
Indemnifications. The Fund’s organizational documents provide current and former Trustees and officers with a limited indemnification against liabilities arising in connection with the performance of their duties to the Fund. In the normal course of business, the Fund may also enter into contracts that provide general indemnifications. The Fund’s maximum exposure under these arrangements is unknown as this would be dependent on future claims that may be made against the Fund. The risk of material loss from such claims is considered remote.
Federal Taxes. The Fund intends to comply with provisions of the Internal Revenue Code applicable to regulated investment companies and to distribute substantially all of its investment company taxable income, including any net realized gain on investments not offset by capital loss carryforwards, if any, to shareholders. Therefore, no federal income or excise tax provision is required. The Fund files income tax returns in U.S. federal and applicable state jurisdictions. The statute of limitations on the Fund’s tax return filings generally remains open for the three preceding fiscal reporting period ends. The Fund has analyzed its tax positions for the fiscal year ended July 31, 2017, including open tax years, and does not believe there are any uncertain tax positions requiring recognition in the Fund’s financial statements.
The tax components of capital shown in the following table represent distribution requirements the Fund must satisfy under the income tax regulations, losses the Fund may be able to offset against income and gains realized in future years and unrealized appreciation or depreciation of securities and other investments for federal income tax purposes.
|
| 45 OPPENHEIMER ROCHESTER PENNSYLVANIA MUNICIPAL FUND |
NOTES TO FINANCIAL STATEMENTS Continued
2. Significant Accounting Policies (Continued)
| | | | | | | | | | | | |
Undistributed Net Investment Income | | Undistributed
Long-Term
Gain | | | Accumulated Loss
Carryforward1,2,3,4 | | | Net Unrealized
Depreciation
Based on cost of
Securities and Other Investments for Federal Income
Tax Purposes | |
| |
| $11,041,951 | | | $— | | | | $87,595,390 | | | | $107,711,138 | |
1. At period end, the Fund had $87,595,390 of net capital loss carryforward available to offset future realized capital gains, if any, and thereby reduce future taxable gain distributions. Details of the capital loss carryforwards are included in the table below. Capital loss carryovers with no expiration, if any, must be utilized prior to those with expiration dates.
| | | | |
| Expiring | | | |
| |
| 2018 | | $ | 43,078,455 | |
| No expiration | | | 44,516,935 | |
| | | | |
| Total | | $ | 87,595,390 | |
| | | | |
2. During the reporting period, the Fund did not utilize any capital loss carryforward.
3. During the previous reporting period, the Fund did not utilize any capital loss carryforward.
4. During the reporting period, $48,870,545 of unused capital loss carryforward expired.
Net investment income (loss) and net realized gain (loss) may differ for financial statement and tax purposes. The character of dividends and distributions made during the fiscal year from net investment income or net realized gains are determined in accordance with federal income tax requirements, which may differ from the character of net investment income or net realized gains presented in those financial statements in accordance with U.S. GAAP. Also, due to timing of dividends and distributions, the fiscal year in which amounts are distributed may differ from the fiscal year in which the income or net realized gain was recorded by the Fund.
Accordingly, the following amounts have been reclassified for the reporting period. Net assets of the Fund were unaffected by the reclassifications.
| | | | | | | | |
Reduction to Paid-in Capital | | Increase to Accumulated
Net Investment
Loss | | | Reduction to Accumulated Net
Realized Loss on Investments | |
| |
| $48,870,545 | | | $912,591 | | | | $49,783,136 | |
The tax character of distributions paid during the reporting periods:
| | | | | | | | |
| | | Year Ended
July 31, 2017 | | | Year Ended
July 31, 2016 | |
| |
| Distributions paid from: | | | | | | | | |
| Exempt-interest dividends | | $ | 38,057,756 | | | $ | 44,028,997 | |
| Ordinary income | | | 176,743 | | | | 164,170 | |
| | | | |
| Total | | $ | 38,234,499 | | | $ | 44,193,167 | |
| | | | |
The aggregate cost of securities and other investments and the composition of unrealized
|
| 46 OPPENHEIMER ROCHESTER PENNSYLVANIA MUNICIPAL FUND |
2. Significant Accounting Policies (Continued)
appreciation and depreciation of securities and other investments for federal income tax purposes at period end are noted in the following table. The primary difference between book and tax appreciation or depreciation of securities and other investments, if applicable, is attributable to the tax deferral of losses or tax realization of financial statement unrealized gain or loss.
| | | | |
| Federal tax cost of securities | | $ | 863,978,6781 | |
| | | | |
| Gross unrealized appreciation | | $ | 38,234,543 | |
| Gross unrealized depreciation | | | (145,945,681) | |
| | | | |
| Net unrealized depreciation | | $ | (107,711,138) | |
| | | | |
1. The Federal tax cost of securities does not include cost of $20,339,660, which has otherwise been recognized for financial reporting purposes, related to bonds placed into trusts in conjunction with certain investment transactions. See the Inverse Floating Rate Securities note in Note 4.
Use of Estimates. The preparation of financial statements in conformity with U.S. GAAP requires management to make estimates and assumptions that affect the reported amounts of assets and liabilities and disclosure of contingent assets and liabilities at the date of the financial statements and the reported amounts of increases and decreases in net assets from operations during the reporting period. Actual results could differ from those estimates.
Recent Accounting Pronouncement. In October 2016, the Securities and Exchange Commission (“SEC”) adopted amendments to rules under the Investment Company Act of 1940 (“final rules”) intended to modernize the reporting and disclosure of information by registered investment companies. The final rules amend Regulation S-X and require funds to provide standardized, enhanced derivative disclosure in fund financial statements in a format designed for individual investors. The amendments to Regulation S-X also update the disclosures for other investments and investments in, and advances to affiliates and amend the rules regarding the general form and content of fund financial statements. The compliance date for the amendments to Regulation S-X is for reporting periods ended after August 1, 2017. The implementation of the rules will not have a material impact on the Fund’s financial statements.
3. Securities Valuation
The Fund calculates the net asset value of its shares as of 4:00 P.M. Eastern time, on each day the New York Stock Exchange (the “Exchange”) is open for trading, except in the case of a scheduled early closing of the Exchange, in which case the Fund will calculate net asset value of the shares as of the scheduled early closing time of the Exchange.
The Fund’s Board has adopted procedures for the valuation of the Fund’s securities and has delegated the day-to-day responsibility for valuation determinations under those procedures to the Manager. The Manager has established a Valuation Committee which is responsible for determining a fair valuation for any security for which market quotations are not readily available. The Valuation Committee’s fair valuation determinations are subject to review,
|
| 47 OPPENHEIMER ROCHESTER PENNSYLVANIA MUNICIPAL FUND |
NOTES TO FINANCIAL STATEMENTS Continued
3. Securities Valuation (Continued)
approval and ratification by the Fund’s Board at its next regularly scheduled meeting covering the calendar quarter in which the fair valuation was determined.
Valuation Methods and Inputs
Securities are valued primarily using unadjusted quoted market prices, when available, as supplied by third party pricing services or broker-dealers.
The following methodologies are used to determine the market value or the fair value of the types of securities described below:
Corporate and government debt securities (of U.S. or foreign issuers) and municipal debt securities, short-term notes, mortgage-backed securities, collateralized mortgage obligations, and asset-backed securities are valued at the mean between the bid and asked prices utilizing evaluated prices obtained from third party pricing services or broker-dealers who may use matrix pricing methods to determine the evaluated prices. Pricing services generally price debt securities assuming orderly transactions of an institutional “round lot” size, but some trades may occur in smaller, “odd lot” sizes, sometimes at lower prices than institutional round lot trades. Standard inputs generally considered by third-party pricing vendors include reported trade data, broker-dealer price quotations, benchmark yields, issuer spreads on comparable securities, the credit quality, yield, maturity, as well as other appropriate factors.
Securities for which market quotations are not readily available or a significant event has occurred that would materially affect the value of the security, the security is fair valued either (i) by a standardized fair valuation methodology applicable to the security type or the significant event as previously approved by the Valuation Committee and the Fund’s Board or (ii) as determined in good faith by the Manager’s Valuation Committee. The Valuation Committee considers all relevant facts that are reasonably available, through either public information or information available to the Manager, when determining the fair value of a security. Those standardized fair valuation methodologies include, but are not limited to, valuing securities at the last sale price or initially at cost and subsequently adjusting the value based on: changes in company specific fundamentals, changes in an appropriate securities index, or changes in the value of similar securities which may be further adjusted for any discounts related to security-specific resale restrictions. When possible, such methodologies use observable market inputs such as unadjusted quoted prices of similar securities, observable interest rates, currency rates and yield curves. The methodologies used for valuing securities are not necessarily an indication of the risks associated with investing in those securities nor can it be assured that the Fund can obtain the fair value assigned to a security if it were to sell the security.
To assess the continuing appropriateness of security valuations, the Manager regularly compares prior day prices and sale prices to the current day prices and challenges those prices exceeding certain tolerance levels with the third party pricing service or broker source. For those securities valued by fair valuations, whether through a standardized fair valuation methodology or a fair valuation determination, the Valuation Committee reviews and affirms the reasonableness of the valuations based on such methodologies and fair valuation determinations on a regular basis after considering all relevant information that is reasonably
|
| 48 OPPENHEIMER ROCHESTER PENNSYLVANIA MUNICIPAL FUND |
3. Securities Valuation (Continued)
available.
Classifications
Each investment asset or liability of the Fund is assigned a level at measurement date based on the significance and source of the inputs to its valuation. Various data inputs may be used in determining the value of each of the Fund’s investments as of the reporting period end. These data inputs are categorized in the following hierarchy under applicable financial accounting standards:
1) Level 1-unadjusted quoted prices in active markets for identical assets or liabilities (including securities actively traded on a securities exchange)
2) Level 2-inputs other than unadjusted quoted prices that are observable for the asset or liability (such as unadjusted quoted prices for similar assets and market corroborated inputs such as interest rates, prepayment speeds, credit risks, etc.)
3) Level 3-significant unobservable inputs (including the Manager’s own judgments about assumptions that market participants would use in pricing the asset or liability).
The inputs used for valuing securities are not necessarily an indication of the risks associated with investing in those securities.
The table below categorizes amounts that are included in the Fund’s Statement of Assets and Liabilities at period end based on valuation input level:
| | | | | | | | | | | | | | | | |
| | | Level 1—
Unadjusted
Quoted Prices | | | Level 2— Other Significant Observable Inputs | | | Level 3—
Significant
Unobservable
Inputs | | | Value | |
| |
| Assets Table | | | | | | | | | | | | | | | | |
| Investments, at Value: | | | | | | | | | | | | | | | | |
| Municipal Bonds and Notes | | | | | | | | | | | | | | | | |
Pennsylvania | | $ | — | | | $ | 550,100,910 | | | $ | 6,925,550 | | | $ | 557,026,460 | |
U.S. Possessions | | | — | | | | 219,580,740 | | | | — | | | | 219,580,740 | |
| | | | |
| Total Assets | | $ | — | | | $ | 769,681,650 | | | $ | 6,925,550 | | | $ | 776,607,200 | |
| | | | |
Forward currency exchange contracts and futures contracts, if any, are reported at their unrealized appreciation/depreciation at measurement date, which represents the change in the contract’s value from trade date. All additional assets and liabilities included in the above table are reported at their market value at measurement date.
The table below shows the transfers between Level 2 and Level 3. The Fund’s policy is to recognize transfers in and transfers out as of the beginning of the reporting period.
|
| 49 OPPENHEIMER ROCHESTER PENNSYLVANIA MUNICIPAL FUND |
NOTES TO FINANCIAL STATEMENTS Continued
3. Securities Valuation (Continued)
| | | | | | | | |
| | | Transfers out of
Level 2* | | | Transfers into
Level 3* | |
| |
| Assets Table | | | | | | | | |
| Investments, at Value: | | | | | | | | |
| Municipal Bonds and Notes | | | | | | | | |
Pennsylvania | | $ | (27) | | | $ | 27 | |
| | | | |
| Total Assets | | $ | (27) | | | $ | 27 | |
| | | | |
*Transferred from Level 2 to Level 3 because of the lack of observable market data due to a decrease in market activity for these securities.
4. Investments and Risks
Inverse Floating Rate Securities. The Fund invests in inverse floating rate securities that pay interest at a rate that varies inversely with short-term interest rates. Because inverse floating rate securities are leveraged instruments, the value of an inverse floating rate security will change more significantly in response to changes in interest rates and other market fluctuations than the market value of a conventional fixed-rate municipal security of similar maturity and credit quality, including the municipal bond underlying an inverse floating rate security.
An inverse floating rate security is created as part of a financial transaction referred to as a “tender option bond” transaction. In most cases, in a tender option bond transaction the Fund sells a fixed-rate municipal bond (the “underlying municipal bond”) to a trust (the “Trust”). The Trust then issues and sells short-term floating rate securities with a fixed principal amount representing a senior interest in the underlying municipal bond to third parties and a residual, subordinate interest in the underlying municipal bond (referred to as an “inverse floating rate security”) to the Fund. The interest rate on the short-term floating rate securities resets periodically, usually weekly, to a prevailing market rate and holders of these securities are granted the option to tender their securities back to the Trust for repurchase at their principal amount plus accrued interest thereon (the “purchase price”) periodically, usually daily or weekly. A remarketing agent for the Trust is required to attempt to re-sell any tendered short-term floating rate securities to new investors for the purchase price. If the remarketing agent is unable to successfully re-sell the tendered short-term floating rate securities, a liquidity provider to the Trust must contribute cash to the Trust to ensure that the tendering holders receive the purchase price of their securities on the repurchase date.
Because holders of the short-term floating rate securities are granted the right to tender their securities to the Trust for repurchase at frequent intervals for the purchase price, with such payment effectively guaranteed by the liquidity provider, the securities generally bear short-term rates of interest commensurate with money market instruments. When interest is paid on the underlying municipal bond to the Trust, such proceeds are first used to pay the Trust’s administrative expenses and accrued interest to holders of the short-term floating rate securities, with any remaining amounts being paid to the Fund, as the holder of the inverse
|
| 50 OPPENHEIMER ROCHESTER PENNSYLVANIA MUNICIPAL FUND |
4. Investments and Risks (Continued)
floating rate security. Accordingly, the amount of such interest on the underlying municipal bond paid to the Fund is inversely related to the rate of interest on the short-term floating rate securities. Additionally, because the principal amount of the short-term floating rate securities is fixed and is not adjusted in response to changes in the market value of the underlying municipal bond, any change in the market value of the underlying municipal bond is reflected entirely in a change to the value of the inverse floating rate security.
Typically, the terms of an inverse floating rate security grant certain rights to the Fund, as holder. For example, the Fund typically has the right upon request to require that the Trust compel a tender of the short-term floating rate securities to facilitate the Fund’s acquisition of the underlying municipal bond. Following such a request, the Fund pays the Trust the purchase price of the short-term floating rate securities and a specified portion of any market value gain on the underlying municipal bond since its deposit into the Trust, which the Trust uses to redeem the short-term floating rate securities. The Trust then distributes the underlying municipal bond to the Fund. Through the exercise of this right, the Fund can voluntarily terminate or “collapse” the Trust, terminate its investment in the related inverse floating rate security and obtain the underlying municipal bond. Additionally, the Fund also typically has the right to exchange with the Trust (i) a principal amount of short-term floating rate securities held by the Fund for a corresponding additional principal amount of the inverse floating rate security or (ii) a principal amount of the inverse floating rate security held by the Fund for a corresponding additional principal amount of short-term floating rate securities (which are typically then sold to other investors). Through the exercise of this right, the Fund may increase (or decrease) the principal amount of short-term floating rate securities outstanding, thereby increasing (or decreasing) the amount of leverage provided by the short-term floating rate securities to the Fund’s investment exposure to the underlying municipal bond.
The Fund’s investments in inverse floating rate securities involve certain risks. As short-term interest rates rise, an inverse floating rate security produces less current income (and, in extreme cases, may pay no income) and as short-term interest rates fall, an inverse floating rate security produces more current income. Thus, if short-term interest rates rise after the issuance of the inverse floating rate security, any yield advantage is reduced or eliminated. All inverse floating rate securities entail some degree of leverage represented by the outstanding principal amount of the related short-term floating rate securities, relative to the par value of the underlying municipal bond. The value of, and income earned on, an inverse floating rate security that has a higher degree of leverage will fluctuate more significantly in response to changes in interest rates and to changes in the market value of the related underlying municipal bond than that of an inverse floating rate security with a lower degree of leverage, and is more likely to be eliminated entirely under adverse market conditions. Changes in the value of an inverse floating rate security will also be more significant than changes in the market value of the related underlying municipal bond because the leverage provided by the related short-term floating rate securities increases the sensitivity of an inverse floating rate security to changes in interest rates and to the market value of the underlying municipal bond. An inverse floating rate security can be expected to underperform fixed-rate municipal bonds when the difference between long-term and short-term interest rates is decreasing
|
| 51 OPPENHEIMER ROCHESTER PENNSYLVANIA MUNICIPAL FUND |
NOTES TO FINANCIAL STATEMENTS Continued
4. Investments and Risks (Continued)
(or is already small) or when long-term interest rates are rising, but can be expected to outperform fixed-rate municipal bonds when the difference between long-term and short-term interest rates is increasing (or is already large) or when long-term interest rates are falling. Additionally, a tender option bond transaction typically provides for the automatic termination or “collapse” of a Trust upon the occurrence of certain adverse events, usually referred to as “mandatory tender events” or “tender option termination events.” These events may include, among others, a credit ratings downgrade of the underlying municipal bond below a specified level, a decrease in the market value of the underlying municipal bond below a specified amount, a bankruptcy of the liquidity provider or the inability of the remarketing agent to resell to new investors short-term floating rate securities that have been tendered for repurchase by holders thereof. Following the occurrence of such an event, the underlying municipal bond is generally sold for current market value and the proceeds distributed to holders of the short-term floating rate securities and inverse floating rate security, with the holder of the inverse floating rate security (the Fund) generally receiving the proceeds of such sale only after the holders of the short-term floating rate securities have received proceeds equal to the purchase price of their securities (and the liquidity provider is generally required to contribute cash to the Trust only in an amount sufficient to ensure that the holders of the short-term floating rate securities receive the purchase price of their securities in connection with such termination of the Trust). Following the occurrence of such events, the Fund could potentially lose the entire amount of its investment in the inverse floating rate security.
Finally, the Fund may enter into shortfall/reimbursement agreements with the liquidity provider of certain tender option bond transactions in connection with certain inverse floating rate securities held by the Fund. These agreements commit the Fund to reimburse the liquidity provider to the extent that the liquidity provider must provide cash to a Trust, including following the termination of a Trust resulting from the occurrence of a “mandatory tender event.” In connection with the occurrence of such an event and the termination of the Trust triggered thereby, the shortfall/reimbursement agreement will make the Fund liable for the amount of the negative difference, if any, between the liquidation value of the underlying municipal bond and the purchase price of the short-term floating rate securities issued by the Trust. Under the standard terms of a tender option bond transaction, absent such a shortfall/ reimbursement agreement, the Fund, as holder of the inverse floating rate security, would not be required to make such a reimbursement payment to the liquidity provider. The Manager monitors the Fund’s potential exposure with respect to these agreements on a daily basis and intends to take action to terminate the Fund’s investment in related inverse floating rate securities, if it deems it appropriate to do so. At period end, the Fund’s maximum exposure under such agreements is estimated at $19,460,000.
When the Fund creates an inverse floating rate security in a tender option bond transaction by selling an underlying municipal bond to a Trust, the transaction is considered a secured borrowing for financial reporting purposes. As a result of such accounting treatment, the Fund includes the underlying municipal bond on its Statement of Investments and as an asset on its Statement of Assets and Liabilities (but does not separately include the related inverse floating rate security on either). The Fund also includes a liability on its Statement of Assets and
|
| 52 OPPENHEIMER ROCHESTER PENNSYLVANIA MUNICIPAL FUND |
4. Investments and Risks (Continued)
Liabilities equal to the outstanding principal amount and accrued interest on the related short-term floating rate securities issued by the Trust. Interest on the underlying municipal bond is recorded as investment income on the Fund’s Statement of Operations, while interest payable on the related short-term floating rate securities is recorded as interest expense. At period end, municipal bond holdings with a value of $38,262,455 shown on the Fund’s Statement of Investments are held by such Trusts and serve as the underlying municipal bonds for the related $25,460,000 in short-term floating rate securities issued and outstanding at that date.
At period end, the inverse floating rate securities associated with tender option bond transactions accounted for as secured borrowings were as follows:
| | | | | | | | | | | | | | |
Principal
Amount | | Inverse Floater1 | | Coupon
Rate2 | | | Maturity
Date | | | Value | |
| |
| $ 3,250,000 | | Berks County, PA Municipal Authority Tender Option Bond Series 2015-XF2016 Trust3 | | | 14.683% | | | | 11/1/31 | | | $ | 4,391,790 | |
| 3,000,000 | | PA GO Tender Option Bond Series 2016-XF0534 Trust | | | 10.143 | | | | 6/1/22 | | | | 4,463,670 | |
| 3,230,000 | | PA Southcentral General Authority (Hanover Hospital) Tender Option Bond Series 2015-XF2131 Trust3 | | | 16.601 | | | | 6/1/29 | | | | 3,946,995 | |
| | | | | | | | | | | | | | |
| | | | | | | | | | | | $ | 12,802,455 | |
| | | | | | | | | | | | | | |
1. For a list of abbreviations used in the Inverse Floater table see the Portfolio Abbreviations table at the end of the Statement of Investments.
2. Represents the current interest rate for the inverse floating rate security.
3. Represents an inverse floating rate security that is subject to a shortfall/reimbursement agreement.
The Fund may also purchase an inverse floating rate security created as part of a tender option bond transaction not initiated by the Fund when a third party, such as a municipal issuer or financial institution, transfers an underlying municipal bond to a Trust. For financial reporting purposes, the Fund includes the inverse floating rate security related to such transaction on its Statement of Investments and as an asset on its Statement of Assets and Liabilities, and interest on the security is recorded as investment income on the Fund’s Statement of Operations.
The Fund may invest in inverse floating rate securities with any degree of leverage (as measured by the outstanding principal amount of related short-term floating rate securities). However, the Fund may only expose up to 20% of its total assets to the effects of leverage from its investments in inverse floating rate securities. This limitation is measured by comparing the aggregate principal amount of the short-term floating rate securities that are related to the inverse floating rate securities held by the Fund to the total assets of the Fund. The Fund’s exposure to the effects of leverage from its investments in inverse floating rate securities amounts to $25,460,000 or 3.22% of its total assets at period end.
Securities on a When-Issued or Delayed Delivery Basis. The Fund may purchase securities on a “when-issued” basis, and may purchase or sell securities on a “delayed delivery” basis. “When-issued” or “delayed delivery” refers to securities whose terms
|
| 53 OPPENHEIMER ROCHESTER PENNSYLVANIA MUNICIPAL FUND |
NOTES TO FINANCIAL STATEMENTS Continued
4. Investments and Risks (Continued)
and indenture are available and for which a market exists, but which are not available for immediate delivery. Delivery and payment for securities that have been purchased by the Fund on a when-issued basis normally takes place within six months and possibly as long as two years or more after the trade date. During this period, such securities do not earn interest, are subject to market fluctuation and may increase or decrease in value prior to their delivery. The purchase of securities on a when-issued basis may increase the volatility of the Fund’s net asset value to the extent the Fund executes such transactions while remaining substantially fully invested. When the Fund engages in when-issued or delayed delivery transactions, it relies on the buyer or seller, as the case may be, to complete the transaction. Their failure to do so may cause the Fund to lose the opportunity to obtain or dispose of the security at a price and yield it considers advantageous. The Fund may also sell securities that it purchased on a when-issued basis or forward commitment prior to settlement of the original purchase.
At period end, the Fund had purchased securities issued on a when-issued or delayed delivery basis and sold securities issued on a delayed delivery basis as follows:
| | | | |
| | | When-Issued or
Delayed Delivery
Basis Transactions | |
| |
| Purchased securities | | | $7,376,480 | |
| Sold securities | | | 6,119,726 | |
Credit Risk. The Fund invests in high-yield, non-investment-grade bonds, which may be subject to a greater degree of credit risk. Credit risk relates to the ability of the issuer to meet interest or principal payments or both as they become due. The Fund may acquire securities that have missed an interest payment, and is not obligated to dispose of securities whose issuers or underlying obligors subsequently miss an interest payment.
In June 2016, Congress passed the Puerto Rico Oversight, Management, and Economic Stability Act (“PROMESA”). PROMESA established a federally-appointed fiscal oversight board (the “Oversight Board”) to oversee Puerto Rico’s financial operations and allows the Oversight Board to file cases on behalf of the Commonwealth of Puerto Rico or one of its instrumentalities to restructure debt and other obligations of the relevant entity in a “Title III” proceeding. Title III incorporates many provisions of the federal Bankruptcy Code for U.S. territories, and incorporates legal mechanisms for a litigation stay and restructuring of pension and debt obligations, among other provisions. In early May 2017, Title III petitions were filed for the Commonwealth of Puerto Rico and the Puerto Rico Sales Tax Financing Corporation (“COFINA”), two of the largest issuers of Puerto Rico debt. Title III petitions for Puerto Rico Highways & Transportation Authority (“PRHTA”) and Puerto Rico Electric Power Authority (“PREPA”) were subsequently filed in mid-May and early July, respectively. Title III petitions for additional Puerto Rican instrumentalities are expected to be filed. These restructuring proceedings create uncertainty as to the treatment of claims of varying degrees of seniority and the levels and priorities of payment from the affected entities.
Information concerning securities not accruing interest at period end is as follows:
|
| 54 OPPENHEIMER ROCHESTER PENNSYLVANIA MUNICIPAL FUND |
4. Investments and Risks (Continued)
| | | | | | | | |
| Cost | | $ | 188,553,999 | | | | | |
| Market Value | | $ | 86,583,364 | | | | | |
| Market Value as % of Net Assets | | | 11.44% | | | | | |
Concentration Risk. The Fund invests a large percentage of its total assets in obligations of issuers within its respective state and U.S. territories. Risks may arise from geographic concentration in any state, commonwealth or territory, such as Puerto Rico, the U.S. Virgin Islands, Guam or the Northern Mariana Islands. Certain economic, regulatory or political developments occurring in the state, commonwealth or territory such as ongoing developments in Puerto Rico may impair the ability of certain issuers of municipal securities to pay principal and interest on their obligations.
5. Market Risk Factors
The Fund’s investments in securities and/or financial derivatives may expose the Fund to various market risk factors:
Commodity Risk. Commodity risk relates to the change in value of commodities or commodity indexes as they relate to increases or decreases in the commodities market. Commodities are physical assets that have tangible properties. Examples of these types of assets are crude oil, heating oil, metals, livestock, and agricultural products.
Credit Risk. Credit risk relates to the ability of the issuer of debt to meet interest and principal payments, or both, as they come due. In general, lower-grade, higher-yield debt securities are subject to credit risk to a greater extent than lower-yield, higher-quality securities.
Equity Risk. Equity risk relates to the change in value of equity securities as they relate to increases or decreases in the general market.
Foreign Exchange Rate Risk. Foreign exchange rate risk relates to the change in the U.S. dollar value of a security held that is denominated in a foreign currency. The U.S. dollar value of a foreign currency denominated security will decrease as the dollar appreciates against the currency, while the U.S. dollar value will increase as the dollar depreciates against the currency.
Interest Rate Risk. Interest rate risk refers to the fluctuations in value of fixed-income securities resulting from the inverse relationship between price and yield. For example, an increase in general interest rates will tend to reduce the market value of already issued fixed-income investments, and a decline in general interest rates will tend to increase their value. In addition, debt securities with longer maturities, which tend to have higher yields, are subject to potentially greater fluctuations in value from changes in interest rates than obligations with shorter maturities.
Volatility Risk. Volatility risk refers to the magnitude of the movement, but not the direction of the movement, in a financial instrument’s price over a defined time period. Large increases or decreases in a financial instrument’s price over a relative time period typically indicate greater volatility risk, while small increases or decreases in its price typically indicate lower volatility risk.
|
| 55 OPPENHEIMER ROCHESTER PENNSYLVANIA MUNICIPAL FUND |
NOTES TO FINANCIAL STATEMENTS Continued
6. Shares of Beneficial Interest
The Fund has authorized an unlimited number of no par value shares of beneficial interest of each class. Transactions in shares of beneficial interest were as follows:
| | | | | | | | | | | | | | | | |
| | | Year Ended July 31, 2017 | | | Year Ended July 31, 2016 | |
| | | Shares | | | Amount | | | Shares | | | Amount | |
| Class A | | | | | | | | | | | | | | | | |
| Sold | | | 5,257,460 | | | $ | 55,073,746 | | | | 4,395,258 | | | $ | 46,102,334 | |
| Dividends and/or distributions reinvested | | | 2,152,725 | | | | 22,561,837 | | | | 2,480,172 | | | | 26,014,670 | |
| Redeemed | | | (8,819,104) | | | | (92,299,429) | | | | (10,183,046) | | | | (107,011,705) | |
| Net decrease | | | (1,408,919) | | | $ | (14,663,846) | | | | (3,307,616) | | | $ | (34,894,701) | |
| | | | | | | | | | | | | | | | |
| | | | | | | | | | | | | | | | | |
| Class B | | | | | | | | | | | | | | | | |
| Sold | | | 3,082 | | | $ | 32,328 | | | | 6,434 | | | $ | 67,303 | |
| Dividends and/or distributions reinvested | | | 14,637 | | | | 153,394 | | | | 32,572 | | | | 341,402 | |
| Redeemed | | | (292,025) | | | | (3,073,917) | | | | (562,180) | | | | (5,888,446) | |
| Net decrease | | | (274,306) | | | $ | (2,888,195) | | | | (523,174) | | | $ | (5,479,741) | |
| | | | | | | | | | | | | | | | |
| | | | | | | | | | | | | | | | | |
| Class C | | | | | | | | | | | | | | | | |
| Sold | | | 2,001,073 | | | $ | 20,955,609 | | | | 2,066,439 | | | $ | 21,629,265 | |
| Dividends and/or distributions reinvested | | | 789,856 | | | | 8,257,664 | | | | 932,513 | | | | 9,756,871 | |
| Redeemed | | | (4,378,996) | | | | (45,681,885) | | | | (3,877,722) | | | | (40,534,036) | |
| Net decrease | | | (1,588,067) | | | $ | (16,468,612) | | | | (878,770) | | | $ | (9,147,900) | |
| | | | | | | | | | | | | | | | |
| | | | | | | | | | | | | | | | | |
| Class Y | | | | | | | | | | | | | | | | |
| Sold | | | 3,186,877 | | | $ | 33,267,075 | | | | 1,061,869 | | | $ | 11,166,397 | |
| Dividends and/or distributions reinvested | | | 182,375 | | | | 1,912,475 | | | | 143,040 | | | | 1,501,125 | |
| Redeemed | | | (988,574) | | | | (10,305,105) | | | | (1,137,609) | | | | (11,937,147) | |
| Net increase | | | 2,380,678 | | | $ | 24,874,445 | | | | 67,300 | | | $ | 730,375 | |
| | | | | | | | | | | | | | | | |
7. Purchases and Sales of Securities
The aggregate cost of purchases and proceeds from sales of securities, other than short-term obligations, for the reporting period were as follows:
| | | | | | | | |
| | | Purchases | | | Sales | |
| Investment securities | | $ | 156,530,753 | | | $ | 195,802,968 | |
8. Fees and Other Transactions with Affiliates
Management Fees. Under the investment advisory agreement, the Fund pays the Manager a management fee based on the daily net assets of the Fund at an annual rate as shown in the following table:
|
| 56 OPPENHEIMER ROCHESTER PENNSYLVANIA MUNICIPAL FUND |
8. Fees and Other Transactions with Affiliates (Continued)
| | | | |
| Fee Schedule | | | |
| Up to $200 million | | | 0.60% | |
| Next $100 million | | | 0.55 | |
| Next $200 million | | | 0.50 | |
| Next $250 million | | | 0.45 | |
| Next $250 million | | | 0.40 | |
| Next $4 billion | | | 0.35 | |
| Over $5 billion | | | 0.33 | |
The Fund’s effective management fee for the reporting period was 0.51% of average annual net assets before any applicable waivers.
Sub-Adviser Fees. The Manager has retained the Sub-Adviser to provide the day-to-day portfolio management of the Fund. Under the Sub-Advisory Agreement, the Manager pays the Sub-Adviser an annual fee in monthly installments, equal to a percentage of the investment management fee collected by the Manager from the Fund, which shall be calculated after any investment management fee waivers. The fee paid to the Sub-Adviser is paid by the Manager, not by the Fund.
Transfer Agent Fees. OFI Global (the “Transfer Agent”) serves as the transfer and shareholder servicing agent for the Fund. The Fund pays the Transfer Agent a fee based on annual net assets, which shall be calculated after any applicable fee waivers. Fees incurred and average net assets for each class with respect to these services are detailed in the Statement of Operations and Financial Highlights, respectively.
Sub-Transfer Agent Fees. The Transfer Agent has retained Shareholder Services, Inc., a wholly-owned subsidiary of OFI (the “Sub-Transfer Agent”), to provide the day-to-day transfer agent and shareholder servicing of the Fund. Under the Sub-Transfer Agency Agreement, the Transfer Agent pays the Sub-Transfer Agent an annual fee in monthly installments, equal to a percentage of the transfer agent fee collected by the Transfer Agent from the Fund, which shall be calculated after any applicable fee waivers. The fee paid to the Sub-Transfer Agent is paid by the Transfer Agent, not by the Fund.
Trustees’ Compensation. The Fund has adopted an unfunded retirement plan (the “Plan”) for the Fund’s Independent Trustees. Benefits are based on years of service and fees paid to each Trustee during their period of service. The Plan was frozen with respect to adding new participants effective December 31, 2006 (the “Freeze Date”) and existing Plan Participants as of the Freeze Date will continue to receive accrued benefits under the Plan. Active
Independent Trustees as of the Freeze Date have each elected a distribution method with respect to their benefits under the Plan. During the reporting period, the Fund’s projected benefit obligations, payments to retired Trustees and accumulated liability were as follows:
| | | | |
| Projected Benefit Obligations Increased | | $ | — | |
| Payments Made to Retired Trustees | | | 7,269 | |
| Accumulated Liability as of July 31, 2017 | | | 52,543 | |
|
| 57 OPPENHEIMER ROCHESTER PENNSYLVANIA MUNICIPAL FUND |
NOTES TO FINANCIAL STATEMENTS Continued
8. Fees and Other Transactions with Affiliates (Continued)
The Fund’s Board of Trustees (“Board”) has adopted a compensation deferral plan for Independent Trustees that enables Trustees to elect to defer receipt of all or a portion of the annual compensation they are entitled to receive from the Fund. For purposes of determining the amount owed to the Trustee under the plan, deferred amounts are treated as though equal dollar amounts had been invested in shares of the Fund or in other Oppenheimer funds selected by the Trustee. The Fund purchases shares of the funds selected for deferral by the Trustee in amounts equal to his or her deemed investment, resulting in a Fund asset equal to the deferred compensation liability. Such assets are included as a component of “Other” within the asset section of the Statement of Assets and Liabilities. Deferral of Trustees’ fees under the plan will not affect the net assets of the Fund and will not materially affect the Fund’s assets, liabilities or net investment income per share. Amounts will be deferred until distributed in accordance with the compensation deferral plan.
Distribution and Service Plan (12b-1) Fees. Under its General Distributor’s Agreement with the Fund, OppenheimerFunds Distributor, Inc. (the “Distributor”) acts as the Fund’s principal underwriter in the continuous public offering of the Fund’s classes of shares.
Service Plan for Class A Shares. The Fund has adopted a Service Plan (the “Plan”) for Class A shares pursuant to Rule 12b-1 under the 1940 Act. Under the Plan, the Fund reimburses the Distributor for a portion of its costs incurred for services provided to accounts that hold Class A shares. Reimbursement is made periodically at an annual rate of up to 0.15% of the daily net assets of Class A shares of the Fund. Effective April 3, 2017, this rate changed to 0.25%. The Distributor currently uses all of those fees to pay dealers, brokers, banks and other financial institutions periodically for providing personal service and maintenance of accounts of their customers that hold Class A shares. Any unreimbursed expenses the Distributor incurs with respect to Class A shares in any fiscal year cannot be recovered in subsequent periods. Fees incurred by the Fund under the Plan are detailed in the Statement of Operations.
Distribution and Service Plans for Class B and Class C Shares. The Fund has adopted Distribution and Service Plans (the “Plans”) for Class B and Class C shares pursuant to Rule 12b-1 under the 1940 Act to compensate the Distributor for distributing those share classes, maintaining accounts and providing shareholder services. Under the Plans, the Fund pays the Distributor an annual asset-based sales charge of 0.75% on Class B and Class C shares’ daily net assets. The Fund also pays a service fee under the Plans at an annual rate of 0.15% of daily net assets. The Plans continue in effect from year to year only if the Fund’s Board of Trustees votes annually to approve their continuance at an in person meeting called for that purpose. Fees incurred by the Fund under the Plans are detailed in the Statement of Operations.
Sales Charges. Front-end sales charges and CDSC do not represent expenses of the Fund. They are deducted from the proceeds of sales of Fund shares prior to investment or
|
| 58 OPPENHEIMER ROCHESTER PENNSYLVANIA MUNICIPAL FUND |
8. Fees and Other Transactions with Affiliates (Continued)
from redemption proceeds prior to remittance, as applicable. The sales charges retained by the Distributor from the sale of shares and the CDSC retained by the Distributor on the redemption of shares is shown in the following table for the period indicated.
| | | | | | | | | | | | | | | | | | | | |
| Year Ended | | Class A
Front-End
Sales Charges
Retained by
Distributor | | | Class A
Contingent
Deferred
Sales Charges
Retained by
Distributor | | | Class B
Contingent
Deferred
Sales Charges
Retained by
Distributor | | | Class C
Contingent
Deferred
Sales Charges
Retained by
Distributor | | | Class Y
Contingent
Deferred
Sales Charges
Retained by
Distributor | |
| July 31, 2017 | | | $108,249 | | | | $7,520 | | | | $2,577 | | | | $11,687 | | | | $— | |
9. Borrowings and Other Financing
Borrowings. The Fund can borrow money from banks in amounts up to one third of its total assets (including the amount borrowed) less all liabilities and indebtedness other than borrowings (meaning that the value of those assets must be at least 300% of the amount borrowed). The Fund can use those borrowings for investment-related purposes such as purchasing portfolio securities. The Fund also may borrow to meet redemption obligations or for temporary and emergency purposes. When the Fund invests borrowed money in portfolio securities, it is using a speculative investment technique known as leverage and changes in the value of the Fund’s investments will have a larger effect on its share price than if it did not borrow because of the effect of leverage.
The Fund can also use the borrowings for other investment-related purposes, including in connection with the Fund’s inverse floater investments as discussed in Note 4. The Fund may use the borrowings to reduce the leverage amount of, or unwind or “collapse” trusts that issued “inverse floaters” owned by the Fund, or in circumstances in which the Fund has entered into a shortfall and forbearance agreement with the sponsor of the inverse floater trust to meet the Fund’s obligation to reimburse the sponsor of the inverse floater for the difference between the liquidation value of the underlying bond and the amount due to holders of the short-term floating rate notes issued by the Trust. See the discussion in Note 4 (Inverse Floating Rate Securities) for additional information.
The Fund will pay interest and may pay other fees in connection with loans. If the Fund does borrow, it will be subject to greater expenses than funds that do not borrow. The interest on borrowed money and the other fees incurred in conjunction with loans are an expense that might reduce the Fund’s yield and return. Expenses incurred by the Fund with respect to interest on borrowings and commitment fees are disclosed separately or as other expenses on the Statement of Operations.
The Fund entered into a Revolving Credit and Security Agreement (the “Agreement”) with conduit lenders and Citibank N.A. which enables it to participate with certain other Oppenheimer funds in a committed, secured borrowing facility that permits borrowings of up to $2.5 billion, collectively, by the Oppenheimer Rochester Funds. To secure the loan, the Fund pledges investment securities in accordance with the terms of the Agreement. Securities held in collateralized accounts to cover these borrowings are noted in the Statement of
|
| 59 OPPENHEIMER ROCHESTER PENNSYLVANIA MUNICIPAL FUND |
NOTES TO FINANCIAL STATEMENTS Continued
9. Borrowings and Other Financing (Continued)
Investments. Interest is charged to the Fund, based on its borrowings, at current commercial paper issuance rates (1.1825% at period end). The Fund pays additional fees monthly to its lender on its outstanding borrowings to manage and administer the facility and is allocated its pro-rata share of an annual structuring fee and ongoing commitment fees both of which are based on the total facility size. Total fees and interest that are included in expenses on the Fund’s Statement of Operations related to its participation in the borrowing facility during the reporting period equal 0.08% of the Fund’s average net assets on an annualized basis. The Fund has the right to prepay such loans and terminate its participation in the conduit loan facility at any time upon prior notice.
At period end, the Fund had no borrowings outstanding.
Details of the borrowings for the reporting period are as follows:
| | | | |
| Average Daily Loan Balance | | $ | 14,764,932 | |
| Average Daily Interest Rate | | | 0.841 | % |
| Fees Paid | | $ | 516,656 | |
| Interest Paid | | $ | 124,040 | |
Reverse Repurchase Agreements. The Fund may engage in reverse repurchase agreements. A reverse repurchase agreement is the sale of one or more securities to a counterparty at an agreed-upon purchase price with the simultaneous agreement to repurchase those securities on a future date at a higher repurchase price. The repurchase price represents the repayment of the purchase price and interest accrued thereon over the term of the repurchase agreement. The cash received by the Fund in connection with a reverse repurchase agreement may be used for investment-related purposes such as purchasing portfolio securities or for other purposes such as those described in the preceding “Borrowings” note.
The Fund entered into a Committed Repurchase Transaction Facility (the “Facility”) with J.P. Morgan Securities LLC (the “counterparty”) which enables it to participate with certain other Oppenheimer funds in a committed reverse repurchase agreement facility that permits aggregate outstanding reverse repurchase agreements of up to $750 million, collectively. Interest is charged to the Fund on the purchase price of outstanding reverse repurchase agreements at current LIBOR rates plus an applicable spread. The Fund is also allocated its pro-rata share of an annual structuring fee based on the total Facility size and ongoing commitment fees based on the total unused amount of the Facility. The Fund retains the economic exposure to fluctuations in the value of securities subject to reverse repurchase agreements under the Facility and therefore these transactions are considered secured borrowings for financial reporting purposes. The Fund also continues to receive the economic benefit of interest payments received on securities subject to reverse repurchase agreements, in the form of a direct payment from the counterparty. These payments are included in interest income on the Statement of Operations. Total fees and interest related to the Fund’s participation in the Facility during the reporting period are included in expenses on the Fund’s Statement of Operations and equal 0.03% of the Fund’s average net assets on an annualized basis.
|
| 60 OPPENHEIMER ROCHESTER PENNSYLVANIA MUNICIPAL FUND |
9. Borrowings and Other Financing (Continued)
The securities subject to reverse repurchase agreements under the Facility are valued on a daily basis. To the extent this value, after adjusting for certain margin requirements of the Facility, exceeds the cash proceeds received, the Fund may request the counterparty to return securities equal in margin value to this excess. To the extent that the cash proceeds received exceed the margin value of the securities subject to the transaction, the counterparty may request additional securities from the Fund. The Fund has the right to declare each Wednesday as the repurchase date for any outstanding reverse repurchase agreement upon delivery of advanced notification and may also recall any security subject to such a transaction by substituting eligible securities of equal or greater margin value according to the Facility’s terms.
The Fund executed no transactions under the Facility during the reporting period.
Details of reverse repurchase agreement transactions for the reporting period are as follows:
10. Subsequent Event
Since the reporting period end there have been two hurricanes that impacted Puerto Rico and the U.S. Virgin Islands causing significant damages. While the full impact of these storms is uncertain, subsequent to fiscal year end and through financial statement issuance date, the change in market value of the Fund’s investments in Puerto Rico and the U.S. Virgin Islands had a negative impact on the Fund’s net assets by less than 2%.
|
| 61 OPPENHEIMER ROCHESTER PENNSYLVANIA MUNICIPAL FUND |
REPORT OF INDEPENDENT REGISTERED PUBLIC ACCOUNTING FIRM
The Board of Trustees and Shareholders of Oppenheimer Multi-State Municipal Trust:
We have audited the accompanying statement of assets and liabilities of Oppenheimer Rochester Pennsylvania Municipal Fund (the Fund), a separate series of Oppenheimer Multi-State Municipal Trust, including the statement of investments, as of July 31, 2017, and the related statements of operations and cash flows for the year then ended, the statements of changes in net assets for each of the years in the two-year period then ended, and the financial highlights for each of the years in the five-year period then ended. These financial statements and financial highlights are the responsibility of the Fund’s management. Our responsibility is to express an opinion on these financial statements and financial highlights based on our audits.
We conducted our audits in accordance with the standards of the Public Company Accounting Oversight Board (United States). Those standards require that we plan and perform the audit to obtain reasonable assurance about whether the financial statements and financial highlights are free of material misstatement. An audit includes examining, on a test basis, evidence supporting the amounts and disclosures in the financial statements. Our procedures included confirmation of securities owned as of July 31, 2017, by correspondence with the custodian, and brokers, or by other appropriate auditing procedures where replies from brokers were not received. An audit also includes assessing the accounting principles used and significant estimates made by management, as well as evaluating the overall financial statement presentation. We believe that our audits provide a reasonable basis for our opinion.
In our opinion, the financial statements and financial highlights referred to above present fairly, in all material respects, the financial position of Oppenheimer Rochester Pennsylvania Municipal Fund as of July 31, 2017, the results of its operations and cash flows for the year then ended, the changes in its net assets for each of the years in the two-year period then ended, and the financial highlights for each of the years in the five-year period then ended, in conformity with U.S. generally accepted accounting principles.
KPMGLLP
Denver, Colorado
September 28, 2017
|
| 62 OPPENHEIMER ROCHESTER PENNSYLVANIA MUNICIPAL FUND |
FEDERAL INCOME TAX INFORMATION Unaudited
In early 2017, if applicable, shareholders of record received information regarding all dividends and distributions paid to them by the Fund during calendar year 2016.
None of the dividends paid by the Fund during the reporting period are eligible for the corporate dividend-received deduction. 99.54% of the dividends were derived from interest on municipal bonds and are not subject to federal income taxes. To the extent a shareholder is subject to any state or local tax laws, some or all of the dividends received may be taxable.
The foregoing information is presented to assist shareholders in reporting distributions received from the Fund to the Internal Revenue Service. Because of the complexity of the federal regulations which may affect your individual tax return and the many variations in state and local tax regulations, we recommend that you consult your tax advisor for specific guidance.
|
| 63 OPPENHEIMER ROCHESTER PENNSYLVANIA MUNICIPAL FUND |
PORTFOLIO PROXY VOTING POLICIES AND GUIDELINES;
UPDATES TO STATEMENTS OF INVESTMENTS Unaudited
The Fund has adopted Portfolio Proxy Voting Policies and Guidelines under which the Fund votes proxies relating to securities (“portfolio proxies”) held by the Fund. A description of the Fund’s Portfolio Proxy Voting Policies and Guidelines is available (i) without charge, upon request, by calling the Fund toll-free at 1.800.CALL OPP (225.5677), (ii) on the Fund’s website at www.oppenheimerfunds.com, and (iii) on the SEC’s website at www.sec.gov. In addition, the Fund is required to file Form N-PX, with its complete proxy voting record for the 12 months ended June 30th, no later than August 31st of each year. The Fund’s voting record is available (i) without charge, upon request, by calling the Fund toll-free at 1.800.CALL OPP (225.5677), and (ii) in the Form N-PX filing on the SEC’s website at www.sec.gov.
The Fund files its complete schedule of portfolio holdings with the SEC for the first quarter and the third quarter of each fiscal year on Form N-Q. The Fund’s Form N-Q filings are available on the SEC’s website at www.sec.gov. Those forms may be reviewed and copied at the SEC’s Public Reference Room in Washington, D.C. Information on the operation of the Public Reference Room may be obtained by calling 1-800-SEC-0330.
Householding—Delivery of Shareholder Documents
This is to inform you about OppenheimerFunds’ “householding” policy. If more than one member of your household maintains an account in a particular fund, OppenheimerFunds will mail only one copy of the fund’s prospectus (or, if available, the fund’s summary prospectus), annual and semiannual report and privacy policy. The consolidation of these mailings, called householding, benefits your fund through reduced mailing expense, and benefits you by reducing the volume of mail you receive from OppenheimerFunds. Householding does not affect the delivery of your account statements.
Please note that we will continue to household these mailings for as long as you remain an OppenheimerFunds shareholder, unless you request otherwise. If you prefer to receive multiple copies of these materials, please call us at 1.800.CALL-OPP (225-5677). You may also notify us in writing or via email. We will begin sending you individual copies of the prospectus (or, if available, the summary prospectus), reports and privacy policy within 30 days of receiving your request to stop householding.
|
| 64 OPPENHEIMER ROCHESTER PENNSYLVANIA MUNICIPAL FUND |
DISTRIBUTION SOURCES Unaudited
For any distribution that took place over the last six months of the Fund’s reporting period, the table below details on a per-share basis the percentage of the Fund’s total distribution payment amount that was derived from the following sources: net income, net profit from the sale of securities, and other capital sources. Other capital sources represent a return of capital. A return of capital may occur, for example, when some or all of the money that you invested in the Fund is paid back to you. A return of capital distribution does not necessarily reflect the Fund’s investment performance and should not be confused with “yield” or “income.” You should not draw any conclusions about each Fund’s investment performance from the amounts of these distributions. This information is based upon income and capital gains using generally accepted accounting principles as of the date of each distribution. Because the Fund is actively managed, the relative amount of the Fund’s total distributions derived from various sources over the calendar year may change. Please note that this information should not be used for tax reporting purposes as the tax character of distributable income may differ from the amounts used for this notification. You will receive IRS tax forms in the first quarter of each calendar year detailing the actual amount of the taxable and non-taxable portion of distributions paid to you during the tax year.
For the most current information, please go to oppenheimerfunds.com. Select your Fund, then the ‘Detailed’ tab; where ‘Dividends’ are shown, the Fund’s latest pay date will be followed by the sources of any distribution, updated daily.
| | | | | | | | | | | | | | | | |
| Fund Name | | Pay
Date | | | Net Income | | | Net Profit
from Sale | | | Other
Capital
Sources | |
| Oppenheimer Rochester Pennsylvania Municipal Fund | | | 2/21/17 | | | | 85.5% | | | | 14.5% | | | | 0.0% | |
| Oppenheimer Rochester Pennsylvania Municipal Fund | | | 4/25/17 | | | | 80.0% | | | | 0.0% | | | | 20.0% | |
| Oppenheimer Rochester Pennsylvania Municipal Fund | | | 5/23/17 | | | | 95.8% | | | | 0.0% | | | | 4.2% | |
| Oppenheimer Rochester Pennsylvania Municipal Fund | | | 6/27/17 | | | | 64.2% | | | | 0.0% | | | | 35.8% | |
| Oppenheimer Rochester Pennsylvania Municipal Fund | | | 7/25/17 | | | | 31.5% | | | | 0.0% | | | | 68.5% | |
|
| 65 OPPENHEIMER ROCHESTER PENNSYLVANIA MUNICIPAL FUND |
TRUSTEES AND OFFICERS Unaudited
| | |
Name, Position(s) Held with the Fund,
Length of Service, Year of Birth | | Principal Occupation(s) During the Past 5 Years; Other Trusteeships/ Directorships Held; Number of
Portfolios in the Fund Complex Currently Overseen |
| |
| INDEPENDENT TRUSTEES | | The address of each Trustee in the chart below is 6803 S. Tucson Way, Centennial, Colorado 80112-3924. Each Trustee serves for an indefinite term, or until his or her resignation, retirement, death or removal. |
| |
Brian F. Wruble, Chairman of the Board of Trustees (since 2007) and Trustee (since 2005) Year of Birth: 1943 | | Governor of Community Foundation of the Florida Keys (non-profit) (since July 2012); Director of TCP Capital, Inc. (since November 2015); Chairman Emeritus of the Board of Trustees (since August 2011), Chairman of the Board of Trustees (August 2007-August 2011), Trustee of the Board of Trustees (since August 1991) of The Jackson Laboratory (non-profit); Member of Zurich Insurance Group’s Investment Management Advisory Council (insurance) (October 2004-February 2017); Treasurer (since 2007) and Trustee (since May 1992) of the Institute for Advanced Study (non-profit educational institute); Director of Special Value Opportunities Fund, LLC (registered investment company) (affiliate of the Sub- Adviser’s parent company) (September 2004-June 2015); General Partner of Odyssey Partners, L.P. (hedge fund) (September 1995-December 2007); Special Limited Partner of Odyssey Investment Partners, LLC (private equity investment) (January 1999-September 2004). Oversees 57 portfolios in the OppenheimerFunds complex. Mr. Wruble has served on the Boards of certain Oppenheimer funds since April 2001, during which time he has become familiar with the Fund’s (and other Oppenheimer funds’) financial, accounting, regulatory and investment matters and has contributed to the Boards’ deliberations. |
| |
Beth Ann Brown, Trustee (since 2016) Year of Birth: 1968 | | Advisor, Board of Advisors of Caron Engineering Inc. (since December 2014); Independent Consultant (since September 2012); held the following positions at Columbia Management Investment Advisers LLC: Head of Intermediary Distribution (2008-2012), Managing Director, Strategic Relations (2005-2008), Managing Director, Head of National Accounts (2004-2005); Senior Vice President, National Account Manager (2002-2004), Senior Vice President, Key Account Manager (1999-2002) and Vice President, Key Account Manager (1996-1999) of Liberty Funds Distributor, Inc.; President and Director, of Acton Shapleigh Youth Conservation Corps (non -profit) (2012-2015); and Vice President and Director of Grahamtastic Connection (non-profit) (since May 2013). Oversees 57 portfolios in the OppenheimerFunds complex. Ms. Brown has served on the Boards of certain Oppenheimer funds since January 2016, during which time she has become familiar with the Fund’s (and other Oppenheimer funds’) financial, accounting, regulatory and investment matters and has contributed to the Boards’ deliberations. |
| |
Edmund P. Giambastiani, Jr., Trustee (since 2013) Year of Birth: 1948 | | Advisory Board Member of the Maxwell School of Citizenship and Public Affairs of Syracuse University (since April 2012); Director of Mercury Defense Systems Inc. (information technology) (August 2011-February 2013); Trustee of the U.S. Naval Academy Foundation Athletic & Scholarship Program (since November 2010); Advisory Board Member of the Massachusetts Institute of Technology Lincoln Laboratory (federally-funded research development center) (since May 2010); Director of The Boeing Company (aerospace and defense) (since October 2009); Trustee of MITRE Corporation (federally-funded research development center) (since September 2008); Independent Director of QinetiQ Group Plc (defense technology and security) (February 2008-August 2011); Chairman of Monster Worldwide, Inc. (on-line career services) (March 2015-November 2016), |
|
| 66 OPPENHEIMER ROCHESTER PENNSYLVANIA MUNICIPAL FUND |
| | |
| |
Edmund P. Giambastiani, Jr., Continued | | Director of Monster Worldwide, Inc. (on-line career services) (February 2008-June 2011); Lead Director (June 2011-March 2015); Chairman of Alenia North America, Inc. (military and defense products) (January 2008-October 2009); Director of SRA International, Inc. (information technology and services) (January 2008-July 2011); President of Giambastiani Group LLC (national security and energy consulting) (since October 2007); United States Navy, career nuclear submarine officer (June 1970-October 2007), Vice Chairman of the Joint Chiefs of Staff (2005-October 2007), Supreme Allied Commander of NATO Commander Transformation (2003-2005), Commander, U.S. Joint Forces Command (2002-2005). Since his retirement from the U.S. Navy in October 2007, Admiral Giambastiani has also served on numerous U.S. Government advisory boards, investigations and task forces for the Secretaries of Defense, State and Interior and the Central Intelligence Agency. He recently completed serving as a federal commissioner on the Military Compensation and Retirement Modernization Commission. Oversees 57 portfolios in the OppenheimerFunds complex. Admiral Giambastiani has served on the Boards of certain Oppenheimer funds since February 2013, during which time he has become familiar with the Fund’s (and other Oppenheimer funds’) financial, accounting, regulatory and investment matters and has contributed to the Boards’ deliberations. For purposes of this report, Admiral Giambastiani is identified as a Trustee. |
| |
Elizabeth Krentzman, Trustee (since 2014) Year of Birth: 1959 | | Director of Cartica Management, LLC Funds (private investment funds) (since 2017); Trustee of University of Florida Law Center Association, Inc. (since 2016); Member of University of Florida Law Advisory Board, Washington, DC Alumni Group (since 2015); Advisory Board Member of the Securities and Exchange Commission Historical Society (since 2007); held the following positions at Deloitte & Touche LLP: Principal and Chief Regulatory Advisor for Asset Management Services (2007 - 2014) and U.S. Mutual Fund Leader (2011 - 2014); General Counsel of the Investment Company Institute (trade association) (June 2004 - April 2007); held the following positions at Deloitte & Touche LLP: National Director of the Investment Management Regulatory Consulting Practice (1997 - 2004), Principal (2003 - 2004), Director (1998 - 2003) and Senior Manager (1997 - 1998); Assistant Director of the Division of Investment Management - Office of Disclosure and Investment Adviser Regulation of the U.S. Securities and Exchange Commission (1996 - 1997) and various positions with the Division of Investment Management – Office of Regulatory Policy (1991 - 1996) of the U.S. Securities and Exchange Commission; Associate at Ropes & Gray LLP (1987 – 1991). Oversees 57 portfolios in the OppenheimerFunds complex. Ms. Krentzman has served on the Boards of certain Oppenheimer funds since August 2014, during which time she has become familiar with the Fund’s (and other Oppenheimer funds’) financial, accounting, regulatory and investment matters and has contributed to the Boards’ deliberations. |
| |
Mary F. Miller, Trustee (since 2004) Year of Birth: 1942 | | Trustee of International House (not-for-profit) (since June 2007); Trustee of the American Symphony Orchestra (not-for-profit) (October 1998-November 2011); and Senior Vice President and General Auditor of American Express Company (financial services company) (July 1998-February 2003). Oversees 57 portfolios in the OppenheimerFunds complex. Ms. Miller has served on the Boards of certain Oppenheimer funds since August 2004, during which time she has become familiar with the Fund’s (and other Oppenheimer funds’) financial, accounting, regulatory and investment matters and has contributed to the Boards’ deliberations. |
|
| 67 OPPENHEIMER ROCHESTER PENNSYLVANIA MUNICIPAL FUND |
TRUSTEES AND OFFICERS Unaudited / Continued
| | |
| |
Joel W. Motley, Trustee (since 2002) Year of Birth: 1952 | | Director of Office of Finance Federal Home Loan Bank (since September 2016); Director of Greenwall Foundation (since October 2013); Member of Board and Investment Committee of The Greenwall Foundation (since April 2013); Member of the Vestry of Trinity Wall Street (since April 2012); Director of Southern Africa Legal Services Foundation (since March 2012); Board Member of Pulitzer Center for Crisis Reporting (non-profit journalism) (since March 2011); Managing Director of Public Capital Advisors, LLC (privately-held financial advisor) (since January 2006); Managing Director of Carmona Motley, Inc. (privately-held financial advisor) (since January 2002); Director of Columbia Equity Financial Corp. (privately-held financial advisor) (2002-2007); Managing Director of Carmona Motley Hoffman Inc. (privately-held financial advisor) (January 1998-December 2001); Member of the Finance and Budget Committee of the Council on Foreign Relations, Member of the Investment Committee and Board of Human Rights Watch (since July 2000) and Member of the Investment Committee and Board of Historic Hudson Valley (since February 2010). Oversees 57 portfolios in the OppenheimerFunds complex. Mr. Motley has served on the Boards of certain Oppenheimer funds since October 2002, during which time he has become familiar with the Fund’s (and other Oppenheimer funds’) financial, accounting, regulatory and investment matters and has contributed to the Boards’ deliberations. |
| |
Joanne Pace, Trustee (since 2013) Year of Birth: 1958 | | Advisory Board Director of Massey Quick and Company, LLC (since October 2014); Board Director of Horizon Blue Cross Blue Shield of New Jersey (since November 2012); Advisory Board Director of The Alberleen Group LLC (since March, 2012); Board Member (since January 2015), Board Member of 100 Women in Hedge Funds (non-profit) (since January 2015); Advisory Council Member of Morgan Stanley Children’s Hospital (non-profit) (since May, 2012); Senior Advisor of SECOR Asset Management, LP (2010-2011); Managing Director and Chief Operating Officer of Morgan Stanley Investment Management (2006-2010); Partner and Chief Operating Officer of FrontPoint Partners, LLC (hedge fund) (2005-2006); held the following positions at Credit Suisse: Managing Director (2003-2005); Global Head of Human Resources and member of Executive Board and Operating Committee (2004-2005), Global Head of Operations and Product Control (2003- 2004); held the following positions at Morgan Stanley: Managing Director (1997- 2003), Controller and Principal Accounting Officer (1999-2003); Chief Financial Officer (temporary assignment) for the Oversight Committee, Long Term Capital Management (1998-1999). Lead Independent Director and Chair of the Audit and Nominating Committee of The Global Chartist Fund, LLC of Oppenheimer Asset Management (2011-2012); Board Director of Managed Funds Association (2008- 2010); Board Director of Morgan Stanley Foundation (2007-2010) and Investment Committee Chair (2008-2010). Oversees 57 portfolios in the OppenheimerFunds complex. Ms. Pace has served on the Boards of certain Oppenheimer funds since November 2012, including as an Advisory Board Member for certain Oppenheimer funds, during which time she has become familiar with the Fund’s (and other Oppenheimer funds’) financial, accounting, regulatory and investment matters and has contributed to the Board’s deliberations. For purposes of this report, Ms. Pace is identified as a Trustee. |
|
| 68 OPPENHEIMER ROCHESTER PENNSYLVANIA MUNICIPAL FUND |
| | |
| |
Daniel Vandivort, Trustee (since 2014) Year of Birth: 1954 | | Chairman and Lead Independent Director/Trustee (March 2010-September 2014), Chairman of the Audit Committee (March 2009-September 2014) and Director/ Trustee (December 2008-September 2014) of the Board of Directors/Trustees of Value Line Funds; Trustee, Board of Trustees of Huntington Disease Foundation of America (since January 2015 and June 2007-December 2013) and Treasurer, Chairman of the Audit and Finance Committee (since January 2016); Trustee, Board of Trustees, RIM Retirement Savings Plan (2005-2007); President and Chief Investment Officer, Robeco Investment Management, formerly known as Weiss Peck and Greer (January 2005-June 2007); Member, Management Committee of Robeco Investment Management (2001-2007); Chairman and Trustee of the Board of Trustees of Weiss, Peck and Greer Funds (2004-2005); Managing Director and Head of Fixed Income, Weiss, Peck and Greer (November 1994-January 2005); Managing Director and Head of Fixed Income, CS First Boston Investment Management (January 1992-November 1994); Director, Global Product Development, First Boston Asset Management (November 1989 to January 1992); Vice President, Fixed Income Sales, First Boston Corp. (May 1984-November 1989). Oversees 57 portfolios in the OppenheimerFunds complex. Mr. Vandivort has served on the Boards of certain Oppenheimer funds since 2014, during which time he has become familiar with the Fund’s (and other Oppenheimer funds’) financial, accounting, regulatory and investment matters and has contributed to the Boards’ deliberations. |
| | | |
| |
INTERESTED TRUSTEE AND OFFICER | | Mr. Steinmetz is an “Interested Trustee” because he is affiliated with the Manager and the Sub-Adviser by virtue of his positions as Chairman of the Sub-Adviser and officer and director of the Manager. Both as a Trustee and as an officer, Mr. Steinmetz serves for an indefinite term, or until his resignation, retirement, death or removal. Mr. Steinmetz’s address is 225 Liberty Street, New York, New York 10281-1008. |
| |
Arthur P. Steinmetz, Trustee (since 2015), President and Principal Executive Officer (since 2014) Year of Birth: 1958 | | Chairman of the Sub-Adviser (since January 2015); CEO and Chairman of the Manager (since July 2014), President of the Manager (since May 2013), a Director of the Manager (since January 2013), Director of the Sub-Adviser (since July 2014), President, Management Director and CEO of Oppenheimer Acquisition Corp. (the Sub-Adviser’s parent holding company) (since July 2014), and President and Director of OFI SteelPath, Inc. (since January 2013). Chief Investment Officer of the OppenheimerFunds advisory entities from (January 2013-December 2013); Executive Vice President of the Manager (January 2013-May 2013); Chief Investment Officer of the Sub-Adviser (October 2010-December 2012); Chief Investment Officer, Fixed-Income, of the Sub-Adviser (April 2009-October 2010); Executive Vice President of the Sub-Adviser (October 2009-December 2012); Director of Fixed Income of the Sub-Adviser (January 2009-April 2009); and a Senior Vice President of the Sub-Adviser (March 1993-September 2009). An officer of 101 portfolios in the OppenheimerFunds complex. |
| | | |
| |
| OTHER OFFICERS OF THE FUND | | The addresses of the Officers in the chart below are as follows: for Messrs. Cottier, Willis, DeMitry, Camarella, Pulire, Stein, Mss. Mossow, Lo Bessette, Foxson and Picciotto, 225 Liberty Street, New York, New York 10281-1008, for Mr. Petersen, 6803 S. Tucson Way, Centennial, Colorado 80112-3924. Each Officer serves for an indefinite term or until his or her resignation, retirement, death or removal. |
| |
Scott S. Cottier, Vice President (since 2005) Year of Birth: 1971 | | Senior Vice President of the Sub-Adviser (since January 2017) and a Senior Portfolio Manager (since September 2002). Vice President of the Sub-Adviser (September 2002-January 2017). Portfolio Manager and trader at Victory Capital Management (1999-2002). Team Leader, a Senior Portfolio Manager, an officer and a trader for the Fund and other Oppenheimer funds. |
|
| 69 OPPENHEIMER ROCHESTER PENNSYLVANIA MUNICIPAL FUND |
TRUSTEES AND OFFICERS Unaudited / Continued
| | |
| |
Troy E. Willis, Vice President (since 2005) Year of Birth: 1972 | | Senior Vice President of the Sub-Adviser (since January 2017) and a Senior Portfolio Manager (since January 2006); Vice President of the Sub-Adviser (July 2009-January 2017); Assistant Vice President of the Sub-Adviser (July 2005- June 2009). Portfolio Manager of the Sub-Adviser (June 2002-December 2005). Corporate Attorney for Southern Resource Group (June 1999-July 2001). Team Leader, a Senior Portfolio Manager, an officer and a trader for the Fund and other Oppenheimer funds. |
| |
Mark R. DeMitry, Vice President (since 2009) Year of Birth: 1976 | | Vice President of the Sub-Adviser and a Senior Portfolio Manager (since July 2009); Associate Portfolio Manager of the Fund (September 2006- June 2009). Research Analyst of the Sub-Adviser (June 2003-September 2006) and a Credit Analyst of the Sub-Adviser (July 2001-May 2003). Senior Portfolio Manager, an officer and a trader for the Fund and other Oppenheimer funds. |
| |
Michael L. Camarella. Vice President (since 2009) Year of Birth: 1976 | | Vice President of the Sub-Adviser and a Senior Portfolio Manager (since January 2011); Assistant Vice President of the Sub-Adviser (July 2009-December 2010); Associate Portfolio Manager of the Sub-Adviser (January 2008-December 2010). Research Analyst of the Sub-Adviser (April 2006-December 2007) and a Credit Analyst of the Sub-Adviser (June 2003-March 2006). Senior Portfolio Manager, an officer and a trader for the Fund and other Oppenheimer funds. |
| |
Charles S. Pulire, Vice President (since 2011) Year of Birth: 1977 | | Vice President of the Sub-Adviser and a Senior Portfolio Manager (since February 2013); Assistant Vice President of the Sub-Adviser (December 2010-January 2013); Research Analyst of the Manager (February 2008-November 2010); Credit Analyst of the Sub-Adviser (May 2006-January 2008). Senior Portfolio Manager, an officer and a trader for the Fund and other Oppenheimer funds. |
| |
Elizabeth S. Mossow, Vice President (since 2016) Year of Birth: 1978 | | Vice President of the Sub-Adviser (since January 2016) and Senior Portfolio Manager of the Sub-Adviser (since January 2017); Portfolio Manager of the Sub- Adviser (January 2016-January 2017); Assistant Vice President of the Sub-Adviser (January 2011-January 2016). Associate Portfolio Manager (June 2013-January 2016). Research Analyst of the Sub-Adviser (June 2011-June 2013) and was a Credit Analyst of the Sub-Adviser (May 2007-May 2011). Portfolio Manager, an officer and a trader for the Fund and other Oppenheimer funds. |
| |
Richard A. Stein, Vice President (since 2007) Year of Birth: 1957 | | Director of the Rochester Credit Analysis team (since March 2004); Senior Vice President of the Sub-Adviser (since June 2011) and a Vice President of the Sub- Adviser (November 1997-May 2011); heads up the Rochester Credit Analysis team (since May 1993). |
| |
Cynthia Lo Bessette, Secretary and Chief Legal Officer (since 2016) Year of Birth: 1969 | | Executive Vice President, General Counsel and Secretary of the Manager (since February 2016); Senior Vice President and Deputy General Counsel of the Manager (March 2015-February 2016); Chief Legal Officer of the Sub-Adviser and the Distributor (since February 2016); Vice President, General Counsel and Secretary of Oppenheimer Acquisition Corp. (since February 2016); General Counsel of OFI SteelPath, Inc., VTL Associates, LLC and Index Management Solutions, LLC (since February 2016); Chief Legal Officer of OFI Global Institutional, Inc., HarbourView Asset Management Corporation, OFI Global Trust Company, Oppenheimer Real Asset Management, Inc., OFI Private Investments Inc., Shareholder Services, Inc. and Trinity Investment Management Corporation (since February 2016); Corporate Counsel (February 2012-March 2015) and Deputy Chief Legal Officer (April 2013-March 2015) of Jennison Associates LLC; Assistant General Counsel (April 2008-September 2009) and Deputy General Counsel (October 2009-February 2012) of Lord Abbett & Co. LLC. An officer of 101 portfolios in the OppenheimerFunds complex. |
|
| 70 OPPENHEIMER ROCHESTER PENNSYLVANIA MUNICIPAL FUND |
| | |
| |
Jennifer Foxson, Vice President and Chief Business Officer (since 2014) Year of Birth: 1969 | | Senior Vice President of OppenheimerFunds Distributor, Inc. (since June 2014); Vice President of OppenheimerFunds Distributor, Inc. (April 2006-June 2014); Vice President of the Sub-Adviser (January 1998-March 2006); Assistant Vice President of the Sub-Adviser (October 1991-December 1998). An officer of 101 portfolios in the OppenheimerFunds complex. |
| |
Mary Ann Picciotto, Chief Compliance Officer and Chief Anti-Money Laundering Officer (since 2014) Year of Birth: 1973 | | Senior Vice President and Chief Compliance Officer of the Manager (since March 2014); Chief Compliance Officer of the Sub-Adviser, OFI SteelPath, Inc., OFI Global Trust Company, OFI Global Institutional, Inc., Oppenheimer Real Asset Management, Inc., OFI Private Investments, Inc., Harborview Asset Management Corporation, Trinity Investment Management Corporation, and Shareholder Services, Inc. (since March 2014); Managing Director of Morgan Stanley Investment Management Inc. and certain of its various affiliated entities; Chief Compliance Officer of various Morgan Stanley Funds (May 2010-January 2014); Chief Compliance Officer of Morgan Stanley Investment Management Inc. (April 2007-January 2014). An officer of 101 portfolios in the OppenheimerFunds complex. |
| |
Brian S. Petersen, Treasurer and Principal Financial & Accounting Officer (since 2016) Year of Birth: 1970 | | Senior Vice President of the Manager (since January 2017); Vice President of the Manager (January 2013-January 2017); Vice President of the Sub-Adviser (February 2007-December 2012); Assistant Vice President of the Sub-Adviser (August 2002- 2007). An officer of 101 portfolios in the OppenheimerFunds complex. |
The Fund’s Statement of Additional Information contains additional information about the Fund’s Trustees and Officers and is available without charge upon request by calling 1.800.CALL OPP (225.5677).
|
| 71 OPPENHEIMER ROCHESTER PENNSYLVANIA MUNICIPAL FUND |
OPPENHEIMER ROCHESTER PENNSYLVANIA MUNICIPAL FUND
| | |
| |
| Manager | | OFI Global Asset Management, Inc. |
| |
| Sub-Adviser | | OppenheimerFunds, Inc. |
| |
| Distributor | | OppenheimerFunds Distributor, Inc. |
| |
Transfer and Shareholder Servicing Agent | | OFI Global Asset Management, Inc. |
| |
| Sub-Transfer Agent | | Shareholder Services, Inc. DBA OppenheimerFunds Services |
| |
Independent Registered Public Accounting Firm | | KPMG LLP |
| |
| Legal Counsel | | Kramer Levin Naftalis & Frankel LLP |
© 2017 OppenheimerFunds, Inc. All rights reserved.
|
| 72 OPPENHEIMER ROCHESTER PENNSYLVANIA MUNICIPAL FUND |
PRIVACY POLICY NOTICE
As an Oppenheimer fund shareholder, you are entitled to know how we protect your personal information and how we limit its disclosure.
Information Sources
We obtain nonpublic personal information about our shareholders from the following sources:
| ● | | Applications or other forms |
| ● | | When you create a user ID and password for online account access |
| ● | | When you enroll in eDocs Direct,SM our electronic document delivery service |
| ● | | Your transactions with us, our affiliates or others |
| ● | | Technologies on our website, including: “cookies” and web beacons, which are used to collect data on the pages you visit and the features you use. |
If you visit oppenheimerfunds.com and do not log on to the secure account information areas, we do not obtain any personal information about you. When you do log on to a secure area, we do obtain your user ID and password to identify you. We also use this information to provide you with products and services you have requested, to inform you about products and services that you may be interested in and assist you in other ways.
We do not collect personal information through our website unless you willingly provide it to us, either directly by email or in those areas of the website that request information. In order to update your personal information (including your mailing address, email address and phone number) you must first log on and visit your user profile.
If you have set your browser to warn you before accepting cookies, you will receive the warning message with each cookie. You can refuse cookies by turning them off in your browser. However, doing so may limit your access to certain sections of our website.
We use cookies to help us improve and manage our website. For example, cookies help us recognize new versus repeat visitors to the site, track the pages visited, and enable some special features on the website. This data helps us provide a better service for our website visitors.
Protection of Information
We do not disclose any non-public personal information (such as names on a customer list) about current or former customers to anyone, except as permitted by law.
Disclosure of Information
Copies of confirmations, account statements and other documents reporting activity in your fund accounts are made available to your financial advisor (as designated by you). We may also use details about you and your investments to help us, our financial service affiliates, or firms that jointly market their financial products and services with ours, to better serve your investment needs or suggest educational material that may be of interest to you. If this requires us to provide you with an opportunity to “opt in” or “opt out” of such information sharing with a firm not affiliated with us, you will receive notification on how to do so, before any such sharing takes place.
Right of Refusal
We will not disclose your personal information to unaffiliated third parties (except as permitted by law), unless we first offer you a reasonable opportunity to refuse or “opt out” of such disclosure.
|
| 73 OPPENHEIMER ROCHESTER PENNSYLVANIA MUNICIPAL FUND |
PRIVACY POLICY NOTICE Continued
Internet Security and Encryption
In general, the email services provided by our website are encrypted and provide a secure and private means of communication with us. To protect your own privacy, confidential and/or personal information should only be communicated via email when you are advised that you are using a secure website. As a security measure, we do not include personal or account information in non-secure emails, and we advise you not to send such information to us in non-secure emails. Instead, you may take advantage of the secure features of our website to encrypt your email correspondence. To do this, you will need to use a browser that supports Secure Sockets Layer (SSL) protocol.
| ● | | All transactions, including redemptions, exchanges and purchases, are secured by SSL and 256-bit encryption. SSL is used to establish a secure connection between your PC and OppenheimerFunds’ server. It transmits information in an encrypted and scrambled format. |
| ● | | Encryption is achieved through an electronic scrambling technology that uses a “key” to code and then decode the data. Encryption acts like the cable converter box you may have on your television set. It scrambles data with a secret code so that no one can make sense of it while it is being transmitted. When the data reaches its destination, the same software unscrambles the data. |
| ● | | You can exit the secure area by either closing your browser, or for added security, you can use the Log Out button before you close your browser. |
Other Security Measures
We maintain physical, electronic and procedural safeguards to protect your personal account information. Our employees and agents have access to that information only so that they may offer you products or provide services, for example, when responding to your account questions.
How You Can Help
You can also do your part to keep your account information private and to prevent unauthorized transactions. If you obtain a user ID and password for your account, safeguard that information. Also, take special precautions when accessing your account on a computer used by others.
Who We Are
This joint notice describes the privacy policies of the Oppenheimer funds, OppenheimerFunds, Inc., each of its investment adviser subsidiaries, OppenheimerFunds Distributor, Inc. and OFI Global Trust Co. It applies to all Oppenheimer fund accounts you presently have, or may open in the future, using your Social Security number—whether or not you remain a shareholder of our funds. This notice was last updated November 2016. In the event it is updated or changed, we will post an updated notice on our website at oppenheimerfunds.com. If you have any questions about this privacy policy, write to us at P.O. Box 5270, Denver, CO 80217-5270, email us by clicking on the Contact Us section of our website at oppenheimerfunds.com or call us at 1.800.CALL OPP (225.5677).
|
| 74 OPPENHEIMER ROCHESTER PENNSYLVANIA MUNICIPAL FUND |
THIS PAGE INTENTIONALLY LEFT BLANK.
|
| 75 OPPENHEIMER ROCHESTER PENNSYLVANIA MUNICIPAL FUND |
THIS PAGE INTENTIONALLY LEFT BLANK.
|
| 76 OPPENHEIMER ROCHESTER PENNSYLVANIA MUNICIPAL FUND |
THIS PAGE INTENTIONALLY LEFT BLANK.
|
| 77 OPPENHEIMER ROCHESTER PENNSYLVANIA MUNICIPAL FUND |
THIS PAGE INTENTIONALLY LEFT BLANK.
|
| 78 OPPENHEIMER ROCHESTER PENNSYLVANIA MUNICIPAL FUND |
THIS PAGE INTENTIONALLY LEFT BLANK.
|
| 79 OPPENHEIMER ROCHESTER PENNSYLVANIA MUNICIPAL FUND |

OppenheimerFunds®
The Right Way
to Invest
Visit us at oppenheimerfunds.com for 24-hr access to
account information and transactions or call us at 800.CALL
OPP (800.225.5677) for 24-hr automated information and
automated transactions. Representatives also available
Mon–Fri 8am-8pm ET.
| | |
Visit Us oppenheimerfunds.com Call Us 800 225 5677 | | |
Follow Us 
| | Oppenheimer funds are distributed by OppenheimerFunds Distributor, Inc. 225 Liberty Street, New York, NY 10281-1008 © 2017 OppenheimerFunds Distributor, Inc. All rights reserved. RA0740.001.0717 September 26, 2017 |
Table of Contents
Class A Shares
AVERAGE ANNUAL TOTAL RETURNS AT 7/31/17
| | | | | | |
| | | Class A Shares of the Fund | | |
| | | Without Sales Charge | | With Sales Charge | | Bloomberg Barclays
Municipal Bond Index |
| 1-Year | | 4.47% | | -0.50% | | 0.26% |
| 5-Year | | 6.13 | | 5.10 | | 3.10 |
| 10-Year | | 1.95 | | 1.45 | | 4.60 |
Performance data quoted represents past performance, which does not guarantee future results. The investment return and principal value of an investment in the Fund will fluctuate so that an investor’s shares, when redeemed, may be worth more or less than their original cost. Fund returns include changes in share price, reinvested distributions, and a 4.75% maximum applicable sales charge except where “without sales charge” is indicated. Current performance may be lower or higher than the performance quoted. Returns do not consider capital gains or income taxes on an individual’s investment. For performance data current to the most recent month-end, visit oppenheimerfunds.com or call 1.800.CALL OPP (225.5677).
Our Twitter handle is @RochesterFunds.
|
| 2 OPPENHEIMER ROCHESTER HIGH YIELD MUNICIPAL FUND |
Fund Performance Discussion
Oppenheimer Rochester High Yield Municipal Fund continued to generate attractive levels of tax-free income during the most recent reporting period. As of July 31, 2017, the Class A shares provided a distribution yield at net asset value (NAV) of 5.41% and a yield-driven, 12-month total return of 4.47% at NAV. Over the same period, the Fund’s benchmark, the Bloomberg Barclays Municipal Bond Index, provided a total return of 0.26%. Tax-free income comprised 100% of the total return this reporting period.
MARKET OVERVIEW
During this reporting period, U.S. equities rallied and yields on AAA-rated municipal bonds and Treasury securities improved. The price declines in the municipal bond market, which were most notable immediately after Election Day, depressed the total return of this Fund’s benchmark, which is a widely used index of the performance of the general muni market.
On June 14, 2017, the Fed Funds target rate was raised by one-quarter of 1 percentage point to a range of 1.00% to 1.25%, and the Federal Reserve Open Market Committee (FOMC) signaled plans for one more rate
The average distribution yield in Lipper’s High Yield Municipal Debt Funds category was 3.72% at the end of this reporting period. At 5.41%, the distribution yield at NAV for this Fund’s Class A shares was 169 basis points higher than the category average.
increase in 2017. Citing continued U.S. economic growth and job market strength, the Fed also announced it would begin to reduce its $4.5 trillion holdings of bonds and other securities later this year.
| | | | | |
| | |
YIELDS & DISTRIBUTIONS FOR CLASS A SHARES | | | | | |
| Dividend Yield w/o sales charge | | | | 5.41 | % |
| Dividend Yield with sales charge | | | | 5.15 | |
| Standardized Yield | | | | 3.80 | |
| Taxable Equivalent Yield | | | | 6.71 | |
| Last distribution (7/25/17) | | | $ | 0.033 | |
| Total distributions (8/1/16 to 7/31/17) | | | $ | 0.420 | |
| |
Endnotes for this discussion begin on page 15 of this report. | | | | | |
|
| 3 OPPENHEIMER ROCHESTER HIGH YIELD MUNICIPAL FUND |
At the July 26, 2017 meeting, the FOMC announced its decision to maintain the target range for the Fed Funds rate to the range that had been set in June. According to the Fed’s press release, the FOMC “expects that economic conditions will evolve in a manner that will warrant gradual increases” to the Fed Funds rate. Additionally, the “balance sheet normalization program” for reducing its holdings will begin “relatively soon, provided the economy evolves broadly as anticipated.”
The benchmark interest rate was raised in December 2016 and in March 2017, each time by one-quarter of 1 percentage point. At a press conference after the March 2017 meeting, Chairman Janet Yellen said “The simple message is—the economy is doing well. The unemployment rate has moved way down, and many more people are feeling optimistic about their labor prospects.”
From December 2008 until December 2015, the key rate was held to a range of zero to 0.25%.
We remind investors that a change in the Fed Funds rate does not automatically translate into a change in longer-term interest rates, which are determined by the marketplace. During this reporting period, the muni market’s reactions to the Fed’s moves did not appear to be especially significant or lasting. This Fund’s portfolio managers do not adjust their investment style in response to Fed actions.
The yield curve for high-grade municipal bonds was higher at the end of this reporting period than on July 29, 2016, the last business day of the previous reporting period. The median yield on 30-year, AAA-rated muni bonds stood at 2.89% on July 31, 2017, up 62 basis points from July 29, 2016. The median yield on 10-year, AAA-rated muni bonds was 2.07% on July 31, 2017, up 62 basis points from the July 2016 date, and the median yield on 1-year, AAA-rated muni bonds was 0.85%, up 40 basis points from the July 2016 date.
The Treasury yield curve also was higher at the end of the reporting period than on July 29, 2016. While the Treasury yield curve maintained its shape – moving up uniformly – the muni yield curve steepened as the yields on longer-term munis rose more than the yields on shorter-term munis. While a steepening yield curve reflects investors’ expectations for a stronger economy and, perhaps, rising inflation, we note that high-grade munis with maturities of 15 years or more continued to offer taxpayers in all federal tax brackets more favorable after-tax yields than Treasury securities with comparable maturities; Treasury bonds are backed by the full faith and credit of the U.S. government.
This reporting period was also characterized by credit spread tightening, which occurs when the difference between yields on
|
| 4 OPPENHEIMER ROCHESTER HIGH YIELD MUNICIPAL FUND |
low-rated municipal bonds and higher-rated bonds decreases. As credit spreads tighten, investments in BBB-rated, lower-rated and unrated securities typically outperform municipal securities with higher credit ratings.
The Commonwealth of Puerto Rico remained in the headlines throughout this reporting period, and more detailed information about the developments discussed below can be found on our online PR Roundup (oppenheimerfunds.com/puerto-rico).
In August 2016, the Obama administration announced the seven members of the federal oversight board established by the Puerto Rico Oversight, Management and Economic Stability Act (PROMESA), which was enacted in June 2016.
At the outset of this reporting period, the Rochester complex received 100% of the payments owed on holdings backed by Puerto Rico’s sales and use tax (COFINA bonds) and 100% of the payments owed on its Municipal Finance Authority holdings. The Government Development Bank of Puerto Rico (GDB), the Public Finance Corporation (PFC) and the Puerto Rico Infrastructure and Finance Authority (PRIFA) did not make their August 1, 2016 payments, and the Commonwealth also failed to make an interest payment of $1.3 million on its G.O. debt.
In September 2016, S&P downgraded several senior unsecured GDB bonds GDB after the GDB failed to make August 1 and September 1, 2016 interest payments.
In early September 2016, Francisco Besosa, a U.S. District Court judge, said he would not halt a lawsuit in which plaintiffs allege that Gov. Alejandro García Padilla violated PROMESA by declaring a moratorium on payments of constitutionally backed debt.
The fiscal plan presented to the federal oversight board on October 14 by then-Gov. Padilla was immediately challenged by Carlos Garcia, a member of the oversight board. He took issue with the government’s assessment of its fiscal situation.
Ricardo Rosselló Nevares, who was elected governor of the Commonwealth in November 2016, began his term in office by signing several executive orders related to fiscal and economic conditions in the Commonwealth, including a measure that required reductions in the operating expenses of all government agencies. Gov. Rosselló also ordered the use of zero-base budgets beginning with fiscal 2018 (which began July 1, 2017) and the creation of an entity to expedite the approvals of permits and certifications for infrastructure projects.
|
| 5 OPPENHEIMER ROCHESTER HIGH YIELD MUNICIPAL FUND |
On January 3, 2017, PREPA made its $192.5 million interest payment in full. Also in early January, subsidiaries of the insurer Assured Guaranty made payments of $39 million and $5 million on G.O. debt and Public Building Authority debt, respectively. The Commonwealth, as expected, failed to pay $358 million of interest on its G.O. bonds on January 3.
In the first month of his administration, Gov. Rosselló tried to secure some changes to deadlines set forth in PROMESA. The federal oversight board was amenable but imposed certain conditions, including a commitment not to take more loans to provide short-term liquidity. Simultaneously, the federal oversight board told Gov. Rosselló that his plan had to make spending cuts and certain revenue increases.
Also in January 2017, the governor signed an extension through December 2021 to a tax on foreign corporations. The Act 154 tax, originally slated to expire at the end of 2017, has historically been a significant source of government revenue. The governor also signed a new measure, the Puerto Rico Financial Emergency and Fiscal Responsibility Act, to replace the Debt Moratorium Act, which had given the former governor the power to suspend debt payments.
Full coupon payments were made on February 1, 2017, on COFINAs as well as bonds issued
by the Puerto Rico Industrial Development Company, PRASA (the Commonwealth’s aqueduct and sewer authority), and PRHTA (its highways and transportation authority). However, the GDB, PFC and PRIFA failed to make certain payments on that date.
In February 2017, Gov. Rosselló discussed his 10-year fiscal plan. The plan called for cuts in government spending and for funds to be set aside for future debt service obligations, but it did not meet the federal oversight board’s requirement that certain fiscal adjustments be made to close the fiscal 2019 budget gap. The federal oversight board called for emergency spending cuts on March 8 based on concerns about the Commonwealth’s liquidity and the need to reduce spending immediately; shortly thereafter, the board approved an amended plan and established a number of milestones for the Rosselló administration.
In other developments related to the fiscal plan, the federal fiscal 2018 budget proposal that President Trump announced in May 2017 calls for $1.59 billion to fund Medicaid in Puerto Rico, an increase of $1.24 billion versus the previous Medicaid cap for the Commonwealth. Puerto Rico officials did not adjust the Commonwealth’s fiscal plan, which assumes the federal government’s Medicaid allocation is zero.
Despite the portfolio management team’s multi-year efforts to reach negotiated
|
| 6 OPPENHEIMER ROCHESTER HIGH YIELD MUNICIPAL FUND |
settlements with various issuers in Puerto Rico, the federal oversight board in May 2017 commenced proceedings under Title III of PROMESA, similar to a Chapter 9 bankruptcy, for the Commonwealth, the Puerto Rico Sales Tax Financing Corporation (issuer of COFINA bonds), the PRHTA and the Employee Retirement System. The commencement of these proceedings effectively blocked various lawsuits that had been filed soon after the May 1 expiration of the stay of litigation, which had been included in PROMESA and subsequently extended.
The Commonwealth held a vote regarding statehood in June. Those who voted in the nonbinding referendum were overwhelmingly in favor of changing the Commonwealth’s status to U.S. statehood, but less than one-quarter of the electorate voted.
The Puerto Rico Electric Power Authority (PREPA) and its forbearing bondholders, including Oppenheimer Rochester, worked throughout this reporting period to finalize a restructuring support agreement (RSA) whose terms were agreed on in September 2015. In December 2016, PREPA and its forbearing bondholders agreed to extend the RSA until March 31, 2017; further extensions pushed the RSA’s expiration until the end of June 2017.
PREPA allowed the nearly finalized RSA to terminate in late June 2017, even though the
forbearing creditors had offered to extend the agreement again. On July 2, 2017, the federal oversight board commenced PREPA’s Title III proceeding; the utility did not make its July 3 payments of principal and interest.
In Title III, the unresolved issues among debtors and creditors will proceed along separate tracks: mediation and litigation. While court-facilitated mediation may be an effective and efficient process, investors should be aware that protracted litigation remains a very real possibility. These developments affect current dividend distribution calculations for funds with holdings subject to Title III. The Title III proceedings are being overseen by U.S. District Judge Laura Taylor Swain, who was selected by the Chief Justice of the U.S. Supreme Court, John Roberts.
In late June 2017, the federal oversight board approved its own consolidated budget and earmarked more than $900 million for debt-service obligations. The new budget came as a response to the governor’s proposed $9.56 billion general fund budget, which had been released in May and had called for a 6.3% increase in spending but very limited money available for debt service, inconsistent with the requirements of PROMESA.
In mid-July 2017, the federal oversight board approved a restructuring plan for the GDB, giving bondholders between 55% and 75%
|
| 7 OPPENHEIMER ROCHESTER HIGH YIELD MUNICIPAL FUND |
of the face value of their debt; the size of the “haircut” depends on the interest rate of the newly issued debt. In late July, the mayor of San Juan announced intentions to challenge this plan as a means to protect the city’s GDB deposits. (This Fund does not hold GDB debt; the Oppenheimer Rochester funds’ holdings of GDB debt represent less than one-hundredth of 1% of the assets of a single fund, Oppenheimer Rochester Limited Term California Municipal Fund.)
Please note: Shortly after the end of this reporting cycle, the Puerto Rico Legislature and the federal oversight board approved a budget for fiscal year 2018, ordered 5% spending cuts and announced plans to conduct a “comprehensive investigation” of the Commonwealth’s debt. Puerto Rico’s cash position as of June 30, 2017 was $1.5 billion higher than Judge Swain had been told it would be, according to figures released in early August, raising new questions about why the Commonwealth claimed it could not make debt payments.
Tax collections in July, the first month of the fiscal 2018, were $20 million to $30 million ahead of budget, according to Puerto Rico’s treasury secretary; in fiscal 2017, tax collections exceeded forecasts by 2.6%, or $235 million. The unemployment rate in July dropped to 9.8%, which was lower than it had been since early 2008. Also in early August, the Commonwealth’s Supreme Court
denied the governor’s request to keep his initial draft budget (submitted to the board in late April) and other documents under wraps.
At an August 9 hearing, Judge Swain approved an agreement establishing a procedure to resolve, by December 15, the debt dispute between Puerto Rico and certain COFINA bondholders. Debt restructurings for GDB securities, which were approved by the Puerto Rico Legislature two days later, have yet to receive approval from the U.S. District Court.
In September, two hurricanes – Irma and Maria – caused damage on Puerto Rico. Irma passed to the north of the Commonwealth, but Maria made landfall and damage from it was extensive.
FUND PERFORMANCE
Oppenheimer Rochester High Yield Municipal Fund held more than 1,190 securities as of July 31, 2017. The Fund was invested in a broad range of sectors, providing shareholders with a diversity of holdings that we believe would be difficult and costly to replicate in an individual portfolio.
During this reporting period, a rally in U.S. equities and persistent low interest rates put pressure on the dividends of many fixed income investments. This Fund’s Class A dividend, which was 3.7 cents per share at the outset of this reporting period, was
|
| 8 OPPENHEIMER ROCHESTER HIGH YIELD MUNICIPAL FUND |
reduced to 3.5 cents per share beginning with the November 2016 payout and to 3.3 cents per share beginning with the July 2017 payout. In all, the Fund distributed 42.4 cents per Class A share this reporting period. Shareholders should note that market conditions during this reporting period did not affect the Fund’s overall investment goals or cause it to pay any capital gain distributions.
Seven of the 10 largest sectors were among the top eight contributors to the Fund’s performance during this reporting period. The Fund’s outperformance at NAV versus its benchmark this reporting period was primarily driven by its holdings of tobacco bonds. These high-yielding securities, which are backed by proceeds from the landmark 1998 Master Settlement Agreement (MSA), constituted
9 OPPENHEIMER ROCHESTER HIGH YIELD MUNICIPAL FUND

10 OPPENHEIMER ROCHESTER HIGH YIELD MUNICIPAL FUND
the Fund’s largest sector as of July 31, 2017. The Special Assessments sector was both the second largest and the second strongest contributor to the Fund’s total return during this reporting period. Special Assessment securities are land development bonds that help finance the infrastructure needs of new real estate development. We continue to believe that improvements in the housing market and the general economy could further strengthen the credit profiles of the Fund’s land development securities. Other leading contributors to performance were the securities in Fund’s fifth through eighth largest sectors: hospital/healthcare, adult living facilities, sewer utilities and tax increment financing bonds, respectively. Research-based security selection continued to be a factor in the strong performance of these sectors. Bonds issued by PRASA represented about one-fifth of the assets in the sewer utilities sector, as of July 31, 2017. The Fund’s tenth largest sector – education – was also among the eight top contributors to the Fund’s total return this reporting period.
Of the Fund’s 43 sectors, 13 detracted from the Fund’s total return during the reporting period. Many of the securities in the Fund’s electric utilities sector, the Fund’s ninth largest as of July 31, 2017, were issued by PREPA. Like the PREPA securities, the Fund’s holdings of general obligation (G.O.) and the sales tax revenue bonds – comprising the Fund’s third and fourth largest sectors, respectively – were also adversely affected by developments
in Puerto Rico (as discussed above). Also detracting from the Fund’s performance were several smaller sectors, including diversified financial services, municipal leases and resource recovery, among others.
In aggregate, the Fund’s substantial investments in securities issued in the Commonwealth of Puerto Rico detracted from performance this reporting period. (As discussed above, the Commonwealth continued to experience significant financial difficulties this reporting period; the Fund’s current dividend distribution calculations reflect adjustments based on the failure of various Commonwealth issuers to make their debt-service payments on time and in full.) The securities are exempt from federal, state and local income taxes, and the Fund’s holdings include the aforementioned G.O. bonds and securities from many different sectors. Most of the Fund’s investments in securities issued in Puerto Rico are supported by taxes and other revenues and are designed to help finance electric utilities, highways and education, among other entities.
Investors should note that some of this Fund’s investments in securities issued in Puerto Rico – including some of the G.O.s and sales tax revenue bonds – are insured. A complete listing of securities held by this Fund can be found in this report’s Statement of Investments.
|
| 11 OPPENHEIMER ROCHESTER HIGH YIELD MUNICIPAL FUND |
INVESTMENT STRATEGY
This high yield fund intends to hold no more than 70% of total assets in below-investment-grade securities, or “junk “ bonds, under normal market conditions; the percentage of assets is measured at the time of purchase as is the credit quality of the securities. Additionally, the credit quality is based on Nationally Recognized Statistical Rating Organization (“NRSRO”) ratings or, if no NRSRO rating, on internal ratings. This Fund does not have a maturity cap.
While market conditions can and do fluctuate, the Fund’s portfolio management team
adheres to a consistent investment approach based on its belief that tax-free yield can help investors achieve their long-term financial objectives. The team does not manage its funds based on predictions of interest rate changes. Further details about the Rochester team’s investment approach can be found on our landing page, oppenheimerfunds. com/rochesterway.
In closing, we believe that the structure and sector composition of this Fund and the team’s use of time-tested strategies will continue to benefit fixed income investors through interest rate and economic cycles.
| | |
 | | 
Scott S. Cottier, CFA Senior Vice President, Senior Portfolio Manager and Team Leader |
| | |
 | | 
Troy E. Willis, CFA, J.D. Senior Vice President, Senior Portfolio Manager and Team Leader |
On behalf of the rest of the Rochester portfolio management team: Mark R. DeMitry, Michael L. Camarella, Charles S. Pulire and Elizabeth S. Mossow.
|
| 12 OPPENHEIMER ROCHESTER HIGH YIELD MUNICIPAL FUND |
Top Holdings and Allocations
| | | | |
TOP TEN CATEGORIES | | | | |
| Tobacco Master Settlement Agreement | | | 20.3% | |
| Special Assessment | | | 7.1 | |
| General Obligation | | | 7.1 | |
| Sales Tax Revenue | | | 7.1 | |
| Hospital/Healthcare | | | 5.6 | |
| Adult Living Facilities | | | 5.2 | |
| Sewer Utilities | | | 4.9 | |
| Tax Increment Financing (TIF) | | | 3.8 | |
| Electric Utilities | | | 3.8 | |
| Education | | | 3.7 | |
Portfolio holdings and allocations are subject to change. Percentages are as of July 31, 2017 and are based on total assets.
CREDIT ALLOCATION
| | | | | | | | | | | | |
| | | NRSRO-
Rated | | | Sub-
Adviser-
Rated | | | Total | |
AAA | | | 3.8% | | | | 1.3% | | | | 5.1% | |
AA | | | 14.3 | | | | 0.0 | | | | 14.3 | |
A | | | 6.6 | | | | 0.0 | | | | 6.6 | |
BBB | | | 11.6 | | | | 3.6 | | | | 15.2 | |
BB or lower | | | 27.8 | | | | 31.0 | | | | 58.8 | |
Total | | | 64.1% | | | | 35.9% | | | | 100.0% | |
The percentages above are based on the market value of the securities as of July 31, 2017 and are subject to change. OppenheimerFunds, Inc. determines the credit allocation of the Fund’s assets using ratings by nationally recognized statistical rating organizations (NRSROs), such as S&P Global Ratings (S&P). For any security rated by an NRSRO other than S&P, the sub-adviser, OppenheimerFunds, Inc., converts that security’s rating to the equivalent S&P rating. If two or more NRSROs have assigned a rating to a security, the highest rating is used. For securities not rated by an NRSRO, the sub-adviser uses its own credit analysis to assign ratings in categories similar to those of S&P. The use of similar categories is not an indication that the sub-adviser’s credit analysis process is consistent or comparable with any NRSRO’s process were that NRSRO to rate the same security.
For the purposes of this Credit Allocation table, securities rated within the NRSROs’ four highest categories—AAA, AA, A and BBB—are investment-grade securities. For further details, please consult the Fund’s prospectus or Statement of Additional Information.
|
| 13 OPPENHEIMER ROCHESTER HIGH YIELD MUNICIPAL FUND |
Performance
| | | | | | | | |
DISTRIBUTION YIELDS | | | | | |
| As of 7/31/17 | |
| | | Without Sales
Charge | | | With Sales
Charge | |
Class A | | | 5.41% | | | | 5.15% | |
Class B | | | 4.78 | | | | N/A | |
Class C | | | 4.83 | | | | N/A | |
Class Y | | | 5.64 | | | | N/A | |
| | | | | | | | |
| STANDARDIZED YIELDS | | | | | |
For the 30 Days Ended 7/31/17 | |
Class A | | | 3.80% | | | | | |
Class B | | | 3.34 | | | | | |
Class C | | | 3.33 | | | | | |
Class Y | | | 4.24 | | | | | |
| | | | | | | | |
| TAXABLE EQUIVALENT YIELDS | | | | | |
As of 7/31/17 | |
Class A | | | 6.71% | | | | | |
Class B | | | 5.90 | | | | | |
Class C | | | 5.88 | | | | | |
Class Y | | | 7.49 | | | | | |
AVERAGE ANNUAL TOTAL RETURNS WITHOUT SALES CHARGE AS OF 7/31/17
| | | | | | | | | | | | | | | | | | | | |
| | | Inception
Date | | | 1-Year | | | 5-Year | | | 10-Year | | | Since
Inception | |
Class A (ORNAX) | | | 10/1/93 | | | | 4.47% | | | | 6.13% | | | | 1.95% | | | | 4.69% | |
Class B (ORNBX) | | | 10/1/93 | | | | 3.55 | | | | 5.29 | | | | 1.45 | | | | 4.50 | |
Class C (ORNCX) | | | 8/29/95 | | | | 3.74 | | | | 5.33 | | | | 1.17 | | | | 3.99 | |
Class Y (ORNYX) | | | 11/29/10 | | | | 4.66 | | | | 6.27 | | | | N/A | | | | 8.09 | |
AVERAGE ANNUAL TOTAL RETURNS WITH SALES CHARGE AS OF 7/31/17 | | | | | |
| | | Inception
Date | | | 1-Year | | | 5-Year | | | 10-Year | | | Since
Inception | |
Class A (ORNAX) | | | 10/1/93 | | | | -0.50% | | | | 5.10% | | | | 1.45% | | | | 4.47% | |
Class B (ORNBX) | | | 10/1/93 | | | | -1.37 | | | | 4.97 | | | | 1.45 | | | | 4.50 | |
Class C (ORNCX) | | | 8/29/95 | | | | 2.75 | | | | 5.33 | | | | 1.17 | | | | 3.99 | |
Class Y (ORNYX) | | | 11/29/10 | | | | 4.66 | | | | 6.27 | | | | N/A | | | | 8.09 | |
|
| 14 OPPENHEIMER ROCHESTER HIGH YIELD MUNICIPAL FUND |
COMPARISON OF CHANGE IN VALUE OF $10,000 HYPOTHETICAL INVESTMENTS IN:
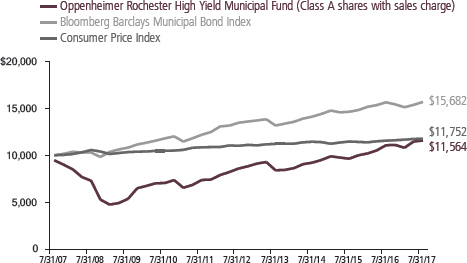
Performance data quoted represents past performance, which does not guarantee future results. The investment return and principal value of an investment in the Fund will fluctuate so that an investor’s shares, when redeemed, may be worth more or less than their original cost. Current performance may be lower or higher than the performance quoted. Returns do not consider capital gains or income taxes on an individual’s investments. For performance data current to the most recent month-end, visit oppenheimerfunds.com or call 1.800. CALL OPP (225.5677). Fund returns include changes in share price, reinvested distributions, and the applicable sales charge: for Class A shares, the current maximum initial sales charge of 4.75%; for Class B shares, the contingent deferred sales charge of 5% (1-year) and 2% (5-year); and for Class C, the contingent deferred sales charge of 1% for the 1-year period. There is no sales charge for Class Y shares. Because Class B shares convert to Class A shares 72 months after purchase, the 10-year return for Class B shares uses Class A performance for the period after conversion.
The Fund’s performance is compared to the performance of the Bloomberg Barclays Municipal Bond Index, an index of a broad range of investment-grade municipal bonds that measures the performance of the general municipal bond market. The Fund’s performance is also compared to the Consumer Price Index, a non-securities index that measures changes in the inflation rate. Indices are unmanaged and cannot be purchased by investors. While index comparisons may be useful to provide a benchmark for the Fund’s performance, it must be noted that the Fund’s investments are not limited to the investments comprising the indices. Index performance includes reinvestment of income, but does not reflect transaction costs, fees, expenses or taxes. Index performance is shown for illustrative purposes only as a benchmark for the Fund’s performance, and does not predict or depict performance of the Fund. The Fund’s performance reflects the effects of the Fund’s business and operating expenses.
Distribution yields for Class A shares are based on dividends of $0.033 for the 28-day accrual period ended July 25, 2017. The yield without sales charge for Class A shares is calculated by dividing annualized dividends by the Class A net asset value (NAV) on July 25, 2017; for the yield with charge, the denominator is the Class A maximum offering price on that date. Distribution yields for Class B, C and Y are annualized based on dividends of $0.0293,
|
| 15 OPPENHEIMER ROCHESTER HIGH YIELD MUNICIPAL FUND |
$0.0294 and $0.0344, respectively, for the 28-day accrual period ended July 25, 2017 and on the corresponding net asset values on that date.
Standardized yield is based on an SEC-standardized formula designed to approximate the Fund’s annualized hypothetical current income from securities less expenses for the 30-day period ended July 31, 2017 and that date’s maximum offering price (for Class A shares) or net asset value (for all other share classes). Each result is compounded semiannually and annualized. Falling share prices artificially increase yields.
The average distribution yield in this Fund’s Lipper category was calculated based on the distributions and the final NAVs of the reporting period for the funds in each category. The average yield at NAV in Lipper’s High Yield Municipal Debt Funds category is based on 173 NAVs, one for each class of each fund in the category; a fund can have up to 4 classes. Lipper yields do not include sales charges, which – if included – would reduce results.
Taxable equivalent yield is based on the standardized yield and the 2017 top federal tax rate of 43.4%. Calculations factor in the 3.8% tax on unearned income under the Patient Protection and Affordable Care Act, as applicable. A portion of the Fund’s distributions may be subject to tax; distributions may also increase an investor’s exposure to the alternative minimum tax. Capital gains distributions are taxable as capital gains. Tax treatments of the Fund’s distributions and capital gains may vary by state; investors should consult a tax advisor to determine if the Fund is appropriate for them. Each result is compounded semiannually and annualized. Falling share prices artificially increase yields. This Report must be preceded or accompanied by a Fund prospectus.
Investments in “tobacco bonds,” which are backed by the proceeds a state or territory receives from the 1998 national litigation settlement with tobacco manufacturers, may be vulnerable to economic and/or legislative events that affect issuers in a particular municipal market sector. Annual payments by MSA-participating manufacturers, for example, hinge on many factors, including annual domestic cigarette shipments, inflation and the relative market share of non-participating manufacturers. To date, we believe consumption figures remain within an acceptable range of the assumptions used to structure MSA bonds. Future MSA payments could be reduced if consumption were to fall more rapidly than originally forecast.
The median yields for AAA-rated municipal securities are provided by Municipal Market Advisors (MMA) and are based on its benchmark of general obligation bonds structured with a 5% coupon and a 10-year par call. The MMA benchmark is constructed using yields from a group of active primary and secondary market makers and other municipal market participants.
The Fund’s investment strategy and focus can change over time. The mention of specific fund holdings does not constitute a recommendation by OppenheimerFunds, Inc. or its affiliates.
Before investing in any of the Oppenheimer funds, investors should carefully consider a fund’s investment objectives, risks, charges and expenses. Fund prospectuses and summary prospectuses contain this and other information about the funds, and may be obtained by asking your financial advisor, visiting oppenheimerfunds.com, or calling 1.800.CALL OPP (225.5677). Read prospectuses and summary prospectuses carefully before investing.
|
| 16 OPPENHEIMER ROCHESTER HIGH YIELD MUNICIPAL FUND |
Shares of Oppenheimer funds are not deposits or obligations of any bank, are not guaranteed by any bank, are not insured by the FDIC or any other agency and involve investment risks, including the possible loss of the principal amount invested.
|
| 17 OPPENHEIMER ROCHESTER HIGH YIELD MUNICIPAL FUND |
Fund Expenses
Fund Expenses. As a shareholder of the Fund, you incur two types of costs: (1) transaction costs, which may include sales charges (loads) on purchase payments and/or contingent deferred sales charges on redemptions; and (2) ongoing costs, including management fees; distribution and service fees; and other Fund expenses. These examples are intended to help you understand your ongoing costs (in dollars) of investing in the Fund and to compare these costs with the ongoing costs of investing in other mutual funds.
The examples are based on an investment of $1,000.00 invested at the beginning of the period and held for the entire 6-month period ended July 31, 2017.
Actual Expenses. The first section of the table provides information about actual account values and actual expenses. You may use the information in this section for the class of shares you hold, together with the amount you invested, to estimate the expense that you paid over the period. Simply divide your account value by $1,000.00 (for example, an $8,600.00 account value divided by $1,000.00 = 8.60), then multiply the result by the number in the first section under the heading entitled “Expenses Paid During 6 Months Ended July 31, 2017” to estimate the expenses you paid on your account during this period.
Hypothetical Example for Comparison Purposes. The second section of the table provides information about hypothetical account values and hypothetical expenses based on the Fund’s actual expense ratio for each class of shares, and an assumed rate of return of 5% per year for each class before expenses, which is not the Fund’s actual return. The hypothetical account values and expenses may not be used to estimate the actual ending account balance or expenses you paid for the period. You may use this information to compare the ongoing costs of investing in the Fund and other funds. To do so, compare this 5% hypothetical example for the class of shares you hold with the 5% hypothetical examples that appear in the shareholder reports of the other funds.
Please note that the expenses shown in the table are meant to highlight your ongoing costs only and do not reflect any transactional costs, such as front-end or contingent deferred sales charges (loads). Therefore, the “hypothetical” section of the table is useful in comparing ongoing costs only, and will not help you determine the relative total costs of owning different funds. In addition, if these transactional costs were included, your costs would have been higher.
|
| 18 OPPENHEIMER ROCHESTER HIGH YIELD MUNICIPAL FUND |
| | | | | | |
| Actual | | Beginning Account Value February 1, 2017 | | Ending Account Value July 31, 2017 | | Expenses Paid During 6 Months Ended
July 31, 2017 |
Class A | | $ 1,000.00 | | $ 1,071.40 | | $ 5.66 |
Class B | | 1,000.00 | | 1,067.50 | | 9.22 |
Class C | | 1,000.00 | | 1,068.10 | | 9.22 |
Class Y | | 1,000.00 | | 1,072.60 | | 4.58 |
| | | |
| Hypothetical | | | | | | |
| (5% return before expenses) | | | | | | |
Class A | | 1,000.00 | | 1,019.34 | | 5.52 |
Class B | | 1,000.00 | | 1,015.92 | | 8.99 |
Class C | | 1,000.00 | | 1,015.92 | | 8.99 |
Class Y | | 1,000.00 | | 1,020.38 | | 4.47 |
Expenses are equal to the Fund’s annualized expense ratio for that class, multiplied by the average account value over the period, multiplied by 181/365 (to reflect the one-half year period). Those annualized expense ratios, excluding indirect expenses from affiliated funds, based on the 6-month period ended July 31, 2017 are as follows:
| | | | |
| Class | | Expense Ratios | |
Class A | | | 1.10% | |
Class B | | | 1.79 | |
Class C | | | 1.79 | |
Class Y | | | 0.89 | |
|
| 19 OPPENHEIMER ROCHESTER HIGH YIELD MUNICIPAL FUND |
STATEMENT OF INVESTMENTS July 31, 2017
| | | | | | | | | | | | | | |
Principal Amount | | | | Coupon | | | Maturity | | | Value | |
| Municipal Bonds and Notes—112.0% | |
| Alabama—4.0% | |
| $2,710,000 | | AL Port Authority (Alabama Docks Dept.)1 | | | 5.000 | % | | | 10/01/2028 | | | $ | 3,201,973 | |
| 2,380,000 | | AL Port Authority (Alabama Docks Dept.)1 | | | 5.000 | | | | 10/01/2029 | | | | 2,792,644 | |
| 4,500,000 | | Homewood, AL Educational Building Authority (Samford University)1 | | | 5.000 | | | | 12/01/2047 | | | | 5,003,820 | |
| 21,895,000 | | Jefferson County, AL Sewer1 | | | 0.000 | 2 | | | 10/01/2039 | | | | 18,226,931 | |
| 30,000,000 | | Jefferson County, AL Sewer1 | | | 0.000 | 2 | | | 10/01/2046 | | | | 24,868,800 | |
| 20,045,000 | | Jefferson County, AL Sewer1 | | | 0.000 | 2 | | | 10/01/2046 | | | | 17,116,025 | |
| 17,500,000 | | Jefferson County, AL Sewer1 | | | 0.000 | 2 | | | 10/01/2050 | | | | 14,933,975 | |
| 50,050,000 | | Jefferson County, AL Sewer1 | | | 0.000 | 2 | | | 10/01/2050 | | | | 41,041,000 | |
| 8,500,000 | | Jefferson County, AL Sewer1 | | | 5.500 | | | | 10/01/2053 | | | | 9,743,635 | |
| 51,500,000 | | Jefferson County, AL Sewer1 | | | 6.500 | | | | 10/01/2053 | | | | 62,078,615 | |
| 25,000,000 | | Jefferson County, AL Sewer1 | | | 7.000 | | | | 10/01/2051 | | | | 30,855,000 | |
| 500,000 | | Mobile, AL Improvement District (McGowin Park)1 | | | 5.250 | | | | 08/01/2030 | | | | 518,945 | |
| 1,300,000 | | Mobile, AL Improvement District (McGowin Park)1 | | | 5.500 | | | | 08/01/2035 | | | | 1,344,031 | |
| | | | | | | | | | | | | 231,725,394 | |
| | | | | | | | | | | | | | | |
| Alaska—0.4% | |
| 1,965,208 | | AK Industrial Devel. & Export Authority (Anchorage Sportsplex/Grace Community Church Obligated Group)3 | | | 6.120 | | | | 08/01/2031 | | | | 294,388 | |
| 1,650,000 | | AK Industrial Devel. & Export Authority Community Provider (Boys & Girls Home)4 | | | 5.875 | | | | 12/01/2027 | | | | 152,625 | |
| 500,000 | | AK Industrial Devel. & Export Authority Community Provider (Boys & Girls Home)4 | | | 6.000 | | | | 12/01/2036 | | | | 46,250 | |
| 1,755,000 | | AK Municipal Bond Bank Authority1 | | | 5.000 | | | | 12/01/2030 | | | | 2,008,580 | |
| 1,365,000 | | AK Municipal Bond Bank Authority1 | | | 5.000 | | | | 12/01/2031 | | | | 1,557,110 | |
| 1,960,000 | | AK Municipal Bond Bank Authority1 | | | 5.000 | | | | 12/01/2032 | | | | 2,225,972 | |
| 2,055,000 | | AK Municipal Bond Bank Authority1 | | | 5.000 | | | | 12/01/2033 | | | | 2,322,993 | |
| 20,860,000 | | AK Northern Tobacco Securitization Corp. (TASC) | | | 6.372 | 5 | | | 06/01/2046 | | | | 1,432,248 | |
| 10,350,000 | | Koyukuk, AK (Tanana Chiefs Conference Health Care Facility)1 | | | 7.750 | | | | 10/01/2041 | | | | 11,819,389 | |
| | | | | | | | | | | | | 21,859,555 | |
| | | | | | | | | | | | | | | |
| Arizona—1.2% | |
| 580,000 | | AZ IDA (Franklin Phonetic Charter School)1 | | | 5.500 | | | | 07/01/2037 | | | | 578,579 | |
| 680,000 | | AZ IDA (Franklin Phonetic Charter School)1 | | | 5.750 | | | | 07/01/2047 | | | | 677,409 | |
| 645,000 | | AZ IDA (Franklin Phonetic Charter School)1 | | | 5.875 | | | | 07/01/2052 | | | | 645,200 | |
| 3,807,000 | | Buckeye, AZ Watson Road Community Facilities District | | | 6.000 | | | | 07/01/2030 | | | | 3,705,201 | |
| 4,680,000 | | East San Luis, AZ Community Facilities District Special Assessment (Area One)3 | | | 6.375 | | | | 01/01/2028 | | | | 3,041,251 | |
| 140,000 | | East San Luis, AZ Community Facilities District Special Assessment (Area Two)3 | | | 8.500 | | | | 01/01/2028 | | | | 83,978 | |
| 1,184,000 | | Estrella Mountain Ranch, AZ Community Facilities District (Golf Village)1 | | | 6.375 | | | | 07/01/2022 | | | | 1,185,705 | |
| 3,877,000 | | Estrella Mountain Ranch, AZ Community Facilities District (Golf Village)1 | | | 6.750 | | | | 07/01/2032 | | | | 3,879,132 | |
| 1,000,000 | | Glendale, AZ IDA (Midwestern University Foundation)1 | | | 5.000 | | | | 07/01/2033 | | | | 1,062,720 | |
| 7,225,000 | | Maricopa County, AZ IDA (Christian Care Surprise) | | | 6.000 | | | | 01/01/2048 | | | | 7,241,039 | |
|
| 20 OPPENHEIMER ROCHESTER HIGH YIELD MUNICIPAL FUND |
| | | | | | | | | | | | | | |
Principal
Amount | | | | Coupon | | | Maturity | | | Value | |
| Arizona (Continued) | | | | | | | | | | | | |
| $1,870,000 | | Maricopa County, AZ IDA (Immanuel Campus Care)3 | | | 8.500 | % | | | 04/20/2041 | | | $ | 744,223 | |
| 294,000 | | Merrill Ranch, AZ Community Facilities District No. 1 Special Assessment Lien1 | | | 5.250 | | | | 07/01/2024 | | | | 294,241 | |
| 435,000 | | Merrill Ranch, AZ Community Facilities District No. 21 | | | 5.250 | | | | 07/15/2040 | | | | 470,818 | |
| 262,000 | | Merrill Ranch, AZ Community Facilities District No. 2 Special Assessment Lien1 | | | 5.250 | | | | 07/01/2024 | | | | 262,375 | |
| 641,000 | | Merrill Ranch, AZ Community Facilities District No. 2 Special Assessment Lien1 | | | 5.300 | | | | 07/01/2030 | | | | 641,519 | |
| 420,000 | | Parkway, AZ Community Facilities District No. 1 (Prescott Valley) | | | 5.300 | | | | 07/15/2025 | | | | 415,724 | |
| 350,000 | | Parkway, AZ Community Facilities District No. 1 (Prescott Valley) | | | 5.350 | | | | 07/15/2031 | | | | 334,030 | |
| 1,650,000 | | Phoenix, AZ IDA (Espiritu Community Devel. Corp.) | | | 6.250 | | | | 07/01/2036 | | | | 1,650,578 | |
| 4,135,000 | | Phoenix, AZ IDA (Freedom Academy)1 | | | 5.500 | | | | 07/01/2046 | | | | 4,172,794 | |
| 1,935,000 | | Phoenix, AZ IDA (Gourmet Boutique West) | | | 5.875 | | | | 11/01/2037 | | | | 977,078 | |
| 1,550,000 | | Pima County, AZ IDA (Christian Care Tucson)1 | | | 5.000 | | | | 06/15/2037 | | | | 1,727,754 | |
| 2,830,000 | | Pima County, AZ IDA (Christian Care Tucson)1 | | | 5.000 | | | | 12/15/2047 | | | | 3,116,877 | |
| 2,400,000 | | Pima County, AZ IDA (Excalibur Charter School)1 | | | 5.500 | | | | 09/01/2046 | | | | 2,293,224 | |
| 2,985,000 | | Pima County, AZ IDA (New Plan Learning/OG Ohio/250 Shoup Mill Obligated Group)1 | | | 8.125 | | | | 07/01/2041 | | | | 3,037,924 | |
| 3,315,000 | | Pima County, AZ IDA (P.L.C. Charter Schools)1 | | | 6.000 | | | | 12/01/2036 | | | | 3,497,590 | |
| 6,310,000 | | Pima County, AZ IDA (P.L.C. Charter Schools)1 | | | 6.000 | | | | 12/01/2046 | | | | 6,602,973 | |
| 5,730,000 | | Pima County, AZ IDA (P.L.C. Charter Schools)1 | | | 7.500 | | | | 04/01/2041 | | | | 7,308,844 | |
| 1,025,000 | | Pima County, AZ IDA (Paideia Academies) | | | 6.000 | | | | 07/01/2035 | | | | 1,062,136 | |
| 3,310,000 | | Pima County, AZ IDA (Paideia Academies) | | | 6.125 | | | | 07/01/2045 | | | | 3,409,068 | |
| 635,000 | | Pinal County, AZ IDA (San Manuel Facility)1 | | | 6.250 | | | | 06/01/2026 | | | | 648,799 | |
| 1,022,000 | | Prescott Valley, AZ Southside Community Facilities District No. 1 | | | 7.250 | | | | 07/01/2032 | | | | 751,456 | |
| 265,000 | | Show Low Bluff, AZ Community Facilities District | | | 5.600 | | | | 07/01/2031 | | | | 250,780 | |
| 1,000,000 | | Tartesso West, AZ Community Facilities District1 | | | 5.900 | | | | 07/15/2032 | | | | 1,000,470 | |
| 695,000 | | Tempe, AZ IDA (Tempe Life Care Village)1 | | | 6.000 | | | | 12/01/2032 | | | | 738,104 | |
| 1,550,000 | | Tempe, AZ IDA (Tempe Life Care Village)1 | | | 6.250 | | | | 12/01/2042 | | | | 1,651,200 | |
| 675,000 | | Verrado, AZ Community Facilities District No. 11 | | | 5.700 | | | | 07/15/2029 | | | | 724,174 | |
| 1,800,000 | | Verrado, AZ Community Facilities District No. 11 | | | 6.000 | | | | 07/15/2027 | | | | 1,969,110 | |
| 610,000 | | Verrado, AZ Community Facilities District No. 11 | | | 6.000 | | | | 07/15/2033 | | | | 659,239 | |
| | | | | | | | | | | | | 72,513,316 | |
| | | | | | | | | | | | | | | |
| Arkansas—0.1% | | | | | | | | | | | | |
| 5,645,000 | | Cave Springs, AR Municipal Property (Creeks Special Sewer District)4 | | | 6.250 | | | | 02/01/2038 | | | | 3,355,896 | |
| | | | | | | | | | | | | | | |
| California—14.7% | | | | | | | | | | | | |
| 2,500,000 | | Adelanto, CA Public Utility Authority1 | | | 6.750 | | | | 07/01/2039 | | | | 2,693,700 | |
| 7,300,000 | | Alameda, CA Corridor Transportation Authority1 | | | 5.000 | | | | 10/01/2034 | | | | 8,548,373 | |
| 750,000 | | Alhambra, CA (Atherton Baptist Homes)1 | | | 7.625 | | | | 01/01/2040 | | | | 869,805 | |
| 250,000 | | Beaumont, CA Financing Authority, Series C1 | | | 5.000 | | | | 09/01/2022 | | | | 255,542 | |
| 190,000 | | Blythe, CA Redevel. Agency (Redevel. Project No. 1 Tax Allocation)1 | | | 6.200 | | | | 05/01/2031 | | | | 190,382 | |
|
| 21 OPPENHEIMER ROCHESTER HIGH YIELD MUNICIPAL FUND |
STATEMENT OF INVESTMENTS Continued
| | | | | | | | | | | | | | |
Principal
Amount | | | | Coupon | | | Maturity | | | Value | |
| California (Continued) | | | | | | | | | | | | |
| $5,500,000 | | Brea, CA Community Facilities District (Brea Plaza Area)1 | | | 7.375 | % | | | 09/01/2039 | | | $ | 5,803,325 | |
| 127,310,000 | | CA County Tobacco Securitization Agency | | | 5.307 | 5 | | | 06/01/2046 | | | | 17,077,363 | |
| 107,400,000 | | CA County Tobacco Securitization Agency | | | 5.502 | 5 | | | 06/01/2050 | | | | 5,966,070 | |
| 212,950,000 | | CA County Tobacco Securitization Agency | | | 6.341 | 5 | | | 06/01/2055 | | | | 7,391,494 | |
| 33,920,000 | | CA County Tobacco Securitization Agency | | | 6.647 | 5 | | | 06/01/2046 | | | | 3,948,288 | |
| 215,100,000 | | CA County Tobacco Securitization Agency | | | 6.998 | 5 | | | 06/01/2055 | | | | 9,849,429 | |
| 7,765,000 | | CA County Tobacco Securitization Agency | | | 8.145 | 5 | | | 06/01/2033 | | | | 3,071,135 | |
| 255,000 | | CA County Tobacco Securitization Agency (TASC)1 | | | 5.250 | | | | 06/01/2045 | | | | 253,909 | |
| 7,000,000 | | CA County Tobacco Securitization Agency (TASC) | | | 5.250 | | | | 06/01/2046 | | | | 6,909,350 | |
| 625,000 | | CA County Tobacco Securitization Agency (TASC)1 | | | 5.500 | | | | 06/01/2033 | | | | 627,325 | |
| 520,920,000 | | CA County Tobacco Securitization Agency (TASC) | | | 5.559 | 5 | | | 06/01/2050 | | | | 51,670,055 | |
| 18,500,000 | | CA County Tobacco Securitization Agency (TASC)1 | | | 5.650 | 2 | | | 06/01/2041 | | | | 18,607,485 | |
| 18,030,000 | | CA County Tobacco Securitization Agency (TASC)1 | | | 5.700 | 2 | | | 06/01/2046 | | | | 17,985,286 | |
| 2,775,000 | | CA County Tobacco Securitization Agency (TASC)1 | | | 5.875 | | | | 06/01/2035 | | | | 2,802,195 | |
| 7,285,000 | | CA County Tobacco Securitization Agency (TASC)1 | | | 5.875 | | | | 06/01/2043 | | | | 7,326,087 | |
| 4,670,000 | | CA County Tobacco Securitization Agency (TASC)1 | | | 6.000 | | | | 06/01/2042 | | | | 4,715,766 | |
| 5,000,000 | | CA County Tobacco Securitization Agency (TASC)1 | | | 6.125 | | | | 06/01/2038 | | | | 5,053,950 | |
| 9,125,000 | | CA Enterprise Devel. Authority (Sunpower Corp.) | | | 8.500 | | | | 04/01/2031 | | | | 10,015,052 | |
| 10,000,000 | | CA GO1 | | | 4.000 | | | | 09/01/2032 | | | | 10,927,000 | |
| 19,585,000 | | CA GO1 | | | 5.000 | | | | 08/01/2030 | | | | 23,924,253 | |
| 2,160,000 | | CA GO1 | | | 5.000 | | | | 09/01/2031 | | | | 2,601,202 | |
| 7,265,000 | | CA GO1 | | | 5.000 | | | | 09/01/2032 | | | | 8,640,337 | |
| 10,000,000 | | CA GO1 | | | 5.000 | | | | 08/01/2035 | | | | 11,848,800 | |
| 2,500,000 | | CA GO1 | | | 5.000 | | | | 04/01/2038 | | | | 2,566,625 | |
| 555,000 | | CA Golden State Tobacco Securitization Corp. (TASC)1 | | | 5.000 | | | | 06/01/2029 | | | | 654,906 | |
| 161,610,000 | | CA Golden State Tobacco Securitization Corp. (TASC)1 | | | 5.750 | | | | 06/01/2047 | | | | 161,610,000 | |
| 4,000,000 | | CA Health Facilities Financing Authority (SHlth/MPHS/ SBMF/SCHosp/SEBH/SBH/SGMF/SVlyH/SVMF/SVNA&H Obligated Group)1 | | | 5.000 | | | | 11/15/2048 | | | | 4,649,480 | |
| 30,420,000 | | CA Health Facilities Financing Authority (SJHS/SJHCN/ SJHE/SJHO Obligated Group)6 | | | 5.750 | | | | 07/01/2039 | | | | 33,010,263 | |
| 1,835,000 | | CA Independent Cities Finance Authority Mobile Home Park (Lamplighter Salinas)1 | | | 6.250 | | | | 07/15/2050 | | | | 1,994,847 | |
| 10,000,000 | | CA Infrastructure and Economic Devel. (Sanford Consortium)6 | | | 5.000 | | | | 05/15/2040 | | | | 11,110,600 | |
| 5,000,000 | | CA Municipal Finance Authority (CHCC/FCHMC Obligated Group)1 | | | 5.000 | | | | 02/01/2047 | | | | 5,614,500 | |
| 750,000 | | CA Municipal Finance Authority (Harbor Regional Center)1 | | | 8.500 | | | | 11/01/2039 | | | | 874,912 | |
| 1,430,000 | | CA Pollution Control Financing Authority (Calplant I) | | | 7.000 | | | | 07/01/2022 | | | | 1,472,871 | |
| 6,075,000 | | CA Pollution Control Financing Authority (Calplant I) | | | 7.500 | | | | 07/01/2032 | | | | 6,399,648 | |
| 8,100,000 | | CA Pollution Control Financing Authority (Calplant I) | | | 8.000 | | | | 07/01/2039 | | | | 8,882,865 | |
| 60,000 | | CA Public Works1 | | | 6.625 | | | | 11/01/2034 | | | | 60,166 | |
| 5,945,000 | | CA School Finance Authority Charter School (Grimmway Schools)1 | | | 5.250 | | | | 07/01/2051 | | | | 6,027,160 | |
| 385,000 | | CA School Finance Authority Charter School (Kepler Neighborhood School) | | | 5.000 | | | | 05/01/2027 | | | | 391,811 | |
|
| 22 OPPENHEIMER ROCHESTER HIGH YIELD MUNICIPAL FUND |
| | | | | | | | | | | | | | |
Principal Amount | | | | Coupon | | | Maturity | | | Value | |
| California (Continued) | | | | | | | | | | | | |
| $900,000 | | CA School Finance Authority Charter School (Kepler Neighborhood School) | | | 5.750 | % | | | 05/01/2037 | | | $ | 908,604 | |
| 1,230,000 | | CA School Finance Authority Charter School (Kepler Neighborhood School) | | | 5.875 | | | | 05/01/2047 | | | | 1,239,213 | |
| 850,000 | | CA School Finance Authority Charter School (RE/REW/ RLSA/RDP/RRCP/RSCP/RNNE/RMS/RSSPA/RBM/RSA Obligated Group) | | | 5.125 | | | | 06/01/2047 | | | | 867,926 | |
| 900,000 | | CA School Finance Authority Charter School (RE/REW/ RLSA/RDP/RRCP/RSCP/RNNE/RMS/RSSPA/RBM/RSA Obligated Group) | | | 5.250 | | | | 06/01/2052 | | | | 918,423 | |
| 4,330,000 | | CA School Finance Authority School Facility (Escuela Popular Del Pueblo) | | | 6.500 | | | | 07/01/2050 | | | | 4,357,972 | |
| 160,600,000 | | CA Silicon Valley Tobacco Securitization Authority | | | 8.146 | 5 | | | 06/01/2056 | | | | 9,118,868 | |
| 20,800,000 | | CA Silicon Valley Tobacco Securitization Authority | | | 8.692 | 5 | | | 06/01/2041 | | | | 4,910,048 | |
| 58,990,000 | | CA Silicon Valley Tobacco Securitization Authority | | | 8.898 | 5 | | | 06/01/2047 | | | | 8,624,338 | |
| 60,785,000 | | CA Silicon Valley Tobacco Securitization Authority | | | 8.995 | 5 | | | 06/01/2036 | | | | 20,860,804 | |
| 13,505,000 | | CA Silicon Valley Tobacco Securitization Authority | | | 8.998 | 5 | | | 06/01/2047 | | | | 1,643,964 | |
| 25,920,000 | | CA State University6 | | | 5.000 | | | | 11/01/2047 | | | | 30,549,053 | |
| 1,145,000 | | CA Statewide CDA (Albert Einstein Academy) | | | 6.000 | | | | 11/01/2032 | | | | 804,443 | |
| 1,730,000 | | CA Statewide CDA (Albert Einstein Academy) | | | 6.250 | | | | 11/01/2042 | | | | 1,216,086 | |
| 10,000 | | CA Statewide CDA (Escrow Term)1 | | | 6.750 | | | | 09/01/2037 | | | | 10,025 | |
| 4,020,000 | | CA Statewide CDA (Guidance Charter School) | | | 6.500 | | | | 07/01/2037 | | | | 4,162,268 | |
| 14,690,000 | | CA Statewide CDA (Guidance Charter School) | | | 6.750 | | | | 07/01/2052 | | | | 15,192,839 | |
| 2,019,578 | | CA Statewide CDA (Microgy Holdings)3 | | | 9.000 | | | | 12/01/2038 | | | | 20 | |
| 8,015,000 | | CA Statewide CDA (Yucaipa Valley Water Reservoir) | | | 6.000 | | | | 09/02/2044 | | | | 7,867,284 | |
| 4,515,000 | | CA Statewide Financing Authority Tobacco Settlement (TASC)1 | | | 6.000 | | | | 05/01/2037 | | | | 4,547,960 | |
| 1,120,000 | | CA Statewide Financing Authority Tobacco Settlement (TASC)1 | | | 6.000 | | | | 05/01/2043 | | | | 1,123,203 | |
| 100,000 | | CA Statewide Financing Authority Tobacco Settlement (TASC)1 | | | 6.000 | | | | 05/01/2043 | | | | 100,730 | |
| 2,500,000 | | Calexico, CA Community Redevel. Agency Tax Allocation (Central Business District & Residential Redevel.)1 | | | 7.250 | | | | 08/01/2033 | | | | 2,992,300 | |
| 1,440,000 | | Coyote Canyon, CA Public Facilities Community Facilities District No. 2004-11 | | | 6.625 | | | | 09/01/2039 | | | | 1,608,480 | |
| 1,215,000 | | Desert Hot Springs, CA Redevel. Agency Tax Allocation1 | | | 5.000 | | | | 09/01/2030 | | | | 1,435,680 | |
| 7,780,000 | | Fresno, CA Unified School District | | | 4.319 | 5 | | | 08/01/2042 | | | | 2,762,522 | |
| 5,000,000 | | Irvine, CA Unified School District1 | | | 5.000 | | | | 03/01/2057 | | | | 5,555,450 | |
| 1,205,000 | | Lathrop, CA Special Tax Community Facilities District No. 03-21,7 | | | 7.000 | | | | 09/01/2033 | | | | 1,207,229 | |
| 4,000,000 | | Long Beach, CA Harbor Revenue1 | | | 5.000 | | | | 05/15/2043 | | | | 4,637,280 | |
| 10,000,000 | | Long Beach, CA Harbor Revenue1 | | | 5.000 | | | | 05/15/2047 | | | | 11,764,100 | |
| 1,625,000 | | Los Angeles, CA Community Facilities District Special Tax (Legends at Cascades)1 | | | 5.750 | | | | 09/01/2040 | | | | 1,676,545 | |
| 1,500,000 | | Los Angeles, CA Dept. of Airports (Los Angeles International Airport)1 | | | 5.000 | | | | 05/15/2033 | | | | 1,745,310 | |
| 31,940,000 | | Los Angeles, CA Dept. of Airports (Los Angeles International Airport)6 | | | 5.375 | | | | 05/15/2030 | | | | 32,938,125 | |
|
| 23 OPPENHEIMER ROCHESTER HIGH YIELD MUNICIPAL FUND |
STATEMENT OF INVESTMENTS Continued
| | | | | | | | | | | | | | |
Principal Amount | | | | Coupon | | | Maturity | | | Value | |
| California (Continued) | | | | | | | | | | | | |
| $2,075,000 | | Los Angeles, CA Dept. of Water & Power1 | | | 5.000 | % | | | 07/01/2033 | | | $ | 2,462,174 | |
| 5,000,000 | | Los Angeles, CA Dept. of Water & Power6 | | | 5.000 | | | | 07/01/2034 | | | | 5,275,500 | |
| 21,000,000 | | Los Angeles, CA Dept. of Water & Power6 | | | 5.000 | | | | 07/01/2035 | | | | 25,136,790 | |
| 8,390,000 | | Los Angeles, CA Regional Airports Improvement Corp. (Delta-Continental Airlines)1,7 | | | 9.250 | | | | 08/01/2024 | | | | 8,442,018 | |
| 200,000 | | Maywood, CA Public Financing Authority1 | | | 7.000 | | | | 09/01/2038 | | | | 200,264 | |
| 10,000,000 | | Northern CA Tobacco Securitization Authority (TASC)1 | | | 5.375 | | | | 06/01/2038 | | | | 9,880,700 | |
| 115,975,000 | | Northern CA Tobacco Securitization Authority (TASC) | | | 6.372 | 5 | | | 06/01/2045 | | | | 12,654,032 | |
| 45,000 | | Placer County, CA Improvement Bond Act 19151 | | | 6.500 | | | | 09/02/2030 | | | | 45,063 | |
| 21,711,000 | | River Rock, CA Entertainment Authority4 | | | 8.000 | | | | 11/01/2018 | | | | 4,183,275 | |
| 1,750,000 | | Riverside County, CA Redevel. Agency1 | | | 7.125 | | | | 10/01/2042 | | | | 2,124,955 | |
| 3,805,000 | | Sacramento County, CA Airport System1 | | | 5.250 | | | | 07/01/2033 | | | | 3,944,149 | |
| 100,000 | | Sacramento County, CA Special Tax Community Facilities District No. 2004-1 (McClellan Park) | | | 6.000 | | | | 09/01/2031 | | | | 100,108 | |
| 2,000,000 | | San Buenaventura, CA Community Memorial Health Systems1 | | | 8.000 | | | | 12/01/2031 | | | | 2,412,420 | |
| 16,245,000 | | San Francisco, CA City & County Airports Commission (SFO Fuel Company)1 | | | 5.750 | | | | 05/01/2020 | | | | 16,845,740 | |
| 10,000,000 | | San Francisco, CA City & County Public Utilities Commission1 | | | 4.000 | | | | 11/01/2036 | | | | 10,747,800 | |
| 750,000 | | San Francisco, CA City & County Redevel. Financing Authority (Mission Bay North Redevel.)1 | | | 6.750 | | | | 08/01/2041 | | | | 897,525 | |
| 1,000,000 | | San Francisco, CA City & County Redevel. Financing Authority (Mission Bay North Redevel.)1 | | | 7.000 | | | | 08/01/2041 | | | | 1,204,890 | |
| 6,000,000 | | Santa Clara, CA Redevel. Agency Tax Allocation (Bayshore North)1 | | | 5.750 | | | | 06/01/2026 | | | | 7,050,540 | |
| 195,570,000 | | Southern CA Tobacco Securitization Authority | | | 6.381 | 5 | | | 06/01/2046 | | | | 26,306,121 | |
| 12,115,000 | | Stockton, CA Unified School District | | | 5.918 | 5 | | | 08/01/2038 | | | | 5,461,200 | |
| 14,735,000 | | Stockton, CA Unified School District | | | 5.948 | 5 | | | 08/01/2041 | | | | 5,743,114 | |
| 17,145,000 | | Stockton, CA Unified School District | | | 5.948 | 5 | | | 08/01/2043 | | | | 6,118,022 | |
| 6,245,000 | | Stockton, CA Unified School District | | | 5.997 | 5 | | | 08/01/2037 | | | | 2,935,337 | |
| 1,335,000 | | Susanville, CA Public Financing Authority (Utility Enterprises)1 | | | 5.875 | | | | 06/01/2035 | | | | 1,407,571 | |
| 1,425,000 | | Susanville, CA Public Financing Authority (Utility Enterprises)1 | | | 6.000 | | | | 06/01/2045 | | | | 1,509,246 | |
| 7,000,000 | | University of California1 | | | 5.000 | | | | 05/15/2037 | | | | 8,413,230 | |
| 3,500,000 | | West Hollywood, CA Community Devel. Commission Tax Allocation (East Side Redevel.)1 | | | 7.500 | | | | 09/01/2042 | | | | 4,283,475 | |
| | | | | | | | | | | | | 858,025,963 | |
| | | | | | | | | | | | | | | |
| Colorado—3.4% | | | | | | | | | | | | |
| 3,100,000 | | Base Village, CO Metropolitan District No. 21 | | | 5.750 | | | | 12/01/2046 | | | | 3,193,093 | |
| 500,000 | | Blue Lake, CO Metropolitan District No. 2 | | | 8.000 | | | | 12/15/2046 | | | | 509,525 | |
| 1,185,000 | | Brennan, CO Metropolitan District | | | 5.250 | | | | 12/01/2046 | | | | 1,132,884 | |
| 4,500,000 | | CO Canyons Metropolitan District No. 5 | | | 6.125 | | | | 12/01/2047 | | | | 4,541,895 | |
| 2,000,000 | | CO Canyons Metropolitan District No. 6 | | | 6.125 | | | | 12/01/2047 | | | | 2,009,500 | |
| 1,025,000 | | CO Country Club Highlands Metropolitan District4 | | | 7.250 | | | | 12/01/2037 | | | | 417,759 | |
| 2,600,000 | | CO Elbert and Highway 86 Metropolitan District1 | | | 5.750 | | | | 12/01/2046 | | | | 2,701,920 | |
| 4,475,000 | | CO Elbert and Highway 86 Metropolitan District4 | | | 7.500 | | | | 12/01/2032 | | | | 2,235,486 | |
|
| 24 OPPENHEIMER ROCHESTER HIGH YIELD MUNICIPAL FUND |
| | | | | | | | | | | | | | |
Principal
Amount | | | | Coupon | | | Maturity | | | Value | |
| Colorado (Continued) | | | | | | | | | | | | |
| $2,176,000 | | CO Elkhorn Ranch Metropolitan District4 | | | 6.375 | % | | | 12/01/2035 | | | $ | 1,416,076 | |
| 1,780,000 | | CO Fossil Ridge Metropolitan District No. 11 | | | 7.250 | | | | 12/01/2040 | | | | 1,903,888 | |
| 14,350,000 | | CO Health Facilities Authority (Sisters of Charity of Leavenworth Health System)6 | | | 5.000 | | | | 01/01/2044 | | | | 15,933,953 | |
| 1,030,000 | | CO Health Facilities Authority Health & Residential Care Facilities (Volunteers of America) | | | 5.300 | | | | 07/01/2037 | | | | 1,029,918 | |
| 1,945,000 | | CO Midcities Metropolitan District No. 2 | | | 7.750 | | | | 12/15/2046 | | | | 1,846,175 | |
| 2,275,000 | | CO Neu Towne Metropolitan District4 | | | 7.250 | | | | 12/01/2034 | | | | 603,580 | |
| 680,000 | | CO North Range Metropolitan District No. 21 | | | 5.500 | | | | 12/15/2018 | | | | 691,662 | |
| 1,000,000 | | CO North Range Metropolitan District No. 21 | | | 5.500 | | | | 12/15/2037 | | | | 1,017,150 | |
| 12,585,000 | | CO Park Valley Water and Sanitation Metropolitan District | | | 5.993 | 5 | | | 12/15/2017 | | | | 3,020,022 | |
| 1,590,000 | | CO Potomac Farms Metropolitan District | | | 7.250 | | | | 12/01/2037 | | | | 1,029,509 | |
| 248,000 | | CO Potomac Farms Metropolitan District | | | 7.625 | 2 | | | 12/01/2023 | | | | 166,587 | |
| 855,000 | | CO Prairie Center Metropolitan District No. 31 | | | 5.400 | | | | 12/15/2031 | | | | 857,086 | |
| 500,000 | | CO Silver Peaks Metropolitan District | | | 5.750 | | | | 12/01/2036 | | | | 334,015 | |
| 1,720,000 | | CO Sorrell Ranch Metropolitan District3 | | | 6.750 | | | | 12/15/2036 | | | | 594,002 | |
| 2,500,000 | | CO STC Metropolitan District No. 2 | | | 6.000 | | | | 12/01/2038 | | | | 2,508,575 | |
| 1,213,000 | | CO Stoneridge Metropolitan District1 | | | 5.625 | | | | 12/01/2036 | | | | 1,232,008 | |
| 1,615,000 | | CO Table Mountain Metropolitan District1 | | | 5.250 | | | | 12/01/2045 | | | | 1,658,363 | |
| 569,000 | | CO Table Mountain Metropolitan District | | | 7.750 | | | | 12/15/2045 | | | | 570,548 | |
| 8,000,000 | | CO Talon Pointe Metropolitan District3 | | | 8.000 | | | | 12/01/2039 | | | | 799,840 | |
| 3,415,000 | | Cundall Farms, CO Metropolitan District | | | 6.875 | | | | 12/01/2044 | | | | 3,425,962 | |
| 785,000 | | Cundall Farms, CO Metropolitan District | | | 7.750 | | | | 12/15/2044 | | | | 748,458 | |
| 19,515,000 | | Denver, CO City & County Airport1 | | | 5.000 | | | | 11/15/2030 | | | | 19,730,055 | |
| 35,375,000 | | Denver, CO City & County Airport Special Facilities (United Air Lines)1 | | | 5.250 | | | | 10/01/2032 | | | | 35,558,596 | |
| 26,350,000 | | Denver, CO City & County Airport Special Facilities (United Air Lines)1 | | | 5.750 | | | | 10/01/2032 | | | | 26,508,363 | |
| 10,000,000 | | Denver, CO City & County Board of Water Commissioners1 | | | 5.000 | | | | 09/15/2047 | | | | 11,932,000 | |
| 2,000,000 | | Erie Farm, CO Metropolitan District | | | 5.500 | | | | 12/01/2045 | | | | 1,980,840 | |
| 600,000 | | Erie Farm, CO Metropolitan District | | | 7.750 | | | | 12/15/2045 | | | | 589,314 | |
| 2,065,000 | | Hawthorn, CO Metropolitan District No. 21 | | | 6.375 | | | | 12/01/2044 | | | | 2,071,753 | |
| 950,000 | | Hawthorn, CO Metropolitan District No. 2 | | | 7.750 | | | | 12/15/2044 | | | | 944,252 | |
| 1,960,000 | | Highlands, CO Metropolitan District No. 3 | | | 5.125 | | | | 12/01/2046 | | | | 1,879,562 | |
| 775,000 | | Iliff Commons, CO Metropolitan District No. 3 | | | 6.000 | | | | 12/01/2046 | | | | 793,367 | |
| 1,626,000 | | Lewis Pointe, CO Metropolitan District | | | 7.750 | | | | 12/15/2047 | | | | 1,644,732 | |
| 1,635,000 | | Leyden Ranch, CO Metropolitan District1 | | | 5.125 | | | | 12/01/2047 | | | | 1,662,615 | |
| 500,000 | | Leyden Ranch, CO Metropolitan District | | | 7.000 | | | | 12/15/2047 | | | | 507,535 | |
| 1,195,000 | | Leyden Rock, CO Metropolitan District No. 10 | | | 7.250 | | | | 12/15/2045 | | | | 1,121,006 | |
| 1,225,000 | | Liberty Ranch, CO Metropolitan District1 | | | 5.000 | | | | 12/01/2046 | | | | 1,257,438 | |
| 1,410,000 | | Marvella, CO Metropolitan District | | | 5.125 | | | | 12/01/2046 | | | | 1,356,335 | |
| 1,000,000 | | Mountain Shadows, CO Metropolitan District1 | | | 5.000 | | | | 12/01/2046 | | | | 994,140 | |
| 2,595,000 | | Prairiestar, CO Metropolitan District No. 2 | | | 5.750 | | | | 12/01/2046 | | | | 2,415,374 | |
| 3,945,000 | | Reserve, CO Metropolitan District No. 21 | | | 5.000 | | | | 12/01/2045 | | | | 3,654,648 | |
| 665,000 | | Reserve, CO Metropolitan District No. 21 | | | 5.125 | | | | 12/01/2045 | | | | 616,694 | |
| 1,035,000 | | Southglenn, CO Metropolitan District1 | | | 5.000 | | | | 12/01/2030 | | | | 1,082,082 | |
| 810,000 | | Southglenn, CO Metropolitan District1 | | | 5.000 | | | | 12/01/2036 | | | | 829,416 | |
|
| 25 OPPENHEIMER ROCHESTER HIGH YIELD MUNICIPAL FUND |
STATEMENT OF INVESTMENTS Continued
| | | | | | | | | | | | | | | | |
| Principal
Amount |
| | | | | Coupon | | | | Maturity | | | | Value | |
| | Colorado (Continued) | | | | | | | | | | | | |
| | $725,000 | | | Tabernash Meadows, CO Water & Sanitation District1 | | | 7.125% | | | | 12/01/2034 | | | $ | 770,189 | |
| | 295,000 | | | Tallyns Reach CO Metropolitan District No. 31 | | | 5.000 | | | | 12/01/2033 | | | | 308,523 | |
| | 685,000 | | | Tallyns Reach CO Metropolitan District No. 31 | | | 5.125 | | | | 11/01/2038 | | | | 717,202 | |
| | 1,220,000 | | | Tallyns Reach, CO Metropolitan District No. 3 | | | 6.750 | | | | 11/01/2038 | | | | 1,223,880 | |
| | 750,000 | | | Thompsong Crossing, CO Metropolitan District No. 61 | | | 6.000 | | | | 12/01/2044 | | | | 753,690 | |
| | 1,645,000 | | | Villas Eastlake Reservoir, CO Metropolitan District1 | | | 6.500 | | | | 12/01/2046 | | | | 1,744,029 | |
| | 20,183,519 | | | Woodmen Heights, CO Metropolitan District No. 1 | | | 0.000 2 | | | | 12/15/2041 | | | | 10,151,301 | |
| | 5,342,763 | | | Woodmen Heights, CO Metropolitan District No. 11 | | | 6.000 | | | | 12/01/2041 | | | | 5,400,999 | |
| | 1,245,000 | | | York Street, CO Metropolitan District | | | 6.250 | | | | 12/01/2047 | | | | 1,270,659 | |
| | | | | | | | | | | | | | | | |
| | | | | | | | | | | | | | | 199,600,028 | |
| | | | | | | | | | | | | | | | | |
| | Connecticut—0.9% | | | | | | | | | | | | |
| | 12,500,000 | | | CT GO1 | | | 4.000 | | | | 08/15/2030 | | | | 13,189,125 | |
| | 5,295,000 | | | CT GO1 | | | 4.000 | | | | 08/15/2031 | | | | 5,552,496 | |
| | 5,000,000 | | | CT Special Tax1 | | | 5.000 | | | | 09/01/2028 | | | | 5,897,900 | |
| | 6,000,000 | | | CT Special Tax1 | | | 5.000 | | | | 08/01/2032 | | | | 6,799,980 | |
| | 7,965,000 | | | CT Special Tax1 | | | 5.000 | | | | 08/01/2033 | | | | 8,984,838 | |
| | 8,125,000 | | | CT Special Tax (Transportation Infrastructure)1 | | | 5.000 | | | | 09/01/2030 | | | | 9,425,975 | |
| | 470,000 | | | Georgetown, CT Special Taxing District3 | | | 5.125 | | | | 10/01/2036 | | | | 140,995 | |
| | 1,580,000 | | | Hartford, CT GO1 | | | 5.000 | | | | 10/01/2033 | | | | 1,707,680 | |
| | 11,841,815 | | | Mashantucket Western Pequot Tribe CT8 | | | 6.050 | | | | 07/01/2031 | | | | 454,726 | |
| | | | | | | | | | | | | | | | |
| | | | | | | | | | | | | | | 52,153,715 | |
| | | | | | | | | | | | | | | | | |
| | Delaware—0.1% | | | | | | | | | | | | |
| | 1,226,000 | | | Bridgeville, DE Special Obligation (Heritage Shores)1 | | | 5.450 | | | | 07/01/2035 | | | | 1,226,429 | |
| | 7,201,000 | | | Millsboro, DE Special Obligation (Plantation Lakes) | | | 5.450 | | | | 07/01/2036 | | | | 6,315,997 | |
| | | | | | | | | | | | | | | | |
| | | | | | | | | | | | | | | 7,542,426 | |
| | | | | | | | | | | | | | | | | |
| | District of Columbia—2.6% | | | | | | | | | | | | |
| | 4,745,000 | | | District of Columbia (Howard University)1 | | | 6.250 | | | | 10/01/2032 | | | | 5,621,686 | |
| | 5,255,000 | | | District of Columbia (Howard University)1 | | | 6.250 | | | | 10/01/2032 | | | | 5,606,139 | |
| | 21,795,000 | | | District of Columbia (Howard University)1 | | | 6.500 | | | | 10/01/2041 | | | | 23,190,970 | |
| | 315,000 | | | District of Columbia (Howard University)1 | | | 6.500 | | | | 10/01/2041 | | | | 376,025 | |
| | 3,200,000 | | | District of Columbia Center for Strategic & International Studies1 | | | 6.375 | | | | 03/01/2031 | | | | 3,472,928 | |
| | 2,000,000 | | | District of Columbia Center for Strategic & International Studies1 | | | 6.625 | | | | 03/01/2041 | | | | 2,183,680 | |
| | 32,680,000 | | | District of Columbia Tobacco Settlement Financing Corp.1 | | | 6.750 | | | | 05/15/2040 | | | | 35,289,825 | |
| | 1,375,680,000 | | | District of Columbia Tobacco Settlement Financing Corp. (TASC) | | | 5.909 5 | | | | 06/15/2055 | | | | 46,277,875 | |
| | 1,055,000,000 | | | District of Columbia Tobacco Settlement Financing Corp. (TASC) | | | 6.211 5 | | | | 06/15/2055 | | | | 31,998,150 | |
| | | | | | | | | | | | | | | | |
| | | | | | | | | | | | | | | 154,017,278 | |
| | | | | | | | | | | | | | | | | |
| | Florida—9.1% | | | | | | | | | | | | |
| | 750,000 | | | Alachua County, FL Health Facilities Authority (Oak Hammock University Florida)1 | | | 8.000 | | | | 10/01/2032 | | | | 893,947 | |
|
| 26 OPPENHEIMER ROCHESTER HIGH YIELD MUNICIPAL FUND |
| | | | | | | | | | | | | | | | |
| Principal
Amount |
| | | | | Coupon | | | | Maturity | | | | Value | |
| | Florida (Continued) | | | | | | | | | | | | |
| | $1,000,000 | | | Alachua County, FL Health Facilities Authority (Oak Hammock University Florida)1 | | | 8.000% | | | | 10/01/2042 | | | $ | 1,189,870 | |
| | 1,000,000 | | | Alachua County, FL Health Facilities Authority (Oak Hammock University Florida)1 | | | 8.000 | | | | 10/01/2046 | | | | 1,187,810 | |
| | 4,655,000 | | | Amelia Concourse, FL Community Devel. District3 | | | 5.750 | | | | 05/01/2038 | | | | 3,956,890 | |
| | 3,385,000 | | | Amelia Concourse, FL Community Devel. District | | | 6.000 | | | | 05/01/2047 | | | | 3,249,769 | |
| | 6,040,000 | | | Arlington Ridge, FL Community Devel. District1 | | | 5.500 | | | | 05/01/2036 | | | | 5,457,382 | |
| | 1,045,000 | | | Avignon Villages, FL Community Devel. District3 | | | 5.300 | | | | 05/01/2014 | | | | 135,934 | |
| | 755,000 | | | Avignon Villages, FL Community Devel. District3 | | | 5.400 | | | | 05/01/2037 | | | | 98,210 | |
| | 15,269,400 | | | Baker, FL Correctional Devel. Corp. (Baker County Detention Center) | | | 8.000 | | | | 02/01/2030 | | | | 12,213,993 | |
| | 225,000 | | | Bayshore, FL Hsg. Corp.3 | | | 8.000 | | | | 12/01/2016 | | | | 101,243 | |
| | 7,420,000 | | | Baywinds, FL Community Devel. District1 | | | 5.250 | | | | 05/01/2037 | | | | 7,444,486 | |
| | 1,125,000 | | | Baywinds, FL Community Devel. District1,7 | | | 7.020 | | | | 05/01/2022 | | | | 1,124,685 | |
| | 7,555,000 | | | Belle Isle, FL Charter School (Cornerstone Charter Academy & Cornerstone Charter High School Obligated Group)1 | | | 6.000 | | | | 10/01/2042 | | | | 8,242,505 | |
| | 725,000 | | | Boynton Village, FL Community Devel. District Special Assessment | | | 6.000 | | | | 05/01/2038 | | | | 725,116 | |
| | 170,000 | | | Broward County, FL HFA (Single Family)1 | | | 5.000 | | | | 10/01/2039 | | | | 170,139 | |
| | 5,845,000 | | | Buckeye Park, FL Community Devel. District3 | | | 7.875 | | | | 05/01/2038 | | | | 1,749,408 | |
| | 885,000 | | | Carlton Lakes, FL Community Devel. District Special Assessment7 | | | 5.625 | | | | 11/01/2036 | | | | 919,506 | |
| | 2,160,000 | | | Carlton Lakes, FL Community Devel. District Special Assessment7 | | | 5.750 | | | | 11/01/2047 | | | | 2,239,747 | |
| | 5,000,000 | | | Central FL Expressway Authority1 | | | 4.000 | | | | 07/01/2036 | | | | 5,282,200 | |
| | 25,360,000 | | | CFM, FL Community Devel. District, Series A3 | | | 6.250 | | | | 05/01/2035 | | | | 10,773,435 | |
| | 8,115,000 | | | Chapel Creek, FL Community Devel. District Special Assessment3 | | | 5.500 | | | | 05/01/2038 | | | | 4,827,614 | |
| | 13,074,058 | | | Clearwater Cay, FL Community Devel. District3 | | | 5.500 | | | | 05/01/2037 | | | | 7,582,300 | |
| | 1,690,000 | | | Creekside, FL Community Devel. District3 | | | 5.200 | | | | 05/01/2038 | | | | 675,256 | |
| | 20,000 | | | Crosscreek, FL Community Devel. District3 | | | 5.500 | | | | 05/01/2017 | | | | 9,995 | |
| | 985,000 | | | Crosscreek, FL Community Devel. District7 | | | 5.600 | | | | 05/01/2037 | | | | 1,001,932 | |
| | 35,000 | | | Crosscreek, FL Community Devel. District4 | | | 5.600 | | | | 05/01/2039 | | | | 17,491 | |
| | 2,110,000 | | | Crosscreek, FL Community Devel. District7 | | | 6.750 | | | | 11/30/2021 | | | | 2,135,721 | |
| | 55,000 | | | Dade County, FL HFA (Golden Lakes Apartments)1 | | | 6.050 | | | | 11/01/2039 | | | | 55,062 | |
| | 10,000 | | | Dade County, FL HFA (Siesta Pointe Apartments) | | | 5.650 | | | | 09/01/2017 | | | | 10,031 | |
| | 900,000 | | | Dade County, FL IDA (Miami Cerebral Palsy Residence)1 | | | 8.000 | | | | 06/01/2022 | | | | 900,144 | |
| | 1,940,000 | | | Durbin Crossing, FL Community Devel. District Special Assessment4 | | | 5.250 | | | | 11/01/2020 | | | | 775,961 | |
| | 6,718,000 | | | FL Capital Trust Agency (Atlantic Hsg. Foundation) | | | 7.000 | | | | 07/15/2032 | | | | 5,038,298 | |
| | 12,500,000 | | | FL Capital Trust Agency (Atlantic Hsg. Foundation) | | | 8.260 | | | | 07/15/2038 | | | | 9,374,625 | |
| | 6,045,000 | | | FL Devel. Finance Corp. (Florida Charter Educational Foundation) | | | 5.000 | | | | 07/15/2046 | | | | 5,788,813 | |
| | 90,000 | | | FL HFA (Stoddert Arms Apartments)1 | | | 6.250 | | | | 09/01/2026 | | | | 90,121 | |
| | 2,635,170 | | | FL Lake Ashton II Community Devel. District1 | | | 5.375 | | | | 05/01/2036 | | | | 2,551,793 | |
| | 3,334,862 | | | Glades, FL Correctional Devel. Corp. | | | 0.000 2 | | | | 03/01/2030 | | | | 69,699 | |
| | 6,240,678 | | | Glades, FL Correctional Devel. Corp. | | | 7.000 | | | | 03/01/2030 | | | | 5,760,021 | |
|
| 27 OPPENHEIMER ROCHESTER HIGH YIELD MUNICIPAL FUND |
STATEMENT OF INVESTMENTS Continued
| | | | | | | | | | | | | | | | |
| Principal
Amount |
| | | | | Coupon | | | | Maturity | | | | Value | |
| | Florida (Continued) | | | | | | | | | | | | |
| | $2,895,000 | | | Greater Lakes/Sawgrass Bay, FL Community Devel. District1 | | | 5.500% | | | | 05/01/2038 | | | $ | 2,895,145 | |
| | 1,665,000 | | | Harbor Bay, FL Community Devel. District1 | | | 6.750 | | | | 05/01/2034 | | | | 1,666,931 | |
| | 345,000 | | | Highland Meadows, FL Community Devel. District Special Assessment, Series A1 | | | 5.500 | | | | 05/01/2036 | | | | 345,062 | |
| | 5,480,000 | | | Indigo, FL Community Devel. District4 | | | 5.750 | | | | 05/01/2036 | | | | 3,339,512 | |
| | 7,650,000 | | | Lakewood Ranch, FL Stewardship District1 | | | 5.500 | | | | 05/01/2036 | | | | 7,679,223 | |
| | 17,805,000 | | | Lakewood Ranch, FL Stewardship District (Country Club East Investors)1 | | | 5.400 | | | | 05/01/2037 | | | | 17,805,178 | |
| | 3,700,000 | | | Legends Bay, FL Community Devel. District | | | 5.875 | | | | 05/01/2038 | | | | 3,700,185 | |
| | 100,000 | | | Leon County, FL Educational Facilities Authority (Southgate Residence Hall)1 | | | 6.750 | | | | 09/01/2028 | | | | 100,065 | |
| | 1,275,000 | | | Liberty County, FL Revenue (Twin Oaks)3 | | | 8.250 | | | | 07/01/2028 | | | | 113,590 | |
| | 1,180,000 | | | Madison County, FL Mtg. (Twin Oaks) | | | 6.000 | | | | 07/01/2025 | | | | 944,000 | |
| | 5,000,000 | | | Magnolia Creek, FL Community Devel. District3 | | | 5.600 | | | | 05/01/2014 | | | | 1,048,000 | |
| | 5,360,000 | | | Magnolia Creek, FL Community Devel. District3 | | | 5.900 | | | | 05/01/2039 | | | | 1,123,456 | |
| | 2,805,000 | | | Magnolia West, FL Community Devel. District Special Assessment4 | | | 5.350 | | | | 05/01/2037 | | | | 1,402,472 | |
| | 1,400,000 | | | Main Street, FL Community Devel. District1 | | | 6.800 | | | | 05/01/2038 | | | | 1,402,842 | |
| | 1,140,000 | | | Main Street, FL Community Devel. District1 | | | 6.800 | | | | 05/01/2038 | | | | 1,190,171 | |
| | 1,715,000 | | | Miami, FL World Center Community Devel. District1 | | | 5.125 | | | | 11/01/2039 | | | | 1,794,233 | |
| | 2,570,000 | | | Miami, FL World Center Community Devel. District1 | | | 5.250 | | | | 11/01/2049 | | | | 2,685,856 | |
| | 4,000,000 | | | Miami-Dade County, FL School Board1 | | | 5.000 | | | | 05/01/2031 | | | | 4,634,760 | |
| | 5,455,000 | | | Miami-Dade County, FL School Board1 | | | 5.000 | | | | 05/01/2032 | | | | 6,238,665 | |
| | 10,000,000 | | | Miami-Dade County, FL School Board COP6 | | | 5.000 | | | | 02/01/2027 | | | | 10,604,600 | |
| | 10,000,000 | | | Miami-Dade County, FL School Board COP6 | | | 5.250 | | | | 02/01/2027 | | | | 10,641,700 | |
| | 50,000,000 | | | Miami-Dade County, FL School Board COP6 | | | 5.375 | | | | 02/01/2034 | | | | 53,301,500 | |
| | 12,430,000 | | | Montecito, FL Community Devel. District3 | | | 5.100 | | | | 05/01/2013 | | | | 9,318,522 | |
| | 5,405,000 | | | Montecito, FL Community Devel. District4 | | | 5.500 | | | | 05/01/2037 | | | | 4,052,020 | |
| | 550,000 | | | Moody River, FL Estates Community Devel. District1 | | | 5.350 | | | | 05/01/2036 | | | | 550,061 | |
| | 9,960,000 | | | Nassau County, FL (Nassau Care Centers) | | | 6.900 | | | | 01/01/2038 | | | | 10,109,699 | |
| | 3,640,000 | | | Naturewalk, FL Community Devel. District3 | | | 5.300 | | | | 05/01/2016 | | | | 2,000,289 | |
| | 4,345,000 | | | Naturewalk, FL Community Devel. District4 | | | 5.500 | | | | 05/01/2038 | | | | 2,387,708 | |
| | 2,015,000 | | | Orange County, FL Tourist Devel. Tax Revenue1 | | | 4.000 | | | | 10/01/2032 | | | | 2,174,548 | |
| | 3,750,000 | | | Palm Bay, FL Educational Facilities (Patriot Charter School)3 | | | 7.000 | | | | 07/01/2036 | | | | 1,727,363 | |
| | 3,000,000 | | | Palm Beach County, FL Health Facilities Authority (Sinai Residences Boca Raton)1 | | | 7.500 | | | | 06/01/2049 | | | | 3,573,960 | |
| | 11,950,000 | | | Palm Coast Park, FL Community Devel. District Special Assessment | | | 5.700 | | | | 05/01/2037 | | | | 11,846,752 | |
| | 5,900,000 | | | Palm Glades, FL Community Devel. District Special Assessment1 | | | 7.125 | | | | 05/01/2039 | | | | 5,935,754 | |
| | 1,850,000 | | | Palm River, FL Community Devel. District3 | | | 5.150 | | | | 05/01/2013 | | | | 728,142 | |
| | 1,565,000 | | | Palm River, FL Community Devel. District3 | | | 5.375 | | | | 05/01/2036 | | | | 616,923 | |
| | 1,455,000 | | | Parkway Center, FL Community Devel. District, Series A1 | | | 6.300 | | | | 05/01/2034 | | | | 1,457,561 | |
| | 5,430,000 | | | Pine Ridge Plantation, FL Community Devel. District | | | 5.400 | | | | 05/01/2037 | | | | 4,727,847 | |
| | 2,250,000 | | | Pinellas County, FL Educational Facilities Authority (Pinellas Prep Academy)1 | | | 7.125 | | | | 09/15/2041 | | | | 2,422,058 | |
|
| 28 OPPENHEIMER ROCHESTER HIGH YIELD MUNICIPAL FUND |
| | | | | | | | | | | | | | | | |
| Principal
Amount |
| | | | | Coupon | | | | Maturity | | | | Value | |
| | Florida (Continued) | | | | | | | | | | | | |
| | $240,000 | | | Port St. Lucie, FL Special Assessment (Peacock & Lowry)1 | | | 5.350% | | | | 07/01/2027 | | | $ | 231,370 | |
| | 9,400,000 | | | Portico, FL Community Devel. District | | | 5.450 | | | | 05/01/2037 | | | | 8,762,304 | |
| | 2,715,000 | | | Portofino Cove, FL Community Devel. District Special Assessment | | | 5.500 | | | | 05/01/2038 | | | | 2,715,217 | |
| | 5,905,000 | | | Portofino Isles, FL Community Devel. District (Portofino Court)3 | | | 5.600 | | | | 05/01/2036 | | | | 1,178,992 | |
| | 1,000,000 | | | Portofino Landings, FL Community Devel. District Special Assessment3 | | | 5.200 | | | | 05/01/2017 | | | | 391,960 | |
| | 1,955,000 | | | Portofino Landings, FL Community Devel. District Special Assessment3 | | | 5.400 | | | | 05/01/2038 | | | | 766,888 | |
| | 2,470,000 | | | Portofino Vista, FL Community Devel. District3 | | | 5.000 | | | | 05/01/2013 | | | | 1,111,006 | |
| | 3,420,000 | | | Reunion East, FL Community Devel. District4 | | | 5.800 | | | | 05/01/2036 | | | | 34 | |
| | 1,525,000 | | | Reunion East, FL Community Devel. District | | | 6.600 | | | | 05/01/2033 | | | | 1,579,915 | |
| | 3,585,000 | | | Reunion East, FL Community Devel. District | | | 6.600 | | | | 05/01/2036 | | | | 3,689,503 | |
| | 1,425,000 | | | Reunion East, FL Community Devel. District4 | | | 7.375 | | | | 05/01/2033 | | | | 14 | |
| | 140,000 | | | Ridgewood Trails, FL Community Devel. District1 | | | 5.650 | | | | 05/01/2038 | | | | 140,017 | |
| | 2,365,000 | | | River Bend, FL Community Devel. District3 | | | 7.125 | | | | 11/01/2015 | | | | 234,939 | |
| | 7,580,000 | | | River Glen, FL Community Devel. District Special Assessment3 | | | 5.450 | | | | 05/01/2038 | | | | 3,788,029 | |
| | 156,464 | | | Santa Rosa Bay, FL Bridge Authority | | | 6.250 | | | | 07/01/2028 | | | | 142,384 | |
| | 1,895,000 | | | Sarasota County, FL Educational Facilities (School of Arts & Sciences)1 | | | 6.500 | | | | 07/01/2040 | | | | 2,024,656 | |
| | 4,000,000 | | | Seminole County, FL IDA (Progressive Health)1 | | | 7.500 | | | | 03/01/2035 | | | | 3,879,160 | |
| | 3,240,000 | | | South Bay, FL Community Devel. District4 | | | 0.000 2 | | | | 05/01/2025 | | | | 2,526,487 | |
| | 8,750,000 | | | South Bay, FL Community Devel. District4 | | | 0.000 2 | | | | 05/01/2036 | | | | 6,779,763 | |
| | 7,035,000 | | | South Bay, FL Community Devel. District1 | | | 5.125 | | | | 05/01/2020 | | | | 6,885,928 | |
| | 7,235,000 | | | South Bay, FL Community Devel. District1 | | | 5.950 | | | | 05/01/2036 | | | | 7,006,519 | |
| | 5,110,000 | | | South Bay, FL Community Devel. District3 | | | 5.950 | | | | 05/01/2036 | | | | 253,865 | |
| | 3,655,000 | | | South Fork East, FL Community Devel. District1 | | | 6.500 2 | | | | 05/01/2038 | | | | 3,584,824 | |
| | 14,510,000 | | | South Miami, FL Health Facilities Authority (BHSF/ BHM/HHI/SMH/MarH/DrsH/WKBP/BOS Obligated Group)1 | | | 5.000 | | | | 08/15/2032 | | | | 14,548,887 | |
| | 30,000,000 | | | South Miami, FL Health Facilities Authority (BHSF/ BHM/HHI/SMH/MarH/DrsH/WKBP/BOS Obligated Group)1 | | | 5.000 | | | | 08/15/2042 | | | | 30,056,700 | |
| | 860,333 | | | St. Johns County, FL IDA (Glenmoor)4 | | | 2.500 | | | | 01/01/2049 | | | | 9 | |
| | 2,325,000 | | | St. Johns County, FL IDA (Glenmoor)3 | | | 5.375 9 | | | | 01/01/2049 | | | | 1,485,675 | |
| | 3,500,000 | | | St. Johns County, FL IDA (Presbyterian Retirement)1 | | | 5.875 | | | | 08/01/2040 | | | | 3,985,555 | |
| | 3,500,000 | | | St. Johns County, FL IDA (Presbyterian Retirement)1 | | | 6.000 | | | | 08/01/2045 | | | | 3,998,400 | |
| | 1,000,000 | | | St. Johns County, FL IDA (St. John’s County Welfare Federation) | | | 5.250 | | | | 10/01/2041 | | | | 878,430 | |
| | 16,765,000 | | | Tern Bay, FL Community Devel. District3 | | | 5.000 | | | | 05/01/2015 | | | | 4,080,098 | |
| | 19,075,000 | | | Tern Bay, FL Community Devel. District3 | | | 5.375 | | | | 05/01/2037 | | | | 4,645,335 | |
| | 10,790,000 | | | Town Center, FL at Palm Coast Community Devel. District1 | | | 6.000 | | | | 05/01/2036 | | | | 10,789,029 | |
| | 4,950,000 | | | Treeline, FL Preservation Community Devel. District4 | | | 6.800 | | | | 05/01/2039 | | | | 1,484,901 | |
| | 1,265,000 | | | Villa Vizcaya, FL Community Devel. District Special Assessment3 | | | 5.550 | | | | 05/01/2039 | | | | 695,295 | |
|
| 29 OPPENHEIMER ROCHESTER HIGH YIELD MUNICIPAL FUND |
STATEMENT OF INVESTMENTS Continued
| | | | | | | | | | | | | | | | |
| Principal
Amount |
| | | | | Coupon | | | | Maturity | | | | Value | |
| | Florida (Continued) | | | | | | | | | | | | |
| | $590,000 | | | Villages of Glen Creek FL Community Devel. District Community Devel. District | | | 4.750% | | | | 05/01/2026 | | | $ | 568,506 | |
| | 1,080,000 | | | Villages of Glen Creek FL Community Devel. District Community Devel. District | | | 5.250 | | | | 05/01/2036 | | | | 1,017,133 | |
| | 1,815,000 | | | Villages of Glen Creek FL Community Devel. District Community Devel. District | | | 5.375 | | | | 05/01/2046 | | | | 1,687,696 | |
| | 3,515,000 | | | Villages of Glen Creek FL Community Devel. District Community Devel. District | | | 5.375 | | | | 05/01/2046 | | | | 3,268,458 | |
| | 4,395,000 | | | Waterford Estates, FL Community Devel. District Special Assessment3 | | | 5.125 | | | | 05/01/2013 | | | | 2,658,887 | |
| | 3,350,000 | | | Waterford Estates, FL Community Devel. District Special Assessment3 | | | 5.500 | | | | 05/01/2037 | | | | 2,026,683 | |
| | 130,000 | | | Waters Edge, FL Community Devel. District1 | | | 5.350 | | | | 05/01/2039 | | | | 125,376 | |
| | 4,360,000 | | | Waters Edge, FL Community Devel. District1 | | | 6.600 2 | | | | 05/01/2039 | | | | 4,269,835 | |
| | 14,800,000 | | | Waterstone, FL Community Devel. District3 | | | 5.500 | | | | 05/01/2018 | | | | 7,396,892 | |
| | 1,215,000 | | | West Villages, FL Improvement District3 | | | 5.350 | | | | 05/01/2015 | | | | 728,465 | |
| | 18,400,000 | | | West Villages, FL Improvement District | | | 5.500 | | | | 05/01/2038 | | | | 18,464,216 | |
| | 18,150,000 | | | West Villages, FL Improvement District3 | | | 5.800 | | | | 05/01/2036 | | | | 10,882,014 | |
| | 14,925,000 | | | Westridge, FL Community Devel. District3 | | | 5.800 | | | | 05/01/2037 | | | | 8,954,552 | |
| | 11,045,000 | | | Westside, FL Community Devel. District4 | | | 5.650 | | | | 05/01/2037 | | | | 6,624,128 | |
| | 16,135,000 | | | Westside, FL Community Devel. District4 | | | 7.200 | | | | 05/01/2038 | | | | 9,676,805 | |
| | 7,420,000 | | | Wyld Palms, FL Community Devel. District3 | | | 5.400 | | | | 05/01/2015 | | | | 1,483,777 | |
| | 4,340,000 | | | Wyld Palms, FL Community Devel. District3 | | | 5.500 | | | | 05/01/2038 | | | | 867,870 | |
| | 3,830,000 | | | Zephyr Ridge, FL Community Devel. District3 | | | 5.250 | | | | 05/01/2013 | | | | 1,914,004 | |
| | 2,665,000 | | | Zephyr Ridge, FL Community Devel. District3 | | | 5.625 | | | | 05/01/2037 | | | | 1,331,807 | |
| | | | | | | | | | | | | | | | |
| | | | | | | | | | | | | | | 530,376,697 | |
| | | | | | | | | | | | | | | | | |
| | Georgia—1.6% | | | | | | | | | | | | |
| | 700,000 | | | Atlanta, GA Tax Allocation (Beltline)1 | | | 7.500 | | | | 01/01/2031 | | | | 758,702 | |
| | 3,600,000 | | | Atlanta, GA Tax Allocation (Beltline)1 | | | 7.500 | | | | 01/01/2031 | | | | 3,902,508 | |
| | 12,000,000 | | | Burke County, GA Devel. Authority (Oglethorpe Power Corp.)1 | | | 5.700 | | | | 01/01/2043 | | | | 12,182,520 | |
| | 1,445,000 | | | Cobb County, GA Devel. Authority (Provident Group- Creekside Properties) | | | 6.000 | | | | 07/01/2036 | | | | 1,359,268 | |
| | 5,440,000 | | | Cobb County, GA Devel. Authority (Provident Group- Creekside Properties) | | | 6.000 | | | | 07/01/2051 | | | | 4,966,393 | |
| | 1,435,000 | | | Franklin County, GA Industrial Building Authority (Emmanuel College)3 | | | 5.750 | | | | 11/01/2025 | | | | 717,199 | |
| | 1,380,000 | | | Franklin County, GA Industrial Building Authority (Emmanuel College)3 | | | 6.000 | | | | 11/01/2032 | | | | 689,710 | |
| | 10,625,000 | | | Franklin County, GA Industrial Building Authority (Emmanuel College)3 | | | 6.250 | | | | 11/01/2043 | | | | 5,310,269 | |
| | 31,945,000 | | | Fulton County, GA Devel. Authority (PHC)6 | | | 5.000 | | | | 06/15/2029 | | | | 34,367,028 | |
| | 13,730,000 | | | Fulton County, GA Devel. Authority (PHC/PHosp/PHF Obligated Group)6 | | | 5.250 | | | | 06/15/2037 | | | | 14,834,573 | |
| | 1,800,000 | | | GA Environmental Loan Acquisition Corp. (Local Water Authority)1 | | | 5.125 | | | | 03/15/2031 | | | | 1,847,898 | |
| | 9,100,000 | | | GA Road & Tollway Authority (I-75 S Express Lanes)1 | | | 0.000 2 | | | | 06/01/2049 | | | | 5,628,350 | |
| | 2,250,000 | | | GA Road & Tollway Authority (I-75 S Express Lanes) | | | 6.246 5 | | | | 06/01/2024 | | | | 1,510,245 | |
|
| 30 OPPENHEIMER ROCHESTER HIGH YIELD MUNICIPAL FUND |
| | | | | | | | | | | | | | |
Principal Amount | | | | Coupon | | | Maturity | | | Value | |
| Georgia (Continued) | | | | | | | | | |
| $3,750,000 | | GA Road & Tollway Authority (I-75 S Express Lanes) | | | 6.748 | %5 | | | 06/01/2034 | | | $ | 1,279,725 | |
| 1,720,000 | | Gainesville & Hall County, GA Devel. Authority Educational Facilities (Riverside Military Academy)1 | | | 5.000 | | | | 03/01/2047 | | | | 1,819,227 | |
| 1,720,000 | | Gainesville & Hall County, GA Devel. Authority Educational Facilities (Riverside Military Academy)1 | | | 5.125 | | | | 03/01/2052 | | | | 1,819,347 | |
| 2,000,000 | | Marietta, GA Devel. Authority (Life University)1 | | | 7.000 | | | | 06/15/2039 | | | | 2,104,420 | |
| | | | | | | | | | | | | 95,097,382 | |
| | | | | | | | | | | | | | | |
| Hawaii—0.0% | | | | | | | | | | | | |
| 405,000 | | HI Dept. of Transportation (Continental Airlines)1 | | | 5.625 | | | | 11/15/2027 | | | | 406,437 | |
| 1,735,000 | | Kuakini, HI Health System (KMC/KHS/KGC/KSS Obligated Group)1 | | | 6.300 | | | | 07/01/2022 | | | | 1,735,139 | |
| 275,000 | | Kuakini, HI Health System (KMC/KHS/KGC/KSS Obligated Group)1 | | | 6.375 | | | | 07/01/2032 | | | | 274,981 | |
| | | | | | | | | | | | | 2,416,557 | |
| | | | | | | | | | | | | | | |
| Idaho—0.0% | | | | | | | | | | | | |
| 1,230,700 | | Nampa, ID Local Improvement District No. 148 | | | 6.625 | | | | 09/01/2030 | | | | 1,257,788 | |
| | | | | | | | | | | | | | | |
| Illinois—6.7% | | | | | | | | | | | | |
| 300,000 | | Annawan, IL Tax Increment (Patriot Renewable Fuels)1 | | | 5.625 | | | | 01/01/2018 | | | | 299,157 | |
| 3,000,000 | | Carol Stream, IL Park District1 | | | 5.000 | | | | 01/01/2037 | | | | 3,430,110 | |
| 30,685,000 | | Caseyville, IL Tax (Forest Lakes)4 | | | 7.000 | | | | 12/30/2022 | | | | 1,380,211 | |
| 1,100,000 | | Chicago, IL Board of Education1 | | | 5.000 | | | | 12/01/2042 | | | | 949,267 | |
| 5,700,000 | | Chicago, IL Board of Education1 | | | 6.000 | | | | 04/01/2046 | | | | 6,189,174 | |
| 1,500,000 | | Chicago, IL Board of Education1 | | | 6.500 | | | | 12/01/2046 | | | | 1,485,285 | |
| 7,000,000 | | Chicago, IL Board of Education1 | | | 7.000 | | | | 12/01/2044 | | | | 7,165,130 | |
| 10,000,000 | | Chicago, IL Board of Education1 | | | 7.500 | 9 | | | 03/01/2035 | | | | 9,995,000 | |
| 20,000,000 | | Chicago, IL GO1 | | | 5.250 | | | | 01/01/2033 | | | | 20,032,200 | |
| 3,000,000 | | Chicago, IL Midway Airport, Series A1 | | | 5.000 | | | | 01/01/2033 | | | | 3,330,210 | |
| 35,000 | | Chicago, IL Multifamily Hsg. (Cottage View Terrace)1 | | | 6.125 | | | | 02/20/2042 | | | | 35,104 | |
| 2,500,000 | | Chicago, IL O’Hare International Airport1 | | | 5.000 | | | | 01/01/2047 | | | | 2,801,750 | |
| 5,000,000 | | Chicago, IL O’Hare International Airport1 | | | 5.000 | | | | 01/01/2052 | | | | 5,556,450 | |
| 8,000,000 | | Chicago, IL O’Hare International Airport1 | | | 5.250 | | | | 01/01/2042 | | | | 9,441,760 | |
| 2,755,000 | | Chicago, IL Waterworks1 | | | 5.250 | | | | 11/01/2030 | | | | 3,345,369 | |
| 2,900,000 | | Chicago, IL Waterworks1 | | | 5.250 | | | | 11/01/2031 | | | | 3,507,579 | |
| 2,135,000 | | Chicago, IL Waterworks1 | | | 5.250 | | | | 11/01/2032 | | | | 2,569,665 | |
| 2,000,000 | | Chicago, IL Waterworks1 | | | 5.250 | | | | 11/01/2033 | | | | 2,399,340 | |
| 2,885,000 | | Chicago, IL Waterworks1 | | | 5.250 | | | | 11/01/2035 | | | | 3,444,171 | |
| 10,032,000 | | Cortland, IL Special Tax (Sheaffer System)4 | | | 5.500 | | | | 03/01/2017 | | | | 2,001,685 | |
| 915,000 | | Country Club Hills, IL GO1 | | | 5.000 | | | | 12/01/2026 | | | | 917,855 | |
| 965,000 | | Country Club Hills, IL GO1 | | | 5.000 | | | | 12/01/2027 | | | | 967,528 | |
| 1,010,000 | | Country Club Hills, IL GO1 | | | 5.000 | | | | 12/01/2028 | | | | 1,012,707 | |
| 1,060,000 | | Country Club Hills, IL GO1 | | | 5.000 | | | | 12/01/2029 | | | | 1,062,629 | |
| 1,120,000 | | Country Club Hills, IL GO1 | | | 5.000 | | | | 12/01/2030 | | | | 1,122,520 | |
| 1,175,000 | | Country Club Hills, IL GO1 | | | 5.000 | | | | 12/01/2031 | | | | 1,177,620 | |
| 2,425,000 | | Country Club Hills, IL GO1 | | | 5.000 | | | | 12/01/2032 | | | | 2,429,923 | |
| 1,000,000 | | Du Page County, IL Special Service Area No. 31 Special Tax (Monarch Landing)1 | | | 5.625 | | | | 03/01/2036 | | | | 1,000,010 | |
|
| 31 OPPENHEIMER ROCHESTER HIGH YIELD MUNICIPAL FUND |
STATEMENT OF INVESTMENTS Continued
| | | | | | | | | | | | | | |
Principal
Amount | | | | Coupon | | | Maturity | | | Value | |
| Illinois (Continued) | | | | | | | | | |
| $1,585,000 | | Franklin Park, IL GO1 | | | 6.250 | % | | | 07/01/2030 | | | $ | 1,784,599 | |
| 2,159,097 | | Gilberts, IL Special Service Area No. 24 Special Tax (Conservancy) | | | 5.375 | | | | 03/01/2034 | | | | 1,865,416 | |
| 6,165,000 | | Harvey, IL GO4 | | | 5.500 | | | | 12/01/2027 | | | | 3,865,332 | |
| 1,800,000 | | Harvey, IL GO4 | | | 5.625 | | | | 12/01/2032 | | | | 1,151,244 | |
| 10,140,000 | | IL Educational Facilities Authority (Plum Creek Rolling Meadows)1 | | | 6.500 | | | | 12/01/2037 | | | | 10,342,699 | |
| 19,410,000 | | IL Finance Authority (Advocate Health Care)6 | | | 5.375 | | | | 04/01/2044 | | | | 20,675,870 | |
| 5,820,000 | | IL Finance Authority (Advocate Health Care)6 | | | 5.375 | | | | 04/01/2044 | | | | 6,199,537 | |
| 5,180,000 | | IL Finance Authority (Advocate Health Care)6 | | | 5.375 | | | | 04/01/2044 | | | | 5,517,801 | |
| 21,765,000 | | IL Finance Authority (Advocate Health Care)6 | | | 5.375 | | | | 04/01/2044 | | | | 23,184,457 | |
| 10,575,000 | | IL Finance Authority (Advocate Health Care)6 | | | 5.500 | | | | 04/01/2044 | | | | 11,294,946 | |
| 9,425,000 | | IL Finance Authority (Advocate Health Care)6 | | | 5.500 | | | | 04/01/2044 | | | | 10,066,654 | |
| 365,000 | | IL Finance Authority (AHCN/ANSHN/ACMC/AH&HC Obligated Group)1 | | | 5.375 | | | | 04/01/2044 | | | | 386,754 | |
| 320,000 | | IL Finance Authority (AHCN/ANSHN/ACMC/AH&HC Obligated Group)1 | | | 5.375 | | | | 04/01/2044 | | | | 342,886 | |
| 3,195,000 | | IL Finance Authority (Bethel Terrace Apartments)1 | | | 5.375 | | | | 09/01/2035 | | | | 3,196,693 | |
| 5,000,000 | | IL Finance Authority (Central Dupage Health System/ Central Dupage Hospital Assoc.)6 | | | 5.375 | | | | 11/01/2039 | | | | 5,435,100 | |
| 12,500,000 | | IL Finance Authority (Central Dupage Health)6 | | | 5.500 | | | | 11/01/2039 | | | | 13,663,125 | |
| 5,590,000 | | IL Finance Authority (DeKalb Supportive Living)1 | | | 6.100 | | | | 12/01/2041 | | | | 5,663,732 | |
| 2,030,000 | | IL Finance Authority (Friendship Village Schaumburg)1 | | | 5.625 | | | | 02/15/2037 | | | | 2,030,081 | |
| 1,000,000 | | IL Finance Authority (Lake Forest College)1 | | | 6.000 | | | | 10/01/2048 | | | | 1,073,630 | |
| 850,000 | | IL Finance Authority (Luther Oaks) | | | 6.000 | | | | 08/15/2026 | | | | 851,037 | |
| 1,500,000 | | IL Finance Authority (Luther Oaks) | | | 6.000 | | | | 08/15/2039 | | | | 1,501,125 | |
| 105,000 | | IL Finance Authority (PHN/PCTC/PC&SHN/PLC/PCHN/ PSSC/PHCr/PBH/PAS/PHFBT Obligated Group )1 | | | 7.750 | | | | 08/15/2034 | | | | 119,229 | |
| 11,050,000 | | IL Finance Authority (PHN/PCTC/PC&SHN/PLC/PCHN/ PSSC/PHCr/PBH/PAS/PHFBT Obligated Group )1 | | | 7.750 | | | | 08/15/2034 | | | | 12,547,386 | |
| 575,000 | | IL Finance Authority (Rogers Park Montessori School)1 | | | 6.000 | | | | 02/01/2034 | | | | 607,884 | |
| 1,310,000 | | IL Finance Authority (Rogers Park Montessori School)1 | | | 6.125 | | | | 02/01/2045 | | | | 1,378,330 | |
| 11,870,000 | | IL Finance Authority (St. Anthony Lassing) | | | 6.500 | | | | 12/01/2032 | | | | 12,522,494 | |
| 1,500,000 | | IL Finance Authority (The New Admiral at the Lake) | | | 8.000 | | | | 05/15/2040 | | | | 1,667,610 | |
| 5,775,000 | | IL Finance Authority (The New Admiral at the Lake) | | | 8.000 | | | | 05/15/2046 | | | | 6,409,326 | |
| 4,185,000 | | IL Finance Authority (Villa St. Benedict)1 | | | 6.125 | | | | 11/15/2035 | | | | 4,481,884 | |
| 4,400,000 | | IL Finance Authority (Villa St. Benedict)1 | | | 6.375 | | | | 11/15/2043 | | | | 4,754,904 | |
| 1,640,000 | | IL Hsg. Devel. Authority (Stonebridge Gurnee) | | | 5.450 | | | | 01/01/2046 | | | | 1,541,370 | |
| 1,775,000 | | IL Hsg. Devel. Authority (Stonebridge Gurnee) | | | 5.600 | | | | 01/01/2056 | | | | 1,672,068 | |
| 14,300,000 | | IL Metropolitan Pier & Exposition Authority (McCormick Place Exposition) | | | 4.379 | 5 | | | 12/15/2032 | | | | 7,514,221 | |
| 15,580,000 | | IL Sales Tax1 | | | 4.000 | | | | 06/15/2028 | | | | 16,434,251 | |
| 15,580,000 | | IL Sales Tax1 | | | 4.000 | | | | 06/15/2029 | | | | 16,270,038 | |
| 12,455,000 | | IL Sales Tax1 | | | 4.000 | | | | 06/15/2031 | | | | 12,830,518 | |
| 13,635,000 | | Lombard, IL Public Facilities Corp. (Conference Center & Hotel)4 | | | 7.125 | | | | 01/01/2036 | | | | 5,926,589 | |
| 2,950,000 | | Manhattan, IL Special Service Area Special Tax (Groebe Farm-Stonegate)3 | | | 5.750 | | | | 03/01/2022 | | | | 529,997 | |
|
| 32 OPPENHEIMER ROCHESTER HIGH YIELD MUNICIPAL FUND |
| | | | | | | | | | | | | | |
Principal Amount | | | | Coupon | | | Maturity | | | Value | |
| Illinois (Continued) | | | | | | | | | |
| $4,000,000 | | Manhattan, IL Special Service Area Special Tax (Groebe Farm-Stonegate)3 | | | 6.125 | % | | | 03/01/2040 | | | $ | 718,640 | |
| 1,778,000 | | Manhattan, IL Special Service Area Special Tax (Lakeside Towns Liberty)3 | | | 5.750 | | | | 03/01/2022 | | | | 346,852 | |
| 3,491,000 | | Plano, IL Special Service Area No. 53 | | | 6.000 | | | | 03/01/2036 | | | | 2,082,835 | |
| 5,510,000 | | Quad Cities, IL Regional EDA (Pheasant Ridge Apartments)7 | | | 6.375 | | | | 08/01/2040 | | | | 4,205,508 | |
| 162 | | Robbins, IL Res Rec (Robbins Res Rec Partners)1 | | | 7.250 | | | | 10/15/2024 | | | | 165 | |
| 2,500,000 | | Southwestern IL Devel. Authority (Comprehensive Mental Health Center) | | | 6.625 | | | | 06/01/2037 | | | | 2,539,400 | |
| 1,500,000 | | Southwestern IL Devel. Authority (Eden Retirement Center) | | | 5.850 | | | | 12/01/2036 | | | | 1,363,515 | |
| 11,610,000 | | Southwestern IL Devel. Authority (Local Government Programming) | | | 7.000 | | | | 10/01/2022 | | | | 5,804,187 | |
| 4,135,000 | | Southwestern IL Devel. Authority (Village of Sauget)1 | | | 5.625 | | | | 11/01/2026 | | | | 3,683,706 | |
| 8,515,000 | | Southwestern IL Devel. Authority Solid Waste Disposal (Center Ethanol Company) | | | 8.250 | | | | 12/01/2019 | | | | 8,523,004 | |
| 12,690,000 | | Upper, IL River Valley Devel. Authority (DeerPath Huntley)1 | | | 6.500 | | | | 12/01/2032 | | | | 13,155,850 | |
| 7,620,000 | | Upper, IL River Valley Devel. Authority (Living Springs McHenry)1 | | | 6.100 | | | | 12/01/2041 | | | | 7,720,508 | |
| 1,900,000 | | Will-Kankakee, IL Regional Devel. Authority (Senior Estates Supportive Living)1 | | | 7.000 | | | | 12/01/2042 | | | | 1,948,032 | |
| | | | | | | | | | | | | 388,442,428 | |
| | | | | | | | | | | | | | | |
| Indiana—1.5% | | | | | | | | | | | | |
| 2,000,000 | | Allen County, IN Economic Devel. (Storypoint/SL2016/ SLW/SLFW/SLF Obligated Group) | | | 6.875 | | | | 01/15/2052 | | | | 2,073,860 | |
| 955,000 | | Anderson, IN Multifamily Hsg. (Cross Lakes Apartments)4 | | | 8.000 | | | | 12/01/2045 | | | | 477,385 | |
| 1,140,000 | | Anderson, IN Multifamily Hsg. (Cross Lakes Apartments)3 | | | 9.000 | | | | 12/01/2045 | | | | 569,863 | |
| 4,300,000 | | Carmel, IN Redevel. District COP1 | | | 6.500 | | | | 07/15/2035 | | | | 5,059,595 | |
| 1,225,000 | | Chesterton, IN Economic Devel. (Storypoint/SL2016/ SLW/SLC Obligated Group) | | | 6.375 | | | | 01/15/2051 | | | | 1,241,697 | |
| 5,805,000 | | East Chicago, IN Solid Waste Disposal (USG Corp.)1 | | | 6.375 | | | | 08/01/2029 | | | | 5,816,262 | |
| 2,050,000 | | IN Finance Authority (Avondale Meadows Academy)1 | | | 5.375 | | | | 07/01/2047 | | | | 2,018,553 | |
| 1,675,000 | | IN Finance Authority (BHI Senior Living)1 | | | 5.500 | | | | 11/15/2031 | | | | 1,821,864 | |
| 2,850,000 | | IN Finance Authority (BHI Senior Living)1 | | | 5.750 | | | | 11/15/2041 | | | | 3,085,438 | |
| 11,505,000 | | IN Finance Authority (Marian University)1 | | | 6.375 | | | | 09/15/2041 | | | | 12,675,634 | |
| 925,000 | | IN Finance Authority Educational Facilities (Irvington Community)1 | | | 9.000 | | | | 07/01/2039 | | | | 929,523 | |
| 3,950,000 | | IN Hsg. & Community Devel. Authority (Evergreen Village Bloomington)1 | | | 5.500 | | | | 01/01/2037 | | | | 3,848,683 | |
| 6,225,000 | | IN Hsg. & Community Devel. Authority (Hammond Assisted Living Community)1 | | | 5.750 | | | | 01/01/2036 | | | | 6,072,861 | |
| 1,095,000 | | Kokomo, IN Multifamily Hsg. (Silver Birch of Kokomo)1 | | | 5.750 | | | | 01/01/2034 | | | | 1,119,857 | |
| 4,570,000 | | Kokomo, IN Multifamily Hsg. (Silver Birch of Kokomo)1 | | | 5.875 | | | | 01/01/2037 | | | | 4,676,618 | |
|
| 33 OPPENHEIMER ROCHESTER HIGH YIELD MUNICIPAL FUND |
STATEMENT OF INVESTMENTS Continued
| | | | | | | | | | | | | | |
Principal
Amount | | | | Coupon | | | Maturity | | | Value | |
| Indiana (Continued) | | | | | | | | | |
| $1,060,000 | | Lafayette, IN Multifamily Hsg. (Glasswater Creek of Lafayette)1 | | | 5.600 | % | | | 01/01/2033 | | | $ | 1,080,140 | |
| 5,160,000 | | Lafayette, IN Multifamily Hsg. (Glasswater Creek of Lafayette)1 | | | 5.800 | | | | 01/01/2037 | | | | 5,249,990 | |
| 4,965,000 | | Merrillville, IN Economic Devel. (Belvedere Hsg.)1 | | | 5.750 | | | | 04/01/2036 | | | | 4,796,587 | |
| 14,565,000 | | Michigan City, IN Multifamily Hsg. (Silver Birch Project)1 | | | 5.150 | | | | 01/01/2037 | | | | 13,987,498 | |
| 2,560,000 | | Muncie, IN Multifamily Hsg. (Silver Birch Project)1 | | | 5.250 | | | | 01/01/2037 | | | | 2,460,467 | |
| 4,995,000 | | Shelbyville, IN Redevel. District Tax Increment (Central Shelbyville Economic)1 | | | 6.500 | | | | 07/01/2022 | | | | 5,279,016 | |
| 3,605,000 | | Vincennes, IN Economic Devel. (Southwest Indiana Regional Youth Village) | | | 6.250 | | | | 01/01/2029 | | | | 3,510,585 | |
| | | | | | | | | | | | | 87,851,976 | |
| | | | | | | | | | | | | | | |
| Iowa—0.4% | | | | | | | | | | | | |
| 630,000 | | IA Finance Authority (Amity Fellowserve) | | | 6.000 | | | | 10/01/2028 | | | | 630,019 | |
| 940,000 | | IA Finance Authority (Amity Fellowserve) | | | 6.375 | | | | 10/01/2026 | | | | 940,705 | |
| 2,190,000 | | IA Finance Authority (Amity Fellowserve) | | | 6.500 | | | | 10/01/2036 | | | | 2,191,051 | |
| 1,160,000 | | IA Finance Authority (Boys & Girls Home and Family Services)4 | | | 5.900 | | | | 12/01/2028 | | | | 107,300 | |
| 815,000 | | IA Finance Authority Senior Hsg. (Wedum Walnut Ridge)1 | | | 5.375 | | | | 06/01/2025 | | | | 762,938 | |
| 15,230,000 | | IA Tobacco Settlement Authority1 | | | 5.500 | | | | 06/01/2042 | | | | 15,159,333 | |
| 2,955,000 | | IA Tobacco Settlement Authority (TASC)1 | | | 6.500 | | | | 06/01/2023 | | | | 2,931,123 | |
| | | | | | | | | | | | | 22,722,469 | |
| | | | | | | | | | | | | | | |
| Kansas—0.0% | | | | | | | | | | | | |
| 525,000 | | Lenexa, KS Multifamily Hsg. (Meadows Apartments)1 | | | 7.950 | | | | 10/15/2035 | | | | 525,562 | |
| 3,405,637 | | Olathe, KS Tax Increment (Gateway)4 | | | 5.000 | | | | 03/01/2026 | | | | 1,360,756 | |
| | | | | | | | | | | | | 1,886,318 | |
| | | | | | | | | | | | | | | |
| Kentucky—0.6% | | | | | | | | | | | | |
| 1,880,000 | | Kuttawa, KY (1st Mtg.-GF/Kentucky) | | | 6.750 | | | | 03/01/2029 | | | | 1,882,895 | |
| 14,000,000 | | KY EDFA (Baptist Healthcare System)6 | | | 5.375 | | | | 08/15/2024 | | | | 14,602,140 | |
| 1,250,000 | | KY EDFA (Masonic Home Independent Living II)1 | | | 7.250 | | | | 05/15/2041 | | | | 1,529,813 | |
| 1,000,000 | | KY EDFA (Masonic Home Independent Living II)1 | | | 7.375 | | | | 05/15/2046 | | | | 1,228,470 | |
| 1,350,000 | | KY EDFA (Owensboro Medical Health System)1 | | | 6.500 | | | | 03/01/2045 | | | | 1,553,134 | |
| 6,785,000 | | KY Municipal Power Agency1 | | | 5.000 | | | | 09/01/2034 | | | | 7,692,290 | |
| 5,000,000 | | KY Municipal Power Agency1 | | | 5.000 | | | | 09/01/2036 | | | | 5,647,650 | |
| | | | | | | | | | | | | 34,136,392 | |
| | | | | | | | | | | | | | | |
| Louisiana—0.6% | | | | | | | | | | | | |
| 12,270,000 | | East Baton Rouge Parish, LA Sewer1 | | | 5.000 | | | | 02/01/2039 | | | | 13,885,223 | |
| 1,200,000 | | Juban Park, LA Community Devel. District Special Assessment3 | | | 5.150 | | | | 10/01/2014 | | | | 119,784 | |
| 9,630,000 | | LA GO1 | | | 4.000 | | | | 09/01/2031 | | | | 10,299,574 | |
|
| 34 OPPENHEIMER ROCHESTER HIGH YIELD MUNICIPAL FUND |
| | | | | | | | | | | | | | |
Principal Amount | | | | Coupon | | | Maturity | | | Value | |
| Louisiana (Continued) | | | | | | | | | |
| $11,415,000 | | LA HFA (La Chateau)1 | | | 7.250 | % | | | 09/01/2039 | | | $ | 11,598,325 | |
| | | | | | | | | | | | | 35,902,906 | |
| | | | | | | | | | | | | | | |
| Maine—0.3% | | | | | | | | | | | | |
| 2,000,000 | | ME H&HEFA (Maine General Medical Center)1 | | | 6.750 | | | | 07/01/2041 | | | | 2,189,140 | |
| 4,800,000 | | Rumford, ME Pollution Control (Boise Cascade Corp.)1 | | | 6.625 | | | | 07/01/2020 | | | | 4,817,856 | |
| 12,265,000 | | Rumford, ME Solid Waste Disposal (Boise Cascade Corp.)1 | | | 6.875 | | | | 10/01/2026 | | | | 12,310,503 | |
| | | | | | | | | | | | | 19,317,499 | |
| | | | | | | | | | | | | | | |
| Maryland—0.1% | | | | | | | | | | | | |
| 1,100,000 | | Baltimore, MD Special Obligation (Center/West Devel.)1 | | | 5.375 | | | | 06/01/2036 | | | | 1,139,413 | |
| 1,360,000 | | Baltimore, MD Special Obligation (Center/West Devel.)1 | | | 5.500 | | | | 06/01/2043 | | | | 1,410,932 | |
| 1,750,000 | | Baltimore, MD Special Obligation (Harbor Point)1 | | | 5.125 | | | | 06/01/2043 | | | | 1,809,535 | |
| 6,861,636 | | Salisbury, MD Special Obligation (Villages at Salisbury Lake)4 | | | 3.787 | 5 | | | 01/01/2037 | | | | 807,409 | |
| | | | | | | | | | | | | 5,167,289 | |
| | | | | | | | | | | | | | | |
| Massachusetts—1.0% | | | | | | | | | | | | |
| 6,905,000 | | MA Devel. Finance Agency (Lasell College)1 | | | 6.000 | | | | 07/01/2041 | | | | 7,633,961 | |
| 1,600,702 | | MA Devel. Finance Agency (Linden Ponds) | | | 1.009 | 5 | | | 11/15/2056 | | | | 37,697 | |
| 4,635,000 | | MA Devel. Finance Agency (Linden Ponds)1 | | | 4.680 | | | | 11/15/2021 | | | | 4,679,311 | |
| 195,000 | | MA Devel. Finance Agency (Linden Ponds)1 | | | 4.680 | | | | 11/15/2021 | | | | 196,864 | |
| 321,825 | | MA Devel. Finance Agency (Linden Ponds)1 | | | 5.500 | | | | 11/15/2046 | | | | 313,573 | |
| 685,000 | | MA Devel. Finance Agency (Linden Ponds)1 | | | 6.250 | | | | 11/15/2018 | | | | 696,844 | |
| 2,057,748 | | MA Devel. Finance Agency (Linden Ponds)1 | | | 6.250 | | | | 11/15/2039 | | | | 2,134,790 | |
| 6,062,305 | | MA Devel. Finance Agency (Linden Ponds)1 | | | 6.250 | | | | 11/15/2046 | | | | 6,273,455 | |
| 1,000,000 | | MA Devel. Finance Agency (VOA Concord)1 | | | 5.200 | | | | 11/01/2041 | | | | 1,001,100 | |
| 3,140,000 | | MA Devel. Finance Agency (Wheelock College)1 | | | 5.250 | | | | 10/01/2037 | | | | 3,158,777 | |
| 7,240,000 | | MA Educational Financing Authority, Series H1 | | | 6.350 | | | | 01/01/2030 | | | | 7,576,298 | |
| 9,820,000 | | MA H&EFA (Milford Regional Medical Center)1 | | | 5.000 | | | | 07/15/2032 | | | | 9,841,113 | |
| 11,960,000 | | MA HFA, Series C6 | | | 5.350 | | | | 12/01/2042 | | | | 12,737,041 | |
| 595,000 | | MA Port Authority (Delta Air Lines)1 | | | 5.000 | | | | 01/01/2027 | | | | 600,688 | |
| | | | | | | | | | | | | 56,881,512 | |
| | | | | | | | | | | | | | | |
| Michigan—2.5% | | | | | | | | | | | | |
| 1,600,000 | | American Montessori Academy, MI Public School Academy | | | 7.000 | | | | 12/01/2046 | | | | 1,610,304 | |
| 3,465,000 | | Arts & Technology Academy Pontiac, MI Public School Academy | | | 6.000 | | | | 11/01/2046 | | | | 3,260,149 | |
| 2,740,000 | | Charyl Stockwell Academy, MI Public School Academy1 | | | 5.500 | | | | 10/01/2035 | | | | 2,768,852 | |
| 4,140,000 | | Charyl Stockwell Academy, MI Public School Academy1 | | | 5.750 | | | | 10/01/2045 | | | | 4,202,721 | |
| 10,100,000 | | Detroit, MI City School District6 | | | 6.000 | | | | 05/01/2029 | | | | 12,504,305 | |
| 803,643 | | Detroit, MI GO1 | | | 5.000 | | | | 04/01/2020 | | | | 805,677 | |
| 906,750 | | Detroit, MI GO1 | | | 5.000 | | | | 04/01/2021 | | | | 909,098 | |
| 350,300 | | Detroit, MI GO1 | | | 5.250 | | | | 04/01/2020 | | | | 351,274 | |
| 155,000 | | Detroit, MI GO | | | 5.250 | | | | 04/01/2020 | | | | 155,091 | |
|
| 35 OPPENHEIMER ROCHESTER HIGH YIELD MUNICIPAL FUND |
STATEMENT OF INVESTMENTS Continued
| | | | | | | | | | | | | | |
Principal
Amount | | | | Coupon | | | Maturity | | | Value | |
| Michigan (Continued) | | | | | | | | | |
| $342,550 | | Detroit, MI GO | | | 5.250 | % | | | 04/01/2021 | | | $ | 343,465 | |
| 206,150 | | Detroit, MI GO1 | | | 5.250 | | | | 04/01/2022 | | | | 206,729 | |
| 15,500 | | Detroit, MI GO | | | 5.250 | | | | 04/01/2023 | | | | 15,542 | |
| 1,845,000 | | Detroit, MI Local Devel. Finance Authority1 | | | 6.700 | | | | 05/01/2021 | | | | 1,845,867 | |
| 1,175,000 | | Detroit, MI Local Devel. Finance Authority1 | | | 6.850 | | | | 05/01/2021 | | | | 1,175,764 | |
| 2,585,000 | | Macomb, MI Interceptor Drainage District1 | | | 5.000 | | | | 05/01/2032 | | | | 3,107,532 | |
| 1,500,000 | | Macomb, MI Interceptor Drainage District1 | | | 5.000 | | | | 05/01/2033 | | | | 1,794,660 | |
| 1,700,000 | | Macomb, MI Interceptor Drainage District1 | | | 5.000 | | | | 05/01/2034 | | | | 2,025,907 | |
| 415,000 | | Macomb, MI Public Academy1 | | | 6.750 | | | | 05/01/2037 | | | | 414,942 | |
| 4,800,000 | | MI Finance Authority (HFHS/HFMHCT/HFWH/WAFMH Obligated Group)1 | | | 5.000 | | | | 11/15/2028 | | | | 5,700,960 | |
| 200,000 | | MI Finance Authority (HFHS/HFMHCT/HFWH/WAFMH Obligated Group)1 | | | 5.000 | | | | 11/15/2041 | | | | 224,618 | |
| 1,400,000 | | MI Finance Authority (Old Redford Public School Academy)1 | | | 5.900 | | | | 12/01/2030 | | | | 1,419,096 | |
| 685,000 | | MI Public Educational Facilities Authority (American Montessori) | | | 6.500 | | | | 12/01/2037 | | | | 688,288 | |
| 1,400,000 | | MI Public Educational Facilities Authority (Old Redford Academy)1 | | | 6.000 | | | | 12/01/2035 | | | | 1,400,252 | |
| 1,135,125 | | MI Strategic Fund Limited Obligation (Wolverine Human Services)1 | | | 7.875 | | | | 08/31/2028 | | | | 1,141,538 | |
| 3,700,000 | | MI Strategic Fund Solid Waste (Genesee Power Station)1 | | | 7.500 | | | | 01/01/2021 | | | | 3,637,174 | |
| 144,990,000 | | MI Tobacco Settlement Finance Authority | | | 6.387 | 5 | | | 06/01/2052 | | | | 9,386,653 | |
| 2,725,780,000 | | MI Tobacco Settlement Finance Authority | | | 7.965 | 5 | | | 06/01/2058 | | | | 62,801,971 | |
| 1,625,000 | | Pontiac, MI City School District | | | 4.500 | | | | 05/01/2020 | | | | 1,508,991 | |
| 3,500,000 | | Summit Academy North, MI Public School Academy1 | | | 5.000 | | | | 11/01/2031 | | | | 3,548,930 | |
| 2,800,000 | | Summit Academy North, MI Public School Academy1 | | | 5.000 | | | | 11/01/2035 | | | | 2,770,068 | |
| 13,735,000 | | Wayne, MI Charter County Airport Facilities (Northwest Airlines)1 | | | 6.000 | | | | 12/01/2029 | | | | 13,765,217 | |
| | | | | | | | | | | | | 145,491,635 | |
| | | | | | | | | | | | | | | |
| Minnesota—0.7% | | | | | | | | | | | | |
| 6,915,000 | | Brooklyn Center, MN Multifamily Hsg. (Sanctuary Brooklyn Center)1 | | | 5.500 | | | | 11/01/2035 | | | | 6,941,623 | |
| 3,115,000 | | Brooklyn Center, MN Multifamily Hsg. (Sanctuary Brooklyn Center)1 | | | 6.500 | | | | 11/01/2035 | | | | 3,116,557 | |
| 1,000,000 | | Dakota County, MN Community Devel. Agency (Walker Methodist)1 | | | 5.000 | | | | 08/01/2046 | | | | 1,017,240 | |
| 200,000 | | Inner Grove Heights, MN Nursing Home (Presbyterian Homes Bloomington Care Center)1 | | | 5.500 | | | | 10/01/2041 | | | | 200,092 | |
| 6,370,000 | | International Falls, MN Solid Waste Disposal (Boise Cascade Corp.)1 | | | 6.850 | | | | 12/01/2029 | | | | 6,399,748 | |
| 1,075,000 | | Minneapolis, MN Charter School (Spero Academy)7 | | | 6.250 | | | | 07/01/2037 | | | | 1,078,075 | |
| 4,740,000 | | Minneapolis, MN Charter School (Spero Academy)7 | | | 6.500 | | | | 07/01/2048 | | | | 4,753,367 | |
| 730,000 | | Minneapolis, MN Multifamily Hsg. (Blaisdell Apartments)1 | | | 5.400 | | | | 04/01/2028 | | | | 730,073 | |
| 5,340,000 | | Minneapolis, MN Multifamily Hsg. (Blaisdell Apartments)1 | | | 5.500 | | | | 04/01/2042 | | | | 5,339,947 | |
|
| 36 OPPENHEIMER ROCHESTER HIGH YIELD MUNICIPAL FUND |
| | | | | | | | | | | | | | |
Principal
Amount | | | | Coupon | | | Maturity | | | Value | |
| Minnesota (Continued) | | | | | | | | | |
| $1,515,000 | | St. Paul, MN Hsg. & Redevel. Authority (Bridgecreek Senior Place)1 | | | 7.000 | % | | | 09/15/2037 | | | $ | 1,516,045 | |
| 1,584,570 | | St. Paul, MN Hsg. & Redevel. Authority (Episcopal Nursing Home)1 | | | 5.630 | | | | 10/01/2033 | | | | 1,587,691 | |
| 2,417,000 | | St. Paul, MN Hsg. & Redevel. Authority (Great Northern Lofts)1 | | | 6.250 | | | | 03/01/2029 | | | | 2,417,000 | |
| 1,075,000 | | St. Paul, MN Hsg. & Redevel. Authority (Great River School)7 | | | 5.500 | | | | 07/01/2052 | | | | 1,078,193 | |
| 2,305,000 | | St. Paul, MN Hsg. & Redevel. Authority Charter School (Hmong College Prep Academy)1 | | | 5.500 | | | | 09/01/2043 | | | | 2,341,603 | |
| 385,000 | | Wadena, MN Hsg. & Redevel. Authority (Humphrey Manor East)1 | | | 6.000 | | | | 02/01/2019 | | | | 382,170 | |
| | | | | | | | | | | | | 38,899,424 | |
| | | | | | | | | | | | | | | |
| Mississippi—0.2% | | | | | | | | | | | | |
| 2,065,000 | | Meridian, MS Tax Increment (Meridian Crossroads)1 | | | 8.750 | | | | 12/01/2024 | | | | 2,250,602 | |
| 4,530,000 | | MS Business Finance Corp. (Mississippi Power Company)1 | | | 5.150 | 9 | | | 09/01/2028 | | | | 4,538,018 | |
| 1,395,000 | | Ridgeland, MS Tax Increment (Colony Park)1 | | | 5.250 | | | | 10/01/2027 | | | | 1,449,140 | |
| 1,755,000 | | Ridgeland, MS Tax Increment (Colony Park)1 | | | 5.375 | | | | 10/01/2028 | | | | 1,824,024 | |
| 16,410,000 | | Stonebridge, MS Public Improvement District Special Assessment3 | | | 7.500 | | | | 10/01/2042 | | | | 2,290,016 | |
| | | | | | | | | | | | | 12,351,800 | |
| | | | | | | | | | | | | | | |
| Missouri—1.2% | | | | | | | | | | | | |
| 4,900,000 | | Branson, MO Commerce Park Community Improvement District4 | | | 5.750 | | | | 06/01/2026 | | | | 734,804 | |
| 2,430,000 | | Branson, MO IDA (Branson Hills Redevel.) | | | 5.750 | | | | 05/01/2026 | | | | 2,437,339 | |
| 12,800,000 | | Branson, MO IDA (Branson Hills Redevel.) | | | 7.050 | | | | 05/01/2027 | | | | 12,814,592 | |
| 695,000 | | Branson, MO IDA (Branson Landing) | | | 5.250 | | | | 06/01/2021 | | | | 691,879 | |
| 2,470,000 | | Branson, MO IDA (Branson Landing) | | | 5.500 | | | | 06/01/2029 | | | | 2,425,614 | |
| 18,820,000 | | Branson, MO IDA (Branson Shoppe Redevel.)1 | | | 5.950 | | | | 11/01/2029 | | | | 18,839,949 | |
| 570,000 | | Broadway-Fairview, MO Transportation Devel. District (Columbia) | | | 6.125 | | | | 12/01/2036 | | | | 448,727 | |
| 1,005,000 | | Chillicothe, MO Tax Increment (South U.S. 65) | | | 5.500 | | | | 04/01/2021 | | | | 843,285 | |
| 3,100,000 | | Chillicothe, MO Tax Increment (South U.S. 65) | | | 5.625 | | | | 04/01/2027 | | | | 2,176,665 | |
| 1,120,000 | | Jennings, MO Tax Increment & Community Improvement (Northland Redevel. Area) | | | 5.000 | | | | 11/01/2023 | | | | 1,071,560 | |
| 1,000,000 | | Kansas City, MO IDA (Sales Tax)1 | | | 5.000 | | | | 04/01/2036 | | | | 964,870 | |
| 740,000 | | Kansas City, MO IDA (Sales Tax)1 | | | 5.000 | | | | 04/01/2046 | | | | 690,198 | |
| 1,161,000 | | Kansas City, MO IDA (West Paseo)1 | | | 6.750 | | | | 07/01/2036 | | | | 1,161,139 | |
| 1,200,000 | | Lees Summit, MO IDA (Kensington Farms)4 | | | 5.500 | | | | 03/01/2021 | | | | 775,644 | |
| 750,000 | | Lees Summit, MO IDA (Kensington Farms)4 | | | 5.750 | | | | 03/01/2029 | | | | 463,072 | |
| 2,800,000 | | Lees Summit, MO Tax (Summit Fair Community Improvement District)1 | | | 6.000 | | | | 05/01/2042 | | | | 2,842,196 | |
| 2,310,000 | | Liberty, MO Tax Increment (Liberty Triangle)1 | | | 5.875 | | | | 10/01/2029 | | | | 2,315,452 | |
| 3,020,000 | | MO Dardenne Town Square Transportation Devel. District4 | | | 5.000 | | | | 05/01/2026 | | | | 1,086,203 | |
|
| 37 OPPENHEIMER ROCHESTER HIGH YIELD MUNICIPAL FUND |
STATEMENT OF INVESTMENTS Continued
| | | | | | | | | | | | | | |
Principal
Amount | | | | Coupon | | | Maturity | | | Value | |
| Missouri (Continued) | | | | | | | | | |
| $3,825,000 | | MO Dardenne Town Square Transportation Devel. District4 | | | 5.000 | % | | | 05/01/2036 | | | $ | 1,375,738 | |
| 220,000 | | MO Grindstone Plaza Transportation Devel. District | | | 5.250 | | | | 10/01/2021 | | | | 216,014 | |
| 400,000 | | MO Grindstone Plaza Transportation Devel. District | | | 5.400 | | | | 10/01/2026 | | | | 378,752 | |
| 115,000 | | MO Grindstone Plaza Transportation Devel. District | | | 5.550 | | | | 10/01/2036 | | | | 102,364 | |
| 700,000 | | Northwoods, MO Transportation Devel. District | | | 5.850 | | | | 02/01/2031 | | | | 653,499 | |
| 2,750,000 | | Saint Charles County, MO IDA (Suemandy/Mid-Rivers Community Improvement District)1 | | | 5.000 | | | | 10/01/2046 | | | | 2,626,415 | |
| 4,580,000 | | St. Louis, MO IDA (Railway Exchange Building Redevel.)3 | | | 8.000 | | | | 04/27/2033 | | | | 1,600,252 | |
| 2,442,000 | | St. Louis, MO Tax Increment (1601 Washington Redevel.)4 | | | 6.000 | | | | 08/21/2026 | | | | 1,343,027 | |
| 2,032,491 | | St. Louis, MO Tax Increment (Pet Building Redevel.) | | | 5.500 | | | | 05/29/2028 | | | | 1,337,765 | |
| 1,660,000 | | St. Louis, MO Tax Increment (Printers Lofts)4 | | | 6.000 | | | | 08/21/2026 | | | | 663,519 | |
| 3,043,000 | | St. Louis, MO Tax Increment (Security Building Redevel.)4 | | | 6.300 | | | | 04/01/2027 | | | | 1,064,959 | |
| 1,510,000 | | St. Louis, MO Tax Increment (Washington East Condominiums)4 | | | 5.500 | | | | 01/20/2028 | | | | 905,955 | |
| 2,340,000 | | St. Louis, MO Tax Increment (Washington East Condominiums) | | | 5.500 | | | | 01/20/2028 | | | | 1,787,456 | |
| 1,108,000 | | St. Louis, MO Tax Increment Financing, Series A | | | 5.500 | | | | 09/02/2028 | | | | 664,833 | |
| 1,865,000 | | Stone Canyon, MO Improvement District (Infrastructure)3 | | | 5.700 | | | | 04/01/2022 | | | | 503,475 | |
| 975,000 | | Stone Canyon, MO Improvement District (Infrastructure)3 | | | 5.750 | | | | 04/01/2027 | | | | 263,211 | |
| | | | | | | | | | | | | 68,270,422 | |
| | | | | | | | | | | | | | | |
| Montana—0.0% | | | | | | | | | | | | |
| 5,935,000 | | Hardin, MT Tax Increment Industrial Infrastructure Devel. (Rocky Mountain Power)4 | | | 6.250 | 2 | | | 09/01/2031 | | | | 1,184,923 | |
| | | | | | | | | | | | | | | |
| Nebraska—0.4% | | | | | | | | | | | | |
| 405,000 | | Beatrice, NE Community Redevel. Authority (Beatrice Biodiesel)1 | | | 6.625 | | | | 12/01/2021 | | | | 387,156 | |
| 20,000,000 | | Douglas County, NE Hospital Authority (Methodist Health System)6 | | | 5.750 | | | | 11/01/2048 | | | | 21,206,571 | |
| 1,000,000 | | Omaha, NE Public Facilities Corp. (Omaha Baseball Stadium)1 | | | 4.000 | | | | 06/01/2031 | | | | 1,092,890 | |
| | | | | | | | | | | | | 22,686,617 | |
| | | | | | | | | | | | | | | |
| Nevada—0.1% | | | | | | | | | | | | |
| 5,375,000 | | Clark County, NV GO1 | | | 4.000 | | | | 11/01/2031 | | | | 5,917,983 | |
| 975,000 | | Clark County, NV Improvement District1 | | | 5.000 | | | | 02/01/2026 | | | | 953,501 | |
| 750,000 | | Clark County, NV Improvement District1 | | | 5.050 | | | | 02/01/2031 | | | | 727,440 | |
| 105,000 | | Mesquite, NV Special Improvement District (Canyon Creek)1,7 | | | 5.400 | | | | 08/01/2020 | | | | 102,881 | |
|
| 38 OPPENHEIMER ROCHESTER HIGH YIELD MUNICIPAL FUND |
| | | | | | | | | | | | | | |
Principal
Amount | | | | Coupon | | | Maturity | | | Value | |
| Nevada (Continued) | | | | | | | | | |
| $355,000 | | Mesquite, NV Special Improvement District (Canyon Creek)1,7 | | | 5.500 | % | | | 08/01/2025 | | | $ | 354,659 | |
| | | | | | | | | | | | | 8,056,464 | |
| | | | | | | | | | | | | | | |
| New Hampshire—0.1% | | | | | | | | | | | | |
| 1,395,000 | | NH Business Finance Authority (Huggins Hospital)1 | | | 6.875 | | | | 10/01/2039 | | | | 1,567,464 | |
| 100,000 | | NH H&EFA (Hillside Village) | | | 5.250 | | | | 07/01/2027 | | | | 101,697 | |
| 1,725,000 | | NH H&EFA (Hillside Village) | | | 6.125 | | | | 07/01/2037 | | | | 1,753,066 | |
| 3,875,000 | | NH H&EFA (Hillside Village) | | | 6.125 | | | | 07/01/2052 | | | | 3,858,144 | |
| 865,000 | | NH H&EFA (Hillside Village) | | | 6.250 | | | | 07/01/2042 | | | | 878,995 | |
| | | | | | | | | | | | | 8,159,366 | |
| | | | | | | | | | | | | | | |
| New Jersey—4.3% | | | | | | | | | | | | |
| 3,583,000 | | Newark, NJ GO1 | | | 5.000 | | | | 07/15/2029 | | | | 3,834,491 | |
| 5,000,000 | | NJ EDA1 | | | 5.000 | | | | 06/15/2041 | | | | 5,144,850 | |
| 110,000 | | NJ EDA (Continental Airlines)1 | | | 4.875 | | | | 09/15/2019 | | | | 115,855 | |
| 3,750,000 | | NJ EDA (Continental Airlines)1 | | | 5.625 | | | | 11/15/2030 | | | | 4,242,487 | |
| 565,000 | | NJ EDA (Leap Academy Charter School)1 | | | 6.000 | | | | 10/01/2034 | | | | 575,803 | |
| 750,000 | | NJ EDA (Leap Academy Charter School)1 | | | 6.200 | | | | 10/01/2044 | | | | 760,733 | |
| 500,000 | | NJ EDA (Leap Academy Charter School)1 | | | 6.300 | | | | 10/01/2049 | | | | 508,480 | |
| 1,000,000 | | NJ EDA (Paterson Charter School Science & Technology)1 | | | 6.100 | | | | 07/01/2044 | | | | 1,000,780 | |
| 650,000 | | NJ EDA (Provident Group-Kean Properties)1 | | | 5.000 | | | | 07/01/2047 | | | | 700,037 | |
| 1,000,000 | | NJ EDA (Provident Group-Kean Properties)1 | | | 5.000 | | | | 01/01/2050 | | | | 1,068,880 | |
| 5,000,000 | | NJ Educational Facilities Authority (College of St. Elizabeth)1 | | | 5.000 | | | | 07/01/2046 | | | | 5,050,850 | |
| 480,000 | | NJ Educational Facilities Authority (Georgian Court University)1 | | | 5.000 | | | | 07/01/2033 | | | | 480,710 | |
| 76,230,000 | | NJ Tobacco Settlement Financing Corp.1 | | | 4.750 | | | | 06/01/2034 | | | | 72,654,813 | |
| 51,680,000 | | NJ Tobacco Settlement Financing Corp.1 | | | 5.000 | | | | 06/01/2029 | | | | 51,461,910 | |
| 38,355,000 | | NJ Tobacco Settlement Financing Corp.1 | | | 5.000 | | | | 06/01/2041 | | | | 36,810,061 | |
| 9,500,000 | | NJ Transportation Trust Fund Authority1 | | | 5.000 | | | | 06/15/2029 | | | | 9,702,920 | |
| 10,200,000 | | NJ Transportation Trust Fund Authority1 | | | 5.000 | | | | 06/15/2030 | | | | 10,408,998 | |
| 43,465,000 | | NJ Transportation Trust Fund Authority1 | | | 5.000 | | | | 06/15/2031 | | | | 44,317,783 | |
| 210,000 | | Weehawken Township, NJ GO1 | | | 6.000 | | | | 08/01/2021 | | | | 234,982 | |
| 210,000 | | Weehawken Township, NJ GO1 | | | 6.000 | | | | 08/01/2022 | | | | 234,293 | |
| | | | | | | | | | | | | 249,309,716 | |
| | | | | | | | | | | | | | | |
| New Mexico—0.2% | | | | | | | | | | | | |
| 615,000 | | Boulders, NM Pubic Improvement District1 | | | 5.750 | | | | 10/01/2044 | | | | 622,048 | |
| 3,500,000 | | Farmington, NM Pollution Control (Public Service Company of New Mexico)1 | | | 2.125 | 9 | | | 06/01/2040 | | | | 3,539,305 | |
| 385,000 | | Mariposa East, NM Public Improvement District | | | 5.900 | 2 | | | 09/01/2032 | | | | 350,373 | |
| 560,000 | | Mariposa East, NM Public Improvement District | | | 5.900 | | | | 09/01/2032 | | | | 481,516 | |
| 80,000 | | Mariposa East, NM Public Improvement District1 | | | 5.900 | | | | 09/01/2032 | | | | 79,963 | |
| 475,000 | | Mariposa East, NM Public Improvement District | | | 12.495 | 5 | | | 09/01/2032 | | | | 66,415 | |
| 875,000 | | Montecito Estates, NM Public Improvement District1 | | | 7.000 | | | | 10/01/2037 | | | | 883,995 | |
| 1,925,000 | | NM Trails Public Improvement District | | | 7.750 | | | | 10/01/2038 | | | | 1,874,623 | |
|
| 39 OPPENHEIMER ROCHESTER HIGH YIELD MUNICIPAL FUND |
STATEMENT OF INVESTMENTS Continued
| | | | | | | | | | | | | | |
Principal
Amount | | | | Coupon | | | Maturity | | | Value | |
| New Mexico (Continued) | | | | | | | | | |
| $4,325,000 | | Saltillo, NM Improvement District1 | | | 7.625 | % | | | 10/01/2037 | | | $ | 4,398,741 | |
| | | | | | | | | | | | | 12,296,979 | |
| | | | | | | | | | | | | | | |
| New York—10.2% | | | | | | | | | | | | |
| 15,015,000 | | Brookhaven, NY IDA (BK at Lake Grove)1 | | | 7.750 | 9 | | | 11/01/2046 | | | | 15,962,747 | |
| 14,980,000 | | Brookhaven, NY IDA (BK at Lake Grove)1 | | | 7.750 | 9 | | | 11/01/2046 | | | | 15,921,793 | |
| 10,000,000 | | Brookhaven, NY IDA (BK at Lake Grove)1 | | | 7.750 | 9 | | | 11/01/2046 | | | | 10,628,700 | |
| 17,700,000 | | Erie County, NY Tobacco Asset Securitization Corp. | | | 5.630 | 5 | | | 06/01/2055 | | | | 854,025 | |
| 4,245,000 | | Essex County, NY IDA (Champlain Valley Milling Corp.) | | | 6.250 | | | | 06/01/2047 | | | | 4,320,264 | |
| 17,000,000 | | Glen Cove, NY Local Assistance Corp. (Gravies Point Public Improvement) | | | 0.000 | 2 | | | 01/01/2055 | | | | 12,531,210 | |
| 8,500,000 | | Hudson Yards, NY Infrastructure Corp.1 | | | 5.000 | | | | 02/15/2037 | | | | 10,020,735 | |
| 7,500,000 | | Hudson Yards, NY Infrastructure Corp.1 | | | 5.000 | | | | 02/15/2039 | | | | 8,814,450 | |
| 1,485,000 | | Islip, NY IDA (Engel Burman at Sayville)1 | | | 7.750 | 9 | | | 11/01/2045 | | | | 1,683,054 | |
| 1,000,000 | | Monroe County, NY Industrial Devel. Corp. (St. John Fisher College)1 | | | 6.000 | | | | 06/01/2030 | | | | 1,126,140 | |
| 2,937,408 | | Nassau County, NY IDA (Amsterdam at Harborside)3 | | | 2.000 | | | | 01/01/2049 | | | | 489,960 | |
| 1,197,880 | | Nassau County, NY IDA (Amsterdam at Harborside)1 | | | 5.500 | | | | 07/01/2020 | | | | 1,197,185 | |
| 187,500 | | Nassau County, NY IDA (Amsterdam at Harborside)1 | | | 5.875 | | | | 01/01/2023 | | | | 188,827 | |
| 922,500 | | Nassau County, NY IDA (Amsterdam at Harborside)1 | | | 6.500 | | | | 01/01/2032 | | | | 931,347 | |
| 1,780,000 | | Nassau County, NY IDA (Amsterdam at Harborside)1 | | | 6.700 | | | | 01/01/2049 | | | | 1,791,214 | |
| 2,100,000 | | Nassau County, NY IDA (Amsterdam at Harborside)1 | | | 6.700 | | | | 01/01/2049 | | | | 2,113,230 | |
| 234,000,000 | | NY Counties Tobacco Trust V | | | 6.732 | 5 | | | 06/01/2060 | | | | 1,839,240 | |
| 51,600,000 | | NY Counties Tobacco Trust V | | | 7.146 | 5 | | | 06/01/2060 | | | | 608,364 | |
| 9,300,000 | | NY MTA (Green Bond)1 | | | 5.000 | | | | 11/15/2035 | | | | 11,145,306 | |
| 7,000,000 | | NY MTA (Green Bond)1 | | | 5.000 | | | | 11/15/2047 | | | | 8,231,160 | |
| 10,000,000 | | NY MTA (Green Bond)1 | | | 5.250 | | | | 11/15/2057 | | | | 11,977,200 | |
| 8,200,000 | | NY MTA Hudson Rail Yards1 | | | 5.000 | | | | 11/15/2051 | | | | 9,037,138 | |
| 33,190,000 | | NY MTA Hudson Rail Yards1 | | | 5.000 | | | | 11/15/2056 | | | | 37,602,279 | |
| 10,000,000 | | NY MTA, Series B-21 | | | 5.000 | | | | 11/15/2033 | | | | 12,083,700 | |
| 15,000,000 | | NY MTA, Series B-21 | | | 5.250 | | | | 11/15/2033 | | | | 18,598,350 | |
| 485,000 | | NY MTA, Series D1 | | | 5.250 | | | | 11/15/2027 | | | | 587,476 | |
| 560,000 | | NY MTA, Series D1 | | | 5.250 | | | | 11/15/2028 | | | | 674,615 | |
| 900,000 | | NY MTA, Series D1 | | | 5.250 | | | | 11/15/2029 | | | | 1,074,744 | |
| 900,000 | | NY MTA, Series D1 | | | 5.250 | | | | 11/15/2030 | | | | 1,075,032 | |
| 900,000 | | NY MTA, Series D1 | | | 5.250 | | | | 11/15/2031 | | | | 1,072,314 | |
| 900,000 | | NY MTA, Series D1 | | | 5.250 | | | | 11/15/2032 | | | | 1,068,219 | |
| 900,000 | | NY MTA, Series D1 | | | 5.250 | | | | 11/15/2033 | | | | 1,064,718 | |
| 7,100,000 | | NYC IDA (Brooklyn Navy Yard Cogeneration Partners)1 | | | 5.650 | | | | 10/01/2028 | | | | 6,018,599 | |
| 6,045,000 | | NYC IDA (Brooklyn Navy Yard Cogeneration Partners)1 | | | 5.750 | | | | 10/01/2036 | | | | 4,991,054 | |
| 8,670,000 | | NYC IDA (Brooklyn Navy Yard Cogeneration Partners)1 | | | 6.200 | | | | 10/01/2022 | | | | 8,343,575 | |
| 2,985,000 | | NYC Municipal Water Finance Authority6 | | | 5.750 | | | | 06/15/2040 | | | | 3,115,234 | |
| 9,970,000 | | NYC Municipal Water Finance Authority6 | | | 5.750 | | | | 06/15/2040 | | | | 10,404,984 | |
| 5,430,000 | | NYC Transitional Finance Authority (Future Tax)1 | | | 4.000 | | | | 05/01/2031 | | | | 6,089,093 | |
| 6,110,000 | | NYC Transitional Finance Authority (Future Tax)1 | | | 5.000 | | | | 11/01/2029 | | | | 7,508,274 | |
| 1,360,000 | | NYC Transitional Finance Authority (Future Tax)1 | | | 5.000 | | | | 02/01/2032 | | | | 1,635,726 | |
| 7,000,000 | | NYC Transitional Finance Authority (Future Tax)1 | | | 5.000 | | | | 02/01/2035 | | | | 8,308,930 | |
| 75,000,000 | | NYC Transitional Finance Authority (Future Tax)6 | | | 5.000 | | | | 05/01/2042 | | | | 88,150,500 | |
|
40 OPPENHEIMER ROCHESTER HIGH YIELD MUNICIPAL FUND |
| | | | | | | | | | | | | | | | |
| Principal
Amount |
| | | | | Coupon | | | | Maturity | | | | Value | |
| | New York (Continued) | | | | | | | | | | | | |
| | $18,700,000 | | | NYS DA (St. Mary’s Hospital for Children) | | | 7.875% | | | | 11/15/2041 | | | $ | 20,218,814 | |
| | 10,000,000 | | | NYS DA (State Personal Income Tax Authority)1 | | | 5.000 | | | | 02/15/2032 | | | | 11,975,500 | |
| | 14,870,000 | | | NYS DA (State Personal Income Tax Authority)1 | | | 5.000 | | | | 03/15/2036 | | | | 17,562,957 | |
| | 10,000,000 | | | NYS DA (State Personal Income Tax Authority)6 | | | 5.000 | | | | 02/15/2037 | | | | 11,754,777 | |
| | 21,750,000 | | | NYS Liberty Devel. Corp. (4 World Trade Center)1 | | | 5.750 | | | | 11/15/2051 | | | | 25,129,297 | |
| | 37,380,000 | | | NYS Liberty Devel. Corp. (Bank of America Tower)6 | | | 5.125 | | | | 01/15/2044 | | | | 40,478,696 | |
| | 3,000,000 | | | NYS Thruway Authority1 | | | 5.000 | | | | 01/01/2036 | | | | 3,457,770 | |
| | 2,500,000 | | | NYS Transitional Devel. Corp. (LaGuardia Airport Terminal B Redevel.)1 | | | 5.000 | | | | 07/01/2034 | | | | 2,752,725 | |
| | 5,000,000 | | | NYS Transitional Devel. Corp. (LaGuardia Airport Terminal B Redevel.)1 | | | 5.000 | | | | 07/01/2041 | | | | 5,439,450 | |
| | 7,000,000 | | | NYS Transitional Devel. Corp. (LaGuardia Airport Terminal B Redevel.)1 | | | 5.250 | | | | 01/01/2050 | | | | 7,695,590 | |
| | 13,000,000 | | | NYS Transportation Devel. Corp. (American Airlines/JFK International Airport)1 | | | 5.000 | | | | 08/01/2026 | | | | 13,993,460 | |
| | 25,435,000 | | | NYS UDC (State Personal Income Tax Authority)1 | | | 5.000 | | | | 03/15/2033 | | | | 30,577,448 | |
| | 200,000 | | | Port Authority NY/NJ (JFK International Air Terminal)1 | | | 5.750 | | | | 12/01/2025 | | | | 202,372 | |
| | 1,650,000 | | | Port Authority NY/NJ (KIAC)1 | | | 6.750 | | | | 10/01/2019 | | | | 1,677,819 | |
| | 11,050,000 | | | Port Authority NY/NJ, 200th Series1 | | | 5.000 | | | | 04/15/2057 | | | | 12,766,065 | |
| | 13,000,000 | | | Port Authority NY/NJ, 205th Series1,7 | | | 5.000 | | | | 05/15/2057 | | | | 15,114,190 | |
| | 10,000,000 | | | Port Authority NY/NJ, 206th Series1,7 | | | 5.000 | | | | 11/15/2047 | | | | 11,523,400 | |
| | 8,385,000 | | | Suffolk, NY Tobacco Asset Securitization Corp. | | | 6.000 | | | | 06/01/2048 | | | | 8,388,522 | |
| | 1,640,000 | | | Yonkers, NY IDA (St. Joseph’s Hospital), Series 98-C | | | 6.200 | | | | 03/01/2020 | | | | 1,640,082 | |
| | | | | | | | | | | | | | | | |
| | | | | | | | | | | | | | | 593,229,639 | |
| | | | | | | | | | | | | | | | | |
| | North Carolina—0.2% | | | | | | | | | | | | |
| | 1,000,000 | | | Charlotte, NC Airport (Charlotte Douglas Airport)1 | | | 5.000 | | | | 07/01/2027 | | | | 1,248,250 | |
| | 1,000,000 | | | Charlotte, NC Airport (Charlotte Douglas Airport)1 | | | 5.000 | | | | 07/01/2029 | | | | 1,228,230 | |
| | 1,910,000 | | | Charlotte, NC Airport (Charlotte Douglas Airport)1 | | | 5.000 | | | | 07/01/2030 | | | | 2,332,721 | |
| | 1,360,000 | | | Charlotte, NC Airport (Charlotte Douglas Airport)1 | | | 5.000 | | | | 07/01/2031 | | | | 1,652,291 | |
| | 2,415,000 | | | Charlotte, NC Airport (Charlotte Douglas Airport)1 | | | 5.000 | | | | 07/01/2034 | | | | 2,889,548 | |
| | 1,500,000 | | | NC Medical Care Commission (AHACHC)1 | | | 5.800 | | | | 10/01/2034 | | | | 1,503,405 | |
| | 1,650,000 | | | NC Medical Care Commission (Whitestone)1 | | | 7.750 | | | | 03/01/2031 | | | | 1,818,960 | |
| | | | | | | | | | | | | | | | |
| | | | | | | | | | | | | | | 12,673,405 | |
| | | | | | | | | | | | | | | | | |
| | Ohio—9.3% | | | | | | | | | | | | |
| | 9,950,000 | | | Allen County, OH Hospital Facilities (Catholic Healthcare)6 | | | 5.000 | | | | 06/01/2038 | | | | 10,668,390 | |
| | 12,115,000 | | | Buckeye, OH Tobacco Settlement Financing Authority (TASC) | | | 5.125 | | | | 06/01/2024 | | | | 11,353,088 | |
| | 18,115,000 | | | Buckeye, OH Tobacco Settlement Financing Authority (TASC) | | | 5.375 | | | | 06/01/2024 | | | | 17,592,745 | |
| | 22,655,000 | | | Buckeye, OH Tobacco Settlement Financing Authority (TASC) | | | 5.750 | | | | 06/01/2034 | | | | 21,499,368 | |
| | 41,465,000 | | | Buckeye, OH Tobacco Settlement Financing Authority (TASC) | | | 5.875 | | | | 06/01/2030 | | | | 39,321,259 | |
| | 89,205,000 | | | Buckeye, OH Tobacco Settlement Financing Authority (TASC)1 | | | 5.875 | | | | 06/01/2047 | | | | 84,490,516 | |
|
| 41 OPPENHEIMER ROCHESTER HIGH YIELD MUNICIPAL FUND |
STATEMENT OF INVESTMENTS Continued
| | | | | | | | | | | | | | | | |
| Principal
Amount |
| | | | | Coupon | | | | Maturity | | | | Value | |
| | Ohio (Continued) | | | | | | | | | | | | |
| | $12,937,000 | | | Buckeye, OH Tobacco Settlement Financing Authority (TASC)1 | | | 6.000% | | | | 06/01/2042 | | | $ | 12,124,039 | |
| | 57,055,000 | | | Buckeye, OH Tobacco Settlement Financing Authority (TASC) | | | 6.250 2 | | | | 06/01/2037 | | | | 57,145,147 | |
| | 76,170,000 | | | Buckeye, OH Tobacco Settlement Financing Authority (TASC)1 | | | 6.500 | | | | 06/01/2047 | | | | 75,516,461 | |
| | 2,295,300,000 | | | Buckeye, OH Tobacco Settlement Financing Authority (TASC) | | | 6.529 5 | | | | 06/01/2052 | | | | 71,154,300 | |
| | 5,645,000 | | | Butler County, OH Port Authority (Maple Knoll Communities)1 | | | 7.000 | | | | 07/01/2043 | | | | 5,910,315 | |
| | 1,000,000 | | | Butler County, OH Port Authority (Storypoint/SL2016/ SLW/SLC/SLFW/SLF Obligated Group) | | | 6.250 | | | | 01/15/2034 | | | | 1,019,970 | |
| | 1,000,000 | | | Butler County, OH Port Authority (Storypoint/SL2016/ SLW/SLC/SLFW/SLF Obligated Group) | | | 6.375 | | | | 01/15/2043 | | | | 1,020,220 | |
| | 2,250,000 | | | Butler County, OH Port Authority (Storypoint/SL2016/ SLW/SLC/SLFW/SLF Obligated Group) | | | 6.500 | | | | 01/15/2052 | | | | 2,302,177 | |
| | 4,495,000 | | | Centerville, OH Health Care (Bethany Lutheran Village)1 | | | 6.000 | | | | 11/01/2038 | | | | 4,552,311 | |
| | 2,075,000 | | | Cleveland-Cuyahoga County, OH Port Authority (Forest Hill Park Apartments)1,4 | | | 5.250 | | | | 09/01/2040 | | | | 1,588,392 | |
| | 645,000 | | | Cleveland-Cuyahoga County, OH Port Authority (Forest Hill Park Apartments)1,4 | | | 5.375 | | | | 09/01/2045 | | | | 488,949 | |
| | 1,305,000 | | | Cleveland-Cuyahoga County, OH Port Authority (Forest Hill Park Apartments)1,4 | | | 5.500 | | | | 09/01/2050 | | | | 988,629 | |
| | 205,000 | | | Columbus-Franklin County, OH Finance Authority, Series A1 | | | 6.000 | | | | 05/15/2035 | | | | 206,109 | |
| | 11,550,000 | | | Cuyahoga County, OH Hospital (Metro Health System)1 | | | 5.500 | | | | 02/15/2052 | | | | 12,873,745 | |
| | 4,900,000 | | | Cuyahoga County, OH Hospital (Metro Health System)1 | | | 5.500 | | | | 02/15/2057 | | | | 5,449,094 | |
| | 31,400,000 | | | Gallia County, OH Hospital Facilities (Holzer/HHlthS/ HMCG/HMCJ Obligated Group) | | | 8.000 | | | | 07/01/2042 | | | | 36,233,402 | |
| | 1,450,000 | | | Hancock County, OH Hospital (BVRHC/BVHF Obligated Group)1 | | | 6.250 | | | | 12/01/2034 | | | | 1,643,546 | |
| | 105,000 | | | Lake County, OH Hospital Facilities (Lake Hospital System)1 | | | 5.750 | | | | 08/15/2038 | | | | 110,259 | |
| | 20,000 | | | Lake County, OH Hospital Facilities (Lake Hospital System)1 | | | 5.750 | | | | 08/15/2038 | | | | 20,797 | |
| | 435,000 | | | Lorain County, OH Port Authority (Alumalloy LLC)1 | | | 6.000 | | | | 11/15/2025 | | | | 432,042 | |
| | 10,000,000 | | | Montgomery County, OH (Miami Valley Hospital)6 | | | 5.750 | | | | 11/15/2023 | | | | 11,288,200 | |
| | 1,100,000 | | | Norwood, OH Special Obligation (Central Parke)1 | | | 6.000 | | | | 12/01/2046 | | | | 1,132,912 | |
| | 2,000,000 | | | OH Air Quality Devel. Authority (FirstEnergy Generation) | | | 3.100 9 | | | | 03/01/2023 | | | | 895,000 | |
| | 13,500,000 | | | OH Air Quality Devel. Authority (FirstEnergy Generation) | | | 3.750 9 | | | | 12/01/2023 | | | | 6,041,250 | |
| | 10,795,000 | | | OH Air Quality Devel. Authority (FirstEnergy Generation) | | | 4.250 9 | | | | 08/01/2029 | | | | 10,352,621 | |
| | 18,700,000 | | | OH Higher Educational Facility Commission (Hiram College)1 | | | 6.000 | | | | 10/01/2041 | | | | 18,950,954 | |
| | 16,320,000 | | | OH Port Authority of Columbiana Solid Waste (Apex Environmental)3,10 | | | 7.250 | | | | 08/01/2034 | | | | 390,048 | |
|
| 42 OPPENHEIMER ROCHESTER HIGH YIELD MUNICIPAL FUND |
| | | | | | | | | | | | | | | | |
| Principal
Amount |
| | | | | Coupon | | | | Maturity | | | | Value | |
| | Ohio (Continued) | | | | | | | | | | | | |
| | $2,235,822 | | | OH Port Authority of Columbiana Solid Waste (Apex Environmental)3,10 | | | 10.820% | | | | 08/01/2034 | | | $ | 53,436 | |
| | 1,500,000 | | | OH Water Devel. Authority (FirstEnergy Generation) | | | 3.000 | | | | 05/15/2019 | | | | 671,250 | |
| | 1,350,000 | | | Port of Greater Cincinnati, OH Devel. Authority (Public Parking Infrastructure) | | | 6.300 | | | | 02/15/2024 | | | | 1,311,755 | |
| | 2,500,000 | | | Port of Greater Cincinnati, OH Devel. Authority (Public Parking Infrastructure) | | | 6.400 | | | | 02/15/2034 | | | | 2,383,400 | |
| | 4,100,000 | | | Southeastern OH Port Authority Hospital Facility (Memorial Health System)1 | | | 5.750 | | | | 12/01/2032 | | | | 4,504,465 | |
| | 1,225,000 | | | Toledo-Lucas County, OH Port Authority (Storypoint/ SL2016/SLW/SLC Obligated Group) | | | 6.125 | | | | 01/15/2034 | | | | 1,251,840 | |
| | 1,700,000 | | | Toledo-Lucas County, OH Port Authority (Storypoint/ SL2016/SLW/SLC Obligated Group) | | | 6.375 | | | | 01/15/2051 | | | | 1,742,976 | |
| | 1,526,096 | | | Toledo-Lucas County, OH Port Authority (Town Square at Levis Commons)1 | | | 5.400 | | | | 11/01/2036 | | | | 1,526,096 | |
| | 382,899 | | | Toledo-Lucas County, OH Port Authority (Town Square at Levis Commons)3 | | | 5.400 | | | | 11/01/2036 | | | | 4 | |
| | 3,415,000 | | | Warren County, OH Port Authority (Corridor 75 Park) | | | 7.500 | | | | 12/01/2034 | | | | 3,492,691 | |
| | | | | | | | | | | | | | | | |
| | | | | | | | | | | | | | | 541,694,168 | |
| | | | | | | | | | | | | | | | | |
| | Oklahoma—0.2% | | | | | | | | | | | | |
| | 5,000,000 | | | Atoka County, OK Healthcare Authority (Atoka Memorial Hospital) | | | 6.625 | | | | 10/01/2037 | | | | 3,962,000 | |
| | 4,710,000 | | | Grady County, OK Criminal Justice Authority1 | | | 7.000 | | | | 11/01/2041 | | | | 4,473,511 | |
| | 100,000 | | | OK Ordnance Works Authority Sewer & Solid Waste Disposal Facilities (Ralston Purina Group)1 | | | 6.500 | | | | 09/01/2026 | | | | 100,305 | |
| | | | | | | | | | | | | | | | |
| | | | | | | | | | | | | | | 8,535,816 | |
| | | | | | | | | | | | | | | | | |
| | Oregon—0.1% | | | | | | | | | | | | |
| | 700,000 | | | OR Facilities Authority (Concordia University)1,7 | | | 6.125 | | | | 09/01/2030 | | | | 805,455 | |
| | 2,625,000 | | | OR Facilities Authority (Personalized Learning- Redmond Proficiency Academy)1 | | | 5.250 | | | | 06/15/2051 | | | | 2,649,334 | |
| | 1,640,000 | | | OR Facilities Authority (Personalized Learning- Redmond Proficiency Academy)1 | | | 5.750 | | | | 06/15/2046 | | | | 1,718,146 | |
| | | | | | | | | | | | | | | | |
| | | | | | | | | | | | | | | 5,172,935 | |
| | | | | | | | | | | | | | | | | |
| | Pennsylvania—2.5% | | | | | | | | | | | | |
| | 1,000,000 | | | Allegheny County, PA Sanitary Authority1 | | | 4.000 | | | | 12/01/2031 | | | | 1,089,780 | |
| | 2,155,000 | | | Allentown, PA Neighborhood Improvement Zone1 | | | 5.000 | | | | 05/01/2032 | | | | 2,292,834 | |
| | 5,385,000 | | | Allentown, PA Neighborhood Improvement Zone1 | | | 5.000 | | | | 05/01/2042 | | | | 5,624,094 | |
| | 22,300,000 | | | Beaver County, PA IDA (FirstEnergy Generation) | | | 4.500 9 | | | | 06/01/2028 | | | | 21,382,801 | |
| | 2,700,000 | | | Chester County, PA H&EFA (Immaculata University)1 | | | 7.000 | | | | 11/01/2041 | | | | 2,950,209 | |
| | 2,750,000 | | | Chester County, PA IDA (Collegium Charter School)1 | | | 5.250 | | | | 10/15/2047 | | | | 2,797,685 | |
| | 5,180,000 | | | Chester County, PA IDA (Hickman Friends Senior Community of West Chester) | | | 5.500 | | | | 01/01/2052 | | | | 5,120,534 | |
| | 2,750,000 | | | Crawford County, PA Hospital Authority (MMedC/ COHS/MMedCF/MPS/HCCO/TAHC/TAH/TAHCF/TAHS/ CVHC/HCrawC/FCIM Obligated Group) | | | 6.000 | | | | 06/01/2046 | | | | 2,890,085 | |
|
| 43 OPPENHEIMER ROCHESTER HIGH YIELD MUNICIPAL FUND |
STATEMENT OF INVESTMENTS Continued
| | | | | | | | | | | | | | | | |
| Principal
Amount |
| | | | | Coupon | | | | Maturity | | | | Value | |
| | Pennsylvania (Continued) | | | | | | | | | | | | |
| | $3,215,000 | | | Crawford County, PA Hospital Authority (MMedC/ COHS/MMedCF/MPS/HCCO/TAHC/TAH/TAHCF/TAHS/ CVHC/HCrawC/FCIM Obligated Group) | | | 6.000% | | | | 06/01/2051 | | | $ | 3,371,828 | |
| | 515,000 | | | Luzerne County, PA IDA1 | | | 7.500 | | | | 12/15/2019 | | | | 529,755 | |
| | 500,000 | | | Luzerne County, PA IDA1 | | | 7.750 | | | | 12/15/2027 | | | | 521,730 | |
| | 803,864 | | | Northampton County, PA IDA (Northampton Generating)4,8 | | | 5.000 | | | | 12/31/2023 | | | | 240,998 | |
| | 8,238,655 | | | Northampton County, PA IDA (Northampton Generating)4,8 | | | 5.000 | | | | 12/31/2023 | | | | 2,469,949 | |
| | 24,937,498 | | | PA EDFA (Bionol Clearfield)3 | | | 8.500 | | | | 07/01/2015 | | | | 4,346,107 | |
| | 15,000,000 | | | PA EDFA (FirstEnergy Generation) | | | 4.500 9 | | | | 06/01/2028 | | | | 14,383,350 | |
| | 11,500,000 | | | PA Geisinger Authority Health System, Series A6 | | | 5.250 | | | | 06/01/2039 | | | | 12,396,770 | |
| | 2,150,000 | | | PA GO1 | | | 4.000 | | | | 09/15/2031 | | | | 2,328,450 | |
| | 2,980,000 | | | PA GO1 | | | 4.000 | | | | 09/15/2032 | | | | 3,207,553 | |
| | 4,000,000 | | | PA HEFA (Shippensburg University)1 | | | 6.250 | | | | 10/01/2043 | | | | 4,426,080 | |
| | 3,000,000 | | | PA Public School Building Authority (School District of Philadelphia)1 | | | 5.000 | | | | 04/01/2030 | | | | 3,171,210 | |
| | 20,000,000 | | | PA State Public School Building Authority (Philadelphia School District)1 | | | 5.000 | | | | 06/01/2032 | | | | 22,582,600 | |
| | 1,500,000 | | | Philadelphia, PA Authority for Industrial Devel. (Architecture & Design Charter School)1 | | | 6.125 | | | | 03/15/2043 | | | | 1,579,470 | |
| | 885,000 | | | Philadelphia, PA Authority for Industrial Devel. (Green Woods Charter School)1 | | | 5.500 | | | | 06/15/2022 | | | | 940,782 | |
| | 2,000,000 | | | Philadelphia, PA Authority for Industrial Devel. (Green Woods Charter School)1 | | | 5.500 | | | | 06/15/2032 | | | | 2,066,200 | |
| | 2,390,000 | | | Philadelphia, PA Gas Works1 | | | 5.000 | | | | 10/01/2033 | | | | 2,752,921 | |
| | 3,350,000 | | | Philadelphia, PA H&HEFA (Temple University Health System)1 | | | 5.625 | | | | 07/01/2036 | | | | 3,617,966 | |
| | 5,250,000 | | | Philadelphia, PA H&HEFA (Temple University Health System)1 | | | 5.625 | | | | 07/01/2042 | | | | 5,652,885 | |
| | 785,000 | | | Reading, PA School District1,7 | | | 5.000 | | | | 03/01/2035 | | | | 903,119 | |
| | 720,000 | | | Reading, PA School District1,7 | | | 5.000 | | | | 03/01/2036 | | | | 826,423 | |
| | 5,680,000 | | | York, PA GO1 | | | 7.250 | | | | 11/15/2041 | | | | 6,208,240 | |
| | | | | | | | | | | | | | | | |
| | | | | | | | | | | | | | | 142,672,408 | |
| | | | | | | | | | | | | | | | | |
| | Rhode Island—0.3% | | | | | | | | | | | | |
| | 44,240,000 | | | Central Falls, RI Detention Facility4 | | | 7.250 | | | | 07/15/2035 | | | | 10,915,335 | |
| | 7,500,000 | | | RI Health & Educational Building Corp. (Public Schools Financing Program)1 | | | 6.000 | | | | 05/15/2029 | | | | 8,171,925 | |
| | | | | | | | | | | | | | | | |
| | | | | | | | | | | | | | | 19,087,260 | |
| | | | | | | | | | | | | | | | | |
| | South Carolina—0.7% | | | | | | | | | | | | |
| | 6,530,000 | | | Hardeeville, SC Assessment Revenue (Anderson Tract Municipal Improvement District) | | | 7.750 | | | | 11/01/2039 | | | | 6,625,077 | |
| | 13,531,000 | | | Richland County, SC Assessment Revenue (Village at Sandhill Improvement District) | | | 6.200 | | | | 11/01/2036 | | | | 13,521,799 | |
| | 7,174,927 | | | SC Connector 2000 Assoc. Toll Road, Series B | | | 2.887 5 | | | | 01/01/2020 | | | | 5,718,991 | |
| | 191,763 | | | SC Connector 2000 Assoc. Toll Road, Series B | | | 6.295 5 | | | | 01/01/2026 | | | | 93,500 | |
| | 8,105,757 | | | SC Connector 2000 Assoc. Toll Road, Series B | | | 6.619 5 | | | | 01/01/2024 | | | | 4,629,927 | |
|
| 44 OPPENHEIMER ROCHESTER HIGH YIELD MUNICIPAL FUND |
| | | | | | | | | | | | | | | | |
| Principal
Amount |
| | | | | Coupon | | | | Maturity | | | | Value | |
| | South Carolina (Continued) | | | | | | | | | | | | |
| | $5,070,000 | | | SC Public Service Authority (Santee Cooper)1 | | | 5.000% | | | | 12/01/2029 | | | $ | 5,567,772 | |
| | 6,465,000 | | | SC Public Service Authority (Santee Cooper)1 | | | 5.500 | | | | 12/01/2033 | | | | 7,332,862 | |
| | | | | | | | | | | | | | | | |
| | | | | | | | | | | | | | | 43,489,928 | |
| | | | | | | | | | | | | | | | | |
| | South Dakota—0.0% | | | | | | | | | | | | |
| | 1,425,000 | | | Turner County, SD Tax Increment1 | | | 5.000 | | | | 12/15/2026 | | | | 1,391,285 | |
| | | | | | | | | | | | | | | | | |
| | Tennessee—0.5% | | | | | | | | | | | | |
| | 1,000,000 | | | Bristol, TN Industrial Devel. Board | | | 5.022 5 | | | | 12/01/2022 | | | | 799,460 | |
| | 10,340,000 | | | Chattanooga, TN HE&HFB (Catholic Health Initiatives)1 | | | 1.260 9 | | | | 05/01/2039 | | | | 10,340,000 | |
| | 9,000,000 | | | Shelby County, TN HE&HFB (Trezevant Manor) | | | 5.500 | | | | 09/01/2047 | | | | 9,371,880 | |
| | 6,350,000 | | | Shelby County, TN HE&HFB (Trezevant Manor)7 | | | 8.000 | | | | 09/01/2044 | | | | 6,793,547 | |
| | | | | | | | | | | | | | | | |
| | | | | | | | | | | | | | | 27,304,887 | |
| | | | | | | | | | | | | | | | | |
| | Texas—10.4% | | | | | | | | | | | | |
| | 1,000,000 | | | Abilene, TX GO1 | | | 4.000 | | | | 02/15/2033 | | | | 1,065,280 | |
| | 2,040,000 | | | Anson, TX Education Facilities Corp. (Arlington Classics Academy)1 | | | 5.000 | | | | 08/15/2045 | | | | 2,069,600 | |
| | 1,325,000 | | | Arlington, TX Higher Education Finance Corp. (Leadership Prep School)1 | | | 5.000 | | | | 06/15/2046 | | | | 1,326,868 | |
| | 700,000 | | | Aubrey, TX Special Assessment (Jackson Ridge Public Improvement District No. 1)1 | | | 7.250 | | | | 09/01/2045 | | | | 702,660 | |
| | 230,000 | | | Beaumont, TX Multifamily HDC (Madison on the Lake Apartments)1 | | | 7.750 | | | | 12/01/2028 | | | | 219,473 | |
| | 41,315,000 | | | Brazos River Authority, TX Pollution Control (TXU Energy Company)3,10 | | | 5.000 | | | | 03/01/2041 | | | | — | |
| | 13,500,000 | | | Brazos River Authority, TX Pollution Control (TXU Energy Company)3,10 | | | 5.400 | | | | 05/01/2029 | | | | — | |
| | 2,345,000 | | | Brazos River Authority, TX Pollution Control (TXU Energy Company)3,10 | | | 6.300 | | | | 07/01/2032 | | | | — | |
| | 11,420,000 | | | Brazos River Authority, TX Pollution Control (TXU Energy Company)3,10 | | | 6.750 | | | | 10/01/2038 | | | | — | |
| | 10,000,000 | | | Brazos River Authority, TX Pollution Control (TXU Energy Company)3,10 | | | 7.700 | | | | 03/01/2032 | | | | — | |
| | 26,120,000 | | | Brazos River Authority, TX Pollution Control (TXU Energy Company)3,10 | | | 7.700 | | | | 04/01/2033 | | | | — | |
| | 1,925,000 | | | Brushy Creek, TX Regional Utility Authority1 | | | 4.000 | | | | 08/01/2030 | | | | 2,133,092 | |
| | 2,000,000 | | | Brushy Creek, TX Regional Utility Authority1 | | | 4.000 | | | | 08/01/2031 | | | | 2,193,940 | |
| | 2,000,000 | | | Brushy Creek, TX Regional Utility Authority1 | | | 4.000 | | | | 08/01/2032 | | | | 2,177,300 | |
| | 1,755,000 | | | Brushy Creek, TX Regional Utility Authority1 | | | 4.000 | | | | 08/01/2033 | | | | 1,893,241 | |
| | 15,350,000 | | | Cambridge, TX Student Hsg. (Cambridge Student Hsg. Devel.) | | | 7.000 | | | | 11/01/2039 | | | | 14,976,381 | |
| | 675,000 | | | Celina, TX Special Assessment7 | | | 5.375 | | | | 09/01/2028 | | | | 665,833 | |
| | 400,000 | | | Celina, TX Special Assessment | | | 5.500 | | | | 09/01/2032 | | | | 393,304 | |
| | 1,100,000 | | | Celina, TX Special Assessment | | | 5.875 | | | | 09/01/2040 | | | | 1,077,362 | |
| | 1,895,000 | | | Celina, TX Special Assessment1 | | | 6.250 | | | | 09/01/2045 | | | | 1,929,754 | |
| | 4,020,000 | | | Celina, TX Special Assessment | | | 7.500 | | | | 09/01/2045 | | | | 4,224,095 | |
| | 1,000,000 | | | Celina, TX Special Assessment (Sutton Fields II) | | | 7.250 | | | | 09/01/2045 | | | | 1,009,810 | |
|
| 45 OPPENHEIMER ROCHESTER HIGH YIELD MUNICIPAL FUND |
STATEMENT OF INVESTMENTS Continued
| | | | | | | | | | | | | | |
Principal Amount | | | | Coupon | | | Maturity | | | Value | |
| Texas (Continued) | | | | | | | | | | | | |
| $750,000 | | Clifton, TX Higher Education Finance Corp. (Idea Public Schools)1 | | | 5.750 | % | | | 08/15/2041 | | | $ | 811,567 | �� |
| 1,250,000 | | Crane, TX Independent School District1 | | | 5.000 | | | | 02/15/2030 | | | | 1,253,500 | |
| 3,270,000 | | Dallas County, TX Community College District1 | | | 5.000 | | | | 02/15/2025 | | | | 4,024,683 | |
| 3,440,000 | | Dallas County, TX Community College District1 | | | 5.000 | | | | 02/15/2026 | | | | 4,270,416 | |
| 3,610,000 | | Dallas County, TX Community College District1 | | | 5.000 | | | | 02/15/2027 | | | | 4,522,680 | |
| 9,405,000 | | El Paso, TX GO1 | | | 4.000 | | | | 08/15/2029 | | | | 10,404,846 | |
| 1,500,000 | | Flower Mound, TX Special Assessment (River Walk Public Improvement District No. 1)1 | | | 6.125 | | | | 09/01/2028 | | | | 1,570,275 | |
| 1,500,000 | | Flower Mound, TX Special Assessment (River Walk Public Improvement District No. 1)1 | | | 6.500 | | | | 09/01/2036 | | | | 1,560,030 | |
| 2,000,000 | | Flower Mound, TX Special Assessment (River Walk Public Improvement District No. 1)1 | | | 6.750 | | | | 09/01/2043 | | | | 2,065,920 | |
| 2,250,000 | | Galveston, TX Special Assessment7 | | | 5.625 | | | | 09/01/2028 | | | | 2,184,053 | |
| 3,700,000 | | Galveston, TX Special Assessment | | | 6.000 | | | | 09/01/2038 | | | | 3,541,307 | |
| 3,500,000 | | Galveston, TX Special Assessment | | | 6.125 | | | | 09/01/2044 | | | | 3,292,100 | |
| 10,000,000 | | Grand Parkway, TX Transportation Corp.6 | | | 5.000 | | | | 04/01/2053 | | | | 11,423,200 | |
| 11,238,709 | | Gulf Coast, TX IDA (Microgy Holdings)3 | | | 7.000 | | | | 12/01/2036 | | | | 112 | |
| 20,000 | | Gulf Coast, TX IDA Solid Waste (Citgo Petroleum Corp.)1 | | | 8.000 | | | | 04/01/2028 | | | | 19,996 | |
| 3,225,000 | | Harris County, TX Cultural Education Facilities Finance Corp. (Space Center Houston)1 | | | 7.000 | | | | 08/15/2028 | | | | 3,427,111 | |
| 435,000 | | Houston, TX Higher Education Finance Corp. (Cosmos Foundation)1 | | | 6.500 | | | | 05/15/2031 | | | | 521,221 | |
| 380,000 | | Houston, TX Higher Education Finance Corp. (Cosmos Foundation)1 | | | 6.500 | | | | 05/15/2031 | | | | 453,602 | |
| 500,000 | | Houston, TX Higher Education Finance Corp. (Ninos)1 | | | 6.000 | | | | 08/15/2036 | | | | 529,515 | |
| 750,000 | | Houston, TX Higher Education Finance Corp. (Ninos)1 | | | 6.000 | | | | 08/15/2041 | | | | 792,285 | |
| 425,000 | | Leander, TX Special Assesment (Oak Creek Public Improvement District)1,7 | | | 5.375 | | | | 09/01/2028 | | | | 423,785 | |
| 600,000 | | Leander, TX Special Assesment (Oak Creek Public Improvement District)1 | | | 5.750 | | | | 09/01/2038 | | | | 597,426 | |
| 600,000 | | Leander, TX Special Assesment (Oak Creek Public Improvement District)1 | | | 5.875 | | | | 09/01/2044 | | | | 597,144 | |
| 450,000 | | Mclendon-Chisholm, TX Special Assessment (Sonoma Public Improvement District)1 | | | 5.375 | | | | 09/15/2035 | | | | 446,117 | |
| 400,000 | | Mclendon-Chisholm, TX Special Assessment (Sonoma Public Improvement District)1 | | | 5.500 | | | | 09/15/2040 | | | | 396,100 | |
| 8,750,000 | | Mission, TX EDC (Carbonlite Recycling) | | | 6.500 | | | | 12/01/2033 | | | | 8,468,163 | |
| 24,970,000 | | Mission, TX EDC (Natgasoline)1 | | | 5.750 | | | | 10/01/2031 | | | | 26,157,573 | |
| 13,000,000 | | Mission, TX EDC (Natgasoline)1 | | | 5.750 | | | | 10/01/2031 | | | | 13,618,280 | |
| 700,000 | | New Hope, TX Cultural Educational Facilities Finance Corp. (East Grand Preparatory Academy)1 | | | 5.500 | | | | 08/15/2046 | | | | 708,848 | |
| 1,200,000 | | New Hope, TX Cultural Educational Facilities Finance Corp. (East Grand Preparatory Academy)1 | | | 5.500 | | | | 08/15/2051 | | | | 1,213,104 | |
| 2,085,000 | | New Hope, TX Cultural Educational Facilities Finance Corp. (Jubilee Academic Center)1 | | | 5.125 | | | | 08/15/2047 | | | | 2,098,156 | |
|
| 46 OPPENHEIMER ROCHESTER HIGH YIELD MUNICIPAL FUND |
| | | | | | | | | | | | | | |
Principal Amount | | | | Coupon | | | Maturity | | | Value | |
| Texas (Continued) | | | | | | | | | | | | |
| $350,000 | | New Hope, TX Cultural Educational Facilities Finance Corp. Senior Living (Cardinal Bay-Village on the Park Carriage Inn)1 | | | 5.000 | % | | | 07/01/2031 | | | $ | 402,038 | |
| 1,750,000 | | New Hope, TX Cultural Educational Facilities Finance Corp. Senior Living (Cardinal Bay-Village on the Park Carriage Inn)1 | | | 5.000 | | | | 07/01/2046 | | | | 1,943,865 | |
| 1,750,000 | | New Hope, TX Cultural Educational Facilities Finance Corp. Senior Living (Cardinal Bay-Village on the Park Carriage Inn)1 | | | 5.000 | | | | 07/01/2051 | | | | 1,939,455 | |
| 400,000 | | New Hope, TX Cultural Educational Facilities Finance Corp. Senior Living (MRC Senior Living-Langford Project) | | | 5.375 | | | | 11/15/2036 | | | | 386,004 | |
| 650,000 | | New Hope, TX Cultural Educational Facilities Finance Corp. Senior Living (MRC Senior Living-Langford Project) | | | 5.500 | | | | 11/15/2046 | | | | 622,174 | |
| 1,000,000 | | New Hope, TX Cultural Educational Facilities Finance Corp. Senior Living (MRC Senior Living-Langford Project) | | | 5.500 | | | | 11/15/2052 | | | | 940,110 | |
| 1,250,000 | | New Hope, TX Cultural Educational Facilities Finance Corp. Student Hsg. (A&M University-Collegiate Hsg. Corpus Christi II)1 | | | 5.000 | | | | 04/01/2048 | | | | 1,341,675 | |
| 2,315,000 | | New Hope, TX Cultural Educational Facilities Finance Corp. Student Hsg. (A&M University-Collegiate Hsg. San Antonio)1 | | | 5.000 | | | | 04/01/2048 | | | | 2,477,768 | |
| 1,300,000 | | New Hope, TX Educational Facilities Finance Corp. Retirement Facility (Wesleyan Homes) | | | 5.500 | | | | 01/01/2049 | | | | 1,339,000 | |
| 785,000 | | New Hope, TX Educational Facilities Finance Corp. Student Hsg. (Stephenville-Tarleton State University)1 | | | 5.875 | | | | 04/01/2036 | | | | 888,651 | |
| 1,950,000 | | New Hope, TX Educational Facilities Finance Corp. Student Hsg. (Stephenville-Tarleton State University)1 | | | 6.000 | | | | 04/01/2045 | | | | 2,215,668 | |
| 1,475,000 | | Newark, TX Higher Education Finance Corp. (A+ Charter Schools)1 | | | 5.750 | | | | 08/15/2045 | | | | 1,509,235 | |
| 1,600,000 | | North Central TX HFC (Village Kaufman Apartments)1 | | | 6.150 | 9 | | | 01/01/2043 | | | | 1,658,576 | |
| 38,000,000 | | North Central TX HFDC (Children’s Medical Center)6 | | | 5.750 | | | | 08/15/2039 | | | | 41,062,800 | |
| 5,195,000 | | North TX Tollway Authority6 | | | 5.750 | | | | 01/01/2048 | | | | 5,296,199 | |
| 14,060,000 | | North TX Tollway Authority6 | | | 5.750 | | | | 01/01/2048 | | | | 14,333,889 | |
| 725,000 | | North TX Tollway Authority6 | | | 5.750 | | | | 01/01/2048 | | | | 739,123 | |
| 1,940,000 | | North TX Tollway Authority6 | | | 5.750 | | | | 01/01/2048 | | | | 1,977,791 | |
| 655,000 | | Pottsboro, TX Higher Education Finance Corp. (Imagine International Academy of North Texas)1 | | | 5.000 | | | | 08/15/2036 | | | | 667,871 | |
| 1,000,000 | | Pottsboro, TX Higher Education Finance Corp. (Imagine International Academy of North Texas)1 | | | 5.000 | | | | 08/15/2046 | | | | 1,010,350 | |
| 2,000,000 | | Red River, TX Educational Finance Corp. (Houston Baptist University)1 | | | 5.500 | | | | 10/01/2046 | | | | 2,231,960 | |
| 3,000,000 | | Red River, TX Health Facilities Devel. Corp. (Happy Harbor Methodist Home) | | | 8.000 | | | | 11/15/2049 | | | | 3,458,850 | |
| 750,000 | | Rowlett, TX Special Assessment (Bayside Public Improvement District) | | | 6.000 | | | | 09/15/2046 | | | | 738,578 | |
| 2,050,000 | | Sabine Neches, TX HFC (Fox Run Apartments)1 | | | 6.150 | | | | 01/01/2043 | | | | 2,108,774 | |
|
| 47 OPPENHEIMER ROCHESTER HIGH YIELD MUNICIPAL FUND |
STATEMENT OF INVESTMENTS Continued
| | | | | | | | | | | | | | |
Principal Amount | | | | Coupon | | | Maturity | | | Value | |
| Texas (Continued) | | | | | | | | | | | | |
| $4,100,000 | | Sabine River Authority, TX Pollution Control (TXU Electric Company)3,10 | | | 6.150 | % | | | 08/01/2022 | | | $ | — | |
| 1,800,000 | | Sabine River Authority, TX Pollution Control (TXU Electric Company)3,10 | | | 6.450 | | | | 06/01/2021 | | | | — | |
| 10,000,000 | | San Jacinto, TX Community College District6 | | | 5.125 | | | | 02/15/2038 | | | | 10,229,700 | |
| 26,820,000 | | Sanger, TX Industrial Devel. Corp. (Texas Pellets)3 | | | 7.500 | | | | 07/01/2038 | | | | 7,607,493 | |
| 7,935,000 | | Tarrant County, TX Cultural Education Facilities Finance Corp. (Baylor Health Care System)6 | | | 5.750 | | | | 11/15/2024 | | | | 8,427,201 | |
| 32,600,000 | | Tarrant County, TX Cultural Education Facilities Finance Corp. (Baylor Health Care System)6 | | | 6.250 | | | | 11/15/2029 | | | | 34,830,492 | |
| 3,810,000 | | Tarrant County, TX Cultural Education Facilities Finance Corp. (Buckingham Senior Living Community)1 | | | 5.750 | | | | 11/15/2037 | | | | 3,824,440 | |
| 3,500,000 | | Tarrant County, TX Cultural Education Facilities Finance Corp. (Buckner Senior Living Ventana) | | | 6.750 | | | | 11/15/2047 | | | | 3,750,705 | |
| 2,000,000 | | Tarrant County, TX Cultural Education Facilities Finance Corp. (Buckner Senior Living Ventana) | | | 6.750 | | | | 11/15/2052 | | | | 2,135,540 | |
| 13,500,000 | | Tarrant County, TX Health Facilities Devel. Corp. (Cook Childrens Medical Center)6 | | | 5.000 | | | | 12/01/2033 | | | | 14,576,220 | |
| 27,525,000 | | Travis County, TX HFDC (Longhorn Village)1 | | | 7.125 | | | | 01/01/2046 | | | | 29,765,535 | |
| 10,000,000 | | Trinity River Authority, TX Central Regional Wastewater System1 | | | 5.000 | | | | 08/01/2028 | | | | 12,485,000 | |
| 2,000,000 | | Trinity River Authority, TX Central Regional Wastewater System1 | | | 5.000 | | | | 08/01/2030 | | | | 2,453,400 | |
| 1,000,000 | | Trinity River Authority, TX Central Regional Wastewater System1 | | | 5.000 | | | | 08/01/2031 | | | | 1,218,510 | |
| 1,000,000 | | Trinity River Authority, TX Central Regional Wastewater System1 | | | 5.000 | | | | 08/01/2032 | | | | 1,211,610 | |
| 1,000,000 | | Trinity River Authority, TX Central Regional Wastewater System1 | | | 5.000 | | | | 08/01/2033 | | | | 1,205,740 | |
| 1,000,000 | | Trinity River Authority, TX Central Regional Wastewater System1 | | | 5.000 | | | | 08/01/2034 | | | | 1,200,880 | |
| 2,000,000 | | Trinity River Authority, TX Central Regional Wastewater System1 | | | 5.000 | | | | 08/01/2035 | | | | 2,395,940 | |
| 1,000,000 | | Trinity River Authority, TX Central Regional Wastewater System1 | | | 5.000 | | | | 08/01/2037 | | | | 1,193,140 | |
| 2,495,000 | | Trinity River Authority, TX Pollution Control (TXU Electric Company)3,10 | | | 6.250 | | | | 05/01/2028 | | | | — | |
| 19,800,000 | | Trophy Club, TX Public Improvement (Highlands Trophy Club)1 | | | 7.750 | | | | 10/01/2037 | | | | 20,021,562 | |
| 34,600,000 | | TX Angelina & Neches River Authority (Aspen Power)3 | | | 6.500 | | | | 11/01/2029 | | | | 346 | |
| 20,000,000 | | TX GO1 | | | 5.000 | | | | 10/01/2030 | | | | 24,711,600 | |
| 117,760,000 | | TX Municipal Gas Acquisition & Supply Corp.1 | | | 6.250 | | | | 12/15/2026 | | | | 143,230,310 | |
| 900,000 | | TX Public Finance Authority Charter School Finance Corp. (Ed-Burnham Wood)1 | | | 6.250 | | | | 09/01/2036 | | | | 909,990 | |
| 525,000 | | TX Student Hsg. Corp. (University of North Texas)1 | | | 6.750 | | | | 07/01/2021 | | | | 524,995 | |
| 200,000 | | TX Student Hsg. Corp. (University of North Texas)1 | | | 6.850 | | | | 07/01/2031 | | | | 199,346 | |
| 8,500,000 | | TX Water Devel. Board1 | | | 4.000 | | | | 10/15/2030 | | | | 9,440,015 | |
| 10,000,000 | | TX Water Devel. Board1 | | | 5.000 | | | | 10/15/2041 | | | | 11,778,400 | |
| 2,076,000 | | Vintage Township, TX Public Facilities Corp.1 | | | 7.375 | | | | 10/01/2038 | | | | 2,116,005 | |
|
| 48 OPPENHEIMER ROCHESTER HIGH YIELD MUNICIPAL FUND |
| | | | | | | | | | | | | | |
Principal Amount | | | | Coupon | | | Maturity | | | Value | |
| Texas (Continued) | | | | | | | | | | | | |
| $6,375,000 | | Waxahachie, TX Special Assessment | | | 6.000 | % | | | 08/15/2045 | | | $ | 6,272,873 | |
| 2,920,000 | | Wise County, TX (Parket County Junior College District)1 | | | 7.500 | | | | 08/15/2025 | | | | 3,348,014 | |
| 4,615,000 | | Wise County, TX (Parket County Junior College District)1 | | | 7.750 | | | | 08/15/2028 | | | | 5,304,527 | |
| | | | | | | | | | | | | 607,111,041 | |
| | | | | | | | | | | | | | | |
| Utah—0.4% | | | | | | | | | | | | | | |
| 1,765,000 | | Hideout, UT Local District No. 1 Special Assessment7 | | | 7.750 | | | | 08/01/2024 | | | | 1,776,031 | |
| 4,915,000 | | Hideout, UT Local District No. 1 Special Assessment | | | 8.250 | | | | 08/01/2034 | | | | 4,942,377 | |
| 605,000 | | UT Charter School Finance Authority (Endeavor Hall)1 | | | 5.500 | | | | 07/15/2022 | | | | 631,317 | |
| 1,750,000 | | UT Charter School Finance Authority (Endeavor Hall)1 | | | 6.000 | | | | 07/15/2032 | | | | 1,811,967 | |
| 3,870,000 | | UT Charter School Finance Authority (Endeavor Hall)1 | | | 6.250 | | | | 07/15/2042 | | | | 4,016,325 | |
| 6,550,000 | | UT Charter School Finance Authority (Hawthorn Academy)1 | | | 8.250 | | | | 07/15/2046 | | | | 7,131,050 | |
| 750,000 | | UT Charter School Finance Authority (Vista Entrada School of Performing Arts & Technology)1 | | | 6.300 | | | | 07/15/2032 | | | | 817,410 | |
| 1,640,000 | | UT Charter School Finance Authority (Vista Entrada School of Performing Arts & Technology)1 | | | 6.550 | | | | 07/15/2042 | | | | 1,791,684 | |
| 825,000 | | Utah County, UT Charter School (Renaissance Academy)1 | | | 5.625 | | | | 07/15/2037 | | | | 825,198 | |
| 415,000 | | Utah County, UT Charter School (Ronald Wilson Reagan Academy)1 | | | 5.000 | | | | 02/15/2036 | | | | 425,425 | |
| 855,000 | | Utah County, UT Charter School (Ronald Wilson Reagan Academy)1 | | | 5.000 | | | | 02/15/2046 | | | | 868,082 | |
| | | | | | | | | | | | | 25,036,866 | |
| | | | | | | | | | | | | | | |
| Virginia—1.1% | | | | | | | | | | | | |
| 1,649,000 | | Celebrate, VA North CDA Special Assessment4 | | | 6.750 | | | | 03/01/2034 | | | | 1,064,364 | |
| 4,562,000 | | Celebrate, VA South CDA Special Assessment3 | | | 6.250 | | | | 03/01/2037 | | | | 2,280,635 | |
| 8,000,000 | | Chesapeake Bay, VA Bridge & Tunnel District1 | | | 5.000 | | | | 07/01/2046 | | | | 9,026,480 | |
| 14,300,000 | | Farms New Kent, VA Community Devel. Authority Special Assessment4 | | | 5.125 | | | | 03/01/2036 | | | | 3,575,000 | |
| 9,200,000 | | Farms New Kent, VA Community Devel. Authority Special Assessment4 | | | 5.450 | | | | 03/01/2036 | | | | 2,300,000 | |
| 3,206,000 | | Farms New Kent, VA Community Devel. Authority Special Assessment4 | | | 5.800 | | | | 03/01/2036 | | | | 801,500 | |
| 622,000 | | Lewistown, VA Commerce Center Community Devel. Authority1 | | | 6.050 | | | | 03/01/2044 | | | | 598,998 | |
| 1,278,000 | | Lewistown, VA Commerce Center Community Devel. Authority | | | 6.050 | | | | 03/01/2044 | | | | 1,176,028 | |
| 1,995,000 | | Lewistown, VA Commerce Center Community Devel. Authority4 | | | 6.050 | | | | 03/01/2054 | | | | 297,215 | |
| 2,900,000 | | New Port, VA CDA3 | | | 5.600 | | | | 09/01/2036 | | | | 1,448,521 | |
| 1,945,000 | | Norfolk, VA EDA, Series A | | | 6.000 | | | | 11/01/2036 | | | | 1,801,265 | |
| 18,446,000 | | Peninsula, VA Town Center Community Devel. Authority Special Obligation1 | | | 6.450 | | | | 09/01/2037 | | | | 18,466,106 | |
| 2,160,000 | | Richmond, VA Redevel. & Hsg. Authority (American Tobacco Apartments)1 | | | 5.550 | | | | 01/01/2037 | | | | 2,172,463 | |
|
| 49 OPPENHEIMER ROCHESTER HIGH YIELD MUNICIPAL FUND |
STATEMENT OF INVESTMENTS Continued
| | | | | | | | | | | | | | |
Principal Amount | | | | Coupon | | | Maturity | | | Value | |
| Virginia (Continued) | | | | | | | | | | | | |
| $233,700,000 | | VA Tobacco Settlement Financing Corp. | | | 7.470 | %5 | | | 06/01/2047 | | | $ | 20,215,050 | |
| 2,404,674 | | West Point, VA IDA Solid Waste (Chesapeake Corp.)3 | | | 6.375 | | | | 03/01/2019 | | | | 24 | |
| | | | | | | | | | | | | 65,223,649 | |
| | | | | | | | | | | | | | | |
| Washington—2.0% | | | | | | | | | | | | |
| 750,000 | | Greater Wenatchee, WA Regional Events Center1 | | | 5.000 | | | | 09/01/2027 | | | | 782,940 | |
| 200,000 | | Kelso County, WA Hsg. Authority (Chinook & Columbia Apartments)1 | | | 5.600 | | | | 03/01/2028 | | | | 200,042 | |
| 50,000 | | Kitsap County, WA Consolidated Hsg. Authority (Heritage Apartments)1 | | | 6.100 | | | | 10/01/2031 | | | | 50,038 | |
| 1,790,000 | | Seattle, WA Hsg. Authority (Newholly Phase II)1 | | | 7.000 | | | | 01/01/2032 | | | | 1,807,023 | |
| 3,329,358 | | Tacoma, WA Consolidated Local Improvements District No. 65 | | | 5.750 | | | | 04/01/2043 | | | | 3,333,553 | |
| 1,500,000 | | Tes Properties, WA6 | | | 5.500 | | | | 12/01/2029 | | | | 1,624,590 | |
| 12,000,000 | | Tes Properties, WA6 | | | 5.625 | | | | 12/01/2038 | | | | 13,023,960 | |
| 21,710,000 | | WA EDFA (Columbia Pulp I)7 | | | 7.500 | | | | 01/01/2032 | | | | 22,971,351 | |
| 5,000,000 | | WA GO1 | | | 5.000 | | | | 08/01/2029 | | | | 6,080,150 | |
| 12,425,000 | | WA GO1 | | | 5.000 | | | | 02/01/2030 | | | | 15,145,826 | |
| 18,075,000 | | WA Health Care Facilities Authority (Catholic Health Initiatives)6 | | | 6.375 | | | | 10/01/2036 | | | | 19,042,190 | |
| 17,410,000 | | WA Health Care Facilities Authority (Peacehealth)6 | | | 5.000 | | | | 11/01/2028 | | | | 18,527,896 | |
| 1,000,000 | | WA Hsg. Finance Commission (Heron’s Key) | | | 7.000 | | | | 07/01/2045 | | | | 997,480 | |
| 1,700,000 | | WA Hsg. Finance Commission (Heron’s Key) | | | 7.000 | | | | 07/01/2050 | | | | 1,678,325 | |
| 10,860,000 | | WA Kalispel Tribe Indians Priority District1 | | | 6.750 | | | | 01/01/2038 | | | | 11,453,608 | |
| | | | | | | | | | | | | 116,718,972 | |
| | | | | | | | | | | | | | | |
| West Virginia—0.4% | | | | | | | | | | | | |
| 3,000,000 | | Brooke County, WV (Bethany College)1 | | | 6.500 | | | | 10/01/2031 | | | | 3,091,080 | |
| 4,500,000 | | Brooke County, WV (Bethany College)1 | | | 6.750 | | | | 10/01/2037 | | | | 4,658,400 | |
| 27,145,000 | | Harrison County, WV Tax Increment (Charles Pointe)4 | | | 7.000 | | | | 06/01/2035 | | | | 13,560,013 | |
| | | | | | | | | | | | | 21,309,493 | |
| | | | | | | | | | | | | | | |
| Wisconsin—3.6% | | | | | | | | | | | | |
| 3,000,000 | | WI H&EFA (AE Nursing Centers) | | | 7.250 | | | | 06/01/2038 | | | | 3,085,260 | |
| 750,000 | | WI H&EFA (Beloit College)1 | | | 6.125 | | | | 06/01/2035 | | | | 855,705 | |
| 2,015,000 | | WI H&EFA (Beloit College)1 | | | 6.125 | | | | 06/01/2039 | | | | 2,298,994 | |
| 6,335,000 | | WI H&EFA (Wellington Homes) | | | 6.750 | | | | 09/01/2037 | | | | 6,339,941 | |
| 53,000,000 | | WI Public Finance Authority (American Dream at Meadowlands Project) | | | 6.750 | | | | 08/01/2031 | | | | 55,987,080 | |
| 25,000,000 | | WI Public Finance Authority (American Dream at Meadowlands Project) | | | 7.000 | | | | 12/01/2050 | | | | 27,419,000 | |
| 2,000,000 | | WI Public Finance Authority (Bancroft Neurohealth/ Bancroft Rehabilitation Services Obligated Group)1 | | | 5.125 | | | | 06/01/2048 | | | | 2,014,820 | |
| 5,200,000 | | WI Public Finance Authority (FNC&M / FBA / FCP / FFC / FGC / FJeffC / FJC / FMN / FTS / FP1 / FP2 / FRB Obligated Group)1 | | | 5.000 | | | | 12/01/2045 | | | | 5,474,716 | |
| 3,800,000 | | WI Public Finance Authority (FNC&M / FBA / FCP / FFC / FGC / FJeffC / FJC / FMN / FTS / FP1 / FP2 / FRB Obligated Group)1 | | | 5.150 | | | | 12/01/2050 | | | | 3,995,700 | |
|
| 50 OPPENHEIMER ROCHESTER HIGH YIELD MUNICIPAL FUND |
| | | | | | | | | | | | | | |
Principal
Amount | | | | Coupon | | | Maturity | | | Value | |
| Wisconsin (Continued) | | | | | | | | | | | | |
| $6,790,000 | | WI Public Finance Authority (FNC&M / FBA / FCP / FFC / FGC / FJeffC / FJC / FMN / FTS / FP1 / FP2 / FRB Obligated Group)1 | | | 5.350 | % | | | 12/01/2052 | | | $ | 7,206,363 | |
| 1,665,000 | | WI Public Finance Authority (Las Ventanas Retirement Community) | | | 0.210 | 5 | | | 10/01/2042 | | | | 713,502 | |
| 6,657,500 | | WI Public Finance Authority (Las Ventanas Retirement Community) | | | 7.000 | | | | 10/01/2042 | | | | 6,679,403 | |
| 2,000,000 | | WI Public Finance Authority (Las Ventanas Retirement Community) | | | 36.095 | 5 | | | 10/01/2042 | | | | 37,800 | |
| 54,600,000 | | WI Public Finance Authority (Natogasoline)8 | | | 10.000 | | | | 06/30/2021 | | | | 54,572,700 | |
| 660,000 | | WI Public Finance Authority (Thomas Jefferson Classical Academy)1 | | | 7.000 | | | | 07/01/2031 | | | | 698,782 | |
| 2,500,000 | | WI Public Finance Authority Charter School (Envision Science Academy) | | | 5.250 | | | | 05/01/2046 | | | | 2,400,150 | |
| 1,230,000 | | WI Public Finance Authority Charter School (Explore Knowledge Foundation)1 | | | 5.750 | | | | 07/15/2032 | | | | 1,324,156 | |
| 845,000 | | WI Public Finance Authority Charter School (Explore Knowledge Foundation)1 | | | 6.000 | | | | 07/15/2042 | | | | 910,040 | |
| 1,910,000 | | WI Public Finance Authority Educational Facility (Ask Academy)1 | | | 6.000 | | | | 02/01/2045 | | | | 1,931,812 | |
| 5,875,000 | | WI Public Finance Authority Educational Facility (Horizon Academy West Charter School)1 | | | 6.000 | | | | 09/01/2045 | | | | 6,003,428 | |
| 6,815,000 | | WI Public Finance Authority Higher Education Facilities (Wittenberg University) | | | 5.250 | | | | 12/01/2039 | | | | 6,554,531 | |
| 10,960,000 | | WI Public Financing Authority Multifamily Hsg. (Trinity-Eagle’s Point)1 | | | 5.250 | | | | 01/01/2052 | | | | 11,447,939 | |
| | | | | | | | | | | | | 207,951,822 | |
| | | | | | | | | | | | | | | |
| U.S. Possessions—11.1% | | | | | | | | | | | | |
| 27,050,000 | | Northern Mariana Islands Commonwealth, Series B | | | 5.000 | | | | 10/01/2033 | | | | 23,439,366 | |
| 10,000 | | Puerto Rico Aqueduct & Sewer Authority, AGC | | | 5.000 | | | | 07/01/2025 | | | | 10,216 | |
| 11,980,000 | | Puerto Rico Aqueduct & Sewer Authority | | | 5.000 | | | | 07/01/2033 | | | | 9,689,544 | |
| 250,000 | | Puerto Rico Aqueduct & Sewer Authority | | | 5.500 | | | | 07/01/2028 | | | | 206,437 | |
| 25,035,000 | | Puerto Rico Aqueduct & Sewer Authority | | | 5.750 | | | | 07/01/2037 | | | | 20,439,575 | |
| 3,325,000 | | Puerto Rico Aqueduct & Sewer Authority | | | 6.000 | | | | 07/01/2038 | | | | 2,797,987 | |
| 7,645,000 | | Puerto Rico Aqueduct & Sewer Authority | | | 6.000 | | | | 07/01/2044 | | | | 6,397,260 | |
| 30,945,000 | | Puerto Rico Aqueduct & Sewer Authority | | | 6.000 | | | | 07/01/2047 | | | | 25,779,661 | |
| 4,685,000 | | Puerto Rico Children’s Trust Fund (TASC)1 | | | 5.375 | | | | 05/15/2033 | | | | 4,725,994 | |
| 7,260,000 | | Puerto Rico Children’s Trust Fund (TASC)1 | | | 5.500 | | | | 05/15/2039 | | | | 7,200,468 | |
| 3,065,000 | | Puerto Rico Children’s Trust Fund (TASC)1 | | | 5.625 | | | | 05/15/2043 | | | | 3,023,653 | |
| 152,450,000 | | Puerto Rico Children’s Trust Fund (TASC) | | | 9.352 | 5 | | | 05/15/2055 | | | | 7,982,282 | |
| 2,145,000 | | Puerto Rico Commonwealth GO, AGC11 | | | 3.200 | | | | 07/01/2019 | | | | 2,142,898 | |
| 285,000 | | Puerto Rico Commonwealth GO, AGC11 | | | 3.220 | | | | 07/01/2020 | | | | 285,995 | |
| 1,500,000 | | Puerto Rico Commonwealth GO3 | | | 5.000 | | | | 07/01/2024 | | | | 851,250 | |
| 2,550,000 | | Puerto Rico Commonwealth GO3 | | | 5.000 | | | | 07/01/2033 | | | | 1,447,125 | |
| 5,000,000 | | Puerto Rico Commonwealth GO3 | | | 5.000 | | | | 07/01/2033 | | | | 2,837,500 | |
| 10,000 | | Puerto Rico Commonwealth GO, AGC1 | | | 5.000 | | | | 07/01/2034 | | | | 10,017 | |
| 1,660,000 | | Puerto Rico Commonwealth GO3 | | | 5.000 | | | | 07/01/2034 | | | | 942,050 | |
| 6,765,000 | | Puerto Rico Commonwealth GO3 | | | 5.000 | | | | 07/01/2041 | | | | 3,754,575 | |
|
| 51 OPPENHEIMER ROCHESTER HIGH YIELD MUNICIPAL FUND |
STATEMENT OF INVESTMENTS Continued
| | | | | | | | | | | | | | |
Principal
Amount | | | | Coupon | | | Maturity | | | Value | |
| U.S. Possessions (Continued) | | | | | | | | | | | | |
| $700,000 | �� | Puerto Rico Commonwealth GO3 | | | 5.125 | % | | | 07/01/2031 | | | $ | 397,250 | |
| 2,000,000 | | Puerto Rico Commonwealth GO3 | | | 5.125 | | | | 07/01/2037 | | | | 1,135,000 | |
| 5,000 | | Puerto Rico Commonwealth GO, AGC | | | 5.250 | | | | 07/01/2024 | | | | 5,284 | |
| 1,920,000 | | Puerto Rico Commonwealth GO3 | | | 5.250 | | | | 07/01/2026 | | | | 1,089,600 | |
| 2,165,000 | | Puerto Rico Commonwealth GO3 | | | 5.250 | | | | 07/01/2037 | | | | 1,228,637 | |
| 40,000 | | Puerto Rico Commonwealth GO3 | | | 5.500 | | | | 07/01/2018 | | | | 22,700 | |
| 14,695,000 | | Puerto Rico Commonwealth GO3 | | | 5.500 | | | | 07/01/2026 | | | | 8,339,412 | |
| 3,255,000 | | Puerto Rico Commonwealth GO3 | | | 5.500 | | | | 07/01/2026 | | | | 1,847,212 | |
| 340,000 | | Puerto Rico Commonwealth GO3 | | | 5.500 | | | | 07/01/2027 | | | | 192,950 | |
| 62,180,000 | | Puerto Rico Commonwealth GO3 | | | 5.500 | | | | 07/01/2039 | | | | 35,287,150 | |
| 11,540,000 | | Puerto Rico Commonwealth GO3 | | | 5.750 | | | | 07/01/2036 | | | | 6,548,950 | |
| 1,345,000 | | Puerto Rico Commonwealth GO, AGC | | | 5.750 | | | | 07/01/2037 | | | | 1,347,946 | |
| 3,000,000 | | Puerto Rico Commonwealth GO3 | | | 5.750 | | | | 07/01/2038 | | | | 1,702,500 | |
| 65,250,000 | | Puerto Rico Commonwealth GO3 | | | 5.750 | | | | 07/01/2041 | | | | 37,029,375 | |
| 2,625,000 | | Puerto Rico Commonwealth GO3 | | | 6.000 | | | | 07/01/2035 | | | | 1,489,687 | |
| 1,480,000 | | Puerto Rico Commonwealth GO3 | | | 6.000 | | | | 07/01/2038 | | | | 839,900 | |
| 2,250,000 | | Puerto Rico Commonwealth GO3 | | | 6.000 | | | | 07/01/2039 | | | | 1,276,875 | |
| 9,265,000 | | Puerto Rico Commonwealth GO3 | | | 6.000 | | | | 07/01/2039 | | | | 5,257,887 | |
| 14,550,000 | | Puerto Rico Commonwealth GO3 | | | 6.500 | | | | 07/01/2037 | | | | 8,257,125 | |
| 13,000,000 | | Puerto Rico Commonwealth GO3 | | | 6.500 | | | | 07/01/2040 | | | | 7,377,500 | |
| 1,545,000 | | Puerto Rico Commonwealth GO3 | | | 8.000 | | | | 07/01/2035 | | | | 927,000 | |
| 1,501,705 | | Puerto Rico Electric Power Authority3 | | | 10.000 | | | | 07/01/2019 | | | | 919,389 | |
| 1,501,705 | | Puerto Rico Electric Power Authority3 | | | 10.000 | | | | 07/01/2019 | | | | 919,389 | |
| 1,629,052 | | Puerto Rico Electric Power Authority3 | | | 10.000 | | | | 01/01/2021 | | | | 998,234 | |
| 1,629,051 | | Puerto Rico Electric Power Authority3 | | | 10.000 | | | | 07/01/2021 | | | | 998,527 | |
| 543,017 | | Puerto Rico Electric Power Authority3 | | | 10.000 | | | | 01/01/2022 | | | | 333,277 | |
| 543,018 | | Puerto Rico Electric Power Authority3 | | | 10.000 | | | | 07/01/2022 | | | | 333,277 | |
| 3,100,000 | | Puerto Rico Electric Power Authority, Series A3 | | | 5.000 | | | | 07/01/2029 | | | | 1,891,000 | |
| 7,070,000 | | Puerto Rico Electric Power Authority, Series A3 | | | 5.000 | | | | 07/01/2042 | | | | 4,312,700 | |
| 11,535,000 | | Puerto Rico Electric Power Authority, Series A3 | | | 5.050 | | | | 07/01/2042 | | | | 7,036,350 | |
| 20,375,000 | | Puerto Rico Electric Power Authority, Series A3 | | | 6.750 | | | | 07/01/2036 | | | | 12,428,750 | |
| 10,330,000 | | Puerto Rico Electric Power Authority, Series A3 | | | 7.000 | | | | 07/01/2033 | | | | 6,301,300 | |
| 480,000 | | Puerto Rico Electric Power Authority, Series A3 | | | 7.000 | | | | 07/01/2040 | | | | 292,800 | |
| 9,080,000 | | Puerto Rico Electric Power Authority, Series A3 | | | 7.000 | | | | 07/01/2043 | | | | 5,538,800 | |
| 160,000 | | Puerto Rico Electric Power Authority, Series A3 | | | 7.250 | | | | 07/01/2030 | | | | 97,600 | |
| 40,000 | | Puerto Rico Electric Power Authority, Series AAA3 | | | 5.250 | | | | 07/01/2021 | | | | 24,400 | |
| 40,000 | | Puerto Rico Electric Power Authority, Series AAA3 | | | 5.250 | | | | 07/01/2022 | | | | 24,400 | |
| 10,000 | | Puerto Rico Electric Power Authority, Series AAA3 | | | 5.250 | | | | 07/01/2023 | | | | 6,100 | |
| 500,000 | | Puerto Rico Electric Power Authority, Series AAA3 | | | 5.250 | | | | 07/01/2025 | | | | 305,000 | |
| 4,570,000 | | Puerto Rico Electric Power Authority, Series AAA3 | | | 5.250 | | | | 07/01/2026 | | | | 2,787,700 | |
| 2,600,000 | | Puerto Rico Electric Power Authority, Series AAA3 | | | 5.250 | | | | 07/01/2028 | | | | 1,586,000 | |
| 445,000 | | Puerto Rico Electric Power Authority, Series AAA3 | | | 5.250 | | | | 07/01/2029 | | | | 271,450 | |
| 95,000 | | Puerto Rico Electric Power Authority, Series AAA3 | | | 5.250 | | | | 07/01/2030 | | | | 57,950 | |
| 310,000 | | Puerto Rico Electric Power Authority, Series CCC3 | | | 5.000 | | | | 07/01/2022 | | | | 189,100 | |
| 35,000 | | Puerto Rico Electric Power Authority, Series CCC3 | | | 5.000 | | | | 07/01/2024 | | | | 21,350 | |
| 20,000 | | Puerto Rico Electric Power Authority, Series CCC3 | | | 5.000 | | | | 07/01/2025 | | | | 12,200 | |
| 285,000 | | Puerto Rico Electric Power Authority, Series CCC3 | | | 5.000 | | | | 07/01/2027 | | | | 173,850 | |
| 540,000 | | Puerto Rico Electric Power Authority, Series CCC3 | | | 5.000 | | | | 07/01/2028 | | | | 329,400 | |
|
| 52 OPPENHEIMER ROCHESTER HIGH YIELD MUNICIPAL FUND |
| | | | | | | | | | | | | | |
Principal
Amount | | | | Coupon | | | Maturity | | | Value | |
| U.S. Possessions (Continued) | | | | | | | | | | | | |
| $2,570,000 | | Puerto Rico Electric Power Authority, Series CCC3 | | | 5.250 | % | | | 07/01/2027 | | | $ | 1,567,700 | |
| 385,000 | | Puerto Rico Electric Power Authority, Series CCC3 | | | 5.250 | | | | 07/01/2028 | | | | 234,850 | |
| 185,000 | | Puerto Rico Electric Power Authority, Series DDD3 | | | 5.000 | | | | 07/01/2022 | | | | 112,850 | |
| 15,000 | | Puerto Rico Electric Power Authority, Series NN3 | | | 5.500 | | | | 07/01/2020 | | | | 9,150 | |
| 170,000 | | Puerto Rico Electric Power Authority, Series TT3 | | | 5.000 | | | | 07/01/2018 | | | | 103,700 | |
| 20,000 | | Puerto Rico Electric Power Authority, Series TT3 | | | 5.000 | | | | 07/01/2018 | | | | 12,200 | |
| 5,000 | | Puerto Rico Electric Power Authority, Series TT3 | | | 5.000 | | | | 07/01/2020 | | | | 3,050 | |
| 55,000 | | Puerto Rico Electric Power Authority, Series TT3 | | | 5.000 | | | | 07/01/2021 | | | | 33,550 | |
| 210,000 | | Puerto Rico Electric Power Authority, Series TT3 | | | 5.000 | | | | 07/01/2022 | | | | 128,100 | |
| 280,000 | | Puerto Rico Electric Power Authority, Series TT3 | | | 5.000 | | | | 07/01/2023 | | | | 170,800 | |
| 15,000 | | Puerto Rico Electric Power Authority, Series TT3 | | | 5.000 | | | | 07/01/2024 | | | | 9,150 | |
| 375,000 | | Puerto Rico Electric Power Authority, Series TT3 | | | 5.000 | | | | 07/01/2025 | | | | 228,750 | |
| 895,000 | | Puerto Rico Electric Power Authority, Series TT3 | | | 5.000 | | | | 07/01/2026 | | | | 545,950 | |
| 1,990,000 | | Puerto Rico Electric Power Authority, Series TT3 | | | 5.000 | | | | 07/01/2027 | | | | 1,213,900 | |
| 7,355,000 | | Puerto Rico Electric Power Authority, Series TT3 | | | 5.000 | | | | 07/01/2032 | | | | 4,486,550 | |
| 6,100,000 | | Puerto Rico Electric Power Authority, Series TT3 | | | 5.000 | | | | 07/01/2037 | | | | 3,721,000 | |
| 390,000 | | Puerto Rico Electric Power Authority, Series UU3 | | | 1.614 | 9 | | | 07/01/2017 | | | | 230,607 | |
| 685,000 | | Puerto Rico Electric Power Authority, Series WW3 | | | 5.000 | | | | 07/01/2028 | | | | 417,850 | |
| 185,000 | | Puerto Rico Electric Power Authority, Series WW3 | | | 5.250 | | | | 07/01/2025 | | | | 112,850 | |
| 415,000 | | Puerto Rico Electric Power Authority, Series WW3 | | | 5.250 | | | | 07/01/2033 | | | | 253,150 | |
| 85,000 | | Puerto Rico Electric Power Authority, Series WW3 | | | 5.375 | | | | 07/01/2022 | | | | 51,850 | |
| 390,000 | | Puerto Rico Electric Power Authority, Series WW3 | | | 5.375 | | | | 07/01/2024 | | | | 237,900 | |
| 60,000 | | Puerto Rico Electric Power Authority, Series WW3 | | | 5.500 | | | | 07/01/2021 | | | | 36,600 | |
| 605,000 | | Puerto Rico Electric Power Authority, Series WW3 | | | 5.500 | | | | 07/01/2038 | | | | 369,050 | |
| 10,000 | | Puerto Rico Electric Power Authority, Series XX3 | | | 5.250 | | | | 07/01/2026 | | | | 6,100 | |
| 845,000 | | Puerto Rico Electric Power Authority, Series XX3 | | | 5.250 | | | | 07/01/2027 | | | | 515,450 | |
| 2,660,000 | | Puerto Rico Electric Power Authority, Series XX3 | | | 5.250 | | | | 07/01/2035 | | | | 1,622,600 | |
| 38,430,000 | | Puerto Rico Electric Power Authority, Series XX3 | | | 5.250 | | | | 07/01/2040 | | | | 23,442,300 | |
| 18,575,000 | | Puerto Rico Electric Power Authority, Series XX3 | | | 5.750 | | | | 07/01/2036 | | | | 11,330,750 | |
| 190,000 | | Puerto Rico Electric Power Authority, Series ZZ3 | | | 4.625 | | | | 07/01/2025 | | | | 115,900 | |
| 140,000 | | Puerto Rico Electric Power Authority, Series ZZ3 | | | 5.000 | | | | 07/01/2018 | | | | 85,400 | |
| 820,000 | | Puerto Rico Electric Power Authority, Series ZZ3 | | | 5.000 | | | | 07/01/2018 | | | | 500,200 | |
| 95,000 | | Puerto Rico Electric Power Authority, Series ZZ3 | | | 5.000 | | | | 07/01/2021 | | | | 57,950 | |
| 850,000 | | Puerto Rico Electric Power Authority, Series ZZ3 | | | 5.000 | | | | 07/01/2022 | | | | 518,500 | |
| 215,000 | | Puerto Rico Electric Power Authority, Series ZZ3 | | | 5.000 | | | | 07/01/2024 | | | | 131,150 | |
| 10,000 | | Puerto Rico Electric Power Authority, Series ZZ3 | | | 5.000 | | | | 07/01/2026 | | | | 6,100 | |
| 515,000 | | Puerto Rico Electric Power Authority, Series ZZ3 | | | 5.250 | | | | 07/01/2018 | | | | 314,150 | |
| 25,000 | | Puerto Rico Electric Power Authority, Series ZZ3 | | | 5.250 | | | | 07/01/2021 | | | | 15,250 | |
| 50,000 | | Puerto Rico Electric Power Authority, Series ZZ3 | | | 5.250 | | | | 07/01/2022 | | | | 30,500 | |
| 380,000 | | Puerto Rico Electric Power Authority, Series ZZ3 | | | 5.250 | | | | 07/01/2024 | | | | 231,800 | |
| 275,000 | | Puerto Rico Electric Power Authority, Series ZZ3 | | | 5.250 | | | | 07/01/2025 | | | | 167,750 | |
| 310,000 | | Puerto Rico Electric Power Authority, Series ZZ3 | | | 5.250 | | | | 07/01/2026 | | | | 189,100 | |
| 215,000 | | Puerto Rico Highway & Transportation Authority, AGC1 | | | 5.000 | | | | 07/01/2023 | | | | 217,055 | |
| 45,000 | | Puerto Rico Highway & Transportation Authority, AGC1 | | | 5.000 | | | | 07/01/2027 | | | | 45,430 | |
| 1,360,000 | | Puerto Rico Highway & Transportation Authority3 | | | 5.000 | | | | 07/01/2028 | | | | 824,622 | |
| 2,175,000 | | Puerto Rico Highway & Transportation Authority3 | | | 5.000 | | | | 07/01/2028 | | | | 108,750 | |
| 250,000 | | Puerto Rico Highway & Transportation Authority, NPFGC1 | | | 5.000 | | | | 07/01/2029 | | | | 250,295 | |
|
| 53 OPPENHEIMER ROCHESTER HIGH YIELD MUNICIPAL FUND |
STATEMENT OF INVESTMENTS Continued
| | | | | | | | | | | | | | |
Principal
Amount | | | | Coupon | | | Maturity | | | Value | |
| U.S. Possessions (Continued) | | | | | | | | | | | | |
| $1,035,000 | | Puerto Rico Highway & Transportation Authority3 | | | 5.000 | % | | | 07/01/2035 | | | $ | 611,654 | |
| 7,895,000 | | Puerto Rico Highway & Transportation Authority3 | | | 5.300 | | | | 07/01/2035 | | | | 4,665,787 | |
| 25,000 | | Puerto Rico Highway & Transportation Authority, AGC1 | | | 5.500 | | | | 07/01/2023 | | | | 27,777 | |
| 5,000,000 | | Puerto Rico Highway & Transportation Authority3 | | | 5.500 | | | | 07/01/2029 | | | | 3,013,950 | |
| 3,250,000 | | Puerto Rico Highway & Transportation Authority3 | | | 5.500 | | | | 07/01/2030 | | | | 1,951,332 | |
| 45,000 | | Puerto Rico Highway & Transportation Authority, AGC1 | | | 5.750 | | | | 07/01/2019 | | | | 45,538 | |
| 6,940,000 | | Puerto Rico Highway & Transportation Authority, FGIC12 | | | 5.750 | | | | 07/01/2019 | | | | 4,432,925 | |
| 350,000 | | Puerto Rico Highway & Transportation Authority, FGIC12 | | | 5.750 | | | | 07/01/2021 | | | | 223,562 | |
| 9,000,000 | | Puerto Rico Highway & Transportation Authority, AGC1 | | | 5.750 | | | | 07/01/2022 | | | | 9,107,550 | |
| 605,000 | | Puerto Rico Highway & Transportation Authority, Series H3 | | | 5.450 | | | | 07/01/2035 | | | | 148,981 | |
| 4,715,000 | | Puerto Rico Highway & Transportation Authority, Series M3 | | | 5.000 | | | | 07/01/2046 | | | | 1,161,069 | |
| 5,000,000 | | Puerto Rico Infrastructure4 | | | 5.000 | | | | 07/01/2031 | | | | 362,500 | |
| 3,000,000 | | Puerto Rico Infrastructure4 | | | 5.000 | | | | 07/01/2037 | | | | 217,500 | |
| 7,300,000 | | Puerto Rico Infrastructure (Mepsi Campus)3 | | | 6.500 | | | | 10/01/2037 | | | | 3,616,347 | |
| 25,000 | | Puerto Rico Infrastructure Financing Authority, AGC1 | | | 5.000 | | | | 07/01/2041 | | | | 25,040 | |
| 2,500,000 | | Puerto Rico ITEMECF (Cogeneration Facilities) | | | 6.625 | | | | 06/01/2026 | | | | 2,362,825 | |
| 4,050,000 | | Puerto Rico ITEMECF (Hospital Auxilio Mutuo)1 | | | 6.000 | | | | 07/01/2033 | | | | 4,155,341 | |
| 300,000 | | Puerto Rico ITEMECF (University of the Sacred Heart)1 | | | 5.000 | | | | 10/01/2020 | | | | 261,714 | |
| 100,000 | | Puerto Rico ITEMECF (University of the Sacred Heart)1 | | | 5.000 | | | | 10/01/2021 | | | | 83,841 | |
| 25,000 | | Puerto Rico Municipal Finance Agency, Series B, AGC1 | | | 5.250 | | | | 07/01/2019 | | | | 26,346 | |
| 3,870,000 | | Puerto Rico Public Buildings Authority4 | | | 5.000 | | | | 07/01/2032 | | | | 2,041,425 | |
| 4,880,000 | | Puerto Rico Public Buildings Authority4 | | | 5.000 | | | | 07/01/2036 | | | | 2,482,700 | |
| 150,000 | | Puerto Rico Public Buildings Authority4 | | | 5.000 | | | | 07/01/2037 | | | | 78,562 | |
| 100,000 | | Puerto Rico Public Buildings Authority4 | | | 5.250 | | | | 07/01/2023 | | | | 53,500 | |
| 1,640,000 | | Puerto Rico Public Buildings Authority4 | | | 5.250 | | | | 07/01/2033 | | | | 856,900 | |
| 83,395,000 | | Puerto Rico Public Buildings Authority4 | | | 5.250 | | | | 07/01/2042 | | | | 42,635,694 | |
| 260,000 | | Puerto Rico Public Buildings Authority4 | | | 5.500 | | | | 07/01/2023 | | | | 139,100 | |
| 200,000 | | Puerto Rico Public Buildings Authority4 | | | 5.500 | | | | 07/01/2037 | | | | 105,250 | |
| 15,860,000 | | Puerto Rico Public Buildings Authority4 | | | 5.625 | | | | 07/01/2039 | | | | 8,366,150 | |
| 12,845,000 | | Puerto Rico Public Buildings Authority3 | | | 5.750 | | | | 07/01/2022 | | | | 6,872,075 | |
| 7,000,000 | | Puerto Rico Public Buildings Authority4 | | | 5.875 | | | | 07/01/2039 | | | | 3,640,000 | |
| 8,825,000 | | Puerto Rico Public Buildings Authority4 | | | 6.000 | | | | 07/01/2041 | | | | 4,699,312 | |
| 12,000,000 | | Puerto Rico Public Buildings Authority4 | | | 6.125 | | | | 07/01/2023 | | | | 6,450,000 | |
| 5,100,000 | | Puerto Rico Public Buildings Authority4 | | | 6.250 | | | | 07/01/2026 | | | | 2,747,625 | |
| 4,980,000 | | Puerto Rico Public Buildings Authority4 | | | 6.750 | | | | 07/01/2036 | | | | 2,664,300 | |
| 410,000 | | Puerto Rico Public Buildings Authority4 | | | 7.000 | | | | 07/01/2021 | | | | 222,425 | |
| 1,515,000 | | Puerto Rico Public Buildings Authority, Series D4 | | | 5.250 | | | | 07/01/2036 | | | | 791,588 | |
| 49,020,000 | | Puerto Rico Public Finance Corp., Series B4 | | | 5.500 | | | | 08/01/2031 | | | | 1,348,050 | |
| 9,500,000 | | Puerto Rico Sales Tax Financing Corp.3 | | | 6.900 | 2 | | | 08/01/2026 | | | | 2,351,250 | |
| 220,000 | | Puerto Rico Sales Tax Financing Corp. (Build America Bonds)3 | | | 5.750 | | | | 08/01/2042 | | | | 54,450 | |
| 42,745,000 | | Puerto Rico Sales Tax Financing Corp., Series A3 | | | 0.000 | 2 | | | 08/01/2033 | | | | 7,741,547 | |
| 1,590,000 | | Puerto Rico Sales Tax Financing Corp., Series A3 | | | 5.000 | | | | 08/01/2019 | | | | 427,313 | |
| 1,630,000 | | Puerto Rico Sales Tax Financing Corp., Series A3 | | | 5.000 | | | | 08/01/2024 | | | | 438,063 | |
| 15,735,000 | | Puerto Rico Sales Tax Financing Corp., Series A3 | | | 5.000 | | | | 08/01/2043 | | | | 4,228,781 | |
|
| 54 OPPENHEIMER ROCHESTER HIGH YIELD MUNICIPAL FUND |
| | | | | | | | | | | | | | | | |
Principal
Amount | | | | | Coupon | | | Maturity | | | Value | |
| | U.S. Possessions (Continued) | | | | | | | | | | | | |
| | $11,885,000 | | | Puerto Rico Sales Tax Financing Corp., Series A3 | | | 5.250 | % | | | 08/01/2027 | | | $ | 3,194,094 | |
| | 51,045,000 | | | Puerto Rico Sales Tax Financing Corp., Series A3 | | | 5.375 | | | | 08/01/2039 | | | | 13,718,344 | |
| | 700,000 | | | Puerto Rico Sales Tax Financing Corp., Series A3 | | | 5.500 | | | | 08/01/2023 | | | | 188,125 | |
| | 4,145,000 | | | Puerto Rico Sales Tax Financing Corp., Series A3 | | | 5.500 | | | | 08/01/2028 | | | | 1,113,969 | |
| | 14,720,000 | | | Puerto Rico Sales Tax Financing Corp., Series A3 | | | 5.500 | | | | 08/01/2037 | | | | 3,956,000 | |
| | 45,145,000 | | | Puerto Rico Sales Tax Financing Corp., Series A3 | | | 5.500 | | | | 08/01/2042 | | | | 12,132,719 | |
| | 44,060,000 | | | Puerto Rico Sales Tax Financing Corp., Series A3 | | | 5.750 | | | | 08/01/2037 | | | | 11,841,125 | |
| | 44,365,000 | | | Puerto Rico Sales Tax Financing Corp., Series A, NPFGC | | | 5.826 | 5 | | | 08/01/2043 | | | | 9,849,917 | |
| | 46,950,000 | | | Puerto Rico Sales Tax Financing Corp., Series A, NPFGC | | | 5.829 | 5 | | | 08/01/2042 | | | | 11,002,263 | |
| | 17,500,000 | | | Puerto Rico Sales Tax Financing Corp., Series A, NPFGC | | | 5.830 | 5 | | | 08/01/2041 | | | | 4,316,725 | |
| | 2,250,000 | | | Puerto Rico Sales Tax Financing Corp., Series A3 | | | 6.125 | | | | 08/01/2029 | | | | 604,688 | |
| | 3,000,000 | | | Puerto Rico Sales Tax Financing Corp., Series A3 | | | 6.375 | | | | 08/01/2039 | | | | 806,250 | |
| | 53,275,000 | | | Puerto Rico Sales Tax Financing Corp., Series A3 | | | 6.500 | | | | 08/01/2044 | | | | 14,317,656 | |
| | 7,945,000 | | | Puerto Rico Sales Tax Financing Corp., Series A3 | | | 7.886 | 5 | | | 08/01/2034 | | | | 604,138 | |
| | 37,060,000 | | | Puerto Rico Sales Tax Financing Corp., Series A3 | | | 8.691 | 5 | | | 08/01/2035 | | | | 2,799,883 | |
| | 30,980,000 | | | Puerto Rico Sales Tax Financing Corp., Series A-13 | | | 5.250 | | | | 08/01/2043 | | | | 8,325,875 | |
| | 330,000 | | | Puerto Rico Sales Tax Financing Corp., Series C3 | | | 4.000 | | | | 08/01/2026 | | | | 204,188 | |
| | 300,000 | | | Puerto Rico Sales Tax Financing Corp., Series C3 | | | 5.000 | | | | 08/01/2035 | | | | 80,625 | |
| | 135,000 | | | Puerto Rico Sales Tax Financing Corp., Series C3 | | | 5.000 | | | | 08/01/2046 | | | | 83,531 | |
| | 63,720,000 | | | Puerto Rico Sales Tax Financing Corp., Series C3 | | | 5.250 | | | | 08/01/2041 | | | | 17,124,750 | |
| | 3,670,000 | | | Puerto Rico Sales Tax Financing Corp., Series C3 | | | 5.375 | | | | 08/01/2036 | | | | 986,313 | |
| | 5,290,000 | | | Puerto Rico Sales Tax Financing Corp., Series C3 | | | 5.375 | | | | 08/01/2038 | | | | 1,421,688 | |
| | 10,000,000 | | | Puerto Rico Sales Tax Financing Corp., Series C3 | | | 5.500 | | | | 08/01/2040 | | | | 2,687,500 | |
| | 19,555,000 | | | Puerto Rico Sales Tax Financing Corp., Series C3 | | | 5.750 | | | | 08/01/2057 | | | | 12,099,656 | |
| | 5,000,000 | | | Puerto Rico Sales Tax Financing Corp., Series C3 | | | 6.000 | | | | 08/01/2039 | | | | 1,343,750 | |
| | 65,695,000 | | | Puerto Rico Sales Tax Financing Corp., Series C3 | | | 6.000 | | | | 08/01/2042 | | | | 17,655,531 | |
| | 10,865,000 | | | Puerto Rico Sales Tax Financing Corp., Series C3 | | | 6.750 | 2 | | | 08/01/2032 | | | | 2,919,969 | |
| | 5,000,000 | | | University of Puerto Rico, Series P | | | 5.000 | | | | 06/01/2030 | | | | 2,500,000 | |
| | | | | | | | | | | | | | | 644,589,206 | |
| | Total Municipal Bonds and Notes (Cost $7,324,639,354) | | | | | | | | | | | 6,532,150,910 | |
| | | |
| | | | | | | | | | | | | | |
| | Corporate Bonds and Notes—0.1% | | | | | | | | | | | | |
| | 3,030,000 | | | TX German Pellets Series Secured Note, Series 201613 | | | 8.000 | | | | 12/10/2017 | | | | 2,727,000 | |
| | 2,890,000 | | | TX German Pellets Series Secured Note, Series 201613 | | | 8.000 | | | | 12/10/2017 | | | | 2,601,000 | |
| | Total Corporate Bonds and Notes (Cost $5,920,000) | | | | | | | | | | | 5,328,000 | |
| | | |
| | | | | | | | | | | | | | |
| | Corporate Loans—0.0% | | | | | | | | | | | | |
| | 6,000,000 | | | Aspen Power Senior Secured Bridge Promissory Note3,13 | | | 9.000 | 9 | | | 11/16/2017 | | | | 557,922 | |
| | 2,750,000 | | | Aspen Power Senior Secured Bridge Promissory Note3,13 | | | 9.000 | 9 | | | 11/16/2017 | | | | 255,714 | |
| | 7,000,000 | | | Aspen Power Senior Secured Bridge Promissory Note3,13 | | | 9.000 | 9 | | | 11/16/2017 | | | | 650,909 | |
|
| 55 OPPENHEIMER ROCHESTER HIGH YIELD MUNICIPAL FUND |
STATEMENT OF INVESTMENTS Continued
| | | | | | | | | | | | | | |
Principal Amount | | | | Coupon | | | Maturity | | | Value | |
| Corporate Loans (Continued) | | | | | | | | | | | | |
| $3,500,000 | | Aspen Power Senior Secured Bridge Promissory Note3,13 | | | 9.000 | %9 | | | 11/16/2017 | | | $ | 325,455 | |
| Total Corporate Loans (Cost $19,250,000) | | | | | | | | | | | 1,790,000 | |
| | | | |
| Shares | | | | | | | | | | | |
| Common Stocks—0.0% | | | | | | | | | | | | |
| 7,679 | | Delta Air Lines, Inc.13 | | | | | | | | | | | 379,033 | |
| 2,919 | | General Motors Co.13 | | | | | | | | | | | 105,026 | |
| Total Common Stocks (Cost $54,137) | | | | | | | | | | | 484,059 | |
| | | | | | | | | | | | | | | |
| Total Investments, at Value (Cost $7,349,863,491)—112.1% | | | | | | | | | | | 6,539,752,969 | |
| Net Other Assets (Liabilities)—(12.1) | | | | | | | | | | | (706,411,126 | ) |
| Net Assets—100.0% | | | | | | | | | | $ | 5,833,341,843 | |
| | | | | | | | | | | | | | |
Footnotes to Statement of Investments
1. All or a portion of the security position has been segregated for collateral to cover borrowings. See Note 9 of the accompanying Notes.
2. Denotes a step bond: a zero coupon bond that converts to a fixed or variable interest rate at a designated future date.
3. This security is not accruing income because its issuer has missed or is expected to miss interest and/or principal payments. The rate shown is the contractual interest rate. See Note 4 of the accompanying Notes.
4. This security is accruing partial income at an anticipated effective rate based on expected interest and/or principal payments. The rate shown is the contractual interest rate.
5. Zero coupon bond reflects effective yield on the original acquisition date.
6. Security represents the underlying municipal bond with respect to an inverse floating rate security held by the Fund. The bond was purchased by the Fund and subsequently transferred to a trust, which issued the related inverse floating rate security. See Note 4 of the accompanying Notes.
7. All or a portion of the security position is when-issued or delayed delivery to be delivered and settled after period end. See Note 4 of the accompanying Notes.
8. Interest or dividend is paid-in-kind, when applicable.
9. Represents the current interest rate for a variable or increasing rate security.
10. Security received as the result of issuer reorganization.
11. Denotes an inflation-indexed security: coupon or principal are indexed to a consumer price index.
12. The issuer of this security has missed or is expected to miss interest and/or principal payments on this security. The security is insured and is accruing partial income at a rate anticipated to be recovered through the insurer. The rate shown is the contractual interest rate.
13. Received as a result of a corporate action.
To simplify the listings of securities, abbreviations are used per the table below:
| | |
| ACMC | | Advocate Condell Medical Center |
| AE | | American Eagle |
| AGC | | Assured Guaranty Corp. |
| AH&HC | | Advocate Health & Hospitals Corp. |
| AHACHC | | ARC/HDS Alamance Country Housing Corp. |
| AHCN | | Advocate Health Care Metro |
| ANSHN | | Advocate North Side Health Network |
| ARC | | Assoc. of Retarded Citizens |
| BHCor | | Baptist Health Corbin |
|
| 56 OPPENHEIMER ROCHESTER HIGH YIELD MUNICIPAL FUND |
To simplify the listings of securities, abbreviations are used per the table below: (Continued)
| | | | |
| BHI | | Baptist Homes of Indiana |
| BHL | | Baptist Health Louisville |
| BHLex | | Baptist Health Lexington |
| BHlthL | | Baptist Health Lagrange |
| BHM | | Baptist Hospital of Miami |
| BHP | | Baptist Health Paducah |
| BHS | | Baptist Healthcare System |
| BHSF | | Baptist Health South Florida |
| BOS | | Baptist Outpatient Services |
| BVHF | | Blanchard Valley Health Foundation |
| BVRHC | | Blanchard Valley Regional Health Care |
| CCHCS | | Cook Children’s Health Care System |
| CCMCtr | | Cook Children’s Medical Center |
| CCPN | | Cook Children’s Physical Network |
| CDA | | Communities Devel. Authority |
| CDHA | | Central Dupage Hospital Association |
| CDHS | | Central Dupage Health System |
| CHCC | | Community Hospitals of Central California |
| CMCD | | Children’s Medical Center of Dallas |
| CMCtrF | | Children’s Medical Center Foundation |
| COHS | | Community Health Service |
| COP | | Certificates of Participation |
| CVHC | | Conneaut Valley Health Center |
| DA | | Dormitory Authority |
| DrsH | | Doctors Hospital |
| EDA | | Economic Devel. Authority |
| EDC | | Economic Devel. Corp. |
| EDFA | | Economic Devel. Finance Authority |
| FBA | | FFAH Beaumont Avenue |
| FCHMC | | Fresno Community Hospital & Medical Center |
| FCIM | | French Creek Internal Medicine |
| FCommH | | Fayette Community Hospital |
| FCP | | FFAH Coleridge Road |
| FFC | | FFAH Franklin Court |
| FGC | | FFAH Glendale Court |
| FGIC | | Financial Guaranty Insurance Co. |
| FJC | | FFAH Johnson Court |
| FJeffC | | FFAH Jefferson Court |
| FMN | | FFAH Market North |
| FNC&M | | FFAH North Carolina and Missouri |
| FP1 | | FFAH Plaza 1 |
| FP2 | | FFAH Plaza 2 |
| FRB | | FFAH Riverview Bend |
| FTS | | FFAH Tucker Street |
| GO | | General Obligation |
| |
| H&EFA | | Health and Educational Facilities Authority |
| H&HEFA | | Hospitals and Higher Education Facilities Authority |
| HCCO | | Homecare Connections |
| HCrawC | | Hospice of Crawford County |
| HDC | | Housing Devel. Corp. |
|
| 57 OPPENHEIMER ROCHESTER HIGH YIELD MUNICIPAL FUND |
STATEMENT OF INVESTMENTS Continued
To simplify the listings of securities, abbreviations are used per the table below: (Continued)
| | |
| HDS | | Housing Devel. Services |
| HE&HFB | | Higher Educational and Housing Facility Board |
| HEFA | | Higher Education Facilities Authority |
| HFA | | Housing Finance Agency |
| HFC | | Housing Finance Corp. |
| HFDC | | Health Facilities Devel. Corp. |
| HFHS | | Henry Ford Health System |
| HFMHCT | | Henry Ford Macomb Hospital Corp.-Clinton Township |
| HFWH | | Henry Ford Wyandotte Hospital |
| HHI | | Homestead Hospital |
| HHlthS | | Holzer Health Systems |
| HMCG | | Holzer Medical Center-Gallipolis |
| HMCJ | | Holzer Medical Center-Jackson |
| IDA | | Industrial Devel. Agency |
| ITEMECF | | Industrial, Tourist, Educational, Medical and Environmental Community Facilities |
| JFK | | John Fitzgerald Kennedy |
| KGC | | Kuakini Geriatric Care |
| KHS | | Kaukini Health System |
| KMC | | Kuakini Medical Center |
| KSS | | Kuakini Support Services |
| MarH | | Mariners Hospital |
| MHRMC | | Mission Hospital Regional Medical Center |
| MMedC | | Meadville Medical Center |
| MMedCF | | Meadville Medical Center Foundation |
| MPHS | | Mills-Peninsula Health Services |
| MPS | | Meadville Physician Services |
| MRC | | Methodist Retirement Communities |
| MTA | | Metropolitan Transportation Authority |
| NPFGC | | National Public Finance Guarantee Corp |
| NY/NJ | | New York/New Jersey |
| NYC | | New York City |
| NYS | | New York State |
| PAS | | Presence Ambulatory Services |
| PBH | | Presence Behavioral Health |
| PC&SHN | | Presence Central & Suburban Hospitals Network |
| PCHN | | Presence Chicago Hospitals Network |
| PClinic | | Piedmont Clinic |
| PCTC | | Presence Care Transformation Corp. |
| PHC | | Piedmont Healthcare |
| PHCr | | Presence Home Care |
| PHF | | Piedmont Hospital Foundation |
| PHFBT | | Presence Health Food Foundation Board of Trustees |
| PHHosp | | Piedmont Henry Hospital |
| PHI | | Piedmont Heart Institute |
| PHIP | | Piedmont Heart Institute Physicians |
| PHlthCF | | Piedmont Healthcare Foundation |
| PHN | | Presence Health Network |
| PHosp | | Piedmont Hospital |
| PLC | | Presence Life Connections |
| PMCC | | Piedmont Medical Care Corp. |
|
| 58 OPPENHEIMER ROCHESTER HIGH YIELD MUNICIPAL FUND |
To simplify the listings of securities, abbreviations are used per the table below: (Continued)
| | |
| PMSH | | Piedmont Mountainside Hospital |
| PNH | | Piedmont Newnan Hospital |
| PSSC | | Presence Senior Services - Chicagoland |
| QVMCNC | | Queen of the Valley Medical Center of Napa California |
| RBM | | Rocketship Brilliant Minds |
| RDP | | Rocketship Discovery Prep |
| RE | | Rocketship Education |
| Res Rec | | Resource Recovery Facility |
| REW | | Rocketship Education Wisconsin |
| RLSA | | Rocketship Los Suenos Academy |
| RMS | | Rocketship Mateo Sheedy |
| RNNE | | Rocketship Nashville Northeast Elementary |
| RRCP | | Rocketship Redwood City Prep |
| RSA | | Rocketship Spark Academy |
| RSCP | | Rocketship Southside Community Prep |
| RSSPA | | Rocketship Si Se Puede Academy |
| SBH | | Sutter Bay Hospitals |
| SBMF | | Sutter Bay Medical Foundation |
| SCHosp | | Sutter Coast Hospital |
| SEBH | | Sutter East Bay Hospitals |
| SGMF | | Sutter Gould Medical Foundation |
| SHlth | | Sutter Health |
| SJHCN | | St. Joseph Home Care Network |
| SJHE | | St. Joseph Hospital of Eureka |
| SJHO | | St. Joseph Hospital of Orange |
| SJHosp | | St. Jude Hospital |
| SJHS | | St. Joseph Health System |
| SL2016 | | Senior Living 2016 |
| SLC | | Senior Living Chesteron |
| SLF | | Senior Living Fairfield |
| SLFW | | Senior Living Fort Wayne |
| SLW | | Senior Living Waterville |
| SMH | | South Miami Hospital |
| SMMCtr | | St. Mary’s Medical Center |
| SVlyH | | Sutter Valley Hospitals |
| SVMF | | Sutter Vialley Medical Foundation |
| SVNA&H | | Sutter Visiting Nurse Association & Hospice |
| |
| TAH | | Titusville Area Hospital |
| TAHC | | Titusville Area Health Center |
| TAHCF | | Titusville Area Health Foundation |
| TAHS | | Titusville Area Health Service |
| TASC | | Tobacco Settlement Asset-Backed Bonds |
| UDC | | Urban Development Corporation |
| VOA | | Volunteers of America |
| WAFMH | | W A Foote Memorial Hospital |
| WICF | | W.I. Cook Foundation |
| WKBP | | West Kendall Baptist Hospital |
See accompanying Notes to Financial Statements.
|
| 59 OPPENHEIMER ROCHESTER HIGH YIELD MUNICIPAL FUND |
STATEMENT OF ASSETS AND LIABILITIES July 31, 2017
| | | | |
| |
| Assets | | | | |
| Investments, at value (cost $7,349,863,491)—see accompanying statement of investments | | $ | 6,539,752,969 | |
| |
| Cash | | | 983,350 | |
| |
| Receivables and other assets: | | | | |
| Interest | | | 64,234,123 | |
| Shares of beneficial interest sold | | | 9,396,318 | |
| Investments sold on a when-issued or delayed delivery basis | | | 3,204,965 | |
| Other | | | 2,311,464 | |
| | | | |
| Total assets | | | 6,619,883,189 | |
| |
| Liabilities | | | | |
| Payables and other liabilities: | | | | |
| Payable for short-term floating rate notes issued (See Note 4) | | | 522,985,000 | |
| Payable for borrowings (See Note 9) | | | 193,700,000 | |
| Investments purchased on a when-issued or delayed delivery basis | | | 56,170,281 | |
| Shares of beneficial interest redeemed | | | 5,769,449 | |
| Dividends | | | 5,586,092 | |
| Distribution and service plan fees | | | 844,320 | |
| Trustees’ compensation | | | 648,513 | |
| Interest expense on borrowings | | | 165,883 | |
| Shareholder communications | | | 19,569 | |
| Other | | | 652,239 | |
| | | | |
| Total liabilities | | | 786,541,346 | |
| |
| Net Assets | | $ | 5,833,341,843 | |
| | | | |
| | | | |
| |
| Composition of Net Assets | | | | |
| Paid-in capital | | $ | 8,604,381,110 | |
| |
| Accumulated net investment income | | | 95,220,787 | |
| |
| Accumulated net realized loss on investments | | | (2,056,149,532) | |
| |
| Net unrealized depreciation on investments | | | (810,110,522) | |
| | | | |
Net Assets | | $ | 5,833,341,843 | |
| | | | |
|
| 60 OPPENHEIMER ROCHESTER HIGH YIELD MUNICIPAL FUND |
| | | | |
| |
| Net Asset Value Per Share | | | | |
Class A Shares: | | | | |
Net asset value and redemption price per share (based on net assets of $3,182,442,684 and 438,013,675 shares of beneficial interest outstanding) | | $ | 7.27 | |
| Maximum offering price per share (net asset value plus sales charge of 4.75% of offering price) | | $ | 7.63 | |
| |
| |
Class B Shares: | | | | |
| Net asset value, redemption price (excludes applicable contingent deferred sales charge) and offering price per share (based on net assets of $15,244,223 and 2,087,525 shares of beneficial interest outstanding) | | $ | 7.30 | |
| |
| |
Class C Shares: | | | | |
| Net asset value, redemption price (excludes applicable contingent deferred sales charge) and offering price per share (based on net assets of $1,301,304,452 and 179,837,218 shares of beneficial interest outstanding) | | $ | 7.24 | |
| |
| |
Class Y Shares: | | | | |
| Net asset value, redemption price and offering price per share (based on net assets of $1,334,350,484 and 183,831,829 shares of beneficial interest outstanding) | | $ | 7.26 | |
See accompanying Notes to Financial Statements.
|
| 61 OPPENHEIMER ROCHESTER HIGH YIELD MUNICIPAL FUND |
STATEMENT OF
OPERATIONS For the Year Ended July 31, 2017
| | | | |
| Investment Income | | | | |
| Interest | | $ | 356,924,691 | |
| Dividends | | | 10,657 | |
| | | | |
Total investment income | | | 356,935,348 | |
| Expenses | | | | |
| Management fees | | | 20,865,458 | |
| Distribution and service plan fees: | | | | |
| Class A | | | 5,745,204 | |
| Class B | | | 195,298 | |
| Class C | | | 11,945,026 | |
| Transfer and shareholder servicing agent fees: | | | | |
| Class A | | | 3,159,413 | |
| Class B | | | 21,712 | |
| Class C | | | 1,327,390 | |
| Class Y | | | 1,060,187 | |
| Shareholder communications: | | | | |
| Class A | | | 42,540 | |
| Class B | | | 194 | |
| Class C | | | 24,331 | |
| Class Y | | | 14,410 | |
| Interest expense and fees on short-term floating rate notes issued (See Note 4) | | | 10,298,216 | |
| Borrowing fees | | | 6,896,100 | |
| Legal, auditing and other professional fees | | | 5,217,227 | |
| Interest expense on borrowings | | | 325,717 | |
| Trustees’ compensation | | | 85,144 | |
| Custodian fees and expenses | | | 38,281 | |
| Other | | | 58,714 | |
| | | | |
| Total expenses | | | 67,320,562 | |
Net Investment Income | | | 289,614,786 | |
| Realized and Unrealized Gain (Loss) | | | | |
| Net realized loss on investment transactions | | | (184,071,772) | |
| Net change in unrealized appreciation/depreciation on investment transactions | | | 132,331,091 | |
| Net Increase in Net Assets Resulting from Operations | | $ | 237,874,105 | |
| | | | |
See accompanying Notes to Financial Statements.
|
| 62 OPPENHEIMER ROCHESTER HIGH YIELD MUNICIPAL FUND |
STATEMENTS OF CHANGES IN NET ASSETS
| | | | | | | | |
| | | Year Ended July 31, 2017 | | | Year Ended July 31, 2016 | |
Operations | | | | | | | | |
Net investment income | | $ | 289,614,786 | | | $ | 331,235,088 | |
Net realized loss | | | (184,071,772 | ) | | | (2,076,581) | |
Net change in unrealized appreciation/depreciation | | | 132,331,091 | | | | 385,032,195 | |
| | | | |
Net increase in net assets resulting from operations | | | 237,874,105 | | | | 714,190,702 | |
Dividends and/or Distributions to Shareholders | | | | | | | | |
Dividends from net investment income: | | | | | | | | |
Class A | | | (185,836,275 | ) | | | (202,787,362) | |
Class B | | | (1,115,064 | ) | | | (2,211,758) | |
Class C | | | (68,905,668 | ) | | | (76,045,026) | |
Class Y | | | (64,206,346 | ) | | | (54,440,217) | |
| | | | |
| | | (320,063,353 | ) | | | (335,484,363) | |
Beneficial Interest Transactions | | | | | | | | |
Net increase (decrease) in net assets resulting from beneficial interest transactions: | | | | | | | | |
Class A | | | (15,209,173 | ) | | | 51,939,322 | |
Class B | | | (15,086,186 | ) | | | (21,534,658) | |
Class C | | | (51,062,821 | ) | | | 46,666,928 | |
Class Y | | | 424,801,625 | | | | 170,204,604 | |
| | | | |
| | | 343,443,445 | | | | 247,276,196 | |
Net Assets | | | | | | | | |
Total increase | | | 261,254,197 | | | | 625,982,535 | |
Beginning of period | | | 5,572,087,646 | | | | 4,946,105,111 | |
| | | | |
End of period (including accumulated net investment income of $95,220,787 and $90,404,914, respectively) | | $ | 5,833,341,843 | | | $ | 5,572,087,646 | |
| | | | |
See accompanying Notes to Financial Statements.
|
| 63 OPPENHEIMER ROCHESTER HIGH YIELD MUNICIPAL FUND |
STATEMENT OF
CASH FLOWS For the Year Ended July 31, 2017
| | | | |
| Cash Flows from Operating Activities | | | | |
Net increase in net assets from operations | | $ | 237,874,105 | |
Adjustments to reconcile net increase in net assets from operations to net cash used in operating activities: | | | | |
Purchase of investment securities | | | (2,437,576,456) | |
Proceeds from disposition of investment securities | | | 1,785,838,532 | |
Short-term investment securities, net | | | 100,427,999 | |
Premium amortization | | | 19,784,766 | |
Discount accretion | | | (96,593,963) | |
Net realized loss on investment transactions | | | 184,071,772 | |
Net change in unrealized appreciation/depreciation on investment transactions | | | (132,331,091) | |
Change in assets: | | | | |
Decrease in other assets | | | 52,226 | |
Decrease in interest receivable | | | 12,938,381 | |
Decrease in receivable for securities sold | | | 118,027,146 | |
Change in liabilities: | | | | |
Increase in other liabilities | | | 636,331 | |
Increase in payable for securities purchased | | | 9,737,675 | |
| | | | |
Net cash used in operating activities | | | (197,112,577) | |
| Cash Flows from Financing Activities | | | | |
Proceeds from borrowings | | | 786,300,000 | |
Payments on borrowings | | | (592,600,000) | |
Payments on short-term floating rate notes issued | | | (91,175,000) | |
Proceeds from shares sold | | | 1,881,115,804 | |
Payments on shares redeemed | | | (1,777,588,943) | |
Cash distributions paid | | | (53,544,658) | |
| | | | |
Net cash provided by financing activities | | | 152,507,203 | |
Net decrease in cash | | | (44,605,374) | |
Cash, beginning balance | | | 45,588,724 | |
| | | | |
Cash, ending balance | | $ | 983,350 | |
| | | | |
Supplemental disclosure of cash flow information:
Noncash financing activities not included herein consist of reinvestment of dividends and distributions of $265,779,175.
Cash paid for interest on borrowings—$159,834.
Cash paid for interest on short-term floating rate notes issued— $10,298,216.
See accompanying Notes to Financial Statements.
|
| 64 OPPENHEIMER ROCHESTER HIGH YIELD MUNICIPAL FUND |
FINANCIAL HIGHLIGHTS
| | | | | | | | | | | | | | | | | | | | |
| Class A | | Year Ended
July 31, 2017 | | | Year Ended
July 31, 2016 | | | Year Ended
July 31, 2015 | | | Year Ended
July 31, 2014 | | | Year Ended
July 31, 2013 | |
| |
| Per Share Operating Data | | | | | | | | | | | | | | | | | | | | |
| Net asset value, beginning of period | | | $7.37 | | | | $6.86 | | | | $7.01 | | | | $6.87 | | | | $7.50 | |
| |
| Income (loss) from investment operations: | | | | | | | | | | | | | | | | | | | | |
| Net investment income1 | | | 0.39 | | | | 0.46 | | | | 0.51 | | | | 0.50 | | | | 0.51 | |
| Net realized and unrealized gain (loss) | | | (0.07) | | | | 0.52 | | | | (0.18) | | | | 0.13 | | | | (0.65) | |
| | | | |
| Total from investment operations | | | 0.32 | | | | 0.98 | | | | 0.33 | | | | 0.63 | | | | (0.14) | |
| |
| Dividends and/or distributions to shareholders: | | | | | | | | | | | | | | | | | | | | |
| Dividends from net investment income | | | (0.42) | | | | (0.47) | | | | (0.48) | | | | (0.49) | | | | (0.49) | |
| |
| Net asset value, end of period | | | $7.27 | | | | $7.37 | | | | $6.86 | | | | $7.01 | | | | $6.87 | |
| | | | |
|
| |
| Total Return, at Net Asset Value2 | | | 4.47% | | | | 14.91% | | | | 4.59% | | | | 9.63% | | | | (2.19)% | |
|
| |
| Ratios/Supplemental Data | | | | | | | | | | | | | | | | | | | | |
| Net assets, end of period (in thousands) | | | $3,182,443 | | | | $3,245,013 | | | | $2,968,690 | | | | $3,260,438 | | | | $3,688,901 | |
| |
| Average net assets (in thousands) | | | $3,159,138 | | | | $3,064,632 | | | | $3,258,788 | | | | $3,477,994 | | | | $4,450,000 | |
| |
| Ratios to average net assets:3 | | | | | | | | | | | | | | | | | | | | |
| Net investment income | | | 5.36% | | | | 6.54% | | | | 7.19% | | | | 7.24% | | | | 6.69% | |
| Expenses excluding specific expenses listed below | | | 0.75% | | | | 0.74% | | | | 0.74% | | | | 0.71% | | | | 0.73% | |
| Interest and fees from borrowings | | | 0.13% | | | | 0.09% | | | | 0.08% | | | | 0.09% | | | | 0.10% | |
| Interest and fees on short-term floating rate notes issued4 | | | 0.18% | | | | 0.17% | | | | 0.17% | | | | 0.25% | | | | 0.25% | |
| | | | |
| Total expenses | | | 1.06% | | | | 1.00% | | | | 0.99% | | | | 1.05% | | | | 1.08% | |
| Expenses after payments, waivers and/or reimbursements and reduction to custodian expenses | | | 1.06% | | | | 1.00% | | | | 0.99% | | | | 1.05%5 | | | | 1.08%5 | |
| |
| Portfolio turnover rate | | | 29% | | | | 20% | | | | 16% | | | | 16% | | | | 18% | |
1. Per share amounts calculated based on the average shares outstanding during the period.
2. Assumes an initial investment on the business day before the first day of the fiscal period, with all dividends and distributions reinvested in additional shares on the reinvestment date, and redemption at the net asset value calculated on the last business day of the fiscal period. Sales charges are not reflected in the total returns. Total returns are not annualized for periods less than one full year. Returns do not reflect the deduction of taxes that a shareholder would pay on fund distributions or the redemption of fund shares.
3. Annualized for periods less than one full year.
4. Interest and fee expense related to the Fund’s liability for short-term floating rate notes issued in conjunction with inverse floating rate securities.
5. Waiver was less than 0.005%.
See accompanying Notes to Financial Statements.
|
| 65 OPPENHEIMER ROCHESTER HIGH YIELD MUNICIPAL FUND |
FINANCIAL HIGHLIGHTS Continued
| | | | | | | | | | | | | | | | | | | | |
| Class B | | Year Ended
July 31, 2017 | | | Year Ended
July 31, 2016 | | | Year Ended
July 31, 2015 | | | Year Ended
July 31, 2014 | | | Year Ended
July 31, 2013 | |
| |
| Per Share Operating Data | | | | | | | | | | | | | | | | | | | | |
| Net asset value, beginning of period | | | $7.41 | | | | $6.89 | | | | $7.04 | | | | $6.89 | | | | $7.53 | |
| |
| Income (loss) from investment operations: | | | | | | | | | | | | | | | | | | | | |
| Net investment income1 | | | 0.35 | | | | 0.41 | | | | 0.46 | | | | 0.45 | | | | 0.45 | |
| Net realized and unrealized gain (loss) | | | (0.09) | | | | 0.52 | | | | (0.19) | | | | 0.14 | | | | (0.66) | |
| | | | |
| Total from investment operations | | | 0.26 | | | | 0.93 | | | | 0.27 | | | | 0.59 | | | | (0.21) | |
| |
| Dividends and/or distributions to shareholders: | | | | | | | | | | | | | | | | | | | | |
| Dividends from net investment income | | | (0.37) | | | | (0.41) | | | | (0.42) | | | | (0.44) | | | | (0.43) | |
| |
| Net asset value, end of period | | | $7.30 | | | | $7.41 | | | | $6.89 | | | | $7.04 | | | | $6.89 | |
| | | | |
|
| |
| Total Return, at Net Asset Value2 | | | 3.55% | | | | 14.14% | | | | 3.79% | | | | 8.89% | | | | (3.12)% | |
|
| |
| Ratios/Supplemental Data | | | | | | | | | | | | | | | | | | | | |
| Net assets, end of period (in thousands) | | | $15,244 | | | | $30,878 | | | | $49,792 | | | | $77,369 | | | | $107,602 | |
| |
| Average net assets (in thousands) | | | $21,639 | | | | $37,720 | | | | $65,703 | | | | $90,234 | | | | $142,525 | |
| |
| Ratios to average net assets:3 | | | | | | | | | | | | | | | | | | | | |
| Net investment income | | | 4.83% | | | | 5.84% | | | | 6.43% | | | | 6.49% | | | | 5.86% | |
| Expenses excluding specific expenses listed below | | | 1.47% | | | | 1.49% | | | | 1.50% | | | | 1.49% | | | | 1.56% | |
| Interest and fees from borrowings | | | 0.13% | | | | 0.09% | | | | 0.08% | | | | 0.09% | | | | 0.10% | |
| Interest and fees on short-term floating rate notes issued4 | | | 0.18% | | | | 0.17% | | | | 0.17% | | | | 0.25% | | | | 0.25% | |
| | | | |
| Total expenses | | | 1.78% | | | | 1.75% | | | | 1.75% | | | | 1.83% | | | | 1.91% | |
| Expenses after payments, waivers and/or reimbursements and reduction to custodian expenses | | | 1.78% | | | | 1.75% | | | | 1.75% | | | | 1.83%5 | | | | 1.91%5 | |
| |
| Portfolio turnover rate | | | 29% | | | | 20% | | | | 16% | | | | 16% | | | | 18% | |
1. Per share amounts calculated based on the average shares outstanding during the period.
2. Assumes an initial investment on the business day before the first day of the fiscal period, with all dividends and distributions reinvested in additional shares on the reinvestment date, and redemption at the net asset value calculated on the last business day of the fiscal period. Sales charges are not reflected in the total returns. Total returns are not annualized for periods less than one full year. Returns do not reflect the deduction of taxes that a shareholder would pay on fund distributions or the redemption of fund shares.
3. Annualized for periods less than one full year.
4. Interest and fee expense related to the Fund’s liability for short-term floating rate notes issued in conjunction with inverse floating rate securities.
5. Waiver was less than 0.005%.
See accompanying Notes to Financial Statements.
|
| 66 OPPENHEIMER ROCHESTER HIGH YIELD MUNICIPAL FUND |
| | | | | | | | | | | | | | | | | | | | |
| Class C | | Year Ended
July 31, 2017 | | | Year Ended
July 31, 2016 | | | Year Ended
July 31, 2015 | | | Year Ended
July 31, 2014 | | | Year Ended
July 31, 2013 | |
| |
| Per Share Operating Data | | | | | | | | | | | | | | | | | | | | |
| Net asset value, beginning of period | | | $7.35 | | | | $6.83 | | | | $6.99 | | | | $6.85 | | | | $7.48 | |
| |
| Income (loss) from investment operations: | | | | | | | | | | | | | | | | | | | | |
| Net investment income1 | | | 0.33 | | | | 0.41 | | | | 0.46 | | | | 0.44 | | | | 0.45 | |
| Net realized and unrealized gain (loss) | | | (0.07) | | | | 0.53 | | | | (0.20) | | | | 0.14 | | | | (0.65) | |
| | | | |
| Total from investment operations | | | 0.26 | | | | 0.94 | | | | 0.26 | | | | 0.58 | | | | (0.20) | |
| |
| Dividends and/or distributions to shareholders: | | | | | | | | | | | | | | | | | | | | |
| Dividends from net investment income | | | (0.37) | | | | (0.42) | | | | (0.42) | | | | (0.44) | | | | (0.43) | |
| |
| Net asset value, end of period | | | $7.24 | | | | $7.35 | | | | $6.83 | | | | $6.99 | | | | $6.85 | |
| | | | |
|
| |
| Total Return, at Net Asset Value2 | | | 3.74% | | | | 14.13% | | | | 3.68% | | | | 8.84% | | | | (2.94)% | |
|
| |
| Ratios/Supplemental Data | | | | | | | | | | | | | | | | | | | | |
| Net assets, end of period (in thousands) | | | $1,301,304 | | | | $1,375,239 | | | | $1,234,906 | | | | $1,311,700 | | | | $1,463,567 | |
| |
| Average net assets (in thousands) | | | $1,327,082 | | | | $1,289,508 | | | | $1,344,166 | | | | $1,337,849 | | | | $1,735,006 | |
| |
| Ratios to average net assets:3 | | | | | | | | | | | | | | | | | | | | |
| Net investment income | | | 4.66% | | | | 5.80% | | | | 6.43% | | | | 6.49% | | | | 5.92% | |
| Expenses excluding specific expenses listed below | | | 1.47% | | | | 1.49% | | | | 1.50% | | | | 1.47% | | | | 1.50% | |
| Interest and fees from borrowings | | | 0.13% | | | | 0.09% | | | | 0.08% | | | | 0.09% | | | | 0.10% | |
| Interest and fees on short-term floating rate notes issued4 | | | 0.18% | | | | 0.17% | | | | 0.17% | | | | 0.25% | | | | 0.25% | |
| | | | |
| Total expenses | | | 1.78% | | | | 1.75% | | | | 1.75% | | | | 1.81% | | | | 1.85% | |
| Expenses after payments, waivers and/or reimbursements and reduction to custodian expenses | | | 1.78% | | | | 1.75% | | | | 1.75% | | | | 1.81%5 | | | | 1.85%5 | |
| |
| Portfolio turnover rate | | | 29% | | | | 20% | | | | 16% | | | | 16% | | | | 18% | |
1. Per share amounts calculated based on the average shares outstanding during the period.
2. Assumes an initial investment on the business day before the first day of the fiscal period, with all dividends and distributions reinvested in additional shares on the reinvestment date, and redemption at the net asset value calculated on the last business day of the fiscal period. Sales charges are not reflected in the total returns. Total returns are not annualized for periods less than one full year. Returns do not reflect the deduction of taxes that a shareholder would pay on fund distributions or the redemption of fund shares.
3. Annualized for periods less than one full year.
4. Interest and fee expense related to the Fund’s liability for short-term floating rate notes issued in conjunction with inverse floating rate securities.
5. Waiver was less than 0.005%.
See accompanying Notes to Financial Statements.
|
| 67 OPPENHEIMER ROCHESTER HIGH YIELD MUNICIPAL FUND |
FINANCIAL HIGHLIGHTS Continued
| | | | | | | | | | | | | | | | | | | | |
| Class Y | | Year Ended
July 31, 2017 | | | Year Ended
July 31, 2016 | | | Year Ended
July 31, 2015 | | | Year Ended
July 31, 2014 | | | Year Ended
July 31, 2013 | |
| |
| Per Share Operating Data | | | | | | | | | | | | | | | | | | | | |
| Net asset value, beginning of period | | | $7.37 | | | | $6.85 | | | | $7.00 | | | | $6.86 | | | | $7.50 | |
| |
| Income (loss) from investment operations: | | | | | | | | | | | | | | | | | | | | |
| Net investment income1 | | | 0.39 | | | | 0.47 | | | | 0.52 | | | | 0.50 | | | | 0.52 | |
| Net realized and unrealized gain (loss) | | | (0.06) | | | | 0.53 | | | | (0.18) | | | | 0.14 | | | | (0.66) | |
| | | | |
| Total from investment operations | | | 0.33 | | | | 1.00 | | | | 0.34 | | | | 0.64 | | | | (0.14) | |
| |
| Dividends and/or distributions to shareholders: | | | | | | | | | | | | | | | | | | | | |
| Dividends from net investment income | | | (0.44) | | | | (0.48) | | | | (0.49) | | | | (0.50) | | | | (0.50) | |
| |
| Net asset value, end of period | | | $7.26 | | | | $7.37 | | | | $6.85 | | | | $7.00 | | | | $6.86 | |
| | | | |
|
| |
| Total Return, at Net Asset Value2 | | | 4.66% | | | | 15.10% | | | | 4.61% | | | | 9.96% | | | | (2.19)% | |
|
| |
| Ratios/Supplemental Data | | | | | | | | | | | | | | | | | | | | |
| Net assets, end of period (in thousands) | | | $1,334,351 | | | | $920,958 | | | | $692,717 | | | | $562,641 | | | | $472,068 | |
| |
| Average net assets (in thousands) | | | $1,061,569 | | | | $804,978 | | | | $700,339 | | | | $501,364 | | | | $572,611 | |
| |
| Ratios to average net assets:3 | | | | | | | | | | | | | | | | | | | | |
| Net investment income | | | 5.40% | | | | 6.68% | | | | 7.33% | | | | 7.36% | | | | 6.83% | |
| Expenses excluding specific expenses listed below | | | 0.57% | | | | 0.59% | | | | 0.59% | | | | 0.56% | | | | 0.59% | |
| Interest and fees from borrowings | | | 0.13% | | | | 0.09% | | | | 0.08% | | | | 0.09% | | | | 0.10% | |
| Interest and fees on short-term floating rate notes issued4 | | | 0.18% | | | | 0.17% | | | | 0.17% | | | | 0.25% | | | | 0.25% | |
| | | | |
| Total expenses | | | 0.88% | | | | 0.85% | | | | 0.84% | | | | 0.90% | | | | 0.94% | |
| Expenses after payments, waivers and/or reimbursements and reduction to custodian expenses | | | 0.88% | | | | 0.85% | | | | 0.84% | | | | 0.90% | | | | 0.94%5 | |
| |
| Portfolio turnover rate | | | 29% | | | | 20% | | | | 16% | | | | 16% | | | | 18% | |
1. Per share amounts calculated based on the average shares outstanding during the period.
2. Assumes an initial investment on the business day before the first day of the fiscal period, with all dividends and distributions reinvested in additional shares on the reinvestment date, and redemption at the net asset value calculated on the last business day of the fiscal period. Sales charges are not reflected in the total returns. Total returns are not annualized for periods less than one full year. Returns do not reflect the deduction of taxes that a shareholder would pay on fund distributions or the redemption of fund shares.
3. Annualized for periods less than one full year.
4. Interest and fee expense related to the Fund’s liability for short-term floating rate notes issued in conjunction with inverse floating rate securities.
5. Waiver was less than 0.005%.
See accompanying Notes to Financial Statements.
|
| 68 OPPENHEIMER ROCHESTER HIGH YIELD MUNICIPAL FUND |
NOTES TO FINANCIAL STATEMENTS July 31, 2017
1. Organization
Oppenheimer Rochester High-Yield Municipal Fund (the “Fund”) is a separate series of Oppenheimer Multi-State Municipal Trust, a diversified, open-end management investment company registered under the Investment Company Act of 1940 (“1940 Act”), as amended. The Fund’s investment objective is to seek tax-free income. The Fund’s investment adviser is OFI Global Asset Management, Inc. (“OFI Global” or the “Manager”), a wholly-owned subsidiary of OppenheimerFunds, Inc. (“OFI” or the “Sub-Adviser”). The Manager has entered into a sub-advisory agreement with OFI.
The Fund offers Class A, Class C and Class Y shares, and previously offered Class B shares for new purchase through June 29, 2012. Subsequent to that date, no new purchases of Class B shares are permitted, however reinvestment of dividend and/or capital gain distributions and exchanges of Class B shares into and from other Oppenheimer funds are allowed. Class A shares are sold at their offering price, which is normally net asset value plus a front-end sales charge. Class C shares are sold, and Class B shares were sold, without a front-end sales charge but may be subject to a contingent deferred sales charge (“CDSC”). Class Y shares are sold to certain institutional investors or intermediaries without either a front-end sales charge or a CDSC, however, the intermediaries may impose charges on their accountholders who beneficially own Class Y shares. All classes of shares have identical rights and voting privileges with respect to the Fund in general and exclusive voting rights on matters that affect that class alone. Earnings, net assets and net asset value per share may differ due to each class having its own expenses, such as transfer and shareholder servicing agent fees and shareholder communications, directly attributable to that class. Class A, B and C shares have separate distribution and/or service plans under which they pay fees. Class Y shares do not pay such fees. Class B shares will automatically convert to Class A shares 72 months after the date of purchase.
The following is a summary of significant accounting policies followed in the Fund’s preparation of financial statements in accordance with accounting principles generally accepted in the United States (“U.S. GAAP”).
2. Significant Accounting Policies
Security Valuation. All investments in securities are recorded at their estimated fair value, as described in Note 3.
Allocation of Income, Expenses, Gains and Losses. Income, expenses (other than those attributable to a specific class), gains and losses are allocated on a daily basis to each class of shares based upon the relative proportion of net assets represented by such class. Operating expenses directly attributable to a specific class are charged against the operations of that class.
Dividends and Distributions to Shareholders. Dividends and distributions to shareholders, which are determined in accordance with income tax regulations and may differ from U.S. GAAP, are recorded on the ex-dividend date. Income distributions, if any,
|
| 69 OPPENHEIMER ROCHESTER HIGH YIELD MUNICIPAL FUND |
NOTES TO FINANCIAL STATEMENTS Continued
2. Significant Accounting Policies (Continued)
are declared daily and paid monthly. Capital gain distributions, if any, are declared and paid annually or at other times as deemed necessary by the Manager.
Investment Income. Dividend income is recorded on the ex-dividend date or upon ex-dividend notification in the case of certain foreign dividends where the ex-dividend date may have passed. Non-cash dividends included in dividend income, if any, are recorded at the fair value of the securities received. Withholding taxes on foreign dividends, if any, and capital gains taxes on foreign investments, if any, have been provided for in accordance with the Fund’s understanding of the applicable tax rules and regulations. Interest income is recognized on an accrual basis. Discount and premium, which are included in interest income on the Statement of Operations, are amortized or accreted daily.
Custodian Fees. “Custodian fees and expenses” in the Statement of Operations may include interest expense incurred by the Fund on any cash overdrafts of its custodian account during the period. Such cash overdrafts may result from the effects of failed trades in portfolio securities and from cash outflows resulting from unanticipated shareholder redemption activity. The Fund pays interest to its custodian on such cash overdraft at a rate equal to the Prime Rate plus 0.35%. The “Reduction to custodian expenses” line item, if applicable, represents earnings on cash balances maintained by the Fund during the period. Such interest expense and other custodian fees may be paid with these earnings.
Security Transactions. Security transactions are recorded on the trade date. Realized gains and losses on securities sold are determined on the basis of identified cost.
Indemnifications. The Fund’s organizational documents provide current and former Trustees and officers with a limited indemnification against liabilities arising in connection with the performance of their duties to the Fund. In the normal course of business, the Fund may also enter into contracts that provide general indemnifications. The Fund’s maximum exposure under these arrangements is unknown as this would be dependent on future claims that may be made against the Fund. The risk of material loss from such claims is considered remote.
Federal Taxes. The Fund intends to comply with provisions of the Internal Revenue Code applicable to regulated investment companies and to distribute substantially all of its investment company taxable income, including any net realized gain on investments not offset by capital loss carryforwards, if any, to shareholders. Therefore, no federal income or excise tax provision is required. The Fund files income tax returns in U.S. federal and applicable state jurisdictions. The statute of limitations on the Fund’s tax return filings generally remains open for the three preceding fiscal reporting period ends. The Fund has analyzed its tax positions for the fiscal year ended July 31, 2017, including open tax years, and does not believe there are any uncertain tax positions requiring recognition in the Fund’s financial statements.
The tax components of capital shown in the following table represent distribution
|
| 70 OPPENHEIMER ROCHESTER HIGH YIELD MUNICIPAL FUND |
2. Significant Accounting Policies (Continued)
requirements the Fund must satisfy under the income tax regulations, losses the Fund may be able to offset against income and gains realized in future years and unrealized appreciation or depreciation of securities and other investments for federal income tax purposes.
| | | | | | | | | | | | |
Undistributed Net Investment Income | | Undistributed
Long-Term
Gain | | | Accumulated Loss
Carryforward1,2,3,4 | | | Net Unrealized
Depreciation
Based on cost of
Securities and
Other Investments
for Federal Income
Tax Purposes | |
| |
| $298,469,974 | | | $— | | | | $2,051,407,963 | | | | $812,991,290 | |
1. At period end, the Fund had $2,051,407,963 of net capital loss carryforward available to offset future realized capital gains, if any, and thereby reduce future taxable gain distributions. Details of the capital loss carryforwards are included in the table below. Capital loss carryovers with no expiration, if any, must be utilized prior to those with expiration dates.
| | | | |
| Expiring | | | |
| |
| 2018 | | $ | 915,944,693 | |
| 2019 | | | 35,463,515 | |
| No expiration | | | 1,099,999,755 | |
| | | | |
| Total | | $ | 2,051,407,963 | |
| | | | |
2. During the reporting period, the Fund did not utilize any capital loss carryforward.
3. During the previous reporting period, the Fund utilized $17,180,805 of capital loss carryforward to offset capital gains realized in that fiscal year.
4. During the reporting period, $566,789,505 of unused capital loss carryforward expired.
Net investment income (loss) and net realized gain (loss) may differ for financial statement and tax purposes. The character of dividends and distributions made during the fiscal year from net investment income or net realized gains are determined in accordance with federal income tax requirements, which may differ from the character of net investment income or net realized gains presented in those financial statements in accordance with U.S. GAAP. Also, due to timing of dividends and distributions, the fiscal year in which amounts are distributed may differ from the fiscal year in which the income or net realized gain was recorded by the Fund.
Accordingly, the following amounts have been reclassified for the reporting period. Net assets of the Fund were unaffected by the reclassifications.
| | | | | | | | |
Reduction
to Paid-in Capital | | Increase
to Accumulated
Net Investment
Income | | | Reduction
to Accumulated Net
Realized Loss
on Investments | |
| |
| $567,915,819 | | | $35,264,440 | | | | $532,651,379 | |
The tax character of distributions paid during the reporting periods:
|
| 71 OPPENHEIMER ROCHESTER HIGH YIELD MUNICIPAL FUND |
NOTES TO FINANCIAL STATEMENTS Continued
2. Significant Accounting Policies (Continued)
| | | | | | | | |
| | | Year Ended
July 31, 2017 | | | Year Ended
July 31, 2016 | |
| |
| Distributions paid from: | | | | | | | | |
| Exempt-interest dividends | | $ | 312,380,979 | | | $ | 330,474,963 | |
| Ordinary income | | | 7,682,374 | | | | 5,009,400 | |
| | | | |
| Total | | $ | 320,063,353 | | | $ | 335,484,363 | |
| | | | |
The aggregate cost of securities and other investments and the composition of unrealized appreciation and depreciation of securities and other investments for federal income tax purposes at period end are noted in the following table. The primary difference between book and tax appreciation or depreciation of securities and other investments, if applicable, is attributable to the tax deferral of losses or tax realization of financial statement unrealized gain or loss.
| | | | |
| Federal tax cost of securities | | $ | 6,806,154,9401 | |
| | | | |
| Gross unrealized appreciation | | $ | 384,170,429 | |
| Gross unrealized depreciation | | | (1,197,161,719) | |
| | | | |
| Net unrealized depreciation | | $ | (812,991,290) | |
| | | | |
1. The Federal tax cost of securities does not include cost of $546,589,319, which has otherwise been recognized for financial reporting purposes, related to bonds placed into trusts in conjunction with certain investment transactions. See the Inverse Floating Rate Securities note in Note 4.
Use of Estimates. The preparation of financial statements in conformity with U.S. GAAP requires management to make estimates and assumptions that affect the reported amounts of assets and liabilities and disclosure of contingent assets and liabilities at the date of the financial statements and the reported amounts of increases and decreases in net assets from operations during the reporting period. Actual results could differ from those estimates.
Recent Accounting Pronouncement. In October 2016, the Securities and Exchange Commission (“SEC”) adopted amendments to rules under the Investment Company Act of 1940 (“final rules”) intended to modernize the reporting and disclosure of information by registered investment companies. The final rules amend Regulation S-X and require funds to provide standardized, enhanced derivative disclosure in fund financial statements in a format designed for individual investors. The amendments to Regulation S-X also update the disclosures for other investments and investments in, and advances to affiliates and amend the rules regarding the general form and content of fund financial statements. The compliance date for the amendments to Regulation S-X is for reporting periods ended after August 1, 2017. The implementation of the rules will not have a material impact on the Fund’s financial statements.
3. Securities Valuation
The Fund calculates the net asset value of its shares as of 4:00 P.M. Eastern time, on each day
|
| 72 OPPENHEIMER ROCHESTER HIGH YIELD MUNICIPAL FUND |
3. Securities Valuation (Continued)
the New York Stock Exchange (the “Exchange”) is open for trading, except in the case of a scheduled early closing of the Exchange, in which case the Fund will calculate net asset value of the shares as of the scheduled early closing time of the Exchange.
The Fund’s Board has adopted procedures for the valuation of the Fund’s securities and has delegated the day-to-day responsibility for valuation determinations under those procedures to the Manager. The Manager has established a Valuation Committee which is responsible for determining a fair valuation for any security for which market quotations are not readily available. The Valuation Committee’s fair valuation determinations are subject to review, approval and ratification by the Fund’s Board at its next regularly scheduled meeting covering the calendar quarter in which the fair valuation was determined.
Valuation Methods and Inputs
Securities are valued primarily using unadjusted quoted market prices, when available, as supplied by third party pricing services or broker-dealers.
The following methodologies are used to determine the market value or the fair value of the types of securities described below:
Equity securities traded on a securities exchange (including exchange-traded derivatives other than futures and futures options) are valued based on the official closing price on the principal exchange on which the security is traded, as identified by the Manager, prior to the time when the Fund’s assets are valued. If the official closing price is unavailable, the security is valued at the last sale price on the principal exchange on which it is traded, or if no sales occurred, the security is valued at the mean between the quoted bid and asked prices. Over-the-counter equity securities are valued at the last published sale price, or if no sales occurred, at the mean between the quoted bid and asked prices. Events occurring after the close of trading on foreign exchanges may result in adjustments to the valuation of foreign securities to more accurately reflect their fair value as of the time when the Fund’s assets are valued.
Corporate and government debt securities (of U.S. or foreign issuers) and municipal debt securities, short-term notes, mortgage-backed securities, collateralized mortgage obligations, and asset-backed securities are valued at the mean between the bid and asked prices utilizing evaluated prices obtained from third party pricing services or broker-dealers who may use matrix pricing methods to determine the evaluated prices. Pricing services generally price debt securities assuming orderly transactions of an institutional “round lot” size, but some trades may occur in smaller, “odd lot” sizes, sometimes at lower prices than institutional round lot trades. Standard inputs generally considered by third-party pricing vendors include reported trade data, broker-dealer price quotations, benchmark yields, issuer spreads on comparable securities, the credit quality, yield, maturity, as well as other appropriate factors.
Loans are valued at the mean between the bid and asked prices utilizing evaluated prices obtained from third party pricing services or broker-dealers. Standard inputs generally considered by third-party pricing vendors include information obtained from market participants regarding broker-dealer price quotations.
Securities for which market quotations are not readily available or a significant event has occurred that would materially affect the value of the security, the security is fair valued
|
| 73 OPPENHEIMER ROCHESTER HIGH YIELD MUNICIPAL FUND |
NOTES TO FINANCIAL STATEMENTS Continued
3. Securities Valuation (Continued)
either (i) by a standardized fair valuation methodology applicable to the security type or the significant event as previously approved by the Valuation Committee and the Fund’s Board or (ii) as determined in good faith by the Manager’s Valuation Committee. The Valuation Committee considers all relevant facts that are reasonably available, through either public information or information available to the Manager, when determining the fair value of a security. Those standardized fair valuation methodologies include, but are not limited to, valuing securities at the last sale price or initially at cost and subsequently adjusting the value based on: changes in company specific fundamentals, changes in an appropriate securities index, or changes in the value of similar securities which may be further adjusted for any discounts related to security-specific resale restrictions. When possible, such methodologies use observable market inputs such as unadjusted quoted prices of similar securities, observable interest rates, currency rates and yield curves. The methodologies used for valuing securities are not necessarily an indication of the risks associated with investing in those securities nor can it be assured that the Fund can obtain the fair value assigned to a security if it were to sell the security.
To assess the continuing appropriateness of security valuations, the Manager regularly compares prior day prices and sale prices to the current day prices and challenges those prices exceeding certain tolerance levels with the third party pricing service or broker source. For those securities valued by fair valuations, whether through a standardized fair valuation methodology or a fair valuation determination, the Valuation Committee reviews and affirms the reasonableness of the valuations based on such methodologies and fair valuation determinations on a regular basis after considering all relevant information that is reasonably available.
Classifications
Each investment asset or liability of the Fund is assigned a level at measurement date based on the significance and source of the inputs to its valuation. Various data inputs may be used in determining the value of each of the Fund’s investments as of the reporting period end. These data inputs are categorized in the following hierarchy under applicable financial accounting standards:
1) Level 1-unadjusted quoted prices in active markets for identical assets or liabilities (including securities actively traded on a securities exchange)
2) Level 2-inputs other than unadjusted quoted prices that are observable for the asset or liability (such as unadjusted quoted prices for similar assets and market corroborated inputs such as interest rates, prepayment speeds, credit risks, etc.)
3) Level 3-significant unobservable inputs (including the Manager’s own judgments about assumptions that market participants would use in pricing the asset or liability).
The inputs used for valuing securities are not necessarily an indication of the risks associated with investing in those securities.
The table below categorizes amounts that are included in the Fund’s Statement of Assets and
|
| 74 OPPENHEIMER ROCHESTER HIGH YIELD MUNICIPAL FUND |
3. Securities Valuation (Continued)
Liabilities at period end based on valuation input level:
| | | | | | | | | | | | | | | | |
| | | Level 1—
Unadjusted
Quoted Prices | | | Level 2— Other Significant
Observable Inputs | | | Level 3—
Significant
Unobservable
Inputs | | | Value | |
| Assets Table | | | | | | | | | | | | | | | | |
| Investments, at Value: | | | | | | | | | | | | | | | | |
| Municipal Bonds and Notes | | | | | | | | | | | | | | | | |
Alabama | | $ | — | | | $ | 231,725,394 | | | $ | — | | | $ | 231,725,394 | |
Alaska | | | — | | | | 21,660,680 | | | | 198,875 | | | | 21,859,555 | |
Arizona | | | — | | | | 68,411,009 | | | | 4,102,307 | | | | 72,513,316 | |
Arkansas | | | — | | | | — | | | | 3,355,896 | | | | 3,355,896 | |
California | | | — | | | | 858,025,943 | | | | 20 | | | | 858,025,963 | |
Colorado | | | — | | | | 195,976,426 | | | | 3,623,602 | | | | 199,600,028 | |
Connecticut | | | — | | | | 52,153,715 | | | | — | | | | 52,153,715 | |
Delaware | | | — | | | | 7,542,426 | | | | — | | | | 7,542,426 | |
District of Columbia | | | — | | | | 154,017,278 | | | | — | | | | 154,017,278 | |
Florida | | | — | | | | 504,091,219 | | | | 26,285,478 | | | | 530,376,697 | |
Georgia | | | — | | | | 95,097,382 | | | | — | | | | 95,097,382 | |
Hawaii | | | — | | | | 2,416,557 | | | | — | | | | 2,416,557 | |
Idaho | | | — | | | | 1,257,788 | | | | — | | | | 1,257,788 | |
Illinois | | | — | | | | 372,735,026 | | | | 15,707,402 | | | | 388,442,428 | |
Indiana | | | — | | | | 87,851,976 | | | | — | | | | 87,851,976 | |
Iowa | | | — | | | | 22,615,169 | | | | 107,300 | | | | 22,722,469 | |
Kansas | | | — | | | | 1,886,318 | | | | — | | | | 1,886,318 | |
Kentucky | | | — | | | | 34,136,392 | | | | — | | | | 34,136,392 | |
Louisiana | | | — | | | | 35,902,906 | | | | — | | | | 35,902,906 | |
Maine | | | — | | | | 19,317,499 | | | | — | | | | 19,317,499 | |
Maryland | | | — | | | | 4,359,880 | | | | 807,409 | | | | 5,167,289 | |
Massachusetts | | | — | | | | 56,881,512 | | | | — | | | | 56,881,512 | |
Michigan | | | — | | | | 145,491,635 | | | | — | | | | 145,491,635 | |
Minnesota | | | — | | | | 38,899,424 | | | | — | | | | 38,899,424 | |
Mississippi | | | — | | | | 12,351,800 | | | | — | | | | 12,351,800 | |
Missouri | | | — | | | | 68,270,422 | | | | — | | | | 68,270,422 | |
Montana | | | — | | | | — | | | | 1,184,923 | | | | 1,184,923 | |
Nebraska | | | — | | | | 22,686,617 | | | | — | | | | 22,686,617 | |
Nevada | | | — | | | | 8,056,464 | | | | — | | | | 8,056,464 | |
New Hampshire | | | — | | | | 8,159,366 | | | | — | | | | 8,159,366 | |
New Jersey | | | — | | | | 249,309,716 | | | | — | | | | 249,309,716 | |
New Mexico | | | — | | | | 12,296,979 | | | | — | | | | 12,296,979 | |
New York | | | — | | | | 593,229,639 | | | | — | | | | 593,229,639 | |
North Carolina | | | — | | | | 12,673,405 | | | | — | | | | 12,673,405 | |
Ohio | | | — | | | | 541,694,164 | | | | 4 | | | | 541,694,168 | |
Oklahoma | | | — | | | | 8,535,816 | | | | — | | | | 8,535,816 | |
Oregon | | | — | | | | 5,172,935 | | | | — | | | | 5,172,935 | |
Pennsylvania | | | — | | | | 138,326,301 | | | | 4,346,107 | | | | 142,672,408 | |
Rhode Island | | | — | | | | 19,087,260 | | | | — | | | | 19,087,260 | |
South Carolina | | | — | | | | 29,968,129 | | | | 13,521,799 | | | | 43,489,928 | |
South Dakota | | | — | | | | 1,391,285 | | | | — | | | | 1,391,285 | |
Tennessee | | | — | | | | 27,304,887 | | | | — | | | | 27,304,887 | |
|
| 75 OPPENHEIMER ROCHESTER HIGH YIELD MUNICIPAL FUND |
NOTES TO FINANCIAL STATEMENTS Continued
3. Securities Valuation (Continued)
| | | | | | | | | | | | | | | | |
| | | Level 1—
Unadjusted
Quoted Prices | | | Level 2— Other Significant
Observable Inputs | | | Level 3—
Significant Unobservable Inputs | | | Value | |
| Municipal Bonds and Notes (Continued) | | | | | | | | | | | | | | | | |
Texas | | $ | — | | | $ | 607,110,583 | | | $ | 458 | | | $ | 607,111,041 | |
Utah | | | — | | | | 25,036,866 | | | | — | | | | 25,036,866 | |
Virginia | | | — | | | | 58,547,125 | | | | 6,676,524 | | | | 65,223,649 | |
Washington | | | — | | | | 116,718,972 | | | | — | | | | 116,718,972 | |
West Virginia | | | — | | | | 21,309,493 | | | | — | | | | 21,309,493 | |
Wisconsin | | | — | | | | 207,914,022 | | | | 37,800 | | | | 207,951,822 | |
U.S. Possessions | | | — | | | | 644,589,206 | | | | — | | | | 644,589,206 | |
| Corporate Bonds and Notes | | | — | | | | — | | | | 5,328,000 | | | | 5,328,000 | |
| Corporate Loans | | | — | | | | — | | | | 1,790,000 | | | | 1,790,000 | |
| Common Stocks | | | 484,059 | | | | — | | | | — | | | | 484,059 | |
| | | | |
| Total Assets | | $ | 484,059 | | | $ | 6,452,195,006 | | | $ | 87,073,904 | | | $ | 6,539,752,969 | |
| | | | |
Forward currency exchange contracts and futures contracts, if any, are reported at their unrealized appreciation/depreciation at measurement date, which represents the change in the contract’s value from trade date. All additional assets and liabilities included in the above table are reported at their market value at measurement date.
The table below shows the transfers between Level 2 and Level 3. The Fund’s policy is to recognize transfers in and transfers out as of the beginning of the reporting period.
| | | | | | | | |
| | | Transfers out
of Level 2* | | | Transfers into
Level 3* | |
| Assets Table | | | | | | | | |
| Investments, at Value: | | | | | | | | |
Municipal Bonds and Notes | | | | | | | | |
Alaska | | $ | (181,417) | | | $ | 181,417 | |
Arizona | | | (3,041,860) | | | | 3,041,860 | |
Florida | | | (1,111,327) | | | | 1,111,327 | |
Illinois | | | (10,481,571) | | | | 10,481,571 | |
Iowa | | | (127,542) | | | | 127,542 | |
Maryland | | | (769,327) | | | | 769,327 | |
Corporate Bonds and Notes | | | (2,904,450) | | | | 2,904,450 | |
| | | | |
| Total Assets | | $ | (18,617,494) | | | $ | 18,617,494 | |
| | | | |
* Transferred from Level 2 to Level 3 because of the lack of observable market data due to a decrease in market activity for these securities.
The following is a reconciliation of assets in which significant unobservable inputs (level 3) were used in determining fair value:
|
| 76 OPPENHEIMER ROCHESTER HIGH YIELD MUNICIPAL FUND |
3. Securities Valuation (Continued)
| | | | | | | | | | | | | | | | | | | | |
| | | | | | Value as of
July 31, 2016 | | | Realized gain
(loss) | | | Change in unrealized appreciation/ depreciation | | | Accretion/
(amortization)
of premium/
discounta | |
| Assets Table | | | | | | | | | | | | | | | | | | | | |
| Investments, at Value: | | | | | | | | | | | | | | | | | | | | |
| Municipal Bonds and Notes | | | | | | | | | | | | | | | | | | | | |
Alaska | | | | | | $ | 54,975 | | | $ | — | | | $ | (37,374 | ) | | $ | (143 | ) |
Arizona | | | | | | | 1,147,646 | | | | — | | | | (86,710 | ) | | | (489 | ) |
Arkansas | | | | | | | 3,357,081 | | | | — | | | | (1,185 | ) | | | — | |
California | | | | | | | 20 | | | | — | | | | — | | | | — | |
Colorado | | | | | | | 5,227,731 | | | | — | | | | (2,310,882 | ) | | | 706,753 | |
Florida | | | | | | | 21,139,065 | | | | 31,767 | | | | 3,494,452 | | | | 798,867 | |
Illinois | | | | | | | 12,502,117 | | | | — | | | | (4,281,286 | ) | | | — | |
Iowa | | | | | | | — | | | | — | | | | (20,242 | ) | | | — | |
Louisiana | | | | | | | 1,771,441 | | | | (3,024,810 | ) | | | 1,334,774 | | | | 122,818 | |
Maryland | | | | | | | — | | | | — | | | | (15,403 | ) | | | 53,485 | |
Montana | | | | | | | 1,186,169 | | | | — | | | | (23,326 | ) | | | 22,080 | |
Ohio | | | | | | | — | | | | — | | | | — | | | | — | |
Pennsylvania | | | | | | | 1,044,881 | | | | — | | | | 3,301,226 | | | | — | |
South Carolina | | | | | | | 13,881,542 | | | | 42,329 | | | | (68,023 | ) | | | 5,951 | |
Texas | | | | | | | 7,662,359 | | | | — | | | | (3,006,901 | ) | | | — | |
Virginia | | | | | | | 6,676,492 | | | | — | | | | (51,067 | ) | | | 51,099 | |
Wisconsin | | | | | | | 38,600 | | | | — | | | | (800 | ) | | | — | |
| Corporate Bonds and Notes | | | | | | | — | | | | — | | | | (606,450 | ) | | | — | |
| Corporate Loans | | | | | | | 13,475,000 | | | | — | | | | (11,685,000 | ) | | | — | |
| | | | | | | | |
| Total Assets | | | | | | $ | 89,165,119 | | | $ | (2,950,714 | ) | | $ | (14,064,197 | ) | | $ | 1,760,421 | |
| | | | | | | | |
| | | | | |
| a. Included in net investment income. | | | | | | | | | | | | | | | |
| | | | | |
| | | Purchases | | | Sales | | | Transfers into Level 3 | | | Transfers out
of Level 3 | | | Value as of
July 31, 2017 | |
| Assets Table | | | | | | | | | | | | | | | | | | | | |
| Investments, at Value: | | | | | | | | | | | | | | | | | | | | |
| Municipal Bonds and Notes | | | | | | | | | | | | | | | | | | | | |
Alaska | | $ | — | | | $ | — | | | $ | 181,417 | | | $ | — | | | $ | 198,875 | |
Arizona | | | — | | | | — | | | | 3,041,860 | | | | — | | | | 4,102,307 | |
Arkansas | | | — | | | | — | | | | — | | | | — | | | | 3,355,896 | |
California | | | — | | | | — | | | | — | | | | — | | | | 20 | |
Colorado | | | — | | | | — | | | | — | | | | — | | | | 3,623,602 | |
Florida | | | — | | | | (290,000 | ) | | | 1,111,327 | | | | — | | | | 26,285,478 | |
Illinois | | | — | | | | (2,995,000 | ) | | | 10,481,571 | | | | — | | | | 15,707,402 | |
Iowa | | | — | | | | — | | | | 127,542 | | | | — | | | | 107,300 | |
Louisiana | | | — | | | | (204,223 | ) | | | — | | | | — | | | | — | |
Maryland | | | — | | | | — | | | | 769,327 | | | | — | | | | 807,409 | |
Montana | | | — | | | | — | | | | — | | | | — | | | | 1,184,923 | |
Ohio | | | 4 | | | | — | | | | — | | | | — | | | | 4 | |
Pennsylvania | | | — | | | | — | | | | — | | | | — | | | | 4,346,107 | |
South Carolina | | | — | | | | (340,000 | ) | | | — | | | | — | | | | 13,521,799 | |
Texas | | | — | | | | (4,655,000 | ) | | | — | | | | — | | | | 458 | |
|
| 77 OPPENHEIMER ROCHESTER HIGH YIELD MUNICIPAL FUND |
NOTES TO FINANCIAL STATEMENTS Continued
3. Securities Valuation (Continued)
| | | | | | | | | | | | | | | | | | | | |
| | | Purchases | | | Sales | | | Transfers into
Level 3 | | | Transfers out
of Level 3 | | | Value as of
July 31, 2017 | |
| Assets Table Continued | | | | | | | | | | | | | | | | | | | | |
| Municipal Bonds and Notes (Continued) | | | | | | | | | | | | | | | | | | | | |
Virginia | | $ | — | | | $ | — | | | $ | — | | | $ | — | | | $ | 6,676,524 | |
Wisconsin | | | — | | | | — | | | | — | | | | — | | | | 37,800 | |
| Corporate Bonds and | | | | | | | | | | | | | | | | | | | | |
| Notes | | | 3,030,000 | | | | — | | | | 2,904,450 | | | | — | | | | 5,328,000 | |
| Corporate Loans | | | — | | | | — | | | | — | | | | — | | | | 1,790,000 | |
| | | | |
| Total Assets | | $ | 3,030,004 | | | $ | (8,484,223 | ) | | $ | 18,617,494 | | | $ | — | | | $ | 87,073,904 | |
| | | | |
The total change in unrealized appreciation/depreciation included in the Statement of Operations attributable to Level 3 investments still held at period end:
| | | | |
| | | Change in
unrealized
appreciation/
depreciation | |
| Assets Table | | | | |
| Investments, at Value: | | | | |
| Municipal Bonds and Notes | | | | |
Alaska | | $ | (37,374 | ) |
Arizona | | | (86,710 | ) |
Arkansas | | | (1,185 | ) |
Colorado | | | (2,310,882 | ) |
Florida | | | 3,494,452 | |
Illinois | | | (4,281,286 | ) |
Iowa | | | (20,242 | ) |
Maryland | | | (15,403 | ) |
Montana | | | (23,326 | ) |
Pennsylvania | | | 3,301,226 | |
South Carolina | | | (68,023 | ) |
Texas | | | (3,457,924 | ) |
Virginia | | | (51,067 | ) |
Wisconsin | | | (800 | ) |
| Corporate Bonds and Notes | | | (606,450 | ) |
| Corporate Loans | | | (11,685,000 | ) |
| | | | |
| Total Assets | | $ | (15,849,994 | ) |
| | | | |
The following table summarizes the valuation techniques and significant unobservable inputs used in determining fair value measurements for those investments classified as Level 3 at period end:
|
| 78 OPPENHEIMER ROCHESTER HIGH YIELD MUNICIPAL FUND |
3. Securities Valuation (Continued)
| | | | | | | | | | | | | | | | | | | | |
| | | Value as of
July 31, 2017 | | | Valuation
Technique | | | Unobservable
Input | | | Range of
Unobservable
Inputs | | | Unobservable
Input Used | |
| Assets Table | | | | | | | | | | | | | | | | | | | | |
| Investments, at Value: | | | | | | | | | | | | | | | | | | | | |
| Municipal Bonds and Notes | | | | | | | | | | | | | | | | | | | | |
Alaska | | $ | 198,875 | | | | Pricing service | | | | N/A | | | | N/A | | | | N/A (a) | |
Arizona | | | 4,102,307 | | | | Pricing service | | | | N/A | | | | N/A | | | | N/A (a) | |
Arkansas | | | 3,355,896 | | | | Pricing service | | | | N/A | | | | N/A | | | | N/A (a) | |
California | | | 20 | | | | Pricing service | | | | N/A | | | | N/A | | | | N/A (a) | |
Colorado | | | 3,623,602 | | | | Pricing service | | | | N/A | | | | N/A | | | | N/A (a) | |
Florida | | | 26,285,478 | | | | Pricing service | | | | N/A | | | | N/A | | | | N/A (a) | |
Illinois | | | 15,707,402 | | | | Pricing service | | | | N/A | | | | N/A | | | | N/A (a) | |
Iowa | | | 107,300 | | | | Pricing service | | | | N/A | | | | N/A | | | | N/A (a) | |
Maryland | | | 807,409 | | | | Pricing service | | | | N/A | | | | N/A | | | | N/A (a) | |
Montana | | | 1,184,923 | | | | Pricing service | | | | N/A | | | | N/A | | | | N/A (a) | |
Ohio | | | 4 | | | | Pricing service | | | | N/A | | | | N/A | | | | N/A (a) | |
Pennsylvania | | | 4,346,107 | | | | Pricing service | | | | N/A | | | | N/A | | | | N/A (a) | |
South Carolina | | | 13,521,799 | | | | Pricing service | | | | N/A | | | | N/A | | | | N/A (a) | |
Texas | | | 458 | | | | Pricing service | | | | N/A | | | | N/A | | | | N/A (a) | |
Virginia | | | 6,676,524 | | | | Pricing service | | | | N/A | | | | N/A | | | | N/A (a) | |
Wisconsin | | | 37,800 | | | | Pricing service | | | | N/A | | | | N/A | | | | N/A (a) | |
| | | | | |
| Discount to
expected
recovery |
| |
| Discounted rate
Expected
recovery |
| | | N/A | | | | 10% (b) | |
| Corporate Bond and Note | | | 5,328,000 | | | | proceeds | | | | proceeds | | | | N/A | | | | 100% of par | |
| Corporate Loans | | | 1,790,000 | | |
| Expected
recovery
proceeds |
| |
| Expected
recovery
proceeds |
| | | $1.79 Million | | |
| $1.79
Million (c) |
|
| | | | | | | | | | | | | | | | | | | | |
| Total | | $ | 87,073,904 | | | | | | | | | | | | | | | | | |
| | | | | | | | | | | | | | | | | | | | |
(a) Securities classified as Level 3 whose unadjusted values were provided by a pricing service and for which such inputs are unobservable. The Manager periodically reviews pricing vendor methodologies and inputs to confirm they are determined using unobservable inputs and have been appropriately classified. Such securities’ fair valuations could change significantly based on changes in unobservable inputs used by the pricing service.
(b) The Fund fair values certain corporate bonds at a discount to the expected recovery value to reflect uncertainty and illiquidity. The Manager monitors such investments for additional market information or the occurrence of a significant event which would warrant a re-evaluation of the security’s fair valuation. A significant increase (decrease) to the discount rate or a significant decrease (increase) to the expected recovery value will result in a significant decrease (increase) to the fair value of the investment.
(c) The Fund fair values certain corporate loans at the expected recovery proceeds. The Manager monitors such investments for additional market information or the occurrence of a significant event which would warrant a re-evaluation of the security’s fair valuation. A significant decrease (increase) to the expected recovery value will result in a significant decrease (increase) to the fair value of the investment.
4. Investments and Risks
Inverse Floating Rate Securities. The Fund invests in inverse floating rate securities that pay interest at a rate that varies inversely with short-term interest rates. Because inverse floating rate securities are leveraged instruments, the value of an inverse floating rate security
|
| 79 OPPENHEIMER ROCHESTER HIGH YIELD MUNICIPAL FUND |
NOTES TO FINANCIAL STATEMENTS Continued
4. Investments and Risks (Continued)
will change more significantly in response to changes in interest rates and other market fluctuations than the market value of a conventional fixed-rate municipal security of similar maturity and credit quality, including the municipal bond underlying an inverse floating rate security.
An inverse floating rate security is created as part of a financial transaction referred to as a “tender option bond” transaction. In most cases, in a tender option bond transaction the Fund sells a fixed-rate municipal bond (the “underlying municipal bond”) to a trust (the “Trust”). The Trust then issues and sells short-term floating rate securities with a fixed principal amount representing a senior interest in the underlying municipal bond to third parties and a residual, subordinate interest in the underlying municipal bond (referred to as an “inverse floating rate security”) to the Fund. The interest rate on the short-term floating rate securities resets periodically, usually weekly, to a prevailing market rate and holders of these securities are granted the option to tender their securities back to the Trust for repurchase at their principal amount plus accrued interest thereon (the “purchase price”) periodically, usually daily or weekly. A remarketing agent for the Trust is required to attempt to re-sell any tendered short-term floating rate securities to new investors for the purchase price. If the remarketing agent is unable to successfully re-sell the tendered short-term floating rate securities, a liquidity provider to the Trust must contribute cash to the Trust to ensure that the tendering holders receive the purchase price of their securities on the repurchase date.
Because holders of the short-term floating rate securities are granted the right to tender their securities to the Trust for repurchase at frequent intervals for the purchase price, with such payment effectively guaranteed by the liquidity provider, the securities generally bear short-term rates of interest commensurate with money market instruments. When interest is paid on the underlying municipal bond to the Trust, such proceeds are first used to pay the Trust’s administrative expenses and accrued interest to holders of the short-term floating rate securities, with any remaining amounts being paid to the Fund, as the holder of the inverse floating rate security. Accordingly, the amount of such interest on the underlying municipal bond paid to the Fund is inversely related to the rate of interest on the short-term floating rate securities. Additionally, because the principal amount of the short-term floating rate securities is fixed and is not adjusted in response to changes in the market value of the underlying municipal bond, any change in the market value of the underlying municipal bond is reflected entirely in a change to the value of the inverse floating rate security.
Typically, the terms of an inverse floating rate security grant certain rights to the Fund, as holder. For example, the Fund typically has the right upon request to require that the Trust compel a tender of the short-term floating rate securities to facilitate the Fund’s acquisition of the underlying municipal bond. Following such a request, the Fund pays the Trust the purchase price of the short-term floating rate securities and a specified portion of any market value gain on the underlying municipal bond since its deposit into the Trust, which the Trust uses to redeem the short-term floating rate securities. The Trust then distributes the underlying municipal bond to the Fund. Through the exercise of this right, the Fund can voluntarily terminate or “collapse” the Trust, terminate its investment in the related inverse floating rate security and obtain the underlying municipal bond. Additionally, the Fund also typically has
|
| 80 OPPENHEIMER ROCHESTER HIGH YIELD MUNICIPAL FUND |
4. Investments and Risks (Continued)
the right to exchange with the Trust (i) a principal amount of short-term floating rate securities held by the Fund for a corresponding additional principal amount of the inverse floating rate security or (ii) a principal amount of the inverse floating rate security held by the Fund for a corresponding additional principal amount of short-term floating rate securities (which are typically then sold to other investors). Through the exercise of this right, the Fund may increase (or decrease) the principal amount of short-term floating rate securities outstanding, thereby increasing (or decreasing) the amount of leverage provided by the short-term floating rate securities to the Fund’s investment exposure to the underlying municipal bond.
The Fund’s investments in inverse floating rate securities involve certain risks. As short-term interest rates rise, an inverse floating rate security produces less current income (and, in extreme cases, may pay no income) and as short-term interest rates fall, an inverse floating rate security produces more current income. Thus, if short-term interest rates rise after the issuance of the inverse floating rate security, any yield advantage is reduced or eliminated. All inverse floating rate securities entail some degree of leverage represented by the outstanding principal amount of the related short-term floating rate securities, relative to the par value of the underlying municipal bond. The value of, and income earned on, an inverse floating rate security that has a higher degree of leverage will fluctuate more significantly in response to changes in interest rates and to changes in the market value of the related underlying municipal bond than that of an inverse floating rate security with a lower degree of leverage, and is more likely to be eliminated entirely under adverse market conditions. Changes in the value of an inverse floating rate security will also be more significant than changes in the market value of the related underlying municipal bond because the leverage provided by the related short-term floating rate securities increases the sensitivity of an inverse floating rate security to changes in interest rates and to the market value of the underlying municipal bond. An inverse floating rate security can be expected to underperform fixed-rate municipal bonds when the difference between long-term and short-term interest rates is decreasing (or is already small) or when long-term interest rates are rising, but can be expected to outperform fixed-rate municipal bonds when the difference between long-term and short-term interest rates is increasing (or is already large) or when long-term interest rates are falling. Additionally, a tender option bond transaction typically provides for the automatic termination or “collapse” of a Trust upon the occurrence of certain adverse events, usually referred to as “mandatory tender events” or “tender option termination events.” These events may include, among others, a credit ratings downgrade of the underlying municipal bond below a specified level, a decrease in the market value of the underlying municipal bond below a specified amount, a bankruptcy of the liquidity provider or the inability of the remarketing agent to resell to new investors short-term floating rate securities that have been tendered for repurchase by holders thereof. Following the occurrence of such an event, the underlying municipal bond is generally sold for current market value and the proceeds distributed to holders of the short-term floating rate securities and inverse floating rate security, with the holder of the inverse floating rate security (the Fund) generally receiving the proceeds of such sale only after the holders of the short-term floating rate securities have received proceeds equal to the purchase price of their securities (and the liquidity provider is generally required to contribute cash to
|
| 81 OPPENHEIMER ROCHESTER HIGH YIELD MUNICIPAL FUND |
NOTES TO FINANCIAL STATEMENTS Continued
4. Investments and Risks (Continued)
the Trust only in an amount sufficient to ensure that the holders of the short-term floating rate securities receive the purchase price of their securities in connection with such termination of the Trust). Following the occurrence of such events, the Fund could potentially lose the entire amount of its investment in the inverse floating rate security.
Finally, the Fund may enter into shortfall/reimbursement agreements with the liquidity provider of certain tender option bond transactions in connection with certain inverse floating rate securities held by the Fund. These agreements commit the Fund to reimburse the liquidity provider to the extent that the liquidity provider must provide cash to a Trust, including following the termination of a Trust resulting from the occurrence of a “mandatory tender event.” In connection with the occurrence of such an event and the termination of the Trust triggered thereby, the shortfall/reimbursement agreement will make the Fund liable for the amount of the negative difference, if any, between the liquidation value of the underlying municipal bond and the purchase price of the short-term floating rate securities issued by the Trust. Under the standard terms of a tender option bond transaction, absent such a shortfall/ reimbursement agreement, the Fund, as holder of the inverse floating rate security, would not be required to make such a reimbursement payment to the liquidity provider. The Manager monitors the Fund’s potential exposure with respect to these agreements on a daily basis and intends to take action to terminate the Fund’s investment in related inverse floating rate securities, if it deems it appropriate to do so. At period end, the Fund’s maximum exposure under such agreements is estimated at $254,740,000.
When the Fund creates an inverse floating rate security in a tender option bond transaction by selling an underlying municipal bond to a Trust, the transaction is considered a secured borrowing for financial reporting purposes. As a result of such accounting treatment, the Fund includes the underlying municipal bond on its Statement of Investments and as an asset on its Statement of Assets and Liabilities (but does not separately include the related inverse floating rate security on either). The Fund also includes a liability on its Statement of Assets and Liabilities equal to the outstanding principal amount and accrued interest on the related short-term floating rate securities issued by the Trust. Interest on the underlying municipal bond is recorded as investment income on the Fund’s Statement of Operations, while interest payable on the related short-term floating rate securities is recorded as interest expense. At period end, municipal bond holdings with a value of $818,164,034 shown on the Fund’s Statement of Investments are held by such Trusts and serve as the underlying municipal bonds for the related $522,985,000 in short-term floating rate securities issued and outstanding at that date.
At period end, the inverse floating rate securities associated with tender option bond transactions accounted for as secured borrowings were as follows:
| | | | | | | | | | | | | | |
Principal Amount | | Inverse Floater1 | | Coupon
Rate2 | | | Maturity
Date | | | Value | |
| |
| $ 2,490,000 | | Allen County, OH Hospital Facilities (Mercy Health) Tender Option Bond Series 2015 XF-0235 Trust | | | 12.894% | | | | 6/1/38 | | | $ | 3,208,390 | |
|
| 82 OPPENHEIMER ROCHESTER HIGH YIELD MUNICIPAL FUND |
4. Investments and Risks (Continued)
| | | | | | | | | | | | | | |
Principal
Amount | | Inverse Floater1 | | Coupon
Rate2 | | | Maturity
Date | | | Value | |
| |
| $ 3,750,000 | | CA Health Facilities Financing Authority (SJHS/SJHCN/SJHE/SJHO/SJHosp/SMMCtr/MHRMC/QVMCNC Obligated Group) Tender Option Bond Series 2016-XF0330 Trust | | | 18.713% | | | | 7/1/39 | | | $ | 5,027,250 | |
| 3,855,000 | | CA Health Facilities Financing Authority Tender Option Bond Series 2015-XF2104 Trust3 | | | 15.549 | | | | 7/1/39 | | | | 5,168,013 | |
| 5,000,000 | | CA Infrastructure and Economic Devel. (Sanford Consortium) Tender Option Bond Series 2016- XF0335 Trust | | | 7.232 | | | | 5/15/40 | | | | 6,110,600 | |
| 8,640,000 | | CA State University Tender Option Bond Series 2017-XF0554 Trust | | | 10.203 | | | | 11/1/47 | | | | 13,269,053 | |
| 7,175,000 | | CO Health Facilities Authority (Sisters of Charity of Leavenworth Health System) Tender Option Bond Series 2015 XF0239 Trust | | | 7.231 | | | | 7/1/36 | | | | 8,758,953 | |
| 2,525,000 | | Detroit, MI City School District Tender Option Bond Series 2015 XF-0241 Trust3 | | | 15.442 | | | | 11/1/23 | | | | 4,929,305 | |
| 4,675,000 | | Douglas County, NE Hospital Authority Tender Option Bond Series 2015-XF2132 Trust3 | | | 16.706 | | | | 11/1/48 | | | | 5,881,571 | |
| 7,280,000 | | Fulton County, GA Devel. Authority (PHC/FCommH/PHosp/PMSH/PNH/ PMCC/PClinic/PHlthCF/PHI/PHIP/PHHosp Obligated Group) Tender Option Bond Series 2015-XF0024 Trust | | | 12.870 | | | | 6/15/29 | | | | 9,483,292 | |
| 3,465,000 | | Fulton County, GA Devel. Authority (PHC/FCommH/PHosp/PMSH/PNH/PMCC/PClinic/PHlthCF/PHI/PHIP/PHHosp Obligated Group) Tender Option Bond Series 2015-XF0024-2 Trust | | | 13.645 | | | | 6/15/37 | | | | 4,569,573 | |
| 680,000 | | Fulton County, GA Devel. Authority (PHC/FCommH/PHosp/PMSH/PNH/PMCC/PClinic/PHlthCF/PHI/PHIP/PHHosp Obligated Group) Tender Option Bond Series 2015-XF0024-3 Trust | | | 13.587 | | | | 6/15/29 | | | | 898,736 | |
| 2,875,000 | | Geisinger, PA Authority (Geisinger Health System) Tender Option Bond Series 2015 XF-0040 Trust | | | 13.760 | | | | 6/1/39 | | | | 3,771,770 | |
| 5,000,000 | | Grand Parkway, TX Transportation Corp. Tender Option Bond Series 2015-XF2034 Trust3 | | | 7.195 | | | | 4/1/53 | | | | 6,423,200 | |
| 5,000,000 | | IL Finance Authority (AHCN/ANSHN/ACMC/ AH&HC Obligated Group) Tender Option Bond Series 2015-XF0023 Trust | | | 14.620 | | | | 4/1/44 | | | | 6,361,600 | |
| 4,345,000 | | IL Finance Authority (AHCN/ANSHN/ACMC/ AH&HC Obligated Group) Tender Option Bond Series 2015-XF0023-2 Trust | | | 14.200 | | | | 4/1/44 | | | | 5,478,133 | |
| 2,750,000 | | IL Finance Authority (AHCN/ANSHN/ACMC/ AH&HC Obligated Group) Tender Option Bond Series 2015-XF0023-3 Trust | | | 14.193 | | | | 4/1/44 | | | | 3,467,337 | |
| 2,500,000 | | IL Finance Authority (AHCN/ANSHN/ACMC/ AH&HC Obligated Group) Tender Option Bond Series 2015-XF0023-4 Trust | | | 14.205 | | | | 4/1/44 | | | | 3,152,200 | |
|
| 83 OPPENHEIMER ROCHESTER HIGH YIELD MUNICIPAL FUND |
NOTES TO FINANCIAL STATEMENTS Continued
4. Investments and Risks (Continued)
| | | | | | | | | | | | | | |
Principal
Amount | | Inverse Floater1 | | Coupon Rate2 | | | Maturity
Date | | | Value | |
| |
| $ 2,200,000 | | IL Finance Authority (AHCN/ANSHN/ACMC/ AH&HC Obligated Group) Tender Option Bond Series 2015-XF0023-5 Trust | | | 14.179% | | | | 4/1/44 | | | $ | 2,773,870 | |
| 1,250,000 | | IL Finance Authority (AHCN/ANSHN/ACMC/ AH&HC Obligated Group) Tender Option Bond Series 2015-XF0023-6 Trust | | | 14.193 | | | | 4/1/44 | | | | 1,576,125 | |
| 3,125,000 | | IL Finance Authority (CDHS/CDHA Obligated Group) Tender Option Bond Series 2015-XF0025 Trust | | | 14.626 | | | | 11/1/39 | | | | 4,288,125 | |
| 1,250,000 | | IL Finance Authority (CDHS/CDHA Obligated Group) Tender Option Bond Series 2015-XF0025-2 Trust | | | 14.193 | | | | 11/1/39 | | | | 1,685,100 | |
| 3,500,000 | | KY EDFA (BHS/BHP/BHL/BHCor/BHLex/BHlthL Obligated Group) Tender Option Bond Series 2015-XF2011 Trust3 | | | 13.379 | | | | 8/15/24 | | | | 4,102,140 | |
| 7,985,000 | | Los Angeles, CA Dept. of Airports (Los Angeles International Airport) Tender Option Bond Series 2015 XF-0041 Trust | | | 14.013 | | | | 5/15/30 | | | | 8,983,125 | |
| 1,250,000 | | Los Angeles, CA Dept. of Water & Power Tender Option Bond Series 2015 XF-0039 Trust | | | 12.894 | | | | 7/1/34 | | | | 1,525,500 | |
| 7,000,000 | | Los Angeles, CA Dept. of Water & Power Tender Option Bond Series 2017-XF0556 Trust | | | 13.055 | | | | 7/1/35 | | | | 11,136,790 | |
| 5,980,000 | | MA HFA Tender Option Bond Series 2015-XF2150 Trust3 | | | 7.837 | | | | 12/1/42 | | | | 6,757,041 | |
| 2,500,000 | | Miami-Dade County, FL School Board Tender Option Bond Series 2015-XF2117 Trust3 | | | 13.666 | | | | 2/1/27 | | | | 3,141,700 | |
| 2,500,000 | | Miami-Dade County, FL School Board Tender Option Bond Series 2015-XF2117-2 Trust3 | | | 12.800 | | | | 2/1/27 | | | | 3,104,600 | |
| 12,500,000 | | Miami-Dade County, FL School Board Tender Option Bond Series 2015-XF2117-3 Trust3 | | | 14.099 | | | | 2/1/34 | | | | 15,801,500 | |
| 2,500,000 | | Montgomery County, OH (Miami Valley Hospital) Tender Option Bond Series 2015-XF0029 Trust | | | 15.103 | | | | 11/15/23 | | | | 3,788,200 | |
| 9,500,000 | | North Central TX HFDC (CMCD/CMCtrF Obligated Group) Tender Option Bond Series 2015-XF0034 Trust | | | 15.685 | | | | 8/15/39 | | | | 12,562,800 | |
| 4,000,000 | | North TX Tollway Authority Tender Option Bond Series 2015-XF2036 Trust3 | | | 15.549 | | | | 1/1/48 | | | | 4,311,680 | |
| 1,480,000 | | North TX Tollway Authority Tender Option Bond Series 2015-XF2037 Trust3 | | | 15.189 | | | | 1/1/48 | | | | 1,595,322 | |
| 3,240,000 | | NYC Municipal Water Finance Authority Tender Option Bond Series 2015-XF2151 Trust3 | | | 15.735 | | | | 6/15/40 | | | | 3,805,218 | |
| 25,000,000 | | NYC Transitional Finance Authority (Future Tax) Tender Option Bond Series 2015 XF-2472 Trust3 | | | 10.220 | | | | 5/1/42 | | | | 38,150,500 | |
| 3,335,000 | | NYS DA (State Personal Income Tax Authority) Tender Option Bond Series 2017-XF0555 Trust | | | 10.139 | | | | 2/15/37 | | | | 5,089,777 | |
| 18,695,000 | | NYS Liberty Devel. Corp. Tender Option Bond Series 2015-XF2146 Trust3 | | | 7.465 | | | | 1/15/44 | | | | 21,793,696 | |
| 2,500,000 | | San Jacinto, TX Community College District Tender Option Bond Series 2015-XF2010 Trust3 | | | 13.383 | | | | 2/15/38 | | | | 2,729,700 | |
|
| 84 OPPENHEIMER ROCHESTER HIGH YIELD MUNICIPAL FUND |
4. Investments and Risks (Continued)
| | | | | | | | | | | | | | |
Principal Amount | | Inverse Floater1 | | Coupon
Rate2 | | | Maturity
Date | | | Value | |
| |
| $ 1,985,000 | | Tarrant County, TX Cultural Education Facilities Finance Corp. Tender Option Bond Series 2015-XF2057 Trust3 | | | 14.941% | | | | 11/15/29 | | | $ | 2,477,201 | |
| 8,150,000 | | Tarrant County, TX Cultural Education Facilities Finance Corp. Tender Option Bond Series 2015-XF2057-2 Trust3 | | | 16.682 | | | | 11/15/29 | | | | 10,380,492 | |
| 6,750,000 | | Tarrant County, TX Health Facilities Devel. Corp. (CCMCtr/CCHCS/CCPN/WICF Obligated Group) Tender Option Bond Series 2015-XF0028 Trust | | | 7.176 | | | | 12/1/33 | | | | 7,826,220 | |
| 375,000 | | Tes Properties, WA Tender Option Bond Series 2015-XF0038 Trust | | | 14.446 | | | | 12/1/29 | | | | 499,590 | |
| 3,000,000 | | Tes Properties, WA Tender Option Bond Series 2015-XF0038-2 Trust | | | 14.879 | | | | 12/1/38 | | | | 4,023,960 | |
| 8,705,000 | | WA Health Care Facilities Authority (Peacehealth) Tender Option Bond Series 2015 XF-0042 Trust | | | 6.946 | | | | 11/1/28 | | | | 9,822,896 | |
| 4,520,000 | | WA Health Care Facilities Authority Tender Option Bond Series 2015-XF2035 Trust3 | | | 16.601 | | | | 10/1/36 | | | | 5,487,190 | |
| | | | | | | | | | | | | | |
| | | | | | | | | | | | $ | 295,179,034 | |
| | | | | | | | | | | | | | |
1. For a list of abbreviations used in the Inverse Floater table see the Portfolio Abbreviations table at the end of the Statement of Investments.
2. Represents the current interest rate for the inverse floating rate security.
3. Represents an inverse floating rate security that is subject to a shortfall/reimbursement agreement.
The Fund may also purchase an inverse floating rate security created as part of a tender option bond transaction not initiated by the Fund when a third party, such as a municipal issuer or financial institution, transfers an underlying municipal bond to a Trust. For financial reporting purposes, the Fund includes the inverse floating rate security related to such transaction on its Statement of Investments and as an asset on its Statement of Assets and Liabilities, and interest on the security is recorded as investment income on the Fund’s Statement of Operations.
The Fund may invest in inverse floating rate securities with any degree of leverage (as measured by the outstanding principal amount of related short-term floating rate securities). However, the Fund may only expose up to 35% of its total assets to the effects of leverage from its investments in inverse floating rate securities. This limitation is measured by comparing the aggregate principal amount of the short-term floating rate securities that are related to the inverse floating rate securities held by the Fund to the total assets of the Fund. The Fund’s exposure to the effects of leverage from its investments in inverse floating rate securities amounts to $522,985,000 or 7.90% of its total assets at period end.
Loans. The Fund invests in loans made to U.S. and foreign borrowers that are corporations, partnerships or other business entities. The Fund will do so directly as an original lender or by assignment or indirectly through participation agreements or certain derivative instruments. While many of these loans will be collateralized, the Fund can also invest in uncollateralized loans. Loans are often issued in connection with recapitalizations, acquisitions, leveraged
|
| 85 OPPENHEIMER ROCHESTER HIGH YIELD MUNICIPAL FUND |
NOTES TO FINANCIAL STATEMENTS Continued
4. Investments and Risks (Continued)
buyouts, and refinancing of borrowers. The loans often pay interest at rates that float above (or are adjusted periodically based on) a benchmark that reflects current interest rates although the Fund can also invest in loans with fixed interest rates.
Securities on a When-Issued or Delayed Delivery Basis. The Fund may purchase securities on a “when-issued” basis, and may purchase or sell securities on a “delayed delivery” basis. “When-issued” or “delayed delivery” refers to securities whose terms and indenture are available and for which a market exists, but which are not available for immediate delivery. Delivery and payment for securities that have been purchased by the Fund on a when-issued basis normally takes place within six months and possibly as long as two years or more after the trade date. During this period, such securities do not earn interest, are subject to market fluctuation and may increase or decrease in value prior to their delivery. The purchase of securities on a when-issued basis may increase the volatility of the Fund’s net asset value to the extent the Fund executes such transactions while remaining substantially fully invested. When the Fund engages in when-issued or delayed delivery transactions, it relies on the buyer or seller, as the case may be, to complete the transaction. Their failure to do so may cause the Fund to lose the opportunity to obtain or dispose of the security at a price and yield it considers advantageous. The Fund may also sell securities that it purchased on a when-issued basis or forward commitment prior to settlement of the original purchase.
At period end, the Fund had purchased securities issued on a when-issued or delayed delivery basis and sold securities issued on a delayed delivery basis as follows:
| | | | |
| | | When-Issued or
Delayed Delivery
Basis Transactions | |
| |
| Purchased securities | | $ | 56,170,281 | |
| Sold securities | | | 3,204,965 | |
Equity Security Risk. Stocks and other equity securities fluctuate in price. The value of the Fund’s portfolio may be affected by changes in the equity markets generally. Equity markets may experience significant short-term volatility and may fall sharply at times. Different markets may behave differently from each other and U.S. equity markets may move in the opposite direction from one or more foreign stock markets. Adverse events in any part of the equity or fixed-income markets may have unexpected negative effects on other market segments.
The prices of individual equity securities generally do not all move in the same direction at the same time and a variety of factors can affect the price of a particular company’s securities. These factors may include, but are not limited to, poor earnings reports, a loss of customers, litigation against the company, general unfavorable performance of the company’s sector or industry, or changes in government regulations affecting the company or its industry.
Credit Risk. The Fund invests in high-yield, non-investment-grade bonds, which may be subject to a greater degree of credit risk. Credit risk relates to the ability of the issuer to meet interest or principal payments or both as they become due. The Fund may acquire securities
|
| 86 OPPENHEIMER ROCHESTER HIGH YIELD MUNICIPAL FUND |
4. Investments and Risks (Continued)
that have missed an interest payment, and is not obligated to dispose of securities whose issuers or underlying obligors subsequently miss an interest payment.
In June 2016, Congress passed the Puerto Rico Oversight, Management, and Economic Stability Act (“PROMESA”). PROMESA established a federally-appointed fiscal oversight board (the “Oversight Board”) to oversee Puerto Rico’s financial operations and allows the Oversight Board to file cases on behalf of the Commonwealth of Puerto Rico or one of its instrumentalities to restructure debt and other obligations of the relevant entity in a “Title III” proceeding. Title III incorporates many provisions of the federal Bankruptcy Code for U.S. territories, and incorporates legal mechanisms for a litigation stay and restructuring of pension and debt obligations, among other provisions. In early May 2017, Title III petitions were filed for the Commonwealth of Puerto Rico and the Puerto Rico Sales Tax Financing Corporation (“COFINA”), two of the largest issuers of Puerto Rico debt. Title III petitions for Puerto Rico Highways & Transportation Authority (“PRHTA”) and Puerto Rico Electric Power Authority (“PREPA”) were subsequently filed in mid-May and early July, respectively. Title III petitions for additional Puerto Rican instrumentalities are expected to be filed. These restructuring proceedings create uncertainty as to the treatment of claims of varying degrees of seniority and the levels and priorities of payment from the affected entities.
Information concerning securities not accruing interest at period end is as follows:
| | | | |
| Cost | | $ | 1,101,585,649 | |
| Market Value | | | $543,578,987 | |
| Market Value as % of Net Assets | | | 9.32% | |
Concentration Risk. The Fund invests a large percentage of its total assets in obligations of issuers within its respective state and U.S. territories. Risks may arise from geographic concentration in any state, commonwealth or territory, such as Puerto Rico, the U.S. Virgin Islands, Guam or the Northern Mariana Islands. Certain economic, regulatory or political developments occurring in the state, commonwealth or territory such as ongoing developments in Puerto Rico may impair the ability of certain issuers of municipal securities to pay principal and interest on their obligations.
5. Market Risk Factors
The Fund’s investments in securities and/or financial derivatives may expose the Fund to various market risk factors:
Commodity Risk. Commodity risk relates to the change in value of commodities or commodity indexes as they relate to increases or decreases in the commodities market. Commodities are physical assets that have tangible properties. Examples of these types of assets are crude oil, heating oil, metals, livestock, and agricultural products.
Credit Risk. Credit risk relates to the ability of the issuer of debt to meet interest and principal payments, or both, as they come due. In general, lower-grade, higher-yield debt securities are subject to credit risk to a greater extent than lower-yield, higher-quality securities.
|
| 87 OPPENHEIMER ROCHESTER HIGH YIELD MUNICIPAL FUND |
NOTES TO FINANCIAL STATEMENTS Continued
5. Market Risk Factors (Continued)
Equity Risk. Equity risk relates to the change in value of equity securities as they relate to increases or decreases in the general market.
Foreign Exchange Rate Risk. Foreign exchange rate risk relates to the change in the U.S. dollar value of a security held that is denominated in a foreign currency. The U.S. dollar value of a foreign currency denominated security will decrease as the dollar appreciates against the currency, while the U.S. dollar value will increase as the dollar depreciates against the currency.
Interest Rate Risk. Interest rate risk refers to the fluctuations in value of fixed-income securities resulting from the inverse relationship between price and yield. For example, an increase in general interest rates will tend to reduce the market value of already issued fixed-income investments, and a decline in general interest rates will tend to increase their value. In addition, debt securities with longer maturities, which tend to have higher yields, are subject to potentially greater fluctuations in value from changes in interest rates than obligations with shorter maturities.
Volatility Risk. Volatility risk refers to the magnitude of the movement, but not the direction of the movement, in a financial instrument’s price over a defined time period. Large increases or decreases in a financial instrument’s price over a relative time period typically indicate greater volatility risk, while small increases or decreases in its price typically indicate lower volatility risk.
6. Shares of Beneficial Interest
The Fund has authorized an unlimited number of no par value shares of beneficial interest of each class. Transactions in shares of beneficial interest were as follows:
| | | | | | | | | | | | | | | | |
| | | Year Ended July 31, 2017 | | | Year Ended July 31, 2016 | |
| | | Shares | | | Amount | | | Shares | | | Amount | |
| Class A | | | | | | | | | | | | | | | | |
| Sold | | | 115,327,306 | | | $ | 828,957,347 | | | | 86,452,000 | | | $ | 611,505,576 | |
| Dividends and/or distributions reinvested | | | 21,456,702 | | | | 154,850,971 | | | | 23,193,253 | | | | 163,980,260 | |
| Redeemed | | | (138,859,277) | | | | (999,017,491) | | | | (102,437,853) | | | | (723,546,514) | |
| Net increase (decrease) | | | (2,075,269) | | | $ | (15,209,173) | | | | 7,207,400 | | | $ | 51,939,322 | |
| | | | | | | | | | | | | | | | |
| | | | | | | | | | | | | | | | | |
| Class B | | | | | | | | | | | | | | | | |
| Sold | | | 33,669 | | | $ | 246,689 | | | | 160,607 | | | $ | 1,148,292 | |
| Dividends and/or distributions reinvested | | | 141,531 | | | | 1,026,583 | | | | 280,246 | | | | 1,984,560 | |
| Redeemed | | | (2,256,625) | | | | (16,359,458) | | | | (3,499,569) | | | | (24,667,510) | |
| Net decrease | | | (2,081,425) | | | $ | (15,086,186) | | | | (3,058,716) | | | $ | (21,534,658) | |
| | | | | | | | | | | | | | | | |
|
| 88 OPPENHEIMER ROCHESTER HIGH YIELD MUNICIPAL FUND |
6. Shares of Beneficial Interest (Continued)
| | | | | | | | | | | | | | | | |
| | | Year Ended July 31, 2017 | | | Year Ended July 31, 2016 | |
| | | Shares | | | Amount | | | Shares | | | Amount | |
| Class C | | | | | | | | | | | | | | | | |
| Sold | | | 31,846,432 | | | $ | 228,909,131 | | | | 35,755,468 | | | $ | 252,677,043 | |
| Dividends and/or distributions reinvested | | | 7,923,676 | | | | 56,947,446 | | | | 8,620,150 | | | | 60,682,555 | |
| Redeemed | | | (47,160,297) | | | | (336,919,398) | | | | (37,865,695) | | | | (266,692,670) | |
| Net increase (decrease) | | | (7,390,189) | | | $ | (51,062,821) | | | | 6,509,923 | | | $ | 46,666,928 | |
| | | | | | | | | | | | | | | | |
| | | | | | | | | | | | | | | | | |
| Class Y | | | | | | | | | | | | | | | | |
| Sold | | | 110,295,897 | | | $ | 792,134,437 | | | | 60,869,249 | | | $ | 430,204,335 | |
| Dividends and/or distributions reinvested | | | 7,331,489 | | | | 52,954,175 | | | | 6,115,406 | | | | 43,218,178 | |
| Redeemed | | | (58,811,699) | | | | (420,286,987) | | | | (43,086,261) | | | | (303,217,909) | |
| Net increase | | | 58,815,687 | | | $ | 424,801,625 | | | | 23,898,394 | | | $ | 170,204,604 | |
| | | | | | | | | | | | | | | | |
7. Purchases and Sales of Securities
The aggregate cost of purchases and proceeds from sales of securities, other than short-term obligations, for the reporting period were as follows:
| | | | | | | | | | | | |
| | | Purchases | | | | | | Sales | |
| |
| Investment securities | | $ | 2,437,576,456 | | | | | | | $ | 1,785,838,532 | |
8. Fees and Other Transactions with Affiliates
Management Fees. Under the investment advisory agreement, the Fund pays the Manager a management fee based on the daily net assets of the Fund at an annual rate as shown in the following table:
| | | | |
| Fee Schedule | | | |
| |
| Up to $200 million | | | 0.60% | |
| Next $100 million | | | 0.55 | |
| Next $200 million | | | 0.50 | |
| Next $250 million | | | 0.45 | |
| Next $250 million | | | 0.40 | |
| Next $10 billion | | | 0.35 | |
| Over $11 billion | | | 0.34 | |
The Fund’s effective management fee for the reporting period was 0.37% of average annual net assets before any applicable waivers.
Sub-Adviser Fees. The Manager has retained the Sub-Adviser to provide the day-to-day portfolio management of the Fund. Under the Sub-Advisory Agreement, the Manager pays the Sub-Adviser an annual fee in monthly installments, equal to a percentage of the investment management fee collected by the Manager from the Fund, which shall be calculated after any investment management fee waivers. The fee paid to the Sub-Adviser is paid by the Manager, not by the Fund.
Transfer Agent Fees. OFI Global (the “Transfer Agent”) serves as the transfer and
|
| 89 OPPENHEIMER ROCHESTER HIGH YIELD MUNICIPAL FUND |
NOTES TO FINANCIAL STATEMENTS Continued
8. Fees and Other Transactions with Affiliates (Continued)
shareholder servicing agent for the Fund. The Fund pays the Transfer Agent a fee based on annual net assets, which shall be calculated after any applicable fee waivers. Fees incurred and average net assets for each class with respect to these services are detailed in the Statement of Operations and Financial Highlights, respectively.
Sub-Transfer Agent Fees. The Transfer Agent has retained Shareholder Services, Inc., a wholly-owned subsidiary of OFI (the “Sub-Transfer Agent”), to provide the day-to-day transfer agent and shareholder servicing of the Fund. Under the Sub-Transfer Agency Agreement, the Transfer Agent pays the Sub-Transfer Agent an annual fee in monthly installments, equal to a percentage of the transfer agent fee collected by the Transfer Agent from the Fund, which shall be calculated after any applicable fee waivers. The fee paid to the Sub-Transfer Agent is paid by the Transfer Agent, not by the Fund.
Trustees’ Compensation. The Fund has adopted an unfunded retirement plan (the “Plan”) for the Fund’s Independent Trustees. Benefits are based on years of service and fees paid to each Trustee during their period of service. The Plan was frozen with respect to adding new participants effective December 31, 2006 (the “Freeze Date”) and existing Plan Participants as of the Freeze Date will continue to receive accrued benefits under the Plan. Active Independent Trustees as of the Freeze Date have each elected a distribution method with respect to their benefits under the Plan. During the reporting period, the Fund’s projected benefit obligations, payments to retired Trustees and accumulated liability were as follows:
| | | | |
| Projected Benefit Obligations Increased | | $ | — | |
| Payments Made to Retired Trustees | | | 36,410 | |
| Accumulated Liability as of July 31, 2017 | | | 263,150 | |
The Fund’s Board of Trustees (“Board”) has adopted a compensation deferral plan for Independent Trustees that enables Trustees to elect to defer receipt of all or a portion of the annual compensation they are entitled to receive from the Fund. For purposes of determining the amount owed to the Trustee under the plan, deferred amounts are treated as though equal dollar amounts had been invested in shares of the Fund or in other Oppenheimer funds selected by the Trustee. The Fund purchases shares of the funds selected for deferral by the Trustee in amounts equal to his or her deemed investment, resulting in a Fund asset equal to the deferred compensation liability. Such assets are included as a component of “Other” within the asset section of the Statement of Assets and Liabilities. Deferral of Trustees’ fees under the plan will not affect the net assets of the Fund and will not materially affect the Fund’s assets, liabilities or net investment income per share. Amounts will be deferred until distributed in accordance with the compensation deferral plan.
Distribution and Service Plan (12b-1) Fees. Under its General Distributor’s Agreement with the Fund, OppenheimerFunds Distributor, Inc. (the “Distributor”) acts as the Fund’s principal underwriter in the continuous public offering of the Fund’s classes of shares.
|
| 90 OPPENHEIMER ROCHESTER HIGH YIELD MUNICIPAL FUND |
8. Fees and Other Transactions with Affiliates (Continued)
Service Plan for Class A Shares. The Fund has adopted a Service Plan (the “Plan”) for Class A shares pursuant to Rule 12b-1 under the 1940 Act. Under the Plan, the Fund reimburses the Distributor for a portion of its costs incurred for services provided to accounts that hold Class A shares. Reimbursement is made periodically at an annual rate of up to 0.15% of the daily net assets of Class A shares of the Fund. Effective April 1, 2017, this rate changed to 0.25%. The Distributor currently uses all of those fees to pay dealers, brokers, banks and other financial institutions periodically for providing personal service and maintenance of accounts of their customers that hold Class A shares. Any unreimbursed expenses the Distributor incurs with respect to Class A shares in any fiscal year cannot be recovered in subsequent periods. Fees incurred by the Fund under the Plan are detailed in the Statement of Operations.
Distribution and Service Plans for Class B and Class C Shares. The Fund has adopted Distribution and Service Plans (the “Plans”) for Class B and Class C shares pursuant to Rule 12b-1 under the 1940 Act to compensate the Distributor for distributing those share classes, maintaining accounts and providing shareholder services. Under the Plans, the Fund pays the Distributor an annual asset-based sales charge of 0.75% on Class B and Class C shares’ daily net assets. The Fund also pays a service fee under the Plans at an annual rate of 0.15% of daily net assets. The Plans continue in effect from year to year only if the Fund’s Board of Trustees votes annually to approve their continuance at an in person meeting called for that purpose. Fees incurred by the Fund under the Plans are detailed in the Statement of Operations.
Sales Charges. Front-end sales charges and CDSC do not represent expenses of the Fund. They are deducted from the proceeds of sales of Fund shares prior to investment or from redemption proceeds prior to remittance, as applicable. The sales charges retained by the Distributor from the sale of shares and the CDSC retained by the Distributor on the redemption of shares is shown in the following table for the period indicated.
| | | | | | | | | | | | | | | | |
| Year Ended | | Class A
Front-End
Sales Charges
Retained by
Distributor | | | Class A
Contingent
Deferred
Sales Charges
Retained by
Distributor | | | Class B
Contingent
Deferred
Sales Charges
Retained by
Distributor | | | Class C
Contingent
Deferred
Sales Charges
Retained by
Distributor | |
| |
| July 31, 2017 | | | $685,866 | | | | $76,794 | | | | $19,150 | | | | $170,391 | |
9. Borrowings and Other Financing
Borrowings. The Fund can borrow money from banks in amounts up to one third of its total assets (including the amount borrowed) less all liabilities and indebtedness other than borrowings (meaning that the value of those assets must be at least 300% of the amount borrowed). The Fund can use those borrowings for investment-related purposes such as purchasing portfolio securities. The Fund also may borrow to meet redemption obligations or
|
| 91 OPPENHEIMER ROCHESTER HIGH YIELD MUNICIPAL FUND |
NOTES TO FINANCIAL STATEMENTS Continued
9. Borrowings and Other Financing (Continued)
for temporary and emergency purposes. When the Fund invests borrowed money in portfolio securities, it is using a speculative investment technique known as leverage and changes in the value of the Fund’s investments will have a larger effect on its share price than if it did not borrow because of the effect of leverage.
The Fund can also use the borrowings for other investment-related purposes, including in connection with the Fund’s inverse floater investments as discussed in Note 4. The Fund may use the borrowings to reduce the leverage amount of, or unwind or “collapse” trusts that issued “inverse floaters” owned by the Fund, or in circumstances in which the Fund has entered into a shortfall and forbearance agreement with the sponsor of the inverse floater trust to meet the Fund’s obligation to reimburse the sponsor of the inverse floater for the difference between the liquidation value of the underlying bond and the amount due to holders of the short-term floating rate notes issued by the Trust. See the discussion in Note 4 (Inverse Floating Rate Securities) for additional information.
The Fund will pay interest and may pay other fees in connection with loans. If the Fund does borrow, it will be subject to greater expenses than funds that do not borrow. The interest on borrowed money and the other fees incurred in conjunction with loans are an expense that might reduce the Fund’s yield and return. Expenses incurred by the Fund with respect to interest on borrowings and commitment fees are disclosed separately or as other expenses on the Statement of Operations.
The Fund entered into a Revolving Credit and Security Agreement (the “Agreement”) with conduit lenders and Citibank N.A. which enables it to participate with certain other Oppenheimer funds in a committed, secured borrowing facility that permits borrowings of up to $2.5 billion, collectively, by the Oppenheimer Rochester Funds. To secure the loan, the Fund pledges investment securities in accordance with the terms of the Agreement. Securities held in collateralized accounts to cover these borrowings are noted in the Statement of Investments. Interest is charged to the Fund, based on its borrowings, at current commercial paper issuance rates (1.1825% at period end). The Fund pays additional fees monthly to its lender on its outstanding borrowings to manage and administer the facility and is allocated its pro-rata share of an annual structuring fee and ongoing commitment fees both of which are based on the total facility size. Total fees and interest that are included in expenses on the Fund’s Statement of Operations related to its participation in the borrowing facility during the reporting period equal 0.09% of the Fund’s average net assets on an annualized basis. The Fund has the right to prepay such loans and terminate its participation in the conduit loan facility at any time upon prior notice.
At period end, the Fund had borrowings outstanding at an interest rate of 1.1825%.
Details of the borrowings for the reporting period are as follows:
| | | | |
| Average Daily Loan Balance | | $ | 33,004,384 | |
| Average Daily Interest Rate | | | 0.910 % | |
| Fees Paid | | $ | 4,417,024 | |
| Interest Paid | | $ | 159,834 | |
Reverse Repurchase Agreements. The Fund may engage in reverse repurchase
|
| 92 OPPENHEIMER ROCHESTER HIGH YIELD MUNICIPAL FUND |
9. Borrowings and Other Financing (Continued)
agreements. A reverse repurchase agreement is the sale of one or more securities to a counterparty at an agreed-upon purchase price with the simultaneous agreement to repurchase those securities on a future date at a higher repurchase price. The repurchase price represents the repayment of the purchase price and interest accrued thereon over the term of the repurchase agreement. The cash received by the Fund in connection with a reverse repurchase agreement may be used for investment-related purposes such as purchasing portfolio securities or for other purposes such as those described in the preceding “Borrowings” note.
The Fund entered into a Committed Repurchase Transaction Facility (the “Facility”) with J.P. Morgan Securities LLC (the “counterparty”) which enables it to participate with certain other Oppenheimer funds in a committed reverse repurchase agreement facility that permits aggregate outstanding reverse repurchase agreements of up to $750 million, collectively. Interest is charged to the Fund on the purchase price of outstanding reverse repurchase agreements at current LIBOR rates plus an applicable spread. The Fund is also allocated its pro-rata share of an annual structuring fee based on the total Facility size and ongoing commitment fees based on the total unused amount of the Facility. The Fund retains the economic exposure to fluctuations in the value of securities subject to reverse repurchase agreements under the Facility and therefore these transactions are considered secured borrowings for financial reporting purposes. The Fund also continues to receive the economic benefit of interest payments received on securities subject to reverse repurchase agreements, in the form of a direct payment from the counterparty. These payments are included in interest income on the Statement of Operations. Total fees and interest related to the Fund’s participation in the Facility during the reporting period are included in expenses on the Fund’s Statement of Operations and equal 0.04% of the Fund’s average net assets on an annualized basis.
The securities subject to reverse repurchase agreements under the Facility are valued on a daily basis. To the extent this value, after adjusting for certain margin requirements of the Facility, exceeds the cash proceeds received, the Fund may request the counterparty to return securities equal in margin value to this excess. To the extent that the cash proceeds received exceed the margin value of the securities subject to the transaction, the counterparty may request additional securities from the Fund. The Fund has the right to declare each Wednesday as the repurchase date for any outstanding reverse repurchase agreement upon delivery of advanced notification and may also recall any security subject to such a transaction by substituting eligible securities of equal or greater margin value according to the Facility’s terms.
The Fund executed no transactions under the Facility during the reporting period.
Details of reverse repurchase agreement transactions for the reporting period are as follows:
10. Subsequent Event
Since the reporting period end there have been two hurricanes that impacted Puerto Rico and
|
| 93 OPPENHEIMER ROCHESTER HIGH YIELD MUNICIPAL FUND |
NOTES TO FINANCIAL STATEMENTS Continued
10. Subsequent Event (Continued)
the U.S. Virgin Islands causing significant damages. While the full impact of these storms is uncertain, subsequent to fiscal year end and through financial statement issuance date, the change in market value of the Fund’s investments in Puerto Rico and the U.S. Virgin Islands had a negative impact on the Fund’s net assets by less than 2%.
|
| 94 OPPENHEIMER ROCHESTER HIGH YIELD MUNICIPAL FUND |
REPORT OF INDEPENDENT REGISTERED PUBLIC ACCOUNTING FIRM
The Board of Trustees and Shareholders of Oppenheimer Multi-State Municipal Trust:
We have audited the accompanying statement of assets and liabilities of Oppenheimer Rochester High Yield Municipal Fund (the Fund), a separate series of Oppenheimer Multi-State Municipal Trust, including the statement of investments, as of July 31, 2017, and the related statements of operations and cash flows for the year then ended, the statements of changes in net assets for each of the years in the two-year period then ended, and the financial highlights for each of the years in the five-year period then ended. These financial statements and financial highlights are the responsibility of the Fund’s management. Our responsibility is to express an opinion on these financial statements and financial highlights based on our audits.
We conducted our audits in accordance with the standards of the Public Company Accounting Oversight Board (United States). Those standards require that we plan and perform the audit to obtain reasonable assurance about whether the financial statements and financial highlights are free of material misstatement. An audit includes examining, on a test basis, evidence supporting the amounts and disclosures in the financial statements. Our procedures included confirmation of securities owned as of July 31, 2017, by correspondence with the custodian, and brokers, or by other appropriate auditing procedures where replies from brokers were not received. An audit also includes assessing the accounting principles used and significant estimates made by management, as well as evaluating the overall financial statement presentation. We believe that our audits provide a reasonable basis for our opinion.
In our opinion, the financial statements and financial highlights referred to above present fairly, in all material respects, the financial position of Oppenheimer Rochester High Yield Municipal Fund as of July 31, 2017, the results of its operations and cash flows for the year then ended, the changes in its net assets for each of the years in the two-year period then ended, and the financial highlights for each of the years in the five-year period then ended, in conformity with U.S. generally accepted accounting principles.
KPMG LLP
Denver, Colorado
September 28, 2017
|
| 95 OPPENHEIMER ROCHESTER HIGH YIELD MUNICIPAL FUND |
FEDERAL INCOME TAX INFORMATION Unaudited
In early 2017, if applicable, shareholders of record received information regarding all dividends and distributions paid to them by the Fund during calendar year 2016.
None of the dividends paid by the Fund during the reporting period are eligible for the corporate dividend-received deduction. 97.60% of the dividends were derived from interest on municipal bonds and are not subject to federal income taxes. To the extent a shareholder is subject to any state or local tax laws, some or all of the dividends received may be taxable.
The foregoing information is presented to assist shareholders in reporting distributions received from the Fund to the Internal Revenue Service. Because of the complexity of the federal regulations which may affect your individual tax return and the many variations in state and local tax regulations, we recommend that you consult your tax advisor for specific guidance.
|
| 96 OPPENHEIMER ROCHESTER HIGH YIELD MUNICIPAL FUND |
PORTFOLIO PROXY VOTING POLICIES AND GUIDELINES;
UPDATES TO STATEMENTS OF INVESTMENTS Unaudited
The Fund has adopted Portfolio Proxy Voting Policies and Guidelines under which the Fund votes proxies relating to securities (“portfolio proxies”) held by the Fund. A description of the Fund’s Portfolio Proxy Voting Policies and Guidelines is available (i) without charge, upon request, by calling the Fund toll-free at 1.800.CALL OPP (225.5677), (ii) on the Fund’s website at www.oppenheimerfunds.com, and (iii) on the SEC’s website at www.sec.gov. In addition, the Fund is required to file Form N-PX, with its complete proxy voting record for the 12 months ended June 30th, no later than August 31st of each year. The Fund’s voting record is available (i) without charge, upon request, by calling the Fund toll-free at 1.800.CALL OPP (225.5677), and (ii) in the Form N-PX filing on the SEC’s website at www.sec.gov.
The Fund files its complete schedule of portfolio holdings with the SEC for the first quarter and the third quarter of each fiscal year on Form N-Q. The Fund’s Form N-Q filings are available on the SEC’s website at www.sec.gov. Those forms may be reviewed and copied at the SEC’s Public Reference Room in Washington, D.C. Information on the operation of the Public Reference Room may be obtained by calling 1-800-SEC-0330.
Householding—Delivery of Shareholder Documents
This is to inform you about OppenheimerFunds’ “householding” policy. If more than one member of your household maintains an account in a particular fund, OppenheimerFunds will mail only one copy of the fund’s prospectus (or, if available, the fund’s summary prospectus), annual and semiannual report and privacy policy. The consolidation of these mailings, called householding, benefits your fund through reduced mailing expense, and benefits you by reducing the volume of mail you receive from OppenheimerFunds. Householding does not affect the delivery of your account statements.
Please note that we will continue to household these mailings for as long as you remain an OppenheimerFunds shareholder, unless you request otherwise. If you prefer to receive multiple copies of these materials, please call us at 1.800.CALL-OPP (225-5677). You may also notify us in writing or via email. We will begin sending you individual copies of the prospectus (or, if available, the summary prospectus), reports and privacy policy within 30 days of receiving your request to stop householding.
|
| 97 OPPENHEIMER ROCHESTER HIGH YIELD MUNICIPAL FUND |
TRUSTEES AND OFFICERS Unaudited
| | |
Name, Position(s) Held with the Fund, Length of Service, Year of Birth | | Principal Occupation(s) During the Past 5 Years; Other Trusteeships/ Directorships Held; Number of
Portfolios in the Fund Complex Currently Overseen |
| |
| INDEPENDENT TRUSTEES | | The address of each Trustee in the chart below is 6803 S. Tucson Way, Centennial, Colorado 80112-3924. Each Trustee serves for an indefinite term, or until his or her resignation, retirement, death or removal. |
| |
Brian F. Wruble, Chairman of the Board of Trustees (since 2007) and Trustee (since 2005) Year of Birth: 1943 | | Governor of Community Foundation of the Florida Keys (non-profit) (since July 2012); Director of TCP Capital, Inc. (since November 2015); Chairman Emeritus of the Board of Trustees (since August 2011), Chairman of the Board of Trustees (August 2007-August 2011), Trustee of the Board of Trustees (since August 1991) of The Jackson Laboratory (non-profit); Member of Zurich Insurance Group’s Investment Management Advisory Council (insurance) (October 2004-February 2017); Treasurer (since 2007) and Trustee (since May 1992) of the Institute for Advanced Study (non-profit educational institute); Director of Special Value Opportunities Fund, LLC (registered investment company) (affiliate of the Sub-Adviser’s parent company) (September 2004-June 2015); General Partner of Odyssey Partners, L.P. (hedge fund) (September 1995-December 2007); Special Limited Partner of Odyssey Investment Partners, LLC (private equity investment) (January 1999-September 2004). Oversees 57 portfolios in the OppenheimerFunds complex. Mr. Wruble has served on the Boards of certain Oppenheimer funds since April 2001, during which time he has become familiar with the Fund’s (and other Oppenheimer funds’) financial, accounting, regulatory and investment matters and has contributed to the Boards’ deliberations. |
| |
Beth Ann Brown, Trustee (since 2016) Year of Birth: 1968 | | Advisor, Board of Advisors of Caron Engineering Inc. (since December 2014); Independent Consultant (since September 2012); held the following positions at Columbia Management Investment Advisers LLC: Head of Intermediary Distribution (2008-2012), Managing Director, Strategic Relations (2005-2008), Managing Director, Head of National Accounts (2004-2005); Senior Vice President, National Account Manager (2002-2004), Senior Vice President, Key Account Manager (1999-2002) and Vice President, Key Account Manager (1996-1999) of Liberty Funds Distributor, Inc.; President and Director, of Acton Shapleigh Youth Conservation Corps (non -profit) (2012-2015); and Vice President and Director of Grahamtastic Connection (non-profit) (since May 2013). Oversees 57 portfolios in the OppenheimerFunds complex. Ms. Brown has served on the Boards of certain Oppenheimer funds since January 2016, during which time she has become familiar with the Fund’s (and other Oppenheimer funds’) financial, accounting, regulatory and investment matters and has contributed to the Boards’ deliberations. |
| |
Edmund P. Giambastiani, Jr., Trustee (since 2013) Year of Birth: 1948 | | Advisory Board Member of the Maxwell School of Citizenship and Public Affairs of Syracuse University (since April 2012); Director of Mercury Defense Systems Inc. (information technology) (August 2011-February 2013); Trustee of the U.S. Naval Academy Foundation Athletic & Scholarship Program (since November 2010); Advisory Board Member of the Massachusetts Institute of Technology Lincoln Laboratory (federally-funded research development center) (since May 2010); Director of The Boeing Company (aerospace and defense) (since October 2009); Trustee of MITRE Corporation (federally-funded research development center) (since September 2008); Independent Director of QinetiQ Group Plc (defense technology and security) (February 2008-August 2011); Chairman of Monster Worldwide, Inc. (on-line career services) (March 2015-November 2016), |
|
| 98 OPPENHEIMER ROCHESTER HIGH YIELD MUNICIPAL FUND |
| | |
Edmund P. Giambastiani, Jr., Continued | | Director of Monster Worldwide, Inc. (on-line career services) (February 2008-June 2011); Lead Director (June 2011-March 2015); Chairman of Alenia North America, Inc. (military and defense products) (January 2008-October 2009); Director of SRA International, Inc. (information technology and services) (January 2008-July 2011); President of Giambastiani Group LLC (national security and energy consulting) (since October 2007); United States Navy, career nuclear submarine officer (June 1970-October 2007), Vice Chairman of the Joint Chiefs of Staff (2005-October 2007), Supreme Allied Commander of NATO Commander Transformation (2003-2005), Commander, U.S. Joint Forces Command (2002-2005). Since his retirement from the U.S. Navy in October 2007, Admiral Giambastiani has also served on numerous U.S. Government advisory boards, investigations and task forces for the Secretaries of Defense, State and Interior and the Central Intelligence Agency. He recently completed serving as a federal commissioner on the Military Compensation and Retirement Modernization Commission. Oversees 57 portfolios in the OppenheimerFunds complex. Admiral Giambastiani has served on the Boards of certain Oppenheimer funds since February 2013, during which time he has become familiar with the Fund’s (and other Oppenheimer funds’) financial, accounting, regulatory and investment matters and has contributed to the Boards’ deliberations. For purposes of this report, Admiral Giambastiani is identified as a Trustee. |
| |
Elizabeth Krentzman, Trustee (since 2014) Year of Birth: 1959 | | Director of Cartica Management, LLC Funds (private investment funds) (since 2017); Trustee of University of Florida Law Center Association, Inc. (since 2016); Member of University of Florida Law Advisory Board, Washington, DC Alumni Group (since 2015); Advisory Board Member of the Securities and Exchange Commission Historical Society (since 2007); held the following positions at Deloitte & Touche LLP: Principal and Chief Regulatory Advisor for Asset Management Services (2007 - 2014) and U.S. Mutual Fund Leader (2011 - 2014); General Counsel of the Investment Company Institute (trade association) (June 2004 - April 2007); held the following positions at Deloitte & Touche LLP: National Director of the Investment Management Regulatory Consulting Practice (1997 - 2004), Principal (2003 - 2004), Director (1998 - 2003) and Senior Manager (1997 - 1998); Assistant Director of the Division of Investment Management - Office of Disclosure and Investment Adviser Regulation of the U.S. Securities and Exchange Commission (1996 - 1997) and various positions with the Division of Investment Management – Office of Regulatory Policy (1991 - 1996) of the U.S. Securities and Exchange Commission; Associate at Ropes & Gray LLP (1987 – 1991). Oversees 57 portfolios in the OppenheimerFunds complex. Ms. Krentzman has served on the Boards of certain Oppenheimer funds since August 2014, during which time she has become familiar with the Fund’s (and other Oppenheimer funds’) financial, accounting, regulatory and investment matters and has contributed to the Boards’ deliberations. |
| |
Mary F. Miller, Trustee (since 2007) Year of Birth: 1942 | | Trustee of International House (not-for-profit) (since June 2007); Trustee of the American Symphony Orchestra (not-for-profit) (October 1998-November 2011); and Senior Vice President and General Auditor of American Express Company (financial services company) (July 1998-February 2003). Oversees 57 portfolios in the OppenheimerFunds complex. Ms. Miller has served on the Boards of certain Oppenheimer funds since August 2004, during which time she has become familiar with the Fund’s (and other Oppenheimer funds’) financial, accounting, regulatory and investment matters and has contributed to the Boards’ deliberations. |
|
| 99 OPPENHEIMER ROCHESTER HIGH YIELD MUNICIPAL FUND |
TRUSTEES AND OFFICERS Unaudited / Continued
| | |
Joel W. Motley, Trustee (since 2002) Year of Birth: 1952 | | Director of Office of Finance Federal Home Loan Bank (since September 2016); Director of Greenwall Foundation (since October 2013); Member of Board and Investment Committee of The Greenwall Foundation (since April 2013); Member of the Vestry of Trinity Wall Street (since April 2012); Director of Southern Africa Legal Services Foundation (since March 2012); Board Member of Pulitzer Center for Crisis Reporting (non-profit journalism) (since March 2011); Managing Director of Public Capital Advisors, LLC (privately-held financial advisor) (since January 2006); Managing Director of Carmona Motley, Inc. (privately-held financial advisor) (since January 2002); Director of Columbia Equity Financial Corp. (privately-held financial advisor) (2002-2007); Managing Director of Carmona Motley Hoffman Inc. (privately-held financial advisor) (January 1998-December 2001); Member of the Finance and Budget Committee of the Council on Foreign Relations, Member of the Investment Committee and Board of Human Rights Watch (since July 2000) and Member of the Investment Committee and Board of Historic Hudson Valley (since February 2010). Oversees 57 portfolios in the OppenheimerFunds complex. Mr. Motley has served on the Boards of certain Oppenheimer funds since October 2002, during which time he has become familiar with the Fund’s (and other Oppenheimer funds’) financial, accounting, regulatory and investment matters and has contributed to the Boards’ deliberations. |
| |
Joanne Pace, Trustee (since 2013) Year of Birth: 1958 | | Advisory Board Director of Massey Quick and Company, LLC (since October 2014); Board Director of Horizon Blue Cross Blue Shield of New Jersey (since November 2012); Advisory Board Director of The Alberleen Group LLC (since March, 2012); Board Member (since January 2015), Board Member of 100 Women in Hedge Funds (non-profit) (since January 2015); Advisory Council Member of Morgan Stanley Children’s Hospital (non-profit) (since May, 2012); Senior Advisor of SECOR Asset Management, LP (2010-2011); Managing Director and Chief Operating Officer of Morgan Stanley Investment Management (2006-2010); Partner and Chief Operating Officer of FrontPoint Partners, LLC (hedge fund) (2005-2006); held the following positions at Credit Suisse: Managing Director (2003-2005); Global Head of Human Resources and member of Executive Board and Operating Committee (2004-2005), Global Head of Operations and Product Control (2003-2004); held the following positions at Morgan Stanley: Managing Director (1997-2003), Controller and Principal Accounting Officer (1999-2003); Chief Financial Officer (temporary assignment) for the Oversight Committee, Long Term Capital Management (1998-1999). Lead Independent Director and Chair of the Audit and Nominating Committee of The Global Chartist Fund, LLC of Oppenheimer Asset Management (2011-2012); Board Director of Managed Funds Association (2008-2010); Board Director of Morgan Stanley Foundation (2007-2010) and Investment Committee Chair (2008-2010). Oversees 57 portfolios in the OppenheimerFunds complex. Ms. Pace has served on the Boards of certain Oppenheimer funds since November 2012, including as an Advisory Board Member for certain Oppenheimer funds, during which time she has become familiar with the Fund’s (and other Oppenheimer funds’) financial, accounting, regulatory and investment matters and has contributed to the Board’s deliberations. For purposes of this report, Ms. Pace is identified as a Trustee. |
|
| 100 OPPENHEIMER ROCHESTER HIGH YIELD MUNICIPAL FUND |
| | |
Daniel Vandivort, Trustee (since 2014) Year of Birth: 1954 | | Chairman and Lead Independent Director/Trustee (March 2010-September 2014), Chairman of the Audit Committee (March 2009-September 2014) and Director/ Trustee (December 2008-September 2014) of the Board of Directors/Trustees of Value Line Funds; Trustee, Board of Trustees of Huntington Disease Foundation of America (since January 2015 and June 2007-December 2013) and Treasurer, Chairman of the Audit and Finance Committee (since January 2016); Trustee, Board of Trustees, RIM Retirement Savings Plan (2005-2007); President and Chief Investment Officer, Robeco Investment Management, formerly known as Weiss Peck and Greer (January 2005-June 2007); Member, Management Committee of Robeco Investment Management (2001-2007); Chairman and Trustee of the Board of Trustees of Weiss, Peck and Greer Funds (2004-2005); Managing Director and Head of Fixed Income, Weiss, Peck and Greer (November 1994-January 2005); Managing Director and Head of Fixed Income, CS First Boston Investment Management (January 1992-November 1994); Director, Global Product Development, First Boston Asset Management (November 1989 to January 1992); Vice President, Fixed Income Sales, First Boston Corp. (May 1984-November 1989). Oversees 57 portfolios in the OppenheimerFunds complex. Mr. Vandivort has served on the Boards of certain Oppenheimer funds since 2014, during which time he has become familiar with the Fund’s (and other Oppenheimer funds’) financial, accounting, regulatory and investment matters and has contributed to the Boards’ deliberations. |
| | | |
INTERESTED TRUSTEE AND OFFICER | | Mr. Steinmetz is an “Interested Trustee” because he is affiliated with the Manager and the Sub-Adviser by virtue of his positions as Chairman of the Sub-Adviser and officer and director of the Manager. Both as a Trustee and as an officer, Mr. Steinmetz serves for an indefinite term, or until his resignation, retirement, death or removal. Mr. Steinmetz’s address is 225 Liberty Street, New York, New York 10281-1008. |
| |
Arthur P. Steinmetz, Trustee (since 2015), President and Principal Executive Officer (since 2014) Year of Birth: 1958 | | Chairman of the Sub-Adviser (since January 2015); CEO and Chairman of the Manager (since July 2014), President of the Manager (since May 2013), a Director of the Manager (since January 2013), Director of the Sub-Adviser (since July 2014), President, Management Director and CEO of Oppenheimer Acquisition Corp. (the Sub-Adviser’s parent holding company) (since July 2014), and President and Director of OFI SteelPath, Inc. (since January 2013). Chief Investment Officer of the OppenheimerFunds advisory entities from (January 2013-December 2013); Executive Vice President of the Manager (January 2013-May 2013); Chief Investment Officer of the Sub-Adviser (October 2010-December 2012); Chief Investment Officer, Fixed-Income, of the Sub-Adviser (April 2009-October 2010); Executive Vice President of the Sub-Adviser (October 2009-December 2012); Director of Fixed Income of the Sub-Adviser (January 2009-April 2009); and a Senior Vice President of the Sub-Adviser (March 1993-September 2009). An officer of 101 portfolios in the OppenheimerFunds complex. |
| | | |
| OTHER OFFICERS OF THE FUND | | The addresses of the Officers in the chart below are as follows: for Messrs. Cottier, Willis, DeMitry, Camarella, Pulire, Stein, Mss. Mossow, Lo Bessette, Foxson and Picciotto, 225 Liberty Street, New York, New York 10281-1008, for Mr. Petersen, 6803 S. Tucson Way, Centennial, Colorado 80112-3924. Each Officer serves for an indefinite term or until his or her resignation, retirement, death or removal. |
| |
Scott S. Cottier, Vice President (since 2005) Year of Birth: 1971 | | Senior Vice President of the Sub-Adviser (since January 2017) and a Senior Portfolio Manager (since September 2002). Vice President of the Sub-Adviser (September 2002-January 2017). Portfolio Manager and trader at Victory Capital Management (1999-2002). Team Leader, a Senior Portfolio Manager, an officer and a trader for the Fund and other Oppenheimer funds. |
|
| 101 OPPENHEIMER ROCHESTER HIGH YIELD MUNICIPAL FUND |
TRUSTEES AND OFFICERS Unaudited / Continued
| | |
Troy E. Willis, Vice President (since 2005) Year of Birth: 1972 | | Senior Vice President of the Sub-Adviser (since January 2017) and a Senior Portfolio Manager (since January 2006); Vice President of the Sub-Adviser (July 2009-January 2017); Assistant Vice President of the Sub-Adviser (July 2005-June 2009). Portfolio Manager of the Sub-Adviser (June 2002-December 2005). Corporate Attorney for Southern Resource Group (June 1999-July 2001). Team Leader, a Senior Portfolio Manager, an officer and a trader for the Fund and other Oppenheimer funds. |
| |
Mark R. DeMitry, Vice President (since 2009) Year of Birth: 1976 | | Vice President of the Sub-Adviser and a Senior Portfolio Manager (since July 2009); Associate Portfolio Manager of the Fund (September 2006- June 2009). Research Analyst of the Sub-Adviser (June 2003-September 2006) and a Credit Analyst of the Sub-Adviser (July 2001-May 2003). Senior Portfolio Manager, an officer and a trader for the Fund and other Oppenheimer funds. |
| |
Michael L. Camarella. Vice President (since 2009) Year of Birth: 1976 | | Vice President of the Sub-Adviser and a Senior Portfolio Manager (since January 2011); Assistant Vice President of the Sub-Adviser (July 2009-December 2010); Associate Portfolio Manager of the Sub-Adviser (January 2008-December 2010). Research Analyst of the Sub-Adviser (April 2006-December 2007) and a Credit Analyst of the Sub-Adviser (June 2003-March 2006). Senior Portfolio Manager, an officer and a trader for the Fund and other Oppenheimer funds. |
| |
Charles S. Pulire, Vice President (since 2011) Year of Birth: 1977 | | Vice President of the Sub-Adviser and a Senior Portfolio Manager (since February 2013); Assistant Vice President of the Sub-Adviser (December 2010-January 2013); Research Analyst of the Manager (February 2008-November 2010); Credit Analyst of the Sub-Adviser (May 2006-January 2008). Senior Portfolio Manager, an officer and a trader for the Fund and other Oppenheimer funds. |
| |
Elizabeth S. Mossow, Vice President (since 2016) Year of Birth: 1978 | | Vice President of the Sub-Adviser (since January 2016) and Senior Portfolio Manager of the Sub-Adviser (since January 2017); Portfolio Manager of the Sub-Adviser (January 2016-January 2017); Assistant Vice President of the Sub-Adviser (January 2011-January 2016). Associate Portfolio Manager (June 2013-January 2016). Research Analyst of the Sub-Adviser (June 2011-June 2013) and was a Credit Analyst of the Sub-Adviser (May 2007-May 2011). Portfolio Manager, an officer and a trader for the Fund and other Oppenheimer funds. |
| |
Richard A. Stein, Vice President (since 2007) Year of Birth: 1957 | | Director of the Rochester Credit Analysis team (since March 2004); Senior Vice President of the Sub-Adviser (since June 2011) and a Vice President of the Sub-Adviser (November 1997-May 2011); heads up the Rochester Credit Analysis team (since May 1993). |
| |
Cynthia Lo Bessette, Secretary and Chief Legal Officer (since 2016) Year of Birth: 1969 | | Executive Vice President, General Counsel and Secretary of the Manager (since February 2016); Senior Vice President and Deputy General Counsel of the Manager (March 2015-February 2016); Chief Legal Officer of the Sub-Adviser and the Distributor (since February 2016); Vice President, General Counsel and Secretary of Oppenheimer Acquisition Corp. (since February 2016); General Counsel of OFI SteelPath, Inc., VTL Associates, LLC and Index Management Solutions, LLC (since February 2016); Chief Legal Officer of OFI Global Institutional, Inc., HarbourView Asset Management Corporation, OFI Global Trust Company, Oppenheimer Real Asset Management, Inc., OFI Private Investments Inc., Shareholder Services, Inc. and Trinity Investment Management Corporation (since February 2016); Corporate Counsel (February 2012-March 2015) and Deputy Chief Legal Officer (April 2013-March 2015) of Jennison Associates LLC; Assistant General Counsel (April 2008-September 2009) and Deputy General Counsel (October 2009-February 2012) of Lord Abbett & Co. LLC. An officer of 101 portfolios in the OppenheimerFunds complex. |
|
| 102 OPPENHEIMER ROCHESTER HIGH YIELD MUNICIPAL FUND |
| | |
Jennifer Foxson, Vice President and Chief Business Officer (since 2014) Year of Birth: 1969 | | Senior Vice President of OppenheimerFunds Distributor, Inc. (since June 2014); Vice President of OppenheimerFunds Distributor, Inc. (April 2006-June 2014); Vice President of the Sub-Adviser (January 1998-March 2006); Assistant Vice President of the Sub-Adviser (October 1991-December 1998). An officer of 101 portfolios in the OppenheimerFunds complex. |
| |
Mary Ann Picciotto, Chief Compliance Officer and Chief Anti-Money Laundering Officer (since 2014) Year of Birth: 1973 | | Senior Vice President and Chief Compliance Officer of the Manager (since March 2014); Chief Compliance Officer of the Sub-Adviser, OFI SteelPath, Inc., OFI Global Trust Company, OFI Global Institutional, Inc., Oppenheimer Real Asset Management, Inc., OFI Private Investments, Inc., Harborview Asset Management Corporation, Trinity Investment Management Corporation, and Shareholder Services, Inc. (since March 2014); Managing Director of Morgan Stanley Investment Management Inc. and certain of its various affiliated entities; Chief Compliance Officer of various Morgan Stanley Funds (May 2010-January 2014); Chief Compliance Officer of Morgan Stanley Investment Management Inc. (April 2007-January 2014). An officer of 101 portfolios in the OppenheimerFunds complex. |
| |
Brian S. Petersen, Treasurer and Principal Financial & Accounting Officer (since 2016) Year of Birth: 1970 | | Senior Vice President of the Manager (since January 2017); Vice President of the Manager (January 2013-January 2017); Vice President of the Sub-Adviser (February 2007-December 2012); Assistant Vice President of the Sub-Adviser (August 2002-2007). An officer of 101 portfolios in the OppenheimerFunds complex. |
The Fund’s Statement of Additional Information contains additional information about the Fund’s Trustees and Officers and is available without charge upon request by calling 1.800.CALL OPP (225.5677).
|
| 103 OPPENHEIMER ROCHESTER HIGH YIELD MUNICIPAL FUND |
OPPENHEIMER ROCHESTER HIGH YIELD MUNICIPAL FUND
| | |
| Manager | | OFI Global Asset Management, Inc. |
| |
| Sub-Adviser | | OppenheimerFunds, Inc. |
| |
| Distributor | | OppenheimerFunds Distributor, Inc. |
| |
| Transfer and Shareholder | | OFI Global Asset Management, Inc. |
| Servicing Agent | | |
| |
| Sub-Transfer Agent | | Shareholder Services, Inc. |
| | DBA OppenheimerFunds Services |
| |
| Independent Registered | | KPMG LLP |
| Public Accounting Firm | | |
| |
| Legal Counsel | | Kramer Levin Naftalis & Frankel LLP |
© 2017 OppenheimerFunds, Inc. All rights reserved.
|
| 104 OPPENHEIMER ROCHESTER HIGH YIELD MUNICIPAL FUND |
PRIVACY POLICY NOTICE
As an Oppenheimer fund shareholder, you are entitled to know how we protect your personal information and how we limit its disclosure.
Information Sources
We obtain nonpublic personal information about our shareholders from the following sources:
| ● | | Applications or other forms |
| ● | | When you create a user ID and password for online account access |
| ● | | When you enroll in eDocs Direct,SM our electronic document delivery service |
| ● | | Your transactions with us, our affiliates or others |
| ● | | Technologies on our website, including: “cookies” and web beacons, which are used to collect data on the pages you visit and the features you use. |
If you visit oppenheimerfunds.com and do not log on to the secure account information areas, we do not obtain any personal information about you. When you do log on to a secure area, we do obtain your user ID and password to identify you. We also use this information to provide you with products and services you have requested, to inform you about products and services that you may be interested in and assist you in other ways.
We do not collect personal information through our website unless you willingly provide it to us, either directly by email or in those areas of the website that request information. In order to update your personal information (including your mailing address, email address and phone number) you must first log on and visit your user profile.
If you have set your browser to warn you before accepting cookies, you will receive the warning message with each cookie. You can refuse cookies by turning them off in your browser. However, doing so may limit your access to certain sections of our website.
We use cookies to help us improve and manage our website. For example, cookies help us recognize new versus repeat visitors to the site, track the pages visited, and enable some special features on the website. This data helps us provide a better service for our website visitors.
Protection of Information
We do not disclose any non-public personal information (such as names on a customer list) about current or former customers to anyone, except as permitted by law.
Disclosure of Information
Copies of confirmations, account statements and other documents reporting activity in your fund accounts are made available to your financial advisor (as designated by you). We may also use details about you and your investments to help us, our financial service affiliates, or firms that jointly market their financial products and services with ours, to better serve your investment needs or suggest educational material that may be of interest to you. If this requires us to provide you with an opportunity to “opt in” or “opt out” of such information sharing with a firm not affiliated with us, you will receive notification on how to do so, before any such sharing takes place.
Right of Refusal
We will not disclose your personal information to unaffiliated third parties (except as permitted by law), unless we first offer you a reasonable opportunity to refuse or “opt out” of such disclosure.
|
| 105 OPPENHEIMER ROCHESTER HIGH YIELD MUNICIPAL FUND |
PRIVACY POLICY NOTICE Continued
Internet Security and Encryption
In general, the email services provided by our website are encrypted and provide a secure and private means of communication with us. To protect your own privacy, confidential and/or personal information should only be communicated via email when you are advised that you are using a secure website. As a security measure, we do not include personal or account information in non-secure emails, and we advise you not to send such information to us in non-secure emails. Instead, you may take advantage of the secure features of our website to encrypt your email correspondence. To do this, you will need to use a browser that supports Secure Sockets Layer (SSL) protocol.
| ● | | All transactions, including redemptions, exchanges and purchases, are secured by SSL and 256-bit encryption. SSL is used to establish a secure connection between your PC and OppenheimerFunds’ server. It transmits information in an encrypted and scrambled format. |
| ● | | Encryption is achieved through an electronic scrambling technology that uses a “key” to code and then decode the data. Encryption acts like the cable converter box you may have on your television set. It scrambles data with a secret code so that no one can make sense of it while it is being transmitted. When the data reaches its destination, the same software unscrambles the data. |
| ● | | You can exit the secure area by either closing your browser, or for added security, you can use the Log Out button before you close your browser. |
Other Security Measures
We maintain physical, electronic and procedural safeguards to protect your personal account information. Our employees and agents have access to that information only so that they may offer you products or provide services, for example, when responding to your account questions.
How You Can Help
You can also do your part to keep your account information private and to prevent unauthorized transactions. If you obtain a user ID and password for your account, safeguard that information. Also, take special precautions when accessing your account on a computer used by others.
Who We Are
This joint notice describes the privacy policies of the Oppenheimer funds, OppenheimerFunds, Inc., each of its investment adviser subsidiaries, OppenheimerFunds Distributor, Inc. and OFI Global Trust Co. It applies to all Oppenheimer fund accounts you presently have, or may open in the future, using your Social Security number—whether or not you remain a shareholder of our funds. This notice was last updated November 2016. In the event it is updated or changed, we will post an updated notice on our website at oppenheimerfunds.com. If you have any questions about this privacy policy, write to us at P.O. Box 5270, Denver, CO 80217-5270, email us by clicking on the Contact Us section of our website at oppenheimerfunds.com or call us at 1.800.CALL OPP (225.5677).
|
| 106 OPPENHEIMER ROCHESTER HIGH YIELD MUNICIPAL FUND |
THIS PAGE INTENTIONALLY LEFT BLANK.
|
| 107 OPPENHEIMER ROCHESTER HIGH YIELD MUNICIPAL FUND |
THIS PAGE INTENTIONALLY LEFT BLANK.
|
| 108 OPPENHEIMER ROCHESTER HIGH YIELD MUNICIPAL FUND |
THIS PAGE INTENTIONALLY LEFT BLANK.
|
| 109 OPPENHEIMER ROCHESTER HIGH YIELD MUNICIPAL FUND |
THIS PAGE INTENTIONALLY LEFT BLANK.
|
| 110 OPPENHEIMER ROCHESTER HIGH YIELD MUNICIPAL FUND |
THIS PAGE INTENTIONALLY LEFT BLANK.
|
| 111 OPPENHEIMER ROCHESTER HIGH YIELD MUNICIPAL FUND |

OppenheimerFunds®
The Right Way
to Invest
Visit us at oppenheimerfunds.com for 24-hr access to account information and transactions or call us at 800.CALL OPP (800.225.5677) for 24-hr automated information and automated transactions. Representatives also available Mon–Fri 8am-8pm ET.
| | |
Visit Us oppenheimerfunds.com Call Us 800 225 5677 | | |
Follow Us 
| | Oppenheimer funds are distributed by OppenheimerFunds Distributor, Inc. 225 Liberty Street, New York, NY 10281-1008 © 2017 OppenheimerFunds Distributor, Inc. All rights reserved. RA0795.001.0717 September 26, 2017 |
Item 2. Code of Ethics.
The registrant has adopted a code of ethics that applies to the registrant’s principal executive officer, principal financial officer, principal accounting officer or controller or persons performing similar functions.
Item 3. Audit Committee Financial Expert.
The Board of Trustees of the registrant has determined that Joanne Pace, the Board’s Audit Committee Chairwoman, is an audit committee financial expert and that Ms. Pace is “independent” for purposes of this Item 3.
Item 4. Principal Accountant Fees and Services.
The principal accountant for the audit of the registrant’s annual financial statements billed $148,600 in fiscal 2017 and $140,800 in fiscal 2016.
The principal accountant for the audit of the registrant’s annual financial statements billed $12,150 in fiscal 2017 and $13,212 in fiscal 2016.
The principal accountant for the audit of the registrant’s annual financial statements billed $320,775 in fiscal 2017 and $736,335 in fiscal 2016 to the registrant’s investment adviser or any entity controlling, controlled by, or under common control with the adviser that provides ongoing services to the registrant.
Such services include: Internal control reviews, GIPS attestation procedures, additional audit services, and custody exams
The principal accountant for the audit of the registrant’s annual financial statements billed no such fees in fiscal 2017 and no such fees in fiscal 2016.
The principal accountant for the audit of the registrant’s annual financial statements billed $710,577 in fiscal 2017 and $298,261 in fiscal 2016 to the registrant’s investment adviser or any entity controlling, controlled by, or under common control with the adviser that provides ongoing services to the registrant.
Such services include: tax compliance, tax planning and tax advice. Tax compliance generally involves preparation of original and amended tax returns, claims for a refund and tax payment-planning services. Tax planning and tax advice includes assistance with tax audits and appeals, tax advice related to mergers and acquisitions and requests for rulings or technical advice from taxing authorities.
The principal accountant for the audit of the registrant’s annual financial statements billed no such fees in fiscal 2017 and no such fees in fiscal 2016.
The principal accountant for the audit of the registrant’s annual financial statements billed no such fees in fiscal 2017 and no such fees in fiscal 2016 to the registrant’s investment adviser or any entity controlling, controlled by, or under common control with the adviser that provides ongoing services to the registrant.
Such fees would include the cost to the principal accountant of attending audit committee meetings and consultations regarding the registrant’s retirement plan with respect to its Trustees.
| (e) | (1) During its regularly scheduled periodic meetings, the registrant’s audit committee will pre-approve all audit, audit-related, tax and other services to be provided by the principal accountants of the registrant. |
The audit committee has delegated pre-approval authority to its Chairwoman for any subsequent new engagements that arise between regularly scheduled meeting dates provided that any fees such pre-approved are presented to the audit committee at its next regularly scheduled meeting.
Under applicable laws, pre-approval of non-audit services may be waived provided that: 1) the aggregate amount of all such services provided constitutes no more than five percent of the total amount of fees paid by the registrant to its principal accountant during the fiscal year in which services are provided 2) such services were not recognized by the registrant at the time of engagement as non-audit services and 3) such services are promptly brought to the attention of the audit committee of the registrant and approved prior to the completion of the audit.
(2) 0%
| (f) | Not applicable as less than 50%. |
| (g) | The principal accountant for the audit of the registrant’s annual financial statements billed $1,043,502 in fiscal 2017 and $1,047,808 in fiscal 2016 to the registrant and the registrant’s investment adviser or any entity controlling, controlled by, or under common control with the adviser that provides ongoing services to the registrant related to non-audit fees. Those billings did not include any prohibited non-audit services as defined by the Securities Exchange Act of 1934. |
| (h) | The registrant’s audit committee of the board of Trustees has considered whether the provision of non-audit services that were rendered to the registrant’s investment adviser, and any entity controlling, controlled by, or under common control with the investment adviser that provides ongoing services to the registrant that were not pre-approved pursuant to paragraph (c)(7)(ii) of Rule 2-01 of Regulation S-X is compatible with maintaining the principal accountant’s independence. No such services were rendered. |
Item 5. Audit Committee of Listed Registrants
Not applicable.
Item 6. Schedule of Investments.
a) Not applicable. The complete schedule of investments is included in Item 1 of this Form N-CSR.
b) Not applicable.
Item 7. Disclosure of Proxy Voting Policies and Procedures for Closed-End Management Investment Companies.
Not applicable.
Item 8. Portfolio Managers of Closed-End Management Investment Companies.
Not applicable.
Item 9. Purchases of Equity Securities by Closed-End Management Investment Company and Affiliated Purchasers.
Not applicable.
Item 10. Submission of Matters to a Vote of Security Holders.
The Fund’s Governance Committee Provisions with Respect to Nominations of Directors/Trustees to the Respective Boards
None
Item 11. Controls and Procedures.
Based on their evaluation of the registrant’s disclosure controls and procedures (as defined in rule 30a-3(c) under the Investment Company Act of 1940 (17 CFR 270.30a-3(c)) as of 7/31/2017, the registrant’s principal executive officer and principal financial officer found the registrant’s disclosure controls and procedures to provide reasonable assurances that information required to be disclosed by the registrant in the reports that it files under the Securities Exchange Act of 1934 (a) is accumulated and communicated to registrant’s management, including its principal executive officer and principal financial officer, to allow timely decisions regarding required disclosure, and (b) is recorded, processed, summarized and reported, within the time periods specified in the rules and forms adopted by the U.S. Securities and Exchange Commission.
There have been no changes in the registrant’s internal controls over financial reporting that occurred during the registrant’s second fiscal quarter of the period covered by this report that
have materially affected, or are reasonably likely to materially affect, the registrant’s internal control over financial reporting.
Item 12. Exhibits.
| (a) | (1) Exhibit attached hereto. |
(2) Exhibits attached hereto.
(3) Not applicable.
| (b) | Exhibit attached hereto. |
SIGNATURES
Pursuant to the requirements of the Securities Exchange Act of 1934 and the Investment Company Act of 1940, the registrant has duly caused this report to be signed on its behalf by the undersigned, thereunto duly authorized.
Oppenheimer Multi-State Municipal Trust
| | |
| |
| By: | | /s/ Arthur P. Steinmetz |
| | Arthur P. Steinmetz |
| | Principal Executive Officer |
| Date: | | 9/12/2017 |
Pursuant to the requirements of the Securities Exchange Act of 1934 and the Investment Company Act of 1940, this report has been signed below by the following persons on behalf of the registrant and in the capacities and on the dates indicated.
| | |
| |
| By: | | /s/ Arthur P. Steinmetz |
| | Arthur P. Steinmetz |
| | Principal Executive Officer |
| Date: | | 9/12/2017 |
| |
| By: | | /s/ Brian S. Petersen |
| | Brian S. Petersen |
| | Principal Financial Officer |
| Date: | | 9/12/2017 |
