UNITED STATES
SECURITIES AND EXCHANGE COMMISSION
WASHINGTON, D.C. 20549
FORM N-CSR
CERTIFIED SHAREHOLDER REPORT OF REGISTERED
MANAGEMENT INVESTMENT COMPANIES
Investment Company Act file number 811-5867
Oppenheimer Multi-State Municipal Trust
(Exact name of registrant as specified in charter)
6803 South Tucson Way, Centennial, Colorado 80112-3924
(Address of principal executive offices) (Zip code)
Arthur S. Gabinet
OFI Global Asset Management, Inc.
225 Liberty Street, New York, New York 10281-1008
(Name and address of agent for service)
Registrant’s telephone number, including area code: (303) 768-3200
Date of fiscal year end: July 31
Date of reporting period: 7/31/2015
| Item 1. | Reports to Stockholders. |
Table of Contents
Class A Shares
AVERAGE ANNUAL TOTAL RETURNS AT 7/31/15
| | | | | | | | |
| | | Class A Shares of the Fund | | | | |
| | | Without Sales Charge
| | With Sales Charge
| | Barclays
Municipal Bond
Index | | |
1-Year | | 1.64% | | -3.19% | | 3.56% | | |
5-Year | | 4.02 | | 3.01 | | 4.39 | | |
10-Year | | 3.00 | | 2.50 | | 4.57 | | |
Performance data quoted represents past performance, which does not guarantee future results. The investment return and principal value of an investment in the Fund will fluctuate so that an investor’s shares, when redeemed, may be worth more or less than their original cost. Fund returns include changes in share price, reinvested distributions, and a 4.75% maximum applicable sales charge except where “without sales charge” is indicated. Current performance may be lower or higher than the performance quoted. Returns do not consider capital gains or income taxes on an individual’s investment. For performance data current to the most recent month-end, visit oppenheimerfunds.com or call 1.800.CALL OPP (225.5677).
Oppenheimer Rochester is using social media to provide timely information related to muni market developments at www.twitter.com/RochesterFunds.
2 OPPENHEIMER ROCHESTER NEW JERSEY MUNICIPAL FUND
Fund Performance Discussion
Amid low interest rates and coverage that we believe was often narrowly focused on the market’s challenges, Oppenheimer Rochester New Jersey Municipal Fund delivered high levels of tax-free income in the 12 months ended July 31, 2015. The Fund’s Class A shares provided a distribution yield of 5.26% at net asset value (NAV) at the end of this reporting period trailing only one category peer – this Fund’s Y shares – in Lipper’s New Jersey Municipal Debt Funds category. Tax-free income generated by this Fund’s holdings contributed 100% of the Fund’s total return this reporting period.
MARKET OVERVIEW
Yields on high-grade municipal bonds rose during this reporting period as the market continued to anticipate changes to the Fed Funds target rate. Since October 2014, when the Federal Open Market Committee (FOMC) voted to end its program of purchasing mortgage-backed securities and long-term Treasuries in an effort to stimulate the economy (quantitative easing), speculation about the Fed’s plans often triggered movements in the equity and bond markets.
Near the end of this reporting period, Federal Reserve Chairman Janet Yellen told the U.S. Congress that improving economic conditions “would likely make it appropriate for the
|
The average distribution yield in Lipper’s New Jersey Municipal Debt Funds category was 3.48% at the end of this reporting period. At 5.26%, the distribution yield at NAV for this Fund’s Class A shares was 178 basis points higher than the category average. |
central bank to raise rates at some point this year,” assuming the labor market continues to advance.
While not definitive by any measure, the statement was more specific than earlier announcements from the Fed. For example, in October 2014, the FOMC said it planned to
| | | | |
| YIELDS & DISTRIBUTIONS FOR CLASS A SHARES | | | |
| | |
| |
Dividend Yield w/o sales charge | | | 5.26% | |
| | |
| |
Dividend Yield with sales charge | | | 5.01 | |
| | |
| |
Standardized Yield | | | 4.31 | |
| | |
| |
Taxable Equivalent Yield | | | 8.42 | |
| | |
| |
Last distribution (7/28/15) | | $ | 0.041 | |
| | |
| |
Total distributions (8/1/14 to 7/31/15) | | $ | 0.504 | |
| | |
Endnotes for this discussion begin on page 17 of this report
3 OPPENHEIMER ROCHESTER NEW JERSEY MUNICIPAL FUND
keep the Fed Funds target rate at its current level “for a considerable time” after the end of its bond-buying program. According to a statement released November 19, 2014, the FOMC observed solid job gains, a lower unemployment rate and increases in household and business spending. The committee’s concerns about inflation and falling energy prices, among other factors, played into its decision to “maintain its existing policy of reinvesting principal payments from its holdings of agency debt and agency mortgage-backed securities and rolling over maturing Treasury securities at auction.”
In December 2014, the committee said it could “be patient in beginning to normalize the stance of monetary policy,” but the word “patient” did not appear in the minutes of the February 2015 meeting. In a press conference after the February meeting, Ms. Yellen cautioned that “just because we removed the word ‘patient’ doesn’t mean we will be impatient.” Fed officials also stated in February that “the committee will increase the Fed Funds rate only when it has seen further improvement in the labor market and is reasonably confident that inflation will move back to its 2% objective over the medium term.”
By late April, the Fed had removed all calendar-based language relating to possible rate increases, citing a “transitory” decline in output and employment during the first quarter of 2015 with declines in energy prices and non-energy imports keeping inflation low.
In a speech after the May 2015 FOMC meeting, Ms. Yellen said, “If the economy continues to improve as I expect, I think it will be appropriate at some point this year to take the initial step to raise the Federal Funds rate target and begin the process of normalizing monetary policy.”
With the current Fed Funds rate set between zero and 0.25% since December 2008, the only plausible change would be an increase. We remind investors that a change in the Fed Funds rate does not automatically translate into a change in longer-term interest rates, which are determined by the marketplace.
The Fund’s investment team will continue to search for value in the muni market as it seeks to produce competitive levels of tax-free income amid stable or changing market conditions.
As of July 31, 2015, the average yield on 30-year, AAA-rated muni bonds was 4.53%, up 109 basis points from July 31, 2014. The average yield on 10-year, AAA-rated muni bonds was 2.40% on July 31, 2015, up 18 basis points from the July 2014 date, and the average yield on 1-year, AAA-rated muni bonds was 0.37%, up 22 basis points from the July 2014 date.
During this reporting period, New Jersey and its municipalities faced an assortment of credit rating downgrades and legal issues. In September 2014, for example, both Fitch Ratings and Standard & Poor’s downgraded the state’s general obligation (G.O.) debt to A,
4 OPPENHEIMER ROCHESTER NEW JERSEY MUNICIPAL FUND
from A-plus, with negative and stable outlooks, respectively. In mid-April 2015, Moody’s Investors Services cut the credit rating one notch, down to A2 with a negative outlook, citing the state’s budget and pension funding struggles for the downgrade, the ninth under Governor Chris Christie.
Atlantic City was also in the news this reporting period. In late January 2015, Gov. Christie signed an executive order to install an emergency management team in the state’s gaming capital. Gov. Christie tapped Kevin Lavin and Kevyn Orr, who was Detroit’s emergency manager during its recent Chapter 9 bankruptcy process, to overhaul the operations and finances of the struggling Atlantic City government.
Atlantic City also garnered attention from the rating agencies. The city suffered a double setback at the hands of S&P, which downgraded its bonds in September 2014 and in January 2015. The second downgrade left the Atlantic City’s debt with a below-investment-grade (“junk bond”) status. Moody’s, which held a Ba1 rating for the city’s G.O. debt, lowered that rating to Caa1 during this reporting period.
By July 2015, Atlantic City – which the state markets as America’s Favorite Playground – received optimistic reports showing an increase in non-casino business. Cash sales at the city’s non-gambling outlets increased 6.2% over the past 2 years. A Moody’s report called Atlantic City’s ability to meet G.O. payments a credit positive, noting that the city
has been able to raise sufficient cash for debt service while continuing to seek long-term solutions to its financial challenges.
The city of Newark was also under increasing financial stress during this reporting period. In 2014, Newark’s officials disclosed that because of a property tax collection shortfall and state budget regulations, they needed to find a way to come up with more than $93 million in additional revenue to pay its bills. By giving the state financial control of Newark’s government, New Jersey was able to offer significant aid in property tax relief, transitional aid, and grants. Moody’s identified this action as a credit positive for Newark.
Late in the reporting period, the New Jersey Supreme Court sided with Gov. Christie in his effort to cut pension funding, a move that credit analysts say provides the state short-term budget flexibility while risking long-term financial burdens. The Garden State’s highest court reversed a lower court ruling upholding the governor’s veto of $1.6 billion of pension contributions from the 2015 budget.
In late June, the governor signed the state’s fiscal 2016 budget, cutting more than $1.6 billion in new spending on items including pensions, and vetoing higher taxes on businesses and the rich as he has done in past years. Gov. Christie used the line-item veto to eliminate the extra taxes and the higher pension payment, choosing instead to make a pension payment of $1.3 billion. Also, because of higher-than-expected revenues in the waning months of fiscal year 2015, which
5 OPPENHEIMER ROCHESTER NEW JERSEY MUNICIPAL FUND
ended June 30, the governor added $212 million to the state’s pension payment. In all, the pension payment for the current fiscal year will total $893 million.
Successful investors, we have found, maintain a long-term perspective regardless of the specific developments associated with any given reporting period. To maximize the benefits that municipal bond funds seek to provide, many investors reinvest their dividends and allow the income generated from their investments to compound over time.
FUND PERFORMANCE
Oppenheimer Rochester New Jersey Municipal Fund held more than 210 securities as of July 31, 2015. The Fund was invested in a broad range of sectors, providing shareholders with a diversity of holdings that we believe would be difficult and costly to replicate in an individual portfolio.
The Fund’s Class A distribution yield at NAV was among the top 2% in Lipper’s New Jersey Municipal Debt Funds category as of July 31, 2015. At 5.26%, the distribution yield at NAV for this Fund’s Class A shares was 178 basis points higher than the category average, which was 3.48%. Additionally, for a taxable investment to have provided a greater benefit than an investment in this Fund, it would have had to yield more than 8.42%, based on the Fund’s standardized yield as of July 31, 2015, and the current top federal and New Jersey income tax rates. As long-time investors know, yields on fixed-income funds rise when share
prices fall, and yields have historically contributed the lion’s share of the long-term total returns generated by bonds.
Market conditions created pressure on the dividends of many fixed-income funds this reporting period. This Fund’s Class A dividend, which was 4.3 cents per share at the outset of the reporting period, was reduced to 4.1 cents per share beginning with the February 2015 payout. In all, the Fund distributed 50.4 cents per Class A share this reporting period.
As of July 31, 2015, the Fund was invested in the hospital/healthcare sector, which represented 19.9% of total assets (20.7% of net assets). Our holdings in this sector, including one bond issued in Puerto Rico, consist of securities across the credit spectrum, but most are investment grade. Bonds held in this sector contributed positively to Fund performance this reporting period.
Securities issued in the Commonwealth of Puerto Rico, which are exempt from federal, state and local income taxes, represented 16.0% of the Fund’s total assets (16.7% of net assets) at the end of this reporting period. Puerto Rico’s “tobacco bonds” are excluded from this figure, as they are backed by proceeds from the tobacco Master Settlement Agreement (the MSA) and included in this Fund’s tobacco holdings. The Fund’s holdings, some of which are insured, include G.O. debt and securities from many different sectors. Most of the Fund’s investments in securities issued in Puerto Rico are supported by taxes and other revenues and are designed to help
6 OPPENHEIMER ROCHESTER NEW JERSEY MUNICIPAL FUND
The Rochester Portfolio Management Team
| | | | | | | | |
 | |  | |  | |  | | |
| | | | |
| Dan Loughran, CFA | | Scott Cottier, CFA | | Troy Willis, JD, CFA | | Mark DeMitry, CFA | | |
| | | | |
| Team Leader and | | Senior Portfolio | | Senior Portfolio | | Senior Portfolio | | |
| Senior Portfolio | | Manager | | Manager | | Manager | | |
| Manager | | | | | | | | |
| | | | | | | | |
 | |  | |  | | | | |
| Michael Camarella, CFA | | Charlie Pulire, CFA | | Elizabeth Mossow, CFA | | | | |
| | | | |
| Senior Portfolio | | Senior Portfolio | | Associate Portfolio | | | | |
| Manager | | Manager | | Manager | | | | |
| | | | | | | | |
finance electric utilities, highways and education, among other things.
During this reporting period, the government agreed to raise its sales tax rate to 11.5%, from 7.0%. By April 1, 2016, the sales tax will be replaced by a value-added tax (VAT), which is expected to lead to higher tax revenues for the Commonwealth.
News from the Commonwealth that it had once again passed a balanced budget was
tempered by the sudden announcement by Governor Alejandro García Padilla in late June 2015 that Puerto Rico was not able to pay its debts. A government-commissioned study known as the Krueger Report reached a similar conclusion. Investors should note that the report is unaudited and does not compel the administration to implement the report’s recommendations.
The $9.8 billion budget for fiscal year 2016 includes approximately $1 billion to cover the
7 OPPENHEIMER ROCHESTER NEW JERSEY MUNICIPAL FUND
The Rochester Credit Research Team
| | | | | | | | |
 | |  | |  | |  | | |
| | | | |
| Rich Stein, CFA | | Chris Weiler, CFA | | Bob Bertucci, CFA | | Angela Uttaro | | |
| Director of Credit | | Senior Credit Analyst | | Senior Credit Analyst | | Senior Credit Analyst | | |
| Research | | | | | | | | |
| | | | | | | | |
 | |  | |  | |  | | |
| | | | |
| Matt Torpey, CFA | | René Vecka, CFA | | Jon Hagen, CFA | | Alen Kreso, CFA | | |
| Senior Credit Analyst | | Senior Credit Analyst | | Senior Credit Analyst | | Senior Credit Analyst | | |
| | | | | | | | |
 | |  | |  | | | | |
| Chris Meteyer | | Clara Sanguinetti | | Chad Osterhout | | | | |
| Credit Analyst | | Credit Analyst | | Credit Analyst | | | | |
8 OPPENHEIMER ROCHESTER NEW JERSEY MUNICIPAL FUND
Commonwealth’s G.O. debt-service obligations. Operational spending totals about $8.3 billion. The legislature also created a $275 million special fund from the Government Development Bank’s allocation to cover debt obligations and economic development. With the lowest operational spending level in at least 10 years, the budget reduces the operational budgets of most government agencies by 2% to 3% versus fiscal year 2015, which ended June 30, 2015. Nonprofits that provide essential social services had their budgets decreased by no more than 10%.
A decision that we believe has important implications for the muni industry – and our funds in particular – was announced earlier in the reporting period: On February 6, 2015, a federal judge ruled that the Puerto Rico Public Corporation Debt Enforcement and Recovery Act (the “Recovery Act”) violated the U.S. Constitution and was invalid. As you may recall, the Recovery Act was passed in late June 2014 and the Oppenheimer Rochester municipal bond funds filed suit immediately, challenging the legislation that was designed to allow PREPA (the island’s electric utility authority), PRASA (the aqueduct and sewer authority) and PRHTA (the highway authority) to restructure their debt under the supervision of a Commonwealth court. On July 6, 2015, a federal appeals court unanimously affirmed the earlier decision.
The forbearance agreement that was reached in August 2014 between PREPA and many of its creditors, including this Fund, was extended
several times beyond March 31, 2015, its initial expiration date. In the agreement, now set to expire September 15, 2015, the bondholders have agreed to forbear from exercising rights in connection with events that would constitute a default on PREPA bonds, and PREPA had agreed to a variety of financial terms and to submit a 5-year restructuring plan. PREPA made a full $415 million bond payment on July 1, 2015 and promised to reach a comprehensive restructuring plan with its creditors by September 1, 2015. PREPA’s payment was among more than $1 billion in transfers made by Puerto Rico public entities, as money came due at the start of the Commonwealth’s new fiscal year, July 1, 2015.
We are encouraged by the government’s efforts to reduce spending and increase revenue. We continue to believe that Puerto Rico must act within the tenets of the law, including its Constitution. Questions about the degree to which Puerto Rico and its agencies and authorities are committed to honoring their debt-service obligations created significant pressure on the prices of their securities, especially in the latter months of this reporting period. As a result, the Fund’s Puerto Rico holdings in aggregate had a negative impact on the Fund’s total return.
Our investment team’s commitment to protecting the interests of our shareholders is unwavering. Investors should note that deterioration of the Puerto Rican economy could have an adverse impact on Puerto Rico bonds and the performance of the
9 OPPENHEIMER ROCHESTER NEW JERSEY MUNICIPAL FUND
Oppenheimer Rochester municipal funds that hold them, including this Fund. We will continue to monitor credit rating changes and other developments related to our Puerto Rico holdings closely.
Given the degree to which Oppenheimer Rochester funds have been cited in news coverage about the economic and fiscal challenges facing Puerto Rico, we feel compelled to remind investors that all fund investments are actively managed. Our team is responsive to the dynamics of the market and may choose to adjust trading strategies in the interest of maximizing the potential benefits to our shareholders. Further, while we remain committed to keeping investors informed about our basic investing strategies, we do not provide comment about near-term trading strategies as we believe doing so might allow other market participants to impair our team’s ability to deliver shareholder value.
Update (as of September 21, 2015): In the weeks that followed the end of this reporting period, several developments in Puerto Rico and decisions by its agencies and officials kept the Commonwealth in the spotlight. For example, of the four Puerto Rico bond issuers that had payments due on August 3, 2015, three made their payments on time and in full; the Puerto Rico Finance Corporation (PFC) did not.
The PFC’s bond covenant called for a $58 million payment of principal and interest on August 3. Instead, a payment of $628,000 was made to PFC bondholders, a group that
includes individual Americans on the mainland and in the Commonwealth, Puerto Rican credit unions, and Oppenheimer Rochester municipal bond funds and other retail municipal bond funds, among others. Prior to August 3, prices of PFC bonds fell sharply, a signal that the market had anticipated this default; as of this update, these securities continued to trade in the teens.
As long-time investors know, net asset values (NAVs) of municipal bond funds are adjusted daily based on a third party’s pricing of all bonds in the marketplace. Thus, the NAVs of our funds, many of which have invested in the Commonwealth and its agencies and government instrumentalities, reflect all price changes. In light of the non-payment by the PFC, investors should expect volatility in the prices of PFC bonds and other bonds issued by the Commonwealth.
We note that two issuers of revenue-backed bonds – the Puerto Rico Sales Tax Financing Corporation (COFINA) and the Puerto Rico Municipal Finance Agency (MFA) – met their August 3, 2015 debt-service obligations on time and in full.
The COFINA bonds, which are backed by sales tax revenue, are held by several of the Oppenheimer Rochester funds. The MFA bonds – which are backed by ad valorem taxes that are based on the assessed value of real estate, personal property and/or the duty levied on imported items – also paid their bondholders, including Oppenheimer Rochester funds. We believe that the legal
10 OPPENHEIMER ROCHESTER NEW JERSEY MUNICIPAL FUND
protections for the COFINA bonds and Puerto Rico’s general obligation (G.O.) debt are strong, and many of our funds have overweight positions in these bonds.
Also on August 3, 2015, the Government Development Bank for Puerto Rico (GDB) made loan payments to banks that totaled approximately $140 million.
Later in the month, on August 21, 2015, the Commonwealth petitioned the U.S. Supreme Court to overturn a federal district court ruling, which had been affirmed on appeal, related to the Recovery Act: that the Act violated the U.S. Constitution and was invalid. In its petition, the Commonwealth argues that Puerto Rico’s issuers should have the right to restructure their debt pursuant to the terms set forth in the Commonwealth’s Recovery Act. As bondholders, we see things differently: The Commonwealth and its issuers agreed to specific and carefully constructed bond covenants when they sold securities, and the contracts should be honored. Our team remains ready to defend the terms of our investments’ bond indentures.
On September 1, 2015, just prior to the expiration of the forbearance agreement, PREPA and the forbearing bondholders reached an agreement in principle on the major financial terms of a securitization transaction to lower PREPA’s debt service costs. Although the proposed agreement would result in a reduction in the par value of PREPA’s existing bonds, we nevertheless
believe the agreement – if implemented – will be a win for bondholders.
Investors should note that the new bond structure would be bankruptcy remote, which serves to protect bondholders from event risks; that the term sheet requires that the new securitization bonds earn an investment-grade rating; that the deal requires high participation by all bondholders, and that insurers reach agreement with PREPA on the treatment of the insured bonds. If all goes as planned, bondholders will face neither the risks and uncertainties related to any inefficiency in PREPA’s operations nor the costs that would mount should any future litigation be required. While we expect that all parties will work toward a restructuring support agreement, we remind investors that there is no guarantee of either a timeline or implementation.
The forbearance agreement with bondholders, which has been extended repeatedly since first signed in August 2014 and was set to expire September 18, 2015, was extended on that date to October 1, 2015. However, PREPA did not secure an extension from its bond insurers, a group that guarantees $2.5 billion of the utility’s debt. According to PREPA’s chief restructuring officer, negotiations with the bond insurers will continue.
After a week-long delay that officials said was caused by Hurricane Erika, the Working Group that had been charged by the governor to deliver a 5-Year Fiscal Plan by September 1, 2015, handed in its plan. Like the government-commissioned Krueger Report
11 OPPENHEIMER ROCHESTER NEW JERSEY MUNICIPAL FUND
that preceded it, the Working Group’s plan included a lengthy roster of policy changes and austerity measures designed to resolve some of the Commonwealth’s financial difficulties. Politicians, including some candidates for the presidency, have voiced concerns about the current circumstances in Puerto Rico, and we believe the situation will remain political in the near term. In fact, many of the recommendations would require action by the U.S. Congress or the Puerto Rico Legislature. Even if all the recommendations were implemented, the plan indicated that Puerto Rico would still face a $14 billion financing gap between 2016 and 2020. In the weeks following the release of the plan, leading market analysts raised what we believe to be substantive questions about the accuracy of many of the plan’s figures.
Investors should note that the plan also seeks to reduce and/or restructure some of Puerto Rico’s debt. In a televised address, the governor said, “The plan itself will not get us out of the hole we find ourselves in. It’s time that creditors come to the table and share in the sacrifice.” We continue to believe that Puerto Rico must act within the tenets of the law, including its Constitution.
Separately, it is noteworthy that PRASA, the water utility, had announced plans to issue $750 million in bonds. Originally slated for August 25, 2015, the offering has since been revised to provide greater bondholder protections and higher initial yields and, as of this writing, was listed as “day-to-day.” PRASA’s ability to cut expenses and reduce its
debt service obligations helped the utility achieve stronger-than-expected results for fiscal year 2015 despite lower-than-expected revenue, according to results released in September.
The Oppenheimer Rochester team has been an active participant in negotiations with Puerto Rico officials, and shareholders should be confident that we will continue to work to protect our shareholders’ rights and best interests.
Municipal bonds backed by proceeds from the tobacco MSA, the national litigation settlement with U.S. tobacco manufacturers, represented 11.2% of the Fund’s total assets (11.7% of net assets) at the end of this reporting period. The sector was a positive contributor to the Fund’s total return.
We believe the securities we hold in this sector are fundamentally sound credits, and we like that “tobacco bonds” can provide tax-exempt income for investors as well as benefits to the issuing states and territories. Our long-term view of the sector remains bullish and, given attractive valuations, we believe that it is likely we will continue to hold a greater percentage of tobacco bonds in our portfolios than our peers. As in prior reporting periods, the tobacco bonds this Fund held during this reporting period made all scheduled payments of interest and principal on time and in full.
G.O. securities, which are backed by the full faith and taxing authority of state and local governments, comprised 8.7% of total assets
12 OPPENHEIMER ROCHESTER NEW JERSEY MUNICIPAL FUND
(9.1% of net assets) as of July 31, 2015. The Fund’s holdings in this sector, which included bonds issued in various New Jersey municipalities, the Northern Mariana Islands, and in the Commonwealth of Puerto Rico at the end of this reporting period, contributed positively to performance.
The Fund was also invested in securities used to finance marine and aviation facilities this reporting period. Many of these securities are high-grade investments that are backed by the valuable collateral of the projects whose construction they finance. As of July 31, 2015, 6.9% of the Fund’s total assets (7.2% net assets) were invested in the marine/aviation facilities sector, which contributed positively to performance.
Many sectors in which the Fund maintained relatively smaller investments as of July 31, 2015, also contributed positively to performance. Investors benefited this reporting period from the Fund’s holdings in the student loans sector, highways/commuter facilities bonds, transportation infrastructure securities, higher education bonds, the adult living facilities securities and the bonds in several other sectors.
As of July 31, 2015, only one sector detracted from the Fund’s performance—the sales tax sector, which represented 6.0% of total assets (6.2% of net assets). Debt-service payments on securities in this sector are paid using the issuing municipality’s sales tax revenue. More than 85% of the Fund’s holdings in this sector were issued in Puerto Rico at the end of this
reporting period, based on current market value.
During this reporting period, the Fund maintained an investment in municipal inverse-floating rate securities, which are tax-exempt securities with interest payments that move inversely to changes in short-term interest rates. “Inverse floaters” continued to provide high levels of income to funds across the industry during this reporting period and contributed positively to this Fund’s performance. We continue to believe that “inverse floaters” are an essential element of this Fund’s portfolio because they can produce attractive yields under certain market conditions.
Our approach to municipal bond investing is flexible and responsive to market conditions. Shareholders should note that market conditions during this reporting period did not affect the Fund’s overall investment goals or cause it to pay any capital gain distributions. In closing, we believe that the Fund’s structure and sector composition as well as our time-tested strategies will continue to benefit fixed-income investors through interest rate and economic cycles.
INVESTMENT STRATEGY
The Rochester investment team focuses exclusively on municipal bonds and has consistently used a time-tested, value-oriented and security-specific approach to fund management. We know that market conditions can and do fluctuate, but we do not waver in our belief in the power of tax-free
13 OPPENHEIMER ROCHESTER NEW JERSEY MUNICIPAL FUND
yield to help investors achieve their long-term objectives.
This Fund invests primarily in investment-grade municipal securities. It may invest up to 25% of its total assets in below-investment grade securities, or “junk” bonds; the percentage of assets is measured at the time of purchase as is the credit quality of the securities. Additionally, the credit quality is based on Nationally Recognized Statistical Rating Organization (“NRSRO”) ratings or, if no NRSRO rating, on internal ratings. As of July 31, 2015, market movements or rating changes of municipal bonds, notably the Fund’s investments in Puerto Rico paper, caused the Fund’s below-investment-grade holdings to exceed this threshold. As a result, no further purchases of below-investment-grade bonds will be made until the Fund’s holdings of these types of bonds is once again below 25% of total assets.
Our team continually searches for bonds that we believe are undervalued and can provide a meaningful level of tax-free income until maturity. Rather than making allocation shifts based on expected market conditions, we search the marketplace for what we believe to be the best values for generating income. It remains important to note that we do not manage our funds based on predictions of interest rate changes.
Instead, our investment approach involves scouring the market for municipal securities that meet our stringent credit criteria and buying bonds that we believe will deliver
above-average yields relative to peer funds. We focus on identifying inefficiencies in market pricing that can lead to investment advantages. We seek to maintain a thoughtful mix of industry sectors, maturities and credit ratings in this Fund’s portfolio.
The Rochester team also prospects for yield-enhancing opportunities in the secondary market, often picking up odd lots that we believe can add significant incremental yield to our portfolios. We will also look for non-rated issues with solid credit qualities, which we believe can often help enhance a fund’s tax-free yield. Investors should note that non-rated or unrated securities may or may not be the equivalent of investment grade securities.
The Rochester Way, we believe, distinguishes our approach to municipal investing from those of our competitors.

Daniel G. Loughran,
Senior Vice President, Senior Portfolio Manager and Team Leader, on behalf of the rest of the Rochester portfolio management team: Scott S. Cottier, Troy E. Willis, Mark R. DeMitry, Michael L. Camarella, Charles S. Pulire and Elizabeth S. Mossow.
14 OPPENHEIMER ROCHESTER NEW JERSEY MUNICIPAL FUND
Top Holdings and Allocations
TOP TEN CATEGORIES
| | | | |
| | |
Hospital/Healthcare | | | 19.9% | |
| |
Tobacco Master Settlement Agreement | | | 11.2 | |
| |
General Obligation | | | 8.7 | |
| |
Marine/Aviation Facilities | | | 6.9 | |
| |
Student Loans | | | 6.8 | |
| |
Sales Tax Revenue | | | 6.0 | |
| |
Highways/Commuter Facilities | | | 5.6 | |
| |
Transportation Infrastructure | | | 4.9 | |
| |
Higher Education | | | 4.2 | |
| |
Adult Living Facilities | | | 4.0 | |
Portfolio holdings are subject to change. Percentages are as of July 31, 2015, and are based on total assets.
CREDIT ALLOCATION
| | | | | | | | | | | | |
| | | NRSRO-
Rated | | | Sub-
Adviser-
Rated | | | Total | |
| | | |
AAA | | | 0.0% | | | | 0.0% | | | | 0.0% | |
| | | |
AA | | | 19.2 | | | | 0.0 | | | | 19.2 | |
| | | |
A | | | 20.4 | | | | 0.0 | | | | 20.4 | |
| | | |
BBB | | | 26.0 | | | | 1.6 | | | | 27.6 | |
| | | |
BB or lower | | | 22.3 | | | | 10.5 | | | | 32.8 | |
| | | |
Total | | | 87.9% | | | | 12.1% | | | | 100.0% | |
The percentages above are based on the market value of the securities as of July 31, 2015, and are subject to change. OppenheimerFunds, Inc. determines the credit allocation of the Fund’s assets using ratings by nationally recognized statistical rating organizations (NRSROs), such as Standard & Poor’s. For any security rated by an NRSRO other than S&P, the sub-adviser, OppenheimerFunds, Inc., converts that security’s rating to the equivalent S&P rating. If two or more NRSROs have assigned a rating to a security, the highest rating is used. For securities not rated by an NRSRO, the sub-adviser uses its own credit analysis to assign ratings in categories similar to those of S&P. The use of similar categories is not an indication that the sub-adviser’s credit analysis process is consistent or comparable with any NRSRO’s process were that NRSRO to rate the same security.
For the purposes of this Credit Allocation table, securities rated within the NRSROs’ four highest categories—AAA, AA, A and BBB—are investment-grade securities. For further details, please consult the Fund’s prospectus or Statement of Additional Information.
15 OPPENHEIMER ROCHESTER NEW JERSEY MUNICIPAL FUND
Performance
DISTRIBUTION YIELDS
As of 7/31/15
| | | | | | | | | | |
| | | Without Sales
Charge | | With Sales Charge |
Class A | | | | 5.26 | % | | | | 5.01 | % |
Class B | | | | 4.38 | | | | | N/A | |
Class C | | | | 4.38 | | | | | N/A | |
Class Y | | | | 5.42 | | | | | N/A | |
STANDARDIZED YIELDS
For the 30 Days Ended 7/31/15
| | | | |
Class A | | | 4.31% | |
Class B | | | 3.79 | |
Class C | | | 3.78 | |
Class Y | | | 4.67 | |
TAXABLE EQUIVALENT YIELDS
As of 7/31/15
| | | | |
Class A | | | 8.42% | |
Class B | | | 7.40 | |
Class C | | | 7.38 | |
Class Y | | | 9.12 | |
AVERAGE ANNUAL TOTAL RETURNS WITHOUT SALES CHARGE AS OF 7/31/15
| | | | | | | | | | | | | | | | | | | | |
| | | Inception
Date | | | 1-Year | | | 5-Year | | | 10-Year | | | Since Inception | |
Class A (ONJAX) | | | 3/1/94 | | | | 1.64% | | | | 4.02% | | | | 3.00% | | | | 4.61% | |
Class B (ONJBX) | | | 3/1/94 | | | | 0.86 | | | | 3.19 | | | | 2.50 | | | | 4.39 | |
Class C (ONJCX) | | | 8/29/95 | | | | 0.87 | | | | 3.25 | | | | 2.22 | | | | 3.93 | |
Class Y (ONJYX) | | | 11/29/10 | | | | 1.79 | | | | N/A | | | | N/A | | | | 4.65 | |
|
AVERAGE ANNUAL TOTAL RETURNS WITH SALES CHARGE AS OF 7/31/15 | |
| | | Inception
Date | | | 1-Year | | | 5-Year | | | 10-Year | | | Since Inception | |
Class A (ONJAX) | | | 3/1/94 | | | | -3.19% | | | | 3.01% | | | | 2.50% | | | | 4.37% | |
Class B (ONJBX) | | | 3/1/94 | | | | -3.97 | | | | 2.86 | | | | 2.50 | | | | 4.39 | |
Class C (ONJCX) | | | 8/29/95 | | | | -0.09 | | | | 3.25 | | | | 2.22 | | | | 3.93 | |
Class Y (ONJYX) | | | 11/29/10 | | | | 1.79 | | | | N/A | | | | N/A | | | | 4.65 | |
16 OPPENHEIMER ROCHESTER NEW JERSEY MUNICIPAL FUND
COMPARISON OF CHANGE IN VALUE OF $10,000 HYPOTHETICAL INVESTMENTS IN:
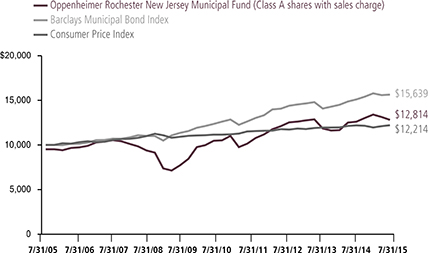
Performance data quoted represents past performance, which does not guarantee future results. The investment return and principal value of an investment in the Fund will fluctuate so that an investor’s shares, when redeemed, may be worth more or less than their original cost. Current performance may be lower or higher than the performance quoted. Returns do not consider capital gains or income taxes on an individual’s investments. For performance data current to the most recent month-end, visit oppenheimerfunds.com or call 1.800.CALL OPP (225.5677). Fund returns include changes in share price, reinvested distributions, and the applicable sales charge: for Class A shares, the current maximum initial sales charge of 4.75%; for Class B shares, the contingent deferred sales charge of 5% (1-year) and 2% (5-year); and for Class C, the contingent deferred sales charge of 1% for the 1-year period. There is no sales charge for Class Y shares. Because Class B shares convert to Class A shares 72 months after purchase, the 10-year return for Class B shares uses Class A performance for the period after conversion.
The Fund’s performance is compared to the performance of the Barclays Municipal Bond Index, an unmanaged index of a broad range of investment-grade municipal bonds that is a measure of the general municipal bond market. The Fund’s performance is also compared to the Consumer Price Index, a non-securities index that measures changes in the inflation rate. Indices are unmanaged and cannot be purchased by investors. While index comparisons may be useful to provide a benchmark for the Fund’s performance, it must be noted that the Fund’s investments are not limited to the investments comprising the indices. Index performance includes reinvestment of income, but does not reflect transaction costs, fees, expenses or taxes. Index performance is shown for illustrative purposes only as a benchmark for the Fund’s performance, and does not predict or depict performance of the Fund. The Fund’s performance reflects the effects of the Fund’s business and operating expenses.
Distribution yields for Class A shares are based on dividends of $0.041 for the 35-day accrual period ended July 28, 2015. The yield without sales charge for Class A shares is calculated by dividing annualized dividends by the Class A net asset value on July 28, 2015; for the yield
17 OPPENHEIMER ROCHESTER NEW JERSEY MUNICIPAL FUND
with sales charge, the denominator is the Class A maximum offering price on that date. Distribution yields for Class B, C and Y are annualized based on dividends of $0.0342, $0.0342 and $0.0423, respectively, for the 35-day accrual period ended July 28, 2015, and on the corresponding net asset values on that date.
Standardized yield is based on the Fund’s net investment income for the 30-day period ended July 31, 2015, and either that date’s maximum offering price (for Class A shares) or net asset value (for the other classes). Each result is compounded semiannually and annualized. Falling share prices artificially increase yields.
The average distribution yield in Lipper’s New Jersey Municipal Debt Funds category was calculated based on the distributions and the final net asset values (NAVs) of the reporting period for the funds in each category. The calculation included 49 NAVs, one for each class of each fund in the category; a fund can have up to 4 classes. Lipper yields do not include sales charges – which, if included, would reduce results.
Taxable equivalent yield is based on the standardized yield and the top combined federal and New Jersey 2015 tax rate of 48.8%. Calculations factor in the 3.8% tax on unearned income under the Patient Protection and Affordable Care Act, as applicable. A portion of the Fund’s distributions may be subject to tax; distributions may also increase an investor’s exposure to the alternative minimum tax. Capital gains distributions are taxable as capital gains. Tax treatments of the Fund’s distributions and capital gains may vary by state; investors should consult a tax advisor to determine if the Fund is appropriate for them. Each result is compounded semiannually and annualized. Falling share prices artificially increase yields. This Report must be preceded or accompanied by a Fund prospectus.
The average yields for AAA-rated municipal securities are provided by Municipal Market Advisors (MMA) and are based on its benchmark of general obligation bonds structured with a 5% coupon. The MMA 5% benchmark is constructed using yields from the leading underwriters, who represent a significant percentage of the primary activity of the top 10 underwriters and therefore the total issuance.
Investments in “tobacco bonds,” which are backed by the proceeds a state or territory receives from the 1998 national litigation settlement with tobacco manufacturers, may be vulnerable to economic and/or legislative events that affect issuers in a particular municipal market sector. Annual payments by MSA-participating manufacturers, for example, hinge on many factors, including annual domestic cigarette shipments, inflation and the relative market share of non-participating manufacturers. To date, we believe consumption figures remain within an acceptable range of the assumptions used to structure MSA bonds. Future MSA payments could be reduced if consumption were to fall more rapidly than originally forecast.
The Fund’s investment strategy and focus can change over time. The mention of specific fund holdings does not constitute a recommendation by OppenheimerFunds, Inc. or its affiliates.
Before investing in any of the Oppenheimer funds, investors should carefully consider a fund’s investment objectives, risks, charges and expenses. Fund prospectuses and summary prospectuses contain this and other information about the funds, and may be obtained by asking your financial advisor, visiting oppenheimerfunds.com, or calling 1.800.CALL OPP (225.5677). Read prospectuses and summary prospectuses carefully before investing.
18 OPPENHEIMER ROCHESTER NEW JERSEY MUNICIPAL FUND
Shares of Oppenheimer funds are not deposits or obligations of any bank, are not guaranteed by any bank, are not insured by the FDIC or any other agency and involve investment risks, including the possible loss of the principal amount invested.
19 OPPENHEIMER ROCHESTER NEW JERSEY MUNICIPAL FUND
Fund Expenses
Fund Expenses. As a shareholder of the Fund, you incur two types of costs: (1) transaction costs, which may include sales charges (loads) on purchase payments and/or contingent deferred sales charges on redemptions; and (2) ongoing costs, including management fees; distribution and service fees; and other Fund expenses. These examples are intended to help you understand your ongoing costs (in dollars) of investing in the Fund and to compare these costs with the ongoing costs of investing in other mutual funds.
The examples are based on an investment of $1,000.00 invested at the beginning of the period and held for the entire 6-month period ended July 31, 2015.
Actual Expenses. The first section of the table provides information about actual account values and actual expenses. You may use the information in this section for the class of shares you hold, together with the amount you invested, to estimate the expense that you paid over the period. Simply divide your account value by $1,000.00 (for example, an $8,600.00 account value divided by $1,000.00 = 8.60), then multiply the result by the number in the first section under the heading entitled “Expenses Paid During 6 Months Ended July 31, 2015” to estimate the expenses you paid on your account during this period.
Hypothetical Example for Comparison Purposes. The second section of the table provides information about hypothetical account values and hypothetical expenses based on the Fund’s actual expense ratio for each class of shares, and an assumed rate of return of 5% per year for each class before expenses, which is not the Fund’s actual return. The hypothetical account values and expenses may not be used to estimate the actual ending account balance or expenses you paid for the period. You may use this information to compare the ongoing costs of investing in the Fund and other funds. To do so, compare this 5% hypothetical example for the class of shares you hold with the 5% hypothetical examples that appear in the shareholder reports of the other funds.
Please note that the expenses shown in the table are meant to highlight your ongoing costs only and do not reflect any transactional costs, such as front-end or contingent deferred sales charges (loads). Therefore, the “hypothetical” section of the table is useful in comparing ongoing costs only, and will not help you determine the relative total costs of owning different funds. In addition, if these transactional costs were included, your costs would have been higher.
20 OPPENHEIMER ROCHESTER NEW JERSEY MUNICIPAL FUND
| | | | | | | | | | | | | | |
| Actual | | Beginning
Account Value
February 1, 2015 | | | Ending Account Value
July 31, 2015 | | | Expenses
Paid During
6 Months Ended
July 31, 2015 | | | |
Class A | | $ | 1,000.00 | | | $ | 956.10 | | | $ | 5.69 | | | |
Class B | | | 1,000.00 | | | | 952.50 | | | | 9.34 | | | |
Class C | | | 1,000.00 | | | | 952.50 | | | | 9.34 | | | |
Class Y | | | 1,000.00 | | | | 957.80 | | | | 4.92 | | | |
| | | | |
Hypothetical | | | | | | | | | | | | | | |
(5% return before expenses) | | | | | | | | | | | | | | |
Class A | | | 1,000.00 | | | | 1,018.99 | | | | 5.87 | | | |
Class B | | | 1,000.00 | | | | 1,015.27 | | | | 9.64 | | | |
Class C | | | 1,000.00 | | | | 1,015.27 | | | | 9.64 | | | |
Class Y | | | 1,000.00 | | | | 1,019.79 | | | | 5.07 | | | |
Expenses are equal to the Fund’s annualized expense ratio for that class, multiplied by the average account value over the period, multiplied by 181/365 (to reflect the one-half year period). Those annualized expense ratios, excluding indirect expenses from affiliated funds, based on the 6-month period ended July 31, 2015 are as follows:
| | | | |
| Class | | Expense Ratios | |
Class A | | | 1.17% | |
Class B | | | 1.92 | |
Class C | | | 1.92 | |
Class Y | | | 1.01 | |
21 OPPENHEIMER ROCHESTER NEW JERSEY MUNICIPAL FUND
STATEMENT OF INVESTMENTS July 31, 2015
| | | | | | | | | | | | | | | | |
Principal Amount | | | | | Coupon | | | Maturity | | | Value | |
| Municipal Bonds and Notes—107.2% | | | | | | | | | | | | |
| New Jersey—72.7% | | | | | | | | | | | | |
| | $40,000 | | | Atlantic City, NJ GO1 | | | 5.000 | % | | | 12/01/2024 | | | $ | 33,131 | |
| | 370,000 | | | Bayonne, NJ Parking Authority1 | | | 5.000 | | | | 06/15/2027 | | | | 370,503 | |
| | 6,065,000 | | | Bayonne, NJ Redevel. Agency1 | | | 7.625 | | | | 04/01/2038 | | | | 7,429,200 | |
| | 10,000 | | | Bergen County, NJ HDC1 | | | 6.750 | | | | 10/01/2018 | | | | 10,039 | |
| | 35,000 | | | Bergen County, NJ Improvement Authority (Community Action Program)1 | | | 5.250 | | | | 12/01/2034 | | | | 35,124 | |
| | 25,000 | | | Camden County, NJ Improvement Authority1 | | | 5.000 | | | | 09/01/2018 | | | | 25,100 | |
| | 1,000,000 | | | Camden County, NJ Improvement Authority (Cooper Health System)1 | | | 5.000 | | | | 02/15/2034 | | | | 1,078,850 | |
| | 1,000,000 | | | Camden County, NJ Improvement Authority (Cooper Health System)1 | | | 5.000 | | | | 02/15/2033 | | | | 1,077,340 | |
| | 1,000,000 | | | Camden County, NJ Improvement Authority (Cooper Health System)1 | | | 5.000 | | | | 02/15/2035 | | | | 1,075,090 | |
| | 2,000,000 | | | Casino Reinvestment Devel. Authority of NJ1 | | | 5.000 | | | | 11/01/2031 | | | | 2,198,700 | |
| | 3,000,000 | | | Casino Reinvestment Devel. Authority of NJ1 | | | 5.250 | | | | 11/01/2039 | | | | 3,136,140 | |
| | 3,000,000 | | | Casino Reinvestment Devel. Authority of NJ1 | | | 5.250 | | | | 11/01/2044 | | | | 3,113,280 | |
| | 1,665,000 | | | Casino Reinvestment Devel. Authority of NJ1 | | | 5.250 | | | | 01/01/2024 | | | | 1,703,478 | |
| | 60,000 | | | Casino Reinvestment Devel. Authority of NJ | | | 5.250 | | | | 06/01/2017 | | | | 60,211 | |
| | 175,000 | | | Casino Reinvestment Devel. Authority of NJ (Hotel Room Fee) | | | 5.250 | | | | 01/01/2018 | | | | 179,112 | |
| | 395,000 | | | Casino Reinvestment Devel. Authority of NJ (Hotel Room Fee)1 | | | 5.000 | | | | 01/01/2025 | | | | 403,615 | |
| | 175,000 | | | Casino Reinvestment Devel. Authority of NJ (Hotel Room Fee) | | | 5.250 | | | | 01/01/2022 | | | | 179,023 | |
| | 155,000 | | | Essex County, NJ Improvement Authority (Newark)1 | | | 5.125 | | | | 04/01/2029 | | | | 155,133 | |
| | 250,000 | | | Essex County, NJ Improvement Authority (Newark)1 | | | 6.250 | | | | 11/01/2030 | | | | 278,885 | |
| | 20,000 | | | Essex County, NJ Improvement Authority (Sportsplex)1 | | | 5.625 | | | | 10/01/2023 | | | | 20,045 | |
| | 105,000 | | | Essex County, NJ Improvement Authority (Sportsplex)1 | | | 5.625 | | | | 10/01/2027 | | | | 105,189 | |
| | 1,000,000 | | | Hudson County, NJ Improvement Authority1 | | | 6.000 | | | | 01/01/2040 | | | | 1,139,180 | |
| | 2,655,000 | | | Hudson County, NJ Improvement Authority (Lincoln Park Golf Course)1 | | | 5.500 | | | | 06/01/2041 | | | | 3,038,833 | |
| | 1,500,000 | | | Hudson County, NJ Improvement Authority (Lincoln Park Golf Course)1 | | | 5.000 | | | | 06/01/2035 | | | | 1,640,895 | |
| | 1,250,000 | | | Hudson County, NJ Improvement Authority (Lincoln Park Golf Course)1 | | | 5.000 | | | | 06/01/2038 | | | | 1,361,862 | |
| | 120,000 | | | Lodie, NJ Board of Education COP1 | | | 5.700 | | | | 09/15/2021 | | | | 121,105 | |
| | 2,535,000 | | | Middlesex County, NJ Improvement Authority (Heldrich Center Hotel) | | | 5.000 | | | | 01/01/2032 | | | | 1,913,722 | |
| | 500,000 | | | Middlesex County, NJ Improvement Authority (Heldrich Center Hotel) | | | 5.000 | | | | 01/01/2020 | | | | 398,555 | |
| | 1,100,000 | | | Middlesex County, NJ Improvement Authority (Heldrich Center Hotel) | | | 5.125 | | | | 01/01/2037 | | | | 829,829 | |
| | 20,000 | | | Middlesex County, NJ Improvement Authority (South Plainfield Urban Renewal)1 | | | 5.500 | | | | 09/01/2030 | | | | 20,074 | |
| | 20,000 | | | Mount Holly, NJ Municipal Utilities Authority | | | 5.000 | | | | 12/01/2016 | | | | 20,081 | |
| | 25,000 | | | Neptune City, NJ Hsg. Authority1 | | | 6.000 | | | | 04/01/2019 | | | | 25,059 | |
| | 605,000 | | | New Brunswick, NJ Parking Authority | | | 5.000 | | | | 09/01/2029 | | | | 677,176 | |
| | 445,000 | | | New Brunswick, NJ Parking Authority | | | 5.000 | | | | 09/01/2027 | | | | 502,512 | |
22 OPPENHEIMER ROCHESTER NEW JERSEY MUNICIPAL FUND
| | | | | | | | | | | | | | | | |
Principal
Amount | | | | | Coupon | | | Maturity | | | Value | |
| New Jersey (Continued) | | | | | | | | | | | | |
| | $2,000,000 | | | Newark, NJ GO1 | | | 5.000 | % | | | 07/15/2029 | | | $ | 2,097,500 | |
| | 430,000 | | | Newark, NJ GO1 | | | 5.000 | | | | 07/15/2029 | | | | 450,963 | |
| | 50,000 | | | Newark, NJ Hsg. Authority (Lock Street Urban Renewal Partnership)1 | | | 6.400 | | | | 01/20/2034 | | | | 50,095 | |
| | 315,000 | | | Newark, NJ Hsg. Authority (Port Newark Marine Terminal Rental)1 | | | 5.000 | | | | 01/01/2032 | | | | 355,074 | |
| | 2,875,000 | | | Newark, NJ Hsg. Authority (South Ward Police Facility)1 | | | 6.750 | | | | 12/01/2038 | | | | 3,404,345 | |
| | 2,095,000 | | | NJ EDA | | | 5.000 | | | | 06/15/2028 | | | | 2,246,657 | |
| | 750,000 | | | NJ EDA | | | 5.000 | | | | 06/15/2029 | | | | 801,143 | |
| | 25,000 | | | NJ EDA (Cadbury at Cherry Hill)1 | | | 5.500 | | | | 07/01/2028 | | | | 21,201 | |
| | 410,000 | | | NJ EDA (Cadbury at Cherry Hill)1 | | | 5.500 | | | | 07/01/2018 | | | | 403,493 | |
| | 3,100,000 | | | NJ EDA (Cranes Mill)1 | | | 5.100 | | | | 06/01/2027 | | | | 3,114,911 | |
| | 130,000 | | | NJ EDA (Dept. of Human Services) | | | 6.250 | | | | 07/01/2024 | | | | 133,085 | |
| | 1,525,000 | | | NJ EDA (Drew University)1 | | | 5.250 | | | | 07/01/2021 | | | | 1,720,322 | |
| | 2,000,000 | | | NJ EDA (Engel Burman at Woodcliff Lake)1 | | | 8.000 | | | | 05/01/2044 | | | | 2,166,920 | |
| | 2,000,000 | | | NJ EDA (Engel Burman at Woodcliff Lake) | | | 8.000 | | | | 05/01/2044 | | | | 2,166,920 | |
| | 2,000,000 | | | NJ EDA (Engel Burman at Woodcliff Lake) | | | 8.000 | | | | 05/01/2044 | | | | 2,166,920 | |
| | 6,000,000 | | | NJ EDA (GMT Realty)1 | | | 6.875 | | | | 01/01/2037 | | | | 6,022,740 | |
| | 17,160,000 | | | NJ EDA (Hamilton Care)1 | | | 6.650 | | | | 11/01/2037 | | | | 17,731,428 | |
| | 3,050,000 | | | NJ EDA (Harrogate)1 | | | 5.875 | | | | 12/01/2026 | | | | 3,052,318 | |
| | 10,000 | | | NJ EDA (Hillcrest Health Service) | | | 7.250 | 2 | | | 01/01/2018 | | | | 9,443 | |
| | 90,000 | | | NJ EDA (Liberty State Park Lease Rental) | | | 5.750 | | | | 03/15/2022 | | | | 90,180 | |
| | 10,000 | | | NJ EDA (Liberty State Park) | | | 5.700 | | | | 03/15/2016 | | | | 10,046 | |
| | 90,000 | | | NJ EDA (Metromall Urban Renewal)1 | | | 6.500 | | | | 04/01/2031 | | | | 90,140 | |
| | 20,000 | | | NJ EDA (Motor Vehicle Surcharges)1 | | | 5.000 | | | | 07/01/2034 | | | | 20,288 | |
| | 455,000 | | | NJ EDA (Motor Vehicle Surcharges)1 | | | 5.250 | | | | 07/01/2031 | | | | 462,876 | |
| | 100,000 | | | NJ EDA (Motor Vehicle Surcharges)1 | | | 5.000 | | | | 07/01/2023 | | | | 101,442 | |
| | 50,000 | | | NJ EDA (Motor Vehicle Surcharges)1 | | | 5.000 | | | | 07/01/2029 | | | | 50,721 | |
| | 10,000 | | | NJ EDA (Motor Vehicle Surcharges)1 | | | 5.250 | | | | 07/01/2033 | | | | 10,173 | |
| | 1,030,000 | | | NJ EDA (Motor Vehicle Surcharges)1 | | | 5.250 | | | | 07/01/2017 | | | | 1,047,829 | |
| | 2,500,000 | | | NJ EDA (MSU Student Hsg.)1 | | | 5.750 | | | | 06/01/2031 | | | | 2,789,200 | |
| | 55,000 | | | NJ EDA (Municipal Rehabilitation) | | | 5.000 | | | | 04/01/2028 | | | | 55,094 | |
| | 4,350,000 | | | NJ EDA (New Jersey American Water Company)1 | | | 5.700 | | | | 10/01/2039 | | | | 4,957,130 | |
| | 5,320,000 | | | NJ EDA (New Jersey American Water Company)1 | | | 5.600 | | | | 11/01/2034 | | | | 5,993,140 | |
| | 30,000 | | | NJ EDA (New Jersey Transit Corp.)1 | | | 5.750 | | | | 12/15/2017 | | | | 30,095 | |
| | 145,000 | | | NJ EDA (New Jersey Transit Corp.)1 | | | 5.750 | | | | 12/15/2017 | | | | 145,460 | |
| | 800,000 | | | NJ EDA (Newark Downtown District Management Corp.)1 | | | 5.125 | | | | 06/15/2027 | | | | 824,208 | |
| | 1,400,000 | | | NJ EDA (Newark Downtown District Management Corp.)1 | | | 5.125 | | | | 06/15/2037 | | | | 1,430,618 | |
| | 650,000 | | | NJ EDA (Paterson Charter School Science & Technology) | | | 6.000 | | | | 07/01/2032 | | | | 655,051 | |
| | 1,900,000 | | | NJ EDA (Paterson Charter School Science & Technology) | | | 6.100 | | | | 07/01/2044 | | | | 1,897,321 | |
| | 1,500,000 | | | NJ EDA (Paterson Charter School)1 | | | 5.000 | | | | 07/01/2032 | | | | 1,355,190 | |
| | 2,500,000 | | | NJ EDA (Paterson Charter School)1 | | | 5.300 | | | | 07/01/2044 | | | | 2,214,275 | |
| | 850,000 | | | NJ EDA (Rutgers University)1 | | | 5.000 | | | | 06/15/2038 | | | | 956,956 | |
| | 3,690,000 | | | NJ EDA (School Facilities Construction)1 | | | 5.000 | | | | 03/01/2030 | | | | 3,833,726 | |
| | 1,000,000 | | | NJ EDA (School Facilities)1 | | | 5.250 | | | | 09/01/2026 | | | | 1,073,860 | |
23 OPPENHEIMER ROCHESTER NEW JERSEY MUNICIPAL FUND
STATEMENT OF INVESTMENTS Continued
| | | | | | | | | | | | | | | | |
Principal
Amount | | | | | Coupon | | | Maturity | | | Value | |
| New Jersey (Continued) | | | | | | | | | | | | |
| | $50,000 | | | NJ EDA (St. Barnabas Medical Center) | | | 6.750 | %2 | | | 07/01/2018 | | | $ | 47,201 | |
| | 25,000 | | | NJ EDA (St. Barnabas Medical Center) | | | 7.153 | 2 | | | 07/01/2020 | | | | 21,901 | |
| | 65,000 | | | NJ EDA (St. Barnabas Medical Center) | | | 6.833 | 2 | | | 07/01/2021 | | | | 54,629 | |
| | 110,000 | | | NJ EDA (State Office Buildings)1 | | | 5.000 | | | | 06/15/2020 | | | | 110,441 | |
| | 2,200,000 | | | NJ EDA (Team Academy Charter School)1 | | | 6.000 | | | | 10/01/2043 | | | | 2,470,512 | |
| | 10,000,000 | | | NJ EDA (The Goethals Bridge Replacement)1 | | | 5.375 | | | | 01/01/2043 | | | | 10,747,700 | |
| | 1,250,000 | | | NJ EDA (UMM Energy Partners) | | | 5.125 | | | | 06/15/2043 | | | | 1,313,388 | |
| | 1,500,000 | | | NJ EDA (UMM Energy Partners) | | | 5.000 | | | | 06/15/2037 | | | | 1,566,180 | |
| | 3,500,000 | | | NJ EDA Retirement Community (Seabrook Village)1 | | | 5.250 | | | | 11/15/2026 | | | | 3,579,450 | |
| | 100,000 | | | NJ Educational Facilities Authority (Dorm Safety) | | | 5.000 | | | | 03/01/2016 | | | | 100,398 | |
| | 875,000 | | | NJ Educational Facilities Authority (Georgian Court University)1 | | | 5.250 | | | | 07/01/2027 | | | | 928,428 | |
| | 2,735,000 | | | NJ Educational Facilities Authority (Georgian Court University)1 | | | 5.000 | | | | 07/01/2033 | | | | 2,882,936 | |
| | 50,000 | | | NJ Educational Facilities Authority (Higher Education)1 | | | 5.000 | | | | 09/01/2017 | | | | 50,201 | |
| | 2,115,000 | | | NJ Educational Facilities Authority (Higher Education)1 | | | 5.000 | | | | 06/15/2026 | | | | 2,245,305 | |
| | 125,000 | | | NJ Educational Facilities Authority (Higher Education)1 | | | 5.000 | | | | 09/01/2018 | | | | 125,500 | |
| | 30,000 | | | NJ Educational Facilities Authority (Kean University) | | | 5.000 | | | | 07/01/2021 | | | | 30,120 | |
| | 120,000 | | | NJ Educational Facilities Authority (Kean University)1 | | | 5.250 | | | | 09/01/2029 | | | | 134,083 | |
| | 40,000 | | | NJ Educational Facilities Authority (Kean University) | | | 5.000 | | | | 07/01/2018 | | | | 40,162 | |
| | 5,000 | | | NJ Educational Facilities Authority (Public Library) | | | 5.000 | | | | 09/01/2022 | | | | 5,007 | |
| | 30,000 | | | NJ Educational Facilities Authority (Richard Stockton College)1 | | | 5.125 | | | | 07/01/2028 | | | | 33,039 | |
| | 1,000,000 | | | NJ Educational Facilities Authority (Rider University) | | | 5.000 | | | | 07/01/2037 | | | | 1,065,750 | |
| | 15,000 | | | NJ Educational Facilities Authority (Stevens Institute of Technology) | | | 5.000 | | | | 07/01/2028 | | | | 15,054 | |
| | 5,000 | | | NJ Educational Facilities Authority (Stevens Institute of Technology)1 | | | 5.000 | | | | 07/01/2018 | | | | 5,354 | |
| | 2,000,000 | | | NJ Health Care Facilities Financing Authority (Barnabas Health)1 | | | 5.625 | | | | 07/01/2032 | | | | 2,266,980 | |
| | 3,000,000 | | | NJ Health Care Facilities Financing Authority (Barnabas Health)1 | | | 5.000 | | | | 07/01/2044 | | | | 3,226,530 | |
| | 7,085,000 | | | NJ Health Care Facilities Financing Authority (Catholic Health East)1 | | | 5.000 | | | | 11/15/2033 | | | | 7,879,158 | |
| | 1,000,000 | | | NJ Health Care Facilities Financing Authority (Hebrew Old Age Center of Atlantic City)1 | | | 5.375 | | | | 11/01/2036 | | | | 814,340 | |
| | 750,000 | | | NJ Health Care Facilities Financing Authority (Hebrew Old Age Center of Atlantic City)1 | | | 5.300 | | | | 11/01/2026 | | | | 669,510 | |
| | 1,010,000 | | | NJ Health Care Facilities Financing Authority (Holy Name Hospital)1 | | | 5.000 | | | | 07/01/2036 | | | | 1,023,655 | |
| | 295,000 | | | NJ Health Care Facilities Financing Authority (Hospital Asset Transformation)1 | | | 5.250 | | | | 10/01/2038 | | | | 315,172 | |
| | 1,500,000 | | | NJ Health Care Facilities Financing Authority (Kennedy Health System) | | | 5.000 | | | | 07/01/2031 | | | | 1,634,715 | |
| | 9,430,000 | | | NJ Health Care Facilities Financing Authority (Raritan Bay Medical Center)1 | | | 7.250 | | | | 07/01/2027 | | | | 9,442,353 | |
| | 2,030,000 | | | NJ Health Care Facilities Financing Authority (RWJ University Hospital)1 | | | 5.000 | | | | 07/01/2035 | | | | 2,031,989 | |
24 OPPENHEIMER ROCHESTER NEW JERSEY MUNICIPAL FUND
| | | | | | | | | | | | | | | | |
Principal
Amount | | | | | Coupon | | | Maturity | | | Value | |
| New Jersey (Continued) | | | | | | | | | | | | |
| | $15,000 | | | NJ Health Care Facilities Financing Authority (St. Barnabas Corp.) | | | 6.621 | %2 | | | 07/01/2017 | | | $ | 14,561 | |
| | 37,955,000 | | | NJ Health Care Facilities Financing Authority (St. Barnabas Corp./St. Barnabas Medical Center Obligated Group) | | | 6.250 | 2 | | | 07/01/2030 | | | | 18,249,903 | |
| | 10,000,000 | | | NJ Health Care Facilities Financing Authority (St. Joseph’s Hospital & Medical Center)1 | | | 6.625 | | | | 07/01/2038 | | | | 11,144,100 | |
| | 1,960,000 | | | NJ Health Care Facilities Financing Authority (St. Luke’s Warren Hospital) | | | 5.000 | | | | 08/15/2034 | | | | 2,122,288 | |
| | 6,040,000 | | | NJ Health Care Facilities Financing Authority (Trinitas Hospital/Marillac Corp. Obligated Group)1 | | | 5.250 | | | | 07/01/2023 | | | | 6,407,836 | |
| | 125,000 | | | NJ Health Care Facilities Financing Authority (Virtua Health Obligated Group)1 | | | 5.750 | | | | 07/01/2033 | | | | 140,811 | |
| | 100,000 | | | NJ Higher Education Assistance Authority1 | | | 5.750 | | | | 12/01/2029 | | | | 110,111 | |
| | 3,160,000 | | | NJ Higher Education Assistance Authority1 | | | 5.500 | | | | 12/01/2025 | | | | 3,500,427 | |
| | 24,450,000 | | | NJ Higher Education Student Assistance Authority (Student Loans)1 | | | 6.125 | | | | 06/01/2030 | | | | 26,558,079 | |
| | 15,000 | | | NJ Hsg. & Mtg. Finance Agency1 | | | 5.400 | | | | 11/01/2016 | | | | 15,218 | |
| | 570,000 | | | NJ Hsg. & Mtg. Finance Agency (Multifamily)1 | | | 5.000 | | | | 11/01/2036 | | | | 573,734 | |
| | 1,330,000 | | | NJ Hsg. & Mtg. Finance Agency (Single Family Hsg.)3 | | | 5.000 | | | | 10/01/2037 | | | | 1,348,806 | |
| | 3,760,000 | | | NJ Hsg. & Mtg. Finance Agency (Single Family Hsg.)3 | | | 4.625 | | | | 10/01/2027 | | | | 3,832,643 | |
| | 135,000 | | | NJ Hsg. & Mtg. Finance Agency, Series AA1 | | | 6.375 | | | | 10/01/2028 | | | | 140,215 | |
| | 200,000 | | | NJ Hsg. & Mtg. Finance Agency, Series AA1 | | | 6.150 | | | | 10/01/2023 | | | | 213,148 | |
| | 25,000 | | | NJ Hsg. & Mtg. Finance Agency, Series AA1 | | | 6.500 | | | | 10/01/2038 | | | | 25,947 | |
| | 100,000 | | | NJ South Jersey Port Corp.1 | | | 5.250 | | | | 01/01/2030 | | | | 100,165 | |
| | 20,000 | | | NJ Sports & Expositions Authority | | | 5.250 | | | | 09/01/2015 | | | | 20,086 | |
| | 17,080,000 | | | NJ Tobacco Settlement Financing Corp.1 | | | 5.000 | | | | 06/01/2041 | | | | 12,890,447 | |
| | 10,000,000 | | | NJ Transportation Trust Fund Authority1 | | | 5.875 | | | | 12/15/2038 | | | | 11,074,400 | |
| | 5,000,000 | | | NJ Transportation Trust Fund Authority1 | | | 5.500 | | | | 06/15/2041 | | | | 5,275,150 | |
| | 4,500,000 | | | NJ Transportation Trust Fund Authority1 | | | 6.000 | | | | 06/15/2035 | | | | 5,153,940 | |
| | 1,625,000 | | | NJ Transportation Trust Fund Authority1 | | | 5.000 | | | | 06/15/2038 | | | | 1,667,656 | |
| | 5,000,000 | | | NJ Turnpike Authority1 | | | 5.000 | | | | 01/01/2038 | | | | 5,544,500 | |
| | 200,000 | | | Passaic Valley, NJ Sewage Commissioners | | | 5.000 | | | | 12/01/2022 | | | | 200,754 | |
| | 100,000 | | | Passaic Valley, NJ Sewage Commissioners | | | 5.000 | | | | 12/01/2023 | | | | 100,377 | |
| | 4,000,000 | | | Rutgers State University NJ3 | | | 5.000 | | | | 05/01/2038 | | | | 4,493,480 | |
| | 6,330,000 | | | Rutgers State University NJ3 | | | 5.000 | | | | 05/01/2029 | | | | 7,292,143 | |
| | 5,380,000 | | | Rutgers State University NJ3 | | | 5.000 | | | | 05/01/2030 | | | | 6,175,003 | |
| | 3,650,000 | | | South Jersey, NJ Transportation Authority1 | | | 5.000 | | | | 11/01/2039 | | | | 3,865,934 | |
| | 45,000 | | | Union County, NJ Improvement Authority (Linden Airport)1 | | | 5.000 | | | | 03/01/2028 | | | | 45,149 | |
| | 25,000 | | | Washington Township, NJ Board of Education (Robbinsville)1 | | | 5.000 | | | | 01/01/2020 | | | | 25,496 | |
| | 40,000 | | | West Milford, NJ Township (Municipal Utilties Authority)1 | | | 5.375 | | | | 08/01/2031 | | | | 40,042 | |
| | | | | | | | | | | | | | | | |
| | | | | | | | | | | | | | | 307,806,258 | |
| | | | |
| | | | | | | | | | | | | | | | | |
| New York—7.5% | | | | | | | | | | | | |
| | 5,100,000 | | | Port Authority NY/NJ (JFK International Air Terminal)1 | | | 6.500 | | | | 12/01/2028 | | | | 5,194,146 | |
| | 2,679,000 | | | Port Authority NY/NJ (JFK International Air Terminal)1 | | | 5.750 | | | | 12/01/2022 | | | | 2,693,467 | |
25 OPPENHEIMER ROCHESTER NEW JERSEY MUNICIPAL FUND
STATEMENT OF INVESTMENTS Continued
| | | | | | | | | | | | | | | | |
Principal
Amount | | | | | Coupon | | | Maturity | | | Value | |
| New York (Continued) | | | | | | | | | | | | |
| | $8,685,000 | | | Port Authority NY/NJ (JFK International Air
Terminal)1 | | | 5.750 | % | | | 12/01/2025 | | | $ | 8,710,447 | |
| | 2,505,000 | | | Port Authority NY/NJ (KIAC)1 | | | 6.750 | | | | 10/01/2019 | | | | 2,504,624 | |
| | 1,725,000 | | | Port Authority NY/NJ, 141st Series1 | | | 5.000 | | | | 09/01/2027 | | | | 1,731,934 | |
| | 10,500,000 | | | Port Authority NY/NJ, 143rd Series3 | | | 5.000 | | | | 10/01/2030 | | | | 10,774,890 | |
| | | | | | | | | | | | | | | | |
| | | | | | | | | | | | | | | 31,609,508 | |
| | | | |
| | | | | | | | | | | | | | | | | |
| U.S. Possessions—27.0% | | | | | | | | | | | | |
| | 10,000 | | | Guam Hsg. Corp. (Single Family Mtg.)1 | | | 5.750 | | | | 09/01/2031 | | | | 10,877 | |
| | 125,000 | | | Guam Power Authority, Series A | | | 5.000 | | | | 10/01/2024 | | | | 147,607 | |
| | 125,000 | | | Guam Power Authority, Series A | | | 5.000 | | | | 10/01/2023 | | | | 147,790 | |
| | 250,000 | | | Guam Power Authority, Series A | | | 5.000 | | | | 10/01/2030 | | | | 288,427 | |
| | 120,000 | | | Northern Mariana Islands Commonwealth, Series A1 | | | 5.000 | | | | 06/01/2017 | | | | 120,810 | |
| | 3,760,000 | | | Northern Mariana Islands Commonwealth, Series A1 | | | 5.000 | | | | 06/01/2030 | | | | 3,260,258 | |
| | 2,355,000 | | | Northern Mariana Islands Ports Authority, Series A1 | | | 6.250 | | | | 03/15/2028 | | | | 2,095,220 | |
| | 1,005,000 | | | Northern Mariana Islands Ports Authority, Series A1 | | | 5.500 | | | | 03/15/2031 | | | | 909,053 | |
| | 2,525,000 | | | Puerto Rico Aqueduct & Sewer Authority | | | 6.000 | | | | 07/01/2038 | | | | 1,810,071 | |
| | 1,000,000 | | | Puerto Rico Aqueduct & Sewer Authority | | | 6.125 | 4 | | | 07/01/2024 | | | | 749,480 | |
| | 190,000 | | | Puerto Rico Children’s Trust Fund (TASC)1 | | | 5.375 | | | | 05/15/2033 | | | | 190,247 | |
| | 16,605,000 | | | Puerto Rico Children’s Trust Fund (TASC)1 | | | 5.625 | | | | 05/15/2043 | | | | 16,638,044 | |
| | 18,550,000 | | | Puerto Rico Children’s Trust Fund (TASC)1 | | | 5.500 | | | | 05/15/2039 | | | | 18,548,701 | |
| | 26,000,000 | | | Puerto Rico Children’s Trust Fund (TASC) | | | 6.016 | 2 | | | 05/15/2055 | | | | 703,820 | |
| | 5,000,000 | | | Puerto Rico Commonwealth GO | | | 6.000 | | | | 07/01/2029 | | | | 3,237,800 | |
| | 2,795,000 | | | Puerto Rico Commonwealth GO | | | 5.500 | | | | 07/01/2039 | | | | 1,754,841 | |
| | 2,150,000 | | | Puerto Rico Commonwealth GO | | | 5.250 | | | | 07/01/2037 | | | | 1,341,922 | |
| | 3,205,000 | | | Puerto Rico Commonwealth GO | | | 5.750 | | | | 07/01/2041 | | | | 2,016,426 | |
| | 6,085,000 | | | Puerto Rico Commonwealth GO | | | 6.000 | | | | 07/01/2039 | | | | 3,865,679 | |
| | 3,000,000 | | | Puerto Rico Commonwealth GO | | | 6.500 | | | | 07/01/2040 | | | | 1,932,120 | |
| | 8,350,000 | | | Puerto Rico Commonwealth GO | | | 5.750 | | | | 07/01/2036 | | | | 5,304,504 | |
| | 3,000,000 | | | Puerto Rico Electric Power Authority, Series A5 | | | 7.000 | | | | 07/01/2043 | | | | 1,739,850 | |
| | 1,990,000 | | | Puerto Rico Electric Power Authority, Series A5 | | | 5.000 | | | | 07/01/2042 | | | | 1,154,936 | |
| | 1,700,000 | | | Puerto Rico Electric Power Authority, Series A5 | | | 5.000 | | | | 07/01/2029 | | | | 986,357 | |
| | 45,000 | | | Puerto Rico Electric Power Authority, Series A5 | | | 5.050 | | | | 07/01/2042 | | | | 26,115 | |
| | 5,000,000 | | | Puerto Rico Electric Power Authority, Series AAA5 | | | 5.250 | | | | 07/01/2030 | | | | 2,901,150 | |
| | 550,000 | | | Puerto Rico Electric Power Authority, Series AAA5 | | | 5.250 | | | | 07/01/2031 | | | | 319,116 | |
| | 3,000,000 | | | Puerto Rico Electric Power Authority, Series AAA5 | | | 5.250 | | | | 07/01/2028 | | | | 1,740,450 | |
| | 50,000 | | | Puerto Rico Electric Power Authority, Series CCC5 | | | 5.000 | | | | 07/01/2021 | | | | 29,173 | |
| | 90,000 | | | Puerto Rico Electric Power Authority, Series CCC5 | | | 5.000 | | | | 07/01/2025 | | | | 52,273 | |
| | 80,000 | | | Puerto Rico Electric Power Authority, Series TT5 | | | 5.000 | | | | 07/01/2037 | | | | 46,422 | |
| | 100,000 | | | Puerto Rico Electric Power Authority, Series TT5 | | | 5.000 | | | | 07/01/2023 | | | | 58,154 | |
| | 395,000 | | | Puerto Rico Electric Power Authority, Series XX5 | | | 5.250 | | | | 07/01/2035 | | | | 229,195 | |
| | 750,000 | | | Puerto Rico Highway & Transportation Authority | | | 5.750 | | | | 07/01/2020 | | | | 468,907 | |
| | 3,000,000 | | | Puerto Rico Highway & Transportation Authority,
Series L | | | 5.250 | | | | 07/01/2038 | | | | 2,575,830 | |
| | 3,000,000 | | | Puerto Rico Infrastructure | | | 7.050 | 2 | | | 07/01/2042 | | | | 356,610 | |
| | 975,000 | | | Puerto Rico Infrastructure | | | 7.000 | 2 | | | 07/01/2035 | | | | 219,268 | |
| | 2,610,000 | | | Puerto Rico Infrastructure | | | 5.000 | | | | 07/01/2041 | | | | 671,318 | |
| | 4,750,000 | | | Puerto Rico Infrastructure | | | 5.000 | | | | 07/01/2037 | | | | 1,228,445 | |
| | 575,000 | | | Puerto Rico Infrastructure | | | 5.000 | | | | 07/01/2027 | | | | 184,420 | |
| | 400,000 | | | Puerto Rico Infrastructure (Mepsi Campus)1 | | | 6.500 | | | | 10/01/2037 | | | | 238,708 | |
26 OPPENHEIMER ROCHESTER NEW JERSEY MUNICIPAL FUND
| | | | | | | | | | | | | | | | |
Principal
Amount | | | | | Coupon | | | Maturity | | | Value | |
| U.S. Possessions (Continued) | | | | | | | | | | | | |
| | $100,000 | | | Puerto Rico ITEMECF (Ana G. Mendez University) | | | 5.000 | % | | | 04/01/2027 | | | $ | 86,812 | |
| | 100,000 | | | Puerto Rico ITEMECF (Ana G. Mendez University) | | | 5.375 | | | | 04/01/2042 | | | | 84,189 | |
| | 930,000 | | | Puerto Rico ITEMECF (Ana G. Mendez University)1 | | | 5.000 | | | | 03/01/2036 | | | | 760,126 | |
| | 100,000 | | | Puerto Rico ITEMECF (Ana G. Mendez University) | | | 5.125 | | | | 04/01/2032 | | | | 84,847 | |
| | 175,000 | | | Puerto Rico ITEMECF (Cogeneration Facilities)1 | | | 6.625 | | | | 06/01/2026 | | | | 165,351 | |
| | 1,000,000 | | | Puerto Rico ITEMECF (Polytechnic University)1 | | | 5.000 | | | | 08/01/2032 | | | | 828,850 | |
| | 2,000,000 | | | Puerto Rico Municipal Finance Agency, Series A | | | 5.250 | | | | 08/01/2020 | | | | 1,972,660 | |
| | 200,000 | | | Puerto Rico Public Buildings Authority | | | 7.000 | | | | 07/01/2025 | | | | 128,702 | |
| | 305,000 | | | Puerto Rico Public Buildings Authority | | | 5.250 | | | | 07/01/2033 | | | | 173,115 | |
| | 1,000,000 | | | Puerto Rico Public Buildings Authority | | | 5.625 | | | | 07/01/2039 | | | | 570,140 | |
| | 1,000,000 | | | Puerto Rico Public Buildings Authority1 | | | 6.000 | | | | 07/01/2028 | | | | 1,001,340 | |
| | 5,000,000 | | | Puerto Rico Public Buildings Authority | | | 5.250 | | | | 07/01/2042 | | | | 2,782,000 | |
| | 1,530,000 | | | Puerto Rico Public Buildings Authority, Series D | | | 5.250 | | | | 07/01/2036 | | | | 862,767 | |
| | 6,800,000 | | | Puerto Rico Sales Tax Financing Corp., Series A | | | 6.500 | | | | 08/01/2044 | | | | 2,929,100 | |
| | 9,850,000 | | | Puerto Rico Sales Tax Financing Corp., Series A | | | 5.375 | | | | 08/01/2039 | | | | 4,022,248 | |
| | 10,935,000 | | | Puerto Rico Sales Tax Financing Corp., Series A | | | 5.500 | | | | 08/01/2042 | | | | 4,396,745 | |
| | 325,000 | | | Puerto Rico Sales Tax Financing Corp., Series A | | | 6.375 | | | | 08/01/2039 | | | | 139,188 | |
| | 2,500,000 | | | Puerto Rico Sales Tax Financing Corp., Series A | | | 5.500 | | | | 08/01/2021 | | | | 1,099,650 | |
| | 4,850,000 | | | Puerto Rico Sales Tax Financing Corp., Series A | | | 5.500 | | | | 08/01/2022 | | | | 2,118,044 | |
| | 5,235,000 | | | Puerto Rico Sales Tax Financing Corp., Series B6 | | | 6.000 | | | | 08/01/2026 | | | | 654,375 | |
| | 14,000,000 | | | Puerto Rico Sales Tax Financing Corp., Series C | | | 5.750 | | | | 08/01/2057 | | | | 8,559,180 | |
| | 3,100,000 | | | V.I. Tobacco Settlement Financing Corp. | | | 7.625 | 2 | | | 05/15/2035 | | | | 247,070 | |
| | 2,050,000 | | | V.I. Tobacco Settlement Financing Corp. | | | 6.875 | 2 | | | 05/15/2035 | | | | 226,382 | |
| | 1,100,000 | | | V.I. Tobacco Settlement Financing Corp. | | | 6.500 | 2 | | | 05/15/2035 | | | | 133,155 | |
| | | | | | | | | | | | | | | | |
| | | | | | | | | | | | | | | 114,326,430 | |
| | | | |
| | | | | | | | | | | | | | | | | |
| Total Investments, at Value (Cost $483,083,901)—107.2% | | | | | | | | | | | 453,742,196 | |
| Net Other Assets (Liabilities)—(7.2) | | | | | | | | | | | (30,378,635 | ) |
| | | | | | | | | | | | | | | | |
| Net Assets—100.0% | | | | | | | | | | $ | 423,363,561 | |
| | | | | | | | | | | | | | | | |
27 OPPENHEIMER ROCHESTER NEW JERSEY MUNICIPAL FUND
STATEMENT OF INVESTMENTS Continued
Footnotes to Statement of Investments
1. All or a portion of the security position has been segregated for collateral to cover borrowings. See Note 8 of the accompanying Notes.
2. Zero coupon bond reflects effective yield on the date of purchase.
3. Security represents the underlying municipal bond with respect to an inverse floating rate security held by the Fund. The bond was purchased by the Fund and subsequently transferred to a trust, which issued the related inverse floating rate security. See Note 4 of the accompanying Notes.
4. Denotes a step bond: a zero coupon bond that converts to a fixed or variable interest rate at a designated future date.
5. Subject to a forbearance agreement. Rate shown is the contractual interest rate. See Note 4 of the accompanying Notes.
6. This security is not accruing income because the issuer has missed an interest payment on it and/or is not anticipated to make future interest and or principal payments. The rate shown is the contractual interest rate. See Note 4 of the accompanying Notes.
To simplify the listings of securities, abbreviations are used per the table below:
| | |
| COP | | Certificates of Participation |
| EDA | | Economic Devel. Authority |
| GO | | General Obligation |
| HDC | | Housing Devel. Corp. |
| ITEMECF | | Industrial, Tourist, Educational, Medical and Environmental Community Facilities |
| JFK | | John Fitzgerald Kennedy |
| MSU | | Montclair State University |
| NY/NJ | | New York/New Jersey |
| ROLs | | Reset Option Longs |
| RWJ | | Robert Wood Johnson |
| TASC | | Tobacco Settlement Asset-Backed Bonds |
| V.I. | | United States Virgin Islands |
See accompanying Notes to Financial Statements.
28 OPPENHEIMER ROCHESTER NEW JERSEY MUNICIPAL FUND
|
| STATEMENT OF ASSETS AND LIABILITIES July 31, 2015 |
| | | | |
Assets | | | | |
Investments, at value (cost $483,083,901)—see accompanying statement of investments | | $ | 453,742,196 | |
Cash | | | 567,135 | |
Receivables and other assets: | | | | |
Interest | | | 5,738,024 | |
Investments sold (including $4,353,237 sold on a when-issued or delayed delivery basis) | | | 4,353,237 | |
Shares of beneficial interest sold | | | 159,353 | |
Other | | | 506,875 | |
| | | | |
Total assets | | | 465,066,820 | |
| |
| | | | |
Liabilities | | | | |
Payables and other liabilities: | | | | |
Payable for short-term floating rate notes issued (See Note 4) | | | 22,200,000 | |
Payable for borrowings (See Note 8) | | | 16,800,000 | |
Shares of beneficial interest redeemed | | | 2,158,211 | |
Dividends | | | 320,361 | |
Trustees’ compensation | | | 84,220 | |
Distribution and service plan fees | | | 55,650 | |
Shareholder communications | | | 7,227 | |
Interest expense on borrowings | | | 2,091 | |
Other | | | 75,499 | |
| | | | |
Total liabilities | | | 41,703,259 | |
| |
| | | | |
Net Assets | | $ | 423,363,561 | |
| | | | |
| | | | |
Composition of Net Assets | | | | |
Paid-in capital | | $ | 612,648,887 | |
Accumulated net investment income | | | 3,428,344 | |
Accumulated net realized loss on investments | | | (163,371,965) | |
Net unrealized depreciation on investments | | | (29,341,705) | |
| | | | |
Net Assets | | $ | 423,363,561 | |
| | | | |
29 OPPENHEIMER ROCHESTER NEW JERSEY MUNICIPAL FUND
STATEMENT OF ASSETS AND LIABILITIES Continued
| | | | |
Net Asset Value Per Share | | | | |
| |
| Class A Shares: | | | | |
| |
| Net asset value and redemption price per share (based on net assets of $263,872,752 and 28,255,634 shares of beneficial interest outstanding) | | $ | 9.34 | |
| |
| Maximum offering price per share (net asset value plus sales charge of 4.75% of offering price) | | $ | 9.81 | |
| |
| Class B Shares: | | | | |
| |
| Net asset value, redemption price (excludes applicable contingent deferred sales charge) and offering price per share (based on net assets of $4,443,944 and 474,620 shares of beneficial interest outstanding) | | $ | 9.36 | |
| |
| Class C Shares: | | | | |
| |
| Net asset value, redemption price (excludes applicable contingent deferred sales charge) and offering price per share (based on net assets of $131,468,256 and 14,061,543 shares of beneficial interest outstanding) | | $ | 9.35 | |
| |
| Class Y Shares: | | | | |
| |
| Net asset value, redemption price and offering price per share (based on net assets of $23,578,609 and 2,522,404 shares of beneficial interest outstanding) | | $ | 9.35 | |
See accompanying Notes to Financial Statements.
30 OPPENHEIMER ROCHESTER NEW JERSEY MUNICIPAL FUND
STATEMENT OF OPERATIONS For the Year Ended July 31, 2015
| | | | |
Investment Income | | | | |
Interest | | $ | 28,761,761 | |
Expenses | | | | |
Management fees | | | 2,636,822 | |
Distribution and service plan fees: | | | | |
Class A | | | 446,921 | |
Class B | | | 50,116 | |
Class C | | | 1,286,317 | |
Transfer and shareholder servicing agent fees: | | | | |
Class A | | | 303,386 | |
Class B | | | 5,572 | |
Class C | | | 143,003 | |
Class Y | | | 25,130 | |
Shareholder communications: | | | | |
Class A | | | 16,634 | |
Class B | | | 795 | |
Class C | | | 8,949 | |
Class Y | | | 1,430 | |
Borrowing fees | | | 1,084,602 | |
Interest expense and fees on short-term floating rate notes issued (See Note 4) | | | 338,219 | |
Interest expense on borrowings | | | 14,686 | |
Trustees’ compensation | | | 7,271 | |
Custodian fees and expenses | | | 6,080 | |
Other | | | 254,488 | |
| | | | |
Total expenses | | | 6,630,421 | |
Net Investment Income | | | 22,131,340 | |
Realized and Unrealized Loss | | | | |
Net realized loss on investments | | | (8,229,498) | |
Net change in unrealized appreciation/depreciation on investments | | | (6,240,853) | |
Net Increase in Net Assets Resulting from Operations | | $ | 7,660,989 | |
| | | | |
See accompanying Notes to Financial Statements.
31 OPPENHEIMER ROCHESTER NEW JERSEY MUNICIPAL FUND
STATEMENTS OF CHANGES IN NET ASSETS
| | | | | | | | |
| | | Year Ended
July 31, 2015 | | | Year Ended
July 31, 2014 | |
Operations | | | | | | | | |
Net investment income | | $ | 22,131,340 | | | $ | 27,080,399 | |
Net realized loss | | | (8,229,498) | | | | (36,313,172) | |
Net change in unrealized appreciation/depreciation | | | (6,240,853) | | | | 36,245,859 | |
| | | | | | | | |
Net increase in net assets resulting from operations | | | 7,660,989 | | | | 27,013,086 | |
| | | | | | | | |
Dividends and/or Distributions to Shareholders | | | | | | | | |
Dividends from net investment income: | | | | | | | | |
Class A | | | (15,406,697) | | | | (17,961,148) | |
Class B | | | (239,014) | | | | (365,538) | |
Class C | | | (6,175,481) | | | | (7,139,284) | |
Class Y | | | (1,309,505) | | | | (1,182,464) | |
| | | | |
| | | (23,130,697) | | | | (26,648,434) | |
| | | | | | | | |
Beneficial Interest Transactions | | | | | | | | |
Net increase (decrease) in net assets resulting from beneficial interest transactions: | | | | | | | | |
Class A | | | (32,683,565) | | | | (62,414,978) | |
Class B | | | (1,767,809) | | | | (3,925,573) | |
Class C | | | (5,925,078) | | | | (31,680,313) | |
Class Y | | | 690,570 | | | | 550,178 | |
| | | | | | | | |
| | | (39,685,882) | | | | (97,470,686) | |
| | | | | | | | |
Net Assets | | | | | | | | |
Total decrease | | | (55,155,590) | | | | (97,106,034) | |
Beginning of period | | | 478,519,151 | | | | 575,625,185 | |
| | | | | | | | |
| | |
| End of period (including accumulated net investment income of $3,428,344 and $4,207,870, respectively) | | $ | 423,363,561 | | | $ | 478,519,151 | |
| | | | |
See accompanying Notes to Financial Statements.
32 OPPENHEIMER ROCHESTER NEW JERSEY MUNICIPAL FUND
STATEMENT OF CASH FLOWS For the Year Ended July 31, 2015
| | | | |
Cash Flows from Operating Activities | | | | |
Net increase in net assets from operations | | $ | 7,660,989 | |
| | |
Adjustments to reconcile net increase in net assets from operations to net cash provided by operating activities: | | | | |
Purchase of investment securities | | | (37,004,113 | ) |
Proceeds from disposition of investment securities | | | 91,623,526 | |
Short-term investment securities, net | | | 628,789 | |
Premium amortization | | | 2,112,556 | |
Discount accretion | | | (1,667,335 | ) |
Net realized loss on investments | | | 8,229,498 | |
Net change in unrealized appreciation/depreciation on investments | | | 6,240,853 | |
Change in assets: | | | | |
Increase in other assets | | | (264,608 | ) |
Decrease in interest receivable | | | 462,194 | |
Increase in receivable for securities sold | | | (4,353,237 | ) |
Change in liabilities: | | | | |
Decrease in other liabilities | | | (43,678 | ) |
Decrease in payable for securities purchased | | | (55,784 | ) |
| | | | |
Net cash provided by operating activities | | | 73,569,650 | |
| | | | |
Cash Flows from Financing Activities | | | | |
Proceeds from borrowings | | | 135,900,000 | |
Payments on borrowings | | | (128,500,000 | ) |
Payments on short-term floating rate notes issued | | | (18,775,000 | ) |
Proceeds from shares sold | | | 63,372,735 | |
Payments on shares redeemed | | | (121,381,893 | ) |
Cash distributions paid | | | (4,337,995 | ) |
| | | | |
Net cash used in financing activities | | | (73,722,153 | ) |
| | |
Net decrease in cash | | | (152,503 | ) |
| | |
Cash, beginning balance | | | 719,638 | |
| | | | |
Cash, ending balance | | $ | 567,135 | |
| | | | |
Supplemental disclosure of cash flow information:
Noncash financing activities not included herein consist of reinvestment of dividends and distributions of $18,994,670.
Cash paid for interest on borrowings—$13,599.
Cash paid for interest on short-term floating rate notes issued—$338,219.
See accompanying Notes to Financial Statements.
33 OPPENHEIMER ROCHESTER NEW JERSEY MUNICIPAL FUND
FINANCIAL HIGHLIGHTS
| | | | | | | | | | | | | | | | | | | | |
| Class A | | Year Ended
July 31,
2015 | | | Year Ended
July 31,
2014 | | | Year Ended
July 31,
2013 | | | Year Ended
July 31,
2012 | | | Year Ended
July 29,
2011 1 | |
| |
| Per Share Operating Data | | | | | | | | | | | | | | | | | | | | |
| Net asset value, beginning of period | | $ | 9.67 | | | $ | 9.60 | | | $ | 10.68 | | | $ | 9.75 | | | $ | 10.14 | |
| |
Income (loss) from investment operations: | | | | | | | | | | | | | | | | | | | | |
Net investment income2 | | | 0.48 | | | | 0.52 | | | | 0.50 | | | | 0.54 | | | | 0.64 | |
Net realized and unrealized gain (loss) | | | (0.31) | | | | 0.07 | | | | (1.05) | | | | 1.00 | | | | (0.41) | |
| | | | |
Total from investment operations | | | 0.17 | | | | 0.59 | | | | (0.55) | | | | 1.54 | | | | 0.23 | |
| |
Dividends and/or distributions to shareholders: | | | | | | | | | | | | | | | | | | | | |
Dividends from net investment income | | | (0.50) | | | | (0.52) | | | | (0.53) | | | | (0.61) | | | | (0.62) | |
| |
Net asset value, end of period | | $ | 9.34 | | | $ | 9.67 | | | $ | 9.60 | | | $ | 10.68 | | | $ | 9.75 | |
| | | | |
| |
| Total Return, at Net Asset Value3 | | | 1.64% | | | | 6.40% | | | | (5.43)% | | | | 16.21% | | | | 2.46% | |
| | | | | | | | | | | | | | | | | | | | |
| |
| Ratios/Supplemental Data | | | | | | | | | | | | | | | | | | | | |
Net assets, end of period (in thousands) | | $ | 263,873 | | | $ | 306,172 | | | $ | 368,177 | | | $ | 421,443 | | | $ | 359,697 | |
| |
Average net assets (in thousands) | | $ | 301,779 | | | $ | 326,496 | | | $ | 425,664 | | | $ | 385,776 | | | $ | 377,127 | |
| |
Ratios to average net assets:4 | | | | | | | | | | | | | | | | | | | | |
Net investment income | | | 4.89% | | | | 5.58% | | | | 4.80% | | | | 5.31% | | | | 6.62% | |
| Expenses excluding interest and fees on short-term floating rate notes issued and interest and fees from borrowings | | | 0.87% | | | | 0.83% | | | | 0.76% | | | | 0.76% | | | | 0.77% | |
Interest and fees from borrowings | | | 0.23% | | | | 0.15% | | | | 0.11% | | | | 0.08% | | | | 0.10% | |
Interest and fees on short-term floating rate notes issued 5 | | | 0.07% | | | | 0.08% | | | | 0.06% | | | | 0.11% | | | | 0.19% | |
| | | | |
Total expenses | | | 1.17% | | | | 1.06% | | | | 0.93% | | | | 0.95% | | | | 1.06% | |
| Expenses after payments, waivers and/or reimbursements and reduction to custodian expenses | | | 1.17% | | | | 1.06% | | | | 0.91% | | | | 0.93% | | | | 1.05% | |
| |
Portfolio turnover rate | | | 7% | | | | 30% | | | | 24% | | | | 18% | | | | 15% | |
1. July 29, 2011 represents the last business day of the Fund’s reporting period.
2. Per share amounts calculated based on the average shares outstanding during the period.
3. Assumes an initial investment on the business day before the first day of the fiscal period, with all dividends and distributions reinvested in additional shares on the reinvestment date, and redemption at the net asset value calculated on the last business day of the fiscal period. Sales charges are not reflected in the total returns. Total returns are not annualized for periods less than one full year. Returns do not reflect the deduction of taxes that a shareholder would pay on fund distributions or the redemption of fund shares. The returns do not include adjustments in accordance with generally accepted accounting principles required at the period end for financial reporting purposes.
4. Annualized for periods less than one full year.
5. Interest and fee expense relates to the Fund’s liability for short-term floating rate notes issued in conjunction with inverse floating rate security transactions.
See accompanying Notes to Financial Statements.
34 OPPENHEIMER ROCHESTER NEW JERSEY MUNICIPAL FUND
| | | | | | | | | | | | | | | | | | | | |
| Class B | | Year Ended
July 31,
2015 | | | Year Ended
July 31,
2014 | | | Year Ended
July 31,
2013 | | | Year Ended
July 31,
2012 | | | Year Ended
July 29,
2011 1 | |
| |
| Per Share Operating Data | | | | | | | | | | | | | | | | | | | | |
| Net asset value, beginning of period | | $ | 9.69 | | | $ | 9.62 | | | $ | 10.70 | | | $ | 9.77 | | | $ | 10.15 | |
| |
| Income (loss) from investment operations: | | | | | | | | | | | | | | | | | | | | |
| Net investment income2 | | | 0.41 | | | | 0.45 | | | | 0.42 | | | | 0.46 | | | | 0.56 | |
| Net realized and unrealized gain (loss) | | | (0.31) | | | | 0.06 | | | | (1.06) | | | | 0.99 | | | | (0.40) | |
| | | | |
| Total from investment operations | | | 0.10 | | | | 0.51 | | | | (0.64) | | | | 1.45 | | | | 0.16 | |
| |
| Dividends and/or distributions to shareholders: | | | | | | | | | | | | | | | | | | | | |
| Dividends from net investment income | | | (0.43) | | | | (0.44) | | | | (0.44) | | | | (0.52) | | | | (0.54) | |
| |
| Net asset value, end of period | | $ | 9.36 | | | $ | 9.69 | | | $ | 9.62 | | | $ | 10.70 | | | $ | 9.77 | |
| | | | |
| |
| | | | | | | | | | | | | | | | | | | | |
| Total Return, at Net Asset Value3 | | | 0.86% | | | | 5.55% | | | | (6.24)% | | | | 15.20% | | | | 1.71% | |
| | | | | | | | | | | | | | | | | | | | |
| |
| Ratios/Supplemental Data | | | | | | | | | | | | | | | | | | | | |
| Net assets, end of period (in thousands) | | $ | 4,444 | | | $ | 6,351 | | | $ | 10,331 | | | $ | 18,879 | | | $ | 23,305 | |
| |
| Average net assets (in thousands) | | $ | 5,540 | | | $ | 7,822 | | | $ | 15,007 | | | $ | 20,307 | | | $ | 28,889 | |
| |
| Ratios to average net assets:4 | | | | | | | | | | | | | | | | | | | | |
| Net investment income | | | 4.13% | | | | 4.81% | | | | 3.96% | | | | 4.50% | | | | 5.78% | |
| Expenses excluding interest and fees on short-term floating rate notes issued and interest and fees from borrowings | | | 1.63% | | | | 1.63% | | | | 1.61% | | | | 1.61% | | | | 1.61% | |
| Interest and fees from borrowings | | | 0.23% | | | | 0.15% | | | | 0.11% | | | | 0.08% | | | | 0.10% | |
| Interest and fees on short-term floating rate notes issued 5 | | | 0.07% | | | | 0.08% | | | | 0.06% | | | | 0.11% | | | | 0.19% | |
| | | | |
| Total expenses | | | 1.93% | | | | 1.86% | | | | 1.78% | | | | 1.80% | | | | 1.90% | |
| Expenses after payments, waivers and/or reimbursements and reduction to custodian expenses | | | 1.93% | | | | 1.86% | | | | 1.76% | | | | 1.78% | | | | 1.89% | |
| |
| Portfolio turnover rate | | | 7% | | | | 30% | | | | 24% | | | | 18% | | | | 15% | |
1. July 29, 2011 represents the last business day of the Fund’s reporting period.
2. Per share amounts calculated based on the average shares outstanding during the period.
3. Assumes an initial investment on the business day before the first day of the fiscal period, with all dividends and distributions reinvested in additional shares on the reinvestment date, and redemption at the net asset value calculated on the last business day of the fiscal period. Sales charges are not reflected in the total returns. Total returns are not annualized for periods less than one full year. Returns do not reflect the deduction of taxes that a shareholder would pay on fund distributions or the redemption of fund shares. The returns do not include adjustments in accordance with generally accepted accounting principles required at the period end for financial reporting purposes.
4. Annualized for periods less than one full year.
5. Interest and fee expense relates to the Fund’s liability for short-term floating rate notes issued in conjunction with inverse floating rate security transactions.
See accompanying Notes to Financial Statements.
35 OPPENHEIMER ROCHESTER NEW JERSEY MUNICIPAL FUND
FINANCIAL HIGHLIGHTS Continued
| | | | | | | | | | | | | | | | | | | | |
| Class C | | Year Ended
July 31,
2015 | | | Year Ended
July 31,
2014 | | | Year Ended
July 31,
2013 | | | Year Ended
July 31,
2012 | | | Year Ended
July 29,
2011 1 | |
| |
| Per Share Operating Data | | | | | | | | | | | | | | | | | | | | |
| Net asset value, beginning of period | | $ | 9.68 | | | $ | 9.61 | | | $ | 10.69 | | | $ | 9.76 | | | $ | 10.14 | |
| |
| Income (loss) from investment operations: | | | | | | | | | | | | | | | | | | | | |
| Net investment income2 | | | 0.40 | | | | 0.45 | | | | 0.42 | | | | 0.46 | | | | 0.57 | |
| Net realized and unrealized gain (loss) | | | (0.30) | | | | 0.06 | | | | (1.05) | | | | 1.00 | | | | (0.41) | |
| | | | |
| Total from investment operations | | | 0.10 | | | | 0.51 | | | | (0.63) | | | | 1.46 | | | | 0.16 | |
| |
| Dividends and/or distributions to shareholders: | | | | | | | | | | | | | | | | | | | | |
| Dividends from net investment income | | | (0.43) | | | | (0.44) | | | | (0.45) | | | | (0.53) | | | | (0.54) | |
| |
| Net asset value, end of period | | $ | 9.35 | | | $ | 9.68 | | | $ | 9.61 | | | $ | 10.69 | | | $ | 9.76 | |
| | | | |
| | | | | | | | | | | | | | | | | | | | |
| |
| Total Return, at Net Asset Value3 | | | 0.87% | | | | 5.60% | | | | (6.15)% | | | | 15.32% | | | | 1.79% | |
| | | | | | | | | | | | | | | | | | | | |
| |
| Ratios/Supplemental Data | | | | | | | | | | | | | | | | | | | | |
| Net assets, end of period (in thousands) | | $ | 131,468 | | | $ | 142,154 | | | $ | 173,766 | | | $ | 187,934 | | | $ | 159,119 | |
| |
| Average net assets (in thousands) | | $ | 142,243 | | | $ | 150,721 | | | $ | 194,185 | | | $ | 169,315 | | | $ | 166,762 | |
| |
| Ratios to average net assets:4 | | | | | | | | | | | | | | | | | | | | |
| Net investment income | | | 4.06% | | | | 4.83% | | | | 4.04% | | | | 4.55% | | | | 5.85% | |
| Expenses excluding interest and fees on short-term floating rate notes issued and interest and fees from borrowings | | | 1.62% | | | | 1.59% | | | | 1.52% | | | | 1.52% | | | | 1.54% | |
| Interest and fees from borrowings | | | 0.23% | | | | 0.15% | | | | 0.11% | | | | 0.08% | | | | 0.10% | |
| Interest and fees on short-term floating rate notes issued 5 | | | 0.07% | | | | 0.08% | | | | 0.06% | | | | 0.11% | | | | 0.19% | |
| | | | |
| Total expenses | | | 1.92% | | | | 1.82% | | | | 1.69% | | | | 1.71% | | | | 1.83% | |
| Expenses after payments, waivers and/or reimbursements and reduction to custodian expenses | | | 1.92% | | | | 1.82% | | | | 1.67% | | | | 1.69% | | | | 1.82% | |
| |
| Portfolio turnover rate | | | 7% | | | | 30% | | | | 24% | | | | 18% | | | | 15% | |
1. July 29, 2011 represents the last business day of the Fund’s reporting period.
2. Per share amounts calculated based on the average shares outstanding during the period.
3. Assumes an initial investment on the business day before the first day of the fiscal period, with all dividends and distributions reinvested in additional shares on the reinvestment date, and redemption at the net asset value calculated on the last business day of the fiscal period. Sales charges are not reflected in the total returns. Total returns are not annualized for periods less than one full year. Returns do not reflect the deduction of taxes that a shareholder would pay on fund distributions or the redemption of fund shares. The returns do not include adjustments in accordance with generally accepted accounting principles required at the period end for financial reporting purposes.
4. Annualized for periods less than one full year.
5. Interest and fee expense relates to the Fund’s liability for short-term floating rate notes issued in conjunction with inverse floating rate security transactions.
See accompanying Notes to Financial Statements.
36 OPPENHEIMER ROCHESTER NEW JERSEY MUNICIPAL FUND
| | | | | | | | | | | | | | | | | | | | |
| Class Y | | Year Ended
July 31,
2015 | | | Year Ended
July 31,
2014 | | | Year Ended
July 31,
2013 | | | Year Ended
July 31,
2012 | | | Period Ended
July 29,
20111 | |
| |
| Per Share Operating Data | | | | | | | | | | | | | | | | | | | | |
| Net asset value, beginning of period | | $ | 9.68 | | | $ | 9.60 | | | $ | 10.69 | | | $ | 9.76 | | | $ | 9.86 | |
| |
| Income (loss) from investment operations: | | | | | | | | | | | | | | | | | | | | |
| Net investment income2 | | | 0.49 | | | | 0.54 | | | | 0.52 | | | | 0.55 | | | | 0.41 | |
| Net realized and unrealized gain (loss) | | | (0.30) | | | | 0.07 | | | | (1.07) | | | | 1.00 | | | | (0.10) | |
| | | | |
| Total from investment operations | | | 0.19 | | | | 0.61�� | | | | (0.55) | | | | 1.55 | | | | 0.31 | |
| |
| Dividends and/or distributions to shareholders: | | | | | | | | | | | | | | | | | | | | |
| Dividends from net investment income | | | (0.52) | | | | (0.53) | | | | (0.54) | | | | (0.62) | | | | (0.41) | |
| |
| Net asset value, end of period | | $ | 9.35 | | | $ | 9.68 | | | $ | 9.60 | | | $ | 10.69 | | | $ | 9.76 | |
| | | | |
| | | | | | | | | | | | | | | | | | | | |
| |
| Total Return, at Net Asset Value3 | | | 1.79% | | | | 6.66% | | | | (5.40)% | | | | 16.34% | | | | 3.48% | |
| | | | | | | | | | | | | | | | | | | | |
| |
| Ratios/Supplemental Data | | | | | | | | | | | | | | | | | | | | |
| Net assets, end of period (in thousands) | | $ | 23,579 | | | $ | 23,842 | | | $ | 23,351 | | | $ | 23,882 | | | $ | 9,232 | |
| |
| Average net assets (in thousands) | | $ | 25,005 | | | $ | 20,998 | | | $ | 25,821 | | | $ | 15,130 | | | $ | 4,339 | |
| |
| Ratios to average net assets:4 | | | | | | | | | | | | | | | | | | | | |
| Net investment income | | | 5.02% | | | | 5.71% | | | | 4.94% | | | | 5.33% | | | | 6.48% | |
| Expenses excluding interest and fees on short-term floating rate notes issued and interest and fees from borrowings | | | 0.72% | | | | 0.69% | | | | 0.62% | | | | 0.63% | | | | 0.62% | |
| Interest and fees from borrowings | | | 0.23% | | | | 0.15% | | | | 0.11% | | | | 0.08% | | | | 0.10% | |
| Interest and fees on short-term floating rate notes issued 5 | | | 0.07% | | | | 0.08% | | | | 0.06% | | | | 0.11% | | | | 0.19% | |
| | | | |
| Total expenses | | | 1.02% | | | | 0.92% | | | | 0.79% | | | | 0.82% | | | | 0.91% | |
| Expenses after payments, waivers and/or reimbursements and reduction to custodian expenses | | | 1.02% | | | | 0.92% | | | | 0.77% | | | | 0.80% | | | | 0.90% | |
| |
| Portfolio turnover rate | | | 7% | | | | 30% | | | | 24% | | | | 18% | | | | 15% | |
1. For the period from November 29, 2010 (inception of offering) to July 29, 2011.
2. Per share amounts calculated based on the average shares outstanding during the period.
3. Assumes an initial investment on the business day before the first day of the fiscal period, with all dividends and distributions reinvested in additional shares on the reinvestment date, and redemption at the net asset value calculated on the last business day of the fiscal period. Sales charges are not reflected in the total returns. Total returns are not annualized for periods less than one full year. Returns do not reflect the deduction of taxes that a shareholder would pay on fund distributions or the redemption of fund shares. The returns do not include adjustments in accordance with generally accepted accounting principles required at the period end for financial reporting purposes.
4. Annualized for periods less than one full year.
5. Interest and fee expense relates to the Fund’s liability for short-term floating rate notes issued in conjunction with inverse floating rate security transactions.
See accompanying Notes to Financial Statements.
37 OPPENHEIMER ROCHESTER NEW JERSEY MUNICIPAL FUND
NOTES TO FINANCIAL STATEMENTS July 31, 2015
1. Organization
Oppenheimer Rochester New Jersey Municipal Fund (the “Fund”) is a separate series of Oppenheimer Multi-State Municipal Trust, a non-diversified, open-end management investment company registered under the Investment Company Act of 1940 (“1940 Act”), as amended. The Fund’s investment objective is to seek tax-free income. The Fund’s investment adviser is OFI Global Asset Management, Inc. (“OFI Global” or the “Manager”), a wholly-owned subsidiary of OFI (“OFI” or the “Sub-Adviser”). The Manager has entered into a sub-advisory agreement with OFI.
The Fund offers Class A, Class C and Class Y shares, and previously offered Class B shares for new purchase through June 29, 2012. Subsequent to that date, no new purchases of Class B shares are permitted, however reinvestment of dividend and/or capital gain distributions and exchanges of Class B shares into and from other Oppenheimer funds will be allowed. Class A shares are sold at their offering price, which is normally net asset value plus a front-end sales charge. Class C shares are sold, and Class B shares were sold, without a front-end sales charge but may be subject to a contingent deferred sales charge (“CDSC”). Class Y shares are sold to certain institutional investors or intermediaries without either a front-end sales charge or a CDSC, however, the intermediaries may impose charges on their accountholders who beneficially own Class Y shares. All classes of shares have identical rights and voting privileges with respect to the Fund in general and exclusive voting rights on matters that affect that class alone. Earnings, net assets and net asset value per share may differ due to each class having its own expenses, such as transfer and shareholder servicing agent fees and shareholder communications, directly attributable to that class. Class A, B and C shares have separate distribution and/or service plans under which they pay fees. Class Y shares do not pay such fees. Class B shares will automatically convert to Class A shares 72 months after the date of purchase.
The following is a summary of significant accounting policies followed in the Fund’s preparation of financial statements in accordance with accounting principles generally accepted in the United States (“U.S. GAAP”).
2. Significant Accounting Policies
Security Valuation. All investments in securities are recorded at their estimated fair value, as described in Note 3.
Reporting Period End Date. The last day of the Fund’s reporting period is the last day the New York Stock Exchange was open for trading during the period. The Fund’s financial statements have been presented through that date to maintain consistency with the Fund’s net asset value calculations used for shareholder transactions.
Allocation of Income, Expenses, Gains and Losses. Income, expenses (other than those attributable to a specific class), gains and losses are allocated on a daily basis to each class of shares based upon the relative proportion of net assets represented by such class. Operating expenses directly attributable to a specific class are charged against the operations of that class.
38 OPPENHEIMER ROCHESTER NEW JERSEY MUNICIPAL FUND
2. Significant Accounting Policies (Continued)
Dividends and Distributions to Shareholders. Dividends and distributions to shareholders, which are determined in accordance with income tax regulations and may differ from U.S. generally accepted accounting principles, are recorded on the ex-dividend date. Income distributions, if any, are declared daily and paid monthly. Capital gain distributions, if any, are declared and paid annually.
Investment Income. Interest income is recognized on an accrual basis. Discount and premium, which are included in interest income on the Statement of Operations, are amortized or accreted daily.
Custodian Fees. “Custodian fees and expenses” in the Statement of Operations may include interest expense incurred by the Fund on any cash overdrafts of its custodian account during the period. Such cash overdrafts may result from the effects of failed trades in portfolio securities and from cash outflows resulting from unanticipated shareholder redemption activity. The Fund pays interest to its custodian on such cash overdraft at a rate equal to the 1 Month LIBOR Rate plus 2.00%. The “Reduction to custodian expenses” line item, if applicable, represents earnings on cash balances maintained by the Fund during the period. Such interest expense and other custodian fees may be paid with these earnings.
Security Transactions. Security transactions are recorded on the trade date. Realized gains and losses on securities sold are determined on the basis of identified cost.
Indemnifications. The Fund’s organizational documents provide current and former Trustees and officers with a limited indemnification against liabilities arising in connection with the performance of their duties to the Fund. In the normal course of business, the Fund may also enter into contracts that provide general indemnifications. The Fund’s maximum exposure under these arrangements is unknown as this would be dependent on future claims that may be made against the Fund. The risk of material loss from such claims is considered remote.
Federal Taxes. The Fund intends to comply with provisions of the Internal Revenue Code applicable to regulated investment companies and to distribute substantially all of its investment company taxable income, including any net realized gain on investments not offset by capital loss carryforwards, if any, to shareholders. Therefore, no federal income or excise tax provision is required. The Fund files income tax returns in U.S. federal and applicable state jurisdictions. The statute of limitations on the Fund’s tax return filings generally remains open for the three preceding fiscal reporting period ends.
The tax components of capital shown in the following table represent distribution requirements the Fund must satisfy under the income tax regulations, losses the Fund may be able to offset against income and gains realized in future years and unrealized appreciation or depreciation of securities and other investments for federal income tax purposes.
39 OPPENHEIMER ROCHESTER NEW JERSEY MUNICIPAL FUND
NOTES TO FINANCIAL STATEMENTS Continued
2. Significant Accounting Policies (Continued)
| | | | | | | | | | | | |
Undistributed
Net Investment
Income | | Undistributed
Long-Term
Gain | | | Accumulated
Loss
Carryforward1,2,3 | | | Net Unrealized
Depreciation
Based on cost of
Securities and
Other Investments
for Federal Income
Tax Purposes | |
| |
$3,791,313 | | | $— | | | | $163,242,995 | | | | $29,389,453 | |
1. At period end, the Fund had $163,242,995 of net capital loss carryforward available to offset future realized capital gains, if any, and thereby reduce future taxable gain distributions. Details of the capital loss carryforwards are included in the table below. Capital loss carryovers with no expiration, if any, must be utilized prior to those with expiration dates.
| | | | |
| Expiring | | | |
| |
2016 | | $ | 1,484,285 | |
2017 | | | 18,113,753 | |
2018 | | | 22,257,929 | |
No expiration | | | 121,387,028 | |
| | | | |
Total | | $ | 163,242,995 | |
| | | | |
2. During the reporting period, the Fund did not utilize any capital loss carryforward.
3. During the previous reporting period, the Fund did not utilize any capital loss carryforward.
Net investment income (loss) and net realized gain (loss) may differ for financial statement and tax purposes. The character of dividends and distributions made during the fiscal year from net investment income or net realized gains are determined in accordance with federal income tax requirements, which may differ from the character of net investment income or net realized gains presented in those financial statements in accordance with GAAP. Also, due to timing of dividends and distributions, the fiscal year in which amounts are distributed may differ from the fiscal year in which the income or net realized gain was recorded by the Fund.
Accordingly, the following amounts have been reclassified for the reporting period. Net assets of the Fund were unaffected by the reclassifications.
| | | | |
Increase
to Accumulated
Net Investment
Income | | Increase to Accumulated Net Realized Loss on Investments | |
| |
$219,831 | | | $219,831 | |
The tax character of distributions paid during the reporting periods:
| | | | | | | | |
| | | Year Ended
July 31, 2015 | | | Year Ended
July 31, 2014 | |
| |
Distributions paid from: | | | | | | | | |
Exempt-interest dividends | | $ | 22,711,443 | | | $ | 26,574,786 | |
Ordinary income | | | 419,254 | | | | 73,648 | |
| | | | |
Total | | $ | 23,130,697 | | | $ | 26,648,434 | |
| | | | |
40 OPPENHEIMER ROCHESTER NEW JERSEY MUNICIPAL FUND
2. Significant Accounting Policies (Continued)
The aggregate cost of securities and other investments and the composition of unrealized appreciation and depreciation of securities and other investments for federal income tax purposes at period end are noted in the following table. The primary difference between book and tax appreciation or depreciation of securities and other investments, if applicable, is attributable to the tax deferral of losses or tax realization of financial statement unrealized gain or loss.
| | | | |
Federal tax cost of securities | | $ | 460,931,6491 | |
| | | | |
| |
Gross unrealized appreciation | | $ | 22,862,490 | |
Gross unrealized depreciation | | | (52,251,943) | |
| | | | |
Net unrealized depreciation | | $ | (29,389,453) | |
| | | | |
1. The Federal tax cost of securities does not include cost of $22,200,000, which has otherwise been recognized for financial reporting purposes, related to bonds placed into trusts in conjunction with certain investment transactions. See the Inverse Floating Rate Securities note in Note 4.
Use of Estimates. The preparation of financial statements in conformity with accounting principles generally accepted in the United States of America requires management to make estimates and assumptions that affect the reported amounts of assets and liabilities and disclosure of contingent assets and liabilities at the date of the financial statements and the reported amounts of increases and decreases in net assets from operations during the reporting period. Actual results could differ from those estimates.
3. Securities Valuation
The Fund calculates the net asset value of its shares as of the close of the New York Stock Exchange (the “Exchange”), normally 4:00 P.M. Eastern time, on each day the Exchange is open for trading.
The Fund’s Board has adopted procedures for the valuation of the Fund’s securities and has delegated the day-to-day responsibility for valuation determinations under those procedures to the Manager. The Manager has established a Valuation Committee which is responsible for determining a “fair valuation” for any security for which market quotations are not “readily available.” The Valuation Committee’s fair valuation determinations are subject to review, approval and ratification by the Fund’s Board at its next regularly scheduled meeting covering the calendar quarter in which the fair valuation was determined.
Valuation Methods and Inputs
Securities are valued using unadjusted quoted market prices, when available, as supplied primarily by third party pricing services or dealers.
The following methodologies are used to determine the market value or the fair value of the types of securities described below:
Securities traded on a registered U.S. securities exchange (including exchange-traded derivatives other than futures and futures options) are valued based on the last sale price of the security reported on the principal exchange on which it is traded, prior to the time when
41 OPPENHEIMER ROCHESTER NEW JERSEY MUNICIPAL FUND
NOTES TO FINANCIAL STATEMENTS Continued
3. Securities Valuation (Continued)
the Fund’s assets are valued. In the absence of a sale, the security is valued at the last sale price on the prior trading day, if it is within the spread of the current day’s closing “bid” and “asked” prices, and if not, at the current day’s closing bid price. A security of a foreign issuer traded on a foreign exchange, but not listed on a registered U.S. securities exchange, is valued based on the last sale price on the principal exchange on which the security is traded, as identified by the third party pricing service used by the Manager, prior to the time when the Fund’s assets are valued. If the last sale price is unavailable, the security is valued at the most recent official closing price on the principal exchange on which it is traded. If the last sales price or official closing price for a foreign security is not available, the security is valued at the mean between the bid and asked price per the exchange or, if not available from the exchange, obtained from two dealers. If bid and asked prices are not available from either the exchange or two dealers, the security is valued by using one of the following methodologies (listed in order of priority): (1) using a bid from the exchange, (2) the mean between the bid and asked price as provided by a single dealer, or (3) a bid from a single dealer.
Shares of a registered investment company that are not traded on an exchange are valued at that investment company’s net asset value per share.
Corporate and government debt securities (of U.S. or foreign issuers) and municipal debt securities, event-linked bonds, loans, mortgage-backed securities, collateralized mortgage obligations, and asset-backed securities are valued at the mean between the “bid” and “asked” prices utilizing evaluated prices obtained from third party pricing services or broker-dealers who may use matrix pricing methods to determine the evaluated prices.
Short-term money market type debt securities with a remaining maturity of sixty days or less are valued at cost adjusted by the amortization of discount or premium to maturity (amortized cost), which approximates market value. Short-term debt securities with a remaining maturity in excess of sixty days are valued at the mean between the “bid” and “asked” prices utilizing evaluated prices obtained from third party pricing services or broker-dealers.
A description of the standard inputs that may generally be considered by the third party pricing vendors in determining their evaluated prices is provided below.
| | |
| Security Type | | Standard inputs generally considered by third-party pricing vendors |
| Corporate debt, government debt, municipal, mortgage-backed and asset-backed securities | | Reported trade data, broker-dealer price quotations, benchmark yields, issuer spreads on comparable securities, the credit quality, yield, maturity, and other appropriate factors. |
| Loans | | Information obtained from market participants regarding reported trade data and broker-dealer price quotations. |
| Event-linked bonds | | Information obtained from market participants regarding reported trade data and broker-dealer price quotations. |
If a market value or price cannot be determined for a security using the methodologies described above, or if, in the “good faith” opinion of the Manager, the market value or price obtained does not constitute a “readily available market quotation,” or a significant event has occurred that would materially affect the value of the security, the security is fair valued either (i) by a standardized fair valuation methodology applicable to the security type or the
42 OPPENHEIMER ROCHESTER NEW JERSEY MUNICIPAL FUND
3. Securities Valuation (Continued)
significant event as previously approved by the Valuation Committee and the Fund’s Board or (ii) as determined in good faith by the Manager’s Valuation Committee. The Valuation Committee considers all relevant facts that are reasonably available, through either public information or information available to the Manager, when determining the fair value of a security. Fair value determinations by the Manager are subject to review, approval and ratification by the Fund’s Board at its next regularly scheduled meeting covering the calendar quarter in which the fair valuation was determined. Those fair valuation standardized methodologies include, but are not limited to, valuing securities at the last sale price or initially at cost and subsequently adjusting the value based on: changes in company specific fundamentals, changes in an appropriate securities index, or changes in the value of similar securities which may be further adjusted for any discounts related to security-specific resale restrictions. When possible, such methodologies use observable market inputs such as unadjusted quoted prices of similar securities, observable interest rates, currency rates and yield curves. The methodologies used for valuing securities are not necessarily an indication of the risks associated with investing in those securities nor can it be assured that the Fund can obtain the fair value assigned to a security if it were to sell the security.
To assess the continuing appropriateness of security valuations, the Manager, or its third party service provider who is subject to oversight by the Manager, regularly compares prior day prices, prices on comparable securities, and sale prices to the current day prices and challenges those prices exceeding certain tolerance levels with the third party pricing service or broker source. For those securities valued by fair valuations, whether through a standardized fair valuation methodology or a fair valuation determination, the Valuation Committee reviews and affirms the reasonableness of the valuations based on such methodologies and fair valuation determinations on a regular basis after considering all relevant information that is reasonably available.
Classifications
Each investment asset or liability of the Fund is assigned a level at measurement date based on the significance and source of the inputs to its valuation. Various data inputs are used in determining the value of each of the Fund’s investments as of the reporting period end. These data inputs are categorized in the following hierarchy under applicable financial accounting standards:
1) Level 1-unadjusted quoted prices in active markets for identical assets or liabilities (including securities actively traded on a securities exchange)
2) Level 2-inputs other than unadjusted quoted prices that are observable for the asset or liability (such as unadjusted quoted prices for similar assets and market corroborated inputs such as interest rates, prepayment speeds, credit risks, etc.)
3) Level 3-significant unobservable inputs (including the Manager’s own judgments about assumptions that market participants would use in pricing the asset or liability).
The inputs used for valuing securities are not necessarily an indication of the risks associated with investing in those securities.
43 OPPENHEIMER ROCHESTER NEW JERSEY MUNICIPAL FUND
NOTES TO FINANCIAL STATEMENTS Continued
3. Securities Valuation (Continued)
The table below categorizes amounts that are included in the Fund’s Statement of Assets and Liabilities at period end based on valuation input level:
| | | | | | | | | | | | | | | | |
| | | Level 1—
Unadjusted
Quoted Prices | | | Level 2— Other Significant
Observable Inputs | | | Level 3—
Significant
Unobservable
Inputs | | | Value | |
| |
Assets Table | | | | | | | | | | | | | | | | |
Investments, at Value: | | | | | | | | | | | | | | | | |
Municipal Bonds and Notes | | | | | | | | | | | | | | | | |
New Jersey | | $ | — | | | $ | 307,806,258 | | | $ | — | | | $ | 307,806,258 | |
New York | | | — | | | | 31,609,508 | | | | — | | | | 31,609,508 | |
U.S. Possessions | | | — | | | | 114,326,430 | | | | — | | | | 114,326,430 | |
| | | | |
Total Assets | | $ | — | | | $ | 453,742,196 | | | $ | — | | | $ | 453,742,196 | |
| | | | |
Forward currency exchange contracts and futures contracts, if any, are reported at their unrealized appreciation/depreciation at measurement date, which represents the change in the contract’s value from trade date. All additional assets and liabilities included in the above table are reported at their market value at measurement date.
4. Investments and Risks
Inverse Floating Rate Securities. The Fund invests in inverse floating rate securities that pay interest at a rate that varies inversely with short-term interest rates. Because inverse floating rate securities are leveraged instruments, the value of an inverse floating rate security will change more significantly in response to changes in interest rates and other market fluctuations than the market value of a conventional fixed-rate municipal security of similar maturity and credit quality, including the municipal bond underlying an inverse floating rate security.
An inverse floating rate security is created as part of a financial transaction referred to as a “tender option bond” transaction. In most cases, in a tender option bond transaction the Fund sells a fixed-rate municipal bond (the “underlying municipal bond”) to a trust (the “Trust”). The Trust then issues and sells short-term floating rate securities with a fixed principal amount representing a senior interest in the underlying municipal bond to third parties and a residual, subordinate interest in the underlying municipal bond (referred to as an “inverse floating rate security”) to the Fund. The interest rate on the short-term floating rate securities resets periodically, usually weekly, to a prevailing market rate and holders of these securities are granted the option to tender their securities back to the Trust for repurchase at their principal amount plus accrued interest thereon (the “purchase price”) periodically, usually daily or weekly. A remarketing agent for the Trust is required to attempt to re-sell any tendered short-term floating rate securities to new investors for the purchase price. If the remarketing agent is unable to successfully re-sell the tendered short-term floating rate securities, a liquidity provider to the Trust must contribute cash to the Trust to ensure that the tendering holders receive the purchase price of their securities on the repurchase date.
Because holders of the short-term floating rate securities are granted the right to tender their securities to the Trust for repurchase at frequent intervals for the purchase price, with
44 OPPENHEIMER ROCHESTER NEW JERSEY MUNICIPAL FUND
4. Investments and Risks (Continued)
such payment effectively guaranteed by the liquidity provider, the securities generally bear short-term rates of interest commensurate with money market instruments. When interest is paid on the underlying municipal bond to the Trust, such proceeds are first used to pay the Trust’s administrative expenses and accrued interest to holders of the short-term floating rate securities, with any remaining amounts being paid to the Fund, as the holder of the inverse floating rate security. Accordingly, the amount of such interest on the underlying municipal bond paid to the Fund is inversely related the rate of interest on the short-term floating rate securities. Additionally, because the principal amount of the short-term floating rate securities is fixed and is not adjusted in response to changes in the market value of the underlying municipal bond, any change in the market value of the underlying municipal bond is reflected entirely in a change to the value of the inverse floating rate security.
Typically, the terms of an inverse floating rate security grant certain rights to the Fund, as holder. For example, the Fund typically has the right upon request to require that the Trust compel a tender of the short-term floating rate securities to facilitate the Fund’s acquisition of the underlying municipal bond. Following such a request, the Fund pays the Trust the purchase price of the short-term floating rate securities and a specified portion of any market value gain on the underlying municipal bond since its deposit into the Trust, which the Trust uses to redeem the short-term floating rate securities. The Trust then distributes the underlying municipal bond to the Fund. Through the exercise of this right, the Fund can voluntarily terminate or “collapse” the Trust, terminate its investment in the related inverse floating rate security and obtain the underlying municipal bond. Additionally, the Fund also typically has the right to exchange with the Trust (i) a principal amount of short-term floating rate securities held by the Fund for a corresponding additional principal amount of the inverse floating rate security or (ii) a principal amount of the inverse floating rate security held by the Fund for a corresponding additional principal amount of short-term floating rate securities (which are typically then sold to other investors). Through the exercise of this right, the Fund may increase (or decrease) the principal amount of short-term floating rate securities outstanding, thereby increasing (or decreasing) the amount of leverage provided by the short-term floating rate securities to the Fund’s investment exposure to the underlying municipal bond.
The Fund’s investments in inverse floating rate securities involve certain risks. As short-term interest rates rise, an inverse floating rate security produces less current income (and, in extreme cases, may pay no income) and as short-term interest rates fall, an inverse floating rate security produces more current income. Thus, if short-term interest rates rise after the issuance of the inverse floating rate security, any yield advantage is reduced or eliminated. All inverse floating rate securities entail some degree of leverage represented by the outstanding principal amount of the related short-term floating rate securities, relative to the par value of the underlying municipal bond. The value of, and income earned on, an inverse floating rate security that has a higher degree of leverage will fluctuate more significantly in response to changes in interest rates and to changes in the market value of the related underlying municipal bond than that of an inverse floating rate security with a lower degree of leverage, and is more likely to be eliminated entirely under adverse market conditions. Changes in the value of an inverse floating rate security will also be more significant than changes in the
45 OPPENHEIMER ROCHESTER NEW JERSEY MUNICIPAL FUND
NOTES TO FINANCIAL STATEMENTS Continued
4. Investments and Risks (Continued)
market value of the related underlying municipal bond because the leverage provided by the related short-term floating rate securities increases the sensitivity of an inverse floating rate security to changes in interest rates and to the market value of the underlying municipal bond. An inverse floating rate security can be expected to underperform fixed-rate municipal bonds when the difference between long-term and short-term interest rates is decreasing (or is already small) or when long-term interest rates are rising, but can be expected to outperform fixed-rate municipal bonds when the difference between long-term and short-term interest rates is increasing (or is already large) or when long-term interest rates are falling. Additionally, a tender option bond transaction typically provides for the automatic termination or “collapse” of a Trust upon the occurrence of certain adverse events, usually referred to as “mandatory tender events” or “tender option termination events.” These events may include, among others, a credit ratings downgrade of the underlying municipal bond below a specified level, a decrease in the market value of the underlying municipal bond below a specified amount, a bankruptcy of the liquidity provider or the inability of the remarketing agent to re-sell to new investors short-term floating rate securities that have been tendered for repurchase by holders thereof. Following the occurrence of such an event, the underlying municipal bond is generally sold for current market value and the proceeds distributed to holders of the short-term floating rate securities and inverse floating rate security, with the holder of the inverse floating rate security (the Fund) generally receiving the proceeds of such sale only after the holders of the short-term floating rate securities have received proceeds equal to the purchase price of their securities (and the liquidity provider is generally required to contribute cash to the Trust only in an amount sufficient to ensure that the holders of the short-term floating rate securities receive the purchase price of their securities in connection with such termination of the Trust). Following the occurrence of such events, the Fund could potentially lose the entire amount of its investment in the inverse floating rate security.
Finally, the Fund may enter into shortfall/reimbursement agreements with the liquidity provider of certain tender option bond transactions in connection with certain inverse floating rate securities held by the Fund. These agreements commit the Fund to reimburse the liquidity provider to the extent that the liquidity provider must provide cash to a Trust, including following the termination of a Trust resulting from the occurrence of a “mandatory tender event.” In connection with the occurrence of such an event and the termination of the Trust triggered thereby, the shortfall/reimbursement agreement will make the Fund liable for the amount of the negative difference, if any, between the liquidation value of the underlying municipal bond and the purchase price of the short-term floating rate securities issued by the Trust. Under the standard terms of a tender option bond transaction, absent such a shortfall/reimbursement agreement, the Fund, as holder of the inverse floating rate security, would not be required to make such a reimbursement payment to the liquidity provider. The Manager monitors the Fund’s potential exposure with respect to these agreements on a daily basis and intends to take action to terminate the Fund’s investment in related inverse floating rate securities, if it deems it appropriate to do so.
When the Fund creates an inverse floating rate security in a tender option bond transaction by selling an underlying municipal bond to a Trust, the transaction is considered a
46 OPPENHEIMER ROCHESTER NEW JERSEY MUNICIPAL FUND
4. Investments and Risks (Continued)
secured borrowing for financial reporting purposes. As a result of such accounting treatment, the Fund includes the underlying municipal bond on its Statement of Investments and as an asset on its Statement of Assets and Liabilities (but does not separately include the related inverse floating rate security on either). The Fund also includes a liability on its Statement of Assets and Liabilities equal to the outstanding principal amount and accrued interest on the related short-term floating rate securities issued by the Trust. Interest on the underlying municipal bond is recorded as investment income on the Fund’s Statement of Operations, while interest payable on the related short-term floating rate securities is recorded as interest expense. At period end, municipal bond holdings with a value of $33,916,965 shown on the Fund’s Statement of Investments are held by such Trusts and serve as the underlying municipal bonds for the related $22,200,000 in short-term floating rate securities issued and outstanding at that date.
At period end, the inverse floating rate securities associated with tender option bond transactions accounted for as secured borrowings were as follows:
| | | | | | | | | | | | | | | | |
Principal
Amount | | | Inverse Floater1 | | Coupon
Rate2 | | | Maturity Date | | | Value | |
| | |
| | $ 1,880,000 | | | NJ Hsg. & Mtg. Finance Agency (Single Family Hsg.) Tender Option Bond Series 2015-XF0015 Trust | | | 7.326% | | | | 10/1/27 | | | $ | 1,952,643 | |
| | 665,000 | | | NJ Hsg. & Mtg. Finance Agency (Single Family Hsg.) ROLs | | | 7.976 | | | | 10/1/37 | | | | 683,806 | |
| | 2,625,000 | | | Port Authority NY/NJ, 143rd Series Tender Option Bond Series 2015-XF0032 Trust | | | 15.515 | | | | 10/1/30 | | | | 2,899,890 | |
| | 1,000,000 | | | Rutgers State University NJ ROLs | | | 18.478 | | | | 5/1/38 | | | | 1,493,480 | |
| | 1,585,000 | | | Rutgers State University NJ Tender Option Bond Series 2015-XF2105 Trust | | | 18.506 | | | | 5/1/29 | | | | 2,547,143 | |
| | 1,345,000 | | | Rutgers State University NJ ROLs | | | 18.478 | | | | 5/1/30 | | | | 2,140,003 | |
| | | | | | | | | | | | | | | | |
| | | | | | | | | | | | | | $ | 11,716,965 | |
| | | | | | | | | | | | | | | | |
1. For a list of abbreviations used in the Inverse Floater table see the Portfolio Abbreviations table at the end of the Statement of Investments.
2. Represents the current interest rate for the inverse floating rate security.
The Fund may also purchase an inverse floating rate security created as part of a tender option bond transaction not initiated by the Fund when a third party, such as a municipal issuer or financial institution, transfers an underlying municipal bond to a Trust. For financial reporting purposes, the Fund includes the inverse floating rate security related to such transaction on its Statement of Investments and as an asset on its Statement of Assets and Liabilities, and interest on the security is recorded as investment income on the Fund’s Statement of Operations.
The Fund may invest in inverse floating rate securities with any degree of leverage (as measured by the outstanding principal amount of related short-term floating rate securities). However, the Fund may only expose up to 20% of its total assets to the effects of leverage from its investments in inverse floating rate securities. This limitation is measured by comparing the aggregate principal amount of the short-term floating rate securities that are related to the inverse floating rate securities held by the Fund to the total assets of the Fund.
47 OPPENHEIMER ROCHESTER NEW JERSEY MUNICIPAL FUND
NOTES TO FINANCIAL STATEMENTS Continued
4. Investments and Risks (Continued)
The Fund’s exposure to the effects of leverage from its investments in inverse floating rate securities amounts to $22,200,000 or 4.77% of its total assets at period end.
Securities on a When-Issued or Delayed Delivery Basis. The Fund may purchase securities on a “when-issued” basis, and may purchase or sell securities on a “delayed delivery” basis. “When-issued” or “delayed delivery” refers to securities whose terms and indenture are available and for which a market exists, but which are not available for immediate delivery. Delivery and payment for securities that have been purchased by the Fund on a when-issued basis normally takes place within six months and possibly as long as two years or more after the trade date. During this period, such securities do not earn interest, are subject to market fluctuation and may increase or decrease in value prior to their delivery. The purchase of securities on a when-issued basis may increase the volatility of the Fund’s net asset value to the extent the Fund executes such transactions while remaining substantially fully invested. When the Fund engages in when-issued or delayed delivery transactions, it relies on the buyer or seller, as the case may be, to complete the transaction. Their failure to do so may cause the Fund to lose the opportunity to obtain or dispose of the security at a price and yield it considers advantageous. The Fund may also sell securities that it purchased on a when-issued basis or forward commitment prior to settlement of the original purchase.
At period end, the Fund had sold securities issued on a delayed delivery basis as follows:
| | | | |
| | | When-Issued or
Delayed Delivery
Basis Transactions | |
| |
Sold securities | | | $4,353,237 | |
Credit Risk. The Fund invests in high-yield, non-investment-grade bonds, which may be subject to a greater degree of credit risk. Credit risk relates to the ability of the issuer to meet interest or principal payments or both as they become due. The Fund may acquire securities that have missed an interest payment, and is not obligated to dispose of securities whose issuers or underlying obligors subsequently miss an interest payment. Information concerning securities not accruing interest at period end is as follows:
| | | | |
Cost | | | $5,413,956 | |
Market Value | | | $654,375 | |
Market Value as % of Net Assets | | | 0.15% | |
The Fund has entered into forbearance agreements with certain obligors under which the Fund has agreed to temporarily forego receipt of the original principal or coupon interest rates. At period end, securities with an aggregate market value of $9,283,191, representing 2.19% of the Fund’s net assets, were subject to these forbearance agreements.
Concentration Risk. There are certain risks arising from geographic concentration in any state, commonwealth or territory. Certain economic, regulatory or political developments occurring in the state, commonwealth or territory may impair the ability of certain issuers of municipal securities to pay principal and interest on their obligations.
48 OPPENHEIMER ROCHESTER NEW JERSEY MUNICIPAL FUND
5. Shares of Beneficial Interest
The Fund has authorized an unlimited number of no par value shares of beneficial interest of each class. Transactions in shares of beneficial interest were as follows:
| | | | | | | | | | | | | | | | |
| | | Year Ended July 31, 2015 | | | Year Ended July 31, 2014 | |
| | | Shares | | | Amount | | | Shares | | | Amount | |
| |
Class A | | | | | | | | | | | | | | | | |
Sold | | | 3,344,023 | | | $ | 32,873,200 | | | | 4,831,911 | | | $ | 45,374,472 | |
Dividends and/or distributions reinvested | | | 1,316,338 | | | | 12,909,781 | | | | 1,594,449 | | | | 14,986,662 | |
Redeemed | | | (8,063,759 | ) | | | (78,466,546 | ) | | | (13,134,106 | ) | | | (122,776,112) | |
| | | | |
Net decrease | | | (3,403,398 | ) | | $ | (32,683,565 | ) | | | (6,707,746 | ) | | $ | (62,414,978) | |
| | | | |
| | | | | | | | | | | | | | | | |
| |
Class B | | | | | | | | | | | | | | | | |
Sold | | | 5,480 | | | $ | 54,312 | | | | 22,237 | | | $ | 210,890 | |
Dividends and/or distributions reinvested | | | 20,687 | | | | 203,518 | | | | 32,070 | | | | 301,746 | |
Redeemed | | | (206,711 | ) | | | (2,025,639 | ) | | | (473,491 | ) | | | (4,438,209) | |
| | | | |
Net decrease | | | (180,544 | ) | | $ | (1,767,809 | ) | | | (419,184 | ) | | $ | (3,925,573) | |
| | | | |
| | | | | | | | | | | | | | | | |
| |
Class C | | | | | | | | | | | | | | | | |
Sold | | | 1,575,257 | | | $ | 15,542,186 | | | | 1,293,000 | | | $ | 12,097,191 �� | |
Dividends and/or distributions reinvested | | | 495,032 | | | | 4,859,117 | | | | 587,480 | | | | 5,528,467 | |
Redeemed | | | (2,691,822 | ) | | | (26,326,381 | ) | | | (5,286,801 | ) | | | (49,305,971) | |
| | | | |
Net decrease | | | (621,533 | ) | | $ | (5,925,078 | ) | | | (3,406,321 | ) | | $ | (31,680,313) | |
| | | | |
| | | | | | | | | | | | | | | | |
| |
Class Y | | | | | | | | | | | | | | | | |
Sold | | | 1,514,002 | | | $ | 14,876,443 | | | | 1,013,897 | | | $ | 9,661,643 | |
Dividends and/or distributions reinvested | | | 104,237 | | | | 1,022,254 | | | | 94,977 | | | | 894,210 | |
Redeemed | | | (1,558,998 | ) | | | (15,208,127 | ) | | | (1,077,140 | ) | | | (10,005,675) | |
| | | | |
Net increase | | | 59,241 | | | $ | 690,570 | | | | 31,734 | | | $ | 550,178 | |
| | | | |
6. Purchases and Sales of Securities
The aggregate cost of purchases and proceeds from sales of securities, other than short-term obligations, for the reporting period were as follows:
| | | | | | | | |
| | | Purchases | | | Sales | |
| |
Investment securities | | $ | 37,004,113 | | | $ | 91,623,526 | |
7. Fees and Other Transactions with Affiliates
Management Fees. Under the investment advisory agreement, the Fund pays the Manager a management fee based on the daily net assets of the Fund at an annual rate as shown in the following table:
49 OPPENHEIMER ROCHESTER NEW JERSEY MUNICIPAL FUND
NOTES TO FINANCIAL STATEMENTS Continued
7. Fees and Other Transactions with Affiliates (Continued)
| | | | |
| Fee Schedule | | | |
| |
Up to $200 million | | | 0.60% | |
Next $100 million | | | 0.55 | |
Next $200 million | | | 0.50 | |
Next $250 million | | | 0.45 | |
Next $250 million | | | 0.40 | |
Over $1 billion | | | 0.35 | |
The Fund’s effective management fee for the reporting period was 0.56% of average annual net assets before any applicable waivers.
Sub-Adviser Fees. The Manager has retained the Sub-Adviser to provide the day-to-day portfolio management of the Fund. Under the Sub-Advisory Agreement, the Manager pays the Sub-Adviser an annual fee in monthly installments, equal to a percentage of the investment management fee collected by the Manager from the Fund, which shall be calculated after any investment management fee waivers. The fee paid to the Sub-Adviser is paid by the Manager, not by the Fund.
Transfer Agent Fees. OFI Global (the “Transfer Agent”) serves as the transfer and shareholder servicing agent for the Fund. The Fund pays the Transfer Agent a fee based on annual net assets. Fees incurred and average net assets for each class with respect to these services are detailed in the Statement of Operations and Financial Highlights, respectively.
Sub-Transfer Agent Fees. The Transfer Agent has retained Shareholder Services, Inc., a wholly-owned subsidiary of OFI (the “Sub-Transfer Agent”), to provide the day-to-day transfer agent and shareholder servicing of the Fund. Under the Sub-Transfer Agency Agreement, the Transfer Agent pays the Sub-Transfer Agent an annual fee in monthly installments, equal to a percentage of the transfer agent fee collected by the Transfer Agent from the Fund, which shall be calculated after any applicable fee waivers. The fee paid to the Sub-Transfer Agent is paid by the Transfer Agent, not by the Fund.
Trustees’ Compensation. The Fund has adopted an unfunded retirement plan (the “Plan”) for the Fund’s Independent Trustees. Benefits are based on years of service and fees paid to each Trustee during their period of service. The Plan was frozen with respect to adding new participants effective December 31, 2006 (the “Freeze Date”) and existing Plan Participants as of the Freeze Date will continue to receive accrued benefits under the Plan. Active Independent Trustees as of the Freeze Date have each elected a distribution method with respect to their benefits under the Plan. During the reporting period, the Fund’s projected benefit obligations, payments to retired Trustees and accumulated liability were as follows:
| | | | |
Projected Benefit Obligations Increased | | $ | — | |
Payments Made to Retired Trustees | | | 5,096 | |
Accumulated Liability as of July 31, 2015 | | | 40,392 | |
The Fund’s Board of Trustees (“Board”) has adopted a compensation deferral plan for Independent Trustees that enables Trustees to elect to defer receipt of all or a portion of the
50 OPPENHEIMER ROCHESTER NEW JERSEY MUNICIPAL FUND
7. Fees and Other Transactions with Affiliates (Continued)
annual compensation they are entitled to receive from the Fund. For purposes of determining the amount owed to the Trustee under the plan, deferred amounts are treated as though equal dollar amounts had been invested in shares of the Fund or in other Oppenheimer funds selected by the Trustee. The Fund purchases shares of the funds selected for deferral by the Trustee in amounts equal to his or her deemed investment, resulting in a Fund asset equal to the deferred compensation liability. Such assets are included as a component of “Other” within the asset section of the Statement of Assets and Liabilities. Deferral of Trustees’ fees under the plan will not affect the net assets of the Fund and will not materially affect the Fund’s assets, liabilities or net investment income per share. Amounts will be deferred until distributed in accordance with the compensation deferral plan.
Distribution and Service Plan (12b-1) Fees. Under its General Distributor’s Agreement with the Fund, OppenheimerFunds Distributor, Inc. (the “Distributor”) acts as the Fund’s principal underwriter in the continuous public offering of the Fund’s classes of shares.
Service Plan for Class A Shares. The Fund has adopted a Service Plan (the “Plan”) for Class A shares pursuant to Rule 12b-1 under the 1940 Act. Under the Plan, the Fund reimburses the Distributor for a portion of its costs incurred for services provided to accounts that hold Class A shares. Reimbursement is made periodically at an annual rate of up to 0.15% of the daily net assets of Class A shares of the Fund. The Distributor currently uses all of those fees to pay dealers, brokers, banks and other financial institutions periodically for providing personal service and maintenance of accounts of their customers that hold Class A shares. Any unreimbursed expenses the Distributor incurs with respect to Class A shares in any fiscal year cannot be recovered in subsequent periods. Fees incurred by the Fund under the Plan are detailed in the Statement of Operations.
Distribution and Service Plans for Class B and Class C Shares. The Fund has adopted Distribution and Service Plans (the “Plans”) for Class B and Class C shares pursuant to Rule 12b-1 under the 1940 Act to compensate the Distributor for distributing those share classes, maintaining accounts and providing shareholder services. Under the Plans, the Fund pays the Distributor an annual asset-based sales charge of 0.75% on Class B and Class C shares’ daily net assets. The Fund also pays a service fee under the Plans at an annual rate of 0.15% of daily net assets. The Plans continue in effect from year to year only if the Fund’s Board of Trustees votes annually to approve their continuance at an in person meeting called for that purpose. Fees incurred by the Fund under the Plans are detailed in the Statement of Operations.
Sales Charges. Front-end sales charges and CDSC do not represent expenses of the Fund. They are deducted from the proceeds of sales of Fund shares prior to investment or from redemption proceeds prior to remittance, as applicable. The sales charges retained by the Distributor from the sale of shares and the CDSC retained by the Distributor on the redemption of shares is shown in the following table for the period indicated.
51 OPPENHEIMER ROCHESTER NEW JERSEY MUNICIPAL FUND
NOTES TO FINANCIAL STATEMENTS Continued
7. Fees and Other Transactions with Affiliates (Continued)
| | | | | | | | | | | | | | | | |
| Year Ended | | Class A Front-End Sales Charges
Retained by Distributor | | | Class A
Contingent
Deferred Sales Charges
Retained by
Distributor | | | Class B
Contingent
Deferred Sales Charges
Retained by
Distributor | | | Class C
Contingent
Deferred Sales Charges
Retained by
Distributor | |
July 31, 2015 | | | $62,712 | | | | $5,492 | | | | $11,043 | | | | $6,290 | |
8. Borrowings and Other Financing
Borrowings. The Fund can borrow money from banks in amounts up to one third of its total assets (including the amount borrowed) less all liabilities and indebtedness other than borrowings (meaning that the value of those assets must be at least 300% of the amount borrowed). The Fund can use those borrowings for investment-related purposes such as purchasing portfolio securities. The Fund also may borrow to meet redemption obligations or for temporary and emergency purposes. When the Fund invests borrowed money in portfolio securities, it is using a speculative investment technique known as leverage and changes in the value of the Fund’s investments will have a larger effect on its share price than if it did not borrow because of the effect of leverage.
The Fund can also use the borrowings for other investment-related purposes, including in connection with the Fund’s inverse floater investments as discussed in Note 4. The Fund may use the borrowings to reduce the leverage amount of, or unwind or “collapse” trusts that issued “inverse floaters” owned by the Fund, or in circumstances in which the Fund has entered into a shortfall and forbearance agreement with the sponsor of the inverse floater trust to meet the Fund’s obligation to reimburse the sponsor of the inverse floater for the difference between the liquidation value of the underlying bond and the amount due to holders of the short-term floating rate notes issued by the Trust. See the discussion in Note 4 (Inverse Floating Rate Securities) for additional information.
The Fund will pay interest and may pay other fees in connection with loans. If the Fund does borrow, it will be subject to greater expenses than funds that do not borrow. The interest on borrowed money and the other fees incurred in conjunction with loans are an expense that might reduce the Fund’s yield and return. Expenses incurred by the Fund with respect to interest on borrowings and commitment fees are disclosed separately or as other expenses on the Statement of Operations.
The Fund entered into a Revolving Credit and Security Agreement (the “Agreement”) with conduit lenders and Citibank N.A. which enables it to participate with certain other Oppenheimer funds in a committed, secured borrowing facility that permits borrowings of up to $2.5 billion, collectively, by the Oppenheimer Rochester Funds. To secure the loan, the Fund pledges investment securities in accordance with the terms of the Agreement. Securities held in collateralized accounts to cover these borrowings are noted in the Statement of Investments. Interest is charged to the Fund, based on its borrowings, at current commercial paper issuance rates (0.1925% at period end). The Fund pays additional fees monthly to its lender on its outstanding borrowings to manage and administer the facility and is allocated its pro-rata share of an annual structuring fee and ongoing commitment fees both of which are based on the total facility size. Total fees and interest that are included in expenses on the
52 OPPENHEIMER ROCHESTER NEW JERSEY MUNICIPAL FUND
8. Borrowings and Other Financing (Continued)
Fund’s Statement of Operations related to its participation in the borrowing facility during the reporting period equal 0.16% of the Fund’s average net assets on an annualized basis. The Fund has the right to prepay such loans and terminate its participation in the conduit loan facility at any time upon prior notice.
At period end, the Fund had borrowings outstanding at an interest rate of 0.1925%.
Details of the borrowings for the reporting period are as follows:
| | | | | | |
Average Daily Loan Balance | | $ | | | 8,357,534 | |
Average Daily Interest Rate | | | | | 0.169 | % |
Fees Paid | | $ | | | 1,066,532 | |
Interest Paid | | $ | | | 13,599 | |
Reverse Repurchase Agreements. The Fund may engage in reverse repurchase agreements. A reverse repurchase agreement is the sale of one or more securities to a counterparty at an agreed-upon purchase price with the simultaneous agreement to repurchase those securities on a future date at a higher repurchase price. The repurchase price represents the repayment of the purchase price and interest accrued thereon over the term of the repurchase agreement. The cash received by the Fund in connection with a reverse repurchase agreement may be used for investment-related purposes such as purchasing portfolio securities or for other purposes such as those described in the preceding “Borrowings” note.
The Fund entered into a Committed Repurchase Transaction Facility (the “Facility”) with J.P. Morgan Securities LLC (the “counterparty’) which enables it to participate with certain other Oppenheimer funds in a committed reverse repurchase agreement facility that permits aggregate outstanding reverse repurchase agreements of up to $750 million, collectively. Interest is charged to the Fund on the purchase price of outstanding reverse repurchase agreements at current LIBOR rates plus an applicable spread. The Fund is also allocated its pro-rata share of an annual structuring fee based on the total Facility size and ongoing commitment fees based on the total unused amount of the Facility. The Fund retains the economic exposure to fluctuations in the value of securities subject to reverse repurchase agreements under the Facility and therefore these transactions are considered secured borrowings for financial reporting purposes. The Fund also continues to receive the economic benefit of interest payments received on securities subject to reverse repurchase agreements, in the form of a direct payment from the counterparty. These payments are included in interest income on the Statement of Operations. Total fees and interest related to the Fund’s participation in the Facility during the reporting period are included in expenses on the Fund’s Statement of Operations and equal 0.07% of the Fund’s average net assets on an annualized basis.
The securities subject to reverse repurchase agreements under the Facility are valued on a daily basis. To the extent this value, after adjusting for certain margin requirements of the Facility, exceeds the cash proceeds received, the Fund may request the counterparty to return securities equal in margin value to this excess. To the extent that the cash proceeds received exceed the margin value of the securities subject to the transaction, the counterparty may request additional securities from the Fund. The Fund has the right to declare each
53 OPPENHEIMER ROCHESTER NEW JERSEY MUNICIPAL FUND
NOTES TO FINANCIAL STATEMENTS Continued
8. Borrowings and Other Financing (Continued)
Wednesday as the repurchase date for any outstanding reverse repurchase agreement upon delivery of advanced notification and may also recall any security subject to such a transaction by substituting eligible securities of equal or greater margin value according to the Facility’s terms.
The fund executed no transactions under the Facility during the year ended July 31, 2015
Details of reverse repurchase agreement transactions for the reporting period are as follows:
9. Pending Litigation
In 2009, several putative class action lawsuits were filed and later consolidated before the U.S. District Court for the District of Colorado against OppenheimerFunds, Inc. (“OFI”), OppenheimerFunds Distributor, Inc. (“OFDI”), and Oppenheimer Rochester California Municipal Fund, a fund advised by OFI Global Asset Management, Inc. and distributed by the Distributor (the “Defendant Fund”), in connection with the Defendant Fund’s investment performance. The plaintiffs asserted claims against OFI, OFDI and certain present and former trustees and officers of the Defendant Fund under the federal securities laws, alleging, among other things, that the disclosure documents of the Defendant Fund contained misrepresentations and omissions and the investment policies of the Defendant Fund were not followed. Plaintiffs in the suit filed an amended complaint and defendants filed a motion to dismiss. In 2011, the court issued an order which granted in part and denied in part the defendants’ motion to dismiss. In 2012, plaintiffs filed a motion, which defendants opposed, to certify a class and appoint class representatives and class counsel. In March 2015, the court granted plaintiffs’ motion for class certification. In May 2015, the U.S. Court of Appeals for the Tenth Circuit vacated the class certification order and remanded the matter to the district court for further proceedings. In July 2015, the district court held an evidentiary hearing on plaintiffs’ motion for class certification.
OFI and OFDI believe the suit is without merit; that it is premature to render any opinion as to the likelihood of an outcome unfavorable to them in the suit; and that no estimate can yet be made as to the amount or range of any potential loss. Furthermore, OFI believes that the suit should not impair the ability of OFI or OFDI to perform their respective duties to the Fund and that the outcome of the suit should not have any material effect on the operations of any of the Oppenheimer funds.
54 OPPENHEIMER ROCHESTER NEW JERSEY MUNICIPAL FUND
REPORT OF INDEPENDENT REGISTERED PUBLIC ACCOUNTING FIRM
The Board of Trustees and Shareholders of Oppenheimer Multi-States Municipal Trust:
We have audited the accompanying statement of assets and liabilities of Oppenheimer Rochester New Jersey Municipal Fund (a separate series of Oppenheimer Multi-State Municipal Trust), including the statement of investments, as of July 31, 2015, and the related statement of operations and cash flows for the year then ended, the statements of changes in net assets for each of the years in the two-year period then ended, and the financial highlights for each of the years or periods in the five-year period then ended. These financial statements and financial highlights are the responsibility of the Fund’s management. Our responsibility is to express an opinion on these financial statements and financial highlights based on our audits.
We conducted our audits in accordance with the standards of the Public Company Accounting Oversight Board (United States). Those standards require that we plan and perform the audit to obtain reasonable assurance about whether the financial statements and financial highlights are free of material misstatement. An audit includes examining, on a test basis, evidence supporting the amounts and disclosures in the financial statements. Our procedures included confirmation of securities owned as of July 31, 2015, by correspondence with the custodian and brokers, or by other appropriate auditing procedures where replies from brokers were not received. An audit also includes assessing the accounting principles used and significant estimates made by management, as well as evaluating the overall financial statement presentation. We believe that our audits provide a reasonable basis for our opinion.
In our opinion, the financial statements and financial highlights referred to above present fairly, in all material respects, the financial position of Oppenheimer Rochester New Jersey Municipal Fund as of July 31, 2015, the results of its operations and cash flows for the year then ended, the changes in its net assets for each of the years in the two-year period then ended, and the financial highlights for each of the years or periods in the five-year period then ended, in conformity with U.S. generally accepted accounting principles.
KPMG LLP
Denver, Colorado
September 28, 2015
55 OPPENHEIMER ROCHESTER NEW JERSEY MUNICIPAL FUND
FEDERAL INCOME TAX INFORMATION Unaudited
In early 2015, if applicable, shareholders of record received information regarding all dividends and distributions paid to them by the Fund during calendar year 2014.
None of the dividends paid by the Fund during the reporting period are eligible for the corporate dividend-received deduction. 98.19% of the dividends were derived from interest on municipal bonds and are not subject to federal income taxes. To the extent a shareholder is subject to any state or local tax laws, some or all of the dividends received may be taxable.
The foregoing information is presented to assist shareholders in reporting distributions received from the Fund to the Internal Revenue Service. Because of the complexity of the federal regulations which may affect your individual tax return and the many variations in state and local tax regulations, we recommend that you consult your tax advisor for specific guidance.
56 OPPENHEIMER ROCHESTER NEW JERSEY MUNICIPAL FUND
PORTFOLIO PROXY VOTING POLICIES AND PROCEDURES;
UPDATES TO STATEMENTS OF INVESTMENTS Unaudited
The Fund has adopted Portfolio Proxy Voting Policies and Procedures under which the Fund votes proxies relating to securities (“portfolio proxies”) held by the Fund. A description of the Fund’s Portfolio Proxy Voting Policies and Procedures is available (i) without charge, upon request, by calling the Fund toll-free at 1.800.CALL OPP (225.5677), (ii) on the Fund’s website at www.oppenheimerfunds.com, and (iii) on the SEC’s website at www.sec.gov. In addition, the Fund is required to file Form N-PX, with its complete proxy voting record for the 12 months ended June 30th, no later than August 31st of each year. The Fund’s voting record is available (i) without charge, upon request, by calling the Fund toll-free at 1.800.CALL OPP (225.5677), and (ii) in the Form N-PX filing on the SEC’s website at www.sec.gov.
The Fund files its complete schedule of portfolio holdings with the SEC for the first quarter and the third quarter of each fiscal year on Form N-Q. The Fund’s Form N-Q filings are available on the SEC’s website at www.sec.gov. Those forms may be reviewed and copied at the SEC’s Public Reference Room in Washington, D.C. Information on the operation of the Public Reference Room may be obtained by calling 1-800-SEC-0330.
Householding—Delivery of Shareholder Documents
This is to inform you about OppenheimerFunds’ “householding” policy. If more than one member of your household maintains an account in a particular fund, OppenheimerFunds will mail only one copy of the fund’s prospectus (or, if available, the fund’s summary prospectus), annual and semiannual report and privacy policy. The consolidation of these mailings, called householding, benefits your fund through reduced mailing expense, and benefits you by reducing the volume of mail you receive from OppenheimerFunds. Householding does not affect the delivery of your account statements.
Please note that we will continue to household these mailings for as long as you remain an OppenheimerFunds shareholder, unless you request otherwise. If you prefer to receive multiple copies of these materials, please call us at 1.800.CALL-OPP (225-5677). You may also notify us in writing or via email. We will begin sending you individual copies of the prospectus (or, if available, the summary prospectus), reports and privacy policy within 30 days of receiving your request to stop householding.
57 OPPENHEIMER ROCHESTER NEW JERSEY MUNICIPAL FUND
TRUSTEES AND OFFICERS Unaudited
| | |
Name, Position(s) Held with the
Fund, Length of Service, Year of
Birth | | Principal Occupation(s) During the Past 5 Years; Other Trusteeships/Directorships Held; Number of
Portfolios in the Fund Complex Currently Overseen |
| |
INDEPENDENT TRUSTEES | | The address of each Trustee in the chart below is 6803 S. Tucson Way, Centennial, Colorado 80112-3924. Each Trustee serves for an indefinite term, or until his or her resignation, retirement, death or removal. |
| |
Brian F. Wruble, Chairman of the Board of Trustees (Since 2007) and Trustee (since 2005) Year of Birth: 1943 | | Director and Vice Chairman of Community Foundation of the Florida Keys (non-profit) (since July 2012); Trustee of the Board of Trustees, The Jackson Laboratory (non-profit) (1991-2011 and since May 2014); Chairman Emeritus (since August 2011) of The Jackson Laboratory (non-profit); Director of Special Value Opportunities Fund, LLC (registered investment company) (affiliate of the Sub-Adviser’s parent company) (since September 2004); Member of Zurich Insurance Group’s Investment Management Advisory Council (insurance) (since 2004); Treasurer (since 2007) and Trustee of the Institute for Advanced Study (non-profit educational institute) (since May 1992); General Partner of Odyssey Partners, L.P. (hedge fund) (September 1995-December 2007); Special Limited Partner of Odyssey Investment Partners, LLC (private equity investment) (January 1999-September 2004). Oversees 53 portfolios in the OppenheimerFunds complex. Mr. Wruble has served on the Boards of certain Oppenheimer funds since April 2001, during which time he has become familiar with the Fund’s (and other Oppenheimer funds’) financial, accounting, regulatory and investment matters and has contributed to the Boards’ deliberations. |
| |
David K. Downes, Trustee (since 2007) Year of Birth: 1940 | | Director of THL Credit Inc. (since June 2009); Chief Executive Officer and Board Member of Community Capital Management (investment management company) (since January 2004); President of The Community Reinvestment Act Qualified Investment Fund (investment management company) (since 2004); Director of Actua Corporation (information technology company) (since October 2003); formerly, Independent Chairman GSK Employee Benefit Trust (April 2006-June 2013); Director of Correctnet (January 2006-2007); Independent Chairman of the Board of Trustees of Quaker Investment Trust (registered investment company) (2004-2007); Chief Operating Officer and Chief Financial Officer of Lincoln National Investment Companies, Inc. (subsidiary of Lincoln National Corporation, a publicly traded company) and Delaware Investments U.S., Inc. (investment management subsidiary of Lincoln National Corporation) (1993-2003); President, Chief Executive Officer and Trustee of Delaware Investment Family of Funds (1993-2003); President and Board Member of Lincoln National Convertible Securities Funds, Inc. and the Lincoln National Income Funds, TDC (1993-2003); Chairman and Chief Executive Officer of Retirement Financial Services, Inc. (registered transfer agent and investment adviser and subsidiary of Delaware Investments U.S., Inc.) (1993-2003); President and Chief Executive Officer of Delaware Service Company, Inc. (1995-2003); Chief Administrative Officer, Chief Financial Officer, Vice Chairman and Director of Equitable Capital Management Corporation (investment subsidiary of Equitable Life Assurance Society) (1985- 1992); Corporate Controller of Merrill Lynch Company (financial services holding company) (1977-1985); held the following positions at the Colonial Penn Group, Inc. (insurance company): Corporate Budget Director (1974-1977), Assistant Treasurer (1972-1974) and Director of Corporate Taxes (1969-1972); held the following positions at Price Waterhouse Company (financial services firm): Tax Manager (1967-1969), Tax Senior (1965-1967) and Staff Accountant (1963- 1965); United States Marine Corps (1957-1959). Oversees 53 portfolios in the |
58 OPPENHEIMER ROCHESTER NEW JERSEY MUNICIPAL FUND
| | |
| |
David K. Downes, Continued | | OppenheimerFunds complex. Mr. Downes has served on the Boards of certain Oppenheimer funds since December 2005, during which time he has become familiar with the Fund’s (and other Oppenheimer funds’) financial, accounting, regulatory and investment matters and has contributed to the Boards’ deliberations. |
| |
Matthew P. Fink, Trustee (since 2005) Year of Birth: 1941 | | Trustee of the Committee for Economic Development (policy research foundation) (2005-2011); Director of ICI Education Foundation (education foundation) (October 1991-August 2006); President of the Investment Company Institute (trade association) (October 1991-June 2004); Director of ICI Mutual Insurance Company (insurance company) (October 1991-June 2004); Author of The Rise of Mutual Funds: An Insider’s View published by Oxford University Press (second edition 2010). Oversees 53 portfolios in the OppenheimerFunds complex. Mr. Fink has served on the Boards of certain Oppenheimer funds since January 2005, during which time he has become familiar with the Fund’s (and other Oppenheimer funds’) financial, accounting, regulatory and investment matters and has contributed to the Boards’ deliberations. |
| |
Edmund P. Giambastiani, Jr., Trustee (since 2013) Year of Birth: 1948 | | Advisory Board Member of the Maxwell School of Citizenship and Public Affairs of Syracuse University (since April 2012); Director of Mercury Defense Systems Inc. (information technology) (August 2011-February 2013); Trustee of the U.S. Naval Academy Foundation (since November 2010); Advisory Board Member of the Massachusetts Institute of Technology Lincoln Laboratory (federally-funded research development center) (since May 2010); Director of The Boeing Company (aerospace and defense) (since October 2009); Trustee of MITRE Corporation (federally-funded research development center) (since September 2008); Independent Director of QinetiQ Group Plc (defense technology and security) (February 2008-August 2011); Director of Monster Worldwide, Inc. (on-line career services) (since January 2008, Lead Director since June 2011); Chairman of Alenia North America, Inc. (military and defense products) (January 2008-October 2009); Director of SRA International, Inc. (information technology and services) (January 2008-July 2011); President of Giambastiani Group LLC (national security and energy consulting) (since October 2007); United States Navy, career nuclear submarine officer (June 1970-October 2007), Vice Chairman of the Joint Chiefs of Staff (2005-October 2007), Supreme Allied Commander of NATO Commander Transformation (2003-2005), Commander, U.S. Joint Forces Command (2002- 2005). Since his retirement from the U.S. Navy in October 2007, Admiral Giambastiani has also served on numerous U.S. Government advisory boards, investigations and task forces for the Secretaries of Defense, State and Interior and the Central Intelligence Agency. Oversees 53 portfolios in the OppenheimerFunds complex. Admiral Giambastiani has served on the Boards of certain Oppenheimer funds since February 2013, including as an Advisory Board Member for certain Oppenheimer funds, during which time he has become familiar with the Fund’s (and other Oppenheimer funds’) financial, accounting, regulatory and investment matters and has contributed to the Boards’ deliberations. For purposes of this report, Admiral Giambastiani is identified as a Trustee. |
| |
Elizabeth Krentzman, Trustee (since 2014) Year of Birth: 1959 | | Advisory Board Member of the Securities and Exchange Commission Historical Society (since 2007); held the following positions at Deloitte & Touche LLP: Principal and Chief Regulatory Advisor for Asset Management Services (2007 - 2014) and U.S. Mutual Fund Leader (2011 - 2014); General Counsel of the Investment Company Institute (trade association) (June 2004 - April 2007); held |
59 OPPENHEIMER ROCHESTER NEW JERSEY MUNICIPAL FUND
TRUSTEES AND OFFICERS Unaudited / Continued
| | |
| |
Elizabeth Krentzman, Continued | | the following positions at Deloitte & Touche LLP: National Director of the Investment Management Regulatory Consulting Practice (1997 - 2004), Principal (2003 - 2004), Director (1998 - 2003) and Senior Manager (1997 - 1998); Assistant Director of the Division of Investment Management - Office of Disclosure and Investment Adviser Regulation (1996 - 1997) and various positions with the Division of Investment Management – Office of Regulatory Policy (1991 - 1996) of the U.S. Securities and Exchange Commission; Associate at Ropes & Gray (1987 - 1991); former Chair of the Investment Management Subcommittee of the Washington, D.C. Bar. Oversees 53 portfolios in the OppenheimerFunds complex. Ms. Krentzman has served on the Boards of certain Oppenheimer funds since August 2014, during which time she has become familiar with the Fund’s (and other Oppenheimer funds’) financial, accounting, regulatory and investment matters and has contributed to the Boards’ deliberations. |
| |
Mary F. Miller, Trustee (since 2004) Year of Birth: 1942 | | Trustee of International House (not-for-profit) (since June 2007); Trustee of the American Symphony Orchestra (not-for-profit) (October 1998-November 2011); and Senior Vice President and General Auditor of American Express Company (financial services company) (July 1998-February 2003). Oversees 53 portfolios in the OppenheimerFunds complex. Ms. Miller has served on the Boards of certain Oppenheimer funds since August 2004, during which time she has become familiar with the Fund’s (and other Oppenheimer funds’) financial, accounting, regulatory and investment matters and has contributed to the Boards’ deliberations. |
| |
Joel W. Motley, Trustee (since 2002) Year of Birth: 1952 | | Director of Greenwall Foundation (since October 2013); Member of the Vestry of Trinity Wall Street (since April 2012); Director of Southern Africa Legal Services Foundation (since March 2012); Board Member of Pulitzer Center for Crisis Reporting (non-profit journalism) (since March 2011); Managing Director of Public Capital Advisors, LLC (privately-held financial advisor) (since January 2006); Managing Director of Carmona Motley, Inc. (privately-held financial advisor) (since January 2002); Director of Columbia Equity Financial Corp. (privately-held financial advisor) (2002-2007); Managing Director of Carmona Motley Hoffman Inc. (privately-held financial advisor) (January 1998-December 2001); Member of the Finance and Budget Committee of the Council on Foreign Relations, Member of the Investment Committee and Board of Human Rights Watch (since July 2000) and Member of the Investment Committee and Board of Historic Hudson Valley (since February 2010). Oversees 53 portfolios in the OppenheimerFunds complex. Mr. Motley has served on the Boards of certain Oppenheimer funds since October 2002, during which time he has become familiar with the Fund’s (and other Oppenheimer funds’) financial, accounting, regulatory and investment matters and has contributed to the Boards’ deliberations. |
| |
Joanne Pace, Trustee (since 2012) Year of Birth: 1958 | | Board Director of Horizon Blue Cross Blue Shield of New Jersey (since November 2012); Advisory Board Director of The Alberleen Group LLC (since March, 2012); Advisory Council Member of 100 Women in Hedge Funds (non-profit) (since December, 2012); Advisory Council Member of Morgan Stanley Children’s Hospital (non-profit) (since May, 2012); Board Director of The Komera Project (non-profit) (since April, 2012); Advisory Board Director of The Agile Trading Group LLC (2012-2013); New York Advisory Board Director of Peace First (non-profit) (2010-2013); Senior Advisor of SECOR Asset Management, LP (2010- 2011); Managing Director and Chief Operating Officer of Morgan Stanley |
60 OPPENHEIMER ROCHESTER NEW JERSEY MUNICIPAL FUND
| | |
| |
Joanne Pace, Continued | | Investment Management (2006-2010); Partner and Chief Operating Officer of FrontPoint Partners, LLC (hedge fund) (2005-2006); held the following positions at Credit Suisse: Managing Director (2003-2005); Global Head of Human Resources and member of Executive Board and Operating Committee (2004- 2005), Global Head of Operations and Product Control (2003-2004); held the following positions at Morgan Stanley: Managing Director (1997-2003), Controller and Principal Accounting Officer (1999-2003); Chief Financial Officer (temporary assignment) for the Oversight Committee, Long Term Capital Management (1998-1999). Lead Independent Director and Chair of the Audit and Nominating Committee of The Global Chartist Fund, LLC of Oppenheimer Asset Management (2011-2012); Board Director of Managed Funds Association (2008-2010); Board Director of Morgan Stanley Foundation (2007-2010) and Investment Committee Chair (2008-2010). Oversees 53 portfolios in the OppenheimerFunds complex. Ms. Pace has served on the Boards of certain Oppenheimer funds since November 2012, including as an Advisory Board Member for certain Oppenheimer funds, during which time she has become familiar with the Fund’s (and other Oppenheimer funds’) financial, accounting, regulatory and investment matters and has contributed to the Board’s deliberations. For purposes of this report, Ms. Pace is identified as a Trustee. |
| |
Daniel Vandivort, Trustee (since 2014) Year of Birth: 1954 | | Chairman and Lead Independent Director/Trustee (March 2010-September 2014), Chairman of the Audit Committee (March 2009-September 2014) and Director/Trustee (December 2008-September 2014) of the Board of Directors/Trustees of Value Line Funds; Trustee, Board of Trustees of Huntington Disease Foundation of America (June 2007-December 2013): Trustee, Board of Trustees, RIM Retirement Savings Plan (2005-2007); President and Chief Investment Officer, Robeco Investment Management, formerly known as Weiss Peck and Greer (January 2005-June 2007); Member, Management Committee of Robeco Investment Management (2001-2007); Chairman and Trustee of the Board of Trustees of Weiss, Peck and Greer Funds (2004-2005); Managing Director and Head of Fixed Income, Weiss, Peck and Greer (November 1994- January 2005); Managing Director and Head of Fixed Income, CS First Boston Investment Management (January 1992-November 1994); Director, Global Product Development, First Boston Asset Management (November 1989-January 1992); Vice President, Fixed Income Sales, First Boston Corp. (May 1984- November 1989). Oversees 53 portfolios in the OppenheimerFunds complex. Mr. Vandivort has served on the Boards of certain Oppenheimer funds since 2014, during which time he has become familiar with the Fund’s (and other Oppenheimer funds’) financial, accounting, regulatory and investment matters and has contributed to the Boards’ deliberations. |
|
|
| |
| INTERESTED TRUSTEES | | Mr. Glavin is an “Interested Trustee” because he is affiliated with the Manager and the Sub-Adviser by virtue of his positions as director of the Sub-Adviser, and as a shareholder of the Sub-Adviser’s parent company. As a Trustee, he serves for an indefinite term, or until his resignation, retirement, death or removal. Mr. Glavin’s address is 225 Liberty Street, New York, New York 10281-1008. |
| |
| | Mr. Steinmetz is an “Interested Trustee” because he is affiliated with the Manager and the Sub-Adviser by virtue of his positions as Chairman of the Sub-Adviser and officer and director of the Manager. Both as a Trustee and as an officer, Mr. Steinmetz serves for an indefinite term, or until his resignation, retirement, death or removal. Mr. Steinmetz’s address is 225 Liberty Street, New York, New York 10281-1008. |
61 OPPENHEIMER ROCHESTER NEW JERSEY MUNICIPAL FUND
TRUSTEES AND OFFICERS Unaudited / Continued
| | |
| |
William F. Glavin, Jr., Trustee (since 2013) Year of Birth: 1958 | | Chairman of the Sub-Adviser (July 2014 -December 2014 and December 2009- December 2012) and Director of the Sub-Adviser (since January 2009); Chairman, Director and Chief Executive Officer (January 2013-June 2014) of the Manager; President of the Manager (January 2013-May 2013); Chief Executive Officer (January 2009-December 2012); President of the Sub-Adviser (May 2009- December 2012); Management Director (June 2009-June 2014), President (December 2009-June 2014) and Chief Executive Officer (January 2011-June 2014) of Oppenheimer Acquisition Corp. (“OAC”) (the Sub-Adviser’s parent holding company); Director of Oppenheimer Real Asset Management, Inc. (March 2010-June 2014); Executive Vice President (March 2006-February 2009) and Chief Operating Officer (July 2007-February 2009) of Massachusetts Mutual Life Insurance Company (OAC’s parent company); Director (May 2004-March 2006) and Chief Operating Officer and Chief Compliance Officer (May 2004- January 2005), President (January 2005-March 2006) and Chief Executive Officer (June 2005-March 2006) of Babson Capital Management LLC; Director (March 2005-March 2006), President (May 2003-March 2006) and Chief Compliance Officer (July 2005-March 2006) of Babson Capital Securities, Inc. (a broker-dealer); President (May 2003-March 2006) of Babson Investment Company, Inc.; Director (May 2004-August 2006) of Babson Capital Europe Limited; Director (May 2004-October 2006) of Babson Capital Guernsey Limited; Director (May 2004-March 2006) of Babson Capital Management LLC; Non-Executive Director (March 2005-March 2007) of Baring Asset Management Limited; Director (February 2005-June 2006) Baring Pension Trustees Limited; Director and Treasurer (December 2003-November 2006) of Charter Oak Capital Management, Inc.; Director (May 2006-September 2006) of C.M. Benefit Insurance Company; Director (May 2008-June 2009) and Executive Vice President (June 2007-July 2009) of C.M. Life Insurance Company; President (March 2006-May 2007) of MassMutual Assignment Company; Director (January 2005-December 2006), Deputy Chairman (March 2005-December 2006) and President (February 2005-March 2005) of MassMutual Holdings (Bermuda) Limited; Director (May 2008-June 2009) and Executive Vice President (June 2007-July 2009) of MML Bay State Life Insurance Company; Chief Executive Officer and President (April 2007-January 2009) of MML Distributors, LLC; and Chairman (March 2006-December 2008) and Chief Executive Officer (May 2007-December 2008) of MML Investors Services, Inc. An officer of 91 portfolios in the OppenheimerFunds complex. Mr. Glavin has served on the Boards of certain Oppenheimer funds since December 2009, during which time he has become familiar with the Fund’s (and other Oppenheimer funds’) financial, accounting, regulatory and investment matters and has contributed to the Boards’ deliberations |
| |
Arthur P. Steinmetz, Trustee (since 2015), President and Principal Executive Officer (since 2014) Year of Birth: 1958 | | Chairman of the Sub-Adviser (since January 2015); CEO and Chairman of the Manager (since July 2014), President of the Manager (since May 2013), a Director of the Manager (since January 2013), Director of the Sub-Adviser (since July 2014), President, Management Director and CEO of Oppenheimer Acquisition Corp. (the Sub-Adviser’s parent holding company) (since July 2014), and President and Director of OFI SteelPath, Inc. (since January 2013). Chief Investment Officer of the OppenheimerFunds advisory entities from (January 2013-December 2013); Executive Vice President of the Manager (January 2013-May 2013); Chief Investment Officer of the Sub-Adviser (October 2010-December 2012); Chief Investment Officer, Fixed-Income, of the Sub-Adviser (April 2009-October 2010); Executive Vice President of the Sub-Adviser (October |
62 OPPENHEIMER ROCHESTER NEW JERSEY MUNICIPAL FUND
| | |
| |
Arthur P. Steinmetz, Continued | | 2009-December 2012); Director of Fixed Income of the Sub-Adviser (January 2009-April 2009); and a Senior Vice President of the Sub-Adviser (March 1993- September 2009). An officer of 91 portfolios in the OppenheimerFunds complex. |
|
|
| |
| OFFICERS OF THE FUND | | The addresses of the Officers in the chart below are as follows: for Messrs. Loughran, Cottier, Willis, DeMitry, Camarella, Pulire, Stein, Gabinet, Mss. Sexton and Picciotto, 225 Liberty Street, New York, New York 10281-1008, for Mr. Wixted, 6803 S. Tucson Way, Centennial, Colorado 80112-3924. Each Officer serves for an indefinite term or until his or her resignation, retirement, death or removal. |
| |
Daniel G. Loughran, Vice President (since 2005) Year of Birth: 1963 | | Senior Vice President of the Sub-Adviser (since July 2007) and a Senior Portfolio Manager (since December 2001); Vice President of the Sub-Adviser (April 2001- June 2007) and a Portfolio Manager with the Sub-Adviser (December 1999- November 2001). Team Leader, a Senior Portfolio Manager, an officer and a trader for the Fund and other Oppenheimer funds. |
| |
Scott S. Cottier, Vice President (since 2005) Year of Birth: 1971 | | Vice President of the Sub-Adviser and a Senior Portfolio Manager (since September 2002). Portfolio Manager and trader at Victory Capital Management (1999-2002). Senior Portfolio Manager, an officer and a trader for the Fund and other Oppenheimer funds. |
| |
Troy E. Willis, Vice President (since 2005) Year of Birth: 1972 | | Vice President of the Sub-Adviser (since July 2009) and a Senior Portfolio Manager (since January 2006); Assistant Vice President of the Sub-Adviser (July 2005-June 2009). Portfolio Manager of the Sub-Adviser (June 2002-December 2005). Corporate Attorney for Southern Resource Group (June 1999-July 2001). Senior Portfolio Manager, an officer and a trader for the Fund and other Oppenheimer funds. |
| |
Mark R. DeMitry, Vice President (since 2009) Year of Birth: 1976 | | Vice President of the Sub-Adviser and a Senior Portfolio Manager (since July 2009); Associate Portfolio Manager of the Fund (September 2006- June 2009). Research Analyst of the Sub-Adviser (June 2003-September 2006) and a Credit Analyst of the Sub-Adviser (July 2001-May 2003). Senior Portfolio Manager, an officer and a trader for the Fund and other Oppenheimer funds. |
| |
Michael L. Camarella, Vice President (since 2009) Year of Birth: 1976 | | Vice President of the Sub-Adviser and a Senior Portfolio Manager (since January 2011); Assistant Vice President of the Sub-Adviser (July 2009-December 2010); Associate Portfolio Manager of the Sub-Adviser (January 2008-December 2010). Research Analyst of the Sub-Adviser (April 2006-December 2007) and a Credit Analyst of the Sub-Adviser (June 2003-March 2006). Senior Portfolio Manager, an officer and a trader for the Fund and other Oppenheimer funds. |
| |
Charles S. Pulire, Vice President (since 2011) Year of Birth: 1977 | | Vice President of the Sub-Adviser and a Senior Portfolio Manager (since February 2013); Assistant Vice President of the Sub-Adviser (December 2010-January 2013); Research Analyst of the Manager (February 2008-November 2010); Credit Analyst of the Sub-Adviser (May 2006-January 2008). Senior Portfolio Manager, an officer and a trader for the Fund and other Oppenheimer funds. |
| |
Richard A. Stein, Vice President (since 2007) Year of Birth: 1957 | | Director of the Rochester Credit Analysis team (since March 2004); Senior Vice President of the Sub-Adviser (since June 2011) and a Vice President of the Sub- Adviser (November 1997-May 2011); heads up the Rochester Credit Analysis team (since May 1993). |
63 OPPENHEIMER ROCHESTER NEW JERSEY MUNICIPAL FUND
TRUSTEES AND OFFICERS Unaudited / Continued
| | |
| |
Arthur S. Gabinet, Secretary and Chief Legal Officer (since 2011) Year of Birth: 1958 | | Executive Vice President, Secretary and General Counsel of the Manager (since January 2013); General Counsel OFI SteelPath, Inc. (since January 2013); Executive Vice President (May 2010-December 2012) and General Counsel (since January 2011) of the Sub-Adviser; General Counsel of the Distributor (since January 2011); General Counsel of Centennial Asset Management Corporation (January 2011-December 2012); Executive Vice President (January 2011- December 2012) and General Counsel of HarbourView Asset Management Corporation (since January 2011); Assistant Secretary (since January 2011) and Director (since January 2011) of OppenheimerFunds International Ltd. and OppenheimerFunds plc; Director of Oppenheimer Real Asset Management, Inc. (January 2011-December 2012) and General Counsel (since January 2011); Executive Vice President (January 2011-December 2011) and General Counsel of Shareholder Financial Services, Inc. and Shareholder Services, Inc. (since January 2011); Executive Vice President (January 2011-December 2012) and General Counsel of OFI Private Investments Inc. (since January 2011); Vice President of OppenheimerFunds Legacy Program (January 2011-December 2011); Executive Vice President (January 2011-December 2012) and General Counsel of OFI Institutional Asset Management, Inc. (since January 2011); General Counsel, Asset Management of the Sub-Adviser (May 2010-December 2010); Principal, The Vanguard Group (November 2005-April 2010); District Administrator, U.S. Securities and Exchange Commission (January 2003-October 2005). An officer of 91 portfolios in the OppenheimerFunds complex. |
| |
Jennifer Sexton, Vice President and Chief Business Officer (since 2014) Year of Birth: 1969 | | Senior Vice President of OppenheimerFunds Distributor, Inc. (since June 2014); Vice President of OppenheimerFunds Distributor, Inc. (April 2006-June 2014); Vice President of the Sub-Adviser (January 1998-March 2006); Assistant Vice President of the Sub-Adviser (October 1991-December 1998). An officer of 91 portfolios in the OppenheimerFunds complex. |
| |
Mary Ann Picciotto, Chief Compliance Officer and Chief Anti-Money Laundering Officer (since 2014) Year of Birth: 1973 | | Senior Vice President and Chief Compliance Officer of the Manager (since March 2014); Chief Compliance Officer of the Sub-Adviser, OFI SteelPath, Inc., OFI Global Trust Company, OFI Global Institutional, Inc., Oppenheimer Real Asset Management, Inc., OFI Private Investments, Inc., Harborview Asset Management Corporation, Trinity Investment Management Corporation, and Shareholder Services, Inc. (since March 2014); Managing Director of Morgan Stanley Investment Management Inc. and certain of its various affiliated entities; Chief Compliance Officer of various Morgan Stanley Funds (May 2010-January 2014); Chief Compliance Officer of Morgan Stanley Investment Management Inc. (April 2007-January 2014). An officer of 91 portfolios in the OppenheimerFunds complex. |
| |
Brian W. Wixted, Treasurer and Principal Financial & Accounting Officer (since 2007) Year of Birth: 1959 | | Senior Vice President of the Manager (since January 2013); Treasurer of the Sub- Adviser, HarbourView Asset Management Corporation, Shareholder Financial Services, Inc., Shareholder Services, Inc., and Oppenheimer Real Asset Management, Inc. (March 1999-June 2008), OFI Private Investments, Inc. (March 2000-June 2008), OppenheimerFunds International Ltd. and OppenheimerFunds plc (since May 2000), OFI Institutional Asset Management, Inc. (November 2000- June 2008), and OppenheimerFunds Legacy Program (charitable trust program established by the Sub-Adviser) (June 2003-December 2011); Treasurer and Chief Financial Officer of OFI Trust Company (since May 2000); Assistant Treasurer of Oppenheimer Acquisition Corporation (March 1999-June 2008). An officer of 91 portfolios in the OppenheimerFunds complex. |
64 OPPENHEIMER ROCHESTER NEW JERSEY MUNICIPAL FUND
The Fund’s Statement of Additional Information contains additional information about the Fund’s Trustees and Officers and is available without charge upon request, by calling 1.800.CALL OPP (225.5677).
65 OPPENHEIMER ROCHESTER NEW JERSEY MUNICIPAL FUND
OPPENHEIMER ROCHESTER NEW JERSEY MUNICIPAL FUND
| | |
| Manager | | OFI Global Asset Management, Inc. |
| |
| Sub-Adviser | | OppenheimerFunds, Inc. |
| |
| Distributor | | OppenheimerFunds Distributor, Inc. |
| |
| Transfer and Shareholder Servicing Agent | | OFI Global Asset Management, Inc. |
| |
| Sub-Transfer Agent | | Shareholder Services, Inc. DBA OppenheimerFunds Services |
| |
| Independent Registered Public Accounting Firm | | KPMG LLP |
| |
| Legal Counsel | | Kramer Levin Naftalis & Frankel LLP |
© 2015 OppenheimerFunds, Inc. All rights reserved.
66 OPPENHEIMER ROCHESTER NEW JERSEY MUNICIPAL FUND
PRIVACY POLICY NOTICE
As an Oppenheimer fund shareholder, you are entitled to know how we protect your personal information and how we limit its disclosure.
Information Sources
We obtain nonpublic personal information about our shareholders from the following sources:
| ● | | Applications or other forms |
| ● | | When you create a user ID and password for online account access |
| ● | | When you enroll in eDocs Direct, our electronic document delivery service |
| ● | | Your transactions with us, our affiliates or others |
| ● | | A software program on our website, often referred to as a “cookie,” which indicates which parts of our site you’ve visited |
| ● | | When you set up challenge questions to reset your password online |
If you visit oppenheimerfunds.com and do not log on to the secure account information areas, we do not obtain any personal information about you. When you do log on to a secure area, we do obtain your user ID and password to identify you. We also use this information to provide you with products and services you have requested, to inform you about products and services that you may be interested in and assist you in other ways.
We do not collect personal information through our website unless you willingly provide it to us, either directly by email or in those areas of the website that request information. In order to update your personal information (including your mailing address, email address and phone number) you must first log on and visit your user profile.
If you have set your browser to warn you before accepting cookies, you will receive the warning message with each cookie. You can refuse cookies by turning them off in your browser. However, doing so may limit your access to certain sections of our website.
We use cookies to help us improve and manage our website. For example, cookies help us recognize new versus repeat visitors to the site, track the pages visited, and enable some special features on the website. This data helps us provide a better service for our website visitors.
Protection of Information
We do not disclose any non-public personal information (such as names on a customer list) about current or former customers to anyone, except as permitted by law.
Disclosure of Information
Copies of confirmations, account statements and other documents reporting activity in your fund accounts are made available to your financial advisor (as designated by you). We may also use details about you and your investments to help us, our financial service affiliates, or firms that jointly market their financial products and services with ours, to better serve your investment needs or suggest financial services or educational material that may be of interest to you. If this requires us to provide you with an opportunity to “opt in” or “opt out” of such information sharing with a firm not affiliated with us, you will receive notification on how to do so, before any such sharing takes place.
Right of Refusal
We will not disclose your personal information to unaffiliated third parties (except as permitted by law), unless we first offer you a reasonable opportunity to refuse or “opt out” of such disclosure.
67 OPPENHEIMER ROCHESTER NEW JERSEY MUNICIPAL FUND
PRIVACY POLICY NOTICE Continued
Internet Security and Encryption
In general, the email services provided by our website are encrypted and provide a secure and private means of communication with us. To protect your own privacy, confidential and/or personal information should only be communicated via email when you are advised that you are using a secure website. As a security measure, we do not include personal or account information in non-secure emails, and we advise you not to send such information to us in non-secure emails. Instead, you may take advantage of the secure features of our website to encrypt your email correspondence. To do this, you will need to use a browser that supports Secure Sockets Layer (SSL) protocol.
We do not guarantee or warrant that any part of our website, including files available for download, are free of viruses or other harmful code. It is your responsibility to take appropriate precautions, such as use of an anti-virus software package, to protect your computer hardware and software.
| ● | | All transactions, including redemptions, exchanges and purchases, are secured by SSL and 256-bit encryption. SSL is used to establish a secure connection between your PC and OppenheimerFunds’ server. It transmits information in an encrypted and scrambled format. |
| ● | | Encryption is achieved through an electronic scrambling technology that uses a “key” to code and then decode the data. Encryption acts like the cable converter box you may have on your television set. It scrambles data with a secret code so that no one can make sense of it while it is being transmitted. When the data reaches its destination, the same software unscrambles the data. |
| ● | | You can exit the secure area by either closing your browser, or for added security, you can use the Log Out button before you close your browser. |
Other Security Measures
We maintain physical, electronic and procedural safeguards to protect your personal account information. Our employees and agents have access to that information only so that they may offer you products or provide services, for example, when responding to your account questions.
How You Can Help
You can also do your part to keep your account information private and to prevent unauthorized transactions. If you obtain a user ID and password for your account, do not allow it to be used by anyone else. Also, take special precautions when accessing your account on a computer used by others.
Who We Are
This joint notice describes the privacy policies of the Oppenheimer funds, OppenheimerFunds, Inc., each of its investment adviser subsidiaries, OppenheimerFunds Distributor, Inc. and OFI Global Trust Co. It applies to all Oppenheimer fund accounts you presently have, or may open in the future, using your Social Security number—whether or not you remain a shareholder of our funds. This notice was last updated March 2015. In the event it is updated or changed, we will post an updated notice on our website at oppenheimerfunds.com. If you have any questions about this privacy policy, write to us at P.O. Box 5270, Denver, CO 80217-5270, email us by clicking on the Contact Us section of our website at oppenheimerfunds.com or call us at 1.800.CALL OPP (225.5677).
68 OPPENHEIMER ROCHESTER NEW JERSEY MUNICIPAL FUND
THIS PAGE INTENTIONALLY LEFT BLANK.
69 OPPENHEIMER ROCHESTER NEW JERSEY MUNICIPAL FUND
THIS PAGE INTENTIONALLY LEFT BLANK.
70 OPPENHEIMER ROCHESTER NEW JERSEY MUNICIPAL FUND
THIS PAGE INTENTIONALLY LEFT BLANK.
71 OPPENHEIMER ROCHESTER NEW JERSEY MUNICIPAL FUND

Class A Shares
AVERAGE ANNUAL TOTAL RETURNS AT 7/31/15
| | | | | | | | |
| | | Class A Shares of the Fund | | | | |
| | | Without Sales Charge | | With Sales Charge | | Barclays Municipal
Bond Index | | |
1-Year | | 6.98% | | 1.89% | | 3.56% | | |
| | |
5-Year | | 5.08 | | 4.07 | | 4.39 | | |
| | |
10-Year | | 3.72 | | 3.22 | | 4.57 | | |
| | |
Performance data quoted represents past performance, which does not guarantee future results. The investment return and principal value of an investment in the Fund will fluctuate so that an investor’s shares, when redeemed, may be worth more or less than their original cost. Fund returns include changes in share price, reinvested distributions, and a 4.75% maximum applicable sales charge except where “without sales charge” is indicated. Current performance may be lower or higher than the performance quoted. Returns do not consider capital gains or income taxes on an individual’s investment. For performance data current to the most recent month-end, visit oppenheimerfunds.com or call 1.800.CALL OPP (225.5677).
Oppenheimer Rochester is using social media to provide timely information related to muni market developments at www.twitter.com/RochesterFunds.
2 OPPENHEIMER ROCHESTER PENNSYLVANIA MUNICIPAL FUND
Fund Performance Discussion
Amid low interest rates and coverage that we believe was often narrowly focused on the market’s challenges, Oppenheimer Rochester Pennsylvania Municipal Fund delivered high levels of tax-free income in the 12 months ended July 31, 2015, and outperformed its benchmark, the Barclays Municipal Bond Index. The distribution yield of the Class A shares was 5.89% (without sales charge) and produced an annual total return of 6.98% (without sales charge), beating its benchmark by 342 basis points for the 12-month period ended July 31, 2015. During this reporting period, tax-free income provided approximately 85% of the Fund’s total return.
MARKET OVERVIEW
Yields on high-grade municipal bonds rose during this reporting period as the market continued to anticipate changes to the Fed Funds target rate. Since October 2014, when the Federal Open Market Committee (FOMC) voted to end its program of purchasing mortgage-backed securities and long-term Treasuries in an effort to stimulate the economy (quantitative easing), speculation about the Fed’s plans often triggered movements in the equity and bond markets.
Near the end of this reporting period, Federal Reserve Chairman Janet Yellen told the U.S. Congress that improving economic conditions “would likely make it appropriate for the
|
The average distribution yield in Pennsylvania Municipal Debt Funds category was 3.44% at the end of this reporting period. At 5.89%, the distribution yield at NAV for this Fund’s Class A shares was 245 basis points higher than the category average. |
central bank to raise rates at some point this year,” assuming the labor market continues to advance.
While not definitive by any measure, the statement was more specific than earlier announcements from the Fed. For example, in October 2014, the FOMC said it planned to
| | | | | | | | |
| | | | | | | | | |
| | | |
YIELDS & DISTRIBUTIONS FOR CLASS A SHARES | | | | | | | | |
| | | |
Dividend Yield w/o sales charge | | | 5.89 | % | | | | |
| | | |
Dividend Yield with sales charge | | | 5.61 | | | | | |
| | | |
Standardized Yield | | | 5.51 | | | | | |
| | | |
Taxable Equivalent Yield | | | 10.07 | | | | | |
| | | |
Last distribution (7/28/15) | | $ | 0.0510 | | | | | |
| | | |
Total distributions (8/1/14 to 7/31/15) | | $ | 0.6120 | | | | | |
| | | |
| Endnotes for this discussion begin on page 18 of this report | | | | | | | | |
3 OPPENHEIMER ROCHESTER PENNSYLVANIA MUNICIPAL FUND
keep the Fed Funds target rate at its current level “for a considerable time” after the end of its bond-buying program. According to a statement released November 19, 2014, the FOMC observed solid job gains, a lower unemployment rate and increases in household and business spending. The committee’s concerns about inflation and falling energy prices, among other factors, played into its decision to “maintain its existing policy of reinvesting principal payments from its holdings of agency debt and agency mortgage-backed securities and rolling over maturing Treasury securities at auction.”
In December 2014, the committee said it could “be patient in beginning to normalize the stance of monetary policy,” but the word “patient” did not appear in the minutes of the February 2015 meeting. In a press conference after the February meeting, Ms. Yellen cautioned that “just because we removed the word ‘patient’ doesn’t mean we will be impatient.” Fed officials also stated in February that “the committee will increase the Fed Funds rate only when it has seen further improvement in the labor market and is reasonably confident that inflation will move back to its 2% objective over the medium term.”
By late April, the Fed had removed all calendar-based language relating to possible rate increases, citing a “transitory” decline in output and employment during the first quarter of 2015 with declines in energy prices and non-energy imports keeping inflation low.
In a speech after the May 2015 FOMC meeting, Ms. Yellen said, “If the economy continues to improve as I expect, I think it will be appropriate at some point this year to take the initial step to raise the Federal Funds rate target and begin the process of normalizing monetary policy.”
With the current Fed Funds rate set between zero and 0.25% since December 2008, the only plausible change would be an increase. We remind investors that a change in the Fed Funds rate does not automatically translate into a change in longer-term interest rates, which are determined by the marketplace.
The Fund’s investment team will continue to search for value in the muni market as it seeks to produce competitive levels of tax-free income amid stable or changing market conditions.
As of July 31, 2015, the average yield on 30-year, AAA-rated muni bonds was 4.53%, up 109 basis points from July 31, 2014. The average yield on 10-year, AAA-rated muni bonds was 2.40% on July 31, 2015, up 18 basis points from the July 2014 date, and the average yield on 1-year, AAA-rated muni bonds was 0.37%, up 22 basis points from the July 2014 date.
Pennsylvania elected Tom Wolf as its new governor in November 2014, a result that signaled the electorate’s discontent with the economy and the leadership of the incumbent, Tom Corbett. Gov. Wolf promptly declined to take a salary and benefits.
4 OPPENHEIMER ROCHESTER PENNSYLVANIA MUNICIPAL FUND
He inherited the $29 billion fiscal 2015 budget that was passed in July 2014 and 2.2% larger than the fiscal 2014 budget. The new spending plan called for increased funding for education and early childhood development.
The 2016 budget, due on July 1, 2015, was passed by the legislature on time but vetoed by Gov. Wolf, who favors raising personal income and sales taxes, reducing property taxes and imposing a severance tax on Marcellus shale natural gas drilling. The Republican-crafted budget called for no tax rate changes and included proposals to privatize the state-run liquor stores and offer new state hires a 401(k)-style defined contribution plan, instead of a conventional defined-benefit pension plan. The governor is opposed to all such proposals. As of July 31, 2015, Pennsylvania did not have a signed budget for fiscal 2016.
The nation’s leading credit rating agencies have cited Pennsylvania’s pension headaches and budget imbalance in recent downgrades. Standard & Poor’s downgraded Pennsylvania’s general obligation (G.O.) debt three times this reporting period, bringing Pennsylvania’s rating to AA-minus by the end of the reporting period. Fitch Ratings also downgraded the G.O. debt to AA-minus, while Moody’s Investors Service downgraded the debt to Aa3.
During this reporting period, legislators agreed to limit how long a distressed municipality could be afforded protection under Act 47, a state-sponsored workout program established in 1987. In Harrisburg, a former Act 47
municipality, Mayor Eric Papenfuse signed a restructuring agreement in January 2015 for debt related to the Verizon Tower, a 12-story downtown building that was to be leased for use by more than 800 Department of General Services workers. The settlement was expected to reduce the city’s total debt service to about $18 million.
In April 2015 Gov. Wolf announced an investment of $130.7 million for 12 drinking water and wastewater projects across eight counties through the Pennsylvania Infrastructure Investment Authority (Pennvest).
Successful investors, we have found, maintain a long-term perspective regardless of the specific developments associated with any given reporting period. To maximize the benefits that municipal bond funds seek to provide, many investors reinvest their dividends and allow the income generated from their investments to compound over time.
FUND PERFORMANCE
Oppenheimer Rochester Pennsylvania Municipal Fund held more than 290 securities as of July 31, 2015. The Fund was invested in a broad range of sectors, providing shareholders with a diversity of holdings that we believe would be difficult and costly to replicate in an individual portfolio.
The Fund’s Class A distribution yield at NAV was the second highest in Lipper’s Pennsylvania Municipal Debt Funds category as of July 31, 2015, trailing only the
5 OPPENHEIMER ROCHESTER PENNSYLVANIA MUNICIPAL FUND
distribution yield of this Fund’s Y shares. At 5.89% on that date, it was 245 basis points higher than the category average, which was 3.44%. Additionally, for Pennsylvania residents in the top bracket for federal and state income taxes, a taxable investment with a July 2015 yield of less than 10.07% would not have delivered as much after-tax income as the Class A shares of this Fund. As long-time investors know, yields on fixed-income funds rise when share prices fall, and yields have historically contributed the lion’s share of the long-term total returns generated by bonds.
The Fund’s dividend trend this reporting period demonstrates the power a yield-driven approach can have amid challenging market conditions. This Fund’s Class A dividend remained steady at 5.1 cents per share throughout this reporting period. In all, the Fund distributed 61.2 cents per Class A share this reporting period.
Municipal bonds backed by proceeds from the tobacco Master Settlement Agreement (the MSA), the national litigation settlement with U.S. tobacco manufacturers, represented 23.4% of the Fund’s total assets (24.0% of net assets) at the end of this reporting period. Bonds were issued in the Commonwealth of Puerto Rico, the U.S. Virgin Islands and Guam and contributed positively to the Fund’s performance.
We believe the securities we hold in this sector are fundamentally sound credits, and we like that “tobacco bonds” can provide tax-exempt
income for investors as well as benefits to the issuing states and territories. Our long-term view of the sector remains bullish and, given attractive valuations, we believe that it is likely we will continue to hold a greater percentage of tobacco bonds in our portfolios than our peers. As in prior reporting periods, the tobacco bonds this Fund held during this reporting period made all scheduled payments of interest and principal on time and in full.
As of July 31, 2015, 13.0% of the Fund’s total assets (13.3% of net assets) were invested in the higher education sector. The bonds we hold in this sector, some of which were issued in Puerto Rico, have regularly provided high levels of tax-free income with what we believe to be far less credit risk than their external ratings would suggest. Investments in this sector contributed positively to the Fund’s performance this reporting period.
Securities issued in the Commonwealth of Puerto Rico, which are exempt from federal, state and local income taxes, represented 12.8% of the Fund’s total assets (13.2% of net assets) at the end of this reporting period. Puerto Rico’s “tobacco bonds” are excluded from this figure, as they are backed by proceeds from the tobacco MSA and included in this Fund’s tobacco holdings. The Fund’s holdings, some of which are insured, include G.O. debt and securities from many different sectors. Most of the Fund’s investments in securities issued in Puerto Rico are supported by taxes and other revenues and are designed to help finance electric utilities, highways and education, among other things.
6 OPPENHEIMER ROCHESTER PENNSYLVANIA MUNICIPAL FUND
The Rochester Portfolio Management Team

During this reporting period, the government agreed to raise its sales tax rate to 11.5%, from 7.0%. By April 1, 2016, the sales tax will be replaced by a value-added tax (VAT), which is expected to lead to higher tax revenues for the Commonwealth.
News from the Commonwealth that it had once again passed a balanced budget was tempered by the sudden announcement by Governor Alejandro García Padilla in late June 2015 that Puerto Rico was not able to pay its
debts. A government-commissioned study known as the Krueger Report reached a similar conclusion. Investors should note that the report is unaudited and does not compel the administration to implement the report’s recommendations.
The $9.8 billion budget for fiscal year 2016 includes approximately $1 billion to cover the Commonwealth’s G.O. debt-service obligations. Operational spending totals about $8.3 billion. The legislature also created a
7 OPPENHEIMER ROCHESTER PENNSYLVANIA MUNICIPAL FUND
The Rochester Credit Research Team

8 OPPENHEIMER ROCHESTER PENNSYLVANIA MUNICIPAL FUND
$275 million special fund from the Government Development Bank’s allocation to cover debt obligations and economic development. With the lowest operational spending level in at least 10 years, the budget reduces the operational budgets of most government agencies by 2% to 3% versus fiscal year 2015, which ended June 30, 2015. Nonprofits that provide essential social services had their budgets decreased by no more than 10%.
A decision that we believe has important implications for the muni industry – and our funds in particular – was announced earlier in the reporting period: On February 6, 2015, a federal judge ruled that the Puerto Rico Public Corporation Debt Enforcement and Recovery Act (the “Recovery Act”) violated the U.S. Constitution and was invalid. As you may recall, the Recovery Act was passed in late June 2014 and the Oppenheimer Rochester municipal bond funds filed suit immediately, challenging the legislation that was designed to allow PREPA (the island’s electric utility authority), PRASA (the aqueduct and sewer authority) and PRHTA (the highway authority) to restructure their debt under the supervision of a Commonwealth court. On July 6, 2015, a federal appeals court unanimously affirmed the earlier decision.
The forbearance agreement that was reached in August 2014 between PREPA and many of its creditors, including this Fund, was extended several times beyond March 31, 2015, its initial expiration date. In the agreement, now set to expire September 15, 2015, the
bondholders have agreed to forbear from exercising rights in connection with events that would constitute a default on PREPA bonds, and PREPA had agreed to a variety of financial terms and to submit a 5-year restructuring plan. PREPA made a full $415 million bond payment on July 1, 2015 and promised to reach a comprehensive restructuring plan with its creditors by September 1, 2015. PREPA’s payment was among more than $1 billion in transfers made by Puerto Rico public entities, as money came due at the start of the Commonwealth’s new fiscal year, July 1, 2015.
We are encouraged by the government’s efforts to reduce spending and increase revenue. We continue to believe that Puerto Rico must act within the tenets of the law, including its Constitution. Questions about the degree to which Puerto Rico and its agencies and authorities are committed to honoring their debt-service obligations created significant pressure on the prices of their securities, especially in the latter months of this reporting period. As a result, the Fund’s Puerto Rico holdings in aggregate had a negative impact on the Fund’s total return.
Our investment team’s commitment to protecting the interests of our shareholders is unwavering. Investors should note that deterioration of the Puerto Rican economy could have an adverse impact on Puerto Rico bonds and the performance of the Oppenheimer Rochester municipal funds that hold them, including this Fund. We will continue to monitor credit rating changes and
9 OPPENHEIMER ROCHESTER PENNSYLVANIA MUNICIPAL FUND
other developments related to our Puerto Rico holdings closely.
Given the degree to which Oppenheimer Rochester funds have been cited in news coverage about the economic and fiscal challenges facing Puerto Rico, we feel compelled to remind investors that all fund investments are actively managed. Our team is responsive to the dynamics of the market and may choose to adjust trading strategies in the interest of maximizing the potential benefits to our shareholders. Further, while we remain committed to keeping investors informed about our basic investing strategies, we do not provide comment about near-term trading strategies as we believe doing so might allow other market participants to impair our team’s ability to deliver shareholder value.
Update (as of September 21, 2015): In the weeks that followed the end of this reporting period, several developments in Puerto Rico and decisions by its agencies and officials kept the Commonwealth in the spotlight. For example, of the four Puerto Rico bond issuers that had payments due on August 3, 2015, three made their payments on time and in full; the Puerto Rico Finance Corporation (PFC) did not.
The PFC’s bond covenant called for a $58 million payment of principal and interest on August 3. Instead, a payment of $628,000 was made to PFC bondholders, a group that includes individual Americans on the mainland and in the Commonwealth, Puerto Rican credit unions, and Oppenheimer Rochester municipal
bond funds and other retail municipal bond funds, among others. Prior to August 3, prices of PFC bonds fell sharply, a signal that the market had anticipated this default; as of this update, these securities continued to trade in the teens.
As long-time investors know, net asset values (NAVs) of municipal bond funds are adjusted daily based on a third party’s pricing of all bonds in the marketplace. Thus, the NAVs of our funds, many of which have invested in the Commonwealth and its agencies and government instrumentalities, reflect all price changes. In light of the non-payment by the PFC, investors should expect volatility in the prices of PFC bonds and other bonds issued by the Commonwealth.
We note that two issuers of revenue-backed bonds – the Puerto Rico Sales Tax Financing Corporation (COFINA) and the Puerto Rico Municipal Finance Agency (MFA) – met their August 3, 2015 debt-service obligations on time and in full.
The COFINA bonds, which are backed by sales tax revenue, are held by several of the Oppenheimer Rochester funds. The MFA bonds – which are backed by ad valorem taxes that are based on the assessed value of real estate, personal property and/or the duty levied on imported items – also paid their bondholders, including Oppenheimer Rochester funds. We believe that the legal protections for the COFINA bonds and Puerto Rico’s general obligation (G.O.) debt are
10 OPPENHEIMER ROCHESTER PENNSYLVANIA MUNICIPAL FUND
strong, and many of our funds have overweight positions in these bonds.
Also on August 3, 2015, the Government Development Bank for Puerto Rico (GDB) made loan payments to banks that totaled approximately $140 million.
Later in the month, on August 21, 2015, the Commonwealth petitioned the U.S. Supreme Court to overturn a federal district court ruling, which had been affirmed on appeal, related to the Recovery Act: that the Act violated the U.S. Constitution and was invalid. In its petition, the Commonwealth argues that Puerto Rico’s issuers should have the right to restructure their debt pursuant to the terms set forth in the Commonwealth’s Recovery Act. As bondholders, we see things differently: The Commonwealth and its issuers agreed to specific and carefully constructed bond covenants when they sold securities, and the contracts should be honored. Our team remains ready to defend the terms of our investments’ bond indentures.
On September 1, 2015, just prior to the expiration of the forbearance agreement, PREPA and the forbearing bondholders reached an agreement in principle on the major financial terms of a securitization transaction to lower PREPA’s debt service costs. Although the proposed agreement would result in a reduction in the par value of PREPA’s existing bonds, we nevertheless believe the agreement – if implemented – will be a win for bondholders.
Investors should note that the new bond structure would be bankruptcy remote, which serves to protect bondholders from event risks; that the term sheet requires that the new securitization bonds earn an investment-grade rating; that the deal requires high participation by all bondholders, and that insurers reach agreement with PREPA on the treatment of the insured bonds. If all goes as planned, bondholders will face neither the risks and uncertainties related to any inefficiency in PREPA’s operations nor the costs that would mount should any future litigation be required. While we expect that all parties will work toward a restructuring support agreement, we remind investors that there is no guarantee of either a timeline or implementation.
The forbearance agreement with bondholders, which has been extended repeatedly since first signed in August 2014 and was set to expire September 18, 2015, was extended on that date to October 1, 2015. However, PREPA did not secure an extension from its bond insurers, a group that guarantees $2.5 billion of the utility’s debt. According to PREPA’s chief restructuring officer, negotiations with the bond insurers will continue.
After a week-long delay that officials said was caused by Hurricane Erika, the Working Group that had been charged by the governor to deliver a 5-Year Fiscal Plan by September 1, 2015, handed in its plan. Like the government-commissioned Krueger Report that preceded it, the Working Group’s plan included a lengthy roster of policy changes and austerity measures designed to resolve
11 OPPENHEIMER ROCHESTER PENNSYLVANIA MUNICIPAL FUND
some of the Commonwealth’s financial difficulties. Politicians, including some candidates for the presidency, have voiced concerns about the current circumstances in Puerto Rico, and we believe the situation will remain political in the near term. In fact, many of the recommendations would require action by the U.S. Congress or the Puerto Rico Legislature. Even if all the recommendations were implemented, the plan indicated that Puerto Rico would still face a $14 billion financing gap between 2016 and 2020. In the weeks following the release of the plan, leading market analysts raised what we believe to be substantive questions about the accuracy of many of the plan’s figures.
Investors should note that the plan also seeks to reduce and/or restructure some of Puerto Rico’s debt. In a televised address, the governor said, “The plan itself will not get us out of the hole we find ourselves in. It’s time that creditors come to the table and share in the sacrifice.” We continue to believe that Puerto Rico must act within the tenets of the law, including its Constitution.
Separately, it is noteworthy that PRASA, the water utility, had announced plans to issue $750 million in bonds. Originally slated for August 25, 2015, the offering has since been revised to provide greater bondholder protections and higher initial yields and, as of this writing, was listed as “day-to-day.” PRASA’s ability to cut expenses and reduce its debt service obligations helped the utility achieve stronger-than-expected results for fiscal year 2015 despite lower-than-expected
revenue, according to results released in September.
The Oppenheimer Rochester team has been an active participant in negotiations with Puerto Rico officials, and shareholders should be confident that we will continue to work to protect our shareholders’ rights and best interests.
As of July 31, 2015, the Fund’s investments in the student housing sector represented 8.9% of the Fund’s total assets (9.1% of net assets). We like that the nation’s colleges and universities have a reliable student population, giving this sector a clear sense of its revenue stream. This sector contributed positively to the Fund’s performance this reporting period.
As of July 31, 2015, the Fund was invested in the hospital/healthcare sector, which represented 8.5% of total assets (8.7% of net assets). Our holdings in this sector consist of securities across the credit spectrum, but most are investment grade. Based on market value at the end of this reporting period, the two bonds in this sector that were issued in Puerto Rico represented less than 1.5% of the sector’s holdings and contributed positively to the Fund’s performance, as did the sector as a whole.
The Fund’s holdings in municipal bonds issued by utilities represented 8.4% of total assets (8.6% of net assets) at the end of this reporting period. This set of holdings included electric utilities with 4.4% of total assets (4.5% of net assets), sewer utilities with 2.1%
12 OPPENHEIMER ROCHESTER PENNSYLVANIA MUNICIPAL FUND
of total assets (2.1% of net assets), and water utilities with 1.9% of total assets (2.0% of net assets) as of July 31, 2015. Based on market value at the end of this reporting period, securities issued by PRASA represented about 45% of the Fund’s holdings in the sewer utilities sector and securities issued by PREPA represented about 70% of the electric utilities sector. Our holdings in these sectors consist of securities in the mid-range of the credit spectrum and all of the Fund’s utility sectors contributed positively to performance this reporting period. Investors should note that the Fund’s PRASA and PREPA holdings were among the positive contributors to the Fund’s total return.
G.O. securities, which are backed by the full faith and taxing authority of state and local governments, comprised 5.9% of total assets (6.1% of net assets) as of July 31, 2015. Within this sector the Fund holds bonds issued in various U.S. municipalities, including the Commonwealth of Puerto Rico and the Northern Mariana Islands. Investments in this sector detracted from the Fund’s overall performance this reporting period, driven in part by the performance of Puerto Rico’s G.O.s.
As of July 31, 2015, 5.8% of the Fund’s total assets (6.0% of net assets) were invested in the education sector. Bonds in this sector primarily finance the infrastructure needs of a variety of charter schools around the state. Investments in this sector contributed positively to the Fund’s performance this reporting period.
The sales tax sector represented 3.9% of the Fund’s total assets (4.0% of net assets) as of July 31, 2015. All holdings in this sector were issued in Puerto Rico and the sector was a detractor to Fund performance this reporting period.
The Fund continued to be invested in the highways/commuter facilities sector this reporting period, which represented 3.4% of total assets (3.5% of net assets) as of July 31, 2015. The bonds in this sector, some of which were issued in Puerto Rico, are used to build and maintain roadways and highway amenities. This sector contributed positively to the Fund’s performance.
Several sectors in which the Fund maintained relatively smaller investments as of July 31, 2015, contributed positively to performance. Investors benefited this reporting period from the Fund’s holdings in the tax increment financing (TIF), adult living facilities, marine/aviation, multifamily housing, municipal leases and non-profit organizations sectors.
Several of the Fund’s smallest sectors detracted from the Fund’s performance this reporting period, including the energy and equipment services sector and the government appropriations sector.
During this reporting period, the Fund maintained an investment in municipal inverse-floating rate securities, which are tax-exempt securities with interest payments that move inversely to changes in short-term
13 OPPENHEIMER ROCHESTER PENNSYLVANIA MUNICIPAL FUND
interest rates. “Inverse floaters” continued to provide high levels of income to funds across the industry during this reporting period and contributed positively to this Fund’s performance. We continue to believe that “inverse floaters” are an essential element of this Fund’s portfolio because they can produce attractive yields under certain market conditions.
Our approach to municipal bond investing is flexible and responsive to market conditions. Shareholders should note that market conditions during this reporting period did not affect the Fund’s overall investment goals or cause it to pay any capital gain distributions. In closing, we believe that the Fund’s structure and sector composition as well as our time-tested strategies will continue to benefit fixed-income investors through interest rate and economic cycles.
INVESTMENT STRATEGY
The Rochester investment team focuses exclusively on municipal bonds and has consistently used a time-tested, value-oriented and security-specific approach to fund management. We know that market conditions can and do fluctuate, but we do not waver in our belief in the power of tax-free yield to help investors achieve their long-term objectives.
This Fund invests primarily in investment-grade municipal securities. It may invest up to 25% of its total assets in below-investment grade securities, or “junk” bonds; the percentage of assets is measured at the time of purchase as
is the credit quality of the securities. Additionally, the credit quality is based on Nationally Recognized Statistical Rating Organization (“NRSRO”) ratings or, if no NRSRO rating, on internal ratings. As of July 31, 2015, market movements or rating changes of municipal bonds, notably the Fund’s investments in Puerto Rico paper, caused the Fund’s below-investment-grade holdings to exceed this threshold. As a result, no further purchases of below-investment-grade bonds will be made until the Fund’s holdings of these types of bonds is once again below 25% of total assets.
Our team continually searches for bonds that we believe are undervalued and can provide a meaningful level of tax-free income until maturity. Rather than making allocation shifts based on expected market conditions, we search the marketplace for what we believe to be the best values for generating income. It remains important to note that we do not manage our funds based on predictions of interest rate changes.
Instead, our investment approach involves scouring the market for municipal securities that meet our stringent credit criteria and buying bonds that we believe will deliver above-average yields relative to peer funds. We focus on identifying inefficiencies in market pricing that can lead to investment advantages. We seek to maintain a thoughtful mix of industry sectors, maturities and credit ratings in this Fund’s portfolio.
14 OPPENHEIMER ROCHESTER PENNSYLVANIA MUNICIPAL FUND
The Rochester team also prospects for yield-enhancing opportunities in the secondary market, often picking up odd lots that we believe can add significant incremental yield to our portfolios. We will also look for non-rated issues with solid credit qualities, which we believe can often help enhance a fund’s tax-free yield. Investors should note that non-rated or unrated securities may or may not be the equivalent of investment grade securities.
The Rochester Way, we believe, distinguishes our approach to municipal investing from those of our competitors.


Daniel G. Loughran,
Senior Vice President, Senior Portfolio Manager and Team Leader, on behalf of the rest of the Rochester portfolio management team: Scott S. Cottier, Troy E. Willis, Mark R. DeMitry, Michael L. Camarella, Charles S. Pulire and Elizabeth S. Mossow.
15 OPPENHEIMER ROCHESTER PENNSYLVANIA MUNICIPAL FUND
Top Holdings and Allocations
TOP TEN CATEGORIES
| | | | |
Tobacco Master Settlement Agreement | | | 23.4% | |
Higher Education | | | 13.0 | |
Housing - Student | | | 8.9 | |
Hospital/Healthcare | | | 8.5 | |
General Obligation | | | 5.9 | |
Education | | | 5.8 | |
Electric Utilities | | | 4.4 | |
Sales Tax Revenue | | | 3.9 | |
Highways/Commuter Facilities | | | 3.4 | |
Tax Increment Financing (TIF) | | | 3.1 | |
Portfolio holdings and allocations are subject to change. Percentages are as of July 31, 2015, and are based on total assets.
CREDIT ALLOCATION
| | | | | | | | | | | | |
| | | NRSRO-
Rated | | | Sub-
Adviser-
Rated | | | Total | |
AAA | | | 0.0% | | | | 0.3% | | | | 0.3% | |
AA | | | 12.4 | | | | 1.4 | | | | 13.8 | |
A | | | 12.3 | | | | 0.0 | | | | 12.3 | |
BBB | | | 37.0 | | | | 6.1 | | | | 43.1 | |
BB or lower | | | 24.2 | | | | 6.3 | | | | 30.5 | |
Total | | | 85.9% | | | | 14.1% | | | | 100.0% | |
The percentages above are based on the market value of the securities as of July 31, 2015, and are subject to change. OppenheimerFunds, Inc. determines the credit allocation of the Fund’s assets using ratings by nationally recognized statistical rating organizations (NRSROs), such as Standard & Poor’s. For any security rated by an NRSRO other than S&P, the sub-adviser, OppenheimerFunds, Inc., converts that security’s rating to the equivalent S&P rating. If two or more NRSROs have assigned a rating to a security, the highest rating is used. For securities not rated by an NRSRO, the sub-adviser uses its own credit analysis to assign ratings in categories similar to those of S&P. The use of similar categories is not an indication that the sub-adviser’s credit analysis process is consistent or comparable with any NRSRO’s process were that NRSRO to rate the same security.
For the purposes of this Credit Allocation table, securities rated within the NRSROs’ four highest categories—AAA, AA, A and BBB—are investment-grade securities. For further details, please consult the Fund’s prospectus or Statement of Additional Information.
16 OPPENHEIMER ROCHESTER PENNSYLVANIA MUNICIPAL FUND
Performance
DISTRIBUTION YIELDS
As of 7/31/15
| | | | | | | | |
| | | Without Sales
Charge | | | | With Sales
Charge | | |
Class A | | 5.89% | | | | 5.61% | | |
Class B | | 5.01 | | | | N/A | | |
Class C | | 5.03 | | | | N/A | | |
Class Y | | 6.05 | | | | N/A | | |
STANDARDIZED YIELDS
For the 30 Days Ended 7/31/15
| | | | |
Class A | | 5.51% | | |
Class B | | 5.02 | | |
Class C | | 5.03 | | |
Class Y | | 5.92 | | |
TAXABLE EQUIVALENT YIELDS
As of 7/31/15
| | | | | | |
Class A | | | 10.07 | % | | |
Class B | | | 9.18 | | | |
Class C | | | 9.20 | | | |
Class Y | | | 10.82 | | | |
AVERAGE ANNUAL TOTAL RETURNS WITHOUT SALES CHARGE AS OF 7/31/15
| | | | | | | | | | | | | | | | | | |
| | | Inception Date | | | 1-Year | | | 5-Year | | | 10-Year | | | Since Inception |
Class A (OPATX) | | | 9/18/89 | | | | 6.98% | | | | 5.08% | | | | 3.72% | | | 5.66% |
Class B (OPABX) | | | 5/3/93 | | | | 6.27 | | | | 4.26 | | | | 3.22 | | | 4.82 |
Class C (OPACX) | | | 8/29/95 | | | | 6.19 | | | | 4.30 | | | | 2.94 | | | 4.36 |
Class Y (OPAYX) | | | 11/29/10 | | | | 7.23 | | | | N/A | | | | N/A | | | 5.76 |
AVERAGE ANNUAL TOTAL RETURNS WITH SALES CHARGE AS OF 7/31/15
| | | | | | | | | | | | | | | | | | |
| | | Inception Date | | | 1-Year | | | 5-Year | | | 10-Year | | | Since Inception |
Class A (OPATX) | | | 9/18/89 | | | | 1.89% | | | | 4.07% | | | | 3.22% | | | 5.46% |
Class B (OPABX) | | | 5/3/93 | | | | 1.27 | | | | 3.93 | | | | 3.22 | | | 4.82 |
Class C (OPACX) | | | 8/29/95 | | | | 5.19 | | | | 4.30 | | | | 2.94 | | | 4.36 |
Class Y (OPAYX) | | | 11/29/10 | | | | 7.23 | | | | N/A | | | | N/A | | | 5.76 |
17 OPPENHEIMER ROCHESTER PENNSYLVANIA MUNICIPAL FUND
COMPARISON OF CHANGE IN VALUE OF $10,000 HYPOTHETICAL INVESTMENTS IN:
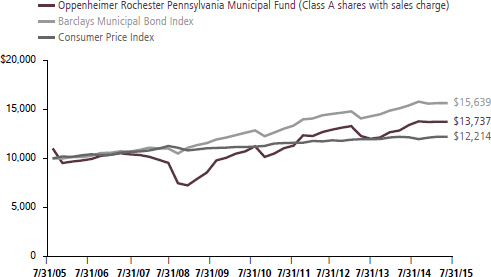
Performance data quoted represents past performance, which does not guarantee future results. The investment return and principal value of an investment in the Fund will fluctuate so that an investor’s shares, when redeemed, may be worth more or less than their original cost. Current performance may be lower or higher than the performance quoted. Returns do not consider capital gains or income taxes on an individual’s investments. For performance data current to the most recent month-end, visit oppenheimerfunds.com or call 1.800.CALL OPP (225.5677). Fund returns include changes in share price, reinvested distributions, and the applicable sales charge: for Class A shares, the current maximum initial sales charge of 4.75%; for Class B shares, the contingent deferred sales charge of 5% (1-year) and 2% (5-year); and for Class C, the contingent deferred sales charge of 1% for the 1-year period. There is no sales charge for Class Y shares. Because Class B shares convert to Class A shares 72 months after purchase, the 10-year return for Class B shares uses Class A performance for the period after conversion.
The Fund’s performance is compared to the performance of the Barclays Municipal Bond Index, an unmanaged index of a broad range of investment-grade municipal bonds that is a measure of the general municipal bond market. The Fund’s performance is also compared to the Consumer Price Index, a non-securities index that measures changes in the inflation rate. Indices are unmanaged and cannot be purchased by investors. While index comparisons may be useful to provide a benchmark for the Fund’s performance, it must be noted that the Fund’s investments are not limited to the investments comprising the indices. Index performance includes reinvestment of income, but does not reflect transaction costs, fees, expenses or taxes. Index performance is shown for illustrative purposes only as a benchmark for the Fund’s performance, and does not predict or depict performance of the Fund. The Fund’s performance reflects the effects of the Fund’s business and operating expenses.
Distribution yields for Class A shares are based on dividends of $0.051 for the 35-day accrual period ended July 28, 2015. The yield without sales charge for Class A shares is calculated by dividing annualized dividends by the Class A net asset value on July 28, 2015; for the yield
18 OPPENHEIMER ROCHESTER PENNSYLVANIA MUNICIPAL FUND
with sales charge, the denominator is the Class A maximum offering price on that date. Distribution yields for Class B, C and Y are annualized based on dividends of $0.0434, $0.0435 and $0.0524, respectively, for the 35-day accrual period ended July 28, 2015, and on the corresponding net asset values on that date.
Standardized yield is based on the Fund’s net investment income for the 30-day period ended July 31, 2015, and either that date’s maximum offering price (for Class A shares) or net asset value (for the other classes). Each result is compounded semiannually and annualized. Falling share prices artificially increase yields.
The average distribution yield in this Fund’s Lipper category was calculated based on the distributions and the final net asset values (NAVs) of the reporting period for the funds in each category. The average yield at NAV in Lipper’s Pennsylvania Municipal Debt Funds category is based on 59 NAVs, one for each class of each fund in the category; a fund can have up to 4 classes. Lipper yields do not include sales charges – which, if included, would reduce results.
Taxable equivalent yield is based on the standardized yield and the top combined federal and Pennsylvania 2015 tax rate of 45.3%. Calculations factor in the 3.8% tax on unearned income under the Patient Protection and Affordable Care Act, as applicable. A portion of the Fund’s distributions may be subject to tax; distributions may also increase an investor’s exposure to the alternative minimum tax. Capital gains distributions are taxable as capital gains. Tax treatments of the Fund’s distributions and capital gains may vary by state; investors should consult a tax advisor to determine if the Fund is appropriate for them. Each result is compounded semiannually and annualized. Falling share prices artificially increase yields. This Report must be preceded or accompanied by a Fund prospectus.
The average yields for AAA-rated municipal securities are provided by Municipal Market Advisors (MMA) and are based on its benchmark of general obligation bonds structured with a 5% coupon. The MMA 5% benchmark is constructed using yields from the leading underwriters, who represent a significant percentage of the primary activity of the top 10 underwriters and therefore the total issuance.
Investments in “tobacco bonds,” which are backed by the proceeds a state or territory receives from the 1998 national litigation settlement with tobacco manufacturers, may be vulnerable to economic and/or legislative events that affect issuers in a particular municipal market sector. Annual payments by MSA-participating manufacturers, for example, hinge on many factors, including annual domestic cigarette shipments, inflation and the relative market share of non-participating manufacturers. To date, we believe consumption figures remain within an acceptable range of the assumptions used to structure MSA bonds. Future MSA payments could be reduced if consumption were to fall more rapidly than originally forecast.
The Fund’s investment strategy and focus can change over time. The mention of specific fund holdings does not constitute a recommendation by OppenheimerFunds, Inc. or its affiliates.
Before investing in any of the Oppenheimer funds, investors should carefully consider a fund’s investment objectives, risks, charges and expenses. Fund prospectuses and summary prospectuses contain this and other information about the funds, and may be obtained by asking your financial advisor, visiting oppenheimerfunds.com, or calling 1.800.CALL OPP (225.5677). Read prospectuses and summary prospectuses carefully before investing.
19 OPPENHEIMER ROCHESTER PENNSYLVANIA MUNICIPAL FUND
Shares of Oppenheimer funds are not deposits or obligations of any bank, are not guaranteed by any bank, are not insured by the FDIC or any other agency and involve investment risks, including the possible loss of the principal amount invested.
20 OPPENHEIMER ROCHESTER PENNSYLVANIA MUNICIPAL FUND
Fund Expenses
Fund Expenses. As a shareholder of the Fund, you incur two types of costs: (1) transaction costs, which may include sales charges (loads) on purchase payments and/or contingent deferred sales charges on redemptions; and (2) ongoing costs, including management fees; distribution and service fees; and other Fund expenses. These examples are intended to help you understand your ongoing costs (in dollars) of investing in the Fund and to compare these costs with the ongoing costs of investing in other mutual funds.
The examples are based on an investment of $1,000.00 invested at the beginning of the period and held for the entire 6-month period ended July 31, 2015.
Actual Expenses. The first section of the table provides information about actual account values and actual expenses. You may use the information in this section for the class of shares you hold, together with the amount you invested, to estimate the expense that you paid over the period. Simply divide your account value by $1,000.00 (for example, an $8,600.00 account value divided by $1,000.00 = 8.60), then multiply the result by the number in the first section under the heading entitled “Expenses Paid During 6 Months Ended July 31, 2015” to estimate the expenses you paid on your account during this period.
Hypothetical Example for Comparison Purposes. The second section of the table provides information about hypothetical account values and hypothetical expenses based on the Fund’s actual expense ratio for each class of shares, and an assumed rate of return of 5% per year for each class before expenses, which is not the Fund’s actual return. The hypothetical account values and expenses may not be used to estimate the actual ending account balance or expenses you paid for the period. You may use this information to compare the ongoing costs of investing in the Fund and other funds. To do so, compare this 5% hypothetical example for the class of shares you hold with the 5% hypothetical examples that appear in the shareholder reports of the other funds.
Please note that the expenses shown in the table are meant to highlight your ongoing costs only and do not reflect any transactional costs, such as front-end or contingent deferred sales charges (loads). Therefore, the “hypothetical” section of the table is useful in comparing ongoing costs only, and will not help you determine the relative total costs of owning different funds. In addition, if these transactional costs were included, your costs would have been higher.
21 OPPENHEIMER ROCHESTER PENNSYLVANIA MUNICIPAL FUND
| | | | | | | | | | | | | | |
| | | Beginning | | | Ending | | | Expenses | | | |
| | | Account | | | Account | | | Paid During | | | |
| | | Value | | | Value | | | 6 Months Ended | | | |
| Actual | | February 1, 2015 | | | July 31, 2015 | | | July 31, 2015 | | | |
Class A | | $ | 1,000.00 | | | $ | 996.80 | | | $ | 4.66 | | | |
Class B | | | 1,000.00 | | | | 994.00 | | | | 8.39 | | | |
Class C | | | 1,000.00 | | | | 994.00 | | | | 8.39 | | | |
Class Y | | | 1,000.00 | | | | 998.50 | | | | 3.92 | | | |
| | | | |
Hypothetical | | | | | | | | | | | | | | |
(5% return before expenses) | | | | | | | | | | | | | | |
Class A | | | 1,000.00 | | | | 1,020.13 | | | | 4.72 | | | |
Class B | | | 1,000.00 | | | | 1,016.41 | | | | 8.48 | | | |
Class C | | | 1,000.00 | | | | 1,016.41 | | | | 8.48 | | | |
Class Y | | | 1,000.00 | | | | 1,020.88 | | | | 3.97 | | | |
Expenses are equal to the Fund’s annualized expense ratio for that class, multiplied by the average account value over the period, multiplied by 181/365 (to reflect the one-half year period). Those annualized expense ratios, excluding indirect expenses from affiliated funds, based on the 6-month period ended July 31, 2015 are as follows:
| | | | | | |
| Class | | Expense Ratios | | | |
Class A | | | 0.94 | % | | |
Class B | | | 1.69 | | | |
Class C | | | 1.69 | | | |
Class Y | | | 0.79 | | | |
22 OPPENHEIMER ROCHESTER PENNSYLVANIA MUNICIPAL FUND
STATEMENT OF INVESTMENTS July 31, 2015
| | | | | | | | | | | | | | |
| Principal | | | | | | | | | | | |
| Amount | | | | | Coupon | | | Maturity | | Value | |
| Municipal Bonds and Notes—109.6% | | | | | | | | | | |
| Pennsylvania—71.6% | | | | | | | | | | |
| | $ 1,125,000 | | | Allegheny County, PA HDA (Jefferson Regional Medical Center)1 | | | 5.125 | % | | 05/01/2029 | | $ | 1,124,684 | |
| | 80,000 | | | Allegheny County, PA HDA (Jefferson Regional Medical Center)1 | | | 5.125 | | | 05/01/2025 | | | 80,497 | |
| | 160,000 | | | Allegheny County, PA HDA (UPMC Health System)1 | | | 5.500 | | | 08/15/2034 | | | 178,395 | |
| | 35,000 | | | Allegheny County, PA HDA (UPMC Health System)1 | | | 5.375 | | | 08/15/2029 | | | 39,094 | |
| | 1,125,000 | | | Allegheny County, PA HEBA (Carlow University)1 | | | 6.750 | | | 11/01/2031 | | | 1,290,150 | |
| | 1,310,000 | | | Allegheny County, PA HEBA (Carlow University)1 | | | 6.000 | | | 11/01/2021 | | | 1,464,279 | |
| | 1,000,000 | | | Allegheny County, PA HEBA (Chatham University) | | | 5.000 | | | 09/01/2035 | | | 1,059,220 | |
| | 15,000 | | | Allegheny County, PA HEBA (Robert Morris University)1 | | | 6.000 | | | 05/01/2028 | | | 17,482 | |
| | 2,000,000 | | | Allegheny County, PA HEBA (Robert Morris University)1 | | | 6.000 | | | 10/15/2038 | | | 2,175,380 | |
| | 2,500,000 | | | Allegheny County, PA HEBA (Robert Morris University)1 | | | 5.900 | | | 10/15/2028 | | | 2,716,850 | |
| | 3,650,000 | | | Allegheny County, PA HEBA (Robert Morris University)1 | | | 5.750 | | | 10/15/2040 | | | 3,953,388 | |
| | 2,250,000 | | | Allegheny County, PA HEBA (Robert Morris University)1 | | | 5.500 | | | 10/15/2030 | | | 2,428,357 | |
| | 10,000 | | | Allegheny County, PA IDA (ARC Allegheny Foundation)1 | | | 5.000 | | | 12/01/2028 | | | 10,002 | |
| | 1,200,000 | | | Allegheny County, PA IDA (Propel Charter School- East)1 | | | 6.375 | | | 08/15/2035 | | | 1,297,884 | |
| | 1,000,000 | | | Allegheny County, PA IDA (Propel Charter School- Montour)1 | | | 6.750 | | | 08/15/2035 | | | 1,097,000 | |
| | 1,500,000 | | | Allegheny County, PA IDA (Propel Charter School- Sunrise) | | | 6.000 | | | 07/15/2038 | | | 1,581,315 | |
| | 1,225,000 | | | Allegheny County, PA IDA (RR/RRSW/RRDC Obligated Group)1 | | | 5.100 | | | 09/01/2026 | | | 1,233,342 | |
| | 1,000,000 | | | Allegheny County, PA IDA (RR/RRSW/RRDC Obligated Group)1 | | | 5.000 | | | 09/01/2021 | | | 1,014,770 | |
| | 890,000 | | | Allegheny County, PA IDA (RR/RRSW/RRDC Obligated Group)1 | | | 5.125 | | | 09/01/2031 | | | 893,498 | |
| | 380,000 | | | Allegheny County, PA IDA (School Facility Devel.)1,2 | | | 5.900 | | | 08/15/2026 | | | 405,608 | |
| | 15,435,000 | | | Allegheny County, PA Redevel. Authority (Pittsburgh Mills)1 | | | 5.600 | | | 07/01/2023 | | | 15,608,798 | |
| | 1,650,000 | | | Allegheny County, PA Residential Finance Authority (Broadview Manor Apartments)1 | | | 5.950 | | | 01/20/2043 | | | 1,714,399 | |
| | 25,000 | | | Allegheny County, PA Residential Finance Authority (Cambridge Square Apartments)1 | | | 4.250 | | | 01/15/2017 | | | 25,603 | |
| | 1,280,000 | | | Allegheny County, PA Residential Finance Authority (Independence House Apartments)1 | | | 6.100 | | | 01/20/2043 | | | 1,336,026 | |
| | 1,650,000 | | | Allegheny County, PA Residential Finance Authority (Versailles Apartments)1 | | | 6.160 | | | 01/20/2043 | | | 1,724,497 | |
| | 13,000,000 | | | Berks County, PA Municipal Authority (Reading Hospital & Medical Center)3 | | | 5.500 | | | 11/01/2031 | | | 14,851,200 | |
| | 3,000,000 | | | Bethlehem, PA Area School District1 | | | 5.000 | | | 08/01/2035 | | | 3,371,550 | |
| | 3,675,000 | | | Bethlehem, PA Area School District1 | | | 5.000 | | | 08/01/2034 | | | 4,146,686 | |
| | 1,750,000 | | | Bethlehem, PA GO1 | | | 6.500 | | | 12/01/2032 | | | 2,056,005 | |
23 OPPENHEIMER ROCHESTER PENNSYLVANIA MUNICIPAL FUND
STATEMENT OF INVESTMENTS Continued
| | | | | | | | | | | | | | |
| Principal | | | | | | | | | | | |
| Amount | | | | | Coupon | | | Maturity | | Value | |
| Pennsylvania (Continued) | | | | | | | | | | |
| | $ 1,000,000 | | | Bucks County, PA IDA (Lutheran Community Telford Center)1 | | | 5.750 | % | | 01/01/2027 | | $ | 1,016,100 | |
| | 1,760,000 | | | Butler County, PA IDA (Greenview Gardens Apartments)1 | | | 6.250 | | | 07/01/2033 | | | 1,777,653 | |
| | 710,000 | | | Butler County, PA IDA (Greenview Gardens Apartments)1 | | | 6.000 | | | 07/01/2023 | | | 717,121 | |
| | 2,865,000 | | | Cambridge, PA Area Joint Authority1 | | | 6.000 | | | 12/01/2037 | | | 3,046,899 | |
| | 2,000,000 | | | Centre County, PA Hospital Authority (Mt. Nittany Medical Center)1 | | | 7.000 | | | 11/15/2046 | | | 2,394,500 | |
| | 950,000 | | | Centre County, PA Hospital Authority (Mt. Nittany Medical Center)1 | | | 6.250 | | | 11/15/2041 | | | 1,098,884 | |
| | 30,000 | | | Charleroi, PA Area School Authority | | | 6.000 | | | 10/01/2017 | | | 30,145 | |
| | 2,000,000 | | | Chester County, PA H&EFA (Immaculata University)1 | | | 7.000 | | | 11/01/2041 | | | 2,338,220 | |
| | 23,915,000 | | | Chester County, PA IDA (Aqua Pennsylvania)3 | | | 5.000 | | | 02/01/2041 | | | 24,424,124 | |
| | 1,000,000 | | | Chester County, PA IDA (West Chester University Student Hsg.) | | | 5.000 | | | 08/01/2035 | | | 1,057,020 | |
| | 1,000,000 | | | Clairton, PA Municipal Authority | | | 5.000 | | | 12/01/2037 | | | 1,067,550 | |
| | 1,220,000 | | | Clarion County, PA IDA (Clarion University Foundation)1 | | | 5.000 | | | 07/01/2024 | | | 1,335,924 | |
| | 1,310,000 | | | Clarion County, PA IDA (Clarion University Foundation)1 | | | 5.000 | | | 07/01/2034 | | | 1,388,561 | |
| | 3,500,000 | | | Clarion County, PA IDA (Clarion University of Pennsylvania Hsg.)1 | | | 5.000 | | | 07/01/2033 | | | 3,677,975 | |
| | 2,430,000 | | | Clarion County, PA IDA (Clarion University of Pennsylvania Hsg.)1 | | | 5.000 | | | 07/01/2029 | | | 2,583,163 | |
| | 2,240,000 | | | Cumberland County, PA Municipal Authority (Diakon Lutheran Social Ministries)1 | | | 6.250 | | | 01/01/2024 | | | 2,625,347 | |
| | 260,000 | | | Cumberland County, PA Municipal Authority (Diakon Lutheran Social Ministries)1 | | | 6.250 | | | 01/01/2024 | | | 296,962 | |
| | 950,000 | | | Cumberland County, PA Municipal Authority (Presbyterian Homes)1 | | | 5.000 | | | 12/01/2021 | | | 960,269 | |
| | 6,605,000 | | | Delaware County, PA Authority (Cabrini College)1 | | | 5.500 | | | 07/01/2024 | | | 6,614,775 | |
| | 6,385,000 | | | Delaware County, PA Authority (Eastern University) | | | 5.000 | | | 10/01/2027 | | | 6,860,810 | |
| | 3,965,000 | | | Delaware County, PA Authority (Eastern University) | | | 5.250 | | | 10/01/2032 | | | 4,280,812 | |
| | 100,000 | | | Delaware County, PA Authority (MAS/MCMCSPA/MHH/MHP/MHSSPA Obligated Group) | | | 5.375 | | | 11/15/2023 | | | 100,435 | |
| | 650,000 | | | Delaware County, PA Authority (Neumann College)1 | | | 6.250 | | | 10/01/2038 | | | 653,666 | |
| | 1,160,000 | | | Delaware County, PA Authority (Neumann College)1 | | | 6.000 | | | 10/01/2025 | | | 1,304,188 | |
| | 280,000 | | | Delaware County, PA Authority (Neumann College)1 | | | 6.000 | | | 10/01/2030 | | | 311,979 | |
| | 1,000,000 | | | Delaware County, PA Authority (Neumann College)1 | | | 6.125 | | | 10/01/2034 | | | 1,113,950 | |
| | 1,250,000 | | | Delaware County, PA Authority (Neumann University)1 | | | 5.250 | | | 10/01/2031 | | | 1,327,612 | |
| | 1,150,000 | | | Delaware County, PA Authority (Neumann University)1 | | | 5.000 | | | 10/01/2025 | | | 1,220,771 | |
| | 18,705,000 | | | Delaware County, PA IDA (Aqua Pennsylvania)3 | | | 5.000 | | | 11/01/2038 | | | 18,877,037 | |
| | 4,120,000 | | | Delaware County, PA IDA (Naamans Creek)1 | | | 7.000 | | | 12/01/2036 | | | 4,296,130 | |
| | 2,750,000 | | | East Hempfield Township, PA IDA (Millersville University Student Services)1 | | | 5.000 | | | 07/01/2047 | | | 2,876,912 | |
| | 1,250,000 | | | East Hempfield Township, PA IDA (Millersville University Student Services) | | | 5.000 | | | 07/01/2035 | | | 1,310,387 | |
24 OPPENHEIMER ROCHESTER PENNSYLVANIA MUNICIPAL FUND
| | | | | | | | | | | | | | |
| Principal | | | | | | | | | | | |
| Amount | | | | | Coupon | | | Maturity | | Value | |
| Pennsylvania (Continued) | | | | | | | | | | |
| | $ 1,000,000 | | | East Hempfield Township, PA IDA (Millersville University Student Services) | | | 5.000 | % | | 07/01/2030 | | $ | 1,064,200 | |
| | 820,000 | | | East Hempfield Township, PA IDA (Millersville University Student Services)1 | | | 5.000 | | | 07/01/2030 | | | 883,091 | |
| | 1,060,000 | | | East Hempfield Township, PA IDA (Millersville University Student Services)1 | | | 5.000 | | | 07/01/2035 | | | 1,121,130 | |
| | 3,945,000 | | | Erie County, PA Hospital Authority (St. Vincent’s Health)1 | | | 7.000 | | | 07/01/2027 | | | 4,186,197 | |
| | 7,840,000 | | | Erie, PA Higher Education Building Authority (Gannon University) | | | 5.000 | | | 05/01/2038 | | | 8,325,374 | |
| | 1,000,000 | | | Erie, PA Higher Education Building Authority (Gannon University)1 | | | 5.375 | | | 05/01/2030 | | | 1,067,800 | |
| | 2,565,000 | | | Erie, PA Higher Education Building Authority (Gannon University)1 | | | 5.500 | | | 05/01/2040 | | | 2,758,478 | |
| | 905,000 | | | Erie, PA Higher Education Building Authority (Mercyhurst College)1 | | | 5.350 | | | 03/15/2028 | | | 979,029 | |
| | 3,000,000 | | | Erie, PA Higher Education Building Authority (Mercyhurst College)1 | | | 5.500 | | | 03/15/2038 | | | 3,228,990 | |
| | 370,000 | | | Erie-Western PA Port Authority1 | | | 5.125 | | | 06/15/2016 | | | 370,507 | |
| | 3,265,000 | | | Fayette County, PA Redevel. Authority (Fayette Crossing)1 | | | 7.000 | | | 09/01/2019 | | | 3,444,183 | |
| | 550,000 | | | Harrisburg, PA Authority1 | | | 5.000 | | | 07/15/2024 | | | 551,166 | |
| | 165,000 | | | Harrisburg, PA Authority1 | | | 5.000 | | | 07/15/2023 | | | 165,373 | |
| | 50,000 | | | Harrisburg, PA GO | | | 9.614 | 4 | | 09/15/2016 | | | 48,085 | |
| | 10,000 | | | Harrisburg, PA GO | | | 9.600 | 4 | | 09/15/2015 | | | 9,960 | |
| | 40,000 | | | Harrisburg, PA GO | | | 9.600 | 4 | | 03/15/2016 | | | 39,143 | |
| | 70,000 | | | Harrisburg, PA GO | | | 9.727 | 4 | | 09/15/2015 | | | 69,718 | |
| | 335,000 | | | Harrisburg, PA Water System1 | | | 5.000 | | | 07/15/2023 | | | 336,270 | |
| | 6,440,000 | | | Horsham, PA Industrial and Commercial Devel. Authority (Pennsylvania LTC)1 | | | 6.000 | | | 12/01/2037 | | | 6,769,986 | |
| | 225,000 | | | Jeanette, PA GO1 | | | 5.000 | | | 04/01/2018 | | | 225,810 | |
| | 2,100,000 | | | Lackawanna County, PA GO1 | | | 6.000 | | | 09/15/2032 | | | 2,428,986 | |
| | 12,565,000 | | | Lawrence County, PA IDA (Shenango Presbyterian Center)1 | | | 5.625 | | | 11/15/2037 | | | 12,675,572 | |
| | 3,600,000 | | | Lehigh County, PA GPA (Kidspeace Obligated Group) | | | 6.000 | | | 11/01/2023 | | | 3,583,440 | |
| | 1,807,494 | | | Lehigh County, PA GPA (Kidspeace Obligated Group) | | | 6.000 | | | 11/01/2018 | | | 1,809,537 | |
| | 2,747,774 | | | Lehigh County, PA GPA (Kidspeace)1 | | | 0.000 | 5 | | 02/01/2044 | | | 768,442 | |
| | 2,721,970 | | | Lehigh County, PA GPA (Kidspeace)6 | | | 7.500 | | | 02/01/2044 | | | 27 | |
| | 3,606,455 | | | Lehigh County, PA GPA (Kidspeace/KC/KNCONY/KCH/KMAKNC/KNCONM / IRSch Obligated Group)1 | | | 7.500 | | | 02/01/2044 | | | 3,602,235 | |
| | 4,700,000 | | | Lehigh Northampton, PA Airport Authority1 | | | 6.000 | | | 05/15/2030 | | | 4,704,653 | |
| | 5,000,000 | | | Luzerne County, PA IDA1 | | | 7.750 | | | 12/15/2027 | | | 5,210,900 | |
| | 3,720,000 | | | Lycoming County, PA Authority (Pennsylvania College of Technology) | | | 5.000 | | | 05/01/2032 | | | 4,083,184 | |
| | 11,060,000 | | | Mifflin County, PA Hospital Authority (Lewiston Hospital/Lewiston Healthcare Foundation Obligated Group)1 | | | 5.125 | | | 07/01/2030 | | | 11,642,309 | |
| | 595,000 | | | Millcreek, PA Richland Joint Authority1 | | | 5.250 | | | 08/01/2022 | | | 626,606 | |
25 OPPENHEIMER ROCHESTER PENNSYLVANIA MUNICIPAL FUND
STATEMENT OF INVESTMENTS Continued
| | | | | | | | | | | | | | |
| Principal | | | | | | | | | | | |
| Amount | | | | | Coupon | | | Maturity | | Value | |
| Pennsylvania (Continued) | | | | | | | | | | |
| | $ 1,390,000 | | | Millcreek, PA Richland Joint Authority1 | | | 5.500 | % | | 08/01/2037 | | $ | 1,436,176 | |
| | 20,915,000 | | | Montgomery County, PA IDA3 | | | 5.375 | | | 08/01/2038 | | | 24,901,282 | |
| | 300,000 | | | Montgomery County, PA IDA (Philadelphia Presbyterian Homes)1 | | | 6.500 | | | 12/01/2025 | | | 347,481 | |
| | 2,860,000 | | | Northampton County, PA General Purpose Authority (Moravian College) | | | 5.000 | | | 07/01/2031 | | | 3,045,442 | |
| | 1,500,000 | | | Northampton County, PA IDA (Morningstar Senior Living) | | | 5.000 | | | 07/01/2027 | | | 1,571,340 | |
| | 15,111,360 | | | Northampton County, PA IDA (Northampton Generating)1,10 | | | 5.000 | | | 12/31/2023 | | | 13,659,612 | |
| | 1,205,000 | | | Northumberland County, PA IDA (NHS Youth Services)1 | | | 5.500 | | | 02/15/2033 | | | 1,056,062 | |
| | 1,525,000 | | | Northumberland County, PA IDA (NHS Youth Services)1 | | | 7.500 | | | 02/15/2029 | | | 919,804 | |
| | 3,300,000 | | | Northumberland County, PA IDA (NHS Youth Services)1 | | | 7.750 | | | 02/15/2029 | | | 1,990,230 | |
| | 16,000,000 | | | PA Commonwealth Financing Authority3 | | | 5.000 | | | 06/01/2032 | | | 17,986,400 | |
| | 39,737,908 | | | PA EDFA (Bionol Clearfield)7 | | | 8.500 | | | 07/01/2015 | | | 1,721,446 | |
| | 255,000 | | | PA EDFA (Fayette Thermal)1 | | | 5.250 | | | 12/01/2016 | | | 255,089 | |
| | 35,000 | | | PA EDFA (Fayette Thermal)1 | | | 5.500 | | | 12/01/2021 | | | 35,010 | |
| | 3,000,000 | | | PA EDFA (Forum) | | | 5.000 | | | 03/01/2029 | | | 3,348,360 | |
| | 2,000,000 | | | PA EDFA (PA Bridges Finco)1 | | | 5.000 | | | 06/30/2042 | | | 2,097,760 | |
| | 3,000,000 | | | PA EDFA (Philadelphia Biosolids Facility)1 | | | 6.250 | | | 01/01/2032 | | | 3,330,900 | |
| | 2,950,000 | | | PA EDFA (US Airways Group)1 | | | 8.000 | | | 05/01/2029 | | | 3,499,791 | |
| | 1,025,000 | | | PA HEFA (Assoc. of Independent Colleges & Universities)1 | | | 5.125 | | | 05/01/2032 | | | 1,056,242 | |
| | 55,000 | | | PA HEFA (California University of Pennsylvania Student Assoc.)1 | | | 6.800 | | | 09/01/2025 | | | 55,122 | |
| | 145,000 | | | PA HEFA (California University of Pennsylvania Student Assoc.)1,2 | | | 6.750 | | | 09/01/2020 | | | 145,403 | |
| | 3,115,000 | | | PA HEFA (California University of Pennsylvania Student Assoc.)1 | | | 6.750 | | | 09/01/2032 | | | 3,118,863 | |
| | 100,000 | | | PA HEFA (California University of Pennsylvania Student Assoc.)1 | | | 5.000 | | | 07/01/2028 | | | 100,026 | |
| | 535,000 | | | PA HEFA (Delaware Valley College of Science & Agriculture) | | | 5.000 | | | 11/01/2042 | | | 554,982 | |
| | 1,245,000 | | | PA HEFA (Delaware Valley College of Science & Agriculture) | | | 5.000 | | | 11/01/2027 | | | 1,334,615 | |
| | 175,000 | | | PA HEFA (Delaware Valley College of Science & Agriculture)1 | | | 5.750 | | | 04/15/2034 | | | 175,249 | |
| | 10,000 | | | PA HEFA (Drexel University College of Medicine)1 | | | 5.000 | | | 05/01/2037 | | | 10,703 | |
| | 6,285,000 | | | PA HEFA (Edinboro University Foundation)1 | | | 5.750 | | | 07/01/2028 | | | 6,590,262 | |
| | 8,225,000 | | | PA HEFA (Edinboro University Foundation)1 | | | 6.000 | | | 07/01/2042 | | | 8,632,055 | |
| | 9,000,000 | | | PA HEFA (Edinboro University Foundation)1 | | | 5.875 | | | 07/01/2038 | | | 9,427,680 | |
| | 3,000,000 | | | PA HEFA (Edinboro University Foundation)1 | | | 5.800 | | | 07/01/2030 | | | 3,226,950 | |
| | 3,500,000 | | | PA HEFA (Edinboro University Foundation)1 | | | 6.000 | | | 07/01/2043 | | | 3,781,120 | |
| | 4,000,000 | | | PA HEFA (Elizabethtown College)1 | | | 5.000 | | | 12/15/2027 | | | 4,125,280 | |
| | 1,300,000 | | | PA HEFA (Gwynedd Mercy College) | | | 5.375 | | | 05/01/2042 | | | 1,399,944 | |
| | 750,000 | | | PA HEFA (Indiana University Foundation) | | | 5.000 | | | 07/01/2041 | | | 788,888 | |
| | 2,650,000 | | | PA HEFA (La Salle University)1 | | | 5.000 | | | 05/01/2029 | | | 2,888,288 | |
| | 1,490,000 | | | PA HEFA (Marywood University)1 | | | 5.125 | | | 06/01/2029 | | | 1,497,629 | |
26 OPPENHEIMER ROCHESTER PENNSYLVANIA MUNICIPAL FUND
| | | | | | | | | | | | | | |
| Principal | | | | | | | | | | | |
| Amount | | | | | Coupon | | | Maturity | | Value | |
| Pennsylvania (Continued) | | | | | | | | | | |
| | $ 50,000 | | | PA HEFA (Pennsylvania State University) | | | 5.000 | % | | 03/01/2022 | | $ | 50,200 | |
| | 250,000 | | | PA HEFA (Philadelphia University)1 | | | 5.000 | | | 06/01/2035 | | | 252,405 | |
| | 1,400,000 | | | PA HEFA (Shippensburg University Student Services) | | | 5.000 | | | 10/01/2035 | | | 1,452,682 | |
| | 3,000,000 | | | PA HEFA (Shippensburg University)1 | | | 6.000 | | | 10/01/2031 | | | 3,289,050 | |
| | 7,000,000 | | | PA HEFA (Shippensburg University)1 | | | 6.250 | | | 10/01/2043 | | | 7,752,570 | |
| | 2,250,000 | | | PA HEFA (St. Francis University)1 | | | 6.250 | | | 11/01/2041 | | | 2,503,688 | |
| | 1,750,000 | | | PA HEFA (St. Francis University)1 | | | 6.000 | | | 11/01/2031 | | | 1,921,570 | |
| | 100,000 | | | PA HEFA (Student Association)1 | | | 6.750 | | | 09/01/2023 | | | 100,130 | |
| | 4,515,000 | | | PA HEFA (University of Pennsylvania Health System)1 | | | 5.750 | | | 08/15/2041 | | | 5,269,321 | |
| | 3,050,000 | | | PA HEFA (University of the Arts)1 | | | 5.625 | | | 03/15/2025 | | | 3,055,765 | |
| | 1,685,000 | | | PA HEFA (University of the Arts)1 | | | 5.750 | | | 03/15/2030 | | | 1,687,763 | |
| | 60,000 | | | PA HEFA (University of the Arts)1 | | | 5.500 | | | 03/15/2020 | | | 60,166 | |
| | 1,000,000 | | | PA HEFA (Ursinus College) | | | 5.000 | | | 01/01/2029 | | | 1,087,310 | |
| | 1,000,000 | | | PA HEFA (Widener University)1 | | | 5.000 | | | 07/15/2038 | | | 1,073,070 | |
| | 500,000 | | | PA HEFA (York College)1 | | | 5.250 | | | 11/01/2024 | | | 506,200 | |
| | 5,000,000 | | | PA Public School Building Authority (Harrisburg Area Community College)1 | | | 5.000 | | | 10/01/2031 | | | 5,353,050 | |
| | 4,000,000 | | | PA Public School Building Authority (School District of Philadelphia)1 | | | 5.000 | | | 04/01/2028 | | | 4,376,840 | |
| | 3,500,000 | | | PA Public School Building Authority (School District of Philadelphia)1 | | | 5.000 | | | 04/01/2027 | | | 3,870,440 | |
| | 3,000,000 | | | PA Public School Building Authority (School District of Philadelphia)1 | | | 5.000 | | | 04/01/2029 | | | 3,250,530 | |
| | 4,540,000 | | | PA Public School Building Authority (School District of Philadelphia)1 | | | 5.000 | | | 04/01/2032 | | | 4,871,783 | |
| | 2,250,000 | | | PA Public School Building Authority (School District of Philadelphia)1 | | | 5.000 | | | 04/01/2031 | | | 2,419,920 | |
| | 1,120,000 | | | PA Southcentral General Authority (Hanover Hospital)1 | | | 5.000 | | | 12/01/2020 | | | 1,133,126 | |
| | 900,000 | | | PA Southcentral General Authority (Hanover Hospital)1 | | | 5.000 | | | 12/01/2027 | | | 907,344 | |
| | 2,310,000 | | | PA Southcentral General Authority (Hanover Hospital)1 | | | 5.000 | | | 12/01/2028 | | | 2,328,157 | |
| | 12,940,000 | | | PA Southcentral General Authority (Wellspan Health Obligated Group)3 | | | 6.000 | | | 06/01/2029 | | | 14,543,760 | |
| | 3,680,000 | | | PA State Public School Building Authority (Philadelphia School District)1 | | | 5.000 | | | 06/01/2026 | | | 4,170,986 | |
| | 4,000,000 | | | PA Turnpike Commission1 | | | 0.000 | 5 | | 12/01/2034 | | | 4,366,600 | |
| | 2,000,000 | | | PA Turnpike Commission1 | | | 5.000 | | | 12/01/2032 | | | 2,242,100 | |
| | 2,000,000 | | | PA Turnpike Commission1 | | | 5.000 | | | 12/01/2030 | | | 2,274,560 | |
| | 5,000,000 | | | PA Turnpike Commission1 | | | 0.000 | 5 | | 12/01/2034 | | | 5,346,500 | |
| | 10,000,000 | | | PA Turnpike Commission1 | | | 0.000 | 5 | | 12/01/2038 | | | 11,011,200 | |
| | 2,000,000 | | | PA West Shore Area Hospital Authority (Holy Spirit Hospital of the Sisters of Christian Charity)1 | | | 5.625 | | | 01/01/2032 | | | 2,337,360 | |
| | 1,835,000 | | | PA West Shore Area Hospital Authority (Holy Spirit Hospital of the Sisters of Christian Charity)1 | | | 6.500 | | | 01/01/2041 | | | 2,170,952 | |
| | 5,000,000 | | | Philadelphia, PA Airport, Series A1 | | | 5.000 | | | 06/15/2037 | | | 5,182,400 | |
| | 50,000 | | | Philadelphia, PA Airport, Series A1 | | | 5.000 | | | 06/15/2025 | | | 50,191 | |
| | 2,500,000 | | | Philadelphia, PA Authority for Industrial Devel. (Architecture & Design Charter School) | | | 6.125 | | | 03/15/2043 | | | 2,695,975 | |
27 OPPENHEIMER ROCHESTER PENNSYLVANIA MUNICIPAL FUND
STATEMENT OF INVESTMENTS Continued
| | | | | | | | | | | | | | |
| Principal | | | | | | | | | | | |
| Amount | | | | | Coupon | | | Maturity | | Value | |
| Pennsylvania (Continued) | | | | | | | | | | |
| | $ 20,000 | | | Philadelphia, PA Authority for Industrial Devel. (Cathedral Village)1 | | | 6.750 | % | | 04/01/2023 | | $ | 20,041 | |
| | 185,000 | | | Philadelphia, PA Authority for Industrial Devel. (Cathedral Village)1 | | | 6.875 | | | 04/01/2034 | | | 185,333 | |
| | 450,000 | | | Philadelphia, PA Authority for Industrial Devel. (Discovery Charter School) | | | 5.875 | | | 04/01/2032 | | | 473,747 | |
| | 500,000 | | | Philadelphia, PA Authority for Industrial Devel. (Discovery Charter School) | | | 6.250 | | | 04/01/2042 | | | 532,980 | |
| | 1,000,000 | | | Philadelphia, PA Authority for Industrial Devel. (Global Leadership Academy)1 | | | 5.750 | | | 11/15/2030 | | | 1,041,930 | |
| | 500,000 | | | Philadelphia, PA Authority for Industrial Devel. (Global Leadership Academy)1 | | | 6.375 | | | 11/15/2040 | | | 534,310 | |
| | 2,040,000 | | | Philadelphia, PA Authority for Industrial Devel. (International Apartments Temple University)1 | | | 5.375 | | | 06/15/2030 | | | 2,140,858 | |
| | 4,000,000 | | | Philadelphia, PA Authority for Industrial Devel. (International Apartments Temple University)1 | | | 5.625 | | | 06/15/2042 | | | 4,200,040 | |
| | 2,115,000 | | | Philadelphia, PA Authority for Industrial Devel. (Marina Bracetti Academy)1 | | | 7.150 | | | 12/15/2036 | | | 2,321,932 | |
| | 1,000,000 | | | Philadelphia, PA Authority for Industrial Devel. (Marina Bracetti Academy)1 | | | 7.625 | | | 12/15/2041 | | | 1,124,110 | |
| | 1,500,000 | | | Philadelphia, PA Authority for Industrial Devel. (New Foundation Charter School) | | | 6.625 | | | 12/15/2041 | | | 1,650,840 | |
| | 1,640,000 | | | Philadelphia, PA Authority for Industrial Devel. (Richard Allen Prep Charter School)1 | | | 6.250 | | | 05/01/2033 | | | 1,651,316 | |
| | 1,580,000 | | | Philadelphia, PA Authority for Industrial Devel. (Stapeley Germantown)1 | | | 5.125 | | | 01/01/2021 | | | 1,513,972 | |
| | 3,090,000 | | | Philadelphia, PA Authority for Industrial Devel. (Tacony Academy Charter School) | | | 7.000 | | | 06/15/2043 | | | 3,479,309 | |
| | 2,000,000 | | | Philadelphia, PA Authority for Industrial Devel. (Tacony Academy Charter School) | | | 6.750 | | | 06/15/2033 | | | 2,227,380 | |
| | 280,000 | | | Philadelphia, PA Authority for Industrial Devel. Senior Living (GIH/PPAM)1 | | | 5.125 | | | 07/01/2016 | | | 282,811 | |
| | 1,755,000 | | | Philadelphia, PA Authority for Industrial Devel. Senior Living (Miriam and Robert M. Rieder House)1 | | | 6.100 | | | 07/01/2033 | | | 1,756,895 | |
| | 3,000,000 | | | Philadelphia, PA Authority for Industrial Devel. Senior Living (Presbyterian Homes Germantown)1 | | | 5.625 | | | 07/01/2035 | | | 3,040,830 | |
| | 6,260,000 | | | Philadelphia, PA GO1 | | | 6.500 | | | 08/01/2041 | | | 7,479,636 | |
| | 1,005,000 | | | Philadelphia, PA H&HEFA (Centralized Comprehensive Human Services)1 | | | 7.250 | | | 01/01/2021 | | | 1,008,236 | |
| | 250,000 | | | Philadelphia, PA Hsg. Authority1 | | | 5.000 | | | 12/01/2021 | | | 253,045 | |
| | 1,000,000 | | | Philadelphia, PA Municipal Authority1 | | | 6.500 | | | 04/01/2034 | | | 1,141,640 | |
| | 50,000 | | | Philadelphia, PA Parking Authority | | | 5.125 | | | 02/15/2018 | | | 50,206 | |
| | 20,000 | | | Philadelphia, PA Parking Authority, Series A1 | | | 5.250 | | | 02/15/2029 | | | 20,072 | |
| | 5,000 | | | Philadelphia, PA Redevel. Authority (Beech Student Hsg. Complex), Series A1 | | | 5.500 | | | 07/01/2035 | | | 5,005 | |
| | 1,500,000 | | | Philadelphia, PA Redevel. Authority (Beech Student Hsg. Complex), Series A1 | | | 5.625 | | | 07/01/2028 | | | 1,501,500 | |
| | 1,000,000 | | | Philadelphia, PA Redevel. Authority (Beech Student Hsg. Complex), Series A1 | | | 5.625 | | | 07/01/2023 | | | 1,001,290 | |
| | 110,000 | | | Philadelphia, PA Redevel. Authority (Multifamily Hsg.)1,2 | | | 5.450 | | | 02/01/2023 | | | 111,405 | |
28 OPPENHEIMER ROCHESTER PENNSYLVANIA MUNICIPAL FUND
| | | | | | | | | | | | | | |
| Principal | | | | | | | | | | | |
| Amount | | | | | Coupon | | | Maturity | | Value | |
| Pennsylvania (Continued) | | | | | | | | | | |
| | $ 4,100,000 | | | Philadelphia, PA Redevel. Authority (Pavilion Apartments)1 | | | 6.250 | % | | 10/01/2032 | | $ | 4,106,273 | |
| | 2,285,000 | | | Philadelphia, PA Redevel. Authority (Pavilion Apartments)1 | | | 6.000 | | | 10/01/2023 | | | 2,288,953 | |
| | 50,000 | | | Philadelphia, PA Redevel. Authority (Philadelphia Corp. for Aging)1 | | | 5.250 | | | 07/01/2031 | | | 50,128 | |
| | 45,000 | | | Philadelphia, PA School District1 | | | 6.000 | | | 09/01/2038 | | | 51,846 | |
| | 5,000 | | | Philadelphia, PA School District1 | | | 6.000 | | | 09/01/2038 | | | 5,761 | |
| | 3,335,000 | | | Philadelphia, PA School District1 | | | 6.000 | | | 09/01/2038 | | | 3,730,131 | |
| | 30,000 | | | Pittsburgh, PA Public Parking Authority1 | | | 5.000 | | | 12/01/2023 | | | 30,391 | |
| | 2,810,000 | | | Pittsburgh, PA Urban Redevel. Authority (Marian Plaza)1 | | | 6.130 | | | 01/20/2043 | | | 2,938,277 | |
| | 900,000 | | | Reading, PA Hsg. Auth (Goggle Works Apts.)1 | | | 5.625 | | | 06/01/2042 | | | 936,009 | |
| | 2,895,000 | | | Reading, PA Hsg. Auth (Goggle Works Apts.)1 | | | 5.875 | | | 06/01/2052 | | | 3,032,773 | |
| | 15,000 | | | Schuylkill County, PA IDA (Ascension Health Credit Group) | | | 5.000 | | | 11/01/2019 | | | 15,059 | |
| | 55,000 | | | Schuylkill County, PA IDA (Ascension Health Credit Group) | | | 5.000 | | | 11/01/2028 | | | 55,205 | |
| | 10,000 | | | Schuylkill County, PA IDA (DOCNHS/BSVHS/WMHS Obligated Group) | | | 5.000 | | | 11/01/2028 | | | 10,037 | |
| | 6,450,000 | | | Susquehanna, PA Area Regional Airport Authority1 | | | 6.500 | | | 01/01/2038 | | | 6,895,953 | |
| | 7,100,000 | | | Washington County, PA Redevel. Authority (Victory Centre)1 | | | 5.450 | | | 07/01/2035 | | | 7,201,175 | |
| | 10,000,000 | | | Wilkes-Barre, PA Finance Authority (Wilkes University)1 | | | 5.000 | | | 03/01/2037 | | | 10,183,900 | |
| | | | | | | | | | | | | 586,021,911 | |
| U.S. Possessions—38.0% | | | | | | | | | | |
| | 700,000 | | | Guam Hsg. Corp. (Single Family Mtg.)1 | | | 5.750 | | | 09/01/2031 | | | 761,404 | |
| | 235,000 | | | Guam Power Authority, Series A | | | 5.000 | | | 10/01/2024 | | | 277,502 | |
| | 185,000 | | | Guam Power Authority, Series A | | | 5.000 | | | 10/01/2023 | | | 218,729 | |
| | 420,000 | | | Guam Power Authority, Series A | | | 5.000 | | | 10/01/2030 | | | 484,558 | |
| | 38,902,000 | | | Guam Tobacco Settlement Economic Devel. & Commerce Authority (TASC) | | | 7.250 | 4 | | 06/01/2057 | | | 675,339 | |
| | 1,500,000 | | | Guam Tobacco Settlement Economic Devel. & Commerce Authority (TASC)1 | | | 5.625 | | | 06/01/2047 | | | 1,275,765 | |
| | 320,000 | | | Northern Mariana Islands Commonwealth, Series A1 | | | 5.000 | | | 06/01/2017 | | | 322,160 | |
| | 855,000 | | | Northern Mariana Islands Commonwealth, Series A1 | | | 5.000 | | | 10/01/2022 | | | 827,589 | |
| | 1,395,000 | | | Northern Mariana Islands Ports Authority, Series A1 | | | 6.250 | | | 03/15/2028 | | | 1,241,118 | |
| | 2,175,000 | | | Northern Mariana Islands Ports Authority, Series A1 | | | 5.500 | | | 03/15/2031 | | | 1,967,353 | |
| | 1,025,000 | | | Northern Mariana Islands Ports Authority, Series A1 | | | 6.600 | | | 03/15/2028 | | | 1,022,294 | |
| | 4,500,000 | | | Puerto Rico Aqueduct & Sewer Authority | | | 6.125 | 5 | | 07/01/2024 | | | 3,372,660 | |
| | 1,460,000 | | | Puerto Rico Aqueduct & Sewer Authority | | | 5.750 | | | 07/01/2037 | | | 1,041,170 | |
| | 810,000 | | | Puerto Rico Aqueduct & Sewer Authority | | | 5.250 | | | 07/01/2029 | | | 576,372 | |
| | 1,005,000 | | | Puerto Rico Aqueduct & Sewer Authority | | | 6.000 | | | 07/01/2047 | | | 709,269 | |
| | 3,000,000 | | | Puerto Rico Aqueduct & Sewer Authority | | | 5.125 | | | 07/01/2037 | | | 2,075,700 | |
| | 69,645,000 | | | Puerto Rico Children’s Trust Fund (TASC)1 | | | 5.500 | | | 05/15/2039 | | | 69,640,125 | |
| | 379,890,000 | | | Puerto Rico Children’s Trust Fund (TASC) | | | 6.558 | 4 | | 05/15/2050 | | | 30,527,960 | |
| | 136,000,000 | | | Puerto Rico Children’s Trust Fund (TASC) | | | 7.325 | 4 | | 05/15/2055 | | | 3,681,520 | |
| | 1,817,000,000 | | | Puerto Rico Children’s Trust Fund (TASC) | | | 7.625 | 4 | | 05/15/2057 | | | 31,906,520 | |
| | 52,750,000 | | | Puerto Rico Children’s Trust Fund (TASC)1 | | | 5.625 | | | 05/15/2043 | | | 52,854,972 | |
29 OPPENHEIMER ROCHESTER PENNSYLVANIA MUNICIPAL FUND
STATEMENT OF INVESTMENTS Continued
| | | | | | | | | | | | | | |
| Principal | | | | | | | | | | | |
| Amount | | | | | Coupon | | | Maturity | | Value | |
| U.S. Possessions (Continued) | | | | | | | | | | |
| | $ 3,000,000 | | | Puerto Rico Commonwealth GO | | | 5.750 | % | | 07/01/2041 | | $ | 1,887,450 | |
| | 5,000,000 | | | Puerto Rico Commonwealth GO | | | 5.500 | | | 07/01/2026 | | | 3,237,650 | |
| | 7,360,000 | | | Puerto Rico Commonwealth GO | | | 5.500 | | | 07/01/2039 | | | 4,620,976 | |
| | 9,000,000 | | | Puerto Rico Commonwealth GO | | | 5.750 | | | 07/01/2036 | | | 5,717,430 | |
| | 15,000 | | | Puerto Rico Commonwealth GO1 | | | 6.000 | | | 07/01/2027 | | | 15,043 | |
| | 2,000,000 | | | Puerto Rico Commonwealth GO | | | 5.000 | | | 07/01/2020 | | | 1,322,080 | |
| | 11,500,000 | | | Puerto Rico Commonwealth GO | | | 8.000 | | | 07/01/2035 | | | 8,008,255 | |
| | 790,000 | | | Puerto Rico Commonwealth GO | | | 6.000 | | | 07/01/2028 | | | 512,489 | |
| | 2,500,000 | | | Puerto Rico Commonwealth GO | | | 5.375 | | | 07/01/2033 | | | 1,572,475 | |
| | 3,000,000 | | | Puerto Rico Commonwealth GO | | | 5.125 | | | 07/01/2028 | | | 1,901,550 | |
| | 3,000,000 | | | Puerto Rico Electric Power Authority, Series A8 | | | 6.750 | | | 07/01/2036 | | | 1,739,880 | |
| | 3,325,000 | | | Puerto Rico Electric Power Authority, Series A8 | | | 5.000 | | | 07/01/2042 | | | 1,929,730 | |
| | 4,920,000 | | | Puerto Rico Electric Power Authority, Series A8 | | | 5.000 | | | 07/01/2029 | | | 2,854,633 | |
| | 1,760,000 | | | Puerto Rico Electric Power Authority, Series AAA8 | | | 5.250 | | | 07/01/2030 | | | 1,021,205 | |
| | 5,540,000 | | | Puerto Rico Electric Power Authority, Series AAA8 | | | 5.250 | | | 07/01/2027 | | | 3,214,253 | |
| | 1,510,000 | | | Puerto Rico Electric Power Authority, Series AAA8 | | | 5.250 | | | 07/01/2025 | | | 876,842 | |
| | 1,435,000 | | | Puerto Rico Electric Power Authority, Series AAA8 | | | 5.250 | | | 07/01/2024 | | | 833,620 | |
| | 3,505,000 | | | Puerto Rico Electric Power Authority, Series AAA8 | | | 5.250 | | | 07/01/2031 | | | 2,033,636 | |
| | 3,000,000 | | | Puerto Rico Electric Power Authority, Series CCC8 | | | 5.250 | | | 07/01/2027 | | | 1,740,570 | |
| | 6,000,000 | | | Puerto Rico Electric Power Authority, Series SS | | | 5.000 | | | 07/01/2025 | | | 5,647,140 | |
| | 1,450,000 | | | Puerto Rico Electric Power Authority, Series TT8 | | | 5.000 | | | 07/01/2032 | | | 841,362 | |
| | 1,670,000 | | | Puerto Rico Electric Power Authority, Series WW8 | | | 5.000 | | | 07/01/2028 | | | 968,967 | |
| | 2,445,000 | | | Puerto Rico Electric Power Authority, Series XX8 | | | 5.250 | | | 07/01/2040 | | | 1,418,662 | |
| | 725,000 | | | Puerto Rico Electric Power Authority, Series ZZ8 | | | 5.000 | | | 07/01/2022 | | | 422,088 | |
| | 1,000,000 | | | Puerto Rico Highway & Transportation Authority | | | 5.300 | | | 07/01/2035 | | | 683,350 | |
| | 10,000 | | | Puerto Rico Highway & Transportation Authority, Series A | | | 5.000 | | | 07/01/2038 | | | 3,206 | |
| | 325,000 | | | Puerto Rico Highway & Transportation Authority, Series H | | | 5.000 | | | 07/01/2028 | | | 104,188 | |
| | 700,000 | | | Puerto Rico Highway & Transportation Authority, Series N | | | 5.250 | | | 07/01/2039 | | | 411,075 | |
| | 270,000 | | | Puerto Rico Infrastructure | | | 5.000 | | | 07/01/2041 | | | 69,447 | |
| | 1,750,000 | | | Puerto Rico Infrastructure | | | 6.400 | 4 | | 07/01/2043 | | | 208,425 | |
| | 1,400,000 | | | Puerto Rico Infrastructure (Mepsi Campus)1 | | | 6.500 | | | 10/01/2037 | | | 835,478 | |
| | 185,000 | | | Puerto Rico ITEMECF (Ana G. Mendez University) | | | 5.375 | | | 04/01/2042 | | | 155,750 | |
| | 200,000 | | | Puerto Rico ITEMECF (Ana G. Mendez University) | | | 5.000 | | | 04/01/2027 | | | 173,624 | |
| | 1,250,000 | | | Puerto Rico ITEMECF (Ana G. Mendez University)1 | | | 5.000 | | | 03/01/2036 | | | 1,021,675 | |
| | 125,000 | | | Puerto Rico ITEMECF (Ana G. Mendez University) | | | 5.125 | | | 04/01/2032 | | | 106,059 | |
| | 360,000 | | | Puerto Rico ITEMECF (IEP/HESL/HECR Obligated Group) | | | 5.750 | | | 06/01/2019 | | | 152,881 | |
| | 1,500,000 | | | Puerto Rico Public Buildings Authority | | | 6.500 | | | 07/01/2030 | | | 913,035 | |
| | 1,265,000 | | | Puerto Rico Public Buildings Authority | | | 6.000 | | | 07/01/2019 | | | 851,914 | |
| | 3,000,000 | | | Puerto Rico Public Buildings Authority | | | 5.750 | 9 | | 07/01/2034 | | | 2,219,130 | |
| | 1,000,000 | | | Puerto Rico Public Buildings Authority | | | 6.750 | | | 07/01/2036 | | | 612,560 | |
| | 115,000 | | | Puerto Rico Public Buildings Authority | | | 6.250 | | | 07/01/2023 | | | 73,438 | |
| | 2,070,000 | | | Puerto Rico Public Buildings Authority | | | 6.000 | | | 07/01/2041 | | | 1,208,652 | |
| | 1,015,000 | | | Puerto Rico Public Buildings Authority, Series D | | | 5.250 | | | 07/01/2036 | | | 572,358 | |
| | 5,725,000 | | | Puerto Rico Public Finance Corp., Series B7 | | | 5.500 | | | 08/01/2031 | | | 715,625 | |
| | 7,385,000 | | | Puerto Rico Sales Tax Financing Corp., Series A | | | 5.500 | | | 08/01/2037 | | | 3,033,906 | |
| | 30,000,000 | | | Puerto Rico Sales Tax Financing Corp., Series A | | | 7.280 | 4 | | 08/01/2034 | | | 3,904,500 | |
30 OPPENHEIMER ROCHESTER PENNSYLVANIA MUNICIPAL FUND
| | | | | | | | | | | | | | | | |
Principal Amount | | | | | Coupon | | | Maturity | | | Value | |
| | |
| U.S. Possessions (Continued) | |
| | $ 950,000 | | | Puerto Rico Sales Tax Financing Corp., Series A | | | 5.500 | % | | | 08/01/2042 | | | $ | 381,976 | |
| | 3,000,000 | | | Puerto Rico Sales Tax Financing Corp., Series A | | | 5.375 | | | | 08/01/2039 | | | | 1,225,050 | |
| | 5,000,000 | | | Puerto Rico Sales Tax Financing Corp., Series A | | | 5.750 | | | | 08/01/2037 | | | | 2,066,550 | |
| | 5,000,000 | | | Puerto Rico Sales Tax Financing Corp., Series A | | | 6.375 | | | | 08/01/2039 | | | | 2,141,350 | |
| | 3,000,000 | | | Puerto Rico Sales Tax Financing Corp., Series A | | | 6.500 | | | | 08/01/2044 | | | | 1,292,250 | |
| | 18,015,000 | | | Puerto Rico Sales Tax Financing Corp., Series C | | | 6.380 | 4 | | | 08/01/2038 | | | | 1,611,802 | |
| | 5,500,000 | | | Puerto Rico Sales Tax Financing Corp., Series C | | | 6.000 | | | | 08/01/2039 | | | | 2,314,290 | |
| | 2,170,000 | | | Puerto Rico Sales Tax Financing Corp., Series C | | | 6.000 | | | | 08/01/2042 | | | | 913,071 | |
| | 22,130,000 | | | Puerto Rico Sales Tax Financing Corp., Series C | | | 5.750 | | | | 08/01/2057 | | | | 13,529,618 | |
| | 3,235,000 | | | University of Puerto Rico, Series P | | | 5.000 | | | | 06/01/2030 | | | | 1,525,950 | |
| | 1,300,000 | | | University of Puerto Rico, Series Q | | | 5.000 | | | | 06/01/2030 | | | | 613,210 | |
| | 17,450,000 | | | V.I. Tobacco Settlement Financing Corp. | | | 6.250 | 4 | | | 05/15/2035 | | | | 2,364,475 | |
| | 7,000,000 | | | V.I. Tobacco Settlement Financing Corp. | | | 7.625 | 4 | | | 05/15/2035 | | | | 557,900 | |
| | 4,150,000 | | | V.I. Tobacco Settlement Financing Corp. | | | 6.875 | 4 | | | 05/15/2035 | | | | 458,284 | |
| | 2,195,000 | | | V.I. Tobacco Settlement Financing Corp. | | | 6.500 | 4 | | | 05/15/2035 | | | | 265,705 | |
| | 2,235,000 | | | V.I. Tobacco Settlement Financing Corp. (TASC)1 | | | 5.000 | | | | 05/15/2031 | | | | 2,213,902 | |
| | 20,000 | | | V.I. Tobacco Settlement Financing Corp. (TASC)1 | | | 5.000 | | | | 05/15/2021 | | | | 19,999 | |
| | | | | | | | | | | | | | | 311,323,723 | |
| | | | | | | | | | | | | | | | | |
| Total Investments, at Value (Cost $1,016,588,343)—109.6% | | | | | | | | 897,345,634 | |
| Net Other Assets (Liabilities)—(9.6) | | | | | | | | (78,688,984) | |
| Net Assets—100.0% | | | | | | | $ | 818,656,650 | |
| | | | | | | | | | | | | | | | |
Footnotes to Statement of Investments
1. All or a portion of the security position has been segregated for collateral to cover borrowings. See Note 8 of the accompanying Notes.
2. All or a portion of the security position is when-issued or delayed delivery to be delivered and settled after period end. See Note 4 of the accompanying Notes.
3. Security represents the underlying municipal bond with respect to an inverse floating rate security held by the Fund. The bond was purchased by the Fund and subsequently transferred to a trust, which issued the related inverse floating rate security. See Note 4 of the accompanying Notes.
4. Zero coupon bond reflects effective yield on the date of purchase.
5. Denotes a step bond: a zero coupon bond that converts to a fixed or variable interest rate at a designated future date.
6. This security is accruing partial income at an anticipated effective rate based on expected interest and/or principal payments. The rate shown is the original contractual interest rate.
7. This security is not accruing income because the issuer has missed an interest payment on it and/or is not anticipated to make future interest and or principal payments. The rate shown is the contractual interest rate. See Note 4 of the accompanying Notes.
8. Subject to a forbearance agreement. Rate shown is the contractual interest rate. See Note 4 of the accompanying Notes.
9. Represents the current interest rate for a variable or increasing rate security.
10. Interest or dividend is paid-in-kind, when applicable.
31 OPPENHEIMER ROCHESTER PENNSYLVANIA MUNICIPAL FUND
STATEMENT OF INVESTMENTS Continued
To simplify the listings of securities, abbreviations are used per the table below:
| | |
| ARC | | Assoc. of Retarded Citizens |
| BSVHS | | Baptist/St. Vincent’s Health System |
| DOCNHS | | Daughters of Charity National Health Systems |
| EDFA | | Economic Devel. Finance Authority |
| GIH | | Germantown Interfaith Housing |
| GO | | General Obligation |
| GPA | | General Purpose Authority |
| H&EFA | | Health and Educational Facilities Authority |
| H&HEFA | | Hospitals and Higher Education Facilities Authority |
| HDA | | Hospital Devel. Authority |
| HEBA | | Higher Education Building Authority |
| HECR | | Hospital Episcopal Cristo Redentor |
| HEFA | | Higher Education Facilities Authority |
| HESL | | Hospital Episcopal San Lucas |
| IDA | | Industrial Devel. Agency |
| IEP | | Iglesia Episcopal Puertorriquena |
| IRSch | | Iron Range School |
| ITEMECF | | Industrial, Tourist, Educational, Medical and Environmental Community Facilities |
| KC | | Kidspeace Corporation |
| KCH | | Kidspeace Childrens Hospital |
| KMAKNC | | Kidspeace Mesabi Academy |
| KNCONM | | Kidspeace National Centers of North America |
| KNCONY | | Kidspeace National Centers of New York |
| MAS | | Mercy Adult Services |
| MCMCSPA | | Mercy Catholic Medical Center of Southeastern Pennsylvania |
| MHH | | Mercy Haverford Foundation |
| MHP | | Mercy Health Plan |
| MHSSPA | | Mercy Health System of Southeastern Pennsylvania |
| PPAM | | Philadelphia Presbytery Apartments of Morrisville |
| RITES | | Residual Interest Tax Exempt Security |
| RR | | Residential Resources |
| RRDC | | Residential Resources Devel. Corp. |
| RRSW | | Residential Resources Southwest |
| TASC | | Tobacco Settlement Asset-Backed Bonds |
| UPMC | | University of Pittsburgh Medical Center |
| V.I. | | United States Virgin Islands |
| WMHS | | Western Maryland Health Systems |
See accompanying Notes to Financial Statements.
32 OPPENHEIMER ROCHESTER PENNSYLVANIA MUNICIPAL FUND
STATEMENT OF ASSETS AND LIABILITIES July 31, 2015
| | | | |
Assets | | | | |
Investments, at value (cost $1,016,588,343)—see accompanying statement of investments | | $ | 897,345,634 | |
Cash | | | 625,559 | |
Receivables and other assets: | | | | |
Interest | | | 11,245,971 | |
Shares of beneficial interest sold | | | 249,750 | |
Investments sold on a when-issued or delayed delivery basis | | | 196,072 | |
Other | | | 203,679 | |
Total assets | | | 909,866,665 | |
Liabilities | | | | |
Payables and other liabilities: | | | | |
Payable for short-term floating rate notes issued (See Note 4) | | | 69,805,000 | |
Payable for borrowings (See Note 8) | | | 18,800,000 | |
Shares of beneficial interest redeemed | | | 1,513,381 | |
Dividends | | | 688,647 | |
Trustees’ compensation | | | 148,975 | |
Distribution and service plan fees | | | 107,197 | |
Shareholder communications | | | 8,287 | |
Interest expense on borrowings | | | 3,587 | |
Other | | | 134,941 | |
Total liabilities | | | 91,210,015 | |
Net Assets | | $ | 818,656,650 | |
| | | | |
| | | | |
Composition of Net Assets | | | | |
Paid-in capital | | $ | 1,049,264,044 | |
Accumulated net investment income | | | 12,265,975 | |
Accumulated net realized loss on investments | | | (123,630,660) | |
Net unrealized depreciation on investments | | | (119,242,709) | |
Net Assets | | $ | 818,656,650 | |
| | | | |
| | | | |
Net Asset Value Per Share | | | | |
Class A Shares: | | | | |
| Net asset value and redemption price per share (based on net assets of $552,145,972 and 52,629,754 shares of beneficial interest outstanding) | | | $10.49 | |
| Maximum offering price per share (net asset value plus sales charge of 4.75% of offering price) | | | $11.01 | |
Class B Shares: | | | | |
| Net asset value, redemption price (excludes applicable contingent deferred sales charge) and offering price per share (based on net assets of $11,078,114 and 1,056,541 shares of beneficial interest outstanding) | | | $10.49 | |
Class C Shares: | | | | |
| Net asset value, redemption price (excludes applicable contingent deferred sales charge) and offering price per share (based on net assets of $226,295,490 and 21,620,527 shares of beneficial interest outstanding) | | | $10.47 | |
Class Y Shares: | | | | |
| Net asset value, redemption price and offering price per share (based on net assets of $29,137,074 and 2,776,175 shares of beneficial interest outstanding) | | | $10.50 | |
See accompanying Notes to Financial Statements.
33 OPPENHEIMER ROCHESTER PENNSYLVANIA MUNICIPAL FUND
STATEMENT OF OPERATIONS For the Year Ended July 31, 2015
| | | | |
Investment Income | | | | |
Interest | | $ | 60,431,558 | |
Expenses | | | | |
Management fees | | | 4,392,958 | |
Distribution and service plan fees: | | | | |
Class A | | | 869,118 | |
Class B | | | 131,449 | |
Class C | | | 2,164,905 | |
Transfer and shareholder servicing agent fees: | | | | |
Class A | | | 592,182 | |
Class B | | | 14,611 | |
Class C | | | 240,968 | |
Class Y | | | 30,533 | |
Shareholder communications: | | | | |
Class A | | | 17,000 | |
Class B | | | 923 | |
Class C | | | 8,449 | |
Class Y | | | 983 | |
Borrowing fees | | | 934,963 | |
Interest expense and fees on short-term floating rate notes issued (See Note 4) | | | 624,116 | |
Trustees’ compensation | | | 13,411 | |
Interest expense on borrowings | | | 11,158 | |
Custodian fees and expenses | | | 4,836 | |
Other | | | 111,420 | |
Total expenses | | | 10,163,983 | |
Net Investment Income | | | 50,267,575 | |
Realized and Unrealized Gain (Loss) | | | | |
Net realized gain on investments | | | 7,737,755 | |
Net change in unrealized appreciation/depreciation on investments | | | (348,069) | |
Net Increase in Net Assets Resulting from Operations | | $ | 57,657,261 | |
| | | | |
See accompanying Notes to Financial Statements.
34 OPPENHEIMER ROCHESTER PENNSYLVANIA MUNICIPAL FUND
STATEMENTS OF CHANGES IN NET ASSETS
| | | | | | | | | | |
| | | Year Ended
July 31, 2015 | | | | | Year Ended
July 31, 2014 | |
Operations | | | | | | | | | | |
Net investment income | | $ | 50,267,575 | | | | | $ | 59,299,359 | |
Net realized gain (loss) | | | 7,737,755 | | | | | | (6,473,581) | |
Net change in unrealized appreciation/depreciation | | | (348,069) | | | | | | (20,998,208) | |
Net increase in net assets resulting from operations | | | 57,657,261 | | | | | | 31,827,570 | |
| | | | | | | | | | |
Dividends and/or Distributions to Shareholders | | | | | | | | | | |
Dividends from net investment income: | | | | | | | | | | |
Class A | | | (33,610,451) | | | | | | (36,896,556) | |
Class B | | | (717,638) | | | | | | (1,058,123) | |
Class C | | | (11,894,471) | | | | | | (13,216,533) | |
Class Y | | | (1,779,180) | | | | | | (1,718,189) | |
| | | (48,001,740) | | | | | | (52,889,401) | |
| | | | | | | | | | |
Beneficial Interest Transactions | | | | | | | | | | |
Net increase (decrease) in net assets resulting from beneficial interest transactions: | | | | | | | | | | |
Class A | | | (41,348,855) | | | | | | (136,470,700) | |
Class B | | | (6,005,142) | | | | | | (9,126,545) | |
Class C | | | (12,518,925) | | | | | | (61,970,892) | |
Class Y | | | 2,584,679 | | | | | | (5,698,171) | |
| | | (57,288,243) | | | | | | (213,266,308) | |
| | | | | | | | | | |
Net Assets | | | | | | | | | | |
Total decrease | | | (47,632,722) | | | | | | (234,328,139) | |
Beginning of period | | | 866,289,372 | | | | | | 1,100,617,511 | |
End of period (including accumulated net investment income of $12,265,975 and $11,510,289, respectively) | | $ | 818,656,650 | | | | | $ | 866,289,372 | |
| | | | |
See accompanying Notes to Financial Statements.
35 OPPENHEIMER ROCHESTER PENNSYLVANIA MUNICIPAL FUND
STATEMENT OF CASH FLOWS For the Year Ended July 31, 2015
| | | | |
Cash Flows from Operating Activities | | | | |
Net increase in net assets from operations | | | $ 57,657,261 | |
Adjustments to reconcile net increase in net assets from operations to net cash provided by operating activities: | | | | |
Purchase of investment securities | | | (113,324,618) | |
Proceeds from disposition of investment securities | | | 188,974,870 | |
Short-term investment securities, net | | | (6,365,888) | |
Premium amortization | | | 1,635,592 | |
Discount accretion | | | (12,602,159) | |
Net realized gain on investments | | | (7,737,755) | |
Net change in unrealized appreciation/depreciation on investments | | | 348,069 | |
Change in assets: | | | | |
Decrease in other assets | | | 349,613 | |
Decrease in interest receivable | | | 1,581,207 | |
Decrease in receivable for securities sold | | | 1,508,928 | |
Change in liabilities: | | | | |
Increase in other liabilities | | | 47,872 | |
Net cash provided by operating activities | | | 112,072,992 | |
|
| | |
Cash Flows from Financing Activities | | | | |
Proceeds from borrowings | | | 103,900,000 | |
Payments on borrowings | | | (85,100,000) | |
Payments on short-term floating rate notes issued | | | (23,750,000) | |
Payment on bank overdraft | | | (1,084,250) | |
Proceeds from shares sold | | | 96,330,804 | |
Payments on shares redeemed | | | (194,334,670) | |
Cash distributions paid | | | (7,409,317) | |
Net cash used in financing activities | | | (111,447,433) | |
Net increase in cash | | | 625,559 | |
Cash, beginning balance | | | — | |
Cash, ending balance | | | $ 625,559 | |
| | | | |
Supplemental disclosure of cash flow information:
Noncash financing activities not included herein consist of reinvestment of dividends and distributions of $40,956,131.
Cash paid for interest on borrowings—$8,539.
Cash paid for interest on short-term floating rate notes issued—$624,116.
See accompanying Notes to Financial Statements.
36 OPPENHEIMER ROCHESTER PENNSYLVANIA MUNICIPAL FUND
FINANCIAL HIGHLIGHTS
| | | | | | | | | | | | | | | | | | | | |
| Class A | | Year Ended
July 31, 2015 | | | Year Ended
July 31, 2014 | | | Year Ended
July 31, 2013 | | | Year Ended
July 31, 2012 | | | Year Ended
July 29,
20111 | |
Per Share Operating Data | | | | | | | | | | | | | | | | | | | | |
Net asset value, beginning of period | | $ | 10.38 | | | $ | 10.53 | | | $ | 11.47 | | | $ | 10.60 | | | $ | 10.96 | |
Income (loss) from investment operations: | | | | | | | | | | | | | | | | | | | | |
Net investment income2 | | | 0.63 | | | | 0.67 | | | | 0.61 | | | | 0.63 | | | | 0.69 | |
Net realized and unrealized gain (loss) | | | 0.09 | | | | (0.22) | | | | (0.94) | | | | 0.90 | | | | (0.39) | |
Total from investment operations | | | 0.72 | | | | 0.45 | | | | (0.33) | | | | 1.53 | | | | 0.30 | |
Dividends and/or distributions to shareholders: | | | | | | | | | | | | | | | | | | | | |
Dividends from net investment income | | | (0.61) | | | | (0.60) | | | | (0.61) | | | | (0.66) | | | | (0.66) | |
Net asset value, end of period | | $ | 10.49 | | | $ | 10.38 | | | $ | 10.53 | | | $ | 11.47 | | | $ | 10.60 | |
| | | | |
|
| | |
Total Return, at Net Asset Value3 | | | 6.98% | | | | 4.57% | | | | (3.13)% | | | | 14.84% | | | | 2.98% | |
|
| | |
Ratios/Supplemental Data | | | | | | | | | | | | | | | | | | | | |
Net assets, end of period (in thousands) | | $ | 552,146 | | | $ | 586,870 | | | $ | 737,142 | | | $ | 795,924 | | | $ | 723,618 | |
Average net assets (in thousands) | | $ | 589,000 | | | $ | 624,096 | | | $ | 812,430 | | | $ | 752,625 | | | $ | 760,121 | |
Ratios to average net assets:4 | | | | | | | | | | | | | | | | | | | | |
| Net investment income | | | 5.93% | | | | 6.60% | | | | 5.32% | | | | 5.67% | | | | 6.50% | |
| Expenses excluding interest and fees on short-term floating rate notes issued and interest and fees from borrowings | | | 0.77% | | | | 0.76% | | | | 0.69% | | | | 0.70% | | | | 0.70% | |
| Interest and fees from borrowings | | | 0.11% | | | | 0.14% | | | | 0.09% | | | | 0.12% | | | | 0.13% | |
Interest and fees on short-term floating rate notes issued5 | | | 0.07% | | | | 0.13% | | | | 0.11% | | | | 0.16% | | | | 0.20% | |
Total expenses | | | 0.95% | | | | 1.03% | | | | 0.89% | | | | 0.98% | | | | 1.03% | |
| Expenses after payments, waivers and/or reimbursements and reduction to custodian expenses | | | 0.95% | | | | 1.03% | | | | 0.88% | | | | 0.97% | | | | 1.03% | |
Portfolio turnover rate | | | 12% | | | | 6% | | | | 10% | | | | 15% | | | | 16% | |
1. July 29, 2011 represents the last business day of the Fund’s reporting period.
2. Per share amounts calculated based on the average shares outstanding during the period.
3. Assumes an initial investment on the business day before the first day of the fiscal period, with all dividends and distributions reinvested in additional shares on the reinvestment date, and redemption at the net asset value calculated on the last business day of the fiscal period. Sales charges are not reflected in the total returns. Total returns are not annualized for periods less than one full year. Returns do not reflect the deduction of taxes that a shareholder would pay on fund distributions or the redemption of fund shares. The returns do not include adjustments in accordance with generally accepted accounting principles required at the period end for financial reporting purposes.
4. Annualized for periods less than one full year.
5. Interest and fee expense relates to the Fund’s liability for short-term floating rate notes issued in conjunction with inverse floating rate security transactions.
See accompanying Notes to Financial Statements.
37 OPPENHEIMER ROCHESTER PENNSYLVANIA MUNICIPAL FUND
FINANCIAL HIGHLIGHTS Continued
| | | | | | | | | | | | | | | | | | | | |
| Class B | | Year Ended
July 31, 2015 | | | Year Ended
July 31, 2014 | | | Year Ended
July 31, 2013 | | | Year Ended
July 31, 2012 | | | Year Ended
July 29,
20111 | |
Per Share Operating Data | | | | | | | | | | | | | | | | | | | | |
Net asset value, beginning of period | | $ | 10.37 | | | $ | 10.52 | | | $ | 11.47 | | | $ | 10.59 | | | $ | 10.95 | |
Income (loss) from investment operations: | | | | | | | | | | | | | | | | | | | | |
Net investment income2 | | | 0.55 | | | | 0.59 | | | | 0.51 | | | | 0.54 | | | | 0.60 | |
Net realized and unrealized gain (loss) | | | 0.10 | | | | (0.22) | | | | (0.95) | | | | 0.91 | | | | (0.38) | |
Total from investment operations | | | 0.65 | | | | 0.37 | | | | (0.44) | | | | 1.45 | | | | 0.22 | |
Dividends and/or distributions to shareholders: | | | | | | | | | | | | | | | | | | | | |
Dividends from net investment income | | | (0.53) | | | | (0.52) | | | | (0.51) | | | | (0.57) | | | | (0.58) | |
Net asset value, end of period | | $ | 10.49 | | | $ | 10.37 | | | $ | 10.52 | | | $ | 11.47 | | | $ | 10.59 | |
| | | | |
|
| | |
Total Return, at Net Asset Value3 | | | 6.27% | | | | 3.75% | | | | (4.03)% | | | | 14.02% | | | | 2.13% | |
|
| | |
Ratios/Supplemental Data | | | | | | | | | | | | | | | | | | | | |
Net assets, end of period (in thousands) | | $ | 11,078 | | | $ | 16,828 | | | $ | 26,479 | | | $ | 41,662 | | | $ | 48,569 | |
Average net assets (in thousands) | | $ | 14,523 | | | $ | 20,693 | | | $ | 35,453 | | | $ | 44,543 | | | $ | 57,201 | |
Ratios to average net assets:4 | | | | | | | | | | | | | | | | | | | | |
| Net investment income | | | 5.14% | | | | 5.82% | | | | 4.47% | | | | 4.86% | | | | 5.67% | |
| Expenses excluding interest and fees on short-term floating rate notes issued and interest and fees from borrowings | | | 1.53% | | | | 1.56% | | | | 1.53% | | | | 1.54% | | | | 1.53% | |
| Interest and fees from borrowings | | | 0.11% | | | | 0.14% | | | | 0.09% | | | | 0.12% | | | | 0.13% | |
Interest and fees on short-term floating rate notes issued5 | | | 0.07% | | | | 0.13% | | | | 0.11% | | | | 0.16% | | | | 0.20% | |
| Total expenses | | | 1.71% | | | | 1.83% | | | | 1.73% | | | | 1.82% | | | | 1.86% | |
| Expenses after payments, waivers and/or reimbursements and reduction to custodian expenses | | | 1.71% | | | | 1.83% | | | | 1.72% | | | | 1.81% | | | | 1.86% | |
| Portfolio turnover rate | | | 12% | | | | 6% | | | | 10% | | | | 15% | | | | 16% | |
1. July 29, 2011 represents the last business day of the Fund’s reporting period.
2. Per share amounts calculated based on the average shares outstanding during the period.
3. Assumes an initial investment on the business day before the first day of the fiscal period, with all dividends and distributions reinvested in additional shares on the reinvestment date, and redemption at the net asset value calculated on the last business day of the fiscal period. Sales charges are not reflected in the total returns. Total returns are not annualized for periods less than one full year. Returns do not reflect the deduction of taxes that a shareholder would pay on fund distributions or the redemption of fund shares. The returns do not include adjustments in accordance with generally accepted accounting principles required at the period end for financial reporting purposes.
4. Annualized for periods less than one full year.
5. Interest and fee expense relates to the Fund’s liability for short-term floating rate notes issued in conjunction with inverse floating rate security transactions.
See accompanying Notes to Financial Statements.
38 OPPENHEIMER ROCHESTER PENNSYLVANIA MUNICIPAL FUND
| | | | | | | | | | | | | | | | | | | | |
| Class C | | Year Ended
July 31, 2015 | | | Year Ended
July 31, 2014 | | | Year Ended
July 31, 2013 | | | Year Ended
July 31, 2012 | | | Year Ended
July 29,
20111 | |
Per Share Operating Data | | | | | | | | | | | | | | | | | | | | |
Net asset value, beginning of period | | $ | 10.36 | | | $ | 10.51 | | | $ | 11.45 | | | $ | 10.58 | | | $ | 10.94 | |
Income (loss) from investment operations: | | | | | | | | | | | | | | | | | | | | |
Net investment income2 | | | 0.55 | | | | 0.60 | | | | 0.52 | | | | 0.54 | | | | 0.61 | |
Net realized and unrealized gain (loss) | | | 0.09 | | | | (0.22) | | | | (0.94) | | | | 0.91 | | | | (0.39) | |
Total from investment operations | | | 0.64 | | | | 0.38 | | | | (0.42) | | | | 1.45 | | | | 0.22 | |
Dividends and/or distributions to shareholders: | | | | | | | | | | | | | | | | | | | | |
Dividends from net investment income | | | (0.53) | | | | (0.53) | | | | (0.52) | | | | (0.58) | | | | (0.58) | |
Net asset value, end of period | | $ | 10.47 | | | $ | 10.36 | | | $ | 10.51 | | | $ | 11.45 | | | $ | 10.58 | |
| | | | |
|
| | |
Total Return, at Net Asset Value3 | | | 6.19% | | | | 3.79% | | | | (3.88)% | | | | 14.01% | | | | 2.20% | |
|
| | |
Ratios/Supplemental Data | | | | | | | | | | | | | | | | | | | | |
Net assets, end of period (in thousands) | | $ | 226,296 | | | $ | 236,269 | | | $ | 304,243 | | | $ | 332,380 | | | $ | 277,553 | |
Average net assets (in thousands) | | $ | 239,680 | | | $ | 255,808 | | | $ | 342,161 | | | $ | 302,122 | | | $ | 287,679 | |
Ratios to average net assets:4 | | | | | | | | | | | | | | | | | | | | |
Net investment income | | | 5.17% | | | | 5.84% | | | | 4.55% | | | | 4.89% | | | | 5.74% | |
| Expenses excluding interest and fees on short-term floating rate notes issued and interest and fees from borrowings | | | 1.52% | | | | 1.52% | | | | 1.46% | | | | 1.46% | | | | 1.46% | |
| Interest and fees from borrowings | | | 0.11% | | | | 0.14% | | | | 0.09% | | | | 0.12% | | | | 0.13% | |
Interest and fees on short-term floating rate notes issued5 | | | 0.07% | | | | 0.13% | | | | 0.11% | | | | 0.16% | | | | 0.20% | |
| Total expenses | | | 1.70% | | | | 1.79% | | | | 1.66% | | | | 1.74% | | | | 1.79% | |
| Expenses after payments, waivers and/or reimbursements and reduction to custodian expenses | | | 1.70% | | | | 1.79% | | | | 1.65% | | | | 1.73% | | | | 1.79% | |
| Portfolio turnover rate | | | 12% | | | | 6% | | | | 10% | | | | 15% | | | | 16% | |
1. July 29, 2011 represents the last business day of the Fund’s reporting period.
2. Per share amounts calculated based on the average shares outstanding during the period.
3. Assumes an initial investment on the business day before the first day of the fiscal period, with all dividends and distributions reinvested in additional shares on the reinvestment date, and redemption at the net asset value calculated on the last business day of the fiscal period. Sales charges are not reflected in the total returns. Total returns are not annualized for periods less than one full year. Returns do not reflect the deduction of taxes that a shareholder would pay on fund distributions or the redemption of fund shares. The returns do not include adjustments in accordance with generally accepted accounting principles required at the period end for financial reporting purposes.
4. Annualized for periods less than one full year.
5. Interest and fee expense relates to the Fund’s liability for short-term floating rate notes issued in conjunction with inverse floating rate security transactions.
See accompanying Notes to Financial Statements.
39 OPPENHEIMER ROCHESTER PENNSYLVANIA MUNICIPAL FUND
FINANCIAL HIGHLIGHTS Continued
| | | | | | | | | | | | | | | | | | | | |
| Class Y | | Year Ended
July 31,
2015 | | | Year Ended
July 31,
2014 | | | Year Ended
July 31,
2013 | | | Year Ended
July 31,
2012 | | | Period Ended July 29,
20111 | |
Per Share Operating Data | | | | | | | | | | | | | | | | | | | | |
Net asset value, beginning of period | | $ | 10.38 | | | $ | 10.53 | | | $ | 11.48 | | | $ | 10.60 | | | $ | 10.68 | |
Income (loss) from investment operations: | | | | | | | | | | | | | | | | | | | | |
Net investment income2 | | | 0.65 | | | | 0.69 | | | | 0.62 | | | | 0.64 | | | | 0.44 | |
Net realized and unrealized gain (loss) | | | 0.10 | | | | (0.22) | | | | (0.94) | | | | 0.92 | | | | (0.07) | |
Total from investment operations | | | 0.75 | | | | 0.47 | | | | (0.32) | | | | 1.56 | | | | 0.37 | |
Dividends and/or distributions to shareholders: | | | | | | | | | | | | | | | | | | | | |
Dividends from net investment income | | | (0.63) | | | | (0.62) | | | | (0.63) | | | | (0.68) | | | | (0.45) | |
Net asset value, end of period | | $ | 10.50 | | | $ | 10.38 | | | $ | 10.53 | | | $ | 11.48 | | | $ | 10.60 | |
| | | | |
|
| | |
Total Return, at Net Asset Value3 | | | 7.23% | | | | 4.72% | | | | (3.08)% | | | | 15.09% | | | | 3.73% | |
|
| | |
Ratios/Supplemental Data | | | | | | | | | | | | | | | | | | | | |
Net assets, end of period (in thousands) | | $ | 29,137 | | | $ | 26,322 | | | $ | 32,754 | | | $ | 28,701 | | | $ | 12,171 | |
Average net assets (in thousands) | | $ | 30,378 | | | $ | 28,437 | | | $ | 34,321 | | | $ | 20,110 | | | $ | 4,849 | |
Ratios to average net assets:4 | | | | | | | | | | | | | | | | | | | | |
| Net investment income | | | 6.07% | | | | 6.75% | | | | 5.46% | | | | 5.70% | | | | 6.23% | |
| Expenses excluding interest and fees on short-term floating rate notes issued and interest and fees from borrowings | | | 0.62% | | | | 0.62% | | | | 0.55% | | | | 0.56% | | | | 0.57% | |
| Interest and fees from borrowings | | | 0.11% | | | | 0.14% | | | | 0.09% | | | | 0.12% | | | | 0.13% | |
Interest and fees on short-term floating rate notes issued5 | | | 0.07% | | | | 0.13% | | | | 0.11% | | | | 0.16% | | | | 0.20% | |
| Total expenses | | | 0.80% | | | | 0.89% | | | | 0.75% | | | | 0.84% | | | | 0.90% | |
| Expenses after payments, waivers and/or reimbursements and reduction to custodian expenses | | | 0.80% | | | | 0.89% | | | | 0.74% | | | | 0.83% | | | | 0.90% | |
| Portfolio turnover rate | | | 12% | | | | 6% | | | | 10% | | | | 15% | | | | 16% | |
1. For the period from November 29, 2010 (inception of offering) to July 29, 2011 which represents the last business day of the Fund’s reporting period.
2. Per share amounts calculated based on the average shares outstanding during the period.
3. Assumes an initial investment on the business day before the first day of the fiscal period, with all dividends and distributions reinvested in additional shares on the reinvestment date, and redemption at the net asset value calculated on the last business day of the fiscal period. Sales charges are not reflected in the total returns. Total returns are not annualized for periods less than one full year. Returns do not reflect the deduction of taxes that a shareholder would pay on fund distributions or the redemption of fund shares. The returns do not include adjustments in accordance with generally accepted accounting principles required at the period end for financial reporting purposes.
4. Annualized for periods less than one full year.
5. Interest and fee expense relates to the Fund’s liability for short-term floating rate notes issued in conjunction with inverse floating rate security transactions.
See accompanying Notes to Financial Statements.
40 OPPENHEIMER ROCHESTER PENNSYLVANIA MUNICIPAL FUND
NOTES TO FINANCIAL STATEMENTS July 31, 2015
1. Significant Accounting Policies
Oppenheimer Rochester Pennsylvania Municipal Fund (the “Fund”) is a separate series of Oppenheimer Multi-State Municipal Trust, a diversified open-end management investment company registered under the Investment Company Act of 1940 (“1940 Act”), as amended. The Fund’s investment objective is to seek tax-free income. The Fund’s investment adviser is OFI Global Asset Management, Inc. (“OFI Global” or the “Manager”), a wholly-owned subsidiary of OppenheimerFunds, Inc. (“OFI” or the “Sub-Adviser”). The Manager has entered into a sub-advisory agreement with OFI.
The Fund offers Class A, Class C and Class Y shares, and previously offered Class B shares for new purchase through June 29, 2012. Subsequent to that date, no new purchases of Class B shares are permitted, however reinvestment of dividend and/or capital gain distributions and exchanges of Class B shares into and from other Oppenheimer funds will be allowed. Class A shares are sold at their offering price, which is normally net asset value plus a front-end sales charge. Class C shares are sold, and Class B shares were sold, without a front-end sales charge but may be subject to a contingent deferred sales charge (“CDSC”). Class Y shares are sold to certain institutional investors or intermediaries without either a front-end sales charge or a CDSC, however, the intermediaries may impose charges on their accountholders who beneficially own Class Y shares. All classes of shares have identical rights and voting privileges with respect to the Fund in general and exclusive voting rights on matters that affect that class alone. Earnings, net assets and net asset value per share may differ due to each class having its own expenses, such as transfer and shareholder servicing agent fees and shareholder communications, directly attributable to that class. Class A, B and C shares have separate distribution and/or service plans under which they pay fees. Class Y shares do not pay such fees. Class B shares will automatically convert to Class A shares 72 months after the date of purchase.
The following is a summary of significant accounting policies followed in the Fund’s preparation of financial statements in accordance with accounting principles generally accepted in the United States (“U.S. GAAP”).
2. Significant Accounting Policies
Security Valuation. All investments in securities are recorded at their estimated fair value, as described in Note 3.
Reporting Period End Date. The last day of the Fund’s reporting period is the last day the New York Stock Exchange was open for trading during the period. The Fund’s financial statements have been presented through that date to maintain consistency with the Fund’s net asset value calculations used for shareholder transactions.
Allocation of Income, Expenses, Gains and Losses. Income, expenses (other than those attributable to a specific class), gains and losses are allocated on a daily basis to each class of shares based upon the relative proportion of net assets represented by such class. Operating expenses directly attributable to a specific class are charged against the operations of that class.
41 OPPENHEIMER ROCHESTER PENNSYLVANIA MUNICIPAL FUND
NOTES TO FINANCIAL STATEMENTS Continued
2. Significant Accounting Policies (Continued)
Dividends and Distributions to Shareholders. Dividends and distributions to shareholders, which are determined in accordance with income tax regulations and may differ from U.S. generally accepted accounting principles, are recorded on the ex-dividend date. Income distributions, if any, are declared daily and paid monthly. Capital gain distributions, if any, are declared and paid annually.
Investment Income. Interest income is recognized on an accrual basis. Discount and premium, which are included in interest income on the Statement of Operations, are amortized or accreted daily.
Custodian Fees. “Custodian fees and expenses” in the Statement of Operations may include interest expense incurred by the Fund on any cash overdrafts of its custodian account during the period. Such cash overdrafts may result from the effects of failed trades in portfolio securities and from cash outflows resulting from unanticipated shareholder redemption activity. The Fund pays interest to its custodian on such cash overdraft at a rate equal to the 1 Month LIBOR Rate plus 2.00%. The “Reduction to custodian expenses” line item, if applicable, represents earnings on cash balances maintained by the Fund during the period. Such interest expense and other custodian fees may be paid with these earnings.
Security Transactions. Security transactions are recorded on the trade date. Realized gains and losses on securities sold are determined on the basis of identified cost.
Indemnifications. The Fund’s organizational documents provide current and former Trustees and officers with a limited indemnification against liabilities arising in connection with the performance of their duties to the Fund. In the normal course of business, the Fund may also enter into contracts that provide general indemnifications. The Fund’s maximum exposure under these arrangements is unknown as this would be dependent on future claims that may be made against the Fund. The risk of material loss from such claims is considered remote.
Federal Taxes. The Fund intends to comply with provisions of the Internal Revenue Code applicable to regulated investment companies and to distribute substantially all of its investment company taxable income, including any net realized gain on investments not offset by capital loss carryforwards, if any, to shareholders. Therefore, no federal income or excise tax provision is required. The Fund files income tax returns in U.S. federal and applicable state jurisdictions. The statute of limitations on the Fund’s tax return filings generally remains open for the three preceding fiscal reporting period ends.
The tax components of capital shown in the following table represent distribution requirements the Fund must satisfy under the income tax regulations, losses the Fund may be able to offset against income and gains realized in future years and unrealized appreciation or depreciation of securities and other investments for federal income tax purposes.
42 OPPENHEIMER ROCHESTER PENNSYLVANIA MUNICIPAL FUND
2. Significant Accounting Policies (Continued)
| | | | | | | | | | | | |
Undistributed Net Investment Income | | Undistributed
Long-Term
Gain | | | Accumulated
Loss
Carryforward1,2,3 | | | Net Unrealized
Depreciation
Based on cost of
Securities and
Other Investments
for Federal Income
Tax Purposes | |
$11,698,846 | | | $— | | | | $122,572,073 | | | | $118,992,049 | |
1. At period end, the Fund had $122,572,073 of net capital loss carryforward available to offset future realized capital gains, if any, and thereby reduce future taxable gain distributions. Details of the capital loss carryforwards are included in the table below. Capital loss carryovers with no expiration, if any, must be utilized prior to those with expiration dates.
| | | | |
| Expiring | | | |
2016 | | $ | 1,143,881 | |
2017 | | | 48,870,545 | |
2018 | | | 43,078,455 | |
No expiration | | | 29,479,192 | |
Total | | $ | 122,572,073 | |
| | | | |
2. During the reporting period, the Fund utilized $7,963,395 of capital loss carryforward to offset capital gains realized in that fiscal year.
3. During the previous reporting period, the Fund did not utilize any capital loss carryforward.
Net investment income (loss) and net realized gain (loss) may differ for financial statement and tax purposes. The character of dividends and distributions made during the fiscal year from net investment income or net realized gains are determined in accordance with federal income tax requirements, which may differ from the character of net investment income or net realized gains presented in those financial statements in accordance with GAAP. Also, due to timing of dividends and distributions, the fiscal year in which amounts are distributed may differ from the fiscal year in which the income or net realized gain was recorded by the Fund.
Accordingly, the following amounts have been reclassified for the reporting period. Net assets of the Fund were unaffected by the reclassifications.
| | | | |
Reduction to Accumulated Net Investment Income | | Reduction
to Accumulated Net
Realized Loss
on Investments | |
$1,510,149 | | | $1,510,149 | |
The tax character of distributions paid during the reporting periods:
| | | | | | | | |
| | | Year Ended
July 31, 2015 | | | Year Ended
July 31, 2014 | |
Distributions paid from: | | | | | | | | |
Exempt-interest dividends | | $ | 47,486,075 | | | $ | 52,341,805 | |
Ordinary income | | | 515,665 | | | | 547,596 | |
Total | | $ | 48,001,740 | | | $ | 52,889,401 | |
| | | | |
43 OPPENHEIMER ROCHESTER PENNSYLVANIA MUNICIPAL FUND
NOTES TO FINANCIAL STATEMENTS Continued
2. Significant Accounting Policies (Continued)
The aggregate cost of securities and other investments and the composition of unrealized appreciation and depreciation of securities and other investments for federal income tax purposes at period end are noted in the following table. The primary difference between book and tax appreciation or depreciation of securities and other investments, if applicable, is attributable to the tax deferral of losses or tax realization of financial statement unrealized gain or loss.
| | | | | | |
Federal tax cost of securities | | $ | 944,793,219 | 1 | | |
| | | |
Gross unrealized appreciation | | $ | 53,000,387 | | | |
Gross unrealized depreciation | | | (171,992,436 | ) | | |
| | | |
Net unrealized depreciation | | $ | (118,992,049 | ) | | |
| | | |
1. The Federal tax cost of securities does not include cost of $71,544,464, which has otherwise been recognized for financial reporting purposes, related to bonds placed into trusts in conjunction with certain investment transactions. See the Inverse Floating Rate Securities note in Note 4.
Use of Estimates. The preparation of financial statements in conformity with accounting principles generally accepted in the United States of America requires management to make estimates and assumptions that affect the reported amounts of assets and liabilities and disclosure of contingent assets and liabilities at the date of the financial statements and the reported amounts of increases and decreases in net assets from operations during the reporting period. Actual results could differ from those estimates.
3. Securities Valuation
The Fund calculates the net asset value of its shares as of the close of the New York Stock Exchange (the “Exchange”), normally 4:00 P.M. Eastern time, on each day the Exchange is open for trading.
The Fund’s Board has adopted procedures for the valuation of the Fund’s securities and has delegated the day-to-day responsibility for valuation determinations under those procedures to the Manager. The Manager has established a Valuation Committee which is responsible for determining a “fair valuation” for any security for which market quotations are not “readily available.” The Valuation Committee’s fair valuation determinations are subject to review, approval and ratification by the Fund’s Board at its next regularly scheduled meeting covering the calendar quarter in which the fair valuation was determined.
Valuation Methods and Inputs
Securities are valued using unadjusted quoted market prices, when available, as supplied primarily by third party pricing services or dealers.
The following methodologies are used to determine the market value or the fair value of the types of securities described below:
Securities traded on a registered U.S. securities exchange (including exchange-traded derivatives other than futures and futures options) are valued based on the last sale price of
44 OPPENHEIMER ROCHESTER PENNSYLVANIA MUNICIPAL FUND
3. Securities Valuation (Continued)
the security reported on the principal exchange on which it is traded, prior to the time when the Fund’s assets are valued. In the absence of a sale, the security is valued at the last sale price on the prior trading day, if it is within the spread of the current day’s closing “bid” and “asked” prices, and if not, at the current day’s closing bid price. A security of a foreign issuer traded on a foreign exchange, but not listed on a registered U.S. securities exchange, is valued based on the last sale price on the principal exchange on which the security is traded, as identified by the third party pricing service used by the Manager, prior to the time when the Fund’s assets are valued. If the last sale price is unavailable, the security is valued at the most recent official closing price on the principal exchange on which it is traded. If the last sales price or official closing price for a foreign security is not available, the security is valued at the mean between the bid and asked price per the exchange or, if not available from the exchange, obtained from two dealers. If bid and asked prices are not available from either the exchange or two dealers, the security is valued by using one of the following methodologies (listed in order of priority): (1) using a bid from the exchange, (2) the mean between the bid and asked price as provided by a single dealer, or (3) a bid from a single dealer.
Shares of a registered investment company that are not traded on an exchange are valued at that investment company’s net asset value per share.
Corporate and government debt securities (of U.S. or foreign issuers) and municipal debt securities, event-linked bonds, loans, mortgage-backed securities, collateralized mortgage obligations, and asset-backed securities are valued at the mean between the “bid” and “asked” prices utilizing evaluated prices obtained from third party pricing services or broker-dealers who may use matrix pricing methods to determine the evaluated prices.
Short-term money market type debt securities with a remaining maturity of sixty days or less are valued at cost adjusted by the amortization of discount or premium to maturity (amortized cost), which approximates market value. Short-term debt securities with a remaining maturity in excess of sixty days are valued at the mean between the “bid” and “asked” prices utilizing evaluated prices obtained from third party pricing services or broker-dealers.
A description of the standard inputs that may generally be considered by the third party pricing vendors in determining their evaluated prices is provided below.
| | |
| Security Type | | Standard inputs generally considered by third-party pricing vendors |
|
| Corporate debt, government debt, municipal, mortgage-backed and asset-backed securities | | Reported trade data, broker-dealer price quotations, benchmark yields, issuer spreads on comparable securities, the credit quality, yield, maturity, and other appropriate factors. |
|
| Loans | | Information obtained from market participants regarding reported trade data and broker-dealer price quotations. |
|
| Event-linked bonds | | Information obtained from market participants regarding reported trade data and broker-dealer price quotations. |
If a market value or price cannot be determined for a security using the methodologies described above, or if, in the “good faith” opinion of the Manager, the market value or price obtained does not constitute a “readily available market quotation,” or a significant event has occurred that would materially affect the value of the security, the security is fair valued
45 OPPENHEIMER ROCHESTER PENNSYLVANIA MUNICIPAL FUND
NOTES TO FINANCIAL STATEMENTS Continued
3. Securities Valuation (Continued)
either (i) by a standardized fair valuation methodology applicable to the security type or the significant event as previously approved by the Valuation Committee and the Fund’s Board or (ii) as determined in good faith by the Manager’s Valuation Committee. The Valuation Committee considers all relevant facts that are reasonably available, through either public information or information available to the Manager, when determining the fair value of a security. Fair value determinations by the Manager are subject to review, approval and ratification by the Fund’s Board at its next regularly scheduled meeting covering the calendar quarter in which the fair valuation was determined. Those fair valuation standardized methodologies include, but are not limited to, valuing securities at the last sale price or initially at cost and subsequently adjusting the value based on: changes in company specific fundamentals, changes in an appropriate securities index, or changes in the value of similar securities which may be further adjusted for any discounts related to security-specific resale restrictions. When possible, such methodologies use observable market inputs such as unadjusted quoted prices of similar securities, observable interest rates, currency rates and yield curves. The methodologies used for valuing securities are not necessarily an indication of the risks associated with investing in those securities nor can it be assured that the Fund can obtain the fair value assigned to a security if it were to sell the security.
To assess the continuing appropriateness of security valuations, the Manager, or its third party service provider who is subject to oversight by the Manager, regularly compares prior day prices, prices on comparable securities, and sale prices to the current day prices and challenges those prices exceeding certain tolerance levels with the third party pricing service or broker source. For those securities valued by fair valuations, whether through a standardized fair valuation methodology or a fair valuation determination, the Valuation Committee reviews and affirms the reasonableness of the valuations based on such methodologies and fair valuation determinations on a regular basis after considering all relevant information that is reasonably available.
Classifications
Each investment asset or liability of the Fund is assigned a level at measurement date based on the significance and source of the inputs to its valuation. Various data inputs are used in determining the value of each of the Fund’s investments as of the reporting period end. These data inputs are categorized in the following hierarchy under applicable financial accounting standards:
1) Level 1-unadjusted quoted prices in active markets for identical assets or liabilities (including securities actively traded on a securities exchange)
2) Level 2-inputs other than unadjusted quoted prices that are observable for the asset or liability (such as unadjusted quoted prices for similar assets and market corroborated inputs such as interest rates, prepayment speeds, credit risks, etc.)
3) Level 3-significant unobservable inputs (including the Manager’s own judgments about assumptions that market participants would use in pricing the asset or liability).
The inputs used for valuing securities are not necessarily an indication of the risks associated with investing in those securities.
46 OPPENHEIMER ROCHESTER PENNSYLVANIA MUNICIPAL FUND
3. Securities Valuation (Continued)
The table below categorizes amounts that are included in the Fund’s Statement of Assets and Liabilities at period end based on valuation input level:
| | | | | | | | | | | | | | | | |
| | | Level 1—
Unadjusted
Quoted Prices | | | Level 2— Other Significant
Observable Inputs | | | Level 3—
Significant
Unobservable
Inputs | | | Value | |
| |
Assets Table | | | | | | | | | | | | | | | | |
Investments, at Value: | | | | | | | | | | | | | | | | |
Municipal Bonds and Notes | | | | | | | | | | | | | | | | |
Pennsylvania | | $ | — | | | $ | 584,300,438 | | | $ | 1,721,473 | | | $ | 586,021,911 | |
U.S. Possessions | | | — | | | | 311,323,723 | | | | — | | | | 311,323,723 | |
| | | | |
Total Assets | | $ | — | | | $ | 895,624,161 | | | $ | 1,721,473 | | | $ | 897,345,634 | |
| | | | |
Forward currency exchange contracts and futures contracts, if any, are reported at their unrealized appreciation/depreciation at measurement date, which represents the change in the contract’s value from trade date. All additional assets and liabilities included in the above table are reported at their market value at measurement date.
The table below shows the transfers between Level 2 and Level 3. The Fund’s policy is to recognize transfers in and transfers out as of the beginning of the reporting period.
| | | | | | | | |
| | | Transfers out of
Level 2* | | | Transfers into
Level 3* | |
Assets Table | | | | | | | | |
Investments, at Value: | | | | | | | | |
Municipal Bonds and Notes | | | | | | | | |
Pennsylvania | | $ | (1,775,092 | ) | | $ | 1,775,092 | |
| | | | |
Total Assets | | $ | (1,775,092 | ) | | $ | 1,775,092 | |
| | | | |
* Transferred from Level 2 to Level 3 because of the lack of observable market data.
4. Investments and Risks
Inverse Floating Rate Securities. The Fund invests in inverse floating rate securities that pay interest at a rate that varies inversely with short-term interest rates. Because inverse floating rate securities are leveraged instruments, the value of an inverse floating rate security will change more significantly in response to changes in interest rates and other market fluctuations than the market value of a conventional fixed-rate municipal security of similar maturity and credit quality, including the municipal bond underlying an inverse floating rate security.
An inverse floating rate security is created as part of a financial transaction referred to as a “tender option bond” transaction. In most cases, in a tender option bond transaction the Fund sells a fixed-rate municipal bond (the “underlying municipal bond”) to a trust (the “Trust”). The Trust then issues and sells short-term floating rate securities with a fixed principal amount representing a senior interest in the underlying municipal bond to third parties and a residual, subordinate interest in the underlying municipal bond (referred to as an “inverse floating rate security”) to the Fund. The interest rate on the short-term floating rate securities resets periodically, usually weekly, to a prevailing market rate and holders of these securities are granted the option to tender their securities back to the Trust for
47 OPPENHEIMER ROCHESTER PENNSYLVANIA MUNICIPAL FUND
NOTES TO FINANCIAL STATEMENTS Continued
4. Investments and Risks (Continued)
repurchase at their principal amount plus accrued interest thereon (the “purchase price”) periodically, usually daily or weekly. A remarketing agent for the Trust is required to attempt to re-sell any tendered short-term floating rate securities to new investors for the purchase price. If the remarketing agent is unable to successfully re-sell the tendered short-term floating rate securities, a liquidity provider to the Trust must contribute cash to the Trust to ensure that the tendering holders receive the purchase price of their securities on the repurchase date.
Because holders of the short-term floating rate securities are granted the right to tender their securities to the Trust for repurchase at frequent intervals for the purchase price, with such payment effectively guaranteed by the liquidity provider, the securities generally bear short-term rates of interest commensurate with money market instruments. When interest is paid on the underlying municipal bond to the Trust, such proceeds are first used to pay the Trust’s administrative expenses and accrued interest to holders of the short-term floating rate securities, with any remaining amounts being paid to the Fund, as the holder of the inverse floating rate security. Accordingly, the amount of such interest on the underlying municipal bond paid to the Fund is inversely related the rate of interest on the short-term floating rate securities. Additionally, because the principal amount of the short-term floating rate securities is fixed and is not adjusted in response to changes in the market value of the underlying municipal bond, any change in the market value of the underlying municipal bond is reflected entirely in a change to the value of the inverse floating rate security.
Typically, the terms of an inverse floating rate security grant certain rights to the Fund, as holder. For example, the Fund typically has the right upon request to require that the Trust compel a tender of the short-term floating rate securities to facilitate the Fund’s acquisition of the underlying municipal bond. Following such a request, the Fund pays the Trust the purchase price of the short-term floating rate securities and a specified portion of any market value gain on the underlying municipal bond since its deposit into the Trust, which the Trust uses to redeem the short-term floating rate securities. The Trust then distributes the underlying municipal bond to the Fund. Through the exercise of this right, the Fund can voluntarily terminate or “collapse” the Trust, terminate its investment in the related inverse floating rate security and obtain the underlying municipal bond. Additionally, the Fund also typically has the right to exchange with the Trust (i) a principal amount of short-term floating rate securities held by the Fund for a corresponding additional principal amount of the inverse floating rate security or (ii) a principal amount of the inverse floating rate security held by the Fund for a corresponding additional principal amount of short-term floating rate securities (which are typically then sold to other investors). Through the exercise of this right, the Fund may increase (or decrease) the principal amount of short-term floating rate securities outstanding, thereby increasing (or decreasing) the amount of leverage provided by the short-term floating rate securities to the Fund’s investment exposure to the underlying municipal bond.
The Fund’s investments in inverse floating rate securities involve certain risks. As short-term interest rates rise, an inverse floating rate security produces less current income (and, in extreme cases, may pay no income) and as short-term interest rates fall, an inverse floating rate security produces more current income. Thus, if short-term interest rates rise after the
48 OPPENHEIMER ROCHESTER PENNSYLVANIA MUNICIPAL FUND
4. Investments and Risks (Continued)
issuance of the inverse floating rate security, any yield advantage is reduced or eliminated. All inverse floating rate securities entail some degree of leverage represented by the outstanding principal amount of the related short-term floating rate securities, relative to the par value of the underlying municipal bond. The value of, and income earned on, an inverse floating rate security that has a higher degree of leverage will fluctuate more significantly in response to changes in interest rates and to changes in the market value of the related underlying municipal bond than that of an inverse floating rate security with a lower degree of leverage, and is more likely to be eliminated entirely under adverse market conditions. Changes in the value of an inverse floating rate security will also be more significant than changes in the market value of the related underlying municipal bond because the leverage provided by the related short-term floating rate securities increases the sensitivity of an inverse floating rate security to changes in interest rates and to the market value of the underlying municipal bond. An inverse floating rate security can be expected to underperform fixed-rate municipal bonds when the difference between long-term and short-term interest rates is decreasing (or is already small) or when long-term interest rates are rising, but can be expected to outperform fixed-rate municipal bonds when the difference between long-term and short-term interest rates is increasing (or is already large) or when long-term interest rates are falling. Additionally, a tender option bond transaction typically provides for the automatic termination or “collapse” of a Trust upon the occurrence of certain adverse events, usually referred to as “mandatory tender events” or “tender option termination events.” These events may include, among others, a credit ratings downgrade of the underlying municipal bond below a specified level, a decrease in the market value of the underlying municipal bond below a specified amount, a bankruptcy of the liquidity provider or the inability of the remarketing agent to re-sell to new investors short-term floating rate securities that have been tendered for repurchase by holders thereof. Following the occurrence of such an event, the underlying municipal bond is generally sold for current market value and the proceeds distributed to holders of the short-term floating rate securities and inverse floating rate security, with the holder of the inverse floating rate security (the Fund) generally receiving the proceeds of such sale only after the holders of the short-term floating rate securities have received proceeds equal to the purchase price of their securities (and the liquidity provider is generally required to contribute cash to the Trust only in an amount sufficient to ensure that the holders of the short-term floating rate securities receive the purchase price of their securities in connection with such termination of the Trust). Following the occurrence of such events, the Fund could potentially lose the entire amount of its investment in the inverse floating rate security.
Finally, the Fund may enter into shortfall/reimbursement agreements with the liquidity provider of certain tender option bond transactions in connection with certain inverse floating rate securities held by the Fund. These agreements commit the Fund to reimburse the liquidity provider to the extent that the liquidity provider must provide cash to a Trust, including following the termination of a Trust resulting from the occurrence of a “mandatory tender event.” In connection with the occurrence of such an event and the termination of the Trust triggered thereby, the shortfall/reimbursement agreement will make the Fund liable for the amount of the negative difference, if any, between the liquidation value of the underlying
49 OPPENHEIMER ROCHESTER PENNSYLVANIA MUNICIPAL FUND
NOTES TO FINANCIAL STATEMENTS Continued
4. Investments and Risks (Continued)
municipal bond and the purchase price of the short-term floating rate securities issued by the Trust. Under the standard terms of a tender option bond transaction, absent such a shortfall/reimbursement agreement, the Fund, as holder of the inverse floating rate security, would not be required to make such a reimbursement payment to the liquidity provider. The Manager monitors the Fund’s potential exposure with respect to these agreements on a daily basis and intends to take action to terminate the Fund’s investment in related inverse floating rate securities, if it deems it appropriate to do so. At period end, the Fund’s maximum exposure under such agreements is estimated at $47,860,000.
When the Fund creates an inverse floating rate security in a tender option bond transaction by selling an underlying municipal bond to a Trust, the transaction is considered a secured borrowing for financial reporting purposes. As a result of such accounting treatment, the Fund includes the underlying municipal bond on its Statement of Investments and as an asset on its Statement of Assets and Liabilities (but does not separately include the related inverse floating rate security on either). The Fund also includes a liability on its Statement of Assets and Liabilities equal to the outstanding principal amount and accrued interest on the related short-term floating rate securities issued by the Trust. Interest on the underlying municipal bond is recorded as investment income on the Fund’s Statement of Operations, while interest payable on the related short-term floating rate securities is recorded as interest expense. At period end, municipal bond holdings with a value of $115,583,803 shown on the Fund’s Statement of Investments are held by such Trusts and serve as the underlying municipal bonds for the related $69,805,000 in short-term floating rate securities issued and outstanding at that date.
At period end, the inverse floating rate securities associated with tender option bond transactions accounted for as secured borrowings were as follows:
| | | | | | | | | | | | | | |
Principal
Amount | | Inverse Floater1 | | Coupon
Rate2 | | | Maturity
Date | | | Value | |
| |
$ 3,250,000 | | Berks County, PA Municipal Authority Tender Option Bond Series 2015-XF2016 Trust3 | | | 17.304% | | | | 11/1/31 | | | $ | 5,101,200 | |
7,980,000 | | Chester County, PA IDA (Water Facilities Authority) Tender Option Bond Series 2015- XF2128 Trust3 | | | 6.470 | | | | 2/1/41 | | | | 8,489,124 | |
6,240,000 | | Delaware County, PA IDA Tender Option Bond Series 2015-XF2127 Trust3 | | | 11.851 | | | | 11/1/38 | | | | 6,412,037 | |
6,970,000 | | Montgomery County, PA IDA RITES | | | 12.834 | | | | 8/1/38 | | | | 10,956,282 | |
8,000,000 | | PA Commonwealth Financing Authority Tender Option Bond Series 2015 XF-0026 Trust | | | 7.986 | | | | 6/1/32 | | | | 9,986,400 | |
3,230,000 | | PA Southcentral General Authority (Hanover Hospital) Tender Option Bond Series 2015- XF2131 Trust3 | | | 19.187 | | | | 6/1/29 | | | | 4,833,760 | |
| | | | | | | | | | | | | | |
| | | | | | | | | | | | $ | 45,778,803 | |
| | | | | | | | | | | | | | |
1. For a list of abbreviations used in the Inverse Floater table see the Portfolio Abbreviations table at the end of the Statement of Investments.
2. Represents the current interest rate for the inverse floating rate security.
3. Represents an inverse floating rate security that is subject to a shortfall/reimbursement agreement.
50 OPPENHEIMER ROCHESTER PENNSYLVANIA MUNICIPAL FUND
4. Investments and Risks (Continued)
The Fund may also purchase an inverse floating rate security created as part of a tender option bond transaction not initiated by the Fund when a third party, such as a municipal issuer or financial institution, transfers an underlying municipal bond to a Trust. For financial reporting purposes, the Fund includes the inverse floating rate security related to such transaction on its Statement of Investments and as an asset on its Statement of Assets and Liabilities, and interest on the security is recorded as investment income on the Fund’s Statement of Operations.
The Fund may invest in inverse floating rate securities with any degree of leverage (as measured by the outstanding principal amount of related short-term floating rate securities). However, the Fund may only expose up to 20% of its total assets to the effects of leverage from its investments in inverse floating rate securities. This limitation is measured by comparing the aggregate principal amount of the short-term floating rate securities that are related to the inverse floating rate securities held by the Fund to the total assets of the Fund. The Fund’s exposure to the effects of leverage from its investments in inverse floating rate securities amounts to $69,805,000 or 7.67% of its total assets at period end.
Securities on a When-Issued or Delayed Delivery Basis. The Fund may purchase securities on a “when-issued” basis, and may purchase or sell securities on a “delayed delivery” basis. “When-issued” or “delayed delivery” refers to securities whose terms and indenture are available and for which a market exists, but which are not available for immediate delivery. Delivery and payment for securities that have been purchased by the Fund on a when-issued basis normally takes place within six months and possibly as long as two years or more after the trade date. During this period, such securities do not earn interest, are subject to market fluctuation and may increase or decrease in value prior to their delivery. The purchase of securities on a when-issued basis may increase the volatility of the Fund’s net asset value to the extent the Fund executes such transactions while remaining substantially fully invested. When the Fund engages in when-issued or delayed delivery transactions, it relies on the buyer or seller, as the case may be, to complete the transaction. Their failure to do so may cause the Fund to lose the opportunity to obtain or dispose of the security at a price and yield it considers advantageous. The Fund may also sell securities that it purchased on a when-issued basis or forward commitment prior to settlement of the original purchase.
At period end, the Fund had sold securities issued on a delayed delivery basis as follows:
| | | | |
| | | When-Issued or
Delayed Delivery
Basis Transactions | |
Sold securities | | | $196,072 | |
Credit Risk. The Fund invests in high-yield, non-investment-grade bonds, which may be subject to a greater degree of credit risk. Credit risk relates to the ability of the issuer to meet interest or principal payments or both as they become due. The Fund may acquire securities that have missed an interest payment, and is not obligated to dispose of securities whose issuers or underlying obligors subsequently miss an interest payment.
51 OPPENHEIMER ROCHESTER PENNSYLVANIA MUNICIPAL FUND
NOTES TO FINANCIAL STATEMENTS Continued
4. Investments and Risks (Continued)
Information concerning securities not accruing interest at period end is as follows:
| | | | |
Cost | | $ | 45,462,908 | |
Market Value | | | $2,437,071 | |
Market Value as % of Net Assets | | | 0.30% | |
The Fund has entered into forbearance agreements with certain obligors under which the Fund has agreed to temporarily forego receipt of the original principal or coupon interest rates. At period end, securities with an aggregate market value of $19,895,448, representing 2.4% of the Fund’s net assets, were subject to these forbearance agreements.
Concentration Risk. There are certain risks arising from geographic concentration in any state, commonwealth or territory. Certain economic, regulatory or political developments occurring in the state, commonwealth or territory may impair the ability of certain issuers of municipal securities to pay principal and interest on their obligations.
5. Shares of Beneficial Interest
The Fund has authorized an unlimited number of no par value shares of beneficial interest of each class. Transactions in shares of beneficial interest were as follows:
| | | | | | | | | | | | | | | | |
| | | Year Ended July 31, 2015 | | | Year Ended July 31, 2014 | |
| | | Shares | | | Amount | | | Shares | | | Amount | |
| |
Class A | | | | | | | | | | | | | | | | |
Sold | | | 5,147,549 | | | $ | 55,004,856 | | | | 5,689,720 | | | $ | 58,137,092 | |
Dividends and/or distributions reinvested | | | 2,662,938 | | | | 28,399,350 | | | | 3,029,465 | | | | 30,890,536 | |
Redeemed | | | (11,746,596 | ) | | | (124,753,061 | ) | | | (22,171,343 | ) | | | (225,498,328) | |
Net decrease | | | (3,936,109 | ) | | $ | (41,348,855 | ) | | | (13,452,158 | ) | | $ | (136,470,700) | |
| | | | | | | | | | | | | | | | |
| | | | | | | | | | | | | | | | |
| |
Class B | | | | | | | | | | | | | | | | |
Sold | | | 24,857 | | | $ | 264,092 | | | | 14,809 | | | $ | 150,764 | |
Dividends and/or distributions reinvested | | | 61,008 | | | | 650,781 | | | | 93,178 | | | | 949,037 | |
Redeemed | | | (652,191 | ) | | | (6,920,015 | ) | | | (1,001,669 | ) | | | (10,226,346) | |
Net decrease | | | (566,326 | ) | | $ | (6,005,142 | ) | | | (893,682 | ) | | $ | (9,126,545) | |
| | | | | | | | | | | | | | | | |
| | | | | | | | | | | | | | | | |
| |
Class C | | | | | | | | | | | | | | | | |
Sold | | | 2,434,481 | | | $ | 25,934,993 | | | | 2,157,744 | | | $ | 21,893,192 | |
Dividends and/or distributions reinvested | | | 968,498 | | | | 10,307,580 | | | | 1,112,153 | | | | 11,317,055 | |
Redeemed | | | (4,605,581 | ) | | | (48,761,498 | ) | | | (9,405,754 | ) | | | (95,181,139) | |
Net decrease | | | (1,202,602 | ) | | $ | (12,518,925 | ) | | | (6,135,857 | ) | | $ | (61,970,892) | |
| | | | | | | | | | | | | | | | |
52 OPPENHEIMER ROCHESTER PENNSYLVANIA MUNICIPAL FUND
5. Shares of Beneficial Interest (Continued)
| | | | | | | | | | | | | | | | |
| | | Year Ended July 31, 2015 | | | Year Ended July 31, 2014 | |
| | | Shares | | | Amount | | | Shares | | | Amount | |
Class Y | | | | | | | | | | | | | | | | |
Sold | | | 1,368,248 | | | $ | 14,592,950 | | | | 1,210,804 | | | $ | 12,372,773 | |
Dividends and/or distributions reinvested | | | 149,763 | | | | 1,598,420 | | | | 143,946 | | | | 1,467,996 | |
Redeemed | | | (1,278,028 | ) | | | (13,606,691 | ) | | | (1,928,725 | ) | | | (19,538,940) | |
Net increase (decrease) | | | 239,983 | | | $ | 2,584,679 | | | | (573,975 | ) | | $ | (5,698,171) | |
| | | | | | | | | | | | | | | | |
6. Purchases and Sales of Securities
The aggregate cost of purchases and proceeds from sales of securities, other than short-term obligations, for the reporting period were as follows:
| | | | | | | | |
| | | Purchases | | | Sales | |
Investment securities | | | $113,324,618 | | | | $188,974,870 | |
7. Fees and Other Transactions with Affiliates
Management Fees. Under the investment advisory agreement, the Fund pays the Manager a management fee based on the daily net assets of the Fund at an annual rate as shown in the following table:
| | | | |
| Fee Schedule Through November 30, 2014 | | | |
| |
Up to $200 million | | | 0.60% | |
Next $100 million | | | 0.55 | |
Next $200 million | | | 0.50 | |
Next $250 million | | | 0.45 | |
Next $250 million | | | 0.40 | |
Over $1 billion | | | 0.35 | |
| | | | |
| Fee Schedule Effective December 1, 2014 | | | |
| |
Up to $200 million | | | 0.60% | |
Next $100 million | | | 0.55 | |
Next $200 million | | | 0.50 | |
Next $250 million | | | 0.45 | |
Next $250 million | | | 0.40 | |
Next $4 billion | | | 0.35 | |
Over $5 billion | | | 0.33 | |
The Fund’s effective management fee for the reporting period was 0.50% of average annual net assets before any applicable waivers.
Sub-Adviser Fees. The Manager has retained the Sub-Adviser to provide the day-to-day portfolio management of the Fund. Under the Sub-Advisory Agreement, the Manager pays the Sub-Adviser an annual fee in monthly installments, equal to a percentage of the investment management fee collected by the Manager from the Fund, which shall be calculated after any investment management fee waivers. The fee paid to the Sub-Adviser is paid by the Manager, not by the Fund.
Transfer Agent Fees. OFI Global (the “Transfer Agent”) serves as the transfer and shareholder servicing agent for the Fund. The Fund pays the Transfer Agent a fee based on annual net assets. Fees incurred and average net assets for each class with respect to these services are detailed in the Statement of Operations and Financial Highlights, respectively.
53 OPPENHEIMER ROCHESTER PENNSYLVANIA MUNICIPAL FUND
NOTES TO FINANCIAL STATEMENTS Continued
7. Fees and Other Transactions with Affiliates (Continued)
Sub-Transfer Agent Fees. The Transfer Agent has retained Shareholder Services, Inc., a wholly-owned subsidiary of OFI (the “Sub-Transfer Agent”), to provide the day-to-day transfer agent and shareholder servicing of the Fund. Under the Sub-Transfer Agency Agreement, the Transfer Agent pays the Sub-Transfer Agent an annual fee in monthly installments, equal to a percentage of the transfer agent fee collected by the Transfer Agent from the Fund, which shall be calculated after any applicable fee waivers. The fee paid to the Sub-Transfer Agent is paid by the Transfer Agent, not by the Fund.
Trustees’ Compensation. The Fund has adopted an unfunded retirement plan (the “Plan”) for the Fund’s Independent Trustees. Benefits are based on years of service and fees paid to each Trustee during their period of service. The Plan was frozen with respect to adding new participants effective December 31, 2006 (the “Freeze Date”) and existing Plan Participants as of the Freeze Date will continue to receive accrued benefits under the Plan. Active Independent Trustees as of the Freeze Date have each elected a distribution method with respect to their benefits under the Plan. During the reporting period, the Fund’s projected benefit obligations, payments to retired Trustees and accumulated liability were as follows:
| | | | |
Projected Benefit Obligations Increased | | $ | — | |
Payments Made to Retired Trustees | | | 8,644 | |
Accumulated Liability as of July 31, 2015 | | | 68,499 | |
The Fund’s Board of Trustees (“Board”) has adopted a compensation deferral plan for Independent Trustees that enables Trustees to elect to defer receipt of all or a portion of the annual compensation they are entitled to receive from the Fund. For purposes of determining the amount owed to the Trustee under the plan, deferred amounts are treated as though equal dollar amounts had been invested in shares of the Fund or in other Oppenheimer funds selected by the Trustee. The Fund purchases shares of the funds selected for deferral by the Trustee in amounts equal to his or her deemed investment, resulting in a Fund asset equal to the deferred compensation liability. Such assets are included as a component of “Other” within the asset section of the Statement of Assets and Liabilities. Deferral of Trustees’ fees under the plan will not affect the net assets of the Fund and will not materially affect the Fund’s assets, liabilities or net investment income per share. Amounts will be deferred until distributed in accordance with the compensation deferral plan.
Distribution and Service Plan (12b-1) Fees. Under its General Distributor’s Agreement with the Fund, OppenheimerFunds Distributor, Inc. (the “Distributor”) acts as the Fund’s principal underwriter in the continuous public offering of the Fund’s classes of shares.
Service Plan for Class A Shares. The Fund has adopted a Service Plan (the “Plan”) for Class A shares pursuant to Rule 12b-1 under the 1940 Act. Under the Plan, the Fund reimburses the Distributor for a portion of its costs incurred for services provided to accounts that hold Class A shares. Reimbursement is made periodically at an annual rate of up to 0.15% of the daily net assets of Class A shares of the Fund. The Distributor currently uses all of those fees to pay dealers, brokers, banks and other financial institutions periodically for providing personal service and maintenance of accounts of their customers that hold Class A
54 OPPENHEIMER ROCHESTER PENNSYLVANIA MUNICIPAL FUND
7. Fees and Other Transactions with Affiliates (Continued)
shares. Any unreimbursed expenses the Distributor incurs with respect to Class A shares in any fiscal year cannot be recovered in subsequent periods. Fees incurred by the Fund under the Plan are detailed in the Statement of Operations.
Distribution and Service Plans for Class B and Class C Shares. The Fund has adopted Distribution and Service Plans (the “Plans”) for Class B and Class C shares pursuant to Rule 12b-1 under the 1940 Act to compensate the Distributor for distributing those share classes, maintaining accounts and providing shareholder services. Under the Plans, the Fund pays the Distributor an annual asset-based sales charge of 0.75% on Class B and Class C shares’ daily net assets. The Fund also pays a service fee under the Plans at an annual rate of 0.15% of daily net assets. The Plans continue in effect from year to year only if the Fund’s Board of Trustees votes annually to approve their continuance at an in person meeting called for that purpose. Fees incurred by the Fund under the Plans are detailed in the Statement of Operations.
Sales Charges. Front-end sales charges and CDSC do not represent expenses of the Fund. They are deducted from the proceeds of sales of Fund shares prior to investment or from redemption proceeds prior to remittance, as applicable. The sales charges retained by the Distributor from the sale of shares and the CDSC retained by the Distributor on the redemption of shares is shown in the following table for the period indicated.
| | | | | | | | | | | | | | | | |
| Year Ended | | Class A Front-End
Sales Charges
Retained by
Distributor | | | Class A
Contingent
Deferred Sales
Charges
Retained by
Distributor | | | Class B
Contingent
Deferred Sales
Charges
Retained by
Distributor | | | Class C
Contingent
Deferred Sales
Charges
Retained by
Distributor | |
| |
July 31, 2015 | | | $161,433 | | | | $1,052 | | | | $31,848 | | | | $11,588 | |
8. Borrowings and Other Financing
Borrowings. The Fund can borrow money from banks in amounts up to one third of its total assets (including the amount borrowed) less all liabilities and indebtedness other than borrowings (meaning that the value of those assets must be at least 300% of the amount borrowed). The Fund can use those borrowings for investment-related purposes such as purchasing portfolio securities. The Fund also may borrow to meet redemption obligations or for temporary and emergency purposes. When the Fund invests borrowed money in portfolio securities, it is using a speculative investment technique known as leverage and changes in the value of the Fund’s investments will have a larger effect on its share price than if it did not borrow because of the effect of leverage.
The Fund can also use the borrowings for other investment-related purposes, including in connection with the Fund’s inverse floater investments as discussed in Note 4. The Fund may use the borrowings to reduce the leverage amount of, or unwind or “collapse” trusts that issued “inverse floaters” owned by the Fund, or in circumstances in which the Fund has entered into a shortfall and forbearance agreement with the sponsor of the inverse floater trust to meet the Fund’s obligation to reimburse the sponsor of the inverse floater for the
55 OPPENHEIMER ROCHESTER PENNSYLVANIA MUNICIPAL FUND
NOTES TO FINANCIAL STATEMENTS Continued
8. Borrowings and Other Financing (Continued)
difference between the liquidation value of the underlying bond and the amount due to holders of the short-term floating rate notes issued by the Trust. See the discussion in Note 4 (Inverse Floating Rate Securities) for additional information.
The Fund will pay interest and may pay other fees in connection with loans. If the Fund does borrow, it will be subject to greater expenses than funds that do not borrow. The interest on borrowed money and the other fees incurred in conjunction with loans are an expense that might reduce the Fund’s yield and return. Expenses incurred by the Fund with respect to interest on borrowings and commitment fees are disclosed separately or as other expenses on the Statement of Operations.
The Fund entered into a Revolving Credit and Security Agreement (the “Agreement”) with conduit lenders and Citibank N.A. which enables it to participate with certain other Oppenheimer funds in a committed, secured borrowing facility that permits borrowings of up to $2.5 billion, collectively, by the Oppenheimer Rochester Funds. To secure the loan, the Fund pledges investment securities in accordance with the terms of the Agreement. Securities held in collateralized accounts to cover these borrowings are noted in the Statement of Investments. Interest is charged to the Fund, based on its borrowings, at current commercial paper issuance rates (0.1925% at period end). The Fund pays additional fees monthly to its lender on its outstanding borrowings to manage and administer the facility and is allocated its pro-rata share of an annual structuring fee and ongoing commitment fees both of which are based on the total facility size. Total fees and interest that are included in expenses on the Fund’s Statement of Operations related to its participation in the borrowing facility during the reporting period equal 0.08% of the Fund’s average net assets on an annualized basis. The Fund has the right to prepay such loans and terminate its participation in the conduit loan facility at any time upon prior notice.
At period end, the Fund had borrowings outstanding at an interest rate of 0.1925%.
Details of the borrowings for the reporting period are as follows:
| | | | |
Average Daily Loan Balance | | $ | 5,754,247 | |
Average Daily Interest Rate | | | 0.180 | % |
Fees Paid | | $ | 301,915 | |
Interest Paid | | $ | 8,539 | |
Reverse Repurchase Agreements. The Fund may engage in reverse repurchase agreements. A reverse repurchase agreement is the sale of one or more securities to a counterparty at an agreed-upon purchase price with the simultaneous agreement to repurchase those securities on a future date at a higher repurchase price. The repurchase price represents the repayment of the purchase price and interest accrued thereon over the term of the repurchase agreement. The cash received by the Fund in connection with a reverse repurchase agreement may be used for investment-related purposes such as purchasing portfolio securities or for other purposes such as those described in the preceding “Borrowings” note.
The Fund entered into a Committed Repurchase Transaction Facility (the “Facility”) with J.P. Morgan Securities LLC (the “counterparty”) which enables it to participate with certain other Oppenheimer funds in a committed reverse repurchase agreement facility that permits
56 OPPENHEIMER ROCHESTER PENNSYLVANIA MUNICIPAL FUND
8. Borrowings and Other Financing (Continued)
aggregate outstanding reverse repurchase agreements of up to $750 million, collectively. Interest is charged to the Fund on the purchase price of outstanding reverse repurchase agreements at current LIBOR rates plus an applicable spread. The Fund is also allocated its pro-rata share of an annual structuring fee based on the total Facility size and ongoing commitment fees based on the total unused amount of the Facility. The Fund retains the economic exposure to fluctuations in the value of securities subject to reverse repurchase agreements under the Facility and therefore these transactions are considered secured borrowings for financial reporting purposes. The Fund also continues to receive the economic benefit of interest payments received on securities subject to reverse repurchase agreements, in the form of a direct payment from the counterparty. These payments are included in interest income on the Statement of Operations. Total fees and interest related to the Fund’s participation in the Facility during the reporting period are included in expenses on the Fund’s Statement of Operations and equal 0.03% of the Fund’s average net assets on an annualized basis.
The securities subject to reverse repurchase agreements under the Facility are valued on a daily basis. To the extent this value, after adjusting for certain margin requirements of the Facility, exceeds the cash proceeds received, the Fund may request the counterparty to return securities equal in margin value to this excess. To the extent that the cash proceeds received exceed the margin value of the securities subject to the transaction, the counterparty may request additional securities from the Fund. The Fund has the right to declare each Wednesday as the repurchase date for any outstanding reverse repurchase agreement upon delivery of advanced notification and may also recall any security subject to such a transaction by substituting eligible securities of equal or greater margin value according to the Facility’s terms.
The Fund executed no transactions under the Facility during the reporting period.
Details of reverse repurchase agreement transactions for the reporting period are as follows:
9. Pending Litigation
In 2009, several putative class action lawsuits were filed and later consolidated before the U.S. District Court for the District of Colorado against OppenheimerFunds, Inc. (“OFI”), OppenheimerFunds Distributor, Inc. (“OFDI”), and Oppenheimer Rochester California Municipal Fund, a fund advised by OFI Global Asset Management, Inc. and distributed by the Distributor (the “Defendant Fund”), in connection with the Defendant Fund’s investment performance. The plaintiffs asserted claims against OFI, OFDI and certain present and former trustees and officers of the Defendant Fund under the federal securities laws, alleging, among other things, that the disclosure documents of the Defendant Fund contained misrepresentations and omissions and the investment policies of the Defendant Fund were not followed. Plaintiffs in the suit filed an amended complaint and defendants filed a motion to dismiss. In 2011, the court issued an order which granted in part and denied in part the defendants’ motion to dismiss. In 2012, plaintiffs filed a motion, which defendants opposed, to certify a class and appoint class representatives and class counsel. In March 2015, the
57 OPPENHEIMER ROCHESTER PENNSYLVANIA MUNICIPAL FUND
NOTES TO FINANCIAL STATEMENTS Continued
9. Pending Litigation (Continued)
court granted plaintiffs’ motion for class certification. In May 2015, the U.S. Court of Appeals for the Tenth Circuit vacated the class certification order and remanded the matter to the district court for further proceedings. In July 2015, the district court held an evidentiary hearing on plaintiffs’ motion for class certification.
OFI and OFDI believe the suit is without merit; that it is premature to render any opinion as to the likelihood of an outcome unfavorable to them in the suit; and that no estimate can yet be made as to the amount or range of any potential loss. Furthermore, OFI believes that the suit should not impair the ability of OFI or OFDI to perform their respective duties to the Fund and that the outcome of the suit should not have any material effect on the operations of any of the Oppenheimer funds.
58 OPPENHEIMER ROCHESTER PENNSYLVANIA MUNICIPAL FUND
REPORT OF INDEPENDENT REGISTERED PUBLIC ACCOUNTING FIRM
The Board of Trustees and Shareholders of Oppenheimer Multi-State Municipal Trust:
We have audited the accompanying statement of assets and liabilities of Oppenheimer Rochester Pennsylvania Municipal Fund (a separate series of Oppenheimer Multi-State Municipal Trust), including the statement of investments, as of July 31, 2015, and the related statements of operations and cash flows for the year then ended, the statements of changes in net assets for each of the years in the two-year period then ended, and the financial highlights for each of the years or periods in the five-year period then ended. These financial statements and financial highlights are the responsibility of the Fund’s management. Our responsibility is to express an opinion on these financial statements and financial highlights based on our audits.
We conducted our audits in accordance with the standards of the Public Company Accounting Oversight Board (United States). Those standards require that we plan and perform the audit to obtain reasonable assurance about whether the financial statements and financial highlights are free of material misstatement. An audit includes examining, on a test basis, evidence supporting the amounts and disclosures in the financial statements. Our procedures included confirmation of securities owned as of July 31, 2015, by correspondence with the custodian and brokers, or by other appropriate auditing procedures where replies from brokers were not received. An audit also includes assessing the accounting principles used and significant estimates made by management, as well as evaluating the overall financial statement presentation. We believe that our audits provide a reasonable basis for our opinion.
In our opinion, the financial statements and financial highlights referred to above present fairly, in all material respects, the financial position of Oppenheimer Rochester Pennsylvania Municipal Fund as of July 31, 2015, the results of its operations and cash flows for the year then ended, the changes in its net assets for each of the years in the two-year period then ended, and the financial highlights for each of the years or periods in the five-year period then ended, in conformity with U.S. generally accepted accounting principles.
KPMG LLP
Denver, Colorado
September 28, 2015
59 OPPENHEIMER ROCHESTER PENNSYLVANIA MUNICIPAL FUND
FEDERAL INCOME TAX INFORMATION Unaudited
In early 2015, if applicable, shareholders of record received information regarding all dividends and distributions paid to them by the Fund during calendar year 2014.
None of the dividends paid by the Fund during the reporting period are eligible for the corporate dividend-received deduction. 98.93% of the dividends were derived from interest on municipal bonds and are not subject to federal income taxes. To the extent a shareholder is subject to any state or local tax laws, some or all of the dividends received may be taxable.
The foregoing information is presented to assist shareholders in reporting distributions received from the Fund to the Internal Revenue Service. Because of the complexity of the federal regulations which may affect your individual tax return and the many variations in state and local tax regulations, we recommend that you consult your tax advisor for specific guidance.
60 OPPENHEIMER ROCHESTER PENNSYLVANIA MUNICIPAL FUND
PORTFOLIO PROXY VOTING POLICIES AND PROCEDURES;
UPDATES TO STATEMENTS OF INVESTMENTS Unaudited
The Fund has adopted Portfolio Proxy Voting Policies and Procedures under which the Fund votes proxies relating to securities (“portfolio proxies”) held by the Fund. A description of the Fund’s Portfolio Proxy Voting Policies and Procedures is available (i) without charge, upon request, by calling the Fund toll-free at 1.800.CALL OPP (225.5677), (ii) on the Fund’s website at www.oppenheimerfunds.com, and (iii) on the SEC’s website at www.sec.gov. In addition, the Fund is required to file Form N-PX, with its complete proxy voting record for the 12 months ended June 30th, no later than August 31st of each year. The Fund’s voting record is available (i) without charge, upon request, by calling the Fund toll-free at 1.800.CALL OPP (225.5677), and (ii) in the Form N-PX filing on the SEC’s website at www.sec.gov.
The Fund files its complete schedule of portfolio holdings with the SEC for the first quarter and the third quarter of each fiscal year on Form N-Q. The Fund’s Form N-Q filings are available on the SEC’s website at www.sec.gov. Those forms may be reviewed and copied at the SEC’s Public Reference Room in Washington, D.C. Information on the operation of the Public Reference Room may be obtained by calling 1-800-SEC-0330.
Householding—Delivery of Shareholder Documents
This is to inform you about OppenheimerFunds’ “householding” policy. If more than one member of your household maintains an account in a particular fund, OppenheimerFunds will mail only one copy of the fund’s prospectus (or, if available, the fund’s summary prospectus), annual and semiannual report and privacy policy. The consolidation of these mailings, called householding, benefits your fund through reduced mailing expense, and benefits you by reducing the volume of mail you receive from OppenheimerFunds. Householding does not affect the delivery of your account statements.
Please note that we will continue to household these mailings for as long as you remain an OppenheimerFunds shareholder, unless you request otherwise. If you prefer to receive multiple copies of these materials, please call us at 1.800.CALL-OPP (225-5677). You may also notify us in writing or via email. We will begin sending you individual copies of the prospectus (or, if available, the summary prospectus), reports and privacy policy within 30 days of receiving your request to stop householding.
61 OPPENHEIMER ROCHESTER PENNSYLVANIA MUNICIPAL FUND
TRUSTEES AND OFFICERS Unaudited
| | |
Name, Position(s) Held with the Fund, Length of Service, Year of Birth | | Principal Occupation(s) During the Past 5 Years; Other Trusteeships/Directorships Held; Number of Portfolios in the Fund Complex Currently Overseen |
| |
| INDEPENDENT TRUSTEES | | The address of each Trustee in the chart below is 6803 S. Tucson Way, Centennial, Colorado 80112-3924. Each Trustee serves for an indefinite term, or until his or her resignation, retirement, death or removal. |
| |
Brian F. Wruble, Chairman of the Board of Trustees (since 2007) and Trustee (since 2005) Year of Birth: 1943 | | Director and Vice Chairman of Community Foundation of the Florida Keys (non- profit) (since July 2012); Trustee of the Board of Trustees, The Jackson Laboratory (non-profit) (1991-2011 and since May 2014); Chairman Emeritus (since August 2011) of The Jackson Laboratory (non-profit); Director of Special Value Opportunities Fund, LLC (registered investment company) (affiliate of the Sub-Adviser’s parent company) (since September 2004); Member of Zurich Insurance Group’s Investment Management Advisory Council (insurance) (since 2004); Treasurer (since 2007) and Trustee of the Institute for Advanced Study (non-profit educational institute) (since May 1992); General Partner of Odyssey Partners, L.P. (hedge fund) (September 1995-December 2007); Special Limited Partner of Odyssey Investment Partners, LLC (private equity investment) (January 1999-September 2004). Oversees 53 portfolios in the OppenheimerFunds complex. Mr. Wruble has served on the Boards of certain Oppenheimer funds since April 2001, during which time he has become familiar with the Fund’s (and other Oppenheimer funds’) financial, accounting, regulatory and investment matters and has contributed to the Boards’ deliberations. |
| |
David K. Downes, Trustee (since 2007) Year of Birth: 1940 | | Director of THL Credit Inc. (since June 2009); Chief Executive Officer and Board Member of Community Capital Management (investment management company) (since January 2004); President of The Community Reinvestment Act Qualified Investment Fund (investment management company) (since 2004); Director of Actua Corporation (information technology company) (since October 2003); formerly, Independent Chairman GSK Employee Benefit Trust (April 2006- June 2013); Director of Correctnet (January 2006-2007); Independent Chairman of the Board of Trustees of Quaker Investment Trust (registered investment company) (2004-2007); Chief Operating Officer and Chief Financial Officer of Lincoln National Investment Companies, Inc. (subsidiary of Lincoln National Corporation, a publicly traded company) and Delaware Investments U.S., Inc. (investment management subsidiary of Lincoln National Corporation) (1993- 2003); President, Chief Executive Officer and Trustee of Delaware Investment Family of Funds (1993-2003); President and Board Member of Lincoln National Convertible Securities Funds, Inc. and the Lincoln National Income Funds, TDC (1993-2003); Chairman and Chief Executive Officer of Retirement Financial Services, Inc. (registered transfer agent and investment adviser and subsidiary of Delaware Investments U.S., Inc.) (1993-2003); President and Chief Executive Officer of Delaware Service Company, Inc. (1995-2003); Chief Administrative Officer, Chief Financial Officer, Vice Chairman and Director of Equitable Capital Management Corporation (investment subsidiary of Equitable Life Assurance Society) (1985-1992); Corporate Controller of Merrill Lynch Company (financial services holding company) (1977-1985); held the following positions at the Colonial Penn Group, Inc. (insurance company): Corporate Budget Director (1974-1977), Assistant Treasurer (1972-1974) and Director of Corporate Taxes (1969-1972); held the following positions at Price Waterhouse Company (financial services firm): Tax Manager (1967-1969), Tax Senior (1965-1967) and Staff Accountant (1963-1965); United States Marine Corps (1957-1959). |
62 OPPENHEIMER ROCHESTER PENNSYLVANIA MUNICIPAL FUND
| | |
| |
David K. Downes,
Continued | | Oversees 53 portfolios in the OppenheimerFunds complex. Mr. Downes has served on the Boards of certain Oppenheimer funds since December 2005, during which time he has become familiar with the Fund’s (and other Oppenheimer funds’) financial, accounting, regulatory and investment matters and has contributed to the Boards’ deliberations. |
| |
Matthew P. Fink,
Trustee (since 2005) Year of Birth: 1941 | | Trustee of the Committee for Economic Development (policy research foundation) (2005-2011); Director of ICI Education Foundation (education foundation) (October 1991-August 2006); President of the Investment Company Institute (trade association) (October 1991-June 2004); Director of ICI Mutual Insurance Company (insurance company) (October 1991-June 2004); Author of The Rise of Mutual Funds: An Insider’s View published by Oxford University Press (second edition 2010). Oversees 53 portfolios in the OppenheimerFunds complex. Mr. Fink has served on the Boards of certain Oppenheimer funds since January 2005, during which time he has become familiar with the Fund’s (and other Oppenheimer funds’) financial, accounting, regulatory and investment matters and has contributed to the Boards’ deliberations. |
| |
Edmund P. Giambastiani, Jr.,
Trustee (since 2013)Year of Birth: 1948 | | Advisory Board Member of the Maxwell School of Citizenship and Public Affairs of Syracuse University (since April 2012); Director of Mercury Defense Systems Inc. (information technology) (August 2011-February 2013); Trustee of the U.S. Naval Academy Foundation (since November 2010); Advisory Board Member of the Massachusetts Institute of Technology Lincoln Laboratory (federally-funded research development center) (since May 2010); Director of The Boeing Company (aerospace and defense) (since October 2009); Trustee of MITRE Corporation (federally-funded research development center) (since September 2008); Independent Director of QinetiQ Group Plc (defense technology and security) (February 2008-August 2011); Director of Monster Worldwide, Inc. (on- line career services) (since January 2008, Lead Director since June 2011); Chairman of Alenia North America, Inc. (military and defense products) (January 2008-October 2009); Director of SRA International, Inc. (information technology and services) (January 2008-July 2011); President of Giambastiani Group LLC (national security and energy consulting) (since October 2007); United States Navy, career nuclear submarine officer (June 1970-October 2007), Vice Chairman of the Joint Chiefs of Staff (2005-October 2007), Supreme Allied Commander of NATO Commander Transformation (2003-2005), Commander, U.S. Joint Forces Command (2002-2005). Since his retirement from the U.S. Navy in October 2007, Admiral Giambastiani has also served on numerous U.S. Government advisory boards, investigations and task forces for the Secretaries of Defense, State and Interior and the Central Intelligence Agency. Oversees 53 portfolios in the OppenheimerFunds complex. Admiral Giambastiani has served on the Boards of certain Oppenheimer funds since February 2013, including as an Advisory Board Member for certain Oppenheimer funds, during which time he has become familiar with the Fund’s (and other Oppenheimer funds’) financial, accounting, regulatory and investment matters and has contributed to the Boards’ deliberations. For purposes of this report, Admiral Giambastiani is identified as a Trustee. |
| |
Elizabeth Krentzman,
Trustee (since 2014) Year of Birth: 1959 | | Advisory Board Member of the Securities and Exchange Commission Historical Society (since 2007); held the following positions at Deloitte & Touche LLP: Principal and Chief Regulatory Advisor for Asset Management Services (2007 - 2014) and U.S. Mutual Fund Leader (2011 - 2014); General Counsel of the Investment Company Institute (trade association) (June 2004 - April 2007); held |
63 OPPENHEIMER ROCHESTER PENNSYLVANIA MUNICIPAL FUND
TRUSTEES AND OFFICERS Unaudited / Continued
| | |
| |
Elizabeth Krentzman,
Continued | | the following positions at Deloitte & Touche LLP: National Director of the Investment Management Regulatory Consulting Practice (1997 - 2004), Principal (2003 - 2004), Director (1998 - 2003) and Senior Manager (1997 - 1998); Assistant Director of the Division of Investment Management – Office of Disclosure and Investment Adviser Regulation (1996 - 1997) and various positions with the Division of Investment Management – Office of Regulatory Policy (1991 - 1996) of the U.S. Securities and Exchange Commission; Associate at Ropes & Gray (1987 - 1991); former Chair of the Investment Management Subcommittee of the Washington, D.C. Bar. Oversees 53 portfolios in the OppenheimerFunds complex. Ms. Krentzman has served on the Boards of certain Oppenheimer funds since August 2014, during which time she has become familiar with the Fund’s (and other Oppenheimer funds’) financial, accounting, regulatory and investment matters and has contributed to the Boards’ deliberations. |
| |
Mary F. Miller,
Trustee (since 2004)
Year of Birth: 1942 | | Trustee of International House (not-for-profit) (since June 2007); Trustee of the American Symphony Orchestra (not-for-profit) (October 1998-November 2011); and Senior Vice President and General Auditor of American Express Company (financial services company) (July 1998-February 2003). Oversees 53 portfolios in the OppenheimerFunds complex. Ms. Miller has served on the Boards of certain Oppenheimer funds since August 2004, during which time she has become familiar with the Fund’s (and other Oppenheimer funds’) financial, accounting, regulatory and investment matters and has contributed to the Boards’ deliberations. |
| |
Joel W. Motley,
Trustee (since 2002)
Year of Birth: 1952 | | Director of Greenwall Foundation (since October 2013); Member of the Vestry of Trinity Wall Street (since April 2012); Director of Southern Africa Legal Services Foundation (since March 2012); Board Member of Pulitzer Center for Crisis Reporting (non-profit journalism) (since March 2011); Managing Director of Public Capital Advisors, LLC (privately-held financial advisor) (since January 2006); Managing Director of Carmona Motley, Inc. (privately-held financial advisor) (since January 2002); Director of Columbia Equity Financial Corp. (privately-held financial advisor) (2002-2007); Managing Director of Carmona Motley Hoffman Inc. (privately-held financial advisor) (January 1998-December 2001); Member of the Finance and Budget Committee of the Council on Foreign Relations, Member of the Investment Committee and Board of Human Rights Watch (since July 2000) and Member of the Investment Committee and Board of Historic Hudson Valley (since February 2010). Oversees 53 portfolios in the OppenheimerFunds complex. Mr. Motley has served on the Boards of certain Oppenheimer funds since October 2002, during which time he has become familiar with the Fund’s (and other Oppenheimer funds’) financial, accounting, regulatory and investment matters and has contributed to the Boards’ deliberations. |
| |
Joanne Pace,
Trustee (since 2012)
Year of Birth: 1958 | | Board Director of Horizon Blue Cross Blue Shield of New Jersey (since November 2012); Advisory Board Director of The Alberleen Group LLC (since March, 2012); Advisory Council Member of 100 Women in Hedge Funds (non-profit) (since December, 2012); Advisory Council Member of Morgan Stanley Children’s Hospital (non-profit) (since May, 2012); Board Director of The Komera Project (non-profit) (since April, 2012); Advisory Board Director of The Agile Trading Group LLC (2012-2013); New York Advisory Board Director of Peace First (non- profit) (2010-2013); Senior Advisor of SECOR Asset Management, LP (2010- 2011); Managing Director and Chief Operating Officer of Morgan Stanley |
64 OPPENHEIMER ROCHESTER PENNSYLVANIA MUNICIPAL FUND
| | |
Joanne Pace, Continued | | Investment Management (2006-2010); Partner and Chief Operating Officer of FrontPoint Partners, LLC
(hedge fund) (2005-2006); held the following positions at Credit Suisse: Managing Director (2003-2005);
Global Head of Human Resources and member of Executive Board and Operating Committee (2004- 2005),
Global Head of Operations and Product Control (2003-2004); held the following positions at Morgan Stanley:
Managing Director (1997-2003), Controller and Principal Accounting Officer (1999-2003); Chief Financial
Officer (temporary assignment) for the Oversight Committee, Long Term Capital Management (1998-1999).
Lead Independent Director and Chair of the Audit and Nominating Committee of The Global Chartist Fund,
LLC of Oppenheimer Asset Management (2011-2012); Board Director of Managed Funds Association (2008-
2010); Board Director of Morgan Stanley Foundation (2007-2010) and Investment Committee Chair (2008-
2010). Oversees 53 portfolios in the OppenheimerFunds complex. Ms. Pace has served on the Boards of
certain Oppenheimer funds since November 2012, including as an Advisory Board Member for certain
Oppenheimer funds, during which time she has become familiar with the Fund’s (and other Oppenheimer
funds’) financial, accounting, regulatory and investment matters and has contributed to the Board’s
deliberations. For purposes of this report, Ms. Pace is identified as a Trustee. |
| |
Daniel Vandivort,
Trustee (since 2014) Year of Birth: 1954 | | Chairman and Lead Independent Director/Trustee (March 2010-September 2014), Chairman of the Audit Committee (March 2009-September 2014) and Director/Trustee (December 2008-September 2014) of the Board of Directors/Trustees of Value Line Funds; Trustee, Board of Trustees of Huntington Disease Foundation of America (June 2007-December 2013): Trustee, Board of Trustees, RIM Retirement Savings Plan (2005-2007); President and Chief Investment Officer, Robeco Investment Management, formerly known as Weiss Peck and Greer (January 2005-June 2007); Member, Management Committee of Robeco Investment Management (2001-2007); Chairman and Trustee of the Board of Trustees of Weiss, Peck and Greer Funds (2004-2005); Managing Director and Head of Fixed Income, Weiss, Peck and Greer (November 1994- January 2005); Managing Director and Head of Fixed Income, CS First Boston Investment Management (January 1992-November 1994); Director, Global Product Development, First Boston Asset Management (November 1989-January 1992); Vice President, Fixed Income Sales, First Boston Corp. (May 1984- November 1989). Oversees 53 portfolios in the OppenheimerFunds complex. Mr. Vandivort has served on the Boards of certain Oppenheimer funds since 2014, during which time he has become familiar with the Fund’s (and other Oppenheimer funds’) financial, accounting, regulatory and investment matters and has contributed to the Boards’ deliberations. |
|
|
| |
| INTERESTED TRUSTEES | | Mr. Glavin is an “Interested Trustee” because he is affiliated with the Manager and the Sub-Adviser by virtue of his positions as director of the Sub-Adviser, and as a shareholder of the Sub-Adviser’s parent company. As a Trustee, he serves for an indefinite term, or until his resignation, retirement, death or removal. Mr. Glavin’s address is 225 Liberty Street, New York, New York 10281-1008. Mr. Steinmetz is an “Interested Trustee” because he is affiliated with the Manager and the Sub-Adviser by virtue of his positions as Chairman of the Sub- Adviser and officer and director of the Manager. Both as a Trustee and as an officer, Mr. Steinmetz serves for an indefinite term, or until his resignation, retirement, death or removal. Mr. Steinmetz’s address is 225 Liberty Street, New York, New York 10281-1008 |
| |
| | Mr. Steinmetz is an “Interested Trustee” because he is affiliated with the Manager and the Sub-Adviser by virtue of his positions as Chairman of the Sub-Adviser and officer and director of the Manager. Both as a Trustee and as an officer, Mr. Steinmetz serves for an indefinite term, or until his resignation, retirement, death or removal. Mr. Steinmetz’s address is 225 Liberty Street, New York, New York 10281-1008 |
65 OPPENHEIMER ROCHESTER PENNSYLVANIA MUNICIPAL FUND
TRUSTEES AND OFFICERS Unaudited / Continued
| | |
William F. Glavin, Jr., Trustee (since 2013) Year of Birth: 1958 | | Chairman of the Sub-Adviser (July 2014 -December 2014 and December 2009-December 2012) and Director of the Sub-Adviser (since January 2009); Chairman, Director and Chief Executive Officer (January 2013-June 2014) of the Manager; President of the Manager (January 2013-May 2013); Chief Executive Officer (January 2009-December 2012); President of the Sub-Adviser (May 2009-December 2012); Management Director (June 2009-June 2014), President (December 2009-June 2014) and Chief Executive Officer (January 2011-June 2014) of Oppenheimer Acquisition Corp. (“OAC”) (the Sub-Adviser’s parent holding company); Director of Oppenheimer Real Asset Management, Inc. (March 2010-June 2014); Executive Vice President (March 2006-February 2009) and Chief Operating Officer (July 2007-February 2009) of Massachusetts Mutual Life Insurance Company (OAC’s parent company); Director (May 2004-March 2006) and Chief Operating Officer and Chief Compliance Officer (May 2004-January 2005), President (January 2005-March 2006) and Chief Executive Officer (June 2005-March 2006) of Babson Capital Management LLC; Director (March 2005-March 2006), President (May 2003-March 2006) and Chief Compliance Officer (July 2005-March 2006) of Babson Capital Securities, Inc. (a broker-dealer); President (May 2003-March 2006) of Babson Investment Company, Inc.; Director (May 2004-August 2006) of Babson Capital Europe Limited; Director (May 2004-October 2006) of Babson Capital Guernsey Limited; Director (May 2004-March 2006) of Babson Capital Management LLC; Non-Executive Director (March 2005-March 2007) of Baring Asset Management Limited; Director (February 2005-June 2006) Baring Pension Trustees Limited; Director and Treasurer (December 2003-November 2006) of Charter Oak Capital Management, Inc.; Director (May 2006-September 2006) of C.M. Benefit Insurance Company; Director (May 2008-June 2009) and Executive Vice President (June 2007-July 2009) of C.M. Life Insurance Company; President (March 2006-May 2007) of MassMutual Assignment Company; Director (January 2005-December 2006), Deputy Chairman (March 2005-December 2006) and President (February 2005-March 2005) of MassMutual Holdings (Bermuda) Limited; Director (May 2008-June 2009) and Executive Vice President (June 2007-July 2009) of MML Bay State Life Insurance Company; Chief Executive Officer and President (April 2007-January 2009) of MML Distributors, LLC; and Chairman (March 2006-December 2008) and Chief Executive Officer (May 2007-December 2008) of MML Investors Services, Inc. An officer of 91 portfolios in the OppenheimerFunds complex. Mr. Glavin has served on the Boards of certain Oppenheimer funds since December 2009, during which time he has become familiar with the Fund’s (and other Oppenheimer funds’) financial, accounting, regulatory and investment matters and has contributed to the Boards’ deliberations. |
| |
Arthur P. Steinmetz, Trustee (since 2015), President and Principal Executive Officer (since 2014) Year of Birth: 1958 | | Chairman of the Sub-Adviser (since January 2015); CEO and Chairman of the Manager (since July 2014), President of the Manager (since May 2013), a Director of the Manager (since January 2013), Director of the Sub-Adviser (since July 2014), President, Management Director and CEO of Oppenheimer Acquisition Corp. (the Sub-Adviser’s parent holding company) (since July 2014), and President and Director of OFI SteelPath, Inc. (since January 2013). Chief Investment Officer of the OppenheimerFunds advisory entities from (January 2013-December 2013); Executive Vice President of the Manager (January 2013-May 2013); Chief Investment Officer of the Sub-Adviser (October 2010-December 2012); Chief Investment Officer, Fixed-Income, of the Sub-Adviser (April 2009-October 2010); Executive Vice President of the Sub-Adviser (October |
66 OPPENHEIMER ROCHESTER PENNSYLVANIA MUNICIPAL FUND
| | |
Arthur P. Steinmetz, Continued | | 2009-December 2012); Director of Fixed Income of the Sub-Adviser (January 2009-April 2009); and a Senior Vice President of the Sub-Adviser (March 1993- September 2009). An officer of 91 portfolios in the OppenheimerFunds complex. |
| |
| OFFICERS OF THE FUND | | The addresses of the Officers in the chart below are as follows: for Messrs. Loughran, Cottier, Willis, DeMitry, Camarella, Pulire, Stein, Gabinet, Mss. Sexton and Picciotto, 225 Liberty Street, New York, New York 10281-1008, for Mr. Wixted, 6803 S. Tucson Way, Centennial, Colorado 80112-3924. Each Officer serves for an indefinite term or until his or her resignation, retirement, death or removal. |
| |
Daniel G. Loughran, Vice President (since 2005) Year of Birth: 1963 | | Senior Vice President of the Sub-Adviser (since July 2007) and a Senior Portfolio Manager (since December 2001); Vice President of the Sub-Adviser (April 2001- June 2007) and a Portfolio Manager with the Sub-Adviser (December 1999- November 2001). Team Leader, a Senior Portfolio Manager, an officer and a trader for the Fund and other Oppenheimer funds. |
| |
Scott S. Cottier, Vice President (since 2005) Year of Birth: 1971 | | Vice President of the Sub-Adviser and a Senior Portfolio Manager (since September 2002). Portfolio Manager and trader at Victory Capital Management (1999-2002). Senior Portfolio Manager, an officer and a trader for the Fund and other Oppenheimer funds. |
| |
Troy E. Willis, Vice President (since 2005) Year of Birth: 1972 | | Vice President of the Sub-Adviser (since July 2009) and a Senior Portfolio Manager (since January 2006); Assistant Vice President of the Sub-Adviser (July 2005-June 2009). Portfolio Manager of the Sub-Adviser (June 2002-December 2005). Corporate Attorney for Southern Resource Group (June 1999-July 2001). Senior Portfolio Manager, an officer and a trader for the Fund and other Oppenheimer funds. |
| |
Mark R. DeMitry, Vice President (since 2009) Year of Birth: 1976 | | Vice President of the Sub-Adviser and a Senior Portfolio Manager (since July 2009); Associate Portfolio Manager of the Fund (September 2006- June 2009). Research Analyst of the Sub-Adviser (June 2003-September 2006) and a Credit Analyst of the Sub-Adviser (July 2001-May 2003). Senior Portfolio Manager, an officer and a trader for the Fund and other Oppenheimer funds. |
| |
Michael L. Camarella, Vice President (since 2009) Year of Birth: 1976 | | Vice President of the Sub-Adviser and a Senior Portfolio Manager (since January 2011); Assistant Vice President of the Sub-Adviser (July 2009-December 2010); Associate Portfolio Manager of the Sub-Adviser (January 2008-December 2010). Research Analyst of the Sub-Adviser (April 2006-December 2007) and a Credit Analyst of the Sub-Adviser (June 2003-March 2006). Senior Portfolio Manager, an officer and a trader for the Fund and other Oppenheimer funds. |
| |
Charles S. Pulire, Vice President (since 2011) Year of Birth: 1977 | | Vice President of the Sub-Adviser and a Senior Portfolio Manager (since February 2013); Assistant Vice President of the Sub-Adviser (December 2010-January 2013); Research Analyst of the Manager (February 2008-November 2010); Credit Analyst of the Sub-Adviser (May 2006-January 2008). Senior Portfolio Manager, an officer and a trader for the Fund and other Oppenheimer funds. |
| |
Richard A. Stein, Vice President (since 2007) Year of Birth: 1957 | | Director of the Rochester Credit Analysis team (since March 2004); Senior Vice President of the Sub-Adviser (since June 2011) and a Vice President of the Sub-Adviser (November 1997-May 2011); heads up the Rochester Credit Analysis team (since May 1993). |
67 OPPENHEIMER ROCHESTER PENNSYLVANIA MUNICIPAL FUND
TRUSTEES AND OFFICERS Unaudited / Continued
| | |
Arthur S. Gabinet, Secretary and Chief Legal Officer (since 2011) Year of Birth: 1958 | | Executive Vice President, Secretary and General Counsel of the Manager (since January 2013); General Counsel OFI SteelPath, Inc. (since January 2013); Executive Vice President (May 2010-December 2012) and General Counsel (since January 2011) of the Sub-Adviser; General Counsel of the Distributor (since January 2011); General Counsel of Centennial Asset Management Corporation (January 2011-December 2012); Executive Vice President (January 2011-December 2012) and General Counsel of HarbourView Asset Management Corporation (since January 2011); Assistant Secretary (since January 2011) and Director (since January 2011) of OppenheimerFunds International Ltd. and OppenheimerFunds plc; Director of Oppenheimer Real Asset Management, Inc. (January 2011-December 2012) and General Counsel (since January 2011); Executive Vice President (January 2011-December 2011) and General Counsel of Shareholder Financial Services, Inc. and Shareholder Services, Inc. (since January 2011); Executive Vice President (January 2011-December 2012) and General Counsel of OFI Private Investments Inc. (since January 2011); Vice President of OppenheimerFunds Legacy Program (January 2011-December 2011); Executive Vice President (January 2011-December 2012) and General Counsel of OFI Institutional Asset Management, Inc. (since January 2011); General Counsel, Asset Management of the Sub-Adviser (May 2010-December 2010); Principal, The Vanguard Group (November 2005-April 2010); District Administrator, U.S. Securities and Exchange Commission (January 2003-October 2005). An officer of 91 portfolios in the OppenheimerFunds complex. |
| |
Jennifer Sexton, Vice President and Chief Business Officer (since 2014) Year of Birth: 1969 | | Senior Vice President of OppenheimerFunds Distributor, Inc. (since June 2014); Vice President of OppenheimerFunds Distributor, Inc. (April 2006-June 2014); Vice President of the Sub-Adviser (January 1998-March 2006); Assistant Vice President of the Sub-Adviser (October 1991-December 1998). An officer of 91 portfolios in the OppenheimerFunds complex. |
| |
Mary Ann Picciotto, Chief Compliance Officer and Chief Anti-Money Laundering Officer (since 2014) Year of Birth: 1973 | | Senior Vice President and Chief Compliance Officer of the Manager (since March 2014); Chief Compliance Officer of the Sub-Adviser, OFI SteelPath, Inc., OFI Global Trust Company, OFI Global Institutional, Inc., Oppenheimer Real Asset Management, Inc., OFI Private Investments, Inc., Harborview Asset Management Corporation, Trinity Investment Management Corporation, and Shareholder Services, Inc. (since March 2014); Managing Director of Morgan Stanley Investment Management Inc. and certain of its various affiliated entities; Chief Compliance Officer of various Morgan Stanley Funds (May 2010-January 2014); Chief Compliance Officer of Morgan Stanley Investment Management Inc. (April 2007-January 2014). An officer of 91 portfolios in the OppenheimerFunds complex. |
| |
Brian W. Wixted, Treasurer and Principal Financial & Accounting Officer (since 2007) Year of Birth: 1959 | | Senior Vice President of the Manager (since January 2013); Treasurer of the Sub-Adviser, HarbourView Asset Management Corporation, Shareholder Financial Services, Inc., Shareholder Services, Inc., and Oppenheimer Real Asset Management, Inc. (March 1999-June 2008), OFI Private Investments, Inc. (March 2000-June 2008), OppenheimerFunds International Ltd. and OppenheimerFunds plc (since May 2000), OFI Institutional Asset Management, Inc. (November 2000-June 2008), and OppenheimerFunds Legacy Program (charitable trust program established by the Sub-Adviser) (June 2003-December 2011); Treasurer and Chief Financial Officer of OFI Trust Company (since May 2000); Assistant Treasurer of Oppenheimer Acquisition Corporation (March 1999-June 2008). An officer of 91 portfolios in the OppenheimerFunds complex. |
68 OPPENHEIMER ROCHESTER PENNSYLVANIA MUNICIPAL FUND
The Fund’s Statement of Additional Information contains additional information about the Fund’s Trustees and Officers and is available without charge upon request, by calling 1.800.CALL OPP (225.5677).
69 OPPENHEIMER ROCHESTER PENNSYLVANIA MUNICIPAL FUND
OPPENHEIMER ROCHESTER PENNSYLVANIA MUNICIPAL FUND
| | |
| Manager | | OFI Global Asset Management, Inc. |
| |
| Sub-Adviser | | OppenheimerFunds, Inc. |
| |
| Distributor | | OppenheimerFunds Distributor, Inc. |
| |
Transfer and Shareholder Servicing Agent | | OFI Global Asset Management, Inc. |
| |
| Sub-Transfer Agent | | Shareholder Services, Inc. DBA OppenheimerFunds Services |
| |
Independent Registered Public Accounting Firm | | KPMG LLP |
| |
| Legal Counsel | | Kramer Levin Naftalis & Frankel LLP |
© 2015 OppenheimerFunds, Inc. All rights reserved.
70 OPPENHEIMER ROCHESTER PENNSYLVANIA MUNICIPAL FUND
PRIVACY POLICY NOTICE
As an Oppenheimer fund shareholder, you are entitled to know how we protect your personal information and how we limit its disclosure.
Information Sources
We obtain nonpublic personal information about our shareholders from the following sources:
| ● | Applications or other forms |
| ● | When you create a user ID and password for online account access |
| ● | When you enroll in eDocs Direct, our electronic document delivery service |
| ● | Your transactions with us, our affiliates or others |
| ● | A software program on our website, often referred to as a “cookie,” which indicates which parts of our site you’ve visited |
| ● | When you set up challenge questions to reset your password online |
If you visit oppenheimerfunds.com and do not log on to the secure account information areas, we do not obtain any personal information about you. When you do log on to a secure area, we do obtain your user ID and password to identify you. We also use this information to provide you with products and services you have requested, to inform you about products and services that you may be interested in and assist you in other ways.
We do not collect personal information through our website unless you willingly provide it to us, either directly by email or in those areas of the website that request information. In order to update your personal information (including your mailing address, email address and phone number) you must first log on and visit your user profile.
If you have set your browser to warn you before accepting cookies, you will receive the warning message with each cookie. You can refuse cookies by turning them off in your browser. However, doing so may limit your access to certain sections of our website.
We use cookies to help us improve and manage our website. For example, cookies help us recognize new versus repeat visitors to the site, track the pages visited, and enable some special features on the website. This data helps us provide a better service for our website visitors.
Protection of Information
We do not disclose any non-public personal information (such as names on a customer list) about current or former customers to anyone, except as permitted by law.
Disclosure of Information
Copies of confirmations, account statements and other documents reporting activity in your fund accounts are made available to your financial advisor (as designated by you). We may also use details about you and your investments to help us, our financial service affiliates, or firms that jointly market their financial products and services with ours, to better serve your investment needs or suggest financial services or educational material that may be of interest to you. If this requires us to provide you with an opportunity to “opt in” or “opt out” of such information sharing with a firm not affiliated with us, you will receive notification on how to do so, before any such sharing takes place.
Right of Refusal
We will not disclose your personal information to unaffiliated third parties (except as permitted by law), unless we first offer you a reasonable opportunity to refuse or “opt out” of such disclosure.
71 OPPENHEIMER ROCHESTER PENNSYLVANIA MUNICIPAL FUND
PRIVACY POLICY NOTICE Continued
Internet Security and Encryption
In general, the email services provided by our website are encrypted and provide a secure and private means of communication with us. To protect your own privacy, confidential and/or personal information should only be communicated via email when you are advised that you are using a secure website. As a security measure, we do not include personal or account information in non-secure emails, and we advise you not to send such information to us in non-secure emails. Instead, you may take advantage of the secure features of our website to encrypt your email correspondence. To do this, you will need to use a browser that supports Secure Sockets Layer (SSL) protocol.
We do not guarantee or warrant that any part of our website, including files available for download, are free of viruses or other harmful code. It is your responsibility to take appropriate precautions, such as use of an anti-virus software package, to protect your computer hardware and software.
| ● | All transactions, including redemptions, exchanges and purchases, are secured by SSL and 256-bit encryption. SSL is used to establish a secure connection between your PC and OppenheimerFunds’ server. It transmits information in an encrypted and scrambled format. |
| ● | Encryption is achieved through an electronic scrambling technology that uses a “key” to code and then decode the data. Encryption acts like the cable converter box you may have on your television set. It scrambles data with a secret code so that no one can make sense of it while it is being transmitted. When the data reaches its destination, the same software unscrambles the data. |
| ● | You can exit the secure area by either closing your browser, or for added security, you can use the Log Out button before you close your browser. |
Other Security Measures
We maintain physical, electronic and procedural safeguards to protect your personal account information. Our employees and agents have access to that information only so that they may offer you products or provide services, for example, when responding to your account questions.
How You Can Help
You can also do your part to keep your account information private and to prevent unauthorized transactions. If you obtain a user ID and password for your account, do not allow it to be used by anyone else. Also, take special precautions when accessing your account on a computer used by others.
Who We Are
This joint notice describes the privacy policies of the Oppenheimer funds, OppenheimerFunds, Inc., each of its investment adviser subsidiaries, OppenheimerFunds Distributor, Inc. and OFI Global Trust Co. It applies to all Oppenheimer fund accounts you presently have, or may open in the future, using your Social Security number—whether or not you remain a shareholder of our funds. This notice was last updated March 2015. In the event it is updated or changed, we will post an updated notice on our website at oppenheimerfunds.com. If you have any questions about this privacy policy, write to us at P.O. Box 5270, Denver, CO 80217-5270, email us by clicking on the Contact Us section of our website at oppenheimerfunds.com or call us at 1.800.CALL OPP (225.5677).
72 OPPENHEIMER ROCHESTER PENNSYLVANIA MUNICIPAL FUND
THIS PAGE INTENTIONALLY LEFT BLANK.
73 OPPENHEIMER ROCHESTER PENNSYLVANIA MUNICIPAL FUND
THIS PAGE INTENTIONALLY LEFT BLANK.
74 OPPENHEIMER ROCHESTER PENNSYLVANIA MUNICIPAL FUND
THIS PAGE INTENTIONALLY LEFT BLANK.
75 OPPENHEIMER ROCHESTER PENNSYLVANIA MUNICIPAL FUND
THIS PAGE INTENTIONALLY LEFT BLANK.
76 OPPENHEIMER ROCHESTER PENNSYLVANIA MUNICIPAL FUND
THIS PAGE INTENTIONALLY LEFT BLANK.
77 OPPENHEIMER ROCHESTER PENNSYLVANIA MUNICIPAL FUND
THIS PAGE INTENTIONALLY LEFT BLANK.
78 OPPENHEIMER ROCHESTER PENNSYLVANIA MUNICIPAL FUND
THIS PAGE INTENTIONALLY LEFT BLANK.
79 OPPENHEIMER ROCHESTER PENNSYLVANIA MUNICIPAL FUND

Table of Contents
Class A Shares
AVERAGE ANNUAL TOTAL RETURNS AT 7/31/15
| | | | | | | | |
| | | Class A Shares of the Fund | | |
| | | Without Sales Charge | | With Sales Charge | | | | Barclays Municipal
Bond Index |
| | | | |
1-Year | | 4.59% | | -0.37% | | | | 3.56% |
5-Year | | 6.48 | | 5.45 | | | | 4.39 |
10-Year | | 0.98 | | 0.49 | | | | 4.57 |
Performance data quoted represents past performance, which does not guarantee future results. The investment return and principal value of an investment in the Fund will fluctuate so that an investor’s shares, when redeemed, may be worth more or less than their original cost. Fund returns include changes in share price, reinvested distributions, and a 4.75% maximum applicable sales charge except where “without sales charge” is indicated. Current performance may be lower or higher than the performance quoted. Returns do not consider capital gains or income taxes on an individual’s investment. For performance data current to the most recent month-end, visit oppenheimerfunds.com or call 1.800.CALL OPP (225.5677).
Oppenheimer Rochester is using social media to provide timely information related to muni market developments at www.twitter.com/RochesterFunds.
2 OPPENHEIMER ROCHESTER HIGH YIELD MUNICIPAL FUND
Fund Performance Discussion
Amid low interest rates and coverage that we believe was often narrowly focused on the market’s challenges, Oppenheimer Rochester High Yield Municipal Fund delivered high levels of tax-free income in the 12 months ended July 31, 2015 and outperformed its benchmark, the Barclays Municipal Bond Index. The distribution yield of the Class A shares was 6.82% (without sales charge) and produced an annual total return of 4.59% (without sales charge), beating its benchmark by 103 basis points for the 12-month period ended July 31, 2015. During this reporting period, tax-free income provided 100% of the Fund’s total return.
MARKET OVERVIEW
Yields on high-grade municipal bonds rose during this reporting period as the market continued to anticipate changes to the Fed Funds target rate. Since October 2014, when the Federal Open Market Committee (FOMC) voted to end its program of purchasing mortgage-backed securities and long-term Treasuries in an effort to stimulate the economy (quantitative easing), speculation about the Fed’s plans often triggered movements in the equity and bond markets.
Near the end of this reporting period, Federal Reserve Chairman Janet Yellen told the U.S. Congress that improving economic conditions “would likely make it appropriate for the
|
The average distribution yield in Lipper’s High Yield Municipal Debt Funds category was 3.97% at the end of this reporting period. At 6.82%, the distribution yield at NAV for this Fund’s Class A shares was 285 basis points higher than the category average. |
central bank to raise rates at some point this year,” assuming the labor market continues to advance.
While not definitive by any measure, the statement was more specific than earlier announcements from the Fed. For example, in October 2014, the FOMC said it planned to
| | | | | | |
YIELDS & DISTRIBUTIONS FOR CLASS A SHARES | | | | | | |
| | |
Dividend Yield w/o sales charge | | | 6.82 | % | | |
| | |
Dividend Yield with sales charge | | | 6.50 | | | |
| | |
Standardized Yield | | | 6.52 | | | |
| | |
Taxable Equivalent Yield | | | 11.52 | | | |
| | |
Last distribution (7/28/15) | | $ | 0.039 | | | |
| | |
Total distributions (8/1/14 to 7/31/15) | | $ | 0.478 | | | |
Endnotes for this discussion begin on page 17 of this report
3 OPPENHEIMER ROCHESTER HIGH YIELD MUNICIPAL FUND
keep the Fed Funds target rate at its current level “for a considerable time” after the end of its bond-buying program. According to a statement released November 19, 2014, the FOMC observed solid job gains, a lower unemployment rate and increases in household and business spending. The committee’s concerns about inflation and falling energy prices, among other factors, played into its decision to “maintain its existing policy of reinvesting principal payments from its holdings of agency debt and agency mortgage-backed securities and rolling over maturing Treasury securities at auction.”
In December 2014, the committee said it could “be patient in beginning to normalize the stance of monetary policy,” but the word “patient” did not appear in the minutes of the February 2015 meeting. In a press conference after the February meeting, Ms. Yellen cautioned that “just because we removed the word ‘patient’ doesn’t mean we will be impatient.” Fed officials also stated in February that “the committee will increase the Fed Funds rate only when it has seen further improvement in the labor market and is reasonably confident that inflation will move back to its 2% objective over the medium term.”
By late April, the Fed had removed all calendar-based language relating to possible rate increases, citing a “transitory” decline in output and employment during the first quarter of 2015 with declines in energy prices and non-energy imports keeping inflation low.
In a speech after the May 2015 FOMC meeting, Ms. Yellen said, “If the economy continues to improve as I expect, I think it will be appropriate at some point this year to take the initial step to raise the Federal Funds rate target and begin the process of normalizing monetary policy.”
With the current Fed Funds rate set between zero and 0.25% since December 2008, the only plausible change would be an increase. We remind investors that a change in the Fed Funds rate does not automatically translate into a change in longer-term interest rates, which are determined by the marketplace.
The Fund’s investment team will continue to search for value in the muni market as it seeks to produce competitive levels of tax-free income amid stable or changing market conditions.
As of July 31, 2015, the average yield on 30-year, AAA-rated muni bonds was 4.53%, up 109 basis points from July 31, 2014. The average yield on 10-year, AAA-rated muni bonds was 2.40% on July 31, 2015, up 18 basis points from the July 2014 date, and the average yield on 1-year, AAA-rated muni bonds was 0.37%, up 22 basis points from the July 2014 date.
Successful investors, we have found, maintain a long-term perspective regardless of the specific developments associated with any given reporting period. To maximize the benefits that municipal bond funds seek to provide, many investors reinvest their
4 OPPENHEIMER ROCHESTER HIGH YIELD MUNICIPAL FUND
dividends and allow the income generated from their investments to compound over time.
FUND PERFORMANCE
Oppenheimer Rochester High Yield Municipal Fund held more than 1,080 securities as of July 31, 2015. The Fund was invested in a broad range of sectors, providing shareholders with a diversity of holdings that we believe would be difficult and costly to replicate in an individual portfolio.
The Fund’s Class A distribution yield at NAV was the second highest in Lipper’s High Yield Municipal Debt Funds category, trailing only the distribution yield of this Fund’s Y shares. At 6.82% on that date, it was 285 basis points higher than the category average, which was 3.97%. Additionally, for a taxable investment to have provided a greater benefit than an investment in this Fund, it would have had to yield more than 11.52%, based on the Fund’s standardized yield as of July 31, 2015, and the current top federal income tax rate. As long-time investors know, yields on fixed-income funds rise when share prices fall, and yields have historically contributed the lion’s share of the long-term total returns generated by bonds.
The persistence of low interest rates created pressure on the dividends of many fixed-income funds this reporting period. This Fund’s Class A dividend, which was 4.1 cents per share at the outset of the reporting period, was reduced to 3.9 cents per share beginning with the January 2015 payout. In all, the Fund
distributed 47.8 cents per Class A share this reporting period.
Municipal bonds backed by proceeds from the tobacco Master Settlement Agreement (the MSA), the national litigation settlement with U.S. tobacco manufacturers, represented 22.2% of the Fund’s total assets (22.3% of net assets) at the end of this reporting period. During this reporting period, the sector contributed positively to the Fund’s performance.
We believe the securities we hold in this sector are fundamentally sound credits, and we like that “tobacco bonds” can provide tax-exempt income for investors as well as benefits to the issuing states and territories. Our long-term view of the sector remains bullish and, given attractive valuations, we believe that it is likely we will continue to hold a greater percentage of tobacco bonds in our portfolios than our peers. As in prior reporting periods, the tobacco bonds this Fund held during this reporting period made all scheduled payments of interest and principal on time and in full.
As of July 31, 2015, the Fund remained invested in land development (or “dirt”) bonds, which consist of the Fund’s Special Assessment securities and the subset of the Fund’s Special Tax bonds that help finance the infrastructure needs of new real estate development. At the end of this reporting period, the Special Assessment and Special Tax sectors represented 10.2% and 2.0% of the Fund’s total assets (10.3% and 2.0% of net assets), respectively.
5 OPPENHEIMER ROCHESTER HIGH YIELD MUNICIPAL FUND
Overall, we believe that land development bonds have several appealing characteristics: The debt service payments securing these bonds are on parity with real estate taxes and senior to mortgage payments, and assessments or taxes must be paid by whoever owns the land when the tax bill comes due. Additionally, we continue to believe that improvements in the housing market and the general economy could further strengthen the credit profiles of these bonds.
The Special Tax sector also includes a number of bonds that are not land development bonds but are backed instead by various taxes; these taxes have had consistently strong cash flows that must be used to cover the debt service obligations and have consistently done so. These bonds, all of which were issued in Puerto Rico, represented about 6% of this Fund’s Special Tax sector, based on market value at the end of this reporting period.
Both the Special Assessment and Special Tax sectors contributed positively to Fund performance this reporting period.
Securities issued in the Commonwealth of Puerto Rico, which are exempt from federal, state and local income taxes, represented 12.2% of the Fund’s total assets (12.2% of net assets) at the end of this reporting period. Puerto Rico’s “tobacco bonds” are excluded from this figure, as they are backed by proceeds from the tobacco MSA and included in this Fund’s tobacco holdings. The Fund’s holdings, some of which are insured, include G.O. debt and securities from many different
sectors. Most of the Fund’s investments in securities issued in Puerto Rico are supported by taxes and other revenues and are designed to help finance electric utilities, highways and education, among other things.
During this reporting period, the government agreed to raise its sales tax rate to 11.5%, from 7.0%. By April 1, 2016, the sales tax will be replaced by a value-added tax (VAT), which is expected to lead to higher tax revenues for the Commonwealth.
News from the Commonwealth that it had once again passed a balanced budget was tempered by the sudden announcement by Governor Alejandro García Padilla in late June 2015 that Puerto Rico was not able to pay its debts. A government-commissioned study known as the Krueger Report reached a similar conclusion. Investors should note that the report is unaudited and does not compel the administration to implement the report’s recommendations.
The $9.8 billion budget for fiscal year 2016 includes approximately $1 billion to cover the Commonwealth’s G.O. debt-service obligations. Operational spending totals about $8.3 billion. The legislature also created a $275 million special fund from the Government Development Bank’s allocation to cover debt obligations and economic development. With the lowest operational spending level in at least 10 years, the budget reduces the operational budgets of most government agencies by 2% to 3% versus fiscal year 2015, which ended June 30, 2015.
6 OPPENHEIMER ROCHESTER HIGH YIELD MUNICIPAL FUND
The Rochester Portfolio Management Team
Nonprofits that provide essential social services had their budgets decreased by no more than 10%.
A decision that we believe has important implications for the muni industry – and our funds in particular – was announced earlier in the reporting period: On February 6, 2015, a federal judge ruled that the Puerto Rico Public Corporation Debt Enforcement and Recovery Act (the “Recovery Act”) violated the U.S. Constitution and was invalid. As you may recall, the Recovery Act was passed in late
June 2014 and the Oppenheimer Rochester municipal bond funds filed suit immediately, challenging the legislation that was designed to allow PREPA (the island’s electric utility authority), PRASA (the aqueduct and sewer authority) and PRHTA (the highway authority) to restructure their debt under the supervision of a Commonwealth court. On July 6, 2015, a federal appeals court unanimously affirmed the earlier decision.
The forbearance agreement that was reached in August 2014 between PREPA and many of
7 OPPENHEIMER ROCHESTER HIGH YIELD MUNICIPAL FUND
The Rochester Credit Research Team
| | | | | | | | |
 | |  | |  | |  | | |
| | | | |
| Rich Stein, CFA | | Chris Weiler, CFA | | Bob Bertucci, CFA | | Angela Uttaro | | |
| Director of Credit | | Senior Credit Analyst | | Senior Credit Analyst | | Senior Credit Analyst | | |
| Research | | | | | | | | |
| | | | |
 | |  | |  | |  | | |
| | | | |
| Matt Torpey, CFA | | René Vecka, CFA | | Jon Hagen, CFA | | Alen Kreso, CFA | | |
| Senior Credit Analyst | | Senior Credit Analyst | | Senior Credit Analyst | | Senior Credit Analyst | | |
| | | | |
 | |  | |  | | | | |
| Chris Meteyer | | Clara Sanguinetti | | Chad Osterhout | | | | |
| Credit Analyst | | Credit Analyst | | Credit Analyst | | | | |
8 OPPENHEIMER ROCHESTER HIGH YIELD MUNICIPAL FUND
its creditors, including this Fund, was extended several times beyond March 31, 2015, its initial expiration date. In the agreement, now set to expire September 15, 2015, the bondholders have agreed to forbear from exercising rights in connection with events that would constitute a default on PREPA bonds, and PREPA had agreed to a variety of financial terms and to submit a 5-year restructuring plan. PREPA made a full $415 million bond payment on July 1, 2015 and promised to reach a comprehensive restructuring plan with its creditors by September 1, 2015. PREPA’s payment was among more than $1 billion in transfers made by Puerto Rico public entities, as money came due at the start of the Commonwealth’s new fiscal year, July 1, 2015.
We are encouraged by the government’s efforts to reduce spending and increase revenue. We continue to believe that Puerto Rico must act within the tenets of the law, including its Constitution. Questions about the degree to which Puerto Rico and its agencies and authorities are committed to honoring their debt-service obligations created significant pressure on the prices of their securities, especially in the latter months of this reporting period. As a result, the Fund’s Puerto Rico holdings in aggregate had a negative impact on the Fund’s total return.
Our investment team’s commitment to protecting the interests of our shareholders is unwavering. Investors should note that deterioration of the Puerto Rican economy could have an adverse impact on Puerto Rico
bonds and the performance of the Oppenheimer Rochester municipal funds that hold them, including this Fund. We will continue to monitor credit rating changes and other developments related to our Puerto Rico holdings closely.
Given the degree to which Oppenheimer Rochester funds have been cited in news coverage about the economic and fiscal challenges facing Puerto Rico, we feel compelled to remind investors that all fund investments are actively managed. Our team is responsive to the dynamics of the market and may choose to adjust trading strategies in the interest of maximizing the potential benefits to our shareholders. Further, while we remain committed to keeping investors informed about our basic investing strategies, we do not provide comment about near-term trading strategies as we believe doing so might allow other market participants to impair our team’s ability to deliver shareholder value.
Update (as of September 21, 2015): In the weeks that followed the end of this reporting period, several developments in Puerto Rico and decisions by its agencies and officials kept the Commonwealth in the spotlight. For example, of the four Puerto Rico bond issuers that had payments due on August 3, 2015, three made their payments on time and in full; the Puerto Rico Finance Corporation (PFC) did not.
The PFC’s bond covenant called for a $58 million payment of principal and interest on August 3. Instead, a payment of $628,000
9 OPPENHEIMER ROCHESTER HIGH YIELD MUNICIPAL FUND
was made to PFC bondholders, a group that includes individual Americans on the mainland and in the Commonwealth, Puerto Rican credit unions, and Oppenheimer Rochester municipal bond funds and other retail municipal bond funds, among others. Prior to August 3, prices of PFC bonds fell sharply, a signal that the market had anticipated this default; as of this update, these securities continued to trade in the teens.
As long-time investors know, net asset values (NAVs) of municipal bond funds are adjusted daily based on a third party’s pricing of all bonds in the marketplace. Thus, the NAVs of our funds, many of which have invested in the Commonwealth and its agencies and government instrumentalities, reflect all price changes. In light of the non-payment by the PFC, investors should expect volatility in the prices of PFC bonds and other bonds issued by the Commonwealth.
We note that two issuers of revenue-backed bonds – the Puerto Rico Sales Tax Financing Corporation (COFINA) and the Puerto Rico Municipal Finance Agency (MFA) – met their August 3, 2015 debt-service obligations on time and in full.
The COFINA bonds, which are backed by sales tax revenue, are held by several of the Oppenheimer Rochester funds. The MFA bonds – which are backed by ad valorem taxes that are based on the assessed value of real estate, personal property and/or the duty levied on imported items – also paid their bondholders, including Oppenheimer Rochester funds. We believe that the legal
protections for the COFINA bonds and Puerto Rico’s general obligation (G.O.) debt are strong, and many of our funds have overweight positions in these bonds.
Also on August 3, 2015, the Government Development Bank for Puerto Rico (GDB) made loan payments to banks that totaled approximately $140 million.
Later in the month, on August 21, 2015, the Commonwealth petitioned the U.S. Supreme Court to overturn a federal district court ruling, which had been affirmed on appeal, related to the Recovery Act: that the Act violated the U.S. Constitution and was invalid. In its petition, the Commonwealth argues that Puerto Rico’s issuers should have the right to restructure their debt pursuant to the terms set forth in the Commonwealth’s Recovery Act. As bondholders, we see things differently: The Commonwealth and its issuers agreed to specific and carefully constructed bond covenants when they sold securities, and the contracts should be honored. Our team remains ready to defend the terms of our investments’ bond indentures.
On September 1, 2015, just prior to the expiration of the forbearance agreement, PREPA and the forbearing bondholders reached an agreement in principle on the major financial terms of a securitization transaction to lower PREPA’s debt service costs. Although the proposed agreement would result in a reduction in the par value of PREPA’s existing bonds, we nevertheless believe the agreement – if implemented – will be a win for bondholders.
10 OPPENHEIMER ROCHESTER HIGH YIELD MUNICIPAL FUND
Investors should note that the new bond structure would be bankruptcy remote, which serves to protect bondholders from event risks; that the term sheet requires that the new securitization bonds earn an investment-grade rating; that the deal requires high participation by all bondholders, and that insurers reach agreement with PREPA on the treatment of the insured bonds. If all goes as planned, bondholders will face neither the risks and uncertainties related to any inefficiency in PREPA’s operations nor the costs that would mount should any future litigation be required. While we expect that all parties will work toward a restructuring support agreement, we remind investors that there is no guarantee of either a timeline or implementation.
The forbearance agreement with bondholders, which has been extended repeatedly since first signed in August 2014 and was set to expire September 18, 2015, was extended on that date to October 1, 2015. However, PREPA did not secure an extension from its bond insurers, a group that guarantees $2.5 billion of the utility’s debt. According to PREPA’s chief restructuring officer, negotiations with the bond insurers will continue.
After a week-long delay that officials said was caused by Hurricane Erika, the Working Group that had been charged by the governor to deliver a 5-Year Fiscal Plan by September 1, 2015, handed in its plan. Like the government-commissioned Krueger Report that preceded it, the Working Group’s plan included a lengthy roster of policy changes and austerity measures designed to resolve some of the Commonwealth’s financial
difficulties. Politicians, including some candidates for the presidency, have voiced concerns about the current circumstances in Puerto Rico, and we believe the situation will remain political in the near term. In fact, many of the recommendations would require action by the U.S. Congress or the Puerto Rico Legislature. Even if all the recommendations were implemented, the plan indicated that Puerto Rico would still face a $14 billion financing gap between 2016 and 2020. In the weeks following the release of the plan, leading market analysts raised what we believe to be substantive questions about the accuracy of many of the plan’s figures.
Investors should note that the plan also seeks to reduce and/or restructure some of Puerto Rico’s debt. In a televised address, the governor said, “The plan itself will not get us out of the hole we find ourselves in. It’s time that creditors come to the table and share in the sacrifice.” We continue to believe that Puerto Rico must act within the tenets of the law, including its Constitution.
Separately, it is noteworthy that PRASA, the water utility, had announced plans to issue $750 million in bonds. Originally slated for August 25, 2015, the offering has since been revised to provide greater bondholder protections and higher initial yields and, as of this writing, was listed as “day-to-day.” PRASA’s ability to cut expenses and reduce its debt service obligations helped the utility achieve stronger-than-expected results for fiscal year 2015 despite lower-than-expected revenue, according to results released in September.
11 OPPENHEIMER ROCHESTER HIGH YIELD MUNICIPAL FUND
The Oppenheimer Rochester team has been an active participant in negotiations with Puerto Rico officials, and shareholders should be confident that we will continue to work to protect our shareholders’ rights and best interests.
The Fund’s holdings in municipal bonds issued by utilities represented 8.9% of total assets (8.9% of net assets) at the end of this reporting period. This set of holdings included sewer utilities with 5.7% of total assets (5.7% of net assets), electric utilities with 2.2% of total assets (2.2% of net assets), water utilities with 0.9% of total assets (0.9% of net assets) and gas utilities with 0.1% of total assets (0.1% of net assets) as of July 31, 2015. Based on market value at the end of this reporting period, securities issued by PRASA represented about one-quarter of the Fund’s holdings in the sewer utilities sector and securities issued by PREPA represented about three-quarters of the electric utilities sector. Our holdings in these sectors consist of securities in the mid-range of the credit spectrum and all of the Fund’s utility sectors contributed positively to performance this reporting period. Investors should note that the Fund’s PRASA and PREPA holdings were among the positive contributors to the Fund’s total return.
The Fund remained invested in the adult living facilities sector, which represented 7.9% of total assets (8.0% of net assets) as of July 31, 2015. These bonds, which finance various projects at senior living centers, tend to perform well in densely populated geographies with strong real estate values and in more
rural areas with stable home prices. This sector contributed positively to the Fund’s performance.
As of July 31, 2015, the Fund was invested in the hospital/healthcare sector, which represented 7.6% of total assets (7.7% of net assets), contributing positively to Fund performance. Our holdings in this sector consist of securities across the credit spectrum, but most are investment grade. Based on market value at the end of this reporting period, about 1.5% of the Fund’s holdings in this sector were issued in Puerto Rico.
General obligation (G.O.) securities, which are backed by the full faith and taxing authority of state and local governments, comprised 6.2% of total assets (6.2% of net assets) as of July 31, 2015. Within this sector, the Fund holds bonds issued in various U.S. municipalities, including the Commonwealth of Puerto Rico and the Northern Mariana Islands. Investments in this sector detracted from the Fund’s overall performance this reporting period, driven in part by the performance of Puerto Rico’s G.O.s.
The Fund’s airline holdings represented 4.8% of total assets (4.8% of net assets) as of July 31, 2015. Many of the Fund’s holdings in this sector are backed by a security interest in the airport terminal buildings or maintenance facilities whose construction they finance, and we believe that these bonds offer investors valuable collateral. The airline sector contributed positively to the Fund’s performance this reporting period.
12 OPPENHEIMER ROCHESTER HIGH YIELD MUNICIPAL FUND
Tax increment financing (TIF) bonds constituted 4.1% of the Fund’s total assets (4.2% of net assets) on July 31, 2015, and contributed positively to this Fund’s performance. Traditionally, this type of financing has been used for urban and suburban renewal projects. When tax collections increase, driven either by an improving economy or inflation, the credit quality of these types of securities generally improves, which can lead to enhanced performance.
The sales tax revenue sector represented 3.8% of the Fund’s total assets (3.8% of net assets) as of July 31, 2015. Debt-service payments on securities in this sector are paid using the issuing municipality’s sales tax revenue. Based on market values as of July 31, 2015, more than 90% of the Fund’s holdings in this sector were issued in Puerto Rico, which caused the sector to detract from the Fund’s total return.
The Fund’s holdings in the municipal leases sector – representing 2.9% of total assets (2.9% of net assets) at the end of this reporting period also detracted from the Fund’s performance. As state and local governments seek new ways to reduce costs and improve near-term cash flow, many lease all types of assets, including office space for public sector employees. The bonds held by this Fund are backed by the proceeds of these lease arrangements. Based on market value at the end of this reporting period, about 60% of the Fund’s holdings in the municipal leases sector were issued in Puerto Rico.
Several sectors in which the Fund maintained relatively smaller investments as of July 31, 2015, contributed positively to performance. Investors benefited this reporting period from the Fund’s holdings in the higher education, multifamily housing, highways/commuter facilities and diversified financial services sectors, among others.
Several of the Fund’s smaller sectors detracted from the Fund’s performance this reporting period: These included municipal leases with 2.9% of total assets (2.9% of net assets), correctional facilities with 0.7% of total assets (0.7% of net assets), and casinos with 0.5% of total assets (0.5% of net assets). Based on market value at the end of this reporting period, about 60% of the Fund’s holdings in the municipal leases sector were issued in Puerto Rico.
During this reporting period, the Fund maintained an investment in municipal inverse-floating rate securities, which are tax-exempt securities with interest payments that move inversely to changes in short-term interest rates. “Inverse floaters” continued to provide high levels of income to funds across the industry during this reporting period and contributed positively to this Fund’s performance. We continue to believe that “inverse floaters” are an essential element of this Fund’s portfolio because they can produce attractive yields under certain market conditions.
Our approach to municipal bond investing is flexible and responsive to market conditions. Shareholders should note that market
13 OPPENHEIMER ROCHESTER HIGH YIELD MUNICIPAL FUND
conditions during this reporting period did not affect the Fund’s overall investment goals or cause it to pay any capital gain distributions. In closing, we believe that the Fund’s structure and sector composition as well as our time-tested strategies will continue to benefit fixed-income investors through interest rate and economic cycles.
INVESTMENT STRATEGY
The Rochester investment team focuses exclusively on municipal bonds and has consistently used a time-tested, value-oriented and security-specific approach to fund management. We know that market conditions can and do fluctuate, but we do not waver in our belief in the power of tax-free yield to help investors achieve their long-term objectives.
This high yield fund has neither a maturity cap nor a limit on below-investment-grade securities, or “junk” bonds.
Our team continually searches for bonds that we believe are undervalued and can provide a meaningful level of tax-free income until maturity. Rather than making allocation shifts based on expected market conditions, we search the marketplace for what we believe to be the best values for generating income. It remains important to note that we do not manage our funds based on predictions of interest rate changes.
Instead, our investment approach involves scouring the market for municipal securities that meet our stringent credit criteria and buying bonds that we believe will deliver above-average yields relative to peer funds.
We focus on identifying inefficiencies in market pricing that can lead to investment advantages. We seek to maintain a thoughtful mix of industry sectors, maturities and credit ratings in this Fund’s portfolio.
The Rochester team also prospects for yield-enhancing opportunities in the secondary market, often picking up odd lots that we believe can add significant incremental yield to our portfolios. We will also look for non-rated issues with solid credit qualities, which we believe can often help enhance a fund’s tax-free yield. Investors should note that non-rated or unrated securities may or may not be the equivalent of investment grade securities.
The Rochester Way, we believe, distinguishes our approach to municipal investing from those of our competitors.

Daniel G. Loughran,
Senior Vice President, Senior Portfolio Manager and Team Leader, on behalf of the rest of the Rochester portfolio management team: Scott S. Cottier, Troy E. Willis, Mark R. DeMitry, Michael L. Camarella, Charles S. Pulire and Elizabeth S. Mossow.
14 OPPENHEIMER ROCHESTER HIGH YIELD MUNICIPAL FUND
Top Holdings and Allocations
TOP TEN CATEGORIES
| | | | |
| | |
Tobacco Master Settlement Agreement | | | 22.2% | |
| | |
Special Assessment | | | 10.2 | |
| | |
Adult Living Facilities | | | 7.9 | |
| | |
Hospital/Healthcare | | | 7.6 | |
| | |
General Obligation | | | 6.2 | |
| | |
Sewer Utilities | | | 5.7 | |
| | |
Airlines | | | 4.8 | |
| | |
Tax Increment Financing (TIF) | | | 4.1 | |
| | |
Sales Tax Revenue | | | 3.8 | |
| | |
Municipal Leases | | | 2.9 | |
| | |
Portfolio holdings and allocations are subject to change. Percentages are as of July 31, 2015, and are based on total assets.
CREDIT ALLOCATION
| | | | | | | | | | | | |
| | | NRSRO-
Rated | | | Sub-
Adviser-
Rated | | | Total | |
| | | |
AAA | | | 1.4 | % | | | 0.3 | % | | | 1.7 | % |
| | |
AA | | | 6.9 | | | | 0.7 | | | | 7.6 | |
| | |
A | | | 5.3 | | | | 0.5 | | | | 5.8 | |
| | |
BBB | | | 12.6 | | | | 9.5 | | | | 22.1 | |
| | |
BB or lower | | | 30.4 | | | | 32.4 | | | | 62.8 | |
| | |
Total | | | 56.6 | % | | | 43.4 | % | | | 100.0 | % |
| | |
The percentages above are based on the market value of the securities as of July 31, 2015, and are subject to change. OppenheimerFunds, Inc. determines the credit allocation of the Fund’s assets using ratings by nationally recognized statistical rating organizations (NRSROs), such as Standard & Poor’s. For any security rated by an NRSRO other than S&P, the sub-adviser, OppenheimerFunds, Inc., converts that security’s rating to the equivalent S&P rating. If two or more NRSROs have assigned a rating to a security, the highest rating is used. For securities not rated by an NRSRO, the sub-adviser uses its own credit analysis to assign ratings in categories similar to those of S&P. The use of similar categories is not an indication that the sub-adviser’s credit analysis process is consistent or comparable with any NRSRO’s process were that NRSRO to rate the same security.
For the purposes of this Credit Allocation table, securities rated within the NRSROs’ four highest categories—AAA, AA, A and BBB—are investment-grade securities. For further details, please consult the Fund’s prospectus or Statement of Additional Information.
15 OPPENHEIMER ROCHESTER HIGH YIELD MUNICIPAL FUND
Performance
DISTRIBUTION YIELDS
As of 7/31/15
| | | | | | | | |
| | | Without Sales
Charge | | | With Sales
Charge | |
Class A | | | 6.82% | | | | 6.50% | |
| | |
Class B | | | 5.92 | | | | N/A | |
| | |
Class C | | | 5.98 | | | | N/A | |
| | |
Class Y | | | 7.00 | | | | N/A | |
| | |
STANDARDIZED YIELDS
For the 30 Days Ended 7/31/15
| | | | |
Class A | | | 6.52% | |
| | |
Class B | | | 6.09 | |
| | |
Class C | | | 6.09 | |
| | |
Class Y | | | 7.00 | |
| | |
TAXABLE EQUIVALENT YIELDS
As of 7/31/15
| | | | |
Class A | | | 11.52% | |
| | |
Class B | | | 10.76 | |
| | |
Class C | | | 10.76 | |
| | |
Class Y | | | 12.37 | |
| | |
AVERAGE ANNUAL TOTAL RETURNS WITHOUT SALES CHARGE AS OF 7/31/15
| | | | | | | | | | | | | | | | | | | | |
| | | Inception
Date | | | 1-Year | | | 5-Year | | | 10-Year | | | Since
Inception | |
| | | | | |
Class A (ORNAX) | | | 10/1/93 | | | | 4.59% | | | | 6.48% | | | | 0.98% | | | | 4.25% | |
| | |
Class B (ORNBX) | | | 10/1/93 | | | | 3.79 | | | | 5.63 | | | | 0.49 | | | | 4.04 | |
| | |
Class C (ORNCX) | | | 8/29/95 | | | | 3.68 | | | | 5.66 | | | | 0.20 | | | | 3.52 | |
| | |
Class Y (ORNYX) | | | 11/29/10 | | | | 4.61 | | | | N/A | | | | N/A | | | | 7.38 | |
| | |
AVERAGE ANNUAL TOTAL RETURNS WITH SALES CHARGE AS OF 7/31/15
| | | | | | | | | | | | | | | | | | | | |
| | | Inception
Date | | | 1-Year | | | 5-Year | | | 10-Year | | | Since
Inception | |
| | | | | |
Class A (ORNAX) | | | 10/1/93 | | | | -0.37% | | | | 5.45% | | | | 0.49% | | | | 4.02% | |
| | |
Class B (ORNBX) | | | 10/1/93 | | | | -1.11 | | | | 5.32 | | | | 0.49 | | | | 4.04 | |
| | |
Class C (ORNCX) | | | 8/29/95 | | | | 2.70 | | | | 5.66 | | | | 0.20 | | | | 3.52 | |
| | |
Class Y (ORNYX) | | | 11/29/10 | | | | 4.61 | | | | N/A | | | | N/A | | | | 7.38 | |
| | |
16 OPPENHEIMER ROCHESTER HIGH YIELD MUNICIPAL FUND
COMPARISON OF CHANGE IN VALUE OF $10,000 HYPOTHETICAL INVESTMENTS IN:
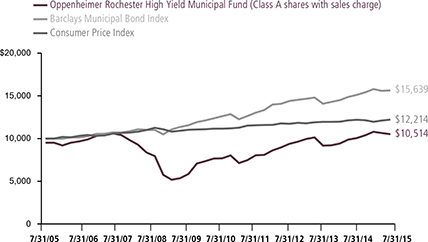
Performance data quoted represents past performance, which does not guarantee future results. The investment return and principal value of an investment in the Fund will fluctuate so that an investor’s shares, when redeemed, may be worth more or less than their original cost. Current performance may be lower or higher than the performance quoted. Returns do not consider capital gains or income taxes on an individual’s investments. For performance data current to the most recent month-end, visit oppenheimerfunds.com or call 1.800.CALL OPP (225.5677). Fund returns include changes in share price, reinvested distributions, and the applicable sales charge: for Class A shares, the current maximum initial sales charge of 4.75%; for Class B shares, the contingent deferred sales charge of 5% (1-year) and 2% (5-year); and for Class C, the contingent deferred sales charge of 1% for the 1-year period. There is no sales charge for Class Y shares. Because Class B shares convert to Class A shares 72 months after purchase, the 10-year return for Class B shares uses Class A performance for the period after conversion.
The Fund’s performance is compared to the performance of the Barclays Municipal Bond Index, an unmanaged index of a broad range of investment-grade municipal bonds that is a measure of the general municipal bond market. The Fund’s performance is also compared to the Consumer Price Index, a non-securities index that measures changes in the inflation rate. Indices are unmanaged and cannot be purchased by investors. While index comparisons may be useful to provide a benchmark for the Fund’s performance, it must be noted that the Fund’s investments are not limited to the investments comprising the indices. Index performance includes reinvestment of income, but does not reflect transaction costs, fees, expenses or taxes. Index performance is shown for illustrative purposes only as a benchmark for the Fund’s performance, and does not predict or depict performance of the Fund. The Fund’s performance reflects the effects of the Fund’s business and operating expenses.
Distribution yields for Class A shares are based on dividends of $0.039 for the 35-day accrual period ended July 28, 2015. The yield without sales charge for Class A shares is calculated by dividing annualized dividends by the Class A net asset value on July 28, 2015; for the yield with sales charge, the denominator is the Class A maximum offering price on that date. Distribution yields for Class B, C and Y are annualized based on dividends of $0.0340,
17 OPPENHEIMER ROCHESTER HIGH YIELD MUNICIPAL FUND
$0.0341 and $0.0400, respectively, for the 35-day accrual period ended July 28, 2015, and on the corresponding net asset values on that date.
Standardized yield is based on the Fund’s net investment income for the 30-day period ended July 31, 2015, and either that date’s maximum offering price (for Class A shares) or net asset value (for the other classes). Each result is compounded semiannually and annualized. Falling share prices artificially increase yields.
The average distribution yield in this Fund’s Lipper category was calculated based on the distributions and the final net asset values (NAVs) of the reporting period for the funds in each category. The average yield at NAV in Lipper’s High Yield Municipal Debt Funds category is based on 157 NAVs, one for each class of each fund in the category; a fund can have up to 4 classes. Lipper yields do not include sales charges – which, if included, would reduce results.
Taxable equivalent yield is based on the standardized yield and the top 2015 federal tax rate of 43.4%. Calculations factor in the 3.8% tax on unearned income under the Patient Protection and Affordable Care Act, as applicable. A portion of the Fund’s distributions may be subject to tax; distributions may also increase an investor’s exposure to the alternative minimum tax. Capital gains distributions are taxable as capital gains. Tax treatments of the Fund’s distributions and capital gains may vary by state; investors should consult a tax advisor to determine if the Fund is appropriate for them. Each result is compounded semiannually and annualized. Falling share prices artificially increase yields. This Report must be preceded or accompanied by a Fund prospectus.
The average yields for AAA-rated municipal securities are provided by Municipal Market Advisors (MMA) and are based on its benchmark of general obligation bonds structured with a 5% coupon. The MMA 5% benchmark is constructed using yields from the leading underwriters, who represent a significant percentage of the primary activity of the top 10 underwriters and therefore the total issuance.
Investments in “tobacco bonds,” which are backed by the proceeds a state or territory receives from the 1998 national litigation settlement with tobacco manufacturers, may be vulnerable to economic and/or legislative events that affect issuers in a particular municipal market sector. Annual payments by MSA-participating manufacturers, for example, hinge on many factors, including annual domestic cigarette shipments, inflation and the relative market share of non-participating manufacturers. To date, we believe consumption figures remain within an acceptable range of the assumptions used to structure MSA bonds. Future MSA payments could be reduced if consumption were to fall more rapidly than originally forecast.
The Fund’s investment strategy and focus can change over time. The mention of specific fund holdings does not constitute a recommendation by OppenheimerFunds, Inc. or its affiliates.
Before investing in any of the Oppenheimer funds, investors should carefully consider a fund’s investment objectives, risks, charges and expenses. Fund prospectuses and summary prospectuses contain this and other information about the funds, and may be obtained by asking your financial advisor, visiting oppenheimerfunds.com, or calling 1.800.CALL OPP (225.5677). Read prospectuses and summary prospectuses carefully before investing.
18 OPPENHEIMER ROCHESTER HIGH YIELD MUNICIPAL FUND
Shares of Oppenheimer funds are not deposits or obligations of any bank, are not guaranteed by any bank, are not insured by the FDIC or any other agency and involve investment risks, including the possible loss of the principal amount invested.
19 OPPENHEIMER ROCHESTER HIGH YIELD MUNICIPAL FUND
Fund Expenses
Fund Expenses. As a shareholder of the Fund, you incur two types of costs: (1) transaction costs, which may include sales charges (loads) on purchase payments and/or contingent deferred sales charges on redemptions; and (2) ongoing costs, including management fees; distribution and service fees; and other Fund expenses. These examples are intended to help you understand your ongoing costs (in dollars) of investing in the Fund and to compare these costs with the ongoing costs of investing in other mutual funds.
The examples are based on an investment of $1,000.00 invested at the beginning of the period and held for the entire 6-month period ended July 31, 2015.
Actual Expenses. The first section of the table provides information about actual account values and actual expenses. You may use the information in this section for the class of shares you hold, together with the amount you invested, to estimate the expense that you paid over the period. Simply divide your account value by $1,000.00 (for example, an $8,600.00 account value divided by $1,000.00 = 8.60), then multiply the result by the number in the first section under the heading entitled “Expenses Paid During 6 Months Ended July 31, 2015” to estimate the expenses you paid on your account during this period.
Hypothetical Example for Comparison Purposes. The second section of the table provides information about hypothetical account values and hypothetical expenses based on the Fund’s actual expense ratio for each class of shares, and an assumed rate of return of 5% per year for each class before expenses, which is not the Fund’s actual return. The hypothetical account values and expenses may not be used to estimate the actual ending account balance or expenses you paid for the period. You may use this information to compare the ongoing costs of investing in the Fund and other funds. To do so, compare this 5% hypothetical example for the class of shares you hold with the 5% hypothetical examples that appear in the shareholder reports of the other funds.
Please note that the expenses shown in the table are meant to highlight your ongoing costs only and do not reflect any transactional costs, such as front-end or contingent deferred sales charges (loads). Therefore, the “hypothetical” section of the table is useful in comparing ongoing costs only, and will not help you determine the relative total costs of owning different funds. In addition, if these transactional costs were included, your costs would have been higher.
20 OPPENHEIMER ROCHESTER HIGH YIELD MUNICIPAL FUND
| | | | | | | | | | | | |
| Actual | | Beginning
Account Value
February 1, 2015 | | | Ending
Account
Value
July 31, 2015 | | | Expenses
Paid During
6 Months Ended
July 31, 2015 | |
| | |
Class A | | $ | 1,000.00 | | | $ | 974.00 | | | $ | 4.76 | |
| | |
Class B | | | 1,000.00 | | | | 970.40 | | | | 8.44 | |
| | |
Class C | | | 1,000.00 | | | | 968.90 | | | | 8.43 | |
| | |
Class Y | | | 1,000.00 | | | | 973.30 | | | | 4.02 | |
| | | |
Hypothetical (5% return before expenses) | | | | | | | | | | | | |
| | |
Class A | | | 1,000.00 | | | | 1,019.98 | | | | 4.87 | |
| | |
Class B | | | 1,000.00 | | | | 1,016.27 | | | | 8.64 | |
| | |
Class C | | | 1,000.00 | | | | 1,016.27 | | | | 8.64 | |
| | |
Class Y | | | 1,000.00 | | | | 1,020.73 | | | | 4.12 | |
Expenses are equal to the Fund’s annualized expense ratio for that class, multiplied by the average account value over the period, multiplied by 181/365 (to reflect the one-half year period). Those annualized expense ratios, excluding indirect expenses from affiliated funds, based on the 6-month period ended July 31, 2015 are as follows:
| | | | |
| Class | | Expense Ratios | |
| | |
Class A | | | 0.97% | |
| | |
Class B | | | 1.72 | |
| | |
Class C | | | 1.72 | |
| | |
Class Y | | | 0.82 | |
21 OPPENHEIMER ROCHESTER HIGH YIELD MUNICIPAL FUND
STATEMENT OF INVESTMENTS July 31, 2015
| | | | | | | | | | | | | | | | |
Principal
Amount | | | | | Coupon | | | Maturity | | | Value | |
| Municipal Bonds and Notes—112.5% | | | | | | | | | | | | |
| Alabama—4.3% | | | | | | | | | | | | |
| | $50,050,000 | | | Jefferson County, AL Sewer | | | 0.000 | %1 | | | 10/01/2050 | | | | $ 33,047,515 | |
| | 30,000,000 | | | Jefferson County, AL Sewer | | | 7.000 | | | | 10/01/2051 | | | | 36,141,900 | |
| | 30,000,000 | | | Jefferson County, AL Sewer | | | 0.000 | 1 | | | 10/01/2046 | | | | 20,129,100 | |
| | 21,895,000 | | | Jefferson County, AL Sewer | | | 0.000 | 1 | | | 10/01/2039 | | | | 14,781,533 | |
| | 20,045,000 | | | Jefferson County, AL Sewer | | | 0.000 | 1 | | | 10/01/2046 | | | | 13,729,823 | |
| | 11,500,000 | | | Jefferson County, AL Sewer | | | 5.500 | | | | 10/01/2053 | | | | 12,755,225 | |
| | 59,250,000 | | | Jefferson County, AL Sewer | | | 6.500 | | | | 10/01/2053 | | | | 68,480,557 | |
| | 17,500,000 | | | Jefferson County, AL Sewer | | | 0.000 | 1 | | | 10/01/2050 | | | | 11,870,775 | |
| | | | | | | | | | | | | | | 210,936,428 | |
| | | | |
| | | | | | | | | | | | | | | | | |
| Alaska—0.3% | | | | | | | | | | | | |
| | 2,250,000 | | | AK Industrial Devel. & Export Authority (Anchorage Sportsplex/Grace Community Church Obligated Group)2 | | | 6.120 | | | | 08/01/2031 | | | | 538,897 | |
| | 1,650,000 | | | AK Industrial Devel. & Export Authority Community Provider (Boys & Girls Home)3 | | | 5.875 | | | | 12/01/2027 | | | | 544,170 | |
| | 500,000 | | | AK Industrial Devel. & Export Authority Community Provider (Boys & Girls Home)3 | | | 6.000 | | | | 12/01/2036 | | | | 164,900 | |
| | 31,850,000 | | | AK Northern Tobacco Securitization Corp. (TASC) | | | 6.125 | 4 | | | 06/01/2046 | | | | 942,442 | |
| | 20,860,000 | | | AK Northern Tobacco Securitization Corp. (TASC) | | | 6.375 | 4 | | | 06/01/2046 | | | | 587,418 | |
| | 10,350,000 | | | Koyukuk, AK (Tanana Chiefs Conference Health Care Facility) | | | 7.750 | | | | 10/01/2041 | | | | 11,918,232 | |
| | | | | | | | | | | | | | | 14,696,059 | |
| | | | |
| | | | | | | | | | | | | | | | | |
| Arizona—1.7% | | | | | | | | | | | | |
| | 4,310,000 | | | Buckeye, AZ Watson Road Community Facilities District | | | 6.000 | | | | 07/01/2030 | | | | 4,357,195 | |
| | 7,948,000 | | | East San Luis, AZ Community Facilities District Special Assessment (Area One)3 | | | 6.375 | | | | 01/01/2028 | | | | 5,390,572 | |
| | 4,275,000 | | | East San Luis, AZ Community Facilities District Special Assessment (Area Two)3 | | | 8.500 | | | | 01/01/2028 | | | | 778,477 | |
| | 335,000 | | | Estrella Mountain Ranch, AZ Community Facilities District | | | 6.125 | | | | 07/15/2027 | | | | 349,171 | |
| | 500,000 | | | Estrella Mountain Ranch, AZ Community Facilities District | | | 6.200 | | | | 07/15/2032 | | | | 520,275 | |
| | 305,000 | | | Estrella Mountain Ranch, AZ Community Facilities District | | | 5.450 | | | | 07/15/2021 | | | | 305,567 | |
| | 810,000 | | | Estrella Mountain Ranch, AZ Community Facilities District | | | 5.625 | | | | 07/15/2025 | | | | 811,029 | |
| | 900,000 | | | Estrella Mountain Ranch, AZ Community Facilities District | | | 5.800 | | | | 07/15/2030 | | | | 901,035 | |
| | 1,015,000 | | | Estrella Mountain Ranch, AZ Community Facilities District | | | 5.900 | | | | 07/15/2022 | | | | 1,068,288 | |
| | 1,215,000 | | | Estrella Mountain Ranch, AZ Community Facilities District (Golf Village) | | | 6.375 | | | | 07/01/2022 | | | | 1,240,551 | |
| | 3,984,000 | | | Estrella Mountain Ranch, AZ Community Facilities District (Golf Village) | | | 6.750 | | | | 07/01/2032 | | | | 4,021,330 | |
| | 394,000 | | | Estrella Mountain Ranch, AZ Community Facilities District (Golf Village) | | | 6.000 | | | | 07/01/2017 | | | | 408,026 | |
| | 1,000,000 | | | Glendale, AZ IDA (Midwestern University Foundation) | | | 5.000 | | | | 07/01/2033 | | | | 1,033,140 | |
22 OPPENHEIMER ROCHESTER HIGH YIELD MUNICIPAL FUND
| | | | | | | | | | | | | | | | |
Principal
Amount | | | | | Coupon | | | Maturity | | | Value | |
| Arizona (Continued) | | | | | | | | | | | | |
| | $1,000,000 | | | Goodyear, AZ IDA Water & Sewer (Litchfield Park Service Company) | | | 6.750 | % | | | 10/01/2031 | | | $ | 1,000,840 | |
| | 1,870,000 | | | Maricopa County, AZ IDA (Immanuel Campus Care)3 | | | 8.500 | | | | 04/20/2041 | | | | 747,346 | |
| | 294,000 | | | Merrill Ranch, AZ Community Facilities District No. 1 Special Assessment Lien | | | 5.250 | | | | 07/01/2024 | | | | 294,858 | |
| | 641,000 | | | Merrill Ranch, AZ Community Facilities District No. 2 Special Assessment Lien | | | 5.300 | | | | 07/01/2030 | | | | 645,218 | |
| | 262,000 | | | Merrill Ranch, AZ Community Facilities District No. 2 Special Assessment Lien | | | 5.250 | | | | 07/01/2024 | | | | 264,638 | |
| | 1,125,000 | | | Palm Valley, AZ Community Facility District No. 3 | | | 5.300 | | | | 07/15/2031 | | | | 1,128,949 | |
| | 350,000 | | | Parkway, AZ Community Facilities District No. 1 (Prescott Valley) | | | 5.350 | | | | 07/15/2031 | | | | 350,742 | |
| | 420,000 | | | Parkway, AZ Community Facilities District No. 1 (Prescott Valley) | | | 5.300 | | | | 07/15/2025 | | | | 422,150 | |
| | 1,650,000 | | | Phoenix, AZ IDA (Espiritu Community Devel. Corp.) | | | 6.250 | | | | 07/01/2036 | | | | 1,663,481 | |
| | 1,935,000 | | | Phoenix, AZ IDA (Gourmet Boutique West) | | | 5.875 | | | | 11/01/2037 | | | | 1,033,832 | |
| | 1,160,000 | | | Pima County, AZ IDA (Christian Senior Living) | | | 5.050 | | | | 01/01/2037 | | | | 1,169,141 | |
| | 1,250,000 | | | Pima County, AZ IDA (Facility Choice Education & Devel. Corp.) | | | 6.250 | | | | 06/01/2026 | | | | 1,275,013 | |
| | 3,700,000 | | | Pima County, AZ IDA (Facility Choice Education & Devel. Corp.) | | | 6.375 | | | | 06/01/2036 | | | | 3,764,602 | |
| | 3,000,000 | | | Pima County, AZ IDA (New Plan Learning/OG Ohio/250 Shoup Mill Obligated Group) | | | 8.125 | | | | 07/01/2041 | | | | 2,950,680 | |
| | 5,730,000 | | | Pima County, AZ IDA (P.L.C. Charter Schools) | | | 7.500 | | | | 04/01/2041 | | | | 6,453,584 | |
| | 1,500,000 | | | Pima County, AZ IDA (P.L.C. Charter Schools) | | | 6.750 | | | | 04/01/2036 | | | | 1,513,335 | |
| | 250,000 | | | Pima County, AZ IDA (Paradise Education Center) | | | 5.875 | | | | 06/01/2022 | | | | 253,788 | |
| | 550,000 | | | Pima County, AZ IDA (Paradise Education Center) | | | 6.000 | | | | 06/01/2036 | | | | 555,126 | |
| | 1,600,000 | | | Pima County, AZ IDA (Sonoran Science Academy) | | | 5.670 | | | | 12/01/2027 | | | | 1,610,976 | |
| | 1,960,000 | | | Pima County, AZ IDA (Sonoran Science Academy) | | | 5.750 | | | | 12/01/2037 | | | | 1,966,664 | |
| | 8,890,000 | | | Pima County, AZ IDA Water & Wastewater (Global Water Resources) | | | 6.550 | | | | 12/01/2037 | | | | 9,047,175 | |
| | 2,215,000 | | | Pima County, AZ IDA Water & Wastewater (Global Water Resources) | | | 5.600 | | | | 12/01/2022 | | | | 2,253,563 | |
| | 11,100,000 | | | Pima County, AZ IDA Water & Wastewater (Global Water Resources) | | | 5.750 | | | | 12/01/2032 | | | | 11,268,831 | |
| | 890,000 | | | Pinal County, AZ IDA (San Manuel Facility) | | | 6.250 | | | | 06/01/2026 | | | | 908,583 | |
| | 1,089,000 | | | Prescott Valley, AZ Southside Community Facilities District No. 1 | | | 7.250 | | | | 07/01/2032 | | | | 793,620 | |
| | 1,500,000 | | | Quail Creek, AZ Community Facilities District | | | 5.550 | | | | 07/15/2030 | | | | 1,505,385 | |
| | 265,000 | | | Show Low Bluff, AZ Community Facilities District | | | 5.600 | | | | 07/01/2031 | | | | 252,651 | |
| | 50,000 | | | Show Low Bluff, AZ Community Facilities District Special Assessment | | | 5.200 | | | | 07/01/2017 | | | | 51,142 | |
| | 1,000,000 | | | Tartesso West, AZ Community Facilities District | | | 5.900 | | | | 07/15/2032 | | | | 1,030,610 | |
| | 695,000 | | | Tempe, AZ IDA (Tempe Life Care Village) | | | 6.000 | | | | 12/01/2032 | | | | 751,448 | |
| | 1,550,000 | | | Tempe, AZ IDA (Tempe Life Care Village) | | | 6.250 | | | | 12/01/2042 | | | | 1,680,169 | |
23 OPPENHEIMER ROCHESTER HIGH YIELD MUNICIPAL FUND
STATEMENT OF INVESTMENTS Continued
| | | | | | | | | | | | | | | | |
Principal
Amount | | | | | Coupon | | | Maturity | | | Value | |
| Arizona (Continued) | | | | | | | | | | | | |
| | $85,000 | | | Tucson, AZ IDA (Joint Single Family Mtg.) | | | 5.000 | % | | | 01/01/2039 | | | $ | 85,656 | |
| | 1,800,000 | | | Verrado, AZ Community Facilities District No. 1 | | | 6.000 | | | | 07/15/2027 | | | | 2,005,074 | |
| | 610,000 | | | Verrado, AZ Community Facilities District No. 1 | | | 6.000 | | | | 07/15/2033 | | | | 669,072 | |
| | 675,000 | | | Verrado, AZ Community Facilities District No. 1 | | | 5.700 | | | | 07/15/2029 | | | | 733,637 | |
| | | | | | | | | | | | | | | | |
| | | | | | | | | | | | | | | 83,286,235 | |
| | | | |
| | | | | | | | | | | | | | | | | |
| Arkansas—0.1% | | | | | | | | | | | | |
| | 5,645,000 | | | Cave Springs, AR Municipal Property (Creeks Special Sewer District)3 | | | 6.250 | | | | 02/01/2038 | | | | 3,372,887 | |
| | | | |
| | | | | | | | | | | | | | | | | |
| California—14.3% | | | | | | | | | | | | |
| | 2,500,000 | | | Adelanto, CA Public Utility Authority | | | 6.750 | | | | 07/01/2039 | | | | 2,843,250 | |
| | 750,000 | | | Alhambra, CA (Atherton Baptist Homes) | | | 7.625 | | | | 01/01/2040 | | | | 801,255 | |
| | 3,905,000 | | | Anaheim, CA Community Facilities District Special Tax (Platinum Triangle) | | | 6.250 | | | | 09/01/2040 | | | | 4,028,593 | |
| | 1,055,000 | | | Anaheim, CA Community Facilities District Special Tax (Platinum Triangle) | | | 6.000 | | | | 09/01/2030 | | | | 1,088,454 | |
| | 370,000 | | | Anaheim, CA Community Facilities District Special Tax (Platinum Triangle) | | | 6.000 | | | | 09/01/2028 | | | | 381,770 | |
| | 11,600,000 | | | Anaheim, CA Public Financing Authority | | | 5.000 | | | | 05/01/2046 | | | | 12,953,604 | |
| | 100,000 | | | Blythe, CA Redevel. Agency (Redevel. Project No. 1 Tax Allocation) | | | 5.750 | | | | 05/01/2034 | | | | 100,092 | |
| | 210,000 | | | Blythe, CA Redevel. Agency (Redevel. Project No. 1 Tax Allocation) | | | 6.200 | | | | 05/01/2031 | | | | 210,300 | |
| | 5,500,000 | | | Brea, CA Community Facilities District (Brea Plaza Area) | | | 7.375 | | | | 09/01/2039 | | | | 5,969,040 | |
| | 33,920,000 | | | CA County Tobacco Securitization Agency | | | 6.650 | 4 | | | 06/01/2046 | | | | 930,426 | |
| | 127,310,000 | | | CA County Tobacco Securitization Agency | | | 6.489 | 4 | | | 06/01/2046 | | | | 9,053,014 | |
| | 107,400,000 | | | CA County Tobacco Securitization Agency | | | 6.619 | 4 | | | 06/01/2050 | | | | 1,902,054 | |
| | 246,760,000 | | | CA County Tobacco Securitization Agency | | | 7.477 | 4 | | | 06/01/2055 | | | | 1,589,134 | |
| | 8,415,000 | | | CA County Tobacco Securitization Agency | | | 8.150 | 4 | | | 06/01/2033 | | | | 2,306,888 | |
| | 215,100,000 | | | CA County Tobacco Securitization Agency | | | 7.000 | 4 | | | 06/01/2055 | | | | 2,118,735 | |
| | 19,000,000 | | | CA County Tobacco Securitization Agency (TASC) | | | 5.250 | | | | 06/01/2046 | | | | 14,023,710 | |
| | 36,000,000 | | | CA County Tobacco Securitization Agency (TASC) | | | 5.650 | 1 | | | 06/01/2041 | | | | 32,128,920 | |
| | 57,000,000 | | | CA County Tobacco Securitization Agency (TASC) | | | 6.400 | 4 | | | 06/01/2046 | | | | 2,572,410 | |
| | 58,530,000 | | | CA County Tobacco Securitization Agency (TASC) | | | 5.700 | 1 | | | 06/01/2046 | | | | 51,920,792 | |
| | 15,015,000 | | | CA County Tobacco Securitization Agency (TASC) | | | 5.600 | 1 | | | 06/01/2036 | | | | 13,792,028 | |
| | 5,000,000 | | | CA County Tobacco Securitization Agency (TASC) | | | 6.125 | | | | 06/01/2038 | | | | 4,999,600 | |
| | 7,285,000 | | | CA County Tobacco Securitization Agency (TASC) | | | 5.875 | | | | 06/01/2043 | | | | 7,284,490 | |
| | 1,080,000 | | | CA County Tobacco Securitization Agency (TASC) | | | 5.500 | | | | 06/01/2033 | | | | 1,072,883 | |
| | 2,630,000 | | | CA County Tobacco Securitization Agency (TASC) | | | 5.875 | | | | 06/01/2035 | | | | 2,629,816 | |
| | 520,920,000 | | | CA County Tobacco Securitization Agency (TASC) | | | 6.669 | 4 | | | 06/01/2050 | | | | 29,848,716 | |
24 OPPENHEIMER ROCHESTER HIGH YIELD MUNICIPAL FUND
| | | | | | | | | | | | | | | | |
Principal
Amount | | | | | Coupon | | | Maturity | | | Value | |
| California (Continued) | | | | | | | | | | | | |
| | $255,000 | | | CA County Tobacco Securitization Agency (TASC) | | | 5.250 | % | | | 06/01/2045 | | | $ | 205,992 | |
| | 4,625,000 | | | CA County Tobacco Securitization Agency (TASC) | | | 6.000 | | | | 06/01/2042 | | | | 4,624,630 | |
| | 9,125,000 | | | CA Enterprise Devel. Authority (Sunpower Corp.) | | | 8.500 | | | | 04/01/2031 | | | | 10,459,896 | |
| | 1,180,000 | | | CA GO5 | | | 5.050 | | | | 12/01/2036 | | | | 1,183,008 | |
| | 133,715,000 | | | CA Golden State Tobacco Securitization Corp. (TASC)5 | | | 5.750 | | | | 06/01/2047 | | | | 114,439,480 | |
| | 49,315,000 | | | CA Golden State Tobacco Securitization Corp. (TASC) | | | 5.750 | | | | 06/01/2047 | | | | 42,206,243 | |
| | 7,000,000 | | | CA Golden State Tobacco Securitization Corp. (TASC) | | | 5.300 | 1 | | | 06/01/2037 | | | | 5,735,030 | |
| | 340,000,000 | | | CA Golden State Tobacco Securitization Corp. (TASC) | | | 6.000 | 4 | | | 06/01/2047 | | | | 9,431,600 | |
| | 22,400,000 | | | CA Golden State Tobacco Securitization Corp. (TASC) | | | 5.000 | | | | 06/01/2033 | | | | 18,785,088 | |
| | 30,420,000 | | | CA Health Facilities Financing Authority (SJHS/SJHCN/SJHE/SJHO Obligated Group)5 | | | 5.750 | | | | 07/01/2039 | | | | 34,795,004 | |
| | 11,095,000 | | | CA Health Facilities Financing Authority (Sutter Health/California Pacific Medical Center Obligated Group)5 | | | 5.000 | | | | 11/15/2042 | | | | 11,517,577 | |
| | 1,835,000 | | | CA Independent Cities Finance Authority Mobile Home Park (Lamplighter Salinas) | | | 6.250 | | | | 07/15/2050 | | | | 2,024,959 | |
| | 10,000,000 | | | CA Infrastructure and Economic Devel. (SanfordConsortium)5 | | | 5.000 | | | | 05/15/2040 | | | | 10,834,400 | |
| | 750,000 | | | CA Municipal Finance Authority (Harbor Regional Center) | | | 8.500 | | | | 11/01/2039 | | | | 972,473 | |
| | 380,000 | | | CA Public Works | | | 6.625 | | | | 11/01/2034 | | | | 382,136 | |
| | 43,890,000 | | | CA Silicon Valley Tobacco Securitization Authority | | | 8.435 | 4 | | | 06/01/2056 | | | | 391,060 | |
| | 25,800,000 | | | CA Silicon Valley Tobacco Securitization Authority | | | 8.590 | 4 | | | 06/01/2041 | | | | 3,618,708 | |
| | 70,785,000 | | | CA Silicon Valley Tobacco Securitization Authority | | | 8.994 | 4 | | | 06/01/2036 | | | | 16,037,757 | |
| | 13,505,000 | | | CA Silicon Valley Tobacco Securitization Authority | | | 9.002 | 4 | | | 06/01/2047 | | | | 838,255 | |
| | 160,600,000 | | | CA Silicon Valley Tobacco Securitization Authority | | | 8.147 | 4 | | | 06/01/2056 | | | | 1,260,710 | |
| | 1,730,000 | | | CA Statewide CDA (Albert Einstein Academy) | | | 6.250 | | | | 11/01/2042 | | | | 1,792,937 | |
| | 1,145,000 | | | CA Statewide CDA (Albert Einstein Academy) | | | 6.000 | | | | 11/01/2032 | | | | 1,179,430 | |
| | 10,000 | | | CA Statewide CDA (Escrow Term) | | | 6.750 | | | | 09/01/2037 | | | | 10,017 | |
| | 2,019,578 | | | CA Statewide CDA (Microgy Holdings)3 | | | 9.000 | | | | 12/01/2038 | | | | 20 | |
| | 8,015,000 | | | CA Statewide CDA (Yucaipa Valley Water Reservoir) | | | 6.000 | | | | 09/02/2044 | | | | 7,900,626 | |
| | 555,300,000 | | | CA Statewide Financing Authority Tobacco Settlement | | | 7.001 | 4 | | | 06/01/2055 | | | | 4,631,202 | |
| | 4,515,000 | | | CA Statewide Financing Authority Tobacco Settlement (TASC) | | | 6.000 | | | | 05/01/2037 | | | | 4,514,639 | |
| | 965,000 | | | CA Statewide Financing Authority Tobacco Settlement (TASC) | | | 6.000 | | | | 05/01/2043 | | | | 964,923 | |
25 OPPENHEIMER ROCHESTER HIGH YIELD MUNICIPAL FUND
STATEMENT OF INVESTMENTS Continued
| | | | | | | | | | | | | | | | |
Principal
Amount | | | | | Coupon | | | Maturity | | | Value | |
| California (Continued) | | | | | | | | | | | | |
| | $100,000 | | | CA Statewide Financing Authority Tobacco Settlement (TASC) | | | 6.000 | % | | | 05/01/2043 | | | $ | 99,991 | |
| | 2,500,000 | | | Calexico, CA Community Redevel. Agency Tax Allocation (Central Business District & Residential Redevel.) | | | 7.250 | | | | 08/01/2033 | | | | 3,105,725 | |
| | 10,465,000 | | | Cerritos, CA Community College District5 | | | 5.250 | | | | 08/01/2033 | | | | 12,205,230 | |
| | 165,000 | | | Chino, CA Community Facilities District Special Tax | | | 5.000 | | | | 09/01/2026 | | | | 167,322 | |
| | 1,440,000 | | | Coyote Canyon, CA Public Facilities Community Facilities District No. 2004-1 | | | 6.625 | | | | 09/01/2039 | | | | 1,616,976 | |
| | 820,000 | | | Elsinore Valley, CA Municipal Water District Community Facilities District No. 2004-1 | | | 6.625 | | | | 09/01/2040 | | | | 846,092 | |
| | 80,000,000 | | | Inland, CA Empire Tobacco Securitization Authority (TASC) | | | 6.750 | 4 | | | 06/01/2047 | | | | 2,836,000 | |
| | 1,000,000,000 | | | Inland, CA Empire Tobacco Securitization Authority (TASC) | | | 8.001 | 4 | | | 06/01/2057 | | | | 8,270,000 | |
| | 377,795,000 | | | Inland, CA Empire Tobacco Securitization Authority (TASC) | | | 7.626 | 4 | | | 06/01/2057 | | | | 3,184,812 | |
| | 310,000 | | | Jurupa, CA Public Financing Authority | | | 6.000 | | | | 09/01/2030 | | | | 320,819 | |
| | 350,000 | | | Jurupa, CA Public Financing Authority | | | 6.000 | | | | 09/01/2031 | | | | 362,215 | |
| | 400,000 | | | Jurupa, CA Public Financing Authority | | | 6.000 | | | | 09/01/2028 | | | | 413,960 | |
| | 500,000 | | | Jurupa, CA Public Financing Authority | | | 6.000 | | | | 09/01/2032 | | | | 517,450 | |
| | 350,000 | | | Jurupa, CA Public Financing Authority | | | 6.000 | | | | 09/01/2029 | | | | 362,215 | |
| | 1,280,000 | | | Lathrop, CA Special Tax Community Facilities District No. 03-2 | | | 7.000 | | | | 09/01/2033 | | | | 1,282,074 | |
| | 3,250,000 | | | Los Alamitos, CA Unified School District COP | | | 0.000 | 1 | | | 08/01/2042 | | | | 2,371,948 | |
| | 1,625,000 | | | Los Angeles, CA Community Facilities District Special Tax (Legends at Cascades) | | | 5.750 | | | | 09/01/2040 | | | | 1,675,700 | |
| | 31,940,000 | | �� | Los Angeles, CA Dept. of Airports (Los Angeles International Airport)5 | | | 5.375 | | | | 05/15/2030 | | | | 35,054,150 | |
| | 5,000,000 | | | Los Angeles, CA Dept. of Water & Power5 | | | 5.000 | | | | 07/01/2034 | | | | 5,554,150 | |
| | 9,930,000 | | | Los Angeles, CA Regional Airports Improvement Corp. (Delta-Continental Airlines)6 | | | 9.250 | | | | 08/01/2024 | | | | 9,985,707 | |
| | 200,000 | | | Maywood, CA Public Financing Authority | | | 7.000 | | | | 09/01/2038 | | | | 200,208 | |
| | 115,975,000 | | | Northern CA Tobacco Securitization Authority (TASC) | | | 6.375 | 4 | | | 06/01/2045 | | | | 2,907,493 | |
| | 25,000,000 | | | Northern CA Tobacco Securitization Authority (TASC) | | | 5.375 | | | | 06/01/2038 | | | | 20,628,750 | |
| | 45,000 | | | Placer County, CA Improvement Bond Act 1915 | | | 6.500 | | | | 09/02/2030 | | | | 45,041 | |
| | 21,711,000 | | | River Rock, CA Entertainment Authority2 | | | 8.000 | | | | 11/01/2018 | | | | 2,171,100 | |
| | 1,750,000 | | | Riverside County, CA Redevel. Agency | | | 7.125 | | | | 10/01/2042 | | | | 2,185,680 | |
| | 100,000 | | | Sacramento County, CA Special Tax Community Facilities District No. 2004-1 (McClellan Park) | | | 6.000 | | | | 09/01/2031 | | | | 99,484 | |
| | 325,000 | | | San Bernardino, CA Special Tax Community Facilities District No. 2006-1 (Lytle Creek) | | | 5.625 | | | | 09/01/2034 | | | | 335,140 | |
| | 2,000,000 | | | San Buenaventura, CA Community Memorial Health Systems | | | 8.000 | | | | 12/01/2031 | | | | 2,510,380 | |
| | 1,000,000 | | | San Francisco, CA City & County Redevel. Financing Authority (Mission Bay North Redevel.) | | | 7.000 | | | | 08/01/2041 | | | | 1,201,650 | |
| | 750,000 | | | San Francisco, CA City & County Redevel. Financing Authority (Mission Bay North Redevel.) | | | 6.750 | | | | 08/01/2041 | | | | 905,738 | |
26 OPPENHEIMER ROCHESTER HIGH YIELD MUNICIPAL FUND
| | | | | | | | | | | | | | | | |
Principal
Amount | | | | | Coupon | | | Maturity | | | Value | |
| California (Continued) | | | | | | | | | | | | |
| | $6,000,000 | | | Santa Clara, CA Redevel. Agency Tax Allocation (Bayshore North) | | | 5.750 | % | | | 06/01/2026 | | | $ | 6,973,140 | |
| | 78,990,000 | | | Silicon Valley CA Tobacco Securitization Authority | | | 8.865 | 4 | | | 06/01/2047 | | | | 4,902,909 | |
| | 143,080,000 | | | Southern CA Tobacco Securitization Authority | | | 7.100 | 4 | | | 06/01/2046 | | | | 2,668,442 | |
| | 41,325,000 | | | Southern CA Tobacco Securitization Authority | | | 6.400 | 4 | | | 06/01/2046 | | | | 828,566 | |
| | 10,000,000 | | | Southern CA Tobacco Securitization Authority | | | 5.125 | | | | 06/01/2046 | | | | 8,200,700 | |
| | 195,570,000 | | | Southern CA Tobacco Securitization Authority | | | 6.383 | 4 | | | 06/01/2046 | | | | 4,525,490 | |
| | 1,000,000 | | | Southern CA Tobacco Securitization Authority (TASC) | | | 5.000 | | | | 06/01/2037 | | | | 841,100 | |
| | 12,115,000 | | | Stockton, CA Unified School District | | | 5.920 | 4 | | | 08/01/2038 | | | | 4,599,581 | |
| | 14,735,000 | | | Stockton, CA Unified School District | | | 5.950 | 4 | | | 08/01/2041 | | | | 4,868,886 | |
| | 17,145,000 | | | Stockton, CA Unified School District | | | 5.950 | 4 | | | 08/01/2043 | | | | 5,204,193 | |
| | 6,245,000 | | | Stockton, CA Unified School District | | | 6.000 | 4 | | | 08/01/2037 | | | | 2,475,643 | |
| | 1,335,000 | | | Susanville, CA Public Financing Authority (Utility Enterprises) | | | 5.875 | | | | 06/01/2035 | | | | 1,484,520 | |
| | 1,425,000 | | | Susanville, CA Public Financing Authority (Utility Enterprises) | | | 6.000 | | | | 06/01/2045 | | | | 1,591,540 | |
| | 4,615,000 | | | Tustin, CA Community Facilities District Special Tax (Legacy/Columbus) | | | 6.000 | | | | 09/01/2036 | | | | 4,827,659 | |
| | 200,000 | | | Upland, CA Community Facilities District (San Antonio) | | | 6.100 | | | | 09/01/2034 | | | | 202,996 | |
| | 3,500,000 | | | West Hollywood, CA Community Devel. Commission Tax Allocation (East Side Redevel.) | | | 7.500 | | | | 09/01/2042 | | | | 4,435,025 | |
| | 7,000,000 | | | West Sacramento, CA Special Tax Community Facilities District No. 27 | | | 7.000 | | | | 09/01/2040 | | | | 7,360,220 | |
| | | | | | | | | | | | | | | | |
| | | | | | | | | | | | | | | 706,701,584 | |
| | | | |
| | | | | | | | | | | | | | | | | |
| Colorado—3.2% | | | | | | | | | | | | |
| | 960,000 | | | CO Andonea Metropolitan District No. 22 | | | 6.125 | | | | 12/01/2025 | | | | 548,467 | |
| | 2,380,000 | | | CO Andonea Metropolitan District No. 32 | | | 6.250 | | | | 12/01/2035 | | | | 1,337,013 | |
| | 1,000,000 | | | CO Confluence Metropolitan District | | | 5.400 | | | | 12/01/2027 | | | | 797,130 | |
| | 1,025,000 | | | CO Country Club Highlands Metropolitan District2 | | | 7.250 | | | | 12/01/2037 | | | | 415,699 | |
| | 1,500,000 | | | CO Crystal Crossing Metropolitan District2 | | | 6.000 | | | | 12/01/2036 | | | | 975,060 | |
| | 1,213,000 | | | CO Elbert and Highway 86 Metropolitan District | | | 5.750 | | | | 12/01/2036 | | | | 861,351 | |
| | 4,475,000 | | | CO Elbert and Highway 86 Metropolitan District2 | | | 7.500 | | | | 12/01/2032 | | | | 2,237,768 | |
| | 2,251,000 | | | CO Elkhorn Ranch Metropolitan District2 | | | 6.375 | | | | 12/01/2035 | | | | 1,471,119 | |
| | 1,790,000 | | | CO Fossil Ridge Metropolitan District No. 1 | | | 7.250 | | | | 12/01/2040 | | | | 1,974,048 | |
| | 14,350,000 | | | CO Health Facilities Authority (Sisters of Charity of Leavenworth Health System)5 | | | 5.000 | | | | 01/01/2044 | | | | 15,786,292 | |
| | 1,030,000 | | | CO Health Facilities Authority Health & Residential Care Facilities (Volunteers of America) | | | 5.300 | | | | 07/01/2037 | | | | 998,163 | |
| | 473,000 | | | CO Horse Creek Metropolitan District | | | 5.750 | | | | 12/01/2036 | | | | 399,661 | |
| | 1,697,000 | | | CO Huntington Trails Metropolitan District | | | 8.250 | 1 | | | 12/01/2037 | | | | 1,729,531 | |
| | 500,000 | | | CO Huntington Trails Metropolitan District | | | 6.250 | | | | 12/01/2036 | | | | 501,275 | |
| | 2,500,000 | | | CO International Center Metropolitan District No. 3 | | | 6.500 | | | | 12/01/2035 | | | | 2,170,900 | |
| | 1,069,000 | | | CO Liberty Ranch Metropolitan District | | | 6.250 | | | | 12/01/2036 | | | | 910,681 | |
| | 1,875,000 | | | CO Madre Metropolitan District No. 2 | | | 5.500 | | | | 12/01/2036 | | | | 1,452,581 | |
27 OPPENHEIMER ROCHESTER HIGH YIELD MUNICIPAL FUND
STATEMENT OF INVESTMENTS Continued
| | | | | | | | | | | | | | | | |
Principal
Amount | | | | | Coupon | | | Maturity | | | Value | |
| Colorado (Continued) | | | | | | | | | | | | |
| | $2,275,000 | | | CO Neu Towne Metropolitan District2 | | | 7.250 | % | | | 12/01/2034 | | | $ | 604,081 | |
| | 1,290,000 | | | CO North Range Metropolitan District No. 2 | | | 5.500 | | | | 12/15/2018 | | | | 1,320,212 | |
| | 1,000,000 | | | CO North Range Metropolitan District No. 2 | | | 5.500 | | | | 12/15/2037 | | | | 1,009,450 | |
| | 12,585,000 | | | CO Park Valley Water and Sanitation Metropolitan District | | | 6.000 | 4 | | | 12/15/2017 | | | | 4,624,987 | |
| | 1,590,000 | | | CO Potomac Farms Metropolitan District | | | 7.250 | | | | 12/01/2037 | | | | 1,115,512 | |
| | 290,000 | | | CO Potomac Farms Metropolitan District | | | 7.625 | 1 | | | 12/01/2023 | | | | 218,530 | |
| | 915,000 | | | CO Prairie Center Metropolitan District No. 3 | | | 5.400 | | | | 12/15/2031 | | | | 935,212 | |
| | 2,253,000 | | | CO Regency Metropolitan District2 | | | 5.750 | | | | 12/01/2036 | | | | 1,785,548 | |
| | 500,000 | | | CO Silver Peaks Metropolitan District | | | 5.750 | | | | 12/01/2036 | | | | 334,580 | |
| | 1,720,000 | | | CO Sorrell Ranch Metropolitan District3 | | | 6.750 | | | | 12/15/2036 | | | | 345,152 | |
| | 4,950,000 | | | CO Sorrell Ranch Metropolitan District2 | | | 5.750 | | | | 12/01/2036 | | | | 3,975,296 | |
| | 2,500,000 | | | CO STC Metropolitan District No. 2 | | | 6.000 | | | | 12/01/2038 | | | | 2,373,625 | |
| | 1,260,000 | | | CO Stoneridge Metropolitan District | | | 5.625 | | | | 12/01/2036 | | | | 1,274,465 | |
| | 8,000,000 | | | CO Talon Pointe Metropolitan District3 | | | 8.000 | | | | 12/01/2039 | | | | 803,920 | |
| | 655,000 | | | CO Todd Creek Farms Metropolitan District No. 13 | | | 6.125 | | | | 12/01/2019 | | | | 419,239 | |
| | 4,390,000 | | | CO Traditions Metropolitan District No. 2 CAB | | | 8.500 | 1 | | | 12/15/2037 | | | | 4,251,891 | |
| | 500,000 | | | CO Wheatlands Metropolitan District | | | 6.000 | | | | 12/01/2025 | | | | 500,595 | |
| | 4,000,000 | | | CO Wheatlands Metropolitan District No. 2 | | | 8.250 | | | | 12/15/2035 | | | | 3,630,320 | |
| | 892,000 | | | CO Wyndham Hill Metropolitan District | | | 6.375 | | | | 12/01/2035 | | | | 863,795 | |
| | 500,000 | | | CO Wyndham Hill Metropolitan District | | | 6.250 | | | | 12/01/2025 | | | | 491,305 | |
| | 3,415,000 | | | Cundall Farms, CO Metropolitan District | | | 6.875 | | | | 12/01/2044 | | | | 3,430,231 | |
| | 35,375,000 | | | Denver, CO City & County Airport Special Facilities (United Air Lines) | | | 5.250 | | | | 10/01/2032 | | | | 36,633,289 | |
| | 31,350,000 | | | Denver, CO City & County Airport Special Facilities (United Air Lines) | | | 5.750 | | | | 10/01/2032 | | | | 32,733,789 | |
| | 2,065,000 | | | Hawthorn, CO Metropolitan District No. 2 | | | 6.375 | | | | 12/01/2044 | | | | 2,074,354 | |
| | 740,000 | | | Tabernash Meadows, CO Water & Sanitation District | | | 7.125 | | | | 12/01/2034 | | | | 807,836 | |
| | 295,000 | | | Tallyns Reach CO Metropolitan District No. 3 | | | 5.000 | | | | 12/01/2033 | | | | 304,620 | |
| | 685,000 | | | Tallyns Reach CO Metropolitan District No. 3 | | | 5.125 | | | | 11/01/2038 | | | | 710,338 | |
| | 20,183,519 | | | Woodmen Heights, CO Metropolitan District No. 1 | | | 0.000 | 1 | | | 12/15/2041 | | | | 10,140,604 | |
| | 5,468,763 | | | Woodmen Heights, CO Metropolitan District No. 1 | | | 6.000 | | | | 12/01/2041 | | | | 5,218,184 | |
| | | | | | | | | | | | | | | | |
| | | | | | | | | | | | | | | 157,497,699 | |
| | | | |
| | | | | | | | | | | | | | | | | |
| Connecticut—0.1% | | | | | | | | | | | | |
| | 2,350,000 | | | CT H&EFA (ECHNS/MMH/RGH/TACHC Obligated Group) | | | 6.000 | | | | 07/01/2025 | | | | 2,398,598 | |
| | 470,000 | | | Georgetown, CT Special Taxing District3 | | | 5.125 | | | | 10/01/2036 | | | | 185,847 | |
| | 10,719,181 | | | Mashantucket Western Pequot Tribe CT | | | 4.000 | | | | 07/01/2031 | | | | 749,271 | |
| | | | | | | | | | | | | | | | |
| | | | | | | | | | | | | | | 3,333,716 | |
| | | | |
| | | | | | | | | | | | | | | | | |
| Delaware—0.1% | | | | | | | | | | | | |
| | 1,300,000 | | | Bridgeville, DE Special Obligation (Heritage Shores) | | | 5.450 | | | | 07/01/2035 | | | | 1,300,182 | |
28 OPPENHEIMER ROCHESTER HIGH YIELD MUNICIPAL FUND
| | | | | | | | | | | | | | | | |
Principal
Amount | | | | | Coupon | | | Maturity | | | Value | |
| Delaware (Continued) | | | | | | | | | | | | |
| | $7,438,000 | | | Millsboro, DE Special Obligation (Plantation Lakes) | | | 5.450 | % | | | 07/01/2036 | | | $ | 5,685,682 | |
| | | | | | | | | | | | | | | 6,985,864 | |
| | | | |
| | | | | | | | | | | | | | | | | |
| District of Columbia—2.0% | | | | | | | | | | | | |
| | 10,000,000 | | | District of Columbia (Howard University) | | | 6.250 | | | | 10/01/2032 | | | | 10,621,000 | |
| | 25,610,000 | | | District of Columbia (Howard University) | | | 6.500 | | | | 10/01/2041 | | | | 27,382,980 | |
| | 5,000,000 | | | District of Columbia (National Public Radio)5 | | | 5.000 | | | | 04/01/2035 | | | | 5,579,200 | |
| | 3,200,000 | | | District of Columbia Center for Strategic & International Studies | | | 6.375 | | | | 03/01/2031 | | | | 3,471,008 | |
| | 2,000,000 | | | District of Columbia Center for Strategic & International Studies | | | 6.625 | | | | 03/01/2041 | | | | 2,189,620 | |
| | 15,000 | | | District of Columbia Tobacco Settlement Financing Corp. | | | 6.250 | | | | 05/15/2024 | | | | 14,999 | |
| | 32,680,000 | | | District of Columbia Tobacco Settlement Financing Corp. | | | 6.750 | | | | 05/15/2040 | | | | 32,676,405 | |
| | 1,375,680,000 | | | District of Columbia Tobacco Settlement Financing Corp. (TASC) | | | 6.897 | 4 | | | 06/15/2055 | | | | 12,518,688 | |
| | 1,055,000,000 | | | District of Columbia Tobacco Settlement Financing Corp. (TASC) | | | 7.250 | 4 | | | 06/15/2055 | | | | 6,140,100 | |
| | | | | | | | | | | | | | | | |
| | | | | | | | | | | | | | | 100,594,000 | |
| | | | |
| | | | | | | | | | | | | | | | | |
| Florida—11.1% | | | | | | | | | | | | |
| | 1,000,000 | | | Alachua County, FL Health Facilities Authority (Oak Hammock University Florida) | | | 8.000 | | | | 10/01/2046 | | | | 1,238,550 | |
| | 1,000,000 | | | Alachua County, FL Health Facilities Authority (Oak Hammock University Florida) | | | 8.000 | | | | 10/01/2042 | | | | 1,240,780 | |
| | 750,000 | | | Alachua County, FL Health Facilities Authority (Oak Hammock University Florida) | | | 8.000 | | | | 10/01/2032 | | | | 934,815 | |
| | 4,655,000 | | | Amelia Concourse, FL Community Devel. District3 | | | 5.750 | | | | 05/01/2038 | | | | 3,497,767 | |
| | 115,000 | | | Arborwood, FL Community Devel. District (Centex Homes)6 | | | 5.250 | | | | 05/01/2016 | | | | 114,399 | |
| | 13,820,000 | | | Arlington Ridge, FL Community Devel. District2 | | | 5.500 | | | | 05/01/2036 | | | | 8,983,967 | |
| | 1,045,000 | | | Avignon Villages, FL Community Devel. District3 | | | 5.300 | | | | 05/01/2014 | | | | 136,467 | |
| | 755,000 | | | Avignon Villages, FL Community Devel. District3 | | | 5.400 | | | | 05/01/2037 | | | | 98,595 | |
| | 14,970,000 | | | Baker, FL Correctional Devel. Corp. (Detention Center) | | | 7.500 | | | | 02/01/2030 | | | | 12,336,178 | |
| | 225,000 | | | Bayshore, FL Hsg. Corp.3 | | | 8.000 | | | | 12/01/2016 | | | | 119,250 | |
| | 3,035,000 | | | Baywinds, FL Community Devel. District6 | | | 7.020 | | | | 05/01/2022 | | | | 3,020,432 | |
| | 7,815,000 | | | Baywinds, FL Community Devel. District | | | 5.250 | | | | 05/01/2037 | | | | 7,825,238 | |
| | 7,555,000 | | | Belle Isle, FL Charter School (Cornerstone Charter Academy & Cornerstone Charter High School Obligated Group) | | | 6.000 | | | | 10/01/2042 | | | | 7,902,908 | |
| | 8,150,000 | | | Bonnet Creek, FL Resort Community Devel. District Special Assessment | | | 7.375 | | | | 05/01/2034 | | | | 8,153,097 | |
| | 5,355,000 | | | Bonnet Creek, FL Resort Community Devel. District Special Assessment | | | 7.500 | | | | 05/01/2034 | | | | 5,357,570 | |
| | 3,575,000 | | | Boynton Village, FL Community Devel. District Special Assessment | | | 6.000 | | | | 05/01/2038 | | | | 3,603,707 | |
| | 300,000 | | | Broward County, FL HFA (Single Family) | | | 5.000 | | | | 10/01/2039 | | | | 300,297 | |
| | 5,845,000 | | | Buckeye Park, FL Community Devel. District3 | | | 7.875 | | | | 05/01/2038 | | | | 1,753,266 | |
29 OPPENHEIMER ROCHESTER HIGH YIELD MUNICIPAL FUND
STATEMENT OF INVESTMENTS Continued
| | | | | | | | | | | | | | | | |
Principal
Amount | | | | | Coupon | | | Maturity | | | Value | |
| Florida (Continued) | | | | | | | | | | | | |
| | $25,450,000 | | | CFM, FL Community Devel. District, Series A3 | | | 6.250 | % | | | 05/01/2035 | | | $ | 10,824,648 | |
| | 8,510,000 | | | Chapel Creek, FL Community Devel. District Special Assessment3 | | | 5.500 | | | | 05/01/2038 | | | | 5,066,939 | |
| | 24,013,000 | | | Clearwater Cay, FL Community Devel. District3 | | | 5.500 | | | | 05/01/2037 | | | | 13,208,831 | |
| | 1,690,000 | | | Creekside, FL Community Devel. District3 | | | 5.200 | | | | 05/01/2038 | | | | 676,118 | |
| | 1,255,000 | | | Crosscreek, FL Community Devel. District3 | | | 5.600 | | | | 05/01/2039 | | | | 535,621 | |
| | 2,625,000 | | | Crosscreek, FL Community Devel. District3 | | | 5.500 | | | | 05/01/2017 | | | | 1,119,247 | |
| | 55,000 | | | Dade County, FL HFA (Golden Lakes Apartments) | | | 6.050 | | | | 11/01/2039 | | | | 55,057 | |
| | 45,000 | | | Dade County, FL HFA (Siesta Pointe Apartments) | | | 5.650 | | | | 09/01/2017 | | | | 45,135 | |
| | 1,100,000 | | | Dade County, FL IDA (Miami Cerebral Palsy Residence) | | | 8.000 | | | | 06/01/2022 | | | | 1,100,176 | |
| | 7,745,000 | | | Deer Run, FL Community Devel. District Special Assessment3 | | | 7.625 | | | | 05/01/2039 | | | | 4,569,937 | |
| | 1,940,000 | | | Durbin Crossing, FL Community Devel. District Special Assessment2 | | | 5.250 | | | | 11/01/2015 | | | | 1,164,078 | |
| | 6,718,000 | | | FL Capital Trust Agency (Atlantic Hsg. Foundation)2 | | | 7.000 | | | | 07/15/2032 | | | | 1,343,802 | |
| | 12,500,000 | | | FL Capital Trust Agency (Atlantic Hsg. Foundation)2 | | | 8.260 | | | | 07/15/2038 | | | | 2,500,375 | |
| | 50,000 | | | FL HFA (Spinnaker Cove Apartments) | | | 6.500 | | | | 07/01/2036 | | | | 50,127 | |
| | 95,000 | | | FL HFA (Stoddert Arms Apartments) | | | 6.250 | | | | 09/01/2026 | | | | 95,116 | |
| | 4,660,000 | | | FL HFC (Westchase Apartments) | | | 6.610 | | | | 07/01/2038 | | | | 4,438,417 | |
| | 30,000 | | | FL HFC (Westwood Apartments) | | | 5.400 | | | | 02/01/2039 | | | | 30,025 | |
| | 3,400,000 | | | FL Lake Ashton II Community Devel. District | | | 5.375 | | | | 05/01/2036 | | | | 2,851,444 | |
| | 1,315,000 | | | Forest Creek, FL Community Devel. District | | | 5.450 | | | | 05/01/2036 | | | | 1,315,355 | |
| | 1,953,132 | | | Forest Creek, FL Community Devel. District6 | | | 5.450 | | | | 05/01/2036 | | | | 1,953,132 | |
| | 7,660,000 | | | Glades, FL Correctional Devel. Corp. (Glades County Detention)2 | | | 7.375 | | | | 03/01/2030 | | | | 1,569,534 | |
| | 3,065,000 | | | Greater Lakes/Sawgrass Bay, FL Community Devel. District | | | 5.500 | | | | 05/01/2038 | | | | 2,937,404 | |
| | 1,850,000 | | | Harbor Bay, FL Community Devel. District | | | 6.750 | | | | 05/01/2034 | | | | 1,856,826 | |
| | 16,240,000 | | | Heritage Harbour North, FL Community Devel. District | | | 6.375 | | | | 05/01/2038 | | | | 17,034,136 | |
| | 3,480,000 | | | Heritage Plantation, FL Community Devel. District3 | | | 5.400 | | | | 05/01/2037 | | | | 1,044,209 | |
| | 1,910,000 | | | Heritage Plantation, FL Community Devel. District3 | | | 5.100 | | | | 11/01/2013 | | | | 573,115 | |
| | 845,000 | | | Highland Meadows, FL Community Devel. District Special Assessment, Series A3 | | | 5.500 | | | | 05/01/2036 | | | | 335,795 | |
| | 10,000,000 | | | Highlands County, FL Health Facilities Authority (ABH/AGH/AHSGA Obligated Group)5 | | | 5.250 | | | | 11/15/2036 | | | | 10,531,950 | |
| | 13,500,000 | | | Highlands County, FL Health Facilities Authority (ABH/AGH/AHSGA Obligated Group)5 | | | 5.125 | | | | 11/15/2032 | | | | 14,218,133 | |
| | 4,720,000 | | | Highlands, FL Community Devel. District | | | 5.550 | | | | 05/01/2036 | | | | 3,467,312 | |
| | 5,480,000 | | | Indigo, FL Community Devel. District2 | | | 5.750 | | | | 05/01/2036 | | | | 3,312,660 | |
| | 1,425,000 | | | Lakeside Landings, FL Devel. District3 | | | 5.500 | | | | 05/01/2038 | | | | 569,943 | |
| | 2,000,000 | | | Lakeside Landings, FL Devel. District3 | | | 5.250 | | | | 05/01/2013 | | | | 799,940 | |
| | 8,115,000 | | | Lakewood Ranch, FL Stewardship District | | | 5.500 | | | | 05/01/2036 | | | | 7,995,791 | |
| | 15,360,000 | | | Lakewood Ranch, FL Stewardship District (Country Club East Investors) | | | 5.400 | | | | 05/01/2037 | | | | 15,380,890 | |
30 OPPENHEIMER ROCHESTER HIGH YIELD MUNICIPAL FUND
| | | | | | | | | | | | | | | | |
Principal
Amount | | | | | Coupon | | | Maturity | | | Value | |
| Florida (Continued) | | | | | | | | | | | | |
| | $3,800,000 | | | Legends Bay, FL Community Devel. District | | | 5.875 | % | | | 05/01/2038 | | | $ | 3,711,574 | |
| | 100,000 | | | Leon County, FL Educational Facilities Authority (Southgate Residence Hall) | | | 6.750 | | | | 09/01/2028 | | | | 99,988 | |
| | 1,275,000 | | | Liberty County, FL Revenue (Twin Oaks)3 | | | 8.250 | | | | 07/01/2028 | | | | 190,867 | |
| | 1,180,000 | | | Madison County, FL Mtg. (Twin Oaks) | | | 6.000 | | | | 07/01/2025 | | | | 759,849 | |
| | 5,360,000 | | | Magnolia Creek, FL Community Devel. District3 | | | 5.900 | | | | 05/01/2039 | | | | 1,340,322 | |
| | 5,000,000 | | | Magnolia Creek, FL Community Devel. District3 | | | 5.600 | | | | 05/01/2014 | | | | 1,250,300 | |
| | 2,805,000 | | | Magnolia West, FL Community Devel. District Special Assessment2 | | | 5.350 | | | | 05/01/2037 | | | | 2,244,196 | |
| | 2,600,000 | | | Main Street, FL Community Devel. District | | | 6.800 | | | | 05/01/2038 | | | | 2,622,464 | |
| | 975,000 | | | Miami-Dade County, FL HFA (Homeownership Mtg.) | | | 5.450 | | | | 10/01/2038 | | | | 973,771 | |
| | 4,000,000 | | | Miami-Dade County, FL School Board | | | 5.000 | | | | 05/01/2031 | | | | 4,573,560 | |
| | 5,455,000 | | | Miami-Dade County, FL School Board | | | 5.000 | | | | 05/01/2032 | | | | 6,140,093 | |
| | 50,000,000 | | | Miami-Dade County, FL School Board COP5 | | | 5.375 | | | | 02/01/2034 | | | | 54,725,500 | |
| | 10,000,000 | | | Miami-Dade County, FL School Board COP5 | | | 5.250 | | | | 02/01/2027 | | | | 10,833,700 | |
| | 10,000,000 | | | Miami-Dade County, FL School Board COP5 | | | 5.000 | | | | 02/01/2027 | | | | 10,750,800 | |
| | 5,525,000 | | | Montecito, FL Community Devel. District2 | | | 5.500 | | | | 05/01/2037 | | | | 3,593,349 | |
| | 12,430,000 | | | Montecito, FL Community Devel. District3 | | | 5.100 | | | | 05/01/2013 | | | | 8,084,348 | |
| | 580,000 | | | Moody River, FL Estates Community Devel. District | | | 5.350 | | | | 05/01/2036 | | | | 477,108 | |
| | 10,340,000 | | | Nassau County, FL (Nassau Care Centers) | | | 6.900 | | | | 01/01/2038 | | | | 10,593,330 | |
| | 4,345,000 | | | Naturewalk, FL Community Devel. District2 | | | 5.500 | | | | 05/01/2038 | | | | 2,389,924 | |
| | 3,640,000 | | | Naturewalk, FL Community Devel. District2 | | | 5.300 | | | | 05/01/2016 | | | | 2,002,146 | |
| | 750,000 | | | Orange County, FL Health Facilities Authority (Orlando Lutheran Tower) | | | 5.500 | | | | 07/01/2032 | | | | 770,392 | |
| | 5,000 | | | Orange County, FL HFA (Park Avenue Villas) | | | 5.250 | | | | 09/01/2031 | | | | 5,005 | |
| | 3,750,000 | | | Palm Bay, FL Educational Facilities (Patriot Charter School)3 | | | 7.000 | | | | 07/01/2036 | | | | 1,125,075 | |
| | 3,000,000 | | | Palm Beach County, FL Health Facilities Authority (Sinai Residences Boca Raton) | | | 7.500 | | | | 06/01/2049 | | | | 3,451,380 | |
| | 12,555,000 | | | Palm Coast Park, FL Community Devel. District Special Assessment | | | 5.700 | | | | 05/01/2037 | | | | 10,553,733 | |
| | 6,105,000 | | | Palm Glades, FL Community Devel. District Special Assessment | | | 7.125 | | | | 05/01/2039 | | | | 6,242,851 | |
| | 1,850,000 | | | Palm River, FL Community Devel. District3 | | | 5.150 | | | | 05/01/2013 | | | | 729,085 | |
| | 1,565,000 | | | Palm River, FL Community Devel. District3 | | | 5.375 | | | | 05/01/2036 | | | | 617,721 | |
| | 1,495,000 | | | Parkway Center, FL Community Devel. District, Series A | | | 6.300 | | | | 05/01/2034 | | | | 1,422,328 | |
| | 5,715,000 | | | Pine Ridge Plantation, FL Community Devel. District | | | 5.400 | | | | 05/01/2037 | | | | 4,985,423 | |
| | 2,250,000 | | | Pinellas County, FL Educational Facilities Authority (Pinellas Prep Academy) | | | 7.125 | | | | 09/15/2041 | | | | 2,463,953 | |
| | 4,500,000 | | | Pinellas County, FL Health Facility Authority (St. Mark Village) | | | 5.650 | | | | 05/01/2037 | | | | 4,500,315 | |
| | 1,805,000 | | | Poinciana West, FL Community Devel. District Special Assessment | | | 6.000 | | | | 05/01/2037 | | | | 1,839,512 | |
| | 625,000 | | | Port St. Lucie, FL Special Assessment (Peacock & Lowry) | | | 5.350 | | | | 07/01/2027 | | | | 594,300 | |
| | 9,900,000 | | | Portico, FL Community Devel. District | | | 5.450 | | | | 05/01/2037 | | | | 8,424,207 | |
31 OPPENHEIMER ROCHESTER HIGH YIELD MUNICIPAL FUND
STATEMENT OF INVESTMENTS Continued
| | | | | | | | | | | | | | | | |
Principal
Amount | | | | | Coupon | | | Maturity | | | Value | |
| Florida (Continued) | | | | | | | | | | | | |
| | $3,005,000 | | | Portofino Cove, FL Community Devel. District Special Assessment3 | | | 5.500 | % | | | 05/01/2038 | | | $ | 1,352,310 | |
| | 5,905,000 | | | Portofino Isles, FL Community Devel. District (Portofino Court)3 | | | 5.600 | | | | 05/01/2036 | | | | 1,182,004 | |
| | 1,955,000 | | | Portofino Landings, FL Community Devel. District Special Assessment3 | | | 5.400 | | | | 05/01/2038 | | | | 767,885 | |
| | 1,000,000 | | | Portofino Landings, FL Community Devel. District Special Assessment3 | | | 5.200 | | | | 05/01/2017 | | | | 392,470 | |
| | 2,470,000 | | | Portofino Vista, FL Community Devel. District3 | | | 5.000 | | | | 05/01/2013 | | | | 1,111,549 | |
| | 2,495,000 | | | Quarry, FL Community Devel. District | | | 5.500 | | | | 05/01/2036 | | | | 2,485,594 | |
| | 420,000 | | | Renaissance Commons, FL Community Devel. District, Series A | | | 5.600 | | | | 05/01/2036 | | | | 364,757 | |
| | 3,420,000 | | | Reunion East, FL Community Devel. District2 | | | 5.800 | | | | 05/01/2036 | | | | 34 | |
| | 1,645,000 | | | Reunion East, FL Community Devel. District | | | 6.600 | | | | 05/01/2033 | | | | 1,620,144 | |
| | 3,780,000 | | | Reunion East, FL Community Devel. District | | | 6.600 | | | | 05/01/2036 | | | | 3,731,200 | |
| | 1,425,000 | | | Reunion East, FL Community Devel. District2 | | | 7.375 | | | | 05/01/2033 | | | | 14 | |
| | 140,000 | | | Ridgewood Trails, FL Community Devel. District | | | 5.650 | | | | 05/01/2038 | | | | 69,174 | |
| | 8,170,000 | | | River Bend, FL Community Devel. District | | | 5.450 | | | | 05/01/2035 | | | | 6,584,938 | |
| | 2,365,000 | | | River Bend, FL Community Devel. District3 | | | 7.125 | | | | 11/01/2015 | | | | 304,352 | |
| | 7,890,000 | | | River Glen, FL Community Devel. District Special Assessment3 | | | 5.450 | | | | 05/01/2038 | | | | 3,147,400 | |
| | 172,164 | | | Santa Rosa Bay, FL Bridge Authority | | | 6.250 | | | | 07/01/2028 | | | | 109,959 | |
| | 1,895,000 | | | Sarasota County, FL Educational Facilities (School of Arts & Sciences) | | | 6.500 | | | | 07/01/2040 | | | | 2,058,671 | |
| | 4,185,000 | | | Seminole County, FL IDA (Progressive Health) | | | 7.500 | | | | 03/01/2035 | | | | 4,229,780 | |
| | 8,750,000 | | | South Bay, FL Community Devel. District2 | | | 0.000 | 1 | | | 05/01/2036 | | | | 6,782,213 | |
| | 3,240,000 | | | South Bay, FL Community Devel. District2 | | | 0.000 | 1 | | | 05/01/2025 | | | | 2,527,556 | |
| | 5,110,000 | | | South Bay, FL Community Devel. District3 | | | 5.950 | | | | 05/01/2036 | | | | 1,277,653 | |
| | 7,620,000 | | | South Bay, FL Community Devel. District | | | 5.950 | | | | 05/01/2036 | | | | 7,575,042 | |
| | 7,035,000 | | | South Bay, FL Community Devel. District | | | 5.125 | | | | 05/01/2020 | | | | 6,472,974 | |
| | 3,900,000 | | | South Fork East, FL Community Devel. District | | | 6.500 | 1 | | | 05/01/2038 | | | | 3,799,731 | |
| | 1,005,000 | | | South Fork, FL Community Devel. District Special Assessment | | | 6.150 | | | | 05/01/2033 | | | | 1,008,739 | |
| | 2,325,000 | | | St. Johns County, FL IDA (Glenmoor)3 | | | 1.344 | 7 | | | 01/01/2049 | | | | 809,705 | |
| | 860,333 | | | St. Johns County, FL IDA (Glenmoor)2 | | | 2.500 | | | | 01/01/2049 | | | | 9 | |
| | 3,500,000 | | | St. Johns County, FL IDA (Presbyterian Retirement) | | | 6.000 | | | | 08/01/2045 | | | | 3,890,565 | |
| | 3,500,000 | | | St. Johns County, FL IDA (Presbyterian Retirement) | | | 5.875 | | | | 08/01/2040 | | | | 3,865,610 | |
| | 1,000,000 | | | St. Johns County, FL IDA (St. John’s County Welfare Federation) | | | 5.250 | | | | 10/01/2041 | | | | 873,150 | |
| | 2,485,000 | | | St. John’s Forest, FL Community Devel. District, Series A | | | 6.125 | | | | 05/01/2034 | | | | 2,486,541 | |
| | 1,000,000 | | | Tavares, FL First Mtg. (Osprey Lodge Lakeview) | | | 8.375 | | | | 07/01/2036 | | | | 1,001,150 | |
| | 795,000 | | | Tavares, FL First Mtg. (Osprey Lodge Lakeview) | | | 8.750 | | | | 07/01/2046 | | | | 802,759 | |
| | 19,075,000 | | | Tern Bay, FL Community Devel. District3 | | | 5.375 | | | | 05/01/2037 | | | | 4,655,063 | |
| | 16,765,000 | | | Tern Bay, FL Community Devel. District3 | | | 5.000 | | | | 05/01/2015 | | | | 4,088,648 | |
| | 2,475,000 | | | Town Center, FL at Palm Coast Community Devel. District | | | 6.000 | | | | 05/01/2036 | | | | 2,340,187 | |
| | 4,950,000 | | | Treeline, FL Preservation Community Devel. District2 | | | 6.800 | | | | 05/01/2039 | | | | 1,981,040 | |
32 OPPENHEIMER ROCHESTER HIGH YIELD MUNICIPAL FUND
| | | | | | | | | | | | | | | | |
Principal Amount | | | | | Coupon | | | Maturity | | | Value | |
| Florida (Continued) | | | | | | | | | | | | |
| | $635,000 | | | Turnbull Creek, FL Community Devel. District Special Assessment | | | 5.250 | % | | | 05/01/2037 | | | $ | 583,279 | |
| | 8,000,000 | | | Verandah East, FL Community Devel. District | | | 5.400 | | | | 05/01/2037 | | | | 8,014,080 | |
| | 1,265,000 | | | Villa Vizcaya, FL Community Devel. District Special Assessment3 | | | 5.550 | | | | 05/01/2039 | | | | 695,940 | |
| | 8,340,000 | | | Villages of Westport, FL Community Devel. District3,8 | | | 5.700 | | | | 05/01/2035 | | | | 5,379,717 | |
| | 1,955,000 | | | Villages of Westport, FL Community Devel. District3,8 | | | 5.400 | | | | 05/01/2020 | | | | 1,261,073 | |
| | 3,350,000 | | | Waterford Estates, FL Community Devel. District Special Assessment3 | | | 5.500 | | | | 05/01/2037 | | | | 986,073 | |
| | 4,395,000 | | | Waterford Estates, FL Community Devel. District Special Assessment3 | | | 5.125 | | | | 05/01/2013 | | | | 1,292,130 | |
| | 3,190,000 | | | Waterlefe, FL Community Devel. District Golf Course3 | | | 8.125 | | | | 10/01/2025 | | | | 216,888 | |
| | 6,805,000 | | | Waters Edge, FL Community Devel. District | | | 0.000 | 1 | | | 05/01/2039 | | | | 5,696,261 | |
| | 136,000 | | | Waters Edge, FL Community Devel. District | | | 5.350 | | | | 05/01/2039 | | | | 136,286 | |
| | 14,800,000 | | | Waterstone, FL Community Devel. District3 | | | 5.500 | | | | 05/01/2018 | | | | 5,872,936 | |
| | 18,550,000 | | | West Villages, FL Improvement District3 | | | 5.800 | | | | 05/01/2036 | | | | 11,131,299 | |
| | 1,215,000 | | | West Villages, FL Improvement District3 | | | 5.350 | | | | 05/01/2015 | | | | 729,085 | |
| | 19,100,000 | | | West Villages, FL Improvement District | | | 5.500 | | | | 05/01/2038 | | | | 18,757,919 | |
| | 14,925,000 | | | Westridge, FL Community Devel. District3 | | | 5.800 | | | | 05/01/2037 | | | | 5,624,337 | |
| | 11,210,000 | | | Westside, FL Community Devel. District2 | | | 5.650 | | | | 05/01/2037 | | | | 5,610,605 | |
| | 16,790,000 | | | Westside, FL Community Devel. District3 | | | 7.200 | | | | 05/01/2038 | | | | 8,479,622 | |
| | 7,420,000 | | | Wyld Palms, FL Community Devel. District3 | | | 5.400 | | | | 05/01/2015 | | | | 1,855,445 | |
| | 4,340,000 | | | Wyld Palms, FL Community Devel. District3 | | | 5.500 | | | | 05/01/2038 | | | | 1,085,260 | |
| | 2,665,000 | | | Zephyr Ridge, FL Community Devel. District3 | | | 5.625 | | | | 05/01/2037 | | | | 1,050,943 | |
| | 3,830,000 | | | Zephyr Ridge, FL Community Devel. District3 | | | 5.250 | | | | 05/01/2013 | | | | 1,508,254 | |
| | | | | | | | | | | | | | | | |
| | | | | | | | | | | | | | | 547,988,972 | |
| | | | |
| | | | | | | | | | | | | | | | | |
| Georgia—1.5% | | | | | | | | | | | | |
| | 725,000 | | | Atlanta, GA Tax Allocation (Beltline) | | | 7.500 | | | | 01/01/2031 | | | | 842,725 | |
| | 4,100,000 | | | Atlanta, GA Tax Allocation (Beltline) | | | 7.500 | | | | 01/01/2031 | | | | 4,765,758 | |
| | 350,000 | | | East Point, GA (Camp Creek), Series B | | | 8.000 | | | | 02/01/2026 | | | | 350,861 | |
| | 10,625,000 | | | Franklin County, GA Industrial Building Authority (Emmanuel College)3 | | | 6.250 | | | | 11/01/2043 | | | | 6,374,894 | |
| | 1,380,000 | | | Franklin County, GA Industrial Building Authority (Emmanuel College)3 | | | 6.000 | | | | 11/01/2032 | | | | 827,986 | |
| | 1,435,000 | | | Franklin County, GA Industrial Building Authority (Emmanuel College)3 | | | 5.750 | | | | 11/01/2025 | | | | 860,986 | |
| | 31,945,000 | | | Fulton County, GA Devel. Authority (Piedmont Healthcare)5 | | | 5.000 | | | | 06/15/2029 | | | | 34,861,839 | |
| | 13,730,000 | | | Fulton County, GA Devel. Authority (Piedmont Healthcare/Piedmont Hospital/Piedmont Hospital Foundation Obligated Group)5 | | | 5.250 | | | | 06/15/2037 | | | | 14,987,518 | |
| | 2,250,000 | | | GA Road & Tollway Authority (I-75 S Express Lanes) | | | 6.252 | 4 | | | 06/01/2024 | | | | 1,341,832 | |
| | 9,100,000 | | | GA Road & Tollway Authority (I-75 S Express Lanes) | | | 0.000 | 1 | | | 06/01/2049 | | | | 4,977,245 | |
| | 3,750,000 | | | GA Road & Tollway Authority (I-75 S Express Lanes) | | | 6.751 | 4 | | | 06/01/2034 | | | | 1,132,463 | |
33 OPPENHEIMER ROCHESTER HIGH YIELD MUNICIPAL FUND
STATEMENT OF INVESTMENTS Continued
| | | | | | | | | | | | | | | | |
Principal Amount | | | | | Coupon | | | Maturity | | | Value | |
| Georgia (Continued) | | | | | | | | | | | | |
| | $2,000,000 | | | Marietta, GA Devel. Authority (University Facilities) | | | 7.000 | % | | | 06/15/2039 | | | $ | 2,098,940 | |
| | | | | | | | | | | | | | | | |
| | | | | | | | | | | | | | | 73,423,047 | |
| | | | |
| | | | | | | | | | | | | | | | | |
| Hawaii—0.1% | | | | | | | | | | | | |
| | 405,000 | | | HI Dept. of Transportation (Continental Airlines) | | | 5.625 | | | | 11/15/2027 | | | | 405,413 | |
| | 275,000 | | | Kuakini, HI Health System (KMC/KHS/KGC/KSS Obligated Group) | | | 6.375 | | | | 07/01/2032 | | | | 275,558 | |
| | 2,290,000 | | | Kuakini, HI Health System (KMC/KHS/KGC/KSS Obligated Group) | | | 6.300 | | | | 07/01/2022 | | | | 2,296,160 | |
| | | | | | | | | | | | | | | | |
| | | | | | | | | | | | | | | 2,977,131 | |
| | | | |
| | | | | | | | | | | | | | | | | |
| Idaho—0.0% | | | | | | | | | | | | |
| | 5,000 | | | ID Hsg. & Finance Assoc. (Single Family Mtg.) | | | 5.350 | | | | 01/01/2025 | | | | 5,007 | |
| | 1,500,000 | | | Nampa, ID Local Improvement District No. 1486 | | | 6.625 | | | | 09/01/2030 | | | | 1,532,430 | |
| | | | | | | | | | | | | | | | |
| | | | | | | | | | | | | | | 1,537,437 | |
| | | | |
| | | | | | | | | | | | | | | | | |
| Illinois—7.4% | | | | | | | | | | | | |
| | 600,000 | | | Annawan, IL Tax Increment (Patriot Renewable Fuels) | | | 5.625 | | | | 01/01/2018 | | | | 598,308 | |
| | 30,685,000 | | | Caseyville, IL Tax (Forest Lakes)2 | | | 7.000 | | | | 12/30/2022 | | | | 1,429,614 | |
| | 1,100,000 | | | Chicago, IL Board of Education | | | 5.000 | | | | 12/01/2042 | | | | 925,859 | |
| | 32,500,000 | | | Chicago, IL GO5 | | | 5.250 | | | | 01/01/2033 | | | | 31,313,425 | |
| | 35,000 | | | Chicago, IL Multifamily Hsg. (Cottage View Terrace) | | | 6.125 | | | | 02/20/2042 | | | | 35,052 | |
| | 10,000 | | | Chicago, IL O’Hare International Airport (General Airport) | | | 5.250 | | | | 01/01/2034 | | | | 10,034 | |
| | 10,032,000 | | | Cortland, IL Special Tax (Sheaffer System)2 | | | 5.500 | | | | 03/01/2017 | | | | 2,006,801 | |
| | 1,120,000 | | | Country Club Hills, IL GO | | | 5.000 | | | | 12/01/2030 | | | | 1,134,314 | |
| | 1,175,000 | | | Country Club Hills, IL GO | | | 5.000 | | | | 12/01/2031 | | | | 1,191,567 | |
| | 2,425,000 | | | Country Club Hills, IL GO | | | 5.000 | | | | 12/01/2032 | | | | 2,455,434 | |
| | 965,000 | | | Country Club Hills, IL GO | | | 5.000 | | | | 12/01/2027 | | | | 979,465 | |
| | 915,000 | | | Country Club Hills, IL GO | | | 5.000 | | | | 12/01/2026 | | | | 930,958 | |
| | 1,060,000 | | | Country Club Hills, IL GO | | | 5.000 | | | | 12/01/2029 | | | | 1,074,713 | |
| | 1,010,000 | | | Country Club Hills, IL GO | | | 5.000 | | | | 12/01/2028 | | | | 1,024,473 | |
| | 653,000 | | | Deerfield, IL (Chicagoland Conservative Jewish High School Foundation) | | | 6.000 | | | | 10/01/2042 | | | | 618,685 | |
| | 1,000,000 | | | Du Page County, IL Special Service Area No. 31 Special Tax (Monarch Landing) | | | 5.625 | | | | 03/01/2036 | | | | 1,004,020 | |
| | 1,585,000 | | | Franklin Park, IL GO | | | 6.250 | | | | 07/01/2030 | | | | 1,915,789 | |
| | 2,380,519 | | | Gilberts, IL Special Service Area No. 24 Special Tax (Conservancy) | | | 5.375 | | | | 03/01/2034 | | | | 2,012,634 | |
| | 1,800,000 | | | Harvey, IL GO | | | 5.625 | | | | 12/01/2032 | | | | 1,449,324 | |
| | 6,165,000 | | | Harvey, IL GO | | | 5.500 | | | | 12/01/2027 | | | | 5,043,278 | |
| | 10,575,000 | | | IL Educational Facilities Authority (Plum Creek Rolling Meadows) | | | 6.500 | | | | 12/01/2037 | | | | 10,853,969 | |
| | 685,000 | | | IL Finance Authority (Advocate Health Care) | | | 5.375 | | | | 04/01/2044 | | | | 749,787 | |
| | 11,000,000 | | | IL Finance Authority (Advocate Health Care)5 | | | 5.375 | | | | 04/01/2044 | | | | 12,040,380 | |
| | 20,000,000 | | | IL Finance Authority (Advocate Health Care)5 | | | 5.500 | | | | 04/01/2044 | | | | 22,044,600 | |
| | 41,175,000 | | | IL Finance Authority (Advocate Health Care)5 | | | 5.375 | | | | 04/01/2044 | | | | 45,069,326 | |
| | 3,195,000 | | | IL Finance Authority (Bethel Terrace Apartments) | | | 5.375 | | | | 09/01/2035 | | | | 3,196,086 | |
34 OPPENHEIMER ROCHESTER HIGH YIELD MUNICIPAL FUND
| | | | | | | | | | | | | | | | |
Principal Amount | | | | | Coupon | | | Maturity | | | Value | |
| Illinois (Continued) | | | | | | | | | | | | |
| | $145,000 | | | IL Finance Authority (Bridgeway/Bridgeway Foundation/Occupation Devel. Center Obligated Group) | | | 4.625 | % | | | 07/01/2027 | | | $ | 121,881 | |
| | 13,000,000 | | | IL Finance Authority (CDHS/CDHA Obligated Group) | | | 5.750 | | | | 11/01/2039 | | | | 14,999,270 | |
| | 5,000,000 | | | IL Finance Authority (CDHS/CDHA)5 | | | 5.375 | | | | 11/01/2039 | | | | 5,664,450 | |
| | 12,500,000 | | | IL Finance Authority (Central Dupage Health)5 | | | 5.500 | | | | 11/01/2039 | | | | 14,273,625 | |
| | 5,625,000 | | | IL Finance Authority (DeKalb Supportive Living) | | | 6.100 | | | | 12/01/2041 | | | | 5,674,050 | |
| | 2,250,000 | | | IL Finance Authority (Franciscan Communities) | | | 5.500 | | | | 05/15/2027 | | | | 2,338,357 | |
| | 2,030,000 | | | IL Finance Authority (Friendship Village Schaumburg) | | | 5.625 | | | | 02/15/2037 | | | | 2,030,183 | |
| | 1,000,000 | | | IL Finance Authority (Lake Forest College) | | | 6.000 | | | | 10/01/2048 | | | | 1,089,580 | |
| | 850,000 | | | IL Finance Authority (Luther Oaks) | | | 6.000 | | | | 08/15/2026 | | | | 862,563 | |
| | 1,500,000 | | | IL Finance Authority (Luther Oaks) | | | 6.000 | | | | 08/15/2039 | | | | 1,514,430 | |
| | 28,035,000 | | | IL Finance Authority (Provena Health) | | | 7.750 | | | | 08/15/2034 | | | | 33,980,102 | |
| | 575,000 | | | IL Finance Authority (Rogers Park Montessori School) | | | 6.000 | | | | 02/01/2034 | | | | 596,286 | |
| | 1,310,000 | | | IL Finance Authority (Rogers Park Montessori School) | | | 6.125 | | | | 02/01/2045 | | | | 1,344,440 | |
| | 1,090,000 | | | IL Finance Authority (RUMC/RCMC/CMH/RCF/TYW Obligated Group) | | | 7.250 | | | | 11/01/2030 | | | | 1,303,716 | |
| | 11,970,000 | | | IL Finance Authority (St. Anthony Lassing) | | | 6.500 | | | | 12/01/2032 | | | | 12,262,667 | |
| | 5,775,000 | | | IL Finance Authority (The New Admiral at the Lake) | | | 8.000 | | | | 05/15/2046 | | | | 6,569,582 | |
| | 1,500,000 | | | IL Finance Authority (The New Admiral at the Lake) | | | 8.000 | | | | 05/15/2040 | | | | 1,708,530 | |
| | 2,850,000 | | | IL Finance Authority (Uno Charter School Network) | | | 7.125 | | | | 10/01/2041 | | | | 3,209,784 | |
| | 8,700,000 | | | IL Health Facilities Authority | | | 6.900 | | | | 11/15/2033 | | | | 6,941,730 | |
| | 7,140,000 | | | Lake County, IL Special Service Area No. 83 | | | 7.125 | | | | 03/01/2037 | | | | 3,565,930 | |
| | 13,635,000 | | | Lombard, IL Public Facilities Corp. (Conference Center & Hotel)2 | | | 7.125 | | | | 01/01/2036 | | | | 6,537,983 | |
| | 4,000,000 | | | Manhattan, IL Special Service Area Special Tax (Groebe Farm-Stonegate)3 | | | 6.125 | | | | 03/01/2040 | | | | 720,680 | |
| | 2,950,000 | | | Manhattan, IL Special Service Area Special Tax (Groebe Farm-Stonegate)3 | | | 5.750 | | | | 03/01/2022 | | | | 531,502 | |
| | 1,778,000 | | | Manhattan, IL Special Service Area Special Tax (Lakeside Towns Liberty)3 | | | 5.750 | | | | 03/01/2022 | | | | 347,759 | |
| | 3,500,000 | | | Plano, IL Special Service Area No. 53 | | | 6.000 | | | | 03/01/2036 | | | | 2,074,485 | |
| | 4,520,000 | | | Quad Cities, IL Regional EDA (Heritage Woods Moline) | | | 6.000 | | | | 12/01/2041 | | | | 4,541,199 | |
| | 5,715,000 | | | Quad Cities, IL Regional EDA (Pheasant Ridge Apartments)6 | | | 6.375 | | | | 08/01/2040 | | | | 4,493,762 | |
| | 162 | | | Robbins, IL Res Rec (Robbins Res Rec Partners) | | | 7.250 | | | | 10/15/2024 | | | | 172 | |
| | 2,500,000 | | | Southwestern IL Devel. Authority (Comprehensive Mental Health Center) | | | 6.625 | | | | 06/01/2037 | | | | 2,545,850 | |
| | 1,500,000 | | | Southwestern IL Devel. Authority (Eden Retirement Center) | | | 5.850 | | | | 12/01/2036 | | | | 1,357,770 | |
| | 12,710,000 | | | Southwestern IL Devel. Authority (Local Government Programming) | | | 7.000 | | | | 10/01/2022 | | | | 10,668,647 | |
35 OPPENHEIMER ROCHESTER HIGH YIELD MUNICIPAL FUND
STATEMENT OF INVESTMENTS Continued
| | | | | | | | | | | | | | | | |
Principal Amount | | | | | Coupon | | | Maturity | | | Value | |
| Illinois (Continued) | | | | | | | | | | | | |
| | $4,925,000 | | | Southwestern IL Devel. Authority (Village of Sauget) | | | 5.625 | % | | | 11/01/2026 | | | $ | 4,545,824 | |
| | 13,165,000 | | | Southwestern IL Devel. Authority Solid Waste Disposal (Center Ethanol Company) | | | 8.250 | | | | 12/01/2019 | | | | 13,454,103 | |
| | 12,795,000 | | | Upper, IL River Valley Devel. Authority (DeerPath Huntley) | | | 6.500 | | | | 12/01/2032 | | | | 13,183,968 | |
| | 7,890,000 | | | Upper, IL River Valley Devel. Authority (Living Springs McHenry) | | | 6.100 | | | | 12/01/2041 | | | | 7,958,801 | |
| | 3,025,000 | | | Vernon Hills, IL Tax Increment (Town Center) | | | 6.250 | | | | 12/30/2026 | | | | 3,079,632 | |
| | 2,990,000 | | | Volo Village, IL Special Service Area (Lancaster Falls) | | | 5.750 | | | | 03/01/2036 | | | | 3,079,431 | |
| | 5,391,000 | | | Volo Village, IL Special Service Area (Remington Pointe) | | | 6.450 | | | | 03/01/2034 | | | | 5,393,642 | |
| | 1,900,000 | | | Will-Kankakee, IL Regional Devel. Authority (Senior Estates Supportive Living) | | | 7.000 | | | | 12/01/2042 | | | | 1,985,956 | |
| | 6,225,000 | | | Yorkville, IL United City Special Services Area Special Tax (Bristol Bay) | | | 5.875 | | | | 03/01/2036 | | | | 6,321,861 | |
| | | | | | | | | | | | | | | | |
| | | | | | | | | | | | | | | 363,982,078 | |
| | | | |
| | | | | | | | | | | | | | | | | |
| Indiana—1.0% | | | | | | | | | | | | |
| | 1,140,000 | | | Anderson, IN Multifamily Hsg. (Cross Lakes Apartments) | | | 9.000 | | | | 12/01/2045 | | | | 779,726 | |
| | 955,000 | | | Anderson, IN Multifamily Hsg. (Cross Lakes Apartments) | | | 8.000 | | | | 12/01/2045 | | | | 651,549 | |
| | 4,300,000 | | | Carmel, IN Redevel. District COP | | | 6.500 | | | | 07/15/2035 | | | | 4,698,481 | |
| | 5,805,000 | | | East Chicago, IN Solid Waste Disposal (USG Corp.) | | | 6.375 | | | | 08/01/2029 | | | | 5,817,423 | |
| | 1,000,000 | | | Hammond, IN Local Public Improvement District | | | 6.750 | | | | 08/15/2035 | | | | 1,002,720 | |
| | 600,000 | | | Hammond, IN Local Public Improvement District | | | 6.500 | | | | 08/15/2030 | | | | 601,530 | |
| | 2,850,000 | | | IN Finance Authority (BHI Senior Living) | | | 5.750 | | | | 11/15/2041 | | | | 3,074,580 | |
| | 1,675,000 | | | IN Finance Authority (BHI Senior Living) | | | 5.500 | | | | 11/15/2031 | | | | 1,802,283 | |
| | 11,505,000 | | | IN Finance Authority (Marian University) | | | 6.375 | | | | 09/15/2041 | | | | 12,650,668 | |
| | 925,000 | | | IN Finance Authority Educational Facilities (Irvington Community) | | | 9.000 | | | | 07/01/2039 | | | | 944,416 | |
| | 7,790,633 | | | North Manchester, IN Economic Devel. (Peabody Retirement Community)2 | | | 1.000 | | | | 12/01/2045 | | | | 153,397 | |
| | 9,119,085 | | | North Manchester, IN Economic Devel. (Peabody Retirement Community) | | | 6.050 | 7 | | | 12/01/2045 | | | | 5,700,522 | |
| | 6,145,000 | | | Shelbyville, IN Redevel. District Tax Increment (Central Shelbyville Economic) | | | 6.500 | | | | 07/01/2022 | | | | 6,713,904 | |
| | 230,000 | | | St. Joseph County, IN Economic Devel. (Holy Cross Village Notre Dame) | | | 5.550 | | | | 05/15/2019 | | | | 230,453 | |
| | 4,380,000 | | | Vincennes, IN Economic Devel. (Southwest Indiana Regional Youth Village) | | | 6.250 | | | | 01/01/2024 | | | | 3,896,930 | |
| | | | | | | | | | | | | | | | |
| | | | | | | | | | | | | | | 48,718,582 | |
| | | | |
| | | | | | | | | | | | | | | | | |
| Iowa—0.9% | | | | | | | | | | | | |
| | 940,000 | | | IA Finance Authority (Amity Fellowserve) | | | 6.375 | | | | 10/01/2026 | | | | 946,157 | |
| | 2,190,000 | | | IA Finance Authority (Amity Fellowserve) | | | 6.500 | | | | 10/01/2036 | | | | 2,202,001 | |
| | 690,000 | | | IA Finance Authority (Amity Fellowserve) | | | 6.000 | | | | 10/01/2028 | | | | 689,310 | |
| | 130,000 | | | IA Finance Authority (Amity Fellowserve) | | | 5.900 | | | | 10/01/2016 | | | | 131,101 | |
36 OPPENHEIMER ROCHESTER HIGH YIELD MUNICIPAL FUND
| | | | | | | | | | | | | | | | |
Principal Amount | | | | | Coupon | | | Maturity | | | Value | |
| Iowa (Continued) | | | | | | | | | | | | |
| | $1,160,000 | | | IA Finance Authority (Boys & Girls Home and Family Services)3 | | | 5.900 | % | | | 12/01/2028 | | | $ | 382,568 | |
| | 970,000 | | | IA Finance Authority Senior Hsg. (Wedum Walnut Ridge) | | | 5.375 | | | | 06/01/2025 | | | | 890,499 | |
| | 360,990,000 | | | IA Tobacco Settlement Authority | | | 7.125 | 4 | | | 06/01/2046 | | | | 8,732,348 | |
| | 25,230,000 | | | IA Tobacco Settlement Authority | | | 5.500 | | | | 06/01/2042 | | | | 22,086,847 | |
| | 10,000,000 | | | IA Tobacco Settlement Authority (TASC) | | | 5.625 | | | | 06/01/2046 | | | | 8,780,400 | |
| | | | | | | | | | | | | | | | |
| | | | | | | | | | | | | | | 44,841,231 | |
| | | | |
| | | | | | | | | | | | | | | | | |
| Kansas—0.0% | | | | | | | | | | | | |
| | 675,000 | | | Lenexa, KS Multifamily Hsg. (Meadows Apartments) | | | 7.950 | | | | 10/15/2035 | | | | 675,729 | |
| | 15,000 | | | Olathe, KS Senior Living Facility (Catholic Care Campus) | | | 6.000 | | | | 11/15/2038 | | | | 15,132 | |
| | 3,782,108 | | | Olathe, KS Tax Increment (Gateway)2 | | | 5.000 | | | | 03/01/2026 | | | | 1,513,108 | |
| | | | | | | | | | | | | | | | |
| | | | | | | | | | | | | | | 2,203,969 | |
| | | | |
| | | | | | | | | | | | | | | | | |
| Kentucky—0.4% | | | | | | | | | | | | |
| | 2,075,000 | | | Kuttawa, KY (1st Mtg.-GF/Kentucky) | | | 6.750 | | | | 03/01/2029 | | | | 2,078,465 | |
| | 14,000,000 | | | KY EDFA (Baptist Healthcare System)5 | | | 5.375 | | | | 08/15/2024 | | | | 15,370,880 | |
| | 1,000,000 | | | KY EDFA (Masonic Home Independent Living II) | | | 7.375 | | | | 05/15/2046 | | | | 1,133,780 | |
| | 1,250,000 | | | KY EDFA (Masonic Home Independent Living II) | | | 7.250 | | | | 05/15/2041 | | | | 1,411,813 | |
| | | | | | | | | | | | | | | | |
| | | | | | | | | | | | | | | 19,994,938 | |
| | | | |
| | | | | | | | | | | | | | | | | |
| Louisiana—0.4% | | | | | | | | | | | | |
| | 1,200,000 | | | Juban Park, LA Community Devel. District Special Assessment3 | | | 5.150 | | | | 10/01/2014 | | | | 241,404 | |
| | 11,415,000 | | | LA HFA (La Chateau) | | | 7.250 | | | | 09/01/2039 | | | | 12,453,537 | |
| | 5,350,000 | | | LA Public Facilities Authority (Progressive Healthcare)2 | | | 6.375 | | | | 10/01/2028 | | | | 2,112,073 | |
| | 555,000 | | | LA Public Facilities Authority (Progressive Healthcare)3 | | | 6.375 | | | | 10/01/2020 | | | | 219,103 | |
| | 7,400,000 | | | Lakeshore Villages, LA Master Community Devel. District2 | | | 5.250 | | | | 07/01/2017 | | | | 2,591,258 | |
| | | | | | | | | | | | | | | | |
| | | | | | | | | | | | | | | 17,617,375 | |
| | | | |
| | | | | | | | | | | | | | | | | |
| Maine—0.4% | | | | | | | | | | | | |
| | 2,000,000 | | | ME H&HEFA (Maine General Medical Center) | | | 6.750 | | | | 07/01/2041 | | | | 2,271,360 | |
| | 4,800,000 | | | Rumford, ME Pollution Control (Boise Cascade Corp.) | | | 6.625 | | | | 07/01/2020 | | | | 4,819,488 | |
| | 12,265,000 | | | Rumford, ME Solid Waste Disposal (Boise Cascade Corp.) | | | 6.875 | | | | 10/01/2026 | | | | 12,314,796 | |
| | | | | | | | | | | | | | | | |
| | | | | | | | | | | | | | | 19,405,644 | |
| | | | |
| | | | | | | | | | | | | | | | | |
| Maryland—0.0% | | | | | | | | | | | | |
| | 2,250,000 | | | Salisbury, MD Special Obligation (Villages at Salisbury Lake)3 | | | 0.000 | 4 | | | 01/01/2037 | | | | 675,113 | |
| | | | |
| | | | | | | | | | | | | | | | | |
| Massachusetts—1.4% | | | | | | | | | | | | |
| | 6,905,000 | | | MA Devel. Finance Agency (Lasell College) | | | 6.000 | | | | 07/01/2041 | | | | 7,749,550 | |
| | 321,825 | | | MA Devel. Finance Agency (Linden Ponds) | | | 5.500 | | | | 11/15/2046 | | | | 275,936 | |
| | 1,600,702 | | | MA Devel. Finance Agency (Linden Ponds) | | | 0.965 | 4 | | | 11/15/2056 | | | | 9,396 | |
37 OPPENHEIMER ROCHESTER HIGH YIELD MUNICIPAL FUND
STATEMENT OF INVESTMENTS Continued
| | | | | | | | | | | | | | | | |
Principal Amount | | | | | Coupon | | | Maturity | | | Value | |
| Massachusetts (Continued) | | | | | | | | | | | | |
| | $2,057,748 | | | MA Devel. Finance Agency (Linden Ponds) | | | 6.250 | % | | | 11/15/2039 | | | $ | 1,975,705 | |
| | 6,062,305 | | | MA Devel. Finance Agency (Linden Ponds) | | | 6.250 | | | | 11/15/2046 | | | | 5,797,625 | |
| | 685,000 | | | MA Devel. Finance Agency (Linden Ponds) | | | 6.250 | | | | 11/15/2018 | | | | 683,212 | |
| | 210,443 | | | MA Devel. Finance Agency (Northern Berkshire Healthcare)2 | | | 3.184 | 4 | | | 02/15/2043 | | | | 10,474 | |
| | 365,340 | | | MA Devel. Finance Agency (Northern Berkshire Healthcare)2 | | | 0.000 | 1 | | | 02/15/2043 | | | | 18,183 | |
| | 318,761 | | | MA Devel. Finance Agency (Northern Berkshire Healthcare)3 | | | 6.000 | | | | 02/15/2043 | | | | 15,865 | |
| | 1,000,000 | | | MA Devel. Finance Agency (VOA Concord) | | | 5.200 | | | | 11/01/2041 | | | | 979,160 | |
| | 11,710,000 | | | MA Educational Financing Authority, Series H5 | | | 6.350 | | | | 01/01/2030 | | | | 12,876,952 | |
| | 9,980,000 | | | MA HFA, Series A5 | | | 5.300 | | | | 06/01/2049 | | | | 10,140,163 | |
| | 8,015,000 | | | MA HFA, Series C5 | | | 5.400 | | | | 12/01/2049 | | | | 8,109,634 | |
| | 17,790,000 | | | MA HFA, Series C5 | | | 5.350 | | | | 12/01/2042 | | | | 18,409,270 | |
| | 220,000 | | | MA Industrial Finance Agency (Cambridge Friends School) | | | 5.800 | | | | 09/01/2028 | | | | 220,141 | |
| | 50,000 | | | MA Port Authority (Delta Air Lines) | | | 5.000 | | | | 01/01/2027 | | | | 50,154 | |
| | | | | | | | | | | | | | | | |
| | | | | | | | | | | | | | | 67,321,420 | |
| | | | |
| | | | | | | | | | | | | | | | | |
| Michigan—3.1% | | | | | | | | | | | | |
| | 4,140,000 | | | Charyl Stockwell Academy, MI Public School Academy | | | 5.750 | | | | 10/01/2045 | | | | 3,913,625 | |
| | 2,740,000 | | | Charyl Stockwell Academy, MI Public School Academy | | | 5.500 | | | | 10/01/2035 | | | | 2,608,398 | |
| | 10,100,000 | | | Detroit, MI City School District5 | | | 6.000 | | | | 05/01/2029 | | | | 12,090,306 | |
| | 906,750 | | | Detroit, MI GO | | | 5.000 | | | | 04/01/2021 | | | | 903,377 | |
| | 350,300 | | | Detroit, MI GO | | | 5.250 | | | | 04/01/2020 | | | | 350,345 | |
| | 54,250 | | | Detroit, MI GO | | | 5.250 | | | | 04/01/2017 | | | | 54,337 | |
| | 206,150 | | | Detroit, MI GO | | | 5.250 | | | | 04/01/2022 | | | | 200,881 | |
| | 250,000 | | | Detroit, MI GO | | | 5.250 | | | | 11/01/2035 | | | | 267,827 | |
| | 803,643 | | | Detroit, MI GO | | | 5.000 | | | | 04/01/2020 | | | | 790,962 | |
| | 155,000 | | | Detroit, MI GO | | | 5.250 | | | | 04/01/2020 | | | | 154,135 | |
| | 15,500 | | | Detroit, MI GO | | | 5.250 | | | | 04/01/2023 | | | | 15,448 | |
| | 342,550 | | | Detroit, MI GO | | | 5.250 | | | | 04/01/2021 | | | | 342,564 | |
| | 2,150,000 | | | Detroit, MI Local Devel. Finance Authority | | | 6.700 | | | | 05/01/2021 | | | | 2,150,967 | |
| | 1,355,000 | | | Detroit, MI Local Devel. Finance Authority | | | 6.850 | | | | 05/01/2021 | | | | 1,355,881 | |
| | 20,000 | | | Detroit, MI Water Supply System | | | 5.000 | | | | 07/01/2034 | | | | 20,065 | |
| | 200,000 | | | Detroit, MI Water Supply System | | | 5.000 | | | | 07/01/2034 | | | | 200,654 | |
| | 425,000 | | | Macomb, MI Public Academy | | | 6.750 | | | | 05/01/2037 | | | | 428,149 | |
| | 4,943,250 | | | MI Finance Authority (City of Detroit) | | | 5.000 | | | | 04/01/2021 | | | | 4,924,861 | |
| | 1,123,850 | | | MI Finance Authority (City of Detroit) | | | 5.250 | | | | 04/01/2022 | | | | 1,108,566 | |
| | 295,750 | | | MI Finance Authority (City of Detroit) | | | 5.250 | | | | 04/01/2017 | | | | 296,226 | |
| | 1,909,700 | | | MI Finance Authority (City of Detroit) | | | 5.250 | | | | 04/01/2020 | | | | 1,909,948 | |
| | 845,000 | | | MI Finance Authority (City of Detroit) | | | 5.250 | | | | 04/01/2020 | | | | 842,482 | |
| | 1,867,450 | | | MI Finance Authority (City of Detroit) | | | 5.250 | | | | 04/01/2021 | | | | 1,861,624 | |
| | 84,500 | | | MI Finance Authority (City of Detroit) | | | 5.250 | | | | 04/01/2023 | | | | 84,214 | |
| | 1,400,000 | | | MI Finance Authority (Old Redford Public School Academy) | | | 5.900 | | | | 12/01/2030 | | | | 1,407,868 | |
| | 2,590,000 | | | MI Hospital Finance Authority (Oakwood Obligated Group) | | | 5.000 | | | | 07/15/2037 | | | | 2,808,311 | |
38 OPPENHEIMER ROCHESTER HIGH YIELD MUNICIPAL FUND
| | | | | | | | | | | | | | | | |
Principal
Amount | | | | | Coupon | | | Maturity | | | Value | |
| Michigan (Continued) | | | | | | | | | | | | |
| | $840,000 | | | MI Public Educational Facilities Authority (American Montessori) | | | 6.500 | % | | | 12/01/2037 | | | $ | 853,306 | |
| | 1,400,000 | | | MI Public Educational Facilities Authority (Old Redford Academy) | | | 6.000 | | | | 12/01/2035 | | | | 1,400,140 | |
| | 1,248,750 | | | MI Strategic Fund Limited Obligation (Wolverine Human Services) | | | 7.875 | | | | 08/31/2028 | | | | 1,283,678 | |
| | 3,150,000 | | | MI Strategic Fund Solid Waste (Genesee Power Station) | | | 7.500 | | | | 01/01/2021 | | | | 3,104,923 | |
| | 344,990,000 | | | MI Tobacco Settlement Finance Authority | | | 7.305 | 4 | | | 06/01/2052 | | | | 6,675,556 | |
| | 3,048,780,000 | | | MI Tobacco Settlement Finance Authority | | | 8.877 | 4 | | | 06/01/2058 | | | | 13,628,047 | |
| | 1,625,000 | | | Pontiac, MI City School District | | | 4.500 | | | | 05/01/2020 | | | | 1,459,835 | |
| | 52,930,000 | | | Wayne County, MI Airport Authority (Detroit MetroWayne Airport)5 | | | 5.000 | | | | 12/01/2029 | | | | 53,576,193 | |
| | 10,000,000 | | | Wayne County, MI Airport Authority (Detroit MetroWayne Airport)5 | | | 5.000 | | | | 12/01/2034 | | | | 10,122,595 | |
| | 5,223,000 | | | Wayne County, MI GO6 | | | 2.187 | 7 | | | 12/01/2016 | | | | 5,164,816 | |
| | 13,925,000 | | | Wayne, MI Charter County Airport Facilities (Northwest Airlines) | | | 6.000 | | | | 12/01/2029 | | | | 13,956,192 | |
| | | | | | | | | | | | | | | | |
| | | | | | | | | | | | | | | 152,317,302 | |
| | | | |
| | | | | | | | | | | | | | | | | |
| Minnesota—0.7% | | | | | | | | | | | | |
| | 2,830,000 | | | Eveleth, MN Multifamily (Manor House Woodland) | | | 5.700 | | | | 10/01/2036 | | | | 2,140,357 | |
| | 1,510,000 | | | Eveleth, MN Multifamily (Manor House Woodland) | | | 5.500 | | | | 10/01/2025 | | | | 1,261,620 | |
| | 6,370,000 | | | International Falls, MN Solid Waste Disposal (Boise Cascade Corp.) | | | 6.850 | | | | 12/01/2029 | | | | 6,395,862 | |
| | 5,340,000 | | | Minneapolis, MN Multifamily Hsg. (Blaisdell Apartments) | | | 5.500 | | | | 04/01/2042 | | | | 5,130,458 | |
| | 730,000 | | | Minneapolis, MN Multifamily Hsg. (Blaisdell Apartments) | | | 5.400 | | | | 04/01/2028 | | | | 721,773 | |
| | 1,000,000 | | | Minneapolis, MN Senior Hsg. & Healthcare Revenue | | | 5.250 | | | | 11/01/2045 | | | | 1,004,020 | |
| | 975,000 | | | Minneapolis, MN Tax Increment (Ivy Tower) | | | 5.700 | | | | 02/01/2029 | | | | 954,895 | |
| | 500,000 | | | Minneapolis, MN Tax Increment (Ivy Tower) | | | 5.500 | | | | 02/01/2022 | | | | 496,515 | |
| | 2,100,000 | | | Northwest MN Multi-County Hsg. & Redevel. Authority | | | 5.450 | | | | 07/01/2041 | | | | 2,100,252 | |
| | 830,000 | | | St. Anthony, MN Hsg. & Redevel. Authority (Silver Lake Village) | | | 5.375 | | | | 08/01/2021 | | | | 846,974 | |
| | 790,000 | | | St. Anthony, MN Hsg. & Redevel. Authority (Silver Lake Village) | | | 5.625 | | | | 02/01/2031 | | | | 803,351 | |
| | 1,585,000 | | | St. Paul, MN Hsg. & Redevel. Authority (Bridgecreek Senior Place) | | | 7.000 | | | | 09/15/2037 | | | | 1,586,046 | |
| | 1,694,956 | | | St. Paul, MN Hsg. & Redevel. Authority (Episcopal Nursing Home) | | | 5.630 | | | | 10/01/2033 | | | | 1,726,295 | |
| | 2,705,000 | | | St. Paul, MN Hsg. & Redevel. Authority (Great Northern Lofts) | | | 6.250 | | | | 03/01/2029 | | | | 2,734,403 | |
| | 400,000 | | | St. Paul, MN Hsg. & Redevel. Authority (Hmong Academy) | | | 5.750 | | | | 09/01/2026 | | | | 404,980 | |
| | 650,000 | | | St. Paul, MN Hsg. & Redevel. Authority (Hmong Academy) | | | 6.000 | | | | 09/01/2036 | | | | 658,210 | |
39 OPPENHEIMER ROCHESTER HIGH YIELD MUNICIPAL FUND
STATEMENT OF INVESTMENTS Continued
| | | | | | | | | | | | | | | | |
Principal
Amount | | | | | Coupon | | | Maturity | | | Value | |
| Minnesota (Continued) | | | | | | | | | | | | |
| | $2,305,000 | | | St. Paul, MN Hsg. & Redevel. Authority Charter School (Hmong College Prep Academy) | | | 5.500 | % | | | 09/01/2043 | | | $ | 2,396,094 | |
| | 600,000 | | | St. Paul, MN Port Authority (Great Northern) | | | 6.000 | | | | 03/01/2030 | | | | 604,980 | |
| | 466,906 | | | St. Paul, MN Port Authority Parking Revenue (4th Parking Ramp)3 | | | 8.000 | | | | 12/01/2027 | | | | 140,016 | |
| | 725,000 | | | Wadena, MN Hsg. & Redevel. Authority (Humphrey Manor East) | | | 6.000 | | | | 02/01/2019 | | | | 671,002 | |
| | | | | | | | | | | | | | | | |
| | | | | | | | | | | | | | | 32,778,103 | |
| | | | |
| | | | | | | | | | | | | | | | | |
| Mississippi—0.2% | | | | | | | | | | | | |
| | 2,395,000 | | | Meridian, MS Tax Increment (Meridian Crossroads) | | | 8.750 | | | | 12/01/2024 | | | | 2,657,324 | |
| | 3,885,000 | | | MS Business Finance Corp. (Intrinergy Wiggins)2 | | | 8.000 | | | | 01/01/2023 | | | | 2,524,085 | |
| | 1,755,000 | | | Ridgeland, MS Tax Increment (Colony Park) | | | 5.375 | | | | 10/01/2028 | | | | 1,864,143 | |
| | 1,395,000 | | | Ridgeland, MS Tax Increment (Colony Park) | | | 5.250 | | | | 10/01/2027 | | | | 1,476,747 | |
| | 16,410,000 | | | Stonebridge, MS Public Improvement District Special Assessment3 | | | 7.500 | | | | 10/01/2042 | | | | 2,298,385 | |
| | | | | | | | | | | | | | | | |
| | | | | | | | | | | | | | | 10,820,684 | |
| | | | |
| | | | | | | | | | | | | | | | | |
| Missouri—1.5% | | | | | | | | | | | | |
| | 400,000 | | | Belton, MO Tax Increment (Belton Town Center) | | | 5.625 | | | | 03/01/2025 | | | | 411,872 | |
| | 250,000 | | | Belton, MO Tax Increment (Belton Town Center) | | | 5.500 | | | | 03/01/2020 | | | | 257,240 | |
| | 730,000 | | | Branson Hills, MO Infrastructure Facilities | | | 5.500 | | | | 04/01/2022 | | | | 440,102 | |
| | 750,000 | | | Branson Hills, MO Infrastructure Facilities | | | 5.500 | | | | 04/01/2027 | | | | 451,815 | |
| | 500,000 | | | Branson Hills, MO Infrastructure Facilities | | | 5.000 | | | | 04/01/2017 | | | | 303,555 | |
| | 500,000 | | | Branson Hills, MO Infrastructure Facilities | | | 5.000 | | | | 04/01/2016 | | | | 308,505 | |
| | 4,900,000 | | | Branson, MO Commerce Park Community Improvement District2 | | | 5.750 | | | | 06/01/2026 | | | | 1,225,147 | |
| | 2,485,000 | | | Branson, MO IDA (Branson Hills Redevel.) | | | 5.750 | | | | 05/01/2026 | | | | 2,509,303 | |
| | 13,000,000 | | | Branson, MO IDA (Branson Hills Redevel.) | | | 7.050 | | | | 05/01/2027 | | | | 13,009,880 | |
| | 1,050,000 | | | Branson, MO IDA (Branson Landing) | | | 5.250 | | | | 06/01/2021 | | | | 1,050,462 | |
| | 2,470,000 | | | Branson, MO IDA (Branson Landing) | | | 5.500 | | | | 06/01/2029 | | | | 2,469,778 | |
| | 21,700,000 | | | Branson, MO IDA (Branson Shoppe Redevel.) | | | 5.950 | | | | 11/01/2029 | | | | 21,972,335 | |
| | 570,000 | | | Broadway-Fairview, MO Transportation Devel. District (Columbia) | | | 6.125 | | | | 12/01/2036 | | | | 451,993 | |
| | 3,100,000 | | | Chillicothe, MO Tax Increment (South U.S. 65) | | | 5.625 | | | | 04/01/2027 | | | | 2,230,946 | |
| | 1,215,000 | | | Chillicothe, MO Tax Increment (South U.S. 65) | | | 5.500 | | | | 04/01/2021 | | | | 979,411 | |
| | 1,250,000 | | | Jennings, MO Tax Increment & Community Improvement (Northland Redevel. Area) | | | 5.000 | | | | 11/01/2023 | | | | 1,250,462 | |
| | 1,219,000 | | | Kansas City, MO IDA (West Paseo) | | | 6.750 | | | | 07/01/2036 | | | | 1,220,938 | |
| | 1,400,000 | | | Kansas City, MO Tax Increment (Shoal Creek Parkway) | | | 6.500 | | | | 06/01/2025 | | | | 1,412,264 | |
| | 750,000 | | | Lees Summit, MO IDA (Kensington Farms) | | | 5.750 | | | | 03/01/2029 | | | | 727,357 | |
| | 1,200,000 | | | Lees Summit, MO IDA (Kensington Farms) | | | 5.500 | | | | 03/01/2021 | | | | 1,191,096 | |
| | 2,800,000 | | | Lees Summit, MO Tax (Summit Fair Community Improvement District) | | | 6.000 | | | | 05/01/2042 | | | | 2,898,504 | |
| | 2,310,000 | | | Liberty, MO Tax Increment (Liberty Triangle) | | | 5.875 | | | | 10/01/2029 | | | | 2,358,672 | |
| | 3,020,000 | | | MO Dardenne Town Square Transportation Devel. District2 | | | 5.000 | | | | 05/01/2026 | | | | 1,409,404 | |
| | 3,825,000 | | | MO Dardenne Town Square Transportation Devel. District2 | | | 5.000 | | | | 05/01/2036 | | | | 1,546,906 | |
40 OPPENHEIMER ROCHESTER HIGH YIELD MUNICIPAL FUND
| | | | | | | | | | | | | | | | |
Principal Amount | | | | | Coupon | | | Maturity | | | Value | |
| Missouri (Continued) | | | | | | | | | | | | |
| | $220,000 | | | MO Grindstone Plaza Transportation Devel. District | | | 5.250 | % | | | 10/01/2021 | | | $ | 212,672 | |
| | 400,000 | | | MO Grindstone Plaza Transportation Devel. District | | | 5.400 | | | | 10/01/2026 | | | | 370,800 | |
| | 115,000 | | | MO Grindstone Plaza Transportation Devel. District | | | 5.550 | | | | 10/01/2036 | | | | 99,932 | |
| | 709,000 | | | Northwoods, MO Transportation Devel. District6 | | | 5.850 | | | | 02/01/2031 | | | | 650,160 | |
| | 4,580,000 | | | St. Louis, MO IDA (Railway Exchange Building Redevel.)3 | | | 8.000 | | | | 04/27/2033 | | | | 1,592,283 | |
| | 2,442,000 | | | St. Louis, MO Tax Increment (1601 Washington Redevel.) | | | 6.000 | | | | 08/21/2026 | | | | 1,557,215 | |
| | 2,034,000 | | | St. Louis, MO Tax Increment (Pet Building Redevel.) | | | 5.500 | | | | 05/29/2028 | | | | 1,320,025 | |
| | 1,660,000 | | | St. Louis, MO Tax Increment (Printers Lofts)2 | | | 6.000 | | | | 08/21/2026 | | | | 790,210 | |
| | 3,043,000 | | | St. Louis, MO Tax Increment (Security Building Redevel.)2 | | | 6.300 | | | | 04/01/2027 | | | | 1,472,812 | |
| | 1,510,000 | | | St. Louis, MO Tax Increment (Washington East Condominiums)3 | | | 5.500 | | | | 01/20/2028 | | | | 1,028,250 | |
| | 2,367,000 | | | St. Louis, MO Tax Increment (Washington East Condominiums) | | | 5.500 | | | | 01/20/2028 | | | | 1,908,914 | |
| | 1,108,000 | | | St. Louis, MO Tax Increment Financing, Series A | | | 5.500 | | | | 09/02/2028 | | | | 699,636 | |
| | 975,000 | | | Stone Canyon, MO Improvement District (Infrastructure)3 | | | 5.750 | | | | 04/01/2027 | | | | 297,424 | |
| | 1,865,000 | | | Stone Canyon, MO Improvement District (Infrastructure)3 | | | 5.700 | | | | 04/01/2022 | | | | 568,918 | |
| | 595,000 | | | Suemandy, MO Mid-Rivers Community Improvement District | | | 7.500 | | | | 10/01/2029 | | | | 646,426 | |
| | | | | | | | | | | | | | | | |
| | | | | | | | | | | | | | | 75,303,624 | |
| | | | |
| | | | | | | | | | | | | | | | | |
| Montana—0.1% | | | | | | | | | | | | |
| | 5,935,000 | | | Hardin, MT Tax Increment Industrial Infrastructure Devel. (Rocky Mountain Power) | | | 6.250 | 1 | | | 09/01/2031 | | | | 4,429,943 | |
| | 1,650,000 | | | MT Facilities Finance Authority (St. John’s Lutheran) | | | 6.125 | | | | 05/15/2036 | | | | 1,679,552 | |
| | 1,125,000 | | | MT Facilities Finance Authority (St. John’s Lutheran) | | | 6.000 | | | | 05/15/2025 | | | | 1,150,076 | |
| | | | | | | | | | | | | | | | |
| | | | | | | | | | | | | | | 7,259,571 | |
| | | | |
| | | | | | | | | | | | | | | | | |
| Nebraska—0.7% | | | | | | | | | | | | |
| | 865,000 | | | Beatrice, NE Community Redevel. Authority (Beatrice Biodiesel) | | | 6.625 | | | | 12/01/2021 | | | | 840,797 | |
| | 20,000,000 | | | Douglas County, NE Hospital Authority (Methodist Health System)5 | | | 5.750 | | | | 11/01/2048 | | | | 22,973,160 | |
| | 2,400,000 | | | NE Educational Facilities Authority (Midland Lutheran College) | | | 5.600 | | | | 09/15/2029 | | | | 2,293,848 | |
| | 6,960,000 | | | Santee Sioux Nation, NE Tribal Health Care (Indian Health Service) | | | 8.750 | | | | 10/01/2020 | | | | 7,001,830 | |
| | | | | | | | | | | | | | | | |
| | | | | | | | | | | | | | | 33,109,635 | |
| | | | |
| | | | | | | | | | | | | | | | | |
| Nevada—0.3% | | | | | | | | | | | | |
| | 770,000 | | | Clark County, NV Improvement District | | | 5.050 | | | | 02/01/2031 | | | | 739,369 | |
41 OPPENHEIMER ROCHESTER HIGH YIELD MUNICIPAL FUND
STATEMENT OF INVESTMENTS Continued
| | | | | | | | | | | | | | | | |
Principal
Amount | | | | | Coupon | | | Maturity | | | Value | |
| Nevada (Continued) | | | | | | | | | | | | |
| | $1,000,000 | | | Clark County, NV Improvement District | | | 5.000 | % | | | 02/01/2026 | | | $ | 977,650 | |
| | 8,000,000 | | | Las Vegas, NV Valley Water District | | | 5.000 | | | | 06/01/2039 | | | | 8,981,920 | |
| | 400,000 | | | Mesquite, NV Special Improvement District (Canyon Creek)6 | | | 5.500 | | | | 08/01/2025 | | | | 354,724 | |
| | 110,000 | | | Mesquite, NV Special Improvement District (Canyon Creek) | | | 5.400 | | | | 08/01/2020 | | | | 105,424 | |
| | 1,590,000 | | | Mesquite, NV Special Improvement District No. 07-01 (Anthem at Mesquite)6 | | | 6.150 | | | | 08/01/2037 | | | | 1,613,612 | |
| | | | | | | | | | | | | | | | |
| | | | | | | | | | | | | | | 12,772,699 | |
| | | | |
| | | | | | | | | | | | | | | | | |
| New Hampshire—0.1% | | | | | | | | | | | | |
| | 1,445,000 | | | NH Business Finance Authority (Huggins Hospital) | | | 6.875 | | | | 10/01/2039 | | | | 1,544,517 | |
| | 4,620,000 | | | NH H&EFA (Franklin Pierce College) | | | 6.050 | | | | 10/01/2034 | | | | 4,279,275 | |
| | 515,000 | | | NH HE&HFA (Franklin Pierce College) | | | 5.300 | | | | 10/01/2028 | | | | 459,988 | |
| | | | | | | | | | | | | | | | |
| | | | | | | | | | | | | | | 6,283,780 | |
| | | | |
| | | | | | | | | | | | | | | | | |
| New Jersey—6.4% | | | | | | | | | | | | |
| | 3,583,000 | | | Newark, NJ GO | | | 5.000 | | | | 07/15/2029 | | | | 3,757,671 | |
| | 115,000 | | | NJ EDA (Cadbury at Cherry Hill) | | | 5.500 | | | | 07/01/2018 | | | | 113,175 | |
| | 170,000 | | | NJ EDA (Continental Airlines) | | | 4.875 | | | | 09/15/2019 | | | | 178,175 | |
| | 3,750,000 | | | NJ EDA (Continental Airlines) | | | 5.625 | | | | 11/15/2030 | | | | 4,191,375 | |
| | 7,385,000 | | | NJ EDA (Engel Burman at Woodcliff Lake) | | | 8.000 | | | | 05/01/2044 | | | | 8,001,352 | |
| | 7,405,000 | | | NJ EDA (Engel Burman at Woodcliff Lake) | | | 8.000 | | | | 05/01/2044 | | | | 8,023,021 | |
| | 7,405,000 | | | NJ EDA (Engel Burman at Woodcliff Lake) | | | 8.000 | | | | 05/01/2044 | | | | 8,023,021 | |
| | 11,000,000 | | | NJ EDA (GMT Realty) | | | 6.875 | | | | 01/01/2037 | | | | 11,041,690 | |
| | 565,000 | | | NJ EDA (Leap Academy Charter School) | | | 6.000 | | | | 10/01/2034 | | | | 580,572 | |
| | 750,000 | | | NJ EDA (Leap Academy Charter School) | | | 6.200 | | | | 10/01/2044 | | | | 769,418 | |
| | 500,000 | | | NJ EDA (Leap Academy Charter School) | | | 6.300 | | | | 10/01/2049 | | | | 512,855 | |
| | 1,000,000 | | | NJ EDA (Paterson Charter School Science & Technology) | | | 6.100 | | | | 07/01/2044 | | | | 998,590 | |
| | 8,020,000 | | | NJ Health Care Facilities Financing Authority (Raritan Bay Medical Center) | | | 7.250 | | | | 07/01/2027 | | | | 8,030,506 | |
| | 96,125,000 | | | NJ Tobacco Settlement Financing Corp.5 | | | 5.000 | | | | 06/01/2029 | | | | 81,281,138 | |
| | 85,700,000 | | | NJ Tobacco Settlement Financing Corp. | | | 5.000 | | | | 06/01/2041 | | | | 64,678,647 | |
| | 154,950,000 | | | NJ Tobacco Settlement Financing Corp. | | | 4.750 | | | | 06/01/2034 | | | | 115,761,596 | |
| | 210,000 | | | Weehawken Township, NJ GO | | | 6.000 | | | | 08/01/2021 | | | | 245,351 | |
| | 210,000 | | | Weehawken Township, NJ GO | | | 6.000 | | | | 08/01/2022 | | | | 243,046 | |
| | | | | | | | | | | | | | | | |
| | | | | | | | | | | | | | | 316,431,199 | |
| | | | |
| | | | | | | | | | | | | | | | | |
| New Mexico—0.2% | | | | | | | | | | | | |
| | 615,000 | | | Boulders, NM Pubic Improvement District | | | 5.750 | | | | 10/01/2044 | | | | 618,235 | |
| | 97,000 | | | Dona Ana County, NM Multifamily (Montana Meadows Apartments) | | | 8.500 | | | | 12/01/2015 | | | | 97,069 | |
| | 420,000 | | | Mariposa East, NM Public Improvement District | | | 0.000 | 1 | | | 09/01/2032 | | | | 371,456 | |
| | 560,000 | | | Mariposa East, NM Public Improvement District | | | 5.900 | | | | 09/01/2032 | | | | 470,663 | |
| | 500,000 | | | Mariposa East, NM Public Improvement District | | | 12.495 | 4 | | | 09/01/2032 | | | | 59,975 | |
| | 90,000 | | | Mariposa East, NM Public Improvement District | | | 5.900 | | | | 09/01/2032 | | | | 88,946 | |
| | 875,000 | | | Montecito Estates, NM Public Improvement District | | | 7.000 | | | | 10/01/2037 | | | | 897,024 | |
42 OPPENHEIMER ROCHESTER HIGH YIELD MUNICIPAL FUND
| | | | | | | | | | | | | | | | |
Principal Amount | | | | | Coupon | | | Maturity | | | Value | |
| New Mexico (Continued) | | | | | | | | | | | | |
| | $129,000 | | | NM Regional Hsg. Authority (Wildewood Apartments) | | | 8.750 | % | | | 12/01/2020 | | | $ | 129,054 | |
| | 1,925,000 | | | NM Trails Public Improvement District | | | 7.750 | | | | 10/01/2038 | | | | 1,887,597 | |
| | 4,490,000 | | | Saltillo, NM Improvement District | | | 7.625 | | | | 10/01/2037 | | | | 4,642,885 | |
| | 1,000,000 | | | Ventana West, NM Public Improvement District Special Levy | | | 6.875 | | | | 08/01/2033 | | | | 1,001,340 | |
| | | | | | | | | | | | | | | | |
| | | | | | | | | | | | | | | 10,264,244 | |
| | | | |
| | | | | | | | | | | | | | | | | |
| New York—9.3% | | | | | | | | | | | | |
| | 14,980,000 | | | Brookhaven, NY IDA (BK at Lake Grove) | | | 7.750 | 7 | | | 11/01/2046 | | | | 16,171,509 | |
| | 10,000,000 | | | Brookhaven, NY IDA (BK at Lake Grove) | | | 7.750 | 7 | | | 11/01/2046 | | | | 10,795,400 | |
| | 15,015,000 | | | Brookhaven, NY IDA (BK at Lake Grove) | | | 7.750 | 7 | | | 11/01/2046 | | | | 16,218,602 | |
| | 1,010,000 | | | Erie County, NY Tobacco Asset Securitization Corp. | | | 5.000 | | | | 06/01/2045 | | | | 941,472 | |
| | 17,700,000 | | | Erie County, NY Tobacco Asset Securitization Corp. | | | 6.656 | 4 | | | 06/01/2055 | | | | 137,529 | |
| | 9,345,000 | | | Islip, NY IDA (Engel Burman at Sayville) | | | 6.500 | 7 | | | 11/01/2045 | | | | 9,680,953 | |
| | 5,705,000 | | | Islip, NY IDA (Engel Burman at Sayville) | | | 6.500 | 7 | | | 11/01/2045 | | | | 5,910,095 | |
| | 1,500,000 | | | Islip, NY IDA (Engel Burman at Sayville) | | | 7.750 | 7 | | | 11/01/2045 | | | | 1,624,305 | |
| | 14,060,000 | | | Islip, NY IDA (Engel Burman at Sayville) | | | 6.500 | 7 | | | 11/01/2045 | | | | 14,565,457 | |
| | 1,000,000 | | | Monroe County, NY Industrial Devel. Corp. (St. John Fisher College) | | | 6.000 | | | | 06/01/2030 | | | | 1,120,180 | |
| | 3,560,000 | | | Nassau County, NY IDA (Amsterdam at Harborside) | | | 5.500 | | | | 07/01/2020 | | | | 3,558,291 | |
| | 2,100,000 | | | Nassau County, NY IDA (Amsterdam at Harborside) | | | 6.700 | | | | 01/01/2049 | | | | 2,074,989 | |
| | 1,780,000 | | | Nassau County, NY IDA (Amsterdam at Harborside) | | | 6.700 | | | | 01/01/2049 | | | | 1,758,800 | |
| | 2,937,408 | | | Nassau County, NY IDA (Amsterdam at Harborside)3 | | | 2.000 | | | | 01/01/2049 | | | | 161,264 | |
| | 750,000 | | | Nassau County, NY IDA (Amsterdam at Harborside) | | | 6.500 | | | | 01/01/2032 | | | | 750,510 | |
| | 13,050,000 | | | Nassau County, NY Tobacco Settlement Corp. | | | 5.250 | 1 | | | 06/01/2026 | | | | 12,811,446 | |
| | 1,895,000 | | | Nassau County, NY Tobacco Settlement Corp. | | | 5.125 | | | | 06/01/2046 | | | | 1,586,892 | |
| | 2,000,000 | | | Nassau County, NY Tobacco Settlement Corp. (TASC) | | | 5.000 | | | | 06/01/2035 | | | | 1,750,780 | |
| | 413,400,000 | | | NY Counties Tobacco Trust V | | | 7.848 | 4 | | | 06/01/2060 | | | | 1,554,384 | |
| | 412,100,000 | | | NY Counties Tobacco Trust V | | | 7.151 | 4 | | | 06/01/2060 | | | | 1,475,318 | |
| | 37,380,000 | | | NY Liberty Devel. Corp. (Bank of America Tower)5,9 | | | 5.125 | | | | 01/15/2044 | | | | 41,580,580 | |
| | 900,000 | | | NY MTA, Series D | | | 5.250 | | | | 11/15/2029 | | | | 1,054,800 | |
| | 560,000 | | | NY MTA, Series D | | | 5.250 | | | | 11/15/2028 | | | | 658,409 | |
| | 485,000 | | | NY MTA, Series D | | | 5.250 | | | | 11/15/2027 | | | | 572,635 | |
| | 900,000 | | | NY MTA, Series D | | | 5.250 | | | | 11/15/2030 | | | | 1,050,471 | |
| | 900,000 | | | NY MTA, Series D | | | 5.250 | | | | 11/15/2033 | | | | 1,037,601 | |
| | 900,000 | | | NY MTA, Series D | | | 5.250 | | | | 11/15/2032 | | | | 1,039,734 | |
| | 900,000 | | | NY MTA, Series D | | | 5.250 | | | | 11/15/2031 | | | | 1,046,160 | |
| | 1,500,000 | | | NY TSASC, Inc. (TFABs) | | | 5.125 | | | | 06/01/2042 | | | | 1,299,615 | |
| | 8,765,000 | | | NY/NJ Port Authority Austin Trust Inverse Certificates | | | 7.927 | 10 | | | 4/1/2036 | | | | 9,148,907 | |
| | 14,200,000 | | | NYC IDA (American Airlines) | | | 8.000 | | | | 08/01/2028 | | | | 15,209,336 | |
43 OPPENHEIMER ROCHESTER HIGH YIELD MUNICIPAL FUND
STATEMENT OF INVESTMENTS Continued
| | | | | | | | | | | | | | | | |
Principal Amount | | | | | Coupon | | | Maturity | | | Value | |
| New York (Continued) | | | | | | | | | | | | |
| | $40,000,000 | | | NYC IDA (American Airlines) | | | 7.750 | % | | | 08/01/2031 | | | $ | 42,639,200 | |
| | 59,000,000 | | | NYC IDA (American Airlines) | | | 7.625 | | | | 08/01/2025 | | | | 63,032,650 | |
| | 19,550,000 | | | NYC IDA (British Airways) | | | 7.625 | | | | 12/01/2032 | | | | 19,843,837 | |
| | 6,740,000 | | | NYC IDA (Brooklyn Navy Yard Cogeneration Partners) | | | 5.650 | | | | 10/01/2028 | | | | 5,584,966 | |
| | 5,480,000 | | | NYC IDA (Brooklyn Navy Yard Cogeneration Partners) | | | 5.750 | | | | 10/01/2036 | | | | 4,467,789 | |
| | 8,630,000 | | | NYC IDA (Brooklyn Navy Yard Cogeneration Partners) | | | 6.200 | | | | 10/01/2022 | | | | 8,182,276 | |
| | 12,955,000 | | | NYC Municipal Water Finance Authority5 | | | 5.750 | | | | 06/15/2040 | | | | 14,528,506 | |
| | 20,200,000 | | | NYS DA (St. Mary’s Hospital for Children) | | | 7.875 | | | | 11/15/2041 | | | | 21,814,788 | |
| | 26,750,000 | | | NYS Liberty Devel. Corp. (4 World Trade Center) | | | 5.750 | | | | 11/15/2051 | | | | 30,870,035 | |
| | 200,000 | | | Port Authority NY/NJ (JFK International Air Terminal) | | | 5.750 | | | | 12/01/2025 | | | | 200,586 | |
| | 2,700,000 | | | Port Authority NY/NJ (KIAC) | | | 6.750 | | | | 10/01/2019 | | | | 2,699,595 | |
| | 8,385,000 | | | Suffolk, NY Tobacco Asset Securitization Corp. | | | 6.000 | | | | 06/01/2048 | | | | 7,441,771 | |
| | 7,430,497 | | | Westchester County, NY IDA (EBC White Plains) | | | 8.000 | 7 | | | 11/01/2043 | | | | 8,134,834 | |
| | 7,430,459 | | | Westchester County, NY IDA (EBC White Plains) | | | 8.000 | 7 | | | 11/01/2043 | | | | 8,134,792 | |
| | 7,430,497 | | | Westchester County, NY IDA (EBC White Plains) | | | 8.000 | 7 | | | 11/01/2043 | | | | 8,134,834 | |
| | 9,795,000 | | | Westchester County, NY IDA (Engel Burman at Armonk) | | | 6.500 | 7 | | | 11/01/2045 | | | | 10,147,130 | |
| | 9,640,000 | | | Westchester County, NY IDA (Engel Burman at Armonk) | | | 6.500 | 7 | | | 11/01/2045 | | | | 9,986,558 | |
| | 9,640,000 | | | Westchester County, NY IDA (Engel Burman at Armonk) | | | 6.500 | 7 | | | 11/01/2045 | | | | 9,986,558 | |
| | 2,000,000 | | | Westchester County, NY Tobacco Asset Securitization Corp. | | | 5.125 | | | | 06/01/2045 | | | | 1,900,900 | |
| | 2,600,000 | | | Yonkers, NY IDA (St. Joseph’s Hospital), Series 98-C | | | 6.200 | | | | 03/01/2020 | | | | 2,599,922 | |
| | | | | | | | | | | | | | | | |
| | | | | | | | | | | | | | | 458,677,951 | |
| | | | |
| | | | | | | | | | | | | | | | | |
| North Carolina—0.1% | | | | | | | | | | | | |
| | 1,500,000 | | | NC Medical Care Commission (AHACHC) | | | 5.800 | | | | 10/01/2034 | | | | 1,507,245 | |
| | 1,650,000 | | | NC Medical Care Commission (Whitestone) | | | 7.750 | | | | 03/01/2031 | | | | 1,898,457 | |
| | | | | | | | | | | | | | | | |
| | | | | | | | | | | | | | | 3,405,702 | |
| | | | |
| | | | | | | | | | | | | | | | | |
| North Dakota—0.0% | | | | | | | | | | | | |
| | 25,000 | | | Cass County, ND Industrial Devel. Revenue (Fraser Ltd.) | | | 7.000 | | | | 11/01/2015 | | | | 24,965 | |
| | 2,410,000 | | | Richland County, ND Hsg. (Birchwood Properties) | | | 6.750 | | | | 05/01/2029 | | | | 2,322,059 | |
| | | | | | | | | | | | | | | | |
| | | | | | | | | | | | | | | 2,347,024 | |
| | | | |
| | | | | | | | | | | | | | | | | |
| Ohio—8.6% | | | | | | | | | | | | |
| | 9,950,000 | | | Allen County, OH Hospital Facilities (Catholic Healthcare)5 | | | 5.000 | | | | 06/01/2038 | | | | 10,913,854 | |
| | 77,055,000 | | | Buckeye, OH Tobacco Settlement Financing Authority (TASC) | | | 6.250 | 1 | | | 06/01/2037 | | | | 66,181,769 | |
| | 113,205,000 | | | Buckeye, OH Tobacco Settlement Financing Authority (TASC) | | | 5.875 | | | | 06/01/2047 | | | | 91,074,555 | |
| | 18,115,000 | | | Buckeye, OH Tobacco Settlement Financing Authority (TASC) | | | 5.375 | | | | 06/01/2024 | | | | 15,315,146 | |
44 OPPENHEIMER ROCHESTER HIGH YIELD MUNICIPAL FUND
| | | | | | | | | | | | | | | | |
Principal Amount | | | | | Coupon | | | Maturity | | | Value | |
| Ohio (Continued) | | | | | | | | | |
| | $2,295,300,000 | | | Buckeye, OH Tobacco Settlement Financing Authority (TASC) | | | 7.504%4 | | | | 06/01/2052 | | | $ | 21,139,713 | |
| | 44,380,000 | | | Buckeye, OH Tobacco Settlement Financing Authority (TASC) | | | 6.500 | | | | 06/01/2047 | | | | 38,548,468 | |
| | 30,200,000 | | | Buckeye, OH Tobacco Settlement Financing Authority (TASC) | | | 5.875 | | | | 06/01/2030 | | | | 25,002,278 | |
| | 37,115,000 | | | Buckeye, OH Tobacco Settlement Financing Authority (TASC) | | | 5.125 | | | | 06/01/2024 | | | | 30,888,588 | |
| | 12,937,000 | | | Buckeye, OH Tobacco Settlement Financing Authority (TASC) | | | 6.000 | | | | 06/01/2042 | | | | 10,470,043 | |
| | 15,000,000 | | | Buckeye, OH Tobacco Settlement Financing Authority (TASC) | | | 5.750 | | | | 06/01/2034 | | | | 11,975,100 | |
| | 5,645,000 | | | Butler County, OH Port Authority (Maple Knoll Communities) | | | 7.000 | | | | 07/01/2043 | | | | 5,938,201 | |
| | 4,495,000 | | | Centerville, OH Health Care (Bethany Lutheran Village) | | | 6.000 | | | | 11/01/2038 | | | | 4,690,218 | |
| | 5,000 | | | Cleveland, OH Airport (Continental Airlines) | | | 5.700 | | | | 12/01/2019 | | | | 5,025 | |
| | 310,000 | | | Columbus-Franklin County, OH Finance Authority, Series A | | | 6.000 | | | | 05/15/2035 | | | | 323,066 | |
| | 9,680,000 | | | Cuyahoga County, OH Hospital Facilities (CSAHS-UHHS-Cuyahoga/Canton Obligated Group) | | | 7.500 | | | | 01/01/2030 | | | | 9,695,391 | |
| | 32,200,000 | | | Gallia County, OH Hospital Facilities (Holzer/HHlthS/HMCG/HMCJ Obligated Group) | | | 8.000 | | | | 07/01/2042 | | | | 36,343,174 | |
| | 7,500,000 | | | Grove City, OH Tax Increment Financing | | | 5.375 | | | | 12/01/2031 | | | | 7,625,325 | |
| | 1,450,000 | | | Hancock County, OH Hospital (BVRHC/BVHF Obligated Group) | | | 6.250 | | | | 12/01/2034 | | | | 1,696,587 | |
| | 629,413 | | | Hickory Chase, OH Community Authority Infrastructure Improvement3,11 | | | 7.000 | | | | 12/01/2038 | | | | 503,531 | |
| | 125,000 | | | Lake County, OH Hospital Facilities (Lake Hospital System) | | | 5.750 | | | | 08/15/2038 | | | | 137,547 | |
| | 545,000 | | | Lorain County, OH Port Authority (Alumalloy LLC) | | | 6.000 | | | | 11/15/2025 | | | | 539,185 | |
| | 10,000,000 | | | Montgomery County, OH (Miami Valley Hospital)5 | | | 5.750 | | | | 11/15/2023 | | | | 11,751,400 | |
| | 1,644,222 | | | OH Port Authority of Columbiana Solid Waste (Apex Environmental)2 | | | 10.820 | | | | 08/01/2034 | | | | 838,553 | |
| | 16,320,000 | | | OH Port Authority of Columbiana Solid Waste (Apex Environmental)2,8 | | | 7.250 | | | | 08/01/2034 | | | | 11,809,642 | |
| | 1,605,000 | | | Port of Greater Cincinnati, OH Devel. Authority (Public Parking Infrastructure) | | | 6.300 | | | | 02/15/2024 | | | | 1,158,585 | |
| | 2,500,000 | | | Port of Greater Cincinnati, OH Devel. Authority (Public Parking Infrastructure) | | | 6.400 | | | | 02/15/2034 | | | | 1,774,125 | |
| | 4,100,000 | | | Southeastern OH Port Authority Hospital Facility (Memorial Health System) | | | 5.750 | | | | 12/01/2032 | | | | 4,396,963 | |
| | 1,955,000 | | | Toledo-Lucas County, OH Port Authority (Town Square at Levis Commons) | | | 5.400 | | | | 11/01/2036 | | | | 969,465 | |
45 OPPENHEIMER ROCHESTER HIGH YIELD MUNICIPAL FUND
STATEMENT OF INVESTMENTS Continued
| | | | | | | | | | | | | | | | |
Principal Amount | | | | | Coupon | | | Maturity | | | Value | |
| Ohio (Continued) | | | | | | | | | |
| | $3,415,000 | | | Warren County, OH Port Authority (Corridor 75 Park) | | | 7.500% | | | | 12/01/2034 | | | $ | 3,566,489 | |
| | | | | | | | | | | | | | | | |
| | | | | | | | | | | | | | | 425,271,986 | |
| | | | |
| | | | | | | | | | | | | | | | | |
| Oklahoma—0.2% | | | | | | | | | |
| | 1,700,000 | | | Ardmore, OK Devel. Authority (Airpark Increment District) | | | 5.750 | | | | 11/01/2022 | | | | 1,706,817 | |
| | 1,500,000 | | | Atoka County, OK Healthcare Authority (Atoka Memorial Hospital) | | | 6.625 | | | | 10/01/2037 | | | | 1,446,075 | |
| | 4,840,000 | | | Grady County, OK Criminal Justice Authority | | | 7.000 | | | | 11/01/2041 | | | | 4,811,105 | |
| | 100,000 | | | OK Ordnance Works Authority Sewer & Solid Waste Disposal Facilities (Ralston Purina Group) | | | 6.500 | | | | 09/01/2026 | | | | 100,238 | |
| | | | | | | | | | | | | | | 8,064,235 | |
| | | | |
| | | | | | | | | | | | | | | | | |
| Oregon—0.0% | | | | | | | | | |
| | 5,000 | | | Lane County, OR Hsg. Authority & Community Services (Firewood) | | | 6.600 | | | | 11/01/2015 | | | | 5,020 | |
| | 795,000 | | | OR Facilities Authority (Concordia University) | | | 6.125 | | | | 09/01/2030 | | | | 845,467 | |
| | 10,000 | | | OR GO (Elderly & Disabled Hsg.) | | | 5.300 | | | | 08/01/2032 | | | | 10,013 | |
| | 1,300,000 | | | Salem, OR Hospital Finance Authority (Capital Manor) | | | 6.000 | | | | 05/15/2047 | | | | 1,427,231 | |
| | 370,000 | | | Western Generation, OR Agency Cogeneration (Wauna Cogeneration) | | | 5.000 | | | | 01/01/2021 | | | | 377,792 | |
| | | | | | | | | | | | | | | | |
| | | | | | | | | | | | | | | 2,665,523 | |
| | | | |
| | | | | | | | | | | | | | | | | |
| Pennsylvania—1.0% | | | | | | | | | |
| | 500,000 | | | Luzerne County, PA IDA | | | 7.750 | | | | 12/15/2027 | | | | 521,090 | |
| | 1,005,000 | | | Luzerne County, PA IDA | | | 7.500 | | | | 12/15/2019 | | | | 1,054,737 | |
| | 8,396,881 | | | Northampton County, PA IDA (Northampton Generating)12 | | | 5.000 | | | | 12/31/2023 | | | | 7,590,193 | |
| | 24,937,498 | | | PA EDFA (Bionol Clearfield)3 | | | 8.500 | | | | 07/01/2015 | | | | 1,080,292 | |
| | 11,500,000 | | | PA Geisinger Authority Health System, Series A5 | | | 5.250 | | | | 06/01/2039 | | | | 12,653,220 | |
| | 4,000,000 | | | PA HEFA (Shippensburg University) | | | 6.250 | | | | 10/01/2043 | | | | 4,430,040 | |
| | 1,500,000 | | | Philadelphia, PA Authority for Industrial Devel. (Architecture & Design Charter School) | | | 6.125 | | | | 03/15/2043 | | | | 1,617,585 | |
| | 1,155,000 | | | Philadelphia, PA Authority for Industrial Devel. (Green Woods Charter School) | | | 5.500 | | | | 06/15/2022 | | | | 1,228,874 | |
| | 2,000,000 | | | Philadelphia, PA Authority for Industrial Devel. (Green Woods Charter School) | | | 5.500 | | | | 06/15/2032 | | | | 2,058,600 | |
| | 5,250,000 | | | Philadelphia, PA H&HEFA (Temple University Health System) | | | 5.625 | | | | 07/01/2042 | | | | 5,514,758 | |
| | 3,350,000 | | | Philadelphia, PA H&HEFA (Temple University Health System) | | | 5.625 | | | | 07/01/2036 | | | | 3,533,044 | |
| | 5,865,000 | | | York, PA GO | | | 7.250 | | | | 11/15/2041 | | | | 6,619,180 | |
| | | | | | | | | | | | | | | | |
| | | | | | | | | | | | | | | 47,901,613 | |
| | | | |
| | | | | | | | | | | | | | | | | |
| Rhode Island—0.6% | | | | | | | | | |
| | 44,240,000 | | | Central Falls, RI Detention Facility3 | | | 7.250 | | | | 07/15/2035 | | | | 11,014,875 | |
| | 7,500,000 | | | RI Health & Educational Building Corp. (Public Schools Financing Program) | | | 6.000 | | | | 05/15/2029 | | | | 8,406,375 | |
| | 9,715,000 | | | RI Hsg. & Mtg. Finance Corp. (Homeownership Opportunity)5 | | | 5.200 | | | | 10/01/2047 | | | | 9,807,096 | |
46 OPPENHEIMER ROCHESTER HIGH YIELD MUNICIPAL FUND
| | | | | | | | | | | | | | | | |
Principal Amount | | | | | Coupon | | | Maturity | | | Value | |
| Rhode Island (Continued) | | | | | | | | | |
| | $28,225,000 | | | RI Tobacco Settlement Financing Corp. (TASC) | | | 6.125%4 | | | | 06/01/2052 | | | $ | 1,137,185 | |
| | | | | | | | | | | | | | | | |
| | | | | | | | | | | | | | | 30,365,531 | |
| | | | |
| | | | | | | | | | | | | | | | | |
| South Carolina—0.6% | | | | | | | | | |
| | 6,747,000 | | | Hardeeville, SC Assessment Revenue (Anderson Tract Municipal Improvement District) | | | 7.750 | | | | 11/01/2039 | | | | 6,387,587 | |
| | 14,191,000 | | | Richland County, SC Assessment Revenue (Village at Sandhill Improvement District) | | | 6.200 | | | | 11/01/2036 | | | | 14,189,581 | |
| | 7,620,000 | | | SC Connector 2000 Assoc. Toll Road, Series B | | | 6.4534 | | | | 01/01/2020 | | | | 4,801,362 | |
| | 8,500,000 | | | SC Connector 2000 Assoc. Toll Road, Series B | | | 6.6214 | | | | 01/01/2024 | | | | 4,335,850 | |
| | 200,000 | | | SC Connector 2000 Assoc. Toll Road, Series B | | | 6.3004 | | | | 01/01/2026 | | | | 90,020 | |
| | | | | | | | | | | | | | | | |
| | | | | | | | | | | | | | | 29,804,400 | |
| | | | |
| | | | | | | | | | | | | | | | | |
| South Dakota—0.0% | | | | | | | | | |
| | 1,425,000 | | | Turner County, SD Tax Increment | | | 5.000 | | | | 12/15/2026 | | | | 1,424,972 | |
| | | | | | | | | | | | | | | | | |
| Tennessee—0.4% | | | | | | | | | |
| | 8,890,000 | | | Memphis, TN HE&HFB (NH/Mendenhall Hsg./Highland Hsg./NTH/VH Obligated Group)3 | | | 5.7507 | | | | 04/01/2042 | | | | 3,467,100 | |
| | 215,000 | | | Memphis-Shelby County, TN Airport Authority (Express Airlines)2 | | | 6.125 | | | | 12/01/2016 | | | | 32,145 | |
| | 9,000,000 | | | Shelby County, TN HE&HFB (Trezevant Manor) | | | 5.500 | | | | 09/01/2047 | | | | 9,161,550 | |
| | 6,525,000 | | | Shelby County, TN HE&HFB (Trezevant Manor) | | | 8.000 | | | | 09/01/2044 | | | | 7,123,799 | |
| | | | | | | | | | | | | | | | |
| | | | | | | | | | | | | | | 19,784,594 | |
| | | | |
| | | | | | | | | | | | | | | | | |
| Texas—10.5% | | | | | | | | | |
| | 230,000 | | | Beaumont, TX Multifamily HDC (Madison on the Lake Apartments) | | | 7.750 | | | | 12/01/2028 | | | | 219,694 | |
| | 2,345,000 | | | Brazos River Authority, TX Pollution Control (TXU Energy Company)2 | | | 6.3007 | | | | 07/01/2032 | | | | 134,837 | |
| | 11,420,000 | | | Brazos River Authority, TX Pollution Control (TXU Energy Company)3 | | | 6.750 | | | | 10/01/2038 | | | | 656,650 | |
| | 13,500,000 | | | Brazos River Authority, TX Pollution Control (TXU Energy Company)2 | | | 5.400 | | | | 05/01/2029 | | | | 776,250 | |
| | 41,315,000 | | | Brazos River Authority, TX Pollution Control (TXU Energy Company)2 | | | 5.000 | | | | 03/01/2041 | | | | 2,375,612 | |
| | 10,000,000 | | | Brazos River Authority, TX Pollution Control (TXU Energy Company)2 | | | 7.700 | | | | 03/01/2032 | | | | 600,000 | |
| | 26,120,000 | | | Brazos River Authority, TX Pollution Control (TXU Energy Company)3 | | | 7.700 | | | | 04/01/2033 | | | | 1,567,200 | |
| | 15,870,000 | | | Cambridge, TX Student Hsg. (Cambridge Student Hsg. Devel.) | | | 7.000 | | | | 11/01/2039 | | | | 20,220,443 | |
| | 400,000 | | | Celina, TX Special Assessment | | | 5.500 | | | | 09/01/2032 | | | | 388,768 | |
| | 1,100,000 | | | Celina, TX Special Assessment | | | 5.875 | | | | 09/01/2040 | | | | 1,063,557 | |
| | 700,000 | | | Celina, TX Special Assessment | | | 5.375 | | | | 09/01/2028 | | | | 683,277 | |
| | 750,000 | | | Clifton, TX Higher Education Finance Corp. (Idea Public Schools) | | | 5.750 | | | | 08/15/2041 | | | | 838,612 | |
| | 1,250,000 | | | Crane, TX Independent School District | | | 5.000 | | | | 02/15/2030 | | | | 1,274,812 | |
| | 22,150,000 | | | Donna, TX GO | | | 6.250 | | | | 02/15/2037 | | | | 21,776,330 | |
| | 1,500,000 | | | Flower Mound, TX Special Assessment (River Walk Public Improvement District No. 1) | | | 6.500 | | | | 09/01/2036 | | | | 1,551,975 | |
47 OPPENHEIMER ROCHESTER HIGH YIELD MUNICIPAL FUND
STATEMENT OF INVESTMENTS Continued
| | | | | | | | | | | | | | | | |
Principal Amount | | | | | Coupon | | | Maturity | | | Value | |
| Texas (Continued) | | | | | | | | | |
| | $2,000,000 | | | Flower Mound, TX Special Assessment (River Walk Public Improvement District No. 1) | | | 6.750% | | | | 09/01/2043 | | | $ | 2,056,780 | |
| | 1,500,000 | | | Flower Mound, TX Special Assessment (River Walk Public Improvement District No. 1) | | | 6.125 | | | | 09/01/2028 | | | | 1,545,435 | |
| | 3,700,000 | | | Galveston, TX Special Assessment | | | 6.000 | | | | 09/01/2038 | | | | 3,607,352 | |
| | 2,400,000 | | | Galveston, TX Special Assessment | | | 5.625 | | | | 09/01/2028 | | | | 2,355,264 | |
| | 3,500,000 | | | Galveston, TX Special Assessment | | | 6.125 | | | | 09/01/2044 | | | | 3,404,940 | |
| | 10,000,000 | | | Grand Parkway, TX Transportation Corp.5 | | | 5.000 | | | | 04/01/2053 | | | | 10,856,500 | |
| | 11,238,709 | | | Gulf Coast, TX IDA (Microgy Holdings)3 | | | 7.000 | | | | 12/01/2036 | | | | 112 | |
| | 20,000 | | | Gulf Coast, TX IDA Solid Waste (Citgo Petroleum Corp.) | | | 8.000 | | | | 04/01/2028 | | | | 20,036 | |
| | 3,225,000 | | | Harris County, TX Cultural Education Facilities Finance Corp. (Space Center Houston) | | | 7.000 | | | | 08/15/2028 | | | | 3,469,745 | |
| | 2,750,000 | | | HFDC of Central TX (Legacy at Willow Bend Retirement Community) | | | 5.750 | | | | 11/01/2036 | | | | 2,775,768 | |
| | 2,000,000 | | | HFDC of Central TX (Lutheran Social Services of the South) | | | 6.875 | | | | 02/15/2032 | | | | 2,003,360 | |
| | 555,000 | | | Houston, TX Airport System | | | 5.000 | | | | 07/01/2026 | | | | 618,104 | |
| | 1,210,000 | | | Houston, TX Airport System | | | 5.000 | | | | 07/01/2025 | | | | 1,359,471 | |
| | 2,000,000 | | | Houston, TX Airport System | | | 5.000 | | | | 07/01/2024 | | | | 2,259,880 | |
| | 435,000 | | | Houston, TX Higher Education Finance Corp. (Cosmos Foundation) | | | 6.500 | | | | 05/15/2031 | | | | 552,176 | |
| | 380,000 | | | Houston, TX Higher Education Finance Corp. (Cosmos Foundation) | | | 6.500 | | | | 05/15/2031 | | | | 453,800 | |
| | 500,000 | | | Houston, TX Higher Education Finance Corp. (Ninos) | | | 6.000 | | | | 08/15/2036 | | | | 540,715 | |
| | 750,000 | | | Houston, TX Higher Education Finance Corp. (Ninos) | | | 6.000 | | | | 08/15/2041 | | | | 808,253 | |
| | 600,000 | | | Leander, TX Special Assesment (Oak Creek Public Improvement District) | | | 5.875 | | | | 09/01/2044 | | | | 590,106 | |
| | 600,000 | | | Leander, TX Special Assesment (Oak Creek Public Improvement District) | | | 5.750 | | | | 09/01/2038 | | | | 590,928 | |
| | 500,000 | | | Leander, TX Special Assesment (Oak Creek Public Improvement District) | | | 5.375 | | | | 09/01/2028 | | | | 494,430 | |
| | 1,770,000 | | | Maverick County, TX GO COP | | | 8.750 | | | | 03/01/2034 | | | | 1,403,114 | |
| | 5,995,000 | | | Maverick County, TX GO COP | | | 8.750 | | | | 03/01/2034 | | | | 4,752,356 | |
| | 400,000 | | | Mclendon-Chisholm, TX Special Assessment (Sonoma Public Improvement District) | | | 5.500 | | | | 09/15/2040 | | | | 390,924 | |
| | 450,000 | | | Mclendon-Chisholm, TX Special Assessment (Sonoma Public Improvement District) | | | 5.375 | | | | 09/15/2035 | | | | 440,762 | |
| | 520,000 | | | Midlothian, TX Devel. Authority Tax Increment | | | 5.125 | | | | 11/15/2026 | | | | 524,581 | |
| | 1,300,000 | | | New Hope, TX Educational Facilities Finance Corp. Retirement Facility (Wesleyan Homes) | | | 5.500 | | | | 01/01/2049 | | | | 1,316,367 | |
| | 785,000 | | | New Hope, TX Educational Facilities Finance Corp. Student Hsg. (Stephenville-Tarleton State University) | | | 5.875 | | | | 04/01/2036 | | | | 881,147 | |
| | 1,950,000 | | | New Hope, TX Educational Facilities Finance Corp. Student Hsg. (Stephenville-Tarleton State University) | | | 6.000 | | | | 04/01/2045 | | | | 2,199,308 | |
| | 1,630,000 | | | Newark, TX Cultural Education Facilities Finance Corp. (A.W. Brown Fellowship Charter School) | | | 6.000 | | | | 08/15/2042 | | | | 1,682,584 | |
48 OPPENHEIMER ROCHESTER HIGH YIELD MUNICIPAL FUND
| | | | | | | | | | | | | | | | |
Principal Amount | | | | | Coupon | | | Maturity | | | Value | |
| Texas (Continued) | | | | | | | | | |
| | $1,600,000 | | | North Central TX HFC (Village Kaufman Apartments) | | | 6.150%7 | | | | 01/01/2043 | | | $ | 1,676,624 | |
| | 38,000,000 | | | North Central TX HFDC (Children’s Medical Center)5 | | | 5.750 | | | | 08/15/2039 | | | | 42,762,540 | |
| | 5,920,000 | | | North TX Tollway Authority5 | | | 5.750 | | | | 01/01/2048 | | | | 6,510,402 | |
| | 16,000,000 | | | North TX Tollway Authority5 | | | 5.750 | | | | 01/01/2048 | | | | 17,595,680 | |
| | 3,000,000 | | | Red River, TX Health Facilities Devel. Corp. (Happy Harbor Methodist Home) | | | 8.000 | | | | 11/15/2049 | | | | 3,553,860 | |
| | 2,100,000 | | | Sabine Neches, TX HFC (Fox Run Apartments) | | | 6.150 | | | | 01/01/2043 | | | | 2,200,569 | |
| | 1,735,693 | | | Sabine Neches, TX HFC (Single Family Mtg.)5 | | | 5.430 | | | | 12/01/2039 | | | | 1,829,626 | |
| | 4,100,000 | | | Sabine River, TX Authority Pollution Control (TXU Electric Company)3 | | | 6.150 | | | | 08/01/2022 | | | | 235,750 | |
| | 1,800,000 | | | Sabine River, TX Authority Pollution Control (TXU Electric Company)2 | | | 6.4507 | | | | 06/01/2021 | | | | 103,500 | |
| | 10,000,000 | | | San Jacinto, TX Community College District5 | | | 5.125 | | | | 02/15/2038 | | | | 10,916,400 | |
| | 26,820,000 | | | Sanger, TX Industrial Devel. Corp. (Texas Pellets) | | | 7.500 | | | | 07/01/2038 | | | | 28,314,410 | |
| | 4,890,000 | | | Springhill, TX Courtland Heights Public Facility Corp. | | | 5.850 | | | | 12/01/2028 | | | | 4,156,500 | |
| | 32,600,000 | | | Tarrant County, TX Cultural Education Facilities Finance Corp. (Baylor Health Care System)5 | | | 6.250 | | | | 11/15/2029 | | | | 37,941,836 | |
| | 7,935,000 | | | Tarrant County, TX Cultural Education Facilities Finance Corp. (Baylor Health Care System)5 | | | 5.750 | | | | 11/15/2024 | | | | 9,107,540 | |
| | 3,810,000 | | | Tarrant County, TX Cultural Education Facilities Finance Corp. (Buckingham Senior Living Community) | | | 5.750 | | | | 11/15/2037 | | | | 3,889,324 | |
| | 13,500,000 | | | Tarrant County, TX Health Facilities Devel. Corp. (Cook Childrens Medical Center)5 | | | 5.000 | | | | 12/01/2033 | | | | 14,930,055 | |
| | 27,525,000 | | | Travis County, TX HFDC (Longhorn Village) | | | 7.125 | | | | 01/01/2046 | | | | 29,707,457 | |
| | 1,600,000 | | | Travis County, TX HFDC (Querencia Barton Creek) | | | 5.650 | | | | 11/15/2035 | | | | 1,609,152 | |
| | 2,495,000 | | | Trinity, TX River Authority (TXU Energy Company)3 | | | 6.250 | | | | 05/01/2028 | | | | 143,463 | |
| | 20,100,000 | | | Trophy Club, TX Public Improvement (Highlands Trophy Club) | | | 7.750 | | | | 10/01/2037 | | | | 21,394,038 | |
| | 34,600,000 | | | TX Angelina & Neches River Authority (Aspen Power)3 | | | 6.500 | | | | 11/01/2029 | | | | 13,461,130 | |
| | 117,760,000 | | | TX Municipal Gas Acquisition & Supply Corp.5 | | | 6.250 | | | | 12/15/2026 | | | | 141,526,271 | |
| | 1,600,000 | | | TX Public Finance Authority Charter School Finance Corp. (Ed-Burnham Wood) | | | 6.250 | | | | 09/01/2036 | | | | 1,643,536 | |
| | 635,000 | | | TX Student Hsg. Corp. (University of North Texas) | | | 6.750 | | | | 07/01/2021 | | | | 624,192 | |
| | 200,000 | | | TX Student Hsg. Corp. (University of North Texas) | | | 6.850 | | | | 07/01/2031 | | | | 192,920 | |
| | 2,095,000 | | | Vintage Township, TX Public Facilities Corp. | | | 7.375 | | | | 10/01/2038 | | | | 2,178,695 | |
| | 6,375,000 | | | Waxahachie, TX Special Assessment | | | 6.000 | | | | 08/15/2045 | | | | 6,185,089 | |
| | 4,615,000 | | | Wise County, TX (Parket County Junior College District) | | | 7.750 | | | | 08/15/2028 | | | | 5,520,694 | |
49 OPPENHEIMER ROCHESTER HIGH YIELD MUNICIPAL FUND
STATEMENT OF INVESTMENTS Continued
| | | | | | | | | | | | | | | | |
Principal Amount | | | | | Coupon | | | Maturity | | | Value | |
| Texas (Continued) | | | | | | | | | |
| | $2,920,000 | | | Wise County, TX (Parket County Junior College District) | | | 7.500% | | | | 08/15/2025 | | | $ | 3,472,026 | |
| | | | | | | | | | | | | | | | |
| | | | | | | | | | | | | | | 521,465,594 | |
| | | | | | | | | | | | | | | | | |
| Utah—0.6% | | | | | | | | | |
| | 4,915,000 | | | Hideout, UT Local District No. 1 Special Assessment | | | 8.250 | | | | 08/01/2034 | | | | 4,918,096 | |
| | 1,950,000 | | | Hideout, UT Local District No. 1 Special Assessment | | | 7.750 | | | | 08/01/2024 | | | | 1,951,619 | |
| | 1,750,000 | | | UT Charter School Finance Authority (Endeavor Hall) | | | 6.000 | | | | 07/15/2032 | | | | 1,800,978 | |
| | 815,000 | | | UT Charter School Finance Authority (Endeavor Hall) | | | 5.500 | | | | 07/15/2022 | | | | 847,893 | |
| | 3,870,000 | | | UT Charter School Finance Authority (Endeavor Hall) | | | 6.250 | | | | 07/15/2042 | | | | 4,006,379 | |
| | 6,550,000 | | | UT Charter School Finance Authority (Hawthorn Academy) | | | 8.250 | | | | 07/15/2046 | | | | 8,017,593 | |
| | 750,000 | | | UT Charter School Finance Authority (Vista Entrada School of Performing Arts & Technology) | | | 6.300 | | | | 07/15/2032 | | | | 814,733 | |
| | 1,640,000 | | | UT Charter School Finance Authority (Vista Entrada School of Performing Arts & Technology) | | | 6.550 | | | | 07/15/2042 | | | | 1,798,932 | |
| | 1,465,000 | | | UT HFA (RHA Community Service of Utah) | | | 6.875 | | | | 07/01/2027 | | | | 1,467,681 | |
| | 825,000 | | | Utah County, UT Charter School (Renaissance Academy) | | | 5.625 | | | | 07/15/2037 | | | | 828,077 | |
| | 4,300,000 | | | West Valley City, UT Sewer (East Hollywood High School) | | | 5.625 | | | | 06/15/2037 | | | | 4,170,828 | |
| | | | | | | | | | | | | | | | |
| | | | | | | | | | | | | | | 30,622,809 | |
| | | | | | | | | | | | | | | | | |
| Vermont—0.0% | | | | | | | | | |
| | 1,148,454 | | | VT Educational & Health Buildings Financing Agency (Marlboro College) | | | 2.779 | | | | 04/01/2019 | | | | 1,129,815 | |
| | | | | | | | | | | | | | | | | |
| Virginia—1.0% | | | | | | | | | |
| | 1,833,000 | | | Celebrate, VA North CDA Special Assessment2 | | | 6.750 | | | | 03/01/2034 | | | | 1,184,063 | |
| | 5,100,000 | | | Celebrate, VA South CDA Special Assessment3 | | | 6.250 | | | | 03/01/2037 | | | | 2,805,153 | |
| | 3,206,000 | | | Farms New Kent, VA Community Devel. Authority Special Assessment2 | | | 5.800 | | | | 03/01/2036 | | | | 801,756 | |
| | 9,200,000 | | | Farms New Kent, VA Community Devel. Authority Special Assessment2 | | | 5.450 | | | | 03/01/2036 | | | | 2,300,828 | |
| | 14,300,000 | | | Farms New Kent, VA Community Devel. Authority Special Assessment2 | | | 5.125 | | | | 03/01/2036 | | | | 3,576,287 | |
| | 636,000 | | | Lewistown, VA Commerce Center Community Devel. Authority | | | 6.050 | | | | 03/01/2044 | | | | 622,676 | |
| | 2,051,000 | | | Lewistown, VA Commerce Center Community Devel. Authority | | | 6.050 | | | | 03/01/2054 | | | | 102,653 | |
| | 1,297,000 | | | Lewistown, VA Commerce Center Community Devel. Authority | | | 6.050 | | | | 03/01/2044 | | | | 1,065,939 | |
| | 2,900,000 | | | New Port, VA CDA3,6 | | | 5.600 | | | | 09/01/2036 | | | | 1,669,878 | |
| | 2,050,000 | | | Norfolk, VA EDA, Series A | | | 6.000 | | | | 11/01/2036 | | | | 1,875,606 | |
| | 18,986,000 | | | Peninsula, VA Town Center Community Devel. Authority Special Obligation | | | 6.450 | | | | 09/01/2037 | | | | 20,105,225 | |
| | 3,251,000 | | | VA H2O Community Devel. Authority | | | 5.200 | | | | 09/01/2037 | | | | 1,837,303 | |
50 OPPENHEIMER ROCHESTER HIGH YIELD MUNICIPAL FUND
| | | | | | | | | | | | | | | | |
Principal Amount | | | | | Coupon | | | Maturity | | | Value | |
| Virginia (Continued) | | | | | | | | | |
| | $253,700,000 | | | VA Tobacco Settlement Authority | | | 7.441%4 | | | | 06/01/2047 | | | $ | 5,335,311 | |
| | 6,000,000 | | | VA Tobacco Settlement Financing Corp. | | | 5.2001 | | | | 06/01/2046 | | | | 4,335,060 | |
| | 2,404,674 | | | West Point, VA IDA Solid Waste (Chesapeake Corp.)3 | | | 6.375 | | | | 03/01/2019 | | | | 24 | |
| | | | | | | | | | | | | | | | |
| | | | | | | | | | | | | | | 47,617,762 | |
| | | | | | | | | | | | | | | | | |
| Washington—1.6% | | | | | | | | | |
| | 750,000 | | | Greater Wenatchee, WA Regional Events Center | | | 5.000 | | | | 09/01/2027 | | | | 797,032 | |
| | 200,000 | | | Kelso County, WA Hsg. Authority (Chinook & Columbia Apartments) | | | 5.600 | | | | 03/01/2028 | | | | 200,014 | |
| | 10,000 | | | King County, WA Hsg. Authority (Kona Village) | | | 6.700 | | | | 01/01/2020 | | | | 10,016 | |
| | 725,000 | | | King County, WA Hsg. Authority (Southwood Square Apartments) | | | 6.200 | | | | 10/01/2031 | | | | 725,493 | |
| | 100,000 | | | King County, WA Hsg. Authority (Southwood Square Apartments) | | | 6.100 | | | | 10/01/2021 | | | | 101,002 | |
| | 1,500,000 | | | Kitsap County, WA Consolidated Hsg. Authority | | | 5.600 | | | | 06/01/2037 | | | | 1,529,685 | |
| | 50,000 | | | Kitsap County, WA Consolidated Hsg. Authority (Heritage Apartments) | | | 6.100 | | | | 10/01/2031 | | | | 50,027 | |
| | 1,915,000 | | | Seattle, WA Hsg. Authority (Newholly Phase II) | | | 7.000 | | | | 01/01/2032 | | | | 1,933,614 | |
| | 1,675,000 | | | Snohomish County, WA Hsg. Authority (Whispering Pines Apartments) | | | 5.600 | | | | 09/01/2025 | | | | 1,675,921 | |
| | 1,250,000 | | | Snohomish County, WA Hsg. Authority (Whispering Pines Apartments) | | | 5.750 | | | | 09/01/2030 | | | | 1,250,538 | |
| | 100,000 | | | Snohomish County, WA Hsg. Authority (Whispering Pines Apartments) | | | 5.100 | | | | 09/01/2015 | | | | 100,135 | |
| | 3,884,358 | | | Tacoma, WA Consolidated Local Improvements District No. 65 | | | 5.750 | | | | 04/01/2043 | | | | 3,906,227 | |
| | 1,500,000 | | | Tes Properties, WA5 | | | 5.500 | | | | 12/01/2029 | | | | 1,698,000 | |
| | 12,000,000 | | | Tes Properties, WA5 | | | 5.625 | | | | 12/01/2038 | | | | 13,588,080 | |
| | 18,075,000 | | | WA Health Care Facilities Authority (Catholic Health Initiatives)5 | | | 6.375 | | | | 10/01/2036 | | | | 20,530,806 | |
| | 17,410,000 | | | WA Health Care Facilities Authority (Peacehealth)5 | | | 5.000 | | | | 11/01/2028 | | | | 19,058,205 | |
| | 1,700,000 | | | WA Hsg. Finance Commission (Heron’s Key)6 | | | 7.000 | | | | 07/01/2050 | | | | 1,707,089 | |
| | 1,000,000 | | | WA Hsg. Finance Commission (Heron’s Key)6 | | | 7.000 | | | | 07/01/2045 | | | | 1,018,500 | |
| | 10,860,000 | | | WA Kalispel Tribe Indians Priority District | | | 6.750 | | | | 01/01/2038 | | | | 11,005,090 | |
| | | | | | | | | | | | | | | | |
| | | | | | | | | | | | | | | 80,885,474 | |
| | | | | | | | | | | | | | | | | |
| West Virginia—0.5% | | | | | | | | | |
| | 4,500,000 | | | Brooke County, WV (Bethany College) | | | 6.750 | | | | 10/01/2037 | | | | 4,963,995 | |
| | 3,000,000 | | | Brooke County, WV (Bethany College) | | | 6.500 | | | | 10/01/2031 | | | | 3,284,850 | |
| | 27,145,000 | | | Harrison County, WV Tax Increment (Charles Pointe)2 | | | 7.000 | | | | 06/01/2035 | | | | 13,573,857 | |
| | 1,840,000 | | | Harrison County, WV Tax Increment (Charles Pointe) | | | 7.000 | | | | 06/01/2035 | | | | 1,669,745 | |
51 OPPENHEIMER ROCHESTER HIGH YIELD MUNICIPAL FUND
STATEMENT OF INVESTMENTS Continued
| | | | | | | | | | | | | | | | |
Principal Amount | | | | | Coupon | | | Maturity | | | Value | |
| West Virginia (Continued) | | | | | | | | | |
| | $3,045,000 | | | WV Hospital Finance Authority (UTD Health System) | | | 5.500% | | | | 06/01/2039 | | | $ | 3,347,551 | |
| | | | | | | | | | | | | | | | |
| | | | | | | | | | | | | | | 26,839,998 | |
| | | | | | | | | | | | | | | | | |
| Wisconsin—0.7% | | | | | | | | | |
| | 3,970,000 | | | Necedah, WI Community Devel. Authority Exempt Facility (Castle Rock Renewable Fuels)2 | | | 7.500 | | | | 03/01/2018 | | | | 1,640,816 | |
| | 1,800,000 | | | Sokaogon, WI Chippewa Community (Gaming)3 | | | 8.250 | | | | 01/01/2017 | | | | 1,083,600 | |
| | 1,750,000 | | | Sokaogon, WI Chippewa Community (Gaming)3 | | | 7.000 | | | | 01/01/2026 | | | | 931,000 | |
| | 3,000,000 | | | WI H&EFA (AE Nursing Centers) | | | 7.250 | | | | 06/01/2038 | | | | 3,199,380 | |
| | 2,015,000 | | | WI H&EFA (Beloit College) | | | 6.125 | | | | 06/01/2039 | | | | 2,219,966 | |
| | 750,000 | | | WI H&EFA (Beloit College) | | | 6.125 | | | | 06/01/2035 | | | | 830,475 | |
| | 6,335,000 | | | WI H&EFA (Wellington Homes) | | | 6.750 | | | | 09/01/2037 | | | | 6,686,402 | |
| | 2,000,000 | | | WI Public Finance Authority (Las Ventanas Retirement Community) | | | 0.2104 | | | | 10/01/2042 | | | | 626,300 | |
| | 6,657,500 | | | WI Public Finance Authority (Las Ventanas Retirement Community) | | | 7.000 | | | | 10/01/2042 | | | | 6,682,599 | |
| | 2,000,000 | | | WI Public Finance Authority (Las Ventanas Retirement Community) | | | 36.0954 | | | | 10/01/2042 | | | | 20 | |
| | 660,000 | | | WI Public Finance Authority (Thomas Jefferson Classical Academy) | | | 7.000 | | | | 07/01/2031 | | | | 717,625 | |
| | 845,000 | | | WI Public Finance Authority Charter School (Explore Knowledge Foundation) | | | 6.000 | | | | 07/15/2042 | | | | 913,673 | |
| | 1,325,000 | | | WI Public Finance Authority Charter School (Explore Knowledge Foundation) | | | 5.750 | | | | 07/15/2032 | | | | 1,427,860 | |
| | 1,910,000 | | | WI Public Finance Authority Educational Facility (Ask Academy) | | | 6.000 | | | | 02/01/2045 | | | | 1,823,821 | |
| | 5,875,000 | | | WI Public Finance Authority Educational Facility (Horizon Academy West Charter School) | | | 6.000 | | | | 09/01/2045 | | | | 5,955,722 | |
| | | | | | | | | | | | | | | | |
| | | | | | | | | | | | | | | 34,739,259 | |
| | | | | | | | | | | | | | | | | |
| U.S. Possessions—12.8% | | | | | | | | | |
| | 28,225,000 | | | Northern Mariana Islands Commonwealth, Series B | | | 5.000 | | | | 10/01/2033 | | | | 24,244,710 | |
| | 7,645,000 | | | Puerto Rico Aqueduct & Sewer Authority | | | 6.000 | | | | 07/01/2044 | | | | 5,423,669 | |
| | 11,450,000 | | | Puerto Rico Aqueduct & Sewer Authority | | | 5.250 | | | | 07/01/2042 | | | | 7,880,920 | |
| | 10,000 | | | Puerto Rico Aqueduct & Sewer Authority | | | 5.000 | | | | 07/01/2025 | | | | 9,919 | |
| | 3,325,000 | | | Puerto Rico Aqueduct & Sewer Authority | | | 6.000 | | | | 07/01/2038 | | | | 2,383,559 | |
| | 53,230,000 | | | Puerto Rico Aqueduct & Sewer Authority | | | 6.000 | | | | 07/01/2047 | | | | 37,566,540 | |
| | 2,750,000 | | | Puerto Rico Aqueduct & Sewer Authority | | | 5.750 | | | | 07/01/2037 | | | | 1,961,107 | |
| | 11,980,000 | | | Puerto Rico Aqueduct & Sewer Authority | | | 5.000 | | | | 07/01/2033 | | | | 8,347,784 | |
| | 250,000 | | | Puerto Rico Aqueduct & Sewer Authority | | | 5.500 | | | | 07/01/2028 | | | | 179,742 | |
| | 152,450,000 | | | Puerto Rico Children’s Trust Fund (TASC) | | | 9.3554 | | | | 05/15/2055 | | | | 4,126,821 | |
| | 2,145,000 | | | Puerto Rico Commonwealth GO13 | | | 0.800 | | | | 07/01/2019 | | | | 2,007,763 | |
| | 36,400,000 | | | Puerto Rico Commonwealth GO | | | 8.000 | | | | 07/01/2035 | | | | 25,347,868 | |
| | 39,915,000 | | | Puerto Rico Commonwealth GO | | | 5.750 | | | | 07/01/2041 | | | | 25,112,522 | |
| | 1,345,000 | | | Puerto Rico Commonwealth GO | | | 5.750 | | | | 07/01/2037 | | | | 1,337,132 | |
| | 11,540,000 | | | Puerto Rico Commonwealth GO | | | 5.750 | | | | 07/01/2036 | | | | 7,331,016 | |
| | 1,500,000 | | | Puerto Rico Commonwealth GO | | | 5.000 | | | | 07/01/2024 | | | | 961,815 | |
| | 340,000 | | | Puerto Rico Commonwealth GO | | | 5.500 | | | | 07/01/2027 | | | | 218,895 | |
| | 3,255,000 | | | Puerto Rico Commonwealth GO | | | 5.500 | | | | 07/01/2026 | | | | 2,107,710 | |
52 OPPENHEIMER ROCHESTER HIGH YIELD MUNICIPAL FUND
| | | | | | | | | | | | | | | | |
Principal Amount | | | | | Coupon | | | Maturity | | | Value | |
| U.S. Possessions (Continued) | | | | | | | | | |
| | $62,660,000 | | | Puerto Rico Commonwealth GO | | | 5.500% | | | | 07/01/2039 | | | $ | 39,341,081 | |
| | 14,695,000 | | | Puerto Rico Commonwealth GO | | | 5.500 | | | | 07/01/2026 | | | | 9,515,453 | |
| | 4,545,000 | | | Puerto Rico Commonwealth GO | | | 5.000 | | | | 07/01/2041 | | | | 2,780,449 | |
| | 2,625,000 | | | Puerto Rico Commonwealth GO | | | 6.000 | | | | 07/01/2035 | | | | 1,680,551 | |
| | 5,000,000 | | | Puerto Rico Commonwealth GO | | | 5.000 | | | | 07/01/2033 | | | | 3,095,350 | |
| | 1,920,000 | | | Puerto Rico Commonwealth GO | | | 5.250 | | | | 07/01/2026 | | | | 1,233,658 | |
| | 40,000 | | | Puerto Rico Commonwealth GO | | | 5.500 | | | | 07/01/2018 | | | | 28,842 | |
| | 285,000 | | | Puerto Rico Commonwealth GO13 | | | 0.820 | | | | 07/01/2020 | | | | 264,261 | |
| | 2,165,000 | | | Puerto Rico Commonwealth GO | | | 5.250 | | | | 07/01/2037 | | | | 1,351,285 | |
| | 2,250,000 | | | Puerto Rico Commonwealth GO | | | 6.000 | | | | 07/01/2039 | | | | 1,429,380 | |
| | 5,000 | | | Puerto Rico Commonwealth GO | | | 5.250 | | | | 07/01/2024 | | | | 5,012 | |
| | 13,000,000 | | | Puerto Rico Commonwealth GO | | | 6.500 | | | | 07/01/2040 | | | | 8,372,520 | |
| | 9,265,000 | | | Puerto Rico Commonwealth GO | | | 6.000 | | | | 07/01/2039 | | | | 5,885,869 | |
| | 19,550,000 | | | Puerto Rico Commonwealth GO | | | 6.500 | | | | 07/01/2037 | | | | 12,663,317 | |
| | 3,000,000 | | | Puerto Rico Commonwealth GO | | | 5.750 | | | | 07/01/2038 | | | | 1,898,520 | |
| | 5,295,000 | | | Puerto Rico Electric Power Authority, Series A8 | | | 7.000 | | | | 07/01/2033 | | | | 3,070,888 | |
| | 100,000 | | | Puerto Rico Electric Power Authority, Series A8 | | | 7.000 | | | | 07/01/2040 | | | | 57,992 | |
| | 7,750,000 | | | Puerto Rico Electric Power Authority, Series A8 | | | 7.000 | | | | 07/01/2043 | | | | 4,494,612 | |
| | 18,635,000 | | | Puerto Rico Electric Power Authority, Series A8 | | | 6.750 | | | | 07/01/2036 | | | | 10,807,555 | |
| | 5,745,000 | | | Puerto Rico Electric Power Authority, Series A8 | | | 5.000 | | | | 07/01/2042 | | | | 3,334,226 | |
| | 10,035,000 | | | Puerto Rico Electric Power Authority, Series A8 | | | 5.050 | | | | 07/01/2042 | | | | 5,823,712 | |
| | 2,745,000 | | | Puerto Rico Electric Power Authority, Series A8 | | | 5.000 | | | | 07/01/2029 | | | | 1,592,676 | |
| | 500,000 | | | Puerto Rico Electric Power Authority, Series AAA8 | | | 5.250 | | | | 07/01/2025 | | | | 290,345 | |
| | 4,570,000 | | | Puerto Rico Electric Power Authority, Series AAA8 | | | 5.250 | | | | 07/01/2026 | | | | 2,653,114 | |
| | 10,000 | | | Puerto Rico Electric Power Authority, Series AAA8 | | | 5.250 | | | | 07/01/2023 | | | | 5,814 | |
| | 40,000 | | | Puerto Rico Electric Power Authority, Series AAA | | | 5.250 | | | | 07/01/2021 | | | | 23,336 | |
| | 40,000 | | | Puerto Rico Electric Power Authority, Series AAA8 | | | 5.250 | | | | 07/01/2022 | | | | 23,285 | |
| | 95,000 | | | Puerto Rico Electric Power Authority, Series AAA8 | | | 5.250 | | | | 07/01/2030 | | | | 55,122 | |
| | 250,000 | | | Puerto Rico Electric Power Authority, Series AAA8 | | | 5.250 | | | | 07/01/2029 | | | | 145,058 | |
| | 30,000 | | | Puerto Rico Electric Power Authority, Series AAA8 | | | 5.250 | | | | 07/01/2028 | | | | 17,405 | |
| | 140,000 | | | Puerto Rico Electric Power Authority, Series CCC8 | | | 5.250 | | | | 07/01/2028 | | | | 81,221 | |
| | 2,475,000 | | | Puerto Rico Electric Power Authority, Series CCC8 | | | 5.250 | | | | 07/01/2027 | | | | 1,435,970 | |
| | 35,000 | | | Puerto Rico Electric Power Authority, Series CCC | | | 5.000 | | | | 07/01/2024 | | | | 20,336 | |
| | 40,000 | | | Puerto Rico Electric Power Authority, Series CCC | | | 5.000 | | | | 07/01/2027 | | | | 23,208 | |
| | 30,000 | | | Puerto Rico Electric Power Authority, Series CCC8 | | | 5.000 | | | | 07/01/2028 | | | | 17,407 | |
| | 20,000 | | | Puerto Rico Electric Power Authority, Series CCC8 | | | 5.000 | | | | 07/01/2025 | | | | 11,616 | |
| | 185,000 | | | Puerto Rico Electric Power Authority, Series DDD8 | | | 5.000 | | | | 07/01/2022 | | | | 107,705 | |
| | 15,000 | | | Puerto Rico Electric Power Authority, Series NN | | | 5.500 | | | | 07/01/2020 | | | | 8,758 | |
| | 170,000 | | | Puerto Rico Electric Power Authority, Series TT8 | | | 5.000 | | | | 07/01/2017 | | | | 99,464 | |
| | 6,750,000 | | | Puerto Rico Electric Power Authority, Series TT8 | | | 5.000 | | | | 07/01/2032 | | | | 3,916,687 | |
| | 20,000 | | | Puerto Rico Electric Power Authority, Series TT | | | 5.000 | | | | 07/01/2018 | | | | 11,673 | |
| | 895,000 | | | Puerto Rico Electric Power Authority, Series TT8 | | | 5.000 | | | | 07/01/2026 | | | | 519,610 | |
53 OPPENHEIMER ROCHESTER HIGH YIELD MUNICIPAL FUND
STATEMENT OF INVESTMENTS Continued
| | | | | | | | | | | | | | | | |
Principal Amount | | | | | Coupon | | | Maturity | | | Value | |
| U.S. Possessions (Continued) | | | | | | | | | |
| | $1,015,000 | | | Puerto Rico Electric Power Authority, Series TT8 | | | 5.000% | | | | 07/01/2027 | | | $ | 588,903 | |
| | 5,720,000 | | | Puerto Rico Electric Power Authority, Series TT8 | | | 5.000 | | | | 07/01/2037 | | | | 3,319,144 | |
| | 10,000 | | | Puerto Rico Electric Power Authority, Series TT8 | | | 5.000 | | | | 07/01/2025 | | | | 5,808 | |
| | 5,000 | | | Puerto Rico Electric Power Authority, Series TT | | | 5.000 | | | | 07/01/2020 | | | | 2,920 | |
| | 210,000 | | | Puerto Rico Electric Power Authority, Series TT8 | | | 5.000 | | | | 07/01/2022 | | | | 122,260 | |
| | 15,000 | | | Puerto Rico Electric Power Authority, Series TT | | | 5.000 | | | | 07/01/2024 | | | | 8,715 | |
| | 85,000 | | | Puerto Rico Electric Power Authority, Series WW8 | | | 5.375 | | | | 07/01/2022 | | | | 49,473 | |
| | 60,000 | | | Puerto Rico Electric Power Authority, Series WW8 | | | 5.500 | | | | 07/01/2021 | | | | 35,002 | |
| | 135,000 | | | Puerto Rico Electric Power Authority, Series WW8 | | | 5.250 | | | | 07/01/2033 | | | | 78,335 | |
| | 90,000 | | | Puerto Rico Electric Power Authority, Series WW8 | | | 5.000 | | | | 07/01/2028 | | | | 52,220 | |
| | 185,000 | | | Puerto Rico Electric Power Authority, Series WW8 | | | 5.250 | | | | 07/01/2025 | | | | 107,428 | |
| | 395,000 | | | Puerto Rico Electric Power Authority, Series WW8 | | | 5.500 | | | | 07/01/2038 | | | | 229,175 | |
| | 390,000 | | | Puerto Rico Electric Power Authority, Series WW8 | | | 5.375 | | | | 07/01/2024 | | | | 226,543 | |
| | 17,970,000 | | | Puerto Rico Electric Power Authority, Series XX8 | | | 5.750 | | | | 07/01/2036 | | | | 10,426,733 | |
| | 38,050,000 | | | Puerto Rico Electric Power Authority, Series XX8 | | | 5.250 | | | | 07/01/2040 | | | | 22,077,752 | |
| | 165,000 | | | Puerto Rico Electric Power Authority, Series XX8 | | | 5.250 | | | | 07/01/2027 | | | | 95,731 | |
| | 2,290,000 | | | Puerto Rico Electric Power Authority, Series XX8 | | | 5.250 | | | | 07/01/2035 | | | | 1,328,750 | |
| | 10,000 | | | Puerto Rico Electric Power Authority, Series XX | | | 5.250 | | | | 07/01/2026 | | | | 5,806 | |
| | 95,000 | | | Puerto Rico Electric Power Authority, Series ZZ | | | 5.000 | | | | 07/01/2021 | | | | 55,429 | |
| | 50,000 | | | Puerto Rico Electric Power Authority, Series ZZ8 | | | 5.250 | | | | 07/01/2022 | | | | 29,106 | |
| | 60,000 | | | Puerto Rico Electric Power Authority, Series ZZ8 | | | 5.250 | | | | 07/01/2024 | | | | 34,855 | |
| | 150,000 | | | Puerto Rico Electric Power Authority, Series ZZ8 | | | 5.250 | | | | 07/01/2025 | | | | 87,104 | |
| | 215,000 | | | Puerto Rico Electric Power Authority, Series ZZ | | | 5.000 | | | | 07/01/2024 | | | | 124,919 | |
| | 50,000 | | | Puerto Rico Electric Power Authority, Series ZZ8 | | | 5.250 | | | | 07/01/2026 | | | | 29,028 | |
| | 20,000 | | | Puerto Rico Electric Power Authority, Series ZZ8 | | | 5.000 | | | | 07/01/2018 | | | | 11,673 | |
| | 25,000 | | | Puerto Rico Electric Power Authority, Series ZZ | | | 5.250 | | | | 07/01/2021 | | | | 14,585 | |
| | 850,000 | | | Puerto Rico Electric Power Authority, Series ZZ8 | | | 5.000 | | | | 07/01/2022 | | | | 494,862 | |
| | 515,000 | | | Puerto Rico Electric Power Authority, Series ZZ8 | | | 5.250 | | | | 07/01/2018 | | | | 300,580 | |
| | 190,000 | | | Puerto Rico Electric Power Authority, Series ZZ | | | 4.625 | | | | 07/01/2025 | | | | 110,373 | |
| | 820,000 | | | Puerto Rico Electric Power Authority, Series ZZ8 | | | 5.000 | | | | 07/01/2017 | | | | 479,766 | |
| | 10,000 | | | Puerto Rico Electric Power Authority, Series ZZ | | | 5.000 | | | | 07/01/2026 | | | | 5,806 | |
| | 350,000 | | | Puerto Rico Highway & Transportation Authority | | | 5.750 | | | | 07/01/2021 | | | | 216,450 | |
| | 2,175,000 | | | Puerto Rico Highway & Transportation Authority | | | 5.000 | | | | 07/01/2028 | | | | 697,261 | |
| | 6,940,000 | | | Puerto Rico Highway & Transportation Authority | | | 5.750 | | | | 07/01/2019 | | | | 4,427,998 | |
| | 6,415,000 | | | Puerto Rico Highway & Transportation Authority | | | 5.300 | | | | 07/01/2035 | | | | 4,383,690 | |
| | 25,000 | | | Puerto Rico Highway & Transportation Authority | | | 5.500 | | | | 07/01/2023 | | | | 25,388 | |
| | 45,000 | | | Puerto Rico Highway & Transportation Authority | | | 5.000 | | | | 07/01/2027 | | | | 44,707 | |
| | 9,000,000 | | | Puerto Rico Highway & Transportation Authority | | | 5.750 | | | | 07/01/2022 | | | | 6,976,080 | |
| | 150,000 | | | Puerto Rico Highway & Transportation Authority13 | | | 0.920 | | | | 07/01/2027 | | | | 104,629 | |
| | 45,000 | | | Puerto Rico Highway & Transportation Authority | | | 5.750 | | | | 07/01/2019 | | | | 37,509 | |
| | 215,000 | | | Puerto Rico Highway & Transportation Authority | | | 5.000 | | | | 07/01/2023 | | | | 155,765 | |
| | 605,000 | | | Puerto Rico Highway & Transportation Authority, Series H | | | 5.450 | | | | 07/01/2035 | | | | 193,921 | |
| | 4,715,000 | | | Puerto Rico Highway & Transportation Authority, Series M | | | 5.000 | | | | 07/01/2046 | | | | 1,511,299 | |
| | 260,000 | | | Puerto Rico Highway & Transportation Authority, Series N | | | 5.250 | | | | 07/01/2039 | | | | 152,685 | |
| | 3,000,000 | | | Puerto Rico Infrastructure | | | 5.000 | | | | 07/01/2037 | | | | 775,860 | |
| | 5,000,000 | | | Puerto Rico Infrastructure | | | 5.000 | | | | 07/01/2031 | | | | 1,405,600 | |
54 OPPENHEIMER ROCHESTER HIGH YIELD MUNICIPAL FUND
| | | | | | | | | | | | | | | | |
Principal Amount | | | | | Coupon | | | Maturity | | | Value | |
| U.S. Possessions (Continued) | | | | | | | | | |
| | $3,000,000 | | | Puerto Rico Infrastructure (Mepsi Campus) | | | 6.500% | | | | 10/01/2037 | | | $ | 1,790,310 | |
| | 15,000,000 | | | Puerto Rico Infrastructure Financing Authority | | | 6.1404 | | | | 07/01/2034 | | | | 3,602,250 | |
| | 500,000 | | | Puerto Rico ITEMECF (Cogeneration Facilities) | | | 6.625 | | | | 06/01/2026 | | | | 472,430 | |
| | 4,050,000 | | | Puerto Rico ITEMECF (Hospital Auxilio Mutuo) | | | 6.000 | | | | 07/01/2033 | | | | 3,977,870 | |
| | 300,000 | | | Puerto Rico ITEMECF (University of the Sacred Heart) | | | 5.000 | | | | 10/01/2020 | | | | 252,639 | |
| | 100,000 | | | Puerto Rico ITEMECF (University of the Sacred Heart) | | | 5.000 | | | | 10/01/2021 | | | | 82,215 | |
| | 25,000 | | | Puerto Rico Municipal Finance Agency, Series B | | | 5.250 | | | | 07/01/2019 | | | | 24,808 | |
| | 76,125,000 | | | Puerto Rico Public Buildings Authority | | | 5.250 | | | | 07/01/2042 | | | | 42,355,950 | |
| | 8,825,000 | | | Puerto Rico Public Buildings Authority | | | 6.000 | | | | 07/01/2041 | | | | 5,152,829 | |
| | 7,000,000 | | | Puerto Rico Public Buildings Authority | | | 5.875 | | | | 07/01/2039 | | | | 4,060,840 | |
| | 13,840,000 | | | Puerto Rico Public Buildings Authority | | | 5.625 | | | | 07/01/2039 | | | | 7,890,738 | |
| | 2,380,000 | | | Puerto Rico Public Buildings Authority | | | 5.000 | | | | 07/01/2036 | | | | 1,330,253 | |
| | 100,000 | | | Puerto Rico Public Buildings Authority | | | 5.250 | | | | 07/01/2023 | | | | 61,146 | |
| | 260,000 | | | Puerto Rico Public Buildings Authority | | | 5.500 | | | | 07/01/2023 | | | | 160,794 | |
| | 410,000 | | | Puerto Rico Public Buildings Authority | | | 7.000 | | | | 07/01/2021 | | | | 274,339 | |
| | 12,000,000 | | | Puerto Rico Public Buildings Authority | | | 6.125 | | | | 07/01/2023 | | | | 7,632,960 | |
| | 1,640,000 | | | Puerto Rico Public Buildings Authority | | | 5.250 | | | | 07/01/2033 | | | | 930,848 | |
| | 150,000 | | | Puerto Rico Public Buildings Authority | | | 5.000 | | | | 07/01/2037 | | | | 83,646 | |
| | 5,100,000 | | | Puerto Rico Public Buildings Authority | | | 6.250 | | | | 07/01/2026 | | | | 3,180,258 | |
| | 3,870,000 | | | Puerto Rico Public Buildings Authority | | | 5.000 | | | | 07/01/2032 | | | | 2,186,782 | |
| | 12,845,000 | | | Puerto Rico Public Buildings Authority | | | 5.750 | | | | 07/01/2022 | | | | 8,102,754 | |
| | 4,980,000 | | | Puerto Rico Public Buildings Authority | | | 6.750 | | | | 07/01/2036 | | | | 3,050,549 | |
| | 200,000 | | | Puerto Rico Public Buildings Authority | | | 5.500 | | | | 07/01/2037 | | | | 113,520 | |
| | 1,515,000 | | | Puerto Rico Public Buildings Authority, Series D | | | 5.250 | | | | 07/01/2036 | | | | 854,308 | |
| | 39,020,000 | | | Puerto Rico Public Finance Corp., Series B2 | | | 5.500 | | | | 08/01/2031 | | | | 4,877,500 | |
| | 17,895,000 | | | Puerto Rico Sales Tax Financing Corp. | | | 5.250 | | | | 08/01/2057 | | | | 10,734,316 | |
| | 37,060,000 | | | Puerto Rico Sales Tax Financing Corp., Series A | | | 8.6944 | | | | 08/01/2035 | | | | 4,415,699 | |
| | 35,000,000 | | | Puerto Rico Sales Tax Financing Corp., Series A | | | 0.0001 | | | | 08/01/2033 | | | | 13,153,000 | |
| | 37,735,000 | | | Puerto Rico Sales Tax Financing Corp., Series A | | | 5.375 | | | | 08/01/2039 | | | | 15,409,087 | |
| | 31,660,000 | | | Puerto Rico Sales Tax Financing Corp., Series A | | | 5.500 | | | | 08/01/2042 | | | | 12,729,853 | |
| | 2,040,000 | | | Puerto Rico Sales Tax Financing Corp., Series A | | | 5.500 | | | | 08/01/2028 | | | | 861,431 | |
| | 2,250,000 | | | Puerto Rico Sales Tax Financing Corp., Series A | | | 6.125 | | | | 08/01/2029 | | | | 975,128 | |
| | 15,700,000 | | | Puerto Rico Sales Tax Financing Corp., Series A | | | 5.000 | | | | 08/01/2043 | | | | 6,293,816 | |
| | 2,945,000 | | | Puerto Rico Sales Tax Financing Corp., Series A | | | 4.000 | | | | 08/01/2016 | | | | 1,720,881 | |
| | 12,305,000 | | | Puerto Rico Sales Tax Financing Corp., Series A | | | 5.500 | | | | 08/01/2037 | | | | 5,055,140 | |
| | 3,000,000 | | | Puerto Rico Sales Tax Financing Corp., Series A | | | 6.375 | | | | 08/01/2039 | | | | 1,284,810 | |
| | 11,455,000 | | | Puerto Rico Sales Tax Financing Corp., Series A | | | 5.250 | | | | 08/01/2027 | | | | 4,801,363 | |
| | 43,845,000 | | | Puerto Rico Sales Tax Financing Corp., Series A | | | 5.750 | | | | 08/01/2037 | | | | 18,121,577 | |
| | 1,630,000 | | | Puerto Rico Sales Tax Financing Corp., Series A | | | 5.000 | | | | 08/01/2024 | | | | 686,377 | |
| | 7,945,000 | | | Puerto Rico Sales Tax Financing Corp., Series A | | | 7.8904 | | | | 08/01/2034 | | | | 1,034,042 | |
| | 53,275,000 | | | Puerto Rico Sales Tax Financing Corp., Series A | | | 6.500 | | | | 08/01/2044 | | | | 22,948,206 | |
| | 25,860,000 | | | Puerto Rico Sales Tax Financing Corp., Series A-1 | | | 5.250 | | | | 08/01/2043 | | | | 10,365,981 | |
| | 135,000 | | | Puerto Rico Sales Tax Financing Corp., Series C | | | 5.000 | | | | 08/01/2046 | | | | 80,557 | |
| | 52,010,000 | | | Puerto Rico Sales Tax Financing Corp., Series C | | | 5.250 | | | | 08/01/2041 | | | | 21,114,500 | |
| | 300,000 | | | Puerto Rico Sales Tax Financing Corp., Series C | | | 5.000 | | | | 08/01/2035 | | | | 121,011 | |
| | 57,560,000 | | | Puerto Rico Sales Tax Financing Corp., Series C | | | 6.000 | | | | 08/01/2042 | | | | 24,219,521 | |
| | 5,000,000 | | | Puerto Rico Sales Tax Financing Corp., Series C | | | 0.0001 | | | | 08/01/2032 | | | | 2,209,800 | |
55 OPPENHEIMER ROCHESTER HIGH YIELD MUNICIPAL FUND
STATEMENT OF INVESTMENTS Continued
| | | | | | | | | | | | | | | | |
Principal Amount | | | | | Coupon | | | Maturity | | | Value | |
| U.S. Possessions (Continued) | | | | | | | | | |
| | $5,000,000 | | | Puerto Rico Sales Tax Financing Corp., Series C | | | 6.000% | | | | 08/01/2039 | | | $ | 2,103,900 | |
| | 5,160,000 | | | Puerto Rico Sales Tax Financing Corp., Series C | | | 5.375 | | | | 08/01/2038 | | | | 2,113,433 | |
| | 1,000,000 | | | Puerto Rico Sales Tax Financing Corp., Series C | | | 5.375 | | | | 08/01/2036 | | | | 409,600 | |
| | 5,000,000 | | | University of Puerto Rico, Series P | | | 5.000 | | | | 06/01/2030 | | | | 2,358,500 | |
| | | | | | | | | | | | | | | | |
| | | | | | | | | | | | | | | 634,215,526 | |
| | | | | | | | | | | | | | | | |
| Total Municipal Bonds and Notes (Cost $6,890,997,207) | | | | | | | | | | | 5,562,662,018 | |
| | | | |
| Shares | | | | | | | | | | | | |
| Common Stocks—0.0% | | | | | |
| | 7,679 | | | Delta Air Lines, Inc.14,15 | | | | | | | | | | | 340,487 | |
| | 4,927 | | | General Motors Co.14,15 | | | | | | | | | | | 155,250 | |
| | 15,021 | | | Motors Liquidation Co. GUC Trust14,15 | | | | | | | | | | | 255,357 | |
| Total Common Stocks (Cost $54,137) | | | | | | | | | | | 751,094 | |
| | | |
| Units | | | | | Strike Price Expiration | | | | |
| Rights, Warrants and Certificates—0.0% | | | | | |
| | 4,479 | | | General Motors Co. Wts.14,15 | | | $14.710 07/10/2019 | | | | 65,886 | |
| | 4,479 | | | General Motors Co. Wts.14,15 | | | 22.000 07/10/2016 | | | | 98,538 | |
| Total Rights, Warrants and Certificates (Cost $—) | | | | | | | | | | | 164,424 | |
| | | | |
Principal
Amount | | | | | Coupon | | | Maturity | | | | |
| Corporate Loans—0.3% | | | | | |
| | 6,000,000 | | | Aspen Power Senior Secured Bridge Promissory Note14 | | | 9.0007 | | | | 11/16/2015 | | | | 6,000,000 | |
| | 3,500,000 | | | Aspen Power Senior Secured Bridge Promissory Note14 | | | 9.0007 | | | | 11/16/2015 | | | | 3,500,000 | |
| | 7,000,000 | | | Aspen Power Senior Secured Bridge Promissory Note14 | | | 9.0007 | | | | 11/16/2015 | | | | 7,000,000 | |
| Total Corporate Loans (Cost $16,500,000) | | | | | | | | | | | 16,500,000 | |
| | | |
| | | | | | | | | | | | | | |
| Total Investments, at Value (Cost $6,907,551,344)—112.8% | | | | 5,580,077,536 | |
| Net Other Assets (Liabilities)—(12.8) | | | | | | | | (633,972,425 | ) |
| | | | | | | | | | | | | | | | |
| Net Assets—100.0% | | | | | | | $ | 4,946,105,111 | |
| | | | | | | | | | | | | | | | |
Footnotes to Statement of Investments
1. Denotes a step bond: a zero coupon bond that converts to a fixed or variable interest rate at a designated future date.
2. This security is accruing partial income at an anticipated effective rate based on expected interest and/or principal payments. The rate shown is the original contractual interest rate.
3. This security is not accruing income because the issuer has missed an interest payment on it and/or is not anticipated to make future interest and or principal payments. The rate shown is the contractual interest rate. See Note 4 of the accompanying Notes.
4. Zero coupon bond reflects effective yield on the date of purchase.
5. Security represents the underlying municipal bond with respect to an inverse floating rate security held by the Fund. The bond was purchased by the Fund and subsequently transferred to a trust, which issued the related inverse floating rate security. See Note 4 of the accompanying Notes.
6. All or a portion of the security position is when-issued or delayed delivery to be delivered and settled after period end. See Note 4 of the accompanying Notes.
7. Represents the current interest rate for a variable or increasing rate security.
56 OPPENHEIMER ROCHESTER HIGH YIELD MUNICIPAL FUND
Footnotes to Statement of Investments (Continued)
8. Subject to a forbearance agreement. Rate shown is the contractual interest rate. See Note 4 of the accompanying Notes.
9. Restricted security. The aggregate value of restricted securities at period end was $41,580,580, which represents 0.84% of the Fund’s net assets. See Note 4 of the accompanying Notes. Information concerning restricted securities is as follows:
| | | | | | | | | | | | | | | | |
| Security | | Acquisition Dates | | | Cost | | | Value | | | Unrealized Appreciation | |
NY Liberty Devel. Corp. (Bank of America Tower) | | | 7/23/10 - 3/4/11 | | | $ | 37,404,237 | | | $ | 41,580,580 | | | $ | 4,176,343 | |
| 10. | Represents the current interest rate for the inverse floating rate security. See Note 4 of the accompanying Notes. |
| 11. | Security received as the result of issuer reorganization. |
| 12. | Interest or dividend is paid-in-kind, when applicable. |
| 13. | Denotes an inflation-indexed security: coupon or principal are indexed to a consumer price index. |
| 14. | Received as a result of a corporate action. |
| 15. | Non-income producing security. |
To simplify the listings of securities, abbreviations are used per the table below:
| | |
| ABH | | Adventist Bolingbrook Hospital |
| ACMC | | Advocate Condell Medical Center |
| AE | | American Eagle |
| AGH | | Adventist Glenoaks Hospital |
| AH | | Ascension Health |
| AH&HC | | Advocate Health & Hospitals Corp. |
| AHACHC | | ARC/HDS Alamance Country Housing Corp. |
| AHCN | | Advocate Health Care Metro |
| AHSGA | | Adventist Health System-Georgia |
| ANSHN | | Advocate of North Side Health Network |
| BHI | | Baptist Homes of Indiana |
| BVHF | | Blanchard Valley Health Foundation |
| BVRHC | | Blanchard Valley Regional Health Care |
| CAB | | Capital Appreciation Bond |
| CCC | | Continuing Care Center |
| CCHCS | | Cook Children’s Health Care System |
| CCMCtr | | Cook Children’s Medical Center |
| CCPN | | Cook Children;s Physical Network |
| CDA | | Communities Devel. Authority |
| CDHA | | Central Dupage Hospital Association |
| CDHS | | Central Dupage Health System |
| CMCD | | Children’s Medical Center of Dallas |
| CMCtrF | | Children’s Medical Center Foundation |
| CMH | | Copley Memorial Hospital |
| COP | | Certificates of Participation |
| CSAHS | | The Sisters of Charity of St. Augustine Health System |
| DA | | Dormitory Authority |
| DRIVERS | | Derivative Inverse Tax Exempt Receipts |
| EBC | | Engel Berman Corp. |
| ECHNS | | Eastern Connecticut Health Network System |
| EDA | | Economic Devel. Authority |
| EDFA | | Economic Devel. Finance Authority |
| FCommH | | Fayette Community Hospital |
| GO | | General Obligation |
57 OPPENHEIMER ROCHESTER HIGH YIELD MUNICIPAL FUND
STATEMENT OF INVESTMENTS Continued
Abbreviations (Continued)
| | |
| GUC | | General Unsecured Creditors |
| H&EFA | | Health and Educational Facilities Authority |
| H&HEFA | | Hospitals and Higher Education Facilities Authority |
| HC | | HASC Center |
| HDC | | Housing Devel. Corp. |
| HE&HFA | | Higher Education and Health Facilities Authority |
| HE&HFB | | Higher Educational and Housing Facility Board |
| HEFA | | Higher Education Facilities Authority |
| HFA | | Housing Finance Agency |
| HFC | | Housing Finance Corp. |
| HFDC | | Health Facilities Devel. Corp. |
| HHlthS | | Holzer Health Systems |
| HMCG | | Holzer Medical Center-Gallipolis |
| HMCJ | | Holzer Medical Center-Jackson |
| IDA | | Industrial Devel. Agency |
| ITEMECF | | Industrial, Tourist, Educational, Medical and Environmental Community Facilities |
| JFK | | John Fitzgerald Kennedy |
| KGC | | Kuakini Geriatric Care |
| KHS | | Kaukini Health System |
| KMC | | Kuakini Medical Center |
| KSS | | Kuakini Support Services |
| MA | | Mercy Alliance |
| MMH | | McKenna Memorial Hospital |
| MTA | | Metropolitan Transportation Authority |
| NH | | Northgate Housing |
| NTH | | North Terrace Housing |
| NY/NJ | | New York/New Jersey |
| NYC | | New York City |
| NYS | | New York State |
| OH | | Oakwood Healthcare |
| PClinic | | Piedmont Clinic |
| PHC | | Piedmont Healthcare |
| PHHosp | | Piedmont Henty Hospital |
| PHI | | Piedmont Heart Institute |
| PHIP | | Piedmont Heart Institute Physicians |
| PHlthCF | | Piedmont Healthcare Foundation |
| PHosp | | Piedmont Hospital |
| PMCC | | Piedmont Medical Care Corp. |
| PMSH | | Piedmont Mountainside Hospital |
| PNH | | Piedmont Newnan Hospital |
| RCF | | Rush-Copley Foundation |
| RCMC | | Rush-Copley Medical Center |
| Res Rec | | Resource Recovery Facility |
| RGH | | Rockville General Hospital |
| RHA | | Resource Healthcare of America |
| RITES | | Residual Interest Tax Exempt Security |
| ROLs | | Reset Option Longs |
| RUMC | | Rush University Medical Center |
| SJHCN | | St. Joseph Home Care Network |
| SJHE | | St. Joseph Hospital of Eureka |
| SJHO | | St. Joseph Hospital of Orange |
| SJHS | | St. Joseph Health System |
| TASC | | Tobacco Settlement Asset-Backed Bonds |
| TFABs | | Tobacco Flexible Amortization Bonds |
58 OPPENHEIMER ROCHESTER HIGH YIELD MUNICIPAL FUND
Abbreviations (Continued)
| | |
| TYW | | The YMCA of Wichita |
| UHHS | | University Hospitals Health System |
| VH | | Village Housing |
| VOA | | Volunteers of America |
| WICF | | W.I. Cook Foundation |
See accompanying Notes to Financial Statements.
59 OPPENHEIMER ROCHESTER HIGH YIELD MUNICIPAL FUND
STATEMENT OF ASSETS AND LIABILITIES July 31, 2015
| | | | |
Assets | | | | |
Investments at value (cost $6,907,551,344)—see accompanying statement of investments | | $ | 5,580,077,536 | |
Cash | | | 836,847 | |
Receivables and other assets: | | | | |
Interest | | | 79,983,331 | |
Investments sold (including $14,895,402 sold on a when-issued or delayed delivery basis) | | | 44,795,107 | |
Shares of beneficial interest sold | | | 6,053,407 | |
Other | | | 1,657,786 | |
| | | | |
Total assets | | | 5,713,404,014 | |
| | | | |
Liabilities | | | | |
Payables and other liabilities: | | | | |
Payable for short-term floating rate notes issued (See Note 4) | | | 722,510,000 | |
Payable for borrowings (See Note 8) | | | 15,900,000 | |
Shares of beneficial interest redeemed | | | 19,647,700 | |
Dividends | | | 4,928,426 | |
Investments purchased (including $2,699,408 purchased on a when-issued or delayed delivery basis) | | | 2,699,408 | |
Trustees’ compensation | | | 741,268 | |
Distribution and service plan fees | | | 583,164 | |
Shareholder communications | | | 28,102 | |
Interest expense on borrowings | | | 2,889 | |
Other | | | 257,946 | |
| | | | |
Total liabilities | | | 767,298,903 | |
| | | | |
Net Assets | | $ | 4,946,105,111 | |
| | | | |
| | | | |
Composition of Net Assets | | | | |
Paid-in capital | | $ | 8,665,963,173 | |
Accumulated net investment income | | | 100,671,953 | |
Accumulated net realized loss on investments | | | (2,493,056,207) | |
Net unrealized depreciation on investments | | | (1,327,473,808) | |
| | | | |
Net Assets | | $ | 4,946,105,111 | |
| | | | |
60 OPPENHEIMER ROCHESTER HIGH YIELD MUNICIPAL FUND
| | | | |
Net Asset Value Per Share | | | | |
| |
| Class A Shares: | | | | |
| |
| Net asset value and redemption price per share (based on net assets of $2,968,690,503 and 432,881,544 shares of beneficial interest outstanding) | | $ | 6.86 | |
| |
| Maximum offering price per share (net asset value plus sales charge of 4.75% of offering price) | | $ | 7.20 | |
| |
| Class B Shares: | | | | |
| |
| Net asset value, redemption price (excludes applicable contingent deferred sales charge) and offering price per share (based on net assets of $49,791,729 and 7,227,666 shares of beneficial interest outstanding) | | $ | 6.89 | |
| |
| Class C Shares: | | | | |
| |
| Net asset value, redemption price (excludes applicable contingent deferred sales charge) and offering price per share (based on net assets of $1,234,905,516 and 180,717,484 shares of beneficial interest outstanding) | | $ | 6.83 | |
| |
| Class Y Shares: | | | | |
| |
| Net asset value, redemption price and offering price per share (based on net assets of $692,717,363 and 101,117,748 shares of beneficial interest outstanding) | | $ | 6.85 | |
See accompanying Notes to Financial Statements.
61 OPPENHEIMER ROCHESTER HIGH YIELD MUNICIPAL FUND
STATEMENT OF OPERATIONS For the Year Ended July 31, 2015
| | | | |
Investment Income | | | | |
Interest | | $ | 439,122,980 | |
Dividends | | | 10,023 | |
| | | | |
Total investment income | | | 439,133,003 | |
| | | | |
Expenses | | | | |
Management fees | | | 20,272,316 | |
Distribution and service plan fees: | | | | |
Class A | | | 4,869,066 | |
Class B | | | 594,582 | |
Class C | | | 12,157,953 | |
Transfer and shareholder servicing agent fees: | | | | |
Class A | | | 3,276,135 | |
Class B | | | 66,089 | |
Class C | | | 1,351,182 | |
Class Y | | | 703,681 | |
Shareholder communications: | | | | |
Class A | | | 44,955 | |
Class B | | | 2,638 | |
Class C | | | 22,406 | |
Class Y | | | 8,783 | |
Interest expense and fees on short-term floating rate notes issued (See Note 4) | | | 9,261,746 | |
Legal, auditing and other professional fees | | | 4,673,009 | |
Borrowing fees | | | 4,048,465 | |
Trustees’ compensation | | | 82,397 | |
Custodian fees and expenses | | | 42,251 | |
Interest expense on borrowings | | | 4,119 | |
Other | | | 1,399,342 | |
| | | | |
Total expenses | | | 62,881,115 | |
Net Investment Income | | | 376,251,888 | |
Realized and Unrealized Loss | | | | |
Net realized loss on investments | | | (99,572,148) | |
Net change in unrealized appreciation/depreciation on investments | | | (47,125,328) | |
Net Increase in Net Assets Resulting from Operations | | $ | 229,554,412 | |
| | | | |
See accompanying Notes to Financial Statements.
62 OPPENHEIMER ROCHESTER HIGH YIELD MUNICIPAL FUND
STATEMENTS OF CHANGES IN NET ASSETS
| | | | | | | | |
| | | Year Ended
July 31, 2015 | | | Year Ended
July 31, 2014 | |
Operations | | | | | | | | |
Net investment income | | $ | 376,251,888 | | | $ | 381,267,912 | |
Net realized loss | | | (99,572,148) | | | | (4,795,521) | |
Net change in unrealized appreciation/depreciation | | | (47,125,328) | | | | 99,151,615 | |
| | | | | | | | |
Net increase in net assets resulting from operations | | | 229,554,412 | | | | 475,624,006 | |
| | | | | | | | |
Dividends and/or Distributions to Shareholders | | | | | | | | |
Dividends from net investment income: | | | | | | | | |
Class A | | | (217,531,286) | | | | (250,693,322) | |
Class B | | | (3,868,044) | | | | (5,771,650) | |
Class C | | | (79,889,356) | | | | (86,591,025) | |
Class Y | | | (47,795,196) | | | | (36,840,501) | |
| | | | |
| | | (349,083,882) | | | | (379,896,498) | |
| | | | | | | | |
Beneficial Interest Transactions | | | | | | | | |
Net increase (decrease) in net assets resulting from beneficial interest transactions: | | | | | | | | |
Class A | | | (221,818,275) | | | | (490,548,695) | |
Class B | | | (26,821,866) | | | | (31,751,567) | |
Class C | | | (47,369,977) | | | | (174,369,616) | |
Class Y | | | 149,496,945 | | | | 80,952,069 | |
| | | | | | | | |
| | | (146,513,173) | | | | (615,717,809) | |
| | | | | | | | |
Net Assets | | | | | | | | |
Total decrease | | | (266,042,643) | | | | (519,990,301) | |
Beginning of period | | | 5,212,147,754 | | | | 5,732,138,055 | |
| | | | | | | | |
| | |
| End of period (including accumulated net investment income of $100,671,953 and $64,905,154, respectively) | | $ | 4,946,105,111 | | | $ | 5,212,147,754 | |
| | | | |
See accompanying Notes to Financial Statements.
63 OPPENHEIMER ROCHESTER HIGH YIELD MUNICIPAL FUND
STATEMENT OF CASH FLOWS For the Year Ended July 31, 2015
| | | | |
Cash Flows from Operating Activities | | | | |
Net increase in net assets from operations | | $ | 229,554,412 | |
Adjustments to reconcile net increase in net assets from operations to net cash provided by operating activities: | | | | |
Purchase of investment securities | | | (954,245,473) | |
Proceeds from disposition of investment securities | | | 1,248,487,117 | |
Short-term investment securities, net | | | 20,583,338 | |
Premium amortization | | | 1,953,516 | |
Discount accretion | | | (80,045,240) | |
Net realized loss on investments | | | 99,572,148 | |
Net change in unrealized appreciation/depreciation on investments | | | 47,125,328 | |
Change in assets: | | | | |
Decrease in other assets | | | 140,726 | |
Increase in interest receivable | | | (115,764) | |
Increase in receivable for securities sold | | | (26,776,203) | |
Change in liabilities: | | | | |
Decrease in other liabilities | | | (120,501) | |
Decrease in payable for securities purchased | | | (12,315,592) | |
| | | | |
Net cash provided by operating activities | | | 573,797,812 | |
| | | | |
Cash Flows from Financing Activities | | | | |
Proceeds from borrowings | | | 198,200,000 | |
Payments on borrowings | | | (203,600,000) | |
Payments on short-term floating rate notes issued | | | (81,860,000) | |
Proceeds from shares sold | | | 1,220,031,545 | |
Payments on shares redeemed | | | (1,637,409,202) | |
Cash distributions paid | | | (69,401,763) | |
| | | | |
Net cash used in financing activities | | | (574,039,420) | |
Net decrease in cash | | | (241,608) | |
Cash, beginning balance | | | 1,078,455 | |
| | | | |
Cash, ending balance | | $ | 836,847 | |
| | | | |
Supplemental disclosure of cash flow information:
Noncash financing activities not included herein consist of reinvestment of dividends and distributions of $282,364,358.
Cash paid for interest on borrowings—$4,576.
Cash paid for interest on short-term floating rate notes issued—$9,261,746.
See accompanying Notes to Financial Statements.
64 OPPENHEIMER ROCHESTER HIGH YIELD MUNICIPAL FUND
FINANCIAL HIGHLIGHTS
| | | | | | | | | | | | | | | | | | | | |
| Class A | | Year Ended
July 31, 2015 | | | Year Ended
July 31, 2014 | | | Year Ended
July 31, 2013 | | | Year Ended
July 31, 2012 | | | Year Ended
July 29, 20111 | |
| Per Share Operating Data | | | | | | | | | | | | | | | | | | | | |
| Net asset value, beginning of period | | $ | 7.01 | | | $ | 6.87 | | | $ | 7.50 | | | $ | 6.92 | | | $ | 7.17 | |
| |
| Income (loss) from investment operations: | | | | | | | | | | | | | | | | | | | | |
| Net investment income2 | | | 0.51 | | | | 0.50 | | | | 0.51 | | | | 0.50 | | | | 0.55 | |
| Net realized and unrealized gain (loss) | | | (0.18) | | | | 0.13 | | | | (0.65) | | | | 0.60 | | | | (0.25) | |
| | | | |
| Total from investment operations | | | 0.33 | | | | 0.63 | | | | (0.14) | | | | 1.10 | | | | 0.30 | |
| |
| Dividends and/or distributions to shareholders: | | | | | | | | | | | | | | | | | | | | |
| Dividends from net investment income | | | (0.48) | | | | (0.49) | | | | (0.49) | | | | (0.52) | | | | (0.55) | |
| |
| Net asset value, end of period | | $ | 6.86 | | | $ | 7.01 | | | $ | 6.87 | | | $ | 7.50 | | | $ | 6.92 | |
| | | | |
| | | | | | | | | | | | | | | | | | | | |
| Total Return, at Net Asset Value3 | | | 4.59% | | | | 9.63% | | | | (2.19)% | | | | 16.63% | | | | 4.65% | |
| | | | | | | | | | | | | | | | | | | | |
| Ratios/Supplemental Data | | | | | | | | | | | | | | | | | | | | |
| Net assets, end of period (in thousands) | | $ | 2,968,690 | | | $ | 3,260,438 | | | $ | 3,688,901 | | | $ | 4,463,156 | | | $ | 3,969,090 | |
| |
| Average net assets (in thousands) | | $ | 3,258,788 | | | $ | 3,477,994 | | | $ | 4,450,000 | | | $ | 4,001,353 | | | $ | 4,149,509 | |
| |
| Ratios to average net assets:4 | | | | | | | | | | | | | | | | | | | | |
| Net investment income | | | 7.19% | | | | 7.24% | | | | 6.69% | | | | 7.00% | | | | 8.07% | |
| Expenses excluding interest and fees on short-term floating rate notes issued and interest and fees from borrowings | | | 0.74% | | | | 0.71% | | | | 0.73% | | | | 0.64% | | | | 0.64% | |
| Interest and fees from borrowings | | | 0.08% | | | | 0.09% | | | | 0.10% | | | | 0.12% | | | | 0.11% | |
| Interest and fees on short-term floating rate notes issued5 | | | 0.17% | | | | 0.25% | | | | 0.25% | | | | 0.31% | | | | 0.35% | |
| | | | |
| Total expenses | | | 0.99% | | | | 1.05% | | | | 1.08% | | | | 1.07% | | | | 1.10% | |
| Expenses after payments, waivers and/or reimbursements and reduction to custodian expenses | | | 0.99% | | | | 1.05% | | | | 1.08% | | | | 1.07% | | | | 1.10% | |
| |
| Portfolio turnover rate | | | 16% | | | | 16% | | | | 18% | | | | 11% | | | | 18% | |
1. July 29, 2011 represents the last business day of the Fund’s reporting period.
2. Per share amounts calculated based on the average shares outstanding during the period.
3. Assumes an initial investment on the business day before the first day of the fiscal period, with all dividends and distributions reinvested in additional shares on the reinvestment date, and redemption at the net asset value calculated on the last business day of the fiscal period. Sales charges are not reflected in the total returns. Total returns are not annualized for periods less than one full year. Returns do not reflect the deduction of taxes that a shareholder would pay on fund distributions or the redemption of fund shares. The returns do not include adjustments in accordance with generally accepted accounting principles required at the period end for financial reporting purposes.
4. Annualized for periods less than one full year.
5. Interest and fee expense related to the Fund’s liability for short-term floating rate notes issued in conjunction with inverse floating rate securities.
See accompanying Notes to Financial Statements.
65 OPPENHEIMER ROCHESTER HIGH YIELD MUNICIPAL FUND
FINANCIAL HIGHLIGHTS Continued
| | | | | | | | | | | | | | | | | | | | |
| Class B | | Year Ended
July 31,
2015 | | | Year Ended
July 31,
2014 | | | Year Ended
July 31,
2013 | | | Year Ended
July 31,
2012 | | | Year Ended
July 29,
20111 | |
| Per Share Operating Data | | | | | | | | | | | | | | | | | | | | |
| Net asset value, beginning of period | | $ | 7.04 | | | $ | 6.89 | | | $ | 7.53 | | | $ | 6.94 | | | $ | 7.19 | |
| |
| Income (loss) from investment operations: | | | | | | | | | | | | | | | | | | | | |
| Net investment income2 | | | 0.46 | | | | 0.45 | | | | 0.45 | | | | 0.44 | | | | 0.50 | |
| Net realized and unrealized gain (loss) | | | (0.19) | | | | 0.14 | | | | (0.66) | | | | 0.61 | | | | (0.26) | |
| | | | |
| Total from investment operations | | | 0.27 | | | | 0.59 | | | | (0.21) | | | | 1.05 | | | | 0.24 | |
| |
| Dividends and/or distributions to shareholders: | | | | | | | | | | | | | | | | | | | | |
| Dividends from net investment income | | | (0.42) | | | | (0.44) | | | | (0.43) | | | | (0.46) | | | | (0.49) | |
| |
| Net asset value, end of period | | $ | 6.89 | | | $ | 7.04 | | | $ | 6.89 | | | $ | 7.53 | | | $ | 6.94 | |
| | | | |
| | | | | | | | | | | | | | | | | | | | |
| Total Return, at Net Asset Value3 | | | 3.79% | | | | 8.89% | | | | (3.12)% | | | | 15.76% | | | | 3.75% | |
| | | | | | | | | | | | | | | | | | | | |
| Ratios/Supplemental Data | | | | | | | | | | | | | | | | | | | | |
| Net assets, end of period (in thousands) | | $ | 49,792 | | | $ | 77,369 | | | $ | 107,602 | | | $ | 161,197 | | | $ | 162,309 | |
| |
| Average net assets (in thousands) | | $ | 65,703 | | | $ | 90,234 | | | $ | 142,525 | | | $ | 156,216 | | | $ | 186,637 | |
| |
| Ratios to average net assets:4 | | | | | | | | | | | | | | | | | | | | |
| Net investment income | | | 6.43% | | | | 6.49% | | | | 5.86% | | | | 6.17% | | | | 7.21% | |
| Expenses excluding interest and fees on short-term floating rate notes issued and interest and fees from borrowings | | | 1.50% | | | | 1.49% | | | | 1.56% | | | | 1.48% | | | | 1.49% | |
| Interest and fees from borrowings | | | 0.08% | | | | 0.09% | | | | 0.10% | | | | 0.12% | | | | 0.11% | |
| Interest and fees on short-term floating rate notes issued5 | | | 0.17% | | | | 0.25% | | | | 0.25% | | | | 0.31% | | | | 0.35% | |
| | | | |
| Total expenses | | | 1.75% | | | | 1.83% | | | | 1.91% | | | | 1.91% | | | | 1.95% | |
| Expenses after payments, waivers and/or reimbursements and reduction to custodian expenses | | | 1.75% | | | | 1.83% | | | | 1.91% | | | | 1.91% | | | | 1.95% | |
| |
| Portfolio turnover rate | | | 16% | | | | 16% | | | | 18% | | | | 11% | | | | 18% | |
1. July 29, 2011 represents the last business day of the Fund’s reporting period.
2. Per share amounts calculated based on the average shares outstanding during the period.
3. Assumes an initial investment on the business day before the first day of the fiscal period, with all dividends and distributions reinvested in additional shares on the reinvestment date, and redemption at the net asset value calculated on the last business day of the fiscal period. Sales charges are not reflected in the total returns. Total returns are not annualized for periods less than one full year. Returns do not reflect the deduction of taxes that a shareholder would pay on fund distributions or the redemption of fund shares. The returns do not include adjustments in accordance with generally accepted accounting principles required at the period end for financial reporting purposes.
4. Annualized for periods less than one full year.
5. Interest and fee expense related to the Fund’s liability for short-term floating rate notes issued in conjunction with inverse floating rate securities.
See accompanying Notes to Financial Statements.
66 OPPENHEIMER ROCHESTER HIGH YIELD MUNICIPAL FUND
| | | | | | | | | | | | | | | | | | | | |
| Class C | | Year Ended
July 31, 2015 | | | Year Ended
July 31, 2014 | | | Year Ended
July 31, 2013 | | | Year Ended
July 31, 2012 | | | Year Ended
July 29, 20111 | |
| Per Share Operating Data | | | | | | | | | | | | | | | | | | | | |
| Net asset value, beginning of period | | $ | 6.99 | | | $ | 6.85 | | | $ | 7.48 | | | $ | 6.90 | | | $ | 7.15 | |
| |
| Income (loss) from investment operations: | | | | | | | | | | | | | | | | | | | | |
| Net investment income2 | | | 0.46 | | | | 0.44 | | | | 0.45 | | | | 0.44 | | | | 0.50 | |
| Net realized and unrealized gain (loss) | | | (0.20) | | | | 0.14 | | | | (0.65) | | | | 0.61 | | | | (0.25) | |
| | | | |
| Total from investment operations | | | 0.26 | | | | 0.58 | | | | (0.20) | | | | 1.05 | | | | 0.25 | |
| |
| Dividends and/or distributions to shareholders: | | | | | | | | | | | | | | | | | | | | |
| Dividends from net investment income | | | (0.42) | | | | (0.44) | | | | (0.43) | | | | (0.47) | | | | (0.50) | |
| |
| Net asset value, end of period | | $ | 6.83 | | | $ | 6.99 | | | $ | 6.85 | | | $ | 7.48 | | | $ | 6.90 �� | |
| | | | |
| | | | | | | | | | | | | | | | | | | | |
| Total Return, at Net Asset Value3 | | | 3.68% | | | | 8.84% | | | | (2.94)% | | | | 15.80% | | | | 3.86% | |
| | | | | | | | | | | | | | | | | | | | |
| Ratios/Supplemental Data | | | | | | | | | | | | | | | | | | | | |
| Net assets, end of period (in thousands) | | $ | 1,234,906 | | | $ | 1,311,700 | | | $ | 1,463,567 | | | $ | 1,691,778 | | | $ | 1,479,323 | |
| |
| Average net assets (in thousands) | | $ | 1,344,166 | | | $ | 1,337,849 | | | $ | 1,735,006 | | | $ | 1,533,562 | | | $ | 1,545,519 | |
| |
| Ratios to average net assets:4 | | | | | | | | | | | | | | | | | | | | |
| Net investment income | | | 6.43% | | | | 6.49% | | | | 5.92% | | | | 6.23% | | | | 7.30% | |
| Expenses excluding interest and fees on short-term floating rate notes issued and interest and fees from borrowings | | | 1.50% | | | | 1.47% | | | | 1.50% | | | | 1.41% | | | | 1.41% | |
| Interest and fees from borrowings | | | 0.08% | | | | 0.09% | | | | 0.10% | | | | 0.12% | | | | 0.11% | |
| Interest and fees on short-term floating rate notes issued5 | | | 0.17% | | | | 0.25% | | | | 0.25% | | | | 0.31% | | | | 0.35% | |
| | | | |
| Total expenses | | | 1.75% | | | | 1.81% | | | | 1.85% | | | | 1.84% | | | | 1.87% | |
| Expenses after payments, waivers and/or reimbursements and reduction to custodian expenses | | | 1.75% | | | | 1.81% | | | | 1.85% | | | | 1.84% | | | | 1.87% | |
| |
| Portfolio turnover rate | | | 16% | | | | 16% | | | | 18% | | | | 11% | | | | 18% | |
1. July 29, 2011 represents the last business day of the Fund’s reporting period.
2. Per share amounts calculated based on the average shares outstanding during the period.
3. Assumes an initial investment on the business day before the first day of the fiscal period, with all dividends and distributions reinvested in additional shares on the reinvestment date, and redemption at the net asset value calculated on the last business day of the fiscal period. Sales charges are not reflected in the total returns. Total returns are not annualized for periods less than one full year. Returns do not reflect the deduction of taxes that a shareholder would pay on fund distributions or the redemption of fund shares. The returns do not include adjustments in accordance with generally accepted accounting principles required at the period end for financial reporting purposes.
4. Annualized for periods less than one full year.
5. Interest and fee expense related to the Fund’s liability for short-term floating rate notes issued in conjunction with inverse floating rate securities.
See accompanying Notes to Financial Statements.
67 OPPENHEIMER ROCHESTER HIGH YIELD MUNICIPAL FUND
FINANCIAL HIGHLIGHTS Continued
| | | | | | | | | | | | | | | | | | | | |
| Class Y | | Year Ended
July 31, 2015 | | | Year Ended
July 31,
2014 | | | Year Ended
July 31,
2013 | | | Year Ended
July 31,
2012 | | | Period Ended
July 29,
20111,2 | |
| Per Share Operating Data | | | | | | | | | | | | | | | | | | | | |
| Net asset value, beginning of period | | $ | 7.00 | | | $ | 6.86 | | | $ | 7.50 | | | $ | 6.91 | | | $ | 6.90 | |
| |
| Income (loss) from investment operations: | | | | | | | | | | | | | | | | | | | | |
| Net investment income3 | | | 0.52 | | | | 0.50 | | | | 0.52 | | | | 0.50 | | | | 0.36 | |
| Net realized and unrealized gain (loss) | | | (0.18) | | | | 0.14 | | | | (0.66) | | | | 0.62 | | | | 0.02 | |
| | | | |
| Total from investment operations | | | 0.34 | | | | 0.64 | | | | (0.14) | | | | 1.12 | | | | 0.38 | |
| |
| Dividends and/or distributions to shareholders: | | | | | | | | | | | | | | | | | | | | |
| Dividends from net investment income | | | (0.49) | | | | (0.50) | | | | (0.50) | | | | (0.53) | | | | (0.37) | |
| |
| Net asset value, end of period | | $ | 6.85 | | | $ | 7.00 | | | $ | 6.86 | | | $ | 7.50 | | | $ | 6.91 | |
| | | | |
| | | | | | | | | | | | | | | | | | | | |
| Total Return, at Net Asset Value4 | | | 4.61% | | | | 9.96% | | | | (2.19)% | | | | 16.97% | | | | 6.00% | |
| | | | | | | | | | | | | | | | | | | | |
| Ratios/Supplemental Data | | | | | | | | | | | | | | | | | | | | |
| Net assets, end of period (in thousands) | | $ | 692,717 | | | $ | 562,641 | | | $ | 472,068 | | | $ | 517,080 | | | $ | 172,676 | |
| |
| Average net assets (in thousands) | | $ | 700,339 | | | $ | 501,364 | | | $ | 572,611 | | | $ | 344,746 | | | $ | 62,327 | |
| |
| Ratios to average net assets:5 | | | | | | | | | | | | | | | | | | | | |
| Net investment income | | | 7.33% | | | | 7.36% | | | | 6.83% | | | | 7.05% | | | | 8.02% | |
| Expenses excluding interest and fees on short-term floating rate notes issued and interest and fees from borrowings | | | 0.59% | | | | 0.56% | | | | 0.59% | | | | 0.49% | | | | 0.48% | |
| Interest and fees from borrowings | | | 0.08% | | | | 0.09% | | | | 0.10% | | | | 0.12% | | | | 0.12% | |
| Interest and fees on short-term floating rate notes issued6 | | | 0.17% | | | | 0.25% | | | | 0.25% | | | | 0.31% | | | | 0.35% | |
| | | | |
| Total expenses | | | 0.84% | | | | 0.90% | | | | 0.94% | | | | 0.92% | | | | 0.95% | |
| Expenses after payments, waivers and/or reimbursements and reduction to custodian expenses | | | 0.84% | | | | 0.90% | | | | 0.94% | | | | 0.92% | | | | 0.95% | |
| |
| Portfolio turnover rate | | | 16% | | | | 16% | | | | 18% | | | | 11% | | | | 18% | |
1. January 29, 2011 represents the last business day of the Fund’s reporting period.
2. For the period from November 29, 2010 (inception of offering) to July 29, 2011.
3. Per share amounts calculated based on the average shares outstanding during the period.
4. Assumes an initial investment on the business day before the first day of the fiscal period, with all dividends and distributions reinvested in additional shares on the reinvestment date, and redemption at the net asset value calculated on the last business day of the fiscal period. Sales charges are not reflected in the total returns. Total returns are not annualized for periods less than one full year. Returns do not reflect the deduction of taxes that a shareholder would pay on fund distributions or the redemption of fund shares. The returns do not include adjustments in accordance with generally accepted accounting principles required at the period end for financial reporting purposes.
5. Annualized for periods less than one full year.
6. Interest and fee expense related to the Fund’s liability for short-term floating rate notes issued in conjunction with inverse floating rate securities.
See accompanying Notes to Financial Statements.
68 OPPENHEIMER ROCHESTER HIGH YIELD MUNICIPAL FUND
NOTES TO FINANCIAL STATEMENTS July 31, 2015
1. Organization
Oppenheimer Rochester High-Yield Municipal Fund (the “Fund”) is a separate series of Oppenheimer Multi-State Municipal Trust, a diversified, open-end management investment company registered under the Investment Company Act of 1940 (“1940 Act”), as amended. The Fund’s investment objective is to seek tax-free income. The Fund’s investment adviser is OFI Global Asset Management, Inc. (“OFI Global” or the “Manager”), a wholly-owned subsidiary of OppenheimerFunds, Inc. (“OFI” or the “Sub-Adviser”). The Manager has entered into a sub-advisory agreement with OFI.
The Fund offers Class A, Class C and Class Y shares, and previously offered Class B shares for new purchase through June 29, 2012. Subsequent to that date, no new purchases of Class B shares are permitted, however reinvestment of dividend and/or capital gain distributions and exchanges of Class B shares into and from other Oppenheimer funds will be allowed. Class A shares are sold at their offering price, which is normally net asset value plus a front-end sales charge. Class C shares are sold, and Class B shares were sold, without a front-end sales charge but may be subject to a contingent deferred sales charge (“CDSC”). Class Y shares are sold to certain institutional investors or intermediaries without either a front-end sales charge or a CDSC, however, the intermediaries may impose charges on their accountholders who beneficially own Class Y shares. All classes of shares have identical rights and voting privileges with respect to the Fund in general and exclusive voting rights on matters that affect that class alone. Earnings, net assets and net asset value per share may differ due to each class having its own expenses, such as transfer and shareholder servicing agent fees and shareholder communications, directly attributable to that class. Class A, B and C shares have separate distribution and/or service plans under which they pay fees. Class Y shares do not pay such fees. Class B shares will automatically convert to Class A shares 72 months after the date of purchase.
The following is a summary of significant accounting policies followed in the Fund’s preparation of financial statements in accordance with accounting principles generally accepted in the United States (“U.S. GAAP”).
2. Significant Accounting Policies
Security Valuation. All investments in securities are recorded at their estimated fair value, as described in Note 3.
Reporting Period End Date. The last day of the Fund’s reporting period is the last day the New York Stock Exchange was open for trading during the period. The Fund’s financial statements have been presented through that date to maintain consistency with the Fund’s net asset value calculations used for shareholder transactions.
Allocation of Income, Expenses, Gains and Losses. Income, expenses (other than those attributable to a specific class), gains and losses are allocated on a daily basis to each class of shares based upon the relative proportion of net assets represented by such class. Operating expenses directly attributable to a specific class are charged against the operations of that class.
69 OPPENHEIMER ROCHESTER HIGH YIELD MUNICIPAL FUND
|
| NOTES TO FINANCIAL STATEMENTS Continued |
|
| 2. Significant Accounting Policies (Continued) |
Dividends and Distributions to Shareholders. Dividends and distributions to shareholders, which are determined in accordance with income tax regulations and may differ from U.S. generally accepted accounting principles, are recorded on the ex-dividend date. Income distributions, if any, are declared daily and paid monthly. Capital gain distributions, if any, are declared and paid annually.
Investment Income. Interest income is recognized on an accrual basis. Discount and premium, which are included in interest income on the Statement of Operations, are amortized or accreted daily.
Custodian Fees. “Custodian fees and expenses” in the Statement of Operations may include interest expense incurred by the Fund on any cash overdrafts of its custodian account during the period. Such cash overdrafts may result from the effects of failed trades in portfolio securities and from cash outflows resulting from unanticipated shareholder redemption activity. The Fund pays interest to its custodian on such cash overdraft at a rate equal to the 1 Month LIBOR Rate plus 2.00%. The “Reduction to custodian expenses” line item, if applicable, represents earnings on cash balances maintained by the Fund during the period. Such interest expense and other custodian fees may be paid with these earnings.
Security Transactions. Security transactions are recorded on the trade date. Realized gains and losses on securities sold are determined on the basis of identified cost.
Indemnifications. The Fund’s organizational documents provide current and former Trustees and officers with a limited indemnification against liabilities arising in connection with the performance of their duties to the Fund. In the normal course of business, the Fund may also enter into contracts that provide general indemnifications. The Fund’s maximum exposure under these arrangements is unknown as this would be dependent on future claims that may be made against the Fund. The risk of material loss from such claims is considered remote.
Federal Taxes. The Fund intends to comply with provisions of the Internal Revenue Code applicable to regulated investment companies and to distribute substantially all of its investment company taxable income, including any net realized gain on investments not offset by capital loss carryforwards, if any, to shareholders. Therefore, no federal income or excise tax provision is required. The Fund files income tax returns in U.S. federal and applicable state jurisdictions. The statute of limitations on the Fund’s tax return filings generally remains open for the three preceding fiscal reporting period ends.
The tax components of capital shown in the following table represent distribution requirements the Fund must satisfy under the income tax regulations, losses the Fund may be able to offset against income and gains realized in future years and unrealized appreciation or depreciation of securities and other investments for federal income tax purposes.
70 OPPENHEIMER ROCHESTER HIGH YIELD MUNICIPAL FUND
|
|
|
| 2. Significant Accounting Policies (Continued) |
| | | | | | | | | | | | |
Undistributed Net Investment Income | | Undistributed Long-Term Gain | | | Accumulated Loss Carryforward1,2,3 | | | Net Unrealized Depreciation Based on cost of Securities and Other Investments for Federal Income Tax Purposes | |
$260,895,176 | | | $— | | | | $2,506,798,482 | | | | $1,303,958,887 | |
1. At period end, the Fund had $2,506,798,482 of net capital loss carryforward available to offset future realized capital gains, if any, and thereby reduce future taxable gain distributions. Details of the capital loss carryforwards are included in the table below. Capital loss carryovers with no expiration, if any, must be utilized prior to those with expiration dates.
| | | | |
| Expiring | | | |
2016 | | $ | 81,480,187 | |
2017 | | | 566,789,505 | |
2018 | | | 915,944,693 | |
2019 | | | 35,463,515 | |
No expiration | | | 907,120,582 | |
| | | | |
Total | | $ | 2,506,798,482 | |
| | | | |
2. During the reporting period, the Fund did not utilize any capital loss carryforward.
3. During the previous reporting period, the Fund did not utilize any capital loss carryforward.
Net investment income (loss) and net realized gain (loss) may differ for financial statement and tax purposes. The character of dividends and distributions made during the fiscal year from net investment income or net realized gains are determined in accordance with federal income tax requirements, which may differ from the character of net investment income or net realized gains presented in those financial statements in accordance with GAAP. Also, due to timing of dividends and distributions, the fiscal year in which amounts are distributed may differ from the fiscal year in which the income or net realized gain was recorded by the Fund.
Accordingly, the following amounts have been reclassified for the reporting period. Net assets of the Fund were unaffected by the reclassifications.
| | | | | | | | |
Reduction to Paid-in Capital | | Increase
to Accumulated
Net Investment
Income | | | Increase
to Accumulated Net
Realized Loss on Investments | |
$2,753,726 | | | $8,598,793 | | | | $5,845,067 | |
The tax character of distributions paid during the reporting periods:
| | | | | | | | |
| | | Year Ended
July 31, 2015 | | | Year Ended
July 31, 2014 | |
Distributions paid from: | | | | | | | | |
Exempt-interest dividends | | $ | 343,922,506 | | | $ | 372,313,272 | |
Ordinary income | | | 5,161,376 | | | | 7,583,226 | |
| | | | |
Total | | $ | 349,083,882 | | | $ | 379,896,498 | |
| | | | |
71 OPPENHEIMER ROCHESTER HIGH YIELD MUNICIPAL FUND
|
| NOTES TO FINANCIAL STATEMENTS Continued |
|
| 2. Significant Accounting Policies (Continued) |
The aggregate cost of securities and other investments and the composition of unrealized appreciation and depreciation of securities and other investments for federal income tax purposes at period end are noted in the following table. The primary difference between book and tax appreciation or depreciation of securities and other investments, if applicable, is attributable to the tax deferral of losses or tax realization of financial statement unrealized gain or loss.
| | | | |
Federal tax cost of securities | | $ | 6,062,089,174 | 1 |
| | | | |
Gross unrealized appreciation | | $ | 460,726,333 | |
Gross unrealized depreciation | | | (1,764,685,220) | |
| | | | |
Net unrealized depreciation | | $ | (1,303,958,887) | |
| | | | |
1. The Federal tax cost of securities does not include cost of $821,947,249, which has otherwise been recognized for financial reporting purposes, related to bonds placed into trusts in conjunction with certain investment transactions. See the Inverse Floating Rate Securities note in Note 4.
Use of Estimates. The preparation of financial statements in conformity with accounting principles generally accepted in the United States of America requires management to make estimates and assumptions that affect the reported amounts of assets and liabilities and disclosure of contingent assets and liabilities at the date of the financial statements and the reported amounts of increases and decreases in net assets from operations during the reporting period. Actual results could differ from those estimates.
3. Securities Valuation
The Fund calculates the net asset value of its shares as of the close of the New York Stock Exchange (the “Exchange”), normally 4:00 P.M. Eastern time, on each day the Exchange is open for trading.
The Fund’s Board has adopted procedures for the valuation of the Fund’s securities and has delegated the day-to-day responsibility for valuation determinations under those procedures to the Manager. The Manager has established a Valuation Committee which is responsible for determining a “fair valuation” for any security for which market quotations are not “readily available.” The Valuation Committee’s fair valuation determinations are subject to review, approval and ratification by the Fund’s Board at its next regularly scheduled meeting covering the calendar quarter in which the fair valuation was determined.
Valuation Methods and Inputs
Securities are valued using unadjusted quoted market prices, when available, as supplied primarily by third party pricing services or dealers.
The following methodologies are used to determine the market value or the fair value of the types of securities described below:
Securities traded on a registered U.S. securities exchange (including exchange-traded derivatives other than futures and futures options) are valued based on the last sale price of the security reported on the principal exchange on which it is traded, prior to the time when the Fund’s assets are valued. In the absence of a sale, the security is valued at the last sale price on the prior trading day, if it is within the spread of the current day’s closing “bid” and
72 OPPENHEIMER ROCHESTER HIGH YIELD MUNICIPAL FUND
|
|
|
| 3. Securities Valuation (Continued) |
“asked” prices, and if not, at the current day’s closing bid price. A security of a foreign issuer traded on a foreign exchange, but not listed on a registered U.S. securities exchange, is valued based on the last sale price on the principal exchange on which the security is traded, as identified by the third party pricing service used by the Manager, prior to the time when the Fund’s assets are valued. If the last sale price is unavailable, the security is valued at the most recent official closing price on the principal exchange on which it is traded. If the last sales price or official closing price for a foreign security is not available, the security is valued at the mean between the bid and asked price per the exchange or, if not available from the exchange, obtained from two dealers. If bid and asked prices are not available from either the exchange or two dealers, the security is valued by using one of the following methodologies (listed in order of priority): (1) using a bid from the exchange, (2) the mean between the bid and asked price as provided by a single dealer, or (3) a bid from a single dealer.
Shares of a registered investment company that are not traded on an exchange are valued at that investment company’s net asset value per share.
Corporate and government debt securities (of U.S. or foreign issuers) and municipal debt securities, event-linked bonds, loans, mortgage-backed securities, collateralized mortgage obligations, and asset-backed securities are valued at the mean between the “bid” and “asked” prices utilizing evaluated prices obtained from third party pricing services or broker-dealers who may use matrix pricing methods to determine the evaluated prices.
Short-term money market type debt securities with a remaining maturity of sixty days or less are valued at cost adjusted by the amortization of discount or premium to maturity (amortized cost), which approximates market value. Short-term debt securities with a remaining maturity in excess of sixty days are valued at the mean between the “bid” and “asked” prices utilizing evaluated prices obtained from third party pricing services or broker-dealers.
A description of the standard inputs that may generally be considered by the third party pricing vendors in determining their evaluated prices is provided below.
| | |
| Security Type | | Standard inputs generally considered by third-party pricing vendors |
Corporate debt, government debt, municipal,
mortgage-backed and asset-backed securities | | Reported trade data, broker-dealer price quotations, benchmark yields, issuer spreads on comparable securities, the credit quality, yield, maturity, and other appropriate factors. |
| Loans | | Information obtained from market participants regarding reported trade data and broker-dealer price quotations. |
| Event-linked bonds | | Information obtained from market participants regarding reported trade data and broker-dealer price quotations. |
If a market value or price cannot be determined for a security using the methodologies described above, or if, in the “good faith” opinion of the Manager, the market value or price obtained does not constitute a “readily available market quotation,” or a significant event has occurred that would materially affect the value of the security, the security is fair valued either (i) by a standardized fair valuation methodology applicable to the security type or the significant event as previously approved by the Valuation Committee and the Fund’s Board or (ii) as determined in good faith by the Manager’s Valuation Committee. The Valuation
73 OPPENHEIMER ROCHESTER HIGH YIELD MUNICIPAL FUND
|
| NOTES TO FINANCIAL STATEMENTS Continued |
|
| 3. Securities Valuation (Continued) |
Committee considers all relevant facts that are reasonably available, through either public information or information available to the Manager, when determining the fair value of a security. Fair value determinations by the Manager are subject to review, approval and ratification by the Fund’s Board at its next regularly scheduled meeting covering the calendar quarter in which the fair valuation was determined. Those fair valuation standardized methodologies include, but are not limited to, valuing securities at the last sale price or initially at cost and subsequently adjusting the value based on: changes in company specific fundamentals, changes in an appropriate securities index, or changes in the value of similar securities which may be further adjusted for any discounts related to security-specific resale restrictions. When possible, such methodologies use observable market inputs such as unadjusted quoted prices of similar securities, observable interest rates, currency rates and yield curves. The methodologies used for valuing securities are not necessarily an indication of the risks associated with investing in those securities nor can it be assured that the Fund can obtain the fair value assigned to a security if it were to sell the security.
To assess the continuing appropriateness of security valuations, the Manager, or its third party service provider who is subject to oversight by the Manager, regularly compares prior day prices, prices on comparable securities, and sale prices to the current day prices and challenges those prices exceeding certain tolerance levels with the third party pricing service or broker source. For those securities valued by fair valuations, whether through a standardized fair valuation methodology or a fair valuation determination, the Valuation Committee reviews and affirms the reasonableness of the valuations based on such methodologies and fair valuation determinations on a regular basis after considering all relevant information that is reasonably available.
Classifications
Each investment asset or liability of the Fund is assigned a level at measurement date based on the significance and source of the inputs to its valuation. Various data inputs are used in determining the value of each of the Fund’s investments as of the reporting period end. These data inputs are categorized in the following hierarchy under applicable financial accounting standards:
1) Level 1-unadjusted quoted prices in active markets for identical assets or liabilities (including securities actively traded on a securities exchange)
2) Level 2-inputs other than unadjusted quoted prices that are observable for the asset or liability (such as unadjusted quoted prices for similar assets and market corroborated inputs such as interest rates, prepayment speeds, credit risks, etc.)
3) Level 3-significant unobservable inputs (including the Manager’s own judgments about assumptions that market participants would use in pricing the asset or liability).
The inputs used for valuing securities are not necessarily an indication of the risks associated with investing in those securities.
The table below categorizes amounts that are included in the Fund’s Statement of Assets and Liabilities at period end based on valuation input level:
74 OPPENHEIMER ROCHESTER HIGH YIELD MUNICIPAL FUND
|
|
|
| 3. Securities Valuation (Continued) |
| | | | | | | | | | | | | | | | |
| | | Level 1—
Unadjusted
Quoted Prices | | | Level 2— Other Significant
Observable Inputs | | | Level 3—
Significant
Unobservable
Inputs | | | Value | |
Assets Table | | | | | | | | | | | | | | | | |
Investments, at Value: | | | | | | | | | | | | | | | | |
Municipal Bonds and Notes | | | | | | | | | | | | | | | | |
Alabama | | $ | — | | | $ | 210,936,428 | | | $ | — | | | $ | 210,936,428 | |
Alaska | | | — | | | | 14,696,059 | | | | — | | | | 14,696,059 | |
Arizona | | | — | | | | 81,473,926 | | | | 1,812,309 | | | | 83,286,235 | |
Arkansas | | | — | | | | — | | | | 3,372,887 | | | | 3,372,887 | |
California | | | — | | | | 706,701,564 | | | | 20 | | | | 706,701,584 | |
Colorado | | | — | | | | 151,849,392 | | | | 5,648,307 | | | | 157,497,699 | |
Connecticut | | | — | | | | 3,333,716 | | | | — | | | | 3,333,716 | |
Delaware | | | — | | | | 6,985,864 | | | | — | | | | 6,985,864 | |
District of Columbia | | | — | | | | 100,594,000 | | | | — | | | | 100,594,000 | |
Florida | | | — | | | | 538,786,950 | | | | 9,202,022 | | | | 547,988,972 | |
Georgia | | | — | | | | 73,423,047 | | | | — | | | | 73,423,047 | |
Hawaii | | | — | | | | 2,977,131 | | | | — | | | | 2,977,131 | |
Idaho | | | — | | | | 1,537,437 | | | | — | | | | 1,537,437 | |
Illinois | | | — | | | | 349,098,361 | | | | 14,883,717 | | | | 363,982,078 | |
Indiana | | | — | | | | 48,718,582 | | | | — | | | | 48,718,582 | |
Iowa | | | — | | | | 44,841,231 | | | | — | | | | 44,841,231 | |
Kansas | | | — | | | | 2,203,969 | | | | — | | | | 2,203,969 | |
Kentucky | | | — | | | | 19,994,938 | | | | — | | | | 19,994,938 | |
Louisiana | | | — | | | | 15,026,117 | | | | 2,591,258 | | | | 17,617,375 | |
Maine | | | — | | | | 19,405,644 | | | | — | | | | 19,405,644 | |
Maryland | | | — | | | | 675,113 | | | | — | | | | 675,113 | |
Massachusetts | | | — | | | | 67,292,763 | | | | 28,657 | | | | 67,321,420 | |
Michigan | | | — | | | | 152,317,302 | | | | — | | | | 152,317,302 | |
Minnesota | | | — | | | | 32,778,103 | | | | — | | | | 32,778,103 | |
Mississippi | | | — | | | | 10,820,684 | | | | — | | | | 10,820,684 | |
Missouri | | | — | | | | 75,303,624 | | | | — | | | | 75,303,624 | |
Montana | | | — | | | | 2,829,628 | | | | 4,429,943 | | | | 7,259,571 | |
Nebraska | | | — | | | | 33,109,635 | | | | — | | | | 33,109,635 | |
Nevada | | | — | | | | 12,772,699 | | | | — | | | | 12,772,699 | |
New Hampshire | | | — | | | | 6,283,780 | | | | — | | | | 6,283,780 | |
New Jersey | | | — | | | | 316,431,199 | | | | — | | | | 316,431,199 | |
New Mexico | | | — | | | | 10,264,244 | | | | — | | | | 10,264,244 | |
New York | | | — | | | | 458,677,951 | | | | — | | | | 458,677,951 | |
North Carolina | | | — | | | | 3,405,702 | | | | — | | | | 3,405,702 | |
North Dakota | | | — | | | | 2,347,024 | | | | — | | | | 2,347,024 | |
Ohio | | | — | | | | 423,929,902 | | | | 1,342,084 | | | | 425,271,986 | |
Oklahoma | | | — | | | | 8,064,235 | | | | — | | | | 8,064,235 | |
Oregon | | | — | | | | 2,665,523 | | | | — | | | | 2,665,523 | |
Pennsylvania | | | — | | | | 46,821,321 | | | | 1,080,292 | | | | 47,901,613 | |
Rhode Island | | | — | | | | 30,365,531 | | | | — | | | | 30,365,531 | |
South Carolina | | | — | | | | 15,614,819 | | | | 14,189,581 | | | | 29,804,400 | |
South Dakota | | | — | | | | 1,424,972 | | | | — | | | | 1,424,972 | |
Tennessee | | | — | | | | 16,317,494 | | | | 3,467,100 | | | | 19,784,594 | |
Texas | | | — | | | | 503,847,852 | | | | 17,617,742 | | | | 521,465,594 | |
Utah | | | — | | | | 30,622,809 | | | | — | | | | 30,622,809 | |
Vermont | | | — | | | | 1,129,815 | | | | — | | | | 1,129,815 | |
Virginia | | | — | | | | 40,938,867 | | | | 6,678,895 | | | | 47,617,762 | |
75 OPPENHEIMER ROCHESTER HIGH YIELD MUNICIPAL FUND
|
| NOTES TO FINANCIAL STATEMENTS Continued |
|
| 3. Securities Valuation (Continued) |
| | | | | | | | | | | | | | | | |
| | | Level 1—
Unadjusted
Quoted Prices | | | Level 2— Other Significant
Observable Inputs | | | Level 3—
Significant
Unobservable
Inputs | | | Value | |
Municipal Bonds and Notes (Continued) | | | | | | | | | | | | | | | | |
Washington | | $ | — | | | $ | 80,885,474 | | | $ | — | | | $ | 80,885,474 | |
West Virginia | | | — | | | | 26,839,998 | | | | — | | | | 26,839,998 | |
Wisconsin | | | — | | | | 34,739,239 | | | | 20 | | | | 34,739,259 | |
U.S. Possessions | | | — | | | | 634,215,526 | | | | — | | | | 634,215,526 | |
Common Stocks | | | 751,094 | | | | — | | | | — | | | | 751,094 | |
Rights, Warrants and Certificates | | | 164,424 | | | | — | | | | — | | | | 164,424 | |
Corporate Loans | | | — | | | | — | | | | 16,500,000 | | | | 16,500,000 | |
| | | | |
Total Assets | | $ | 915,518 | | | $ | 5,476,317,184 | | | $ | 102,844,834 | | | $ | 5,580,077,536 | |
| | | | |
Forward currency exchange contracts and futures contracts, if any, are reported at their unrealized appreciation/depreciation at measurement date, which represents the change in the contract’s value from trade date. All additional assets and liabilities included in the above table are reported at their market value at measurement date.
The table below shows the transfers between Level 2 and Level 3. The Fund’s policy is to recognize transfers in and transfers out as of the beginning of the reporting period.
| | | | | | | | |
| | | Transfers out of
Level 2* | | | Transfers into
Level 3* | |
Assets Table | | | | | | | | |
Investments, at Value: | | | | | | | | |
Municipal Bonds and Notes | | | | | | | | |
Arizona | | $ | (771,124 | ) | | $ | 771,124 | |
Colorado | | | (321,016 | ) | | | 321,016 | |
Florida | | | (16,727,036 | ) | | | 16,727,036 | |
Louisiana | | | (2,740,220 | ) | | | 2,740,220 | |
Montana | | | (4,694,229 | ) | | | 4,694,229 | |
Pennsylvania | | | (1,113,958 | ) | | | 1,113,958 | |
Texas | | | (3,214,088 | ) | | | 3,214,088 | |
Virginia | | | (14,154,512 | ) | | | 14,154,512 | |
Corporate Loans | | | (10,500,000 | ) | | | 10,500,000 | |
| | | | |
Total Assets | | $ | (54,236,183 | ) | | $ | 54,236,183 | |
| | | | |
* Transferred from Level 2 to Level 3 because of the lack of observable market data.
The following is a reconciliation of assets in which significant unobservable inputs (level 3) were used in determining fair value:
| | | | | | | | | | | | | | | | |
| | | Value as of
July 31, 2014 | | | Realized gain
(loss) | | | Change in
unrealized
appreciation/
depreciation | | | Accretion/
(amortization)
of premium/
discounta | |
Assets Table | | | | | | | | | | | | | | | | |
Investments, at Value: | | | | | | | | | | | | | | | | |
Municipal Bonds and Notes | | | | | | | | | | | | | | | | |
Arizona | | $ | 1,033,367 | | | $ | — | | | $ | 7,818 | | | $ | — | |
Arkansas | | | 3,825,389 | | | | — | | | | 857,498 | | | | — | |
California | | | 20 | | | | — | | | | — | | | | — | |
Colorado | | | 6,653,169 | | | | — | | | | (651,462 | ) | | | 1,075,584 | |
76 OPPENHEIMER ROCHESTER HIGH YIELD MUNICIPAL FUND
|
|
|
| 3. Securities Valuation (Continued) |
| | | | | | | | | | | | | | | | |
| | | Value as of
July 31, 2014 | | | Realized gain
(loss) | | | Change in
unrealized
appreciation/
depreciation | | | Accretion/
(amortization)
of premium/
discounta | |
Municipal Bonds and Notes (Continued) | | | | | | | | | | | | | | | | |
Florida | | $ | 4,022,008 | | | $ | (32,546 | ) | | $ | (5,517,420 | ) | | $ | (834,649) | |
Illinois | | | 12,395,454 | | | | — | | | | 4,553,263 | | | | — | |
Indiana | | | 12,268,148 | | | | 943,559 | | | | 3,462,093 | | | | — | |
Louisiana | | | — | | | | — | | | | (148,962 | ) | | | — | |
Massachusetts | | | 7 | | | | (5,142 | ) | | | 42,429 | | | | 21,138 | |
Minnesota | | | 12,502,516 | | | | 1,468,000 | | | | 2,177,484 | | | | — | |
Montana | | | — | | | | — | | | | (268,536 | ) | | | 4,250 | |
Nebraska | | | 342,875 | | | | (1,249,987 | ) | | | 907,125 | | | | — | |
New Jersey | | | 9 | | | | (781,479 | ) | | | 781,470 | | | | — | |
New York | | | 450,180 | | | | (2,398,758 | ) | | | 2,422,232 | | | | — | |
Ohio | | | 503,671 | | | | (5,614 | ) | | | (382,249 | ) | | | — | |
Pennsylvania | | | — | | | | — | | | | (33,666 | ) | | | — | |
South Carolina | | | 14,935,702 | | | | 183,304 | | | | 467,091 | | | | 17,484 | |
Tennessee | | | 2,933,700 | | | | — | | | | 533,400 | | | | — | |
Texas | | | 15,520,288 | | | | — | | | | (896,634 | ) | | | — | |
Virginia | | | 24 | | | | — | | | | (7,521,545 | ) | | | 45,904 | |
Wisconsin | | | 20 | | | | — | | | | — | | | | — | |
Corporate Loans | | | — | | | | — | | | | — | | | | — | |
| | | | |
Total Assets | | $ | 87,386,547 | | | $ | (1,878,663 | ) | | $ | 791,429 | | | $ | 329,711 | |
| | | | |
| | | | | | | | | | | | | | | | |
| Assets Table (Continued) | | Purchases | | | Sales | | | Transfers into
Level 3 | | | Value as of
July 31, 2015 | |
Investments, at Value: | | | | | | | | | | | | | | | | |
Municipal Bonds and Notes (Continued) | | | | | | | | | | | | | | | | |
Arizona | | $ | — | | | $ | — | | | $ | 771,124 | | | $ | 1,812,309 | |
Arkansas | | | — | | | | (1,310,000 | ) | | | — | | | | 3,372,887 | |
California | | | — | | | | — | | | | — | | | | 20 | |
Colorado | | | — | | | | (1,750,000 | ) | | | 321,016 | | | | 5,648,307 | |
Florida | | | 130,991 | | | | (5,293,398 | ) | | | 16,727,036 | | | | 9,202,022 | |
Illinois | | | — | | | | (2,065,000 | ) | | | — | | | | 14,883,717 | |
Indiana | | | — | | | | (16,673,800 | ) | | | — | | | | — | |
Louisiana | | | — | | | | — | | | | 2,740,220 | | | | 2,591,258 | |
Massachusetts | | | — | | | | (29,775 | ) | | | — | | | | 28,657 | |
Minnesota | | | — | | | | (16,148,000 | ) | | | — | | | | — | |
Montana | | | — | | | | — | | | | 4,694,229 | | | | 4,429,943 | |
Nebraska | | | — | | | | (13 | ) | | | — | | | | — | |
New Jersey | | | — | | | | — | | | | — | | | | — | |
New York | | | — | | | | (473,654 | ) | | | — | | | | — | |
Ohio | | | 1,226,276 | | | | — | | | | — | | | | 1,342,084 | |
Pennsylvania | | | — | | | | — | | | | 1,113,958 | | | | 1,080,292 | |
South Carolina | | | — | | | | (1,414,000 | ) | | | — | | | | 14,189,581 | |
Tennessee | | | — | | | | — | | | | — | | | | 3,467,100 | |
Texas | | | — | | | | (220,000 | ) | | | 3,214,088 | | | | 17,617,742 | |
Virginia | | | — | | | | — | | | | 14,154,512 | | | | 6,678,895 | |
Wisconsin | | | — | | | | — | | | | — | | | | 20 | |
Corporate Loans | | | 6,000,000 | | | | — | | | | 10,500,000 | | | | 16,500,000 | |
| | | | |
Total Assets | | $ | 7,357,267 | | | $ | (45,377,640 | ) | | $ | 54,236,183 | | | $ | 102,844,834 | |
| | | | |
a. Included in net investment income.
77 OPPENHEIMER ROCHESTER HIGH YIELD MUNICIPAL FUND
|
| NOTES TO FINANCIAL STATEMENTS Continued |
|
| 3. Securities Valuation (Continued) |
The total change in unrealized appreciation/depreciation included in the Statement of Operations attributable to Level 3 investments still held at period end:
| | | | |
| | | Change in
unrealized
appreciation/
depreciation | |
Assets Table | | | | |
Investments, at Value: | | | | |
Municipal Bonds and Notes | | | | |
Arizona | | $ | 7,818 | |
Arkansas | | | 857,498 | |
Colorado | | | (1,185,212) | |
Florida | | | (7,607,801) | |
Illinois | | | 4,553,263 | |
Louisiana | | | (148,962) | |
Massachusetts | | | 42,430 | |
Montana | | | (268,536) | |
Ohio | | | (387,723) | |
Pennsylvania | | | (33,666) | |
South Carolina | | | 467,091 | |
Tennessee | | | 533,400 | |
Texas | | | (896,634) | |
Virginia | | | (7,521,545) | |
| | | | |
Total Assets | | $ | (11,588,579) | |
| | | | |
The following table summarizes the valuation techniques and significant unobservable inputs used in determining fair value measurements for those investments classified as Level 3 at period end:
| | | | | | | | | | | | | | | | | | | | |
| | | Value as of July
31, 2015 | | | Valuation
Technique | | | Unobservable
Input | | | Range of
Unobservable
Inputs | | | Unobservable
Input Used | |
Assets Table | | | | | | | | | | | | | | | | | | | | |
Investments, at Value: | | | | | | | | | | | | | | | | | | | | |
Municipal Bonds and Notes | | | | | | | | | | | | | | | | | | | | |
Arizona | | $ | 1,812,309 | | | | Pricing service | | | | N/A | | | | N/A | | | | N/A (a) | |
Arkansas | | | 3,372,887 | | | | Pricing service | | | | N/A | | | | N/A | | | | N/A (a) | |
California | | | 20 | | | | Pricing service | | | | N/A | | | | N/A | | | | N/A (a) | |
Colorado | | | 5,648,307 | | | | Pricing service | | | | N/A | | | | N/A | | | | N/A (a) | |
Florida | | | 9,202,022 | | | | Pricing service | | | | N/A | | | | N/A | | | | N/A (a) | |
Illinois | | | 14,883,717 | | | | Pricing service | | | | N/A | | | | N/A | | | | N/A (a) | |
Louisiana | | | 2,591,258 | | | | Pricing service | | | | N/A | | | | N/A | | | | N/A (a) | |
Massachusetts | | | 28,657 | | | | Pricing service | | | | N/A | | | | N/A | | | | N/A (a) | |
Montana | | | 4,429,943 | | | | Pricing service | | | | N/A | | | | N/A | | | | N/A (a) | |
Ohio | | | 838,553 | | | | Pricing service | | | | N/A | | | | N/A | | | | N/A (a) | |
Ohio | | | 503,531 | | |
| Discount to
expected
distribution |
| | | Discount rate | | | | N/A | | | | 20% (b) | |
Pennsylvania | | | 1,080,292 | | | | Pricing service | | | | N/A | | | | N/A | | | | N/A (a) | |
South Carolina | | | 14,189,581 | | | | Pricing service | | | | N/A | | | | N/A | | | | N/A (a) | |
Tennessee | | | 3,467,100 | | | | Pricing service | | | | N/A | �� | | | N/A | | | | N/A (a) | |
78 OPPENHEIMER ROCHESTER HIGH YIELD MUNICIPAL FUND
|
|
|
| 3. Securities Valuation (Continued) |
| | | | | | | | | | | | | | | | | | | | |
| | | Value as of July
31, 2015 | | | Valuation
Technique | | | Unobservable
Input | | | Range of
Unobservable
Inputs | | | Unobservable
Input Used | |
Municipal Bonds and Notes (Continued) | | | | | | | | | | | | | | | | | | | | |
Texas | | $ | 17,617,742 | | | | Pricing service | | | | N/A | | | | N/A | | | | N/A (a) | |
Virginia | | | 6,678,895 | | | | Pricing service | | | | N/A | | | | N/A | | | | N/A (a) | |
Wisconsin | | | 20 | | | | Pricing service | | | | N/A | | | | N/A | | | | N/A (a) | |
Corporate Loans | | | 16,500,000 | | |
| Recent
transaction
price |
| | | N/A | | | | N/A | | |
| 100% of
par (c) |
|
| | | | | | | | | | | | | | | | | | | | |
Total | | $ | 102,844,834 | | | | | | | | | | | | | | | | | |
| | | | | | | | | | | | | | | | | | | | |
(a) Securities classified as Level 3 whose unadjusted values were provided by a pricing service and for which such inputs are unobservable. The Manager periodically reviews pricing vendor methodologies and inputs to confirm they are determined using unobservable inputs and have been appropriately classified. Such securities’ fair valuations could change significantly based on changes in unobservable inputs used by the pricing service.
(b) The Fund fair values certain municipals bonds using a discount to reflect uncertainty of timing and amount of future distribution. A significant increase (decrease) to the expected distribution amount or a significant decrease (increase) to the discount rate will result in a significant increase (decrease) to the fair value of the investment.
(c) The Fund fair values certain corporate loans at a recent transaction price, based on a transaction within the past seven months. The Manager monitors such investments for additional market information or the occurrence of a significant event which would warrant a re-evaluation of the security’s fair valuation.
4. Investments and Risks
Inverse Floating Rate Securities. The Fund invests in inverse floating rate securities that pay interest at a rate that varies inversely with short-term interest rates. Because inverse floating rate securities are leveraged instruments, the value of an inverse floating rate security will change more significantly in response to changes in interest rates and other market fluctuations than the market value of a conventional fixed-rate municipal security of similar maturity and credit quality, including the municipal bond underlying an inverse floating rate security.
An inverse floating rate security is created as part of a financial transaction referred to as a “tender option bond” transaction. In most cases, in a tender option bond transaction the Fund sells a fixed-rate municipal bond (the “underlying municipal bond”) to a trust (the “Trust”). The Trust then issues and sells short-term floating rate securities with a fixed principal amount representing a senior interest in the underlying municipal bond to third parties and a residual, subordinate interest in the underlying municipal bond (referred to as an “inverse floating rate security”) to the Fund. The interest rate on the short-term floating rate securities resets periodically, usually weekly, to a prevailing market rate and holders of these securities are granted the option to tender their securities back to the Trust for repurchase at their principal amount plus accrued interest thereon (the “purchase price”) periodically, usually daily or weekly. A remarketing agent for the Trust is required to attempt to re-sell any tendered short-term floating rate securities to new investors for the purchase price. If the remarketing agent is unable to successfully re-sell the tendered short-term floating rate securities, a liquidity provider to the Trust must contribute cash to the Trust to ensure that the tendering holders receive the purchase price of their securities on the repurchase date.
79 OPPENHEIMER ROCHESTER HIGH YIELD MUNICIPAL FUND
|
| NOTES TO FINANCIAL STATEMENTS Continued |
|
| 4. Investments and Risks (Continued) |
Because holders of the short-term floating rate securities are granted the right to tender their securities to the Trust for repurchase at frequent intervals for the purchase price, with such payment effectively guaranteed by the liquidity provider, the securities generally bear short-term rates of interest commensurate with money market instruments. When interest is paid on the underlying municipal bond to the Trust, such proceeds are first used to pay the Trust’s administrative expenses and accrued interest to holders of the short-term floating rate securities, with any remaining amounts being paid to the Fund, as the holder of the inverse floating rate security. Accordingly, the amount of such interest on the underlying municipal bond paid to the Fund is inversely related the rate of interest on the short-term floating rate securities. Additionally, because the principal amount of the short-term floating rate securities is fixed and is not adjusted in response to changes in the market value of the underlying municipal bond, any change in the market value of the underlying municipal bond is reflected entirely in a change to the value of the inverse floating rate security.
Typically, the terms of an inverse floating rate security grant certain rights to the Fund, as holder. For example, the Fund typically has the right upon request to require that the Trust compel a tender of the short-term floating rate securities to facilitate the Fund’s acquisition of the underlying municipal bond. Following such a request, the Fund pays the Trust the purchase price of the short-term floating rate securities and a specified portion of any market value gain on the underlying municipal bond since its deposit into the Trust, which the Trust uses to redeem the short-term floating rate securities. The Trust then distributes the underlying municipal bond to the Fund. Through the exercise of this right, the Fund can voluntarily terminate or “collapse” the Trust, terminate its investment in the related inverse floating rate security and obtain the underlying municipal bond. Additionally, the Fund also typically has the right to exchange with the Trust (i) a principal amount of short-term floating rate securities held by the Fund for a corresponding additional principal amount of the inverse floating rate security or (ii) a principal amount of the inverse floating rate security held by the Fund for a corresponding additional principal amount of short-term floating rate securities (which are typically then sold to other investors). Through the exercise of this right, the Fund may increase (or decrease) the principal amount of short-term floating rate securities outstanding, thereby increasing (or decreasing) the amount of leverage provided by the short-term floating rate securities to the Fund’s investment exposure to the underlying municipal bond.
The Fund’s investments in inverse floating rate securities involve certain risks. As short-term interest rates rise, an inverse floating rate security produces less current income (and, in extreme cases, may pay no income) and as short-term interest rates fall, an inverse floating rate security produces more current income. Thus, if short-term interest rates rise after the issuance of the inverse floating rate security, any yield advantage is reduced or eliminated. All inverse floating rate securities entail some degree of leverage represented by the outstanding principal amount of the related short-term floating rate securities, relative to the par value of the underlying municipal bond. The value of, and income earned on, an inverse floating rate security that has a higher degree of leverage will fluctuate more significantly in response to changes in interest rates and to changes in the market value of the related underlying municipal bond than that of an inverse floating rate security with a lower degree of leverage,
80 OPPENHEIMER ROCHESTER HIGH YIELD MUNICIPAL FUND
|
|
|
| 4. Investments and Risks (Continued) |
and is more likely to be eliminated entirely under adverse market conditions. Changes in the value of an inverse floating rate security will also be more significant than changes in the market value of the related underlying municipal bond because the leverage provided by the related short-term floating rate securities increases the sensitivity of an inverse floating rate security to changes in interest rates and to the market value of the underlying municipal bond. An inverse floating rate security can be expected to underperform fixed-rate municipal bonds when the difference between long-term and short-term interest rates is decreasing (or is already small) or when long-term interest rates are rising, but can be expected to outperform fixed-rate municipal bonds when the difference between long-term and short-term interest rates is increasing (or is already large) or when long-term interest rates are falling. Additionally, a tender option bond transaction typically provides for the automatic termination or “collapse” of a Trust upon the occurrence of certain adverse events, usually referred to as “mandatory tender events” or “tender option termination events.” These events may include, among others, a credit ratings downgrade of the underlying municipal bond below a specified level, a decrease in the market value of the underlying municipal bond below a specified amount, a bankruptcy of the liquidity provider or the inability of the remarketing agent to re-sell to new investors short-term floating rate securities that have been tendered for repurchase by holders thereof. Following the occurrence of such an event, the underlying municipal bond is generally sold for current market value and the proceeds distributed to holders of the short-term floating rate securities and inverse floating rate security, with the holder of the inverse floating rate security (the Fund) generally receiving the proceeds of such sale only after the holders of the short-term floating rate securities have received proceeds equal to the purchase price of their securities (and the liquidity provider is generally required to contribute cash to the Trust only in an amount sufficient to ensure that the holders of the short-term floating rate securities receive the purchase price of their securities in connection with such termination of the Trust). Following the occurrence of such events, the Fund could potentially lose the entire amount of its investment in the inverse floating rate security.
Finally, the Fund may enter into shortfall/reimbursement agreements with the liquidity provider of certain tender option bond transactions in connection with certain inverse floating rate securities held by the Fund. These agreements commit the Fund to reimburse the liquidity provider to the extent that the liquidity provider must provide cash to a Trust, including following the termination of a Trust resulting from the occurrence of a “mandatory tender event.” In connection with the occurrence of such an event and the termination of the Trust triggered thereby, the shortfall/reimbursement agreement will make the Fund liable for the amount of the negative difference, if any, between the liquidation value of the underlying municipal bond and the purchase price of the short-term floating rate securities issued by the Trust. Under the standard terms of a tender option bond transaction, absent such a shortfall/reimbursement agreement, the Fund, as holder of the inverse floating rate security, would not be required to make such a reimbursement payment to the liquidity provider. The Manager monitors the Fund’s potential exposure with respect to these agreements on a daily basis and intends to take action to terminate the Fund’s investment in related inverse floating
81 OPPENHEIMER ROCHESTER HIGH YIELD MUNICIPAL FUND
|
| NOTES TO FINANCIAL STATEMENTS Continued |
|
| 4. Investments and Risks (Continued) |
rate securities, if it deems it appropriate to do so. At period end, the Fund’s maximum exposure under such agreements is estimated at $484,360,000.
When the Fund creates an inverse floating rate security in a tender option bond transaction by selling an underlying municipal bond to a Trust, the transaction is considered a secured borrowing for financial reporting purposes. As a result of such accounting treatment, the Fund includes the underlying municipal bond on its Statement of Investments and as an asset on its Statement of Assets and Liabilities (but does not separately include the related inverse floating rate security on either). The Fund also includes a liability on its Statement of Assets and Liabilities equal to the outstanding principal amount and accrued interest on the related short-term floating rate securities issued by the Trust. Interest on the underlying municipal bond is recorded as investment income on the Fund’s Statement of Operations, while interest payable on the related short-term floating rate securities is recorded as interest expense. At period end, municipal bond holdings with a value of $1,223,300,625 shown on the Fund’s Statement of Investments are held by such Trusts and serve as the underlying municipal bonds for the related $722,510,000 in short-term floating rate securities issued and outstanding at that date.
At period end, the inverse floating rate securities associated with tender option bond transactions accounted for as secured borrowings were as follows:
| | | | | | | | | | | | | | | | |
Principal
Amount | | | Inverse Floater1 | | Coupon
Rate2 | | | Maturity
Date | | | Value | |
| | $ 2,490,000 | | | Allen County, OH Hospital Facilities (Mercy Health) Tender Option Bond Series 2015 XF-0235 Trust | | | 18.364% | | | | 6/1/38 | | | $ | 3,453,854 | |
| | 400,000 | | | CA GO Tender Option Bond Series 2015-XF2148 Trust3 | | | 11.799 | | | | 12/1/36 | | | | 403,008 | |
| | 77,555,000 | | | CA Golden State Tobacco Securitization Corp. ROLs3 | | | 6.743 | | | | 6/1/47 | | | | 58,279,480 | |
| | 3,750,000 | | | CA Health Facilities Financing Authority (SJHS/SJHCN Obligated Group) ROLs | | | 21.353 | | | | 7/1/39 | | | | 5,907,300 | |
| | 5,550,000 | | | CA Health Facilities Financing Authority Tender Option Bond Series 2015-XF2027 Trust3 | | | 8.067 | | | | 11/15/42 | | | | 5,972,577 | |
| | 3,855,000 | | | CA Health Facilities Financing Authority Tender Option Bond Series 2015-XF2104 Trust3 | | | 18.171 | | | | 7/1/39 | | | | 6,072,704 | |
| | 5,000,000 | | | CA Infrastructure and Economic Devel. (Sanford Consortium) RITES | | | 8.042 | | | | 5/15/40 | | | | 5,834,400 | |
| | 2,615,000 | | | Cerritos, CA Community College District DRIVERS | | | 16.064 | | | | 8/1/33 | | | | 4,355,230 | |
| | 16,250,000 | | | Chicago, IL GO ROLs3 | | | 8.285 | | | | 1/1/33 | | | | 15,063,425 | |
| | 7,175,000 | | | CO Health Facilities Authority (Sisters of Charity of Leavenworth Health System) Tender Option Bond Series 2015 XF-0239 Trust | | | 8.061 | | | | 1/1/44 | | | | 8,611,292 | |
| | 2,525,000 | | | Detroit, MI City School District Tender Option Bond Series 2015 XF-0241 Trust3 | | | 16.792 | | | | 5/1/29 | | | | 4,515,306 | |
| | 2,500,000 | | | District of Columbia GO Tender Option Bond Series 2015- XF2018 Trust3 | | | 7.980 | | | | 4/1/35 | | | | 3,079,200 | |
| | 4,675,000 | | | Douglas County, NE Hospital Authority Tender Option Bond Series 2015-XF2132 Trust3 | | | 19.493 | | | | 11/1/48 | | | | 7,648,160 | |
| | 680,000 | | | Fulton County, GA Devel. Authority (PHC/FCommH/PHosp/ PMSH/ PNH/PMCC/PClinic/PHlthCF/ PHI/PHIP/PHHosp Obligated Group) ROLs | | | 16.344 | | | | 6/15/29 | | | | 943,425 | |
| | 3,465,000 | | | Fulton County, GA Devel. Authority (PHC/FCommH/PHosp/ PMSH/PNH/PMCC/PClinic/PHlthCF/PHI/PHIP/PHHosp Obligated Group) ROLs | | | 16.163% | | | | 6/15/37 | | | $ | 4,722,518 | |
82 OPPENHEIMER ROCHESTER HIGH YIELD MUNICIPAL FUND
|
|
|
| 4. Investments and Risks (Continued) |
| | | | | | | | | | | | | | | | |
Principal
Amount | | | Inverse Floater1 | | Coupon
Rate2 | | | Maturity
Date | | | Value | |
| | $ 7,280,000 | | | Fulton County, GA Devel. Authority (PHC/FCommH/PHosp/ PMSH/PNH/PMCC/PClinic/PHlthCF/PHI/PHIP/PHHosp Obligated Group) Tender Option Bond Series 2015- XF0024 Trust | | | 15.413% | | | | 6/15/29 | | | $ | 9,933,414 | |
| | 2,875,000 | | | Geisinger, PA Authority (Geisinger Health System) Tender Option Bond Series 2015 XF-0040 Trust | | | 16.310 | | | | 6/1/39 | | | | 4,028,220 | |
| | 5,000,000 | | | Grand Parkway, TX Transportation Corp. Tender Option Bond Series 2015-XF2034 Trust3 | | | 8.070 | | | | 4/1/53 | | | | 5,856,500 | |
| | 11,750,000 | | | Highlands County, FL Health Facilities Authority Tender Option Bond Series 2015-XF2145 Trust3 | | | 8.419 | | | | 11/15/36 | | | | 13,000,083 | |
| | 2,200,000 | | | IL Finance Authority (AHCN/ANSHN/ACMC/AH&HC Obligated Group) ROLs | | | 16.743 | | | | 4/1/44 | | | | 3,032,304 | |
| | 1,250,000 | | | IL Finance Authority (AHCN/ANSHN/ACMC/AH&HC Obligated Group) ROLs | | | 16.743 | | | | 4/1/44 | | | | 1,722,900 | |
| | 2,750,000 | | | IL Finance Authority (AHCN/ANSHN/ACMC/AH&HC Obligated Group) ROLs | | | 16.743 | | | | 4/1/44 | | | | 3,790,380 | |
| | 2,500,000 | | | IL Finance Authority (AHCN/ANSHN/ACMC/AH&HC Obligated Group) ROLs | | | 16.743 | | | | 4/1/44 | | | | 3,445,800 | |
| | 4,345,000 | | | IL Finance Authority (AHCN/ANSHN/ACMC/AH&HC Obligated Group) ROLs | | | 16.738 | | | | 4/1/44 | | | | 5,988,322 | |
| | 5,000,000 | | | IL Finance Authority (AHCN/ANSHN/ACMC/AH&HC Obligated Group) Tender Option Bond Series 2015- XF0023 Trust | | | 17.176 | | | | 4/1/44 | | | | 7,044,600 | |
| | 1,250,000 | | | IL Finance Authority (CDHS/CDHA Obligated Group) ROLs | | | 16.743 | | | | 11/1/39 | | | | 1,914,450 | |
| | 3,125,000 | | | IL Finance Authority (CDHS/CDHA Obligated Group) Tender Option Bond Series 2015-XF0025 Trust | | | 17.176 | | | | 11/1/39 | | | | 4,898,625 | |
| | 3,500,000 | | | KY EDFA (Baptist Healthcare System) Tender Option Bond Series 2015-XF2011 Trust3 | | | 15.940 | | | | 8/15/24 | | | | 4,870,880 | |
| | 7,985,000 | | | Los Angeles, CA Dept. of Airports (Los Angeles International Airport) Tender Option Bond Series 2015 XF-0041 Trust | | | 16.653 | | | | 5/15/30 | | | | 11,099,150 | |
| | 1,250,000 | | | Los Angeles, CA Dept. of Water & Power Tender Option Bond Series 2015 XF-0039 Trust | | | 15.444 | | | | 7/1/34 | | | | 1,804,150 | |
| | 4,185,000 | | | MA Educational Financing Authority ROLs3 | | | 14.196 | | | | 1/1/30 | | | | 4,896,952 | |
| | 3,010,000 | | | MA HFA ROLs3 | | | 11.479 | | | | 12/1/49 | | | | 3,104,634 | |
| | 3,750,000 | | | MA HFA Tender Option Bond Series 2015-XF2130 Trust3 | | | 11.242 | | | | 6/1/49 | | | | 3,910,163 | |
| | 8,895,000 | | | MA HFA Tender Option Bond Series 2015-XF2150 Trust3 | | | 8.687 | | | | 12/1/42 | | | | 9,514,270 | |
| | 12,500,000 | | | Miami-Dade County, FL School Board ROLs3 | | | 16.600 | | | | 2/1/34 | | | | 17,225,500 | |
| | 2,500,000 | | | Miami-Dade County, FL School Board ROLs3 | | | 15.300 | | | | 2/1/27 | | | | 3,250,800 | |
| | 2,500,000 | | | Miami-Dade County, FL School Board Tender Option Bond Series 2015-XF2117 Trust3 | | | 16.167 | | | | 2/1/27 | | | | 3,333,700 | |
| | 2,500,000 | | | Montgomery County, OH (Miami Valley Hospital) Tender Option Bond Series 2015-XF0029 Trust | | | 18.042 | | | | 11/15/23 | | | | 4,251,400 | |
| | 60,560,000 | | | NJ Tobacco Settlement Financing Corp. ROLs3 | | | 5.220 | | | | 6/1/29 | | | | 45,716,138 | |
| | 9,500,000 | | | North Central TX HFDC (CMCD/CMCtrF Obligated Group) Tender Option Bond Series 2015-XF0034 Trust | | | 18.175 | | | | 8/15/39 | | | | 14,262,540 | |
| | 4,000,000 | | | North TX Tollway Authority Tender Option Bond Series 2015-XF2036 Trust3 | | | 18.171 | | | | 1/1/48 | | | | 5,595,680 | |
| | 1,480,000 | | | North TX Tollway Authority Tender Option Bond Series 2015-XF2037 Trust3 | | | 18.171 | | | | 1/1/48 | | | | 2,070,402 | |
83 OPPENHEIMER ROCHESTER HIGH YIELD MUNICIPAL FUND
|
| NOTES TO FINANCIAL STATEMENTS Continued |
|
| 4. Investments and Risks (Continued) |
| | | | | | | | | | | | | | | | |
Principal Amount | | | Inverse Floater1 | | Coupon
Rate2 | | | Maturity
Date | | | Value | |
| | $ 18,695,000 | | | NY Liberty Devel. Corp. Tender Option Bond Series 2015- XF2146 Trust3 | | | 8.305% | | | | 1/15/44 | | | $ | 22,895,580 | |
| | 3,240,000 | | | NYC Municipal Water Finance Authority Tender Option Bond Series 2015-XF2151 Trust3 | | | 18.314 | | | | 6/15/40 | | | | 4,813,506 | |
| | 2,450,000 | | | RI Hsg. & Mtg. Finance Corp. Tender Option Bond Series 2015-XF2120 Trust3 | | | 16.127 | | | | 10/1/47 | | | | 2,542,096 | |
| | 607,000 | | | Sabine Neches, TX HFC (Single Family Mtg.) ROLs3 | | | 6.489 | | | | 12/1/39 | | | | 549,626 | |
| | 2,500,000 | | | San Jacinto, TX Community College District Tender Option Bond Series 2015-XF2010 Trust3 | | | 16.003 | | | | 2/15/38 | | | | 3,416,400 | |
| | 8,150,000 | | | Tarrant County, TX Cultural Education Facilities Finance Corp. ROLs3 | | | 19.185 | | | | 11/15/29 | | | | 13,491,836 | |
| | 1,985,000 | | | Tarrant County, TX Cultural Education Facilities Finance Corp. Tender Option Bond Series 2015-XF2057 Trust3 | | | 17.440 | | | | 11/15/29 | | | | 3,157,540 | |
| | 6,750,000 | | | Tarrant County, TX Health Facilities Devel. Corp. (CCMCtr/CCHCS/CCPN/WICF Obligated Group) Tender Option Bond Series 2015-XF0028 Trust | | | 8.025 | | | | 12/1/33 | | | | 8,180,055 | |
| | 3,000,000 | | | Tes Properties, WA ROLs | | | 17.609 | | | | 12/1/38 | | | | 4,588,080 | |
| | 375,000 | | | Tes Properties, WA Tender Option Bond Series 2015- XF0038 Trust | | | 17.176 | | | | 12/1/29 | | | | 573,000 | |
| | 39,305,000 | | | TX Municipal Gas Acquisition & Supply Corp. ROLs3 | | | 12.545 | | | | 12/15/26 | | | | 63,076,271 | |
| | 8,705,000 | | | WA Health Care Facilities Authority (Peacehealth) Tender Option Bond Series 2015 XF-0042 Trust | | | 7.836 | | | | 11/1/28 | | | | 10,353,205 | |
| | 4,520,000 | | | WA Health Care Facilities Authority Tender Option Bond Series 2015-XF2035 Trust3 | | | 19.763 | | | | 10/1/36 | | | | 6,975,806 | |
| | 3,645,000 | | | Wayne County, MI Airport Authority ROLs3 | | | 11.735 | | | | 12/1/29 | | | | 3,778,443 | |
| | 8,335,000 | | | Wayne County, MI Airport Authority ROLs3 | | | 11.738 | | | | 12/1/29 | | | | 8,640,228 | |
| | 3,335,000 | | | Wayne County, MI Airport Authority ROLs3 | | | 11.734 | | | | 12/1/34 | | | | 3,457,595 | |
| | 5,670,000 | | | Wayne County, MI Airport Authority Tender Option Bond Series 2015-XF2118 Trust3 | | | 11.733 | | | | 12/1/29 | | | | 5,877,522 | |
| | | | | | | | | | | | | | | | |
| | | | | | | | | | | | | | $ | 500,790,625 | |
| | | | | | | | | | | | | | | | |
1. For a list of abbreviations used in the Inverse Floater table see the Portfolio Abbreviations table at the end of the Statement of Investments.
2. Represents the current interest rate for the inverse floating rate security.
3. Represents an inverse floating rate security that is subject to a shortfall/reimbursement agreement.
The Fund may also purchase an inverse floating rate security created as part of a tender option bond transaction not initiated by the Fund when a third party, such as a municipal issuer or financial institution, transfers an underlying municipal bond to a Trust. For financial reporting purposes, the Fund includes the inverse floating rate security related to such transaction on its Statement of Investments and as an asset on its Statement of Assets and Liabilities, and interest on the security is recorded as investment income on the Fund’s Statement of Operations.
The Fund may invest in inverse floating rate securities with any degree of leverage (as measured by the outstanding principal amount of related short-term floating rate securities). However, the Fund may only expose up to 35% of its total assets to the effects of leverage from its investments in inverse floating rate securities. This limitation is measured by comparing the aggregate principal amount of the short-term floating rate securities that are
84 OPPENHEIMER ROCHESTER HIGH YIELD MUNICIPAL FUND
|
|
|
| 4. Investments and Risks (Continued) |
related to the inverse floating rate securities held by the Fund to the total assets of the Fund. The Fund’s exposure to the effects of leverage from its investments in inverse floating rate securities amounts to $722,510,000 or 12.65% of its total assets at period end.
Loans. The Fund invests in loans made to U.S. and foreign borrowers that are corporations, partnerships or other business entities. The Fund will do so directly as an original lender or by assignment or indirectly through participation agreements or certain derivative instruments. While many of these loans will be collateralized, the Fund can also invest in uncollateralized loans. Loans are often issued in connection with recapitalizations, acquisitions, leveraged buyouts, and refinancing of borrowers. The loans often pay interest at rates that float above (or are adjusted periodically based on) a benchmark that reflects current interest rates although the Fund can also invest in loans with fixed interest rates.
Securities on a When-Issued or Delayed Delivery Basis. The Fund may purchase securities on a “when-issued” basis, and may purchase or sell securities on a “delayed delivery” basis. “When-issued” or “delayed delivery” refers to securities whose terms and indenture are available and for which a market exists, but which are not available for immediate delivery. Delivery and payment for securities that have been purchased by the Fund on a when-issued basis normally takes place within six months and possibly as long as two years or more after the trade date. During this period, such securities do not earn interest, are subject to market fluctuation and may increase or decrease in value prior to their delivery. The purchase of securities on a when-issued basis may increase the volatility of the Fund’s net asset value to the extent the Fund executes such transactions while remaining substantially fully invested. When the Fund engages in when-issued or delayed delivery transactions, it relies on the buyer or seller, as the case may be, to complete the transaction. Their failure to do so may cause the Fund to lose the opportunity to obtain or dispose of the security at a price and yield it considers advantageous. The Fund may also sell securities that it purchased on a when-issued basis or forward commitment prior to settlement of the original purchase.
At period end, the Fund had purchased securities issued on a when-issued or delayed delivery basis and sold securities issued on a delayed delivery basis as follows:
| | | | |
| | | When-Issued or
Delayed Delivery
Basis Transactions | |
Purchased securities | | $ | 14,895,402 | |
Sold securities | | | 2,699,408 | |
Restricted Securities. At period end, investments in securities included issues that are restricted. A restricted security may have a contractual restriction on its resale and is valued under methods approved by the Board of Trustees as reflecting fair value. Securities that are restricted are marked with an applicable footnote on the Statement of Investments. Restricted securities are reported on a schedule following the Statement of Investments.
85 OPPENHEIMER ROCHESTER HIGH YIELD MUNICIPAL FUND
|
| NOTES TO FINANCIAL STATEMENTS Continued |
|
| 4. Investments and Risks (Continued) |
Equity Security Risk. Stocks and other equity securities fluctuate in price. The value of the Fund’s portfolio may be affected by changes in the equity markets generally. Equity markets may experience significant short-term volatility and may fall sharply at times. Different markets may behave differently from each other and U.S. equity markets may move in the opposite direction from one or more foreign stock markets. Adverse events in any part of the equity or fixed-income markets may have unexpected negative effects on other market segments.
The prices of individual equity securities generally do not all move in the same direction at the same time and a variety of factors can affect the price of a particular company’s securities. These factors may include, but are not limited to, poor earnings reports, a loss of customers, litigation against the company, general unfavorable performance of the company’s sector or industry, or changes in government regulations affecting the company or its industry.
Credit Risk. The Fund invests in high-yield, non-investment-grade bonds, which may be subject to a greater degree of credit risk. Credit risk relates to the ability of the issuer to meet interest or principal payments or both as they become due. The Fund may acquire securities that have missed an interest payment, and is not obligated to dispose of securities whose issuers or underlying obligors subsequently miss an interest payment.
Information concerning securities not accruing interest at period end is as follows:
| | | | |
Cost | | $ | 553,323,579 | |
Market Value | | $ | 192,181,760 | |
Market Value as % of Net Assets | | | 3.89% | |
The Fund has entered into forbearance agreements with certain obligors under which the Fund has agreed to temporarily forego receipt of the original principal or coupon interest rates. At period end, securities with an aggregate market value of $97,222,147, representing 1.97% of the Fund’s net assets, were subject to these forbearance agreements. Interest payments of $1,742,850 are contractually owed to the Fund with respect to these securities and will not be collected under these forbearance agreements.
Concentration Risk. There are certain risks arising from geographic concentration in any state, commonwealth or territory. Certain economic, regulatory or political developments occurring in the state, commonwealth or territory may impair the ability of certain issuers of municipal securities to pay principal and interest on their obligations.
5. Shares of Beneficial Interest
The Fund has authorized an unlimited number of no par value shares of beneficial interest of each class. Transactions in shares of beneficial interest were as follows:
86 OPPENHEIMER ROCHESTER HIGH YIELD MUNICIPAL FUND
|
|
|
| 5. Shares of Beneficial Interest (Continued) |
| | | | | | | | | | | | | | | | |
| | | Year Ended July 31, 2015 | | | Year Ended July 31, 2014 | |
| | | Shares | | | Amount | | | Shares | | | Amount | |
Class A | | | | | | | | | | | | | | | | |
Sold | | | 87,123,461 | | | $ | 619,980,821 | | | | 137,102,282 | | | $ | 933,950,926 | |
Dividends and/or distributions reinvested | | | 24,865,585 | | | | 176,893,384 | | | | 30,093,455 | | | | 205,951,112 | |
Redeemed | | | (144,091,096) | | | | (1,018,692,480) | | | | (239,441,124) | | | | (1,630,450,733) | |
| | | | |
Net decrease | | | (32,102,050) | | | $ | (221,818,275) | | | | (72,245,387) | | | $ | (490,548,695) | |
| | | | |
| | | | |
| | | | | | | | | | | | | | | | | |
Class B | | | | | | | | | | | | | | | | |
Sold | | | 134,690 | | | $ | 964,201 | | | | 484,637 | | | $ | 3,287,365 | |
Dividends and/or distributions reinvested | | | 471,292 | | | | 3,371,053 | | | | 705,140 | | | | 4,839,098 | |
Redeemed | | | (4,364,892) | | | | (31,157,120) | | | | (5,810,952) | | | | (39,878,030) | |
| | | | |
Net decrease | | | (3,758,910) | | | $ | (26,821,866) | | | | (4,621,175) | | | $ | (31,751,567) | |
| | | | |
| | | | |
| | | | | | | | | | | | | | | | | |
Class C | | | | | | | | | | | | | | | | |
Sold | | | 28,694,059 | | | $ | 203,408,816 | | | | 35,469,141 | | | $ | 241,146,185 | |
Dividends and/or distributions reinvested | | | 8,903,012 | | | | 63,120,770 | | | | 9,923,437 | | | | 67,687,442 | |
Redeemed | | | (44,567,966) | | | | (313,899,563) | | | | (71,505,039) | | | | (483,203,243) | |
| | | | |
Net decrease | | | (6,970,895) | | | $ | (47,369,977) | | | | (26,112,461) | | | $ | (174,369,616) | |
| | | | |
| | | | |
| | | | | | | | | | | | | | | | | |
Class Y | | | | | | | | | | | | | | | | |
Sold | | | 55,233,963 | | | $ | 391,896,568 | | | | 60,336,987 | | | $ | 411,211,484 | |
Dividends and/or distributions reinvested | | | 5,486,984 | | | | 38,979,151 | | | | 4,169,746 | | | | 28,544,554 | |
Redeemed | | | (39,925,421) | | | | (281,378,774) | | | | (52,993,918) | | | | (358,803,969) | |
| | | | |
Net increase | | | 20,795,526 | | | $ | 149,496,945 | | | | 11,512,815 | | | $ | 80,952,069 | |
| | | | |
6. Purchase and Sales of Securities
The aggregate cost of purchases and proceeds from sales of securities, other than short-term obligations, for the reporting period were as follows:
| | | | | | | | |
| | | Purchases | | | Sales | |
Investment securities | | $ | 954,245,473 | | | $ | 1,248,487,117 | |
7. Fees and Other Transactions with Affiliates
Management Fees. Under the investment advisory agreement, the Fund pays the Manager a management fee based on the daily net assets of the Fund at an annual rate as shown in the following table:
87 OPPENHEIMER ROCHESTER HIGH YIELD MUNICIPAL FUND
|
| NOTES TO FINANCIAL STATEMENTS Continued |
|
| 7. Fees and Other Transactions with Affiliates (Continued) |
| | | | |
| Fee Schedule | | | |
Up to $200 million | | | 0.60 | % |
Next $100 million | | | 0.55 | |
Next $200 million | | | 0.50 | |
Next $250 million | | | 0.45 | |
Next $250 million | | | 0.40 | |
Next $10 billion | | | 0.35 | |
Over $11 billion | | | 0.34 | |
The Fund’s effective management fee for the reporting period was 0.38% of average annual net assets before any applicable waivers.
Sub-Adviser Fees. The Manager has retained the Sub-Adviser to provide the day-to-day portfolio management of the Fund. Under the Sub-Advisory Agreement, the Manager pays the Sub-Adviser an annual fee in monthly installments, equal to a percentage of the investment management fee collected by the Manager from the Fund, which shall be calculated after any investment management fee waivers. The fee paid to the Sub-Adviser is paid by the Manager, not by the Fund.
Transfer Agent Fees. OFI Global (the “Transfer Agent”) serves as the transfer and shareholder servicing agent for the Fund. The Fund pays the Transfer Agent a fee based on annual net assets. Fees incurred and average net assets for each class with respect to these services are detailed in the Statement of Operations and Financial Highlights, respectively.
Sub-Transfer Agent Fees. The Transfer Agent has retained Shareholder Services, Inc., a wholly-owned subsidiary of OFI (the “Sub-Transfer Agent”), to provide the day-to-day transfer agent and shareholder servicing of the Fund. Under the Sub-Transfer Agency Agreement, the Transfer Agent pays the Sub-Transfer Agent an annual fee in monthly installments, equal to a percentage of the transfer agent fee collected by the Transfer Agent from the Fund, which shall be calculated after any applicable fee waivers. The fee paid to the Sub-Transfer Agent is paid by the Transfer Agent, not by the Fund.
Trustees’ Compensation. The Fund has adopted an unfunded retirement plan (the “Plan”) for the Fund’s Independent Trustees. Benefits are based on years of service and fees paid to each Trustee during their period of service. The Plan was frozen with respect to adding new participants effective December 31, 2006 (the “Freeze Date”) and existing Plan Participants as of the Freeze Date will continue to receive accrued benefits under the Plan. Active Independent Trustees as of the Freeze Date have each elected a distribution method with respect to their benefits under the Plan. During the reporting period, the Fund’s projected benefit obligations, payments to retired Trustees and accumulated liability were as follows:
| | | | |
Projected Benefit Obligations Increased | | $ | — | |
Payments Made to Retired Trustees | | | 43,290 | |
Accumulated Liability as of July 31, 2015 | | | 343,066 | |
88 OPPENHEIMER ROCHESTER HIGH YIELD MUNICIPAL FUND
|
|
|
| 7. Fees and Other Transactions with Affiliates (Continued) |
The Fund’s Board of Trustees (“Board”) has adopted a compensation deferral plan for Independent Trustees that enables Trustees to elect to defer receipt of all or a portion of the annual compensation they are entitled to receive from the Fund. For purposes of determining the amount owed to the Trustee under the plan, deferred amounts are treated as though equal dollar amounts had been invested in shares of the Fund or in other Oppenheimer funds selected by the Trustee. The Fund purchases shares of the funds selected for deferral by the Trustee in amounts equal to his or her deemed investment, resulting in a Fund asset equal to the deferred compensation liability. Such assets are included as a component of “Other” within the asset section of the Statement of Assets and Liabilities. Deferral of Trustees’ fees under the plan will not affect the net assets of the Fund and will not materially affect the Fund’s assets, liabilities or net investment income per share. Amounts will be deferred until distributed in accordance with the compensation deferral plan.
Distribution and Service Plan (12b-1) Fees. Under its General Distributor’s Agreement with the Fund, OppenheimerFunds Distributor, Inc. (the “Distributor”) acts as the Fund’s principal underwriter in the continuous public offering of the Fund’s classes of shares.
Service Plan for Class A Shares. The Fund has adopted a Service Plan (the “Plan”) for Class A shares pursuant to Rule 12b-1 under the 1940 Act. Under the Plan, the Fund reimburses the Distributor for a portion of its costs incurred for services provided to accounts that hold Class A shares. Reimbursement is made periodically at an annual rate of up to 0.15% of the daily net assets of Class A shares of the Fund. The Distributor currently uses all of those fees to pay dealers, brokers, banks and other financial institutions periodically for providing personal service and maintenance of accounts of their customers that hold Class A shares. Any unreimbursed expenses the Distributor incurs with respect to Class A shares in any fiscal year cannot be recovered in subsequent periods. Fees incurred by the Fund under the Plan are detailed in the Statement of Operations.
Distribution and Service Plans for Class B and Class C Shares. The Fund has adopted Distribution and Service Plans (the “Plans”) for Class B and Class C shares pursuant to Rule 12b-1 under the 1940 Act to compensate the Distributor for distributing those share classes, maintaining accounts and providing shareholder services. Under the Plans, the Fund pays the Distributor an annual asset-based sales charge of 0.75% on Class B and Class C shares’ daily net assets. The Fund also pays a service fee under the Plans at an annual rate of 0.15% of daily net assets. The Plans continue in effect from year to year only if the Fund’s Board of Trustees votes annually to approve their continuance at an in person meeting called for that purpose. Fees incurred by the Fund under the Plans are detailed in the Statement of Operations.
Sales Charges. Front-end sales charges and CDSC do not represent expenses of the Fund. They are deducted from the proceeds of sales of Fund shares prior to investment or from redemption proceeds prior to remittance, as applicable. The sales charges retained by the
89 OPPENHEIMER ROCHESTER HIGH YIELD MUNICIPAL FUND
|
| NOTES TO FINANCIAL STATEMENTS Continued |
|
| 7. Fees and Other Transactions with Affiliates (Continued) |
Distributor from the sale of shares and the CDSC retained by the Distributor on the redemption of shares is shown in the following table for the period indicated.
| | | | | | | | | | | | | | | | |
| | | | | | Class A | | | Class B | | | Class C | |
| | | Class A | | | Contingent | | | Contingent | | | Contingent | |
| | | Front-End | | | Deferred Sales | | | Deferred Sales | | | Deferred Sales | |
| | | Sales Charges | | | Charges | | | Charges | | | Charges | |
| | | Retained by | | | Retained by | | | Retained by | | | Retained by | |
| Year Ended | | Distributor | | | Distributor | | | Distributor | | | Distributor | |
July 31, 2015 | | | $694,797 | | | | $123,433 | | | | $95,532 | | | | $110,098 | |
8. Borrowing and Other Financing
Borrowings. The Fund can borrow money from banks in amounts up to one third of its total assets (including the amount borrowed) less all liabilities and indebtedness other than borrowings (meaning that the value of those assets must be at least 300% of the amount borrowed). The Fund can use those borrowings for investment-related purposes such as purchasing portfolio securities. The Fund also may borrow to meet redemption obligations or for temporary and emergency purposes. When the Fund invests borrowed money in portfolio securities, it is using a speculative investment technique known as leverage and changes in the value of the Fund’s investments will have a larger effect on its share price than if it did not borrow because of the effect of leverage.
The Fund can also use the borrowings for other investment-related purposes, including in connection with the Fund’s inverse floater investments as discussed in Note 4. The Fund may use the borrowings to reduce the leverage amount of, or unwind or “collapse” trusts that issued “inverse floaters” owned by the Fund, or in circumstances in which the Fund has entered into a shortfall and forbearance agreement with the sponsor of the inverse floater trust to meet the Fund’s obligation to reimburse the sponsor of the inverse floater for the difference between the liquidation value of the underlying bond and the amount due to holders of the short-term floating rate notes issued by the Trust. See the discussion in Note 4 (Inverse Floating Rate Securities) for additional information.
The Fund will pay interest and may pay other fees in connection with loans. If the Fund does borrow, it will be subject to greater expenses than funds that do not borrow. The interest on borrowed money and the other fees incurred in conjunction with loans are an expense that might reduce the Fund’s yield and return. Expenses incurred by the Fund with respect to interest on borrowings and commitment fees are disclosed separately or as other expenses on the Statement of Operations.
The Fund entered into a Revolving Credit and Security Agreement (the “Agreement”) with conduit lenders and Citibank N.A. which enables it to participate with certain other Oppenheimer funds in a committed, secured borrowing facility that permits borrowings of up to $2.5 billion, collectively, by the Oppenheimer Rochester Funds. To secure the loan, the Fund pledges investment securities in accordance with the terms of the Agreement. Securities held in collateralized accounts to cover these borrowings are noted in the Statement of Investments. Interest is charged to the Fund, based on its borrowings, at current commercial paper issuance rates (0.1925% at period end). The Fund pays additional fees monthly to its lender on its outstanding borrowings to manage and administer the facility and is allocated its
90 OPPENHEIMER ROCHESTER HIGH YIELD MUNICIPAL FUND
|
|
|
| 8. Borrowing and Other Financing (Continued) |
pro-rata share of an annual structuring fee and ongoing commitment fees both of which are based on the total facility size. Total fees and interest that are included in expenses on the Fund’s Statement of Operations related to its participation in the borrowing facility during the reporting period equal 0.05% of the Fund’s average net assets on an annualized basis. The Fund has the right to prepay such loans and terminate its participation in the conduit loan facility at any time upon prior notice.
At period end, the Fund had borrowings outstanding at an interest rate of 0.1925%.
Details of the borrowings for the reporting period are as follows:
| | | | |
Average Daily Loan Balance | | $ | 2,064,932 | |
Average Daily Interest Rate | | | 0.185 | % |
Fees Paid | | $ | 2,767,770 | |
Interest Paid | | $ | 4,576 | |
Reverse Repurchase Agreements. The Fund may engage in reverse repurchase agreements. A reverse repurchase agreement is the sale of one or more securities to a counterparty at an agreed-upon purchase price with the simultaneous agreement to repurchase those securities on a future date at a higher repurchase price. The repurchase price represents the repayment of the purchase price and interest accrued thereon over the term of the repurchase agreement. The cash received by the Fund in connection with a reverse repurchase agreement may be used for investment-related purposes such as purchasing portfolio securities or for other purposes such as those described in the preceding “Borrowings” note.
The Fund entered into a Committed Repurchase Transaction Facility (the “Facility”) with J.P. Morgan Securities LLC (the “counterparty”) which enables it to participate with certain other Oppenheimer funds in a committed reverse repurchase agreement facility that permits aggregate outstanding reverse repurchase agreements of up to $750 million, collectively. Interest is charged to the Fund on the purchase price of outstanding reverse repurchase agreements at current LIBOR rates plus an applicable spread. The Fund is also allocated its pro-rata share of an annual structuring fee based on the total Facility size and ongoing commitment fees based on the total unused amount of the Facility. The Fund retains the economic exposure to fluctuations in the value of securities subject to reverse repurchase agreements under the Facility and therefore these transactions are considered secured borrowings for financial reporting purposes. The Fund also continues to receive the economic benefit of interest payments received on securities subject to reverse repurchase agreements, in the form of a direct payment from the counterparty. These payments are included in interest income on the Statement of Operations. Total fees and interest related to the Fund’s participation in the Facility during the reporting period are included in expenses on the Fund’s Statement of Operations and equal 0.03% of the Fund’s average net assets on an annualized basis.
The securities subject to reverse repurchase agreements under the Facility are valued on a daily basis. To the extent this value, after adjusting for certain margin requirements of the Facility, exceeds the cash proceeds received, the Fund may request the counterparty to return securities equal in margin value to this excess. To the extent that the cash proceeds received
91 OPPENHEIMER ROCHESTER HIGH YIELD MUNICIPAL FUND
|
| NOTES TO FINANCIAL STATEMENTS Continued |
|
| 8. Borrowing and Other Financing (Continued) |
exceed the margin value of the securities subject to the transaction, the counterparty may request additional securities from the Fund. The Fund has the right to declare each Wednesday as the repurchase date for any outstanding reverse repurchase agreement upon delivery of advanced notification and may also recall any security subject to such a transaction by substituting eligible securities of equal or greater margin value according to the Facility’s terms.
The Fund executed no transactions under the Facility during the reporting period.
Details of reverse repurchase agreement transactions for the reporting period are as follows:
9. Pending Litigation
In 2009, several putative class action lawsuits were filed and later consolidated before the U.S. District Court for the District of Colorado against OppenheimerFunds, Inc. (“OFI”), OppenheimerFunds Distributor, Inc. (“OFDI”), and Oppenheimer Rochester California Municipal Fund, a fund advised by OFI Global Asset Management, Inc. and distributed by the Distributor (the “Defendant Fund”), in connection with the Defendant Fund’s investment performance. The plaintiffs asserted claims against OFI, OFDI and certain present and former trustees and officers of the Defendant Fund under the federal securities laws, alleging, among other things, that the disclosure documents of the Defendant Fund contained misrepresentations and omissions and the investment policies of the Defendant Fund were not followed. Plaintiffs in the suit filed an amended complaint and defendants filed a motion to dismiss. In 2011, the court issued an order which granted in part and denied in part the defendants’ motion to dismiss. In 2012, plaintiffs filed a motion, which defendants opposed, to certify a class and appoint class representatives and class counsel. In March 2015, the court granted plaintiffs’ motion for class certification. In May 2015, the U.S. Court of Appeals for the Tenth Circuit vacated the class certification order and remanded the matter to the district court for further proceedings. In July 2015, the district court held an evidentiary hearing on plaintiffs’ motion for class certification.
OFI and OFDI believe the suit is without merit; that it is premature to render any opinion as to the likelihood of an outcome unfavorable to them in the suit; and that no estimate can yet be made as to the amount or range of any potential loss. Furthermore, OFI believes that the suit should not impair the ability of OFI or OFDI to perform their respective duties to the Fund and that the outcome of the suit should not have any material effect on the operations of any of the Oppenheimer funds.
92 OPPENHEIMER ROCHESTER HIGH YIELD MUNICIPAL FUND
REPORT OF INDEPENDENT REGISTERED ACCOUNTING FIRM
The Board of Trustees and Shareholders of Oppenheimer Multi-State Municipal Trust:
We have audited the accompanying statement of assets and liabilities of Oppenheimer Rochester High Yield Municipal Fund (a separate series of Oppenheimer Multi-State Municipal Trust), including the statement of investments, as of July 31, 2015, and the related statements of operations and cash flows for the year then ended, the statements of changes in net assets for each of the years in the two-year period then ended, and the financial highlights for each of the years or periods in the five-year period then ended. These financial statements and financial highlights are the responsibility of the Fund’s management. Our responsibility is to express an opinion on these financial statements and financial highlights based on our audits.
We conducted our audits in accordance with the standards of the Public Company Accounting Oversight Board (United States). Those standards require that we plan and perform the audit to obtain reasonable assurance about whether the financial statements and financial highlights are free of material misstatement. An audit includes examining, on a test basis, evidence supporting the amounts and disclosures in the financial statements. Our procedures included confirmation of securities owned as of July 31, 2015, by correspondence with the custodian and brokers, or by other appropriate auditing procedures where replies from brokers were not received. An audit also includes assessing the accounting principles used and significant estimates made by management, as well as evaluating the overall financial statement presentation. We believe that our audits provide a reasonable basis for our opinion.
In our opinion, the financial statements and financial highlights referred to above present fairly, in all material respects, the financial position of Oppenheimer Rochester High Yield Municipal Fund as of July 31, 2015, the results of its operations and cash flows for the year then ended, the changes in its net assets for each of the years in the two-year period then ended, and the financial highlights for each of the years or periods in the five-year period then ended, in conformity with U.S. generally accepted accounting principles.
KPMG LLP
Denver, Colorado
September 28, 2015
93 OPPENHEIMER ROCHESTER HIGH YIELD MUNICIPAL FUND
FEDERAL INCOME TAX INFORMATION Unaudited
In early 2015, if applicable, shareholders of record received information regarding all dividends and distributions paid to them by the Fund during calendar year 2014.
None of the dividends paid by the Fund during the reporting period are eligible for the corporate dividend-received deduction. 98.52% of the dividends were derived from interest on municipal bonds and are not subject to federal income taxes. To the extent a shareholder is subject to any state or local tax laws, some or all of the dividends received may be taxable.
The foregoing information is presented to assist shareholders in reporting distributions received from the Fund to the Internal Revenue Service. Because of the complexity of the federal regulations which may affect your individual tax return and the many variations in state and local tax regulations, we recommend that you consult your tax advisor for specific guidance.
94 OPPENHEIMER ROCHESTER HIGH YIELD MUNICIPAL FUND
PORTFOLIO PROXY VOTING POLICIES AND PROCEDURES;
UPDATES TO STATEMENTS OF INVESTMENTS Unaudited
The Fund has adopted Portfolio Proxy Voting Policies and Procedures under which the Fund votes proxies relating to securities (“portfolio proxies”) held by the Fund. A description of the Fund’s Portfolio Proxy Voting Policies and Procedures is available (i) without charge, upon request, by calling the Fund toll-free at 1.800.CALL OPP (225.5677), (ii) on the Fund’s website at www.oppenheimerfunds.com, and (iii) on the SEC’s website at www.sec.gov. In addition, the Fund is required to file Form N-PX, with its complete proxy voting record for the 12 months ended June 30th, no later than August 31st of each year. The Fund’s voting record is available (i) without charge, upon request, by calling the Fund toll-free at 1.800.CALL OPP (225.5677), and (ii) in the Form N-PX filing on the SEC’s website at www.sec.gov.
The Fund files its complete schedule of portfolio holdings with the SEC for the first quarter and the third quarter of each fiscal year on Form N-Q. The Fund’s Form N-Q filings are available on the SEC’s website at www.sec.gov. Those forms may be reviewed and copied at the SEC’s Public Reference Room in Washington, D.C. Information on the operation of the Public Reference Room may be obtained by calling 1-800-SEC-0330.
Householding—Delivery of Shareholder Documents
This is to inform you about OppenheimerFunds’ “householding” policy. If more than one member of your household maintains an account in a particular fund, OppenheimerFunds will mail only one copy of the fund’s prospectus (or, if available, the fund’s summary prospectus), annual and semiannual report and privacy policy. The consolidation of these mailings, called householding, benefits your fund through reduced mailing expense, and benefits you by reducing the volume of mail you receive from OppenheimerFunds. Householding does not affect the delivery of your account statements.
Please note that we will continue to household these mailings for as long as you remain an OppenheimerFunds shareholder, unless you request otherwise. If you prefer to receive multiple copies of these materials, please call us at 1.800.CALL-OPP (225-5677). You may also notify us in writing or via email. We will begin sending you individual copies of the prospectus (or, if available, the summary prospectus), reports and privacy policy within 30 days of receiving your request to stop householding.
95 OPPENHEIMER ROCHESTER HIGH YIELD MUNICIPAL FUND
TRUSTEES AND OFFICERS Unaudited
| | |
Name, Position(s) Held with the
Fund, Length of Service, Year
of Birth | | Principal Occupation(s) During the Past 5 Years; Other Trusteeships/Directorships Held; Number of
Portfolios in the Fund Complex Currently Overseen |
| |
INDEPENDENT TRUSTEES | | The address of each Trustee in the chart below is 6803 S. Tucson Way, Centennial, Colorado 80112-3924. Each Trustee serves for an annual term, or until his or her resignation, retirement, death or removal. |
| |
Brian F. Wruble, Chairman of the Board of Trustees (since 2007) and Trustee (since 2005) Year of Birth: 1943 | | Director and Vice Chairman of Community Foundation of the Florida Keys (non-profit) (since July 2012); Trustee of the Board of Trustees, The Jackson Laboratory (non-profit) (1991-2011 and since May 2014); Chairman Emeritus (since August 2011) of The Jackson Laboratory (non-profit); Director of Special Value Opportunities Fund, LLC (registered investment company) (affiliate of the Sub-Adviser’s parent company) (since September 2004); Member of Zurich Insurance Group’s Investment Management Advisory Council (insurance) (since 2004); Treasurer (since 2007) and Trustee of the Institute for Advanced Study (non-profit educational institute) (since May 1992); General Partner of Odyssey Partners, L.P. (hedge fund) (September 1995-December 2007); Special Limited Partner of Odyssey Investment Partners, LLC (private equity investment) (January 1999-September 2004). Oversees 53 portfolios in the OppenheimerFunds complex. Mr. Wruble has served on the Boards of certain Oppenheimer funds since April 2001, during which time he has become familiar with the Fund’s (and other Oppenheimer funds’) financial, accounting, regulatory and investment matters and has contributed to the Boards’ deliberations. |
| |
David K. Downes, Trustee (since 2007) Year of Birth: 1940 | | Director of THL Credit Inc. (since June 2009); Chief Executive Officer and Board Member of Community Capital Management (investment management company) (since January 2004); President of The Community Reinvestment Act Qualified Investment Fund (investment management company) (since 2004); Director of Actua Corporation (information technology company) (since October 2003); formerly, Independent Chairman GSK Employee Benefit Trust (April 2006- June 2013); Director of Correctnet (January 2006-2007); Independent Chairman of the Board of Trustees of Quaker Investment Trust (registered investment company) (2004-2007); Chief Operating Officer and Chief Financial Officer of Lincoln National Investment Companies, Inc. (subsidiary of Lincoln National Corporation, a publicly traded company) and Delaware Investments U.S., Inc. (investment management subsidiary of Lincoln National Corporation) (1993- 2003); President, Chief Executive Officer and Trustee of Delaware Investment Family of Funds (1993-2003); President and Board Member of Lincoln National Convertible Securities Funds, Inc. and the Lincoln National Income Funds, TDC (1993-2003); Chairman and Chief Executive Officer of Retirement Financial Services, Inc. (registered transfer agent and investment adviser and subsidiary of Delaware Investments U.S., Inc.) (1993-2003); President and Chief Executive Officer of Delaware Service Company, Inc. (1995-2003); Chief Administrative Officer, Chief Financial Officer, Vice Chairman and Director of Equitable Capital Management Corporation (investment subsidiary of Equitable Life Assurance Society) (1985-1992); Corporate Controller of Merrill Lynch Company (financial services holding company) (1977-1985); held the following positions at the Colonial Penn Group, Inc. (insurance company): Corporate Budget Director (1974-1977), Assistant Treasurer (1972-1974) and Director of Corporate Taxes (1969-1972); held the following positions at Price Waterhouse Company (financial services firm): Tax Manager (1967-1969), Tax Senior (1965-1967) and Staff Accountant (1963-1965); United States Marine Corps (1957-1959). |
96 OPPENHEIMER ROCHESTER HIGH YIELD MUNICIPAL FUND
| | |
| |
David K. Downes, Continued | | Oversees 53 portfolios in the OppenheimerFunds complex. Mr. Downes has served on the Boards of certain Oppenheimer funds since December 2005, during which time he has become familiar with the Fund’s (and other Oppenheimer funds’) financial, accounting, regulatory and investment matters and has contributed to the Boards’ deliberations. |
| |
Matthew P. Fink, Trustee (since 2005) Year of Birth: 1941 | | Trustee of the Committee for Economic Development (policy research foundation) (2005-2011); Director of ICI Education Foundation (education foundation) (October 1991-August 2006); President of the Investment Company Institute (trade association) (October 1991-June 2004); Director of ICI Mutual Insurance Company (insurance company) (October 1991-June 2004); Author of The Rise of Mutual Funds: An Insider’s View published by Oxford University Press (second edition 2010). Oversees 53 portfolios in the OppenheimerFunds complex. Mr. Fink has served on the Boards of certain Oppenheimer funds since January 2005, during which time he has become familiar with the Fund’s (and other Oppenheimer funds’) financial, accounting, regulatory and investment matters and has contributed to the Boards’ deliberations. |
| |
Edmund P. Giambastiani, Jr., Trustee (since 2013) Year of Birth: 1948 | | Advisory Board Member of the Maxwell School of Citizenship and Public Affairs of Syracuse University (since April 2012); Director of Mercury Defense Systems Inc. (information technology) (August 2011-February 2013); Trustee of the U.S. Naval Academy Foundation (since November 2010); Advisory Board Member of the Massachusetts Institute of Technology Lincoln Laboratory (federally-funded research development center) (since May 2010); Director of The Boeing Company (aerospace and defense) (since October 2009); Trustee of MITRE Corporation (federally-funded research development center) (since September 2008); Independent Director of QinetiQ Group Plc (defense technology and security) (February 2008-August 2011); Director of Monster Worldwide, Inc. (on-line career services) (since January 2008, Lead Director since June 2011); Chairman of Alenia North America, Inc. (military and defense products) (January 2008-October 2009); Director of SRA International, Inc. (information technology and services) (January 2008-July 2011); President of Giambastiani Group LLC (national security and energy consulting) (since October 2007); United States Navy, career nuclear submarine officer (June 1970-October 2007), Vice Chairman of the Joint Chiefs of Staff (2005-October 2007), Supreme Allied Commander of NATO Commander Transformation (2003-2005), Commander, U.S. Joint Forces Command (2002-2005). Since his retirement from the U.S. Navy in October 2007, Admiral Giambastiani has also served on numerous U.S. Government advisory boards, investigations and task forces for the Secretaries of Defense, State and Interior and the Central Intelligence Agency. Oversees 53 portfolios in the OppenheimerFunds complex. Admiral Giambastiani has served on the Boards of certain Oppenheimer funds since February 2013, including as an Advisory Board Member for certain Oppenheimer funds, during which time he has become familiar with the Fund’s (and other Oppenheimer funds’) financial, accounting, regulatory and investment matters and has contributed to the Boards’ deliberations. For purposes of this report, Admiral Giambastiani is identified as a Trustee. |
| |
Elizabeth Krentzman, Trustee (since 2014) Year of Birth: 1959 | | Advisory Board Member of the Securities and Exchange Commission Historical Society (since 2007); held the following positions at Deloitte & Touche LLP: Principal and Chief Regulatory Advisor for Asset Management Services (2007 - 2014) and U.S. Mutual Fund Leader (2011 - 2014); General Counsel of the Investment Company Institute (trade association) (June 2004 - April 2007); held |
97 OPPENHEIMER ROCHESTER HIGH YIELD MUNICIPAL FUND
TRUSTEES AND OFFICERS Unaudited / Continued
| | |
| |
Elizabeth Krentzman, Continued | | the following positions at Deloitte & Touche LLP: National Director of the Investment Management Regulatory Consulting Practice (1997 - 2004), Principal (2003 - 2004), Director (1998 - 2003) and Senior Manager (1997 - 1998); Assistant Director of the Division of Investment Management - Office of Disclosure and Investment Adviser Regulation (1996 - 1997) and various positions with the Division of Investment Management – Office of Regulatory Policy (1991 - 1996) of the U.S. Securities and Exchange Commission; Associate at Ropes & Gray (1987 - 1991); former Chair of the Investment Management Subcommittee of the Washington, D.C. Bar. Oversees 53 portfolios in the OppenheimerFunds complex. Ms. Krentzman has served on the Boards of certain Oppenheimer funds since August 2014, during which time she has become familiar with the Fund’s (and other Oppenheimer funds’) financial, accounting, regulatory and investment matters and has contributed to the Boards’ deliberations. |
| |
Mary F. Miller, Trustee (since 2007) Year of Birth: 1942 | | Trustee of International House (not-for-profit) (since June 2007); Trustee of the American Symphony Orchestra (not-for-profit) (October 1998-November 2011); and Senior Vice President and General Auditor of American Express Company (financial services company) (July 1998-February 2003). Oversees 53 portfolios in the OppenheimerFunds complex. Ms. Miller has served on the Boards of certain Oppenheimer funds since August 2004, during which time she has become familiar with the Fund’s (and other Oppenheimer funds’) financial, accounting, regulatory and investment matters and has contributed to the Boards’ deliberations. |
| |
Joel W. Motley, Trustee (since 2002) Year of Birth: 1952 | | Director of Greenwall Foundation (since October 2013); Member of the Vestry of Trinity Wall Street (since April 2012); Director of Southern Africa Legal Services Foundation (since March 2012); Board Member of Pulitzer Center for Crisis Reporting (non-profit journalism) (since March 2011); Managing Director of Public Capital Advisors, LLC (privately-held financial advisor) (since January 2006); Managing Director of Carmona Motley, Inc. (privately-held financial advisor) (since January 2002); Director of Columbia Equity Financial Corp. (privately-held financial advisor) (2002-2007); Managing Director of Carmona Motley Hoffman Inc. (privately-held financial advisor) (January 1998-December 2001); Member of the Finance and Budget Committee of the Council on Foreign Relations, Member of the Investment Committee and Board of Human Rights Watch (since July 2000) and Member of the Investment Committee and Board of Historic Hudson Valley (since February 2010). Oversees 53 portfolios in the OppenheimerFunds complex. Mr. Motley has served on the Boards of certain Oppenheimer funds since October 2002, during which time he has become familiar with the Fund’s (and other Oppenheimer funds’) financial, accounting, regulatory and investment matters and has contributed to the Boards’ deliberations. |
| |
Joanne Pace, Trustee (since 2012) Year of Birth: 1958 | | Board Director of Horizon Blue Cross Blue Shield of New Jersey (since November 2012); Advisory Board Director of The Alberleen Group LLC (since March, 2012); Advisory Council Member of 100 Women in Hedge Funds (non-profit) (since December, 2012); Advisory Council Member of Morgan Stanley Children’s Hospital (non-profit) (since May, 2012); Board Director of The Komera Project (non-profit) (since April, 2012); Advisory Board Director of The Agile Trading Group LLC (2012-2013); New York Advisory Board Director of Peace First (non-profit) (2010-2013); Senior Advisor of SECOR Asset Management, LP (2010-2011); Managing Director and Chief Operating Officer of Morgan Stanley Investment Management (2006-2010); Partner and Chief Operating Officer of |
98 OPPENHEIMER ROCHESTER HIGH YIELD MUNICIPAL FUND
| | |
| |
Joanne Pace, Continued | | FrontPoint Partners, LLC (hedge fund) (2005-2006); held the following positions at Credit Suisse: Managing Director (2003-2005); Global Head of Human Resources and member of Executive Board and Operating Committee (2004- 2005), Global Head of Operations and Product Control (2003-2004); held the following positions at Morgan Stanley: Managing Director (1997-2003), Controller and Principal Accounting Officer (1999-2003); Chief Financial Officer (temporary assignment) for the Oversight Committee, Long Term Capital Management (1998-1999). Lead Independent Director and Chair of the Audit and Nominating Committee of The Global Chartist Fund, LLC of Oppenheimer Asset Management (2011-2012); Board Director of Managed Funds Association (2008-2010); Board Director of Morgan Stanley Foundation (2007-2010) and Investment Committee Chair (2008-2010). Oversees 53 portfolios in the OppenheimerFunds complex. Ms. Pace has served on the Boards of certain Oppenheimer funds since November 2012, including as an Advisory Board Member for certain Oppenheimer funds, during which time she has become familiar with the Fund’s (and other Oppenheimer funds’) financial, accounting, regulatory and investment matters and has contributed to the Board’s deliberations. For purposes of this report, Ms. Pace is identified as a Trustee. |
| |
Daniel Vandivort, Trustee (since 2014) Year of Birth: 1954 | | Chairman and Lead Independent Director/Trustee (March 2010-September 2014), Chairman of the Audit Committee (March 2009-September 2014) and Director/Trustee (December 2008-September 2014) of the Board of Directors/Trustees of Value Line Funds; Trustee, Board of Trustees of Huntington Disease Foundation of America (June 2007-December 2013): Trustee, Board of Trustees, RIM Retirement Savings Plan (2005-2007); President and Chief Investment Officer, Robeco Investment Management, formerly known as Weiss Peck and Greer (January 2005-June 2007); Member, Management Committee of Robeco Investment Management (2001-2007); Chairman and Trustee of the Board of Trustees of Weiss, Peck and Greer Funds (2004-2005); Managing Director and Head of Fixed Income, Weiss, Peck and Greer (November 1994-January 2005); Managing Director and Head of Fixed Income, CS First Boston Investment Management (January 1992-November 1994); Director, Global Product Development, First Boston Asset Management (November 1989-January 1992); Vice President, Fixed Income Sales, First Boston Corp. (May 1984-November 1989). Oversees 53 portfolios in the OppenheimerFunds complex. Mr. Vandivort has served on the Boards of certain Oppenheimer funds since 2014, during which time he has become familiar with the Fund’s (and other Oppenheimer funds’) financial, accounting, regulatory and investment matters and has contributed to the Boards’ deliberations. |
|
|
| |
INTERESTED TRUSTEES | | Mr. Glavin is an “Interested Trustee” because he is affiliated with the Manager and the Sub-Adviser by virtue of his positions as director of the Sub-Adviser, and as a shareholder of the Sub-Adviser’s parent company. As a Trustee, he serves for an indefinite term, or until his resignation, retirement, death or removal. Mr. Glavin’s address is 225 Liberty Street, New York, New York 10281-1008. Mr. Steinmetz is an “Interested Trustee” because he is affiliated with the Manager and the Sub-Adviser by virtue of his positions as Chairman of the Sub-Adviser and officer and director of the Manager. Both as a Trustee and as an officer, Mr. Steinmetz serves for an indefinite term, or until his resignation, retirement, death or removal. Mr. Steinmetz’s address is 225 Liberty Street, New York, New York 10281-1008. |
99 OPPENHEIMER ROCHESTER HIGH YIELD MUNICIPAL FUND
TRUSTEES AND OFFICERS Unaudited / Continued
| | |
| |
William F. Glavin, Jr., Trustee (since 2013) Year of Birth: 1958 | | Chairman of the Sub-Adviser (July 2014-December 2014 and December 2009-December 2012) and Director of the Sub-Adviser (since January 2009); Chairman, Director and Chief Executive Officer (January 2013-June 2014) of the Manager; President of the Manager (January 2013-May 2013); Chief Executive Officer (January 2009-December 2012); President of the Sub-Adviser (May 2009-December 2012); Management Director (June 2009-June 2014), President (December 2009-June 2014) and Chief Executive Officer (January 2011-June 2014) of Oppenheimer Acquisition Corp. (“OAC”) (the Sub-Adviser’s parent holding company); Director of Oppenheimer Real Asset Management, Inc. (March 2010-June 2014); Executive Vice President (March 2006-February 2009) and Chief Operating Officer (July 2007-February 2009) of Massachusetts Mutual Life Insurance Company (OAC’s parent company); Director (May 2004-March 2006) and Chief Operating Officer and Chief Compliance Officer (May 2004-January 2005), President (January 2005-March 2006) and Chief Executive Officer (June 2005-March 2006) of Babson Capital Management LLC; Director (March 2005-March 2006), President (May 2003-March 2006) and Chief Compliance Officer (July 2005-March 2006) of Babson Capital Securities, Inc. (a broker-dealer); President (May 2003-March 2006) of Babson Investment Company, Inc.; Director (May 2004-August 2006) of Babson Capital Europe Limited; Director (May 2004-October 2006) of Babson Capital Guernsey Limited; Director (May 2004-March 2006) of Babson Capital Management LLC; Non-Executive Director (March 2005-March 2007) of Baring Asset Management Limited; Director (February 2005-June 2006) Baring Pension Trustees Limited; Director and Treasurer (December 2003-November 2006) of Charter Oak Capital Management, Inc.; Director (May 2006-September 2006) of C.M. Benefit Insurance Company; Director (May 2008-June 2009) and Executive Vice President (June 2007-July 2009) of C.M. Life Insurance Company; President (March 2006-May 2007) of MassMutual Assignment Company; Director (January 2005-December 2006), Deputy Chairman (March 2005-December 2006) and President (February 2005-March 2005) of MassMutual Holdings (Bermuda) Limited; Director (May 2008-June 2009) and Executive Vice President (June 2007-July 2009) of MML Bay State Life Insurance Company; Chief Executive Officer and President (April 2007-January 2009) of MML Distributors, LLC; and Chairman (March 2006-December 2008) and Chief Executive Officer (May 2007- December 2008) of MML Investors Services, Inc. An officer of 91 portfolios in the OppenheimerFunds complex. Mr. Glavin has served on the Boards of certain Oppenheimer funds since December 2009, during which time he has become familiar with the Fund’s (and other Oppenheimer funds’) financial, accounting, regulatory and investment matters and has contributed to the Boards’ deliberations. |
| |
Arthur P. Steinmetz, Trustee (since 2015), President and Principal Executive Officer (since 2014) Year of Birth: 1958 | | Chairman of the Sub-Adviser (since January 2015); CEO and Chairman of the Manager (since July 2014), President of the Manager (since May 2013), a Director of the Manager (since January 2013), Director of the Sub-Adviser (since July 2014), President, Management Director and CEO of Oppenheimer Acquisition Corp. (the Sub-Adviser’s parent holding company) (since July 2014), and President and Director of OFI SteelPath, Inc. (since January 2013). Chief Investment Officer of the OppenheimerFunds advisory entities from (January 2013-December 2013); Executive Vice President of the Manager (January 2013-May 2013); Chief Investment Officer of the Sub-Adviser (October 2010-December 2012); Chief Investment Officer, Fixed-Income, of the Sub-Adviser (April 2009-October 2010); Executive Vice President of the Sub-Adviser (October |
100 OPPENHEIMER ROCHESTER HIGH YIELD MUNICIPAL FUND
| | |
| |
Arthur P. Steinmetz, Continued | | 2009-December 2012); Director of Fixed Income of the Sub-Adviser (January 2009-April 2009); and a Senior Vice President of the Sub-Adviser (March 1993- September 2009). An officer of 91 portfolios in the OppenheimerFunds complex. |
|
|
| |
OFFICERS OF THE FUND | | The addresses of the Officers in the chart below are as follows: for Messrs. Loughran, Cottier, Willis, DeMitry, Camarella, Pulire, Stein, Gabinet, Mss. Sexton and Picciotto, 225 Liberty Street, New York, New York 10281-1008, for Mr. Wixted, 6803 S. Tucson Way, Centennial, Colorado 80112-3924. Each Officer serves for an indefinite term or until his or her resignation, retirement, death or removal. |
| |
Daniel G. Loughran, Vice President (since 2005) Year of Birth: 1963 | | Senior Vice President of the Sub-Adviser (since July 2007) and a Senior Portfolio Manager (since December 2001); Vice President of the Sub-Adviser (April 2001-June 2007) and a Portfolio Manager with the Sub-Adviser (December 1999- November 2001). Team Leader, a Senior Portfolio Manager, an officer and a trader for the Fund and other Oppenheimer funds. |
| |
Scott S. Cottier, Vice President (since 2005) Year of Birth: 1971 | | Vice President of the Sub-Adviser and a Senior Portfolio Manager (since September 2002). Portfolio Manager and trader at Victory Capital Management (1999-2002). Senior Portfolio Manager, an officer and a trader for the Fund and other Oppenheimer funds. |
| |
Troy E. Willis, Vice President (since 2005) Year of Birth: 1972 | | Vice President of the Sub-Adviser (since July 2009) and a Senior Portfolio Manager (since January 2006); Assistant Vice President of the Sub-Adviser (July 2005-June 2009). Portfolio Manager of the Sub-Adviser (June 2002-December 2005). Corporate Attorney for Southern Resource Group (June 1999-July 2001). Senior Portfolio Manager, an officer and a trader for the Fund and other Oppenheimer funds. |
| |
Mark R. DeMitry, Vice President (since 2009) Year of Birth: 1976 | | Vice President of the Sub-Adviser and a Senior Portfolio Manager (since July 2009); Associate Portfolio Manager of the Fund (September 2006- June 2009). Research Analyst of the Sub-Adviser (June 2003-September 2006) and a Credit Analyst of the Sub-Adviser (July 2001-May 2003). Senior Portfolio Manager, an officer and a trader for the Fund and other Oppenheimer funds. |
| |
Michael L. Camarella, Vice President (since 2009) Year of Birth: 1976 | | Vice President of the Sub-Adviser and a Senior Portfolio Manager (since January 2011); Assistant Vice President of the Sub-Adviser (July 2009-December 2010); Associate Portfolio Manager of the Sub-Adviser (January 2008-December 2010). Research Analyst of the Sub-Adviser (April 2006-December 2007) and a Credit Analyst of the Sub-Adviser (June 2003-March 2006). Senior Portfolio Manager, an officer and a trader for the Fund and other Oppenheimer funds. |
| |
Charles S. Pulire, Vice President (since 2011) Year of Birth: 1977 | | Vice President of the Sub-Adviser and a Senior Portfolio Manager (since February 2013); Assistant Vice President of the Sub-Adviser (December 2010-January 2013); Research Analyst of the Manager (February 2008-November 2010); Credit Analyst of the Sub-Adviser (May 2006-January 2008). Senior Portfolio Manager, an officer and a trader for the Fund and other Oppenheimer funds. |
| |
Richard A. Stein, Vice President (since 2007) Year of Birth: 1957 | | Director of the Rochester Credit Analysis team (since March 2004); Senior Vice President of the Sub-Adviser (since June 2011) and a Vice President of the Sub- Adviser (November 1997-May 2011); heads up the Rochester Credit Analysis team (since May 1993). |
101 OPPENHEIMER ROCHESTER HIGH YIELD MUNICIPAL FUND
TRUSTEES AND OFFICERS Unaudited / Continued
| | |
| |
Arthur S. Gabinet, Secretary and Chief Legal Officer (since 2011) Year of Birth: 1958 | | Executive Vice President, Secretary and General Counsel of the Manager (since January 2013); General Counsel OFI SteelPath, Inc. (since January 2013); Executive Vice President (May 2010-December 2012) and General Counsel (since January 2011) of the Sub-Adviser; General Counsel of the Distributor (since January 2011); General Counsel of Centennial Asset Management Corporation (January 2011-December 2012); Executive Vice President (January 2011-December 2012) and General Counsel of HarbourView Asset Management Corporation (since January 2011); Assistant Secretary (since January 2011) and Director (since January 2011) of OppenheimerFunds International Ltd. and OppenheimerFunds plc; Director of Oppenheimer Real Asset Management, Inc. (January 2011-December 2012) and General Counsel (since January 2011); Executive Vice President (January 2011-December 2011) and General Counsel of Shareholder Financial Services, Inc. and Shareholder Services, Inc. (since January 2011); Executive Vice President (January 2011-December 2012) and General Counsel of OFI Private Investments Inc. (since January 2011); Vice President of OppenheimerFunds Legacy Program (January 2011-December 2011); Executive Vice President (January 2011-December 2012) and General Counsel of OFI Institutional Asset Management, Inc. (since January 2011); General Counsel, Asset Management of the Sub-Adviser (May 2010-December 2010); Principal, The Vanguard Group (November 2005-April 2010); District Administrator, U.S. Securities and Exchange Commission (January 2003-October 2005). An officer of 91 portfolios in the OppenheimerFunds complex. |
| |
Jennifer Sexton, Vice President and Chief Business Officer (since 2014) Year of Birth: 1969 | | Senior Vice President of OppenheimerFunds Distributor, Inc. (since June 2014); Vice President of OppenheimerFunds Distributor, Inc. (April 2006-June 2014); Vice President of the Sub-Adviser (January 1998-March 2006); Assistant Vice President of the Sub-Adviser (October 1991-December 1998). An officer of 91 portfolios in the OppenheimerFunds complex. |
| |
Mary Ann Picciotto, Chief Compliance Officer and Chief Anti-Money Laundering Officer (since 2014) Year of Birth: 1973 | | Senior Vice President and Chief Compliance Officer of the Manager (since March 2014); Chief Compliance Officer of the Sub-Adviser, OFI SteelPath, Inc., OFI Global Trust Company, OFI Global Institutional, Inc., Oppenheimer Real Asset Management, Inc., OFI Private Investments, Inc., Harborview Asset Management Corporation, Trinity Investment Management Corporation, and Shareholder Services, Inc. (since March 2014); Managing Director of Morgan Stanley Investment Management Inc. and certain of its various affiliated entities; Chief Compliance Officer of various Morgan Stanley Funds (May 2010-January 2014); Chief Compliance Officer of Morgan Stanley Investment Management Inc. (April 2007-January 2014). An officer of 91 portfolios in the OppenheimerFunds complex. |
| |
Brian W. Wixted, Treasurer and Principal Financial & Accounting Officer (since 2007) Year of Birth: 1959 | | Senior Vice President of the Manager (since January 2013); Treasurer of the Sub-Adviser, HarbourView Asset Management Corporation, Shareholder Financial Services, Inc., Shareholder Services, Inc., and Oppenheimer Real Asset Management, Inc. (March 1999-June 2008), OFI Private Investments, Inc. (March 2000-June 2008), OppenheimerFunds International Ltd. and OppenheimerFunds plc (since May 2000), OFI Institutional Asset Management, Inc. (November 2000-June 2008), and OppenheimerFunds Legacy Program (charitable trust program established by the Sub-Adviser) (June 2003-December 2011); Treasurer and Chief Financial Officer of OFI Trust Company (since May 2000); Assistant Treasurer of Oppenheimer Acquisition Corporation (March 1999-June 2008). An officer of 91 portfolios in the OppenheimerFunds complex. |
102 OPPENHEIMER ROCHESTER HIGH YIELD MUNICIPAL FUND
The Fund’s Statement of Additional Information contains additional information about the Fund’s Trustees and Officers and is available without charge upon request, by calling 1.800.CALL OPP (225.5677).
103 OPPENHEIMER ROCHESTER HIGH YIELD MUNICIPAL FUND
OPPENHEIMER ROCHESTER HIGH YIELD MUNICIPAL FUND
| | |
| Manager | | OFI Global Asset Management, Inc. |
| |
| Sub-Adviser | | OppenheimerFunds, Inc. |
| |
| Distributor | | OppenheimerFunds Distributor, Inc. |
| |
| Transfer and Shareholder Servicing Agent | | OFI Global Asset Management, Inc. |
| |
| Sub-Transfer Agent | | Shareholder Services, Inc. DBA OppenheimerFunds Services |
| |
Independent Registered Public Accounting Firm | | KPMGLLP |
| |
| Legal Counsel | | Kramer Levin Naftalis & Frankel LLP |
©2015 OppenheimerFunds, Inc. All rights reserved.
104 OPPENHEIMER ROCHESTER HIGH YIELD MUNICIPAL FUND
PRIVACY POLICY NOTICE
As an Oppenheimer fund shareholder, you are entitled to know how we protect your personal information and how we limit its disclosure.
Information Sources
We obtain nonpublic personal information about our shareholders from the following sources:
| • | | Applications or other forms |
| • | | When you create a user ID and password for online account access |
| • | | When you enroll in eDocs Direct, our electronic document delivery service |
| • | | Your transactions with us, our affiliates or others |
| • | | A software program on our website, often referred to as a “cookie,” which indicates which parts of our site you’ve visited |
| • | | When you set up challenge questions to reset your password online |
If you visit oppenheimerfunds.com and do not log on to the secure account information areas, we do not obtain any personal information about you. When you do log on to a secure area, we do obtain your user ID and password to identify you. We also use this information to provide you with products and services you have requested, to inform you about products and services that you may be interested in and assist you in other ways.
We do not collect personal information through our website unless you willingly provide it to us, either directly by email or in those areas of the website that request information. In order to update your personal information (including your mailing address, email address and phone number) you must first log on and visit your user profile.
If you have set your browser to warn you before accepting cookies, you will receive the warning message with each cookie. You can refuse cookies by turning them off in your browser. However, doing so may limit your access to certain sections of our website.
We use cookies to help us improve and manage our website. For example, cookies help us recognize new versus repeat visitors to the site, track the pages visited, and enable some special features on the website. This data helps us provide a better service for our website visitors.
Protection of Information
We do not disclose any non-public personal information (such as names on a customer list) about current or former customers to anyone, except as permitted by law.
Disclosure of Information
Copies of confirmations, account statements and other documents reporting activity in your fund accounts are made available to your financial advisor (as designated by you). We may also use details about you and your investments to help us, our financial service affiliates, or firms that jointly market their financial products and services with ours, to better serve your investment needs or suggest financial services or educational material that may be of interest to you. If this requires us to provide you with an opportunity to “opt in” or “opt out” of such information sharing with a firm not affiliated with us, you will receive notification on how to do so, before any such sharing takes place.
Right of Refusal
We will not disclose your personal information to unaffiliated third parties (except as permitted by law), unless we first offer you a reasonable opportunity to refuse or “opt out” of such disclosure.
In general, the email services provided by our website are encrypted and provide a secure and private means of communication with us. To protect your own privacy, confidential and/or personal information should only be communicated via email when you are advised that you are using a secure website.
105 OPPENHEIMER ROCHESTER HIGH YIELD MUNICIPAL FUND
PRIVACY POLICY NOTICE Continued
As a security measure, we do not include personal or account information in non-secure emails, and we advise you not to send such information to us in non-secure emails. Instead, you may take advantage of the secure features of our website to encrypt your email correspondence. To do this, you will need to use a browser that supports Secure Sockets Layer (SSL) protocol.
We do not guarantee or warrant that any part of our website, including files available for download, are free of viruses or other harmful code. It is your responsibility to take appropriate precautions, such as use of an anti-virus software package, to protect your computer hardware and software.
| • | | All transactions, including redemptions, exchanges and purchases, are secured by SSL and 256-bit encryption. SSL is used to establish a secure connection between your PC and OppenheimerFunds’ server. It transmits information in an encrypted and scrambled format. |
| • | | Encryption is achieved through an electronic scrambling technology that uses a “key” to code and then decode the data. Encryption acts like the cable converter box you may have on your television set. It scrambles data with a secret code so that no one can make sense of it while it is being transmitted. When the data reaches its destination, the same software unscrambles the data. |
| • | | You can exit the secure area by either closing your browser, or for added security, you can use the Log Out button before you close your browser. |
Other Security Measures
We maintain physical, electronic and procedural safeguards to protect your personal account information. Our employees and agents have access to that information only so that they may offer you products or provide services, for example, when responding to your account questions.
How You Can Help
You can also do your part to keep your account information private and to prevent unauthorized transactions. If you obtain a user ID and password for your account, do not allow it to be used by anyone else. Also, take special precautions when accessing your account on a computer used by others.
Who We Are
This joint notice describes the privacy policies of the Oppenheimer funds, OppenheimerFunds, Inc., each of its investment adviser subsidiaries, OppenheimerFunds Distributor, Inc. and OFI Global Trust Co. It applies to all Oppenheimer fund accounts you presently have, or may open in the future, using your Social Security number—whether or not you remain a shareholder of our funds. This notice was last updated March 2015. In the event it is updated or changed, we will post an updated notice on our website at oppenheimerfunds.com. If you have any questions about this privacy policy, write to us at P.O. Box 5270, Denver, CO 80217-5270, email us by clicking on the Contact Us section of our website at oppenheimerfunds.com or call us at 1.800.CALL OPP (225.5677).
106 OPPENHEIMER ROCHESTER HIGH YIELD MUNICIPAL FUND
THIS PAGE INTENTIONALLY LEFT BLANK.
107 OPPENHEIMER ROCHESTER HIGH YIELD MUNICIPAL FUND
THIS PAGE INTENTIONALLY LEFT BLANK.
108 OPPENHEIMER ROCHESTER HIGH YIELD MUNICIPAL FUND
THIS PAGE INTENTIONALLY LEFT BLANK.
109 OPPENHEIMER ROCHESTER HIGH YIELD MUNICIPAL FUND
THIS PAGE INTENTIONALLY LEFT BLANK.
110 OPPENHEIMER ROCHESTER HIGH YIELD MUNICIPAL FUND
THIS PAGE INTENTIONALLY LEFT BLANK.
111 OPPENHEIMER ROCHESTER HIGH YIELD MUNICIPAL FUND

The registrant has adopted a code of ethics that applies to the registrant’s principal executive officer, principal financial officer, principal accounting officer or controller or persons performing similar functions.
| Item 3. | Audit Committee Financial Expert. |
The Board of Trustees of the registrant has determined that David Downes, the Board’s Audit Committee Chairman, is an audit committee financial expert and that Mr. Downes is “independent” for purposes of this Item 3.
| Item 4. | Principal Accountant Fees and Services. |
The principal accountant for the audit of the registrant’s annual financial statements billed $137,000 in fiscal 2015 and $141,700 in fiscal 2014.
The principal accountant for the audit of the registrant’s annual financial statements billed $7,500 in fiscal 2015 and $7,500 in fiscal 2014.
The principal accountant for the audit of the registrant’s annual financial statements billed $897,697 in fiscal 2015 and $727,131 in fiscal 2014 to the registrant’s investment adviser or any entity controlling, controlled by, or under common control with the adviser that provides ongoing services to the registrant.
Such services include: Internal control reviews, GIPS attestation procedures, reorganization, and system conversion testing
The principal accountant for the audit of the registrant’s annual financial statements billed no such fees in fiscal 2015 and no such fees in fiscal 2014.
The principal accountant for the audit of the registrant’s annual financial statements billed $559,556 in fiscal 2015 and $202,044 in fiscal 2014 to the registrant’s investment adviser or any entity controlling, controlled by, or under common control with the adviser that provides ongoing services to the registrant.
Such services include: tax compliance, tax planning and tax advice. Tax compliance generally involves preparation of original and amended tax returns, claims for a refund and tax payment-planning services. Tax planning and tax advice includes assistance with tax audits and appeals, tax advice related to mergers and acquisitions and requests for rulings or technical advice from taxing authorities.
The principal accountant for the audit of the registrant’s annual financial statements billed no such fees in fiscal 2015 and no such fees in fiscal 2014.
The principal accountant for the audit of the registrant’s annual financial statements billed no such fees in fiscal 2015 and no such fees in fiscal 2014 to the registrant’s investment adviser or any entity controlling, controlled by, or under common control with the adviser that provides ongoing services to the registrant.
Such fees would include the cost to the principal accountant of attending audit committee meetings and consultations regarding the registrant’s retirement plan with respect to its Trustees.
| (e) | (1) During its regularly scheduled periodic meetings, the registrant’s audit committee will pre-approve all audit, audit-related, tax and other services to be provided by the principal accountants of the registrant. |
The audit committee has delegated pre-approval authority to its Chairman for any subsequent new engagements that arise between regularly scheduled meeting dates provided that any fees such pre-approved are presented to the audit committee at its next regularly scheduled meeting.
Under applicable laws, pre-approval of non-audit services may be waived provided that: 1) the aggregate amount of all such services provided constitutes no more than five percent of the total amount of fees paid by the registrant to its principal accountant during the fiscal year in which services are provided 2) such services were not recognized by the registrant at the time of engagement as non-audit services and 3) such services are promptly brought to the attention of the audit committee of the registrant and approved prior to the completion of the audit.
(2) 0%
| (f) | Not applicable as less than 50%. |
| (g) | The principal accountant for the audit of the registrant’s annual financial statements billed $1,464,753 in fiscal 2015 and $936,675 in fiscal 2014 to the registrant and the registrant’s investment adviser or any entity controlling, controlled by, or under common control with the adviser that provides ongoing services to the registrant related to non-audit fees. Those billings did not include any prohibited non-audit services as defined by the Securities Exchange Act of 1934. |
| (h) | The registrant’s audit committee of the board of Trustees has considered whether the provision of non-audit services that were rendered to the registrant’s investment adviser, and any entity controlling, controlled by, or under common control with the investment adviser that provides ongoing services to the registrant that were not pre-approved pursuant to paragraph (c)(7)(ii) of Rule 2-01 of Regulation S-X is compatible with maintaining the principal accountant’s independence. No such services were rendered. |
| Item 5. | Audit Committee of Listed Registrants |
Not applicable.
| Item 6. | Schedule of Investments. |
a) Not applicable. The complete schedule of investments is included in Item 1 of this Form N-CSR.
b) Not applicable.
Item 7. Disclosure of Proxy Voting Policies and Procedures for Closed-End Management Investment Companies.
Not applicable.
| Item 8. | Portfolio Managers of Closed-End Management Investment Companies. |
Not applicable.
Item 9. Purchases of Equity Securities by Closed-End Management Investment Company
and Affiliated Purchasers.
Not applicable.
| Item 10. | Submission of Matters to a Vote of Security Holders. |
The Fund’s Governance Committee Provisions with Respect to Nominations of Directors/Trustees to the Respective Boards
None
| Item 11. | Controls and Procedures. |
Based on their evaluation of the registrant’s disclosure controls and procedures (as defined in rule 30a-3(c) under the Investment Company Act of 1940 (17 CFR 270.30a-3(c)) as of 7/31/2015, the registrant’s principal executive officer and principal financial officer found the registrant’s disclosure controls and procedures to provide reasonable assurances that information required to be disclosed by the registrant in the reports that it files under the Securities Exchange Act of 1934 (a) is accumulated and communicated to registrant’s management, including its principal executive officer and principal financial officer, to allow timely decisions regarding required disclosure, and (b) is recorded, processed, summarized and reported, within the time periods specified in the rules and forms adopted by the U.S. Securities and Exchange Commission.
There have been no changes in the registrant’s internal controls over financial reporting that occurred during the registrant’s second fiscal quarter of the period covered by this report that
have materially affected, or are reasonably likely to materially affect, the registrant’s internal control over financial reporting.
| (a) | (1) Exhibit attached hereto. |
(2) Exhibits attached hereto.
(3) Not applicable.
| (b) | Exhibit attached hereto. |
SIGNATURES
Pursuant to the requirements of the Securities Exchange Act of 1934 and the Investment Company Act of 1940, the registrant has duly caused this report to be signed on its behalf by the undersigned, thereunto duly authorized.
Oppenheimer Multi-State Municipal Trust
| | |
| By: | | /s/ Arthur P. Steinmetz |
| | Arthur P. Steinmetz |
| | Principal Executive Officer |
| Date: | | 9/9/2015 |
Pursuant to the requirements of the Securities Exchange Act of 1934 and the Investment Company Act of 1940, this report has been signed below by the following persons on behalf of the registrant and in the capacities and on the dates indicated.
| | |
| By: | | /s/ Arthur P. Steinmetz |
| | Arthur P. Steinmetz |
| | Principal Executive Officer |
| Date: | | 9/9/2015 |
| | |
| By: | | /s/ Brian W. Wixted |
| | Brian W. Wixted |
| | Principal Financial Officer |
| Date: | | 9/9/2015 |