UNITED STATES
SECURITIES AND EXCHANGE COMMISSION
WASHINGTON, D.C. 20549
FORM N-CSR
CERTIFIED SHAREHOLDER REPORT OF REGISTERED MANAGEMENT
INVESTMENT COMPANIES
Investment Company Act file number 811-5867
Oppenheimer Multi-State Municipal Trust
(Exact name of registrant as specified in charter)
6803 South Tucson Way, Centennial, Colorado 80112-3924
(Address of principal executive offices) (Zip code)
Arthur S. Gabinet
OppenheimerFunds, Inc.
Two World Financial Center, New York, New York 10281-1008
(Name and address of agent for service)
Registrant’s telephone number, including area code: (303) 768-3200
Date of fiscal year end: July 31
Date of reporting period: 7/31/2012
Item 1. Reports to Stockholders.
July 31, 2012
| | | | |
| | | Oppenheimer New Jersey Municipal Fund | | Management
Commentary and Annual Report |
MANAGEMENT COMMENTARY
An Interview with Your Fund’s Portfolio Managers
ANNUAL REPORT
Listing of Top Holdings
Fund Performance Discussion
Financial Statements
“We hope that the recent strength of the municipal bond market has renewed investors’ confidence in the market’s powerful ability to help investors earn tax-advantaged income.”
Dan Loughran, Senior Vice President, Senior Portfolio Manager and
Team Leader, OppenheimerFunds/Rochester


TOP HOLDINGS AND ALLOCATIONS
| | | | |
| |
Top Ten Categories
| |
| |
Hospital/Healthcare
| |
| 18.9
| %
|
Tobacco-Master Settlement Agreement
| |
| 9.0
|
|
Sales Tax Revenue
| |
| 7.5
|
|
Education
| |
| 7.0
|
|
General Obligation
| |
| 6.5
|
|
Adult Living Facilities
| |
| 5.6
|
|
Marine Aviation Facilities
| |
| 5.6
|
|
Student Loans
| |
| 5.1
|
|
Highways/Commuter Facilities
| |
| 5.0
|
|
| Municipal Leases | | | 4.1 | |
|
| Portfolio holdings are subject to change. Percentages are as of July 31, 2012, and are based on total assets. | |
| | | | | | |
| |
Credit Rating Breakdown
| | NRSRO Only Total
|
|
AAA
| |
| |
| 0.1
| %
|
AA
| |
| |
| 17.8
|
|
A
| |
| |
| 21.1
|
|
BBB
| |
| |
| 36.0
|
|
BB and lower
| |
| |
| 13.0
|
|
| Unrated | | | |
| 12.0
|
|
| Total | | | | | 100.0 | % |
|
| The percentages above are based on the market value of the Fund’s securities as of July 31, 2012, and are subject to change. All securities except for those labeled “unrated” have been rated by at least one Nationally Recognized Statistical Rating Organization (“NRSRO”), such as Standard & Poor’s (“S&P”). For securities rated only by an NRSRO other than S&P, OppenheimerFunds, Inc. (the “Manager”) converts that rating to the equivalent S&P rating. If two or more NRSROs have assigned a rating to a security, the highest rating is used. Unrated securities do not necessarily indicate low credit quality. | |
|
| For the purposes of this Credit Allocation table, “investment-grade” securities are securities rated within the NRSROs’ four highest rating categories, which include AAA, AA, A and BBB. Securities not rated by an NRSRO may or may not be equivalent of investment grade. For further details, please consult the Fund’s prospectus or Statement of Additional Information. | |
| | | | |
| 9 | | | | OPPENHEIMER NEW JERSEY MUNICIPAL FUND |
FUND PERFORMANCE DISCUSSION
How has the Fund performed? Below is a discussion by OppenheimerFunds, Inc., of the Fund’s performance during its fiscal year ended July 31, 2012, followed by a graphical comparison of the Fund’s performance to appropriate broad-based market indices.
Management’s Discussion of Fund Performance. In the reporting period ended July 31, 2012, Oppenheimer New Jersey Municipal Fund benefited from a rally in the municipal market and produced an annual total return of 16.21% at net asset value (10.69% with sales charge).
The charts on pages 14 to 17 show the Fund’s performance. We encourage investors to remain focused on their long-term financial objectives and believe that this Fund’s investments offer structural advantages that can help shareholders achieve their investment goals over the long term.
Securities issued in the Commonwealth of Puerto Rico, which are exempt from federal, state and local income taxes, represented 25.0% of the Fund’s net assets on July 31, 2012. The Fund’s holdings come from many different sectors, including the sales tax revenue sector, as well as general obligation debt. These investments are supported by taxes and other revenues designed to help finance electric utilities, highways and education.
The Fund’s investments in bonds issued in Puerto Rico, including bonds in the sales tax revenue sector (7.5% of the Fund’s total assets as of July 31, 2012), contributed positively to total return this reporting period. Debt-service payments on securities in this sector are paid using the issuing municipality’s sales tax revenues. An investment in this sector requires Fund managers to consider the economic conditions that a municipality has experienced and will likely experience, as well as the aggregate face value of the sales tax revenue bonds being issued relative to the municipality’s historic and likely sales tax balances.
During this reporting period, the market continued to react favorably to better fiscal management under the leadership of Gov. Luis Fortuño. This discipline has helped Puerto Rico significantly reduce pressure on its municipal bonds. The administration proposed another deficit budget for the fiscal year that began July 1, 2012, but has lowered the size of the deficit relative to spending considerably in recent years.
Bond sales have remained strong, despite concerns raised over credit quality. In a period of low issuance, the Puerto Rico Aqueduct and Sewer Authority came to market in February 2012 with $1.8 billion in senior-lien revenue bonds, the largest scheduled sale in the long-term market to date for the year. It came to market once again in March 2012, with another significant sale for $2.3 billion in public improvement refunding bonds, an increase from the anticipated $1.5 billion priced ahead of schedule.
| | | | |
| 10 | | | | OPPENHEIMER NEW JERSEY MUNICIPAL FUND |
During this reporting period, both S&P and Moody’s revised their outlooks on general obligation debt issued by the Commonwealth. As of July 31, 2012, the S&P rating was BBB and the Moody's rating was Baa1, both with negative outlooks. While the ratings agencies have raised concerns about the fiscal environment’s potential to delay structurally balanced budgets in the near future, our stance remains bullish. The Fund’s Puerto Rico holdings contributed positively to the Fund’s total return this reporting period, and we continue to remain confident in the Commonwealth’s ability to collect taxes and make its bond payments.
As of July 31, 2012, the Fund was invested in the hospital/healthcare sector, representing 18.9% of the Fund’s total assets and comprising the Fund’s largest industry sector. Our holdings in this sector consist of securities across the credit spectrum. The sector remained in the news this reporting period as many politicians, lobbyists, activists and others continued to argue about the constitutionality of the Affordable Care Act of 2010. On June 28, 2012, the Supreme Court upheld the “individual mandate,” which was considered the most controversial element of the Act. Immediately after the court’s ruling, some politicians suggested that Congress would revisit and perhaps seek to override the legislation. However, none of these developments has changed our perspective that our disciplined, security-specific approach to credit research can uncover many potentially advantageous opportunities for the Fund in this and other sectors. The hospital/health care sector contributed strongly to the Fund’s total return this reporting period.
The Fund continued to be invested this reporting period in bonds backed by proceeds from the tobacco Master Settlement Agreement (the MSA), the national litigation settlement with U.S tobacco manufacturers. At the end of this reporting period, MSA-backed tobacco bonds accounted for 9.0% of the Fund’s total assets and contributed positively to Fund performance.5
As in prior reporting periods, the tobacco bonds this Fund held during this reporting period made all scheduled payments of interest and principal on time and in full. Our long-term view of the sector remains bullish and, given attractive valuations, we will likely continue to hold a greater percentage of tobacco bonds in our portfolios than our peers. We are confident that this sector will continue to provide high levels of tax-free income to the long-term benefit of our yield-seeking investors.
5. Investments in “tobacco bonds,” which are backed by the proceeds a state or territory receives from the 1998 national litigation settlement with tobacco manufacturers, may be vulnerable to economic and/or legislative events that affect issuers in a particular municipal market sector. Annual payments by MSA-participating manufacturers, for example, hinge on many factors, including annual domestic cigarette shipments, inflation and the relative market share of non-participating manufacturers. To date, we believe consumption figures remain within an acceptable range of the assumptions used to structure MSA bonds. Future MSA payments could be reduced if consumption were to fall more rapidly than originally forecast.
| | | | |
| 11 | | | | OPPENHEIMER NEW JERSEY MUNICIPAL FUND |
FUND PERFORMANCE DISCUSSION
The Fund continued to favor the education sector this reporting period, which constituted 7.0% of total assets as of July 31, 2012. The bonds we hold in this sector have regularly provided high levels of tax-free income and during this reporting period, they contributed positively to the Fund’s total return.
General obligation debt backed by the full faith and taxing authority of the state and local governments represented 6.5% of the Fund’s total assets as of July 31, 2012. New Jersey officials consistently safeguarded the debt service payments on their general obligation bonds this reporting period, while working to resolve their ongoing budget challenges.
During this reporting period, the Fund remained invested in municipal inverse-floating rate securities, which are tax-exempt securities with interest payments that move inversely to changes in short-term interest rates. “Inverse floaters” generally offer higher tax-free yields than fixed-rate bonds of comparable maturity and credit quality, but they face greater price volatility, too. In periods of low short-term interest rates, inverse floaters generally offer very attractive levels of tax-free income. These securities contributed positively to the Fund’s total return this reporting period.
Our approach to municipal bond investing is flexible and responsive to market conditions. Shareholders should note that market conditions during this reporting period did not affect the Fund’s overall investment objectives or cause it to pay any capital gain distributions. In closing, we believe that the Fund’s structure and sector composition—as well as our time-tested strategies—will continue to benefit long-term investors through interest rate and economic cycles.
Comparing the Fund’s Performance to the Market. The graphs that follow show the performance of a hypothetical $10,000 investment in each class of shares of the Fund held until July 31, 2012. In the case of Class A, Class B and Class C shares, performance is measured over a ten-year period. In the case of Class Y shares, performance is measured from inception of the Class on November 29, 2010. The Fund’s performance reflects the deduction of the maximum initial sales charge on Class A shares, the applicable contingent deferred sales charge on Class B and Class C shares, and reinvestments of all dividends and capital gains distributions. Past performance cannot guarantee future results.
The Fund’s performance is compared to the performance of the Barclays Capital Municipal Bond Index, an unmanaged index of a broad range of investment grade municipal bonds that is widely regarded as a measure of the performance of the general municipal bond market. Index performance reflects the reinvestment of income but does not consider the effect of transaction costs, and none of the data in the graphs shows the effect of taxes. The Fund’s performance is also compared to the Consumer Price Index, a
| | | | |
| 12 | | | | OPPENHEIMER NEW JERSEY MUNICIPAL FUND |
non-securities index that measures changes in the inflation rate. The Fund’s performance reflects the effects of the Fund’s business and operating expenses. While index comparisons may be useful to provide a benchmark for the Fund’s performance, it must be noted that the Fund’s investments are not limited to the investments comprising the indices.
| | | | |
| 13 | | | | OPPENHEIMER NEW JERSEY MUNICIPAL FUND |
FUND PERFORMANCE DISCUSSION
Class A Shares
Comparison of Change in Value of $10,000 Hypothetical Investments in:
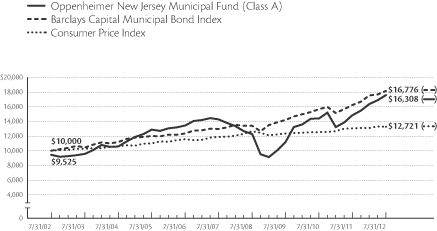
Average Annual Total Returns of Class A Shares With Sales Charge of the Fund at 7/31/12
1-Year 10.69% 5-Year 2.76% 10-Year 5.01%
| | | | |
| 14 | | | | OPPENHEIMER NEW JERSEY MUNICIPAL FUND |
Class B Shares
Comparison of Change in Value of $10,000 Hypothetical Investments in:
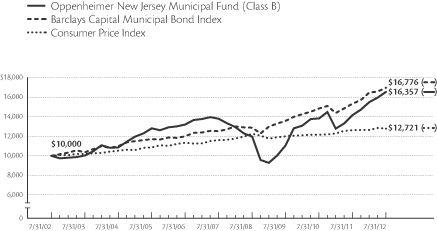
Average Annual Total Returns of Class B Shares With Sales Charge of the Fund at 7/31/12
1-Year 10.20% 5-Year 2.60% 10-Year 5.04%
The performance data quoted represents past performance, which does not guarantee future results. The investment return and principal value of an investment in the Fund will fluctuate so that an investor’s shares, when redeemed, may be worth more or less than their original cost. Current performance may be lower or higher than the performance quoted. Returns do not consider capital gains or income taxes on an individual’s investment. For performance data current to the most recent month-end, visit oppenheimerfunds.com or call 1.800.CALL OPP (225.5677). Fund returns include changes in share price, reinvested distributions, and the applicable sales charge for Class A shares, the current maximum initial sales charge of 4.75%; for Class B shares, and the contingent deferred sales charge of 5% (1-year) and 2% (5-year); and for Class C shares, the 1% contingent deferred sales charge for the 1-year period. There is no sales charge for Class Y shares. Because Class B shares convert to Class A shares 72 months after purchase, the 10-year return for Class B shares uses Class A performance for the period after conversion. See page 18 for further information.
| | | | |
| 15 | | | | OPPENHEIMER NEW JERSEY MUNICIPAL FUND |
FUND PERFORMANCE DISCUSSION
Class C Shares
Comparison of Change in Value of $10,000 Hypothetical Investments in:
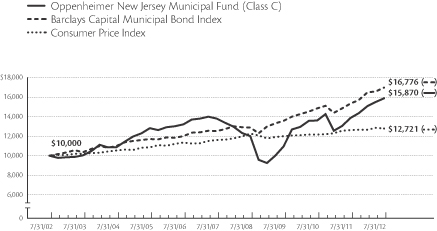
Average Annual Total Returns of Class C Shares With Sales Charge of the Fund at 7/31/12
1-Year 14.32% 5-Year 2.97% 10-Year 4.73%
| | | | |
| 16 | | | | OPPENHEIMER NEW JERSEY MUNICIPAL FUND |
Class Y Shares
Comparison of Change in Value of $10,000 Hypothetical Investments in:
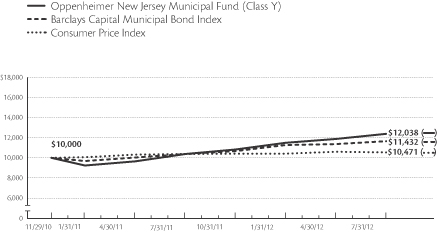
Average Annual Total Returns of Class Y Shares of the Fund at 7/31/12
1-Year 16.34% Since Inception (11/29/10) 11.73%
The performance data quoted represents past performance, which does not guarantee future results. The investment return and principal value of an investment in the Fund will fluctuate so that an investor’s shares, when redeemed, may be worth more or less than their original cost. Current performance may be lower or higher than the performance quoted. Returns do not consider capital gains or income taxes on an individual’s investment. For performance data current to the most recent month-end, visit oppenheimerfunds.com or call 1.800.CALL OPP (225.5677). Fund returns include changes in share price, reinvested distributions, and the applicable sales charge for Class A shares, the current maximum initial sales charge of 4.75%; for Class B shares, and the contingent deferred sales charge of 5% (1-year) and 2% (5-year); and for Class C shares, the 1% contingent deferred sales charge for the 1-year period. There is no sales charge for Class Y shares. Because Class B shares convert to Class A shares 72 months after purchase, the 10-year return for Class B shares uses Class A performance for the period after conversion. See page 18 for further information.
| | | | |
| 17 | | | | OPPENHEIMER NEW JERSEY MUNICIPAL FUND |
NOTES
Total returns and the ending account values in the graphs include changes in share price and reinvestment of dividends and capital gains distributions in a hypothetical investment for the periods shown. Cumulative total returns are not annualized. The Fund’s total returns shown do not reflect the deduction of income taxes on an individual’s investment. Taxes may reduce your actual investment returns on income or gains paid by the Fund or any gains you may realize if you sell your shares. This annual report must be preceded or accompanied by the current prospectus of Oppenheimer New Jersey Municipal Fund. Before investing in any of the Oppenheimer funds, investors should carefully consider a fund's investment objectives, risks, charges and expenses. Fund prospectuses and summary prospectuses contain this and other information about the funds, and may be obtained by asking your financial advisor, visiting oppenheimerfunds.com, or calling 1.800.CALL OPP (225.5677). Read prospectuses and summary prospectuses carefully before investing.
The Fund’s investment strategy and focus can change over time. The mention of specific fund holdings does not constitute a recommendation by OppenheimerFunds, Inc.
Class A shares of the Fund were first publicly offered on 3/1/94. Unless otherwise noted, Class A returns include the current maximum initial sales charge of 4.75%.
Class B shares of the Fund were first publicly offered on 3/1/94. Unless otherwise noted, Class B returns include the applicable contingent deferred sales charge of 5% (1-year) and 2% (5-year). Because Class B shares convert to Class A shares 72 months after purchase, the 10-year return for Class B shares uses Class A performance for the period after conversion. Class B shares are subject to an annual 0.75% asset-based sales charge.
Class C shares of the Fund were first publicly offered on 8/29/95. Unless otherwise noted, Class C returns include the applicable 1% contingent deferred sales charge for the 1-year period. Class C shares are subject to an annual 0.75% asset-based sales charge.
Class Y shares of the Fund were first publicly offered on 11/29/10. Class Y shares are offered only to fee-based clients of dealers that have a special agreement with the Distributor, to certain institutional investors under a special agreement with the Distributor, and to present or former officers, directors, trustees and employees (and their eligible family members) of the Fund, the Manager, its affiliates, its parent company and the subsidiaries of its parent company, and retirement plans established for the benefit of such individuals. There is no sales charge for Class Y shares.
| | | | |
| 18 | | | | OPPENHEIMER NEW JERSEY MUNICIPAL FUND |
FUND EXPENSES
Fund Expenses. As a shareholder of the Fund, you incur two types of costs: (1) transaction costs, which may include sales charges (loads) on purchase payments, contingent deferred sales charges on redemptions and (2) ongoing costs, including management fees; distribution and service fees; and other Fund expenses. These examples are intended to help you understand your ongoing costs (in dollars) of investing in the Fund and to compare these costs with the ongoing costs of investing in other mutual funds.
The examples are based on an investment of $1,000.00 invested at the beginning of the period and held for the entire 6-month period ended July 31, 2012.
Actual Expenses. The first section of the table provides information about actual account values and actual expenses. You may use the information in this section for the class of shares you hold, together with the amount you invested, to estimate the expense that you paid over the period. Simply divide your account value by $1,000.00 (for example, an $8,600.00 account value divided by $1,000.00 = 8.60), then multiply the result by the number in the first section under the heading entitled “Expenses Paid During Period” to estimate the expenses you paid on your account during this period.
Hypothetical Example for Comparison Purposes. The second section of the table provides information about hypothetical account values and hypothetical expenses based on the Fund’s actual expense ratio for each class of shares, and an assumed rate of return of 5% per year for each class before expenses, which is not the actual return. The hypothetical account values and expenses may not be used to estimate the actual ending account balance or expenses you paid for the period. You may use this information to compare the ongoing costs of investing in the Fund and other funds. To do so, compare this 5% hypothetical example for the class of shares you hold with the 5% hypothetical examples that appear in the shareholder reports of the other funds.
Please note that the expenses shown in the table are meant to highlight your ongoing costs only and do not reflect any transactional costs, such as front-end or contingent deferred sales charges (loads), or a $12.00 fee imposed annually on accounts valued at less than $500.00 (subject to exceptions described in the Statement of Additional Information). Therefore, the “hypothetical” section of the table is useful in comparing ongoing costs only, and will not help you determine the relative total costs of owning different funds. In addition, if these transactional costs were included, your costs would have been higher.
| | | | |
| 19 | | | | OPPENHEIMER NEW JERSEY MUNICIPAL FUND |
FUND EXPENSES
| | | | | | | | | | | | |
| Actual | | Beginning
Account
Value
February 1, 2012 | | | Ending
Account
Value
July 31, 2012 | | | Expenses
Paid During
6 Months Ended
July 31, 2012 | |
| Class A | | $ | 1,000.00 | | | $ | 1,064.90 | | | $ | 4.68 | |
| Class B | | | 1,000.00 | | | | 1,060.50 | | | | 8.85 | |
| Class C | | | 1,000.00 | | | | 1,060.80 | | | | 8.59 | |
| Class Y | | | 1,000.00 | | | | 1,065.50 | | | | 4.01 | |
| | | |
Hypothetical
(5% return before expenses) | | | | | | | | | |
| Class A | | | 1,000.00 | | | | 1,020.34 | | | | 4.58 | |
| Class B | | | 1,000.00 | | | | 1,016.31 | | | | 8.66 | |
| Class C | | | 1,000.00 | | | | 1,016.56 | | | | 8.41 | |
| Class Y | | | 1,000.00 | | | | 1,020.98 | | | | 3.93 | |
Expenses are equal to the Fund’s annualized expense ratio for that class, multiplied by the average account value over the period, multiplied by 182/366 (to reflect the one-half year period). Those annualized expense ratios based on the 6-month period ended July 31, 2012 are as follows:
| | | | |
| Class | | Expense Ratios | |
| Class A | | | 0.91 | % |
| Class B | | | 1.72 | |
| Class C | | | 1.67 | |
| Class Y | | | 0.78 | |
The expense ratios reflect voluntary waivers and/or reimbursements of expenses by the Fund’s Manager. Some of these undertakings may be modified or terminated at any time, as indicated in the Fund's prospectus. The “Financial Highlights” tables in the Fund’s financial statements, included in this report, also show the gross expense ratios, without such waivers or reimbursements and reduction to custodian expenses, if applicable.
| | | | |
| 20 | | | | OPPENHEIMER NEW JERSEY MUNICIPAL FUND |
STATEMENT OF INVESTMENTS July 31, 2012
| | | | | | | | | | | | | | | | |
Principal
Amount | | | | | Coupon | | | Maturity | | | Value | |
| | | | | | | | | | | | | | | | | |
| | Municipal Bonds and Notes—106.7% | | | | | |
| | New Jersey—78.8% | | | | | |
| | $ 10,000 | | | Atlantic City, NJ Municipal Utilities Authority1 | | | 4.625 | % | | | 05/01/2017 | | | $ | 10,050 | |
| | 305,000 | | | Atlantic County, NJ Utilities Authority Solid Waste1 | | | 7.125 | | | | 03/01/2016 | | | | 305,918 | |
| | 3,335,000 | | | Bayonne, NJ Parking Authority (City Parking) | | | 5.000 | | | | 06/15/2027 | | | | 3,247,790 | |
| | 6,065,000 | | | Bayonne, NJ Redevel. Agency1 | | | 7.625 | | | | 04/01/2038 | | | | 7,111,334 | |
| | 10,000 | | | Bergen County, NJ HDC | | | 6.750 | | | | 10/01/2018 | | | | 10,035 | |
| | 50,000 | | | Berkeley, NJ HFC (Bayville Hsg.) | | | 5.750 | | | | 08/01/2014 | | | | 50,183 | |
| | 140,000 | | | Camden County, NJ Improvement Authority (Cooper Health System)1 | | | 5.000 | | | | 02/15/2035 | | | | 143,567 | |
| | 190,000 | | | Camden County, NJ Improvement Authority (Cooper Health System)1 | | | 5.750 | | | | 02/15/2034 | | | | 194,110 | |
| | 60,000 | | | Casino Reinvestment Devel. Authority of NJ1 | | | 5.250 | | | | 06/01/2017 | | | | 64,861 | |
| | 10,000 | | | Delaware River Port Authority PA/NJ1 | | | 5.000 | | | | 01/01/2019 | | | | 10,020 | |
| | 60,000 | | | Delaware River Port Authority PA/NJ1 | | | 5.000 | | | | 01/01/2026 | | | | 60,070 | |
| | 40,000 | | | Delaware River Port Authority PA/NJ1 | | | 5.200 | | | | 01/01/2027 | | | | 40,077 | |
| | 1,530,000 | | | Delaware River Port Authority PA/NJ1 | | | 5.625 | | | | 01/01/2026 | | | | 1,533,534 | |
| | 25,000 | | | Delaware River Port Authority PA/NJ1 | | | 5.700 | | | | 01/01/2023 | | | | 25,068 | |
| | 2,050,000 | | | Delaware River Port Authority PA/NJ1 | | | 5.700 | | | | 01/01/2022 | | | | 2,055,494 | |
| | 250,000 | | | Essex County, NJ Improvement Authority (Newark)1 | | | 6.250 | | | | 11/01/2030 | | | | 291,183 | |
| | 20,000 | | | Essex County, NJ Improvement Authority (Sportsplex) | | | 5.625 | | | | 10/01/2023 | | | | 20,045 | |
| | 105,000 | | | Essex County, NJ Improvement Authority (Sportsplex) | | | 5.625 | | | | 10/01/2027 | | | | 105,206 | |
| | 5,000 | | | Highlands, NJ Board of Education COP | | | 6.375 | | | | 02/15/2017 | | | | 5,015 | |
| | 1,000,000 | | | Hudson County, NJ Improvement Authority1 | | | 6.000 | | | | 01/01/2040 | | | | 1,196,290 | |
| | 1,500,000 | | | Hudson County, NJ Improvement Authority (Lincoln Park Golf Course)1 | | | 5.000 | | | | 06/01/2035 | | | | 1,686,000 | |
| | 1,250,000 | | | Hudson County, NJ Improvement Authority (Lincoln Park Golf Course)1 | | | 5.000 | | | | 06/01/2038 | | | | 1,397,900 | |
| | 2,655,000 | | | Hudson County, NJ Improvement Authority (Lincoln Park Golf Course)1 | | | 5.500 | | | | 06/01/2041 | | | | 3,078,313 | |
| | 300,000 | | | Irvington Township, NJ GO1 | | | 5.000 | | | | 07/15/2033 | | | | 302,652 | |
| | 5,000 | | | Jackson, NJ Township Municipal Utilities Authority | | | 5.500 | | | | 12/01/2015 | | | | 5,018 | |
| | 95,000 | | | Lodie, NJ Board of Education COP1 | | | 5.700 | | | | 09/15/2021 | | | | 95,224 | |
| | 100,000 | | | Middlesex County, NJ COP1 | | | 5.000 | | | | 02/15/2019 | | | | 100,309 | |
| | 70,000 | | | Middlesex County, NJ COP1 | | | 5.000 | | | | 08/01/2031 | | | | 70,047 | |
| | 485,000 | | | Middlesex County, NJ Improvement Authority (Heldrich Center Hotel)1 | | | 5.000 | | | | 01/01/2015 | | | | 322,976 | |
| | 500,000 | | | Middlesex County, NJ Improvement Authority (Heldrich Center Hotel)1 | | | 5.000 | | | | 01/01/2020 | | | | 317,950 | |
| | | | |
| 21 | | | | OPPENHEIMER NEW JERSEY MUNICIPAL FUND |
STATEMENT OF INVESTMENTS Continued
| | | | | | | | | | | | | | | | |
Principal
Amount | | | | | Coupon | | | Maturity | | | Value | |
| | | | | | | | | | | | | | | | | |
| | New Jersey Continued | | | | | | | | | | | | |
| | $ 2,535,000 | | | Middlesex County, NJ Improvement Authority (Heldrich Center Hotel)1 | | | 5.000 | % | | | 01/01/2032 | | | $ | 1,629,473 | |
| | 1,100,000 | | | Middlesex County, NJ Improvement Authority (Heldrich Center Hotel)1 | | | 5.125 | | | | 01/01/2037 | | | | 707,476 | |
| | 20,000 | | | Middlesex County, NJ Improvement Authority (South Plainfield Urban Renewal)1 | | | 5.500 | | | | 09/01/2030 | | | | 20,030 | |
| | 150,000 | | | Middlesex County, NJ Pollution Control Authority (Amerada Hess Corp.)1 | | | 5.750 | | | | 09/15/2032 | | | | 150,413 | |
| | 40,000 | | | Neptune City, NJ Hsg. Authority1 | | | 6.000 | | | | 04/01/2019 | | | | 40,082 | |
| | 445,000 | | | New Brunswick, NJ Parking Authority1 | | | 5.000 | | | | 09/01/2027 | | | | 520,877 | |
| | 605,000 | | | New Brunswick, NJ Parking Authority1 | | | 5.000 | | | | 09/01/2029 | | | | 702,453 | |
| | 300,000 | | | New Brunswick, NJ Parking Authority1 | | | 5.000 | | | | 09/01/2031 | | | | 344,685 | |
| | 50,000 | | | Newark, NJ Hsg. Authority (Lock Street Urban Renewal Partnership)1 | | | 6.400 | | | | 01/20/2034 | | | | 50,100 | |
| | 2,875,000 | | | Newark, NJ Hsg. Authority (South Ward Police Facility)1 | | | 6.750 | | | | 12/01/2038 | | | | 3,631,700 | |
| | 2,095,000 | | | NJ EDA1 | | | 5.000 | | | | 06/15/2028 | | | | 2,312,042 | |
| | 750,000 | | | NJ EDA1 | | | 5.000 | | | | 06/15/2029 | | | | 823,800 | |
| | 2,045,000 | | | NJ EDA (American Airlines)2 | | | 7.100 | | | | 11/01/2031 | | | | 953,461 | |
| | 50,000 | | | NJ EDA (Bristol Glen)1 | | | 5.750 | | | | 07/01/2029 | | | | 50,021 | |
| | 755,000 | | | NJ EDA (Cadbury at Cherry Hill) | | | 5.500 | | | | 07/01/2018 | | | | 755,015 | |
| | 25,000 | | | NJ EDA (Cadbury at Cherry Hill) | | | 5.500 | | | | 07/01/2028 | | | | 23,173 | |
| | 300,000 | | | NJ EDA (Chilton Memorial Hospital)1 | | | 5.500 | | | | 07/01/2029 | | | | 321,978 | |
| | 25,000 | | | NJ EDA (Consumers New Jersey Water Company) | | | 5.100 | | | | 09/01/2032 | | | | 25,146 | |
| | 2,500,000 | | | NJ EDA (Continental Airlines)1 | | | 6.250 | | | | 09/15/2019 | | | | 2,510,075 | |
| | 3,000,000 | | | NJ EDA (Continental Airlines)1 | | | 6.400 | | | | 09/15/2023 | | | | 3,012,420 | |
| | 11,430,000 | | | NJ EDA (Continental Airlines)1 | | | 7.000 | | | | 11/15/2030 | | | | 11,473,777 | |
| | 3,100,000 | | | NJ EDA (Cranes Mill)1 | | | 5.100 | | | | 06/01/2027 | | | | 3,148,360 | |
| | 175,000 | | | NJ EDA (Dept. of Human Services)1 | | | 6.250 | | | | 07/01/2024 | | | | 175,441 | |
| | 135,000 | | | NJ EDA (Devereux Foundation)1 | | | 5.450 | | | | 05/01/2027 | | | | 135,186 | |
| | 1,525,000 | | | NJ EDA (Drew University)1 | | | 5.250 | | | | 07/01/2021 | | | | 1,832,638 | |
| | 2,339,945 | | | NJ EDA (Empowerment Zone-Cumberland)2 | | | 7.750 | | | | 03/01/2021 | | | | 23,376 | |
| | 2,000,000 | | | NJ EDA (Engel Burman at Woodcliff Lake) | | | 8.000 | | | | 05/01/2044 | | | | 2,194,160 | |
| | 2,000,000 | | | NJ EDA (Engel Burman at Woodcliff Lake) | | | 8.000 | | | | 05/01/2044 | | | | 2,194,160 | |
| | 2,000,000 | | | NJ EDA (Engel Burman at Woodcliff Lake)3 | | | 8.000 | | | | 05/01/2044 | | | | 2,194,160 | |
| | 6,000,000 | | | NJ EDA (GMT Realty) | | | 6.875 | | | | 01/01/2037 | | | | 6,092,220 | |
| | 17,975,000 | | | NJ EDA (Hamilton Care) | | | 6.650 | | | | 11/01/2037 | | | | 18,592,981 | |
| | 3,050,000 | | | NJ EDA (Harrogate)1 | | | 5.875 | | | | 12/01/2026 | | | | 3,051,617 | |
| | 10,000 | | | NJ EDA (Hillcrest Health Service) | | | 7.250 | 4 | | | 01/01/2018 | | | | 7,908 | |
| | 4,135,000 | | | NJ EDA (Kapkowski Road Landfill)1 | | | 6.500 | | | | 04/01/2031 | | | | 4,895,633 | |
| | | | |
| 22 | | | | OPPENHEIMER NEW JERSEY MUNICIPAL FUND |
| | | | | | | | | | | | | | | | |
Principal
Amount | | | | | Coupon | | | Maturity | | | Value | |
| | | | | | | | | | | | | | | | | |
| | New Jersey Continued | | | | | | | | | | | | |
| | $ 2,060,000 | | | NJ EDA (Keswick Pines) | | | 5.700 | % | | | 01/01/2018 | | | $ | 2,060,906 | |
| | 6,655,000 | | | NJ EDA (Keswick Pines) | | | 5.750 | | | | 01/01/2024 | | | | 6,654,800 | |
| | 30,000 | | | NJ EDA (Kullman Associates)5 | | | 6.125 | | | | 06/01/2018 | | | | 22,883 | |
| | 110,000 | | | NJ EDA (Kullman Associates)5 | | | 6.750 | | | | 07/01/2019 | | | | 83,884 | |
| | 160,000 | | | NJ EDA (Leisure Park) | | | 5.875 | | | | 12/01/2027 | | | | 160,024 | |
| | 90,000 | | | NJ EDA (Liberty State Park Lease Rental) | | | 5.750 | | | | 03/15/2022 | | | | 90,334 | |
| | 50,000 | | | NJ EDA (Liberty State Park) | | | 5.700 | | | | 03/15/2016 | | | | 50,204 | |
| | 810,000 | | | NJ EDA (Lions Gate) | | | 5.750 | | | | 01/01/2025 | | | | 820,595 | |
| | 1,345,000 | | | NJ EDA (Lions Gate) | | | 5.875 | | | | 01/01/2037 | | | | 1,351,819 | |
| | 30,000 | | | NJ EDA (Manchester Manor)1 | | | 6.700 | | | | 08/01/2022 | | | | 30,092 | |
| | 1,000,000 | | | NJ EDA (Marcus L. Ward Home)1 | | | 5.750 | | | | 11/01/2024 | | | | 1,030,530 | |
| | 1,200,000 | | | NJ EDA (Marcus L. Ward Home)1 | | | 5.800 | | | | 11/01/2031 | | | | 1,232,136 | |
| | 2,550,000 | | | NJ EDA (Masonic Charity Foundation of New Jersey)1 | | | 5.500 | | | | 06/01/2031 | | | | 2,579,325 | |
| | 1,000,000 | | | NJ EDA (Masonic Charity Foundation of New Jersey)1 | | | 6.000 | | | | 06/01/2025 | | | | 1,011,880 | |
| | 90,000 | | | NJ EDA (Metromall Urban Renewal)1 | | | 6.500 | | | | 04/01/2031 | | | | 90,100 | |
| | 55,000 | | | NJ EDA (Middlesex Water Company)1 | | | 5.200 | | | | 10/01/2022 | | | | 55,104 | |
| | 1,535,000 | | | NJ EDA (Middlesex Water Company)1 | | | 5.250 | | | | 02/01/2029 | | | | 1,536,013 | |
| | 4,400,000 | | | NJ EDA (Motor Vehicle Surcharges)1 | | | 5.000 | | | | 07/01/2029 | | | | 4,688,992 | |
| | 330,000 | | | NJ EDA (Motor Vehicle Surcharges)1 | | | 5.250 | | | | 07/01/2031 | | | | 353,420 | |
| | 3,925,000 | | | NJ EDA (Motor Vehicle Surcharges)1 | | | 5.250 | | | | 07/01/2033 | | | | 4,203,557 | |
| | 2,500,000 | | | NJ EDA (MSU Student Hsg.)1 | | | 5.750 | | | | 06/01/2031 | | | | 2,798,700 | |
| | 5,000 | | | NJ EDA (New Jersey American Water Company)1 | | | 5.250 | | | | 11/01/2032 | | | | 5,072 | |
| | 5,320,000 | | | NJ EDA (New Jersey American Water Company)1 | | | 5.600 | | | | 11/01/2034 | | | | 6,066,502 | |
| | 4,350,000 | | | NJ EDA (New Jersey American Water Company)1 | | | 5.700 | | | | 10/01/2039 | | | | 4,874,741 | |
| | 125,000 | | | NJ EDA (New Jersey Natural Gas Company)1 | | | 5.000 | | | | 12/01/2038 | | | | 126,528 | |
| | 30,000 | | | NJ EDA (New Jersey Transit Corp.)1 | | | 5.750 | | | | 12/15/2017 | | | | 30,088 | |
| | 145,000 | | | NJ EDA (New Jersey Transit Corp.)1 | | | 5.750 | | | | 12/15/2017 | | | | 145,425 | |
| | 400,000 | | | NJ EDA (Newark Downtown District Management Corp.)1 | | | 5.125 | | | | 06/15/2027 | | | | 419,904 | |
| | 1,400,000 | | | NJ EDA (Newark Downtown District Management Corp.)1 | | | 5.125 | | | | 06/15/2037 | | | | 1,448,342 | |
| | 3,995,000 | | | NJ EDA (Nui Corp.)1 | | | 5.250 | | | | 11/01/2033 | | | | 3,998,236 | |
| | 280,000 | | | NJ EDA (Nui Corp.)1 | | | 5.250 | | | | 11/01/2033 | | | | 280,227 | |
| | 650,000 | | | NJ EDA (Paterson Charter School Science & Technology)1 | | | 6.000 | | | | 07/01/2032 | | | | 685,737 | |
| | 1,900,000 | | | NJ EDA (Paterson Charter School Science & Technology)1 | | | 6.100 | | | | 07/01/2044 | | | | 1,992,055 | |
| | 5,520,000 | | | NJ EDA (Pingry School) | | | 5.000 | | | | 11/01/2038 | | | | 5,524,250 | |
| | 905,000 | | | NJ EDA (Reformed Church Ministries to the Aging The Particulare Synod Mid-Atlantics)1 | | | 5.375 | | | | 12/01/2018 | | | | 905,353 | |
| | | | |
| 23 | | | | OPPENHEIMER NEW JERSEY MUNICIPAL FUND |
STATEMENT OF INVESTMENTS Continued
| | | | | | | | | | | | | | | | |
Principal
Amount | | | | | Coupon | | | Maturity | | | Value | |
| | | | | | | | | | | | | | | | | |
| | New Jersey Continued | | | | | | | | | | | | |
| | $ 5,000,000 | | | NJ EDA (School Facilities Construction)1 | | | 5.125 | % | | | 03/01/2028 | | | $ | 5,407,850 | |
| | 17,430,000 | | | NJ EDA (School Facilities Construction)1 | | | 5.125 | | | | 03/01/2030 | | | | 18,737,424 | |
| | 2,500,000 | | | NJ EDA (School Facilities Construction)1 | | | 5.250 | | | | 09/01/2023 | | | | 3,029,800 | |
| | 8,000,000 | | | NJ EDA (School Facilities Construction)1 | | | 5.750 | | | | 09/01/2023 | | | | 9,981,680 | |
| | 1,000,000 | | | NJ EDA (School Facilities)1 | | | 5.250 | | | | 09/01/2026 | | | | 1,182,830 | |
| | 4,000,000 | | | NJ EDA (Seeing Eye)1 | | | 5.000 | | | | 06/01/2032 | | | | 4,619,600 | |
| | 50,000 | | | NJ EDA (St. Barnabas Medical Center) | | | 6.750 | 4 | | | 07/01/2018 | | | | 41,027 | |
| | 65,000 | | | NJ EDA (St. Barnabas Medical Center) | | | 6.833 | 4 | | | 07/01/2021 | | | | 45,145 | |
| | 25,000 | | | NJ EDA (St. Barnabas Medical Center) | | | 7.153 | 4 | | | 07/01/2020 | | | | 18,371 | |
| | 10,000 | | | NJ EDA (The Presbyterian Home at Montgomery) | | | 6.250 | | | | 11/01/2020 | | | | 10,014 | |
| | 115,000 | | | NJ EDA (The Presbyterian Home at Montgomery) | | | 6.375 | | | | 11/01/2031 | | | | 114,976 | |
| | 20,000 | | | NJ EDA (United Methodist Homes of New Jersey)1 | | | 5.125 | | | | 07/01/2018 | | | | 20,014 | |
| | 50,000 | | | NJ EDA (United Water New Jersey)1 | | | 5.500 | | | | 07/01/2039 | | | | 53,143 | |
| | 480,000 | | | NJ EDA (University of Medicine and Dentistry of New Jersey)1 | | | 5.500 | | | | 12/01/2023 | | | | 485,093 | |
| | 615,000 | | | NJ EDA (University of Medicine and Dentistry of New Jersey)1 | | | 5.500 | | | | 12/01/2027 | | | | 622,786 | |
| | 20,000 | | | NJ EDA (University of Medicine and Dentistry of New Jersey) | | | 5.750 | | | | 06/01/2016 | | | | 20,059 | |
| | 45,000 | | | NJ EDA (University of Medicine and Dentistry of New Jersey)1 | | | 6.000 | | | | 06/01/2021 | | | | 45,103 | |
| | 2,500,000 | | | NJ EDA Retirement Community (Seabrook Village) | | | 5.250 | | | | 11/15/2026 | | | | 2,564,375 | |
| | 3,500,000 | | | NJ EDA Retirement Community (Seabrook Village) | | | 5.250 | | | | 11/15/2036 | | | | 3,533,810 | |
| | 660,000 | | | NJ Educational Facilities Authority (Fairleigh Dickinson University), Series D1 | | | 5.250 | | | | 07/01/2032 | | | | 664,726 | |
| | 16,410,000 | | | NJ Educational Facilities Authority (Fairleigh Dickinson University), Series D1 | | | 6.000 | | | | 07/01/2025 | | | | 16,740,497 | |
| | 1,735,000 | | | NJ Educational Facilities Authority (Georgian Court University)1 | | | 5.000 | | | | 07/01/2033 | | | | 1,837,486 | |
| | 300,000 | | | NJ Educational Facilities Authority (Georgian Court University)1 | | | 5.250 | | | | 07/01/2027 | | | | 323,445 | |
| | 40,000 | | | NJ Educational Facilities Authority (Kean University)1 | | | 5.000 | | | | 07/01/2018 | | | | 40,109 | |
| | 30,000 | | | NJ Educational Facilities Authority (Kean University)1 | | | 5.000 | | | | 07/01/2021 | | | | 30,056 | |
| | 1,000,000 | | | NJ Educational Facilities Authority (Princeton Theological Seminary)1 | | | 5.000 | | | | 07/01/2026 | | | | 1,043,510 | |
| | 855,000 | | | NJ Educational Facilities Authority (Ramapo College)1 | | | 5.000 | | | | 07/01/2037 | | | | 965,090 | |
| | 500,000 | | | NJ Educational Facilities Authority (Rider University)1 | | | 5.000 | | | | 07/01/2037 | | | | 542,835 | |
| | 5,000 | | | NJ Educational Facilities Authority (Stevens Institute of Technology)1 | | | 5.000 | | | | 07/01/2018 | | | | 5,612 | |
| | 4,055,000 | | | NJ Health Care Facilities Financing Authority (AHS Hospital Corp.)1 | | | 5.500 | | | | 07/01/2031 | | | | 4,751,081 | |
| | | | |
| 24 | | | | OPPENHEIMER NEW JERSEY MUNICIPAL FUND |
| | | | | | | | | | | | | | | | |
Principal
Amount | | | | | Coupon | | | Maturity | | | Value | |
| | | | | | | | | | | | | | | | | |
| | New Jersey Continued | | | | | | | | | | | | |
| | $ 2,000,000 | | | NJ Health Care Facilities Financing Authority (Barnabas Health)1 | | | 5.625 | % | | | 07/01/2032 | | | $ | 2,201,480 | |
| | 17,085,000 | | | NJ Health Care Facilities Financing Authority (Catholic Health East)1 | | | 5.000 | | | | 11/15/2033 | | | | 18,625,213 | |
| | 25,000 | | | NJ Health Care Facilities Financing Authority (CMMC/CMHS Obligated Group)1 | | | 5.000 | | | | 07/01/2025 | | | | 25,057 | |
| | 7,000,000 | | | NJ Health Care Facilities Financing Authority (Deborah Heart & Lung Center)1 | | | 6.300 | | | | 07/01/2023 | | | | 6,999,370 | |
| | 50,000 | | | NJ Health Care Facilities Financing Authority (Englewood Hospital & Medical Center)1 | | | 5.000 | | | | 02/01/2021 | | | | 50,122 | |
| | 1,750,000 | | | NJ Health Care Facilities Financing Authority (Hackensack University Medical Center)1 | | | 5.000 | | | | 01/01/2034 | | | | 1,853,810 | |
| | 750,000 | | | NJ Health Care Facilities Financing Authority (Hebrew Old Age Center of Atlantic City) | | | 5.300 | | | | 11/01/2026 | | | | 731,348 | |
| | 1,000,000 | | | NJ Health Care Facilities Financing Authority (Hebrew Old Age Center of Atlantic City) | | | 5.375 | | | | 11/01/2036 | | | | 925,610 | |
| | 1,010,000 | | | NJ Health Care Facilities Financing Authority (Holy Name Hospital)1 | | | 5.000 | | | | 07/01/2036 | | | | 1,027,726 | |
| | 295,000 | | | NJ Health Care Facilities Financing Authority (Hospital Asset Transformation)1 | | | 5.250 | | | | 10/01/2038 | | | | 321,774 | |
| | 15,000 | | | NJ Health Care Facilities Financing Authority (Jersey City Medical Center) | | | 5.000 | | | | 08/01/2031 | | | | 15,015 | |
| | 1,500,000 | | | NJ Health Care Facilities Financing Authority (Kennedy Health System)1 | | | 5.000 | | | | 07/01/2031 | | | | 1,646,865 | |
| | 70,000 | | | NJ Health Care Facilities Financing Authority (KMH-UMC/KSC Obligated Group) | | | 5.250 | | | | 07/01/2015 | | | | 70,167 | |
| | 1,250,000 | | | NJ Health Care Facilities Financing Authority (KMH-UMC/KSC Obligated Group)1 | | | 5.625 | | | | 07/01/2031 | | | | 1,255,650 | |
| | 50,000 | | | NJ Health Care Facilities Financing Authority (Palisades Medical Center)1 | | | 5.200 | | | | 07/01/2019 | | | | 50,033 | |
| | 1,388,838 | | | NJ Health Care Facilities Financing Authority (Pascack Valley Hospital Assoc.)2 | | | 5.125 | | | | 07/01/2018 | | | | 14 | |
| | 5,589,317 | | | NJ Health Care Facilities Financing Authority (Pascack Valley Hospital Assoc.)2 | | | 5.125 | | | | 07/01/2028 | | | | 56 | |
| | 129,334 | | | NJ Health Care Facilities Financing Authority (Pascack Valley Hospital Assoc.)2 | | | 6.625 | | | | 07/01/2036 | | | | 1 | |
| | 400,000 | | | NJ Health Care Facilities Financing Authority (Raritan Bay Medical Center) | | | 7.250 | | | | 07/01/2014 | | | | 400,204 | |
| | 9,830,000 | | | NJ Health Care Facilities Financing Authority (Raritan Bay Medical Center) | | | 7.250 | | | | 07/01/2027 | | | | 9,097,075 | |
| | 2,030,000 | | | NJ Health Care Facilities Financing Authority (RWJ University Hospital) | | | 5.000 | | | | 07/01/2035 | | | | 2,044,961 | |
| | 10,000 | | | NJ Health Care Facilities Financing Authority (Somerset Medical Center)1 | | | 5.500 | | | | 07/01/2023 | | | | 10,096 | |
| | | | |
| 25 | | | | OPPENHEIMER NEW JERSEY MUNICIPAL FUND |
STATEMENT OF INVESTMENTS Continued
| | | | | | | | | | | | | | | | |
Principal
Amount | | | | | Coupon | | | Maturity | | | Value | |
| | | | | | | | | | | | | | | | | |
| | New Jersey Continued | | | | | | | | | | | | |
| | $ 70,000 | | | NJ Health Care Facilities Financing Authority (Somerset Medical Center)1 | | | 5.500 | % | | | 07/01/2033 | | | $ | 70,388 | |
| | 15,000 | | | NJ Health Care Facilities Financing Authority (St. Barnabas Corp.) | | | 6.621 | 4 | | | 07/01/2017 | | | | 12,832 | |
| | 37,955,000 | | | NJ Health Care Facilities Financing Authority (St. Barnabas Corp./St. Barnabas Medical Center Obligated Group) | | | 6.250 | 4 | | | 07/01/2030 | | | | 15,584,703 | |
| | 20,000 | | | NJ Health Care Facilities Financing Authority (St. Barnabas)1 | | | 5.000 | | | | 07/01/2024 | | | | 20,017 | |
| | 17,000,000 | | | NJ Health Care Facilities Financing Authority (St. Joseph’s Hospital & Medical Center)1 | | | 6.625 | | | | 07/01/2038 | | | | 20,070,030 | |
| | 2,500,000 | | | NJ Health Care Facilities Financing Authority (St. Peter’s University Hospital)1 | | | 6.250 | | | | 07/01/2035 | | | | 2,884,825 | |
| | 35,000 | | | NJ Health Care Facilities Financing Authority (THGS/THGSF Obligated Group) | | | 5.100 | | | | 07/01/2021 | | | | 35,000 | |
| | 50,000 | | | NJ Health Care Facilities Financing Authority (THGS/THGSF Obligated Group) | | | 5.200 | | | | 07/01/2031 | | | | 47,470 | |
| | 2,170,000 | | | NJ Health Care Facilities Financing Authority (Trinitas Hospital)1 | | | 5.250 | | | | 07/01/2030 | | | | 2,269,212 | |
| | 6,400,000 | | | NJ Health Care Facilities Financing Authority (Trinitas Hospital/Marillac Corp. Obligated Group)1 | | | 5.250 | | | | 07/01/2023 | | | | 6,824,256 | |
| | 5,380,000 | | | NJ Health Care Facilities Financing Authority (Trinitas Hospital/Marillac Corp. Obligated Group)1 | | | 5.250 | | | | 07/01/2030 | | | | 5,640,553 | |
| | 125,000 | | | NJ Health Care Facilities Financing Authority (Virtua Health Obligated Group)1 | | | 5.750 | | | | 07/01/2033 | | | | 142,346 | |
| | 75,000 | | | NJ Health Care Facilities Financing Authority (Virtua West Jersey Health System/Virtua Health Obligated Group)1 | | | 5.375 | | | | 07/01/2029 | | | | 77,297 | |
| | 45,000 | | | NJ Higher Education Assistance Authority | | | 5.125 | | | | 06/01/2014 | | | | 45,123 | |
| | 185,000 | | | NJ Higher Education Student Assistance Authority (Student Loans)1 | | | 5.250 | | | | 06/01/2018 | | | | 185,346 | |
| | 330,000 | | | NJ Higher Education Student Assistance Authority (Student Loans) | | | 6.000 | | | | 06/01/2015 | | | | 331,201 | |
| | 30,000,000 | | | NJ Higher Education Student Assistance Authority (Student Loans)1 | | | 6.125 | | | | 06/01/2030 | | | | 33,244,500 | |
| | 475,000 | | | NJ Higher Education Student Assistance Authority (Student Loans)1 | | | 6.150 | | | | 06/01/2019 | | | | 476,401 | |
| | 570,000 | | | NJ Hsg. & Mtg. Finance Agency (Multifamily)1 | | | 5.000 | | | | 11/01/2036 | | | | 587,089 | |
| | 160,000 | | | NJ Hsg. & Mtg. Finance Agency (Multifamily)1 | | | 5.150 | | | | 11/01/2030 | | | | 160,155 | |
| | 40,000 | | | NJ Hsg. & Mtg. Finance Agency (Multifamily)1 | | | 5.400 | | | | 11/01/2017 | | | | 40,076 | |
| | 35,000 | | | NJ Hsg. & Mtg. Finance Agency (Multifamily)1 | | | 5.750 | | | | 11/01/2025 | | | | 35,069 | |
| | 10,000,000 | | | NJ Hsg. & Mtg. Finance Agency (Single Family Hsg.)6 | | | 4.550 | | | | 10/01/2022 | | | | 10,605,000 | |
| | 4,890,000 | | | NJ Hsg. & Mtg. Finance Agency (Single Family Hsg.)6 | | | 4.625 | | | | 10/01/2027 | | | | 5,087,947 | |
| | 4,495,000 | | | NJ Hsg. & Mtg. Finance Agency (Single Family Hsg.)6 | | | 5.000 | | | | 10/01/2037 | | | | 4,670,050 | |
| | | | |
| 26 | | | | OPPENHEIMER NEW JERSEY MUNICIPAL FUND |
| | | | | | | | | | | | | | | | |
Principal
Amount | | | | | Coupon | | | Maturity | | | Value | |
| | | | | | | | | | | | | | | | | |
| | New Jersey Continued | | | | | | | | | | | | |
| | $ 2,600,000 | | | NJ Hsg. & Mtg. Finance Agency (Single Family Hsg.)6 | | | 5.375 | % | | | 04/01/2030 | | | $ | 2,777,112 | |
| | 200,000 | | | NJ Hsg. & Mtg. Finance Agency, Series A1 | | | 5.050 | | | | 05/01/2034 | | | | 200,168 | |
| | 415,000 | | | NJ Hsg. & Mtg. Finance Agency, Series A1 | | | 5.550 | | | | 05/01/2027 | | | | 415,697 | |
| | 25,000 | | | NJ Hsg. & Mtg. Finance Agency, Series A1 | | | 5.650 | | | | 05/01/2040 | | | | 25,024 | |
| | 550,000 | | | NJ Hsg. & Mtg. Finance Agency, Series AA1 | | | 6.150 | | | | 10/01/2023 | | | | 641,124 | |
| | 215,000 | | | NJ Hsg. & Mtg. Finance Agency, Series AA1 | | | 6.375 | | | | 10/01/2028 | | | | 241,062 | |
| | 115,000 | | | NJ Hsg. & Mtg. Finance Agency, Series AA1 | | | 6.500 | | | | 10/01/2038 | | | | 122,972 | |
| | 390,000 | | | NJ Hsg. & Mtg. Finance Agency, Series B1 | | | 6.050 | | | | 11/01/2017 | | | | 397,176 | |
| | 10,000 | | | NJ Hsg. & Mtg. Finance Agency, Series B1 | | | 6.150 | | | | 11/01/2020 | | | | 10,027 | |
| | 100,000 | | | NJ South Jersey Port Corp.1 | | | 5.250 | | | | 01/01/2030 | | | | 101,847 | |
| | 375,000 | | | NJ South Jersey Transportation Authority1 | | | 5.000 | | | | 11/01/2029 | | | | 375,559 | |
| | 35,000 | | | NJ Sports & Expositions Authority1 | | | 5.000 | | | | 09/01/2015 | | | | 35,120 | |
| | 30,000 | | | NJ Sports & Expositions Authority1 | | | 5.000 | | | | 09/01/2016 | | | | 30,103 | |
| | 25,000 | | | NJ Sports & Expositions Authority1 | | | 5.000 | | | | 09/01/2017 | | | | 25,086 | |
| | 20,000 | | | NJ Sports & Expositions Authority1 | | | 5.000 | | | | 09/01/2019 | | | | 20,062 | |
| | 100,000 | | | NJ Sports & Expositions Authority | | | 5.125 | | | | 09/01/2014 | | | | 100,354 | |
| | 5,195,000 | | | NJ Tobacco Settlement Financing Corp.1 | | | 4.500 | | | | 06/01/2023 | | | | 4,958,524 | |
| | 27,100,000 | | | NJ Tobacco Settlement Financing Corp.1 | | | 4.625 | | | | 06/01/2026 | | | | 24,675,092 | |
| | 3,085,000 | | | NJ Tobacco Settlement Financing Corp.1 | | | 5.000 | | | | 06/01/2029 | | | | 2,834,190 | |
| | 200,950,000 | | | NJ Tobacco Settlement Financing Corp. | | | 5.812 | 4 | | | 06/01/2041 | | | | 12,872,857 | |
| | 20,000 | | | NJ Transit Corp. (Federal Transportation Administration Grants) | | | 5.250 | | | | 09/15/2014 | | | | 20,076 | |
| | 5,000,000 | | | NJ Transportation Trust Fund Authority1 | | | 5.250 | | | | 06/15/2036 | | | | 5,771,450 | |
| | 5,000,000 | | | NJ Transportation Trust Fund Authority1 | | | 5.500 | | | | 06/15/2041 | | | | 5,854,550 | |
| | 13,450,000 | | | NJ Transportation Trust Fund Authority1 | | | 6.000 | | | | 06/15/2035 | | | | 16,613,440 | |
| | 500,000 | | | NJ Turnpike Authority1 | | | 5.000 | | | | 01/01/2027 | | | | 517,430 | |
| | 4,035,000 | | | North Hudson, NJ Sewerage Authority1 | | | 5.000 | | | | 06/01/2030 | | | | 4,623,263 | |
| | 2,000,000 | | | North Hudson, NJ Sewerage Authority1 | | | 5.000 | | | | 06/01/2042 | | | | 2,245,020 | |
| | 10,000 | | | Passaic Valley, NJ Sewage Commissioners | | | 5.500 | | | | 12/01/2014 | | | | 10,033 | |
| | 10,500,000 | | | Port Authority NY/NJ, 143rd Series6 | | | 5.000 | | | | 10/01/2030 | | | | 11,496,870 | |
| | 2,140,000 | | | Port Authority NY/NJ (JFK International Air Terminal) | | | 5.750 | | | | 12/01/2022 | | | | 2,140,706 | |
| | 7,125,000 | | | Port Authority NY/NJ (JFK International Air Terminal) | | | 5.750 | | | | 12/01/2025 | | | | 7,126,639 | |
| | 2,050,000 | | | Port Authority NY/NJ (JFK International Air Terminal)1 | | | 6.000 | | | | 12/01/2036 | | | | 2,335,668 | |
| | 3,000,000 | | | Port Authority NY/NJ (JFK International Air Terminal)1 | | | 6.000 | | | | 12/01/2042 | | | | 3,406,680 | |
| | 5,000,000 | | | Port Authority NY/NJ (JFK International Air Terminal)1 | | | 6.500 | | | | 12/01/2028 | | | | 5,432,500 | |
| | 3,605,000 | | | Port Authority NY/NJ (KIAC) | | | 6.750 | | | | 10/01/2019 | | | | 3,605,072 | |
| | | | |
| 27 | | | | OPPENHEIMER NEW JERSEY MUNICIPAL FUND |
STATEMENT OF INVESTMENTS Continued
| | | | | | | | | | | | | | | | |
Principal
Amount | | | | | Coupon | | | Maturity | | | Value | |
| | | | | | | | | | | | | | | | | |
| | New Jersey Continued | | | | | | | | | | | | |
| | $ 245,000 | | | Salem County, NJ IPCFA (Atlantic City Electric Company)1 | | | 5.600 | % | | | 11/01/2025 | | | $ | 245,448 | |
| | 60,000 | | | Salem County, NJ IPCFA (Atlantic City Electric Company) | | | 5.600 | | | | 11/01/2025 | | | | 60,110 | |
| | 1,730,000 | | | Salem County, NJ IPCFA (Public Service Electric & Gas)1 | | | 5.750 | | | | 04/01/2031 | | | | 1,749,532 | |
| | 20,000 | | | Trenton, NJ Parking Authority | | | 5.250 | | | | 04/01/2014 | | |
| 20,065
|
|
| | | | | | | | | | | | | | | | 513,969,822 | |
| | U.S. Possessions—27.9% | | | | | | | | | | | | |
| | 2,645,000 | | | Guam GO1 | | | 5.125 | | | | 11/15/2027 | | | | 2,705,623 | |
| | 400,000 | | | Guam GO1 | | | 6.750 | | | | 11/15/2029 | | | | 450,128 | |
| | 600,000 | | | Guam GO1 | | | 7.000 | | | | 11/15/2039 | | | | 679,140 | |
| | 2,570,000 | | | Guam Government Business Privilege1 | | | 5.000 | | | | 01/01/2037 | | | | 2,841,084 | |
| | 1,300,000 | | | Guam Government Business Privilege1 | | | 5.250 | | | | 01/01/2036 | | | | 1,459,497 | |
| | 10,000 | | | Guam Hsg. Corp. (Single Family Mtg.) | | | 5.750 | | | | 09/01/2031 | | | | 12,466 | |
| | 50,000 | | | Guam Power Authority, Series A1 | | | 5.125 | | | | 10/01/2029 | | | | 50,003 | |
| | 10,000 | | | Guam Power Authority, Series A1 | | | 5.250 | | | | 10/01/2034 | | | | 10,002 | |
| | 600,000 | | | Guam Power Authority, Series A1 | | | 5.500 | | | | 10/01/2030 | | | | 635,124 | |
| | 285,000 | | | Northern Mariana Islands Commonwealth, Series A | | | 5.000 | | | | 06/01/2017 | | | | 273,241 | |
| | 4,285,000 | | | Northern Mariana Islands Commonwealth, Series A | | | 5.000 | | | | 06/01/2030 | | | | 3,652,063 | |
| | 200,000 | | | Northern Mariana Islands Commonwealth, Series A1 | | | 6.750 | | | | 10/01/2033 | | | | 200,212 | |
| | 1,110,000 | | | Northern Mariana Islands Ports Authority, Series A1 | | | 5.500 | | | | 03/15/2031 | | | | 996,547 | |
| | 2,685,000 | | | Northern Mariana Islands Ports Authority, Series A1 | | | 6.250 | | | | 03/15/2028 | | | | 2,031,283 | |
| | 10,000,000 | | | Puerto Rico Aqueduct & Sewer Authority6 | | | 5.125 | | | | 07/01/2047 | | | | 10,600,700 | |
| | 12,465,000 | | | Puerto Rico Aqueduct & Sewer Authority1 | | | 5.250 | | | | 07/01/2042 | | | | 12,779,243 | |
| | 5,000,000 | | | Puerto Rico Aqueduct & Sewer Authority1 | | | 5.750 | | | | 07/01/2037 | | | | 5,381,300 | |
| | 2,500,000 | | | Puerto Rico Aqueduct & Sewer Authority1 | | | 6.125 | | | | 07/01/2024 | | | | 2,951,350 | |
| | 8,635,000 | | | Puerto Rico Children’s Trust Fund (TASC)1 | | | 5.500 | | | | 05/15/2039 | | | | 8,634,568 | |
| | 4,720,000 | | | Puerto Rico Children’s Trust Fund (TASC)1 | | | 5.625 | | | | 05/15/2043 | | | | 4,719,717 | |
| | 26,000,000 | | | Puerto Rico Children’s Trust Fund (TASC) | | | 7.031 | 4 | | | 05/15/2055 | | | | 724,620 | |
| | 950,000 | | | Puerto Rico Commonwealth GO1 | | | 5.250 | | | | 07/01/2032 | | | | 991,259 | |
| | 3,300,000 | | | Puerto Rico Commonwealth GO1 | | | 5.375 | | | | 07/01/2030 | | | | 3,538,854 | �� |
| | 8,350,000 | | | Puerto Rico Commonwealth GO1 | | | 5.750 | | | | 07/01/2036 | | | | 8,972,827 | |
| | 3,205,000 | | | Puerto Rico Commonwealth GO1 | | | 5.750 | | | | 07/01/2041 | | | | 3,468,323 | |
| | 5,000,000 | | | Puerto Rico Commonwealth GO1 | | | 6.000 | | | | 07/01/2029 | | | | 5,531,750 | |
| | 1,300,000 | | | Puerto Rico Commonwealth GO1 | | | 6.500 | | | | 07/01/2037 | | | | 1,488,305 | |
| | 3,000,000 | | | Puerto Rico Electric Power Authority, Series AAA1 | | | 5.250 | | | | 07/01/2028 | | | | 3,251,160 | |
| | 5,000,000 | | | Puerto Rico Electric Power Authority, Series AAA1 | | | 5.250 | | | | 07/01/2030 | | | | 5,352,050 | |
| | 4,500,000 | | | Puerto Rico Electric Power Authority, Series ZZ1 | | | 5.250 | | | | 07/01/2026 | | | | 4,931,100 | |
| | | | |
| 28 | | | | OPPENHEIMER NEW JERSEY MUNICIPAL FUND |
| | | | | | | | | | | | | | | | |
Principal
Amount | | | | | Coupon | | | Maturity | | | Value | |
| | | | | | | | | | | | | | | | | |
| | U.S. Possessions Continued | | | | | | | | | | | | |
| | $ 750,000 | | | Puerto Rico Highway & Transportation Authority1 | | | 5.750 | % | | | 07/01/2020 | | | $ | 783,765 | |
| | 3,000,000 | | | Puerto Rico Highway & Transportation Authority, Series L1 | | | 5.250 | | | | 07/01/2038 | | | | 3,238,530 | |
| | 575,000 | | | Puerto Rico Infrastructure1 | | | 5.000 | | | | 07/01/2027 | | | | 602,537 | |
| | 4,750,000 | | | Puerto Rico Infrastructure1 | | | 5.000 | | | | 07/01/2037 | | | | 4,803,058 | |
| | 6,610,000 | | | Puerto Rico Infrastructure1 | | | 5.000 | | | | 07/01/2041 | | | | 6,676,629 | |
| | 2,000,000 | | | Puerto Rico Infrastructure1 | | | 5.000 | | | | 07/01/2046 | | | | 2,026,500 | |
| | 5,000,000 | | | Puerto Rico Infrastructure | | | 7.000 | 4 | | | 07/01/2032 | | | | 1,635,900 | |
| | 2,000,000 | | | Puerto Rico Infrastructure | | | 7.000 | 4 | | | 07/01/2033 | | | | 606,820 | |
| | 975,000 | | | Puerto Rico Infrastructure | | | 7.000 | 4 | | | 07/01/2035 | | | | 253,968 | |
| | 3,000,000 | | | Puerto Rico Infrastructure | | | 7.050 | 4 | | | 07/01/2042 | | | | 503,310 | |
| | 400,000 | | | Puerto Rico Infrastructure (Mepsi Campus) | | | 6.500 | | | | 10/01/2037 | | | | 420,488 | |
| | 100,000 | | | Puerto Rico ITEMECF (Ana G. Mendez University)1 | | | 5.000 | | | | 04/01/2027 | | | | 102,147 | |
| | 930,000 | | | Puerto Rico ITEMECF (Ana G. Mendez University)1 | | | 5.000 | | | | 03/01/2036 | | | | 928,679 | |
| | 100,000 | | | Puerto Rico ITEMECF (Ana G. Mendez University)1 | | | 5.125 | | | | 04/01/2032 | | | | 101,709 | |
| | 100,000 | | | Puerto Rico ITEMECF (Ana G. Mendez University)1 | | | 5.375 | | | | 04/01/2042 | | | | 101,841 | |
| | 1,710,000 | | | Puerto Rico ITEMECF (Cogeneration Facilities)1 | | | 6.625 | | | | 06/01/2026 | | | | 1,716,874 | |
| | 1,000,000 | | | Puerto Rico ITEMECF (Polytechnic University)1 | | | 5.000 | | | | 08/01/2032 | | | | 993,750 | |
| | 2,980,000 | | | Puerto Rico Port Authority (American Airlines), Series A2 | | | 6.300 | | | | 06/01/2023 | | | | 1,942,394 | |
| | 305,000 | | | Puerto Rico Public Buildings Authority1 | | | 5.250 | | | | 07/01/2033 | | | | 310,743 | |
| | 5,000,000 | | | Puerto Rico Public Buildings Authority1 | | | 5.250 | | | | 07/01/2042 | | | | 5,114,250 | |
| | 1,000,000 | | | Puerto Rico Public Buildings Authority1 | | | 5.625 | | | | 07/01/2039 | | | | 1,041,760 | |
| | 500,000 | | | Puerto Rico Public Buildings Authority1 | | | 6.750 | | | | 07/01/2036 | | | | 595,490 | |
| | 200,000 | | | Puerto Rico Public Buildings Authority1 | | | 7.000 | | | | 07/01/2025 | | | | 216,678 | |
| | 1,530,000 | | | Puerto Rico Public Buildings Authority, Series D1 | | | 5.250 | | | | 07/01/2036 | | | | 1,531,698 | |
| | 5,150,000 | | | Puerto Rico Public Finance Corp., Series B1 | | | 5.500 | | | | 08/01/2031 | | | | 5,641,413 | |
| | 11,500,000 | | | Puerto Rico Sales Tax Financing Corp., Series A6 | | | 5.250 | | | | 08/01/2057 | | | | 12,230,825 | |
| | 3,500,000 | | | Puerto Rico Sales Tax Financing Corp., Series A1 | | | 6.500 | | | | 08/01/2044 | | | | 4,184,075 | |
| | 5,235,000 | | | Puerto Rico Sales Tax Financing Corp., Series B1 | | | 6.000 | | | | 08/01/2026 | | | | 6,076,515 | |
| | 14,000,000 | | | Puerto Rico Sales Tax Financing Corp., Series C6 | | | 5.750 | | | | 08/01/2057 | | | | 15,617,700 | |
| | 150,000 | | | University of V.I., Series A | | | 5.250 | | | | 12/01/2023 | | | | 166,415 | |
| | 30,000 | | | V.I. HFA, Series A | | | 6.500 | % | | | 03/01/2025 | | | | 30,044 | |
| | 500,000 | | | V.I. Public Finance Authority (Matching Fund Loan Note)1 | | | 5.250 | | | | 10/01/2029 | | | | 543,695 | |
| | 1,385,000 | | | V.I. Public Finance Authority, Series A1 | | | 6.375 | | | | 10/01/2019 | | | | 1,389,667 | |
| | 1,100,000 | | | V.I. Tobacco Settlement Financing Corp. | | | 6.500 | 4 | | | 05/15/2035 | | | | 136,939 | |
| | 2,050,000 | | | V.I. Tobacco Settlement Financing Corp. | | | 6.875 | 4 | | | 05/15/2035 | | | | 239,071 | |
| | 3,100,000 | | | V.I. Tobacco Settlement Financing Corp. | | | 7.625 | 4 | | | 05/15/2035 | | |
| 291,028
|
|
| | | | | | | | | | | | | | |
| 182,110,444
|
|
| | Total Municipal Bonds and Notes (Cost $687,772,559) | | | | | | | | 696,080,266 | |
| | | | |
| 29 | | | | OPPENHEIMER NEW JERSEY MUNICIPAL FUND |
STATEMENT OF INVESTMENTS Continued
| | | | | | | | | | | | |
| Shares | | | | | | | | | Value | |
| | | | | | | | | | | | | |
| | Common Stocks—0.0% | | | | |
| | 444 | | | Converted Organics, Inc.7,8 (Cost $1,205,000) | | | | | | | $ 1 | |
| | Preferred Stocks—0.0% | | | | |
| | 3,795 | | | Converted Organics, Inc., Series A7,8 (Cost $3,795,000) | | | | | | | 2 | |
| | Total Investments, at Value (Cost $692,772,559)—106.7% | | | | | | | 696,080,269 | |
| | Liabilities in Excess of Other Assets—(6.7) | | | | | | | (43,942,358 | ) |
| | | | | | | | | | |
|
|
|
| | Net Assets—100.0% | | | | | | | $652,137,911 | |
| | | | | | | | | | |
|
|
|
Footnotes to Statement of Investments
1. All or a portion of the security position has been segregated for collateral to cover borrowings. See Note 6 of the accompanying Notes.
2. This security is not accruing income because the issuer has missed an interest payment on it and/or is not anticipated to make future interest and/or principal payments. The rate shown is the original contractual interest rate. See Note 1 of the accompanying Notes.
3. All or a portion of the security position is when-issued or delayed delivery to be delivered and settled after July 31, 2012. See Note 1 of the accompanying Notes.
4. Zero coupon bond reflects effective yield on the date of purchase.
5. This security is accruing partial income at an anticipated effective rate based on expected interest and/or principal payments. The rate shown is the original contractual interest rate.
6. Security represents the underlying municipal bond with respect to an inverse floating rate security held by the Fund. The bond was purchased by the Fund and subsequently transferred to a trust, which issued the related inverse floating rate security. See Note 1 of the accompanying Notes.
7. Received as a result of a corporate action.
8. Non-income producing security.
To simplify the listings of securities, abbreviations are used per the table below:
| | |
| AHS | | Adventist Health System |
| CMHS | | Clara Maass Health System |
| CMMC | | Clara Maass Medical Center |
| COP | | Certificates of Participation |
| DRIVERS | | Derivative Inverse Tax Exempt Receipts |
| EDA | | Economic Devel. Authority |
| GO | | General Obligation |
| | |
| HDC | | Housing Devel. Corp. |
| HFA | | Housing Finance Agency |
| HFC | | Housing Finance Corp. |
| IPCFA | | Industrial Pollution Control Financing Authority |
| ITEMECF | | Industrial, Tourist, Educational, Medical and Environmental Community Facilities |
| | | | |
| 30 | | | | OPPENHEIMER NEW JERSEY MUNICIPAL FUND |
| | |
| JFK | | John Fitzgerald Kennedy |
| KMH | | Kennedy Memorial Hospital |
| KSC | | Kennedy Surgical Center |
| MSU | | Montclair State University |
| NY/NJ | | New York/New Jersey |
| PA/NJ | | Pennsylvania/New Jersey |
| ROLS | | Residual Option Longs |
| RWJ | | Robert Wood Johnson |
| | |
| TASC | | Tobacco Settlement Asset-Backed Bonds |
| THGS | | The House of the Good Shepard |
| THGSF | | The House of the Good Shepard Foundation |
| UMC | | University Medical Center |
| V.I. | | United States Virgin Islands |
See accompanying Notes to Financial Statements.
| | | | |
| 31 | | | | OPPENHEIMER NEW JERSEY MUNICIPAL FUND |
STATEMENT OF ASSETS AND LIABILITIES July 31, 2012
| | | | |
| Assets | | | |
| Investments, at value (cost $692,772,559)—see accompanying statement of investments | | $ | 696,080,269 | |
| Cash | | | 618,423 | |
| Receivables and other assets: | | | | |
| Interest | | | 6,989,948 | |
| Shares of beneficial interest sold | | | 1,445,485 | |
| Investments sold | | | 110,000 | |
| Other | |
| 178,140
|
|
| Total assets | | | 705,422,265 | |
| Liabilities | | | |
| Payables and other liabilities: | | | | |
| Payable for short-term floating rate notes issued (See Note 1) | | | 39,115,000 | |
| Payable on borrowings (See Note 6) | | | 10,100,000 | |
| Investments purchased (including $2,000,000 purchased on a when-issued or delayed delivery basis) | | | 2,389,498 | |
| Shares of beneficial interest redeemed | | | 877,785 | |
| Dividends | | | 531,757 | |
| Trustees’ compensation | | | 89,239 | |
| Distribution and service plan fees | | | 76,302 | |
| Shareholder communications | | | 21,655 | |
| Transfer and shareholder servicing agent fees | | | 21,446 | |
| Interest expense on borrowings | | | 919 | |
| Other | |
| 60,753
|
|
| Total liabilities | | | 53,284,354 | |
| Net Assets | | $
| 652,137,911
|
|
| Composition of Net Assets | | | |
| Paid-in capital | | $ | 757,782,135 | |
| Accumulated net investment income | | | 6,178,774 | |
| Accumulated net realized loss on investments | | | (115,130,708 | ) |
| Net unrealized appreciation on investments | |
| 3,307,710
|
|
| Net Assets | | $
| 652,137,911
|
|
| | | | |
| 32 | | | | OPPENHEIMER NEW JERSEY MUNICIPAL FUND |
| | | | |
| Net Asset Value Per Share | | | |
| Class A Shares: | | | | |
| Net asset value and redemption price per share (based on net assets of $421,442,757 and 39,466,897 shares of beneficial interest outstanding) | | $ | 10.68 | |
| Maximum offering price per share (net asset value plus sales charge of 4.75% of offering price) | | $ | 11.21 | |
| Class B Shares: | | | | |
| Net asset value, redemption price (excludes applicable contingent deferred sales charge) and offering price per share (based on net assets of $18,879,294 and 1,764,544 shares of beneficial interest outstanding) | | $ | 10.70 | |
| Class C Shares: | | | | |
| Net asset value, redemption price (excludes applicable contingent deferred sales charge) and offering price per share (based on net assets of $187,933,676 and 17,582,079 shares of beneficial interest outstanding) | | $ | 10.69 | |
| Class Y Shares: | | | | |
| Net asset value, redemption price and offering price per share (based on net assets of $23,882,184 and 2,235,036 shares of beneficial interest outstanding) | | $ | 10.69 | |
See accompanying Notes to Financial Statements.
| | | | |
| 33 | | | | OPPENHEIMER NEW JERSEY MUNICIPAL FUND |
STATEMENT OF OPERATIONS For the Year Ended July 31, 2012
| | | | |
| Investment Income | | | |
| Interest | | $ | 36,837,759 | |
| Other income | |
| 478
|
|
| Total investment income | | | 36,838,237 | |
| Expenses | | | |
| Management fees | | | 3,159,570 | |
| Distribution and service plan fees: | | | | |
| Class A | | | 565,877 | |
| Class B | | | 183,096 | |
| Class C | | | 1,524,786 | |
| Transfer and shareholder servicing agent fees: | | | | |
| Class A | | | 156,494 | |
| Class B | | | 23,701 | |
| Class C | | | 82,551 | |
| Class Y | | | 9,462 | |
| Shareholder communications: | | | | |
| Class A | | | 23,311 | |
| Class B | | | 4,588 | |
| Class C | | | 11,993 | |
| Class Y | | | 833 | |
| Interest expense and fees on short-term floating rate notes issued (See Note 1) | | | 659,138 | |
| Borrowing fees | | | 448,791 | |
| Trustees’ compensation | | | 14,255 | |
| Interest expense on borrowings | | | 10,903 | |
| Custodian fees and expenses | | | 6,156 | |
| Administration service fees | | | 1,500 | |
| Other | |
| 162,380
|
|
| Total expenses | | | 7,049,385 | |
| Less waivers and reimbursements of expenses | |
| (88,701
| )
|
| Net expenses | | | 6,960,684 | |
| Net Investment Income | | | 29,877,553 | |
| Realized and Unrealized Gain (Loss) | | | |
| Net realized loss on investments | | | (4,615,163 | ) |
| Net change in unrealized appreciation/depreciation on investments | | | 62,024,129 | |
| Net Increase in Net Assets Resulting from Operations | | $
| 87,286,519
|
|
See accompanying Notes to Financial Statements.
| | | | |
| 34 | | | | OPPENHEIMER NEW JERSEY MUNICIPAL FUND |
STATEMENTS OF CHANGES IN NET ASSETS
| | | | | | | | |
| | | Year Ended
July 31,
2012 | | | Year Ended
July 29,
20111 | |
| Operations | | | | | | |
| Net investment income | | $ | 29,877,553 | | | $ | 36,550,570 | |
| Net realized loss | | | (4,615,163 | ) | | | (62,190,049 | ) |
| Net change in unrealized appreciation/depreciation | |
| 62,024,129
|
| |
| 34,075,111
|
|
| Net increase in net assets resulting from operations | | | 87,286,519 | | | | 8,435,632 | |
| Dividends and/or Distributions to Shareholders | | | | | | |
| Dividends from net investment income: | | | | | | | | |
| Class A | | | (22,875,836 | ) | | | (23,959,606 | ) |
| Class B | | | (1,036,785 | ) | | | (1,588,169 | ) |
| Class C | | | (8,738,229 | ) | | | (9,309,522 | ) |
| Class Y | |
| (900,990
| )
| |
| (192,121
| )
|
| | | | (33,551,840 | ) | | | (35,049,418 | ) |
| Beneficial Interest Transactions | | | | | | |
| Net increase (decrease) in net assets resulting from beneficial interest transactions: | | | | | | | | |
| Class A | | | 26,696,440 | | | | (38,131,096 | ) |
| Class B | | | (6,260,755 | ) | | | (10,487,694 | ) |
| Class C | | | 13,343,779 | | | | (16,651,537 | ) |
| Class Y | |
| 13,271,193
|
| |
| 8,735,930
|
|
| | | | 47,050,657 | | | | (56,534,397 | ) |
| Net Assets | | | | | | |
| Total increase (decrease) | | | 100,785,336 | | | | (83,148,183 | ) |
| Beginning of period | |
| 551,352,575
|
| |
| 634,500,758
|
|
End of period (including accumulated net investment income
of $6,178,774 and $10,303,237, respectively) | | $
| 652,137,911
|
| | $
| 551,352,575
|
|
1. July 29, 2011 represents the last business day of the Fund’s 2011 fiscal year. See Note 1 of the accompanying Notes.
See accompanying Notes to Financial Statements.
| | | | |
| 35 | | | | OPPENHEIMER NEW JERSEY MUNICIPAL FUND |
STATEMENT OF CASH FLOWS For the Year Ended July 31, 2012
| | | | |
| Cash Flows from Operating Activities | | | |
| Net increase in net assets from operations | | $ | 87,286,519 | |
| Adjustments to reconcile net increase in net assets from operations to net cash provided by operating activities: | | | | |
Purchase of investment securities | | | (132,240,539 | ) |
Proceeds from disposition of investment securities | | | 103,771,607 | |
Short-term investment securities, net | | | 27,611,080 | |
Premium amortization | | | 1,494,885 | |
Discount accretion | | | (4,361,653 | ) |
Net realized loss on investments | | | 4,615,163 | |
Net change in unrealized appreciation/depreciation on investments | | | (62,024,129 | ) |
| Change in assets: | | | | |
Decrease in interest receivable | | | 52,443 | |
Increase in other assets | | | (46,800 | ) |
Increase in receivable for securities sold | | | (110,000 | ) |
| Change in liabilities: | | | | |
Decrease in other liabilities | | | (16,577 | ) |
Decrease in payable for securities purchased | |
| (3,618,813
| )
|
| Net cash provided by operating activities | | | 22,413,186 | |
| Cash Flows from Financing Activities | | | |
| Proceeds from borrowings | | | 140,200,000 | |
| Payments on borrowings | | | (137,300,000 | ) |
| Payments on short-term floating rate notes issued | | | (38,180,000 | ) |
| Proceeds from shares sold | | | 127,067,199 | |
| Payments on shares redeemed | | | (106,317,538 | ) |
| Cash distributions paid | |
| (7,822,434
| )
|
| Net cash used in financing activities | | | (22,352,773 | ) |
| Net increase in cash | | | 60,413 | |
| Cash, beginning balance | | | 558,010 | |
| Cash, ending balance | | $
| 618,423
|
|
| Supplemental disclosure of cash flow information: | | | | |
| Noncash financing activities not included herein consist of reinvestment of dividends and distributions of $25,701,110. | | | | |
| Cash paid for interest on borrowings—$10,829. | | | | |
| Cash paid for interest on short-term floating rate notes issued—$659,138. | | | | |
See accompanying Notes to Financial Statements.
| | | | |
| 36 | | | | OPPENHEIMER NEW JERSEY MUNICIPAL FUND |
FINANCIAL HIGHLIGHTS
| | | | | | | | | | | | | | | | | | | | |
| Class A | | Year Ended
July 31,
2012 | | | Year Ended
July 29,
20111 | | | Year Ended
July 30,
20101 | | | Year Ended July 31, | |
| | | | | 2009 | | | 2008 | |
| | | | | | | | | | | | | | | | | | | | | |
| Per Share Operating Data | | | | | | | | | | | | | | | |
| Net asset value, beginning of period | | $ | 9.75 | | | $ | 10.14 | | | $ | 8.63 | | | $ | 10.00 | | | $ | 11.98 | |
| Income (loss) from investment operations: | | | | | | | | | | | | | | | | | | | | |
| Net investment income2 | | | .54 | | | | .64 | | | | .64 | | | | .61 | | | | .57 | |
| Net realized and unrealized gain (loss) | |
| 1.00
|
| |
| (.41
| )
| |
| 1.45
|
| |
| (1.42
| )
| |
| (2.01
| )
|
| Total from investment operations | | | 1.54 | | | | .23 | | | | 2.09 | | | | (.81 | ) | | | (1.44 | ) |
| Dividends and/or distributions to shareholders: | | | | | | | | | | | | | | | | | | | | |
| Dividends from net investment income | | | (.61 | ) | | | (.62 | ) | | | (.58 | ) | | | (.56 | ) | | | (.54 | ) |
| Net asset value, end of period | | $
| 10.68
|
| | $
| 9.75
|
| | $
| 10.14
|
| | $
| 8.63
|
| | $
| 10.00
|
|
| Total Return, at Net Asset Value3 | | | 16.21 | % | | | 2.46 | % | | | 24.58 | % | | | (7.63 | )% | | | (12.20 | )% |
| | | | | | | | | | | | | | | | | | | | | |
| Ratios/Supplemental Data | | | | | | | | | | | | | | | |
| Net assets, end of period (in thousands) | | | $421,443 | | | | $359,697 | | | | $415,729 | | | | $361,113 | | | | $467,974 | |
| Average net assets (in thousands) | | | $385,776 | | | | $377,127 | | | | $409,744 | | | | $352,897 | | | | $526,573 | |
| Ratios to average net assets:4 | | | | | | | | | | | | | | | | | | | | |
| Net investment income | | | 5.31 | % | | | 6.62 | % | | | 6.54 | % | | | 7.40 | % | | | 5.20 | % |
| Expenses excluding interest and fees on short-term floating rate notes issued and interest and fees from borrowings | | | 0.76 | % | | | 0.77 | % | | | 0.75 | % | | | 0.76 | % | | | 0.73 | % |
| Interest and fees from borrowings | | | 0.08 | % | | | 0.10 | % | | | 0.25 | % | | | 0.91 | % | | | 0.11 | % |
| Interest and fees on short-term floating rate notes issued5 | |
| 0.11
| %
| |
| 0.19
| %
| |
| 0.24
| %
| |
| 0.51
| %
| |
| 0.70
| %
|
| Total expenses | | | 0.95 | % | | | 1.06 | % | | | 1.24 | % | | | 2.18 | % | | | 1.54 | % |
| Expenses after payments, waivers and/or reimbursements and reduction to custodian expenses | | | 0.93 | % | | | 1.05 | % | | | 1.23 | % | | | 2.18 | % | | | 1.54 | % |
| Portfolio turnover rate | | | 18 | % | | | 15 | % | | | 17 | % | | | 14 | % | | | 31 | % |
1. July 29, 2011 and July 30, 2010 represent the last business days of the Fund’s respective reporting periods. See Note 1 of the accompanying Notes.
2. Per share amounts calculated based on the average shares outstanding during the period.
3. Assumes an initial investment on the business day before the first day of the fiscal period, with all dividends and distributions reinvested in additional shares on the reinvestment date, and redemption at the net asset value calculated on the last business day of the fiscal period. Sales charges are not reflected in the total returns. Total returns are not annualized for periods less than one full year. Returns do not reflect the deduction of taxes that a shareholder would pay on fund distributions or the redemption of fund shares.
4. Annualized for periods less than one full year.
5. Interest and fee expense relates to the Fund’s liability for short-term floating rate notes issued in conjunction with inverse floating rate security transactions.
See accompanying Notes to Financial Statements.
| | | | |
| 37 | | | | OPPENHEIMER NEW JERSEY MUNICIPAL FUND |
FINANCIAL HIGHLIGHTS Continued
| | | | | | | | | | | | | | | | | | | | |
| | | Year Ended
July 31, | | | Year Ended
July 29, | | | Year Ended
July 30, | | | Year Ended July 31, | |
| Class B | | 2012 | | | 20111 | | | 20101 | | | 2009 | | | 2008 | |
| | | | | | | | | | | | | | | | | | | | | |
| Per Share Operating Data | | | | | | | | | | | | | | | |
| Net asset value, beginning of period | | $ | 9.77 | | | $ | 10.15 | | | $ | 8.65 | | | $ | 10.02 | | | $ | 11.99 | |
| Income (loss) from investment operations: | | | | | | | | | | | | | | | | | | | | |
| Net investment income2 | | | .46 | | | | .56 | | | | .56 | | | | .54 | | | | .48 | |
| Net realized and unrealized gain (loss) | |
| .99
|
| |
| (.40
| )
| |
| 1.44
|
| |
| (1.43
| )
| |
| (1.99
| )
|
| Total from investment operations | | | 1.45 | | | | .16 | | | | 2.00 | | | | (.89 | ) | | | (1.51 | ) |
| Dividends and/or distributions to shareholders: | | | | | | | | | | | | | | | | | | | | |
| Dividends from net investment income | | | (.52 | ) | | | (.54 | ) | | | (.50 | ) | | | (.48 | ) | | | (.46 | ) |
| Net asset value, end of period | | $
| 10.70
|
| | $
| 9.77
|
| | $
| 10.15
|
| | $
| 8.65
|
| | $
| 10.02
|
|
| Total Return, at Net Asset Value3 | | | 15.20 | % | | | 1.71 | % | | | 23.39 | % | | | (8.39 | )% | | | (12.81 | )% |
| | | | | | | | | | | | | | | | | | | | | |
| Ratios/Supplemental Data | | | | | | | | | | | | | | | |
| Net assets, end of period (in thousands) | | | $18,879 | | | | $23,305 | | | | $35,276 | | | | $37,076 | | | | $52,981 | |
| Average net assets (in thousands) | | | $20,307 | | | | $28,889 | | | | $37,923 | | | | $39,035 | | | | $61,772 | |
| Ratios to average net assets:4 | | | | | | | | | | | | | | | | | | | | |
| Net investment income | | | 4.50 | % | | | 5.78 | % | | | 5.71 | % | | | 6.56 | % | | | 4.39 | % |
| Expenses excluding interest and fees on short-term floating rate notes issued and interest and fees from borrowings | | | 1.61 | % | | | 1.61 | % | | | 1.59 | % | | | 1.61 | % | | | 1.53 | % |
| Interest and fees from borrowings | | | 0.08 | % | | | 0.10 | % | | | 0.25 | % | | | 0.91 | % | | | 0.11 | % |
| Interest and fees on short-term floating rate notes issued5 | |
| 0.11
| %
| |
| 0.19
| %
| |
| 0.24
| %
| |
| 0.51
| %
| |
| 0.70
| %
|
| Total expenses | | | 1.80 | % | | | 1.90 | % | | | 2.08 | % | | | 3.03 | % | | | 2.34 | % |
| Expenses after payments, waivers and/or reimbursements and reduction to custodian expenses | | | 1.78 | % | | | 1.89 | %�� | | | 2.07 | % | | | 3.03 | % | | | 2.34 | % |
| Portfolio turnover rate | | | 18 | % | | | 15 | % | | | 17 | % | | | 14 | % | | | 31 | % |
1. July 29, 2011 and July 30, 2010 represent the last business days of the Fund’s respective reporting periods. See Note 1 of the accompanying Notes.
2. Per share amounts calculated based on the average shares outstanding during the period.
3. Assumes an initial investment on the business day before the first day of the fiscal period, with all dividends and distributions reinvested in additional shares on the reinvestment date, and redemption at the net asset value calculated on the last business day of the fiscal period. Sales charges are not reflected in the total returns. Total returns are not annualized for periods less than one full year. Returns do not reflect the deduction of taxes that a shareholder would pay on fund distributions or the redemption of fund shares.
4. Annualized for periods less than one full year.
5. Interest and fee expense relates to the Fund’s liability for short-term floating rate notes issued in conjunction with inverse floating rate security transactions.
See accompanying Notes to Financial Statements.
| | | | |
| 38 | | | | OPPENHEIMER NEW JERSEY MUNICIPAL FUND |
| | | | | | | | | | | | | | | | | | | | |
| | | Year Ended
July 31, | | | Year Ended
July 29, | | | Year Ended
July 30, | | | Year Ended July 31, | |
| Class C | | 2012 | | | 20111 | | | 20101 | | | 2009 | | | 2008 | |
| | | | | | | | | | | | | | | | | | | | | |
| Per Share Operating Data | | | | | | | | | | | | | | | |
| Net asset value, beginning of period | | $ | 9.76 | | | $ | 10.14 | | | $ | 8.64 | | | $ | 10.01 | | | $ | 11.99 | |
| Income (loss) from investment operations: | | | | | | | | | | | | | | | | | | | | |
| Net investment income2 | | | .46 | | | | .57 | | | | .57 | | | | .55 | | | | .48 | |
| Net realized and unrealized gain (loss) | |
| 1.00
|
| |
| (.41
| )
| |
| 1.43
|
| |
| (1.43
| )
| |
| (2.00
| )
|
| Total from investment operations | | | 1.46 | | | | .16 | | | | 2.00 | | | | (.88 | ) | | | (1.52 | ) |
| Dividends and/or distributions to shareholders: | | | | | | | | | | | | | | | | | | | | |
| Dividends from net investment income | | | (.53 | ) | | | (.54 | ) | | | (.50 | ) | | | (.49 | ) | | | (.46 | ) |
| Net asset value, end of period | | $
| 10.69
|
| | $
| 9.76
|
| | $
| 10.14
|
| | $
| 8.64
|
| | $
| 10.01
|
|
| Total Return, at Net Asset Value3 | | | 15.32 | % | | | 1.79 | % | | | 23.50 | % | | | (8.35 | )% | | | (12.87 | )% |
| | | | | | | | | | | | | | | | | | | | | |
| Ratios/Supplemental Data | | | | | | | | | | | | | | | |
| Net assets, end of period (in thousands) | | | $187,934 | | | | $159,119 | | | | $183,496 | | | | $153,583 | | | | $182,780 | |
| Average net assets (in thousands) | | | $169,315 | | | | $166,762 | | | | $177,507 | | | | $144,708 | | | | $202,047 | |
| Ratios to average net assets:4 | | | | | | | | | | | | | | | | | | | | |
| Net investment income | | | 4.55 | % | | | 5.85 | % | | | 5.77 | % | | | 6.63 | % | | | 4.43 | % |
| Expenses excluding interest and fees on short-term floating rate notes issued and interest and fees from borrowings | | | 1.52 | % | | | 1.54 | % | | | 1.51 | % | | | 1.55 | % | | | 1.50 | % |
| Interest and fees from borrowings | | | 0.08 | % | | | 0.10 | % | | | 0.25 | % | | | 0.91 | % | | | 0.11 | % |
| Interest and fees on short-term floating rate notes issued5 | |
| 0.11
| %
| |
| 0.19
| %
| |
| 0.24
| %
| |
| 0.51
| %
| |
| 0.70
| %
|
| Total expenses | | | 1.71 | % | | | 1.83 | % | | | 2.00 | % | | | 2.97 | % | | | 2.31 | % |
| Expenses after payments, waivers and/or reimbursements and reduction to custodian expenses | | | 1.69 | % | | | 1.82 | % | | | 1.99 | % | | | 2.97 | % | | | 2.31 | % |
| Portfolio turnover rate | | | 18 | % | | | 15 | % | | | 17 | % | | | 14 | % | | | 31 | % |
1. July 29, 2011 and July 30, 2010 represent the last business days of the Fund’s respective reporting periods. See Note 1 of the accompanying Notes.
2. Per share amounts calculated based on the average shares outstanding during the period.
3. Assumes an initial investment on the business day before the first day of the fiscal period, with all dividends and distributions reinvested in additional shares on the reinvestment date, and redemption at the net asset value calculated on the last business day of the fiscal period. Sales charges are not reflected in the total returns. Total returns are not annualized for periods less than one full year. Returns do not reflect the deduction of taxes that a shareholder would pay on fund distributions or the redemption of fund shares.
4. Annualized for periods less than one full year.
5. Interest and fee expense relates to the Fund’s liability for short-term floating rate notes issued in conjunction with inverse floating rate security transactions.
See accompanying Notes to Financial Statements.
| | | | |
| 39 | | | | OPPENHEIMER NEW JERSEY MUNICIPAL FUND |
FINANCIAL HIGHLIGHTS Continued
| | | | | | | | |
| Class Y | | Year Ended
July 31,
2012 | | | Period Ended
July 29,
20111 | |
| | | | | | | | | |
| Per Share Operating Data | | | | | | |
| Net asset value, beginning of period | | $ | 9.76 | | | $ | 9.86 | |
| Income (loss) from investment operations: | | | | | | | | |
| Net investment income2 | | | .55 | | | | .41 | |
| Net realized and unrealized gain (loss) | |
| 1.00
|
| |
| (.10
| )
|
| Total from investment operations | | | 1.55 | | | | .31 | |
| Dividends and/or distributions to shareholders: | | | | | | | | |
| Dividends from net investment income | | | (.62 | ) | | | (.41 | ) |
| Net asset value, end of period | | $
| 10.69
|
| | $
| 9.76
|
|
| Total Return, at Net Asset Value3 | | | 16.34 | % | | | 3.48 | % |
| | | | | | | | | |
| Ratios/Supplemental Data | | | | | | |
| Net assets, end of period (in thousands) | | | $23,882 | | | | $9,232 | |
| Average net assets (in thousands) | | | $15,130 | | | | $4,339 | |
| Ratios to average net assets:4 | | | | | | | | |
| Net investment income | | | 5.33 | % | | | 6.48 | % |
| Expenses excluding interest and fees on short-term floating rate notes issued and interest and fees from borrowings | | | 0.63 | % | | | 0.62 | % |
| Interest and fees from borrowings | | | 0.08 | % | | | 0.10 | % |
| Interest and fees on short-term floating rate notes issued5 | |
| 0.11
| %
| |
| 0.19
| %
|
| Total expenses | | | 0.82 | % | | | 0.91 | % |
| Expenses after payments, waivers and/or reimbursements and reduction to custodian expenses | | | 0.80 | % | | | 0.90 | % |
| Portfolio turnover rate | | | 18 | % | | | 15 | % |
1. For the period from November 29, 2010 (inception of offering) to July 29, 2011, which represents the last business day of the Fund’s 2011 fiscal year. See Note 1 of the accompanying Notes.
2. Per share amounts calculated based on the average shares outstanding during the period.
3. Assumes an initial investment on the business day before the first day of the fiscal period, with all dividends and distributions reinvested in additional shares on the reinvestment date, and redemption at the net asset value calculated on the last business day of the fiscal period. Sales charges are not reflected in the total returns. Total returns are not annualized for periods less than one full year. Returns do not reflect the deduction of taxes that a shareholder would pay on fund distributions or the redemption of fund shares.
4. Annualized for periods less than one full year.
5. Interest and fee expense relates to the Fund’s liability for short-term floating rate notes issued in conjunction with inverse floating rate security transactions.
See accompanying Notes to Financial Statements.
| | | | |
| 40 | | | | OPPENHEIMER NEW JERSEY MUNICIPAL FUND |
NOTES TO FINANCIAL STATEMENTS July 31, 2012
1. Significant Accounting Policies
Oppenheimer New Jersey Municipal Fund (the “Fund”) is a separate series of Oppenheimer Multi-State Municipal Trust, a non-diversified, open-end management investment company registered under the Investment Company Act of 1940, as amended. The Fund’s investment objective is to seek as high a level of current interest income exempt from federal and New Jersey income taxes for individual investors as is consistent with preservation of capital. The Fund’s investment adviser is OppenheimerFunds, Inc. (the “Manager”).
The Fund offers Class A, Class C and Class Y shares, and previously offered Class B shares for new purchase through June 29, 2012. Subsequent to that date, no new purchases of Class B shares will be permitted, however reinvestment of dividend and/or capital gain distributions and exchanges of Class B shares into and from other Oppenheimer funds will be allowed. Class A shares are sold at their offering price, which is normally net asset value plus a front-end sales charge. Class C shares are sold, and Class B shares were sold, without a front-end sales charge but may be subject to a contingent deferred sales charge (“CDSC”). Class Y shares are sold to certain institutional investors or intermediaries without either a front-end sales charge or a CDSC, however, the intermediaries may impose charges on their accountholders who beneficially own Class Y shares. All classes of shares have identical rights and voting privileges with respect to the Fund in general and exclusive voting rights on matters that affect that class alone. Earnings, net assets and net asset value per share may differ due to each class having its own expenses, such as transfer and shareholder servicing agent fees and shareholder communications, directly attributable to that class. Class A, B and C shares have separate distribution and/or service plans under which they pay fees. Class Y shares do not pay such fees. Class B shares will automatically convert to Class A shares 72 months after the date of purchase.
The following is a summary of significant accounting policies consistently followed by the Fund.
Previous Annual Periods. The last day of certain of the Fund’s prior fiscal years was the last day the New York Stock Exchange was open for trading. The Fund’s financial statements have been presented through that date to maintain consistency with the Fund’s net asset value calculations used for shareholder transactions.
Inverse Floating Rate Securities. The Fund invests in inverse floating rate securities that pay interest at a rate that varies inversely with short-term interest rates. Because inverse floating rate securities are leveraged instruments, the value of an inverse floating rate security will change more significantly in response to changes in interest rates and other market fluctuations than the market value of a conventional fixed-rate municipal security of similar maturity and credit quality, including the municipal bond underlying an inverse floating rate security.
An inverse floating rate security is created as part of a financial transaction referred to as a “tender option bond” transaction. In most cases, in a tender option bond transaction the Fund sells a fixed-rate municipal bond (the “underlying municipal bond”) to a broker dealer (the “sponsor”). The sponsor creates a trust (the “Trust”) into which it deposits the
| | | | |
| 41 | | | | OPPENHEIMER NEW JERSEY MUNICIPAL FUND |
NOTES TO FINANCIAL STATEMENTS Continued
1. Significant Accounting Policies Continued
underlying municipal bond. The Trust then issues and sells short-term floating rate securities with a fixed principal amount representing a senior interest in the underlying municipal bond to third parties and a residual, subordinate interest in the underlying municipal bond (referred to as an “inverse floating rate security”) to the Fund. The interest rate on the short-term floating rate securities resets periodically, usually weekly, to a prevailing market rate and holders of these securities are granted the option to tender their securities back to the Trust for repurchase at their principal amount plus accrued interest thereon (the “purchase price”) periodically, usually daily or weekly. A remarketing agent for the Trust is required to attempt to re-sell any tendered short-term floating rate securities to new investors for the purchase price. If the remarketing agent is unable to successfully re-sell the tendered short-term floating rate securities, a liquidity provider to the Trust (typically an affiliate of the sponsor) must contribute cash to the Trust to ensure that the tendering holders receive the purchase price of their securities on the repurchase date.
Because holders of the short-term floating rate securities are granted the right to tender their securities to the Trust for repurchase at frequent intervals for the purchase price, with such payment effectively guaranteed by the liquidity provider, the securities generally bear short-term rates of interest commensurate with money market instruments. When interest is paid on the underlying municipal bond to the Trust, such proceeds are first used to pay the Trust’s administrative expenses and accrued interest to holders of the short-term floating rate securities, with any remaining amounts being paid to the Fund, as the holder of the inverse floating rate security. Accordingly, the amount of such interest on the underlying municipal bond paid to the Fund is inversely related the rate of interest on the short-term floating rate securities. Additionally, because the principal amount of the short-term floating rate securities is fixed and is not adjusted in response to changes in the market value of the underlying municipal bond, any change in the market value of the underlying municipal bond is reflected entirely in a change to the value of the inverse floating rate security.
Typically, the terms of an inverse floating rate security grant certain rights to the Fund, as holder. For example, the Fund may have the right upon request to require that the Trust compel a tender of the short-term floating rate securities to facilitate the Fund’s acquisition of the underlying municipal bond. Following such a request, the Fund pays the Trust the purchase price of the short-term floating rate securities and a specified portion of any market value gain on the underlying municipal bond since its deposit into the Trust, which the Trust uses to redeem the short-term floating rate securities. The Trust then distributes the underlying municipal bond to the Fund. Similarly, the Fund may have the right to directly purchase the underlying municipal bond from the Trust by paying to the Trust the purchase price of the short-term floating rate securities and a specified portion of any market value gain on the underlying municipal bond since its deposit into the Trust, which the Trust uses to redeem the short-term floating rate securities. Through the exercise of either of these rights, the Fund can voluntarily terminate or “collapse” the Trust, terminate its investment in the related inverse floating rate security and obtain the
| | | | |
| 42 | | | | OPPENHEIMER NEW JERSEY MUNICIPAL FUND |
underlying municipal bond. Additionally, the Fund also typically has the right to exchange with the Trust (i) a principal amount of short-term floating rate securities held by the Fund for a corresponding additional principal amount of the inverse floating rate security or (ii) a principal amount of the inverse floating rate security held by the Fund for a corresponding additional principal amount of short-term floating rate securities (which are typically then sold to other investors). Through the exercise of this right, the Fund may increase (or decrease) the principal amount of short-term floating rate securities outstanding, thereby increasing (or decreasing) the amount of leverage provided by the short-term floating rate securities to the Fund’s investment exposure to the underlying municipal bond.
The Fund’s investments in inverse floating rate securities involve certain risks. As short-term interest rates rise, an inverse floating rate security produces less current income (and, in extreme cases, may pay no income) and as short-term interest rates fall, an inverse floating rate security produces more current income. Thus, if short-term interest rates rise after the issuance of the inverse floating rate security, any yield advantage is reduced or eliminated. All inverse floating rate securities entail some degree of leverage represented by the outstanding principal amount of the related short-term floating rate securities. The value of, and income earned on, an inverse floating rate security that has a higher degree of leverage will fluctuate more significantly in response to changes in interest rates and to changes in the market value of the related underlying municipal bond than that of an inverse floating rate security with a lower degree of leverage, and is more likely to be eliminated entirely under adverse market conditions. Changes in the value of an inverse floating rate security will also be more significant than changes in the market value of the related underlying municipal bond because the leverage provided by the related short-term floating rate securities increases the sensitivity of an inverse floating rate security to changes in interest rates and to the market value of the underlying municipal bond. An inverse floating rate security can be expected to underperform fixed-rate municipal bonds when the difference between long-term and short-term interest rates is decreasing (or is already small) or when long-term interest rates are rising, but can be expected to outperform fixed-rate municipal bonds when the difference between long-term and short-term interest rates is increasing (or is already large) or when long-term interest rates are falling. Additionally, a tender option bond transaction typically provides for the automatic termination or “collapse” of a Trust upon the occurrence of certain adverse events, usually referred to as “mandatory tender events” or “tender option termination events.” These events may include, among others, a credit ratings downgrade of the underlying municipal bond below a specified level, a decrease in the market value of the underlying municipal bond below a specified amount, a bankruptcy of the liquidity provider or the inability of the remarketing agent to re-sell to new investors short-term floating rate securities that have been tendered for repurchase by holders thereof. Following the occurrence of such an event, the underlying municipal bond is generally sold for current market value and the proceeds distributed to holders of the short-term floating rate securities and inverse floating rate security, with the holder of the inverse floating rate security (the Fund)
| | | | |
| 43 | | | | OPPENHEIMER NEW JERSEY MUNICIPAL FUND |
NOTES TO FINANCIAL STATEMENTS Continued
1. Significant Accounting Policies Continued
generally receiving the proceeds of such sale only after the holders of the short-term floating rate securities have received proceeds equal to the purchase price of their securities (and the liquidity provider is generally required to contribute cash to the Trust only in an amount sufficient to ensure that the holders of the short-term floating rate securities receive the purchase price of their securities in connection with such termination of the Trust). Following the occurrence of such events, the Fund could potentially lose the entire amount of its investment in the inverse floating rate security.
Finally, the Fund may enter into shortfall/reimbursement agreements with the liquidity provider of certain tender option bond transactions in connection with certain inverse floating rate securities held by the Fund. These agreements commit the Fund to reimburse the liquidity provider to the extent that the liquidity provider must provide cash to a Trust, including following the termination of a Trust resulting from the occurrence of a “mandatory tender event.” In connection with the occurrence of such an event and the termination of the Trust triggered thereby, the shortfall/reimbursement agreement will make the Fund liable for the amount of the negative difference, if any, between the liquidation value of the underlying municipal bond and the purchase price of the short-term floating rate securities issued by the Trust. Under the standard terms of a tender option bond transaction, absent such a shortfall/reimbursement agreement, the Fund, as holder of the inverse floating rate security, would not be required to make such a reimbursement payment to the liquidity provider. The Manager monitors the Fund’s potential exposure with respect to these agreements on a daily basis and intends to take action to terminate the Fund’s investment in related inverse floating rate securities, if it deems it appropriate to do so. As of July 31, 2012, the Fund’s maximum exposure under such agreements is estimated at $20,250,000.
When the Fund creates an inverse floating rate security in a tender option bond transaction by selling an underlying municipal bond to a sponsor for deposit into a Trust, the transaction is considered a secured borrowing for financial reporting purposes. As a result of such accounting treatment, the Fund includes the underlying municipal bond on its Statement of Investments and as an asset on its Statement of Assets and Liabilities (but does not separately include the related inverse floating rate security on either). The Fund also includes a liability on its Statement of Assets and Liabilities equal to the outstanding principal amount and accrued interest on the related short-term floating rate securities issued by the Trust. Interest on the underlying municipal bond is recorded as investment income on the Fund’s Statement of Operations, while interest payable on the related short-term floating rate securities is recorded as interest expense. At July 31, 2012, municipal bond holdings with a value of $73,086,204 shown on the Fund’s Statement of Investments are held by such Trusts and serve as the underlying municipal bonds for the related $39,115,000 in short-term floating rate securities issued and outstanding at that date.
| | | | |
| 44 | | | | OPPENHEIMER NEW JERSEY MUNICIPAL FUND |
At July 31, 2012, the inverse floating rate securities associated with tender option bond transactions accounted for as secured borrowings were as follows:
| | | | | | | | | | | | | | |
Principal
Amount | | Inverse Floater1 | | Coupon
Rate2 | | | Maturity
Date | | | Value | |
| $2,445,000 | | NJ Hsg. & Mtg. Finance Agency (Single Family Hsg.) DRIVERS | | | 7.109 | % | | | 10/1/27 | | | $ | 2,642,947 | |
| 1,300,000 | | NJ Hsg. & Mtg. Finance Agency (Single Family Hsg.) DRIVERS | | | 8.412 | | | | 4/1/30 | | | | 1,477,112 | |
| 2,250,000 | | NJ Hsg. & Mtg. Finance Agency (Single Family Hsg.) DRIVERS | | | 7.753 | | | | 10/1/37 | | | | 2,425,050 | |
| 2,500,000 | | NJ Hsg. & Mtg. Finance Agency ROLs3 | | | 15.668 | | | | 10/1/22 | | | | 3,105,000 | |
| 2,625,000 | | Port Authority NY/NJ, 3205th Series | | | 14.711 | | | | 10/1/30 | | | | 3,621,870 | |
| 5,000,000 | | Puerto Rico Aqueduct & Sewer Authority ROLs | | | 7.912 | | | | 7/1/47 | | | | 5,600,700 | |
| 5,750,000 | | Puerto Rico Sales Tax Financing Corp. ROLs3 | | | 8.360 | | | | 8/1/57 | | | | 6,480,825 | |
| 7,000,000 | | Puerto Rico Sales Tax Financing Corp. ROLs3 | | | 8.953 | | | | 8/1/57 | | | | 8,617,700 | |
| | | | | | | | | | | | |
|
|
|
| | | | | | | | | | | | | $ | 33,971,204 | |
| | | | | | | | | | | | |
|
|
|
1. For a list of abbreviations used in the Inverse Floater table see the Portfolio Abbreviations table at the end of the Statement of Investments.
2. Represents the current interest rate for the inverse floating rate security.
3. Represents an inverse floating rate security that is subject to a shortfall/reimbursement agreement.
The Fund may also purchase an inverse floating rate security created as part of a tender option bond transaction not initiated by the Fund when a third party, such as a municipal issuer or financial institution, transfers an underlying municipal bond to a Trust. For financial reporting purposes, the Fund includes the inverse floating rate security related to such transaction on its Statement of Investments and as an asset on its Statement of Assets and Liabilities, and interest on the security is recorded as investment income on the Fund’s Statement of Operations.
The Fund may invest in inverse floating rate securities with any degree of leverage (as measured by the outstanding principal amount of related short-term floating rate securities). However, the Fund may only expose up to 20% of its total assets to the effects of leverage from its investments in inverse floating rate securities. This limitation is measured by comparing the aggregate principal amount of the short-term floating rate securities that are related to the inverse floating rate securities held by the Fund to the total assets of the Fund. The Fund’s exposure to the effects of leverage from its investments in inverse floating rate securities amounts to $39,115,000 or 5.54% of its total assets as of July 31, 2012.
Securities on a When-Issued or Delayed Delivery Basis. The Fund may purchase securities on a “when-issued” basis, and may purchase or sell securities on a “delayed delivery” basis. “When-issued” or “delayed delivery” refers to securities whose terms and indenture are available and for which a market exists, but which are not available for immediate delivery. Delivery and payment for securities that have been purchased by the Fund on a when-issued basis normally takes place within six months and possibly as long as two years or more after the trade date. During this period, such securities do not earn interest, are subject to market fluctuation and may increase or decrease in value prior to
| | | | |
| 45 | | | | OPPENHEIMER NEW JERSEY MUNICIPAL FUND |
NOTES TO FINANCIAL STATEMENTS Continued
1. Significant Accounting Policies Continued
their delivery. The purchase of securities on a when-issued basis may increase the volatility of the Fund’s net asset value to the extent the Fund executes such transactions while remaining substantially fully invested. When the Fund engages in when-issued or delayed delivery transactions, it relies on the buyer or seller, as the case may be, to complete the transaction. Their failure to do so may cause the Fund to lose the opportunity to obtain or dispose of the security at a price and yield it considers advantageous. The Fund may also sell securities that it purchased on a when-issued basis or forward commitment prior to settlement of the original purchase.
As of July 31, 2012, the Fund had purchased securities issued on a when-issued or delayed delivery basis as follows:
| | | | |
| | | When-Issued or
Delayed Delivery
Basis Transactions | |
| Purchased securities | | $ | 2,000,000 | |
Credit Risk. The Fund invests in high-yield, non-investment-grade bonds, which may be subject to a greater degree of credit risk. Credit risk relates to the ability of the issuer to meet interest or principal payments or both as they become due. The Fund may acquire securities that have missed an interest payment, and is not obligated to dispose of securities whose issuers or underlying obligors subsequently miss an interest payment. Information concerning securities not accruing interest as of July 31, 2012 is as follows:
| | | | |
| Cost | | $ | 8,470,263 | |
| Market Value | | $ | 2,919,302 | |
| Market Value as a % of Net Assets | | | 0.45 | % |
Concentration Risk. There are certain risks arising from geographic concentration in any state, commonwealth or territory. Certain economic, regulatory or political developments occurring in the state, commonwealth or territory may impair the ability of certain issuers of municipal securities to pay principal and interest on their obligations.
Allocation of Income, Expenses, Gains and Losses. Income, expenses (other than those attributable to a specific class), gains and losses are allocated on a daily basis to each class of shares based upon the relative proportion of net assets represented by such class. Operating expenses directly attributable to a specific class are charged against the operations of that class.
Federal Taxes. The Fund intends to comply with provisions of the Internal Revenue Code applicable to regulated investment companies and to distribute substantially all of its investment company taxable income, including any net realized gain on investments not offset by capital loss carryforwards, if any, to shareholders. Therefore, no federal income or excise tax provision is required. The Fund files income tax returns in U.S. federal and applicable state jurisdictions. The statute of limitations on the Fund’s tax return filings generally remain open for the three preceding fiscal reporting period ends.
| | | | |
| 46 | | | | OPPENHEIMER NEW JERSEY MUNICIPAL FUND |
The tax components of capital shown in the following table represent distribution requirements the Fund must satisfy under the income tax regulations, losses the Fund may be able to offset against income and gains realized in future years and unrealized appreciation or depreciation of securities and other investments for federal income tax purposes.
| | | | | | | | | | | | |
Undistributed
Net Investment
Income | | Undistributed
Long-Term
Gain | | | Accumulated
Loss
Carryforward1,2,3 | | | Net Unrealized
Appreciation
Based on Cost of
Securities and Other
Investments for Federal
Income Tax Purposes | |
| $7,252,072 | | $ | — | | | $ | 114,331,620 | | | $ | 2,508,619 | |
1. As of July 31, 2012, the Fund had $114,331,620 of net capital loss carryforwards available to offset future realized capital gains, if any, and thereby reduce future taxable gain distributions. Details of the capital loss carryforwards are included in the table below. Capital loss carryovers with no expiration, if any, must be utilized prior to those with expiration dates.
| | | | |
| Expiring | | | |
| 2016 | | $ | 1,484,285 | |
| 2017 | | | 18,113,753 | |
| 2018 | | | 22,257,929 | |
| No expiration | | | 72,475,653 | |
| | |
|
|
|
| Total | | $ | 114,331,620 | |
| | |
|
|
|
2. During the fiscal year ended July 31, 2012, the Fund did not utilize any capital loss carryforward.
3. During the fiscal year ended July 31, 2011, the Fund utilized $254,743 of capital loss carryforward to offset capital gains realized in that fiscal year.
Net investment income (loss) and net realized gain (loss) may differ for financial statement and tax purposes. The character of dividends and distributions made during the fiscal year from net investment income or net realized gains may differ from their ultimate characterization for federal income tax purposes. Also, due to timing of dividends and distributions, the fiscal year in which amounts are distributed may differ from the fiscal year in which the income or net realized gain was recorded by the Fund.
Accordingly, the following amounts have been reclassified for July 31, 2012. Net assets of the Fund were unaffected by the reclassifications.
| | | | | | |
Reduction
to Accumulated
Net Investment
Income | | | Reduction
to Accumulated Net
Realized Loss on
Investments | |
| $ | 450,176 | | | $ | 450,176 | |
| | | | |
| 47 | | | | OPPENHEIMER NEW JERSEY MUNICIPAL FUND |
NOTES TO FINANCIAL STATEMENTS Continued
1. Significant Accounting Policies Continued
The tax character of distributions paid during the years ended July 31, 2012 and July 31, 2011 was as follows:
| | | | | | | | |
| | | Year Ended
July 31, 2012 | | | Year Ended
July 31, 2011 | |
| Distributions paid from: | | | | | | | | |
| Exempt-interest dividends | | $ | 32,717,778 | | | $ | 34,316,961 | |
| Ordinary income | | | 834,062 | | | | 732,457 | |
| | |
|
|
| |
|
|
|
| Total | | $ | 33,551,840 | | | $ | 35,049,418 | |
| | |
|
|
| |
|
|
|
The aggregate cost of securities and other investments and the composition of unrealized appreciation and depreciation of securities and other investments for federal income tax purposes as of July 31, 2012 are noted in the following table. The primary difference between book and tax appreciation or depreciation of securities and other investments, if applicable, is attributable to the tax deferral of losses or tax realization of financial statement unrealized gain or loss.
| | | | |
| Federal tax cost of securities | | $ | 653,454,9291 | |
| | |
|
|
|
| Gross unrealized appreciation | | $ | 44,725,335 | |
| Gross unrealized depreciation | | | (42,216,716 | ) |
| | |
|
|
|
| Net unrealized appreciation | | $ | 2,508,619 | |
| | |
|
|
|
1. The Federal tax cost of securities does not include cost of $40,116,721, which has otherwise been recognized for financial reporting purposes, related to bonds placed into trusts in conjunction with certain investment transactions. See the Inverse Floating Rate Securities note above.
Trustees’ Compensation. The Fund has adopted an unfunded retirement plan (the “Plan”) for the Fund’s independent trustees. Benefits are based on years of service and fees paid to each trustee during their period of service. The Plan was frozen with respect to adding new participants effective December 31, 2006 (the “Freeze Date”) and existing Plan Participants as of the Freeze Date will continue to receive accrued benefits under the Plan. Active independent trustees as of the Freeze Date have each elected a distribution method with respect to their benefits under the Plan. During the year ended July 31, 2012, the Fund’s projected benefit obligations, payments to retired trustees and accumulated liability were as follows:
| | | | |
| Projected Benefit Obligations Increased | | $ | 5,370 | |
| Payments Made to Retired Trustees | | | 6,405 | |
| Accumulated Liability as of July 31, 2012 | | | 47,070 | |
The Board of Trustees has adopted a compensation deferral plan for independent trustees that enables trustees to elect to defer receipt of all or a portion of the annual compensation they are entitled to receive from the Fund. For purposes of determining the amount owed to the Trustee under the plan, deferred amounts are treated as though equal dollar amounts had been invested in shares of the Fund or in other Oppenheimer funds selected by the Trustee. The Fund purchases shares of the funds selected for deferral by the Trustee in amounts equal to his or her deemed investment, resulting in a Fund asset equal to the deferred compensation liability. Such assets are included as a
| | | | |
| 48 | | | | OPPENHEIMER NEW JERSEY MUNICIPAL FUND |
component of “Other” within the asset section of the Statement of Assets and Liabilities. Deferral of trustees’ fees under the plan will not affect the net assets of the Fund, and will not materially affect the Fund’s assets, liabilities or net investment income per share. Amounts will be deferred until distributed in accordance with the compensation deferral plan.
Dividends and Distributions to Shareholders. Dividends and distributions to shareholders, which are determined in accordance with income tax regulations and may differ from U.S. generally accepted accounting principles, are recorded on the ex-dividend date. Income distributions, if any, are declared daily and paid monthly. Capital gain distributions, if any, are declared and paid annually.
Investment Income. Interest income is recognized on an accrual basis. Discount and premium, which are included in interest income on the Statement of Operations, are amortized or accreted daily.
Custodian Fees. “Custodian fees and expenses” in the Statement of Operations may include interest expense incurred by the Fund on any cash overdrafts of its custodian account during the period. Such cash overdrafts may result from the effects of failed trades in portfolio securities and from cash outflows resulting from unanticipated shareholder redemption activity. The Fund pays interest to its custodian on such cash overdraft at a rate equal to the 1 Month LIBOR Rate plus 2.00%. The “Reduction to custodian expenses” line item, if applicable, represents earnings on cash balances maintained by the Fund during the period. Such interest expense and other custodian fees may be paid with these earnings.
Security Transactions. Security transactions are recorded on the trade date. Realized gains and losses on securities sold are determined on the basis of identified cost.
Indemnifications. The Fund’s organizational documents provide current and former trustees and officers with a limited indemnification against liabilities arising in connection with the performance of their duties to the Fund. In the normal course of business, the Fund may also enter into contracts that provide general indemnifications. The Fund’s maximum exposure under these arrangements is unknown as this would be dependent on future claims that may be made against the Fund. The risk of material loss from such claims is considered remote.
Other. The preparation of financial statements in conformity with accounting principles generally accepted in the United States of America requires management to make estimates and assumptions that affect the reported amounts of assets and liabilities and disclosure of contingent assets and liabilities at the date of the financial statements and the reported amounts of increases and decreases in net assets from operations during the reporting period. Actual results could differ from those estimates.
| | | | |
| 49 | | | | OPPENHEIMER NEW JERSEY MUNICIPAL FUND |
NOTES TO FINANCIAL STATEMENTS Continued
2. Securities Valuation
The Fund calculates the net asset value of its shares as of the close of the New York Stock Exchange (the “Exchange”), normally 4:00 P.M. Eastern time, on each day the Exchange is open for trading.
The Fund’s Board has adopted procedures for the valuation of the Fund’s securities and has delegated the day-to-day responsibility for valuation determinations under those procedures to the Manager. The Manager has established a Valuation Committee which is responsible for determining a “fair valuation” for any security for which market quotations are not “readily available.” The Valuation Committee’s fair valuation determinations are subject to review, approval and ratification by the Fund’s Board at its next regularly scheduled meeting covering the calendar quarter in which the fair valuation was determined.
Valuation Methods and Inputs
Securities are valued using unadjusted quoted market prices, when available, as supplied primarily by third party pricing services or dealers.
The following methodologies are used to determine the market value or the fair value of the types of securities described below:
Securities traded on a registered U.S. securities exchange (including exchange-traded derivatives other than futures and futures options) are valued based on the last sale price of the security reported on the principal exchange on which it is traded, prior to the time when the Fund’s assets are valued. In the absence of a sale, the security is valued at the last sale price on the prior trading day, if it is within the spread of the current day’s closing “bid” and “asked” prices, and if not, at the current day’s closing bid price. A security of a foreign issuer traded on a foreign exchange but not listed on a registered U.S. securities exchange is valued based on the last sale price on the principal exchange on which the security is traded, as identified by the third party pricing service used by the Manager, prior to the time when the Fund’s assets are valued. If the last sale price is unavailable, the security is valued at the most recent official closing price on the principal exchange on which it is traded. If the last sales price or official closing price for a foreign security is not available, the security is valued at the mean between the bid and asked price per the exchange or, if not available from the exchange, obtained from two dealers. If bid and asked prices are not available from either the exchange or two dealers, the security is valued by using one of the following methodologies (listed in order of priority); (1) using a bid from the exchange, (2) the mean between the bid and asked price as provided by a single dealer, or (3) a bid from a single dealer.
Shares of a registered investment company that are not traded on an exchange are valued at that investment company’s net asset value per share.
Corporate and government debt securities (of U.S. or foreign issuers) and municipal debt securities, event-linked bonds, loans, mortgage-backed securities, collateralized mortgage obligations, and asset-backed securities are valued at the mean between the “bid” and “asked” prices utilizing evaluated prices obtained from third party pricing services or broker-dealers who may use matrix pricing methods to determine the evaluated prices.
| | | | |
| 50 | | | | OPPENHEIMER NEW JERSEY MUNICIPAL FUND |
Short-term money market type debt securities with a remaining maturity of sixty days or less are valued at cost adjusted by the amortization of discount or premium to maturity (amortized cost), which approximates market value. Short-term debt securities with a remaining maturity in excess of sixty days are valued at the mean between the “bid” and “asked” prices utilizing evaluated prices obtained from third party pricing services or broker-dealers.
A description of the standard inputs that may generally be considered by the third party pricing vendors in determining their evaluated prices is provided below.
| | |
| Security Type | | Standard Inputs Generally Considered by Third-Party Pricing Vendors |
| Corporate debt, government debt, municipal, mortgage-backed and asset-backed securities | | Reported trade data, broker-dealer price quotations, benchmark yields, issuer spreads on comparable securities, the credit quality, yield, maturity, and other appropriate factors. |
| Loans | | Information obtained from market participants regarding reported trade data and broker-dealer price quotations. |
| Event-linked bonds | | Information obtained from market participants regarding reported trade data and broker-dealer price quotations. |
If a market value or price cannot be determined for a security using the methodologies described above, or if, in the “good faith” opinion of the Manager, the market value or price obtained does not constitute a “readily available market quotation,” or a significant event has occurred that would materially affect the value of the security the security is fair valued either (i) by a standardized fair valuation methodology applicable to the security type or the significant event as previously approved by the Valuation Committee and the Fund’s Board or (ii) as determined in good faith by the Manager’s Valuation Committee. The Valuation Committee considers all relevant facts that are reasonably available, through either public information or information available to the Manager, when determining the fair value of a security. Fair value determinations by the Manager are subject to review, approval and ratification by the Fund’s Board at its next regularly scheduled meeting covering the calendar quarter in which the fair valuation was determined. Those fair valuation standardized methodologies include, but are not limited to, valuing securities at the last sale price or initially at cost and subsequently adjusting the value based on: changes in company specific fundamentals, changes in an appropriate securities index, or changes in the value of similar securities which may be further adjusted for any discounts related to security-specific resale restrictions. When possible, such methodologies use observable market inputs such as unadjusted quoted prices of similar securities, observable interest rates, currency rates and yield curves. The methodologies used for valuing securities are not necessarily an indication of the risks associated with investing in those securities nor can it be assured that the Fund can obtain the fair value assigned to a security if it were to sell the security.
To assess the continuing appropriateness of security valuations, the Manager, or its third party service provider who is subject to oversight by the Manager, regularly compares prior day prices, prices on comparable securities, and sale prices to the current day prices and challenges those prices exceeding certain tolerance levels with the third party pricing
| | | | |
| 51 | | | | OPPENHEIMER NEW JERSEY MUNICIPAL FUND |
NOTES TO FINANCIAL STATEMENTS Continued
2. Securities Valuation Continued
service or broker source. For those securities valued by fair valuations, whether through a standardized fair valuation methodology or a fair valuation determination, the Valuation Committee reviews and affirms the reasonableness of the valuations based on such methodologies and fair valuation determinations on a regular basis after considering all relevant information that is reasonably available.
Classifications
Each investment asset or liability of the Fund is assigned a level at measurement date based on the significance and source of the inputs to its valuation. Various data inputs are used in determining the value of each of the Fund’s investments as of the reporting period end. These data inputs are categorized in the following hierarchy under applicable financial accounting standards:
| 1) | | Level 1—unadjusted quoted prices in active markets for identical assets or liabilities (including securities actively traded on a securities exchange) |
| 2) | | Level 2—inputs other than unadjusted quoted prices that are observable for the asset or liability (such as unadjusted quoted prices for similar assets and market corroborated inputs such as interest rates, prepayment speeds, credit risks, etc.) |
| 3) | | Level 3—significant unobservable inputs (including the Manager’s own judgments about assumptions that market participants would use in pricing the asset or liability). |
The inputs used for valuing securities are not necessarily an indication of the risks associated with investing in those securities.
The table below categorizes amounts that are included in the Fund’s Statement of Assets and Liabilities as of July 31, 2012 based on valuation input level:
| | | | | | | | | | | | | | | | | | | | |
| | | Level 1—
Unadjusted
Quoted Prices | | Level 2—
Other Significant
Observable Inputs | | Level 3—
Significant
Unobservable
Inputs | | Value |
| Assets Table | | | | | | | | | | | | | | | | | | | | |
| Investments, at Value: | | | | | | | | | | | | | | | | | | | | |
| Municipal Bonds and Notes | | | | | | | | | | | | | | | | | | | | |
New Jersey | | | $ | — | | | | $ | 513,969,751 | | | | $ | 71 | | | | $ | 513,969,822 | |
U.S. Possessions | | | | — | | | | | 182,110,444 | | | | | — | | | | | 182,110,444 | |
| Common Stocks | | | | 1 | | | | | — | | | | | — | | | | | 1 | |
| Preferred Stocks | | | | — | | | | | — | | | | | 2 | | | | | 2 | |
| | | |
|
|
|
| Total Assets | | | $ | 1 | | | | $ | 696,080,195 | | | | $ | 73 | | | | $ | 696,080,269 | |
| | | |
|
|
|
Currency contracts and forwards, if any, are reported at their unrealized appreciation/depreciation at measurement date, which represents the change in the contract’s value from trade date. Futures, if any, are reported at their variation margin at measurement date, which represents the amount due to/from the Fund at that date. All additional assets and liabilities included in the above table are reported at their market value at measurement date.
| | | | |
| 52 | | | | OPPENHEIMER NEW JERSEY MUNICIPAL FUND |
There have been no significant changes to the fair valuation methodologies of the Fund during the period.
3. Shares of Beneficial Interest
The Fund has authorized an unlimited number of no par value shares of beneficial interest of each class. Transactions in shares of beneficial interest were as follows:
| | | | | | | | | | | | | | | | |
| | | Year Ended July 31, 2012 | | | Year Ended July 29, 20111 | |
| | | Shares | | | Amount | | | Shares | | | Amount | |
| Class A | | | | | | | | | | | | | | | | |
| Sold | | | 7,742,571 | | | $ | 79,110,226 | | | | 6,948,031 | | | $ | 68,195,362 | |
Dividends and/or
distributions reinvested | | | 1,743,210 | | | | 17,818,829 | | | | 1,642,315 | | | | 15,893,783 | |
| Redeemed | | | (6,910,740 | ) | | | (70,232,615 | ) | | | (12,717,482 | ) | | | (122,220,241 | ) |
| | |
|
|
| |
|
|
| |
|
|
| |
|
|
|
| Net increase (decrease) | | | 2,575,041 | | | $ | 26,696,440 | | | | (4,127,136 | ) | | $ | (38,131,096 | ) |
| | |
|
|
| |
|
|
| |
|
|
| |
|
|
|
| | | | | | | | | | | | | | | | | |
| Class B | | | | | | | | | | | | | | | | |
| Sold | | | 407,565 | | | $ | 4,152,835 | | | | 219,543 | | | $ | 2,178,913 | |
Dividends and/or
distributions reinvested | | | 79,991 | | | | 816,583 | | | | 110,857 | | | | 1,076,347 | |
| Redeemed | | | (1,108,981 | ) | | | (11,230,173 | ) | | | (1,419,495 | ) | | | (13,742,954 | ) |
| | |
|
|
| |
|
|
| |
|
|
| |
|
|
|
| Net decrease | | | (621,425 | ) | | $ | (6,260,755 | ) | | | (1,089,095 | ) | | $ | (10,487,694 | ) |
| | |
|
|
| |
|
|
| |
|
|
| |
|
|
|
| | | | | | | | | | | | | | | | | |
| Class C | | | | | | | | | | | | | | | | |
| Sold | | | 2,809,872 | | | $ | 28,879,769 | | | | 2,021,109 | | | $ | 19,862,391 | |
Dividends and/or
distributions reinvested | | | 620,150 | | | | 6,341,434 | | | | 588,768 | | | | 5,703,806 | |
| Redeemed | | | (2,152,699 | ) | | | (21,877,424 | ) | | | (4,394,075 | ) | | | (42,217,734 | ) |
| | |
|
|
| |
|
|
| |
|
|
| |
|
|
|
| Net increase (decrease) | | | 1,277,323 | | | $ | 13,343,779 | | | | (1,784,198 | ) | | $ | (16,651,537 | ) |
| | |
|
|
| |
|
|
| |
|
|
| |
|
|
|
| | | | | | | | | | | | | | | | | |
| Class Y | | | | | | | | | | | | | | | | |
| Sold | | | 1,529,775 | | | $ | 15,744,909 | | | | 998,966 | | | $ | 9,236,075 | |
Dividends and/or
distributions reinvested | | | 70,536 | | | | 724,264 | | | | 19,074 | | | | 182,317 | |
| Redeemed | | | (311,621 | ) | | | (3,197,980 | ) | | | (71,694 | ) | | | (682,462 | ) |
| | |
|
|
| |
|
|
| |
|
|
| |
|
|
|
| Net increase | | | 1,288,690 | | | $ | 13,271,193 | | | | 946,346 | | | $ | 8,735,930 | |
| | |
|
|
| |
|
|
| |
|
|
| |
|
|
|
1. For the year ended July 29, 2011, for Class A, Class B and Class C shares, and for the period from November 29, 2010 (inception of offering) to July 29, 2011, for Class Y shares.
4. Purchases and Sales of Securities
The aggregate cost of purchases and proceeds from sales of securities, other than short-term obligations, for the year ended July 31, 2012, were as follows:
| | | | | | | | |
| | | Purchases | | | Sales | |
| Investment securities | | $ | 132,240,539 | | | $ | 103,771,607 | |
| | | | |
| 53 | | | | OPPENHEIMER NEW JERSEY MUNICIPAL FUND |
NOTES TO FINANCIAL STATEMENTS Continued
5. Fees and Other Transactions with Affiliates
Management Fees. Under the investment advisory agreement, the Fund pays the Manager a management fee based on the daily net assets of the Fund at an annual rate as shown in the following table:
| | | | |
| Fee Schedule | | | |
| Up to $200 million | | | 0.60 | % |
| Next $100 million | | | 0.55 | |
| Next $200 million | | | 0.50 | |
| Next $250 million | | | 0.45 | |
| Next $250 million | | | 0.40 | |
| Over $1 billion | | | 0.35 | |
Administration Service Fees. The Fund pays the Manager a fee of $1,500 per year for preparing and filing the Fund’s tax returns.
Transfer Agent Fees. OppenheimerFunds Services (“OFS”), a division of the Manager, acts as the transfer and shareholder servicing agent for the Fund. The Fund pays OFS a per account fee. For the year ended July 31, 2012, the Fund paid $270,896 to OFS for services to the Fund.
Additionally, Class Y shares are subject to minimum fees of $10,000 annually for assets of $10 million or more. The Class Y shares are subject to the minimum fees in the event that the per account fee does not equal or exceed the applicable minimum fees. OFS may voluntarily waive the minimum fees.
Distribution and Service Plan (12b-1) Fees. Under its General Distributor’s Agreement with the Fund, OppenheimerFunds Distributor, Inc. (the “Distributor”) acts as the Fund’s principal underwriter in the continuous public offering of the Fund’s classes of shares.
Service Plan for Class A Shares. The Fund has adopted a Service Plan (the “Plan”) for Class A shares under Rule 12b-1 of the Investment Company Act of 1940. Under the Plan, the Fund reimburses the Distributor for a portion of its costs incurred for services provided to accounts that hold Class A shares. Reimbursement is made periodically at an annual rate of up to 0.15% of the daily net assets of Class A shares of the Fund. The Distributor currently uses all of those fees to pay dealers, brokers, banks and other financial institutions periodically for providing personal service and maintenance of accounts of their customers that hold Class A shares. Any unreimbursed expenses the Distributor incurs with respect to Class A shares in any fiscal year cannot be recovered in subsequent periods. Fees incurred by the Fund under the Plan are detailed in the Statement of Operations.
Distribution and Service Plans for Class B and Class C Shares. The Fund has adopted Distribution and Service Plans (the “Plans”) for Class B and Class C shares under Rule 12b-1 of the Investment Company Act of 1940 to compensate the Distributor for its services in connection with the distribution of those shares and servicing accounts. Under the Plans, the Fund pays the Distributor an annual asset-based sales charge of 0.75% on Class B and Class C shares daily net assets. The Distributor also receives a service fee of 0.15% per year
| | | | |
| 54 | | | | OPPENHEIMER NEW JERSEY MUNICIPAL FUND |
under each plan. If either the Class B or Class C plan is terminated by the Fund or by the shareholders of a class, the Board of Trustees and its independent trustees must determine whether the Distributor shall be entitled to payment from the Fund of all or a portion of the service fee and/or asset-based sales charge in respect to shares sold prior to the effective date of such termination. Fees incurred by the Fund under the Plans are detailed in the Statement of Operations. The Distributor determines its uncompensated expenses under the Plans at calendar quarter ends. The Distributor’s aggregate uncompensated expenses under the Plans at June 30, 2012 were as follows:
| | | | |
| Class B | | $ | 1,920,983 | |
| Class C | | | 3,610,409 | |
Sales Charges. Front-end sales charges and contingent deferred sales charges (“CDSC”) do not represent expenses of the Fund. They are deducted from the proceeds of sales of Fund shares prior to investment or from redemption proceeds prior to remittance, as applicable. The sales charges retained by the Distributor from the sale of shares and the CDSC retained by the Distributor on the redemption of shares is shown in the following table for the period indicated.
| | | | | | | | | | | | | | | | |
| Year Ended | | Class A Front-End
Sales Charges
Retained by
Distributor | | | Class A
Contingent
Deferred
Sales Charges
Retained by
Distributor | | | Class B Contingent
Deferred
Sales Charges
Retained by
Distributor | | | Class C
Contingent
Deferred
Sales Charges
Retained by
Distributor | |
| July 31, 2012 | | $ | 192,486 | | | $ | — | | | $ | 27,252 | | | $ | 9,496 | |
Waivers and Reimbursements of Expenses. The Manager has voluntarily agreed to reimburse the Fund for a portion of the legal costs and fees incurred in connection with the pending litigation matters discussed in the “Pending Litigation” note which appears later in this report. During the year ended July 31, 2012, the Manager reimbursed the Fund $88,701 for legal costs and fees.
OFS has voluntarily agreed to limit transfer and shareholder servicing agent fees for Classes B, C and Y shares to 0.35% of average annual net assets per class; this limit also applied to Class A shares prior to October 1, 2011. Effective October 1, 2011, OFS has voluntarily agreed to limit its fees for Class A shares to 0.30% of average annual net assets of the class.
Some of these undertakings may be modified or terminated at any time; some may not be modified or terminated until after one year from the date of the current prospectus, as indicated therein.
6. Borrowings
The Fund can borrow money from banks in amounts up to one third of its total assets (including the amount borrowed) less all liabilities and indebtedness other than borrowings (meaning that the value of those assets must be at least 300% of the amount borrowed). The Fund can use those borrowings for investment-related purposes such as
| | | | |
| 55 | | | | OPPENHEIMER NEW JERSEY MUNICIPAL FUND |
NOTES TO FINANCIAL STATEMENTS Continued
6. Borrowings Continued
purchasing portfolio securities. The Fund also may borrow to meet redemption obligations or for temporary and emergency purposes. When the Fund invests borrowed money in portfolio securities, it is using a speculative investment technique known as leverage and changes in the value of the Fund’s investments will have a larger effect on its share price than if it did not borrow because of the effect of leverage.
The Fund can also use the borrowings for other investment-related purposes, including in connection with the Fund’s inverse floater investments as discussed in Note 1. The Fund may use the borrowings to reduce the leverage amount of, or unwind or “collapse” trusts that issued “inverse floaters” owned by the Fund, or in circumstances in which the Fund has entered into a shortfall and forbearance agreement with the sponsor of the inverse floater trust to meet the Fund’s obligation to reimburse the sponsor of the inverse floater for the difference between the liquidation value of the underlying bond and the amount due to holders of the short-term floating rate notes issued by the Trust. See the discussion in Note 1 (Inverse Floating Rate Securities) for additional information.
The Fund will pay interest and may pay other fees in connection with loans. If the Fund does borrow, it will be subject to greater expenses than funds that do not borrow. The interest on borrowed money and the other fees incurred in conjunction with loans are an expense that might reduce the Fund’s yield and return. Expenses incurred by the Fund with respect to interest on borrowings and commitment fees are disclosed separately or as other expenses on the Statement of Operations.
The Fund entered into a Revolving Credit and Security Agreement (the “Agreement”) with conduit lenders and Citibank N.A. which enables it to participate with certain other Oppenheimer funds in a committed, secured borrowing facility that permits borrowings of up to $2.0 billion, collectively, by the Oppenheimer Rochester Funds. To secure the loan, the Fund pledges investment securities in accordance with the terms of the Agreement. Securities held in collateralized accounts to cover these borrowings are noted in the Statement of Investments. Interest is charged to the Fund, based on its borrowings, at current commercial paper issuance rates (0.3384% as of July 31, 2012). The Fund pays additional fees annually to its lender on its outstanding borrowings to manage and administer the facility and is allocated its pro-rata share of an annual structuring fee and ongoing commitment fees both of which are based on the total facility size. Total fees and interest that are included in expenses on the Fund’s Statement of Operations related to its participation in the borrowing facility during the year ended July 31, 2012 equal 0.06% of the Fund’s average net assets on an annualized basis. The Fund has the right to prepay such loans and terminate its participation in the conduit loan facility at any time upon prior notice.
| | | | |
| 56 | | | | OPPENHEIMER NEW JERSEY MUNICIPAL FUND |
As of July 31, 2012, the Fund had borrowings outstanding at an interest rate of 0.3384%. Details of the borrowings for the year ended July 31, 2012 are as follows:
| | | | |
| Average Daily Loan Balance | | $ | 4,219,945 | |
| Average Daily Interest Rate | | | 0.263 | % |
| Fees Paid | | $ | 381,071 | |
| Interest Paid | | $ | 10,829 | |
7. Reverse Repurchase Agreements
The Fund may engage in reverse repurchase agreements. A reverse repurchase agreement is the sale of one or more securities to a counterparty at an agreed-upon purchase price with the simultaneous agreement to repurchase those securities on a future date at a higher repurchase price. The repurchase price represents the repayment of the purchase price and interest accrued thereon over the term of the repurchase agreement. The cash received by the Fund in connection with a reverse repurchase agreement may be used for investment-related purposes such as purchasing portfolio securities or for other purposes such as those described in the preceding “Borrowings” note.
The Fund entered into a Committed Repurchase Transaction Facility (the “Facility”) with J.P. Morgan Securities LLC (the “counterparty’) which enables it to participate with certain other Oppenheimer funds in a committed reverse repurchase agreement facility that permits aggregate outstanding reverse repurchase agreements of up to $750 million, collectively. Interest is charged to the Fund on the purchase price of outstanding reverse repurchase agreements at current LIBOR rates plus an applicable spread. The Fund is also allocated its pro-rata share of an annual structuring fee based on the total Facility size and ongoing commitment fees based on the total unused amount of the Facility. The Fund retains the economic exposure to fluctuations in the value of securities subject to reverse repurchase agreements under the Facility and therefore these transactions are considered secured borrowings for financial reporting purposes. The Fund also continues to receive the economic benefit of interest payments received on securities subject to reverse repurchase agreements, in the form of a direct payment from the counterparty. These payments are included in interest income on the Statement of Operations. Total fees and interest related to the Fund’s participation in the Facility during the year ended July 31, 2012 are included in expenses on the Fund’s Statement of Operations and equal 0.02% of the Fund’s average net assets on an annualized basis.
The securities subject to reverse repurchase agreements under the Facility are valued on a daily basis. To the extent this value, after adjusting for certain margin requirements of the Facility, exceeds the cash proceeds received, the Fund may request the counterparty to return securities equal in margin value to this excess. To the extent that the cash proceeds received exceed the margin value of the securities subject to the transaction, the counterparty may request additional securities from the Fund. The Fund has the right to declare the first or fifteenth day of any calendar month as the repurchase date for any outstanding reverse repurchase agreement upon delivery of advanced notification and may also recall any security subject to such a transaction by substituting eligible securities of equal or greater margin value according to the Facility’s terms.
| | | | |
| 57 | | | | OPPENHEIMER NEW JERSEY MUNICIPAL FUND |
NOTES TO FINANCIAL STATEMENTS Continued
7. Reverse Repurchase Agreements Continued
Securities subject to reverse repurchase agreements are separately noted in the Statement of Investments.
The Fund executed no transactions under the Facility during the year ended July 31, 2012.
8. Pending Litigation
Since 2009, a number of class action, derivative and individual lawsuits have been pending in federal and state courts against OppenheimerFunds, Inc., the Fund’s investment advisor (the “Manager”), OppenheimerFunds Distributor, Inc., the Fund’s principal underwriter and distributor (the “Distributor”), and certain funds—including the Fund—advised by the Manager and distributed by the Distributor (the “Defendant Funds”). Several of these lawsuits also name as defendants certain officers and current and former trustees of the respective Defendant Funds. The lawsuits raise claims under federal securities law and allege, among other things, that the disclosure documents of the respective Defendant Funds contained misrepresentations and omissions and that the respective Defendant Funds’ investment policies were not followed. The plaintiffs in these actions seek unspecified damages, equitable relief and awards of attorneys’ fees and litigation expenses. The Defendant Funds’ Boards of Trustees have also engaged counsel to represent the Funds and the present and former Independent Trustees named in those suits.
Other class action and individual lawsuits have been filed since 2008 in various state and federal courts against the Manager and certain of its affiliates by investors seeking to recover investments they allegedly lost as a result of the “Ponzi” scheme run by Bernard L. Madoff and his firm, Bernard L. Madoff Investment Securities, LLC (“BLMIS”). Plaintiffs in these suits allege that they suffered losses as a result of their investments in several funds managed by an affiliate of the Manager and assert a variety of claims, including breach of fiduciary duty, fraud, negligent misrepresentation, unjust enrichment, and violation of federal and state securities laws and regulations, among others. They seek unspecified damages, equitable relief and awards of attorneys’ fees and litigation expenses. Neither the Distributor, nor any of the Oppenheimer mutual funds, their independent trustees or directors are named as defendants in these lawsuits. None of the Oppenheimer mutual funds invested in any funds or accounts managed by Madoff or BLMIS. On February 28, 2011, a stipulation of partial settlement of three groups of consolidated putative class action lawsuits relating to these matters was filed in the U.S. District Court for the Southern District of New York. On August 19, 2011, the court entered an order and final judgment approving the settlement as fair, reasonable and adequate. In September 2011, certain parties filed notices of appeal from the court’s order approving the settlement. On July 29, 2011, a stipulation of settlement between certain affiliates of the Manager and the Trustee appointed under the Securities Investor Protection Act to liquidate BLMIS was filed in the U.S. Bankruptcy Court for the Southern District of New York to resolve purported preference and fraudulent transfer claims by the Trustee. On September 22, 2011, the court entered an order approving the settlement as fair, reasonable and adequate. In October 2011, certain parties filed notices of appeal from the court’s order approving the settlement. In June 2012, the court granted appellees’ motion to dismiss the
| | | | |
| 58 | | | | OPPENHEIMER NEW JERSEY MUNICIPAL FUND |
appeal. The aforementioned settlements do not resolve other outstanding lawsuits against the Manager and its affiliates relating to BLMIS.
On April 16, 2010, a lawsuit was filed in New York state court against the Manager, an affiliate of the Manager and AAArdvark IV Funding Limited (“AAArdvark IV”), an entity advised by the Manager’s affiliate, in connection with investments made by the plaintiffs in AAArdvark IV. Plaintiffs allege breach of contract against the defendants and seek compensatory damages, costs and disbursements, including attorney fees. On July 15, 2011, a lawsuit was filed in New York state court against the Manager, an affiliate of the Manager and AAArdvark Funding Limited (“AAArdvark I”), an entity advised by the Manager’s affiliate, in connection with investments made by the plaintiffs in AAArdvark I. The complaint alleges breach of contract against the defendants and seeks compensatory damages, costs and disbursements, including attorney fees. On November 9, 2011, a lawsuit was filed in New York state court against the Manager, an affiliate of the Manager and AAArdvark XS Funding Limited (“AAArdvark XS”), an entity advised by the Manager’s affiliate, in connection with investments made by the plaintiffs in AAArdvark XS. The complaint alleges breach of contract against the defendants and seeks compensatory damages, costs and disbursements, including attorney fees.
The Manager believes the lawsuits and appeals described above are without legal merit and, with the exception of actions it has settled, is defending against them vigorously. While it is premature to render any opinion as to the outcome in these lawsuits, or whether any costs that the Defendant Funds may bear in defending the suits might not be reimbursed by insurance, the Manager believes that these suits should not impair the ability of the Manager or the Distributor to perform their respective duties to the Fund, and that the outcome of all of the suits together should not have any material effect on the operations of any of the Oppenheimer mutual funds.
| | | | |
| 59 | | | | OPPENHEIMER NEW JERSEY MUNICIPAL FUND |
REPORT OF INDEPENDENT REGISTERED PUBLIC ACCOUNTING FIRM
The Board of Trustees and Shareholders of Oppenheimer Multi-State Municipal Trust:
We have audited the accompanying statement of assets and liabilities of Oppenheimer New Jersey Municipal Fund (a separate series of Oppenheimer Multi-State Municipal Trust), including the statement of investments, as of July 31, 2012, and the related statements of operations and cash flows for the year then ended, the statements of changes in net assets for each of the years or periods in the two-year period then ended, and the financial highlights for each of the years in the five-year period then ended. These financial statements and financial highlights are the responsibility of the Fund’s management. Our responsibility is to express an opinion on these financial statements and financial highlights based on our audits.
We conducted our audits in accordance with the standards of the Public Company Accounting Oversight Board (United States). Those standards require that we plan and perform the audit to obtain reasonable assurance about whether the financial statements and financial highlights are free of material misstatement. An audit includes examining, on a test basis, evidence supporting the amounts and disclosures in the financial statements. Our procedures included confirmation of securities owned as of July 31, 2012, by correspondence with the custodian, and brokers, or by other appropriate auditing procedures where replies from brokers were not received. An audit also includes assessing the accounting principles used and significant estimates made by management, as well as evaluating the overall financial statement presentation. We believe that our audits provide a reasonable basis for our opinion.
In our opinion, the financial statements and financial highlights referred to above present fairly, in all material respects, the financial position of Oppenheimer New Jersey Municipal Fund as of July 31, 2012, the results of its operations and cash flows for the year then ended, the changes in its net assets for each of the years in the two-year period then ended, and the financial highlights for each of the years or periods in the five-year period then ended, in conformity with U.S. generally accepted accounting principles.
KPMG LLP
Denver, Colorado
September 17, 2012
| | | | |
| 60 | | | | OPPENHEIMER NEW JERSEY MUNICIPAL FUND |
CREDIT ALLOCATION Unaudited
This table provides further information regarding the “Unrated” securities category shown in the “Credit Allocation-Credit Rating Breakdown” table located earlier in this report. The third column below titled “Unrated by a NRSRO; Internally Rated by the Manager” shows the credit allocation of Unrated securities as determined by the Fund’s investment adviser, OppenheimerFunds, Inc. (the “Manager”). These internally rated securities are not rated by any nationally recognized statistical rating organization (NRSRO), such as Standard & Poor’s.
The Manager determines the credit allocation of these securities using its own credit analysis to assign ratings using a rating scale or categories similar to that used by S&P. The Manager is not required to, and does not attempt to, employ the same credit analysis process, procedures or methodologies used by S&P or any other NRSRO in assigning a credit rating to an Unrated security. There can be no assurance, nor is it intended, that the Manager’s credit analysis process is consistent or comparable with the credit analysis process that would be used by S&P or any other NRSRO if it were to rate the same security. Securities rated investment-grade or above by the Manager may or may not be the equivalent to an investment grade or above rating assigned by an NRSRO. More information about the Manager’s internal credit analysis process for Unrated (or internally-rated) securities and securities ratings is contained in the Fund’s Prospectus and Statement of Additional Information.
The second column below titled “NRSRO-Rated” shows the ratings by nationally recognized statistical rating organizations (NRSROs), such as Standard & Poor’s. For securities rated by an NRSRO other than S&P, the Manager converts that rating to the equivalent S&P rating. If two or more NRSROs have assigned a rating to a security, the highest rating is used.
The credit allocations below are as of July 31, 2012 and are subject to change. The percentages are based on the market value of the Fund’s securities as of July 31, 2012 and are subject to change; market value does not include cash. AAA, AA, A, and BBB are investment-grade ratings.
| | | | | | | | | | | | |
| | | NRSRO–Rated | | | Unrated by
a NRSRO;
Internally
Rated by
the Manager | | | Total | |
| AAA | | | 0.1 | % | | | 0.0 | % | | | 0.1 | % |
| AA | | | 17.8 | | | | 0.8 | | | | 18.6 | |
| A | | | 21.1 | | | | 0.0 | | | | 21.1 | |
| BBB | | | 36.0 | | | | 1.1 | | | | 37.1 | |
| BB or lower | | | 13.0 | | | | 10.1 | | | | 23.1 | |
| | |
|
|
| |
|
|
| |
|
|
|
| Total | | | 88.0 | % | | | 12.0 | % | | | 100.0 | % |
| | |
|
|
| |
|
|
| |
|
|
|
| | | | |
| 61 | | | | OPPENHEIMER NEW JERSEY MUNICIPAL FUND |
FEDERAL INCOME TAX INFORMATION Unaudited
In early 2012, if applicable, shareholders of record received information regarding all dividends and distributions paid to them by the Fund during calendar year 2011.
None of the dividends paid by the Fund during the fiscal year ended July 31, 2012 are eligible for the corporate dividend-received deduction. 97.51% of the dividends were derived from interest on municipal bonds and are not subject to federal income taxes. To the extent a shareholder is subject to any state or local tax laws, some or all of the dividends received may be taxable.
The foregoing information is presented to assist shareholders in reporting distributions received from the Fund to the Internal Revenue Service. Because of the complexity of the federal regulations which may affect your individual tax return and the many variations in state and local tax regulations, we recommend that you consult your tax advisor for specific guidance.
| | | | |
| 62 | | | | OPPENHEIMER NEW JERSEY MUNICIPAL FUND |
PORTFOLIO PROXY VOTING POLICIES AND PROCEDURES;
UPDATES TO STATEMENTS OF INVESTMENTS Unaudited
The Fund has adopted Portfolio Proxy Voting Policies and Procedures under which the Fund votes proxies relating to securities (“portfolio proxies”) held by the Fund. A description of the Fund’s Portfolio Proxy Voting Policies and Procedures is available (i) without charge, upon request, by calling the Fund toll-free at 1.800.CALL OPP (225.5677), (ii) on the Fund’s website at oppenheimerfunds.com, and (iii) on the SEC’s website at www.sec.gov. In addition, the Fund is required to file Form N-PX, with its complete proxy voting record for the 12 months ended June 30th, no later than August 31st of each year. The Fund’s voting record is available (i) without charge, upon request, by calling the Fund toll-free at 1.800.CALL OPP (225.5677), and (ii) in the Form N-PX filing on the SEC’s website at www.sec.gov.
The Fund files its complete schedule of portfolio holdings with the SEC for the first quarter and the third quarter of each fiscal year on Form N-Q. The Fund’s Form N-Q filings are available on the SEC’s website at www.sec.gov. Those forms may be reviewed and copied at the SEC’s Public Reference Room in Washington, D.C. Information on the operation of the Public Reference Room may be obtained by calling 1-800-SEC-0330.
Householding—Delivery of Shareholder Documents
This is to inform you about OppenheimerFunds’ “householding” policy. If more than one member of your household maintains an account in a particular fund, OppenheimerFunds will mail only one copy of the fund’s prospectus (or, if available, the fund’s summary prospectus), annual and semiannual report and privacy policy. The consolidation of these mailings, called householding, benefits your fund through reduced mailing expense, and benefits you by reducing the volume of mail you receive from OppenheimerFunds. Householding does not affect the delivery of your account statements.
Please note that we will continue to household these mailings for as long as you remain an OppenheimerFunds shareholder, unless you request otherwise. If you prefer to receive multiple copies of these materials, please call us at 1.800.CALL-OPP (225-5677). You may also notify us in writing or via email. We will begin sending you individual copies of the prospectus (or, if available, the summary prospectus), reports and privacy policy within 30 days of receiving your request to stop householding.
| | | | |
| 63 | | | | OPPENHEIMER NEW JERSEY MUNICIPAL FUND |
TRUSTEES AND OFFICERS Unaudited
| | |
| Name, Position(s) Held with the Fund, Length of Service, Age | | Principal Occupation(s) During the Past 5 Years; Other Trusteeships/Directorships Held; Number of Portfolios in the Fund Complex Currently Overseen |
| |
| INDEPENDENT TRUSTEES | | The address of each Trustee in the chart below is 6803 S. Tucson Way, Centennial, Colorado 80112-3924. Each Trustee serves for an indefinite term, or until his or her resignation, retirement, death or removal. |
| |
Brian F. Wruble, Chairman of the Board of Trustees (since 2007), Trustee (since 2005) Age: 69 | | Director of Community Foundation of the Florida Keys (non-profit) (July 2012-June 2013); Chairman Emeritus and Non-Voting Trustee of The Jackson Laboratory (non-profit) (since August 2011); Director of Special Value Opportunities Fund, LLC (registered investment company) (affiliate of the Manager’s parent company) (since September 2004); Member of Zurich Financial Investment Management Advisory Council (insurance) (since 2004); Treasurer (since 2007) and Trustee of the Institute for Advanced Study (non-profit educational institute) (since May 1992); Chairman (August 2007-July 2011) and Trustee (August 1991-July 2011) of the Board of Trustees of The Jackson Laboratory (non-profit); General Partner of Odyssey Partners, L.P. (hedge fund) (September 1995-December 2007); Special Limited Partner of Odyssey Investment Partners, LLC (private equity investment) (January 1999-September 2004). Oversees 58 portfolios in the OppenheimerFunds complex. Mr. Wruble has served on the Boards of certain Oppenheimer funds since April 2001, during which time he has become familiar with the Fund’s (and other Oppenheimer funds’) financial, accounting, regulatory and investment matters and has contributed to the Boards’ deliberations. |
| |
David K. Downes, Trustee (since 2007) Age: 72 | | Director of THL Credit Inc. (since June 2009); Independent Chairman GSK Employee Benefit Trust (since April 2006); Trustee of Employee Trusts (since January 2006); Chief Executive Officer and Board Member of Community Capital Management (investment management company) (since January 2004); President of The Community Reinvestment Act Qualified Investment Fund (investment management company) (since 2004); Director of Internet Capital Group (information technology company) (since October 2003); Director of Correctnet (January 2006-2007); Independent Chairman of the Board of Trustees of Quaker Investment Trust (registered investment company) (2004-2007); Chief Operating Officer and Chief Financial Officer of Lincoln National Investment Companies, Inc. (subsidiary of Lincoln National Corporation, a publicly traded company) and Delaware Investments U.S., Inc. (investment management subsidiary of Lincoln National Corporation) (1993-2003); President, Chief Executive Officer and Trustee of Delaware Investment Family of Funds (1993-2003); President and Board Member of Lincoln National Convertible Securities Funds, Inc. and the Lincoln National Income Funds, TDC (1993-2003); Chairman and Chief Executive Officer of Retirement Financial Services, Inc. (registered transfer agent and investment adviser and subsidiary of Delaware Investments U.S., Inc.) (1993-2003); President and Chief Executive Officer of Delaware Service Company, Inc. (1995-2003); Chief Administrative Officer, Chief Financial Officer, Vice Chairman and Director of Equitable Capital Management Corporation (investment subsidiary of Equitable Life Assurance Society) (1985-1992); Corporate Controller of Merrill Lynch Company (financial services holding company) (1977-1985); held the following positions at the Colonial Penn Group, Inc. (insurance company): Corporate Budget Director (1974-1977), Assistant Treasurer (1972-1974) and Director of Corporate Taxes (1969-1972); held the following positions at Price Waterhouse Company (financial services firm): Tax Manager (1967-1969), Tax Senior (1965-1967) and Staff Accountant (1963-1965); United States Marine Corps (1957-1959). Oversees 58 portfolios in the OppenheimerFunds complex. Mr. Downes has served on the Boards of certain Oppenheimer funds since December 2005, during which time he has become familiar with the Fund’s (and other Oppenheimer funds’) financial, accounting, regulatory and investment matters and has contributed to the Boards’ deliberations. |
| | | | |
| 64 | | | | OPPENHEIMER NEW JERSEY MUNICIPAL FUND |
| | |
Matthew P. Fink, Trustee (since 2005) Age: 71 | | Trustee of the Committee for Economic Development (policy research foundation) (2005-2011); Director of ICI Education Foundation (education foundation) (October 1991-August 2006); President of the Investment Company Institute (trade association) (October 1991-June 2004); Director of ICI Mutual Insurance Company (insurance company) (October 1991-June 2004); Author of The Rise of Mutual Funds: An Insider’s View published by Oxford University Press (second edition 2010). Oversees 58 portfolios in the OppenheimerFunds complex. Mr. Fink has served on the Boards of certain Oppenheimer funds since January 2005, during which time he has become familiar with the Fund’s (and other Oppenheimer funds’) financial, accounting, regulatory and investment matters and has contributed to the Boards’ deliberations. |
| |
Phillip A. Griffiths, Trustee (since 1999) Age: 73 | | Fellow of the Carnegie Corporation (since 2007); Member of the National Academy of Sciences (since 1979); Council on Foreign Relations (since 2002); Foreign Associate of Third World Academy of Sciences (since 2002); Chair of Science Initiative Group (since 1999); Member of the American Philosophical Society (since 1996); Trustee of Woodward Academy (since 1983); Director of GSI Lumonics Inc. (precision technology products company) (2001-2010); Senior Advisor of The Andrew W. Mellon Foundation (2001-2010); Distinguished Presidential Fellow for International Affairs of the National Academy of Science (2002-2010); Director of the Institute for Advanced Study (1991-2004); Director of Bankers Trust New York Corporation (1994-1999); Provost at Duke University (1983-1991). Oversees 58 portfolios in the OppenheimerFunds complex. Mr. Griffiths has served on the Boards of certain Oppenheimer funds since June 1999, during which time he has become familiar with the Fund’s (and other Oppenheimer funds’) financial, accounting, regulatory and investment matters and has contributed to the Boards’ deliberations. |
| |
Mary F. Miller, Trustee (since 2004) Age: 69 | | Trustee of International House (not-for-profit) (since June 2007); Trustee of the American Symphony Orchestra (not-for-profit) (October 1998-November 2011); and Senior Vice President and General Auditor of American Express Company (financial services company) (July 1998-February 2003). Oversees 58 portfolios in the OppenheimerFunds complex. Ms. Miller has served on the Boards of certain Oppenheimer funds since August 2004, during which time she has become familiar with the Fund’s (and other Oppenheimer funds’) financial, accounting, regulatory and investment matters and has contributed to the Boards’ deliberations. |
| |
Joel W. Motley, Trustee (since 2002) Age: 60 | | Director of Southern Africa Legal Services Foundation (since March 2012); Board Member of Pulitzer Center for Crisis Reporting (non-profit journalism) (since December 2010); Managing Director of Public Capital Advisors, LLC (privately-held financial advisor) (since January 2006); Managing Director of Carmona Motley, Inc. (privately-held financial advisor) (since January 2002); Director of Columbia Equity Financial Corp. (privately-held financial advisor) (2002-2007); Managing Director of Carmona Motley Hoffman Inc. (privately-held financial advisor) (January 1998-December 2001); Member of the Finance and Budget Committee of the Council on Foreign Relations, Chairman of the Investment Committee of the Episcopal Church of America, Member of the Investment Committee and Board of Human Rights Watch and Member of the Investment Committee and Board of Historic Hudson Valley. Oversees 58 portfolios in the OppenheimerFunds complex. Mr. Motley has served on the Boards of certain Oppenheimer funds since October 2002, during which time he has become familiar with the Fund’s (and other Oppenheimer funds’) financial, accounting, regulatory and investment matters and has contributed to the Boards’ deliberations. |
| | | | |
| 65 | | | | OPPENHEIMER NEW JERSEY MUNICIPAL FUND |
TRUSTEES AND OFFICERS Unaudited / Continued
| | |
Mary Ann Tynan, Trustee (since 2008) Age: 66 | | Director and Secretary of the Appalachian Mountain Club (non-profit outdoor organization) (since January 2012); Director of Opera House Arts (non-profit arts organization) (since October 2011); Independent Director of the ICI Board of Governors (since October 2011); Vice Chair of Board of Trustees of Brigham and Women’s/Faulkner Hospitals (non-profit hospital) (since 2000); Chair of Board of Directors of Faulkner Hospital (non-profit hospital) (since 1990); Member of Audit and Compliance Committee of Partners Health Care System (non-profit) (since 2004); Board of Trustees of Middlesex School (educational institution) (since 1994); Board of Directors of Idealswork, Inc. (financial services provider) (since 2003); Partner, Senior Vice President and Director of Regulatory Affairs of Wellington Management Company, LLP (global investment manager) (1976-2002); Vice President and Corporate Secretary, John Hancock Advisers, Inc. (mutual fund investment adviser) (1970-1976). Oversees 58 portfolios in the OppenheimerFunds complex. Ms. Tynan has served on the Boards of certain Oppenheimer funds since October 2008, during which time she has become familiar with the Fund’s (and other Oppenheimer funds’) financial, accounting, regulatory and investment matters and has contributed to the Boards’ deliberations. |
| |
Joseph M. Wikler, Trustee (since 2005) Age: 71 | | Director of C-TASC (bio-statistics services) (2007-2012); formerly, Director of the following medical device companies: Medintec (1992-2011) and Cathco (1996-2011); Member of the Investment Committee of the Associated Jewish Charities of Baltimore (since 1994); Director of Lakes Environmental Association (environmental protection organization) (1996-2008); Director of Fortis/Hartford mutual funds (1994-December 2001). Oversees 58 portfolios in the OppenheimerFunds complex. Mr. Wikler has served on the Boards of certain Oppenheimer funds since August 2005, during which time he has become familiar with the Fund’s (and other Oppenheimer funds’) financial, accounting, regulatory and investment matters and has contributed to the Boards’ deliberations. |
| |
Peter I. Wold, Trustee (since 2005) Age: 64 | | Director of Arch Coal, Inc. (since 2010); Director and Chairman of Wyoming Enhanced Oil Recovery Institute Commission (enhanced oil recovery study) (since 2004); President of Wold Oil Properties, Inc. (oil and gas exploration and production company) (since 1994); Vice President of American Talc Company, Inc. (talc mining and milling) (since 1999); Managing Member of Hole-in-the-Wall Ranch (cattle ranching) (since 1979); Director and Chairman of the Denver Branch of the Federal Reserve Bank of Kansas City (1993-1999); and Director of PacifiCorp. (electric utility) (1995-1999). Oversees 58 portfolios in the OppenheimerFunds complex. Mr. Wold has served on the Boards of certain Oppenheimer funds since August 2005, during which time he has become familiar with the Fund’s (and other Oppenheimer funds’) financial, accounting, regulatory and investment matters and has contributed to the Boards’ deliberations. |
| OFFICERS OF THE FUND | | The addresses of the Officers in the chart below are as follows: for Messrs. Glavin, Gabinet and Ms. Nasta, Two World Financial Center, 225 Liberty Street, New York, New York 10281-1008, for Messrs. Vandehey and Wixted, 6803 S. Tucson Way, Centennial, Colorado 80112-3924, for Messrs. Loughran, Cottier, Willis, DeMitry, Camarella, Pulire and Stein, 350 Linden Oaks, Rochester, New York 14625. Each Officer serves for an indefinite term or until his or her resignation, retirement, death or removal. |
| |
Daniel G. Loughran, Vice President (since 2005) Age: 48 | | Senior Vice President of the Manager (since July 2007); Vice President of the Manager (April 2001-June 2007) and a Portfolio Manager with the Manager (1999-2001). Team leader, a Senior Portfolio Manager, an officer and a trader for the Fund and other Oppenheimer funds. |
| | | | |
| 66 | | | | OPPENHEIMER NEW JERSEY MUNICIPAL FUND |
| | |
Scott S. Cottier, Vice President (since 2005) Age: 40 | | Vice President of the Manager (since September 2002). Portfolio Manager and trader at Victory Capital Management (1999-2002). Senior Portfolio Manager, an officer and a trader for the Fund and other Oppenheimer funds. |
| |
Troy E. Willis, Vice President (since 2005) Age: 39 | | Vice President of the Manager (since July 2009); Assistant Vice President of the Manager (July 2005-June 2009). Portfolio Manager of the Manager (2003- 2005). Corporate Attorney for Southern Resource Group (1999-2003). Senior Portfolio Manager, an officer and a trader for the Fund and other Oppenheimer funds. |
| |
Mark R. DeMitry, Vice President (since 2009) Age: 36 | | Vice President of the Manager (since July 2009); Associate Portfolio Manager of the Fund (September 2006- June 2009). Research Analyst of the Manager (June 2003-September 2006) and a Credit Analyst of the Manager (July 2001-May 2003). Senior Portfolio Manager, an officer and a trader for the Fund and other Oppenheimer funds. |
| |
Michael L. Camarella, Vice President (since 2009) Age: 36 | | Vice President of the Manager (since January 2011); Assistant Vice President of the Manager (July 2009-December 2010); Associate Portfolio Manager of the Manager (January 2008-November 2010). Research Analyst of the Manager (April 2006-December 2007) and a Credit Analyst of the Manager (June 2003-March 2006). Senior Portfolio Manager, an officer and a trader for the Fund and other Oppenheimer funds. |
| |
Charles S. Pulire, Vice President (since 2011) Age: 35 | | Assistant Vice President of the Manager (since December 2010); Research Analyst of the Manager (February 2008-November 2010); Credit Analyst of the Manager (May 2006-January 2008). Portfolio Manager, an officer and a trader for the Fund and other Oppenheimer funds. |
| |
Richard A. Stein, Vice President (since 2007) Age: 54 | | Director of the Rochester Credit Analysis team (since March 2004); Senior Vice President of the Manager (since June 2011) and a Vice President of the Manager (1997-May 2011); headed Rochester’s Credit Analysis team (since May 1993). |
| |
William F. Glavin, Jr., President and Principal Executive Officer (since 2009) Age: 53 | | Chairman of the Manager (since December 2009); Chief Executive Officer and Director of the Manager (since January 2009); President of the Manager (since May 2009); Director of Oppenheimer Acquisition Corp. (“OAC”) (the Manager’s parent holding company) (since June 2009); Executive Vice President (March 2006-February 2009) and Chief Operating Officer (July 2007-February 2009) of Massachusetts Mutual Life Insurance Company (OAC’s parent company); Director (May 2004-March 2006) and Chief Operating Officer and Chief Compliance Officer (May 2004-January 2005), President (January 2005-March 2006) and Chief Executive Officer (June 2005-March 2006) of Babson Capital Management LLC; Director (March 2005-March 2006), President (May 2003-March 2006) and Chief Compliance Officer (July 2005-March 2006) of Babson Capital Securities, Inc. (a broker-dealer); President (May 2003-March 2006) of Babson Investment Company, Inc.; Director (May 2004-August 2006) of Babson Capital Europe Limited; Director (May 2004-October 2006) of Babson Capital Guernsey Limited; Director (May 2004-March 2006) of Babson Capital Management LLC; Non-Executive Director (March 2005-March 2007) of Baring Asset Management Limited; Director (February 2005-June 2006) Baring Pension Trustees Limited; Director and Treasurer (December 2003-November 2006) of Charter Oak Capital Management, Inc.; Director (May 2006-September 2006) of C.M. Benefit Insurance Company; Director (May 2008-June 2009) and Executive Vice President (June 2007-July 2009) of C.M. Life Insurance Company; President (March 2006-May 2007) of MassMutual Assignment Company; Director (January 2005-December 2006), Deputy Chairman (March 2005-December 2006) and President (February 2005-March 2005) of MassMutual Holdings (Bermuda) Limited; Director (May 2008-June 2009) and Executive Vice President |
| | | | |
| 67 | | | | OPPENHEIMER NEW JERSEY MUNICIPAL FUND |
TRUSTEES AND OFFICERS Unaudited / Continued
| | |
William F. Glavin, Jr., Continued | | (June 2007-July 2009) of MML Bay State Life Insurance Company; Chief Executive Officer and President (April 2007-January 2009) of MML Distributors, LLC; and Chairman (March 2006-December 2008) and Chief Executive Officer (May 2007-December 2008) of MML Investors Services, Inc. Oversees 63 portfolios as a Trustee/Director and 95 portfolios as an officer in the OppenheimerFunds complex. |
| |
Arthur S. Gabinet, Secretary and Chief Legal Officer (since 2011) Age: 54 | | Executive Vice President (since May 2010) and General Counsel (since January 2011) of the Manager; General Counsel of the Distributor (since January 2011); General Counsel of Centennial Asset Management Corporation (since January 2011); Executive Vice President and General Counsel of HarbourView Asset Management Corporation (since January 2011); Assistant Secretary (since January 2011) and Director (since January 2011) of OppenheimerFunds International Ltd. and OppenheimerFunds plc; Vice President and Director of Oppenheimer Partnership Holdings, Inc. (since January 2011); Director of Oppenheimer Real Asset Management, Inc. (since January 2011); Executive Vice President and General Counsel of Shareholder Financial Services, Inc. and Shareholder Services, Inc. (since January 2011); Executive Vice President and General Counsel of OFI Private Investments, Inc. (since January 2011); Vice President of OppenheimerFunds Legacy Program (January 2011-January 2012); Executive Vice President and General Counsel of OFI Institutional Asset Management, Inc. (since January 2011); General Counsel, Asset Management of the Manager (May 2010-December 2010); Principal, The Vanguard Group (November 2005-April 2010); District Administrator, U.S. Securities and Exchange Commission (January 2003-October 2005). An officer of 95 portfolios in the OppenheimerFunds complex. |
| |
Christina M. Nasta, Vice President and Chief Business Officer (since 2011) Age: 39 | | Senior Vice President of the Manager (since July 2010); Vice President of the Manager (since January 2003); Vice President of OppenheimerFunds Distributor, Inc. (since January 2003). An officer of 95 portfolios in the OppenheimerFunds complex. |
| |
Mark S. Vandehey, Vice President and Chief Compliance Officer (since 2004) Age: 61 | | Senior Vice President and Chief Compliance Officer of the Manager (since March 2004); Chief Compliance Officer of OppenheimerFunds Distributor, Inc., Centennial Asset Management and Shareholder Services, Inc. (since March 2004); Vice President of OppenheimerFunds Distributor, Inc., Centennial Asset Management Corporation and Shareholder Services, Inc. (since June 1983). An officer of 95 portfolios in the OppenheimerFunds complex. |
| |
Brian W. Wixted, Treasurer and Principal Financial & Accounting Officer (since 1999) Age: 52 | | Senior Vice President of the Manager (since March 1999); Treasurer of the Manager and the following: HarbourView Asset Management Corporation, Shareholder Financial Services, Inc., Shareholder Services, Inc., Oppenheimer Real Asset Management, Inc. and Oppenheimer Partnership Holdings, Inc. (March 1999-June 2008), OFI Private Investments, Inc. (March 2000-June 2008), OppenheimerFunds International Ltd. and OppenheimerFunds plc (since May 2000), OFI Institutional Asset Management, Inc. (since November 2000), and OppenheimerFunds Legacy Program (charitable trust program established by the Manager) (June 2003-January 2012); Treasurer and Chief Financial Officer of OFI Trust Company (trust company subsidiary of the Manager) (since May 2000); Assistant Treasurer of OAC (March 1999-June 2008). An officer of 95 portfolios in the OppenheimerFunds complex. |
The Fund’s Statement of Additional Information contains additional information about the Fund’s Trustees and Officers and is available without charge upon request, by calling 1.800.CALL OPP (225.5677).
| | | | |
| 68 | | | | OPPENHEIMER NEW JERSEY MUNICIPAL FUND |
OPPENHEIMER NEW JERSEY MUNICIPAL FUND
| | |
| A Series of Oppenheimer Multi-State Municipal Trust |
| Manager | | OppenheimerFunds, Inc. |
| Distributor | | OppenheimerFunds Distributor, Inc. |
| Transfer and Shareholder Servicing Agent | | OppenheimerFunds Services |
Independent
Registered Public Accounting Firm | | KPMG LLP |
| Legal Counsel | | Kramer Levin Naftalis & Frankel LLP |
©2012 OppenheimerFunds, Inc. All rights reserved.
| | | | |
| 69 | | | | OPPENHEIMER NEW JERSEY MUNICIPAL FUND |
PRIVACY POLICY
As an Oppenheimer fund shareholder, you are entitled to know how we protect your personal information and how we limit its disclosure.
Information Sources
We obtain nonpublic personal information about our shareholders from the following sources:
| l | | Applications or other forms |
| l | | When you create a user ID and password for online account access |
| l | | When you enroll in eDocs Direct, our electronic document delivery service |
| l | | Your transactions with us, our affiliates or others |
| l | | A software program on our website, often referred to as a “cookie,” which indicates which parts of our site you’ve visited |
| l | | When you set up challenge questions to reset your password online |
If you visit oppenheimerfunds.com and do not log on to the secure account information areas, we do not obtain any personal information about you. When you do log on to a secure area, we do obtain your user ID and password to identify you. We also use this information to provide you with products and services you have requested, to inform you about products and services that you may be interested in and assist you in other ways.
We do not collect personal information through our website unless you willingly provide it to us, either directly by email or in those areas of the website that request information. In order to update your personal information (including your mailing address, email address and phone number) you must first log on and visit your user profile.
If you have set your browser to warn you before accepting cookies, you will receive the warning message with each cookie. You can refuse cookies by turning them off in your browser. However, doing so may limit your access to certain sections of our website.
We use cookies to help us improve and manage our website. For example, cookies help us recognize new versus repeat visitors to the site, track the pages visited, and enable some special features on the website. This data helps us provide a better service for our website visitors.
Protection of Information
We do not disclose any non-public personal information (such as names on a customer list) about current or former customers to anyone, except as permitted by law.
Disclosure of Information
We send your financial advisor (as designated by you) copies of confirmations, account statements and other documents reporting activity in your fund accounts. We may also use details about you and your investments to help us, our financial service affiliates, or firms that jointly market their financial products and services with ours, to better serve your investment needs or suggest financial services or educational material that may be of interest to you. If this requires us to provide you with an opportunity to “opt in” or “opt out” of such information sharing with a firm not affiliated with us, you will receive notification on how to do so, before any such sharing takes place.
Right of Refusal
We will not disclose your personal information to unaffiliated third parties (except as permitted by law), unless we first offer you a reasonable opportunity to refuse or “opt out” of such disclosure.
Internet Security and Encryption
In general, the email services provided by our website are encrypted and provide a secure and private means of communication with us. To protect your own privacy, confidential and/or personal information should only be communicated via email when you are advised that you are using a secure website.
| | | | |
| 70 | | | | OPPENHEIMER NEW JERSEY MUNICIPAL FUND |
As a security measure, we do not include personal or account information in non-secure emails, and we advise you not to send such information to us in non-secure emails. Instead, you may take advantage of the secure features of our website to encrypt your email correspondence. To do this, you will need to use a browser that supports Secure Sockets Layer (SSL) protocol.
We do not guarantee or warrant that any part of our website, including files available for download, are free of viruses or other harmful code. It is your responsibility to take appropriate precautions, such as use of an anti-virus software package, to protect your computer hardware and software.
| l | | All transactions, including redemptions, exchanges and purchases, are secured by SSL and 128-bit encryption. SSL is used to establish a secure connection between your PC and OppenheimerFunds’ server. It transmits information in an encrypted and scrambled format. |
| l | | Encryption is achieved through an electronic scrambling technology that uses a “key” to code and then decode the data. Encryption acts like the cable converter box you may have on your television set. It scrambles data with a secret code so that no one can make sense of it while it is being transmitted. When the data reaches its destination, the same software unscrambles the data. |
| l | | You can exit the secure area by either closing your browser, or for added security, you can use the Log Out button before you close your browser. |
Other Security Measures
We maintain physical, electronic and procedural safeguards to protect your personal account information. Our employees and agents have access to that information only so that they may offer you products or provide services, for example, when responding to your account questions.
How You Can Help
You can also do your part to keep your account information private and to prevent unauthorized transactions. If you obtain a user ID and password for your account, do not allow it to be used by anyone else. Also, take special precautions when accessing your account on a computer used by others.
Who We Are
This joint notice describes the privacy policies of the Oppenheimer funds, OppenheimerFunds Distributor, Inc., the trustee of OppenheimerFunds Individual Retirement Accounts (IRAs) and the custodian of the OppenheimerFunds 403(b)(7) tax sheltered custodial accounts. It applies to all Oppenheimer fund accounts you presently have, or may open in the future, using your Social Security number—whether or not you remain a shareholder of our funds. This notice was last updated January 16, 2004. In the event it is updated or changed, we will post an updated notice on our website at oppenheimerfunds.com. If you have any questions about these privacy policies, write to us at P.O. Box 5270, Denver, CO 80217-5270, email us by clicking on the Contact Us section of our website at oppenheimerfunds.com or call us at 1.800.CALL OPP (225.5677).
| | | | |
| 71 | | | | OPPENHEIMER NEW JERSEY MUNICIPAL FUND |
July 31, 2012
| | | | |
| | | |
| | | Oppenheimer Pennsylvania Municipal Fund | | Management Commentary and Annual Report |

MANAGEMENT COMMENTARY
An Interview with Your Fund’s Portfolio Managers
ANNUAL REPORT
Listing of Top Holdings
Fund Performance Discussion
Financial Statements
“We hope that the recent strength of the municipal bond market has renewed investors’ confidence in the market’s powerful ability to help investors earn tax-advantaged income.”
Dan Loughran, Senior Vice President, Senior Portfolio Manager and Team Leader, OppenheimerFunds/Rochester


TOP HOLDINGS AND ALLOCATIONS
| | | | |
| |
Top Ten Categories
| |
| |
Hospital/Healthcare
| |
| 19.0
| %
|
Tobacco-Master Settlement Agreement
| |
| 16.1
|
|
Higher Education
| |
| 12.1
|
|
General Obligation
| |
| 5.6
|
|
Marine/Aviation Facilities
| |
| 3.9
|
|
Student Housing
| |
| 3.8
|
|
Highways/Commuter Facilities
| |
| 3.7
|
|
Adult Living Facilities
| |
| 3.4
|
|
Water Utilities
| |
| 3.4
|
|
| Tax Increment Financing (TIF) | | | 3.2 | |
|
| Portfolio holdings are subject to change. Percentages are as of July 31, 2012, and are based on total assets. | |
| | | | | | |
| |
Credit Rating Breakdown
| | NRSRO Only Total
| |
AA
| | 25.7%
|
|
A
| | 10.0
|
|
BBB
| | 42.7
|
|
BB and lower
| | 6.1
|
|
| Unrated | | | |
| 15.5
|
|
| Total | | | | | 100.0 | % |
|
| The percentages above are based on the market value of the Fund’s securities as of July 31, 2012, and are subject to change. All securities except for those labeled “unrated” have been rated by at least one Nationally Recognized Statistical Rating Organization (“NRSRO”), such as Standard & Poor’s (“S&P”). For securities rated only by an NRSRO other than S&P, OppenheimerFunds, Inc. (the “Manager”) converts that rating to the equivalent S&P rating. If two or more NRSROs have assigned a rating to a security, the highest rating is used. Unrated securities do not necessarily indicate low credit quality. | |
|
| For the purposes of this Credit Allocation table, “investment-grade” securities are securities rated within the NRSROs’ four highest rating categories, which include AAA, AA, A and BBB. Securities not rated by an NRSRO may or may not be equivalent of investment grade. For further details, please consult the Fund’s prospectus or Statement of Additional Information. | |
| | | | |
| 10 | | | | OPPENHEIMER PENNSYLVANIA MUNICIPAL FUND |
FUND PERFORMANCE DISCUSSION
How has the Fund performed? Below is a discussion by OppenheimerFunds, Inc., of the Fund’s performance during its fiscal year ended July 31, 2012, followed by a graphical comparison of the Fund’s performance to appropriate broad-based market indices.
Management’s Discussion of Fund Performance. In the reporting period ended July 31, 2012, Oppenheimer Pennsylvania Municipal Fund benefited from a rally in the municipal market and produced an annual total return of 14.84% at net asset value (9.39% with sales charge).
The charts on pages 15 to 18 show the Fund’s performance. We encourage investors to remain focused on their long-term financial objectives for high levels of tax-free income and believe that this Fund’s investments offer structural advantages over the long term.
Securities issued in the Commonwealth of Puerto Rico, which are exempt from federal, state and local income taxes, represented 24.9% of the Fund’s net assets on July 31, 2012, and contributed positively to the Fund’s total return this reporting period. The Fund’s holdings come from many different sectors, including the tobacco and sales tax revenue sectors, as well as general obligation debt. These investments are supported by taxes and other revenues designed to help finance electric utilities, highways and education.
During this reporting period, the market continued to react favorably to better fiscal management under the leadership of Gov. Luis Fortuño. This discipline has helped Puerto Rico significantly reduce pressure on its municipal bonds. The administration proposed another deficit budget for the fiscal year that began July 1, 2012, but has lowered the size of the deficit relative to spending considerably in recent years.
Bond sales have remained strong, despite concerns raised over credit quality. In a period of low issuance, the Puerto Rico Aqueduct and Sewer Authority came to market in February 2012 with $1.8 billion in senior-lien revenue bonds, the largest scheduled sale in the long-term market to date for the year. It came to market once again in March 2012, with another significant sale for $2.3 billion in public improvement refunding bonds, an increase from the anticipated $1.5 billion priced ahead of schedule.
During this reporting period, both S&P and Moody’s revised their outlooks on general obligation debt issued by the Commonwealth. As of July 31, 2012, the S&P rating was BBB and the Moody’s rating was Baa1, both with negative outlooks. While the ratings agencies have raised concerns about the fiscal environment’s potential to delay structurally balanced budgets in the near future, our stance remains bullish. The Fund’s Puerto Rico holdings contributed positively to the Fund’s total return this reporting period, and we continue to remain confident in the Commonwealth’s ability to collect taxes and make its bond payments.
| | | | |
| 11 | | | | OPPENHEIMER PENNSYLVANIA MUNICIPAL FUND |
FUND PERFORMANCE DISCUSSION
As of July 31, 2012, the Fund was invested in the hospital/healthcare sector, representing 19.0% of the Fund’s total assets and comprising the Fund’s largest industry sector. Our holdings in this sector consist of securities across the credit spectrum. The sector remained in the news this reporting period as many politicians, lobbyists, activists and others continued to argue about the constitutionality of the Affordable Care Act of 2010. On June 28, 2012, the Supreme Court upheld the “individual mandate,” which was considered the most controversial element of the Act. Immediately after the court’s ruling, some politicians suggested that Congress would revisit and perhaps seek to override the legislation. However, none of these developments has changed our perspective that our disciplined, security-specific approach to credit research can uncover many potentially advantageous opportunities for the Fund in this and other sectors. The hospital/health care sector contributed strongly to the Fund’s total return this reporting period.
The Fund continued to be invested this reporting period in bonds backed by proceeds from the tobacco Master Settlement Agreement (the MSA), the national litigation settlement with U.S tobacco manufacturers. At the end of this reporting period, MSA-backed tobacco bonds accounted for 16.1% of the Fund’s total assets and contributed positively to Fund performance.5
As in prior reporting periods, the tobacco bonds this Fund held during this reporting period made all scheduled payments of interest and principal on time and in full. Our long-term view of the sector remains bullish and, given attractive valuations, we will likely continue to hold a greater percentage of tobacco bonds in our portfolios than our peers. We are confident that this sector will continue to provide high levels of tax-free income to the long-term benefit of our yield-seeking investors.
The Fund continued to favor the higher education sector this reporting period, which constituted 12.1% of total assets as of July 31, 2012, and contributed positively to Fund performance. The investment-grade bonds we hold in this sector have regularly provided high levels of tax-free income with what we believe to be far less credit risk than their external ratings would suggest.
5. Investments in “tobacco bonds,” which are backed by the proceeds a state or territory receives from the 1998 national litigation settlement with tobacco manufacturers, may be vulnerable to economic and/or legislative events that affect issuers in a particular municipal market sector. Annual payments by MSA-participating manufacturers, for example, hinge on many factors, including annual domestic cigarette shipments, inflation and the relative marketshare of non-participating manufacturers. To date, we believe consumption figures remain within an acceptable range of the assumptions used to structure MSA bonds. Future MSA payments could be reduced if consumption were to fall more rapidly than originally forecast.
| | | | |
| 12 | | | | OPPENHEIMER PENNSYLVANIA MUNICIPAL FUND |
General obligation debt backed by the full faith and taxing authority of the state and local governments represented 5.6% of the Fund’s total assets as of July 31, 2012, and made a positive contribution to Fund performance. Pennsylvania officials consistently safeguarded the debt service payments on their general obligation bonds this reporting period, while working to resolve their ongoing budget challenges.
The Fund was also invested in securities used to finance marine and aviation facilities this reporting period. Many of these securities are high-grade investments that are backed by the valuable collateral of the terminals, maintenance facilities and other on-site projects whose construction they finance. At the end of the reporting period, 3.9% of the Fund’s total assets were invested in this sector, which contributed positively to Fund performance.
The Resource Recovery sector, with 1.5% of the Fund’s total assets as of July 31, 2012, also was a positive contributor to the Fund’s total return this reporting period. The contribution to total return was diminished this reporting period because North Hampton Generating, which is now in bankruptcy, stopped making payments on its debt. The Fund is committed to pursuing legal remedies on behalf of its shareholders.
Holdings in the Energy Equipment and Services sector totaled 0.3% of the Fund’s total assets at the end of this reporting period. The sector failed to contribute positively to performance primarily because Bional, a company that has a productive ethanol plant, still has not received payment on a sizable contract from a third party that now believes it can purchase ethanol at a lower-than-contracted price. Lacking payment from this third party, Bional has not been able to make payments on the bonds this Fund owns. The Fund has made some progress in its pursuit of legal remedies, but the situation remained unresolved as of July 31, 2012.
During this reporting period, the Fund remained invested in municipal inverse-floating rate securities, which are tax-exempt securities with interest payments that move inversely to changes in short-term interest rates. “Inverse floaters” generally offer higher tax-free yields than fixed-rate bonds of comparable maturity and credit quality, but they face greater price volatility, too. In periods of low short-term interest rates, inverse floaters generally offer very attractive levels of tax-free income. These securities contributed positively to the Fund’s total return this reporting period.
Our approach to municipal bond investing is flexible and responsive to market conditions. Shareholders should note that market conditions during this reporting period did not affect the Fund’s overall investment objectives or cause it to pay any capital gain distributions. In closing, we believe that the Fund’s structure and sector composition—as well as our time-tested strategies—will continue to benefit long-term investors through interest rate and economic cycles.
Comparing the Fund’s Performance to the Market. The graphs that follow show the performance of a hypothetical $10,000 investment in each class of shares of the Fund held until July 31, 2012. In the case of Class A, Class B and Class C shares, performance is
| | | | |
| 13 | | | | OPPENHEIMER PENNSYLVANIA MUNICIPAL FUND |
FUND PERFORMANCE DISCUSSION
measured over a ten-year period. In the case of Class Y shares, performance is measured from inception of the Class on November 29, 2010. The Fund’s performance reflects the deduction of the maximum initial sales charge on Class A shares, the applicable contingent deferred sales charge on Class B and Class C shares, and reinvestments of all dividends and capital gains distributions. Past performance cannot guarantee future results.
The Fund’s performance is compared to the performance of the Barclays Capital Municipal Bond Index, an unmanaged index of a broad range of investment grade municipal bonds that is widely regarded as a measure of the performance of the general municipal bond market. Index performance reflects the reinvestment of income but does not consider the effect of transaction costs, and none of the data in the graphs shows the effect of taxes. The Fund’s performance is also compared to the Consumer Price Index, a non-securities index that measures changes in the inflation rate. The Fund’s performance reflects the effects of the Fund’s business and operating expenses. While index comparisons may be useful to provide a benchmark for the Fund’s performance, it must be noted that the Fund’s investments are not limited to the investments comprising the indices.
| | | | |
| 14 | | | | OPPENHEIMER PENNSYLVANIA MUNICIPAL FUND |
Class A Shares
Comparison of Change in Value of $10,000 Hypothetical Investments in:
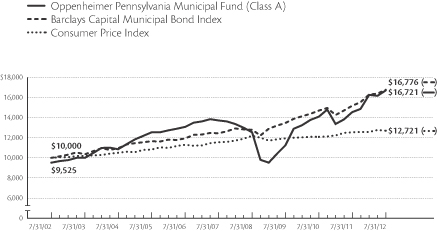
Average Annual Total Returns of Class A Shares With Sales Charge of the Fund at 7/31/12
1-Year 9.39% 5-Year 3.01% 10-Year 5.28%
The performance data quoted represents past performance, which does not guarantee future results. The investment return and principal value of an investment in the Fund will fluctuate so that an investor’s shares, when redeemed, may be worth more or less than their original cost. Current performance may be lower or higher than the performance quoted. Returns do not consider capital gains or income taxes on an individual’s investment. For performance data current to the most recent month-end, visit oppenheimerfunds.com or call 1.800.CALL OPP (225.5677). Fund returns include changes in share price, reinvested distributions, and the applicable sales charge for Class A shares, the current maximum initial sales charge of 4.75%; for Class B shares, and the contingent deferred sales charge of 5% (1-year) and 2% (5-year); and for Class C shares, the 1% contingent deferred sales charge for the 1-year period. There is no sales charge for Class Y shares. Because Class B shares convert to Class A shares 72 months after purchase, the 10-year return for Class B shares uses Class A performance for the period after conversion. See page 19 for further information.
| | | | |
| 15 | | | | OPPENHEIMER PENNSYLVANIA MUNICIPAL FUND |
FUND PERFORMANCE DISCUSSION
Class B Shares
Comparison of Change in Value of $10,000 Hypothetical Investments in:
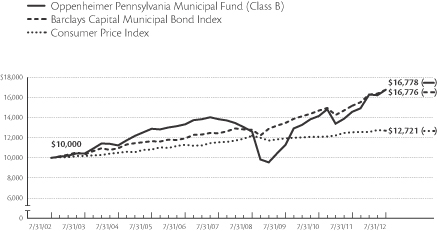
Average Annual Total Returns of Class B Shares With Sales Charge of the Fund at 7/31/12
1-Year 9.02% 5-Year 2.87% 10-Year 5.30%
| | | | |
| 16 | | | | OPPENHEIMER PENNSYLVANIA MUNICIPAL FUND |
Class C Shares
Comparison of Change in Value of $10,000 Hypothetical Investments in:
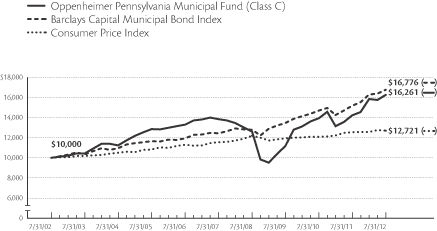
Average Annual Total Returns of Class C Shares With Sales Charge of the Fund at 7/31/12
1-Year 13.01% 5-Year 3.23% 10-Year 4.98%
The performance data quoted represents past performance, which does not guarantee future results. The investment return and principal value of an investment in the Fund will fluctuate so that an investor’s shares, when redeemed, may be worth more or less than their original cost. Current performance may be lower or higher than the performance quoted. Returns do not consider capital gains or income taxes on an individual’s investment. For performance data current to the most recent month-end, visit oppenheimerfunds.com or call 1.800.CALL OPP (225.5677). Fund returns include changes in share price, reinvested distributions, and the applicable sales charge for Class A shares, the current maximum initial sales charge of 4.75%; for Class B shares, and the contingent deferred sales charge of 5% (1-year) and 2% (5-year); and for Class C shares, the 1% contingent deferred sales charge for the 1-year period. There is no sales charge for Class Y shares. Because Class B shares convert to Class A shares 72 months after purchase, the 10-year return for Class B shares uses Class A performance for the period after conversion. See page 19 for further information.
| | | | |
| 17 | | | | OPPENHEIMER PENNSYLVANIA MUNICIPAL FUND |
FUND PERFORMANCE DISCUSSION
Class Y Shares
Comparison of Change in Value of $10,000 Hypothetical Investments in:
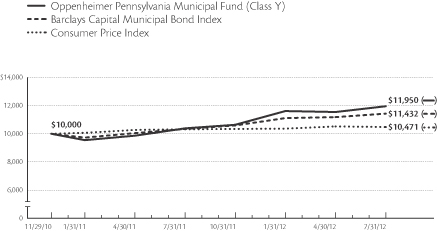
Average Annual Total Returns of Class Y Shares of the Fund at 7/31/12
1-Year 15.09% Since Inception (11/29/10) 11.18%
The performance data quoted represents past performance, which does not guarantee future results. The investment return and principal value of an investment in the Fund will fluctuate so that an investor’s shares, when redeemed, may be worth more or less than their original cost. Current performance may be lower or higher than the performance quoted. Returns do not consider capital gains or income taxes on an individual’s investment. For performance data current to the most recent month-end, visit oppenheimerfunds.com or call 1.800.CALL OPP (225.5677). Fund returns include changes in share price, reinvested distributions, and the applicable sales charge for Class A shares, the current maximum initial sales charge of 4.75%; for Class B shares, and the contingent deferred sales charge of 5% (1-year) and 2% (5-year); and for Class C shares, the 1% contingent deferred sales charge for the 1-year period. There is no sales charge for Class Y shares. Because Class B shares convert to Class A shares 72 months after purchase, the 10-year return for Class B shares uses Class A performance for the period after conversion. See page 19 for further information.
| | | | |
| 18 | | | | OPPENHEIMER PENNSYLVANIA MUNICIPAL FUND |
NOTES
Total returns and the ending account values in the graphs include changes in share price and reinvestment of dividends and capital gains distributions in a hypothetical investment for the periods shown. Cumulative total returns are not annualized. The Fund’s total returns shown do not reflect the deduction of income taxes on an individual’s investment. Taxes may reduce your actual investment returns on income or gains paid by the Fund or any gains you may realize if you sell your shares. This annual report must be preceded or accompanied by the current prospectus of Oppenheimer Pennsylvania Municipal Fund. Before investing in any of the Oppenheimer funds, investors should carefully consider a fund’s investment objectives, risks, charges and expenses. Fund prospectuses and summary prospectuses contain this and other information about the funds, and may be obtained by asking your financial advisor, visiting oppenheimerfunds.com, or calling 1.800.CALL OPP (225.5677). Read prospectuses and summary prospectuses carefully before investing.
The Fund’s investment strategy and focus can change over time. The mention of specific fund holdings does not constitute a recommendation by OppenheimerFunds, Inc.
Class A shares of the Fund were first publicly offered on 9/18/89. Unless otherwise noted, Class A returns include the current maximum initial sales charge of 4.75%.
Class B shares of the Fund were first publicly offered on 5/3/93. Unless otherwise noted, Class B returns include the applicable contingent deferred sales charge of 5% (1-year) and 2% (5-year). Because Class B shares convert to Class A shares 72 months after purchase, the 10-year return for Class B shares uses Class A performance for the period after conversion. Class B shares are subject to an annual 0.75% asset-based sales charge.
Class C shares of the Fund were first publicly offered on 8/29/95. Unless otherwise noted, Class C returns include the applicable 1% contingent deferred sales charge for the 1-year period. Class C shares are subject to an annual 0.75% asset-based sales charge.
Class Y shares of the Fund were first publicly offered on 11/29/10. Class Y shares are offered only to fee-based clients of dealers that have a special agreement with the Distributor, to certain institutional investors under a special agreement with the Distributor, and to present or former officers, directors, trustees and employees (and their eligible family members) of the Fund, the Manager, its affiliates, its parent company and the subsidiaries of its parent company, and retirement plans established for the benefit of such individuals. There is no sales charge for Class Y shares.
| | | | |
| 19 | | | | OPPENHEIMER PENNSYLVANIA MUNICIPAL FUND |
FUND EXPENSE
Fund Expenses. As a shareholder of the Fund, you incur two types of costs: (1) transaction costs, which may include sales charges (loads) on purchase payments, contingent deferred sales charges on redemptions and (2) ongoing costs, including management fees; distribution and service fees; and other Fund expenses. These examples are intended to help you understand your ongoing costs (in dollars) of investing in the Fund and to compare these costs with the ongoing costs of investing in other mutual funds.
The examples are based on an investment of $1,000.00 invested at the beginning of the period and held for the entire 6-month period ended July 31, 2012.
Actual Expenses. The first section of the table provides information about actual account values and actual expenses. You may use the information in this section for the class of shares you hold, together with the amount you invested, to estimate the expense that you paid over the period. Simply divide your account value by $1,000.00 (for example, an $8,600.00 account value divided by $1,000.00 = 8.60), then multiply the result by the number in the first section under the heading entitled “Expenses Paid During Period” to estimate the expenses you paid on your account during this period.
Hypothetical Example for Comparison Purposes. The second section of the table provides information about hypothetical account values and hypothetical expenses based on the Fund’s actual expense ratio for each class of shares, and an assumed rate of return of 5% per year for each class before expenses, which is not the actual return. The hypothetical account values and expenses may not be used to estimate the actual ending account balance or expenses you paid for the period. You may use this information to compare the ongoing costs of investing in the Fund and other funds. To do so, compare this 5% hypothetical example for the class of shares you hold with the 5% hypothetical examples that appear in the shareholder reports of the other funds.
Please note that the expenses shown in the table are meant to highlight your ongoing costs only and do not reflect any transactional costs, such as front-end or contingent deferred sales charges (loads), or a $12.00 fee imposed annually on accounts valued at less than $500.00 (subject to exceptions described in the Statement of Additional Information). Therefore, the “hypothetical” section of the table is useful in comparing ongoing costs only, and will not help you determine the relative total costs of owning different funds. In addition, if these transactional costs were included, your costs would have been higher.
| | | | |
| 20 | | | | OPPENHEIMER PENNSYLVANIA MUNICIPAL FUND |
| | | | | | | | | | | | |
| Actual | | Beginning
Account
Value
February 1, 2012 | | | Ending
Account
Value
July 31, 2012 | | | Expenses
Paid During
6 Months Ended
July 31, 2012 | |
| Class A | | $ | 1,000.00 | | | $ | 1,026.90 | | | $ | 4.85 | |
| Class B | | | 1,000.00 | | | | 1,023.80 | | | | 8.89 | |
| Class C | | | 1,000.00 | | | | 1,023.10 | | | | 8.69 | |
| Class Y | | | 1,000.00 | | | | 1,028.60 | | | | 4.09 | |
| | | |
Hypothetical
(5% return before expenses) | | | | | | | | | |
| Class A | | | 1,000.00 | | | | 1,020.09 | | | | 4.83 | |
| Class B | | | 1,000.00 | | | | 1,016.11 | | | | 8.86 | |
| Class C | | | 1,000.00 | | | | 1,016.31 | | | | 8.66 | |
| Class Y | | | 1,000.00 | | | | 1,020.84 | | | | 4.08 | |
Expenses are equal to the Fund’s annualized expense ratio for that class, multiplied by the average account value over the period, multiplied by 182/366 (to reflect the one-half year period). Those annualized expense ratios based on the 6-month period ended July 31, 2012 are as follows:
| | | | |
| Class | | Expense Ratios | |
| Class A | | | 0.96 | % |
| Class B | | | 1.76 | |
| Class C | | | 1.72 | |
| Class Y | | | 0.81 | |
The expense ratios reflect voluntary waivers and/or reimbursements of expenses by the Fund’s Manager. Some of these undertakings may be modified or terminated at any time, as indicated in the Fund’s prospectus. The “Financial Highlights” tables in the Fund’s financial statements, included in this report, also show the gross expense ratios, without such waivers or reimbursements and reduction to custodian expenses, if applicable.
| | | | |
| 21 | | | | OPPENHEIMER PENNSYLVANIA MUNICIPAL FUND |
STATEMENT OF INVESTMENTS July 31, 2012
| | | | | | | | | | | | | | | | |
Principal
Amount | | | | | Coupon | | | Maturity | | | Value | |
| | | | | | | | | | | | | | | | | |
| | Municipal Bonds and Notes—113.2% | | | | | | | | | | | | |
| | Pennsylvania—86.2% | | | | | | | | | | | | |
| | $ 24,750,000 | | | Allegheny County, PA GO1 | | | 0.862 | %2 | | | 11/01/2026 | | | $ | 20,856,330 | |
| | 130,000 | | | Allegheny County, PA HDA (Catholic Health East)1 | | | 5.375 | | | | 11/15/2022 | | | | 130,857 | |
| | 75,000 | | | Allegheny County, PA HDA (Catholic Health East)1 | | | 5.500 | | | | 11/15/2032 | | | | 75,400 | |
| | 80,000 | | | Allegheny County, PA HDA (Jefferson Regional Medical Center)1 | | | 5.125 | | | | 05/01/2025 | | | | 80,022 | |
| | 25,000 | | | Allegheny County, PA HDA (Jefferson Regional Medical Center)1 | | | 5.125 | | | | 05/01/2029 | | | | 25,003 | |
| | 3,150,000 | | | Allegheny County, PA HDA (Ohio Valley General Hospital)1 | | | 5.125 | | | | 04/01/2035 | | | | 2,997,761 | |
| | 35,000 | | | Allegheny County, PA HDA (UPMC Health System)1 | | | 5.375 | | | | 08/15/2029 | | | | 39,870 | |
| | 160,000 | | | Allegheny County, PA HDA (UPMC Health System)1 | | | 5.500 | | | | 08/15/2034 | | | | 181,571 | |
| | 1,310,000 | | | Allegheny County, PA HEBA (Carlow University)1 | | | 6.000 | | | | 11/01/2021 | | | | 1,439,546 | |
| | 1,125,000 | | | Allegheny County, PA HEBA (Carlow University)1 | | | 6.750 | | | | 11/01/2031 | | | | 1,256,456 | |
| | 8,000,000 | | | Allegheny County, PA HEBA (Chatham College)1 | | | 5.750 | | | | 11/15/2035 | | | | 8,127,040 | |
| | 1,000,000 | | | Allegheny County, PA HEBA (Chatham University)1 | | | 5.000 | | | | 09/01/2035 | | | | 1,071,550 | |
| | 2,250,000 | | | Allegheny County, PA HEBA (Robert Morris University)1 | | | 5.500 | | | | 10/15/2030 | | | | 2,438,910 | |
| | 3,650,000 | | | Allegheny County, PA HEBA (Robert Morris University)1 | | | 5.750 | | | | 10/15/2040 | | | | 3,971,638 | |
| | 2,500,000 | | | Allegheny County, PA HEBA (Robert Morris University)1 | | | 5.900 | | | | 10/15/2028 | | | | 2,680,500 | |
| | 15,000 | | | Allegheny County, PA HEBA (Robert Morris University)1 | | | 6.000 | | | | 05/01/2028 | | | | 17,426 | |
| | 2,000,000 | | | Allegheny County, PA HEBA (Robert Morris University)1 | | | 6.000 | | | | 10/15/2038 | | | | 2,125,120 | |
| | 3,095,000 | | | Allegheny County, PA HEBA (Waynesburg College)1 | | | 4.800 | | | | 05/01/2036 | | | | 3,129,695 | |
| | 10,000 | | | Allegheny County, PA IDA (ARC Allegheny Foundation) | | | 5.000 | | | | 12/01/2028 | | | | 7,939 | |
| | 1,200,000 | | | Allegheny County, PA IDA (Propel Charter School-East)1 | | | 6.375 | | | | 08/15/2035 | | | | 1,267,848 | |
| | 1,000,000 | | | Allegheny County, PA IDA (Propel Charter School-Montour)1 | | | 6.750 | | | | 08/15/2035 | | | | 1,083,160 | |
| | 1,000,000 | | | Allegheny County, PA IDA (RR/RRSW/RRDC Obligated Group)1 | | | 5.000 | | | | 09/01/2021 | | | | 1,020,670 | |
| | 1,225,000 | | | Allegheny County, PA IDA (RR/RRSW/RRDC Obligated Group)1 | | | 5.100 | | | | 09/01/2026 | | | | 1,227,634 | |
| | 1,245,000 | | | Allegheny County, PA IDA (RR/RRSW/RRDC Obligated Group)1 | | | 5.125 | | | | 09/01/2031 | | | | 1,227,807 | |
| | 465,000 | | | Allegheny County, PA IDA (School Facility Devel.)1 | | | 5.900 | | | | 08/15/2026 | | | | 490,840 | |
| | | | |
| 22 | | | | OPPENHEIMER PENNSYLVANIA MUNICIPAL FUND |
| | | | | | | | | | | | | | | | |
Principal
Amount | | | | | Coupon | | | Maturity | | | Value | |
| | Pennsylvania Continued | | | | | | | | | | | | |
| | $ 1,055,000 | | | Allegheny County, PA Redevel. Authority (Pittsburgh Mills) | | | 5.100 | % | | | 07/01/2014 | | | $ | 1,095,016 | |
| | 23,750,000 | | | Allegheny County, PA Redevel. Authority (Pittsburgh Mills) | | | 5.600 | | | | 07/01/2023 | | | | 24,514,018 | |
| | 245,000 | | | Allegheny County, PA Redevel. Authority (Robinson Mall) | | | 6.875 | | | | 11/01/2017 | | | | 245,025 | |
| | 70,000 | | | Allegheny County, PA Redevel. Authority (Robinson Mall)1 | | | 7.000 | | | | 11/01/2017 | | | | 70,014 | |
| | 1,710,000 | | | Allegheny County, PA Residential Finance Authority (Broadview Manor Apartments) | | | 5.950 | | | | 01/20/2043 | | | | 1,826,981 | |
| | 1,330,000 | | | Allegheny County, PA Residential Finance Authority (Independence House Apartments) | | | 6.100 | | | | 01/20/2043 | | | | 1,430,468 | |
| | 1,710,000 | | | Allegheny County, PA Residential Finance Authority (Versailles Apartments) | | | 6.160 | | | | 01/20/2043 | | | | 1,844,064 | |
| | 13,000,000 | | | Berks County, PA Municipal Authority (Reading Hospital & Medical Center)3 | | | 5.500 | | | | 11/01/2031 | | | | 15,052,440 | |
| | 1,750,000 | | | Bethlehem, PA GO1 | | | 6.500 | | | | 12/01/2032 | | | | 2,093,630 | |
| | 16,815 | | | Blair County, PA IDA (The Village at Penn State Retirement Community)4 | | | 6.400 | | | | 01/01/2012 | | | | 841 | |
| | 1,740,349 | | | Blair County, PA IDA (The Village at Penn State Retirement Community)4 | | | 6.900 | | | | 01/01/2022 | | | | 87,087 | |
| | 2,999,369 | | | Blair County, PA IDA (The Village at Penn State Retirement Community)4 | | | 7.000 | | | | 01/01/2034 | | | | 150,088 | |
| | 50,000 | | | Blair County, PA IDA (The Village at Penn State Retirement Community)4 | | | 10.000 | | | | 01/01/2012 | | | | 1 | |
| | 1,180,000 | | | Bonneauville Borough, PA Municipal Authority | | | 5.250 | | | | 06/01/2037 | | | | 1,228,710 | |
| | 2,000,000 | | | Bonneauville Borough, PA Municipal Authority | | | 5.300 | | | | 06/01/2043 | | | | 2,075,520 | |
| | 1,000,000 | | | Bucks County, PA IDA (Chandler Hall Health Care Facility) | | | 6.200 | | | | 05/01/2019 | | | | 1,000,440 | |
| | 10,000 | | | Bucks County, PA IDA (Chandler Hall Health Care Facility) | | | 6.300 | | | | 05/01/2029 | | | | 9,984 | |
| | 1,000,000 | | | Bucks County, PA IDA (Lutheran Community Telford Center) | | | 5.750 | | | | 01/01/2027 | | | | 1,023,580 | |
| | 2,000,000 | | | Butler County, PA Hospital Authority (Butler Health System)1 | | | 7.250 | | | | 07/01/2039 | | | | 2,406,020 | |
| | 480,000 | | | Butler County, PA IDA (Greenview Gardens Apartments)1 | | | 6.000 | | | | 07/01/2023 | | | | 491,808 | |
| | 880,000 | | | Butler County, PA IDA (Greenview Gardens Apartments)1 | | | 6.250 | | | | 07/01/2033 | | | | 896,799 | |
| | 100,000 | | | Cambridge, PA Area Joint Authority | | | 5.250 | | | | 12/01/2021 | | | | 100,172 | |
| | 2,865,000 | | | Cambridge, PA Area Joint Authority1 | | | 6.000 | | | | 12/01/2037 | | | | 3,210,118 | |
| | 30,000 | | | Carbondale, PA Hsg. Corp.1 | | | 8.125 | | | | 05/01/2019 | | | | 30,065 | |
| | 1,000,000 | | | Centre County, PA Hospital Authority (Mt. Nittany Medical Center)1 | | | 6.250 | | | | 11/15/2041 | | | | 1,161,690 | |
| | | | |
| 23 | | | | OPPENHEIMER PENNSYLVANIA MUNICIPAL FUND |
STATEMENT OF INVESTMENTS Continued
| | | | | | | | | | | | | | | | |
Principal
Amount | | | | | Coupon | | | Maturity | | | Value | |
| | Pennsylvania Continued | | | | | | | | | | | | |
| | $ 3,995,000 | | | Centre County, PA Hospital Authority (Mt. Nittany Medical Center)1 | | | 6.250 | % | | | 11/15/2044 | | | $ | 4,216,802 | |
| | 2,000,000 | | | Centre County, PA Hospital Authority (Mt. Nittany Medical Center)1 | | | 7.000 | | | | 11/15/2046 | | | | 2,423,960 | |
| | 30,000 | | | Charleroi, PA Area School Authority1 | | | 6.000 | | | | 10/01/2017 | | | | 30,118 | |
| | 5,000 | | | Chester County, PA H&EFA (Chester County Hospital) | | | 5.875 | | | | 07/01/2016 | | | | 5,020 | |
| | 2,330,000 | | | Chester County, PA H&EFA (Chester County Hospital)1 | | | 6.750 | | | | 07/01/2021 | | | | 2,333,588 | |
| | 8,750,000 | | | Chester County, PA H&EFA (Chester County Hospital)1 | | | 6.750 | | | | 07/01/2031 | | | | 8,759,013 | |
| | 23,915,000 | | | Chester County, PA IDA (Aqua Pennsylvania)3 | | | 5.000 | | | | 02/01/2041 | | | | 25,412,447 | |
| | 1,050,000 | | | Chester County, PA IDA (Collegium Charter School)1 | | | 5.000 | | | | 04/15/2022 | | | | 1,049,360 | |
| | 7,595,000 | | | Chester County, PA IDA (Collegium Charter School)1 | | | 5.500 | | | | 04/15/2031 | | | | 7,524,291 | |
| | 1,000,000 | | | Clairton, PA Municipal Authority5 | | | 5.000 | | | | 12/01/2037 | | | | 1,024,680 | |
| | 1,000,000 | | | Clairton, PA Municipal Authority5 | | | 5.000 | | | | 12/01/2042 | | | | 1,019,840 | |
| | 3,450,000 | | | Cumberland County, PA Municipal Authority (Asbury Atlantic) | | | 6.000 | | | | 01/01/2040 | | | | 3,650,480 | |
| | 1,000,000 | | | Cumberland County, PA Municipal Authority (Diakon Lutheran Ministries)1 | | | 5.000 | | | | 01/01/2027 | | | | 1,025,420 | |
| | 3,000,000 | | | Cumberland County, PA Municipal Authority (Diakon Lutheran Social Ministries)1 | | | 6.250 | | | | 01/01/2024 | | | | 3,369,540 | |
| | 1,000,000 | | | Cumberland County, PA Municipal Authority (Presbyterian Homes)1 | | | 5.000 | | | | 12/01/2020 | | | | 1,043,970 | |
| | 950,000 | | | Cumberland County, PA Municipal Authority (Presbyterian Homes)1 | | | 5.000 | | | | 12/01/2021 | | | | 985,901 | |
| | 6,605,000 | | | Delaware County, PA Authority (Cabrini College) | | | 5.500 | | | | 07/01/2024 | | | | 6,674,022 | |
| | 2,500,000 | | | Delaware County, PA Authority (CCMC/CKHS/DCMH Obligated Group)1 | | | 5.000 | | | | 12/15/2026 | | | | 2,520,350 | |
| | 5,900,000 | | | Delaware County, PA Authority (CCMC/CKHS/DCMH Obligated Group)1 | | | 5.000 | | | | 12/15/2031 | | | | 5,834,746 | |
| | 6,385,000 | | | Delaware County, PA Authority (Eastern University)1 | | | 5.000 | | | | 10/01/2027 | | | | 6,733,429 | |
| | 3,965,000 | | | Delaware County, PA Authority (Eastern University)1 | | | 5.250 | | | | 10/01/2032 | | | | 4,162,298 | |
| | 120,000 | | | Delaware County, PA Authority (MAS/MCMCSPA/MHH/MHP/MHSSPA Obligated Group) | | | 5.375 | | | | 11/15/2023 | | | | 121,117 | |
| | 1,160,000 | | | Delaware County, PA Authority (Neumann College)1 | | | 6.000 | | | | 10/01/2025 | | | | 1,284,271 | |
| | 280,000 | | | Delaware County, PA Authority (Neumann College)1 | | | 6.000 | | | | 10/01/2030 | | | | 304,576 | |
| | | | |
| 24 | | | | OPPENHEIMER PENNSYLVANIA MUNICIPAL FUND |
| | | | | | | | | | | | | | | | |
Principal
Amount | | | | | Coupon | | | Maturity | | | Value | |
| | Pennsylvania Continued | | | | | | | | | | | | |
| | $ 1,000,000 | | | Delaware County, PA Authority (Neumann College)1 | | | 6.125 | % | | | 10/01/2034 | | | $ | 1,084,350 | |
| | 1,200,000 | | | Delaware County, PA Authority (Neumann College)1 | | | 6.250 | | | | 10/01/2038 | | | | 1,328,556 | |
| | 1,150,000 | | | Delaware County, PA Authority (Neumann University)1 | | | 5.000 | | | | 10/01/2025 | | | | 1,247,313 | |
| | 1,250,000 | | | Delaware County, PA Authority (Neumann University)1 | | | 5.250 | | | | 10/01/2031 | | | | 1,365,613 | |
| | 18,705,000 | | | Delaware County, PA IDA (Aqua Pennsylvania)3 | | | 5.000 | | | | 11/01/2038 | | | | 19,591,018 | |
| | 4,345,000 | | | Delaware County, PA IDA (Naamans Creek) | | | 7.000 | | | | 12/01/2036 | | | | 4,590,449 | |
| | 65,000 | | | Delaware County, PA IDA (Philadelphia Suburban Water Company)1 | | | 5.350 | | | | 10/01/2031 | | | | 65,207 | |
| | 85,000 | | | Delaware River Port Authority PA/NJ1 | | | 5.000 | | | | 01/01/2026 | | | | 85,099 | |
| | 2,605,000 | | | Delaware River Port Authority PA/NJ1 | | | 5.625 | | | | 01/01/2026 | | | | 2,611,018 | |
| | 3,950,000 | | | Delaware River Port Authority PA/NJ1 | | | 5.700 | | | | 01/01/2022 | | | | 3,960,586 | |
| | 4,000,000 | | | Erie County, PA Hospital Authority (St. Vincent’s Health)1 | | | 7.000 | | | | 07/01/2027 | | | | 4,399,520 | |
| | 1,000,000 | | | Erie, PA Higher Education Building Authority (Gannon University)1 | | | 5.375 | | | | 05/01/2030 | | | | 1,098,830 | |
| | 2,565,000 | | | Erie, PA Higher Education Building Authority (Gannon University)1 | | | 5.500 | | | | 05/01/2040 | | | | 2,832,530 | |
| | 3,000,000 | | | Erie, PA Higher Education Building Authority (Mercyhurst College)1 | | | 5.500 | | | | 03/15/2038 | | | | 3,224,370 | |
| | 1,375,000 | | | Erie-Western PA Port Authority | | | 5.125 | | | | 06/15/2016 | | | | 1,524,545 | |
| | 4,750,000 | | | Fayette County, PA Redevel. Authority (Fayette Crossing) | | | 7.000 | | | | 09/01/2019 | | | | 5,047,778 | |
| | 425,000 | | | Harrisburg, PA Authority1 | | | 5.000 | | | | 07/15/2024 | | | | 425,094 | |
| | 165,000 | | | Harrisburg, PA GO | | | 9.510 | 6 | | | 09/15/2012 | | | | 163,680 | |
| | 125,000 | | | Harrisburg, PA GO | | | 9.600 | 6 | | | 09/15/2013 | | | | 115,963 | |
| | 10,000 | | | Harrisburg, PA GO | | | 9.600 | 6 | | | 09/15/2015 | | | | 8,067 | |
| | 40,000 | | | Harrisburg, PA GO | | | 9.600 | 6 | | | 03/15/2016 | | | | 31,068 | |
| | 225,000 | | | Harrisburg, PA GO | | | 9.601 | 6 | | | 03/15/2013 | | | | 215,831 | |
| | 210,000 | | | Harrisburg, PA GO | | | 9.601 | 6 | | | 03/15/2015 | | | | 175,333 | |
| | 50,000 | | | Harrisburg, PA GO | | | 9.614 | 6 | | | 09/15/2016 | | | | 37,503 | |
| | 25,000 | | | Harrisburg, PA GO | | | 9.624 | 6 | | | 03/15/2014 | | | | 22,395 | |
| | 70,000 | | | Harrisburg, PA GO | | | 9.727 | 6 | | | 09/15/2015 | | | | 56,468 | |
| | 150,000 | | | Harrisburg, PA GO | | | 10.084 | 6 | | | 03/15/2015 | | | | 125,238 | |
| | 115,000 | | | Harrisburg, PA GO | | | 10.366 | 6 | | | 03/15/2013 | | | | 110,314 | |
| | 50,000 | | | Harrisburg, PA GO | | | 11.012 | 6 | | | 09/15/2013 | | | | 46,385 | |
| | 2,205,000 | | | Harrisburg, PA Water System1 | | | 5.000 | | | | 07/15/2018 | | | | 2,223,720 | |
| | 5,055,000 | | | Harrisburg, PA Water System1 | | | 5.000 | | | | 07/15/2020 | | | | 5,100,748 | |
| | | | |
| 25 | | | | OPPENHEIMER PENNSYLVANIA MUNICIPAL FUND |
STATEMENT OF INVESTMENTS Continued
| | | | | | | | | | | | | | | | |
Principal
Amount | | | | | Coupon | | | Maturity | | | Value | |
| | Pennsylvania Continued | | | | | | | | | | | | |
| | $ 335,000 | | | Harrisburg, PA Water System1 | | | 5.000 | % | | | 07/15/2023 | | | $ | 337,298 | |
| | 6,815,000 | | | Horsham, PA Industrial and Commercial Devel. Authority (Pennsylvania LTC) | | | 6.000 | | | | 12/01/2037 | | | | 6,692,603 | |
| | 3,000,000 | | | Indiana County, PA IDA (Student Coop Association)1 | | | 5.000 | | | | 05/01/2033 | | | | 3,323,100 | |
| | 140,000 | | | Indiana County, PA IDA Pollution Control (PSEG Power LLC)1 | | | 5.850 | | | | 06/01/2027 | | | | 141,555 | |
| | 2,100,000 | | | Lackawanna County, PA GO1 | | | 6.000 | | | | 09/15/2032 | | | | 2,400,594 | |
| | 25,000 | | | Lancaster County, PA Hospital Authority (St. Anne’s Home for the Aged) | | | 6.500 | | | | 04/01/2015 | | | | 25,055 | |
| | 820,000 | | | Lancaster County, PA Hospital Authority (Willow Valley Retirement Communities)1 | | | 5.875 | | | | 06/01/2021 | | | | 835,432 | |
| | 90,000 | | | Latrobe, PA IDA (St. Vincent College)1 | | | 5.700 | | | | 05/01/2031 | | | | 90,554 | |
| | 13,260,000 | | | Lawrence County, PA IDA (Shenango Presbyterian Center) | | | 5.625 | | | | 11/15/2037 | | | | 12,774,286 | |
| | 1,020,000 | | | Lehigh County, PA GPA (Bible Fellowship Church Home) | | | 6.000 | | | | 12/15/2023 | | | | 1,020,500 | |
| | 1,060,000 | | | Lehigh County, PA GPA (Bible Fellowship Church Home) | | | 7.625 | | | | 11/01/2021 | | | | 1,083,182 | |
| | 750,000 | | | Lehigh County, PA GPA (Bible Fellowship Church Home) | | | 7.750 | | | | 11/01/2033 | | | | 766,020 | |
| | 410,000 | | | Lehigh County, PA GPA (Desales University) | | | 5.125 | | | | 12/15/2023 | | | | 417,565 | |
| | 445,000 | | | Lehigh County, PA GPA (Kidspeace Obligated Group) | | | 5.800 | | | | 11/01/2012 | | | | 280,306 | |
| | 8,190,000 | | | Lehigh County, PA GPA (Kidspeace Obligated Group) | | | 6.000 | | | | 11/01/2018 | | | | 3,930,381 | |
| | 2,000,000 | | | Lehigh County, PA GPA (Kidspeace Obligated Group) | | | 6.000 | | | | 11/01/2018 | | | | 959,800 | |
| | 1,100,000 | | | Lehigh County, PA GPA (Kidspeace Obligated Group) | | | 6.000 | | | | 11/01/2023 | | | | 527,890 | |
| | 3,600,000 | | | Lehigh County, PA GPA (Kidspeace Obligated Group) | | | 6.000 | | | | 11/01/2023 | | | | 1,727,640 | |
| | 4,700,000 | | | Lehigh Northampton, PA Airport Authority1 | | | 6.000 | | | | 05/15/2030 | | | | 4,703,666 | |
| | 10,000 | | | Luzerne County, PA Flood Protection Authority1 | | | 5.000 | | | | 01/15/2023 | | | | 10,009 | |
| | 5,000,000 | | | Luzerne County, PA IDA | | | 7.750 | | | | 12/15/2027 | | | | 5,258,850 | |
| | 105,000 | | | Luzerne County, PA IDA (Pennsylvania-American Water Company)1 | | | 5.100 | | | | 09/01/2034 | | | | 107,062 | |
| | 22,500,000 | | | Luzerne County, PA IDA (Pennsylvania-American Water)3 | | | 5.100 | | | | 09/01/2034 | | | | 23,136,750 | |
| | 10,000 | | | Luzerne County, PA IDA (Pennsylvania-American Water)1 | | | 5.100 | | | | 09/01/2034 | | | | 10,283 | |
| | 3,720,000 | | | Lycoming County, PA Authority (Pennsylvania College of Technology)1 | | | 5.000 | | | | 05/01/2032 | | | | 4,119,677 | |
| | | | |
| 26 | | | | OPPENHEIMER PENNSYLVANIA MUNICIPAL FUND |
| | | | | | | | | | | | | | | | |
Principal
Amount | | | | | Coupon | | | Maturity | | | Value | |
| | Pennsylvania Continued | | | | | | | | | | | | |
| | $ 2,730,000 | | | McKean County, PA Hospital Authority (Bradford Hospital) | | | 5.000 | % | | | 10/01/2020 | | | $ | 2,414,985 | |
| | 2,900,000 | | | McKean County, PA Hospital Authority (Bradford Hospital) | | | 5.250 | | | | 10/01/2030 | | | | 2,237,814 | |
| | 11,060,000 | | | Mifflin County, PA Hospital Authority (Lewiston Hospital/Lewiston Healthcare Foundation Obligated Group)1 | | | 5.125 | | | | 07/01/2030 | | | | 11,285,624 | |
| | 595,000 | | | Millcreek, PA Richland Joint Authority | | | 5.250 | | | | 08/01/2022 | | | | 648,366 | |
| | 855,000 | | | Millcreek, PA Richland Joint Authority | | | 5.375 | | | | 08/01/2027 | | | | 901,461 | |
| | 1,000,000 | | | Millcreek, PA Richland Joint Authority | | | 5.500 | | | | 08/01/2037 | | | | 1,042,060 | |
| | 1,390,000 | | | Millcreek, PA Richland Joint Authority | | | 5.500 | | | | 08/01/2037 | | | | 1,469,452 | |
| | 10,000 | | | Montgomery County, PA HEHA (Abington Memorial Hospital)1 | | | 5.000 | | | | 06/01/2028 | | | | 10,013 | |
| | 200,000 | | | Montgomery County, PA HEHA (Holy Redeemer Health System)1 | | | 5.250 | | | | 10/01/2023 | | | | 200,002 | |
| | 160,000 | | | Montgomery County, PA HEHA (Holy Redeemer Health System)1 | | | 5.250 | | | | 10/01/2027 | | | | 160,130 | |
| | 390,000 | | | Montgomery County, PA HEHA (Holy Redeemer Physician & Ambulatory Services)1 | | | 5.250 | | | | 10/01/2023 | | | | 390,004 | |
| | 21,000,000 | | | Montgomery County, PA IDA3 | | | 5.375 | | | | 08/01/2038 | | | | 24,161,340 | |
| | 1,500,000 | | | Montgomery County, PA IDA1 | | | 5.375 | | | | 08/01/2038 | | | | 1,725,810 | |
| | 270,000 | | | Montgomery County, PA IDA (Pennsylvania-American Water Company)1 | | | 5.050 | | | | 06/01/2029 | | | | 270,270 | |
| | 3,840,000 | | | Montgomery County, PA IDA (Wordsworth Academy) | | | 8.000 | | | | 09/01/2024 | | | | 3,848,026 | |
| | 3,000,000 | | | Northampton County, PA General Purpose Authority (Moravian College)1 | | | 5.000 | | | | 07/01/2027 | | | | 3,440,580 | |
| | 4,860,000 | | | Northampton County, PA General Purpose Authority (Moravian College)1 | | | 5.000 | | | | 07/01/2031 | | | | 5,446,748 | |
| | 15,000 | | | Northampton County, PA IDA (Moravian Hall Square) | | | 5.550 | | | | 07/01/2014 | | | | 15,044 | |
| | 40,000 | | | Northampton County, PA IDA (Moravian Hall Square) | | | 5.700 | | | | 07/01/2020 | | | | 40,067 | |
| | 5,385,000 | | | Northeastern, PA Hospital & Education Authority (Wilkes University)1 | | | 5.250 | | | | 03/01/2042 | | | | 5,733,086 | |
| | 1,205,000 | | | Northumberland County, PA IDA (NHS Youth Services) | | | 5.500 | | | | 02/15/2033 | | | | 684,958 | |
| | 1,660,000 | | | Northumberland County, PA IDA (NHS Youth Services) | | | 7.500 | | | | 02/15/2029 | | | | 940,556 | |
| | 3,520,000 | | | Northumberland County, PA IDA (NHS Youth Services) | | | 7.750 | | | | 02/15/2029 | | | | 1,993,869 | |
| | 16,000,000 | | | PA Commonwealth Financing Authority3 | | | 5.000 | | | | 06/01/2032 | | | | 18,022,240 | |
| | 1,550,000 | | | PA Commonwealth Financing Authority1 | | | 5.000 | | | | 06/01/2032 | | | | 1,745,905 | |
| | 50,000 | | | PA COP (Dept. of General Services)1 | | | 5.250 | | | | 05/01/2016 | | | | 50,158 | |
| | | | |
| 27 | | | | OPPENHEIMER PENNSYLVANIA MUNICIPAL FUND |
STATEMENT OF INVESTMENTS Continued
| | | | | | | | | | | | | | | | |
Principal
Amount | | | | | Coupon | | | Maturity | | | Value | |
| | Pennsylvania Continued | | | | | | | | | | | | |
| | $ 11,400,000 | | | PA EDFA (30th Street Garage)1 | | | 5.875 | % | | | 06/01/2033 | | | $ | 11,623,782 | |
| | 10,000,000 | | | PA EDFA (Albert Einstein Healthcare)1 | | | 6.250 | | | | 10/15/2023 | | | | 11,406,500 | |
| | 39,737,908 | | | PA EDFA (Bionol Clearfield)4 | | | 8.500 | | | | 07/15/2015 | | | | 3,965,048 | |
| | 885,000 | | | PA EDFA (DGABC/DGABF/DGABEI Obligated Group) | | | 5.625 | | | | 12/01/2015 | | | | 886,947 | |
| | 590,000 | | | PA EDFA (Fayette Thermal) | | | 5.250 | | | | 12/01/2016 | | | | 552,836 | |
| | 35,000 | | | PA EDFA (Fayette Thermal) | | | 5.500 | | | | 12/01/2021 | | | | 33,093 | |
| | 3,000,000 | | | PA EDFA (Forum)1 | | | 5.000 | | | | 03/01/2029 | | | | 3,388,380 | |
| | 12,500,000 | | | PA EDFA (Forum)1 | | | 5.000 | | | | 03/01/2034 | | | | 13,988,000 | |
| | 14,700,000 | | | PA EDFA (National Gypsum Company) | | | 6.125 | | | | 11/01/2027 | | | | 14,336,175 | |
| | 5,000,000 | | | PA EDFA (National Gypsum Company) | | | 6.250 | | | | 11/01/2027 | | | | 4,936,600 | |
| | 1,800,000 | | | PA EDFA (Northampton Generating)4 | | | 6.500 | | | | 01/01/2013 | | | | 1,137,222 | |
| | 21,800,000 | | | PA EDFA (Northampton Generating)4 | | | 6.600 | | | | 01/01/2019 | | | | 13,962,464 | |
| | 500,000 | | | PA EDFA (Northampton Generating)4 | | | 6.875 | | | | 01/01/2011 | | | | 98,245 | |
| | 12,000,000 | | | PA EDFA (Northampton Generating)4 | | | 6.950 | | | | 01/01/2021 | | | | 2,402,760 | |
| | 120,000 | | | PA EDFA (Northwestern Human Services)1 | | | 5.125 | | | | 06/01/2018 | | | | 120,041 | |
| | 3,000,000 | | | PA EDFA (Northwestern Human Services)1 | | | 5.250 | | | | 06/01/2028 | | | | 2,921,160 | |
| | 3,000,000 | | | PA EDFA (Philadelphia Biosolids Facility)1 | | | 6.250 | | | | 01/01/2032 | | | | 3,353,880 | |
| | 3,000,000 | | | PA EDFA (US Airways Group) | | | 8.000 | | | | 05/01/2029 | | | | 3,473,850 | |
| | 50,000 | | | PA EDFA (York Water Company)1 | | | 6.000 | | | | 11/01/2038 | | | | 51,213 | |
| | 30,000,000 | | | PA Geisinger Authority Health System, Series A3 | | | 5.250 | | | | 06/01/2039 | | | | 33,444,600 | |
| | 3,185,000 | | | PA HEFA (Allegheny Delaware Valley Obligated Group)1 | | | 5.875 | | | | 11/15/2021 | | | | 3,186,879 | |
| | 1,025,000 | | | PA HEFA (Assoc. of Independent Colleges & Universities)1 | | | 5.125 | | | | 05/01/2032 | | | | 1,065,149 | |
| | 100,000 | | | PA HEFA (California University of Pennsylvania Student Assoc.) | | | 5.000 | | | | 07/01/2028 | | | | 90,117 | |
| | 230,000 | | | PA HEFA (California University of Pennsylvania Student Assoc.)1 | | | 6.750 | | | | 09/01/2020 | | | | 230,497 | |
| | 115,000 | | | PA HEFA (California University of Pennsylvania Student Assoc.)1 | | | 6.750 | | | | 09/01/2032 | | | | 115,190 | |
| | 55,000 | | | PA HEFA (California University of Pennsylvania Student Assoc.)1 | | | 6.800 | | | | 09/01/2025 | | | | 55,098 | |
| | 875,000 | | | PA HEFA (College of Science & Agriculture) | | | 5.350 | | | | 04/15/2028 | | | | 875,359 | |
| | 1,460,000 | | | PA HEFA (Delaware Valley College of Science & Agriculture)1 | | | 5.650 | | | | 04/15/2025 | | | | 1,478,542 | |
| | 220,000 | | | PA HEFA (Delaware Valley College of Science & Agriculture)1 | | | 5.750 | | | | 04/15/2034 | | | | 224,077 | |
| | 3,210,000 | | | PA HEFA (Delaware Valley College of Science & Agriculture)1 | | | 5.800 | | | | 04/15/2030 | | | | 3,255,935 | |
| | 3,385,000 | | | PA HEFA (Delaware Valley College of Science & Agriculture)1 | | | 5.800 | | | | 04/15/2033 | | | | 3,426,805 | |
| | | | |
| 28 | | | | OPPENHEIMER PENNSYLVANIA MUNICIPAL FUND |
| | | | | | | | | | | | | | | | |
Principal
Amount | | | | | Coupon | | | Maturity | | | Value | |
| | Pennsylvania Continued | | | | | | | | | | | | |
| | $ 6,285,000 | | | PA HEFA (Edinboro University Foundation)1 | | | 5.750 | % | | | 07/01/2028 | | | $ | 6,862,592 | |
| | 3,000,000 | | | PA HEFA (Edinboro University Foundation)1 | | | 5.800 | | | | 07/01/2030 | | | | 3,333,120 | |
| | 9,000,000 | | | PA HEFA (Edinboro University Foundation)1 | | | 5.875 | | | | 07/01/2038 | | | | 9,821,520 | |
| | 8,225,000 | | | PA HEFA (Edinboro University Foundation)1 | | | 6.000 | | | | 07/01/2042 | | | | 9,020,193 | |
| | 3,500,000 | | | PA HEFA (Edinboro University Foundation)1 | | | 6.000 | | | | 07/01/2043 | | | | 3,932,985 | |
| | 4,000,000 | | | PA HEFA (Elizabethtown College)1 | | | 5.000 | | | | 12/15/2027 | | | | 4,168,240 | |
| | 130,000 | | | PA HEFA (Frontier II) | | | 5.125 | | | | 04/01/2033 | | | | 130,114 | |
| | 1,300,000 | | | PA HEFA (Gwynedd Mercy College)1 | | | 5.375 | | | | 05/01/2042 | | | | 1,357,564 | |
| | 750,000 | | | PA HEFA (Indiana University Foundation)1 | | | 5.000 | | | | 07/01/2041 | | | | 785,513 | |
| | 2,000,000 | | | PA HEFA (La Salle University)1 | | | 5.000 | | | | 05/01/2037 | | | | 2,091,340 | |
| | 50,000 | | | PA HEFA (La Salle University)1 | | | 5.500 | | | | 05/01/2034 | | | | 50,890 | |
| | 1,490,000 | | | PA HEFA (Marywood University)1 | | | 5.125 | | | | 06/01/2029 | | | | 1,533,076 | |
| | 60,000 | | | PA HEFA (MCP/HUHS/AUS Obligated Group)1 | | | 5.875 | | | | 11/15/2016 | | | | 60,057 | |
| | 30,085,000 | | | PA HEFA (MCP/HUHS/AUS Obligated Group) | | | 5.875 | | | | 11/15/2016 | | | | 30,113,581 | |
| | 9,785,000 | | | PA HEFA (MCP/HUHS/AUS Obligated Group)1 | | | 5.875 | | | | 11/15/2021 | | | | 9,790,773 | |
| | 250,000 | | | PA HEFA (Philadelphia University)1 | | | 5.000 | | | | 06/01/2035 | | | | 254,165 | |
| | 3,000,000 | | | PA HEFA (Philadelphia University)1 | | | 5.125 | | | | 06/01/2025 | | | | 3,057,870 | |
| | 2,000,000 | | | PA HEFA (Philadelphia University)1 | | | 5.250 | | | | 06/01/2032 | | | | 2,027,040 | |
| | 2,005,000 | | | PA HEFA (Philadelphia University)1 | | | 5.500 | | | | 06/01/2020 | | | | 2,155,034 | |
| | 170,000 | | | PA HEFA (SCHS/MCP/HUHS Obligated Group)1 | | | 5.875 | | | | 11/15/2016 | | | | 170,162 | |
| | 3,000,000 | | | PA HEFA (Shippensburg University)1 | | | 6.000 | | | | 10/01/2031 | | | | 3,325,230 | |
| | 7,000,000 | | | PA HEFA (Shippensburg University)1 | | | 6.250 | | | | 10/01/2043 | | | | 7,844,270 | |
| | 105,000 | | | PA HEFA (St. Francis University)1 | | | 5.750 | | | | 11/01/2023 | | | | 106,468 | |
| | 1,750,000 | | | PA HEFA (St. Francis University)1 | | | 6.000 | | | | 11/01/2031 | | | | 1,912,068 | |
| | 3,925,000 | | | PA HEFA (St. Francis University)1 | | | 6.250 | | | | 11/01/2018 | | | | 4,019,671 | |
| | 2,250,000 | | | PA HEFA (St. Francis University)1 | | | 6.250 | | | | 11/01/2041 | | | | 2,466,540 | |
| | 3,000,000 | | | PA HEFA (State System Higher Education)1 | | | 5.000 | | | | 06/15/2030 | | | | 3,563,190 | |
| | 4,615,000 | | | PA HEFA (University of Pennsylvania Health System)1 | | | 5.750 | | | | 08/15/2041 | | | | 5,423,363 | |
| | 60,000 | | | PA HEFA (University of the Arts) | | | 5.500 | | | | 03/15/2020 | | | | 60,062 | |
| | 3,000,000 | | | PA HEFA (University of the Arts) | | | 5.625 | | | | 03/15/2025 | | | | 3,001,710 | |
| | 1,670,000 | | | PA HEFA (University of the Arts) | | | 5.750 | | | | 03/15/2030 | | | | 1,670,635 | |
| | 270,000 | | | PA HEFA (UPMC Health System)1 | | | 5.000 | | | | 08/01/2029 | | | | 270,381 | |
| | 1,000,000 | | | PA HEFA (Ursinus College)1 | | | 5.000 | | | | 01/01/2029 | | | | 1,119,000 | |
| | 650,000 | | | PA HEFA (Widener University)1 | | | 5.000 | | | | 07/15/2026 | | | | 678,067 | |
| | 100,000 | | | PA HEFA (Widener University)1 | | | 5.250 | | | | 07/15/2024 | | | | 102,999 | |
| | 155,000 | | | PA HEFA (Widener University)1 | | | 5.400 | | | | 07/15/2036 | | | | 160,244 | |
| | 10,030,000 | | | PA HFA (Single Family Mtg.), Series 74B3 | | | 5.150 | | | | 10/01/2022 | | | | 10,126,188 | |
| | | | |
| 29 | | | | OPPENHEIMER PENNSYLVANIA MUNICIPAL FUND |
STATEMENT OF INVESTMENTS Continued
| | | | | | | | | | | | | | | | |
Principal
Amount | | | | | Coupon | | | Maturity | | | Value | |
| | Pennsylvania Continued | | | | | | | | | | | | |
| | $ 16,970,000 | | | PA HFA (Single Family Mtg.), Series 96A3 | | | 4.700 | % | | | 10/01/2037 | | | $ | 17,339,090 | |
| | 1,575,000 | | | PA HFA (Single Family Mtg.), Series 99A3 | | | 5.250 | | | | 10/01/2032 | | | | 1,596,257 | |
| | 5,000,000 | | | PA Public School Building Authority (Harrisburg Area Community College)1 | | | 5.000 | | | | 10/01/2031 | | | | 5,364,800 | |
| | 1,265,000 | | | PA Southcentral General Authority (Hanover Hospital)1 | | | 5.000 | | | | 12/01/2020 | | | | 1,321,432 | |
| | 1,400,000 | | | PA Southcentral General Authority (Hanover Hospital)1 | | | 5.000 | | | | 12/01/2023 | | | | 1,440,082 | |
| | 3,265,000 | | | PA Southcentral General Authority (Hanover Hospital)1 | | | 5.000 | | | | 12/01/2026 | | | | 3,317,338 | |
| | 900,000 | | | PA Southcentral General Authority (Hanover Hospital)1 | | | 5.000 | | | | 12/01/2027 | | | | 913,617 | |
| | 2,310,000 | | | PA Southcentral General Authority (Hanover Hospital)1 | | | 5.000 | | | | 12/01/2028 | | | | 2,340,608 | |
| | 1,470,000 | | | PA Southcentral General Authority (Hanover Hospital)1 | | | 5.000 | | | | 12/01/2030 | | | | 1,483,142 | |
| | 24,615,000 | | | PA Southcentral General Authority (Wellspan Health Obligated Group)3 | | | 6.000 | | | | 06/01/2029 | | | | 28,529,826 | |
| | 4,000,000 | | | PA Turnpike Commission1 | | | 0.000 | 7 | | | 12/01/2034 | | | | 3,844,560 | |
| | 15,775,000 | | | PA Turnpike Commission1 | | | 0.000 | 7 | | | 12/01/2034 | | | | 14,850,270 | |
| | 10,000,000 | | | PA Turnpike Commission1 | | | 0.000 | 7 | | | 12/01/2038 | | | | 9,469,100 | |
| | 2,095,000 | | | PA Turnpike Commission1 | | | 5.000 | | | | 12/01/2030 | | | | 2,434,725 | |
| | 1,500,000 | | | PA Turnpike Commission1 | | | 5.000 | | | | 12/01/2032 | | | | 1,698,825 | |
| | 18,000,000 | | | PA Turnpike Commission (Motor License)3 | | | 5.000 | | | | 12/01/2040 | | | | 20,094,660 | |
| | 2,000,000 | | | PA West Shore Area Hospital Authority (Holy Spirit Hospital of the Sisters of Christian Charity)1 | | | 5.625 | | | | 01/01/2032 | | | | 2,245,340 | |
| | 7,625,000 | | | PA West Shore Area Hospital Authority (Holy Spirit Hospital of the Sisters of Christian Charity)1 | | | 6.000 | | | | 01/01/2028 | | | | 9,085,416 | |
| | 1,835,000 | | | PA West Shore Area Hospital Authority (Holy Spirit Hospital of the Sisters of Christian Charity)1 | | | 6.500 | | | | 01/01/2041 | | | | 2,149,299 | |
| | 10,000,000 | | | Philadelphia, PA Airport1 | | | 4.750 | | | | 06/15/2035 | | | | 10,107,800 | |
| | 5,000,000 | | | Philadelphia, PA Airport, Series D1 | | | 5.250 | | | | 06/15/2028 | | | | 5,501,550 | |
| | 5,935,000 | | | Philadelphia, PA Authority for Industrial Devel. (Aero Philadelphia) | | | 5.500 | | | | 01/01/2024 | | | | 4,746,041 | |
| | 3,870,000 | | | Philadelphia, PA Authority for Industrial Devel. (Air Cargo)1 | | | 7.500 | | | | 01/01/2025 | | | | 3,871,780 | |
| | 1,150,000 | | | Philadelphia, PA Authority for Industrial Devel. (Baptist Home of Philadelphia)8 | | | 5.500 | | | | 11/15/2018 | | | | 664,068 | |
| | 786,000 | | | Philadelphia, PA Authority for Industrial Devel. (Baptist Home of Philadelphia)4 | | | 5.600 | | | | 11/15/2028 | | | | 279,077 | |
| | 450,000 | | | Philadelphia, PA Authority for Industrial Devel. (Cathedral Village)1 | | | 6.750 | | | | 04/01/2023 | | | | 460,863 | |
| | | | |
| 30 | | | | OPPENHEIMER PENNSYLVANIA MUNICIPAL FUND |
| | | | | | | | | | | | | | | | |
Principal
Amount | | | | | Coupon | | | Maturity | | | Value | |
| | Pennsylvania Continued | | | | | | | | | | | | |
| | $ 2,600,000 | | | Philadelphia, PA Authority for Industrial Devel. (Cathedral Village)1 | | | 6.875 | % | | | 04/01/2034 | | | $ | 2,654,756 | |
| | 450,000 | | | Philadelphia, PA Authority for Industrial Devel. (Discovery Charter School)1 | | | 5.875 | | | | 04/01/2032 | | | | 474,561 | |
| | 500,000 | | | Philadelphia, PA Authority for Industrial Devel. (Discovery Charter School)1 | | | 6.250 | | | | 04/01/2042 | | | | 534,355 | |
| | 1,000,000 | | | Philadelphia, PA Authority for Industrial Devel. (Global Leadership Academy)1 | | | 5.750 | | | | 11/15/2030 | | | | 1,025,730 | |
| | 500,000 | | | Philadelphia, PA Authority for Industrial Devel. (Global Leadership Academy)1 | | | 6.375 | | | | 11/15/2040 | | | | 525,535 | |
| | 2,040,000 | | | Philadelphia, PA Authority for Industrial Devel. (International Apartments Temple University)1 | | | 5.375 | | | | 06/15/2030 | | | | 2,188,553 | |
| | 4,000,000 | | | Philadelphia, PA Authority for Industrial Devel. (International Apartments Temple University)1 | | | 5.625 | | | | 06/15/2042 | | | | 4,242,240 | |
| | 2,115,000 | | | Philadelphia, PA Authority for Industrial Devel. (Marina Bracetti Academy)1 | | | 7.150 | | | | 12/15/2036 | | | | 2,320,451 | |
| | 1,000,000 | | | Philadelphia, PA Authority for Industrial Devel. (Marina Bracetti Academy)1 | | | 7.625 | | | | 12/15/2041 | | | | 1,129,420 | |
| | 1,500,000 | | | Philadelphia, PA Authority for Industrial Devel. (New Foundation Charter School)1 | | | 6.625 | | | | 12/15/2041 | | | | 1,633,410 | |
| | 1,640,000 | | | Philadelphia, PA Authority for Industrial Devel. (Richard Allen Prep Charter School)1 | | | 6.250 | | | | 05/01/2033 | | | | 1,673,768 | |
| | 810,000 | | | Philadelphia, PA Authority for Industrial Devel. (Stapeley Germantown) | | | 5.000 | | | | 01/01/2015 | | | | 791,807 | |
| | 1,580,000 | | | Philadelphia, PA Authority for Industrial Devel. (Stapeley Germantown) | | | 5.125 | | | | 01/01/2021 | | | | 1,388,362 | |
| | 2,105,000 | | | Philadelphia, PA Authority for Industrial Devel. Senior Living (Arbor House)1 | | | 6.100 | | | | 07/01/2033 | | | | 2,156,699 | |
| | 710,000 | | | Philadelphia, PA Authority for Industrial Devel. Senior Living (GIH/PPAM)1 | | | 5.125 | | | | 07/01/2016 | | | | 729,979 | |
| | 1,860,000 | | | Philadelphia, PA Authority for Industrial Devel. Senior Living (Miriam and Robert M. Rieder House)1 | | | 6.100 | | | | 07/01/2033 | | | | 1,905,682 | |
| | 3,000,000 | | | Philadelphia, PA Authority for Industrial Devel. Senior Living (Presbyterian Homes Germantown)1 | | | 5.625 | | | | 07/01/2035 | | | | 3,020,940 | |
| | 1,745,000 | | | Philadelphia, PA Authority for Industrial Devel. Senior Living (Robert Saligman House)1 | | | 6.100 | | | | 07/01/2033 | | | | 1,787,857 | |
| | 4,000,000 | | | Philadelphia, PA GO1 | | | 6.000 | | | | 08/01/2036 | | | | 4,712,360 | |
| | 6,260,000 | | | Philadelphia, PA GO1 | | | 6.500 | | | | 08/01/2041 | | | | 7,655,980 | |
| | 1,210,000 | | | Philadelphia, PA H&HEFA (Centralized Comprehensive Human Services) | | | 7.250 | | | | 01/01/2021 | | | | 1,237,612 | |
| | 10,000,000 | | | Philadelphia, PA H&HEFA (Temple University Health System)1 | | | 5.625 | | | | 07/01/2036 | | | | 10,503,500 | |
| | 5,000,000 | | | Philadelphia, PA H&HEFA (Temple University Health System)1 | | | 5.625 | | | | 07/01/2042 | | | | 5,239,750 | |
| | | | |
| 31 | | | | OPPENHEIMER PENNSYLVANIA MUNICIPAL FUND |
STATEMENT OF INVESTMENTS Continued
| | | | | | | | | | | | | | | | |
Principal
Amount | | | | | Coupon | | | Maturity | | | Value | |
| | Pennsylvania Continued | | | | | | | | | | | | |
| | $ 7,420,000 | | | Philadelphia, PA H&HEFA (Temple University Hospital)1 | | | 5.500 | % | | | 07/01/2026 | | | $ | 7,747,074 | |
| | 250,000 | | | Philadelphia, PA Hsg. Authority1 | | | 5.000 | | | | 12/01/2021 | | | | 254,948 | |
| | 1,000,000 | | | Philadelphia, PA Municipal Authority1 | | | 6.500 | | | | 04/01/2034 | | | | 1,164,350 | |
| | 20,000 | | | Philadelphia, PA Parking Authority, Series A1 | | | 5.250 | | | | 02/15/2029 | | | | 20,031 | |
| | 5,000 | | | Philadelphia, PA Redevel. Authority (Beech Student Hsg. Complex), Series A | | | 5.500 | | | | 07/01/2035 | | | | 4,708 | |
| | 1,000,000 | | | Philadelphia, PA Redevel. Authority (Beech Student Hsg. Complex), Series A | | | 5.625 | | | | 07/01/2023 | | | | 998,740 | |
| | 1,500,000 | | | Philadelphia, PA Redevel. Authority (Beech Student Hsg. Complex), Series A | | | 5.625 | | | | 07/01/2028 | | | | 1,471,350 | |
| | 140,000 | | | Philadelphia, PA Redevel. Authority (Multifamily Hsg.)1 | | | 5.450 | | | | 02/01/2023 | | | | 142,225 | |
| | 2,580,000 | | | Philadelphia, PA Redevel. Authority (Pavilion Apartments)1 | | | 6.000 | | | | 10/01/2023 | | | | 2,629,794 | |
| | 4,100,000 | | | Philadelphia, PA Redevel. Authority (Pavilion Apartments)1 | | | 6.250 | | | | 10/01/2032 | | | | 4,172,406 | |
| | 3,000,000 | | | Philadelphia, PA Redevel. Authority (Transformation Initiative)1 | | | 5.000 | | | | 04/15/2025 | | | | 3,453,810 | |
| | 2,645,000 | | | Philadelphia, PA Redevel. Authority (Transformation Initiative)1 | | | 5.000 | | | | 04/15/2026 | | | | 3,016,649 | |
| | 3,385,000 | | | Philadelphia, PA School District1 | | | 6.000 | | | | 09/01/2038 | | | | 3,851,927 | |
| | 2,000,000 | | | Pittsburgh, PA GO1 | | | 5.000 | | | | 09/01/2025 | | | | 2,328,360 | |
| | 2,910,000 | | | Pittsburgh, PA Urban Redevel. Authority (Marian Plaza) | | | 6.130 | | | | 01/20/2043 | | | | 3,141,287 | |
| | 20,000 | | | Pittsburgh, PA Urban Redevel. Authority, Series A1 | | | 5.200 | | | | 10/01/2020 | | | | 20,034 | |
| | 25,000 | | | Pittsburgh, PA Urban Redevel. Authority, Series A1 | | | 5.250 | | | | 10/01/2029 | | | | 25,028 | |
| | 40,000 | | | Pittsburgh, PA Urban Redevel. Authority, Series B1 | | | 5.350 | | | | 10/01/2022 | | | | 40,066 | |
| | 60,000 | | | Pittsburgh, PA Urban Redevel. Authority, Series C1 | | | 5.600 | | | | 04/01/2020 | | | | 60,120 | |
| | 10,000 | | | Pittsburgh, PA Urban Redevel. Authority, Series C1 | | | 5.700 | | | | 04/01/2030 | | | | 10,014 | |
| | 4,170,000 | | | Pottsville, PA Hospital Authority (Pottsville Hospital & Warne Clinic) | | | 5.625 | | | | 07/01/2024 | | | | 4,170,375 | |
| | 1,000,000 | | | Reading, PA Area Water Authority1 | | | 5.000 | | | | 12/01/2031 | | | | 1,118,930 | |
| | 3,000,000 | | | Reading, PA Area Water Authority1 | | | 5.250 | | | | 12/01/2036 | | | | 3,347,700 | |
| | 6,495,000 | | | Reading, PA GO1 | | | 5.625 | | | | 11/15/2020 | | | | 6,725,702 | |
| | 900,000 | | | Reading, PA Hsg. Auth (Goggle Works Apts.)1 | | | 5.625 | | | | 06/01/2042 | | | | 990,666 | |
| | 2,895,000 | | | Reading, PA Hsg. Auth (Goggle Works Apts.)1 | | | 5.875 | | | | 06/01/2052 | | | | 3,185,774 | |
| | 10,000 | | | Schuylkill County, PA IDA (DOCNHS/BSVHS/WMHS Obligated Group)1 | | | 5.000 | | | | 11/01/2028 | | | | 10,017 | |
| | 6,500,000 | | | Scranton, PA Parking Authority | | | 5.250 | | | | 06/01/2039 | | | | 6,011,850 | |
| | 1,000,000 | | | Scranton, PA Sewer Authority1 | | | 5.500 | | | | 12/01/2035 | | | | 1,134,580 | |
| | | | |
| 32 | | | | OPPENHEIMER PENNSYLVANIA MUNICIPAL FUND |
| | | | | | | | | | | | | | | | |
Principal
Amount | | | | | Coupon | | | Maturity | | | Value | |
| | Pennsylvania Continued | | | | | | | | | | | | |
| | $ 95,000 | | | Sharon, PA Regional Health System Authority (SRPS/SRHS Obligated Group)1 | | | 5.000 | % | | | 12/01/2018 | | | $ | 95,140 | |
| | 5,000 | | | Sharon, PA Regional Health System Authority (SRPS/SRHS Obligated Group)1 | | | 5.000 | | | | 12/01/2028 | | | | 5,002 | |
| | 2,000,000 | | | South Fork, PA Municipal Authority (Conemaugh Health System)1 | | | 5.500 | | | | 07/01/2029 | | | | 2,168,600 | |
| | 745,000 | | | South Fork, PA Municipal Authority (Conemaugh Valley Memorial Hospital)1 | | | 5.000 | | | | 07/01/2028 | | | | 745,328 | |
| | 355,000 | | | South Fork, PA Municipal Authority (Good Samaritan Medical Center of Johnstown)1 | | | 5.250 | | | | 07/01/2026 | | | | 355,280 | |
| | 5,000,000 | | | St. Mary Hospital Authority, PA Health System (Catholic Health East)1 | | | 5.250 | | | | 11/15/2023 | | | | 5,672,350 | |
| | 150,000 | | | Susquehanna, PA Area Regional Airport Authority1 | | | 5.000 | | | | 01/01/2028 | | | | 143,981 | |
| | 4,300,000 | | | Susquehanna, PA Area Regional Airport Authority1 | | | 6.500 | | | | 01/01/2038 | | | | 4,526,567 | |
| | 800,000 | | | Susquehanna, PA Area Regional Airport Authority (Aero Harrisburg) | | | 5.500 | | | | 01/01/2024 | | | | 689,968 | |
| | 75,000 | | | Washington County, PA Hospital Authority (Washington Hospital)1 | | | 5.125 | | | | 07/01/2028 | | | | 75,047 | |
| | 7,700,000 | | | Washington County, PA Redevel. Authority (Victory Centre) | | | 5.450 | | | | 07/01/2035 | | | | 7,896,196 | |
| | 550,000 | | | Washington, PA Township Municipal Authority | | | 5.875 | | | | 12/15/2023 | | | | 560,467 | |
| | 2,475,000 | | | Washington, PA Township Municipal Authority | | | 6.000 | | | | 12/15/2033 | | | | 2,522,075 | |
| | 1,285,000 | | | Westmoreland County, PA IDA (Redstone Retirement Community) | | | 5.875 | | | | 01/01/2032 | | | | 1,315,596 | |
| | 5,000,000 | | | Wilkes-Barre, PA Finance Authority (Wilkes University)1 | | | 5.000 | | | | 03/01/2027 | | | | 5,184,000 | |
| | 10,000,000 | | | Wilkes-Barre, PA Finance Authority (Wilkes University)1 | | | 5.000 | | | | 03/01/2037 | | | | 10,183,900 | |
| | 10,000 | | | York County, PA IDA (PSEG Power)1 | | | 5.500 | | | | 09/01/2020 | | | | 10,119 | |
| | 2,000,000 | | | York, PA GO1 | | | 7.250 | | | | 11/15/2041 | | | | 2,326,060 | |
| | | | | | | | | | | | | | |
|
|
|
| | | | | | | | | | | | | | | | 1,034,057,049 | |
| | U.S. Possessions—27.0% | | | | | | | | | | | | |
| | 25,000 | | | Guam GO1 | | | 5.375 | | | | 11/15/2013 | | | | 25,057 | |
| | 750,000 | | | Guam GO1 | | | 6.750 | | | | 11/15/2029 | | | | 843,990 | |
| | 2,000,000 | | | Guam GO1 | | | 7.000 | | | | 11/15/2039 | | | | 2,263,800 | |
| | 700,000 | | | Guam Hsg. Corp. (Single Family Mtg.) | | | 5.750 | | | | 09/01/2031 | | | | 872,592 | |
| | 1,300,000 | | | Guam Power Authority, Series A1 | | | 5.500 | | | | 10/01/2030 | | | | 1,376,102 | |
| | 1,100,000 | | | Guam Power Authority, Series A1 | | | 5.500 | | | | 10/01/2040 | | | | 1,151,436 | |
| | 3,710,000 | | | Guam Tobacco Settlement Economic Devel. & Commerce Authority (TASC)1 | | | 5.250 | | | | 06/01/2032 | | | | 3,620,441 | |
| | | | |
| 33 | | | | OPPENHEIMER PENNSYLVANIA MUNICIPAL FUND |
STATEMENT OF INVESTMENTS Continued
| | | | | | | | | | | | | | | | |
Principal
Amount | | | | | Coupon | | | Maturity | | | Value | |
| | U.S. Possessions Continued | | | | | | | | | | | | |
| | $ 1,500,000 | | | Guam Tobacco Settlement Economic Devel. & Commerce Authority (TASC)1 | | | 5.625 | % | | | 06/01/2047 | | | $ | 1,329,015 | |
| | 38,902,000 | | | Guam Tobacco Settlement Economic Devel. & Commerce Authority (TASC) | | | 7.250 | 6 | | | 06/01/2057 | | | | 909,529 | |
| | 735,000 | | | Northern Mariana Islands Commonwealth, Series A | | | 5.000 | | | | 06/01/2017 | | | | 704,674 | |
| | 980,000 | | | Northern Mariana Islands Commonwealth, Series A | | | 5.000 | | | | 10/01/2022 | | | | 894,132 | |
| | 400,000 | | | Northern Mariana Islands Commonwealth, Series A1 | | | 6.750 | | | | 10/01/2033 | | | | 400,424 | |
| | 2,415,000 | | | Northern Mariana Islands Ports Authority, Series A1 | | | 5.500 | | | | 03/15/2031 | | | | 2,168,163 | |
| | 1,580,000 | | | Northern Mariana Islands Ports Authority, Series A1 | | | 6.250 | | | | 03/15/2028 | | | | 1,195,317 | |
| | 1,165,000 | | | Northern Mariana Islands Ports Authority, Series A1 | | | 6.600 | | | | 03/15/2028 | | | | 1,148,608 | |
| | 5,000,000 | | | Puerto Rico Aqueduct & Sewer Authority1 | | | 5.250 | | | | 07/01/2042 | | | | 5,126,050 | |
| | 4,500,000 | | | Puerto Rico Aqueduct & Sewer Authority1 | | | 6.125 | | | | 07/01/2024 | | | | 5,312,430 | |
| | 69,645,000 | | | Puerto Rico Children’s Trust Fund (TASC) | | | 5.500 | | | | 05/15/2039 | | | | 69,641,518 | |
| | 52,735,000 | | | Puerto Rico Children’s Trust Fund (TASC)1 | | | 5.625 | | | | 05/15/2043 | | | | 52,731,836 | |
| | 357,750,000 | | | Puerto Rico Children’s Trust Fund (TASC) | | | 6.403 | 6 | | | 05/15/2050 | | | | 25,722,225 | |
| | 136,000,000 | | | Puerto Rico Children’s Trust Fund (TASC) | | | 7.325 | 6 | | | 05/15/2055 | | | | 3,790,320 | |
| | 1,817,000,000 | | | Puerto Rico Children’s Trust Fund (TASC) | | | 7.625 | 6 | | | 05/15/2057 | | | | 31,906,520 | |
| | 9,000,000 | | | Puerto Rico Commonwealth GO1 | | | 5.750 | | | | 07/01/2036 | | | | 9,671,310 | |
| | 3,000,000 | | | Puerto Rico Commonwealth GO1 | | | 5.750 | | | | 07/01/2041 | | | | 3,246,480 | |
| | 5,000,000 | | | Puerto Rico Electric Power Authority, Series A1 | | | 5.000 | | | | 07/01/2042 | | | | 5,155,600 | |
| | 1,435,000 | | | Puerto Rico Electric Power Authority, Series AAA1 | | | 5.250 | | | | 07/01/2024 | | | | 1,594,716 | |
| | 1,510,000 | | | Puerto Rico Electric Power Authority, Series AAA1 | | | 5.250 | | | | 07/01/2025 | | | | 1,664,398 | |
| | 5,540,000 | | | Puerto Rico Electric Power Authority, Series AAA1 | | | 5.250 | | | | 07/01/2027 | | | | 6,043,032 | |
| | 1,760,000 | | | Puerto Rico Electric Power Authority, Series AAA1 | | | 5.250 | | | | 07/01/2030 | | | | 1,883,922 | |
| | 3,505,000 | | | Puerto Rico Electric Power Authority, Series AAA1 | | | 5.250 | | | | 07/01/2031 | | | | 3,732,334 | |
| | 500,000 | | | Puerto Rico Highway & Transportation Authority | | | 5.300 | | | | 07/01/2035 | | | | 523,490 | |
| | 10,000 | | | Puerto Rico Highway & Transportation Authority, Series A1 | | | 5.000 | | | | 07/01/2038 | | | | 10,001 | |
| | 325,000 | | | Puerto Rico Highway & Transportation Authority, Series H1 | | | 5.000 | | | | 07/01/2028 | | | | 326,970 | |
| | 700,000 | | | Puerto Rico Highway & Transportation Authority, Series N1 | | | 5.250 | | | | 07/01/2039 | | | | 757,862 | |
| | 1,750,000 | | | Puerto Rico Infrastructure | | | 6.400 | 6 | | | 07/01/2043 | | | | 274,943 | |
| | 1,400,000 | | | Puerto Rico Infrastructure (Mepsi Campus) | | | 6.500 | | | | 10/01/2037 | | | | 1,471,708 | |
| | 200,000 | | | Puerto Rico ITEMECF (Ana G. Mendez University)1 | | | 5.000 | | | | 04/01/2027 | | | | 204,294 | |
| | 1,250,000 | | | Puerto Rico ITEMECF (Ana G. Mendez University)1 | | | 5.000 | | | | 03/01/2036 | | | | 1,248,225 | |
| | 125,000 | | | Puerto Rico ITEMECF (Ana G. Mendez University)1 | | | 5.125 | | | | 04/01/2032 | | | | 127,136 | |
| | | | |
| 34 | | | | OPPENHEIMER PENNSYLVANIA MUNICIPAL FUND |
| | | | | | | | | | | | | | | | |
Principal
Amount | | | | | Coupon | | | Maturity | | | Value | |
| | U.S. Possessions Continued | | | | | | | | | | | | |
| | $ 185,000 | | | Puerto Rico ITEMECF (Ana G. Mendez University)1 | | | 5.375 | % | | | 04/01/2042 | | | $ | 188,406 | |
| | 585,000 | | | Puerto Rico ITEMECF (IEP/HESL/HECR Obligated Group)1 | | | 5.750 | | | | 06/01/2019 | | | | 520,902 | |
| | 3,000,000 | | | Puerto Rico Public Buildings Authority1 | | | 5.250 | | | | 07/01/2042 | | | | 3,068,550 | |
| | 1,500,000 | | | Puerto Rico Public Buildings Authority1 | | | 6.500 | | | | 07/01/2030 | | | | 1,757,685 | |
| | 1,000,000 | | | Puerto Rico Public Buildings Authority1 | | | 6.750 | | | | 07/01/2036 | | | | 1,190,980 | |
| | 1,015,000 | | | Puerto Rico Public Buildings Authority, Series D1 | | | 5.250 | | | | 07/01/2036 | | | | 1,016,127 | |
| | 6,000,000 | | | Puerto Rico Public Finance Corp., Series B1 | | | 5.500 | | | | 08/01/2031 | | | | 6,572,520 | |
| | 4,500,000 | | | Puerto Rico Sales Tax Financing Corp., Series A1 | | | 5.500 | | | | 08/01/2037 | | | | 4,880,565 | |
| | 2,000,000 | | | Puerto Rico Sales Tax Financing Corp., Series A1 | | | 6.500 | | | | 08/01/2044 | | | | 2,390,900 | |
| | 30,000,000 | | | Puerto Rico Sales Tax Financing Corp., Series A | | | 7.280 | 6 | | | 08/01/2034 | | | | 9,203,100 | |
| | 22,130,000 | | | Puerto Rico Sales Tax Financing Corp., Series C3 | | | 5.750 | | | | 08/01/2057 | | | | 24,688,277 | |
| | 5,500,000 | | | Puerto Rico Sales Tax Financing Corp., Series C1 | | | 6.000 | | | | 08/01/2039 | | | | 6,317,795 | |
| | 18,015,000 | | | Puerto Rico Sales Tax Financing Corp., Series C | | | 6.380 | 6 | | | 08/01/2038 | | | | 4,173,175 | |
| | 17,450,000 | | | V.I. Tobacco Settlement Financing Corp. | | | 6.250 | 6 | | | 05/15/2035 | | | | 2,370,234 | |
| | 2,195,000 | | | V.I. Tobacco Settlement Financing Corp. | | | 6.500 | 6 | | | 05/15/2035 | | | | 273,256 | |
| | 4,150,000 | | | V.I. Tobacco Settlement Financing Corp. | | | 6.875 | 6 | | | 05/15/2035 | | | | 483,973 | |
| | 7,000,000 | | | V.I. Tobacco Settlement Financing Corp. | | | 7.625 | 6 | | | 05/15/2035 | | | | 657,160 | |
| | 30,000 | | | V.I. Tobacco Settlement Financing Corp. (TASC)1 | | | 5.000 | | | | 05/15/2021 | | | | 29,444 | |
| | 2,235,000 | | | V.I. Tobacco Settlement Financing Corp. (TASC)1 | | | 5.000 | | | | 05/15/2031 | | | | 2,009,377 | |
| | 435,000 | | | V.I. Water & Power Authority, Series A1 | | | 5.000 | | | | 07/01/2031 | | | | 444,022 | |
| | | | | | | |
|
|
|
| | | | | | | | | | | | | | | | 323,307,048 | |
| | Total Investments, at Value (Cost $1,370,864,391)—113.2% | | | | | | | | | | | 1,357,364,097 | |
| | Liabilities in Excess of Other Assets—(13.2) | | | | | | | | | | | (158,697,452 | ) |
| | | | | | | |
|
|
|
| | Net Assets–100.0% | | | | | | | | | | $ | 1,198,666,645 | |
| | | | | | | |
|
|
|
Footnotes to Statement of Investments
1. All or a portion of the security position has been segregated for collateral to cover borrowings. See Note 6 of the accompanying Notes.
2. Represents the current interest rate for a variable or increasing rate security.
3. Security represents the underlying municipal bond with respect to an inverse floating rate security held by the Fund. The bond was purchased by the Fund and subsequently transferred to a trust, which issued the related inverse floating rate security. See Note 1 of the accompanying Notes.
4. This security is not accruing income because the issuer has missed an interest payment on it and/or is not anticipated to make future interest and/or principal payments. The rate shown is the original contractual interest rate. See Note 1 of the accompanying Notes.
5. All or a portion of the security position is when-issued or delayed delivery to be delivered and settled after July 31, 2012. See Note 1 of the accompanying Notes.
6. Zero coupon bond reflects effective yield on the date of purchase.
7. Denotes a step bond: a zero coupon bond that converts to a fixed or variable interest rate at a designated future date.
8. This security is accruing partial income at an anticipated effective rate based on expected interest and/or principal payments. The rate shown is the original contractual interest rate.
| | | | |
| 35 | | | | OPPENHEIMER PENNSYLVANIA MUNICIPAL FUND |
STATEMENT OF INVESTMENTS Continued
To simplify the listings of securities, abbreviations are used per the table below:
| | | | | | |
| ARC | | Assoc. of Retarded Citizens | | HUHS | | Hahnemann University Hospital System |
| AUS | | Allegheny United Hospital | | IDA | | Industrial Devel. Agency |
| BSVHS | | Baptist/St. Vincent’s Health System | | IEP | | Iglesia Episcopal Puertorriquena |
| CCMC | | Crozer-Chester Medical Center | | ITEMECF | | Industrial, Tourist, Educational, Medical and Environmental Community Facilities |
| CKHS | | Crozer-Keystone Health System | | MAS | | Mercy Adult Services |
| COP | | Certificates of Participation | | MCMCSPA | | Mercy Catholic Medical Center of Southeastern Pennsylvania |
| DCMH | | Delaware County Memorial Hospital | | MCP | | Medical College Of Pennsylvania |
| DGABC | | Dr. Gertrude A. Barber Center | | MHH | | Mercy Haverford Hospital |
| DGABEI | | Dr. Gertrude A. Barber Educational Institute | | MHP | | Mercy Health Plan |
| DGABF | | Dr. Gertrude A. Barber Foundation | | MHSSPA | | Mercy Health System of Southeastern Pennsylvania |
| DOCNHS | | Daughters of Charity National Health Systems | | PA/NJ | | Pennsylvania/New Jersey |
| DRIVERS | | Derivative Inverse Tax Exempt Receipts | | PPAM | | Philadelphia Presbytery Apartments of Morrisville |
| EDFA | | Economic Devel. Finance Authority | | PSEG | | Public Service Enterprise Group |
| GIH | | Germantown Interfaith Housing | | RR | | Residential Resources |
| GO | | General Obligation | | RITES | | Residual Interest Tax Exempt Security |
| GPA | | General Purpose Authority | | ROLs | | Residual Option Longs |
| H&EFA | | Health and Educational Facilities Authority | | RRDC | | Residential Resources Devel. Corp. |
| H&HEFA | | Hospitals and Higher Education Facilities Authority | | RRSW | | Residential Resources Southwest |
| HDA | | Hospital Devel. Authority | | SCHS | | St. Christopher’s Hospital for Children |
| HEBA | | Higher Education Building Authority | | SRHS | | Sharon Regional Health System |
| HECR | | Hospital Episcopal Cristo Redentor | | SRPS | | Sharon Regional Physicians Services |
| HEFA | | Higher Education Facilities Authority | | TASC | | Tobacco Settlement Asset-Backed Bonds |
| HEHA | | Higher Education and Health Authority | | UPMC | | University of Pittsburgh Medical Center |
| HESL | | Hospital Episcopal San Lucas | | V.I. | | United States Virgin Islands |
| HFA | | Housing Finance Agency | | WMHS | | Western Maryland Health Systems |
See accompanying Notes to Financial Statements.
| | | | |
| 36 | | | | OPPENHEIMER PENNSYLVANIA MUNICIPAL FUND |
STATEMENT OF ASSETS AND LIABILITIES July 31, 2012
| | | | |
| Assets | | | |
| Investments, at value (cost $1,370,864,391)—see accompanying statement of investments | | $ | 1,357,364,097 | |
| Cash | | | 567,597 | |
| Receivables and other assets: | | | | |
| Interest | | | 14,525,601 | |
| Shares of beneficial interest sold | | | 2,562,045 | |
| Investments sold | | | 105,024 | |
| Other | |
| 384,468
|
|
| Total assets | | | 1,375,508,832 | |
| Liabilities | | | |
| Payables and other liabilities: | | | | |
| Payable for short-term floating rate notes issued (See Note 1) | | | 158,210,000 | |
| Payable on borrowings (See Note 6) | | | 14,100,000 | |
| Investments purchased on a when-issued or delayed delivery basis | | | 1,992,200 | |
| Dividends | | | 1,051,589 | |
| Shares of beneficial interest redeemed | | | 976,026 | |
| Trustees’ compensation | | | 156,970 | |
| Distribution and service plan fees | | | 143,154 | |
| Transfer and shareholder servicing agent fees | | | 45,813 | |
| Shareholder communications | | | 37,931 | |
| Interest expense on borrowings | | | 7,202 | |
| Other | |
| 121,302
|
|
| Total liabilities | | | 176,842,187 | |
| Net Assets | | $
| 1,198,666,645
|
|
| Composition of Net Assets | | | |
| Paid-in capital | | $ | 1,315,548,450 | |
| Accumulated net investment income | | | 9,570,343 | |
| Accumulated net realized loss on investments | | | (112,951,854 | ) |
| Net unrealized depreciation on investments | |
| (13,500,294
| )
|
| Net Assets | | $
| 1,198,666,645
|
|
| | | | |
| 37 | | | | OPPENHEIMER PENNSYLVANIA MUNICIPAL FUND |
STATEMENT OF ASSETS AND LIABILITIES Continued
| | | | |
| Net Asset Value Per Share | | | |
| Class A Shares: | | | | |
| Net asset value and redemption price per share (based on net assets of $795,924,254 and 69,363,732 shares of beneficial interest outstanding) | | $ | 11.47 | |
| Maximum offering price per share (net asset value plus sales charge of 4.75% of offering price) | | $ | 12.04 | |
| Class B Shares: | | | | |
| Net asset value, redemption price (excludes applicable contingent deferred sales charge) and offering price per share (based on net assets of $41,661,681 and 3,632,720 shares of beneficial interest outstanding) | | $ | 11.47 | |
| Class C Shares: | | | | |
| Net asset value, redemption price (excludes applicable contingent deferred sales charge) and offering price per share (based on net assets of $332,379,905 and 29,023,874 shares of beneficial interest outstanding) | | $ | 11.45 | |
| Class Y Shares: | | | | |
| Net asset value, redemption price and offering price per share (based on net assets of $28,700,805 and 2,500,546 shares of beneficial interest outstanding) | | $ | 11.48 | |
See accompanying Notes to Financial Statements.
| | | | |
| 38 | | | | OPPENHEIMER PENNSYLVANIA MUNICIPAL FUND |
STATEMENT OF OPERATIONS For the Year Ended July 31, 2012
| | | | |
| Investment Income | | | |
| Interest | | $ | 74,359,791 | |
| Other income | |
| 653
|
|
| Total investment income | | | 74,360,444 | |
| Expenses | | | |
| Management fees | | | 5,325,374 | |
| Distribution and service plan fees: | | | | |
| Class A | | | 1,130,114 | |
| Class B | | | 403,924 | |
| Class C | | | 2,734,383 | |
| Transfer and shareholder servicing agent fees: | | | | |
| Class A | | | 354,660 | |
| Class B | | | 53,326 | |
| Class C | | | 167,166 | |
| Class Y | | | 12,110 | |
| Shareholder communications: | | | | |
| Class A | | | 42,380 | |
| Class B | | | 5,955 | |
| Class C | | | 18,358 | |
| Class Y | | | 740 | |
| Interest expense and fees on short-term floating rate notes issued (See Note 1) | | | 1,793,480 | |
| Borrowing fees | | | 1,272,345 | |
| Interest expense on borrowings | | | 46,086 | |
| Trustees’ compensation | | | 26,356 | |
| Custodian fees and expenses | | | 8,339 | |
| Administration service fees | | | 1,500 | |
| Other | |
| 247,005
|
|
| Total expenses | | | 13,643,601 | |
| Less waivers and reimbursements of expenses | |
| (88,701
| )
|
| Net expenses | | | 13,554,900 | |
| Net Investment Income | | | 60,805,544 | |
| Realized and Unrealized Gain (Loss) | | | |
| Net realized loss on investments | | | (3,858,928 | ) |
| Net change in unrealized appreciation/depreciation on investments | | | 95,650,397 | |
| Net Increase in Net Assets Resulting from Operations | | $
| 152,597,013
|
|
See accompanying Notes to Financial Statements.
| | | | |
| 39 | | | | OPPENHEIMER PENNSYLVANIA MUNICIPAL FUND |
STATEMENT OF CHANGES IN NET ASSETS
| | | | | | | | |
| | | Year Ended
July 31,
2012 | | | Year Ended
July 29,
20111 | |
| Operations | | | | | | |
| Net investment income | | $ | 60,805,544 | | | $ | 69,365,022 | |
| Net realized loss | | | (3,858,928 | ) | | | (10,970,822 | ) |
| Net change in unrealized appreciation/depreciation | |
| 95,650,397
|
| |
| (35,014,387
| )
|
| Net increase in net assets resulting from operations | | | 152,597,013 | | | | 23,379,813 | |
| Dividends and/or Distributions to Shareholders | | | | | | |
| Dividends from net investment income: | | | | | | | | |
| Class A | | | (45,316,007 | ) | | | (47,455,240 | ) |
| Class B | | | (2,320,035 | ) | | | (3,095,134 | ) |
| Class C | | | (15,882,162 | ) | | | (15,802,302 | ) |
| Class Y | |
| (1,222,488
| )
| |
| (206,300
| )
|
| | | | (64,740,692 | ) | | | (66,558,976 | ) |
| Beneficial Interest Transactions | | | | | | |
| Net increase (decrease) in net assets resulting from beneficial interest transactions: | | | | | | | | |
| Class A | | | 13,147,940 | | | | (64,095,088 | ) |
| Class B | | | (10,431,715 | ) | | | (17,678,508 | ) |
| Class C | | | 31,295,073 | | | | (18,734,008 | ) |
| Class Y | |
| 14,888,014
|
| |
| 11,706,343
|
|
| | | | 48,899,312 | | | | (88,801,261 | ) |
| Net Assets | | | | | | |
| Total increase (decrease) | | | 136,755,633 | | | | (131,980,424 | ) |
| Beginning of period | |
| 1,061,911,012
|
| |
| 1,193,891,436
|
|
| End of period (including accumulated net investment income of $9,570,343 and $16,054,984, respectively) | | $
| 1,198,666,645
|
| | $
| 1,061,911,012
|
|
1. July 29, 2011 represents the last business day of the Fund’s 2011 fiscal year. See Note 1 of the accompanying Notes.
See accompanying Notes to Financial Statements.
| | | | |
| 40 | | | | OPPENHEIMER PENNSYLVANIA MUNICIPAL FUND |
STATEMENT OF CASH FLOWS For the Year Ended July 31, 2012
| | | | |
| Cash Flows from Operating Activities | | | |
| Net increase in net assets from operations | | $ | 152,597,013 | |
Adjustments to reconcile net increase in net assets from operations
to net cash provided by operating activities: | | | | |
Purchase of investment securities | | | (202,597,134 | ) |
Proceeds from disposition of investment securities | | | 183,605,824 | |
Short-term investment securities, net | | | 18,737,386 | |
Premium amortization | | | 884,214 | |
Discount accretion | | | (11,396,131 | ) |
Net realized loss on investments | | | 3,858,928 | |
Net change in unrealized appreciation/depreciation on investments | | | (95,650,397 | ) |
| Change in assets: | | | | |
Increase in other assets | | | (33,410 | ) |
Increase in receivable for securities sold | | | (100,024 | ) |
Increase in interest receivable | | | (345,441 | ) |
| Change in liabilities: | | | | |
Increase in payable for securities purchased | | | 1,992,200 | |
Increase in other liabilities | |
| 80,280
|
|
| Net cash provided by operating activities | | | 51,633,308 | |
| Cash Flows from Financing Activities | | | |
| Proceeds from borrowings | | | 259,800,000 | |
| Payments on borrowings | | | (257,000,000 | ) |
| Payments on short-term floating rate notes issued | | | (36,315,000 | ) |
| Proceeds from shares sold | | | 184,390,337 | |
| Payments on shares redeemed | | | (187,901,022 | ) |
| Cash distributions paid | |
| (14,742,059
| )
|
| Net cash used in financing activities | | | (51,767,744 | ) |
| Net decrease in cash | | | (134,436 | ) |
| Cash, beginning balance | |
| 702,033
|
|
| Cash, ending balance | | $
| 567,597
|
|
Supplemental disclosure of cash flow information:
Noncash financing activities not included herein consist of reinvestment of dividends and distributions of $49,527,883.
Cash paid for interest on borrowings—$40,945.
Cash paid for interest on short-term floating rate notes issued—$1,793,480.
See accompanying Notes to Financial Statements.
| | | | |
| 41 | | | | OPPENHEIMER PENNSYLVANIA MUNICIPAL FUND |
FINANCIAL HIGHLIGHTS
| | | | | | | | | | | | | | | | | | | | |
| | | Year Ended
July 31, | | | Year Ended
July 29, | | | Year Ended
July 30, | | | Year Ended July 31, | |
| Class A | | 2012 | | | 20111 | | | 20101 | | | 2009 | | | 2008 | |
| | | | | | | | | | | | | | | | | | | | | |
| Per Share Operating Data | | | | | | | | | | | | | | | |
| Net asset value, beginning of period | | $ | 10.60 | | | $ | 10.96 | | | $ | 9.28 | | | $ | 11.12 | | | $ | 12.77 | |
| Income (loss) from investment operations: | | | | | | | | | | | | | | | | | | | | |
| Net investment income2 | | | .63 | | | | .69 | | | | .71 | | | | .69 | | | | .64 | |
| Net realized and unrealized gain (loss) | |
| .90
|
| |
| (.39
| )
| |
| 1.62
|
| |
| (1.90
| )
| |
| (1.69
| )
|
| Total from investment operations | | | 1.53 | | | | .30 | | | | 2.33 | | | | (1.21 | ) | | | (1.05 | ) |
| Dividends and/or distributions to shareholders: | | | | | | | | | | | | | | | | | | | | |
| Dividends from net investment income | | | (.66 | ) | | | (.66 | ) | | | (.65 | ) | | | (.63 | ) | | | (.60 | ) |
| Net asset value, end of period | | $
| 11.47
|
| | $
| 10.60
|
| | $
| 10.96
|
| | $
| 9.28
|
| | $
| 11.12
|
|
| Total Return, at Net Asset Value3 | | | 14.84 | % | | | 2.98 | % | | | 25.50 | % | | | (10.41 | )% | | | (8.42 | )% |
| | | | | | | | | | | | | | | | | | | | | |
| Ratios/Supplemental Data | | | | | | | | | | | | | | | |
| Net assets, end of period (in thousands) | | | $795,924 | | | | $723,618 | | | | $817,706 | | | | $675,031 | | | | $816,645 | |
| Average net assets (in thousands) | | | $752,625 | | | | $760,121 | | | | $778,632 | | | | $640,109 | | | | $847,089 | |
| Ratios to average net assets:4 | | | | | | | | | | | | | | | | | | | | |
| Net investment income | | | 5.67 | % | | | 6.50 | % | | | 6.71 | % | | | 7.53 | % | | | 5.33 | % |
| Expenses excluding interest and fees on short-term floating rate notes issued and interest and fees from borrowings | | | 0.70 | % | | | 0.70 | % | | | 0.69 | % | | | 0.73 | % | | | 0.67 | % |
| Interest and fees from borrowings | | | 0.12 | % | | | 0.13 | % | | | 0.27 | % | | | 0.87 | % | | | 0.14 | % |
| Interest and fees on short-term floating rate notes issued5 | |
| 0.16
| %
| |
| 0.20
| %
| |
| 0.22
| %
| |
| 0.49
| %
| |
| 0.60
| %
|
| Total expenses | | | 0.98 | % | | | 1.03 | % | | | 1.18 | % | | | 2.09 | % | | | 1.41 | % |
| Expenses after payments, waivers and/or reimbursements and reduction to custodian expenses | | | 0.97 | % | | | 1.03 | % | | | 1.17 | % | | | 2.09 | % | | | 1.41 | % |
| Portfolio turnover rate | | | 15 | % | | | 16 | % | | | 17 | % | | | 30 | % | | | 51 | % |
1. July 29, 2011 and July 30, 2010 represent the last business days of the Fund’s respective reporting periods. See Note 1 of the accompanying Notes.
2. Per share amounts calculated based on the average shares outstanding during the period.
3. Assumes an initial investment on the business day before the first day of the fiscal period, with all dividends and distributions reinvested in additional shares on the reinvestment date, and redemption at the net asset value calculated on the last business day of the fiscal period. Sales charges are not reflected in the total returns. Total returns are not annualized for periods less than one full year. Returns do not reflect the deduction of taxes that a shareholder would pay on fund distributions or the redemption of fund shares.
4. Annualized for periods less than one full year.
5. Interest and fee expense relates to the Fund’s liability for short-term floating rate notes issued in conjunction with inverse floating rate security transactions.
See accompanying Notes to Financial Statements.
| | | | |
| 42 | | | | OPPENHEIMER PENNSYLVANIA MUNICIPAL FUND |
| | | | | | | | | | | | | | | | | | | | |
| | | Year Ended
July 31, | | | Year Ended
July 29, | | | Year Ended
July 30, | | | Year Ended July 31, | |
| Class B | | 2012 | | | 20111 | | | 20101 | | | 2009 | | | 2008 | |
| | | | | | | | | | | | | | | | | | | | | |
| Per Share Operating Data | | | | | | | | | | | | | | | |
| Net asset value, beginning of period | | $ | 10.59 | | | $ | 10.95 | | | $ | 9.28 | | | $ | 11.12 | | | $ | 12.76 | |
| Income (loss) from investment operations: | | | | | | | | | | | | | | | | | | | | |
| Net investment income2 | | | .54 | | | | .60 | | | | .62 | | | | .60 | | | | .54 | |
| Net realized and unrealized gain (loss) | |
| .91
|
| |
| (.38
| )
| |
| 1.61
|
| |
| (1.89
| )
| |
| (1.68
| )
|
| Total from investment operations | | | 1.45 | | | | .22 | | | | 2.23 | | | | (1.29 | ) | | | (1.14 | ) |
| Dividends and/or distributions to shareholders: | | | | | | | | | | | | | | | | | |
| Dividends from net investment income | | | (.57 | ) | | | (.58 | ) | | | (.56 | ) | | | (.55 | ) | | | (.50 | ) |
| Net asset value, end of period | | $
| 11.47
|
| | $
| 10.59
|
| | $
| 10.95
|
| | $
| 9.28
|
| | $
| 11.12
|
|
| Total Return, at Net Asset Value3 | | | 14.02 | % | | | 2.13 | % | | | 24.36 | % | | | (11.16 | )% | | | (9.07 | )% |
| | | | | | | | | | | | | | | | | | | | | |
| Ratios/Supplemental Data | | | | | | | | | | | | | | | |
| Net assets, end of period (in thousands) | | | $41,662 | | | | $48,569 | | | | $68,602 | | | | $69,650 | | | | $119,418 | |
| Average net assets (in thousands) | | | $44,543 | | | | $57,201 | | | | $71,759 | | | | $78,974 | | | | $148,180 | |
| Ratios to average net assets:4 | | | | | | | | | | | | | | | | | | | | |
| Net investment income | | | 4.86 | % | | | 5.67 | % | | | 5.87 | % | | | 6.66 | % | | | 4.51 | % |
| Expenses excluding interest and fees on short-term floating rate notes issued and interest and fees from borrowings | | | 1.54 | % | | | 1.53 | % | | | 1.53 | % | | | 1.53 | % | | | 1.46 | % |
| Interest and fees from borrowings | | | 0.12 | % | | | 0.13 | % | | | 0.27 | % | | | 0.87 | % | | | 0.14 | % |
| Interest and fees on short-term floating rate notes issued5 | |
| 0.16
| %
| |
| 0.20
| %
| |
| 0.22
| %
| |
| 0.49
| %
| |
| 0.60
| %
|
| Total expenses | | | 1.82 | % | | | 1.86 | % | | | 2.02 | % | | | 2.89 | % | | | 2.20 | % |
| Expenses after payments, waivers and/or reimbursements and reduction to custodian expenses | | | 1.81 | % | | | 1.86 | % | | | 2.01 | % | | | 2.89 | % | | | 2.20 | % |
| Portfolio turnover rate | | | 15 | % | | | 16 | % | | | 17 | % | | | 30 | % | | | 51 | % |
1. July 29, 2011 and July 30, 2010 represent the last business days of the Fund’s respective reporting periods. See Note 1 of the accompanying Notes.
2. Per share amounts calculated based on the average shares outstanding during the period.
3. Assumes an initial investment on the business day before the first day of the fiscal period, with all dividends and distributions reinvested in additional shares on the reinvestment date, and redemption at the net asset value calculated on the last business day of the fiscal period. Sales charges are not reflected in the total returns. Total returns are not annualized for periods less than one full year. Returns do not reflect the deduction of taxes that a shareholder would pay on fund distributions or the redemption of fund shares.
4. Annualized for periods less than one full year.
5. Interest and fee expense relates to the Fund’s liability for short-term floating rate notes issued in conjunction with inverse floating rate security transactions.
See accompanying Notes to Financial Statements.
| | | | |
| 43 | | | | OPPENHEIMER PENNSYLVANIA MUNICIPAL FUND |
FINANCIAL HIGHLIGHTS Continued
| | | | | | | | | | | | | | | | | | | | |
| | | Year Ended
July 31, | | | Year Ended
July 29, | | | Year Ended
July 30, | | | Year Ended July 31, | |
| Class C | | 2012 | | | 20111 | | | 20101 | | | 2009 | | | 2008 | |
| | | | | | | | | | | | | | | | | | | | | |
| Per Share Operating Data | | | | | | | | | | | | | | | |
| Net asset value, beginning of period | | $ | 10.58 | | | $ | 10.94 | | | $ | 9.27 | | | $ | 11.11 | | | $ | 12.75 | |
| Income (loss) from investment operations: | | | | | | | | | | | | | | | | | | | | |
| Net investment income2 | | | .54 | | | | .61 | | | | .63 | | | | .61 | | | | .55 | |
| Net realized and unrealized gain (loss) | |
| .91
|
| |
| (.39
| )
| |
| 1.61
|
| |
| (1.89
| )
| |
| (1.68
| )
|
| Total from investment operations | | | 1.45 | | | | .22 | | | | 2.24 | | | | (1.28 | ) | | | (1.13 | ) |
| Dividends and/or distributions to shareholders: | | | | | | | | | | | | | | | | | | | | |
| Dividends from net investment income | | | (.58 | ) | | | (.58 | ) | | | (.57 | ) | | | (.56 | ) | | | (.51 | ) |
| Net asset value, end of period | | $
| 11.45
|
| | $
| 10.58
|
| | $
| 10.94
|
| | $
| 9.27
|
| | $
| 11.11
|
|
| Total Return, at Net Asset Value3 | | | 14.01 | % | | | 2.20 | % | | | 24.47 | % | | | (11.11 | )% | | | (9.05 | )% |
| | | | | | | | | | | | | | | | | | | | | |
| Ratios/Supplemental Data | | | | | | | | | | | | | | | |
| Net assets, end of period (in thousands) | | | $332,380 | | | | $277,553 | | | | $307,583 | | | | $243,599 | | | | $291,693 | |
| Average net assets (in thousands) | | | $302,122 | | | | $287,679 | | | | $287,513 | | | | $227,214 | | | | $309,446 | |
| Ratios to average net assets:4 | | | | | | | | | | | | | | | | | | | | |
| Net investment income | | | 4.89 | % | | | 5.74 | % | | | 5.93 | % | | | 6.74 | % | | | 4.56 | % |
| Expenses excluding interest and fees on short-term floating rate notes issued and interest and fees from borrowings | | | 1.46 | % | | | 1.46 | % | | | 1.45 | % | | | 1.50 | % | | | 1.44 | % |
| Interest and fees from borrowings | | | 0.12 | % | | | 0.13 | % | | | 0.27 | % | | | 0.87 | % | | | 0.14 | % |
| Interest and fees on short-term floating rate notes issued5 | |
| 0.16
| %
| |
| 0.20
| %
| |
| 0.22
| %
| |
| 0.49
| %
| |
| 0.60
| %
|
| Total expenses | | | 1.74 | % | | | 1.79 | % | | | 1.94 | % | | | 2.86 | % | | | 2.18 | % |
| Expenses after payments, waivers and/or reimbursements and reduction to custodian expenses | | | 1.73 | % | | | 1.79 | % | | | 1.93 | % | | | 2.86 | % | | | 2.18 | % |
| Portfolio turnover rate | | | 15 | % | | | 16 | % | | | 17 | % | | | 30 | % | | | 51 | % |
1. July 29, 2011 and July 30, 2010 represent the last business days of the Fund’s respective reporting periods. See Note 1 of the accompanying Notes.
2. Per share amounts calculated based on the average shares outstanding during the period.
3. Assumes an initial investment on the business day before the first day of the fiscal period, with all dividends and distributions reinvested in additional shares on the reinvestment date, and redemption at the net asset value calculated on the last business day of the fiscal period. Sales charges are not reflected in the total returns. Total returns are not annualized for periods less than one full year. Returns do not reflect the deduction of taxes that a shareholder would pay on fund distributions or the redemption of fund shares.
4. Annualized for periods less than one full year.
5. Interest and fee expense relates to the Fund’s liability for short-term floating rate notes issued in conjunction with inverse floating rate security transactions.
See accompanying Notes to Financial Statements.
| | | | |
| 44 | | | | OPPENHEIMER PENNSYLVANIA MUNICIPAL FUND |
| | | | | | | | |
| | | Year Ended
July 31, | | | Period Ended
July 29, | |
| Class Y | | 2012 | | | 20111 | |
| | | | | | | | | |
| Per Share Operating Data | | | | | | |
| Net asset value, beginning of period | | $ | 10.60 | | | $ | 10.68 | |
| Income (loss) from investment operations: | | | | | | | | |
| Net investment income2 | | | .64 | | | | .44 | |
| Net realized and unrealized gain (loss) | |
| .92
|
| |
| (.07
| )
|
| Total from investment operations | | | 1.56 | | | | .37 | |
| Dividends and/or distributions to shareholders: | | | | | | | | |
| Dividends from net investment income | | | (.68 | ) | | | (.45 | ) |
| Net asset value, end of period | | $
| 11.48
|
| | $
| 10.60
|
|
| Total Return, at Net Asset Value3 | | | 15.09 | % | | | 3.73 | % |
| | | | | | | | | |
| Ratios/Supplemental Data | | | | | | |
| Net assets, end of period (in thousands) | | | $28,701 | | | | $12,171 | |
| Average net assets (in thousands) | | | $20,110 | | | | $4,849 | |
| Ratios to average net assets:4 | | | | | | | | |
| Net investment income | | | 5.70 | % | | | 6.23 | % |
| Expenses excluding interest and fees on short-term floating rate notes issued and interest and fees from borrowings | | | 0.56 | % | | | 0.57 | % |
| Interest and fees from borrowings | | | 0.12 | % | | | 0.13 | % |
| Interest and fees on short-term floating rate notes issued5 | |
| 0.16
| %
| |
| 0.20
| %
|
| Total expenses | | | 0.84 | % | | | 0.90 | % |
| Expenses after payments, waivers and/or reimbursements and reduction to custodian expenses | | | 0.83 | % | | | 0.90 | % |
| Portfolio turnover rate | | | 15 | % | | | 16 | % |
1. For the period from November 29, 2010 (inception of offering) to July 29, 2011, which represents the last business day of the Fund’s reporting period. See Note 1 of the accompanying Notes.
2. Per share amounts calculated based on the average shares outstanding during the period.
3. Assumes an initial investment on the business day before the first day of the fiscal period, with all dividends and distributions reinvested in additional shares on the reinvestment date, and redemption at the net asset value calculated on the last business day of the fiscal period. Sales charges are not reflected in the total returns. Total returns are not annualized for periods less than one full year. Returns do not reflect the deduction of taxes that a shareholder would pay on fund distributions or the redemption of fund shares.
4. Annualized for periods less than one full year.
5. Interest and fee expense relates to the Fund’s liability for short-term floating rate notes issued in conjunction with inverse floating rate security transactions.
See accompanying Notes to Financial Statements.
| | | | |
| 45 | | | | OPPENHEIMER PENNSYLVANIA MUNICIPAL FUND |
NOTES TO FINANCIAL STATEMENTS
1. Significant Accounting Policies
Oppenheimer Pennsylvania Municipal Fund (the “Fund”) is a separate series of Oppenheimer Multi-State Municipal Trust, a diversified, open-end management investment company registered under the Investment Company Act of 1940, as amended. The Fund’s investment objective is to seek as high a level of current interest income exempt from federal and Pennsylvania personal income taxes as is available from municipal securities, consistent with preservation of capital. The Fund’s investment adviser is OppenheimerFunds, Inc. (the “Manager”).
The Fund offers Class A, Class C and Class Y shares, and previously offered Class B shares for new purchase through June 29, 2012. Subsequent to that date, no new purchases of Class B shares will be permitted, however reinvestment of dividend and/or capital gain distributions and exchanges of Class B shares into and from other Oppenheimer funds will be allowed. Class A shares are sold at their offering price, which is normally net asset value plus a front-end sales charge. Class C shares are sold, and Class B shares were sold, without a front-end sales charge but may be subject to a contingent deferred sales charge (“CDSC”). Class Y shares are sold to certain institutional investors or intermediaries without either a front-end sales charge or a CDSC, however, the intermediaries may impose charges on their accountholders who beneficially own Class Y shares. All classes of shares have identical rights and voting privileges with respect to the Fund in general and exclusive voting rights on matters that affect that class alone. Earnings, net assets and net asset value per share may differ due to each class having its own expenses, such as transfer and shareholder servicing agent fees and shareholder communications, directly attributable to that class. Class A, B and C shares have separate distribution and/or service plans under which they pay fees. Class Y shares do not pay such fees. Class B shares will automatically convert to Class A shares 72 months after the date of purchase.
The following is a summary of significant accounting policies consistently followed by the Fund.
Previous Annual Periods. The last day of certain of the Fund’s prior fiscal years was the last day the New York Stock Exchange was open for trading. The Fund’s financial statements have been presented through that date to maintain consistency with the Fund’s net asset value calculations used for shareholder transactions.
Inverse Floating Rate Securities. The Fund invests in inverse floating rate securities that pay interest at a rate that varies inversely with short-term interest rates. Because inverse floating rate securities are leveraged instruments, the value of an inverse floating rate security will change more significantly in response to changes in interest rates and other market fluctuations than the market value of a conventional fixed-rate municipal security of similar maturity and credit quality, including the municipal bond underlying an inverse floating rate security.
An inverse floating rate security is created as part of a financial transaction referred to as a “tender option bond” transaction. In most cases, in a tender option bond transaction the Fund sells a fixed-rate municipal bond (the “underlying municipal bond”) to a broker
| | | | |
| 46 | | | | OPPENHEIMER PENNSYLVANIA MUNICIPAL FUND |
dealer (the “sponsor”). The sponsor creates a trust (the “Trust”) into which it deposits the underlying municipal bond. The Trust then issues and sells short-term floating rate securities with a fixed principal amount representing a senior interest in the underlying municipal bond to third parties and a residual, subordinate interest in the underlying municipal bond (referred to as an “inverse floating rate security”) to the Fund. The interest rate on the short-term floating rate securities resets periodically, usually weekly, to a prevailing market rate and holders of these securities are granted the option to tender their securities back to the Trust for repurchase at their principal amount plus accrued interest thereon (the “purchase price”) periodically, usually daily or weekly. A remarketing agent for the Trust is required to attempt to re-sell any tendered short-term floating rate securities to new investors for the purchase price. If the remarketing agent is unable to successfully re-sell the tendered short-term floating rate securities, a liquidity provider to the Trust (typically an affiliate of the sponsor) must contribute cash to the Trust to ensure that the tendering holders receive the purchase price of their securities on the repurchase date.
Because holders of the short-term floating rate securities are granted the right to tender their securities to the Trust for repurchase at frequent intervals for the purchase price, with such payment effectively guaranteed by the liquidity provider, the securities generally bear short-term rates of interest commensurate with money market instruments. When interest is paid on the underlying municipal bond to the Trust, such proceeds are first used to pay the Trust’s administrative expenses and accrued interest to holders of the short-term floating rate securities, with any remaining amounts being paid to the Fund, as the holder of the inverse floating rate security. Accordingly, the amount of such interest on the underlying municipal bond paid to the Fund is inversely related the rate of interest on the short-term floating rate securities. Additionally, because the principal amount of the short-term floating rate securities is fixed and is not adjusted in response to changes in the market value of the underlying municipal bond, any change in the market value of the underlying municipal bond is reflected entirely in a change to the value of the inverse floating rate security.
Typically, the terms of an inverse floating rate security grant certain rights to the Fund, as holder. For example, the Fund may have the right upon request to require that the Trust compel a tender of the short-term floating rate securities to facilitate the Fund’s acquisition of the underlying municipal bond. Following such a request, the Fund pays the Trust the purchase price of the short-term floating rate securities and a specified portion of any market value gain on the underlying municipal bond since its deposit into the Trust, which the Trust uses to redeem the short-term floating rate securities. The Trust then distributes the underlying municipal bond to the Fund. Similarly, the Fund may have the right to directly purchase the underlying municipal bond from the Trust by paying to the Trust the purchase price of the short-term floating rate securities and a specified portion of any market value gain on the underlying municipal bond since its deposit into the Trust, which the Trust uses to redeem the short-term floating rate securities. Through the exercise of either of these rights, the Fund can voluntarily terminate or “collapse” the
| | | | |
| 47 | | | | OPPENHEIMER PENNSYLVANIA MUNICIPAL FUND |
NOTES TO FINANCIAL STATEMENTS Continued
1. Significant Accounting Policies Continued
Trust, terminate its investment in the related inverse floating rate security and obtain the underlying municipal bond. Additionally, the Fund also typically has the right to exchange with the Trust (i) a principal amount of short-term floating rate securities held by the Fund for a corresponding additional principal amount of the inverse floating rate security or (ii) a principal amount of the inverse floating rate security held by the Fund for a corresponding additional principal amount of short-term floating rate securities (which are typically then sold to other investors). Through the exercise of this right, the Fund may increase (or decrease) the principal amount of short-term floating rate securities outstanding, thereby increasing (or decreasing) the amount of leverage provided by the short-term floating rate securities to the Fund’s investment exposure to the underlying municipal bond.
The Fund’s investments in inverse floating rate securities involve certain risks. As short-term interest rates rise, an inverse floating rate security produces less current income (and, in extreme cases, may pay no income) and as short-term interest rates fall, an inverse floating rate security produces more current income. Thus, if short-term interest rates rise after the issuance of the inverse floating rate security, any yield advantage is reduced or eliminated. All inverse floating rate securities entail some degree of leverage represented by the outstanding principal amount of the related short-term floating rate securities. The value of, and income earned on, an inverse floating rate security that has a higher degree of leverage will fluctuate more significantly in response to changes in interest rates and to changes in the market value of the related underlying municipal bond than that of an inverse floating rate security with a lower degree of leverage, and is more likely to be eliminated entirely under adverse market conditions. Changes in the value of an inverse floating rate security will also be more significant than changes in the market value of the related underlying municipal bond because the leverage provided by the related short-term floating rate securities increases the sensitivity of an inverse floating rate security to changes in interest rates and to the market value of the underlying municipal bond. An inverse floating rate security can be expected to underperform fixed-rate municipal bonds when the difference between long-term and short-term interest rates is decreasing (or is already small) or when long-term interest rates are rising, but can be expected to outperform fixed-rate municipal bonds when the difference between long-term and short-term interest rates is increasing (or is already large) or when long-term interest rates are falling. Additionally, a tender option bond transaction typically provides for the automatic termination or “collapse” of a Trust upon the occurrence of certain adverse events, usually referred to as “mandatory tender events” or “tender option termination events.” These events may include, among others, a credit ratings downgrade of the underlying municipal bond below a specified level, a decrease in the market value of the underlying municipal bond below a specified amount, a bankruptcy of the liquidity provider or the inability of the remarketing agent to re-sell to new investors short-term floating rate securities that have been tendered for repurchase by holders thereof. Following the occurrence of such an event, the underlying municipal bond is generally sold for current market value and the
| | | | |
| 48 | | | | OPPENHEIMER PENNSYLVANIA MUNICIPAL FUND |
proceeds distributed to holders of the short-term floating rate securities and inverse floating rate security, with the holder of the inverse floating rate security (the Fund) generally receiving the proceeds of such sale only after the holders of the short-term floating rate securities have received proceeds equal to the purchase price of their securities (and the liquidity provider is generally required to contribute cash to the Trust only in an amount sufficient to ensure that the holders of the short-term floating rate securities receive the purchase price of their securities in connection with such termination of the Trust). Following the occurrence of such events, the Fund could potentially lose the entire amount of its investment in the inverse floating rate security.
Finally, the Fund may enter into shortfall/reimbursement agreements with the liquidity provider of certain tender option bond transactions in connection with certain inverse floating rate securities held by the Fund. These agreements commit the Fund to reimburse the liquidity provider to the extent that the liquidity provider must provide cash to a Trust, including following the termination of a Trust resulting from the occurrence of a “mandatory tender event.” In connection with the occurrence of such an event and the termination of the Trust triggered thereby, the shortfall/reimbursement agreement will make the Fund liable for the amount of the negative difference, if any, between the liquidation value of the underlying municipal bond and the purchase price of the short-term floating rate securities issued by the Trust. Under the standard terms of a tender option bond transaction, absent such a shortfall/reimbursement agreement, the Fund, as holder of the inverse floating rate security, would not be required to make such a reimbursement payment to the liquidity provider. The Manager monitors the Fund’s potential exposure with respect to these agreements on a daily basis and intends to take action to terminate the Fund’s investment in related inverse floating rate securities, if it deems it appropriate to do so. As of July 31, 2012, the Fund’s maximum exposure under such agreements is estimated at $80,485,000.
When the Fund creates an inverse floating rate security in a tender option bond transaction by selling an underlying municipal bond to a sponsor for deposit into a Trust, the transaction is considered a secured borrowing for financial reporting purposes. As a result of such accounting treatment, the Fund includes the underlying municipal bond on its Statement of Investments and as an asset on its Statement of Assets and Liabilities (but does not separately include the related inverse floating rate security on either). The Fund also includes a liability on its Statement of Assets and Liabilities equal to the outstanding principal amount and accrued interest on the related short-term floating rate securities issued by the Trust. Interest on the underlying municipal bond is recorded as investment income on the Fund’s Statement of Operations, while interest payable on the related short-term floating rate securities is recorded as interest expense. At July 31, 2012, municipal bond holdings with a value of $261,195,133 shown on the Fund’s Statement of Investments are held by such Trusts and serve as the underlying municipal bonds for the related $158,210,000 in short-term floating rate securities issued and outstanding at that date.
| | | | |
| 49 | | | | OPPENHEIMER PENNSYLVANIA MUNICIPAL FUND |
NOTES TO FINANCIAL STATEMENTS Continued
1. Significant Accounting Policies Continued
At July 31, 2012, the inverse floating rate securities associated with tender option bond transactions accounted for as secured borrowings were as follows:
| | | | | | | | | | | | | | | | |
Principal
Amount | | | Inverse Floater1 | | Coupon
Rate2 | | | Maturity
Date | | | Value | |
| | $3,250,000 | | | Berks County, PA Municipal Authority ROLs | | | 16.641 | % | | | 11/1/31 | | | $ | 5,302,440 | |
| | 7,980,000 | | | Chester County, PA IDA (Water Facilities Authority)3 | | | 11.068 | | | | 2/1/41 | | | | 9,477,447 | |
| | 6,240,000 | | | Delaware County, PA IDA ROLs3 | | | 11.433 | | | | 11/1/38 | | | | 7,126,018 | |
| | 7,500,000 | | | Luzerne County, PA IDA (Water Facility) ROLs3 | | | 11.683 | | | | 9/1/34 | | | | 8,136,750 | |
| | 7,000,000 | | | Montgomery County, PA IDA RITES | | | 12.511 | | | | 8/1/38 | | | | 10,161,340 | |
| | 8,000,000 | | | PA Commonwealth Financing Authority DRIVERS | | | 7.849 | | | | 6/1/32 | | | | 10,022,240 | |
| | 7,500,000 | | | PA Geisinger Authority Health System DRIVERS | | | 15.747 | | | | 6/1/39 | | | | 10,944,600 | |
| | 5,015,000 | | | PA HFA (Single Family Mtg.) DRIVERS | | | 8.021 | | | | 10/1/22 | | | | 5,111,188 | |
| | 760,000 | | | PA HFA (Single Family Mtg.) ROLs3 | | | 8.538 | | | | 10/1/32 | | | | 781,257 | |
| | 6,345,000 | | | PA HFA (Single Family Mtg.) ROLs3 | | | 10.901 | | | | 10/1/37 | | | | 6,664,090 | |
| | 6,155,000 | | | PA Southcentral General Authority (Hanover Hospital) ROLs | | | 18.591 | | | | 6/1/29 | | | | 10,069,826 | |
| | 9,000,000 | | | PA Turnpike Commission ROLs3 | | | 7.914 | | | | 12/1/40 | | | | 11,094,660 | |
| | 5,535,000 | | | Puerto Rico Sales Tax Financing Corp. ROLs3 | | | 17.099 | | | | 8/1/57 | | | | 8,093,277 | |
| | | | | | | | | | | | | | |
|
|
|
| | | | | | | | | | | | | | | $ | 102,985,133 | |
| | | | | | | | | | | | | | |
|
|
|
1. For a list of abbreviations used in the Inverse Floater table see the Portfolio Abbreviations table at the end of the Statement of Investments.
2. Represents the current interest rate for the inverse floating rate security.
3. Represents an inverse floating rate security that is subject to a shortfall/reimbursement agreement.
The Fund may also purchase an inverse floating rate security created as part of a tender option bond transaction not initiated by the Fund when a third party, such as a municipal issuer or financial institution, transfers an underlying municipal bond to a Trust. For financial reporting purposes, the Fund includes the inverse floating rate security related to such transaction on its Statement of Investments and as an asset on its Statement of Assets and Liabilities, and interest on the security is recorded as investment income on the Fund’s Statement of Operations.
The Fund may invest in inverse floating rate securities with any degree of leverage (as measured by the outstanding principal amount of related short-term floating rate securities). However, the Fund may only expose up to 20% of its total assets to the effects of leverage from its investments in inverse floating rate securities. This limitation is measured by comparing the aggregate principal amount of the short-term floating rate securities that are related to the inverse floating rate securities held by the Fund to the total assets of the Fund. The Fund’s exposure to the effects of leverage from its investments in inverse floating rate securities amounts to $158,210,000 or 11.50% of its total assets as of July 31, 2012.
Securities on a When-Issued or Delayed Delivery Basis. The Fund may purchase securities on a “when-issued” basis, and may purchase or sell securities on a “delayed delivery” basis. “When-issued” or “delayed delivery” refers to securities whose terms and indenture are available and for which a market exists, but which are not available for
| | | | |
| 50 | | | | OPPENHEIMER PENNSYLVANIA MUNICIPAL FUND |
immediate delivery. Delivery and payment for securities that have been purchased by the Fund on a when-issued basis normally takes place within six months and possibly as long as two years or more after the trade date. During this period, such securities do not earn interest, are subject to market fluctuation and may increase or decrease in value prior to their delivery. The purchase of securities on a when-issued basis may increase the volatility of the Fund’s net asset value to the extent the Fund executes such transactions while remaining substantially fully invested. When the Fund engages in when-issued or delayed delivery transactions, it relies on the buyer or seller, as the case may be, to complete the transaction. Their failure to do so may cause the Fund to lose the opportunity to obtain or dispose of the security at a price and yield it considers advantageous. The Fund may also sell securities that it purchased on a when-issued basis or forward commitment prior to settlement of the original purchase.
As of July 31, 2012, the Fund had purchased securities issued on a when-issued or delayed delivery basis as follows:
| | | | |
| | | When-Issued or
Delayed Delivery
Basis Transactions | |
| Purchased securities | | $ | 1,992,200 | |
Credit Risk. The Fund invests in high-yield, non-investment-grade bonds, which may be subject to a greater degree of credit risk. Credit risk relates to the ability of the issuer to meet interest or principal payments or both as they become due. The Fund may acquire securities that have missed an interest payment, and is not obligated to dispose of securities whose issuers or underlying obligors subsequently miss an interest payment. Information concerning securities not accruing interest as of July 31, 2012 is as follows:
| | | | |
| Cost | | $ | 79,611,707 | |
| Market Value | | $ | 22,082,833 | |
| Market Value as a % of Net Assets | | | 1.84 | % |
Concentration Risk. There are certain risks arising from geographic concentration in any state, commonwealth or territory. Certain economic, regulatory or political developments occurring in the state, commonwealth or territory may impair the ability of certain issuers of municipal securities to pay principal and interest on their obligations.
Allocation of Income, Expenses, Gains and Losses. Income, expenses (other than those attributable to a specific class), gains and losses are allocated on a daily basis to each class of shares based upon the relative proportion of net assets represented by such class. Operating expenses directly attributable to a specific class are charged against the operations of that class.
Federal Taxes. The Fund intends to comply with provisions of the Internal Revenue Code applicable to regulated investment companies and to distribute substantially all of its investment company taxable income, including any net realized gain on investments not offset by capital loss carryforwards, if any, to shareholders. Therefore, no federal income or
| | | | |
| 51 | | | | OPPENHEIMER PENNSYLVANIA MUNICIPAL FUND |
NOTES TO FINANCIAL STATEMENTS Continued
1. Significant Accounting Policies Continued
excise tax provision is required. The Fund files income tax returns in U.S. federal and applicable state jurisdictions. The statute of limitations on the Fund’s tax return filings generally remain open for the three preceding fiscal reporting period ends.
The tax components of capital shown in the following table represent distribution requirements the Fund must satisfy under the income tax regulations, losses the Fund may be able to offset against income and gains realized in future years and unrealized appreciation or depreciation of securities and other investments for federal income tax purposes.
| | | | | | | | | | | | |
Undistributed
Net Investment
Income | | Undistributed
Long-Term
Gain | | | Accumulated
Loss
Carryforward1,2,3 | | | Net Unrealized
Depreciation
Based on Cost of
Securities and Other
Investments for Federal
Income Tax Purposes | |
| $7,774,554 | | $ | — | | | $ | 109,554,241 | | | $ | 16,897,910 | |
1. As of July 31, 2012, the Fund had $109,554,241 of net capital loss carryforwards available to offset future realized capital gains, if any, and thereby reduce future taxable gain distributions. Details of the capital loss carryforwards are included in the table below. Capital loss carryovers with no expiration, if any, must be utilized prior to those with expiration dates.
| | | | |
| Expiring | | | |
| 2016 | | $ | 1,143,881 | |
| 2017 | | | 48,870,545 | |
| 2018 | | | 43,078,455 | |
| No expiration | | | 16,461,360 | |
| | |
|
|
|
| Total | | $ | 109,554,241 | |
| | |
|
|
|
2. During the fiscal year ended July 31, 2012, the Fund did not utilize any capital loss carryforward.
3. During the fiscal year ended July 29, 2011, the Fund utilized $3,762,438 of capital loss carryforward to offset capital gains realized in that fiscal year.
Net investment income (loss) and net realized gain (loss) may differ for financial statement and tax purposes. The character of dividends and distributions made during the fiscal year from net investment income or net realized gains may differ from their ultimate characterization for federal income tax purposes. Also, due to timing of dividends and distributions, the fiscal year in which amounts are distributed may differ from the fiscal year in which the income or net realized gain was recorded by the Fund.
Accordingly, the following amounts have been reclassified for July 31, 2012. Net assets of the Fund were unaffected by the reclassifications.
| | | | | | | | |
Reduction to
Paid-in Capital | | Reduction
to Accumulated
Net Investment
Income | | | Reduction
to Accumulated Net
Realized Loss on
Investments | |
| $387,302 | | $ | 2,549,493 | | | $ | 2,936,795 | |
| | | | |
| 52 | | | | OPPENHEIMER PENNSYLVANIA MUNICIPAL FUND |
The tax character of distributions paid during the years ended July 31, 2012 and July 31, 2011 was as follows:
| | | | | | | | |
| | | Year Ended
July 31, 2012 | | | Year Ended
July 31, 2011 | |
| Distributions paid from: | | | | | | | | |
| Exempt-interest dividends | | $ | 63,934,791 | | | $ | 65,756,338 | |
| Ordinary income | | | 418,599 | | | | 1,189,940 | |
| | |
|
|
| |
|
|
|
| Total | | $ | 64,353,390 | | | $ | 66,946,278 | |
| | |
|
|
| |
|
|
|
The aggregate cost of securities and other investments and the composition of unrealized appreciation and depreciation of securities and other investments for federal income tax purposes as of July 31, 2012 are noted in the following table. The primary difference between book and tax appreciation or depreciation of securities and other investments, if applicable, is attributable to the tax deferral of losses or tax realization of financial statement unrealized gain or loss.
| | | | |
| Federal tax cost of securities | | $ | 1,216,182,2291 | |
| | |
|
|
|
| Gross unrealized appreciation | | $ | 104,668,505 | |
| Gross unrealized depreciation | | | (121,566,415 | ) |
| | |
|
|
|
| Net unrealized depreciation | | $ | (16,897,910 | ) |
| | |
|
|
|
1. The Federal tax cost of securities does not include cost of $158,079,778 which has otherwise been recognized for financial reporting purposes, related to bonds placed into trusts in conjunction with certain investment transactions. See the Inverse Floating Rate Securities note above.
Trustees’ Compensation. The Fund has adopted an unfunded retirement plan (the “Plan”) for the Fund’s independent trustees. Benefits are based on years of service and fees paid to each trustee during their period of service. The Plan was frozen with respect to adding new participants effective December 31, 2006 (the “Freeze Date”) and existing Plan Participants as of the Freeze Date will continue to receive accrued benefits under the Plan. Active independent trustees as of the Freeze Date have each elected a distribution method with respect to their benefits under the Plan. During the year ended July 31, 2012, the Fund’s projected benefit obligations, payments to retired trustees and accumulated liability were as follows:
| | | | |
| Projected Benefit Obligations Increased | | $ | 9,105 | |
| Payments Made to Retired Trustees | | | 10,861 | |
| Accumulated Liability as of July 31, 2012 | | | 79,823 | |
The Board of Trustees has adopted a compensation deferral plan for independent trustees that enables trustees to elect to defer receipt of all or a portion of the annual compensation they are entitled to receive from the Fund. For purposes of determining the amount owed to the Trustee under the plan, deferred amounts are treated as though equal dollar amounts had been invested in shares of the Fund or in other Oppenheimer funds selected by the Trustee. The Fund purchases shares of the funds selected for deferral by the Trustee in amounts equal to his or her deemed investment, resulting in a Fund asset equal to the deferred compensation liability. Such assets are included as a
| | | | |
| 53 | | | | OPPENHEIMER PENNSYLVANIA MUNICIPAL FUND |
NOTES TO FINANCIAL STATEMENTS Continued
1. Significant Accounting Policies Continued
component of “Other” within the asset section of the Statement of Assets and Liabilities. Deferral of trustees’ fees under the plan will not affect the net assets of the Fund, and will not materially affect the Fund’s assets, liabilities or net investment income per share. Amounts will be deferred until distributed in accordance with the compensation deferral plan.
Dividends and Distributions to Shareholders. Dividends and distributions to shareholders, which are determined in accordance with income tax regulations and may differ from U.S. generally accepted accounting principles, are recorded on the ex-dividend date. Income distributions, if any, are declared daily and paid monthly. Capital gain distributions, if any, are declared and paid annually.
Investment Income. Interest income is recognized on an accrual basis. Discount and premium, which are included in interest income on the Statement of Operations, are amortized or accreted daily.
Custodian Fees. “Custodian fees and expenses” in the Statement of Operations may include interest expense incurred by the Fund on any cash overdrafts of its custodian account during the period. Such cash overdrafts may result from the effects of failed trades in portfolio securities and from cash outflows resulting from unanticipated shareholder redemption activity. The Fund pays interest to its custodian on such cash overdraft at a rate equal to the 1 Month LIBOR Rate plus 2.00%. The “Reduction to custodian expenses” line item, if applicable, represents earnings on cash balances maintained by the Fund during the period. Such interest expense and other custodian fees may be paid with these earnings.
Security Transactions. Security transactions are recorded on the trade date. Realized gains and losses on securities sold are determined on the basis of identified cost.
Indemnifications. The Fund’s organizational documents provide current and former trustees and officers with a limited indemnification against liabilities arising in connection with the performance of their duties to the Fund. In the normal course of business, the Fund may also enter into contracts that provide general indemnifications. The Fund’s maximum exposure under these arrangements is unknown as this would be dependent on future claims that may be made against the Fund. The risk of material loss from such claims is considered remote.
Other. The preparation of financial statements in conformity with accounting principles generally accepted in the United States of America requires management to make estimates and assumptions that affect the reported amounts of assets and liabilities and disclosure of contingent assets and liabilities at the date of the financial statements and the reported amounts of increases and decreases in net assets from operations during the reporting period. Actual results could differ from those estimates.
| | | | |
| 54 | | | | OPPENHEIMER PENNSYLVANIA MUNICIPAL FUND |
2. Securities Valuation
The Fund calculates the net asset value of its shares as of the close of the New York Stock Exchange (the “Exchange”), normally 4:00 P.M. Eastern time, on each day the Exchange is open for trading.
The Fund’s Board has adopted procedures for the valuation of the Fund’s securities and has delegated the day-to-day responsibility for valuation determinations under those procedures to the Manager. The Manager has established a Valuation Committee which is responsible for determining a “fair valuation” for any security for which market quotations are not “readily available.” The Valuation Committee’s fair valuation determinations are subject to review, approval and ratification by the Fund’s Board at its next regularly scheduled meeting covering the calendar quarter in which the fair valuation was determined.
Valuation Methods and Inputs
Securities are valued using unadjusted quoted market prices, when available, as supplied primarily by third party pricing services or dealers.
The following methodologies are used to determine the market value or the fair value of the types of securities described below:
Securities traded on a registered U.S. securities exchange (including exchange-traded derivatives other than futures and futures options) are valued based on the last sale price of the security reported on the principal exchange on which it is traded, prior to the time when the Fund’s assets are valued. In the absence of a sale, the security is valued at the last sale price on the prior trading day, if it is within the spread of the current day’s closing “bid” and “asked” prices, and if not, at the current day’s closing bid price. A security of a foreign issuer traded on a foreign exchange but not listed on a registered U.S. securities exchange is valued based on the last sale price on the principal exchange on which the security is traded, as identified by the third party pricing service used by the Manager, prior to the time when the Fund’s assets are valued. If the last sale price is unavailable, the security is valued at the most recent official closing price on the principal exchange on which it is traded. If the last sales price or official closing price for a foreign security is not available, the security is valued at the mean between the bid and asked price per the exchange or, if not available from the exchange, obtained from two dealers. If bid and asked prices are not available from either the exchange or two dealers, the security is valued by using one of the following methodologies (listed in order of priority); (1) using a bid from the exchange, (2) the mean between the bid and asked price as provided by a single dealer, or (3) a bid from a single dealer.
Shares of a registered investment company that are not traded on an exchange are valued at that investment company’s net asset value per share.
Corporate and government debt securities (of U.S. or foreign issuers) and municipal debt securities, event-linked bonds, loans, mortgage-backed securities, collateralized mortgage obligations, and asset-backed securities are valued at the mean between the “bid” and “asked” prices utilizing evaluated prices obtained from third party pricing services or broker-dealers who may use matrix pricing methods to determine the evaluated prices.
| | | | |
| 55 | | | | OPPENHEIMER PENNSYLVANIA MUNICIPAL FUND |
NOTES TO FINANCIAL STATEMENTS Continued
2. Securities Valuation Continued
Short-term money market type debt securities with a remaining maturity of sixty days or less are valued at cost adjusted by the amortization of discount or premium to maturity (amortized cost), which approximates market value. Short-term debt securities with a remaining maturity in excess of sixty days are valued at the mean between the “bid” and “asked” prices utilizing evaluated prices obtained from third party pricing services or broker-dealers.
A description of the standard inputs that may generally be considered by the third party pricing vendors in determining their evaluated prices is provided below.
| | |
| Security Type | | Standard inputs generally considered by third-party pricing vendors |
| Corporate debt, government debt, municipal, mortgage-backed and asset-backed securities | | Reported trade data, broker-dealer price quotations, benchmark yields, issuer spreads on comparable securities, the credit quality, yield, maturity, and other appropriate factors. |
| Loans | | Information obtained from market participants regarding reported trade data and broker-dealer price quotations. |
| Event-linked bonds | | Information obtained from market participants regarding reported trade data and broker-dealer price quotations. |
If a market value or price cannot be determined for a security using the methodologies described above, or if, in the “good faith” opinion of the Manager, the market value or price obtained does not constitute a “readily available market quotation,” or a significant event has occurred that would materially affect the value of the security the security is fair valued either (i) by a standardized fair valuation methodology applicable to the security type or the significant event as previously approved by the Valuation Committee and the Fund’s Board or (ii) as determined in good faith by the Manager’s Valuation Committee. The Valuation Committee considers all relevant facts that are reasonably available, through either public information or information available to the Manager, when determining the fair value of a security. Fair value determinations by the Manager are subject to review, approval and ratification by the Fund’s Board at its next regularly scheduled meeting covering the calendar quarter in which the fair valuation was determined. Those fair valuation standardized methodologies include, but are not limited to, valuing securities at the last sale price or initially at cost and subsequently adjusting the value based on: changes in company specific fundamentals, changes in an appropriate securities index, or changes in the value of similar securities which may be further adjusted for any discounts related to security-specific resale restrictions. When possible, such methodologies use observable market inputs such as unadjusted quoted prices of similar securities, observable interest rates, currency rates and yield curves. The methodologies used for valuing securities are not necessarily an indication of the risks associated with investing in those securities nor can it be assured that the Fund can obtain the fair value assigned to a security if it were to sell the security.
To assess the continuing appropriateness of security valuations, the Manager, or its third party service provider who is subject to oversight by the Manager, regularly compares prior day prices, prices on comparable securities, and sale prices to the current day prices and
| | | | |
| 56 | | | | OPPENHEIMER PENNSYLVANIA MUNICIPAL FUND |
challenges those prices exceeding certain tolerance levels with the third party pricing service or broker source. For those securities valued by fair valuations, whether through a standardized fair valuation methodology or a fair valuation determination, the Valuation Committee reviews and affirms the reasonableness of the valuations based on such methodologies and fair valuation determinations on a regular basis after considering all relevant information that is reasonably available.
Classifications
Each investment asset or liability of the Fund is assigned a level at measurement date based on the significance and source of the inputs to its valuation. Various data inputs are used in determining the value of each of the Fund’s investments as of the reporting period end. These data inputs are categorized in the following hierarchy under applicable financial accounting standards:
| 1) | | Level 1—unadjusted quoted prices in active markets for identical assets or liabilities (including securities actively traded on a securities exchange) |
| 2) | | Level 2—inputs other than unadjusted quoted prices that are observable for the asset or liability (such as unadjusted quoted prices for similar assets and market corroborated inputs such as interest rates, prepayment speeds, credit risks, etc.) |
| 3) | | Level 3—significant unobservable inputs (including the Manager’s own judgments about assumptions that market participants would use in pricing the asset or liability). |
The inputs used for valuing securities are not necessarily an indication of the risks associated with investing in those securities.
The table below categorizes amounts that are included in the Fund’s Statement of Assets and Liabilities as of July 31, 2012 based on valuation input level:
| | | | | | | | | | | | | | | | | | | | |
| | | Level 1—
Unadjusted
Quoted Prices | | Level 2—
Other Significant
Observable Inputs | | Level 3—
Significant
Unobservable
Inputs | | Value |
| Assets Table | | | | | | | | | | | | | | | | | | | | |
| Investments, at Value: | | | | | | | | | | | | | | | | | | | | |
| Municipal Bonds and Notes | | | | | | | | | | | | | | | | | | | | |
Pennsylvania | | | $ | — | | | | $ | 1,034,057,049 | | | | $ | — | | | | $ | 1,034,057,049 | |
U.S. Possessions | | | | — | | | | | 323,307,048 | | | | | — | | | | | 323,307,048 | |
| | | |
|
|
|
| Total Assets | | | $ | — | | | | $ | 1,357,364,097 | | | | $ | — | | | | $ | 1,357,364,097 | |
| | | |
|
|
|
There have been no significant changes to the fair valuation methodologies of the Fund during the period.
| | | | |
| 57 | | | | OPPENHEIMER PENNSYLVANIA MUNICIPAL FUND |
NOTES TO FINANCIAL STATEMENTS Continued
3. Shares of Beneficial Interest
The Fund has authorized an unlimited number of no par value shares of beneficial interest of each class. Transactions in shares of beneficial interest were as follows:
| | | | | | | | | | | | | | | | |
| | | Year Ended July 31, 2012 | | | Year Ended July 29, 20111 | |
| | | Shares | | | Amount | | | Shares | | | Amount | |
| Class A | | | | | | | | | | | | | | | | |
| Sold | | | 9,459,222 | | | $ | 105,245,449 | | | | 8,958,293 | | | $ | 95,825,137 | |
| Dividends and/or distributions reinvested | | | 3,121,793 | | | | 34,687,453 | | | | 2,964,502 | | | | 31,336,558 | |
| Redeemed | | | (11,486,531 | ) | | | (126,784,962 | ) | | | (18,273,952 | ) | | | (191,256,783 | ) |
| | |
|
|
|
| Net increase (decrease) | | | 1,094,484 | | | $ | 13,147,940 | | | | (6,351,157 | ) | | $ | (64,095,088 | ) |
| | |
|
|
|
| | | | | | | | | | | | | | | | | |
| Class B | | | | | | | | | | | | | | | | |
| Sold | | | 494,957 | | | $ | 5,475,955 | | | | 560,179 | | | $ | 5,960,996 | |
| Dividends and/or distributions reinvested | | | 169,735 | | | | 1,881,338 | | | | 202,689 | | | | 2,144,251 | |
| Redeemed | | | (1,616,427 | ) | | | (17,789,008 | ) | | | (2,441,536 | ) | | | (25,783,755 | ) |
| | |
|
|
|
| Net decrease | | | (951,735 | ) | | $ | (10,431,715 | ) | | | (1,678,668 | ) | | $ | (17,678,508 | ) |
| | |
|
|
|
| | | | | | | | | | | | | | | | | |
| Class C | | | | | | | | | | | | | | | | |
| Sold | | | 5,093,656 | | | $ | 56,692,049 | | | | 3,427,599 | | | $ | 36,701,253 | |
| Dividends and/or distributions reinvested | | | 1,091,972 | | | | 12,119,353 | | | | 988,382 | | | | 10,432,273 | |
| Redeemed | | | (3,395,650 | ) | | | (37,516,329 | ) | | | (6,299,300 | ) | | | (65,867,534 | ) |
| | |
|
|
|
| Net increase (decrease) | | | 2,789,978 | | | $ | 31,295,073 | | | | (1,883,319 | ) | | $ | (18,734,008 | ) |
| | |
|
|
|
| | | | | | | | | | | | | | | | | |
| Class Y | | | | | | | | | | | | | | | | |
| Sold | | | 1,724,445 | | | $ | 19,024,517 | | | | 1,202,585 | | | $ | 12,263,088 | |
| Dividends and/or distributions reinvested | | | 75,217 | | | | 839,739 | | | | 19,116 | | | | 199,820 | |
| Redeemed | | | (447,069 | ) | | | (4,976,242 | ) | | | (73,748 | ) | | | (756,565 | ) |
| | |
|
|
|
| Net increase | | | 1,352,593 | | | $ | 14,888,014 | | | | 1,147,953 | | | $ | 11,706,343 | |
| | |
|
|
|
1. For the year ended July 29, 2011, for Class A, B, and C shares, and for the period from November 29, 2010 (inception of offering) to July 29, 2011 for Class Y shares.
4. Purchases and Sales of Securities
The aggregate cost of purchases and proceeds from sales of securities, other than short-term obligations, for the year ended July 31, 2012, were as follows:
| | | | | | | | |
| | | Purchases | | | Sales | |
| Investment securities | | $ | 202,597,134 | | | $ | 183,605,824 | |
| | | | |
| 58 | | | | OPPENHEIMER PENNSYLVANIA MUNICIPAL FUND |
5. Fees and Other Transactions with Affiliates
Management Fees. Under the investment advisory agreement, the Fund pays the Manager a management fee based on the daily net assets of the Fund at an annual rate as shown in the following table:
| | | | |
| Fee Schedule | | | |
| Up to $200 million | | | 0.60 | % |
| Next $100 million | | | 0.55 | |
| Next $200 million | | | 0.50 | |
| Next $250 million | | | 0.45 | |
| Next $250 million | | | 0.40 | |
| Over $1 billion | | | 0.35 | |
Administration Service Fees. The Fund pays the Manager a fee of $1,500 per year for preparing and filing the Fund’s tax returns.
Transfer Agent Fees. OppenheimerFunds Services (“OFS”), a division of the Manager, acts as the transfer and shareholder servicing agent for the Fund. The Fund pays OFS a per account fee. For the year ended July 31, 2012, the Fund paid $581,779 to OFS for services to the Fund.
Additionally, Class Y shares are subject to minimum fees of $10,000 annually for assets of $10 million or more. The Class Y shares are subject to the minimum fees in the event that the per account fee does not equal or exceed the applicable minimum fees. OFS may voluntarily waive the minimum fees.
Distribution and Service Plan (12b-1) Fees. Under its General Distributor’s Agreement with the Fund, OppenheimerFunds Distributor, Inc. (the “Distributor”) acts as the Fund’s principal underwriter in the continuous public offering of the Fund’s classes of shares.
Service Plan for Class A Shares. The Fund has adopted a Service Plan (the “Plan”) for Class A shares under Rule 12b-1 of the Investment Company Act of 1940. Under the Plan, the Fund reimburses the Distributor for a portion of its costs incurred for services provided to accounts that hold Class A shares. Reimbursement is made periodically at an annual rate of up to 0.15% of the daily net assets of Class A shares of the Fund. The Distributor currently uses all of those fees to pay dealers, brokers, banks and other financial institutions periodically for providing personal service and maintenance of accounts of their customers that hold Class A shares. Any unreimbursed expenses the Distributor incurs with respect to Class A shares in any fiscal year cannot be recovered in subsequent periods. Fees incurred by the Fund under the Plan are detailed in the Statement of Operations.
Distribution and Service Plans for Class B and Class C Shares. The Fund has adopted Distribution and Service Plans (the “Plans”) for Class B and Class C shares under Rule 12b-1 of the Investment Company Act of 1940 to compensate the Distributor for its services in connection with the distribution of those shares and servicing accounts. Under the Plans, the Fund pays the Distributor an annual asset-based sales charge of 0.75% on Class B and Class C shares daily net assets. The Distributor also receives a service fee of 0.15% per year
| | | | |
| 59 | | | | OPPENHEIMER PENNSYLVANIA MUNICIPAL FUND |
NOTES TO FINANCIAL STATEMENTS Continued
5. Fees and Other Transactions with Affiliates Continued
under each plan. If either the Class B or Class C plan is terminated by the Fund or by the shareholders of a class, the Board of Trustees and its independent trustees must determine whether the Distributor shall be entitled to payment from the Fund of all or a portion of the service fee and/or asset-based sales charge in respect to shares sold prior to the effective date of such termination. Fees incurred by the Fund under the Plans are detailed in the Statement of Operations. The Distributor determines its uncompensated expenses under the Plans at calendar quarter ends. The Distributor’s aggregate uncompensated expenses under the Plans at June 30, 2012 were as follows:
| | | | |
| Class B | | $ | 3,051,846 | |
| Class C | | | 5,646,514 | |
Sales Charges. Front-end sales charges and contingent deferred sales charges (“CDSC”) do not represent expenses of the Fund. They are deducted from the proceeds of sales of Fund shares prior to investment or from redemption proceeds prior to remittance, as applicable. The sales charges retained by the Distributor from the sale of shares and the CDSC retained by the Distributor on the redemption of shares is shown in the following table for the period indicated.
| | | | | | | | | | | | | | | | |
| Year Ended | | Class A Front-End
Sales Charges
Retained by
Distributor | | | Class A
Contingent
Deferred
Sales Charges
Retained by
Distributor | | | Class B Contingent
Deferred
Sales Charges
Retained by
Distributor | | | Class C
Contingent
Deferred
Sales Charges
Retained by
Distributor | |
| July 31, 2012 | | $ | 311,260 | | | $ | — | | | $ | 55,092 | | | $ | 12,960 | |
Waivers and Reimbursements of Expenses. The Manager has voluntarily agreed to reimburse the Fund for a portion of the legal costs and fees incurred in connection with the pending litigation matters discussed in the “Pending Litigation” note which appears later in this report. During the year ended July 31, 2012, the Manager reimbursed the Fund $88,701 for legal costs and fees.
OFS has voluntarily agreed to limit transfer and shareholder servicing agent fees for Classes B, C and Y shares to 0.35% of average annual net assets per class; this limit also applied to Class A shares prior to October 1, 2011. Effective October 1, 2011, OFS has voluntarily agreed to limit its fees for Class A shares to 0.30% of average annual net assets of the class.
Some of these undertakings may be modified or terminated at any time; some may not be modified or terminated until after one year from the date of the current prospectus, as indicated therein.
6. Borrowings
The Fund can borrow money from banks in amounts up to one third of its total assets (including the amount borrowed) less all liabilities and indebtedness other than borrowings (meaning that the value of those assets must be at least 300% of the amount borrowed). The Fund can use those borrowings for investment-related purposes such as
| | | | |
| 60 | | | | OPPENHEIMER PENNSYLVANIA MUNICIPAL FUND |
purchasing portfolio securities. The Fund also may borrow to meet redemption obligations or for temporary and emergency purposes. When the Fund invests borrowed money in portfolio securities, it is using a speculative investment technique known as leverage and changes in the value of the Fund’s investments will have a larger effect on its share price than if it did not borrow because of the effect of leverage.
The Fund can also use the borrowings for other investment-related purposes, including in connection with the Fund’s inverse floater investments as discussed in Note 1. The Fund may use the borrowings to reduce the leverage amount of, or unwind or “collapse” trusts that issued “inverse floaters” owned by the Fund, or in circumstances in which the Fund has entered into a shortfall and forbearance agreement with the sponsor of the inverse floater trust to meet the Fund’s obligation to reimburse the sponsor of the inverse floater for the difference between the liquidation value of the underlying bond and the amount due to holders of the short-term floating rate notes issued by the Trust. See the discussion in Note 1 (Inverse Floating Rate Securities) for additional information.
The Fund will pay interest and may pay other fees in connection with loans. If the Fund does borrow, it will be subject to greater expenses than funds that do not borrow. The interest on borrowed money and the other fees incurred in conjunction with loans are an expense that might reduce the Fund’s yield and return. Expenses incurred by the Fund with respect to interest on borrowings and commitment fees are disclosed separately or as other expenses on the Statement of Operations.
The Fund entered into a Revolving Credit and Security Agreement (the “Agreement”) with conduit lenders and Citibank N.A. which enables it to participate with certain other Oppenheimer funds in a committed, secured borrowing facility that permits borrowings of up to $2.0 billion, collectively, by the Oppenheimer Rochester Funds. To secure the loan, the Fund pledges investment securities in accordance with the terms of the Agreement. Securities held in collateralized accounts to cover these borrowings are noted in the Statement of Investments. Interest is charged to the Fund, based on its borrowings, at current commercial paper issuance rates (0.3384% as of July 31, 2012). The Fund pays additional fees annually to its lender on its outstanding borrowings to manage and administer the facility and is allocated its pro-rata share of an annual structuring fee and ongoing commitment fees both of which are based on the total facility size. Total fees and interest that are included in expenses on the Fund’s Statement of Operations related to its participation in the borrowing facility during the year ended July 31, 2012 equal 0.09% of the Fund’s average net assets on an annualized basis. The Fund has the right to prepay such loans and terminate its participation in the conduit loan facility at any time upon prior notice.
As of July 31, 2012, the Fund had borrowings outstanding at an interest rate of 0.3384%. Details of the borrowings for the year ended July 31, 2012 are as follows:
| | | | |
| Average Daily Loan Balance | | $ | 16,338,525 | |
| Average Daily Interest Rate | | | 0.267 | % |
| Fees Paid | | $ | 977,263 | |
| Interest Paid | | $ | 40,945 | |
| | | | |
| 61 | | | | OPPENHEIMER PENNSYLVANIA MUNICIPAL FUND |
NOTES TO FINANCIAL STATEMENTS Continued
7. Reverse Repurchase Agreements
The Fund may engage in reverse repurchase agreements. A reverse repurchase agreement is the sale of one or more securities to a counterparty at an agreed-upon purchase price with the simultaneous agreement to repurchase those securities on a future date at a higher repurchase price. The repurchase price represents the repayment of the purchase price and interest accrued thereon over the term of the repurchase agreement. The cash received by the Fund in connection with a reverse repurchase agreement may be used for investment-related purposes such as purchasing portfolio securities or for other purposes such as those described in the preceding “Borrowings” note.
The Fund entered into a Committed Repurchase Transaction Facility (the “Facility”) with J.P. Morgan Securities LLC (the “counterparty’) which enables it to participate with certain other Oppenheimer funds in a committed reverse repurchase agreement facility that permits aggregate outstanding reverse repurchase agreements of up to $750 million, collectively. Interest is charged to the Fund on the purchase price of outstanding reverse repurchase agreements at current LIBOR rates plus an applicable spread. The Fund is also allocated its pro-rata share of an annual structuring fee based on the total Facility size and ongoing commitment fees based on the total unused amount of the Facility. The Fund retains the economic exposure to fluctuations in the value of securities subject to reverse repurchase agreements under the Facility and therefore these transactions are considered secured borrowings for financial reporting purposes. The Fund also continues to receive the economic benefit of interest payments received on securities subject to reverse repurchase agreements, in the form of a direct payment from the counterparty. These payments are included in interest income on the Statement of Operations. Total fees and interest related to the Fund’s participation in the Facility during the year ended July 31, 2012 are included in expenses on the Fund’s Statement of Operations and equal 0.03% of the Fund’s average net assets on an annualized basis.
The securities subject to reverse repurchase agreements under the Facility are valued on a daily basis. To the extent this value, after adjusting for certain margin requirements of the Facility, exceeds the cash proceeds received, the Fund may request the counterparty to return securities equal in margin value to this excess. To the extent that the cash proceeds received exceed the margin value of the securities subject to the transaction, the counterparty may request additional securities from the Fund. The Fund has the right to declare the first or fifteenth day of any calendar month as the repurchase date for any outstanding reverse repurchase agreement upon delivery of advanced notification and may also recall any security subject to such a transaction by substituting eligible securities of equal or greater margin value according to the Facility’s terms.
The Fund executed no transactions under the Facility during the year ended July 31, 2012.
8. Pending Litigation
Since 2009, a number of class action, derivative and individual lawsuits have been pending in federal and state courts against OppenheimerFunds, Inc., the Fund’s investment advisor
| | | | |
| 62 | | | | OPPENHEIMER PENNSYLVANIA MUNICIPAL FUND |
(the “Manager”), OppenheimerFunds Distributor, Inc., the Fund’s principal underwriter and distributor (the “Distributor”), and certain funds – including the Fund—advised by the Manager and distributed by the Distributor (the “Defendant Funds”). Several of these lawsuits also name as defendants certain officers and current and former trustees of the respective Defendant Funds. The lawsuits raise claims under federal securities law and allege, among other things, that the disclosure documents of the respective Defendant Funds contained misrepresentations and omissions and that the respective Defendant Funds’ investment policies were not followed. The plaintiffs in these actions seek unspecified damages, equitable relief and awards of attorneys’ fees and litigation expenses. The Defendant Funds’ Boards of Trustees have also engaged counsel to represent the Funds and the present and former Independent Trustees named in those suits.
Other class action and individual lawsuits have been filed since 2008 in various state and federal courts against the Manager and certain of its affiliates by investors seeking to recover investments they allegedly lost as a result of the “Ponzi” scheme run by Bernard L. Madoff and his firm, Bernard L. Madoff Investment Securities, LLC (“BLMIS”). Plaintiffs in these suits allege that they suffered losses as a result of their investments in several funds managed by an affiliate of the Manager and assert a variety of claims, including breach of fiduciary duty, fraud, negligent misrepresentation, unjust enrichment, and violation of federal and state securities laws and regulations, among others. They seek unspecified damages, equitable relief and awards of attorneys’ fees and litigation expenses. Neither the Distributor, nor any of the Oppenheimer mutual funds, their independent trustees or directors are named as defendants in these lawsuits. None of the Oppenheimer mutual funds invested in any funds or accounts managed by Madoff or BLMIS. On February 28, 2011, a stipulation of partial settlement of three groups of consolidated putative class action lawsuits relating to these matters was filed in the U.S. District Court for the Southern District of New York. On August 19, 2011, the court entered an order and final judgment approving the settlement as fair, reasonable and adequate. In September 2011, certain parties filed notices of appeal from the court’s order approving the settlement. On July 29, 2011, a stipulation of settlement between certain affiliates of the Manager and the Trustee appointed under the Securities Investor Protection Act to liquidate BLMIS was filed in the U.S. Bankruptcy Court for the Southern District of New York to resolve purported preference and fraudulent transfer claims by the Trustee. On September 22, 2011, the court entered an order approving the settlement as fair, reasonable and adequate. In October 2011, certain parties filed notices of appeal from the court’s order approving the settlement. In June 2012, the court granted appellees’ motion to dismiss the appeal. The aforementioned settlements do not resolve other outstanding lawsuits against the Manager and its affiliates relating to BLMIS.
On April 16, 2010, a lawsuit was filed in New York state court against the Manager, an affiliate of the Manager and AAArdvark IV Funding Limited (“AAArdvark IV”), an entity advised by the Manager’s affiliate, in connection with investments made by the plaintiffs in AAArdvark IV. Plaintiffs allege breach of contract against the defendants and seek compensatory damages, costs and disbursements, including attorney fees. On July 15, 2011,
| | | | |
| 63 | | | | OPPENHEIMER PENNSYLVANIA MUNICIPAL FUND |
NOTES TO FINANCIAL STATEMENTS Continued
8. Pending Litigation Continued
a lawsuit was filed in New York state court against the Manager, an affiliate of the Manager and AAArdvark Funding Limited (“AAArdvark I”), an entity advised by the Manager’s affiliate, in connection with investments made by the plaintiffs in AAArdvark I. The complaint alleges breach of contract against the defendants and seeks compensatory damages, costs and disbursements, including attorney fees. On November 9, 2011, a lawsuit was filed in New York state court against the Manager, an affiliate of the Manager and AAArdvark XS Funding Limited (“AAArdvark XS”), an entity advised by the Manager’s affiliate, in connection with investments made by the plaintiffs in AAArdvark XS. The complaint alleges breach of contract against the defendants and seeks compensatory damages, costs and disbursements, including attorney fees.
The Manager believes the lawsuits and appeals described above are without legal merit and, with the exception of actions it has settled, is defending against them vigorously. While it is premature to render any opinion as to the outcome in these lawsuits, or whether any costs that the Defendant Funds may bear in defending the suits might not be reimbursed by insurance, the Manager believes that these suits should not impair the ability of the Manager or the Distributor to perform their respective duties to the Fund, and that the outcome of all of the suits together should not have any material effect on the operations of any of the Oppenheimer mutual funds.
| | | | |
| 64 | | | | OPPENHEIMER PENNSYLVANIA MUNICIPAL FUND |
REPORT OF INDEPENDENT REGISTERED PUBLIC ACCOUNTING FIRM
The Board of Trustees and Shareholders of Oppenheimer Multi-State Municipal Trust:
We have audited the accompanying statement of assets and liabilities of Oppenheimer Pennsylvania Municipal Fund (a separate series of Oppenheimer Multi-State Municipal Trust), including the statement of investments, as of July 31, 2012, and the related statements of operations and cash flows for the year then ended, the statements of changes in net assets for each of the years or periods in the two-year period then ended, and the financial highlights for each of the years in the five-year period then ended. These financial statements and financial highlights are the responsibility of the Fund’s management. Our responsibility is to express an opinion on these financial statements and financial highlights based on our audits.
We conducted our audits in accordance with the standards of the Public Company Accounting Oversight Board (United States). Those standards require that we plan and perform the audit to obtain reasonable assurance about whether the financial statements and financial highlights are free of material misstatement. An audit includes examining, on a test basis, evidence supporting the amounts and disclosures in the financial statements. Our procedures included confirmation of securities owned as of July 31, 2012, by correspondence with the custodian, and brokers, or by other appropriate auditing procedures where replies from brokers were not received. An audit also includes assessing the accounting principles used and significant estimates made by management, as well as evaluating the overall financial statement presentation. We believe that our audits provide a reasonable basis for our opinion.
In our opinion, the financial statements and financial highlights referred to above present fairly, in all material respects, the financial position of Oppenheimer Pennsylvania Municipal Fund as of July 31, 2012, the results of its operations and cash flows for the year then ended, the changes in its net assets for each of the years or periods in the two-year period then ended, and the financial highlights for each of the years in the five-year period then ended, in conformity with U.S. generally accepted accounting principles.
KPMG LLP
Denver, Colorado
September 17, 2012
| | | | |
| 65 | | | | OPPENHEIMER PENNSYLVANIA MUNICIPAL FUND |
CREDIT ALLOCATION Unaudited
This table provides further information regarding the “Unrated” securities category shown in the “Credit Allocation-Credit Rating Breakdown” table located earlier in this report. The third column below titled “Unrated by a NRSRO; Internally Rated by the Manager” shows the credit allocation of Unrated securities as determined by the Fund’s investment adviser, OppenheimerFunds, Inc. (the “Manager”). These internally rated securities are not rated by any nationally recognized statistical rating organization (NRSRO), such as Standard & Poor’s.
The Manager determines the credit allocation of these securities using its own credit analysis to assign ratings using a rating scale or categories similar to that used by S&P. The Manager is not required to, and does not attempt to, employ the same credit analysis process, procedures or methodologies used by S&P or any other NRSRO in assigning a credit rating to an Unrated security. There can be no assurance, nor is it intended, that the Manager’s credit analysis process is consistent or comparable with the credit analysis process that would be used by S&P or any other NRSRO if it were to rate the same security. Securities rated investment-grade or above by the Manager may or may not be the equivalent to an investment grade or above rating assigned by an NRSRO. More information about the Manager’s internal credit analysis process for Unrated (or internally-rated) securities and securities ratings is contained in the Fund’s Prospectus and Statement of Additional Information.
The second column below titled “NRSRO-Rated” shows the ratings by nationally recognized statistical rating organizations (NRSROs), such as Standard & Poor’s. For securities rated by an NRSRO other than S&P, the Manager converts that rating to the equivalent S&P rating. If two or more NRSROs have assigned a rating to a security, the highest rating is used.
The credit allocations below are as of July 31, 2012 and are subject to change. The percentages are based on the market value of the Fund’s securities as of July 31, 2012 and are subject to change; market value does not include cash. AAA, AA, A, and BBB are investment-grade ratings.
| | | | | | | | | | | | |
| | | NRSRO—Rated | | | Unrated by
a NRSRO;
Internally
Rated by
the
Manager | | | Total | |
| AAA | | | 0.0 | % | | | 0.0 | % | | | 0.0 | % |
| AA | | | 25.7 | | | | 0.8 | | | | 26.5 | |
| A | | | 10.0 | | | | 0.0 | | | | 10.0 | |
| BBB | | | 42.7 | | | | 4.9 | | | | 47.6 | |
| BB or lower | | | 6.1 | | | | 9.8 | | | | 15.9 | |
| | |
|
|
|
| Total | | | 84.5 | % | | | 15.5 | % | | | 100.0 | % |
| | |
|
|
|
| | | | |
| 66 | | | | OPPENHEIMER PENNSYLVANIA MUNICIPAL FUND |
FEDERAL INCOME TAX INFORMATION Unaudited
In early 2012, if applicable, shareholders of record received information regarding all dividends and distributions paid to them by the Fund during calendar year 2011.
None of the dividends paid by the Fund during the fiscal year ended July 31, 2012 are eligible for the corporate dividend-received deduction. 99.35% of the dividends were derived from interest on municipal bonds and are not subject to federal income taxes. To the extent a shareholder is subject to any state or local tax laws, some or all of the dividends received may be taxable.
The foregoing information is presented to assist shareholders in reporting distributions received from the Fund to the Internal Revenue Service. Because of the complexity of the federal regulations which may affect your individual tax return and the many variations in state and local tax regulations, we recommend that you consult your tax advisor for specific guidance.
| | | | |
| 67 | | | | OPPENHEIMER PENNSYLVANIA MUNICIPAL FUND |
PORTFOLIO PROXY VOTING POLICIES AND PROCEDURES;
UPDATES TO STATEMENTS OF INVESTMENTS Unaudited
The Fund has adopted Portfolio Proxy Voting Policies and Procedures under which the Fund votes proxies relating to securities (“portfolio proxies”) held by the Fund. A description of the Fund’s Portfolio Proxy Voting Policies and Procedures is available (i) without charge, upon request, by calling the Fund toll-free at 1.800.CALL OPP (225.5677), (ii) on the Fund’s website at oppenheimerfunds.com, and (iii) on the SEC’s website at www.sec.gov. In addition, the Fund is required to file Form N-PX, with its complete proxy voting record for the 12 months ended June 30th, no later than August 31st of each year. The Fund’s voting record is available (i) without charge, upon request, by calling the Fund toll-free at 1.800.CALL OPP (225.5677), and (ii) in the Form N-PX filing on the SEC’s website at www.sec.gov.
The Fund files its complete schedule of portfolio holdings with the SEC for the first quarter and the third quarter of each fiscal year on Form N-Q. The Fund’s Form N-Q filings are available on the SEC’s website at www.sec.gov. Those forms may be reviewed and copied at the SEC’s Public Reference Room in Washington, D.C. Information on the operation of the Public Reference Room may be obtained by calling 1-800-SEC-0330.
Householding—Delivery of Shareholder Documents
This is to inform you about OppenheimerFunds’ “householding” policy. If more than one member of your household maintains an account in a particular fund, OppenheimerFunds will mail only one copy of the fund’s prospectus (or, if available, the fund’s summary prospectus), annual and semiannual report and privacy policy. The consolidation of these mailings, called householding, benefits your fund through reduced mailing expense, and benefits you by reducing the volume of mail you receive from Oppenheimer Funds. Householding does not affect the delivery of your account statements.
Please note that we will continue to household these mailings for as long as you remain an OppenheimerFunds shareholder, unless you request otherwise. If you prefer to receive multiple copies of these materials, please call us at 1.800.CALL-OPP (225-5677). You may also notify us in writing or via email. We will begin sending you individual copies of the prospectus (or, if available, the summary prospectus), reports and privacy policy within 30 days of receiving your request to stop householding.
| | | | |
| 68 | | | | OPPENHEIMER PENNSYLVANIA MUNICIPAL FUND |
TRUSTEES AND OFFICERS Unaudited
| | |
| Name, Position(s) Held with the Fund, Length of Service, Age | | Principal Occupation(s) During the Past 5 Years; Other Trusteeships/Directorships Held; Number of Portfolios in the Fund Complex Currently Overseen |
| |
| INDEPENDENT TRUSTEES | | The address of each Trustee in the chart below is 6803 S. Tucson Way, Centennial, Colorado 80112-3924. Each Trustee serves for an indefinite term, or until his or her resignation, retirement, death or removal. |
| |
Brian F. Wruble, Chairman of the Board of Trustees (since 2007), Trustee (since 2005) Age: 69 | | Director of Community Foundation of the Florida Keys (non-profit) (July 2012-June 2013); Chairman Emeritus and Non-Voting Trustee of The Jackson Laboratory (non-profit) (since August 2011); Director of Special Value Opportunities Fund, LLC (registered investment company) (affiliate of the Manager’s parent company) (since September 2004); Member of Zurich Financial Investment Management Advisory Council (insurance) (since 2004); Treasurer (since 2007) and Trustee of the Institute for Advanced Study (non-profit educational institute) (since May 1992); Chairman (August 2007-July 2011) and Trustee (August 1991-July 2011) of the Board of Trustees of The Jackson Laboratory (non-profit); General Partner of Odyssey Partners, L.P. (hedge fund) (September 1995-December 2007); Special Limited Partner of Odyssey Investment Partners, LLC (private equity investment) (January 1999-September 2004). Oversees 58 portfolios in the OppenheimerFunds complex. Mr. Wruble has served on the Boards of certain Oppenheimer funds since April 2001, during which time he has become familiar with the Fund’s (and other Oppenheimer funds’) financial, accounting, regulatory and investment matters and has contributed to the Boards’ deliberations. |
| |
David K. Downes, Trustee (since 2007) Age: 72 | | Director of THL Credit Inc. (since June 2009); Independent Chairman GSK Employee Benefit Trust (since April 2006); Trustee of Employee Trusts (since January 2006); Chief Executive Officer and Board Member of Community Capital Management (investment management company) (since January 2004); President of The Community Reinvestment Act Qualified Investment Fund (investment management company) (since 2004); Director of Internet Capital Group (information technology company) (since October 2003); Director of Correctnet (January 2006-2007); Independent Chairman of the Board of Trustees of Quaker Investment Trust (registered investment company) (2004-2007); Chief Operating Officer and Chief Financial Officer of Lincoln National Investment Companies, Inc. (subsidiary of Lincoln National Corporation, a publicly traded company) and Delaware Investments U.S., Inc. (investment management subsidiary of Lincoln National Corporation) (1993-2003); President, Chief Executive Officer and Trustee of Delaware Investment Family of Funds (1993-2003); President and Board Member of Lincoln National Convertible Securities Funds, Inc. and the Lincoln National Income Funds, TDC (1993-2003); Chairman and Chief Executive Officer of Retirement Financial Services, Inc. (registered transfer agent and investment adviser and subsidiary of Delaware Investments U.S., Inc.) (1993-2003); President and Chief Executive Officer of Delaware Service Company, Inc. (1995-2003); Chief Administrative Officer, Chief Financial Officer, Vice Chairman and Director of Equitable Capital Management Corporation (investment subsidiary of Equitable Life Assurance Society) (1985-1992); Corporate Controller of Merrill Lynch Company (financial services holding company) (1977-1985); held the following positions at the Colonial Penn Group, Inc. (insurance company): Corporate Budget Director (1974-1977), Assistant Treasurer (1972-1974) and Director of Corporate Taxes (1969-1972); held the following positions at Price Waterhouse Company (financial services firm): Tax Manager (1967-1969), Tax Senior (1965-1967) and Staff Accountant (1963-1965); United States Marine Corps (1957-1959). Oversees 58 portfolios in the OppenheimerFunds complex. Mr. Downes has served on the Boards of certain Oppenheimer funds since December 2005, |
| | | | |
| 69 | | | | OPPENHEIMER PENNSYLVANIA MUNICIPAL FUND |
TRUSTEES AND OFFICERS Unaudited / Continued
| | |
David K. Downes, Continued | | during which time he has become familiar with the Fund’s (and other Oppenheimer funds’) financial, accounting, regulatory and investment matters and has contributed to the Boards’ deliberations. |
| |
Matthew P. Fink, Trustee (since 2005) Age: 71 | | Trustee of the Committee for Economic Development (policy research foundation) (2005-2011); Director of ICI Education Foundation (education foundation) (October 1991-August 2006); President of the Investment Company Institute (trade association) (October 1991-June 2004); Director of ICI Mutual Insurance Company (insurance company) (October 1991-June 2004); Author of The Rise of Mutual Funds: An Insider’s View published by Oxford University Press (second edition 2010). Oversees 58 portfolios in the OppenheimerFunds complex. Mr. Fink has served on the Boards of certain Oppenheimer funds since January 2005, during which time he has become familiar with the Fund’s (and other Oppenheimer funds’) financial, accounting, regulatory and investment matters and has contributed to the Boards’ deliberations. |
| |
Phillip A. Griffiths, Trustee (since 1999) Age: 73 | | Fellow of the Carnegie Corporation (since 2007); Member of the National Academy of Sciences (since 1979); Council on Foreign Relations (since 2002); Foreign Associate of Third World Academy of Sciences (since 2002); Chair of Science Initiative Group (since 1999); Member of the American Philosophical Society (since 1996); Trustee of Woodward Academy (since 1983); Director of GSI Lumonics Inc. (precision technology products company) (2001-2010); Senior Advisor of The Andrew W. Mellon Foundation (2001-2010); Distinguished Presidential Fellow for International Affairs of the National Academy of Science (2002-2010); Director of the Institute for Advanced Study (1991-2004); Director of Bankers Trust New York Corporation (1994-1999); Provost at Duke University (1983-1991). Oversees 58 portfolios in the OppenheimerFunds complex. Mr. Griffiths has served on the Boards of certain Oppenheimer funds since June 1999, during which time he has become familiar with the Fund’s (and other Oppenheimer funds’) financial, accounting, regulatory and investment matters and has contributed to the Boards’ deliberations. |
| |
Mary F. Miller, Trustee (since 2004) Age: 69 | | Trustee of International House (not-for-profit) (since June 2007); Trustee of the American Symphony Orchestra (not-for-profit) (October 1998-November 2011); and Senior Vice President and General Auditor of American Express Company (financial services company) (July 1998-February 2003). Oversees 58 portfolios in the OppenheimerFunds complex. Ms. Miller has served on the Boards of certain Oppenheimer funds since August 2004, during which time she has become familiar with the Fund’s (and other Oppenheimer funds’) financial, accounting, regulatory and investment matters and has contributed to the Boards’ deliberations. |
| |
Joel W. Motley, Trustee (since 2002) Age: 60 | | Director of Southern Africa Legal Services Foundation (since March 2012); Board Member of Pulitzer Center for Crisis Reporting (non-profit journalism) (since December 2010); Managing Director of Public Capital Advisors, LLC (privately-held financial advisor) (since January 2006); Managing Director of Carmona Motley, Inc. (privately-held financial advisor) (since January 2002); Director of Columbia Equity Financial Corp. (privately-held financial advisor) (2002-2007); Managing Director of Carmona Motley Hoffman Inc. (privately-held financial advisor) (January 1998-December 2001); Member of the Finance and Budget Committee of the Council on Foreign Relations, Chairman of the Investment Committee of the Episcopal Church of America, Member of the Investment Committee and Board of Human Rights Watch and Member of the Investment Committee and Board of Historic Hudson Valley. Oversees 58 |
| | | | |
| 70 | | | | OPPENHEIMER PENNSYLVANIA MUNICIPAL FUND |
| | |
Joel W. Motley, Continued | | portfolios in the OppenheimerFunds complex. Mr. Motley has served on the Boards of certain Oppenheimer funds since October 2002, during which time he has become familiar with the Fund’s (and other Oppenheimer funds’) financial, accounting, regulatory and investment matters and has contributed to the Boards’ deliberations. |
| |
Mary Ann Tynan, Trustee (since 2008) Age: 66 | | Director and Secretary of the Appalachian Mountain Club (non-profit outdoor organization) (since January 2012); Director of Opera House Arts (non-profit arts organization) (since October 2011); Independent Director of the ICI Board of Governors (since October 2011); Vice Chair of Board of Trustees of Brigham and Women’s/Faulkner Hospitals (non-profit hospital) (since 2000); Chair of Board of Directors of Faulkner Hospital (non-profit hospital) (since 1990); Member of Audit and Compliance Committee of Partners Health Care System (non-profit) (since 2004); Board of Trustees of Middlesex School (educational institution) (since 1994); Board of Directors of Idealswork, Inc. (financial services provider) (since 2003); Partner, Senior Vice President and Director of Regulatory Affairs of Wellington Management Company, LLP (global investment manager) (1976-2002); Vice President and Corporate Secretary, John Hancock Advisers, Inc. (mutual fund investment adviser) (1970-1976). Oversees 58 portfolios in the OppenheimerFunds complex. Ms. Tynan has served on the Boards of certain Oppenheimer funds since October 2008, during which time she has become familiar with the Fund’s (and other Oppenheimer funds’) financial, accounting, regulatory and investment matters and has contributed to the Boards’ deliberations. |
| |
Joseph M. Wikler, Trustee (since 2005) Age: 71 | | Director of C-TASC (bio-statistics services) (2007-2012); formerly, Director of the following medical device companies: Medintec (1992-2011) and Cathco (1996-2011); Member of the Investment Committee of the Associated Jewish Charities of Baltimore (since 1994); Director of Lakes Environmental Association (environmental protection organization) (1996-2008); Director of Fortis/Hartford mutual funds (1994-December 2001). Oversees 58 portfolios in the OppenheimerFunds complex. Mr. Wikler has served on the Boards of certain Oppenheimer funds since August 2005, during which time he has become familiar with the Fund’s (and other Oppenheimer funds’) financial, accounting, regulatory and investment matters and has contributed to the Boards’ deliberations. |
| |
Peter I. Wold, Trustee (since 2005) Age: 64 | | Director of Arch Coal, Inc. (since 2010); Director and Chairman of Wyoming Enhanced Oil Recovery Institute Commission (enhanced oil recovery study) (since 2004); President of Wold Oil Properties, Inc. (oil and gas exploration and production company) (since 1994); Vice President of American Talc Company, Inc. (talc mining and milling) (since 1999); Managing Member of Hole-in-the-Wall Ranch (cattle ranching) (since 1979); Director and Chairman of the Denver Branch of the Federal Reserve Bank of Kansas City (1993-1999); and Director of PacifiCorp. (electric utility) (1995-1999). Oversees 58 portfolios in the OppenheimerFunds complex. Mr. Wold has served on the Boards of certain Oppenheimer funds since August 2005, during which time he has become familiar with the Fund’s (and other Oppenheimer funds’) financial, accounting, regulatory and investment matters and has contributed to the Boards’ deliberations. |
| | | | |
| 71 | | | | OPPENHEIMER PENNSYLVANIA MUNICIPAL FUND |
TRUSTEES AND OFFICERS Unaudited / Continued
| | |
| OFFICERS OF THE FUND | | The addresses of the Officers in the chart below are as follows: for Messrs. Glavin, Gabinet and Ms. Nasta, Two World Financial Center, 225 Liberty Street, New York, New York 10281-1008, for Messrs. Vandehey and Wixted, 6803 S. Tucson Way, Centennial, Colorado 80112-3924, for Messrs. Loughran, Cottier, Willis, DeMitry, Camarella, Pulire and Stein, 350 Linden Oaks, Rochester, New York 14625. Each Officer serves for an indefinite term or until his or her resignation, retirement, death or removal. |
| |
Daniel G. Loughran, Vice President (since 2005) Age: 48 | | Senior Vice President of the Manager (since July 2007); Vice President of the Manager (April 2001-June 2007) and a Portfolio Manager with the Manager (1999-2001). Team leader, a Senior Portfolio Manager, an officer and a trader for the Fund and other Oppenheimer funds. |
| |
Scott S. Cottier, Vice President (since 2005) Age: 40 | | Vice President of the Manager (since September 2002). Portfolio Manager and trader at Victory Capital Management (1999-2002). Senior Portfolio Manager, an officer and a trader for the Fund and other Oppenheimer funds. |
| |
Troy E. Willis, Vice President (since 2005) Age: 39 | | Vice President of the Manager (since July 2009); Assistant Vice President of the Manager (July 2005-June 2009). Portfolio Manager of the Manager (2003- 2005). Corporate Attorney for Southern Resource Group (1999-2003). Senior Portfolio Manager, an officer and a trader for the Fund and other Oppenheimer funds. |
| |
Mark R. DeMitry, Vice President (since 2009) Age: 36 | | Vice President of the Manager (since July 2009); Associate Portfolio Manager of the Fund (September 2006- June 2009). Research Analyst of the Manager (June 2003-September 2006) and a Credit Analyst of the Manager (July 2001-May 2003). Senior Portfolio Manager, an officer and a trader for the Fund and other Oppenheimer funds. |
| |
Michael L. Camarella, Vice President (since 2009) Age: 36 | | Vice President of the Manager (since January 2011); Assistant Vice President of the Manager (July 2009-December 2010); Associate Portfolio Manager of the Manager (January 2008-November 2010).). Research Analyst of the Manager (April 2006-December 2007) and a Credit Analyst of the Manager (June 2003-March 2006). Senior Portfolio Manager, an officer and a trader for the Fund and other Oppenheimer funds. |
| |
Charles S. Pulire, Vice President (since 2011) Age: 35 | | Assistant Vice President of the Manager (since December 2010); Research Analyst of the Manager (January 2008-November 2010); Credit Analyst of the Manager (May 2006-February 2008). Portfolio Manager, an officer and a trader for the Fund and other Oppenheimer funds. |
| |
Richard A. Stein, Vice President (since 2007) Age: 54 | | Director of the Rochester Credit Analysis team (since March 2004); Senior Vice President of the Manager (since June 2011) and a Vice President of the Manager (1997-May 2011); headed Rochester’s Credit Analysis team (since May 1993). |
| |
William F. Glavin, Jr., President and Principal Executive Officer (since 2009) Age: 53 | | Chairman of the Manager (since December 2009); Chief Executive Officer and Director of the Manager (since January 2009); President of the Manager (since May 2009); Director of Oppenheimer Acquisition Corp. (“OAC”) (the Manager’s parent holding company) (since June 2009); Executive Vice President (March 2006-February 2009) and Chief Operating Officer (July 2007-February 2009) of Massachusetts Mutual Life Insurance Company (OAC’s parent company); Director (May 2004-March 2006) and Chief Operating Officer and Chief Compliance Officer (May 2004-January 2005), President (January 2005-March 2006) and Chief Executive Officer (June 2005-March 2006) of BabsonCapital Management LLC; Director (March 2005-March 2006), President (May 2003-March 2006) and Chief Compliance Officer (July 2005-March 2006) |
| | | | |
| 72 | | | | OPPENHEIMER PENNSYLVANIA MUNICIPAL FUND |
| | |
William F. Glavin, Jr., Continued | | of Babson Capital Securities, Inc. (a broker-dealer); President (May 2003-March 2006) of Babson Investment Company, Inc.; Director (May 2004-August 2006) of Babson Capital Europe Limited; Director (May 2004-October 2006) of Babson Capital Guernsey Limited; Director (May 2004-March 2006) of Babson Capital Management LLC; Non-Executive Director (March 2005-March 2007) of Baring Asset Management Limited; Director (February 2005-June 2006) Baring Pension Trustees Limited; Director and Treasurer (December 2003-November 2006) of Charter Oak Capital Management, Inc.; Director (May 2006-September 2006) of C.M. Benefit Insurance Company; Director (May 2008-June 2009) and Executive Vice President (June 2007-July 2009) of C.M. Life Insurance Company; President (March 2006-May 2007) of MassMutual Assignment Company; Director (January 2005-December 2006), Deputy Chairman (March 2005-December 2006) and President (February 2005-March 2005) of MassMutual Holdings (Bermuda) Limited; Director (May 2008-June 2009) and Executive Vice President (June 2007-July 2009) of MML Bay State Life Insurance Company; Chief Executive Officer and President (April 2007-January 2009) of MML Distributors, LLC; and Chairman (March 2006-December 2008) and Chief Executive Officer (May 2007-December 2008) of MML Investors Services, Inc. Oversees 63 portfolios as a Trustee/Director and 95 portfolios as an officer in the OppenheimerFunds complex. |
| |
Arthur S. Gabinet, Secretary and Chief Legal Officer (since 2011) Age: 54 | | Executive Vice President (since May 2010) and General Counsel (since January 2011) of the Manager; General Counsel of the Distributor (since January 2011); General Counsel of Centennial Asset Management Corporation (since January 2011); Executive Vice President and General Counsel of HarbourView Asset Management Corporation (since January 2011); Assistant Secretary (since January 2011) and Director (since January 2011) of OppenheimerFunds International Ltd. and OppenheimerFunds plc; Vice President and Director of Oppenheimer Partnership Holdings, Inc. (since January 2011); Director of Oppenheimer Real Asset Management, Inc. (since January 2011); Executive Vice President and General Counsel of Shareholder Financial Services, Inc. and Shareholder Services, Inc. (since January 2011); Executive Vice President and General Counsel of OFI Private Investments, Inc. (since January 2011); Vice President of OppenheimerFunds Legacy Program (January 2011-January 2012); Executive Vice President and General Counsel of OFI Institutional Asset Management, Inc. (since January 2011); General Counsel, Asset Management of the Manager (May 2010-December 2010); Principal, The Vanguard Group (November 2005-April 2010); District Administrator, U.S. Securities and Exchange Commission (January 2003-October 2005). An officer of 95 portfolios in the OppenheimerFunds complex. |
| |
Christina M. Nasta, Vice President and Chief Business Officer (since 2011) Age: 39 | | Senior Vice President of the Manager (since July 2010); Vice President of the Manager (since January 2003); Vice President of OppenheimerFunds Distributor, Inc. (since January 2003). An officer of 95 portfolios in the OppenheimerFunds complex. |
| |
Mark S. Vandehey, Vice President and Chief Compliance Officer (since 2004) Age: 61 | | Senior Vice President and Chief Compliance Officer of the Manager (since March 2004); Chief Compliance Officer of OppenheimerFunds Distributor, Inc., Centennial Asset Management and Shareholder Services, Inc. (since March 2004); Vice President of OppenheimerFunds Distributor, Inc., Centennial Asset Management Corporation and Shareholder Services, Inc. (since June 1983). An officer of 95 portfolios in the OppenheimerFunds complex. |
| | | | |
| 73 | | | | OPPENHEIMER PENNSYLVANIA MUNICIPAL FUND |
TRUSTEES AND OFFICERS Unaudited / Continued
| | |
Brian W. Wixted, Treasurer and Principal Financial & Accounting Officer (since 1999) Age: 52 | | Senior Vice President of the Manager (since March 1999); Treasurer of the Manager and the following: HarbourView Asset Management Corporation, Shareholder Financial Services, Inc., Shareholder Services, Inc., Oppenheimer Real Asset Management, Inc. and Oppenheimer Partnership Holdings, Inc. (March 1999-June 2008), OFI Private Investments, Inc. (March 2000-June 2008), OppenheimerFunds International Ltd. and OppenheimerFunds plc (since May 2000), OFI Institutional Asset Management, Inc. (since November 2000), and OppenheimerFunds Legacy Program (charitable trust program established by the Manager) (June 2003-January 2012); Treasurer and Chief Financial Officer of OFI Trust Company (trust company subsidiary of the Manager) (since May 2000); Assistant Treasurer of OAC (March 1999-June 2008). An officer of 95 portfolios in the OppenheimerFunds complex. |
The Fund’s Statement of Additional Information contains additional information about the Fund’s Trustees and Officers and is available without charge upon request, by calling 1.800.CALL OPP (225.5677).
| | | | |
| 74 | | | | OPPENHEIMER PENNSYLVANIA MUNICIPAL FUND |
Oppenheimer Pennsylvania Municipal Fund
| | |
| A Series of Oppenheimer Multi-State Municipal Trust |
| Manager | | OppenheimerFunds, Inc. |
| Distributor | | OppenheimerFunds Distributor, Inc. |
| Transfer and Shareholder Servicing Agent | | OppenheimerFunds Services |
Independent
Registered Public Accounting Firm | | KPMGLLP |
| Counsel | | K&L Gates LLP |
©2012 OppenheimerFunds, Inc. All rights reserved.
| | | | |
| 75 | | | | OPPENHEIMER PENNSYLVANIA MUNICIPAL FUND |
PRIVACY POLICY
As an Oppenheimer fund shareholder, you are entitled to know how we protect your personal information and how we limit its disclosure.
Information Sources
We obtain nonpublic personal information about our shareholders from the following sources:
| l | | Applications or other forms |
| l | | When you create a user ID and password for online account access |
| l | | When you enroll in eDocs Direct, our electronic document delivery service |
| l | | Your transactions with us, our affiliates or others |
| l | | A software program on our website, often referred to as a “cookie,” which indicates which parts of our site you’ve visited |
| l | | When you set up challenge questions to reset your password online |
If you visit oppenheimerfunds.com and do not log on to the secure account information areas, we do not obtain any personal information about you. When you do log on to a secure area, we do obtain your user ID and password to identify you. We also use this information to provide you with products and services you have requested, to inform you about products and services that you may be interested in and assist you in other ways.
We do not collect personal information through our website unless you willingly provide it to us, either directly by email or in those areas of the website that request information. In order to update your personal information (including your mailing address, email address and phone number) you must first log on and visit your user profile.
If you have set your browser to warn you before accepting cookies, you will receive the warning message with each cookie. You can refuse cookies by turning them off in your browser. However, doing so may limit your access to certain sections of our website.
We use cookies to help us improve and manage our website. For example, cookies help us recognize new versus repeat visitors to the site, track the pages visited, and enable some special features on the website. This data helps us provide a better service for our website visitors.
Protection of Information
We do not disclose any non-public personal information (such as names on a customer list) about current or former customers to anyone, except as permitted by law.
Disclosure of Information
We send your financial advisor (as designated by you) copies of confirmations, account statements and other documents reporting activity in your fund accounts. We may also use details about you and your investments to help us, our financial service affiliates, or firms that jointly market their financial products and services with ours, to better serve your investment needs or suggest financial services or educational material that may be of interest to you. If this requires us to provide you with an opportunity to “opt in” or “opt out” of such information sharing with a firm not affiliated with us, you will receive notification on how to do so, before any such sharing takes place.
Right of Refusal
We will not disclose your personal information to unaffiliated third parties (except as permitted by law), unless we first offer you a reasonable opportunity to refuse or “opt out” of such disclosure.
| | | | |
| 76 | | | | OPPENHEIMER PENNSYLVANIA MUNICIPAL FUND |
Internet Security and Encryption
In general, the email services provided by our website are encrypted and provide a secure and private means of communication with us. To protect your own privacy, confidential and/or personal information should only be communicated via email when you are advised that you are using a secure website.
As a security measure, we do not include personal or account information in non-secure emails, and we advise you not to send such information to us in non-secure emails. Instead, you may take advantage of the secure features of our website to encrypt your email correspondence. To do this, you will need to use a browser that supports Secure Sockets Layer (SSL) protocol.
We do not guarantee or warrant that any part of our website, including files available for download, are free of viruses or other harmful code. It is your responsibility to take appropriate precautions, such as use of an anti-virus software package, to protect your computer hardware and software.
| l | | All transactions, including redemptions, exchanges and purchases, are secured by SSL and 128-bit encryption. SSL is used to establish a secure connection between your PC and OppenheimerFunds’ server. It transmits information in an encrypted and scrambled format. |
| l | | Encryption is achieved through an electronic scrambling technology that uses a “key” to code and then decode the data. Encryption acts like the cable converter box you may have on your television set. It scrambles data with a secret code so that no one can make sense of it while it is being transmitted. When the data reaches its destination, the same software unscrambles the data. |
| l | | You can exit the secure area by either closing your browser, or for added security, you can use the Log Out button before you close your browser. |
Other Security Measures
We maintain physical, electronic and procedural safeguards to protect your personal account information. Our employees and agents have access to that information only so that they may offer you products or provide services, for example, when responding to your account questions.
How You Can Help
You can also do your part to keep your account information private and to prevent unauthorized transactions. If you obtain a user ID and password for your account, do not allow it to be used by anyone else. Also, take special precautions when accessing your account on a computer used by others.
Who We Are
This joint notice describes the privacy policies of the Oppenheimer funds, OppenheimerFunds Distributor, Inc., the trustee of OppenheimerFunds Individual Retirement Accounts (IRAs) and the custodian of the OppenheimerFunds 403(b)(7) tax sheltered custodial accounts. It applies to all Oppenheimer fund accounts you presently have, or may open in the future, using your Social Security number—whether or not you remain a shareholder of our funds. This notice was last updated January 16, 2004. In the event it is updated or changed, we will post an updated notice on our website at oppenheimerfunds.com. If you have any questions about these privacy policies, write to us at P.O. Box 5270, Denver, CO 80217-5270, email us by clicking on the Contact Us section of our website at oppenheimerfunds.com or call us at 1.800.CALL OPP (225.5677).
| | | | |
| 77 | | | | OPPENHEIMER PENNSYLVANIA MUNICIPAL FUND |
July 31, 2012
| | | | |
| | | Oppenheimer Rochester National Municipals | | Management Commentary and Annual Report |

MANAGEMENT COMMENTARY
An Interview with Your Fund’s Portfolio Managers
ANNUAL REPORT
Listing of Top Holdings
Fund Performance Discussion
Financial Statements
“We hope that the recent strength of the municipal bond market has renewed investors’ confidence in the market’s powerful ability to help investors earn tax-advantaged income.”
Dan Loughran, Senior Vice President, Senior Portfolio Manager and Team Leader, OppenheimerFunds/Rochester


TOP HOLDINGS AND ALLOCATIONS
| | | | | | |
| | |
Top Ten Categories
| |
| |
| |
Tobacco-Master Settlement Agreement
| |
| |
| 17.0
| %
|
Airlines
| |
| |
| 11.6
|
|
Special Assessment
| |
| |
| 9.8
|
|
Hospital/Healthcare
| |
| |
| 9.2
|
|
General Obligation
| |
| |
| 5.4
|
|
Tax Increment Financing
| |
| |
| 5.1
|
|
Adult Living Facilities
| |
| |
| 4.2
|
|
Sales Tax Revenue
| |
| |
| 3.5
|
|
Highways/Commuter Facilities
| |
| |
| 3.2
|
|
| Diversified Financial Services | | | | | 3.0 | |
|
| Portfolio holdings are subject to change. Percentages are as of July 31, 2012, and are based on total assets. | |
| |
Credit Rating Breakdown
| | NRSRO Only Total
|
|
AAA
| |
| |
| 6.8
| %
|
AA
| |
| |
| 22.1
|
|
A
| |
| |
| 9.6
|
|
BBB
| |
| |
| 10.1
|
|
BB and lower
| |
| |
| 16.4
|
|
| Unrated | | | |
| 35.0
|
|
| Total | | | | | 100.0 | % |
|
| The percentages above are based on the market value of the Fund’s securities as of July 31, 2012, and are subject to change. All securities except for those labeled “unrated” have been rated by at least one Nationally Recognized Statistical Rating Organization (“NRSRO”), such as Standard & Poor’s (“S&P”). For securities rated only by an NRSRO other than S&P, OppenheimerFunds, Inc. (the “Manager”) converts that rating to the equivalent S&P rating. If two or more NRSROs have assigned a rating to a security, the highest rating is used. Unrated securities do not necessarily indicate low credit quality. | |
|
| For the purposes of this Credit Allocation table, “investment-grade” securities are securities rated within the NRSROs’ four highest rating categories, which include AAA, AA, A and BBB. Securities not rated by an NRSRO may or may not be equivalent of investment grade. For further details, please consult the Fund’s prospectus or Statement of Additional Information. | |
| | | | |
| 9 | | | | OPPENHEIMER ROCHESTER NATIONAL MUNICIPALS |
FUND PERFORMANCE DISCUSSION
How has the Fund performed? Below is a discussion by OppenheimerFunds, Inc., of the Fund’s performance during its fiscal year ended July 31, 2012, followed by a graphical comparison of the Fund’s performance to appropriate broad-based market indices.
Management’s Discussion of Fund Performance. In the reporting period ended July 31, 2012, Oppenheimer Rochester National Municipals benefited from a rally in the municipal market and produced an annual total return of 16.63% at net asset value (11.09% with sales charge).
The charts on pages 14 to 17 show the Fund’s performance. We encourage investors to remain focused on their long-term financial objectives, and we believe that this Fund’s investments offer structural advantages that can help shareholders achieve their investment goals over the long term.
The Fund continued to be invested this reporting period in bonds backed by proceeds from the tobacco Master Settlement Agreement (the MSA), the national litigation settlement with U.S tobacco manufacturers. As of July 31, 2012, holdings in this sector represented 17.0% of the Fund’s total assets, comprising the industry’s largest sector.1
As in prior reporting periods, the tobacco bonds this Fund held during this reporting period made all scheduled payments of interest and principal on time and in full. Our long-term view of the sector remains bullish and, given attractive valuations, we will likely continue to hold a greater percentage of tobacco bonds in our portfolios than our peers. We are confident that this sector will continue to provide high levels of tax-free income to the long-term benefit of our yield-seeking investors. This sector contributed strongly to the Fund’s total return this reporting period.
The Fund’s airline holdings represented 11.6% of total assets as of July 31, 2012. Many of the Fund’s holdings are backed by a security interest in the airport terminal buildings or maintenance facilities whose construction they finance and, as a result, these bonds offer investors valuable collateral. In late November 2011, AMR Corporation, the parent company of American Airlines, filed for bankruptcy protection. While the filing itself was largely expected, the timing came as a surprise to the market. As a result, prices of AMR’s equity and bond offerings declined. We anticipate that many of AMR’s obligations will be maintained through the bankruptcy period, and many of them will either be restructured
1. Investments in “tobacco bonds,” which are backed by the proceeds a state or territory receives from the 1998 national litigation settlement with tobacco manufacturers, may be vulnerable to economic and/or legislative events that affect issuers in a particular municipal market sector. Annual payments by MSA-participating manufacturers, for example, hinge on many factors, including annual domestic cigarette shipments, inflation and the relative market share of non-participating manufacturers. To date, we believe consumption figures remain within an acceptable range of the assumptions used to structure MSA bonds. Future MSA payments could be reduced if consumption were to fall more rapidly than originally forecast.
| | | | |
| 10 | | | | OPPENHEIMER ROCHESTER NATIONAL MUNICIPALS |
or resolved at prices that are currently reflected by the market and already incorporated into the Fund’s net asset values. Investors should also know that we would not expect this bankruptcy to be resolved in the short term. These proceedings—as exemplified by past filings, most notably Northwest Airlines in 2005—can take 2 years or more to be fully resolved. The price changes in the Fund’s AMR holdings caused this sector to be a detractor from performance in this reporting period.
Oppenheimer Rochester National Municipals remained invested in land development (or “dirt”) bonds, which are Special Assessment and Special Tax bonds that help finance the infrastructure needs of new real estate development. At the end of this reporting period, the Special Assessment and Special Tax sectors represented 9.8% and 2.1% of the Fund’s total assets, respectively.
In our opinion, bonds in these sectors overall have several appealing characteristics: the debt service payments securing these bonds are on parity with real estate taxes and senior to mortgage payments, and assessments or taxes must be paid by whoever owns the land when the tax bill comes due. In this reporting period, the Fund experienced a reduction in the number of holdings that missed or were likely to miss a scheduled payment of interest or principal, and some positions in the Special Assessment and Special Tax sectors were sold.
The Special Tax and Special Assessment sectors were both positive contributors to the Fund’s total return this reporting period. We will continue to hold carefully researched dirt bonds in our portfolios, as improvements in the housing market and the general economy could strengthen the credit profiles of these sectors going forward. The Fund remains focused on working through other distressed situations and will continue to sell holdings opportunistically.
As of July 31, 2012, the Fund was invested in the hospital/healthcare sector, representing 9.2% of the Fund’s total assets. Our holdings in this sector consist of securities across the credit spectrum. The sector remained in the news this reporting period as many politicians, lobbyists, activists and others continued to argue about the constitutionality of the Affordable Care Act of 2010. On June 28, 2012, the Supreme Court upheld the “individual mandate,” which was considered the most controversial element of the Act. Immediately after the court’s ruling, some politicians suggested that Congress would revisit and perhaps seek to override the legislation. However, none of these developments has changed our perspective that our disciplined, security-specific approach to credit research can uncover many potentially advantageous opportunities for the Fund in this and other sectors. The hospital/health care sector contributed positively to the Fund’s total return this reporting period.
Securities issued in the Commonwealth of Puerto Rico, which are exempt from federal, state and local income taxes, represented 6.6% of the Fund’s net assets on July 31, 2012,
| | | | |
| 11 | | | | OPPENHEIMER ROCHESTER NATIONAL MUNICIPALS |
FUND PERFORMANCE DISCUSSION
and contributed positively to the Fund’s total return this reporting period. The Fund’s holdings come from many different sectors, including the tobacco and sales tax revenue sectors, as well as general obligation debt. These investments are supported by taxes and other revenues designed to help finance electric utilities, highways and education.
During this reporting period, the market continued to react favorably to better fiscal management under the leadership of Gov. Luis Fortuño. This discipline has helped Puerto Rico significantly reduce pressure on its municipal bonds. The administration proposed another deficit budget for the fiscal year that began July 1, 2012, but has lowered the size of the deficit relative to spending considerably in recent years.
Bond sales have remained strong, despite concerns raised over credit quality. In a period of low issuance, the Puerto Rico Aqueduct and Sewer Authority came to market in February 2012 with $1.8 billion in senior-lien revenue bonds, the largest scheduled sale in the long-term market to date for the year. It came to market once again in March 2012, with another significant sale for $2.3 billion in public improvement refunding bonds, an increase from the anticipated $1.5 billion priced ahead of schedule.
During this reporting period, both S&P and Moody’s revised their outlooks on general obligation debt issued by the Commonwealth. As of July 31, 2012, the S&P rating was BBB and the Moody’s rating was Baa1, both with negative outlooks. While the ratings agencies have raised concerns about the fiscal environment’s potential to delay structurally balanced budgets in the near future, our stance remains bullish. We continue to remain confident in the Commonwealth’s ability to collect taxes and make its bond payments.
General obligation debt backed by the full faith and taxing authority of the state and local governments represented 5.4% of the Fund’s total assets as of July 31, 2012, and contributed positively to the Fund’s total return. Elected officials consistently safeguarded the debt service payments on their general obligation bonds this reporting period, while working to resolve their ongoing budget challenges.
Tax increment financing (TIF) bonds constituted 5.1% of the Fund’s total assets at the end of the reporting period. Traditionally, this type of financing has been used for urban renewal projects. Increased tax collections as a result of inflation or an improving economy typically prove favorable for these types of bonds. The TIF sector contributed favorably to the Fund’s total return this reporting period.
The adult living facilities sector, with 4.2% of the Fund’s total assets as of July 31, 2012, was a favorable contributor to the Fund’s total return this reporting period. These bonds, which finance various projects at senior living centers, tend to outperform in densely populated geographies with strong real estate values.
| | | | |
| 12 | | | | OPPENHEIMER ROCHESTER NATIONAL MUNICIPALS |
The electric utilities sector, with 1.2% of the Fund’s total assets as of July 31, 2012, had a negative impact on the Fund’s total return this reporting period. The overall fundamentals appeared to be stable this reporting period and this sector, in the Fund’s experience, has typically been additive to Fund performance. This reporting period, the prices of the Fund’s investment in bonds issued by Energy Future Holdings (formerly TXU Corporation) declined amid widespread speculation that a corporate restructuring was in the offing, causing the sector to underperform.
During this reporting period, the Fund remained invested in municipal inverse-floating rate securities, which are tax-exempt securities with interest payments that move inversely to changes in short-term interest rates. “Inverse floaters” generally offer higher tax-free yields than fixed-rate bonds of comparable maturity and credit quality, but they face greater price volatility, too. In periods of low short-term interest rates, inverse floaters generally offer very attractive levels of tax-free income. These securities contributed positively to the Fund’s total return this reporting period.
Our approach to municipal bond investing is flexible and responsive to market conditions. Shareholders should note that market conditions during this reporting period did not affect the Fund’s overall investment objectives or cause it to pay any capital gain distributions. In closing, we believe that the Fund’s structure and sector composition–as well as our time-tested strategies–will continue to benefit long-term investors through interest rate and economic cycles.
Comparing the Fund’s Performance to the Market. The graphs that follow show the performance of a hypothetical $10,000 investment in each class of shares of the Fund held until July 31, 2012. In the case of Class A, Class B and Class C shares, performance is measured over a ten-year period. In the case of Class Y shares, performance is measured from inception of the Class on November 29, 2010. The Fund’s performance reflects the deduction of the maximum initial sales charge on Class A shares, the applicable contingent deferred sales charge on Class B and Class C shares, and reinvestments of all dividends and capital gains distributions. Past performance cannot guarantee future results.
The Fund’s performance is compared to the performance of the Barclays Capital Municipal Bond Index, an unmanaged index of a broad range of investment grade municipal bonds that is widely regarded as a measure of the performance of the general municipal bond market. Index performance reflects the reinvestment of income but does not consider the effect of transaction costs, and none of the data in the graphs shows the effect of taxes. The Fund’s performance is also compared to the Consumer Price Index, a non-securities index that measures changes in the inflation rate. The Fund’s performance reflects the effects of the Fund’s business and operating expenses. While index comparisons may be useful to provide a benchmark for the Fund’s performance, it must be noted that the Fund’s investments are not limited to the investments comprising the index.
| | | | |
| 13 | | | | OPPENHEIMER ROCHESTER NATIONAL MUNICIPALS |
FUND PERFORMANCE DISCUSSION
Class A Shares
Comparison of Change in Value of $10,000 Hypothetical Investments in:
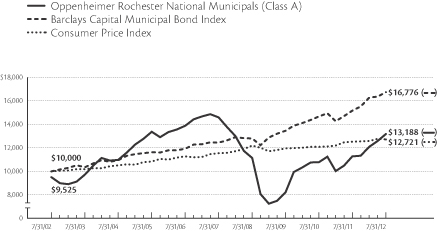
Average Annual Total Returns of Class A Shares With Sales Charge of the Fund at 7/31/12
1-Year 11.09% 5-Year –3.01% 10-Year 2.81%
| | | | |
| 14 | | | | OPPENHEIMER ROCHESTER NATIONAL MUNICIPALS |
Class B Shares
Comparison of Change in Value of $10,000 Hypothetical Investments in:
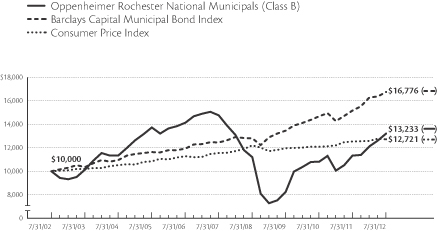
Average Annual Total Returns of Class B Shares With Sales Charge of the Fund at 7/31/12
1-Year 10.76% 5-Year –3.15% 10-Year 2.84%
The performance data quoted represents past performance, which does not guarantee future results. The investment return and principal value of an investment in the Fund will fluctuate so that an investor’s shares, when redeemed, may be worth more or less than their original cost. Current performance may be lower or higher than the performance quoted. Returns do not consider capital gains or income taxes on an individual’s investment. For performance data current to the most recent month-end, visit oppenheimerfunds.com or call 1.800.CALL OPP (225.5677). Fund returns include changes in share price, reinvested distributions, and the applicable sales charge for Class A shares, the current maximum initial sales charge of 4.75%; for Class B shares, and the contingent deferred sales charge of 5% (1-year) and 2% (5-year); and for Class C shares, the 1% contingent deferred sales charge for the 1-year period. There is no sales charge for Class Y shares. Because Class B shares convert to Class A shares 72 months after purchase, the 10-year return for Class B shares uses Class A performance for the period after conversion. See page 18 for further information.
| | | | |
| 15 | | | | OPPENHEIMER ROCHESTER NATIONAL MUNICIPALS |
FUND PERFORMANCE DISCUSSION
Class C Shares
Comparison of Change in Value of $10,000 Hypothetical Investments in:
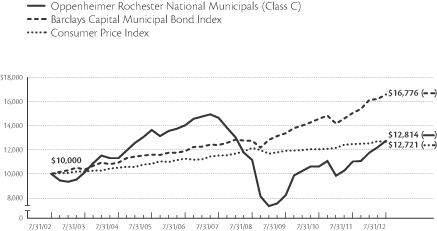
Average Annual Total Returns of Class C Shares With Sales Charge of the Fund at 7/31/12
1-Year 14.80% 5-Year –2.83% 10-Year 2.51%
| | | | |
| 16 | | | | OPPENHEIMER ROCHESTER NATIONAL MUNICIPALS |
Class Y Shares
Comparison of Change in Value of $10,000 Hypothetical Investments in:
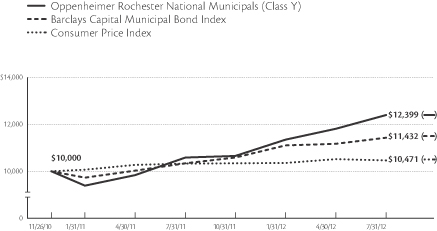
Average Annual Total Returns of Class Y Shares of the Fund at 7/31/12
1-Year 16.97% Since Inception (11/29/10) 13.72%
The performance data quoted represents past performance, which does not guarantee future results. The investment return and principal value of an investment in the Fund will fluctuate so that an investor’s shares, when redeemed, may be worth more or less than their original cost. Current performance may be lower or higher than the performance quoted. Returns do not consider capital gains or income taxes on an individual’s investment. For performance data current to the most recent month-end, visit oppenheimerfunds.com or call 1.800.CALL OPP (225.5677). Fund returns include changes in share price, reinvested distributions, and the applicable sales charge for Class A shares, the current maximum initial sales charge of 4.75%; for Class B shares, and the contingent deferred sales charge of 5% (1-year) and 2% (5-year); and for Class C shares, the 1% contingent deferred sales charge for the 1-year period. There is no sales charge for Class Y shares. Because Class B shares convert to Class A shares 72 months after purchase, the 10-year return for Class B shares uses Class A performance for the period after conversion. See page 18 for further information.
| | | | |
| 17 | | | | OPPENHEIMER ROCHESTER NATIONAL MUNICIPALS |
NOTES
Total returns and the ending account values in the graphs include changes in share price and reinvestment of dividends and capital gains distributions in a hypothetical investment for the periods shown. Cumulative total returns are not annualized. The Fund’s total returns shown do not reflect the deduction of income taxes on an individual’s investment. Taxes may reduce your actual investment returns on income or gains paid by the Fund or any gains you may realize if you sell your shares. This annual report must be preceded or accompanied by the current prospectus of the Oppenheimer Rochester National Municipals. Before investing in any of the Oppenheimer funds, investors should carefully consider a fund’s investment objectives, risks, charges and expenses. Fund prospectuses and summary prospectuses contain this and other information about the funds, and may be obtained by asking your financial advisor, visiting oppenheimerfunds.com, or calling 1.800.CALL OPP (225.5677). Read prospectuses and summary prospectuses carefully before investing.
The Fund’s investment strategy and focus can change over time. The mention of specific fund holdings does not constitute a recommendation by OppenheimerFunds, Inc.
Class A shares of the Fund were first publicly offered on 10/1/93. The average annual total returns are shown net of the applicable 4.75% maximum initial sales charge.
Class B shares of the Fund were first publicly offered on 10/1/93. The average annual total returns are shown net of the applicable contingent deferred sales charge of 5% (1-year) and 2% (5-year). Because Class B shares convert to Class A shares 72 months after purchase, the 10-year return for Class B shares uses Class A performance for the period after conversion. Class B shares are subject to an annual 0.75% asset-based sales charge.
Class C shares of the Fund were first publicly offered on 8/29/95. The average annual total returns are shown net of the applicable 1% contingent deferred sales charge for the 1-year period. Class C shares are subject to an annual 0.75% asset-based sales charge.
Class Y shares of the Fund were first publicly offered on 11/29/10. Class Y shares are offered only to fee-based clients of dealers that have a special agreement with the Distributor, to certain institutional investors under a special agreement with the Distributor, and to present or former officers, directors, trustees and employees (and their eligible family members) of the Fund, the Manager, its affiliates, its parent company and the subsidiaries of its parent company, and retirement plans established for the benefit of such individuals. There is no sales charge for Class Y shares.
| | | | |
| 18 | | | | OPPENHEIMER ROCHESTER NATIONAL MUNICIPALS |
FUND EXPENSES
Fund Expenses. As a shareholder of the Fund, you incur two types of costs: (1) transaction costs, which may include sales charges (loads) on purchase payments, contingent deferred sales charges on redemptions and (2) ongoing costs, including management fees; distribution and service fees; and other Fund expenses. These examples are intended to help you understand your ongoing costs (in dollars) of investing in the Fund and to compare these costs with the ongoing costs of investing in other mutual funds.
The examples are based on an investment of $1,000.00 invested at the beginning of the period and held for the entire 6-month period ended July 31, 2012.
Actual Expenses. The first section of the table provides information about actual account values and actual expenses. You may use the information in this section for the class of shares you hold, together with the amount you invested, to estimate the expense that you paid over the period. Simply divide your account value by $1,000.00 (for example, an $8,600.00 account value divided by $1,000.00 = 8.60), then multiply the result by the number in the first section under the heading entitled “Expenses Paid During Period” to estimate the expenses you paid on your account during this period.
Hypothetical Example for Comparison Purposes. The second section of the table provides information about hypothetical account values and hypothetical expenses based on the Fund’s actual expense ratio for each class of shares, and an assumed rate of return of 5% per year for each class before expenses, which is not the actual return. The hypothetical account values and expenses may not be used to estimate the actual ending account balance or expenses you paid for the period. You may use this information to compare the ongoing costs of investing in the Fund and other funds. To do so, compare this 5% hypothetical example for the class of shares you hold with the 5% hypothetical examples that appear in the shareholder reports of the other funds.
Please note that the expenses shown in the table are meant to highlight your ongoing costs only and do not reflect any transactional costs, such as front-end or contingent deferred sales charges (loads), or a $12.00 fee imposed annually on accounts valued at less than $500.00 (subject to exceptions described in the Statement of Additional Information). Therefore, the “hypothetical” section of the table is useful in comparing ongoing costs only, and will not help you determine the relative total costs of owning different funds. In addition, if these transactional costs were included, your costs would have been higher.
| | | | |
| 19 | | | | OPPENHEIMER ROCHESTER NATIONAL MUNICIPALS |
| | | | | | | | | | | | |
| Actual | | Beginning
Account
Value
February 1, 2012 | | | Ending
Account
Value
July 31, 2012 | | | Expenses
Paid During
6 Months Ended
July 31, 2012 | |
| Class A | | $ | 1,000.00 | | | $ | 1,088.70 | | | $ | 5.31 | |
| Class B | | | 1,000.00 | | | | 1,084.00 | | | | 9.58 | |
| Class C | | | 1,000.00 | | | | 1,084.90 | | | | 9.32 | |
| Class Y | | | 1,000.00 | | | | 1,091.10 | | | | 4.53 | |
| | | |
Hypothetical
(5% return before expenses) | | | | | | | | | |
| Class A | | | 1,000.00 | | | | 1,019.79 | | | | 5.14 | |
| Class B | | | 1,000.00 | | | | 1,015.71 | | | | 9.26 | |
| Class C | | | 1,000.00 | | | | 1,015.96 | | | | 9.01 | |
| Class Y | | | 1,000.00 | | | | 1,020.54 | | | | 4.38 | |
Expenses are equal to the Fund’s annualized expense ratio for that class, multiplied by the average account value over the period, multiplied by 182/366 (to reflect the one-half year period). Those annualized expense ratios based on the 6-month period ended July 31, 2012 are as follows:
| | | | |
| Class | | Expense Ratios | |
| Class A | | | 1.02 | % |
| Class B | | | 1.84 | |
| Class C | | | 1.79 | |
| Class Y | | | 0.87 | |
The expense ratios reflect voluntary waivers and/or reimbursements of expenses by the Fund’s Manager. Some of these undertakings may be modified or terminated at any time, as indicated in the Fund’s prospectus. The “Financial Highlights” tables in the Fund’s financial statements, included in this report, also show the gross expense ratios, without such waivers or reimbursements and reduction to custodian expenses, if applicable.
| | | | |
| 20 | | | | OPPENHEIMER ROCHESTER NATIONAL MUNICIPALS |
STATEMENT OF INVESTMENTS July 31, 2012
| | | | | | | | | | | | | | | | |
Principal
Amount | | | | | Coupon | | | Maturity | | | Value | |
| | Municipal Bonds and Notes—118.9% | | | | | |
| | Alabama—0.3% | | | | | | | | | | | | |
| | $ 15,000 | | | AL HFA (South Bay Apartments)1 | | | 5.950 | % | | | 02/01/2033 | | | $ | 15,147 | |
| | 8,095,000 | | | AL Space Science Exhibit Finance Authority | | | 6.000 | | | | 10/01/2025 | | | | 7,364,912 | |
| | 1,810,000 | | | Andalusia-Opp, AL Airport Authority1 | | | 5.000 | | | | 08/01/2026 | | | | 1,755,067 | |
| | 2,200,000 | | | Rainbow City, AL Special Health Care Facilities Financing Authority (Regency Pointe)2 | | | 8.250 | | | | 01/01/2031 | | | | 1,407,780 | |
| | 10,000 | | | Selma, AL Industrial Devel. Board (International Paper Company)1 | | | 6.000 | | | | 05/01/2025 | | | | 10,084 | |
| | 6,885,000 | | | Tuscaloosa, AL Educational Building Authority (Stillman College)1 | | | 5.000 | | | | 06/01/2026 | | | | 5,814,658 | |
| | 2,600,000 | | | Tuscaloosa, AL Educational Building Authority (Stillman College)1 | | | 5.250 | | | | 06/01/2037 | | | | 2,068,742 | |
| | | | | | | | | | | | | | | | 18,436,390 | |
| | Alaska—0.2% | | | | | | | | | | | | |
| | 2,250,000 | | | AK Industrial Devel. & Export Authority (Anchorage Sportsplex/Grace Community Church Obligated Group)2 | | | 6.150 | | | | 08/01/2031 | | | | 808,358 | |
| | 40,000 | | | AK Industrial Devel. & Export Authority (Snettisham)1 | | | 6.000 | | | | 01/01/2014 | | | | 40,134 | |
| | 1,650,000 | | | AK Industrial Devel. & Export Authority Community Provider (Boys & Girls Home)2 | | | 5.875 | | | | 12/01/2027 | | | | 561,017 | |
| | 500,000 | | | AK Industrial Devel. & Export Authority Community Provider (Boys & Girls Home)2 | | | 6.000 | | | | 12/01/2036 | | | | 170,005 | |
| | 31,850,000 | | | AK Northern Tobacco Securitization Corp. (TASC) | | | 6.125 | 3 | | | 06/01/2046 | | | | 1,032,896 | |
| | 20,860,000 | | | AK Northern Tobacco Securitization Corp. (TASC) | | | 6.375 | 3 | | | 06/01/2046 | | | | 642,697 | |
| | 10,350,000 | | | Koyukuk, AK (Tanana Chiefs Conference Health Care Facility)1 | | | 7.750 | | | | 10/01/2041 | | | | 11,347,119 | |
| | | | | | | | | | | | | | | | 14,602,226 | |
| | Arizona—2.2% | | | | | | | | | | | | |
| | 7,680,000 | | | AZ Health Facilities Authority (Catholic Healthcare West)1 | | | 5.250 | | | | 03/01/2039 | | | | 8,551,296 | |
| | 2,900,000 | | | Buckeye, AZ Watson Road Community Facilities District | | | 5.750 | | | | 07/01/2022 | | | | 2,861,111 | |
| | 4,600,000 | | | Buckeye, AZ Watson Road Community Facilities District | | | 6.000 | | | | 07/01/2030 | | | | 4,363,008 | |
| | 8,388,832 | | | East San Luis, AZ Community Facilities District Special Assessment (Area One) | | | 6.375 | | | | 01/01/2028 | | | | 7,846,075 | |
| | 4,349,000 | | | East San Luis, AZ Community Facilities District Special Assessment (Area Two)4 | | | 8.500 | | | | 01/01/2028 | | | | 3,756,188 | |
| | 305,000 | | | Estrella Mountain Ranch, AZ Community Facilities District1 | | | 5.450 | | | | 07/15/2021 | | | | 312,421 | |
| | | | |
| 21 | | | | OPPENHEIMER ROCHESTER NATIONAL MUNICIPALS |
STATEMENT OF INVESTMENTS Continued
| | | | | | | | | | | | | | | | |
Principal
Amount | | | | | Coupon | | | Maturity | | | Value | |
| | Arizona Continued | | | | | | | | | | | | |
| | $ 810,000 | | | Estrella Mountain Ranch, AZ Community Facilities District1 | | | 5.625 | % | | | 07/15/2025 | | | $ | 823,730 | |
| | 900,000 | | | Estrella Mountain Ranch, AZ Community Facilities District1 | | | 5.800 | | | | 07/15/2030 | | | | 912,384 | |
| | 1,015,000 | | | Estrella Mountain Ranch, AZ Community Facilities District1 | | | 5.900 | | | | 07/15/2022 | | | | 1,066,887 | |
| | 335,000 | | | Estrella Mountain Ranch, AZ Community Facilities District1 | | | 6.125 | | | | 07/15/2027 | | | | 349,562 | |
| | 500,000 | | | Estrella Mountain Ranch, AZ Community Facilities District1 | | | 6.200 | | | | 07/15/2032 | | | | 517,830 | |
| | 927,000 | | | Estrella Mountain Ranch, AZ Community Facilities District (Golf Village)1 | | | 6.000 | | | | 07/01/2017 | | | | 949,888 | |
| | 1,255,000 | | | Estrella Mountain Ranch, AZ Community Facilities District (Golf Village)1 | | | 6.375 | | | | 07/01/2022 | | | | 1,240,869 | |
| | 4,111,000 | | | Estrella Mountain Ranch, AZ Community Facilities District (Golf Village)1 | | | 6.750 | | | | 07/01/2032 | | | | 3,929,047 | |
| | 15,000,000 | | | Glendale, AZ Western Loop Public Facilities1 | | | 6.250 | | | | 07/01/2038 | | | | 15,989,250 | |
| | 1,000,000 | | | Goodyear, AZ IDA Water & Sewer (Litchfield Park Service Company)1 | | | 6.750 | | | | 10/01/2031 | | | | 1,000,670 | |
| | 3,280,000 | | | Maricopa County, AZ IDA (Christian Care Apartments)1 | | | 6.500 | | | | 01/01/2036 | | | | 3,315,457 | |
| | 1,875,000 | | | Maricopa County, AZ IDA (Immanuel Campus Care)2 | | | 8.500 | | | | 04/20/2041 | | | | 1,835,213 | |
| | 295,000 | | | Maricopa County, AZ IDA (Sun King Apartments)1 | | | 6.750 | | | | 11/01/2018 | | | | 265,556 | |
| | 2,345,000 | | | Maricopa County, AZ IDA (Sun King Apartments)1 | | | 6.750 | | | | 05/01/2031 | | | | 1,798,193 | |
| | 3,595,000 | | | Maricopa County, AZ IDA (Sun King Apartments) | | | 9.500 | | | | 11/01/2031 | | | | 3,002,975 | |
| | 437,000 | | | Merrill Ranch, AZ Community Facilities District No. 1 Special Assessment Lien1 | | | 5.250 | | | | 07/01/2024 | | | | 410,417 | |
| | 360,000 | | | Merrill Ranch, AZ Community Facilities District No. 2 Special Assessment Lien1 | | | 5.250 | | | | 07/01/2024 | | | | 338,101 | |
| | 877,000 | | | Merrill Ranch, AZ Community Facilities District No. 2 Special Assessment Lien1 | | | 5.300 | | | | 07/01/2030 | | | | 780,109 | |
| | 1,125,000 | | | Palm Valley, AZ Community Facility District No. 31 | | | 5.300 | | | | 07/15/2031 | | | | 1,027,013 | |
| | 420,000 | | | Parkway, AZ Community Facilities District No. 1
(Prescott Valley)1 | | | 5.300 | | | | 07/15/2025 | | | | 402,889 | |
| | 350,000 | | | Parkway, AZ Community Facilities District No. 1 (Prescott Valley)1 | | | 5.350 | | | | 07/15/2031 | | | | 321,468 | |
| | 3,275,000 | | | Phoenix, AZ IDA (America West Airlines) | | | 6.250 | | | | 06/01/2019 | | | | 2,992,564 | |
| | 7,500,000 | | | Phoenix, AZ IDA (America West Airlines) | | | 6.300 | | | | 04/01/2023 | | | | 6,632,400 | |
| | 1,650,000 | | | Phoenix, AZ IDA (Espiritu Community Devel. Corp.) | | | 6.250 | | | | 07/01/2036 | | | | 1,625,745 | |
| | 1,935,000 | | | Phoenix, AZ IDA (Gourmet Boutique West) | | | 5.875 | | | | 11/01/2037 | | | | 1,198,636 | |
| | | | |
| 22 | | | | OPPENHEIMER ROCHESTER NATIONAL MUNICIPALS |
| | | | | | | | | | | | | | | | |
Principal
Amount | | | | | Coupon | | | Maturity | | | Value | |
| | Arizona Continued | | | | | | | | | | | | |
| | $ 1,575,000 | | | Pima County, AZ IDA (Christian Senior Living)1 | | | 5.050 | % | | | 01/01/2037 | | | $ | 1,597,853 | |
| | 1,250,000 | | | Pima County, AZ IDA (Facility Choice Education & Devel. Corp.) | | | 6.250 | | | | 06/01/2026 | | | | 1,274,975 | |
| | 3,700,000 | | | Pima County, AZ IDA (Facility Choice Education & Devel. Corp.) | | | 6.375 | | | | 06/01/2036 | | | | 3,752,170 | |
| | 12,400,000 | | | Pima County, AZ IDA (Metro Police Facility)5 | | | 5.375 | | | | 07/01/2039 | | | | 13,605,404 | |
| | 3,000,000 | | | Pima County, AZ IDA (New Plan Learning/OG Ohio/250 Shoup Mill Obligated Group) | | | 8.125 | | | | 07/01/2041 | | | | 3,315,840 | |
| | 1,500,000 | | | Pima County, AZ IDA (P.L.C. Charter Schools) | | | 6.750 | | | | 04/01/2036 | | | | 1,476,330 | |
| | 5,730,000 | | | Pima County, AZ IDA (P.L.C. Charter Schools) | | | 7.500 | | | | 04/01/2041 | | | | 5,964,701 | |
| | 250,000 | | | Pima County, AZ IDA (Paradise Education Center)1 | | | 5.875 | | | | 06/01/2022 | | | | 257,560 | |
| | 550,000 | | | Pima County, AZ IDA (Paradise Education Center)1 | | | 6.000 | | | | 06/01/2036 | | | | 555,374 | |
| | 1,600,000 | | | Pima County, AZ IDA (Sonoran Science Academy) | | | 5.670 | | | | 12/01/2027 | | | | 1,513,680 | |
| | 1,960,000 | | | Pima County, AZ IDA (Sonoran Science Academy) | | | 5.750 | | | | 12/01/2037 | | | | 1,791,950 | |
| | 2,215,000 | | | Pima County, AZ IDA Water & Wastewater (Global Water Resources)1 | | | 5.600 | | | | 12/01/2022 | | | | 2,319,725 | |
| | 11,100,000 | | | Pima County, AZ IDA Water & Wastewater (Global Water Resources)1 | | | 5.750 | | | | 12/01/2032 | | | | 11,570,529 | |
| | 9,000,000 | | | Pima County, AZ IDA Water & Wastewater (Global Water Resources)1 | | | 6.550 | | | | 12/01/2037 | | | | 9,420,300 | |
| | 1,220,000 | | | Pinal County, AZ IDA (San Manuel Facility)1 | | | 6.250 | | | | 06/01/2026 | | | | 1,223,343 | |
| | 1,089,000 | | | Prescott Valley, AZ Southside Community Facilities District No. 1 | | | 7.250 | | | | 07/01/2032 | | | | 809,508 | |
| | 1,500,000 | | | Quail Creek, AZ Community Facilities District1 | | | 5.550 | | | | 07/15/2030 | | | | 1,404,480 | |
| | 265,000 | | | Show Low Bluff, AZ Community Facilities District | | | 5.600 | | | | 07/01/2031 | | | | 233,208 | |
| | 150,000 | | | Show Low Bluff, AZ Community Facilities District Special Assessment | | | 5.200 | | | | 07/01/2017 | | | | 151,145 | |
| | 695,000 | | | Tempe, AZ IDA (Tempe Life Care Village)1 | | | 6.000 | | | | 12/01/2032 | | | | 746,277 | |
| | 1,550,000 | | | Tempe, AZ IDA (Tempe Life Care Village)1 | | | 6.250 | | | | 12/01/2042 | | | | 1,673,179 | |
| | 600,000 | | | Tempe, AZ IDA (Tempe Life Care Village)1 | | | 6.250 | | | | 12/01/2046 | | | | 647,682 | |
| | 505,000 | | | Tucson, AZ IDA (Joint Single Family Mtg.)1 | | | 5.000 | | | | 01/01/2039 | | | | 515,741 | |
| | 4,000,000 | | | Verrado, AZ Community Facilities District No. 11 | | | 5.350 | | | | 07/15/2031 | | | | 3,673,920 | |
| | | | | | | | | | | | | | | | 149,911,826 | |
| | Arkansas—0.1% | | | | | | | | | | | | |
| | 7,495,000 | | | Cave Springs, AR Municipal Property (Creeks Special Sewer District)2 | | | 6.250 | | | | 02/01/2038 | | | | 4,256,560 | |
| | California—18.6% | | | | | | | | | | | | |
| | 2,500,000 | | | Adelanto, CA Public Utility Authority1 | | | 6.750 | | | | 07/01/2039 | | | | 2,749,975 | |
| | | | |
| 23 | | | | OPPENHEIMER ROCHESTER NATIONAL MUNICIPALS |
STATEMENT OF INVESTMENTS Continued
| | | | | | | | | | | | | | | | |
Principal
Amount | | | | | Coupon | | | Maturity | | | Value | |
| | California Continued | | | | | | | | | | | | |
| | $ 750,000 | | | Alhambra, CA (Atherton Baptist Homes)1 | | | 7.625 | % | | | 01/01/2040 | | | $ | 832,695 | |
| | 380,000 | | | Anaheim, CA Community Facilities District Special Tax (Platinum Triangle)1 | | | 6.000 | | | | 09/01/2028 | | | | 391,757 | |
| | 1,095,000 | | | Anaheim, CA Community Facilities District Special Tax (Platinum Triangle)1 | | | 6.000 | | | | 09/01/2030 | | | | 1,128,770 | |
| | 4,070,000 | | | Anaheim, CA Community Facilities District Special Tax (Platinum Triangle)1 | | | 6.250 | | | | 09/01/2040 | | | | 4,195,071 | |
| | 11,720,000 | | | Bay Area CA Toll Authority (San Francisco Bay Area)5 | | | 5.500 | | | | 04/01/2043 | | | | 13,324,103 | |
| | 2,745,000 | | | Beaumont, CA Financing Authority1 | | | 5.250 | | | | 09/01/2039 | | | | 2,807,449 | |
| | 100,000 | | | Blythe, CA Redevel. Agency (Redevel. Project No. 1 Tax Allocation)1 | | | 5.750 | | | | 05/01/2034 | | | | 101,052 | |
| | 235,000 | | | Blythe, CA Redevel. Agency (Redevel. Project No. 1 Tax Allocation)1 | | | 6.200 | | | | 05/01/2031 | | | | 236,734 | |
| | 5,500,000 | | | Brea, CA Community Facilities District (Brea Plaza Area)1 | | | 7.375 | | | | 09/01/2039 | | | | 5,950,560 | |
| | 25,000 | | | Buena Park, CA Special Tax (Park Mall)1 | | | 6.125 | | | | 09/01/2033 | | | | 25,239 | |
| | 127,310,000 | | | CA County Tobacco Securitization Agency | | | 6.489 | 3 | | | 06/01/2046 | | | | 4,606,076 | |
| | 107,400,000 | | | CA County Tobacco Securitization Agency | | | 6.619 | 3 | | | 06/01/2050 | | | | 2,240,364 | |
| | 33,920,000 | | | CA County Tobacco Securitization Agency | | | 6.650 | 3 | | | 06/01/2046 | | | | 1,100,026 | |
| | 215,100,000 | | | CA County Tobacco Securitization Agency | | | 7.000 | 3 | | | 06/01/2055 | | | | 2,690,901 | |
| | 246,760,000 | | | CA County Tobacco Securitization Agency | | | 7.477 | 3 | | | 06/01/2055 | | | | 2,149,280 | |
| | 10,530,000 | | | CA County Tobacco Securitization Agency | | | 8.150 | 3 | | | 06/01/2033 | | | | 1,097,226 | |
| | 255,000 | | | CA County Tobacco Securitization Agency (TASC)1 | | | 5.250 | | | | 06/01/2045 | | | | 204,436 | |
| | 19,000,000 | | | CA County Tobacco Securitization Agency (TASC) | | | 5.250 | | | | 06/01/2046 | | | | 13,761,130 | |
| | 10,000,000 | | | CA County Tobacco Securitization Agency (TASC) | | | 5.450 | | | | 06/01/2028 | | | | 9,052,900 | |
| | 1,965,000 | | | CA County Tobacco Securitization Agency (TASC)1 | | | 5.500 | | | | 06/01/2033 | | | | 1,874,669 | |
| | 14,800,000 | | | CA County Tobacco Securitization Agency (TASC) | | | 5.600 | | | | 06/01/2036 | | | | 13,017,044 | |
| | 36,000,000 | | | CA County Tobacco Securitization Agency (TASC) | | | 5.650 | | | | 06/01/2041 | | | | 31,403,520 | |
| | 58,530,000 | | | CA County Tobacco Securitization Agency (TASC) | | | 5.700 | | | | 06/01/2046 | | | | 50,382,624 | |
| | 2,610,000 | | | CA County Tobacco Securitization Agency (TASC)1 | | | 5.875 | | | | 06/01/2035 | | | | 2,609,739 | |
| | 7,285,000 | | | CA County Tobacco Securitization Agency (TASC) | | | 5.875 | | | | 06/01/2043 | | | | 7,227,886 | |
| | 2,930,000 | | | CA County Tobacco Securitization Agency (TASC)1 | | | 6.000 | | | | 06/01/2042 | | | | 2,909,197 | |
| | | | |
| 24 | | | | OPPENHEIMER ROCHESTER NATIONAL MUNICIPALS |
| | | | | | | | | | | | | | | | |
Principal
Amount | | | | | Coupon | | | Maturity | | | Value | |
| | California Continued | | | | | | | | | | | | |
| | $ 5,000,000 | | | CA County Tobacco Securitization Agency (TASC) | | | 6.125 | % | | | 06/01/2038 | | | $ | 4,999,900 | |
| | 57,000,000 | | | CA County Tobacco Securitization Agency (TASC) | | | 6.400 | 3 | | | 06/01/2046 | | | | 3,149,250 | |
| | 525,920,000 | | | CA County Tobacco Securitization Agency (TASC) | | | 6.664 | 3 | | | 06/01/2050 | | | | 22,183,306 | |
| | 9,125,000 | | | CA Enterprise Devel. Authority (Sunpower Corp.) | | | 8.500 | | | | 04/01/2031 | | | | 10,587,738 | |
| | 13,190,000 | | | CA GO5 | | | 5.050 | | | | 12/01/2036 | | | | 13,505,216 | |
| | 14,000,000 | | | CA Golden State Tobacco Securitization Corp. (TASC)1 | | | 5.000 | | | | 06/01/2033 | | | | 11,239,480 | |
| | 7,935,000 | | | CA Golden State Tobacco Securitization Corp. (TASC)1 | | | 5.125 | | | | 06/01/2047 | | | | 6,068,450 | |
| | 133,715,000 | | | CA Golden State Tobacco Securitization Corp. (TASC)5 | | | 5.750 | | | | 06/01/2047 | | | | 113,206,356 | |
| | 51,790,000 | | | CA Golden State Tobacco Securitization Corp. (TASC)1 | | | 5.750 | | | | 06/01/2047 | | | | 43,846,968 | |
| | 340,000,000 | | | CA Golden State Tobacco Securitization Corp. (TASC) | | | 6.000 | 3 | | | 06/01/2047 | | | | 4,406,400 | |
| | 15,420,000 | | | CA Health Facilities Financing Authority (SJHS/SJHCN/SJHE/SJHO Obligated Group)5 | | | 5.750 | | | | 07/01/2039 | | | | 17,836,777 | |
| | 15,000,000 | | | CA Health Facilities Financing Authority (SJHS/SJHCN/SJHE/SJHO Obligated Group)1 | | | 5.750 | | | | 07/01/2039 | | | | 17,350,950 | |
| | 11,095,000 | | | CA Health Facilities Financing Authority (Sutter Health/California Pacific Medical Center Obligated Group)5 | | | 5.000 | | | | 11/15/2042 | | | | 11,654,829 | |
| | 24,000,000 | | | CA Health Facilities Financing Authority (Sutter Health/California Pacific Medical Center)5 | | | 5.250 | | | | 11/15/2046 | | | | 25,472,160 | |
| | 7,050,000 | | | CA Health Facilities Financing Authority (Sutter Health/California Pacific Medical Center)1 | | | 5.250 | | | | 11/15/2046 | | | | 7,482,447 | |
| | 2,700,000 | | | CA Independent Cities Finance Authority (Augusta Communities Mobile Home Park)6 | | | 5.000 | | | | 05/15/2047 | | | | 2,774,736 | |
| | 1,835,000 | | | CA Independent Cities Finance Authority Mobile Home Park (Lamplighter Salinas)1 | | | 6.250 | | | | 07/15/2050 | | | | 1,967,817 | |
| | 10,000,000 | | | CA Infrastructure and Economic Devel. (Sanford Consortium)5 | | | 5.000 | | | | 05/15/2040 | | | | 11,228,100 | |
| | 8,600,000 | | | CA M-S-R Energy Authority | | | 7.000 | | | | 11/01/2034 | | | | 11,294,982 | |
| | 3,300,000 | | | CA Municipal Finance Authority (Casa Griffin Apts.)1 | | | 6.000 | | | | 10/01/2046 | | | | 3,507,603 | |
| | 750,000 | | | CA Municipal Finance Authority (Harbor Regional Center)1 | | | 8.500 | | | | 11/01/2039 | | | | 905,873 | |
| | 6,500,000 | | | CA Public Works1 | | | 5.000 | | | | 04/01/2037 | | | | 7,040,930 | |
| | 6,970,000 | | | CA Public Works1 | | | 5.750 | | | | 03/01/2030 | | | | 7,973,959 | |
| | 1,000,000 | | | CA Public Works1 | | | 6.000 | | | | 03/01/2035 | | | | 1,185,330 | |
| | 3,960,000 | | | CA Public Works1 | | | 6.625 | | | | 11/01/2034 | | | | 4,890,323 | |
| | | | |
| 25 | | | | OPPENHEIMER ROCHESTER NATIONAL MUNICIPALS |
STATEMENT OF INVESTMENTS Continued
| | | | | | | | | | | | | | | | |
Principal
Amount | | | | | Coupon | | | Maturity | | | Value | |
| | California Continued | | | | | | | | | | | | |
| | $ 160,600,000 | | | CA Silicon Valley Tobacco Securitization Authority | | | 8.147 | %3 | | | 06/01/2056 | | | $ | 1,479,126 | |
| | 82,250,000 | | | CA Silicon Valley Tobacco Securitization Authority | | | 8.435 | 3 | | | 06/01/2056 | | | | 625,923 | |
| | 25,800,000 | | | CA Silicon Valley Tobacco Securitization Authority | | | 8.590 | 3 | | | 06/01/2041 | | | | 2,186,808 | |
| | 70,785,000 | | | CA Silicon Valley Tobacco Securitization Authority | | | 8.994 | 3 | | | 06/01/2036 | | | | 9,857,519 | |
| | 13,505,000 | | | CA Silicon Valley Tobacco Securitization Authority | | | 9.002 | 3 | | | 06/01/2047 | | | | 684,974 | |
| | 4,500,000 | | | CA Statewide CDA (Daughters of Charity)1 | | | 5.250 | | | | 07/01/2030 | | | | 4,655,115 | |
| | 10,000 | | | CA Statewide CDA (Escrow Term)1 | | | 6.750 | | | | 09/01/2037 | | | | 10,208 | |
| | 13,500,000 | | | CA Statewide CDA (Kaiser Permanente)1 | | | 5.000 | | | | 04/01/2042 | | | | 14,816,925 | |
| | 7,500,000 | | | CA Statewide CDA (Lodi Memorial Hospital)1 | | | 5.000 | | | | 12/01/2027 | | | | 7,906,725 | |
| | 2,019,578 | | | CA Statewide CDA (Microgy Holdings)2 | | | 9.000 | | | | 12/01/2038 | | | | 18,863 | |
| | 1,500,000 | | | CA Statewide CDA (Notre Dame de Namur University)1 | | | 6.625 | | | | 10/01/2033 | | | | 1,517,010 | |
| | 4,875,000 | | | CA Statewide CDA (Sutter Health/California Pacific Medical Center Obligated Group)1 | | | 5.250 | | | | 11/15/2048 | | | | 5,244,428 | |
| | 200,000 | | | CA Statewide CDA Special Tax Community Facilities District No. 2007-1 (Orinda)1 | | | 5.600 | | | | 09/01/2020 | | | | 210,706 | |
| | 555,300,000 | | | CA Statewide Financing Authority Tobacco Settlement | | | 7.001 | 3 | | | 06/01/2055 | | | | 5,880,627 | |
| | 260,000,000 | | | CA Statewide Financing Authority Tobacco Settlement | | | 7.876 | 3 | | | 06/01/2055 | | | | 2,264,600 | |
| | 4,500,000 | | | CA Statewide Financing Authority Tobacco Settlement (TASC)1 | | | 6.000 | | | | 05/01/2037 | | | | 4,500,405 | |
| | 100,000 | | | CA Statewide Financing Authority Tobacco Settlement (TASC)1 | | | 6.000 | | | | 05/01/2043 | | | | 99,295 | |
| | 1,405,000 | | | CA Statewide Financing Authority Tobacco Settlement (TASC)1 | | | 6.000 | | | | 05/01/2043 | | | | 1,395,095 | |
| | 55,000 | | | CA Western Hills Water District Special Tax (Diablo Grande Community Facilities)1 | | | 6.700 | | | | 09/01/2020 | | | | 45,721 | |
| | 2,500,000 | | | Calexico, CA Community Redevel. Agency Tax Allocation (Central Business District
& Residential Redevel.)1 | | | 7.250 | | | | 08/01/2033 | | | | 2,805,425 | |
| | 10,465,000 | | | Cerritos, CA Community College District5 | | | 5.250 | | | | 08/01/2033 | | | | 12,030,025 | |
| | 165,000 | | | Chino, CA Community Facilities District Special Tax1 | | | 5.000 | | | | 09/01/2026 | | | | 166,284 | |
| | 985,000 | | | Chino, CA Community Facilities District Special Tax No. 2005-11 | | | 5.000 | | | | 09/01/2023 | | | | 995,963 | |
| | 1,490,000 | | | Chino, CA Community Facilities District Special Tax No. 2005-11 | | | 5.000 | | | | 09/01/2036 | | | | 1,391,139 | |
| | 350,000 | | | Chino, CA Community Facilities District Special Tax No. 2009-19-11 | | | 6.250 | | | | 09/01/2027 | | | | 360,868 | |
| | 275,000 | | | Chino, CA Community Facilities District Special Tax No. 2009-19-11 | | | 6.375 | | | | 09/01/2028 | | | | 283,553 | |
| | | | |
| 26 | | | | OPPENHEIMER ROCHESTER NATIONAL MUNICIPALS |
| | | | | | | | | | | | | | | | |
Principal
Amount | | | | | Coupon | | | Maturity | | | Value | |
| | California Continued | | | | | | | | | | | | |
| | $ 1,300,000 | | | Chino, CA Community Facilities District Special Tax No. 2009-19-11 | | | 6.750 | % | | | 09/01/2040 | | | $ | 1,340,287 | |
| | 5,855,000 | | | Compton, CA Public Finance Authority1 | | | 5.250 | | | | 09/01/2027 | | | | 4,928,680 | |
| | 1,440,000 | | | Coyote Canyon, CA Public Facilities Community Facilities District No. 2004-11 | | | 6.625 | | | | 09/01/2039 | | | | 1,566,432 | |
| | 33,000,000 | | | Desert, CA Community College District5 | | | 5.000 | | | | 08/01/2037 | | | | 35,779,920 | |
| | 25,000 | | | Eastern CA Municipal Water District Community Facilities Special Tax1 | | | 6.300 | | | | 09/01/2022 | | | | 25,284 | |
| | 820,000 | | | Elsinore Valley, CA Municipal Water District Community Facilities District No. 2004-11 | | | 6.625 | | | | 09/01/2040 | | | | 888,798 | |
| | 10,000,000 | | | Foothill, CA De Anza Community College District1 | | | 5.000 | | | | 08/01/2040 | | | | 11,588,600 | |
| | 100,000 | | | Fort Bragg, CA Redevel. Agency Tax Allocation1 | | | 5.300 | | | | 05/01/2024 | | | | 102,804 | |
| | 15,000,000 | | | Grossmont, CA Union High School District5 | | | 5.500 | | | | 08/01/2045 | | | | 17,680,050 | |
| | 200,000 | | | Imperial, CA Redevel. Agency Tax Allocation (Imperial Redevel.)1 | | | 5.000 | | | | 12/01/2036 | | | | 184,146 | |
| | 80,000,000 | | | Inland, CA Empire Tobacco Securitization Authority (TASC) | | | 6.750 | 3 | | | 06/01/2047 | | | | 3,641,600 | |
| | 432,795,000 | | | Inland, CA Empire Tobacco Securitization Authority (TASC) | | | 7.626 | 3 | | | 06/01/2057 | | | | 3,752,333 | |
| | 1,000,000,000 | | | Inland, CA Empire Tobacco Securitization Authority (TASC) | | | 8.001 | 3 | | | 06/01/2057 | | | | 8,670,000 | |
| | 1,490,000 | | | Jurupa, CA Community Services District Special Tax Community Facilities District No. 41 | | | 5.700 | | | | 09/01/2034 | | | | 1,516,984 | |
| | 400,000 | | | Jurupa, CA Public Financing Authority1 | | | 6.000 | | | | 09/01/2028 | | | | 412,412 | |
| | 350,000 | | | Jurupa, CA Public Financing Authority1 | | | 6.000 | | | | 09/01/2029 | | | | 360,843 | |
| | 310,000 | | | Jurupa, CA Public Financing Authority1 | | | 6.000 | | | | 09/01/2030 | | | | 319,588 | |
| | 350,000 | | | Jurupa, CA Public Financing Authority1 | | | 6.000 | | | | 09/01/2031 | | | | 360,801 | |
| | 500,000 | | | Jurupa, CA Public Financing Authority1 | | | 6.000 | | | | 09/01/2032 | | | | 515,405 | |
| | 1,000,000 | | | Lake Elsinore, CA Unified School District Community Facilities District No. 04-31 | | | 5.250 | | | | 09/01/2029 | | | | 1,005,240 | |
| | 1,335,000 | | | Lathrop, CA Special Tax Community Facilities District No. 03-21 | | | 7.000 | | | | 09/01/2033 | | | | 1,376,879 | |
| | 3,250,000 | | | Los Alamitos, CA Unified School District COP | | | 0.000 | 7 | | | 08/01/2042 | | | | 1,788,898 | |
| | 8,755,000 | | | Los Angeles County, CA Unified School District5 | | | 5.000 | | | | 01/01/2034 | | | | 9,908,955 | |
| | 1,625,000 | | | Los Angeles, CA Community Facilities District Special Tax (Legends at Cascades)1 | | | 5.750 | | | | 09/01/2040 | | | | 1,674,563 | |
| | 31,940,000 | | | Los Angeles, CA Dept. of Airports (Los Angeles International Airport)5 | | | 5.375 | | | | 05/15/2030 | | | | 35,609,587 | |
| | 5,000,000 | | | Los Angeles, CA Dept. of Water & Power5 | | | 5.000 | | | | 07/01/2034 | | | | 5,615,300 | |
| | 90,000 | | | Los Angeles, CA Multifamily Hsg. (Arminta North & South) | | | 7.700 | | | | 06/20/2028 | | | | 90,088 | |
| | | | |
| 27 | | | | OPPENHEIMER ROCHESTER NATIONAL MUNICIPALS |
STATEMENT OF INVESTMENTS Continued
| | | | | | | | | | | | | | | | |
Principal
Amount | | | | | Coupon | | | Maturity | | | Value | |
| | California Continued | | | | | | | | | | | | |
| | $ 4,500,000 | | | Los Angeles, CA Regional Airports Improvement Corp. (Air Canada) | | | 8.750 | % | | | 10/01/2014 | | | $ | 4,500,675 | |
| | 10,000 | | | Los Angeles, CA Regional Airports Improvement Corp. (American Airlines) | | | 7.000 | | | | 12/01/2012 | | | | 9,980 | |
| | 5,350,000 | | | Los Angeles, CA Regional Airports Improvement Corp. (American Airlines) | | | 7.125 | | | | 12/01/2024 | | | | 5,349,251 | |
| | 19,050,000 | | | Los Angeles, CA Regional Airports Improvement Corp. (American Airlines) | | | 7.500 | | | | 12/01/2024 | | | | 19,047,143 | |
| | 99,245,000 | | | Los Angeles, CA Regional Airports Improvement Corp. (American Airlines) | | | 7.500 | | | | 12/01/2024 | | | | 99,230,063 | |
| | 11,740,000 | | | Los Angeles, CA Regional Airports Improvement Corp. (Delta-Continental Airlines) | | | 9.250 | | | | 08/01/2024 | | | | 11,814,197 | |
| | 26,875,000 | | | Los Angeles, CA Unified School District5 | | | 5.000 | | | | 07/01/2030 | | | | 29,391,774 | |
| | 11,000,000 | | | Los Angeles, CA Unified School District5 | | | 5.000 | | | | 07/01/2032 | | | | 12,392,160 | |
| | 30,000,000 | | | Los Angeles, CA Unified School District5 | | | 5.000 | | | | 07/01/2032 | | | | 33,826,500 | |
| | 7,330,000 | | | Los Angeles, CA Unified School District5 | | | 5.000 | | | | 01/01/2034 | | | | 8,296,898 | |
| | 10,550,000 | | | Los Angeles, CA Unified School District5 | | | 5.000 | | | | 01/01/2034 | | | | 11,941,069 | |
| | 200,000 | | | Maywood, CA Public Financing Authority1 | | | 7.000 | | | | 09/01/2038 | | | | 198,562 | |
| | 1,250,000 | | | Modesto, CA Special Tax Community Facilities
District No. 41 | | | 5.150 | | | | 09/01/2036 | | | | 1,250,850 | |
| | 1,470,000 | | | Moreno Valley, CA Unified School District Community Facilities District Special Tax1 | | | 5.000 | | | | 09/01/2037 | | | | 1,429,002 | |
| | 11,535,000 | | | Newport Beach, CA (Presbyterian Hoag Memorial Hospital)5 | | | 5.000 | | | | 12/01/2024 | | | | 12,106,576 | |
| | 20,000,000 | | | Northern CA Tobacco Securitization Authority (TASC) | | | 5.375 | | | | 06/01/2038 | | | | 16,241,600 | |
| | 115,975,000 | | | Northern CA Tobacco Securitization Authority (TASC) | | | 6.375 | 3 | | | 06/01/2045 | | | | 3,388,790 | |
| | 2,825,000 | | | Novato, CA Redevel. Agency (Hamilton Field Redevel.)1 | | | 6.750 | | | | 09/01/2040 | | | | 3,260,333 | |
| | 5,925,000 | | | Palm Desert, CA Improvement Bond Act 19151 | | | 5.100 | | | | 09/02/2037 | | | | 4,854,649 | |
| | 14,000,000 | | | Paramount, CA Unified School District1 | | | 0.000 | 7 | | | 08/01/2045 | | | | 9,324,980 | |
| | 15,435,000 | | | Peralta, CA Community College District5 | | | 5.000 | | | | 08/01/2035 | | | | 16,335,461 | |
| | 1,000,000 | | | Perris, CA Community Facilities District Special Tax1 | | | 5.300 | | | | 09/01/2035 | | | | 1,012,110 | |
| | 10,000 | | | Perris, CA Public Financing Authority, Series A1 | | | 6.125 | | | | 09/01/2034 | | | | 10,418 | |
| | 28,054,000 | | | River Rock, CA Entertainment Authority | | | 8.000 | | | | 11/01/2018 | | | | 27,232,859 | |
| | 1,750,000 | | | Riverside County, CA Redevel. Agency1 | | | 7.125 | | | | 10/01/2042 | | | | 2,078,038 | |
| | 4,700,000 | | | Riverside, CA (Recovery Zone Facility) COP1 | | | 5.500 | | | | 03/01/2040 | | | | 4,971,237 | |
| | 400,000 | | | Riverside, CA Special Tax Community Facilities District No. 92-1, Series A1 | | | 5.300 | | | | 09/01/2034 | | | | 400,476 | |
| | 1,345,000 | | | Riverside, CA Unified School District Special Tax Community Facilities District No. 151 | | | 5.600 | | | | 09/01/2034 | | | | 1,368,645 | |
| | | | |
| 28 | | | | OPPENHEIMER ROCHESTER NATIONAL MUNICIPALS |
| | | | | | | | | | | | | | | | |
Principal
Amount | | | | | Coupon | | | Maturity | | | Value | |
| | California Continued | | | | | | | | | | | | |
| | $ 1,750,000 | | | Sacramento County, CA COP1 | | | 5.750 | % | | | 02/01/2030 | | | $ | 1,961,803 | |
| | 325,000 | | | San Bernardino, CA Special Tax Community Facilities District No. 2006-1 (Lytle Creek)1 | | | 5.625 | | | | 09/01/2034 | | | | 334,906 | |
| | 825,000 | | | San Bernardino, CA Special Tax Community Facilities District No. 2006-1 (Lytle Creek)1 | | | 5.750 | | | | 09/01/2040 | | | | 850,097 | |
| | 2,000,000 | | | San Buenaventura, CA Community Memorial Health Systems1 | | | 8.000 | | | | 12/01/2031 | | | | 2,533,760 | |
| | 2,200,000 | | | San Diego County, CA COP | | | 5.700 | | | | 02/01/2028 | | | | 1,760,836 | |
| | 16,260,000 | | | San Francisco, CA Bay Area Toll Authority5 | | | 5.125 | | | | 04/01/2047 | | | | 18,485,487 | |
| | 750,000 | | | San Francisco, CA City & County Redevel. Financing Authority (Mission Bay North Redevel.)1 | | | 6.750 | | | | 08/01/2041 | | | | 877,868 | |
| | 1,000,000 | | | San Francisco, CA City & County Redevel. Financing Authority (Mission Bay North Redevel.)1 | | | 7.000 | | | | 08/01/2041 | | | | 1,143,080 | |
| | 5,000,000 | | | San Joaquin Hills, CA Transportation Corridor | | | 6.250 | 3 | | | 01/15/2031 | | | | 1,813,950 | |
| | 6,000,000 | | | Santa Clara, CA Redevel. Agency Tax Allocation (Bayshore North)1 | | | 5.750 | | | | 06/01/2026 | | | | 6,707,280 | |
| | 73,990,000 | | | Silicon Valley CA Tobacco Securitization Authority | | | 8.902 | 3 | | | 06/01/2047 | | | | 3,752,773 | |
| | 28,690,000 | | | Southern CA Tobacco Securitization Authority1 | | | 5.125 | | | | 06/01/2046 | | | | 22,636,984 | |
| | 195,570,000 | | | Southern CA Tobacco Securitization Authority | | | 6.383 | 3 | | | 06/01/2046 | | | | 5,384,042 | |
| | 41,325,000 | | | Southern CA Tobacco Securitization Authority | | | 6.400 | 3 | | | 06/01/2046 | | | | 1,084,368 | |
| | 143,080,000 | | | Southern CA Tobacco Securitization Authority | | | 7.100 | 3 | | | 06/01/2046 | | | | 3,465,398 | |
| | 1,655,000 | | | Stockton, CA Public Financing Authority, Series A1 | | | 5.250 | | | | 09/01/2031 | | | | 1,262,037 | |
| | 12,115,000 | | | Stockton, CA Unified School District | | | 5.920 | 3 | | | 08/01/2038 | | | | 2,778,212 | |
| | 14,735,000 | | | Stockton, CA Unified School District | | | 5.950 | 3 | | �� | 08/01/2041 | | | | 2,838,992 | |
| | 17,145,000 | | | Stockton, CA Unified School District | | | 5.950 | 3 | | | 08/01/2043 | | | | 2,937,110 | |
| | 6,245,000 | | | Stockton, CA Unified School District | | | 6.000 | 3 | | | 08/01/2037 | | | | 1,519,221 | |
| | 5,360,000 | | | Stockton, CA Unified School District | | | 6.020 | 3 | | | 08/01/2048 | | | | 671,018 | |
| | 1,335,000 | | | Susanville, CA Public Financing Authority (Utility Enterprises)1 | | | 5.875 | | | | 06/01/2035 | | | | 1,419,626 | |
| | 1,425,000 | | | Susanville, CA Public Financing Authority (Utility Enterprises)1 | | | 6.000 | | | | 06/01/2045 | | | | 1,517,269 | |
| | 5,425,000 | | | Temecula, CA Public Financing Authority Community Facilities District (Roripaugh) | | | 5.450 | | | | 09/01/2026 | | | | 3,965,729 | |
| | 11,000,000 | | | Temecula, CA Public Financing Authority Community Facilities District (Roripaugh) | | | 5.500 | | | | 09/01/2036 | | | | 7,492,320 | |
| | 2,030,000 | | | Thousand Oaks, CA Community Facilities District6 | | | 5.000 | | | | 09/01/2022 | | | | 2,039,500 | |
| | 6,015,000 | | | Thousand Oaks, CA Community Facilities District6 | | | 5.375 | | | | 09/01/2031 | | | | 6,026,308 | |
| | 4,665,000 | | | Tustin, CA Community Facilities District Special Tax (Legacy/Columbus)1 | | | 6.000 | | | | 09/01/2036 | | | | 4,884,675 | |
| | | | |
| 29 | | | | OPPENHEIMER ROCHESTER NATIONAL MUNICIPALS |
STATEMENT OF INVESTMENTS Continued
| | | | | | | | | | | | | | | | |
Principal
Amount | | | | | Coupon | | | Maturity | | | Value | |
| | California Continued | | | | | | | | | | | | |
| | $ 200,000 | | | Upland, CA Community Facilities District (San Antonio)1 | | | 6.100 | % | | | 09/01/2034 | | | $ | 207,428 | |
| | 3,500,000 | | | West Hollywood, CA Community Devel. Commission Tax Allocation (East Side Redevel.)1 | | | 7.500 | | | | 09/01/2042 | | | | 4,011,175 | |
| | 60,000 | | | West Patterson, CA Financing Authority Special Tax1 | | | 6.700 | | | | 09/01/2032 | | | | 60,025 | |
| | 35,000 | | | West Patterson, CA Financing Authority Special Tax Community Facilities District No. 2001-1-A1 | | | 6.500 | | | | 09/01/2026 | | | | 35,020 | |
| | 7,000,000 | | | West Sacramento, CA Special Tax Community Facilities District No. 271 | | | 7.000 | | | | 09/01/2040 | | | | 7,324,800 | |
| | 4,755,000 | | | Western Placer, CA Unified School District1 | | | 5.750 | | | | 08/01/2049 | | | | 5,254,132 | |
| | 15,000,000 | | | Westminster, CA Redevel. Agency Tax Allocation5 | | | 5.750 | | | | 11/01/2045 | | | | 17,325,450 | |
| | 7,500,000 | | | Westminster, CA Redevel. Agency Tax Allocation5 | | | 6.250 | | | | 11/01/2039 | | | | 9,127,425 | |
| | 75,000 | | | Woodland, CA Special Tax Community Facilities District No. 11 | | | 6.000 | | | | 09/01/2028 | | | | 76,050 | |
| | | | | | | | | | | | | | | | 1,272,798,560 | |
| | Colorado—4.3% | | | | | | | | | | | | |
| | 1,750,000 | | | Arkansas River, CO Power Authority1 | | | 6.125 | | | | 10/01/2040 | | | | 1,879,938 | |
| | 1,000,000 | | | CO Andonea Metropolitan District No. 2 | | | 6.125 | | | | 12/01/2025 | | | | 884,620 | |
| | 2,380,000 | | | CO Andonea Metropolitan District No. 3 | | | 6.250 | | | | 12/01/2035 | | | | 1,968,903 | |
| | 5,000,000 | | | CO Arista Metropolitan District | | | 6.750 | | | | 12/01/2035 | | | | 4,161,100 | |
| | 14,000,000 | | | CO Arista Metropolitan District | | | 9.250 | | | | 12/01/2037 | | | | 11,011,560 | |
| | 3,000,000 | | | CO Beacon Point Metropolitan District1 | | | 6.125 | | | | 12/01/2025 | | | | 3,049,740 | |
| | 3,500,000 | | | CO Beacon Point Metropolitan District1 | | | 6.250 | | | | 12/01/2035 | | | | 3,541,510 | |
| | 500,000 | | | CO Castle Oaks Metropolitan District1 | | | 6.125 | | | | 12/01/2035 | | | | 442,175 | |
| | 5,505,000 | | | CO Central Marksheffel Metropolitan District | | | 7.250 | | | | 12/01/2029 | | | | 5,568,693 | |
| | 1,000,000 | | | CO Confluence Metropolitan District | | | 5.400 | | | | 12/01/2027 | | | | 866,320 | |
| | 1,000,000 | | | CO Copperleaf Metropolitan District No. 2 | | | 5.850 | | | | 12/01/2026 | | | | 785,290 | |
| | 1,850,000 | | | CO Copperleaf Metropolitan District No. 2 | | | 5.950 | | | | 12/01/2036 | | | | 1,327,135 | |
| | 1,025,000 | | | CO Country Club Highlands Metropolitan District2 | | | 7.250 | | | | 12/01/2037 | | | | 953,824 | |
| | 1,500,000 | | | CO Crystal Crossing Metropolitan District4 | | | 6.000 | | | | 12/01/2036 | | | | 998,460 | |
| | 1,210,000 | | | CO Educational and Cultural Facilities Authority (Carbon Valley Academy Charter School) | | | 5.625 | | | | 12/01/2036 | | | | 896,719 | |
| | 1,287,000 | | | CO Elbert and Highway 86 Metropolitan District | | | 5.750 | | | | 12/01/2036 | | | | 945,134 | |
| | 4,475,000 | | | CO Elbert and Highway 86 Metropolitan District4 | | | 7.500 | | | | 12/01/2032 | | | | 3,018,388 | |
| | 2,385,000 | | | CO Elkhorn Ranch Metropolitan District | | | 6.375 | | | | 12/01/2035 | | | | 2,176,384 | |
| | 671,000 | | | CO Fallbrook Metropolitan District1 | | | 5.625 | | | | 12/01/2026 | | | | 597,197 | |
| | 1,800,000 | | | CO Fossil Ridge Metropolitan District No. 11 | | | 7.250 | | | | 12/01/2040 | | | | 1,910,538 | |
| | 50,000 | | | CO Health Facilities Authority (CLC/CLCSF Obligated Group) | | | 6.250 | | | | 01/01/2034 | | | | 49,495 | |
| | | | |
| 30 | | | | OPPENHEIMER ROCHESTER NATIONAL MUNICIPALS |
| | | | | | | | | | | | | | | | |
Principal
Amount | | | | | Coupon | | | Maturity | | | Value | |
| | Colorado Continued | | | | | | | | | | | | |
| | $ 1,225,000 | | | CO Health Facilities Authority Health & Residential Care Facilities (Volunteers of America) | | | 5.300 | % | | | 07/01/2037 | | | $ | 1,160,161 | |
| | 2,942,000 | | | CO Heritage Todd Creek Metropolitan District1 | | | 5.500 | | | | 12/01/2037 | | | | 2,339,890 | |
| | 5,080,000 | | | CO High Plains Metropolitan District | | | 6.125 | | | | 12/01/2025 | | | | 4,706,417 | |
| | 10,875,000 | | | CO High Plains Metropolitan District | | | 6.250 | | | | 12/01/2035 | | | | 9,493,766 | |
| | 491,000 | | | CO Horse Creek Metropolitan District1 | | | 5.750 | | | | 12/01/2036 | | | | 405,866 | |
| | 500,000 | | | CO Huntington Trails Metropolitan District1 | | | 6.250 | | | | 12/01/2036 | | | | 515,790 | |
| | 1,700,000 | | | CO Huntington Trails Metropolitan District1 | | | 8.250 | | | | 12/01/2037 | | | | 1,719,329 | |
| | 2,500,000 | | | CO International Center Metropolitan District No. 31 | | | 6.500 | | | | 12/01/2035 | | | | 2,129,275 | |
| | 1,118,000 | | | CO Liberty Ranch Metropolitan District4 | | | 6.250 | | | | 12/01/2036 | | | | 973,767 | |
| | 1,875,000 | | | CO Madre Metropolitan District No. 2 | | | 5.500 | | | | 12/01/2036 | | | | 1,399,181 | |
| | 2,800,000 | | | CO Mountain Shadows Metropolitan District | | | 5.625 | | | | 12/01/2037 | | | | 2,242,716 | |
| | 1,645,000 | | | CO Multifamily Hsg. Revenue Bond Pass-Through Certificates (MS Loveland/American International Obligated Group)1 | | | 6.000 | 8 | | | 11/01/2033 | | | | 1,645,280 | |
| | 3,000,000 | | | CO Murphy Creek Metropolitan District No. 34 | | | 6.000 | | | | 12/01/2026 | | | | 1,492,350 | |
| | 10,060,000 | | | CO Murphy Creek Metropolitan District No. 34 | | | 6.125 | | | | 12/01/2035 | | | | 4,952,337 | |
| | 2,275,000 | | | CO Neu Towne Metropolitan District4 | | | 7.250 | | | | 12/01/2034 | | | | 684,593 | |
| | 1,290,000 | | | CO North Range Metropolitan District No. 21 | | | 5.500 | | | | 12/15/2018 | | | | 1,315,723 | |
| | 1,000,000 | | | CO North Range Metropolitan District No. 21 | | | 5.500 | | | | 12/15/2037 | | | | 973,270 | |
| | 4,500,000 | | | CO Northwest Metropolitan District No. 31 | | | 6.125 | | | | 12/01/2025 | | | | 4,485,375 | |
| | 7,855,000 | | | CO Northwest Metropolitan District No. 31 | | | 6.250 | | | | 12/01/2035 | | | | 7,712,353 | |
| | 12,585,000 | | | CO Park Valley Water and Sanitation Metropolitan District | | | 6.000 | 3 | | | 12/15/2017 | | | | 5,578,679 | |
| | 1,590,000 | | | CO Potomac Farms Metropolitan District | | | 7.250 | | | | 12/01/2037 | | | | 1,330,162 | |
| | 320,000 | | | CO Potomac Farms Metropolitan District | | | 7.625 | | | | 12/01/2023 | | | | 328,973 | |
| | 780,000 | | | CO Prairie Center Metropolitan District No. 31 | | | 5.250 | | | | 12/15/2021 | | | | 788,744 | |
| | 1,250,000 | | | CO Prairie Center Metropolitan District No. 31 | | | 5.400 | | | | 12/15/2031 | | | | 1,242,488 | |
| | 970,000 | | | CO Prairie Center Metropolitan District No. 31 | | | 5.400 | | | | 12/15/2031 | | | | 964,170 | |
| | 2,259,000 | | | CO Regency Metropolitan District | | | 5.750 | | | | 12/01/2036 | | | | 1,896,476 | |
| | 16,250,000 | | | CO Regional Transportation District (Denver Transportation Partners)1 | | | 6.000 | | | | 01/15/2034 | | | | 18,714,475 | |
| | 6,530,000 | | | CO Regional Transportation District (Denver Transportation Partners)1 | | | 6.000 | | | | 01/15/2041 | | | | 7,443,286 | |
| | 3,500,000 | | | CO Regional Transportation District COP (Denver Transportation Partners)1 | | | 5.375 | | | | 06/01/2031 | | | | 3,996,265 | |
| | 1,750,000 | | | CO Serenity Ridge Metropolitan District No. 24 | | | 7.500 | | | | 12/01/2034 | | | | 845,775 | |
| | 500,000 | | | CO Silver Peaks Metropolitan District | | | 5.750 | | | | 12/01/2036 | | | | 373,395 | |
| | 5,153,000 | | | CO Sorrell Ranch Metropolitan District | | | 5.750 | | | | 12/01/2036 | | | | 5,172,118 | |
| | 1,720,000 | | | CO Sorrell Ranch Metropolitan District4 | | | 6.750 | | | | 12/15/2036 | | | | 1,726,742 | |
| | | | |
| 31 | | | | OPPENHEIMER ROCHESTER NATIONAL MUNICIPALS |
STATEMENT OF INVESTMENTS Continued
| | | | | | | | | | | | | | | | |
Principal
Amount | | | | | Coupon | | | Maturity | | | Value | |
| | Colorado Continued | | | | | | | | | | | | |
| | $ 1,315,000 | | | CO Stoneridge Metropolitan District1 | | | 5.625 | % | | | 12/01/2036 | | | $ | 1,157,739 | |
| | 8,000,000 | | | CO Talon Pointe Metropolitan District | | | 8.000 | | | | 12/01/2039 | | | | 8,207,120 | |
| | 655,000 | | | CO Todd Creek Farms Metropolitan District No. 12 | | | 6.125 | | | | 12/01/2019 | | | | 326,878 | |
| | 695,000 | | | CO Traditions Metropolitan District No. 21 | | | 5.750 | | | | 12/01/2036 | | | | 668,555 | |
| | 4,390,000 | | | CO Traditions Metropolitan District No. 2 CAB | | | 0.000 | 7 | | | 12/15/2037 | | | | 3,960,834 | |
| | 3,755,000 | | | CO Waterview I Metropolitan District | | | 8.000 | | | | 12/15/2032 | | | | 3,831,715 | |
| | 500,000 | | | CO Wheatlands Metropolitan District1 | | | 6.000 | | | | 12/01/2025 | | | | 466,065 | |
| | 2,500,000 | | | CO Wheatlands Metropolitan District1 | | | 6.125 | | | | 12/01/2035 | | | | 2,185,400 | |
| | 4,000,000 | | | CO Wheatlands Metropolitan District No. 2 | | | 8.250 | | | | 12/15/2035 | | | | 4,069,600 | |
| | 500,000 | | | CO Wyndham Hill Metropolitan District1 | | | 6.250 | | | | 12/01/2025 | | | | 466,545 | |
| | 892,000 | | | CO Wyndham Hill Metropolitan District1 | | | 6.375 | | | | 12/01/2035 | | | | 791,008 | |
| | 18,510,000 | | | Colorado Springs, CO Urban Renewal (University Village Colorado) | | | 7.000 | | | | 12/01/2029 | | | | 12,473,149 | |
| | 52,375,000 | | | Denver, CO City & County Airport Special Facilities (United Air Lines)1 | | | 5.250 | | | | 10/01/2032 | | | | 52,273,916 | |
| | 35,200,000 | | | Denver, CO City & County Airport Special Facilities (United Air Lines)1 | | | 5.750 | | | | 10/01/2032 | | | | 35,968,768 | |
| | 950,000 | | | Denver, CO International Business Center Metropolitan District No. 11 | | | 5.000 | | | | 12/01/2030 | | | | 997,804 | |
| | 1,700,000 | | | Denver, CO International Business Center Metropolitan District No. 11 | | | 5.375 | | | | 12/01/2035 | | | | 1,788,434 | |
| | 675,000 | | | Eagle County, CO Airport Terminal Corp.1 | | | 5.250 | | | | 05/01/2020 | | | | 677,538 | |
| | 500,000 | | | Harvest Junction, CO Metropolitan District1 | | | 5.000 | | | | 12/01/2030 | | | | 511,105 | |
| | 200,000 | | | Harvest Junction, CO Metropolitan District1 | | | 5.200 | | | | 12/01/2032 | | | | 205,050 | |
| | 500,000 | | | Harvest Junction, CO Metropolitan District1 | | | 5.375 | | | | 12/01/2037 | | | | 511,100 | |
| | 750,000 | | | Tabernash Meadows, CO Water & Sanitation District1 | | | 7.125 | | | | 12/01/2034 | | | | 873,675 | |
| | 20,183,519 | | | Woodmen Heights, CO Metropolitan
District No. 1 | | | 0.000 | 7 | | | 12/15/2041 | | | | 7,949,077 | |
| | 5,632,763 | | | Woodmen Heights, CO Metropolitan
District No. 11 | | | 6.000 | | | | 12/01/2041 | | | | 5,293,220 | |
| | | | | | | | | | | | | | | | 293,436,605 | |
| | Connecticut—0.1% | | | | | | | | | | | | |
| | 470,000 | | | Georgetown, CT Special Taxing District2 | | | 5.125 | | | | 10/01/2036 | | | | 218,559 | |
| | 3,750,000 | | | Mashantucket, CT Western Pequot Tribe, Series B2 | | | 5.500 | | | | 09/01/2036 | | | | 1,480,725 | |
| | 1,750,000 | | | Mashantucket, CT Western Pequot Tribe, Series B2 | | | 5.750 | | | | 09/01/2027 | | | | 690,778 | |
| | | | |
| 32 | | | | OPPENHEIMER ROCHESTER NATIONAL MUNICIPALS |
| | | | | | | | | | | | | | | | |
Principal
Amount | | | | | Coupon | | | Maturity | | | Value | |
| | Connecticut Continued | | | | | | | | | | | | |
| | $ 6,000,000 | | | Mashantucket, CT Western Pequot Tribe, Series B2,9 | | | 6.500 | % | | | 09/01/2031 | | | $ | 2,365,380 | |
| | | | | | | | | | | | | | | | 4,755,442 | |
| | Delaware—0.1% | | | | | | | | | | | | |
| | 1,400,000 | | | Bridgeville, DE Special Obligation (Heritage Shores)1 | | | 5.450 | | | | 07/01/2035 | | | | 1,130,906 | |
| | 6,932,000 | | | Millsboro, DE Special Obligation (Plantation Lakes)1 | | | 5.450 | | | | 07/01/2036 | | | | 5,349,840 | |
| | | | | | | | | | | | | | | | 6,480,746 | |
| | District of Columbia—3.4% | | | | | | | | | | | | |
| | 10,000,000 | | | District of Columbia (Howard University)1 | | | 6.250 | | | | 10/01/2032 | | | | 11,725,600 | |
| | 25,610,000 | | | District of Columbia (Howard University)1 | | | 6.500 | | | | 10/01/2041 | | | | 30,084,323 | |
| | 5,000,000 | | | District of Columbia (National Public Radio)5 | | | 5.000 | | | | 04/01/2035 | | | | 5,541,050 | |
| | 28,525,000 | | | District of Columbia (National Public Radio)5 | | | 5.000 | | | | 04/01/2043 | | | | 30,824,625 | |
| | 3,200,000 | | | District of Columbia Center for Strategic & International Studies1 | | | 6.375 | | | | 03/01/2031 | | | | 3,462,112 | |
| | 2,000,000 | | | District of Columbia Center for Strategic & International Studies1 | | | 6.625 | | | | 03/01/2041 | | | | 2,183,620 | |
| | 85,000 | | | District of Columbia Tobacco Settlement Financing Corp. | | | 6.250 | | | | 05/15/2024 | | | | 86,698 | |
| | 32,680,000 | | | District of Columbia Tobacco Settlement Financing Corp.1 | | | 6.750 | | | | 05/15/2040 | | | | 33,333,273 | |
| | 1,375,680,000 | | | District of Columbia Tobacco Settlement Financing Corp. (TASC) | | | 6.897 | 3 | | | 06/15/2055 | | | | 12,078,470 | |
| | 1,055,000,000 | | | District of Columbia Tobacco Settlement Financing Corp. (TASC) | | | 7.250 | 3 | | | 06/15/2055 | | | | 8,239,550 | |
| | 29,315,000 | | | Metropolitan Washington D.C. Airport Authority5 | | | 5.000 | | | | 10/01/2032 | | | | 31,068,831 | |
| | 16,615,000 | | | Metropolitan Washington D.C. Airport Authority (Dulles Toll Road) | | | 0.000 | 7 | | | 10/01/2041 | | | | 16,004,399 | |
| | 38,485,000 | | | Metropolitan Washington D.C. Airport Authority (Dulles Toll Road-Metrorail)1 | | | 0.000 | 7 | | | 10/01/2044 | | | | 32,763,050 | |
| | 12,100,000 | | | Metropolitan Washington D.C. Airport Authority, Series B5 | | | 5.000 | | | | 10/01/2034 | | | | 12,445,840 | |
| | | | | | | | | | | | | | | | 229,841,441 | |
| | Florida—12.3% | | | | | | | | | | | | |
| | 1,040,000 | | | Aberdeen, FL Community Devel. District2 | | | 5.250 | | | | 11/01/2015 | | | | 533,021 | |
| | 300,000 | | | Aberdeen, FL Community Devel. District2 | | | 5.500 | | | | 11/01/2011 | | | | 153,756 | |
| | 22,500,000 | | | Aberdeen, FL Community Devel. District4 | | | 5.500 | | | | 05/01/2036 | | | | 11,739,375 | |
| | 8,000,000 | | | Alachua County, FL Industrial Devel. Revenue (North Florida Retirement Village) | | | 5.875 | | | | 11/15/2042 | | | | 7,789,520 | |
| | | | |
| 33 | | | | OPPENHEIMER ROCHESTER NATIONAL MUNICIPALS |
STATEMENT OF INVESTMENTS Continued
| | | | | | | | | | | | | | | | |
Principal
Amount | | | | | Coupon | | | Maturity | | | Value | |
| | Florida Continued | | | | | | | | | | | | |
| | $ 5,350,000 | | | Amelia Concourse, FL Community Devel. District2 | | | 5.750 | % | | | 05/01/2038 | | | $ | 2,131,012 | |
| | 180,000 | | | Arborwood, FL Community Devel. District (Centex Homes)1 | | | 5.250 | | | | 05/01/2016 | | | | 175,039 | |
| | 13,820,000 | | | Arlington Ridge, FL Community Devel. District4 | | | 5.500 | | | | 05/01/2036 | | | | 5,478,248 | |
| | 2,200,000 | | | Avelar Creek, FL Community Devel. District1 | | | 5.375 | | | | 05/01/2036 | | | | 2,101,858 | |
| | 1,045,000 | | | Avignon Villages, FL Community Devel. District2 | | | 5.300 | | | | 05/01/2014 | | | | 261,302 | |
| | 755,000 | | | Avignon Villages, FL Community Devel. District2 | | | 5.400 | | | | 05/01/2037 | | | | 188,856 | |
| | 14,970,000 | | | Baker, FL Correctional Devel. Corp. (Detention Center) | | | 7.500 | | | | 02/01/2030 | | | | 14,840,659 | |
| | 2,150,000 | | | Bay Laurel Center, FL Community Devel. District Special Assessment1 | | | 5.450 | | | | 05/01/2037 | | | | 1,998,318 | |
| | 225,000 | | | Bayshore, FL Hsg. Corp.2 | | | 8.000 | | | | 12/01/2016 | | | | 57,211 | |
| | 10,040,000 | | | Baywinds, FL Community Devel. District | | | 5.250 | | | | 05/01/2037 | | | | 5,361,962 | |
| | 4,250,000 | | | Baywinds, FL Community Devel. District | | | 7.020 | | | | 05/01/2022 | | | | 3,040,790 | |
| | 10,640,000 | | | Bella Verde, FL Golf Community Devel. District2 | | | 7.250 | | | | 12/18/2008 | | | | 2,941,854 | |
| | 10,000,000 | | | Bonnet Creek, FL Resort Community Devel. District Special Assessment1 | | | 7.375 | | | | 05/01/2034 | | | | 10,037,600 | |
| | 9,625,000 | | | Bonnet Creek, FL Resort Community Devel. District Special Assessment1 | | | 7.500 | | | | 05/01/2034 | | | | 9,669,853 | |
| | 3,780,000 | | | Boynton Village, FL Community Devel. District Special Assessment2 | | | 6.000 | | | | 05/01/2038 | | | | 3,380,756 | |
| | 360,000 | | | Broward County, FL HFA (Single Family)1 | | | 5.000 | | | | 10/01/2039 | | | | 360,659 | |
| | 15,000 | | | Broward County, FL HFA (Stirling Apartments)1 | | | 5.600 | | | | 10/01/2018 | | | | 15,011 | |
| | 125,000 | | | Broward County, FL HFA (Stirling Apartments)1 | | | 5.750 | | | | 04/01/2038 | | | | 125,045 | |
| | 5,845,000 | | | Buckeye Park, FL Community Devel. District2 | | | 7.875 | | | | 05/01/2038 | | | | 2,667,424 | |
| | 755,000 | | | Cascades, FL Groveland Community Devel. District1 | | | 5.300 | | | | 05/01/2036 | | | | 595,672 | |
| | 25,500,000 | | | CFM, FL Community Devel. District, Series A2 | | | 6.250 | | | | 05/01/2035 | | | | 10,948,425 | |
| | 12,480,000 | | | Chapel Creek, FL Community Devel. District Special Assessment2 | | | 5.500 | | | | 05/01/2038 | | | | 5,248,090 | |
| | 26,530,000 | | | Clearwater Cay, FL Community Devel. District2 | | | 5.500 | | | | 05/01/2037 | | | | 10,118,011 | |
| | 16,095,000 | | | Concord Stations, FL Community Devel. District | | | 5.300 | | | | 05/01/2035 | | | | 10,531,119 | |
| | 3,775,000 | | | Connerton West, FL Community Devel. District2 | | | 5.125 | | | | 05/01/2016 | | | | 1,444,202 | |
| | 4,310,000 | | | Connerton West, FL Community Devel. District2 | | | 5.400 | | | | 05/01/2038 | | | | 1,648,877 | |
| | 4,800,000 | | | Copperstone, FL Community Devel. District1 | | | 5.200 | | | | 05/01/2038 | | | | 3,952,128 | |
| | 3,230,000 | | | Creekside, FL Community Devel. District2 | | | 5.200 | | | | 05/01/2038 | | | | 1,358,086 | |
| | 2,625,000 | | | Crosscreek, FL Community Devel. District2 | | | 5.500 | | | | 05/01/2017 | | | | 1,130,246 | |
| | 1,255,000 | | | Crosscreek, FL Community Devel. District2 | | | 5.600 | | | | 05/01/2039 | | | | 540,616 | |
| | 9,100,000 | | | Cypress Creek of Hillsborough County, FL Community Devel. District | | | 5.350 | | | | 05/01/2037 | | | | 5,871,593 | |
| | | | |
| 34 | | | | OPPENHEIMER ROCHESTER NATIONAL MUNICIPALS |
| | | | | | | | | | | | | | | | |
Principal
Amount | | | | | Coupon | | | Maturity | | | Value | |
| | Florida Continued | | | | | | | | | | | | |
| | $ 45,000 | | | Dade County, FL HFA (Golden Lakes Apartments)1 | | | 6.050 | % | | | 11/01/2039 | | | $ | 45,023 | |
| | 90,000 | | | Dade County, FL HFA (Siesta Pointe Apartments)1 | | | 5.650 | | | | 09/01/2017 | | | | 90,207 | |
| | 1,500,000 | | | Dade County, FL IDA (Miami Cerebral Palsy Residence)1 | | | 8.000 | | | | 06/01/2022 | | | | 1,500,240 | |
| | 75,000 | | | Dade County, FL Res Rec | | | 5.500 | | | | 10/01/2013 | | | | 75,293 | |
| | 7,745,000 | | | Deer Run, FL Community Devel. District Special Assessment2 | | | 7.625 | | | | 05/01/2039 | | | | 4,319,774 | |
| | 2,270,000 | | | Durbin Crossing, FL Community Devel. District Special Assessment2 | | | 5.250 | | | | 11/01/2015 | | | | 1,853,500 | |
| | 3,130,000 | | | East Homestead, FL Community Devel. District1 | | | 5.375 | | | | 05/01/2036 | | | | 2,433,669 | |
| | 2,185,000 | | | East Park, FL Community Devel. District Special Assessment2 | | | 7.500 | | | | 05/01/2039 | | | | 1,681,663 | |
| | 1,035,000 | | | Easton Park, FL Community Devel. District1 | | | 5.200 | | | | 05/01/2037 | | | | 1,006,558 | |
| | 3,085,000 | | | FL Capital Trust Agency (American Opportunity)2 | | | 5.750 | | | | 06/01/2023 | | | | 1,758,481 | |
| | 2,000,000 | | | FL Capital Trust Agency (American Opportunity)2 | | | 5.875 | | | | 06/01/2038 | | | | 1,140,020 | |
| | 940,000 | | | FL Capital Trust Agency (American Opportunity)2 | | | 7.250 | | | | 06/01/2038 | | | | 5,339 | |
| | 685,000 | | | FL Capital Trust Agency (American Opportunity)2 | | | 8.250 | | | | 06/01/2038 | | | | 5,706 | |
| | 7,000,000 | | | FL Capital Trust Agency (Atlantic Hsg. Foundation)2 | | | 7.000 | | | | 07/15/2032 | | | | 3,149,580 | |
| | 13,000,000 | | | FL Capital Trust Agency (Atlantic Hsg. Foundation)2 | | | 8.260 | | | | 07/15/2038 | | | | 5,849,220 | |
| | 1,750,000 | | | FL Capital Trust Agency (Miami Community Charter School) | | | 7.000 | | | | 10/15/2040 | | | | 1,795,798 | |
| | 2,290,000 | | | FL Gateway Services Community Devel. District (Sun City Center)1 | | | 6.500 | | | | 05/01/2033 | | | | 2,309,236 | |
| | 1,480,000 | | | FL Gateway Services District (Water & Sewer)1 | | | 6.000 | | | | 10/01/2019 | | | | 1,511,776 | |
| | 1,400,000 | | | FL HEFFA (University of Tampa)1 | | | 5.250 | | | | 04/01/2042 | | | | 1,526,770 | |
| | 30,000 | | | FL HFA (Hsg. Partners of Panama City)1 | | | 5.700 | | | | 05/01/2037 | | | | 30,007 | |
| | 115,000 | | | FL HFA (Reserve at Kanapaha)1 | | | 5.700 | | | | 07/01/2037 | | | | 115,018 | |
| | 20,000 | | | FL HFA (Spinnaker Cove Apartments)1 | | | 6.500 | | | | 07/01/2036 | | | | 20,150 | |
| | 1,345,000 | | | FL HFA (St. Cloud Village Associates) | | | 8.000 | | | | 02/15/2030 | | | | 1,186,909 | |
| | 95,000 | | | FL HFA (Stoddert Arms Apartments)1 | | | 6.250 | | | | 09/01/2026 | | | | 95,080 | |
| | 100,000 | | | FL HFC (Ashton Point Apartments)1 | | | 5.750 | | | | 07/01/2036 | | | | 100,127 | |
| | 75,000 | | | FL HFC (Brittany of Rosemont)1 | | | 6.250 | | | | 07/01/2035 | | | | 75,044 | |
| | 20,000 | | | FL HFC (East Lake Apartments)1 | | | 5.050 | | | | 10/01/2026 | | | | 20,006 | |
| | 45,000 | | | FL HFC (Grande Pointe Apartments)1 | | | 6.000 | | | | 07/01/2038 | | | | 45,063 | |
| | 10,000 | | | FL HFC (River Trace Senior Apartments)1 | | | 5.800 | | | | 01/01/2041 | | | | 10,012 | |
| | 10,000 | | | FL HFC (Sanctuary Winterlakes)1 | | | 5.850 | | | | 09/01/2026 | | | | 10,041 | |
| | 10,000 | | | FL HFC (Sundance Pointe Associates)1 | | | 5.850 | | | | 02/01/2037 | | | | 10,013 | |
| | | | |
| 35 | | | | OPPENHEIMER ROCHESTER NATIONAL MUNICIPALS |
STATEMENT OF INVESTMENTS Continued
| | | | | | | | | | | | | | | | |
Principal
Amount | | | | | Coupon | | | Maturity | | | Value | |
| | Florida Continued | | | | | | | | | | | | |
| | $ 4,875,000 | | | FL HFC (Westchase Apartments) | | | 6.610 | % | | | 07/01/2038 | | | $ | 3,559,238 | |
| | 8,170,000 | | | FL Island at Doral III Community Devel. District Special Assessment1 | | | 5.900 | | | | 05/01/2035 | | | | 8,194,102 | |
| | 3,400,000 | | | FL Lake Ashton II Community Devel. District4 | | | 5.375 | | | | 05/01/2036 | | | | 2,615,586 | |
| | 1,500,000 | | | FL Parker Road Community Devel. District2 | | | 5.350 | | | | 05/01/2015 | | | | 729,015 | |
| | 1,415,000 | | | FL Parker Road Community Devel. District4 | | | 5.600 | | | | 05/01/2038 | | | | 682,794 | |
| | 1,480,000 | | | Flora Ridge, FL Educational Facilities Benefit District1 | | | 5.300 | | | | 05/01/2037 | | | | 1,312,420 | |
| | 1,475,000 | | | Forest Creek, FL Community Devel. District1 | | | 5.450 | | | | 05/01/2036 | | | | 1,486,830 | |
| | 4,033,132 | | | Forest Creek, FL Community Devel. District4,10 | | | 5.450 | | | | 05/01/2036 | | | | 2,680,339 | |
| | 60,000 | | | Forest Creek, FL Community Devel. District4,10 | | | 7.000 | | | | 11/01/2013 | | | | 59,283 | |
| | 8,135,000 | | | Glades, FL Correctional Devel. Corp. (Glades County Detention)1 | | | 7.375 | | | | 03/01/2030 | | | | 8,377,098 | |
| | 11,500,000 | | | Greater Lakes/Sawgrass Bay, FL Community Devel. District2 | | | 5.500 | | | | 05/01/2038 | | | | 4,963,170 | |
| | 5,570,000 | | | Hammocks, FL Community Devel. District Special Assessment1 | | | 5.500 | | | | 05/01/2037 | | | | 5,066,249 | |
| | 3,400,000 | | | Harrison Ranch, FL Community Devel. District1 | | | 5.300 | | | | 05/01/2038 | | | | 3,343,424 | |
| | 10,770,000 | | | Heritage Bay, FL Community Devel. District1 | | | 5.500 | | | | 05/01/2036 | | | | 10,881,254 | |
| | 17,080,000 | | | Heritage Harbour North, FL Community Devel. District1 | | | 6.375 | | | | 05/01/2038 | | | | 16,300,640 | |
| | 1,910,000 | | | Heritage Plantation, FL Community Devel. District2 | | | 5.100 | | | | 11/01/2013 | | | | 765,643 | |
| | 3,480,000 | | | Heritage Plantation, FL Community Devel. District4 | | | 5.400 | | | | 05/01/2037 | | | | 1,395,967 | |
| | 930,000 | | | Highland Meadows, FL Community Devel. District Special Assessment, Series A2 | | | 5.500 | | | | 05/01/2036 | | | | 377,245 | |
| | 13,500,000 | | | Highlands County, FL Health Facilities Authority (ABH/AGH/AHSGA Obligated Group)5 | | | 5.125 | | | | 11/15/2032 | | | | 14,446,485 | |
| | 10,000,000 | | | Highlands County, FL Health Facilities Authority (ABH/AGH/AHSGA Obligated Group)5 | | | 5.250 | | | | 11/15/2036 | | | | 10,701,100 | |
| | 4,835,000 | | | Highlands, FL Community Devel. District2 | | | 5.550 | | | | 05/01/2036 | | | | 3,017,233 | |
| | 6,020,000 | | | Hillsborough County, FL IDA (H. Lee Moffitt Cancer Center)1 | | | 5.000 | | | | 07/01/2031 | | | | 6,314,860 | |
| | 2,000,000 | | | Hillsborough County, FL IDA (National Gypsum Company) | | | 7.125 | | | | 04/01/2030 | | | | 2,001,460 | |
| | 7,535,000 | | | Hillsborough County, FL IDA (Senior Care Group)1 | | | 6.700 | | | | 07/01/2021 | | | | 7,544,117 | |
| | 6,035,000 | | | Hillsborough County, FL IDA (Senior Care Group)1 | | | 6.750 | | | | 07/01/2029 | | | | 6,039,647 | |
| | 10,930,000 | | | Indigo, FL Community Devel. District4 | | | 5.750 | | | | 05/01/2036 | | | | 5,580,749 | |
| | 3,470,000 | | | Jacksonville, FL Health Facilities Authority (Mental Health Center of Jacksonville)1 | | | 7.000 | | | | 10/01/2029 | | | | 3,470,035 | |
| | | | |
| 36 | | | | OPPENHEIMER ROCHESTER NATIONAL MUNICIPALS |
| | | | | | | | | | | | | | | | |
Principal
Amount | | | | | Coupon | | | Maturity | | | Value | |
| | Florida Continued | | | | | | | | | | | | |
| | $ 1,095,000 | | | Keys Cove, FL Community Devel. District1 | | | 5.875 | % | | | 05/01/2035 | | | $ | 1,150,976 | |
| | 17,000,000 | | | Lakeland, FL Energy System5 | | | 5.250 | | | | 10/01/2036 | | | | 22,004,630 | |
| | 2,000,000 | | | Lakeside Landings, FL Devel. District2 | | | 5.250 | | | | 05/01/2013 | | | | 821,240 | |
| | 750,000 | | | Lakeside Landings, FL Devel. District2 | | | 5.500 | | | | 05/01/2038 | | | | 308,190 | |
| | 8,770,000 | | | Lakewood Ranch, FL Stewardship District1 | | | 5.500 | | | | 05/01/2036 | | | | 7,000,389 | |
| | 16,590,000 | | | Lakewood Ranch, FL Stewardship District (Country Club East Investors)1 | | | 5.400 | | | | 05/01/2037 | | | | 14,518,904 | |
| | 1,100,000 | | | Legends Bay, FL Community Devel. District | | | 5.500 | | | | 05/01/2014 | | | | 953,370 | |
| | 4,145,000 | | | Legends Bay, FL Community Devel. District | | | 5.875 | | | | 05/01/2038 | | | | 2,967,115 | |
| | 100,000 | | | Leon County, FL Educational Facilities Authority (Southgate Residence Hall) | | | 6.750 | | | | 09/01/2028 | | | | 96,593 | |
| | 1,275,000 | | | Liberty County, FL Revenue (Twin Oaks) | | | 8.250 | | | | 07/01/2028 | | | | 1,293,641 | |
| | 1,255,000 | | | Madison County, FL Mtg. (Twin Oaks) | | | 6.000 | | | | 07/01/2025 | | | | 1,224,353 | |
| | 5,000,000 | | | Magnolia Creek, FL Community Devel. District2 | | | 5.600 | | | | 05/01/2014 | | | | 2,001,400 | |
| | 5,360,000 | | | Magnolia Creek, FL Community Devel. District2 | | | 5.900 | | | | 05/01/2039 | | | | 2,146,680 | |
| | 2,805,000 | | | Magnolia West, FL Community Devel. District Special Assessment4 | | | 5.350 | | | | 05/01/2037 | | | | 1,547,098 | |
| | 2,900,000 | | | Main Street, FL Community Devel. District | | | 6.800 | | | | 05/01/2038 | | | | 2,819,380 | |
| | 14,965,000 | | | Martin County, FL IDA (Indiantown Cogeneration)1 | | | 7.875 | | | | 12/15/2025 | | | | 15,024,860 | |
| | 1,235,000 | | | Martin County, FL IDA (Indiantown Cogeneration)1 | | | 8.050 | | | | 12/15/2025 | | | | 1,239,940 | |
| | 15,000,000 | | | Miami-Dade County, FL Aviation (Miami International Airport)5 | | | 5.000 | | | | 10/01/2040 | | | | 15,832,800 | |
| | 2,700,000 | | | Miami-Dade County, FL Aviation (Miami International Airport)1 | | | 5.375 | | | | 10/01/2035 | | | | 3,086,667 | |
| | 16,975,000 | | | Miami-Dade County, FL Building Better Communities1 | | | 5.000 | | | | 07/01/2041 | | | | 19,069,376 | |
| | 10,000,000 | | | Miami-Dade County, FL School Board COP5 | | | 5.000 | | | | 02/01/2027 | | | | 11,157,500 | |
| | 10,000,000 | | | Miami-Dade County, FL School Board COP5 | | | 5.250 | | | | 02/01/2027 | | | | 11,304,000 | |
| | 50,000,000 | | | Miami-Dade County, FL School Board COP5 | | | 5.375 | | | | 02/01/2034 | | | | 55,823,500 | |
| | 18,190,000 | | | Miromar Lakes, FL Community Devel. District1 | | | 6.875 | | | | 05/01/2035 | | | | 17,678,861 | |
| | 9,135,000 | | | Miromar Lakes, FL Community Devel. District1 | | | 7.375 | | | | 05/01/2032 | | | | 9,150,255 | |
| | 12,970,000 | | | Montecito, FL Community Devel. District2 | | | 5.100 | | | | 05/01/2013 | | | | 5,398,373 | |
| | 5,525,000 | | | Montecito, FL Community Devel. District2 | | | 5.500 | | | | 05/01/2037 | | | | 2,301,384 | |
| | 635,000 | | | Moody River, FL Estates Community Devel. District1 | | | 5.350 | | | | 05/01/2036 | | | | 438,480 | |
| | 15,480,000 | | | Myrtle Creek, FL Improvement District Special Assessment1 | | | 5.200 | | | | 05/01/2037 | | | | 14,003,053 | |
| | 10,820,000 | | | Nassau County, FL (Nassau Care Centers) | | | 6.900 | | | | 01/01/2038 | | | | 10,913,701 | |
| | 5,305,000 | | | Naturewalk, FL Community Devel. District4 | | | 5.300 | | | | 05/01/2016 | | | | 2,659,821 | |
| | | | |
| 37 | | | | OPPENHEIMER ROCHESTER NATIONAL MUNICIPALS |
STATEMENT OF INVESTMENTS Continued
| | | | | | | | | | | | | | | | |
Principal
Amount | | | | | Coupon | | | Maturity | | | Value | |
| | Florida Continued | | | | | | | | | | | | |
| | $ 6,320,000 | | | Naturewalk, FL Community Devel. District4 | | | 5.500 | % | | | 05/01/2038 | | | $ | 3,170,491 | |
| | 13,100,000 | | | North Springs, FL Improvement District (Parkland Golf-Country Club) | | | 5.450 | | | | 05/01/2026 | | | | 12,740,798 | |
| | 3,775,000 | | | Oak Creek, FL Community Devel. District Special Assessment1 | | | 5.800 | | | | 05/01/2035 | | | | 3,569,791 | |
| | 2,750,000 | | | Oakmont Grove, FL Community Devel. District Special Assessment2 | | | 5.250 | | | | 05/01/2012 | | | | 962,830 | |
| | 4,595,000 | | | Oakmont Grove, FL Community Devel. District Special Assessment2 | | | 5.400 | | | | 05/01/2038 | | | | 1,609,904 | |
| | 2,790,000 | | | Old Palm, FL Community Devel. District (Palm Beach Gardens)1 | | | 5.375 | | | | 05/01/2014 | | | | 2,796,445 | |
| | 1,425,000 | | | Orange County, FL Health Facilities Authority (GF Orlando/CFGH Obligated Group)1 | | | 8.875 | | | | 07/01/2021 | | | | 1,442,214 | |
| | 2,850,000 | | | Orange County, FL Health Facilities Authority (GF Orlando/CFGH Obligated Group)1 | | | 9.000 | | | | 07/01/2031 | | | | 2,884,086 | |
| | 750,000 | | | Orange County, FL Health Facilities Authority (Orlando Lutheran Tower)1 | | | 5.500 | | | | 07/01/2032 | | | | 760,590 | |
| | 5,000 | | | Orange County, FL HFA (Park Avenue Villas)1 | | | 5.250 | | | | 09/01/2031 | | | | 5,005 | |
| | 3,750,000 | | | Palm Bay, FL Educational Facilities (Patriot Charter School)2 | | | 7.000 | | | | 07/01/2036 | | | | 1,012,463 | |
| | 13,000,000 | | | Palm Beach County, FL Health Facilities Authority (Bethesda Healthcare System)1 | | | 5.250 | | | | 07/01/2040 | | | | 14,282,580 | |
| | 55,000 | | | Palm Beach County, FL HFA (Golden Lake Hsg. Assoc.)1 | | | 6.100 | | | | 08/01/2029 | | | | 55,098 | |
| | 13,340,000 | | | Palm Coast Park, FL Community Devel. District Special Assessment | | | 5.700 | | | | 05/01/2037 | | | | 9,107,218 | |
| | 2,600,000 | | | Palm Glades, FL Community Devel. District1 | | | 5.300 | | | | 05/01/2036 | | | | 2,281,630 | |
| | 6,360,000 | | | Palm Glades, FL Community Devel. District Special Assessment1 | | | 7.125 | | | | 05/01/2039 | | | | 6,115,776 | |
| | 1,850,000 | | | Palm River, FL Community Devel. District2 | | | 5.150 | | | | 05/01/2013 | | | | 737,077 | |
| | 1,565,000 | | | Palm River, FL Community Devel. District2 | | | 5.375 | | | | 05/01/2036 | | | | 624,012 | |
| | 1,505,000 | | | Panther Trails, FL Community Devel. District1 | | | 5.600 | | | | 05/01/2036 | | | | 1,520,878 | |
| | 1,495,000 | | | Parkway Center, FL Community Devel. District, Series A1 | | | 6.300 | | | | 05/01/2034 | | | | 1,324,181 | |
| | 6,130,000 | | | Pine Ridge Plantation, FL Community Devel. District2 | | | 5.400 | | | | 05/01/2037 | | | | 4,153,688 | |
| | 2,250,000 | | | Pinellas County, FL Educational Facilities Authority (Pinellas Prep Academy)1 | | | 7.125 | | | | 09/15/2041 | | | | 2,450,858 | |
| | 4,615,000 | | | Pinellas County, FL Health Facility Authority (St. Mark Village)1 | | | 5.650 | | | | 05/01/2037 | | | | 4,373,543 | |
| | 30,000 | | | Pinellas County, FL HFA (Single Family Hsg.)1 | | | 5.200 | | | | 03/01/2037 | | | | 30,546 | |
| | 1,805,000 | | | Poinciana West, FL Community Devel. District Special Assessment1 | | | 6.000 | | | | 05/01/2037 | | | | 1,809,440 | |
| | | | |
| 38 | | | | OPPENHEIMER ROCHESTER NATIONAL MUNICIPALS |
| | | | | | | | | | | | | | | | |
Principal
Amount | | | | | Coupon | | | Maturity | | | Value | |
| | Florida Continued | | | | | | | | | | | | |
| | $ 1,500,000 | | | Port St. Lucie, FL Special Assessment (Peacock & Lowry)1 | | | 5.350 | % | | | 07/01/2027 | | | $ | 1,399,095 | |
| | 10,200,000 | | | Portico, FL Community Devel. District | | | 5.450 | | | | 05/01/2037 | | | | 5,638,050 | |
| | 3,005,000 | | | Portofino Cove, FL Community Devel. District Special Assessment2 | | | 5.500 | | | | 05/01/2038 | | | | 1,192,444 | |
| | 5,905,000 | | | Portofino Isles, FL Community Devel. District (Portofino Court)2 | | | 5.600 | | | | 05/01/2036 | | | | 1,747,762 | |
| | 1,000,000 | | | Portofino Landings, FL Community Devel. District Special Assessment2 | | | 5.200 | | | | 05/01/2017 | | | | 396,660 | |
| | 1,955,000 | | | Portofino Landings, FL Community Devel. District Special Assessment2 | | | 5.400 | | | | 05/01/2038 | | | | 775,783 | |
| | 2,470,000 | | | Portofino Vista, FL Community Devel. District2 | | | 5.000 | | | | 05/01/2013 | | | | 979,404 | |
| | 2,870,000 | | | Quarry, FL Community Devel. District1 | | | 5.500 | | | | 05/01/2036 | | | | 2,611,729 | |
| | 455,000 | | | Renaissance Commons, FL Community Devel. District, Series A1 | | | 5.600 | | | | 05/01/2036 | | | | 422,313 | |
| | 7,200,000 | | | Reunion East, FL Community Devel. District2 | | | 5.800 | | | | 05/01/2036 | | | | 3,243,168 | |
| | 6,930,000 | | | Reunion East, FL Community Devel. District1 | | | 7.375 | | | | 05/01/2033 | | | | 7,069,917 | |
| | 3,070,000 | | | Reunion East, FL Community Devel. District4 | | | 7.375 | | | | 05/01/2033 | | | | 1,508,138 | |
| | 6,415,000 | | | Ridgewood Trails, FL Community Devel. District2 | | | 5.650 | | | | 05/01/2038 | | | | 3,444,919 | |
| | 9,195,000 | | | River Bend, FL Community Devel. District2 | | | 5.450 | | | | 05/01/2035 | | | | 4,072,098 | |
| | 5,795,000 | | | River Bend, FL Community Devel. District2 | | | 7.125 | | | | 11/01/2015 | | | | 1,332,966 | |
| | 7,890,000 | | | River Glen, FL Community Devel. District Special Assessment2 | | | 5.450 | | | | 05/01/2038 | | | | 3,226,931 | |
| | 2,755,000 | | | Rolling Hills, FL Community Devel. District4 | | | 5.125 | | | | 11/01/2013 | | | | 1,033,235 | |
| | 8,210,000 | | | Rolling Hills, FL Community Devel. District4 | | | 5.450 | | | | 05/01/2037 | | | | 3,079,078 | |
| | 200,000 | | | Santa Rosa Bay, FL Bridge Authority | | | 6.250 | | | | 07/01/2028 | | | | 109,836 | |
| | 1,895,000 | | | Sarasota County, FL Educational Facilities (School of Arts & Sciences)1 | | | 6.500 | | | | 07/01/2040 | | | | 2,005,232 | |
| | 4,410,000 | | | Seminole County, FL IDA (Progressive Health)1 | | | 7.500 | | | | 03/01/2035 | | | | 4,371,721 | |
| | 775,000 | | | Six Mile Creek, FL Community Devel. District4 | | | 5.500 | | | | 05/01/2017 | | | | 201,632 | |
| | 8,625,000 | | | Six Mile Creek, FL Community Devel. District2 | | | 5.875 | | | | 05/01/2038 | | | | 2,244,311 | |
| | 6,900,000 | | | South Bay, FL Community Devel. District2 | | | 5.125 | | | | 11/01/2009 | | | | 2,212,968 | |
| | 14,510,000 | | | South Bay, FL Community Devel. District2 | | | 5.375 | | | | 05/01/2013 | | | | 3,166,372 | |
| | 16,775,000 | | | South Bay, FL Community Devel. District2 | | | 5.950 | | | | 05/01/2036 | | | | 5,383,098 | |
| | 10,785,000 | | | South Fork East, FL Community Devel. District | | | 5.350 | | | | 05/01/2036 | | | | 9,305,082 | |
| | 3,615,000 | | | South Fork East, FL Community Devel. District2 | | | 6.500 | | | | 05/01/2038 | | | | 1,521,554 | |
| | 2,075,000 | | | South Fork East, FL Community Devel. District4 | | | 7.000 | | | | 11/01/2015 | | | | 1,704,571 | |
| | 3,800,000 | | | St. John’s Forest, FL Community Devel. District, Series A1 | | | 6.125 | | | | 05/01/2034 | | | | 3,812,958 | |
| | 3,100,000 | | | St. Johns County, FL IDA (Glenmoor Health Care) | | | 5.375 | | | | 01/01/2040 | | | | 2,769,137 | |
| | | | |
| 39 | | | | OPPENHEIMER ROCHESTER NATIONAL MUNICIPALS |
STATEMENT OF INVESTMENTS Continued
| | | | | | | | | | | | | | | | |
Principal
Amount | | | | | Coupon | | | Maturity | | | Value | |
| | Florida Continued | | | | | | | | | | | | |
| | $ 3,500,000 | | | St. Johns County, FL IDA (Presbyterian Retirement)1 | | | 5.875 | % | | | 08/01/2040 | | | $ | 3,853,675 | |
| | 3,500,000 | | | St. Johns County, FL IDA (Presbyterian Retirement)1 | | | 6.000 | | | | 08/01/2045 | | | | 3,902,955 | |
| | 1,000,000 | | | St. Johns County, FL IDA (St. John’s County Welfare Federation)1 | | | 5.250 | | | | 10/01/2041 | | | | 843,070 | |
| | 5,800,000 | | | Sweetwater Creek, FL Community Devel. District2 | | | 5.500 | | | | 05/01/2038 | | | | 2,363,790 | |
| | 1,000,000 | | | Tavares, FL First Mtg. (Osprey Lodge Lakeview) | | | 8.375 | | | | 07/01/2036 | | | | 1,060,170 | |
| | 1,360,000 | | | Tavares, FL First Mtg. (Osprey Lodge Lakeview) | | | 8.750 | | | | 07/01/2046 | | | | 1,445,095 | |
| | 16,765,000 | | | Tern Bay, FL Community Devel. District2 | | | 5.000 | | | | 05/01/2015 | | | | 4,160,570 | |
| | 19,075,000 | | | Tern Bay, FL Community Devel. District2 | | | 5.375 | | | | 05/01/2037 | | | | 4,735,178 | |
| | 2,740,000 | | | Town Center, FL at Palm Coast Community Devel. District1 | | | 6.000 | | | | 05/01/2036 | | | | 2,104,183 | |
| | 4,950,000 | | | Treeline, FL Preservation Community Devel. District4 | | | 6.800 | | | | 05/01/2039 | | | | 2,442,627 | |
| | 685,000 | | | Turnbull Creek, FL Community Devel. District Special Assessment | | | 5.250 | | | | 05/01/2037 | | | | 501,742 | |
| | 1,320,000 | | | Two Creeks, FL Community Devel. District | | | 5.250 | | | | 05/01/2037 | | | | 977,275 | |
| | 10,045,000 | | | Verandah East, FL Community Devel. District1 | | | 5.400 | | | | 05/01/2037 | | | | 5,992,747 | |
| | 7,405,000 | | | Verano Center, FL Community Devel. District1 | | | 5.375 | | | | 05/01/2037 | | | | 4,806,215 | |
| | 2,400,000 | | | Villa Portofino East, FL Community Devel. District | | | 5.200 | | | | 05/01/2037 | | | | 2,095,344 | |
| | 1,265,000 | | | Villa Vizcaya, FL Community Devel. District Special Assessment2 | | | 5.550 | | | | 05/01/2039 | | | | 638,926 | |
| | 1,955,000 | | | Villages of Westport, FL Community Devel. District4 | | | 5.400 | | | | 05/01/2020 | | | | 1,417,688 | |
| | 8,340,000 | | | Villages of Westport, FL Community Devel. District4 | | | 5.700 | | | | 05/01/2035 | | | | 5,015,843 | |
| | 2,645,000 | | | Villagewalk of Bonita Springs, FL Community Devel. District1 | | | 5.150 | | | | 05/01/2038 | | | | 2,268,643 | |
| | 4,395,000 | | | Waterford Estates, FL Community Devel. District Special Assessment2 | | | 5.125 | | | | 05/01/2013 | | | | 1,311,116 | |
| | 3,350,000 | | | Waterford Estates, FL Community Devel. District Special Assessment2 | | | 5.500 | | | | 05/01/2037 | | | | 999,942 | |
| | 3,600,000 | | | Watergrass, FL Community Devel. District Special Assessment1 | | | 5.125 | | | | 11/01/2014 | | | | 2,684,880 | |
| | 2,270,000 | | | Watergrass, FL Community Devel. District Special Assessment1 | | | 5.375 | | | | 05/01/2039 | | | | 1,191,523 | |
| | 3,190,000 | | | Waterlefe, FL Community Devel. District Golf Course2 | | | 8.125 | | | | 10/01/2025 | | | | 238,772 | |
| | 9,995,000 | | | Waters Edge, FL Community Devel. District | | | 0.000 | 7 | | | 05/01/2039 | | | | 4,698,450 | |
| | 1,570,000 | | | Waters Edge, FL Community Devel. District2 | | | 5.350 | | | | 05/01/2039 | | | | 392,610 | |
| | 143,000 | | | Waters Edge, FL Community Devel. District1 | | | 5.350 | | | | 05/01/2039 | | | | 143,855 | |
| | 14,800,000 | | | Waterstone, FL Community Devel. District2 | | | 5.500 | | | | 05/01/2018 | | | | 5,934,652 | |
| | | | |
| 40 | | | | OPPENHEIMER ROCHESTER NATIONAL MUNICIPALS |
| | | | | | | | | | | | | | | | |
Principal
Amount | | | | | Coupon | | | Maturity | | | Value | |
| | Florida Continued | | | | | | | | | | | | |
| | $ 2,300,000 | | | West Villages, FL Improvement District2 | | | 5.350 | % | | | 05/01/2015 | | | $ | 1,776,750 | |
| | 15,005,000 | | | West Villages, FL Improvement District2 | | | 5.500 | | | | 05/01/2037 | | | | 6,711,286 | |
| | 20,600,000 | | | West Villages, FL Improvement District4 | | | 5.500 | | | | 05/01/2038 | | | | 9,634,620 | |
| | 18,550,000 | | | West Villages, FL Improvement District2 | | | 5.800 | | | | 05/01/2036 | | | | 8,912,719 | |
| | 14,925,000 | | | Westridge, FL Community Devel. District2 | | | 5.800 | | | | 05/01/2037 | | | | 5,684,783 | |
| | 11,210,000 | | | Westside, FL Community Devel. District4 | | | 5.650 | | | | 05/01/2037 | | | | 4,823,999 | |
| | 17,340,000 | | | Westside, FL Community Devel. District4 | | | 7.200 | | | | 05/01/2038 | | | | 7,390,308 | |
| | 7,420,000 | | | Wyld Palms, FL Community Devel. District2 | | | 5.400 | | | | 05/01/2015 | | | | 2,300,794 | |
| | 4,340,000 | | | Wyld Palms, FL Community Devel. District2 | | | 5.500 | | | | 05/01/2038 | | | | 1,346,268 | |
| | 3,830,000 | | | Zephyr Ridge, FL Community Devel. District2 | | | 5.250 | | | | 05/01/2013 | | | | 1,524,800 | |
| | 2,665,000 | | | Zephyr Ridge, FL Community Devel. District2 | | | 5.625 | | | | 05/01/2037 | | | | 1,061,763 | |
| | | | | | | | | | | | | | | | 841,246,960 | |
| | Georgia—1.3% | | | | | | | | | | | | |
| | 60,000 | | | Acworth, GA Hsg. Authority (Wingate Falls Apartments)1 | | | 6.200 | | | | 03/01/2027 | | | | 60,118 | |
| | 25,000 | | | Acworth, GA Hsg. Authority (Wingate Falls Apartments)1 | | | 6.200 | | | | 03/01/2029 | | | | 25,044 | |
| | 30,000 | | | Americus-Sumter County, GA Hospital Authority (South Georgia Methodist Home for the Aging)1 | | | 6.250 | | | | 05/15/2016 | | | | 30,046 | |
| | 1,770,000 | | | Atlanta, GA Devel. Authority Student Hsg. (Clark Atlanta University) | | | 6.250 | | | | 07/01/2014 | | | | 1,309,818 | |
| | 3,000,000 | | | Atlanta, GA Devel. Authority Student Hsg. (Clark Atlanta University) | | | 6.250 | | | | 07/01/2036 | | | | 1,799,910 | |
| | 4,400,000 | | | Atlanta, GA Tax Allocation (Beltline) | | | 7.500 | | | | 01/01/2031 | | | | 5,200,976 | |
| | 770,000 | | | Atlanta, GA Tax Allocation (Beltline) | | | 7.500 | | | | 01/01/2031 | | | | 857,541 | |
| | 140,000 | | | Atlanta, GA Urban Residential Finance Authority (Spring Branch Apartments)2 | | | 4.250 | | | | 04/01/2026 | | | | 43,382 | |
| | 210,000 | | | Charlton County, GA Solid Waste Management Authority (Chesser Island Road Landfill)1 | | | 7.375 | | | | 04/01/2018 | | | | 210,147 | |
| | 15,000 | | | Cherokee County, GA Hospital Authority (RT Jones Memorial Hospital)1 | | | 7.300 | | | | 12/01/2013 | | | | 15,721 | |
| | 50,000 | | | Crisp County, GA Devel. Authority (International Paper Company)1 | | | 6.200 | | | | 02/01/2020 | | | | 50,427 | |
| | 430,000 | | | East Point, GA (Camp Creek), Series B1 | | | 8.000 | | | | 02/01/2026 | | | | 430,679 | |
| | 31,945,000 | | | Fulton County, GA Devel. Authority (Piedmont Healthcare)5 | | | 5.000 | | | | 06/15/2029 | | | | 35,289,630 | |
| | 13,730,000 | | | Fulton County, GA Devel. Authority (Piedmont Healthcare/Piedmont Hospital/Piedmont Hospital Foundation Obligated Group)5 | | | 5.250 | | | | 06/15/2037 | | | | 15,075,952 | |
| | 6,000,000 | | | Fulton County, GA Residential Care Facilities (Lenbrook Square Foundation)1 | | | 5.000 | | | | 07/01/2027 | | | | 5,937,600 | |
| | | | |
| 41 | | | | OPPENHEIMER ROCHESTER NATIONAL MUNICIPALS |
STATEMENT OF INVESTMENTS Continued
| | | | | | | | | | | | | | | | |
Principal
Amount | | | | | Coupon | | | Maturity | | | Value | |
| | Georgia Continued | | | | | | | | | | | | |
| | $ 2,770,000 | | | Fulton County, GA Residential Care Facilities (Lenbrook Square Foundation)1 | | | 5.000 | % | | | 07/01/2029 | | | $ | 2,704,988 | |
| | 1,000,000 | | | Fulton County, GA Residential Care Facilities (Lenbrook Square Foundation)1 | | | 5.125 | | | | 07/01/2042 | | | | 950,560 | |
| | 24,150,000 | | | Irwin County, GA COP2 | | | 8.000 | | | | 08/01/2037 | | | | 9,921,786 | |
| | 2,000,000 | | | Marietta, GA Devel. Authority (University Facilities)1 | | | 7.000 | | | | 06/15/2039 | | | | 2,095,560 | |
| | 430,000 | | | Savannah, GA EDA (Skidway Health & Living Services) | | | 6.850 | | | | 01/01/2019 | | | | 444,495 | |
| | 1,055,000 | | | Savannah, GA EDA (Skidway Health & Living Services) | | | 7.400 | | | | 01/01/2024 | | | | 1,089,593 | |
| | 2,985,000 | | | Savannah, GA EDA (Skidway Health & Living Services) | | | 7.400 | | | | 01/01/2034 | | | | 3,055,834 | |
| | | | | | | | | | | | | | | | 86,599,807 | |
| | Hawaii—0.1% | | | | | | | | | | | | |
| | 400,000 | | | HI Dept. of Transportation (Continental Airlines)1 | | | 5.625 | | | | 11/15/2027 | | | | 397,612 | |
| | 5,915,000 | | | HI Dept. of Transportation (Continental Airlines) | | | 7.000 | | | | 06/01/2020 | | | | 5,916,538 | |
| | 3,000,000 | | | Kuakini, HI Health System (KMC/KHS/KGC/KSS Obligated Group)1 | | | 6.300 | | | | 07/01/2022 | | | | 3,002,760 | |
| | | | | | | | | | | | | | | | 9,316,910 | |
| | Idaho—0.0% | | | | | | | | | | | | |
| | 5,000 | | | ID Hsg. & Finance Assoc. (Single Family Mtg.)1 | | | 5.350 | | | | 01/01/2025 | | | | 5,156 | |
| | 1,900,000 | | | Nampa, ID Local Improvement District No. 148 | | | 6.625 | | | | 09/01/2030 | | | | 1,939,425 | |
| | | | | | | | | | | | | | | | 1,944,581 | |
| | Illinois—7.2% | | | | | | | | | | | | |
| | 1,300,000 | | | Annawan, IL Tax Increment (Patriot Renewable Fuels) | | | 5.625 | | | | 01/01/2018 | | | | 1,193,075 | |
| | 4,000,000 | | | Bolingbrook, IL Will and Du Page Counties Wastewater Facilities (Crossroads Treatment)1 | | | 6.600 | | | | 01/01/2035 | | | | 3,791,920 | |
| | 30,685,000 | | | Caseyville, IL Tax (Forest Lakes)2 | | | 7.000 | | | | 12/30/2022 | | | | 18,649,729 | |
| | 5,000,000 | | | Chicago, IL Board of Education1 | | | 5.000 | | | | 12/01/2041 | | | | 5,515,450 | |
| | 10,000,000 | | | Chicago, IL Board of Education1 | | | 5.500 | | | | 12/01/2039 | | | | 11,680,000 | |
| | 32,500,000 | | | Chicago, IL GO5 | | | 5.250 | | | | 01/01/2033 | | | | 35,661,275 | |
| | 65,000 | | | Chicago, IL Midway Airport, Series B1 | | | 5.625 | | | | 01/01/2029 | | | | 65,098 | |
| | 35,000 | | | Chicago, IL Multifamily Hsg. (Cottage View Terrace)1 | | | 6.125 | | | | 02/20/2042 | | | | 35,113 | |
| | 8,000,000 | | | Chicago, IL Transit Authority Sales Tax Receipts1 | | | 5.250 | | | | 12/01/2040 | | | | 9,143,840 | |
| | 10,032,000 | | | Cortland, IL Special Tax (Sheaffer System)2 | | | 5.500 | | | | 03/01/2017 | | | | 6,576,678 | |
| | 915,000 | | | Country Club Hills, IL GO1 | | | 5.000 | | | | 12/01/2026 | | | | 963,898 | |
| | 965,000 | | | Country Club Hills, IL GO1 | | | 5.000 | | | | 12/01/2027 | | | | 1,012,777 | |
| | 1,010,000 | | | Country Club Hills, IL GO1 | | | 5.000 | | | | 12/01/2028 | | | | 1,058,419 | |
| | | | |
| 42 | | | | OPPENHEIMER ROCHESTER NATIONAL MUNICIPALS |
| | | | | | | | | | | | | | | | |
Principal
Amount | | | | | Coupon | | | Maturity | | | Value | |
| | Illinois Continued | | | | | | | | | | | | |
| | $ 1,060,000 | | | Country Club Hills, IL GO1 | | | 5.000 | % | | | 12/01/2029 | | | $ | 1,108,845 | |
| | 1,120,000 | | | Country Club Hills, IL GO1 | | | 5.000 | | | | 12/01/2030 | | | | 1,167,242 | |
| | 1,175,000 | | | Country Club Hills, IL GO1 | | | 5.000 | | | | 12/01/2031 | | | | 1,223,986 | |
| | 2,425,000 | | | Country Club Hills, IL GO1 | | | 5.000 | | | | 12/01/2032 | | | | 2,521,394 | |
| | 355,000 | | | Deerfield, IL (Chicagoland Conservative Jewish High School Foundation) | | | 6.000 | 3 | | | 10/01/2031 | | | | 75,665 | |
| | 677,000 | | | Deerfield, IL (Chicagoland Conservative Jewish High School Foundation) | | | 6.000 | | | | 10/01/2042 | | | | 557,584 | |
| | 1,000,000 | | | Du Page County, IL Special Service Area No. 31 Special Tax (Monarch Landing)1 | | | 5.625 | | | | 03/01/2036 | | | | 990,280 | |
| | 1,585,000 | | | Franklin Park, IL GO1 | | | 6.250 | | | | 07/01/2030 | | | | 1,931,259 | |
| | 3,750,000 | | | Gilberts, IL Special Service Area No. 19 Special Tax (Conservancy)2 | | | 5.375 | | | | 03/01/2016 | | | | 1,313,175 | |
| | 1,375,000 | | | Godfrey, IL (United Methodist Village)1 | | | 5.875 | | | | 11/15/2029 | | | | 737,935 | |
| | 6,165,000 | | | Harvey, IL GO | | | 5.500 | | | | 12/01/2027 | | | | 5,846,393 | |
| | 2,500,000 | | | Harvey, IL GO | | | 5.625 | | | | 12/01/2032 | | | | 2,354,150 | |
| | 13,123 | | | IL Devel. Finance Authority (Community Rehabilitation Providers)1 | | | 8.250 | | | | 08/01/2012 | | | | 10,271 | |
| | 11,135,000 | | | IL Educational Facilities Authority (Plum Creek Rolling Meadows)1 | | | 6.500 | | | | 12/01/2037 | | | | 11,211,052 | |
| | 41,175,000 | | | IL Finance Authority (Advocate Health Care)5 | | | 5.375 | | | | 04/01/2044 | | | | 45,432,001 | |
| | 11,000,000 | | | IL Finance Authority (Advocate Health Care)5 | | | 5.375 | | | | 04/01/2044 | | | | 12,137,260 | |
| | 685,000 | | | IL Finance Authority (Advocate Health Care)1 | | | 5.375 | | | | 04/01/2044 | | | | 755,822 | |
| | 20,000,000 | | | IL Finance Authority (Advocate Health Care)5 | | | 5.500 | | | | 04/01/2044 | | | | 22,264,799 | |
| | 3,195,000 | | | IL Finance Authority (Bethel Terrace Apartments)1 | | | 5.375 | | | | 09/01/2035 | | | | 3,171,868 | |
| | 145,000 | | | IL Finance Authority (Bridgeway/Bridgeway Foundation/Occupation Devel. Center Obligated Group) | | | 4.625 | | | | 07/01/2027 | | | | 98,641 | |
| | 5,000,000 | | | IL Finance Authority (Central Dupage Health System/Central Dupage Hospital Assoc.)5 | | | 5.375 | | | | 11/01/2039 | | | | 5,583,600 | |
| | 12,500,000 | | | IL Finance Authority (Central Dupage Health)5 | | | 5.500 | | | | 11/01/2039 | | | | 14,092,125 | |
| | 4,750,000 | | | IL Finance Authority (DeKalb Supportive Living)1 | | | 6.100 | | | | 12/01/2041 | | | | 4,592,395 | |
| | 2,250,000 | | | IL Finance Authority (Franciscan Communities)1 | | | 5.500 | | | | 05/15/2027 | | | | 2,283,818 | |
| | 2,750,000 | | | IL Finance Authority (Franciscan Communities)1 | | | 5.500 | | | | 05/15/2037 | | | | 2,754,345 | |
| | 2,000,000 | | | IL Finance Authority (Friendship Village Schaumburg)1 | | | 5.375 | | | | 02/15/2025 | | | | 2,021,660 | |
| | 2,000,000 | | | IL Finance Authority (Friendship Village Schaumburg)1 | | | 5.625 | | | | 02/15/2037 | | | | 2,010,260 | |
| | 30,000,000 | | | IL Finance Authority (Illinois River Energy) | | | 8.500 | | | | 07/01/2019 | | | | 21,915,900 | |
| | 1,000,000 | | | IL Finance Authority (Lake Forest College)1 | | | 6.000 | | | | 10/01/2048 | | | | 1,026,700 | |
| | 850,000 | | | IL Finance Authority (Luther Oaks) | | | 6.000 | | | | 08/15/2026 | | | | 874,778 | |
| | 1,500,000 | | | IL Finance Authority (Luther Oaks) | | | 6.000 | | | | 08/15/2039 | | | | 1,510,620 | |
| | | | |
| 43 | | | | OPPENHEIMER ROCHESTER NATIONAL MUNICIPALS |
STATEMENT OF INVESTMENTS Continued
| | | | | | | | | | | | | | | | |
Principal
Amount | | | | | Coupon | | | Maturity | | | Value | |
| | Illinois Continued | | | | | | | | | | | | |
| | $ 3,265,000 | | | IL Finance Authority (Lutheran Social Services of Illinois/Vesper Management Corp. Obligated Group)1 | | | 5.000 | % | | | 08/15/2024 | | | $ | 3,279,986 | |
| | 3,640,000 | | | IL Finance Authority (Lutheran Social Services of Illinois/Vesper Management Corp. Obligated Group)1 | | | 5.125 | | | | 08/15/2028 | | | | 3,644,441 | |
| | 1,250,000 | | | IL Finance Authority (Montgomery Place)1 | | | 5.500 | | | | 05/15/2026 | | | | 1,272,500 | |
| | 2,050,000 | | | IL Finance Authority (Montgomery Place)1 | | | 5.750 | | | | 05/15/2038 | | | | 2,071,136 | |
| | 6,350,000 | | | IL Finance Authority (OSF Healthcare System)1 | | | 5.750 | | | | 11/15/2033 | | | | 7,003,415 | |
| | 21,000,000 | | | IL Finance Authority (Provena Health)1 | | | 7.750 | | | | 08/15/2034 | | | | 27,063,330 | |
| | 1,090,000 | | | IL Finance Authority (RUMC/RCMC/CMH/RCF/TYW Obligated Group)1 | | | 7.250 | | | | 11/01/2030 | | | | 1,380,943 | |
| | 2,000,000 | | | IL Finance Authority (Sedgebrook)2,11 | | | 6.000 | | | | 11/15/2027 | | | | 20 | |
| | 9,000,000 | | | IL Finance Authority (Sedgebrook)2,11 | | | 6.000 | | | | 11/15/2037 | | | | 90 | |
| | 8,500,000 | | | IL Finance Authority (Sedgebrook)2,11 | | | 6.000 | | | | 11/15/2042 | | | | 85 | |
| | 11,970,000 | | | IL Finance Authority (St. Anthony Lassing) | | | 6.500 | | | | 12/01/2032 | | | | 12,103,226 | |
| | 1,500,000 | | | IL Finance Authority (The New Admiral at the Lake) | | | 8.000 | | | | 05/15/2040 | | | | 1,764,960 | |
| | 5,775,000 | | | IL Finance Authority (The New Admiral at the Lake) | | | 8.000 | | | | 05/15/2046 | | | | 6,795,096 | |
| | 2,850,000 | | | IL Finance Authority (Uno Charter School Network)1 | | | 7.125 | | | | 10/01/2041 | | | | 3,208,730 | |
| | 8,700,000 | | | IL Health Facilities Authority2 | | | 6.900 | | | | 11/15/2033 | | | | 3,566,130 | |
| | 40,000,000 | | | IL Metropolitan Pier & Exposition Authority (McCormick Place Exposition)5 | | | 5.500 | | | | 06/15/2050 | | | | 44,862,000 | |
| | 7,140,000 | | | Lake County, IL Special Service Area No. 82 | | | 7.125 | | | | 03/01/2037 | | | | 3,620,337 | |
| | 500,000 | | | Lombard, IL Public Facilities Corp. (Conference Center & Hotel) | | | 5.500 | | | | 01/01/2036 | | | | 333,810 | |
| | 13,635,000 | | | Lombard, IL Public Facilities Corp. (Conference Center & Hotel) | | | 7.125 | | | | 01/01/2036 | | | | 9,509,049 | |
| | 2,950,000 | | | Manhattan, IL Special Service Area Special Tax (Groebe Farm-Stonegate)2 | | | 5.750 | | | | 03/01/2022 | | | | 811,575 | |
| | 4,000,000 | | | Manhattan, IL Special Service Area Special Tax (Groebe Farm-Stonegate)2 | | | 6.125 | | | | 03/01/2040 | | | | 1,100,840 | |
| | 1,778,000 | | | Manhattan, IL Special Service Area Special Tax (Lakeside Towns Liberty)2 | | | 5.750 | | | | 03/01/2022 | | | | 578,063 | |
| | 245,000 | | | Peoria, IL Hsg. (Peoria Oak Woods Apartments)1 | | | 7.750 | | | | 10/15/2033 | | | | 245,020 | |
| | 3,500,000 | | | Plano, IL Special Service Area No. 5 | | | 6.000 | | | | 03/01/2036 | | | | 3,338,720 | |
| | 4,630,000 | | | Quad Cities, IL Regional EDA (Heritage Woods Moline)1 | | | 6.000 | | | | 12/01/2041 | | | | 4,356,645 | |
| | 5,975,000 | | | Quad Cities, IL Regional EDA (Pheasant Ridge Apartments) | | | 6.375 | | | | 08/01/2040 | | | | 3,907,112 | |
| | 162 | | | Robbins, IL Res Rec (Robbins Res Rec Partners)1 | | | 7.250 | | | | 10/15/2024 | | | | 161 | |
| | | | |
| 44 | | | | OPPENHEIMER ROCHESTER NATIONAL MUNICIPALS |
| | | | | | | | | | | | | | | | |
Principal
Amount | | | | | Coupon | | | Maturity | | | Value | |
| | Illinois Continued | | | | | | | | | | | | |
| | $ 2,500,000 | | | Southwestern IL Devel. Authority (Comprehensive Mental Health Center) | | | 6.625 | % | | | 06/01/2037 | | | $ | 2,621,700 | |
| | 1,500,000 | | | Southwestern IL Devel. Authority (Eden Retirement Center) | | | 5.850 | | | | 12/01/2036 | | | | 1,194,540 | |
| | 15,225,000 | �� | | Southwestern IL Devel. Authority (Local Government Programming)1 | | | 7.000 | | | | 10/01/2022 | | | | 15,834,609 | |
| | 6,115,000 | | | Southwestern IL Devel. Authority (Village of Sauget)1 | | | 5.625 | | | | 11/01/2026 | | | | 5,245,264 | |
| | 15,230,000 | | | Southwestern IL Devel. Authority Solid Waste Disposal (Center Ethanol Company) | | | 8.250 | | | | 12/01/2019 | | | | 11,431,333 | |
| | 12,795,000 | | | Upper, IL River Valley Devel. Authority (Deer Path Huntley) | | | 6.500 | | | | 12/01/2032 | | | | 12,937,408 | |
| | 8,170,000 | | | Upper, IL River Valley Devel. Authority (Living Springs McHenry)1 | | | 6.100 | | | | 12/01/2041 | | | | 7,846,468 | |
| | 3,025,000 | | | Vernon Hills, IL Tax Increment (Town Center)1 | | | 6.250 | | | | 12/30/2026 | | | | 2,985,282 | |
| | 3,110,000 | | | Volo Village, IL Special Service Area (Lancaster Falls)1 | | | 5.750 | | | | 03/01/2036 | | | | 2,872,520 | |
| | 5,500,000 | | | Volo Village, IL Special Service Area (Remington Pointe)1 | | | 6.450 | | | | 03/01/2034 | | | | 5,486,910 | |
| | 2,000,000 | | | Will-Kankakee, IL Regional Devel. Authority (Senior Estates Supportive Living)1 | | | 7.000 | | | | 12/01/2042 | | | | 2,072,680 | |
| | 5,035,000 | | | Yorkville, IL United City Special Services Area Special Tax (Bristol Bay)1 | | | 5.875 | | | | 03/01/2036 | | | | 5,062,038 | |
| | | | | | | | | | | | | | | | 490,331,267 | |
| | Indiana—1.8% | | | | | | | | | | | | |
| | 970,000 | | | Anderson, IN Multifamily Hsg. (Cross Lakes Apartments)1 | | | 8.000 | | | | 12/01/2045 | | | | 1,047,978 | |
| | 1,155,000 | | | Anderson, IN Multifamily Hsg. (Cross Lakes Apartments)1 | | | 9.000 | | | | 12/01/2045 | | | | 1,192,919 | |
| | 16,845,000 | | | Bluffton, IN Solid Waste Disposal Facility (Bluffton Subordinate Industrial Bio-Energy) | | | 7.500 | | | | 09/01/2019 | | | | 11,642,927 | |
| | 4,300,000 | | | Carmel, IN Redevel. District COP1 | | | 6.500 | | | | 07/15/2035 | | | | 4,581,521 | |
| | 14,700,000 | | | Carmel, IN Redevel. District COP1 | | | 7.750 | | | | 01/15/2030 | | | | 17,048,472 | |
| | 11,830,000 | | | Carmel, IN Redevel. District COP1 | | | 8.000 | | | | 01/15/2035 | | | | 13,736,878 | |
| | 1,475,000 | | | East Chicago, IN Solid Waste Disposal (USG Corp.) | | | 5.500 | | | | 09/01/2028 | | | | 1,360,879 | |
| | 5,805,000 | | | East Chicago, IN Solid Waste Disposal (USG Corp.) | | | 6.375 | | | | 08/01/2029 | | | | 5,804,710 | |
| | 25,000 | | | Fort Wayne, IN Pollution Control (General Motors Corp.)2 | | | 6.200 | | | | 10/15/2025 | | | | — | |
| | 600,000 | | | Hammond, IN Local Public Improvement District1 | | | 6.500 | | | | 08/15/2030 | | | | 628,080 | |
| | 1,000,000 | | | Hammond, IN Local Public Improvement District1 | | | 6.750 | | | | 08/15/2035 | | | | 1,054,360 | |
| | | | |
| 45 | | | | OPPENHEIMER ROCHESTER NATIONAL MUNICIPALS |
STATEMENT OF INVESTMENTS Continued
| | | | | | | | | | | | | | | | |
Principal
Amount | | | | | Coupon | | | Maturity | | | Value | |
| | Indiana Continued | | | | | | | | | | | | |
| | $ 1,675,000 | | | IN Finance Authority (BHI Senior Living)1 | | | 5.500 | % | | | 11/15/2031 | | | $ | 1,826,805 | |
| | 2,850,000 | | | IN Finance Authority (BHI Senior Living)1 | | | 5.750 | | | | 11/15/2041 | | | | 3,130,298 | |
| | 11,505,000 | | | IN Finance Authority (Marian University)1 | | | 6.375 | | | | 09/15/2041 | | | | 12,718,202 | |
| | 925,000 | | | IN Finance Authority Educational Facilities (Irvington Community)1 | | | 9.000 | | | | 07/01/2039 | | | | 1,137,223 | |
| | 3,485,000 | | | IN Health & Educational Facilities Financing Authority (AH/SVH Obligated Group)1 | | | 5.000 | | | | 11/15/2036 | | | | 3,700,617 | |
| | 7,360,000 | | | IN Health Facility Financing Authority (Methodist Hospitals)1 | | | 5.500 | | | | 09/15/2031 | | | | 7,362,576 | |
| | 550,000 | | | Indianapolis, IN Pollution Control (General Motors Corp.)2 | | | 5.625 | | | | 04/01/2011 | | | | 6 | |
| | 30,000 | | | North Manchester, IN (Estelle Peabody Memorial Home)2 | | | 6.500 | | | | 07/01/2015 | | | | 10,197 | |
| | 17,505,000 | | | North Manchester, IN (Estelle Peabody Memorial Home)2 | | | 7.250 | | | | 07/01/2033 | | | | 5,949,774 | |
| | 6,820,000 | | | Shelbyville, IN Redevel. District Tax Increment (Central Shelbyville Economic)1 | | | 6.500 | | | | 07/01/2022 | | | | 6,954,218 | |
| | 230,000 | | | St. Joseph County, IN Economic Devel. (Holy Cross Village Notre Dame)1 | | | 5.550 | | | | 05/15/2019 | | | | 230,216 | |
| | 5,380,000 | | | Vincennes, IN Economic Devel. (Southwest Indiana Regional Youth Village) | | | 6.250 | | | | 01/01/2024 | | | | 3,297,241 | |
| | 21,400,000 | | | Wabash County, IN Economic Devel. (North Manchester Ethanol) | | | 9.250 | | | | 07/01/2020 | | | | 16,584,786 | |
| | 4,500,000 | | | Wabash County, IN Economic Devel. (North Manchester Ethanol) | | | 14.000 | | | | 07/01/2020 | | | | 3,576,465 | |
| | | | | | | | | | | | | | | | 124,577,348 | |
| | Iowa—2.0% | | | | | | | | | | | | |
| | 500,000 | | | Cedar Rapids, IA (Cottage Grove Place) | | | 5.875 | | | | 07/01/2028 | | | | 391,880 | |
| | 1,345,000 | | | Cedar Rapids, IA (Cottage Grove Place) | | | 6.000 | | | | 07/01/2014 | | | | 1,292,827 | |
| | 5,475,000 | | | Dickinson County, IA Hsg. (Spirit Lake)1 | | | 5.875 | | | | 12/01/2036 | | | | 5,432,459 | |
| | 300,000 | | | IA Finance Authority (Amity Fellowserve)1 | | | 5.900 | | | | 10/01/2016 | | | | 318,252 | |
| | 765,000 | | | IA Finance Authority (Amity Fellowserve)1 | | | 6.000 | | | | 10/01/2028 | | | | 765,252 | |
| | 940,000 | | | IA Finance Authority (Amity Fellowserve)1 | | | 6.375 | | | | 10/01/2026 | | | | 983,917 | |
| | 2,190,000 | | | IA Finance Authority (Amity Fellowserve)1 | | | 6.500 | | | | 10/01/2036 | | | | 2,263,299 | |
| | 1,160,000 | | | IA Finance Authority (Boys & Girls Home and Family Services)2 | | | 5.900 | | | | 12/01/2028 | | | | 394,412 | |
| | 1,000,000 | | | IA Finance Authority Senior Hsg. (Bethany Manor)1 | | | 5.550 | | | | 11/01/2041 | | | | 1,001,160 | |
| | 1,175,000 | | | IA Finance Authority Senior Hsg. (Wedum Walnut Ridge)1 | | | 5.375 | | | | 06/01/2025 | | | | 971,159 | |
| | 31,910,000 | | | IA Tobacco Settlement Authority1 | | | 5.375 | | | | 06/01/2038 | | | | 28,689,005 | |
| | 34,000,000 | | | IA Tobacco Settlement Authority1 | | | 5.500 | | | | 06/01/2042 | | | | 30,316,100 | |
| | | | |
| 46 | | | | OPPENHEIMER ROCHESTER NATIONAL MUNICIPALS |
| | | | | | | | | | | | | | | | |
Principal
Amount | | | | | Coupon | | | Maturity | | | Value | |
| | Iowa Continued | | | | | | | | | | | | |
| | $ 360,990,000 | | | IA Tobacco Settlement Authority | | | 7.125 | %3 | | | 06/01/2046 | | | $ | 10,439,831 | |
| | 60,000,000 | | | IA Tobacco Settlement Authority (TASC)1 | | | 5.625 | | | | 06/01/2046 | | | | 53,893,800 | |
| | | | | | | | | | | | | | | | 137,153,353 | |
| | Kansas—0.1% | | | | | | | | | | | | |
| | 55,000 | | | KS Devel. Finance Authority (VS/VSCF/JGCCF Obligated Group)1 | | | 5.500 | | | | 11/15/2015 | | | | 55,035 | |
| | 1,215,000 | | | Lenexa, KS Multifamily Hsg. (Meadows Apartments)1 | | | 7.950 | | | | 10/15/2035 | | | | 1,178,574 | |
| | 4,372,272 | | | Olathe, KS Tax Increment (Gateway)4 | | | 5.000 | | | | 03/01/2026 | | | | 2,265,536 | |
| | 2,442,651 | | | Olathe, KS Transportation Devel. District (Gateway)4 | | | 5.000 | | | | 12/01/2028 | | |
| 978,184
|
|
| | | | | | | | | | | | | | | | 4,477,329 | |
| | Kentucky—0.3% | | | | | | | | | | | | |
| | 2,315,000 | | | Kuttawa, KY (1st Mtg.-GF/Kentucky)1 | | | 6.750 | | | | 03/01/2029 | | | | 2,316,482 | |
| | 14,000,000 | | | KY EDFA (Baptist Healthcare System)5 | | | 5.375 | | | | 08/15/2024 | | | | 15,951,600 | |
| | 1,250,000 | | | KY EDFA (Masonic Home Independent Living II)1 | | | 7.250 | | | | 05/15/2041 | | | | 1,404,863 | |
| | 1,000,000 | | | KY EDFA (Masonic Home Independent Living II)1 | | | 7.375 | | | | 05/15/2046 | | | | 1,133,500 | |
| | | | | | | | | | | | | | | | 20,806,445 | |
| | Louisiana—1.3% | | | | | | | | | | | | |
| | 175,000 | | | Caddo Parish, LA Industrial Devel. Board (Pennzoil Products Company)1 | | | 5.600 | | | | 12/01/2028 | | | | 175,326 | |
| | 20,000 | | | De Soto Parish, LA Environmental Improvement (International Paper Company)1 | | | 5.600 | | | | 11/01/2022 | | | | 20,061 | |
| | 1,200,000 | | | Juban Park, LA Community Devel. District Special Assessment2 | | | 5.150 | | | | 10/01/2014 | | | | 396,060 | |
| | 3,535,000 | | | LA CDA (Eunice Student Hsg. Foundation) | | | 7.375 | | | | 09/01/2033 | | | | 2,932,459 | |
| | 11,415,000 | | | LA HFA (La Chateau)1 | | | 7.250 | | | | 09/01/2039 | | | | 12,333,565 | |
| | 895,000 | | | LA Local Government EF&CD Authority (Cypress Apartments)1 | | | 8.000 | | | | 04/20/2028 | | | | 865,402 | |
| | 415,000 | | | LA Local Government EF&CD Authority (Sharlo Apartments) | | | 8.000 | | | | 06/20/2028 | | | | 403,708 | |
| | 5,350,000 | | | LA Public Facilities Authority (Progressive Healthcare) | | | 6.375 | | | | 10/01/2028 | | | | 5,202,394 | |
| | 65,120,000 | | | LA Tobacco Settlement Financing Corp. (TASC)1 | | | 5.875 | | | | 05/15/2039 | | | | 66,421,749 | |
| | 7,400,000 | | | Lakeshore Villages, LA Master Community Devel. District4 | | | 5.250 | | | | 07/01/2017 | | | | 2,960,814 | |
| | 60,000 | | | New Orleans, LA Sewage Service1 | | | 5.400 | | | | 06/01/2017 | | | | 60,170 | |
| | | | | | | | | | | | | | | | 91,771,708 | |
| | | | |
| 47 | | | | OPPENHEIMER ROCHESTER NATIONAL MUNICIPALS |
STATEMENT OF INVESTMENTS Continued
| | | | | | | | | | | | | | | | |
Principal
Amount | | | | | Coupon | | | Maturity | | | Value | |
| | Maine—0.3% | | | | | | | | | | | | |
| | $ 2,000,000 | | | ME H&HEFA (Maine General Medical Center)1 | | | 6.750 | % | | | 07/01/2041 | | | $ | 2,337,840 | |
| | 10,000 | | | North Berwick, ME (Hussey Seating Company) | | | 7.000 | | | | 12/01/2013 | | | | 10,026 | |
| | 4,800,000 | | | Rumford, ME Pollution Control (Boise Cascade Corp.)1 | | | 6.625 | | | | 07/01/2020 | | | | 4,802,064 | |
| | 12,265,000 | | | Rumford, ME Solid Waste Disposal (Boise Cascade Corp.)1 | | | 6.875 | | | | 10/01/2026 | | | | 12,270,765 | |
| | | | | | | | | | | | | | | | 19,420,695 | |
| | Maryland—0.3% | | | | | | | | | | | | |
| | 6,704,000 | | | Brunswick, MD Special Obligation (Brunswick Crossing)1 | | | 5.500 | | | | 07/01/2036 | | | | 5,917,688 | |
| | 5,135,000 | | | MD EDC Student Hsg. (Bowie State University)1 | | | 6.000 | | | | 06/01/2023 | | | | 5,151,432 | |
| | 400,000 | | | MD EDC Student Hsg. (University of Maryland)1 | | | 5.625 | | | | 10/01/2023 | | | | 306,772 | |
| | 8,500,000 | | | MD EDC Student Hsg. (University of Maryland)1 | | | 5.750 | | | | 10/01/2033 | | | | 5,792,070 | |
| | 600,000 | | | MD H&HEFA (King Farm Presbyterian Community)1 | | | 5.300 | | | | 01/01/2037 | | | | 559,422 | |
| | 925,000 | | | MD H&HEFA (Washington Christian Academy)2,10 | | | 5.500 | | | | 07/01/2038 | | | | 370,000 | |
| | 2,250,000 | | | Salisbury, MD Special Obligation (Villages at Aydelotte Farm) | | | 5.250 | | | | 01/01/2037 | | |
| 882,180
|
|
| | | | | | | | | | | | | | | | 18,979,564 | |
| | Massachusetts—1.9% | | | | | | | | | | | | |
| | 1,750,000 | | | MA Devel. Finance Agency (Boston Architectural College)1 | | | 5.000 | | | | 01/01/2027 | | | | 1,620,850 | |
| | 1,500,000 | | | MA Devel. Finance Agency (Boston Architectural College)1 | | | 5.000 | | | | 01/01/2037 | | | | 1,305,495 | |
| | 720,000 | | | MA Devel. Finance Agency (Eastern Nazarene College)1 | | | 5.625 | | | | 04/01/2019 | | | | 720,475 | |
| | 2,630,000 | | | MA Devel. Finance Agency (Eastern Nazarene College)1 | | | 5.625 | | | | 04/01/2029 | | | | 2,630,395 | |
| | 6,905,000 | | | MA Devel. Finance Agency (Lasell College)1 | | | 6.000 | | | | 07/01/2041 | | | | 7,463,615 | |
| | 1,507,094 | | | MA Devel. Finance Agency (Linden Ponds) | | | 0.435 | 3 | | | 11/15/2056 | | | | 7,837 | |
| | 303,005 | | | MA Devel. Finance Agency (Linden Ponds)1 | | | 5.500 | | | | 11/15/2046 | | | | 189,181 | |
| | 5,707,785 | | | MA Devel. Finance Agency (Linden Ponds)1 | | | 6.250 | | | | 11/15/2046 | | | | 4,171,991 | |
| | 65,000 | | | MA Devel. Finance Agency (May Institute)1 | | | 5.750 | | | | 09/01/2029 | | | | 65,019 | |
| | 287,550 | | | MA Devel. Finance Agency (Northern Berkshire Healthcare) | | | 3.184 | 3 | | | 02/15/2043 | | | | 28,769 | |
| | 371,250 | | | MA Devel. Finance Agency (Northern Berkshire Healthcare) | | | 6.000 | | | | 02/15/2043 | | | | 320,548 | |
| | 448,200 | | | MA Devel. Finance Agency (Northern Berkshire Healthcare) | | | 35.007 | 3 | | | 02/15/2043 | | | | 4 | |
| | 225,000 | | | MA Devel. Finance Agency (Regis College)1 | | | 5.250 | | | | 10/01/2018 | | | | 225,054 | |
| | 1,000,000 | | | MA Devel. Finance Agency (VOA Concord)1 | | | 5.200 | | | | 11/01/2041 | | | | 936,140 | |
| | | | |
| 48 | | | | OPPENHEIMER ROCHESTER NATIONAL MUNICIPALS |
| | | | | | | | | | | | | | | | |
Principal
Amount | | | | | Coupon | | | Maturity | | | Value | |
| | Massachusetts Continued | | | | | | | | | | | | |
| | $ 18,415,000 | | | MA Educational Financing Authority, Series H5 | | | 6.350 | % | | | 01/01/2030 | | | $ | 20,602,879 | |
| | 35,000 | | | MA H&EFA (Holyoke Hospital)1 | | | 6.500 | | | | 07/01/2015 | | | | 34,952 | |
| | 3,005,000 | | | MA HFA (Rental Mtg.)1 | | | 5.250 | | | | 01/01/2046 | | | | 3,024,803 | |
| | 50,080,000 | | | MA HFA, Series A5 | | | 5.250 | | | | 07/01/2025 | | | | 51,225,277 | |
| | 9,980,000 | | | MA HFA, Series A5 | | | 5.300 | | | | 06/01/2049 | | | | 10,398,650 | |
| | 17,790,000 | | | MA HFA, Series C5 | | | 5.350 | | | | 12/01/2042 | | | | 19,108,239 | |
| | 8,015,000 | | | MA HFA, Series C5 | | | 5.400 | | | | 12/01/2049 | | | | 8,284,305 | |
| | 50,000 | | | MA Port Authority (Delta Air Lines) | | | 5.000 | | | | 01/01/2027 | | |
| 45,805
|
|
| | | | | | | | | | | | | | | | 132,410,283 | |
| | Michigan—4.0% | | | | | | | | | | | | |
| | 2,900,000 | | | Detroit, MI City School District1 | | | 5.000 | | | | 05/01/2028 | | | | 3,311,916 | |
| | 1,720,000 | | | Detroit, MI City School District1 | | | 5.000 | | | | 05/01/2031 | | | | 1,942,860 | |
| | 10,100,000 | | | Detroit, MI City School District5 | | | 6.000 | | | | 05/01/2029 | | | | 12,555,007 | |
| | 100,000 | | | Detroit, MI GO | | | 5.000 | | | | 04/01/2014 | | | | 98,150 | |
| | 5,850,000 | | | Detroit, MI GO | | | 5.000 | | | | 04/01/2021 | | | | 5,371,353 | |
| | 225,000 | | | Detroit, MI GO | | | 5.250 | | | | 04/01/2014 | | | | 221,731 | |
| | 2,600,000 | | | Detroit, MI GO | | | 5.250 | | | | 04/01/2016 | | | | 2,519,452 | |
| | 350,000 | | | Detroit, MI GO | | | 5.250 | | | | 04/01/2017 | | | | 336,602 | |
| | 1,000,000 | | | Detroit, MI GO | | | 5.250 | | | | 04/01/2020 | | | | 940,600 | |
| | 2,110,000 | | | Detroit, MI GO | | | 5.250 | | | | 04/01/2020 | | | | 1,968,693 | |
| | 2,210,000 | | | Detroit, MI GO | | | 5.250 | | | | 04/01/2021 | | | | 2,065,731 | |
| | 1,330,000 | | | Detroit, MI GO | | | 5.250 | | | | 04/01/2022 | | | | 1,231,274 | |
| | 100,000 | | | Detroit, MI GO | | | 5.250 | | | | 04/01/2023 | | | | 91,307 | |
| | 10,000,000 | | | Detroit, MI GO1 | | | 5.250 | | | | 11/01/2035 | | | | 10,999,500 | |
| | 40,000 | | | Detroit, MI GO | | | 5.375 | | | | 04/01/2015 | | | | 39,211 | |
| | 2,980,000 | | | Detroit, MI Local Devel. Finance Authority1 | | | 6.700 | | | | 05/01/2021 | | | | 2,965,994 | |
| | 1,890,000 | | | Detroit, MI Local Devel. Finance Authority1 | | | 6.850 | | | | 05/01/2021 | | | | 1,875,050 | |
| | 425,000 | | | Detroit, MI Local Devel. Finance Authority (Chrysler Corp.)1 | | | 5.375 | | | | 05/01/2018 | | | | 411,800 | |
| | 10,800,000 | | | Detroit, MI Water and Sewerage Dept.1 | | | 5.000 | | | | 07/01/2032 | | | | 11,382,444 | |
| | 23,500,000 | | | Detroit, MI Water and Sewerage Dept.1 | | | 5.250 | | | | 07/01/2039 | | | | 24,829,160 | |
| | 720,000 | | | East Lansing, MI Economic Corp. (Burcham Hills) | | | 5.250 | | | | 07/01/2037 | | | | 720,490 | |
| | 500,000 | | | Kalamazoo, MI EDC (Heritage Community) | | | 5.500 | | | | 05/15/2036 | | | | 477,625 | |
| | 440,000 | | | Macomb, MI Public Academy | | | 6.750 | | | | 05/01/2037 | | | | 438,104 | |
| | 1,400,000 | | | MI Finance Authority (Old Redford Public School Academy)1 | | | 5.900 | | | | 12/01/2030 | | | | 1,437,856 | |
| | 1,400,000 | | | MI Finance Authority (Old Redford Public School Academy)1 | | | 6.500 | | | | 12/01/2040 | | | | 1,477,140 | |
| | 25,000,000 | | | MI Finance Authority (Trinity Health Corp.)5 | | | 5.000 | | | | 12/01/2039 | | | | 27,742,000 | |
| | | | |
| 49 | | | | OPPENHEIMER ROCHESTER NATIONAL MUNICIPALS |
STATEMENT OF INVESTMENTS Continued
| | | | | | | | | | | | | | | | |
Principal
Amount | | | | | Coupon | | | Maturity | | | Value | |
| | Michigan Continued | | | | | | | | | | | | |
| | $ 10,000,000 | | | MI Finance Authority (Trinity Health Corp.)1 | | | 5.000 | % | | | 12/01/2039 | | | $ | 11,096,800 | |
| | 13,320,000 | | | MI Hospital Finance Authority (McLaren Health Care Corp.)5 | | | 5.000 | | | | 08/01/2035 | | | | 14,524,661 | |
| | 2,900,000 | | | MI Hospital Finance Authority (Oakwood Obligated Group)1 | | | 5.000 | | | | 07/15/2037 | | | | 3,051,119 | |
| | 2,810,000 | | | MI Hsg. Devel. Authority (Waverly Lansing)1 | | | 5.500 | | | | 02/20/2043 | | | | 2,923,412 | |
| | 900,000 | | | MI Public Educational Facilities Authority (American Montessori) | | | 6.500 | | | | 12/01/2037 | | | | 900,297 | |
| | 1,400,000 | | | MI Public Educational Facilities Authority (Old Redford Academy)1 | | | 6.000 | | | | 12/01/2035 | | | | 1,412,880 | |
| | 1,389,000 | | | MI Strategic Fund Limited Obligation (Wolverine Human Services)1 | | | 7.875 | | | | 08/31/2028 | | | | 1,390,833 | |
| | 3,700,000 | | | MI Strategic Fund Solid Waste (Genesee Power Station) | | | 7.500 | | | | 01/01/2021 | | | | 3,699,556 | |
| | 429,990,000 | | | MI Tobacco Settlement Finance Authority | | | 7.294 | 3 | | | 06/01/2052 | | | | 6,110,158 | |
| | 3,048,780,000 | | | MI Tobacco Settlement Finance Authority | | | 8.877 | 3 | | | 06/01/2058 | | | | 18,749,997 | |
| | 1,625,000 | | | Pontiac, MI City School District1 | | | 4.500 | | | | 05/01/2020 | | | | 1,428,960 | |
| | 14,895,000 | | | Wayne County, MI Airport Authority (Detroit Metro Wayne Airport)1 | | | 5.000 | | | | 12/01/2034 | | | | 15,143,002 | |
| | 52,930,000 | | | Wayne County, MI Airport Authority (Detroit Metro Wayne Airport)5 | | | 5.000 | | | | 12/01/2029 | | | | 55,431,357 | |
| | 10,000,000 | | | Wayne County, MI Airport Authority (Detroit Metro Wayne Airport)5 | | | 5.000 | | | | 12/01/2034 | | | | 10,440,620 | |
| | 14,215,000 | | | Wayne, MI Charter County Airport Facilities (Northwest Airlines) | | | 6.000 | | | | 12/01/2029 | | |
| 12,898,122
|
|
| | | | | | | | | | | | | | | | 276,652,824 | |
| | Minnesota—0.8% | | | | | | | | | | | | |
| | 3,000,000 | | | Columbia Heights, MN Multifamily & Health Care Facilities (Crest View Corp.) | | | 5.700 | | | | 07/01/2042 | | | | 2,246,610 | |
| | 1,510,000 | | | Eveleth, MN Multifamily (Manor House Woodland) | | | 5.500 | | | | 10/01/2025 | | | | 1,372,635 | |
| | 2,830,000 | | | Eveleth, MN Multifamily (Manor House Woodland) | | | 5.700 | | | | 10/01/2036 | | | | 2,456,270 | |
| | 1,000,000 | | | Falcon Heights, MN (Kaleidoscope Charter School) | | | 6.000 | | | | 11/01/2037 | | | | 1,004,860 | |
| | 525,000 | | | International Falls, MN Pollution Control (Boise Cascade Corp.)1 | | | 5.500 | | | | 04/01/2023 | | | | 506,893 | |
| | 6,370,000 | | | International Falls, MN Solid Waste Disposal (Boise Cascade Corp.)1 | | | 6.850 | | | | 12/01/2029 | | | | 6,371,210 | |
| | 1,750,000 | | | Lake Crystal, MN Hsg. (Ecumen-Second Century)1 | | | 6.250 | | | | 09/01/2040 | | | | 1,896,318 | |
| | 14,680,000 | | | Lamberton, MN Solid Waste (Highwater Ethanol) | | | 8.500 | | | | 12/01/2022 | | | | 11,078,996 | |
| | 730,000 | | | Minneapolis, MN Multifamily Hsg. (Blaisdell Apartments)1 | | | 5.400 | | | | 04/01/2028 | | | | 681,630 | |
| | | | |
| 50 | | | | OPPENHEIMER ROCHESTER NATIONAL MUNICIPALS |
| | | | | | | | | | | | | | | | |
Principal
Amount | | | | | Coupon | | | Maturity | | | Value | |
| | Minnesota Continued | | | | | | | | | | | | |
| | $ 5,340,000 | | | Minneapolis, MN Multifamily Hsg. (Blaisdell Apartments)1 | | | 5.500 | % | | | 04/01/2042 | | | $ | 4,775,615 | |
| | 500,000 | | | Minneapolis, MN Tax Increment (Ivy Tower) | | | 5.500 | | | | 02/01/2022 | | | | 477,570 | |
| | 1,000,000 | | | Minneapolis, MN Tax Increment (Ivy Tower) | | | 5.700 | | | | 02/01/2029 | | | | 907,540 | |
| | 900,000 | | | New Hope, MN Hsg. & Health Care Facilities (Minnesota Masonic Home North Ridge)1 | | | 5.900 | | | | 03/01/2019 | | | | 900,900 | |
| | 2,100,000 | | | Northwest MN Multi-County Hsg. and Redevel. Authority | | | 5.450 | | | | 07/01/2041 | | | | 1,934,142 | |
| | 500,000 | | | Pine City, MN Health Care & Hsg. (North Branch)1 | | | 6.125 | | | | 10/20/2047 | | | | 507,385 | |
| | 3,700,000 | | | Richfield, MN Senior Hsg. (Richfield Senior Hsg.) | | | 6.625 | | | | 12/01/2039 | | | | 3,518,626 | |
| | 830,000 | | | St. Anthony, MN Hsg. & Redevel. Authority (Silver Lake Village)1 | | | 5.375 | | | | 08/01/2021 | | | | 854,477 | |
| | 790,000 | | | St. Anthony, MN Hsg. & Redevel. Authority (Silver Lake Village)1 | | | 5.625 | | | | 02/01/2031 | | | | 798,295 | |
| | 1,645,000 | | | St. Paul, MN Hsg. & Redevel. Authority (Bridgecreek Senior Place)1 | | | 7.000 | | | | 09/15/2037 | | | | 1,597,558 | |
| | 1,840,950 | | | St. Paul, MN Hsg. & Redevel. Authority (Episcopal Nursing Home)1 | | | 5.630 | | | | 10/01/2033 | | | | 1,878,579 | |
| | 3,000,000 | | | St. Paul, MN Hsg. & Redevel. Authority (Great Northern Lofts)1 | | | 6.250 | | | | 03/01/2029 | | | | 3,101,580 | |
| | 400,000 | | | St. Paul, MN Hsg. & Redevel. Authority (Hmong Academy)1 | | | 5.750 | | | | 09/01/2026 | | | | 405,780 | |
| | 650,000 | | | St. Paul, MN Hsg. & Redevel. Authority (Hmong Academy)1 | | | 6.000 | | | | 09/01/2036 | | | | 659,100 | |
| | 1,700,000 | | | St. Paul, MN Hsg. & Redevel. Authority (Upper Landing)1 | | | 6.800 | | | | 03/01/2029 | | | | 1,701,139 | |
| | 1,200,000 | | | St. Paul, MN Hsg. & Redevel. Authority (Upper Landing)1 | | | 7.000 | | | | 03/01/2029 | | | | 1,200,996 | |
| | 705,000 | | | St. Paul, MN Port Authority (Great Northern)1 | | | 6.000 | | | | 03/01/2030 | | | | 715,371 | |
| | 522,551 | | | St. Paul, MN Port Authority Parking Revenue (4th Parking Ramp)2 | | | 8.000 | | | | 12/01/2027 | | | | 136,694 | |
| | 1,170,000 | | | Wadena, MN Hsg. & Redevel. Authority (Humphrey Manor East)1 | | | 6.000 | | | | 02/01/2019 | | |
| 1,036,351
|
|
| | | | | | | | | | | | | | | | 54,723,120 | |
| | Mississippi—0.2% | | | | | | | | | | | | |
| | 175,000 | | | Jackson, MS Hsg. Authority (Elton Park Apartments)1 | | | 5.400 | | | | 04/01/2039 | | | | 175,158 | |
| | 2,790,000 | | | Meridian, MS Tax Increment (Meridian Crossroads)1 | | | 8.750 | | | | 12/01/2024 | | | | 3,061,634 | |
| | 3,885,000 | | | MS Business Finance Corp. (Intrinergy Wiggins) | | | 8.000 | | | | 01/01/2023 | | | | 3,645,024 | |
| | 1,395,000 | | | Ridgeland, MS Tax Increment (Colony Park)1 | | | 5.250 | | | | 10/01/2027 | | | | 1,529,492 | |
| | 1,755,000 | | | Ridgeland, MS Tax Increment (Colony Park)1 | | | 5.375 | | | | 10/01/2028 | | | | 1,929,780 | |
| | | | |
| 51 | | | | OPPENHEIMER ROCHESTER NATIONAL MUNICIPALS |
STATEMENT OF INVESTMENTS Continued
| | | | | | | | | | | | | | | | |
Principal
Amount | | | | | Coupon | | | Maturity | | | Value | |
| | Mississippi Continued | | | | | | | | | | | | |
| | $ 16,410,000 | | | Stonebridge, MS Public Improvement District Special Assessment2 | | | 7.500 | % | | | 10/01/2042 | | | $ | 3,932,657 | |
| | 175,000 | | | Warren County, MS Environmental Improvement (International Paper Company)1 | | | 6.250 | | | | 09/01/2023 | | |
| 175,628
|
|
| | | | | | | | | | | | | | | | 14,449,373 | |
| | Missouri—1.5% | | | | | | | | | | | | |
| | 250,000 | | | Belton, MO Tax Increment (Belton Town Center)1 | | | 5.500 | | | | 03/01/2020 | | | | 251,680 | |
| | 400,000 | | | Belton, MO Tax Increment (Belton Town Center)1 | | | 5.625 | | | | 03/01/2025 | | | | 390,304 | |
| | 500,000 | | | Branson Hills, MO Infrastructure Facilities | | | 5.000 | | | | 04/01/2016 | | | | 451,610 | |
| | 500,000 | | | Branson Hills, MO Infrastructure Facilities | | | 5.000 | | | | 04/01/2017 | | | | 439,100 | |
| | 730,000 | | | Branson Hills, MO Infrastructure Facilities | | | 5.500 | | | | 04/01/2022 | | | | 579,686 | |
| | 750,000 | | | Branson Hills, MO Infrastructure Facilities | | | 5.500 | | | | 04/01/2027 | | | | 538,905 | |
| | 4,900,000 | | | Branson, MO Commerce Park Community Improvement District | | | 5.750 | | | | 06/01/2026 | | | | 4,537,988 | |
| | 2,485,000 | | | Branson, MO IDA (Branson Hills Redevel.) | | | 5.750 | | | | 05/01/2026 | | | | 2,388,930 | |
| | 13,000,000 | | | Branson, MO IDA (Branson Hills Redevel.) | | | 7.050 | | | | 05/01/2027 | | | | 13,038,740 | |
| | 1,460,000 | | | Branson, MO IDA (Branson Landing) | | | 5.250 | | | | 06/01/2021 | | | | 1,399,147 | |
| | 2,470,000 | | | Branson, MO IDA (Branson Landing) | | | 5.500 | | | | 06/01/2029 | | | | 2,259,334 | |
| | 23,700,000 | | | Branson, MO IDA (Branson Shoppe Redevel.)1 | | | 5.950 | | | | 11/01/2029 | | | | 23,001,798 | |
| | 570,000 | | | Broadway-Fairview, MO Transportation Devel. District (Columbia) | | | 6.125 | | | | 12/01/2036 | | | | 469,731 | |
| | 1,215,000 | | | Chillicothe, MO Tax Increment (South U.S. 65)1 | | | 5.500 | | | | 04/01/2021 | | | | 1,115,698 | |
| | 1,100,000 | | | Chillicothe, MO Tax Increment (South U.S. 65)1 | | | 5.625 | | | | 04/01/2027 | | | | 1,073,644 | |
| | 1,250,000 | | | Jennings, MO Tax Increment & Community Improvement (Northland Redevel. Area)1 | | | 5.000 | | | | 11/01/2023 | | | | 1,252,538 | |
| | 500,000 | | | Kansas City, MO IDA (Plaza Library)1 | | | 5.900 | | | | 03/01/2024 | | | | 509,260 | |
| | 1,292,000 | | | Kansas City, MO IDA (West Paseo)1 | | | 6.750 | | | | 07/01/2036 | | | | 1,299,959 | |
| | 3,750,000 | | | Kansas City, MO Tax Increment (Briarcliff West)1 | | | 5.400 | | | | 06/01/2024 | | | | 3,663,263 | |
| | 1,400,000 | | | Kansas City, MO Tax Increment (Shoal Creek Parkway)1 | | | 6.500 | | | | 06/01/2025 | | | | 1,457,960 | |
| | 1,400,000 | | | Lees Summit, MO IDA (Kensington Farms)1 | | | 5.500 | | | | 03/01/2021 | | | | 1,394,260 | |
| | 750,000 | | | Lees Summit, MO IDA (Kensington Farms)1 | | | 5.750 | | | | 03/01/2029 | | | | 713,063 | |
| | 2,365,000 | | | Liberty, MO Tax Increment (Liberty Triangle)1 | | | 5.875 | | | | 10/01/2029 | | | | 2,374,697 | |
| | 3,105,000 | | | MO Dardenne Town Square Transportation Devel. District | | | 5.000 | | | | 05/01/2026 | | | | 1,642,079 | |
| | 3,825,000 | | | MO Dardenne Town Square Transportation Devel. District | | | 5.000 | | | | 05/01/2036 | | | | 1,878,152 | |
| | 2,405,000 | | | MO Enright Arlington Community Improvement District | | | 5.400 | | | | 03/01/2026 | | | | 2,174,601 | |
| | 1,705,000 | | | MO Good Shepard Nursing Home District1 | | | 5.900 | | | | 08/15/2023 | | | | 1,706,176 | |
| | | | |
| 52 | | | | OPPENHEIMER ROCHESTER NATIONAL MUNICIPALS |
| | | | | | | | | | | | | | | | |
Principal
Amount | | | | | Coupon | | | Maturity | | | Value | |
| | Missouri Continued | | | | | | | | | | | | |
| | $ 230,000 | | | MO Grindstone Plaza Transportation Devel. District | | | 5.250 | % | | | 10/01/2021 | | | $ | 201,098 | |
| | 400,000 | | | MO Grindstone Plaza Transportation Devel. District | | | 5.400 | | | | 10/01/2026 | | | | 328,332 | |
| | 115,000 | | | MO Grindstone Plaza Transportation Devel. District | | | 5.550 | | | | 10/01/2036 | | | | 85,252 | |
| | 3,915,000 | | | MO HDC (Mansion Apartments Phase II) | | | 6.170 | | | | 04/01/2032 | | | | 3,726,493 | |
| | 755,000 | | | Northwoods, MO Transportation Devel. District | | | 5.850 | | | | 02/01/2031 | | | | 680,867 | |
| | 2,000,000 | | | St. Joseph, MO IDA (Shoppes at North Village)1 | | | 5.500 | | | | 11/01/2027 | | | | 2,005,260 | |
| | 4,580,000 | | | St. Louis, MO IDA (Railway Exchange Building Redevel.)1 | | | 8.000 | | | | 04/01/2033 | | | | 4,583,756 | |
| | 2,442,000 | | | St. Louis, MO Tax Increment (1601 Washington Redevel.) | | | 6.000 | | | | 08/21/2026 | | | | 2,246,103 | |
| | 2,034,000 | | | St. Louis, MO Tax Increment (Pet Building Redevel.) | | | 5.500 | | | | 05/29/2028 | | | | 1,764,312 | |
| | 1,660,000 | | | St. Louis, MO Tax Increment (Printers Lofts)4 | | | 6.000 | | | | 08/21/2026 | | | | 1,190,320 | |
| | 3,043,000 | | | St. Louis, MO Tax Increment (Security Building Redevel.) | | | 6.300 | | | | 04/01/2027 | | | | 2,916,411 | |
| | 2,386,000 | | | St. Louis, MO Tax Increment (Washington East Condominiums)1 | | | 5.500 | | | | 01/20/2028 | | | | 2,123,301 | |
| | 1,600,000 | | | St. Louis, MO Tax Increment (Washington East Condominiums)1 | | | 5.500 | | | | 01/20/2028 | | | | 1,388,992 | |
| | 1,108,000 | | | St. Louis, MO Tax Increment Financing, Series A | | | 5.500 | | | | 09/02/2028 | | | | 953,789 | |
| | 1,865,000 | | | Stone Canyon, MO Improvement District (Infrastructure) | | | 5.700 | | | | 04/01/2022 | | | | 1,324,206 | |
| | 975,000 | | | Stone Canyon, MO Improvement District (Infrastructure) | | | 5.750 | | | | 04/01/2027 | | | | 614,279 | |
| | 75,000 | | | Suemandy, MO Mid-Rivers Community Improvement District1 | | | 7.000 | | | | 10/01/2019 | | | | 82,186 | |
| | 2,225,000 | | | Suemandy, MO Mid-Rivers Community Improvement District1 | | | 7.500 | | | | 10/01/2029 | | | | 2,402,066 | |
| | | | | | | | | | | | | | | | 100,619,326 | |
| | Montana—0.1% | | | | | | | | | | | | |
| | 5,935,000 | | | Hardin, MT Tax Increment Industrial Infrastructure Devel. (Rocky Mountain Power)1 | | | 0.000 | 7 | | | 09/01/2031 | | | | 4,888,660 | |
| | 1,125,000 | | | MT Facilities Finance Authority (St. John’s Lutheran)1 | | | 6.000 | | | | 05/15/2025 | | | | 1,174,725 | |
| | 1,650,000 | | | MT Facilities Finance Authority (St. John’s Lutheran)1 | | | 6.125 | | | | 05/15/2036 | | | | 1,702,701 | |
| | | | | | | | | | | | | | | | 7,766,086 | |
| | Multi States—0.1% | | | | | | | | | | | | |
| | 8,000,000 | | | Munimae TE Bond Subsidiary1 | | | 5.900 | | | | 11/29/2049 | | | | 4,559,920 | |
| | | | |
| 53 | | | | OPPENHEIMER ROCHESTER NATIONAL MUNICIPALS |
STATEMENT OF INVESTMENTS Continued
| | | | | | | | | | | | | | | | |
Principal
Amount | | | | | Coupon | | | Maturity | | | Value | |
| | Nebraska—0.9% | | | | | | | | | | | | |
| | $ 1,120,000 | | | Beatrice, NE Community Redevel. Authority (Beatrice Biodiesel) | | | 6.625 | % | | | 12/01/2021 | | | $
| 649,141
|
|
| | 20,000,000 | | | Douglas County, NE Hospital Authority (Methodist Health System)5 | | | 5.750 | | | | 11/01/2048 | | | | 22,480,088 | |
| | 1,250,000 | | | Mead Village, NE Tax Increment (Biofuels-Mead)1 | | | 5.750 | | | | 01/01/2022 | | | | 558,050 | |
| | 17,500,000 | | | NE Central Plains Gas Energy1 | | | 5.000 | | | | 09/01/2032 | | | | 18,427,150 | |
| | 2,400,000 | | | NE Educational Facilities Authority (Midland Lutheran College)1 | | | 5.600 | | | | 09/15/2029 | | | | 1,959,144 | |
| | 6,960,000 | | | Santee Sioux Nation, NE Tribal Health Care (Indian Health Service)1 | | | 8.750 | | | | 10/01/2020 | | | | 7,499,470 | |
| | 45,745,000 | | | Saunders County, NE Individual Devel. (Mead Biofuels)2 | | | 7.000 | | | | 12/01/2026 | | | | 9,032,808 | |
| | | | | | | | | | | | | | | | 60,605,851 | |
| | Nevada—0.1% | | | | | | | | | | | | |
| | 1,000,000 | | | Clark County, NV Improvement District1 | | | 5.000 | | | | 02/01/2026 | | | | 844,190 | |
| | 770,000 | | | Clark County, NV Improvement District1 | | | 5.050 | | | | 02/01/2031 | | | | 612,319 | |
| | 10,000,000 | | | Director of the State of NV Dept. of Business & Industry (Las Ventanas Retirement)2 | | | 7.000 | | | | 11/15/2034 | | | | 5,310,300 | |
| | 100,000 | | | Las Vegas, NV Paiute Tribe, Series A1 | | | 6.625 | | | | 11/01/2017 | | | | 97,678 | |
| | 120,000 | | | Mesquite, NV Special Improvement District (Canyon Creek)1 | | | 5.400 | | | | 08/01/2020 | | | | 101,192 | |
| | 470,000 | | | Mesquite, NV Special Improvement District (Canyon Creek)1 | | | 5.500 | | | | 08/01/2025 | | | | 349,807 | |
| | 1,780,000 | | | Mesquite, NV Special Improvement District No. 07-01 (Anthem at Mesquite)1 | | | 6.150 | | | | 08/01/2037 | | | | 1,612,235 | |
| | | | | | | | | | | | | | | | 8,927,721 | |
| | New Hampshire—0.1% | | | | | | | | | | | | |
| | 1,780,000 | | | NH Business Finance Authority (Air Cargo at Pease)4 | | | 6.750 | | | | 04/01/2024 | | | | 902,015 | |
| | 70,000 | | | NH Business Finance Authority (Connecticut Light & Power Company)1 | | | 5.850 | | | | 12/01/2022 | | | | 70,533 | |
| | 1,500,000 | | | NH Business Finance Authority (Huggins Hospital)1 | | | 6.875 | | | | 10/01/2039 | | | | 1,650,000 | |
| | 4,620,000 | | | NH H&EFA (Franklin Pierce College)1 | | | 6.050 | | | | 10/01/2034 | | | | 4,653,957 | |
| | 515,000 | | | NH HE&HFA (Franklin Pierce College)1 | | | 5.300 | | | | 10/01/2028 | | | | 501,332 | |
| | | | | | | | | | | | | | | | 7,777,837 | |
| | New Jersey—7.6% | | | | | | | | | | | | |
| | 32,910,000 | | | NJ EDA (Continental Airlines)1 | | | 6.250 | | | | 09/15/2019 | | | | 33,042,627 | |
| | 26,685,000 | | | NJ EDA (Continental Airlines)1 | | | 6.250 | | | | 09/15/2029 | | | | 26,792,541 | |
| | 11,385,000 | | | NJ EDA (Continental Airlines)1 | | | 6.400 | | | | 09/15/2023 | | | | 11,432,134 | |
| | 25,935,000 | | | NJ EDA (Continental Airlines)1 | | | 7.000 | | | | 11/15/2030 | | | | 26,034,331 | |
| | | | |
| 54 | | | | OPPENHEIMER ROCHESTER NATIONAL MUNICIPALS |
| | | | | | | | | | | | | | | | |
Principal
Amount | | | | | Coupon | | | Maturity | | | Value | |
| | New Jersey Continued | | | | | | | | | | | | |
| | $ 16,920,000 | | | NJ EDA (Continental Airlines)1 | | | 7.200 | % | | | 11/15/2030 | | | $ | 16,984,804 | |
| | 16,500,000 | | | NJ EDA (Continental Airlines)1 | | | 9.000 | | | | 06/01/2033 | | | | 17,426,970 | |
| | 865,164 | | | NJ EDA (Empowerment Zone-Cumberland)2 | | | 7.750 | | | | 03/01/2021 | | | | 8,643 | |
| | 7,490,000 | | | NJ EDA (Engel Burman at Woodcliff Lake)1 | | | 8.000 | | | | 05/01/2044 | | | | 8,217,129 | |
| | 7,505,000 | | | NJ EDA (Engel Burman at Woodcliff Lake)1 | | | 8.000 | | | | 05/01/2044 | | | | 8,233,585 | |
| | 7,505,000 | | | NJ EDA (Engel Burman at Woodcliff Lake)6 | | | 8.000 | | | | 05/01/2044 | | | | 8,233,585 | |
| | 11,000,000 | | | NJ EDA (GMT Realty) | | | 6.875 | | | | 01/01/2037 | | | | 11,169,070 | |
| | 10,360,000 | | | NJ EDA (School Facilities)5 | | | 5.000 | | | | 09/01/2024 | | | | 12,259,810 | |
| | 10,000 | | | NJ EDA (The Presbyterian Home at Montgomery)1 | | | 6.375 | | | | 11/01/2031 | | | | 9,998 | |
| | 2,040,000 | | | NJ Health Care Facilities Financing Authority (Raritan Bay Medical Center) | | | 7.250 | | | | 07/01/2014 | | | | 2,041,040 | |
| | 8,450,000 | | | NJ Health Care Facilities Financing Authority (Raritan Bay Medical Center) | | | 7.250 | | | | 07/01/2027 | | | | 7,819,968 | |
| | 160,440,000 | | | NJ Tobacco Settlement Financing Corp. | | | 4.750 | | | | 06/01/2034 | | | | 129,195,914 | |
| | 96,125,000 | | | NJ Tobacco Settlement Financing Corp.5 | | | 5.000 | | | | 06/01/2029 | | | | 88,296,409 | |
| | 115,435,000 | | | NJ Tobacco Settlement Financing Corp. | | | 5.000 | | | | 06/01/2041 | | | | 94,279,228 | |
| | 10,000,000 | | | NJ Transportation Trust Fund Authority5 | | | 5.000 | | | | 12/15/2023 | | | | 12,358,279 | |
| | 2,000,000 | | | NJ Transportation Trust Fund Authority1 | | | 6.000 | | | | 06/15/2035 | | | | 2,470,400 | |
| | 210,000 | | | Weehawken Township, NJ GO1 | | | 6.000 | | | | 08/01/2021 | | | | 232,901 | |
| | 210,000 | | | Weehawken Township, NJ GO1 | | | 6.000 | | | | 08/01/2022 | | | | 229,786 | |
| | 260,000 | | | Weehawken Township, NJ GO1 | | | 6.000 | | | | 08/01/2023 | | | | 281,962 | |
| | 260,000 | | | Weehawken Township, NJ GO1 | | | 6.000 | | | | 08/01/2024 | | | | 280,704 | |
| | 235,000 | | | Weehawken Township, NJ GO1 | | | 6.000 | | | | 08/01/2025 | | |
| 252,583
|
|
| | | | | | | | | | | | | | | | 517,584,401 | |
| | New Mexico—0.3% | | | | | | | | | | | | |
| | 336,000 | | | Dona Ana County, NM Multifamily (Montana Meadows Apartments)1 | | | 8.500 | | | | 12/01/2015 | | | | 337,878 | |
| | 4,700,000 | | | Eldorado, NM Area Water and Sanitation District1 | | | 6.000 | | | | 02/01/2025 | | | | 4,659,298 | |
| | 3,500,000 | | | Farmington, NM Pollution Control (Public Service Company of New Mexico)1 | | | 6.250 | | | | 06/01/2040 | | | | 3,905,230 | |
| | 775,000 | | | Mariposa East, NM Public Improvement District | | | 5.500 | | | | 09/01/2016 | | | | 780,588 | |
| | 500,000 | | | Mariposa East, NM Public Improvement District | | | 5.750 | | | | 09/01/2021 | | | | 475,860 | |
| | 875,000 | | | Montecito Estates, NM Public Improvement District1 | | | 7.000 | | | | 10/01/2037 | | | | 901,556 | |
| | 175,000 | | | NM Regional Hsg. Authority (Wildewood Apartments)1 | | | 8.750 | | | | 12/01/2020 | | | | 175,352 | |
| | 1,925,000 | | | NM Trails Public Improvement District | | | 7.750 | | | | 10/01/2038 | | | | 1,958,052 | |
| | 4,690,000 | | | Saltillo, NM Improvement District1 | | | 7.625 | | | | 10/01/2037 | | | | 4,744,685 | |
| | | | |
| 55 | | | | OPPENHEIMER ROCHESTER NATIONAL MUNICIPALS |
STATEMENT OF INVESTMENTS Continued
| | | | | | | | | | | | | | | | |
Principal
Amount | | | | | Coupon | | | Maturity | | | Value | |
| | New Mexico Continued | | | | | | | | | | | | |
| | $ 1,000,000 | | | Ventana West, NM Public Improvement District Special Levy1 | | | 6.875 | % | | | 08/01/2033 | | | $
| 1,015,140
|
|
| | | | | | | | | | | | | | | | 18,953,639 | |
| | New York—6.9% | | | | | | | | | | | | |
| | 3,000,000 | | | Albany, NY IDA (New Covenant Charter School)2 | | | 7.000 | | | | 05/01/2035 | | | | 674,970 | |
| | 1,785,000 | | | Dutchess County, NY IDA (St. Francis Hospital) | | | 7.500 | | | | 03/01/2029 | | | | 1,839,907 | |
| | 17,700,000 | | | Erie County, NY Tobacco Asset Securitization Corp. | | | 6.656 | 3 | | | 06/01/2055 | | | | 188,859 | |
| | 1,250,000 | | | Huntington, NY Hsg. Authority (GJSR)1 | | | 6.000 | | | | 05/01/2039 | | | | 1,250,863 | |
| | 1,000,000 | | | Monroe County, NY Industrial Devel. Corp. (St. John Fisher College)1 | | | 6.000 | | | | 06/01/2030 | | | | 1,124,560 | |
| | 1,000,000 | | | Nassau County, NY IDA (Amsterdam at Harborside) | | | 6.500 | | | | 01/01/2027 | | | | 672,240 | |
| | 412,100,000 | | | NY Counties Tobacco Trust V | | | 7.151 | 3 | | | 06/01/2060 | | | | 2,101,710 | |
| | 500,000,000 | | | NY Counties Tobacco Trust V | | | 7.836 | 3 | | | 06/01/2060 | | | | 2,550,000 | |
| | 37,380,000 | | | NY Liberty Devel. Corp. (Bank of America Tower)5,11 | | | 5.125 | | | | 01/15/2044 | | | | 41,566,371 | |
| | 8,765,000 | | | NY/NJ Port Authority Austin Trust Inverse Certificates | | | 7.707 | 12 | | | 04/01/2036 | | | | 9,926,012 | |
| | 31,835,000 | | | NYC IDA (American Airlines)2 | | | 6.900 | | | | 08/01/2024 | | | | 20,751,326 | |
| | 8,870,000 | | | NYC IDA (American Airlines) | | | 7.500 | | | | 08/01/2016 | | | | 9,363,349 | |
| | 42,500,000 | | | NYC IDA (American Airlines) | | | 7.625 | | | | 08/01/2025 | | | | 44,868,100 | |
| | 37,000,000 | | | NYC IDA (American Airlines) | | | 7.750 | | | | 08/01/2031 | | | | 39,459,020 | |
| | 7,200,000 | | | NYC IDA (American Airlines) | | | 8.000 | | | | 08/01/2028 | | | | 7,678,368 | |
| | 2,995,000 | | | NYC IDA (American Airlines) | | | 8.500 | | | | 08/01/2028 | | | | 3,099,196 | |
| | 19,450,000 | | | NYC IDA (British Airways)1 | | | 7.625 | | | | 12/01/2032 | | | | 19,993,044 | |
| | 5,475,000 | | | NYC IDA (Brooklyn Navy Yard Cogeneration Partners)1 | | | 5.650 | | | | 10/01/2028 | | | | 4,780,058 | |
| | 5,020,000 | | | NYC IDA (Brooklyn Navy Yard Cogeneration Partners)1 | | | 5.750 | | | | 10/01/2036 | | | | 4,257,010 | |
| | 8,605,000 | | | NYC IDA (Brooklyn Navy Yard Cogeneration Partners)1 | | | 6.200 | | | | 10/01/2022 | | | | 8,187,141 | |
| | 12,955,000 | | | NYC Municipal Water Finance Authority5 | | | 5.750 | | | | 06/15/2040 | | | | 15,637,720 | |
| | 14,575,000 | | | NYC Transitional Finance Authority5 | | | 5.000 | | | | 02/01/2031 | | | | 17,124,021 | |
| | 18,130,000 | | | NYC Transitional Finance Authority5 | | | 5.000 | | | | 02/01/2035 | | | | 20,913,680 | |
| | 25,000,000 | | | NYC Transitional Finance Authority (Building Aid)1 | | | 5.250 | | | | 07/15/2037 | | | | 29,058,000 | |
| | 2,200,000 | | | NYS DA (North Shore L.I. Jewish Obligated Group)1 | | | 5.000 | | | | 05/01/2041 | | | | 2,416,304 | |
| | 31,295,000 | | | NYS DA (Personal Income Tax)1 | | | 5.000 | | | | 03/15/2036 | | | | 34,039,572 | |
| | 22,200,000 | | | NYS DA (St. Mary’s Hospital for Children) | | | 7.875 | | | | 11/15/2041 | | | | 23,886,978 | |
| | | | |
| 56 | | | | OPPENHEIMER ROCHESTER NATIONAL MUNICIPALS |
| | | | | | | | | | | | | | | | |
Principal
Amount | | | | | Coupon | | | Maturity | | | Value | |
| | New York Continued | | | | | | | | | | | | |
| | $ 75,000 | | | NYS DA (State Personal Income Tax Authority)1 | | | 5.000 | % | | | 03/15/2035 | | | $ | 81,653 | |
| | 31,750,000 | | | NYS Liberty Devel. Corp. (4 World Trade Center)1 | | | 5.750 | | | | 11/15/2051 | | | | 37,634,545 | |
| | 200,000 | | | Port Authority NY/NJ (JFK International Air Terminal) | | | 5.750 | | | | 12/01/2025 | | | | 200,046 | |
| | 4,000,000 | | | Port Authority NY/NJ (KIAC)1 | | | 6.750 | | | | 10/01/2019 | | | | 4,000,080 | |
| | 25,000,000 | | | Port Authority NY/NJ, 166th Series5 | | | 5.250 | | | | 07/15/2036 | | | | 29,510,750 | |
| | 6,600,000 | | | Syracuse, NY IDA (Carousel Center)1 | | | 5.000 | | | | 01/01/2036 | | | | 6,672,666 | |
| | 7,530,000 | | | Westchester County, NY IDA (EBC White Plains)1 | | | 8.000 | | | | 11/01/2043 | | | | 8,371,779 | |
| | 7,530,000 | | | Westchester County, NY IDA (EBC White Plains)1 | | | 8.000 | | | | 11/01/2043 | | | | 8,371,779 | |
| | 7,530,000 | | | Westchester County, NY IDA (EBC White Plains)1 | | | 8.000 | | | | 11/01/2043 | | | | 8,371,779 | |
| | 2,600,000 | | | Yonkers, NY IDA (St. Joseph’s Hospital),
Series 98-C | | | 6.200 | | | | 03/01/2020 | | |
| 2,602,184
|
|
| | | | | | | | | | | | | | | | 473,225,640 | |
| | North Carolina—1.0% | | | | | | | | | | | | |
| | 48,200,000 | | | Charlotte, NC Douglas International Airport Special Facilities (US Airways) | | | 5.600 | | | | 07/01/2027 | | | | 44,050,462 | |
| | 12,005,000 | | | Charlotte, NC Douglas International Airport Special Facilities (US Airways) | | | 7.750 | | | | 02/01/2028 | | | | 12,024,328 | |
| | 4,380,000 | | | Gaston, NC IFPCFA (National Gypsum) | | | 5.750 | | | | 08/01/2035 | | | | 3,976,164 | |
| | 1,500,000 | | | NC Medical Care Commission (AHACHC)1 | | | 5.800 | | | | 10/01/2034 | | | | 1,589,745 | |
| | 1,650,000 | | | NC Medical Care Commission (Whitestone)1 | | | 7.750 | | | | 03/01/2031 | | | | 1,894,497 | |
| | 4,725,000 | | | NC Medical Care Commission (Whitestone)1 | | | 7.750 | | | | 03/01/2041 | | |
| 5,371,569
|
|
| | | | | | | | | | | | | | | | 68,906,765 | |
| | North Dakota—0.1% | | | | | | | | | | | | |
| | 500,000 | | | Burleigh County, ND Nursing Home (Baptist Home) | | | 6.200 | | | | 07/01/2032 | | | | 504,090 | |
| | 1,000,000 | | | Cando, ND Nursing Facility (Towner County Medical Center) | | | 7.125 | | | | 08/01/2022 | | | | 1,001,020 | |
| | 85,000 | | | Cass County, ND Industrial Devel. Revenue (Fraser Ltd.)1 | | | 7.000 | | | | 11/01/2015 | | | | 83,857 | |
| | 2,670,000 | | | Richland County, ND Hsg. (Birchwood Properties) | | | 6.750 | | | | 05/01/2029 | | |
| 2,241,545
|
|
| | | | | | | | | | | | | | | | 3,830,512 | |
| | Ohio—5.0% | | | | | | | | | | | | |
| | 9,950,000 | | | Allen County, OH Hospital Facilities (Catholic Healthcare)1 | | | 5.000 | | | | 06/01/2038 | | | | 10,776,447 | |
| | 5,000,000 | | | Buckeye, OH Tobacco Settlement Financing Authority (TASC)1 | | | 5.125 | | | | 06/01/2024 | | | | 4,196,550 | |
| | 25,000,000 | | | Buckeye, OH Tobacco Settlement Financing Authority (TASC)1 | | | 5.750 | | | | 06/01/2034 | | | | 20,355,500 | |
| | 11,245,000 | | | Buckeye, OH Tobacco Settlement Financing Authority (TASC)1 | | | 5.875 | | | | 06/01/2030 | | | | 9,337,511 | |
| | | | |
| 57 | | | | OPPENHEIMER ROCHESTER NATIONAL MUNICIPALS |
STATEMENT OF INVESTMENTS Continued
| | | | | | | | | | | | | | | | |
Principal
Amount | | | | | Coupon | | | Maturity | | | Value | |
| | Ohio Continued | | | | | | | | | | | | |
| | $ 56,910,000 | | | Buckeye, OH Tobacco Settlement Financing Authority (TASC)1 | | | 5.875 | % | | | 06/01/2047 | | | $ | 46,227,424 | |
| | 1,542,000 | | | Buckeye, OH Tobacco Settlement Financing Authority (TASC)1 | | | 6.000 | | | | 06/01/2042 | | | | 1,286,660 | |
| | 13,385,000 | | | Buckeye, OH Tobacco Settlement Financing Authority (TASC)1 | | | 6.500 | | | | 06/01/2047 | | | | 11,915,059 | |
| | 2,347,000,000 | | | Buckeye, OH Tobacco Settlement Financing Authority (TASC) | | | 7.504 | 3 | | | 06/01/2052 | | | | 33,022,290 | |
| | 1,315,000 | | | Butler County, OH Hsg. (Anthony Wayne Apartments) | | | 6.500 | | | | 09/01/2030 | | | | 1,010,499 | |
| | 4,495,000 | | | Centerville, OH Health Care (Bethany Lutheran Village)1 | | | 6.000 | | | | 11/01/2038 | | | | 4,660,011 | |
| | 19,805,000 | | | Cleveland, OH Airport (Continental Airlines) | | | 5.700 | | | | 12/01/2019 | | | | 19,809,159 | |
| | 1,500,000 | | | Cleveland-Cuyahoga County, OH Port Authority (St. Clarence)1 | | | 6.250 | | | | 05/01/2038 | | | | 1,442,370 | |
| | 500,000 | | | Columbus-Franklin County, OH Finance Authority, Series A1 | | | 6.000 | | | | 05/15/2035 | | | | 517,545 | |
| | 10,425,000 | | | Cuyahoga County, OH Hospital Facilities
(CSAHS-UHHS-Cuyahoga/Canton Obligated Group)1 | | | 7.500 | | | | 01/01/2030 | | | | 10,440,221 | |
| | 32,500,000 | | | Gallia County, OH Hospital Facilities (Holzer/HHlthS/HMCG/HMCJ Obligated Group) | | | 8.000 | | | | 07/01/2042 | | | | 36,373,350 | |
| | 7,500,000 | | | Grove City, OH Tax Increment Financing1 | | | 5.375 | | | | 12/01/2031 | | | | 7,546,875 | |
| | 1,450,000 | | | Hancock County, OH Hospital (BVRHC/BVHF Obligated Group)1 | | | 6.250 | | | | 12/01/2034 | | | | 1,710,188 | |
| | 4,200,000 | | | Hickory Chase, OH Community Authority Infrastructure Improvement2 | | | 7.000 | | | | 12/01/2038 | | | | 2,727,606 | |
| | 125,000 | | | Lake County, OH Hospital Facilities (Lake Hospital System)1 | | | 5.750 | | | | 08/15/2038 | | | | 133,281 | |
| | 685,000 | | | Lorain County, OH Port Authority (Alumalloy LLC)1 | | | 6.000 | | | | 11/15/2025 | | | | 660,641 | |
| | 5,500,000 | | | Miami University, OH1 | | | 5.000 | | | | 09/01/2036 | | | | 6,333,360 | |
| | 10,000,000 | | | Montgomery County, OH (Miami Valley Hospital)5 | | | 5.750 | | | | 11/15/2023 | | | | 12,245,400 | |
| | 11,410,000 | | | OH Air Quality Devel. Authority (Fostoria Ethanol) | | | 8.500 | | | | 02/01/2020 | | | | 8,298,379 | |
| | 11,690,000 | | | OH Air Quality Devel. Authority (Marion Ethanol) | | | 8.500 | | | | 02/01/2020 | | | | 8,502,020 | |
| | 50,000 | | | OH Environmental Facilities (Ford Motor Company)1 | | | 5.750 | | | | 04/01/2035 | | | | 51,729 | |
| | 2,250,000 | | | OH Higher Education Facility Commission (Ashland University)1 | | | 6.250 | | | | 09/01/2024 | | | | 2,408,783 | |
| | 2,050,000 | | | OH Port Authority of Columbiana Solid Waste (A&L Salvage)2 | | | 14.500 | | | | 07/01/2028 | | | | — | |
| | 16,320,000 | | | OH Port Authority of Columbiana Solid Waste (Apex Environmental)10 | | | 7.250 | | | | 08/01/2034 | | | | 12,358,810 | |
| | | | |
| 58 | | | | OPPENHEIMER ROCHESTER NATIONAL MUNICIPALS |
| | | | | | | | | | | | | | | | |
Principal
Amount | | | | | Coupon | | | Maturity | | | Value | |
| | Ohio Continued | | | | | | | | | | | | |
| | $ 14,000,000 | | | OH Solid Waste Disposal (General Motors Corp.)2 | | | 6.300 | % | | | 12/01/2032 | | | $ | 140 | |
| | 14,515,000 | | | OH Solid Waste Disposal (USG Corp.) | | | 5.600 | | | | 08/01/2032 | | | | 13,415,198 | |
| | 32,620,000 | | | OH Solid Waste Disposal (USG Corp.) | | | 5.650 | | | | 03/01/2033 | | | | 30,297,456 | |
| | 6,640,000 | | | OH Solid Waste Disposal (USG Corp.) | | | 6.050 | | | | 08/01/2034 | | | | 6,466,895 | |
| | 2,215,000 | | | Port of Greater Cincinnati, OH Devel. Authority (Public Parking Infrastructure)4 | | | 6.300 | | | | 02/15/2024 | | | | 1,335,689 | |
| | 2,500,000 | | | Port of Greater Cincinnati, OH Devel. Authority (Public Parking Infrastructure)4 | | | 6.400 | | | | 02/15/2034 | | | | 1,507,775 | |
| | 4,100,000 | | | Southeastern OH Port Authority Hospital Facility (Memorial Health System)1 | | | 5.750 | | | | 12/01/2032 | | | | 4,308,321 | |
| | 3,000,000 | | | Southeastern OH Port Authority Hospital Facility (Memorial Health System)1 | | | 6.000 | | | | 12/01/2042 | | | | 3,174,990 | |
| | 1,955,000 | | | Toledo-Lucas County, OH Port Authority (Town Square at Levis Commons) | | | 5.400 | | | | 11/01/2036 | | | | 1,085,005 | |
| | 3,415,000 | | | Warren County, OH Port Authority (Corridor 75 Park) | | | 7.500 | | | | 12/01/2034 | | | | 3,509,425 | |
| | | | | | | | | | | | | | | | 339,448,562 | |
| | Oklahoma—1.3% | | | | | | | | | | | | |
| | 1,700,000 | | | Ardmore, OK Devel. Authority (Airpark Increment District) | | | 5.750 | | | | 11/01/2022 | | | | 1,738,692 | |
| | 1,500,000 | | | Atoka County, OK Healthcare Authority (Atoka Memorial Hospital) | | | 6.625 | | | | 10/01/2037 | | | | 1,531,635 | |
| | 5,000,000 | | | Grady County, OK Criminal Justice Authority1 | | | 7.000 | | | | 11/01/2041 | | | | 5,181,950 | |
| | 50,000 | | | OK Ordnance Works Authority Sewer & Solid Waste Disposal Facilities (Ralston Purina Group)1 | | | 6.500 | | | | 09/01/2026 | | | | 50,125 | |
| | 1,500,000 | | | Oklahoma City, OK Industrial & Cultural Facilities (Aero Obligated Group)1 | | | 6.750 | | | | 01/01/2023 | | | | 1,449,720 | |
| | 2,850,000 | | | Oklahoma County, OK Finance Authority (Var-Sail Assoc.)1 | | | 5.250 | | | | 12/01/2041 | | | | 3,027,099 | |
| | 63,795,000 | | | Tulsa, OK Municipal Airport Trust (American Airlines)2 | | | 7.750 | | | | 06/01/2035 | | | | 73,257,074 | |
| | | | | | | | | | | | | | | | 86,236,295 | |
| | Oregon—0.1% | | | | | | | | | | | | |
| | 15,000 | | | Lane County, OR Hsg. Authority & Community Services (Firewood)1 | | | 6.600 | | | | 11/01/2015 | | | | 15,040 | |
| | 795,000 | | | OR Facilities Authority (Concordia University)1 | | | 6.125 | | | | 09/01/2030 | | | | 862,631 | |
| | 2,225,000 | | | OR Facilities Authority (Student Housing-Ashland)1 | | | 5.000 | | | | 07/01/2044 | | | | 2,393,321 | |
| | 1,300,000 | | | Salem, OR Hospital Finance Authority (Capital Manor)1 | | | 6.000 | | | | 05/15/2042 | | | | 1,394,341 | |
| | 1,300,000 | | | Salem, OR Hospital Finance Authority (Capital Manor)1 | | | 6.000 | | | | 05/15/2047 | | | | 1,394,341 | |
| | | | |
| 59 | | | | OPPENHEIMER ROCHESTER NATIONAL MUNICIPALS |
STATEMENT OF INVESTMENTS Continued
| | | | | | | | | | | | | | | | |
Principal
Amount | | | | | Coupon | | | Maturity | | | Value | |
| | Oregon Continued | | | | | | | | | | | | |
| | $ 510,000 | | | Western Generation, OR Agency Cogeneration (Wauna Cogeneration)1 | | | 5.000 | % | | | 01/01/2021 | | | $ | 509,148 | |
| | | | | | | | | | | | | | | | 6,568,822 | |
| | Pennsylvania—1.1% | | | | | | | | | | | | |
| | 1,500,000 | | | Chester County, PA H&EFA (Chester County Hospital)1 | | | 6.750 | | | | 07/01/2031 | | | | 1,501,545 | |
| | 1,300,000 | | | Luzerne County, PA IDA1 | | | 7.500 | | | | 12/15/2019 | | | | 1,352,312 | |
| | 500,000 | | | Luzerne County, PA IDA1 | | | 7.750 | | | | 12/15/2027 | | | | 525,885 | |
| | 24,937,498 | | | PA EDFA (Bionol Clearfield)2 | | | 8.500 | | | | 07/15/2015 | | | | 2,488,264 | |
| | 5,000,000 | | | PA EDFA (National Gypsum Company) | | | 6.250 | | | | 11/01/2027 | | | | 4,936,600 | |
| | 2,100,000 | | | PA EDFA (Northampton Generating)2 | | | 6.500 | | | | 01/01/2013 | | | | 1,326,759 | |
| | 10,950,000 | | | PA EDFA (Northampton Generating)2 | | | 6.600 | | | | 01/01/2019 | | | | 7,013,256 | |
| | 16,000,000 | | | PA EDFA (USG Corp.) | | | 6.000 | | | | 06/01/2031 | | | | 15,524,800 | |
| | 11,500,000 | | | PA Geisinger Authority Health System, Series A5 | | | 5.250 | | | | 06/01/2039 | | | | 12,820,430 | |
| | 2,700,000 | | | PA HEFA (MCP/HUHS/AUS Obligated Group)1 | | | 5.875 | | | | 11/15/2016 | | | | 2,702,565 | |
| | 3,500,000 | | | PA HEFA (MCP/HUHS/AUS Obligated Group)1 | | | 5.875 | | | | 11/15/2021 | | | | 3,502,065 | |
| | 4,000,000 | | | PA HEFA (Shippensburg University)1 | | | 6.250 | | | | 10/01/2043 | | | | 4,482,440 | |
| | 2,000,000 | | | Philadelphia, PA GO1 | | | 6.000 | | | | 08/01/2036 | | | | 2,356,180 | |
| | 2,000,000 | | | Philadelphia, PA GO1 | | | 6.500 | | | | 08/01/2041 | | | | 2,446,000 | |
| | 3,350,000 | | | Philadelphia, PA H&HEFA (Temple University Health System)1 | | | 5.625 | | | | 07/01/2036 | | | | 3,518,673 | |
| | 4,500,000 | | | Philadelphia, PA H&HEFA (Temple University Health System)1 | | | 5.625 | | | | 07/01/2042 | | | | 4,715,775 | |
| | 6,000,000 | | | York, PA GO1 | | | 7.250 | | | | 11/15/2041 | | | | 6,978,180 | |
| | | | | | | | | | | | | | | | 78,191,729 | |
| | Rhode Island—1.6% | | | | | | | | | | | | |
| | 45,000,000 | | | Central Falls, RI Detention Facility | | | 7.250 | | | | 07/15/2035 | | | | 38,875,950 | |
| | 45,000 | | | RI Health & Educational Building Corp. (Roger Williams General Hospital)1 | | | 5.500 | | | | 07/01/2018 | | | | 44,440 | |
| | 20,000 | | | RI Health & Educational Building Corp. (Roger Williams Medical Center)1 | | | 5.500 | | | | 07/01/2028 | | | | 18,349 | |
| | 11,430,000 | | | RI Hsg. & Mtg. Finance Corp. (Homeownership Opportunity)5 | | | 5.200 | | | | 10/01/2047 | | | | 11,852,005 | |
| | 52,090,000 | | | RI Tobacco Settlement Financing Corp. (TASC) | | | 6.125 | 3 | | | 06/01/2052 | | | | 664,668 | |
| | 27,875,000 | | | RI Tobacco Settlement Financing Corp. (TASC)1 | | | 6.250 | | | | 06/01/2042 | | | | 28,292,846 | |
| | 42,825,000 | | | RI Tobacco Settlement Financing Corp. (TASC) | | | 7.868 | 3 | | | 06/01/2052 | | | | 452,660 | |
| | 25,605,000 | | | RI Tobacco Settlement Financing Corp. (TASC), Series A1 | | | 6.125 | | | | 06/01/2032 | | | | 25,860,794 | |
| | | | | | | | | | | | | | | | 106,061,712 | |
| | | | |
| 60 | | | | OPPENHEIMER ROCHESTER NATIONAL MUNICIPALS |
| | | | | | | | | | | | | | | | |
Principal
Amount | | | | | Coupon | | | Maturity | | | Value | |
| | South Carolina—0.6% | | | | | | | | | | | | |
| | $ 1,375,000 | | | Allendale County, SC School District Energy Savings Special Obligation1 | | | 8.500 | % | | | 12/01/2018 | | | $ | 1,486,595 | |
| | 15,000 | | | Georgetown County, SC Environmental Improvement (International Paper Company)1 | | | 6.250 | | | | 09/01/2023 | | | | 15,054 | |
| | 6,988,000 | | | Hardeeville, SC Assessment Revenue (Anderson Tract Municipal Improvement District) | | | 7.750 | | | | 11/01/2039 | | | | 6,552,717 | |
| | 800,000 | | | Myrtle Beach, SC Tax Increment (Myrtle Beach Air Force Base) | | | 5.250 | | | | 11/01/2026 | | | | 724,056 | |
| | 2,000,000 | | | Myrtle Beach, SC Tax Increment (Myrtle Beach Air Force Base) | | | 5.300 | | | | 11/01/2035 | | | | 1,720,880 | |
| | 16,196,000 | | | Richland County, SC Assessment Revenue (Village at Sandhill Improvement District)1 | | | 6.200 | | | | 11/01/2036 | | | | 15,011,101 | |
| | 200,000 | | | SC Connector 2000 Assoc. Toll Road, Series B | | | 6.300 | 3 | | | 01/01/2026 | | | | 7,100 | |
| | 7,620,000 | | | SC Connector 2000 Assoc. Toll Road, Series B | | | 6.453 | 3 | | | 01/01/2020 | | | | 266,624 | |
| | 8,500,000 | | | SC Connector 2000 Assoc. Toll Road, Series B | | | 6.621 | 3 | | | 01/01/2024 | | | | 301,750 | |
| | 50,000 | | | SC Jobs-EDA (JDAM/LH/Franke Home/LS Obligated Group)1 | | | 5.650 | | | | 05/01/2018 | | | | 50,070 | |
| | 1,400,000 | | | SC Jobs-EDA (Palmetto Health)1 | | | 5.750 | | | | 08/01/2039 | | | | 1,562,316 | |
| | 10,000,000 | | | SC Public Service Authority1 | | | 5.000 | | | | 12/01/2036 | | | | 11,403,000 | |
| | | | | | | | | | | | | | | | 39,101,263 | |
| | South Dakota—0.5% | | | | | | | | | | | | |
| | 1,000,000 | | | Lower Brule, SD Sioux Tribe, Series B1 | | | 5.500 | | | | 05/01/2019 | | | | 858,140 | |
| | 33,765,000 | | | SD Educational Enhancement Funding Corp. Tobacco Settlement1 | | | 6.500 | | | | 06/01/2032 | | | | 34,946,437 | |
| | 1,425,000 | | | Turner County, SD Tax Increment1 | | | 5.000 | | | | 12/15/2026 | | | | 1,304,360 | |
| | | | | | | | | | | | | | | | 37,108,937 | |
| | Tennessee—0.2% | | | | | | | | | | | | |
| | 1,760,000 | | | Johnson City, TN H&EFB (Mountain States Health Alliance)1 | | | 5.500 | | | | 07/01/2036 | | | | 1,860,971 | |
| | 8,890,000 | | | Memphis, TN HE&HFB (NH/Mendenhall Hsg./Highland Hsg./NTH/VH Obligated Group) | | | 5.750 | | | | 04/01/2042 | | | | 6,281,941 | |
| | 215,000 | | | Memphis-Shelby County, TN Airport Authority (Express Airlines) | | | 6.125 | | | | 12/01/2016 | | | | 203,676 | |
| | 7,870,000 | | | Metropolitan Knoxville, TN Airport Authority (Northwest Airlines) | | | 8.000 | | | | 04/01/2032 | | | | 7,906,202 | |
| | 485,000 | | | Shelby County, TN HE&HF (Lapaloma Apartments) | | | 7.750 | | | | 12/01/2029 | | | | 417,095 | |
| | | | | | | | | | | | | | | | 16,669,885 | |
| | Texas—14.6% | | | | | | | | | | | | |
| | 230,000 | | | Beaumont, TX Multifamily HDC (Madison on the Lake Apartments) | | | 7.750 | | | | 12/01/2028 | | | | 207,952 | |
| | | | |
| 61 | | | | OPPENHEIMER ROCHESTER NATIONAL MUNICIPALS |
STATEMENT OF INVESTMENTS Continued
| | | | | | | | | | | | | | | | |
Principal
Amount | | | | | Coupon | | | Maturity | | | Value | |
| | Texas Continued | | | | | | | | | | | | |
| | $ 80,000 | | | Bexar County, TX HFC (American Opportunity Hsg.) | | | 7.500 | % | | | 01/01/2013 | | | $ | 78,563 | |
| | 980,000 | | | Bexar County, TX HFC (American Opportunity Hsg.) | | | 8.000 | | | | 01/01/2031 | | | | 669,095 | |
| | 1,130,000 | | | Bexar County, TX HFC (American Opportunity Hsg.-Nob Hill Apartments)2 | | | 8.500 | | | | 06/01/2031 | | | | 338,887 | |
| | 970,000 | | | Bexar County, TX HFC (Doral Club)1 | | | 8.750 | | | | 10/01/2036 | | | | 744,543 | |
| | 200,000 | | | Bexar County, TX HFC (Honey Creek LLC)2 | | | 8.000 | | | | 04/01/2030 | | | | 88,008 | |
| | 100,000 | | | Bexar County, TX HFC (Honey Creek LLC)2 | | | 9.000 | | | | 04/01/2030 | | | | 19,753 | |
| | 1,460,000 | | | Bexar County, TX HFC (Perrin Square)2 | | | 9.750 | | | | 11/20/2031 | | | | 291,985 | |
| | 41,315,000 | | | Brazos River Authority, TX Pollution Control (TXU Energy Company) | | | 5.000 | | | | 03/01/2041 | | | | 3,517,146 | |
| | 13,500,000 | | | Brazos River Authority, TX Pollution Control (TXU Energy Company) | | | 5.400 | | | | 05/01/2029 | | | | 1,317,195 | |
| | 2,345,000 | | | Brazos River Authority, TX Pollution Control (TXU Energy Company) | | | 6.300 | | | | 07/01/2032 | | | | 234,430 | |
| | 2,000,000 | | | Brazos River Authority, TX Pollution Control (TXU Energy Company) | | | 6.750 | 8 | | | 09/01/2034 | | | | 1,508,980 | |
| | 14,080,000 | | | Brazos River Authority, TX Pollution Control (TXU Energy Company) | | | 6.750 | | | | 04/01/2038 | | | | 10,623,219 | |
| | 11,420,000 | | | Brazos River Authority, TX Pollution Control (TXU Energy Company) | | | 6.750 | | | | 10/01/2038 | | | | 1,143,256 | |
| | 10,000,000 | | | Brazos River Authority, TX Pollution Control (TXU Energy Company) | | | 7.700 | | | | 03/01/2032 | | | | 1,079,100 | |
| | 28,120,000 | | | Brazos River Authority, TX Pollution Control (TXU Energy Company) | | | 7.700 | | | | 04/01/2033 | | | | 3,029,649 | |
| | 16,530,000 | | | Cambridge, TX Student Hsg. (Cambridge Student Hsg. Devel.)1 | | | 7.000 | | | | 11/01/2039 | | | | 19,227,861 | |
| | 190,000 | | | Cass County, TX IDC (International Paper Company)1 | | | 6.600 | | | | 03/15/2024 | | | | 190,737 | |
| | 6,880,000 | | | Central TX Regional Mobility Authority1 | | | 6.250 | | | | 01/01/2046 | | | | 7,998,138 | |
| | 750,000 | | | Clifton, TX Higher Education Finance Corp. (Idea Public Schools)1 | | | 5.750 | | | | 08/15/2041 | | | | 831,315 | |
| | 3,875,000 | | | Dallas-Fort Worth, TX International Airport5 | | | 5.000 | | | | 11/01/2035 | | | | 3,878,510 | |
| | 5,000 | | | Dallas-Fort Worth, TX International Airport1 | | | 5.750 | | | | 11/01/2030 | | | | 5,011 | |
| | 305,000 | | | Dallas-Fort Worth, TX International Airport Facility (American Airlines)2 | | | 8.250 | | | | 11/01/2036 | | | | 198,869 | |
| | 22,100,000 | | | Dallas-Fort Worth, TX International Airport Facility Improvement Corp.2 | | | 9.000 | | | | 05/01/2029 | | | | 10,291,086 | |
| | 40,945,000 | | | Dallas-Fort Worth, TX International Airport Facility Improvement Corp.2 | | | 9.125 | | | | 05/01/2029 | | | | 19,079,142 | |
| | 2,115,000 | | | Danbury, TX Higher Education Finance Corp. (Island Foundation) | | | 6.250 | | | | 02/15/2036 | | | | 2,074,096 | |
| | | | |
| 62 | | | | OPPENHEIMER ROCHESTER NATIONAL MUNICIPALS |
| | | | | | | | | | | | | | | | |
Principal
Amount | | | | | Coupon | | | Maturity | | | Value | |
| | Texas Continued | | | | | | | | | | | | |
| | $ 240,000 | | | Decatur, TX Hospital Authority (Wise Regional Health System)1 | | | 5.625 | % | | | 09/01/2013 | | | $ | 249,780 | |
| | 22,950,000 | | | Donna, TX GO1 | | | 6.250 | | | | 02/15/2037 | | | | 21,864,465 | |
| | 50,000 | | | Gainesville, TX Hsg. Authority1 | | | 6.800 | | | | 12/01/2020 | | | | 50,008 | |
| | 935,000 | | | Grapevine, TX IDC (Air Cargo) | | | 6.500 | | | | 01/01/2024 | | | | 935,739 | |
| | 25,000 | | | Gulf Coast, TX IDA (Citgo Petroleum Corp.)1 | | | 7.500 | | | | 05/01/2025 | | | | 25,119 | |
| | 11,238,709 | | | Gulf Coast, TX IDA (Microgy Holdings)2 | | | 7.000 | | | | 12/01/2036 | | | | 106,880 | |
| | 20,000 | | | Gulf Coast, TX IDA Solid Waste (Citgo Petroleum Corp.)1 | | | 8.000 | | | | 04/01/2028 | | | | 20,034 | |
| | 3,225,000 | | | Harris County, TX Cultural Education Facilities Finance Corp. (Space Center Houston)1 | | | 7.000 | | | | 08/15/2028 | | | | 3,510,380 | |
| | 1,510,000 | | | Harris County, TX HFC (Copperwood Ranch Apartments)1 | | | 5.450 | | | | 12/01/2023 | | | | 1,520,781 | |
| | 1,750,000 | | | HFDC of Central TX (Legacy at Willow Bend Retirement Community)1 | | | 5.625 | | | | 11/01/2026 | | | | 1,775,743 | |
| | 2,750,000 | | | HFDC of Central TX (Legacy at Willow Bend Retirement Community)1 | | | 5.750 | | | | 11/01/2036 | | | | 2,761,028 | |
| | 2,000,000 | | | HFDC of Central TX (Lutheran Social Services of the South) | | | 6.875 | | | | 02/15/2032 | | | | 2,034,680 | |
| | 7,940,000 | | | Houston, TX Airport Special Facilities (Continental Airlines)1 | | | 5.700 | | | | 07/15/2029 | | | | 7,898,791 | |
| | 7,290,000 | | | Houston, TX Airport Special Facilities (Continental Airlines)1 | | | 5.700 | | | | 07/15/2029 | | | | 7,252,165 | |
| | 12,740,000 | | | Houston, TX Airport Special Facilities (Continental Airlines)1 | | | 6.125 | | | | 07/15/2017 | | | | 12,720,763 | |
| | 20,245,000 | | | Houston, TX Airport Special Facilities (Continental Airlines) | | | 6.125 | | | | 07/15/2027 | | | | 20,243,178 | |
| | 18,755,000 | | | Houston, TX Airport Special Facilities (Continental Airlines) | | | 6.125 | | | | 07/15/2027 | | | | 18,753,312 | |
| | 100,000 | | | Houston, TX Airport Special Facilities (Continental Airlines)1 | | | 7.000 | | | | 07/01/2029 | | | | 100,431 | |
| | 3,520,000 | | | Houston, TX Airport Special Facilities (Continental Airlines) | | | 7.375 | | | | 07/01/2022 | | | | 3,535,206 | |
| | 2,000,000 | | | Houston, TX Airport System1 | | | 5.000 | | | | 07/01/2024 | | | | 2,288,140 | |
| | 1,210,000 | | | Houston, TX Airport System1 | | | 5.000 | | | | 07/01/2025 | | | | 1,376,762 | |
| | 555,000 | | | Houston, TX Airport System1 | | | 5.000 | | | | 07/01/2026 | | | | 626,667 | |
| | 815,000 | | | Houston, TX Higher Education Finance Corp. (Cosmos Foundation)1 | | | 6.500 | | | | 05/15/2031 | | | | 984,153 | |
| | 500,000 | | | Houston, TX Higher Education Finance Corp. (Ninos)1 | | | 6.000 | | | | 08/15/2036 | | | | 519,340 | |
| | 750,000 | | | Houston, TX Higher Education Finance Corp. (Ninos)1 | | | 6.000 | | | | 08/15/2041 | | | | 773,588 | |
| | 440,000 | | | Houston, TX IDC (Air Cargo) | | | 6.375 | | | | 01/01/2023 | | | | 440,343 | |
| | | | |
| 63 | | | | OPPENHEIMER ROCHESTER NATIONAL MUNICIPALS |
STATEMENT OF INVESTMENTS Continued
| | | | | | | | | | | | | | | | |
Principal
Amount | | | | | Coupon | | | Maturity | | | Value | |
| | Texas Continued | | | | | | | | | | | | |
| | $ 11,400,000 | | | Houston, TX Utility System1 | | | 5.000 | % | | | 11/15/2033 | | | $ | 13,220,466 | |
| | 10,000,000 | | | La Vernia, TX Higher Education Finance Corp.1 | | | 7.125 | | | | 02/15/2038 | | | | 11,468,300 | |
| | 1,945,000 | | | Lubbock, TX HFC (Las Colinas Quail Creek Apartments)1 | | | 6.000 | | | | 07/01/2032 | | | | 1,804,396 | |
| | 1,800,000 | | | Maverick County, TX GO COP | | | 8.750 | | | | 03/01/2034 | | | | 1,812,924 | |
| | 6,110,000 | | | Maverick County, TX GO COP | | | 8.750 | | | | 03/01/2034 | | | | 6,153,870 | |
| | 610,000 | | | Midlothian, TX Devel. Authority Tax Increment1 | | | 5.125 | | | | 11/15/2026 | | | | 612,050 | |
| | 750,000 | | | Newark, TX Cultural Education Facilities Finance Corp.1 | | | 7.250 | | | | 08/15/2021 | | | | 801,518 | |
| | 3,855,000 | | | Newark, TX Cultural Education Facilities Finance Corp.1 | | | 8.250 | | | | 08/15/2031 | | | | 4,169,221 | |
| | 8,605,000 | | | Newark, TX Cultural Education Facilities Finance Corp.1 | | | 8.500 | | | | 08/15/2041 | | | | 9,333,930 | |
| | 1,600,000 | | | North Central TX HFC (Village Kaufman Apartments)1 | | | 6.150 | | | | 01/01/2043 | | | | 1,623,872 | |
| | 38,000,000 | | | North Central TX HFDC (Children’s Medical Center)5 | | | 5.750 | | | | 08/15/2039 | | | | 43,305,560 | |
| | 55,610,000 | | | North TX Tollway Authority5 | | | 5.500 | | | | 09/01/2041 | | | | 66,176,456 | |
| | 16,000,000 | | | North TX Tollway Authority1 | | | 5.750 | | | | 01/01/2048 | | | | 18,321,920 | |
| | 5,920,000 | | | North TX Tollway Authority1 | | | 5.750 | | | | 01/01/2048 | | | | 6,779,110 | |
| | 2,130,000 | | | Sabine Neches, TX HFC (Fox Run Apartments)1 | | | 6.150 | | | | 01/01/2043 | | | | 2,146,508 | |
| | 3,895,835 | | | Sabine Neches, TX HFC (Single Family Mtg.)5 | | | 5.430 | 8 | | | 12/01/2039 | | | | 4,273,994 | |
| | 4,100,000 | | | Sabine River, TX Authority Pollution Control (TXU Electric Company) | | | 6.150 | | | | 08/01/2022 | | | | 411,025 | |
| | 1,800,000 | | | Sabine River, TX Authority Pollution Control (TXU Electric Company) | | | 6.450 | | | | 06/01/2021 | | | | 180,108 | |
| | 10,000,000 | | | San Jacinto, TX Community College District5 | | | 5.125 | | | | 02/15/2038 | | | | 11,012,500 | |
| | 5,510,000 | | | Springhill, TX Courtland Heights Public Facility Corp. | | | 5.850 | | | | 12/01/2028 | | | | 3,457,635 | |
| | 14,000,000 | | | Tarrant County, TX Cultural Education Facilities Finance Corp. (Baylor Health Care System)5 | | | 5.750 | | | | 11/15/2024 | | | | 16,540,860 | |
| | 34,000,000 | | | Tarrant County, TX Cultural Education Facilities Finance Corp. (Baylor Health Care System)5 | | | 6.250 | | | | 11/15/2029 | | | | 40,170,660 | |
| | 3,810,000 | | | Tarrant County, TX Cultural Education Facilities Finance Corp. (Buckingham Senior Living Community)1 | | | 5.750 | | | | 11/15/2037 | | | | 3,933,901 | |
| | 13,500,000 | | | Tarrant County, TX Health Facilities Devel. Corp. (Cook Childrens Medical Center)5 | | | 5.000 | | | | 12/01/2033 | | | | 14,877,135 | |
| | 27,525,000 | | | Travis County, TX HFDC (Longhorn Village) | | | 7.125 | | | | 01/01/2046 | | | | 28,866,293 | |
| | 1,600,000 | | | Travis County, TX HFDC (Querencia Barton Creek)1 | | | 5.650 | | | | 11/15/2035 | | | | 1,609,648 | |
| | 2,495,000 | | | Trinity, TX River Authority (TXU Energy Company) | | | 6.250 | | | | 05/01/2028 | | | | 249,650 | |
| | | | |
| 64 | | | | OPPENHEIMER ROCHESTER NATIONAL MUNICIPALS |
| | | | | | | | | | | | | | | | |
Principal
Amount | | | | | Coupon | | | Maturity | | | Value | |
| | Texas Continued | | | | | | | | | | | | |
| | $ 20,500,000 | | | Trophy Club, TX Public Improvement (Highlands Trophy Club)1 | | | 7.750 | % | | | 10/01/2037 | | | $ | 20,927,630 | |
| | 6,170,000 | | | TX Affordable Hsg. Corp. (South Texas Affordable Properties Corp.)2 | | | 8.000 | | | | 03/01/2032 | | | | 617,062 | |
| | 34,600,000 | | | TX Angelina & Neches River Authority (Aspen Power) | | | 6.500 | | | | 11/01/2029 | | | | 29,998,200 | |
| | 250,000 | | | TX Angelina & Neches River Authority Waste Disposal (Temple-Inland)1 | | | 6.950 | | | | 05/01/2023 | | | | 258,518 | |
| | 11,000,000 | | | TX GO (College Student Loan)1 | | | 5.000 | | | | 08/01/2036 | | | | 12,505,460 | |
| | 321,760,000 | | | TX Municipal Gas Acquisition & Supply Corp.5 | | | 6.250 | | | | 12/15/2026 | | | | 391,449,540 | |
| | 1,000,000 | | | TX Municipal Gas Acquisition & Supply Corp.1 | | | 6.250 | | | | 12/15/2026 | | | | 1,216,590 | |
| | 1,600,000 | | | TX Public Finance Authority Charter School Finance Corp. (Ed-Burnham Wood)1 | | | 6.250 | | | | 09/01/2036 | | | | 1,627,360 | |
| | 635,000 | | | TX Student Hsg. Corp. (University of North Texas)1 | | | 6.750 | | | | 07/01/2021 | | | | 523,418 | |
| | 200,000 | | | TX Student Hsg. Corp. (University of North Texas)1 | | | 6.850 | | | | 07/01/2031 | | | | 155,196 | |
| | 13,210,000 | | | TX Turnpike Authority (Central TX Turnpike System)1 | | | 5.500 | | | | 08/15/2039 | | | | 13,314,227 | |
| | 2,115,000 | | | Vintage Township, TX Public Facilities Corp.1 | | | 7.375 | | | | 10/01/2038 | | | | 2,162,143 | |
| | 638,000 | | | Vintage Township, TX Public Facilities Corp.1 | | | 7.375 | | | | 10/01/2038 | | | | 652,221 | |
| | 2,920,000 | | | Wise County, TX (Parket County Junior College District)1 | | | 7.500 | | | | 08/15/2025 | | | | 3,245,755 | |
| | 4,615,000 | | | Wise County, TX (Parket County Junior College District)1 | | | 7.750 | | | | 08/15/2028 | | | | 5,170,277 | |
| | | | | | | | | | | | | | | | 998,171,109 | |
| | U.S. Possessions—6.9% | | | | | | | | | | | | |
| | 11,700,000 | | | Guam Government Business Privilege1 | | | 5.125 | | | | 01/01/2042 | | | | 13,010,283 | |
| | 1,300,000 | | | Guam Government Business Privilege1 | | | 5.250 | | | | 01/01/2036 | | | | 1,459,497 | |
| | 1,500,000 | | | Guam Government Department of Education COP (John F. Kennedy High School)1 | | | 6.625 | | | | 12/01/2030 | | | | 1,634,670 | |
| | 2,200,000 | | | Guam Government Department of Education COP (John F. Kennedy High School)1 | | | 6.875 | | | | 12/01/2040 | | | | 2,411,684 | |
| | 500,000 | | | Northern Mariana Islands Commonwealth, Series A1 | | | 6.750 | | | | 10/01/2033 | | | | 500,530 | |
| | 34,365,000 | | | Puerto Rico Aqueduct & Sewer Authority1 | | | 5.250 | | | | 07/01/2042 | | | | 35,231,342 | |
| | 26,550,000 | | | Puerto Rico Aqueduct & Sewer Authority1 | | | 5.750 | | | | 07/01/2037 | | | | 28,574,703 | |
| | 23,000,000 | | | Puerto Rico Aqueduct & Sewer Authority1 | | | 6.000 | | | | 07/01/2047 | | | | 25,204,090 | |
| | 1,430,000 | | | Puerto Rico Commonwealth GO1 | | | 5.000 | | | | 07/01/2041 | | | | 1,447,232 | |
| | 72,305,000 | | | Puerto Rico Commonwealth GO1 | | | 5.500 | | | | 07/01/2039 | | | | 76,346,126 | |
| | 11,540,000 | | | Puerto Rico Commonwealth GO1 | | | 5.750 | | | | 07/01/2036 | | | | 12,400,769 | |
| | 4,650,000 | | | Puerto Rico Commonwealth GO1 | | | 6.500 | | | | 07/01/2037 | | | | 5,323,553 | |
| | | | |
| 65 | | | | OPPENHEIMER ROCHESTER NATIONAL MUNICIPALS |
STATEMENT OF INVESTMENTS Continued
| | | | | | | | | | | | | | | | |
Principal
Amount | | | | | Coupon | | | Maturity | | | Value | |
| | U.S. Possessions Continued | | | | | | | | | | | | |
| | $ 3,000,000 | | | Puerto Rico Commonwealth GO1 | | | 6.500 | % | | | 07/01/2040 | | | $ | 3,504,990 | |
| | 10,000,000 | | | Puerto Rico Commonwealth GO1 | | | 6.500 | | | | 07/01/2040 | | | | 11,683,300 | |
| | 4,430,000 | | | Puerto Rico Electric Power Authority, Series AAA1 | | | 5.250 | | | | 07/01/2026 | | | | 4,854,394 | |
| | 3,700,000 | | | Puerto Rico Highway & Transportation Authority1 | | | 5.250 | | | | 07/01/2035 | | | | 4,046,579 | |
| | 6,415,000 | | | Puerto Rico Highway & Transportation Authority | | | 5.300 | | | | 07/01/2035 | | | | 6,716,377 | |
| | 605,000 | | | Puerto Rico Highway & Transportation Authority, Series H1 | | | 5.450 | | | | 07/01/2035 | | | | 636,521 | |
| | 500,000 | | | Puerto Rico ITEMECF (Cogeneration Facilities)1 | | | 6.625 | | | | 06/01/2026 | | | | 502,010 | |
| | 3,000,000 | | | Puerto Rico ITEMECF (Hospital Auxilio Mutuo)1 | | | 6.000 | | | | 07/01/2033 | | | | 3,411,210 | |
| | 34,600,000 | | | Puerto Rico Public Buildings Authority1 | | | 5.250 | | | | 07/01/2042 | | | | 35,390,610 | |
| | 36,500,000 | | | Puerto Rico Public Finance Corp., Series B1 | | | 5.500 | | | | 08/01/2031 | | | | 39,982,830 | |
| | 9,560,000 | | | Puerto Rico Sales Tax Financing Corp., Series A1 | | | 5.250 | | | | 08/01/2027 | | | | 10,905,761 | |
| | 37,610,000 | | | Puerto Rico Sales Tax Financing Corp., Series A5 | | | 5.250 | | | | 08/01/2057 | | | | 40,000,729 | |
| | 16,820,000 | | | Puerto Rico Sales Tax Financing Corp., Series A1 | | | 5.500 | | | | 08/01/2042 | | | | 18,152,649 | |
| | 12,005,000 | | | Puerto Rico Sales Tax Financing Corp., Series A1 | | | 5.750 | | | | 08/01/2037 | | | | 13,451,603 | |
| | 25,000,000 | | | Puerto Rico Sales Tax Financing Corp., Series A-11 | | | 5.250 | | | | 08/01/2043 | | | | 26,689,750 | |
| | 15,890,000 | | | Puerto Rico Sales Tax Financing Corp., Series C1 | | | 5.250 | | | | 08/01/2041 | | | | 16,941,441 | |
| | 17,000,000 | | | Puerto Rico Sales Tax Financing Corp., Series C5 | | | 5.750 | | | | 08/01/2057 | | | | 18,964,350 | |
| | 10,175,000 | | | Puerto Rico Sales Tax Financing Corp., Series C1 | | | 6.000 | | | | 08/01/2039 | | | | 11,687,921 | |
| | | | | | | | | | | | | | | | 471,067,504 | |
| | Utah—0.2% | | | | | | | | | | | | |
| | 6,350,000 | | | UT Charter School Finance Authority (Hawthorn Academy)1 | | | 8.250 | | | | 07/15/2046 | | | | 7,017,830 | |
| | 750,000 | | | UT Charter School Finance Authority (Vista Entrada School of Performing Arts & Technology)1 | | | 6.300 | | | | 07/15/2032 | | | | 784,155 | |
| | 1,640,000 | | | UT Charter School Finance Authority (Vista Entrada School of Performing Arts & Technology)1 | | | 6.550 | | | | 07/15/2042 | | | | 1,711,930 | |
| | 1,595,000 | | | UT HFA (RHA Community Service of Utah)1 | | | 6.875 | | | | 07/01/2027 | | | | 1,596,659 | |
| | 1,315,000 | | | Utah County, UT Charter School (Lincoln Academy) | | | 5.875 | | | | 06/15/2037 | | | | 1,223,358 | |
| | 825,000 | | | Utah County, UT Charter School (Renaissance Academy)1 | | | 5.625 | | | | 07/15/2037 | | | | 802,874 | |
| | 4,400,000 | | | West Valley City, UT Sewer (East Hollywood High School) | | | 5.625 | | | | 06/15/2037 | | | | 3,859,504 | |
| | | | | | | | | | | | | | | | 16,996,310 | |
| | Vermont—0.0% | | | | | | | | | | | | |
| | 280,000 | | | Burlington, VT Electric1 | | | 5.500 | | | | 07/01/2029 | | | | 318,772 | |
| | 315,000 | | | Burlington, VT Electric1 | | | 5.625 | | | | 07/01/2030 | | | | 359,532 | |
| | | | |
| 66 | | | | OPPENHEIMER ROCHESTER NATIONAL MUNICIPALS |
| | | | | | | | | | | | | | | | |
Principal
Amount | | | | | Coupon | | | Maturity | | | Value | |
| | Vermont Continued | | | | | | | | | | | | |
| | $ 460,000 | | | Burlington, VT Electric1 | | | 5.750 | % | | | 07/01/2031 | | | $ | 526,355 | |
| | 1,929,102 | | �� | VT Educational & Health Buildings Financing Agency (Marlboro College)1 | | | 2.779 | | | | 04/01/2019 | | | | 1,871,750 | |
| | | | | | | | | | | | | | | | 3,076,409 | |
| | Virginia—1.1% | | | | | | | | | | | | |
| | 1,875,000 | | | Celebrate, VA North Community Devel. Authority Special Assessment | | | 6.750 | | | | 03/01/2034 | | | | 1,319,588 | |
| | 14,700,000 | | | Farms New Kent, VA Community Devel. Authority Special Assessment | | | 5.125 | | | | 03/01/2036 | | | | 9,237,333 | |
| | 9,200,000 | | | Farms New Kent, VA Community Devel. Authority Special Assessment | | | 5.450 | | | | 03/01/2036 | | | | 5,775,668 | |
| | 3,206,000 | | | Farms New Kent, VA Community Devel. Authority Special Assessment | | | 5.800 | | | | 03/01/2036 | | | | 1,921,901 | |
| | 4,000,000 | | | Lewistown, VA Commerce Center Community Devel. Authority | | | 6.050 | | | | 03/01/2027 | | | | 2,322,720 | |
| | 3,000,000 | | | New Port, VA CDA | | | 5.600 | | | | 09/01/2036 | | | | 1,801,980 | |
| | 2,050,000 | | | Norfolk, VA EDA, Series A | | | 6.000 | | | | 11/01/2036 | | | | 1,594,818 | |
| | 410,000 | | | Norfolk, VA Redevel. & Hsg. Authority (First Mtg.-Retirement Community) | | | 6.125 | | | | 01/01/2035 | | | | 411,304 | |
| | 21,446,000 | | | Peninsula, VA Town Center Community Devel. Authority Special Obligation1 | | | 6.450 | | | | 09/01/2037 | | | | 22,776,295 | |
| | 5,100,000 | | | VA Celebrate South CDA Special Assessment | | | 6.250 | | | | 03/01/2037 | | | | 3,164,499 | |
| | 3,400,000 | | | VA H2O Community Devel. Authority | | | 5.200 | | | | 09/01/2037 | | | | 2,058,496 | |
| | 9,770,000 | | | VA Small Business Financing Authority (Hampton Roads Proton) | | | 9.000 | | | | 07/01/2039 | | | | 10,604,065 | |
| | 228,700,000 | | | VA Tobacco Settlement Authority | | | 7.075 | 3 | | | 06/01/2047 | | | | 5,321,849 | |
| | 6,000,000 | | | VA Tobacco Settlement Financing Corp.1 | | | 5.200 | | | | 06/01/2046 | | | | 4,368,240 | |
| | 2,500,000 | | | West Point, VA IDA Solid Waste (Chesapeake Corp.)2 | | | 6.375 | | | | 03/01/2019 | | | | 150 | |
| | | | | | | | | | | | | | | | 72,678,906 | |
| | Washington—2.7% | | | | | | | | | | | | |
| | 25,000 | | | King County, WA Hsg. Authority (Cascadian Apartments)1 | | | 6.800 | | | | 07/01/2019 | | | | 25,318 | |
| | 10,000 | | | King County, WA Hsg. Authority (Kona Village)1 | | | 6.700 | | | | 01/01/2020 | | | | 10,008 | |
| | 125,000 | | | King County, WA Hsg. Authority (Southwood Square Apartments)1 | | | 6.100 | | | | 10/01/2021 | | | | 125,050 | |
| | 725,000 | | | King County, WA Hsg. Authority (Southwood Square Apartments)1 | | | 6.200 | | | | 10/01/2031 | | | | 725,065 | |
| | 20,000 | | | King County, WA Hsg. Authority (Woodridge Park)1 | | | 6.250 | | | | 05/01/2015 | | | | 20,172 | |
| | 50,000 | | | King County, WA Hsg. Authority (Woodridge Park)1 | | | 6.350 | | | | 05/01/2025 | | | | 50,334 | |
| | | | |
| 67 | | | | OPPENHEIMER ROCHESTER NATIONAL MUNICIPALS |
STATEMENT OF INVESTMENTS Continued
| | | | | | | | | | | | | | | | |
Principal
Amount | | | | | Coupon | | | Maturity | | | Value | |
| | Washington Continued | | | | | | | | | | | | |
| | $ 1,680,000 | | | Kitsap County, WA Consolidated Hsg. Authority1 | | | 5.500 | % | | | 06/01/2027 | | | $ | 1,563,761 | |
| | 2,350,000 | | | Kitsap County, WA Consolidated Hsg. Authority1 | | | 5.600 | | | | 06/01/2037 | | | | 2,189,143 | |
| | 50,000 | | | Kitsap County, WA Consolidated Hsg. Authority (Heritage Apartments)1 | | | 6.100 | | | | 10/01/2031 | | | | 46,834 | |
| | 36,900,000 | | | Port of Seattle, WA5 | | | 5.000 | | | | 10/01/2032 | | | | 39,193,925 | |
| | 5,000,000 | | | Port of Seattle, WA Special Facility (Northwest Airlines) | | | 7.125 | | | | 04/01/2020 | | | | 5,000,300 | |
| | 8,200,000 | | | Port of Seattle, WA Special Facility (Northwest Airlines) | | | 7.250 | | | | 04/01/2030 | | | | 8,200,410 | |
| | 2,305,000 | | | Snohomish County, WA Hsg. Authority (Westwood Crossing Apartments)1 | | | 5.250 | | | | 05/01/2037 | | | | 2,018,996 | |
| | 100,000 | | | Snohomish County, WA Hsg. Authority (Whispering Pines Apartments)1 | | | 5.100 | | | | 09/01/2015 | | | | 99,585 | |
| | 1,675,000 | | | Snohomish County, WA Hsg. Authority (Whispering Pines Apartments)1 | | | 5.600 | | | | 09/01/2025 | | | | 1,604,516 | |
| | 1,250,000 | | | Snohomish County, WA Hsg. Authority (Whispering Pines Apartments)1 | | | 5.750 | | | | 09/01/2030 | | | | 1,186,675 | |
| | 1,500,000 | | | Tes Properties, WA5 | | | 5.500 | | | | 12/01/2029 | | | | 1,719,600 | |
| | 12,000,000 | | | Tes Properties, WA5 | | | 5.625 | | | | 12/01/2038 | | | | 13,603,560 | |
| | 18,075,000 | | | WA Health Care Facilities Authority (Catholic Health Initiatives)1 | | | 6.375 | | | | 10/01/2036 | | | | 21,654,031 | |
| | 19,500,000 | | | WA Health Care Facilities Authority (Peacehealth)5 | | | 5.000 | | | | 11/01/2018 | | | | 22,830,405 | |
| | 17,410,000 | | | WA Health Care Facilities Authority (Peacehealth)5 | | | 5.000 | | | | 11/01/2028 | | | | 18,935,818 | |
| | 15,000,000 | | | WA Health Care Facilities Authority (Seattle Childrens Hospital)5 | | | 5.625 | | | | 10/01/2038 | | | | 17,121,600 | |
| | 10,860,000 | | | WA Kalispel Tribe Indians Priority District1 | | | 6.750 | | | | 01/01/2038 | | | | 9,489,142 | |
| | 14,285,000 | | | WA Tobacco Settlement Authority (TASC)1 | | | 6.625 | | | | 06/01/2032 | | |
| 14,834,258
|
|
| | | | | | | | | | | | | | | | 182,248,506 | |
| | West Virginia—0.6% | | | | | | | | | | | | |
| | 3,000,000 | | | Brooke County, WV (Bethany College)1 | | | 6.500 | | | | 10/01/2031 | | | | 3,459,030 | |
| | 4,500,000 | | | Brooke County, WV (Bethany College)1 | | | 6.750 | | | | 10/01/2037 | | | | 5,187,510 | |
| | 13,435,000 | | | Harrison County, WV Tax Increment (Charles Pointe) | | | 7.000 | | | | 06/01/2028 | | | | 12,997,422 | |
| | 1,840,000 | | | Harrison County, WV Tax Increment (Charles Pointe)1 | | | 7.000 | | | | 06/01/2035 | | | | 1,852,843 | |
| | 13,710,000 | | | Harrison County, WV Tax Increment (Charles Pointe) | | | 7.000 | | | | 06/01/2035 | | | | 12,752,905 | |
| | 3,045,000 | | | WV Hospital Finance Authority (UTD Health System)1 | | | 5.500 | | | | 06/01/2039 | | |
| 3,347,064
|
|
| | | | | | | | | | | | | | | | 39,596,774 | |
| | | | |
| 68 | | | | OPPENHEIMER ROCHESTER NATIONAL MUNICIPALS |
| | | | | | | | | | | | | | | | |
Principal
Amount | | | | | Coupon | | | Maturity | | | Value | |
| | Wisconsin—0.5% | | | | | | | | | | | | |
| | $ 560,000 | | | Milwaukee, WI (Aero Milwaukee) | | | 6.500 | % | | | 01/01/2025 | | | $ | 560,454 | |
| | 1,195,000 | | | Milwaukee, WI (Air Cargo)1 | | | 7.500 | | | | 01/01/2025 | | | | 1,195,777 | |
| | 3,970,000 | | | Necedah, WI Community Devel. Authority Exempt Facility (Castle Rock Renewable Fuels) | | | 7.500 | | | | 03/01/2018 | | | | 2,863,482 | |
| | 1,750,000 | | | Sokaogon, WI Chippewa Community (Gaming)2 | | | 7.000 | | | | 01/01/2026 | | | | 787,220 | |
| | 1,800,000 | | | Sokaogon, WI Chippewa Community (Gaming)2 | | | 8.250 | | | | 01/01/2017 | | | | 809,712 | |
| | 3,000,000 | | | WI H&EFA (AE Nursing Centers) | | | 7.250 | | | | 06/01/2038 | | | | 3,230,790 | |
| | 10,000,000 | | | WI H&EFA (AHCG/SVH/SVE Obligated Group)5 | | | 5.000 | | | | 11/15/2033 | | | | 11,103,200 | |
| | 750,000 | | | WI H&EFA (Beloit College)1 | | | 6.125 | | | | 06/01/2035 | | | | 846,008 | |
| | 2,015,000 | | | WI H&EFA (Beloit College)1 | | | 6.125 | | | | 06/01/2039 | | | | 2,265,223 | |
| | 1,000,000 | | | WI H&EFA (Eastcastle Place) | | | 6.125 | | | | 12/01/2034 | | | | 556,030 | |
| | 7,335,000 | | | WI H&EFA (Wellington Homes) | | | 6.750 | | | | 09/01/2037 | | | | 7,530,551 | |
| | 2,385,000 | | | WI H&EFA (Wisconsin Illinois Senior Hsg.) | | | 5.800 | | | | 08/01/2029 | | | | 2,406,083 | |
| | 660,000 | | | WI Public Finance Authority (Thomas Jefferson Classical Academy)1 | | | 7.000 | | | | 07/01/2031 | | | | 726,634 | |
| | 1,325,000 | | | WI Public Finance Authority Charter School (Explore Knowledge Foundation)1 | | | 5.750 | | | | 07/15/2032 | | | | 1,350,096 | |
| | 845,000 | | | WI Public Finance Authority Charter School (Explore Knowledge Foundation)1 | | | 6.000 | | | | 07/15/2042 | | |
| 852,529
|
|
| | | | | | | | | | | | | | |
| 37,083,789
|
|
| | Total Municipal Bonds and Notes (Cost $8,766,768,004) | | | | | | | | 8,122,445,573 | |
| | Corporate Bonds and Notes—0.1% | | | | | | | | | | | | |
| | 10,231,044 | | | Delta Air Lines, Inc., Sr. Unsec. Nts.13 (Cost $10,128,735) | | | 8.000 | | | | 12/01/2015 | | | | 9,992,968 | |
| | | | |
| Shares | | | | | | | | | | | | |
| | Common Stocks—0.0% | | | | | | | | | | | | |
| | 1,111 | | | Converted Organics, Inc.13,14 | | | | | | | | | | | 3 | |
| | 7,679 | | | Delta Air Lines, Inc.13,14 | | | | | | | | | | | 74,102 | |
| | 59,830 | | | General Motors Co.13,14 | | | | | | | | | | | 1,179,249 | |
| | Total Common Stocks (Cost $9,860,298) | | | | | | | | 1,253,354 | |
| | Preferred Stocks—0.0% | | | | | | | | | | | | |
| | 9,486 | | | Converted Organics, Inc., Series A13,14 (Cost $9,486,000) | | | | | | | | | | | 6 | |
| | | | |
| 69 | | | | OPPENHEIMER ROCHESTER NATIONAL MUNICIPALS |
STATEMENT OF INVESTMENTS Continued
| | | | | | | | | | | | | | | | |
| | | | |
| Units | | | | | Strike Price | | | Expiration | | | Value | |
| | Rights, Warrants, and Certificates—0.0% | | | | | | | | | | | | |
| | 54,392 | | | General Motors Co. Wts.13,14 | | $ | 10.000 | | | | 07/10/2016 | | | $ | 600,488 | |
| | 54,392 | | | General Motors Co. Wts.13,14 | | | 18.330 | | | | 07/10/2019 | | | | 366,602 | |
| | | | | | | | | | | | | | |
|
|
|
| | Total Rights, Warrants, and Certificates (Cost $7,679,687) | | | | | | | | | | | 967,090 | |
| | Total Investments, at Value (Cost $8,803,922,724)—119.0% | | | | | | | | | | | 8,134,658,991 | |
| | Liabilities in Excess of Other Assets—(19.0) | | | | | | | | | | | (1,301,447,793 | ) |
| | | | | | | | | | | | | | |
|
|
|
| | Net Assets—100.0% | | | | | | | | | | $ | 6,833,211,198 | |
| | | | | | | | | | | | | | |
|
|
|
Footnotes to Statement of Investments
1. All or a portion of the security position has been segregated for collateral to cover borrowings. See Note 7 of the accompanying Notes.
2. This security is not accruing income because the issuer has missed an interest payment on it and/or is not anticipated to make future interest and/or principal payments. The rate shown is the original contractual interest rate. See Note 1 of the accompanying Notes.
3. Zero coupon bond reflects effective yield on the date of purchase.
4. This security is accruing partial income at an anticipated effective rate based on expected interest and/or principal payments. The rate shown is the original contractual interest rate.
5. Security represents the underlying municipal bond with respect to an inverse floating rate security held by the Fund. The bond was purchased by the Fund and subsequently transferred to a trust, which issued the related inverse floating rate security. See Note 1 of the accompanying Notes.
6. All or a portion of the security position is when-issued or delayed delivery to be delivered and settled after July 31, 2012. See Note 1 of the accompanying Notes.
7. Denotes a step bond: a zero coupon bond that converts to a fixed or variable interest rate at a designated future date.
8. Represents the current interest rate for a variable or increasing rate security.
9. Represents securities sold under Rule 144A, which are exempt from registration under the Securities Act of 1933, as amended. These securities have been determined to be liquid under guidelines established by the Board of Trustees. These securities amount to $2,365,380 or 0.03% of the Fund’s net assets as of July 31, 2012.
10. Subject to a forbearance agreement. Rate shown is the original contractual interest rate. See Note 1 of the accompanying Notes.
11. Restricted security. The aggregate value of restricted securities as of July 31, 2012 was $41,566,566, which represents 0.61% of the Fund’s net assets. See Note 6 of the accompanying Notes. Information concerning restricted securities is as follows:
| | | | | | | | | | | | | | | | |
| Security | | Acquisition
Dates | | | Cost | | | Value | | | Unrealized
Appreciation | |
| IL Finance Authority (Sedgebrook) | | | 5/20/09 | | | $ | — | | | $ | 20 | | | $ | 20 | |
| IL Finance Authority (Sedgebrook) | | | 6/9/09 | | | | — | | | | 90 | | | | 90 | |
| IL Finance Authority (Sedgebrook) | | | 8/17/07-5/19/09 | | | | — | | | | 85 | | | | 85 | |
NY Liberty Devel. Corp.
(Bank of America Tower) | | | 7/23/10-3/4/11 | | | | 37,403,862 | | | | 41,566,371 | | | | 4,162,509 | |
| | | | | | |
|
|
| |
|
|
| |
|
|
|
| | | | | | | $ | 37,403,862 | | | $ | 41,566,566 | | | $ | 4,162,704 | |
| | | | | | |
|
|
| |
|
|
| |
|
|
|
12. Represents the current interest rate for an inverse floating rate security. See Note 1 of the accompanying Notes.
13. Received as a result of a corporate action.
14. Non-income producing security.
| | | | |
| 70 | | | | OPPENHEIMER ROCHESTER NATIONAL MUNICIPALS |
To simplify the listings of securities, abbreviations are used per the table below:
| | |
| ABH | | Adventist Bolingbrook Hospital |
| ACMC | | Advocate Condell Medical Center |
| AE | | American Eagle |
| AGH | | Adventist Glenoaks Hospital |
| AH | | Ascension Health |
| AHACHC | | ARC/HDS Alamance County Housing Corp. |
| AHCG | | Ascension Health Credit Group |
| AHCN | | Advocate Health Care Network |
| AH&HC | | Advocate Health & Hospitals Corp. |
| AHSGA | | Adventist Health System-Georgia |
| ANSHN | | Advocate North Side Health Network |
| AUS | | Allegheny United Hospital |
| BHI | | Baptist Homes of Indiana |
| BVHF | | Blanchard Valley Health Foundation |
| BVRHC | | Blanchard Valley Regional Health Center |
| CAB | | Capital Appreciation Bond |
| CDA | | Communities Devel. Authority |
| CDHA | | Central Dupage Hospital Association |
| CDHS | | Central Dupage Health System |
| CFGH | | Central Florida Group Homes |
| CLC | | Christian Living Communities |
| CLCSF | | Christian Living Communities Stewardship Fund |
| CMH | | Copley Memorial Hospital |
| COP | | Certificates of Participation |
| CSAHS | | The Sisters of Charity of St. Augustine Health System |
| DA | | Dormitory Authority |
| DRIVERS | | Derivative Inverse Tax Exempt Receipts |
| EBC | | Engel Berman Corp. |
| EDA | | Economic Devel. Authority |
| EDC | | Economic Devel. Corp. |
| EDFA | | Economic Devel. Finance Authority |
| EF&CD | | Environmental Facilities and Community Devel. |
| GJSR | | Gurwin Jewish Senior Residences |
| GO | | General Obligation |
| H&EFA | | Health and Educational Facilities Authority |
| H&EFB | | Health and Educational Facilities Board |
| H&HEFA | | Hospitals and Higher Education Facilities Authority |
| HDC | | Housing Devel. Corp. |
| HE&HF | | Higher Educational and Housing Facilities |
| HE&HFA | | Higher Education and Health Facilities Authority |
| | |
| HE&HFB | | Health Educational and Housing Facility Board |
| HEFA | | Higher Education Facilities Authority |
| HEFFA | | Higher Educational Facilities Finance Authority |
| HFA | | Housing Finance Agency |
| HFC | | Housing Finance Corp. |
| HFDC | | Health Facilities Devel. Corp. |
| HHlthS | | Holzer Health Systems |
| HMCG | | Holzer Medical Center-Gallipolis |
| HMCJ | | Holzer Medical Center-Jackson |
| HUHS | | Hahnemann University Hospital System |
| IDA | | Industrial Devel. Agency |
| IDC | | Industrial Devel. Corp. |
| IFPCFA | | Industrial Facilities and Pollution Control Financing Authority |
| ITEMECF | | Industrial, Tourist, Educational, Medical and Environmental Community Facilities |
| JDAM | | Julia Dyckman Andrus Memorial |
| JFK | | John Fitzgerald Kennedy |
| JGCCF | | Jewish Geriatric & Convalescent Center Foundation |
| KGC | | Kuakini Geriatric Care |
| KHS | | Kuakini Health System |
| KMC | | Kuakini Medical Center |
| KSS | | Kuakini Support Services |
| L.I. | | Long Island |
| LH | | Lowman Home |
| LS | | Lutheran Services |
| MCP | | Medical College Of Pennsylvania |
| M-S-R | | Modesto Irrigation District of the City of Santa Clara and the City of Redding |
| NH | | Northgate Housing |
| NTH | | North Terrace Housing |
| NY/NJ | | New York/New Jersey |
| NYC | | New York City |
| NYS | | New York State |
| PHC | | Piedmont Healthcare |
| PHF | | Piedmont Hospital Foundation |
| RCF | | Rush-Copley Foundation |
| RCMC | | Rush-Copley Medical Center |
| RHA | | Resource Healthcare of America |
| RITES | | Residual Interest Tax Exempt Securities |
| RUMC | | Rush University Medical Center |
| Res Rec | | Resource Recovery Facility |
| ROLs | | Residual Option Longs |
| SJHCN | | St. Joseph Home Care Network |
| SJHE | | St. Joseph Hospital of Eureka |
| SJHO | | St. Joseph Hospital of Orange |
| SJHS | | St. Joseph Health System |
| SVE | | St. Vincent’s East |
| | | | |
| 71 | | | | OPPENHEIMER ROCHESTER NATIONAL MUNICIPALS |
STATEMENT OF INVESTMENTS Continued
| | |
| SVH | | Saint Vincent’s Hospital |
| TASC | | Tobacco Settlement Asset-Backed Bonds |
| TYW | | The YMCA of Wichita |
| UHHS | | University Hospitals Health System |
| | |
| VH | | Village Housing |
| VS | | Village Shalom |
| VSCF | | Village Shalom Charitable Foundation |
See accompanying Notes to Financial Statements.
| | | | |
| 72 | | | | OPPENHEIMER ROCHESTER NATIONAL MUNICIPALS |
STATEMENT OF ASSETS AND LIABILITIES July 31, 2012
| | | | |
| Assets | | | |
| Investments, at value (cost $8,803,922,724)—see accompanying statement of investments | | $ | 8,134,658,991 | |
| Cash | | | 737,940 | |
| Receivables and other assets: | | | | |
| Interest | | | 110,434,780 | |
| Investments sold | | | 21,742,745 | |
| Shares of beneficial interest sold | | | 21,649,494 | |
| Other | |
| 2,724,287
|
|
| Total assets | | | 8,291,948,237 | |
| Liabilities | | | |
| Payables and other liabilities: | | | | |
| Payable for short-term floating rate notes issued (See Note 1) | | | 1,270,215,000 | |
| Payable on borrowings (See Note 7) | | | 140,000,000 | |
| Investments purchased (including $18,319,066 purchased on a when-issued or delayed delivery basis) | | | 27,302,272 | |
| Shares of beneficial interest redeemed | | | 11,360,724 | |
| Dividends | | | 7,195,835 | |
| Trustees’ compensation | | | 765,219 | |
| Distribution and service plan fees | | | 758,998 | |
| Transfer and shareholder servicing agent fees | | | 276,414 | |
| Shareholder communications | | | 108,688 | |
| Interest expense on borrowings and reverse repurchase agreements | | | 34,743 | |
| Other | |
| 719,146
|
|
| Total liabilities | | | 1,458,737,039 | |
| Net Assets | | $
| 6,833,211,198
|
|
| Composition of Net Assets | | | |
| Paid-in capital | | $ | 9,991,733,414 | |
| Accumulated net investment income | | | 15,146,585 | |
| Accumulated net realized loss on investments | | | (2,504,405,068 | ) |
| Net unrealized depreciation on investments | |
| (669,263,733
| )
|
| Net Assets | | $
| 6,833,211,198
|
|
| | | | |
| 73 | | | | OPPENHEIMER ROCHESTER NATIONAL MUNICIPALS |
STATEMENT OF ASSETS AND LIABILITIES Continued
| | | | |
| Net Asset Value Per Share | | | |
| Class A Shares: | | | | |
| Net asset value and redemption price per share (based on net assets of $4,463,155,651 and 594,864,790 shares of beneficial interest outstanding) | | $ | 7.50 | |
| Maximum offering price per share (net asset value plus sales charge of 4.75% of offering price) | | $ | 7.87 | |
| Class B Shares: | | | | |
| Net asset value, redemption price (excludes applicable contingent deferred sales charge) and offering price per share (based on net assets of $161,197,405 and 21,403,875 shares of beneficial interest outstanding) | | $ | 7.53 | |
| Class C Shares: | | | | |
| Net asset value, redemption price (excludes applicable contingent deferred sales charge) and offering price per share (based on net assets of $1,691,778,140 and 226,126,850 shares of beneficial interest outstanding) | | $ | 7.48 | |
| Class Y Shares: | | | | |
| Net asset value, redemption price and offering price per share (based on net assets of $517,080,002 and 68,974,266 shares of beneficial interest outstanding) | | $ | 7.50 | |
See accompanying Notes to Financial Statements.
| | | | |
| 74 | | | | OPPENHEIMER ROCHESTER NATIONAL MUNICIPALS |
STATEMENT OF OPERATIONS For the Year Ended July 31, 2012
| | | | |
| Investment Income | | | |
| Interest | | $ | 486,454,792 | |
| Other income | |
| 2,522
|
|
| Total investment income | | | 486,457,314 | |
| Expenses | | | |
| Management fees | | | 22,514,845 | |
| Distribution and service plan fees: | | | | |
| Class A | | | 5,961,008 | |
| Class B | | | 1,407,559 | |
| Class C | | | 13,811,968 | |
| Transfer and shareholder servicing agent fees: | | | | |
| Class A | | | 2,017,580 | |
| Class B | | | 207,092 | |
| Class C | | | 1,041,500 | |
| Class Y | | | 170,778 | |
| Shareholder communications: | | | | |
| Class A | | | 151,177 | |
| Class B | | | 13,283 | |
| Class C | | | 75,574 | |
| Class Y | | | 13,974 | |
| Interest expense and fees on short-term floating rate notes issued (See Note 1) | | | 18,416,410 | |
| Borrowing fees and reverse repurchase agreement fees | | | 6,961,423 | |
| Interest expense on borrowings and reverse repurchase agreements | | | 175,756 | |
| Trustees’ compensation | | | 136,510 | |
| Custodian fees and expenses | | | 64,926 | |
| Administration service fees | | | 1,500 | |
| Other | |
| 3,789,709
|
|
| Total expenses | | | 76,932,572 | |
| Less waivers and reimbursements of expenses | |
| (88,701
| )
|
| Net expenses | | | 76,843,871 | |
| Net Investment Income | | | 409,613,443 | |
| Realized and Unrealized Gain (Loss) | | | |
| Net realized loss on investments | | | (219,526,293 | ) |
| Net change in unrealized appreciation/depreciation on investments | | | 745,187,448 | |
| Net Increase in Net Assets Resulting from Operations | | $
| 935,274,598
|
|
See accompanying Notes to Financial Statements.
| | | | |
| 75 | | | | OPPENHEIMER ROCHESTER NATIONAL MUNICIPALS |
STATEMENTS OF CHANGES IN NET ASSETS
| | | | | | | | |
| | | Year Ended
July 31,
2012 | | | Year Ended
July 29,
20111 | |
| Operations | | | | | | |
| Net investment income | | $ | 409,613,443 | | | $ | 464,306,482 | |
| Net realized loss | | | (219,526,293 | ) | | | (713,965,519 | ) |
| Net change in unrealized appreciation/depreciation | |
| 745,187,448
|
| |
| 452,559,457
|
|
| Net increase in net assets resulting from operations | | | 935,274,598 | | | | 202,900,420 | |
| Dividends and/or Distributions to Shareholders | | | | | | |
| Dividends from net investment income: | | | | | | | | |
| Class A | | | (294,568,141 | ) | | | (335,370,538 | ) |
| Class B | | | (10,167,728 | ) | | | (13,440,285 | ) |
| Class C | | | (101,413,463 | ) | | | (113,380,710 | ) |
| Class Y | |
| (25,454,773
| )
| |
| (3,413,910
| )
|
| | | | (431,604,105 | ) | | | (465,605,443 | ) |
| Beneficial Interest Transactions | | | | | | |
| Net increase (decrease) in net assets resulting from beneficial interest transactions: | | | | | | | | |
| Class A | | | 164,925,625 | | | | (493,023,518 | ) |
| Class B | | | (13,872,549 | ) | | | (55,101,037 | ) |
| Class C | | | 85,266,098 | | | | (173,696,335 | ) |
| Class Y | |
| 309,823,565
|
| |
| 164,319,295
|
|
| | | | 546,142,739 | | | | (557,501,595 | ) |
| Net Assets | | | | | | |
| Total increase (decrease) | | | 1,049,813,232 | | | | (820,206,618 | ) |
| Beginning of period | |
| 5,783,397,966
|
| |
| 6,603,604,584
|
|
| End of period (including accumulated net investment income of $15,146,585 and $28,299,739, respectively) | | $
| 6,833,211,198
|
| | $
| 5,783,397,966
|
|
1. July 29, 2011 represents the last business day of the Fund’s 2011 fiscal year. See Note 1 of the accompanying Notes.
See accompanying Notes to Financial Statements.
| | | | |
| 76 | | | | OPPENHEIMER ROCHESTER NATIONAL MUNICIPALS |
STATEMENT OF CASH FLOWS For the Year Ended July 31, 2012
| | | | |
| Cash Flows from Operating Activities | | | |
| Net increase in net assets from operations | | $ | 935,274,598 | |
Adjustments to reconcile net increase in net assets from operations
to net cash used in operating activities: | | | | |
Purchase of investment securities | | | (1,253,191,697 | ) |
Proceeds from disposition of investment securities | | | 798,278,237 | |
Short-term investment securities, net | | | (16,187,955 | ) |
Premium amortization | | | 5,065,374 | |
Discount accretion | | | (62,388,870 | ) |
Net realized loss on investments | | | 219,526,293 | |
Net change in unrealized appreciation/depreciation on investments | | | (745,187,448 | ) |
| Change in assets: | | | | |
Increase in other assets | | | (1,216,971 | ) |
Increase in interest receivable | | | (7,943,426 | ) |
Increase in receivable for securities sold | | | (18,528,714 | ) |
| Change in liabilities: | | | | |
Increase in payable for securities purchased | | | 23,133,289 | |
Increase in other liabilities | |
| 227,844
|
|
| Net cash used in operating activities | | | (123,139,446 | ) |
| Cash Flows from Financing Activities | | | |
| Proceeds from borrowings | | | 1,214,900,000 | |
| Payments on borrowings | | | (1,118,400,000 | ) |
| Payments on short-term floating rate notes issued | | | (58,910,000 | ) |
| Payments on reverse repurchase agreements | | | (10,000,000 | ) |
| Proceeds from shares sold | | | 1,851,028,325 | |
| Payments on shares redeemed | | | (1,640,884,820 | ) |
| Cash distributions paid | |
| (114,580,572
| )
|
| Net cash provided by financing activities | | | 123,152,933 | |
| Net increase in cash | | | 13,487 | |
| Cash, beginning balance | |
| 724,453
|
|
| Cash, ending balance | | $ | 737,940 | |
| | |
|
|
|
Supplemental disclosure of cash flow information:
Noncash financing activities not included herein consist of reinvestment of dividends and distributions of $316,542,768.
Cash paid for interest on borrowings and reverse repurchase agreements—$150,162.
Cash paid for interest on short-term floating rate notes issued—$18,416,410.
See accompanying Notes to Financial Statements.
| | | | |
| 77 | | | | OPPENHEIMER ROCHESTER NATIONAL MUNICIPALS |
FINANCIAL HIGHLIGHTS
| | | | | | | | | | | | | | | | | | | | |
| | | Year Ended
July 31,
| | | Year Ended
July 29, | | | Year Ended
July 30,
| | | Year Ended July 31, | |
| Class A | | 2012 | | | 20111 | | | 20101 | | | 2009 | | | 2008 | |
| | | | | | | | | | | | | | | | | | | | | |
| Per Share Operating Data | | | | | | | | | | | | | | | |
| Net asset value, beginning of period | | $ | 6.92 | | | $ | 7.17 | | | $ | 5.90 | | | $ | 8.89 | | | $ | 12.43 | |
| Income (loss) from investment operations: | | | | | | | | | | | | | | | | | | | | |
| Net investment income2 | | | .50 | | | | .55 | | | | .57 | | | | .62 | | | | .70 | |
| Net realized and unrealized gain (loss) | |
| .60
|
| |
| (.25
| )
| |
| 1.25
|
| |
| (2.98
| )
| |
| (3.57
| )
|
| Total from investment operations | | | 1.10 | | | | .30 | | | | 1.82 | | | | (2.36 | ) | | | (2.87 | ) |
| Dividends and/or distributions to shareholders: | | | | | | | | | | | | | | | | | | | | |
| Dividends from net investment income | | | (.52 | ) | | | (.55 | ) | | | (.55 | ) | | | (.63 | ) | | | (.67 | ) |
| Net asset value, end of period | | $
| 7.50
|
| | $
| 6.92
|
| | $
| 7.17
|
| | $
| 5.90
|
| | $
| 8.89
|
|
| Total Return, at Net Asset Value3 | | | 16.63 | % | | | 4.65 | % | | | 31.39 | % | | | (26.44 | )% | | | (23.62 | )% |
| | | | | | | | | | | | | | | | | | | | | |
| Ratios/Supplemental Data | | | | | | | | | | | | | | | |
| Net assets, end of period (in thousands) | | | $4,463,156 | | | | $3,969,090 | | | | $4,651,798 | | | | $3,408,946 | | | | $4,503,510 | |
| Average net assets (in thousands) | | | $4,001,353 | | | | $4,149,509 | | | | $4,393,199 | | | | $3,338,722 | | | | $4,903,394 | |
| Ratios to average net assets:4 | | | | | | | | | | | | | | | | | | | | |
| Net investment income | | | 7.00 | % | | | 8.07 | % | | | 8.04 | % | | | 9.89 | % | | | 6.70 | % |
| Expenses excluding interest and fees on short-term floating rate notes issued and interest and fees from borrowings and reverse repurchase agreements | | | 0.64 | % | | | 0.64 | % | | | 0.59 | % | | | 0.62 | % | | | 0.57 | % |
| Interest and fees from borrowings and reverse repurchase agreements | | | 0.12 | % | | | 0.11 | % | | | 0.27 | % | | | 1.01 | % | | | 0.22 | % |
| Interest and fees on short-term floating rate notes issued5 | |
| 0.31
| %
| |
| 0.35
| %
| |
| 0.39
| %
| |
| 1.34
| %
| |
| 1.25
| %
|
| Total expenses | | | 1.07 | % | | | 1.10 | % | | | 1.25 | % | | | 2.97 | % | | | 2.04 | % |
| Expenses after payments, waivers and/or reimbursements and reduction to custodian expenses | | | 1.07 | % | | | 1.10 | % | | | 1.25 | % | | | 2.97 | % | | | 2.04 | % |
| Portfolio turnover rate | | | 11 | % | | | 18 | % | | | 16 | % | | | 20 | % | | | 37 | % |
1. July 29, 2011 and July 30, 2010 represent the last business days of the Fund’s respective reporting periods. See Note 1 of the accompanying Notes.
2. Per share amounts calculated based on the average shares outstanding during the period.
3. Assumes an initial investment on the business day before the first day of the fiscal period, with all dividends and distributions reinvested in additional shares on the reinvestment date, and redemption at the net asset value calculated on the last business day of the fiscal period. Sales charges are not reflected in the total returns. Total returns are not annualized for periods of less than one full year. Returns do not reflect the deduction of taxes that a shareholder would pay on fund distributions or the redemption of fund shares.
4. Annualized for periods less than one full year.
5. Interest and fee expense relates to the Fund’s liability for short-term floating rate notes issued in conjunction with inverse floating rate security transactions.
See accompanying Notes to Financial Statements.
| | | | |
| 78 | | | | OPPENHEIMER ROCHESTER NATIONAL MUNICIPALS |
| | | | | | | | | | | | | | | | | | | | |
| | | Year Ended
July 31, | | | Year Ended
July 29, | | | Year Ended
July 30, | | | Year Ended July 31, | |
| Class B | | 2012 | | | 20111 | | | 20101 | | | 2009 | | | 2008 | |
| | | | | | | | | | | | | | | | | | | | | |
| Per Share Operating Data | | | | | | | | | | | | | | | |
| Net asset value, beginning of period | | $ | 6.94 | | | $ | 7.19 | | | $ | 5.92 | | | $ | 8.91 | | | $ | 12.46 | |
| Income (loss) from investment operations: | | | | | | | | | | | | | | | | | | | | |
| Net investment income2 | | | .44 | | | | .50 | | | | .51 | | | | .57 | | | | .62 | |
| Net realized and unrealized gain (loss) | |
| .61
|
| |
| (.26
| )
| |
| 1.25
|
| |
| (2.99
| )
| |
| (3.58
| )
|
| Total from investment operations | | | 1.05 | | | | .24 | | | | 1.76 | | | | (2.42 | ) | | | (2.96 | ) |
| Dividends and/or distributions to shareholders: | | | | | | | | | | | | | | | | | | | | |
| Dividends from net investment income | | | (.46 | ) | | | (.49 | ) | | | (.49 | ) | | | (.57 | ) | | | (.59 | ) |
| Net asset value, end of period | | $
| 7.53
|
| | $
| 6.94
|
| | $
| 7.19
|
| | $
| 5.92
|
| | $
| 8.91
|
|
| Total Return, at Net Asset Value3 | | | 15.76 | % | | | 3.75 | % | | | 30.18 | % | | | (27.02 | )% | | | (24.27 | )% |
| | | | | | | | | | | | | | | | | | | | | |
| Ratios/Supplemental Data | | | | | | | | | | | | | | | |
| Net assets, end of period (in thousands) | | | $161,197 | | | | $162,309 | | | | $226,466 | | | | $212,745 | | | | $356,192 | |
| Average net assets (in thousands) | | | $156,216 | | | | $186,637 | | | | $237,875 | | | | $232,793 | | | | $458,627 | |
| Ratios to average net assets:4 | | | | | | | | | | | | | | | | | | | | |
| Net investment income | | | 6.17 | % | | | 7.21 | % | | | 7.23 | % | | | 8.99 | % | | | 5.86 | % |
| Expenses excluding interest and fees on short-term floating rate notes issued and interest and fees from borrowings and reverse repurchase agreements | | | 1.48 | % | | | 1.49 | % | | | 1.46 | % | | �� | 1.46 | % | | | 1.38 | % |
| Interest and fees from borrowings and reverse repurchase agreements | | | 0.12 | % | | | 0.11 | % | | | 0.27 | % | | | 1.01 | % | | | 0.22 | % |
| Interest and fees on short-term floating rate notes issued5 | |
| 0.31
| %
| |
| 0.35
| %
| |
| 0.39
| %
| |
| 1.34
| %
| |
| 1.25
| %
|
| Total expenses | | | 1.91 | % | | | 1.95 | % | | | 2.12 | % | | | 3.81 | % | | | 2.85 | % |
| Expenses after payments, waivers and/or reimbursements and reduction to custodian expenses | | | 1.91 | % | | | 1.95 | % | | | 2.12 | % | | | 3.81 | % | | | 2.85 | % |
| Portfolio turnover rate | | | 11 | % | | | 18 | % | | | 16 | % | | | 20 | % | | | 37 | % |
1. July 29, 2011 and July 30, 2010 represent the last business days of the Fund’s respective reporting periods. See Note 1 of the accompanying Notes.
2. Per share amounts calculated based on the average shares outstanding during the period.
3. Assumes an initial investment on the business day before the first day of the fiscal period, with all dividends and distributions reinvested in additional shares on the reinvestment date, and redemption at the net asset value calculated on the last business day of the fiscal period. Sales charges are not reflected in the total returns. Total returns are not annualized for periods of less than one full year. Returns do not reflect the deduction of taxes that a shareholder would pay on fund distributions or the redemption of fund shares.
4. Annualized for periods less than one full year.
5. Interest and fee expense relates to the Fund’s liability for short-term floating rate notes issued in conjunction with inverse floating rate security transactions.
See accompanying Notes to Financial Statements.
| | | | |
| 79 | | | | OPPENHEIMER ROCHESTER NATIONAL MUNICIPALS |
FINANCIAL HIGHLIGHTS Continued
| | | | | | | | | | | | | | | | | | | | |
| | | Year Ended July 31, | | | Year Ended July 29, | | | Year Ended July 30, | | | Year Ended July 31, | |
| Class C | | 2012 | | | 20111 | | | 20101 | | | 2009 | | | 2008 | |
| | | | | | | | | | | | | | | | | | | | | |
| Per Share Operating Data | | | | | | | | | | | | | | | |
| Net asset value, beginning of period | | $ | 6.90 | | | $ | 7.15 | | | $ | 5.89 | | | $ | 8.87 | | | $ | 12.41 | |
| Income (loss) from investment operations: | | | | | | | | | | | | | | | | | | | | |
| Net investment income2 | | | .44 | | | | .50 | | | | .51 | | | | .57 | | | | .62 | |
| Net realized and unrealized gain (loss) | |
| .61
|
| |
| (.25
| )
| |
| 1.25
|
| |
| (2.97
| )
| |
| (3.57
| )
|
| Total from investment operations | | | 1.05 | | | | .25 | | | | 1.76 | | | | (2.40 | ) | | | (2.95 | ) |
| Dividends and/or distributions to shareholders: | | | | | | | | | | | | | | | | | |
| Dividends from net investment income | | | (.47 | ) | | | (.50 | ) | | | (.50 | ) | | | (.58 | ) | | | (.59 | ) |
| Net asset value, end of period | | $
| 7.48
|
| | $
| 6.90
|
| | $
| 7.15
|
| | $
| 5.89
|
| | $
| 8.87
|
|
| Total Return, at Net Asset Value3 | | | 15.80 | % | | | 3.86 | % | | | 30.27 | % | | | (26.98 | )% | | | (24.26 | )% |
| | | | | | | | | | | | | | | | | | | | | |
| Ratios/Supplemental Data | | | | | | | | | | | | | | | |
| Net assets, end of period (in thousands) | | | $1,691,778 | | | | $1,479,323 | | | | $1,725,341 | | | | $1,254,144 | | | | $1,658,830 | |
| Average net assets (in thousands) | | | $1,533,562 | | | | $1,545,519 | | | | $1,617,761 | | | | $1,215,913 | | | | $1,800,637 | |
| Ratios to average net assets:4 | | | | | | | | | | | | | | | | | | | | |
| Net investment income | | | 6.23 | % | | | 7.30 | % | | | 7.26 | % | | | 9.09 | % | | | 5.93 | % |
| Expenses excluding interest and fees on short-term floating rate notes issued and interest and fees from borrowings and reverse repurchase agreements | | | 1.41 | % | | | 1.41 | % | | | 1.37 | % | | | 1.40 | % | | | 1.34 | % |
| Interest and fees from borrowings and reverse repurchase agreements | | | 0.12 | % | | | 0.11 | % | | | 0.27 | % | | | 1.01 | % | | | 0.22 | % |
| Interest and fees on short-term floating rate notes issued5 | |
| 0.31
| %
| |
| 0.35
| %
| |
| 0.39
| %
| |
| 1.34
| %
| |
| 1.25
| %
|
| Total expenses | | | 1.84 | % | | | 1.87 | % | | | 2.03 | % | | | 3.75 | % | | | 2.81 | % |
| Expenses after payments, waivers and/or reimbursements and reduction to custodian expenses | | | 1.84 | % | | | 1.87 | % | | | 2.03 | % | | | 3.75 | % | | | 2.81 | % |
| Portfolio turnover rate | | | 11 | % | | | 18 | % | | | 16 | % | | | 20 | % | | | 37 | % |
1. July 29, 2011 and July 30, 2010 represent the last business days of the Fund’s respective reporting periods. See Note 1 of the accompanying Notes.
2. Per share amounts calculated based on the average shares outstanding during the period.
3. Assumes an initial investment on the business day before the first day of the fiscal period, with all dividends and distributions reinvested in additional shares on the reinvestment date, and redemption at the net asset value calculated on the last business day of the fiscal period. Sales charges are not reflected in the total returns. Total returns are not annualized for periods of less than one full year. Returns do not reflect the deduction of taxes that a shareholder would pay on fund distributions or the redemption of fund shares.
4. Annualized for periods less than one full year.
5. Interest and fee expense relates to the Fund’s liability for short-term floating rate notes issued in conjunction with inverse floating rate security transactions.
See accompanying Notes to Financial Statements.
| | | | |
| 80 | | | | OPPENHEIMER ROCHESTER NATIONAL MUNICIPALS |
| | | | | | | | |
| Class Y | | Year Ended
July 31,
2012 | | | Period Ended
July 29,
20111 | |
| | | | | | | | | |
| Per Share Operating Data | | | | | | |
| Net asset value, beginning of period | | $ | 6.91 | | | $ | 6.90 | |
| Income (loss) from investment operations: | | | | | | | | |
| Net investment income2 | | | .50 | | | | .36 | |
| Net realized and unrealized gain | |
| .62
|
| |
| .02
|
|
| Total from investment operations | | | 1.12 | | | | .38 | |
| Dividends and/or distributions to shareholders: | | | | | | | | |
| Dividends from net investment income | | | (.53 | ) | | | (.37 | ) |
| Net asset value, end of period | | $
| 7.50
|
| | $
| 6.91
|
|
| Total Return, at Net Asset Value3 | | | 16.97 | % | | | 6.00 | % |
| | | | | | | | | |
| Ratios/Supplemental Data | | | | | | |
| Net assets, end of period (in thousands) | | | $517,080 | | | | $172,676 | |
| Average net assets (in thousands) | | | $344,746 | | | | $62,327 | |
| Ratios to average net assets:4 | | | | | | | | |
| Net investment income | | | 7.05 | % | | | 8.02 | % |
| Expenses excluding interest and fees on short-term floating rate notes issued and interest and fees from borrowings and reverse repurchase agreements | | | 0.49 | % | | | 0.48 | % |
| Interest and fees from borrowings and reverse repurchase agreements | | | 0.12 | % | | | 0.12 | % |
| Interest and fees on short-term floating rate notes issued5 | |
| 0.31
| %
| |
| 0.35
| %
|
| Total expenses | | | 0.92 | % | | | 0.95 | % |
| Expenses after payments, waivers and/or reimbursements and reduction to custodian expenses | | | 0.92 | % | | | 0.95 | % |
| Portfolio turnover rate | | | 11 | % | | | 18 | % |
1. For the period from November 29, 2010 (inception of offering) to July 29, 2011, which represents the last business day of the Fund’s reporting period. See Note 1 of the accompanying Notes.
2. Per share amounts calculated based on the average shares outstanding during the period.
3. Assumes an initial investment on the business day before the first day of the fiscal period, with all dividends and distributions reinvested in additional shares on the reinvestment date, and redemption at the net asset value calculated on the last business day of the fiscal period. Sales charges are not reflected in the total returns. Total returns are not annualized for periods of less than one full year. Returns do not reflect the deduction of taxes that a shareholder would pay on fund distributions or the redemption of fund shares.
4. Annualized for periods less than one full year.
5. Interest and fee expense relates to the Fund’s liability for short-term floating rate notes issued in conjunction with inverse floating rate security transactions.
See accompanying Notes to Financial Statements.
| | | | |
| 81 | | | | OPPENHEIMER ROCHESTER NATIONAL MUNICIPALS |
NOTES TO FINANCIAL STATEMENTS
1. Significant Accounting Policies
Oppenheimer Rochester National Municipals (the “Fund”) is a separate series of Oppenheimer Multi-State Municipal Trust, a diversified open-end management investment company registered under the Investment Company Act of 1940, as amended. The Fund’s investment objective is to seek a high level of current income exempt from federal income taxes for individual investors by investing in a diversified portfolio of high-yield municipal securities. The Fund’s investment adviser is OppenheimerFunds, Inc. (the “Manager”).
The Fund offers Class A, Class C and Class Y shares, and previously offered Class B shares for new purchase through June 29, 2012. Subsequent to that date, no new purchases of Class B shares will be permitted, however reinvestment of dividend and/or capital gain distributions and exchanges of Class B shares into and from other Oppenheimer funds will be allowed. Class A shares are sold at their offering price, which is normally net asset value plus a front-end sales charge. Class C shares are sold, and Class B shares were sold, without a front-end sales charge but may be subject to a contingent deferred sales charge (“CDSC”). Class Y shares are sold to certain institutional investors or intermediaries without either a front-end sales charge or a CDSC, however, the intermediaries may impose charges on their accountholders who beneficially own Class Y shares. All classes of shares have identical rights and voting privileges with respect to the Fund in general and exclusive voting rights on matters that affect that class alone. Earnings, net assets and net asset value per share may differ due to each class having its own expenses, such as transfer and shareholder servicing agent fees and shareholder communications, directly attributable to that class. Class A, B and C shares have separate distribution and/or service plans under which they pay fees. Class Y shares do not pay such fees. Class B shares will automatically convert to Class A shares 72 months after the date of purchase.
The following is a summary of significant accounting policies consistently followed by the Fund.
Previous Annual Periods. The last day of certain of the Fund’s prior fiscal years was the last day the New York Stock Exchange was open for trading. The Fund’s financial statements have been presented through that date to maintain consistency with the Fund’s net asset value calculations used for shareholder transactions.
Inverse Floating Rate Securities. The Fund invests in inverse floating rate securities that pay interest at a rate that varies inversely with short-term interest rates. Because inverse floating rate securities are leveraged instruments, the value of an inverse floating rate security will change more significantly in response to changes in interest rates and other market fluctuations than the market value of a conventional fixed-rate municipal security of similar maturity and credit quality, including the municipal bond underlying an inverse floating rate security.
An inverse floating rate security is created as part of a financial transaction referred to as a “tender option bond” transaction. In most cases, in a tender option bond transaction the Fund sells a fixed-rate municipal bond (the “underlying municipal bond”) to a broker dealer (the “sponsor”). The sponsor creates a trust (the “Trust”) into which it deposits the
| | | | |
| 82 | | | | OPPENHEIMER ROCHESTER NATIONAL MUNICIPALS |
underlying municipal bond. The Trust then issues and sells short-term floating rate securities with a fixed principal amount representing a senior interest in the underlying municipal bond to third parties and a residual, subordinate interest in the underlying municipal bond (referred to as an “inverse floating rate security”) to the Fund. The interest rate on the short-term floating rate securities resets periodically, usually weekly, to a prevailing market rate and holders of these securities are granted the option to tender their securities back to the Trust for repurchase at their principal amount plus accrued interest thereon (the “purchase price”) periodically, usually daily or weekly. A remarketing agent for the Trust is required to attempt to re-sell any tendered short-term floating rate securities to new investors for the purchase price. If the remarketing agent is unable to successfully re-sell the tendered short-term floating rate securities, a liquidity provider to the Trust (typically an affiliate of the sponsor) must contribute cash to the Trust to ensure that the tendering holders receive the purchase price of their securities on the repurchase date.
Because holders of the short-term floating rate securities are granted the right to tender their securities to the Trust for repurchase at frequent intervals for the purchase price, with such payment effectively guaranteed by the liquidity provider, the securities generally bear short-term rates of interest commensurate with money market instruments. When interest is paid on the underlying municipal bond to the Trust, such proceeds are first used to pay the Trust’s administrative expenses and accrued interest to holders of the short-term floating rate securities, with any remaining amounts being paid to the Fund, as the holder of the inverse floating rate security. Accordingly, the amount of such interest on the underlying municipal bond paid to the Fund is inversely related the rate of interest on the short-term floating rate securities. Additionally, because the principal amount of the short-term floating rate securities is fixed and is not adjusted in response to changes in the market value of the underlying municipal bond, any change in the market value of the underlying municipal bond is reflected entirely in a change to the value of the inverse floating rate security.
Typically, the terms of an inverse floating rate security grant certain rights to the Fund, as holder. For example, the Fund may have the right upon request to require that the Trust compel a tender of the short-term floating rate securities to facilitate the Fund’s acquisition of the underlying municipal bond. Following such a request, the Fund pays the Trust the purchase price of the short-term floating rate securities and a specified portion of any market value gain on the underlying municipal bond since its deposit into the Trust, which the Trust uses to redeem the short-term floating rate securities. The Trust then distributes the underlying municipal bond to the Fund. Similarly, the Fund may have the right to directly purchase the underlying municipal bond from the Trust by paying to the Trust the purchase price of the short-term floating rate securities and a specified portion of any market value gain on the underlying municipal bond since its deposit into the Trust, which the Trust uses to redeem the short-term floating rate securities. Through the exercise of either of these rights, the Fund can voluntarily terminate or “collapse” the Trust, terminate its investment in the related inverse floating rate security and obtain the
| | | | |
| 83 | | | | OPPENHEIMER ROCHESTER NATIONAL MUNICIPALS |
NOTES TO FINANCIAL STATEMENTS Continued
1. Significant Accounting Policies Continued
underlying municipal bond. Additionally, the Fund also typically has the right to exchange with the Trust (i) a principal amount of short-term floating rate securities held by the Fund for a corresponding additional principal amount of the inverse floating rate security or (ii) a principal amount of the inverse floating rate security held by the Fund for a corresponding additional principal amount of short-term floating rate securities (which are typically then sold to other investors). Through the exercise of this right, the Fund may increase (or decrease) the principal amount of short-term floating rate securities outstanding, thereby increasing (or decreasing) the amount of leverage provided by the short-term floating rate securities to the Fund’s investment exposure to the underlying municipal bond.
The Fund’s investments in inverse floating rate securities involve certain risks. As short-term interest rates rise, an inverse floating rate security produces less current income (and, in extreme cases, may pay no income) and as short-term interest rates fall, an inverse floating rate security produces more current income. Thus, if short-term interest rates rise after the issuance of the inverse floating rate security, any yield advantage is reduced or eliminated. All inverse floating rate securities entail some degree of leverage represented by the outstanding principal amount of the related short-term floating rate securities. The value of, and income earned on, an inverse floating rate security that has a higher degree of leverage will fluctuate more significantly in response to changes in interest rates and to changes in the market value of the related underlying municipal bond than that of an inverse floating rate security with a lower degree of leverage, and is more likely to be eliminated entirely under adverse market conditions. Changes in the value of an inverse floating rate security will also be more significant than changes in the market value of the related underlying municipal bond because the leverage provided by the related short-term floating rate securities increases the sensitivity of an inverse floating rate security to changes in interest rates and to the market value of the underlying municipal bond. An inverse floating rate security can be expected to underperform fixed-rate municipal bonds when the difference between long-term and short-term interest rates is decreasing (or is already small) or when long-term interest rates are rising, but can be expected to outperform fixed-rate municipal bonds when the difference between long-term and short-term interest rates is increasing (or is already large) or when long-term interest rates are falling. Additionally, a tender option bond transaction typically provides for the automatic termination or “collapse” of a Trust upon the occurrence of certain adverse events, usually referred to as “mandatory tender events” or “tender option termination events.” These events may include, among others, a credit ratings downgrade of the underlying municipal bond below a specified level, a decrease in the market value of the underlying municipal bond below a specified amount, a bankruptcy of the liquidity provider or the inability of the remarketing agent to re-sell to new investors short-term floating rate securities that have been tendered for repurchase by holders thereof. Following the occurrence of such an event, the underlying municipal bond is generally sold for current market value and the proceeds distributed to holders of the short-term floating rate securities and inverse
| | | | |
| 84 | | | | OPPENHEIMER ROCHESTER NATIONAL MUNICIPALS |
floating rate security, with the holder of the inverse floating rate security (the Fund) generally receiving the proceeds of such sale only after the holders of the short-term floating rate securities have received proceeds equal to the purchase price of their securities (and the liquidity provider is generally required to contribute cash to the Trust only in an amount sufficient to ensure that the holders of the short-term floating rate securities receive the purchase price of their securities in connection with such termination of the Trust). Following the occurrence of such events, the Fund could potentially lose the entire amount of its investment in the inverse floating rate security.
Finally, the Fund may enter into shortfall/reimbursement agreements with the liquidity provider of certain tender option bond transactions in connection with certain inverse floating rate securities held by the Fund. These agreements commit the Fund to reimburse the liquidity provider to the extent that the liquidity provider must provide cash to a Trust, including following the termination of a Trust resulting from the occurrence of a “mandatory tender event.” In connection with the occurrence of such an event and the termination of the Trust triggered thereby, the shortfall/reimbursement agreement will make the Fund liable for the amount of the negative difference, if any, between the liquidation value of the underlying municipal bond and the purchase price of the short-term floating rate securities issued by the Trust. Under the standard terms of a tender option bond transaction, absent such a shortfall/reimbursement agreement, the Fund, as holder of the inverse floating rate security, would not be required to make such a reimbursement payment to the liquidity provider. The Manager monitors the Fund’s potential exposure with respect to these agreements on a daily basis and intends to take action to terminate the Fund’s investment in related inverse floating rate securities, if it deems it appropriate to do so. As of July 31, 2012, the Fund’s maximum exposure under such agreements is estimated at $998,285,000.
When the Fund creates an inverse floating rate security in a tender option bond transaction by selling an underlying municipal bond to a sponsor for deposit into a Trust, the transaction is considered a secured borrowing for financial reporting purposes. As a result of such accounting treatment, the Fund includes the underlying municipal bond on its Statement of Investments and as an asset on its Statement of Assets and Liabilities (but does not separately include the related inverse floating rate security on either). The Fund also includes a liability on its Statement of Assets and Liabilities equal to the outstanding principal amount and accrued interest on the related short-term floating rate securities issued by the Trust. Interest on the underlying municipal bond is recorded as investment income on the Fund’s Statement of Operations, while interest payable on the related short-term floating rate securities is recorded as interest expense. At July 31, 2012, municipal bond holdings with a value of $2,275,722,545 shown on the Fund’s Statement of Investments are held by such Trusts and serve as the underlying municipal bonds for the related $1,270,215,000 in short-term floating rate securities issued and outstanding at that date.
| | | | |
| 85 | | | | OPPENHEIMER ROCHESTER NATIONAL MUNICIPALS |
NOTES TO FINANCIAL STATEMENTS Continued
1. Significant Accounting Policies Continued
At July 31, 2012, the inverse floating rate securities associated with tender option bond transactions accounted for as secured borrowings were as follows:
| | | | | | | | | | | | | | | | |
Principal
Amount | | | Inverse Floater1 | | Coupon
Rate2 | | | Maturity
Date | | | Value | |
| | $ 4,400,000 | | | CA GO ROLs3 | | | 11.764 | % | | | 12/1/36 | | | $ | 4,715,216 | |
| | 77,555,000 | | | CA Golden State Tobacco Securitization Corp. ROLs3 | | | 6.707 | | | | 6/1/47 | | | | 57,046,356 | |
| | 3,855,000 | | | CA Health Facilities Financing Authority ROLs3 | | | 17.693 | | | | 7/1/39 | | | | 6,271,777 | |
| | 5,550,000 | | | CA Health Facilities Financing Authority ROLs3 | | | 7.911 | | | | 11/15/42 | | | | 6,109,829 | |
| | 12,000,000 | | | CA Health Facilities Financing Authority ROLs3 | | | 8.350 | | | | 11/15/46 | | | | 13,472,160 | |
| | 5,000,000 | | | CA Infrastructure and Economic Devel. (Sanford Cononsortium) RITES | | | 7.822 | | | | 5/15/40 | | | | 6,228,100 | |
| | 2,615,000 | | | Cerritos, CA Community College District DRIVERS | | | 15.754 | | | | 8/1/33 | | | | 4,180,025 | |
| | 16,250,000 | | | Chicago, IL GO ROLs3 | | | 8.430 | | | | 1/1/33 | | | | 19,411,275 | |
| | 975,000 | | | Dallas-Fort Worth, TX International Airport ROLs3 | | | 14.600 | | | | 11/1/35 | | | | 978,510 | |
| | 11,000,000 | | | Desert, CA Community College District3 | | | 11.501 | | | | 8/1/37 | | | | 13,779,920 | |
| | 2,525,000 | | | Detroit, MI City School District ROLs3 | | | 18.324 | | | | 5/1/29 | | | | 4,980,007 | |
| | 5,000,000 | | | District of Columbia GO ROLs3 | | | 7.864 | | | | 4/1/43 | | | | 5,806,200 | |
| | 2,500,000 | | | District of Columbia GO ROLs3 | | | 7.864 | | | | 4/1/35 | | | | 3,041,050 | |
| | 9,265,000 | | | District of Columbia GO ROLs3 | | | 7.862 | | | | 4/1/43 | | | | 10,758,425 | |
| | 4,675,000 | | | Douglas County, NE Hospital Authority ROLs3 | | | 18.607 | | | | 11/1/48 | | | | 7,155,088 | |
| | 14,530,000 | | | Fulton County, GA Devel. Authority (PHC/Piedmont Hospital/PHF Obligated Group) DRIVERS | | | 7.849 | | | | 6/15/29 | | | | 17,572,582 | |
| | 6,865,000 | | | Fulton County, GA Devel. Authority (PHC/Piedmont Hospital/PHF Obligated Group) DRIVERS | | | 8.283 | | | | 6/15/37 | | | | 8,210,952 | |
| | 1,445,000 | | | Fulton County, GA Devel. Authority (PHC/Piedmont Hospital/PHF Obligated Group) DRIVERS | | | 7.837 | | | | 6/15/29 | | | | 1,747,048 | |
| | 5,000,000 | | | Grossmont, CA Union High School District ROLs3 | | | 12.629 | | | | 8/1/45 | | | | 7,680,050 | |
| | 11,750,000 | | | Highlands County, FL Health Facilities Authority ROLs3 | | | 8.301 | | | | 11/15/36 | | | | 13,397,585 | |
| | 6,670,000 | | | IL Finance Authority (Advocate Health Care) DRIVERS | | | 12.661 | | | | 4/1/44 | | | | 8,934,799 | |
| | 5,790,000 | | | IL Finance Authority (Advocate Health Care) DRIVERS | | | 12.344 | | | | 4/1/44 | | | | 7,586,348 | |
| | 3,670,000 | | | IL Finance Authority (Advocate Health Care) DRIVERS | | | 12.331 | | | | 4/1/44 | | | | 4,807,260 | |
| | 3,335,000 | | | IL Finance Authority (Advocate Health Care) DRIVERS | | | 12.335 | | | | 4/1/44 | | | | 4,368,883 | |
| | 2,935,000 | | | IL Finance Authority (Advocate Health Care) DRIVERS | | | 12.334 | | | | 4/1/44 | | | | 3,844,821 | |
| | 1,670,000 | | | IL Finance Authority (AH&HC/ANSHN/ACMC/AHCN Obligated Group) | | | 12.318 | | | | 4/1/44 | | | | 2,186,949 | |
| | 6,250,000 | | | IL Finance Authority (CDHS/CDHA Obligated Group) DRIVERS | | | 8.718 | | | | 11/1/39 | | | | 7,842,125 | |
| | 2,500,000 | | | IL Finance Authority (CDHS/CDHA Obligated Group) DRIVERS | | | 8.500 | | | | 11/1/39 | | | | 3,083,600 | |
| | 20,000,000 | | | IL Metropolitan Pier & Exposition Authority ROLs3 | | | 8.786 | | | | 6/15/50 | | | | 24,862,000 | |
| | 3,500,000 | | | KY EDFA (Baptist Healthcare System) ROLs3 | | | 16.206 | | | | 8/15/24 | | | | 5,451,600 | |
| | 8,500,000 | | | Lakeland, FL Energy System DRIVERS | | | 8.243 | | | | 10/1/36 | | | | 13,504,630 | |
| | 7,985,000 | | | Los Angeles, CA Dept. of Airports (Los Angeles International Airport) DRIVERS | | | 16.032 | | | | 5/15/30 | | | | 11,654,587 | |
| | 1,250,000 | | | Los Angeles, CA Dept. of Water & Power DRIVERS | | | 14.861 | | | | 7/1/34 | | | | 1,865,300 | |
| | 13,440,000 | | | Los Angeles, CA Unified School District DRIVERS | | | 7.848 | | | | 7/1/30 | | | | 15,956,774 | |
| | 2,750,000 | | | Los Angeles, CA Unified School District ROLs3 | | | 14.449 | | | | 7/1/32 | | | | 4,142,160 | |
| | 1,835,000 | | | Los Angeles, CA Unified School District ROLs3 | | | 15.029 | | | | 1/1/34 | | | | 2,801,898 | |
| | 2,640,000 | | | Los Angeles, CA Unified School District ROLs3 | | | 15.035 | | | | 1/1/34 | | | | 4,031,069 | |
| | 2,190,000 | | | Los Angeles, CA Unified School District ROLs3 | | | 14.891 | | | | 1/1/34 | | | | 3,343,955 | |
| | 7,500,000 | | | Los Angeles, CA Unified School District ROLs3 | | | 15.109 | | | | 7/1/32 | | | | 11,326,500 | |
| | 6,050,000 | | | MA Educational Financing Authority ROLs3 | | | 15.364 | | | | 1/1/30 | | | | 7,847,879 | |
| | 3,750,000 | | | MA HFA ROLs3 | | | 10.853 | | | | 6/1/49 | | | | 4,168,650 | |
| | 3,010,000 | | | MA HFA ROLs3 | | | 11.090 | | | | 12/1/49 | | | | 3,279,305 | |
| | | | |
| 86 | | | | OPPENHEIMER ROCHESTER NATIONAL MUNICIPALS |
| | | | | | | | | | | | | | | | |
Principal
Amount | | | Inverse Floater1 | | Coupon
Rate2 | | | Maturity
Date | | | Value | |
| | $ 8,895,000 | | | MA HFA ROLs3 | | | 8.554 | % | | | 12/1/42 | | | $ | 10,213,239 | |
| | 16,695,000 | | | MA HFA ROLs3 | | | 11.574 | | | | 7/1/25 | | | | 17,840,277 | |
| | 9,775,000 | | | Metropolitan Washington D.C. Airport Authority ROLs3 | | | 11.498 | | | | 10/1/32 | | | | 11,528,831 | |
| | 4,035,000 | | | Metropolitan Washington D.C. Airport Authority, Series B DRIVERS | | | 11.180 | | | | 10/1/34 | | | | 4,380,840 | |
| | 12,500,000 | | | MI Finance Authority ROLs3 | | | 8.044 | | | | 12/1/33 | | | | 15,242,000 | |
| | 6,660,000 | | | MI Hospital Finance Authority (McLaren Health Care Corp.) DRIVERS | | | 7.779 | | | | 8/1/35 | | | | 7,864,661 | |
| | 5,000,000 | | | Miami-Dade County, FL Aviation ROLs3 | | | 11.321 | | | | 10/1/40 | | | | 5,832,800 | |
| | 2,500,000 | | | Miami-Dade County, FL School Board ROLs3 | | | 15.770 | | | | 2/1/27 | | | | 3,804,000 | |
| | 2,500,000 | | | Miami-Dade County, FL School Board ROLs3 | | | 14.899 | | | | 2/1/27 | | | | 3,657,500 | |
| | 12,500,000 | | | Miami-Dade County, FL School Board ROLs3 | | | 16.206 | | | | 2/1/34 | | | | 18,323,500 | |
| | 2,500,000 | | | Montgomery County, OH (Miami Valley Hospital) DRIVERS | | | 17.484 | | | | 11/15/23 | | | | 4,745,400 | |
| | 2,885,000 | | | Newport Beach, CA GO ROLs3 | | | 15.042 | | | | 12/1/24 | | | | 3,456,576 | |
| | 3,420,000 | | | NJ EDA ROLs3 | | | 11.139 | | | | 9/1/24 | | | | 5,319,810 | |
| | 60,560,000 | | | NJ Tobacco Settlement Financing Corp. ROLs3 | | | 5.248 | | | | 6/1/29 | | | | 52,731,409 | |
| | 3,300,000 | | | NJ Transportation Trust Fund Authority ROLs3 | | | 11.143 | | | | 12/15/23 | | | | 5,658,279 | |
| | 9,500,000 | | | North Central Texas HFDC (Children’s Medical Center) DRIVERS | | | 17.484 | | | | 8/15/39 | | | | 14,805,560 | |
| | 27,805,000 | | | North TX Tollway Authority ROLs3 | | | 8.846 | | | | 9/1/41 | | | | 38,371,456 | |
| | 18,695,000 | | | NY Liberty Devel. Corp. ROLs3 | | | 8.200 | | | | 1/15/44 | | | | 22,881,371 | |
| | 3,240,000 | | | NYC Municipal Water Finance Authority ROLs3 | | | 18.046 | | | | 6/15/40 | | | | 5,922,720 | |
| | 7,290,000 | | | NYC Transitional Finance Authority ROLs3 | | | 7.800 | | | | 2/1/30 | | | | 9,839,021 | |
| | 9,065,000 | | | NYC Transitional Finance Authority ROLs3 | | | 7.802 | | | | 2/1/35 | | | | 11,848,680 | |
| | 2,875,000 | | | PA Geisinger Authority Health System, Series A DRIVERS | | | 15.747 | | | | 6/1/39 | | | | 4,195,430 | |
| | 7,720,000 | | | Peralta, CA Community College District DRIVERS | | | 7.847 | | | | 8/1/35 | | | | 8,620,461 | |
| | 3,100,000 | | | Pima County, AZ IDA ROLs3 | | | 16.446 | | | | 7/1/39 | | | | 4,305,404 | |
| | 12,500,000 | | | Port Authority NY/NJ, 166th Series DRIVERS | | | 8.283 | | | | 7/15/36 | | | | 17,010,750 | |
| | 11,070,000 | | | Port of Seattle, WA Special Facilities ROLs3 | | | 12.601 | | | | 10/1/32 | | | | 13,363,925 | |
| | 3,670,000 | | | Puerto Rico Sales Tax Financing Corp. DRIVERS | | | 12.005 | | | | 8/1/57 | | | | 4,369,686 | |
| | 4,250,000 | | | Puerto Rico Sales Tax Financing Corp. ROLs3 | | | 17.136 | | | | 8/1/57 | | | | 6,214,350 | |
| | 8,875,000 | | | Puerto Rico Sales Tax Financing Corp. ROLs3 | | | 11.967 | | | | 8/1/57 | | | | 10,566,043 | |
| | 2,870,000 | | | RI Hsg. & Mtg. Finance Corp. ROLs3 | | | 15.889 | | | | 10/1/47 | | | | 3,292,005 | |
| | 1,082,000 | | | Sabine Neches, TX HFC (Single Family Mtg.) ROLs | | | 14.095 | | | | 12/1/39 | | | | 1,348,994 | |
| | 9,335,000 | | | San Francisco, CA Bay Area Toll Authority ROLs3 | | | 12.109 | | | | 4/1/47 | | | | 13,164,590 | |
| | 2,500,000 | | | San Jacinto, TX Community College District ROLs3 | | | 14.884 | | | | 2/15/38 | | | | 3,512,500 | |
| | 3,500,000 | | | Tarrant County, TX Cultural Education Facilities Finance Corp. ROLs3 | | | 17.063 | | | | 11/15/24 | | | | 6,040,860 | |
| | 8,500,000 | | | Tarrant County, TX Cultural Education Facilities Finance Corp. ROLs3 | | | 18.806 | | | | 11/15/29 | | | | 14,670,660 | |
| | 6,750,000 | | | Tarrant County, TX Health Facilities Devel. Corp. (Cook Childrens Medical Center) DRIVERS | | | 7.849 | | | | 12/1/33 | | | | 8,127,135 | |
| | 375,000 | | | Tes Properties, WA DRIVERS | | | 16.616 | | | | 12/1/29 | | | | 594,600 | |
| | 3,000,000 | | | Tes Properties, WA DRIVERS | | | 17.050 | | | | 12/1/38 | | | | 4,603,560 | |
| | 107,295,000 | | | TX Municipal Gas Acquisition & Supply Corp. ROLs3 | | | 12.336 | | | | 12/15/26 | | | | 176,989,540 | |
| | 4,355,000 | | | WA Health Care Facilities Authority (Peacehealth) DRIVERS | | | 14.451 | | | | 11/1/28 | | | | 5,880,818 | |
| | 5,000,000 | | | WA Health Care Facilities Authority (Seattle Childrens Hospital/Seattle Childrens Healthcare System Obligated Group) | | | 12.992 | | | | 10/1/38 | | | | 7,121,600 | |
| | 4,875,000 | | | WA Health Care Facilities Authority ROLs3 | | | 14.689 | | | | 11/1/18 | | | | 8,205,405 | |
| | | | |
| 87 | | | | OPPENHEIMER ROCHESTER NATIONAL MUNICIPALS |
NOTES TO FINANCIAL STATEMENTS Continued
1. Significant Accounting Policies Continued
| | | | | | | | | | | | | | | | |
Principal
Amount | | | Inverse Floater1 | | Coupon
Rate2 | | | Maturity
Date | | | Value | |
| | $ 5,670,000 | | | Wayne County, MI Airport Authority ROLs3 | | | 11.375 | % | | | 12/1/29 | | | $ | 6,473,552 | |
| | 3,645,000 | | | Wayne County, MI Airport Authority ROLs3 | | | 11.377 | | | | 12/1/29 | | | | 4,161,569 | |
| | 8,335,000 | | | Wayne County, MI Airport Authority ROLs3 | | | 11.379 | | | | 12/1/29 | | | | 9,516,236 | |
| | 3,335,000 | | | Wayne County, MI Airport Authority ROLs3 | | | 11.376 | | | | 12/1/34 | | | | 3,775,620 | |
| | 1,875,000 | | | Westminster, CA Redevel. Agency Tax Allocation ROLs3 | | | 19.256 | | | | 11/1/39 | | | | 3,502,425 | |
| | 3,750,000 | | | Westminster, CA Redevel. Agency Tax Allocation ROLs3 | | | 17.513 | | | | 11/1/45 | | | | 6,075,450 | |
| | 5,000,000 | | | WI H&EFA ROLs3 | | | 7.914 | | | | 11/15/33 | | | | 6,103,200 | |
| | | | | | | | | | | | | | |
|
|
|
| | | | | | | | | | | | | | | $ | 1,005,507,545 | |
| | | | | | | | | | | | | | |
|
|
|
1. For a list of abbreviations used in the Inverse Floater table see the Portfolio Abbreviations table at the end of the Statement of Investments.
2. Represents the current interest rate for the inverse floating rate security.
3. Represents an inverse floating rate security that is subject to a shortfall/reimbursement agreement.
The Fund may also purchase an inverse floating rate security created as part of a tender option bond transaction not initiated by the Fund when a third party, such as a municipal issuer or financial institution, transfers an underlying municipal bond to a Trust. For financial reporting purposes, the Fund includes the inverse floating rate security related to such transaction on its Statement of Investments and as an asset on its Statement of Assets and Liabilities, and interest on the security is recorded as investment income on the Fund’s Statement of Operations.
The Fund may invest in inverse floating rate securities with any degree of leverage (as measured by the outstanding principal amount of related short-term floating rate securities). However, the Fund may only expose up to 35% of its total assets to the effects of leverage from its investments in inverse floating rate securities. This limitation is measured by comparing the aggregate principal amount of the short-term floating rate securities that are related to the inverse floating rate securities held by the Fund to the total assets of the Fund. The Fund’s exposure to the effects of leverage from its investments in inverse floating rate securities amounts to $1,270,215,000 or 15.32% of its total assets as of July 31, 2012.
Securities on a When-Issued or Delayed Delivery Basis. The Fund may purchase securities on a “when-issued” basis, and may purchase or sell securities on a “delayed delivery” basis. “When-issued” or “delayed delivery” refers to securities whose terms and indenture are available and for which a market exists, but which are not available for immediate delivery. Delivery and payment for securities that have been purchased by the Fund on a when-issued basis normally takes place within six months and possibly as long as two years or more after the trade date. During this period, such securities do not earn interest, are subject to market fluctuation and may increase or decrease in value prior to their delivery. The purchase of securities on a when-issued basis may increase the volatility of the Fund’s net asset value to the extent the Fund executes such transactions while remaining substantially fully invested. When the Fund engages in when-issued or delayed
| | | | |
| 88 | | | | OPPENHEIMER ROCHESTER NATIONAL MUNICIPALS |
delivery transactions, it relies on the buyer or seller, as the case may be, to complete the transaction. Their failure to do so may cause the Fund to lose the opportunity to obtain or dispose of the security at a price and yield it considers advantageous. The Fund may also sell securities that it purchased on a when-issued basis or forward commitment prior to settlement of the original purchase.
As of July 31, 2012, the Fund had purchased securities issued on a when-issued or delayed delivery basis as follows:
| | | | |
| | | When-Issued or Delayed Delivery
Basis Transactions | |
| Purchased securities | | $ | 18,319,066 | |
Credit Risk. The Fund invests in high-yield, non-investment-grade bonds, which may be subject to a greater degree of credit risk. Credit risk relates to the ability of the issuer to meet interest or principal payments or both as they become due. The Fund may acquire securities that have missed an interest payment, and is not obligated to dispose of securities whose issuers or underlying obligors subsequently miss an interest payment. Information concerning securities not accruing interest as of July 31, 2012 is as follows:
| | | | |
| Cost | | $ | 855,332,124 | |
| Market Value | | $ | 409,165,262 | |
| Market Value as a % of Net Assets | | | 5.99 | % |
The Fund has entered into forbearance agreements with certain obligors under which the Fund has agreed to temporarily forego receipt of the original principal or coupon interest rates. As of July 31, 2012, securities with an aggregate market value of $15,468,432, representing 0.23% of the Fund’s net assets, were subject to these forbearance agreements. Interest payments of $581,254 are contractually owed to the Fund with respect to these securities and will not be collected under these forbearance agreements.
Allocation of Income, Expenses, Gains and Losses. Income, expenses (other than those attributable to a specific class), gains and losses are allocated on a daily basis to each class of shares based upon the relative proportion of net assets represented by such class. Operating expenses directly attributable to a specific class are charged against the operations of that class.
Federal Taxes. The Fund intends to comply with provisions of the Internal Revenue Code applicable to regulated investment companies and to distribute substantially all of its investment company taxable income, including any net realized gain on investments not offset by capital loss carryforwards, if any, to shareholders. Therefore, no federal income or excise tax provision is required. The Fund files income tax returns in U.S. federal and applicable state jurisdictions. The statute of limitations on the Fund’s tax return filings generally remain open for the three preceding fiscal reporting period ends.
The tax components of capital shown in the following table represent distribution requirements the Fund must satisfy under the income tax regulations, losses the Fund may be able to offset against income and gains realized in future years and unrealized appreciation or depreciation of securities and other investments for federal income tax purposes.
| | | | |
| 89 | | | | OPPENHEIMER ROCHESTER NATIONAL MUNICIPALS |
NOTES TO FINANCIAL STATEMENTS Continued
1. Significant Accounting Policies Continued
| | | | | | | | | | | | |
Undistributed
Net Investment
Income | | Undistributed
Long-Term
Gain | | | Accumulated
Loss
Carryforward1,2,3 | | | Net Unrealized
Depreciation
Based on Cost of
Securities and Other
Investments for Federal
Income Tax Purposes | |
| $134,854,282 | | $ | — | | | $ | 2,472,419,406 | | | $ | 701,013,397 | |
1. As of July 31, 2012, the Fund had $2,472,419,406 of net capital loss carryforwards available to offset future realized capital gains, if any, and thereby reduce future taxable gain distributions. Details of the capital loss carryforwards are included in the table below. Capital loss carryovers with no expiration, if any, must be utilized prior to those with expiration dates.
| | | | |
| Expiring | | | |
| 2014 | | $ | 187,364 | |
| 2016 | | | 81,480,187 | |
| 2017 | | | 566,789,505 | |
| 2018 | | | 915,944,693 | |
| 2019 | | | 35,463,515 | |
| No expiration | | | 872,554,142 | |
| | |
|
|
|
| Total | | $ | 2,472,419,406 | |
| | |
|
|
|
2. During the fiscal year ended July 31, 2012, the Fund did not utilize any capital loss carryforward.
3. During the fiscal year ended July 29, 2011, the Fund did not utilize any capital loss carryforward.
Net investment income (loss) and net realized gain (loss) may differ for financial statement and tax purposes. The character of dividends and distributions made during the fiscal year from net investment income or net realized gains may differ from their ultimate characterization for federal income tax purposes. Also, due to timing of dividends and distributions, the fiscal year in which amounts are distributed may differ from the fiscal year in which the income or net realized gain was recorded by the Fund.
Accordingly, the following amounts have been reclassified for July 31, 2012. Net assets of the Fund were unaffected by the reclassifications.
| | | | | | | | |
Reduction to
Paid-in Capital | | Increase
to Accumulated
Net Investment
Income | | | Increase
to Accumulated Net
Realized Loss
on Investments | |
| $2,463,415 | | $ | 8,837,508 | | | $ | 6,374,093 | |
The tax character of distributions paid during the years ended July 31, 2012 and July 31, 2011 was as follows:
| | | | | | | | |
| | | Year Ended
July 31, 2012 | | | Year Ended
July 31, 2011 | |
| Distributions paid from: | | | | | | | | |
| Exempt-interest dividends | | $ | 426,627,542 | | | $ | 461,604,460 | |
| Ordinary income | | | 4,976,563 | | | | 4,000,983 | |
| | |
|
|
|
| Total | | $ | 431,604,105 | | | $ | 465,605,443 | |
| | |
|
|
|
| | | | |
| 90 | | | | OPPENHEIMER ROCHESTER NATIONAL MUNICIPALS |
The aggregate cost of securities and other investments and the composition of unrealized appreciation and depreciation of securities and other investments for federal income tax purposes as of July 31, 2012 are noted in the following table. The primary difference between book and tax appreciation or depreciation of securities and other investments, if applicable, is attributable to the tax deferral of losses or tax realization of financial statement unrealized gain or loss.
| | | | |
| Federal tax cost of securities | | $ | 7,478,247,732 | 1 |
| | |
|
|
|
| Gross unrealized appreciation | | $ | 831,972,338 | |
| Gross unrealized depreciation | | | (1,532,985,735 | ) |
| | |
|
|
|
| Net unrealized depreciation | | $ | (701,013,397 | ) |
| | |
|
|
|
1. The Federal tax cost of securities does not include cost of $1,357,424,656, which has otherwise been recognized for financial reporting purposes, related to bonds placed into trusts in conjunction with certain investment transactions. See the Inverse Floating Rate Securities note above.
Trustees’ Compensation. The Fund has adopted an unfunded retirement plan (the “Plan”) for the Fund’s independent trustees. Benefits are based on years of service and fees paid to each trustee during their period of service. The Plan was frozen with respect to adding new participants effective December 31, 2006 (the “Freeze Date”) and existing Plan Participants as of the Freeze Date will continue to receive accrued benefits under the Plan. Active independent trustees as of the Freeze Date have each elected a distribution method with respect to their benefits under the Plan. During the year ended July 31, 2012, the Fund’s projected benefit obligations, payments to retired trustees and accumulated liability were as follows:
| | | | |
| Projected Benefit Obligations Increased | | $ | 45,602 | |
| Payments Made to Retired Trustees | | | 54,400 | |
| Accumulated Liability as of July 31, 2012 | | | 399,776 | |
The Board of Trustees has adopted a compensation deferral plan for independent trustees that enables trustees to elect to defer receipt of all or a portion of the annual compensation they are entitled to receive from the Fund. For purposes of determining the amount owed to the Trustee under the plan, deferred amounts are treated as though equal dollar amounts had been invested in shares of the Fund or in other Oppenheimer funds selected by the Trustee. The Fund purchases shares of the funds selected for deferral by the Trustee in amounts equal to his or her deemed investment, resulting in a Fund asset equal to the deferred compensation liability. Such assets are included as a component of “Other” within the asset section of the Statement of Assets and Liabilities. Deferral of trustees’ fees under the plan will not affect the net assets of the Fund, and will not materially affect the Fund’s assets, liabilities or net investment income per share. Amounts will be deferred until distributed in accordance with the compensation deferral plan.
Dividends and Distributions to Shareholders. Dividends and distributions to shareholders, which are determined in accordance with income tax regulations and may differ from U.S. generally accepted accounting principles, are recorded on the ex-dividend
| | | | |
| 91 | | | | OPPENHEIMER ROCHESTER NATIONAL MUNICIPALS |
NOTES TO FINANCIAL STATEMENTS Continued
1. Significant Accounting Policies Continued
date. Income distributions, if any, are declared daily and paid monthly. Capital gain distributions, if any, are declared and paid annually.
Investment Income. Interest income is recognized on an accrual basis. Discount and premium, which are included in interest income on the Statement of Operations, are amortized or accreted daily.
Custodian Fees. “Custodian fees and expenses” in the Statement of Operations may include interest expense incurred by the Fund on any cash overdrafts of its custodian account during the period. Such cash overdrafts may result from the effects of failed trades in portfolio securities and from cash outflows resulting from unanticipated shareholder redemption activity. The Fund pays interest to its custodian on such cash overdraft at a rate equal to the 1 Month LIBOR Rate plus 2.00%. The “Reduction to custodian expenses” line item, if applicable, represents earnings on cash balances maintained by the Fund during the period. Such interest expense and other custodian fees may be paid with these earnings.
Security Transactions. Security transactions are recorded on the trade date. Realized gains and losses on securities sold are determined on the basis of identified cost.
Indemnifications. The Fund’s organizational documents provide current and former trustees and officers with a limited indemnification against liabilities arising in connection with the performance of their duties to the Fund. In the normal course of business, the Fund may also enter into contracts that provide general indemnifications. The Fund’s maximum exposure under these arrangements is unknown as this would be dependent on future claims that may be made against the Fund. The risk of material loss from such claims is considered remote.
Other. The preparation of financial statements in conformity with accounting principles generally accepted in the United States of America requires management to make estimates and assumptions that affect the reported amounts of assets and liabilities and disclosure of contingent assets and liabilities at the date of the financial statements and the reported amounts of increases and decreases in net assets from operations during the reporting period. Actual results could differ from those estimates.
2. Securities Valuation
The Fund calculates the net asset value of its shares as of the close of the New York Stock Exchange (the “Exchange”), normally 4:00 P.M. Eastern time, on each day the Exchange is open for trading.
The Fund’s Board has adopted procedures for the valuation of the Fund’s securities and has delegated the day-to-day responsibility for valuation determinations under those procedures to the Manager. The Manager has established a Valuation Committee which is responsible for determining a “fair valuation” for any security for which market quotations are
| | | | |
| 92 | | | | OPPENHEIMER ROCHESTER NATIONAL MUNICIPALS |
not “readily available.” The Valuation Committee’s fair valuation determinations are subject to review, approval and ratification by the Fund’s Board at its next regularly scheduled meeting covering the calendar quarter in which the fair valuation was determined.
Valuation Methods and Inputs
Securities are valued using unadjusted quoted market prices, when available, as supplied primarily by third party pricing services or dealers.
The following methodologies are used to determine the market value or the fair value of the types of securities described below:
Securities traded on a registered U.S. securities exchange (including exchange-traded derivatives other than futures and futures options) are valued based on the last sale price of the security reported on the principal exchange on which it is traded, prior to the time when the Fund’s assets are valued. In the absence of a sale, the security is valued at the last sale price on the prior trading day, if it is within the spread of the current day’s closing “bid” and “asked” prices, and if not, at the current day’s closing bid price. A security of a foreign issuer traded on a foreign exchange but not listed on a registered U.S. securities exchange is valued based on the last sale price on the principal exchange on which the security is traded, as identified by the third party pricing service used by the Manager, prior to the time when the Fund’s assets are valued. If the last sale price is unavailable, the security is valued at the most recent official closing price on the principal exchange on which it is traded. If the last sales price or official closing price for a foreign security is not available, the security is valued at the mean between the bid and asked price per the exchange or, if not available from the exchange, obtained from two dealers. If bid and asked prices are not available from either the exchange or two dealers, the security is valued by using one of the following methodologies (listed in order of priority); (1) using a bid from the exchange, (2) the mean between the bid and asked price as provided by a single dealer, or (3) a bid from a single dealer.
Shares of a registered investment company that are not traded on an exchange are valued at that investment company’s net asset value per share.
Corporate and government debt securities (of U.S. or foreign issuers) and municipal debt securities, event-linked bonds, loans, mortgage-backed securities, collateralized mortgage obligations, and asset-backed securities are valued at the mean between the “bid” and “asked” prices utilizing evaluated prices obtained from third party pricing services or broker-dealers who may use matrix pricing methods to determine the evaluated prices.
Short-term money market type debt securities with a remaining maturity of sixty days or less are valued at cost adjusted by the amortization of discount or premium to maturity (amortized cost), which approximates market value. Short-term debt securities with a remaining maturity in excess of sixty days are valued at the mean between the “bid” and “asked” prices utilizing evaluated prices obtained from third party pricing services or broker-dealers.
| | | | |
| 93 | | | | OPPENHEIMER ROCHESTER NATIONAL MUNICIPALS |
NOTES TO FINANCIAL STATEMENTS Continued
2. Securities Valuation Continued
A description of the standard inputs that may generally be considered by the third party pricing vendors in determining their evaluated prices is provided below.
| | |
| Security Type | | Standard Inputs Generally Considered by Third-Party
Pricing Vendors |
| Corporate debt, government debt, municipal, mortgage-backed and asset-backed securities | | Reported trade data, broker-dealer price quotations, benchmark yields, issuer spreads on comparable securities, the credit quality, yield, maturity, and other appropriate factors. |
| Loans | | Information obtained from market participants regarding reported trade data and broker-dealer price quotations. |
| Event-linked bonds | | Information obtained from market participants regarding reported trade data and broker-dealer price quotations. |
If a market value or price cannot be determined for a security using the methodologies described above, or if, in the “good faith” opinion of the Manager, the market value or price obtained does not constitute a “readily available market quotation,” or a significant event has occurred that would materially affect the value of the security the security is fair valued either (i) by a standardized fair valuation methodology applicable to the security type or the significant event as previously approved by the Valuation Committee and the Fund’s Board or (ii) as determined in good faith by the Manager’s Valuation Committee. The Valuation Committee considers all relevant facts that are reasonably available, through either public information or information available to the Manager, when determining the fair value of a security. Fair value determinations by the Manager are subject to review, approval and ratification by the Fund’s Board at its next regularly scheduled meeting covering the calendar quarter in which the fair valuation was determined. Those fair valuation standardized methodologies include, but are not limited to, valuing securities at the last sale price or initially at cost and subsequently adjusting the value based on: changes in company specific fundamentals, changes in an appropriate securities index, or changes in the value of similar securities which may be further adjusted for any discounts related to security-specific resale restrictions. When possible, such methodologies use observable market inputs such as unadjusted quoted prices of similar securities, observable interest rates, currency rates and yield curves. The methodologies used for valuing securities are not necessarily an indication of the risks associated with investing in those securities nor can it be assured that the Fund can obtain the fair value assigned to a security if it were to sell the security.
To assess the continuing appropriateness of security valuations, the Manager, or its third party service provider who is subject to oversight by the Manager, regularly compares prior day prices, prices on comparable securities, and sale prices to the current day prices and challenges those prices exceeding certain tolerance levels with the third party pricing service or broker source. For those securities valued by fair valuations, whether through a standardized fair valuation methodology or a fair valuation determination, the Valuation Committee reviews and affirms the reasonableness of the valuations based on such methodologies and fair valuation determinations on a regular basis after considering all relevant information that is reasonably available.
| | | | |
| 94 | | | | OPPENHEIMER ROCHESTER NATIONAL MUNICIPALS |
Classifications
Each investment asset or liability of the Fund is assigned a level at measurement date based on the significance and source of the inputs to its valuation. Various data inputs are used in determining the value of each of the Fund’s investments as of the reporting period end. These data inputs are categorized in the following hierarchy under applicable financial accounting standards:
| 1) | | Level 1—unadjusted quoted prices in active markets for identical assets or liabilities (including securities actively traded on a securities exchange) |
| 2) | | Level 2—inputs other than unadjusted quoted prices that are observable for the asset or liability (such as unadjusted quoted prices for similar assets and market corroborated inputs such as interest rates, prepayment speeds, credit risks, etc.) |
| 3) | | Level 3—significant unobservable inputs (including the Manager’s own judgments about assumptions that market participants would use in pricing the asset or liability). |
The inputs used for valuing securities are not necessarily an indication of the risks associated with investing in those securities.
The table below categorizes amounts that are included in the Fund’s Statement of Assets and Liabilities as of July 31, 2012 based on valuation input level:
| | | | | | | | | | | | | | | | | | | | |
| | | Level 1—
Unadjusted
Quoted Prices | | Level 2—
Other Significant
Observable Inputs | | Level 3—
Significant
Unobservable
Inputs | | Value |
| Assets Table | | | | | | | | | | | | | | | | | | | | |
| Investments, at Value: | | | | | | | | | | | | | | | | | | | | |
| Municipal Bonds and Notes | | | | | | | | | | | | | | | | | | | | |
Alabama | | | $ | — | | | | $ | 18,436,390 | | | | $ | — | | | | $ | 18,436,390 | |
Alaska | | | | — | | | | | 14,602,226 | | | | | — | | | | | 14,602,226 | |
Arizona | | | | — | | | | | 149,911,826 | | | | | — | | | | | 149,911,826 | |
Arkansas | | | | — | | | | | 4,256,560 | | | | | — | | | | | 4,256,560 | |
California | | | | — | | | | | 1,272,798,560 | | | | | — | | | | | 1,272,798,560 | |
Colorado | | | | — | | | | | 293,436,605 | | | | | — | | | | | 293,436,605 | |
Connecticut | | | | — | | | | | 4,755,442 | | | | | — | | | | | 4,755,442 | |
Delaware | | | | — | | | | | 6,480,746 | | | | | — | | | | | 6,480,746 | |
District of Columbia | | | | — | | | | | 229,841,441 | | | | | — | | | | | 229,841,441 | |
Florida | | | | — | | | | | 841,246,960 | | | | | — | | | | | 841,246,960 | |
Georgia | | | | — | | | | | 86,599,807 | | | | | — | | | | | 86,599,807 | |
Hawaii | | | | — | | | | | 9,316,910 | | | | | — | | | | | 9,316,910 | |
Idaho | | | | — | | | | | 1,944,581 | | | | | — | | | | | 1,944,581 | |
Illinois | | | | — | | | | | 490,331,072 | | | | | 195 | | | | | 490,331,267 | |
Indiana | | | | — | | | | | 112,934,421 | | | | | 11,642,927 | | | | | 124,577,348 | |
Iowa | | | | — | | | | | 137,153,353 | | | | | — | | | | | 137,153,353 | |
Kansas | | | | — | | | | | 4,477,329 | | | | | — | | | | | 4,477,329 | |
Kentucky | | | | — | | | | | 20,806,445 | | | | | — | | | | | 20,806,445 | |
Louisiana | | | | — | | | | | 91,771,708 | | | | | — | | | | | 91,771,708 | |
Maine | | | | — | | | | | 19,420,695 | | | | | — | | | | | 19,420,695 | |
Maryland | | | | — | | | | | 18,979,564 | | | | | — | | | | | 18,979,564 | |
Massachusetts | | | | — | | | | | 132,410,283 | | | | | — | | | | | 132,410,283 | |
Michigan | | | | — | | | | | 276,652,824 | | | | | — | | | | | 276,652,824 | |
Minnesota | | | | — | | | | | 54,723,120 | | | | | — | | | | | 54,723,120 | |
Mississippi | | | | — | | | | | 14,449,373 | | | | | — | | | | | 14,449,373 | |
| | | | |
| 95 | | | | OPPENHEIMER ROCHESTER NATIONAL MUNICIPALS |
NOTES TO FINANCIAL STATEMENTS Continued
2. Securities Valuation Continued
| | | | | | | | | | | | | | | | | | | | |
| | | Level 1—
Unadjusted
Quoted Prices | | Level 2—
Other Significant
Observable Inputs | | Level 3—
Significant
Unobservable
Inputs | | Value |
| Municipal Bond and Notes Continued | | | | | | | | | | | | | | | | |
Missouri | | | $ | — | | | | $ | 100,619,326 | | | | $ | — | | | | $ | 100,619,326 | |
Montana | | | | — | | | | | 7,766,086 | | | | | — | | | | | 7,766,086 | |
Multi States | | | | — | | | | | 4,559,920 | | | | | — | | | | | 4,559,920 | |
Nebraska | | | | — | | | | | 60,605,851 | | | | | — | | | | | 60,605,851 | |
Nevada | | | | — | | | | | 8,927,721 | | | | | — | | | | | 8,927,721 | |
New Hampshire | | | | — | | | | | 7,777,837 | | | | | — | | | | | 7,777,837 | |
New Jersey | | | | — | | | | | 517,584,401 | | | | | — | | | | | 517,584,401 | |
New Mexico | | | | — | | | | | 18,953,639 | | | | | — | | | | | 18,953,639 | |
New York | | | | — | | | | | 473,225,640 | | | | | — | | | | | 473,225,640 | |
North Carolina | | | | — | | | | | 68,906,765 | | | | | — | | | | | 68,906,765 | |
North Dakota | | | | — | | | | | 3,830,512 | | | | | — | | | | | 3,830,512 | |
Ohio | | | | — | | | | | 339,448,562 | | | | | — | | | | | 339,448,562 | |
Oklahoma | | | | — | | | | | 86,236,295 | | | | | — | | | | | 86,236,295 | |
Oregon | | | | — | | | | | 6,568,822 | | | | | — | | | | | 6,568,822 | |
Pennsylvania | | | | — | | | | | 78,191,729 | | | | | — | | | | | 78,191,729 | |
Rhode Island | | | | — | | | | | 106,061,712 | | | | | — | | | | | 106,061,712 | |
South Carolina | | | | — | | | | | 39,101,263 | | | | | — | | | | | 39,101,263 | |
South Dakota | | | | — | | | | | 37,108,937 | | | | | — | | | | | 37,108,937 | |
Tennessee | | | | — | | | | | 16,669,885 | | | | | — | | | | | 16,669,885 | |
Texas | | | | — | | | | | 998,171,109 | | | | | — | | | | | 998,171,109 | |
U.S. Possessions | | | | — | | | | | 471,067,504 | | | | | — | | | | | 471,067,504 | |
Utah | | | | — | | | | | 16,996,310 | | | | | — | | | | | 16,996,310 | |
Vermont | | | | — | | | | | 3,076,409 | | | | | — | | | | | 3,076,409 | |
Virginia | | | | — | | | | | 72,678,906 | | | | | — | | | | | 72,678,906 | |
Washington | | | | — | | | | | 182,248,506 | | | | | — | | | | | 182,248,506 | |
West Virginia | | | | — | | | | | 39,596,774 | | | | | — | | | | | 39,596,774 | |
Wisconsin | | | | — | | | | | 37,083,789 | | | | | — | | | | | 37,083,789 | |
| Corporate Bonds and Notes | | | | — | | | | | 9,992,968 | | | | | — | | | | | 9,992,968 | |
| Common Stocks | | | | 1,253,354 | | | | | — | | | | | — | | | | | 1,253,354 | |
| Preferred Stocks | | | | — | | | | | — | | | | | 6 | | | | | 6 | |
| Rights, Warrants, and Certificates | | | | 967,090 | | | | | — | | | | | — | | | | | 967,090 | |
| | | |
|
|
| | |
|
|
| | |
|
|
| | |
|
|
|
| Total Assets | | | $ | 2,220,444 | | | | $ | 8,120,795,419 | | | | $ | 11,643,128 | | | | $ | 8,134,658,991 | |
| | | |
|
|
| | |
|
|
| | |
|
|
| | |
|
|
|
Currency contracts and forwards, if any, are reported at their unrealized appreciation/depreciation at measurement date, which represents the change in the contract’s value from trade date. Futures, if any, are reported at their variation margin at measurement date, which represents the amount due to/from the Fund at that date. All additional assets and liabilities included in the above table are reported at their market value at measurement date.
There have been no significant changes to the fair valuation methodologies of the Fund during the period.
| | | | |
| 96 | | | | OPPENHEIMER ROCHESTER NATIONAL MUNICIPALS |
3. Shares of Beneficial Interest
The Fund has authorized an unlimited number of no par value shares of beneficial interest of each class. Transactions in shares of beneficial interest were as follows:
| | | | | | | | | | | | | | | | |
| | | Year Ended July 31, 2012 | | | Year Ended July 29, 20111 | |
| | | Shares | | | Amount | | | Shares | | | Amount | |
| Class A | | | | | | | | | | | | | | | | |
| Sold | | | 156,963,967 | | | $ | 1,112,830,969 | | | | 174,837,734 | | | $ | 1,189,348,314 | |
| Dividends and/or distributions reinvested | | | 30,868,483 | | | | 218,878,664 | | | | 29,980,327 | | | | 204,080,360 | |
| Redeemed | | | (166,936,412 | ) | | | (1,166,784,008 | ) | | | (279,864,047 | ) | | | (1,886,452,192 | ) |
| | |
|
|
|
| Net increase (decrease) | | | 20,896,038 | | | $ | 164,925,625 | | | | (75,045,986 | ) | | $ | (493,023,518 | ) |
| | |
|
|
|
| | | | | | | | | | | | | | | | | |
| Class B | | | | | | | | | | | | | | | | |
| Sold | | | 3,793,692 | | | $ | 26,995,638 | | | | 3,931,229 | | | $ | 27,120,677 | |
| Dividends and/or distributions reinvested | | | 1,083,781 | | | | 7,702,380 | | | | 1,173,415 | | | | 8,012,346 | |
| Redeemed | | | (6,862,389 | ) | | | (48,570,567 | ) | | | (13,208,670 | ) | | | (90,234,060 | ) |
| | |
|
|
|
| Net decrease | | | (1,984,916 | ) | | $ | (13,872,549 | ) | | | (8,104,026 | ) | | $ | (55,101,037 | ) |
| | |
|
|
|
| | | | | | | | | | | | | | | | | |
| Class C | | | | | | | | | | | | | | | | |
| Sold | | | 41,563,092 | | | $ | 294,751,702 | | | | 40,166,268 | | | $ | 275,191,255 | |
| Dividends and/or distributions reinvested | | | 10,213,554 | | | | 72,200,250 | | | | 9,982,619 | | | | 67,768,179 | |
| Redeemed | | | (40,136,991 | ) | | | (281,685,854 | ) | | | (76,950,092 | ) | | | (516,655,769 | ) |
| | |
|
|
|
| Net increase (decrease) | | | 11,639,655 | | | $ | 85,266,098 | | | | (26,801,205 | ) | | $ | (173,696,335 | ) |
| | |
|
|
|
| | | | | | | | | | | | | | | | | |
| Class Y | | | | | | | | | | | | | | | | |
| Sold | | | 60,733,470 | | | $ | 426,835,262 | | | | 26,073,100 | | | $ | 171,623,150 | |
| Dividends and/or distributions reinvested | | | 2,486,782 | | | | 17,761,474 | | | | 453,856 | | | | 3,063,279 | |
| Redeemed | | | (19,231,279 | ) | | | (134,773,171 | ) | | | (1,541,663 | ) | | | (10,367,134 | ) |
| | |
|
|
|
| Net increase | | | 43,988,973 | | | $ | 309,823,565 | | | | 24,985,293 | | | $ | 164,319,295 | |
| | |
|
|
|
1. For the year ended July 29, 2011, for Class A, Class B and Class C shares, and for the period from November 29, 2010 (inception of offering) to July 29, 2011, for Class Y shares.
4. Purchases and Sales of Securities
The aggregate cost of purchases and proceeds from sales of securities, other than short-term obligations, for the year ended July 31, 2012, were as follows:
| | | | | | | | |
| | | Purchases | | | Sales | |
| Investment securities | | $ | 1,253,191,697 | | | $ | 798,278,237 | |
| | | | |
| 97 | | | | OPPENHEIMER ROCHESTER NATIONAL MUNICIPALS |
NOTES TO FINANCIAL STATEMENTS Continued
5. Fees and Other Transactions with Affiliates
Management Fees. Under the investment advisory agreement, the Fund pays the Manager a management fee based on the daily net assets of the Fund at an annual rate as shown in the following table:
| | | | |
| Fee Schedule | | | |
| Up to $200 million | | | 0.60 | % |
| Next $100 million | | | 0.55 | |
| Next $200 million | | | 0.50 | |
| Next $250 million | | | 0.45 | |
| Next $250 million | | | 0.40 | |
| Next $10 billion | | | 0.35 | |
| Over $11 billion | | | 0.34 | |
Administration Service Fees. The Fund pays the Manager a fee of $1,500 per year for preparing and filing the Fund’s tax returns.
Transfer Agent Fees. OppenheimerFunds Services (“OFS”), a division of the Manager, acts as the transfer and shareholder servicing agent for the Fund. The Fund pays OFS a per account fee. For the year ended July 31, 2012, the Fund paid $3,413,826 to OFS for services to the Fund.
Additionally, Class Y shares are subject to minimum fees of $10,000 annually for assets of $10 million or more. The Class Y shares are subject to the minimum fees in the event that the per account fee does not equal or exceed the applicable minimum fees. OFS may voluntarily waive the minimum fees.
Distribution and Service Plan (12b-1) Fees. Under its General Distributor’s Agreement with the Fund, OppenheimerFunds Distributor, Inc. (the “Distributor”) acts as the Fund’s principal underwriter in the continuous public offering of the Fund’s classes of shares.
Service Plan for Class A Shares. The Fund has adopted a Service Plan (the “Plan”) for Class A shares under Rule 12b-1 of the Investment Company Act of 1940. Under the Plan, the Fund reimburses the Distributor for a portion of its costs incurred for services provided to accounts that hold Class A shares. Reimbursement is made periodically at an annual rate of up to 0.15% of the daily net assets of Class A shares of the Fund. The Distributor currently uses all of those fees to pay dealers, brokers, banks and other financial institutions periodically for providing personal service and maintenance of accounts of their customers that hold Class A shares. Any unreimbursed expenses the Distributor incurs with respect to Class A shares in any fiscal year cannot be recovered in subsequent periods. Fees incurred by the Fund under the Plan are detailed in the Statement of Operations.
Distribution and Service Plans for Class B and Class C Shares. The Fund has adopted Distribution and Service Plans (the “Plans”) for Class B and Class C shares under Rule 12b-1 of the Investment Company Act of 1940 to compensate the Distributor for its services in connection with the distribution of those shares and servicing accounts. Under the Plans, the Fund pays the Distributor an annual asset-based sales charge of 0.75% on Class B and
| | | | |
| 98 | | | | OPPENHEIMER ROCHESTER NATIONAL MUNICIPALS |
Class C shares daily net assets. The Distributor also receives a service fee of 0.15% per year under each plan. If either the Class B or Class C plan is terminated by the Fund or by the shareholders of a class, the Board of Trustees and its independent trustees must determine whether the Distributor shall be entitled to payment from the Fund of all or a portion of the service fee and/or asset-based sales charge in respect to shares sold prior to the effective date of such termination. Fees incurred by the Fund under the Plans are detailed in the Statement of Operations. The Distributor determines its uncompensated expenses under the Plans at calendar quarter ends. The Distributor’s aggregate uncompensated expenses under the Plans at June 30, 2012 were as follows:
| | | | |
| Class B | | $ | 13,909,147 | |
| Class C | | | 38,956,791 | |
Sales Charges. Front-end sales charges and contingent deferred sales charges (“CDSC”) do not represent expenses of the Fund. They are deducted from the proceeds of sales of Fund shares prior to investment or from redemption proceeds prior to remittance, as applicable. The sales charges retained by the Distributor from the sale of shares and the CDSC retained by the Distributor on the redemption of shares is shown in the following table for the period indicated.
| | | | | | | | | | | | | | | | |
| Year Ended | | Class A Front-End
Sales Charges
Retained by
Distributor | | | Class A
Contingent
Deferred
Sales Charges
Retained by
Distributor | | | Class B Contingent
Deferred
Sales Charges
Retained by
Distributor | | | Class C
Contingent
Deferred
Sales Charges
Retained by
Distributor | |
| July 31, 2012 | | $ | 1,648,841 | | | $ | 218,832 | | | $ | 292,814 | | | $ | 143,883 | |
Waivers and Reimbursements of Expenses. The Manager has voluntarily agreed to reimburse the Fund for a portion of the legal costs and fees incurred in connection with the pending litigation matters discussed in the “Pending Litigation” note which appears later in this report. During the year ended July 31, 2012, the Manager reimbursed the Fund $88,701 for legal costs and fees.
OFS has voluntarily agreed to limit transfer and shareholder servicing agent fees for Classes B, C and Y shares to 0.35% of average annual net assets per class; this limit also applied to Class A shares prior to October 1, 2011. Effective October 1, 2011, OFS has voluntarily agreed to limit its fees for Class A shares to 0.30% of average annual net assets of the class.
Some of these undertakings may be modified or terminated at any time; some may not be modified or terminated until after one year from the date of the current prospectus, as indicated therein.
6. Restricted Securities
As of July 31, 2012, investments in securities included issues that are restricted. A restricted security may have a contractual restriction on its resale and is valued under methods approved by the Board of Trustees as reflecting fair value. Securities that are restricted are
| | | | |
| 99 | | | | OPPENHEIMER ROCHESTER NATIONAL MUNICIPALS |
NOTES TO FINANCIAL STATEMENTS Continued
6. Restricted Securities Continued
marked with an applicable footnote on the Statement of Investments. Restricted securities are reported on a schedule following the Statement of Investments.
7. Borrowings
The Fund can borrow money from banks in amounts up to one third of its total assets (including the amount borrowed) less all liabilities and indebtedness other than borrowings (meaning that the value of those assets must be at least 300% of the amount borrowed). The Fund can use those borrowings for investment-related purposes such as purchasing portfolio securities. The Fund also may borrow to meet redemption obligations or for temporary and emergency purposes. When the Fund invests borrowed money in portfolio securities, it is using a speculative investment technique known as leverage and changes in the value of the Fund’s investments will have a larger effect on its share price than if it did not borrow because of the effect of leverage.
The Fund can also use the borrowings for other investment-related purposes, including in connection with the Fund’s inverse floater investments as discussed in Note 1. The Fund may use the borrowings to reduce the leverage amount of, or unwind or “collapse” trusts that issued “inverse floaters” owned by the Fund, or in circumstances in which the Fund has entered into a shortfall and forbearance agreement with the sponsor of the inverse floater trust to meet the Fund’s obligation to reimburse the sponsor of the inverse floater for the difference between the liquidation value of the underlying bond and the amount due to holders of the short-term floating rate notes issued by the Trust. See the discussion in Note 1 (Inverse Floating Rate Securities) for additional information.
The Fund will pay interest and may pay other fees in connection with loans. If the Fund does borrow, it will be subject to greater expenses than funds that do not borrow. The interest on borrowed money and the other fees incurred in conjunction with loans are an expense that might reduce the Fund’s yield and return. Expenses incurred by the Fund with respect to interest on borrowings and commitment fees are disclosed separately or as other expenses on the Statement of Operations.
The Fund entered into a Revolving Credit and Security Agreement (the “Agreement”) with conduit lenders and Citibank N.A. which enables it to participate with certain other Oppenheimer funds in a committed, secured borrowing facility that permits borrowings of up to $2.0 billion, collectively, by the Oppenheimer Rochester Funds. The Agreement’s terms specifically limit individual borrowings of the Fund to $1.0 billion. To secure the loan, the Fund pledges investment securities in accordance with the terms of the Agreement. Securities held in collateralized accounts to cover these borrowings are noted in the Statement of Investments. Interest is charged to the Fund, based on its borrowings, at current commercial paper issuance rates (0.3384% as of July 31, 2012). The Fund pays additional fees annually to its lender on its outstanding borrowings to manage and administer the facility and is allocated its pro-rata share of an annual structuring fee and ongoing commitment fees both of which are based on the total facility size. Total fees and interest that are included in expenses on the Fund’s Statement of Operations related to its
| | | | |
| 100 | | | | OPPENHEIMER ROCHESTER NATIONAL MUNICIPALS |
participation in the borrowing facility during the year ended July 31, 2012 equal 0.09% of the Fund’s average net assets on an annualized basis. The Fund has the right to prepay such loans and terminate its participation in the conduit loan facility at any time upon prior notice.
As of July 31, 2012, the Fund had borrowings outstanding at an interest rate of 0.338%. Details of the borrowings for the year ended July 31, 2012 are as follows:
| | | | |
| Average Daily Loan Balance | | $ | 59,101,913 | |
| Average Daily Interest Rate | | | 0.274 | % |
| Fees Paid | | $ | 6,169,020 | |
| Interest Paid | | $ | 135,634 | |
8. Reverse Repurchase Agreements
The Fund may engage in reverse repurchase agreements. A reverse repurchase agreement is the sale of one or more securities to a counterparty at an agreed-upon purchase price with the simultaneous agreement to repurchase those securities on a future date at a higher repurchase price. The repurchase price represents the repayment of the purchase price and interest accrued thereon over the term of the repurchase agreement. The cash received by the Fund in connection with a reverse repurchase agreement may be used for investment-related purposes such as purchasing portfolio securities or for other purposes such as those described in the preceding “Borrowings” note.
The Fund entered into a Committed Repurchase Transaction Facility (the “Facility”) with J.P. Morgan Securities LLC (the “counterparty’) which enables it to participate with certain other Oppenheimer funds in a committed reverse repurchase agreement facility that permits aggregate outstanding reverse repurchase agreements of up to $750 million, collectively. Interest is charged to the Fund on the purchase price of outstanding reverse repurchase agreements at current LIBOR rates plus an applicable spread. The Fund is also allocated its pro-rata share of an annual structuring fee based on the total Facility size and ongoing commitment fees based on the total unused amount of the Facility. The Fund retains the economic exposure to fluctuations in the value of securities subject to reverse repurchase agreements under the Facility and therefore these transactions are considered secured borrowings for financial reporting purposes. The Fund also continues to receive the economic benefit of interest payments received on securities subject to reverse repurchase agreements, in the form of a direct payment from the counterparty. These payments are included in interest income on the Statement of Operations. Total fees and interest related to the Fund’s participation in the Facility during the year ended July 31, 2012 are included in expenses on the Fund’s Statement of Operations and equal 0.03% of the Fund’s average net assets on an annualized basis.
The securities subject to reverse repurchase agreements under the Facility are valued on a daily basis. To the extent this value, after adjusting for certain margin requirements of the Facility, exceeds the cash proceeds received, the Fund may request the counterparty to return securities equal in margin value to this excess. To the extent that the cash proceeds received exceed the margin value of the securities subject to the transaction, the
| | | | |
| 101 | | | | OPPENHEIMER ROCHESTER NATIONAL MUNICIPALS |
NOTES TO FINANCIAL STATEMENTS Continued
8. Reverse Repurchase Agreements Continued
counterparty may request additional securities from the Fund. The Fund has the right to declare the first or fifteenth day of any calendar month as the repurchase date for any outstanding reverse repurchase agreement upon delivery of advanced notification and may also recall any security subject to such a transaction by substituting eligible securities of equal or greater margin value according to the Facility’s terms.
Securities subject to reverse repurchase agreements are separately noted in the Statement of Investments.
Details of reverse repurchase agreement transactions for the year ended July 31, 2012 are as follows:
| | | | |
| Average Outstanding Daily Balance | | $ | 382,514 | |
| Average Daily Interest Rate | | | 1.688 | % |
| Fees Paid | | $ | 2,081,575 | |
| Interest Paid | | $ | 14,528 | |
9. Pending Litigation
Since 2009, a number of class action, derivative and individual lawsuits have been pending in federal and state courts against OppenheimerFunds, Inc., the Fund’s investment advisor (the “Manager”), OppenheimerFunds Distributor, Inc., the Fund’s principal underwriter and distributor (the “Distributor”), and certain funds—including the Fund—advised by the Manager and distributed by the Distributor (the “Defendant Funds”). Several of these lawsuits also name as defendants certain officers and current and former trustees of the respective Defendant Funds. The lawsuits raise claims under federal securities law and allege, among other things, that the disclosure documents of the respective Defendant Funds contained misrepresentations and omissions and that the respective Defendant Funds’ investment policies were not followed. The plaintiffs in these actions seek unspecified damages, equitable relief and awards of attorneys’ fees and litigation expenses. The Defendant Funds’ Boards of Trustees have also engaged counsel to represent the Funds and the present and former Independent Trustees named in those suits.
Other class action and individual lawsuits have been filed since 2008 in various state and federal courts against the Manager and certain of its affiliates by investors seeking to recover investments they allegedly lost as a result of the “Ponzi” scheme run by Bernard L. Madoff and his firm, Bernard L. Madoff Investment Securities, LLC (“BLMIS”). Plaintiffs in these suits allege that they suffered losses as a result of their investments in several funds managed by an affiliate of the Manager and assert a variety of claims, including breach of fiduciary duty, fraud, negligent misrepresentation, unjust enrichment, and violation of federal and state securities laws and regulations, among others. They seek unspecified damages, equitable relief and awards of attorneys’ fees and litigation expenses. Neither the Distributor, nor any of the Oppenheimer mutual funds, their independent trustees or directors are named as defendants in these lawsuits. None of the Oppenheimer mutual funds invested in any funds or accounts managed by Madoff or BLMIS. On February 28, 2011, a stipulation of partial settlement of three groups of consolidated putative class
| | | | |
| 102 | | | | OPPENHEIMER ROCHESTER NATIONAL MUNICIPALS |
action lawsuits relating to these matters was filed in the U.S. District Court for the Southern District of New York. On August 19, 2011, the court entered an order and final judgment approving the settlement as fair, reasonable and adequate. In September 2011, certain parties filed notices of appeal from the court’s order approving the settlement. On July 29, 2011, a stipulation of settlement between certain affiliates of the Manager and the Trustee appointed under the Securities Investor Protection Act to liquidate BLMIS was filed in the U.S. Bankruptcy Court for the Southern District of New York to resolve purported preference and fraudulent transfer claims by the Trustee. On September 22, 2011, the court entered an order approving the settlement as fair, reasonable and adequate. In October 2011, certain parties filed notices of appeal from the court’s order approving the settlement. In June 2012, the court granted appellees’ motion to dismiss the appeal. The aforementioned settlements do not resolve other outstanding lawsuits against the Manager and its affiliates relating to BLMIS.
On April 16, 2010, a lawsuit was filed in New York state court against the Manager, an affiliate of the Manager and AAArdvark IV Funding Limited (“AAArdvark IV”), an entity advised by the Manager’s affiliate, in connection with investments made by the plaintiffs in AAArdvark IV. Plaintiffs allege breach of contract against the defendants and seek compensatory damages, costs and disbursements, including attorney fees. On July 15, 2011, a lawsuit was filed in New York state court against the Manager, an affiliate of the Manager and AAArdvark Funding Limited (“AAArdvark I”), an entity advised by the Manager’s affiliate, in connection with investments made by the plaintiffs in AAArdvark I. The complaint alleges breach of contract against the defendants and seeks compensatory damages, costs and disbursements, including attorney fees. On November 9, 2011, a lawsuit was filed in New York state court against the Manager, an affiliate of the Manager and AAArdvark XS Funding Limited (“AAArdvark XS”), an entity advised by the Manager’s affiliate, in connection with investments made by the plaintiffs in AAArdvark XS. The complaint alleges breach of contract against the defendants and seeks compensatory damages, costs and disbursements, including attorney fees.
The Manager believes the lawsuits and appeals described above are without legal merit and, with the exception of actions it has settled, is defending against them vigorously. While it is premature to render any opinion as to the outcome in these lawsuits, or whether any costs that the Defendant Funds may bear in defending the suits might not be reimbursed by insurance, the Manager believes that these suits should not impair the ability of the Manager or the Distributor to perform their respective duties to the Fund, and that the outcome of all of the suits together should not have any material effect on the operations of any of the Oppenheimer mutual funds.
| | | | |
| 103 | | | | OPPENHEIMER ROCHESTER NATIONAL MUNICIPALS |
REPORT OF INDEPENDENT REGISTERED PUBLIC ACCOUNTING FIRM
The Board of Trustees and Shareholders of Oppenheimer Multi-State Municipal Trust:
We have audited the accompanying statement of assets and liabilities of Oppenheimer Rochester National Municipals (a separate series of the Oppenheimer Multi-State Municipal Trust), including the statement of investments, as of July 31, 2012, and the related statements of operations and cash flows for the year then ended, the statements of changes in net assets for each of the years or periods in the two-year period then ended, and the financial highlights for each of the years in the five-year period then ended. These financial statements and financial highlights are the responsibility of the Fund’s management. Our responsibility is to express an opinion on these financial statements and financial highlights based on our audits.
We conducted our audits in accordance with the standards of the Public Company Accounting Oversight Board (United States). Those standards require that we plan and perform the audit to obtain reasonable assurance about whether the financial statements and financial highlights are free of material misstatement. An audit includes examining, on a test basis, evidence supporting the amounts and disclosures in the financial statements. Our procedures included confirmation of securities owned as of July 31, 2012, by correspondence with the custodian, and brokers, or by other appropriate auditing procedures where replies from brokers were not received. An audit also includes assessing the accounting principles used and significant estimates made by management, as well as evaluating the overall financial statement presentation. We believe that our audits provide a reasonable basis for our opinion.
In our opinion, the financial statements and financial highlights referred to above present fairly, in all material respects, the financial position of Oppenheimer Rochester National Municipals as of July 31, 2012, the results of its operations and cash flows for the year then ended, the changes in its net assets for each of the years in the two-year period then ended, and the financial highlights for each of the years or periods in the five-year period then ended, in conformity with U.S. generally accepted accounting principles.
KPMGLLP
Denver, Colorado
September 19, 2012
| | | | |
| 104 | | | | OPPENHEIMER ROCHESTER NATIONAL MUNICIPALS |
CREDIT ALLOCATION Unaudited
This table provides further information regarding the “Unrated” securities category shown in the “Credit Allocation-Credit Rating Breakdown” table located earlier in this report. The third column below titled “Unrated by a NRSRO; Internally Rated by the Manager” shows the credit allocation of Unrated securities as determined by the Fund’s investment adviser, OppenheimerFunds, Inc. (the “Manager”). These internally rated securities are not rated by any nationally recognized statistical rating organization (NRSRO), such as Standard & Poor’s.
The Manager determines the credit allocation of these securities using its own credit analysis to assign ratings using a rating scale or categories similar to that used by S&P. The Manager is not required to, and does not attempt to, employ the same credit analysis process, procedures or methodologies used by S&P or any other NRSRO in assigning a credit rating to an Unrated security. There can be no assurance, nor is it intended, that the Manager’s credit analysis process is consistent or comparable with the credit analysis process that would be used by S&P or any other NRSRO if it were to rate the same security. Securities rated investment-grade or above by the Manager may or may not be the equivalent to an investment grade or above rating assigned by an NRSRO. More information about the Manager’s internal credit analysis process for Unrated (or internally-rated) securities and securities ratings is contained in the Fund’s Prospectus and Statement of Additional Information.
The second column below titled “NRSRO-Rated” shows the ratings by nationally recognized statistical rating organizations (NRSROs), such as Standard & Poor’s. For securities rated by an NRSRO other than S&P, the Manager converts that rating to the equivalent S&P rating. If two or more NRSROs have assigned a rating to a security, the highest rating is used.
The credit allocations below are as of July 31, 2012 and are subject to change. The percentages are based on the market value of the Fund’s securities as of July 31, 2012 and are subject to change; market value does not include cash. AAA, AA, A, and BBB are investment-grade ratings.
| | | | | | | | | | | | |
| | | NRSRO-Rated | | | Unrated by
a NRSRO;
Internally
Rated by
the Manager | | | Total | |
| AAA | | | 6.8 | % | | | 0.0 | % | | | 6.8 | % |
| AA | | | 22.1 | | | | 0.5 | | | | 22.6 | |
| A | | | 9.6 | | | | 0.1 | | | | 9.7 | |
| BBB | | | 10.1 | | | | 5.0 | | | | 15.1 | |
| BB or lower | | | 16.4 | | | | 29.4 | | | | 45.8 | |
| | |
|
|
|
| Total | | | 65.0 | % | | | 35.0 | % | | | 100.0 | % |
| | |
|
|
|
| | | | |
| 105 | | | | OPPENHEIMER ROCHESTER NATIONAL MUNICIPALS |
FEDERAL INCOME TAX INFORMATION Unaudited
In early 2012, if applicable, shareholders of record received information regarding all dividends and distributions paid to them by the Fund during calendar year 2011.
None of the dividends paid by the Fund during the fiscal year ended July 31, 2012 are eligible for the corporate dividend-received deduction. 98.85% of the dividends were derived from interest on municipal bonds and are not subject to federal income taxes. To the extent a shareholder is subject to any state or local tax laws, some or all of the dividends received may be taxable.
The foregoing information is presented to assist shareholders in reporting distributions received from the Fund to the Internal Revenue Service. Because of the complexity of the federal regulations which may affect your individual tax return and the many variations in state and local tax regulations, we recommend that you consult your tax advisor for specific guidance.
| | | | |
| 106 | | | | OPPENHEIMER ROCHESTER NATIONAL MUNICIPALS |
PORTFOLIO PROXY VOTING POLICIES AND PROCEDURES;
UPDATES TO STATEMENTS OF INVESTMENTS Unaudited
The Fund has adopted Portfolio Proxy Voting Policies and Procedures under which the Fund votes proxies relating to securities (“portfolio proxies”) held by the Fund. A description of the Fund’s Portfolio Proxy Voting Policies and Procedures is available (i) without charge, upon request, by calling the Fund toll-free at 1.800.CALL OPP (225.5677), (ii) on the Fund’s website at oppenheimerfunds.com, and (iii) on the SEC’s website at www.sec.gov. In addition, the Fund is required to file Form N-PX, with its complete proxy voting record for the 12 months ended June 30th, no later than August 31st of each year. The Fund’s voting record is available (i) without charge, upon request, by calling the Fund toll-free at 1.800.CALL OPP (225.5677), and (ii) in the Form N-PX filing on the SEC’s website at www.sec.gov.
The Fund files its complete schedule of portfolio holdings with the SEC for the first quarter and the third quarter of each fiscal year on Form N-Q. The Fund’s Form N-Q filings are available on the SEC’s website at www.sec.gov. Those forms may be reviewed and copied at the SEC’s Public Reference Room in Washington, D.C. Information on the operation of the Public Reference Room may be obtained by calling 1-800-SEC-0330.
Householding—Delivery of Shareholder Documents
This is to inform you about OppenheimerFunds’ “householding” policy. If more than one member of your household maintains an account in a particular fund, OppenheimerFunds will mail only one copy of the fund’s prospectus (or, if available, the fund’s summary prospectus), annual and semiannual report and privacy policy. The consolidation of these mailings, called householding, benefits your fund through reduced mailing expense, and benefits you by reducing the volume of mail you receive from OppenheimerFunds. Householding does not affect the delivery of your account statements.
Please note that we will continue to household these mailings for as long as you remain an OppenheimerFunds shareholder, unless you request otherwise. If you prefer to receive multiple copies of these materials, please call us at 1.800.CALL-OPP (225-5677). You may also notify us in writing or via email. We will begin sending you individual copies of the prospectus (or, if available, the summary prospectus), reports and privacy policy within 30 days of receiving your request to stop householding.
| | | | |
| 107 | | | | OPPENHEIMER ROCHESTER NATIONAL MUNICIPALS |
TRUSTEES AND OFFICERS Unaudited
| | |
| Name, Position(s) Held with the Fund, Length of Service, Age | | Principal Occupation(s) During the Past 5 Years; Other Trusteeships/Directorships Held; Number of Portfolios in the Fund Complex Currently Overseen |
| |
| INDEPENDENT TRUSTEES | | The address of each Trustee in the chart below is 6803 S. Tucson Way, Centennial, Colorado 80112-3924. Each Trustee serves for an indefinite term, or until his or her resignation, retirement, death or removal. |
| |
Brian F. Wruble, Chairman of the Board of Trustees (since 2007), Trustee (since 2005) Age: 69 | | Director of Community Foundation of the Florida Keys (non-profit) (July 2012-June 2013); Chairman Emeritus and Non-Voting Trustee of The Jackson Laboratory (non-profit) (since August 2011); Director of Special Value Opportunities Fund, LLC (registered investment company) (affiliate of the Manager’s parent company) (since September 2004); Member of Zurich Financial Investment Management Advisory Council (insurance) (since 2004); Treasurer (since 2007) and Trustee of the Institute for Advanced Study (non-profit educational institute) (since May 1992); Chairman (August 2007-July 2011) and Trustee (August 1991-July 2011) of the Board of Trustees of The Jackson Laboratory (non-profit); General Partner of Odyssey Partners, L.P. (hedge fund) (September 1995-December 2007); Special Limited Partner of Odyssey Investment Partners, LLC (private equity investment) (January 1999-September 2004). Oversees 58 portfolios in the OppenheimerFunds complex. Mr. Wruble has served on the Boards of certain Oppenheimer funds since April 2001, during which time he has become familiar with the Fund’s (and other Oppenheimer funds’) financial, accounting, regulatory and investment matters and has contributed to the Boards’ deliberations. |
| |
David K. Downes, Trustee (since 2007) Age: 72 | | Director of THL Credit Inc. (since June 2009); Independent Chairman GSK Employee Benefit Trust (since April 2006); Trustee of Employee Trusts (since January 2006); Chief Executive Officer and Board Member of Community Capital Management (investment management company) (since January 2004); President of The Community Reinvestment Act Qualified Investment Fund (investment management company) (since 2004); Director of Internet Capital Group (information technology company) (since October 2003); Director of Correctnet (January 2006-2007); Independent Chairman of the Board of Trustees of Quaker Investment Trust (registered investment company) (2004-2007); Chief Operating Officer and Chief Financial Officer of Lincoln National Investment Companies, Inc. (subsidiary of Lincoln National Corporation, a publicly traded company) and Delaware Investments U.S., Inc. (investment management subsidiary of Lincoln National Corporation) (1993-2003); President, Chief Executive Officer and Trustee of Delaware Investment Family of Funds (1993-2003); President and Board Member of Lincoln National Convertible Securities Funds, Inc. and the Lincoln National Income Funds, TDC (1993-2003); Chairman and Chief Executive Officer of Retirement Financial Services, Inc. (registered transfer agent and investment adviser and subsidiary of Delaware Investments U.S., Inc.) (1993-2003); President and Chief Executive Officer of Delaware Service Company, Inc. (1995-2003); Chief Administrative Officer, Chief Financial Officer, Vice Chairman and Director of Equitable Capital Management Corporation (investment subsidiary of Equitable Life Assurance Society) (1985-1992); Corporate Controller of Merrill Lynch Company (financial services holding company) (1977-1985); held the following positions at the Colonial Penn Group, Inc. (insurance company): Corporate Budget Director (1974-1977), Assistant Treasurer (1972-1974) and Director of Corporate Taxes (1969-1972); held the following positions at Price Waterhouse Company (financial services firm): Tax Manager (1967-1969), Tax Senior (1965-1967) and Staff Accountant (1963-1965); United States Marine Corps (1957-1959). Oversees 58 portfolios in the OppenheimerFunds complex. Mr. Downes has served on the Boards of certain Oppenheimer funds since December 2005, |
| | | | |
| 108 | | | | OPPENHEIMER ROCHESTER NATIONAL MUNICIPALS |
| | |
David K. Downes,
Continued | | during which time he has become familiar with the Fund’s (and other Oppenheimer funds’) financial, accounting, regulatory and investment matters and has contributed to the Boards’ deliberations. |
| |
Matthew P. Fink, Trustee (since 2005) Age: 71 | | Trustee of the Committee for Economic Development (policy research foundation) (2005-2011); Director of ICI Education Foundation (education foundation) (October 1991-August 2006); President of the Investment Company Institute (trade association) (October 1991-June 2004); Director of ICI Mutual Insurance Company (insurance company) (October 1991-June 2004); Author of The Rise of Mutual Funds: An Insider’s View published by Oxford University Press (second edition 2010). Oversees 58 portfolios in the OppenheimerFunds complex. Mr. Fink has served on the Boards of certain Oppenheimer funds since January 2005, during which time he has become familiar with the Fund’s (and other Oppenheimer funds’) financial, accounting, regulatory and investment matters and has contributed to the Boards’ deliberations. |
| |
Phillip A. Griffiths, Trustee (since 1999) Age: 73 | | Fellow of the Carnegie Corporation (since 2007); Member of the National Academy of Sciences (since 1979); Council on Foreign Relations (since 2002); Foreign Associate of Third World Academy of Sciences (since 2002); Chair of Science Initiative Group (since 1999); Member of the American Philosophical Society (since 1996); Trustee of Woodward Academy (since 1983); Director of GSI Lumonics Inc. (precision technology products company) (2001-2010); Senior Advisor of The Andrew W. Mellon Foundation (2001-2010); Distinguished Presidential Fellow for International Affairs of the National Academy of Science (2002-2010); Director of the Institute for Advanced Study (1991-2004); Director of Bankers Trust New York Corporation (1994-1999); Provost at Duke University (1983-1991). Oversees 58 portfolios in the OppenheimerFunds complex. Mr. Griffiths has served on the Boards of certain Oppenheimer funds since June 1999, during which time he has become familiar with the Fund’s (and other Oppenheimer funds’) financial, accounting, regulatory and investment matters and has contributed to the Boards’ deliberations. |
| |
Mary F. Miller, Trustee (since 2004) Age: 69 | | Trustee of International House (not-for-profit) (since June 2007); Trustee of the American Symphony Orchestra (not-for-profit) (October 1998-November 2011); and Senior Vice President and General Auditor of American Express Company (financial services company) (July 1998-February 2003). Oversees 58 portfolios in the OppenheimerFunds complex. Ms. Miller has served on the Boards of certain Oppenheimer funds since August 2004, during which time she has become familiar with the Fund’s (and other Oppenheimer funds’) financial, accounting, regulatory and investment matters and has contributed to the Boards’ deliberations. |
| |
Joel W. Motley, Trustee (since 2002) Age: 60 | | Director of Southern Africa Legal Services Foundation (since March 2012); Board Member of Pulitzer Center for Crisis Reporting (non-profit journalism) (since December 2010); Managing Director of Public Capital Advisors, LLC (privately-held financial advisor) (since January 2006); Managing Director of Carmona Motley, Inc. (privately-held financial advisor) (since January 2002); Director of Columbia Equity Financial Corp. (privately-held financial advisor) (2002-2007); Managing Director of Carmona Motley Hoffman Inc. (privately-held financial advisor) (January 1998-December 2001); Member of the Finance and Budget Committee of the Council on Foreign Relations, Chairman of the Investment Committee of the Episcopal Church of America, Member of the Investment Committee and Board of Human Rights Watch and Member of the Investment Committee and Board of Historic Hudson Valley. Oversees 58 |
| | | | |
| 109 | | | | OPPENHEIMER ROCHESTER NATIONAL MUNICIPALS |
TRUSTEES AND OFFICERS Unaudited / Continued
| | |
Joel W. Motley,
Continued | | portfolios in the OppenheimerFunds complex. Mr. Motley has served on the Boards of certain Oppenheimer funds since October 2002, during which time he has become familiar with the Fund’s (and other Oppenheimer funds’) financial, accounting, regulatory and investment matters and has contributed to the Boards’ deliberations. |
| |
Mary Ann Tynan, Trustee (since 2008) Age: 66 | | Director and Secretary of the Appalachian Mountain Club (non-profit outdoor organization) (since January 2012); Director of Opera House Arts (non-profit arts organization) (since October 2011); Independent Director of the ICI Board of Governors (since October 2011); Vice Chair of Board of Trustees of Brigham and Women’s/Faulkner Hospitals (non-profit hospital) (since 2000); Chair of Board of Directors of Faulkner Hospital (non-profit hospital) (since 1990); Member of Audit and Compliance Committee of Partners Health Care System (non-profit) (since 2004); Board of Trustees of Middlesex School (educational institution) (since 1994); Board of Directors of Idealswork, Inc. (financial services provider) (since 2003); Partner, Senior Vice President and Director of Regulatory Affairs of Wellington Management Company, LLP (global investment manager) (1976-2002); Vice President and Corporate Secretary, John Hancock Advisers, Inc. (mutual fund investment adviser) (1970-1976). Oversees 58 portfolios in the OppenheimerFunds complex. Ms. Tynan has served on the Boards of certain Oppenheimer funds since October 2008, during which time she has become familiar with the Fund’s (and other Oppenheimer funds’) financial, accounting, regulatory and investment matters and has contributed to the Boards’ deliberations. |
| |
Joseph M. Wikler, Trustee (since 2005) Age: 71 | | Director of C-TASC (bio-statistics services) (2007-2012); formerly, Director of the following medical device companies: Medintec (1992-2011) and Cathco (1996-2011); Member of the Investment Committee of the Associated Jewish Charities of Baltimore (since 1994); Director of Lakes Environmental Association (environmental protection organization) (1996-2008); Director of Fortis/Hartford mutual funds (1994-December 2001). Oversees 58 portfolios in the OppenheimerFunds complex. Mr. Wikler has served on the Boards of certain Oppenheimer funds since August 2005, during which time he has become familiar with the Fund’s (and other Oppenheimer funds’) financial, accounting, regulatory and investment matters and has contributed to the Boards’ deliberations. |
| |
Peter I. Wold, Trustee (since 2005) Age: 64 | | Director of Arch Coal, Inc. (since 2010); Director and Chairman of Wyoming Enhanced Oil Recovery Institute Commission (enhanced oil recovery study) (since 2004); President of Wold Oil Properties, Inc. (oil and gas exploration and production company) (since 1994); Vice President of American Talc Company, Inc. (talc mining and milling) (since 1999); Managing Member of Hole-in-the-Wall Ranch (cattle ranching) (since 1979); Director and Chairman of the Denver Branch of the Federal Reserve Bank of Kansas City (1993-1999); and Director of PacifiCorp. (electric utility) (1995-1999). Oversees 58 portfolios in the OppenheimerFunds complex. Mr. Wold has served on the Boards of certain Oppenheimer funds since August 2005, during which time he has become familiar with the Fund’s (and other Oppenheimer funds’) financial, accounting, regulatory and investment matters and has contributed to the Boards’ deliberations. |
| | | | |
| 110 | | | | OPPENHEIMER ROCHESTER NATIONAL MUNICIPALS |
| | |
| OFFICERS OF THE FUND | | The addresses of the Officers in the chart below are as follows: for Messrs. Glavin, Gabinet and Ms. Nasta, Two World Financial Center, 225 Liberty Street, New York, New York 10281-1008, for Messrs. Vandehey and Wixted, 6803 S. Tucson Way, Centennial, Colorado 80112-3924, for Messrs. Loughran, Cottier, Willis, DeMitry, Camarella, Pulire and Stein, 350 Linden Oaks, Rochester, New York 14625. Each Officer serves for an indefinite term or until his or her resignation, retirement, death or removal. |
| |
Daniel G. Loughran, Vice President (since 2005) Age: 48 | | Senior Vice President of the Manager (since July 2007); Vice President of the Manager (April 2001-June 2007) and a Portfolio Manager with the Manager (1999-2001). Team leader, a Senior Portfolio Manager, an officer and a trader for the Fund and other Oppenheimer funds. |
| |
Scott S. Cottier, Vice President (since 2005) Age: 40 | | Vice President of the Manager (since September 2002). Portfolio Manager and trader at Victory Capital Management (1999-2002). Senior Portfolio Manager, an officer and a trader for the Fund and other Oppenheimer funds. |
| |
Troy E. Willis, Vice President (since 2005) Age: 39 | | Vice President of the Manager (since July 2009); Assistant Vice President of the Manager (July 2005-June 2009). Portfolio Manager of the Manager (2003- 2005). Corporate Attorney for Southern Resource Group (1999-2003). Senior Portfolio Manager, an officer and a trader for the Fund and other Oppenheimer funds. |
| |
Mark R. DeMitry, Vice President (since 2009) Age: 36 | | Vice President of the Manager (since July 2009); Associate Portfolio Manager of the Fund (September 2006- June 2009). Research Analyst of the Manager (June 2003-September 2006) and a Credit Analyst of the Manager (July 2001-May 2003). Senior Portfolio Manager, an officer and a trader for the Fund and other Oppenheimer funds. |
| |
Michael L. Camarella, Vice President (since 2009) Age: 36 | | Vice President of the Manager (since January 2011); Assistant Vice President of the Manager (July 2009-December 2010); Associate Portfolio Manager of the Manager (January 2008-November 2010). Research Analyst of the Manager (April 2006-December 2007) and a Credit Analyst of the Manager (June 2003-March 2006). Senior Portfolio Manager, an officer and a trader for the Fund and other Oppenheimer funds. |
| |
Charles S. Pulire, Vice President (since 2011) Age: 35 | | Assistant Vice President of the Manager (since December 2010); Research Analyst of the Manager (January 2008-November 2010); Credit Analyst of the Manager (May 2006-February 2008). Portfolio Manager, an officer and a trader for the Fund and other Oppenheimer funds. |
| |
Richard A. Stein, Vice President (since 2007) Age: 54 | | Director of the Rochester Credit Analysis team (since March 2004); Senior Vice President of the Manager (since June 2011) and a Vice President of the Manager (1997-May 2011); headed Rochester’s Credit Analysis team (since May 1993). |
| |
William F. Glavin, Jr., President and Principal Executive Officer (since 2009) Age: 53 | | Chairman of the Manager (since December 2009); Chief Executive Officer and Director of the Manager (since January 2009); President of the Manager (since May 2009); Director of Oppenheimer Acquisition Corp. (“OAC”) (the Manager’s parent holding company) (since June 2009); Executive Vice President (March 2006-February 2009) and Chief Operating Officer (July 2007-February 2009) of Massachusetts Mutual Life Insurance Company (OAC’s parent company); Director (May 2004-March 2006) and Chief Operating Officer and Chief Compliance Officer (May 2004-January 2005), President (January 2005-March 2006) and Chief Executive Officer (June 2005-March 2006) of Babson Capital Management LLC; Director (March 2005-March 2006), President (May |
| | | | |
| 111 | | | | OPPENHEIMER ROCHESTER NATIONAL MUNICIPALS |
TRUSTEES AND OFFICERS Unaudited / Continued
| | |
| William F. Glavin, Jr., Continued | | 2003-March 2006) and Chief Compliance Officer (July 2005-March 2006) of Babson Capital Securities, Inc. (a broker-dealer); President (May 2003-March 2006) of Babson Investment Company, Inc.; Director (May 2004-August 2006) of Babson Capital Europe Limited; Director (May 2004-October 2006) of Babson Capital Guernsey Limited; Director (May 2004-March 2006) of Babson Capital Management LLC; Non-Executive Director (March 2005-March 2007) of Baring Asset Management Limited; Director (February 2005-June 2006) Baring Pension Trustees Limited; Director and Treasurer (December 2003-November 2006) of Charter Oak Capital Management, Inc.; Director (May 2006-September 2006) of C.M. Benefit Insurance Company; Director (May 2008-June 2009) and Executive Vice President (June 2007-July 2009) of C.M. Life Insurance Company; President (March 2006-May 2007) of MassMutual Assignment Company; Director (January 2005-December 2006), Deputy Chairman (March 2005-December 2006) and President (February 2005-March 2005) of MassMutual Holdings (Bermuda) Limited; Director (May 2008-June 2009) and Executive Vice President (June 2007-July 2009) of MML Bay State Life Insurance Company; Chief Executive Officer and President (April 2007-January 2009) of MML Distributors, LLC; and Chairman (March 2006-December 2008) and Chief Executive Officer (May 2007-December 2008) of MML Investors Services, Inc. Oversees 63 portfolios as a Trustee/Director and 95 portfolios as an officer in the OppenheimerFunds complex. |
| |
Arthur S. Gabinet, Secretary and Chief Legal Officer (since 2011) Age: 54 | | Executive Vice President (since May 2010) and General Counsel (since January 2011) of the Manager; General Counsel of the Distributor (since January 2011); General Counsel of Centennial Asset Management Corporation (since January 2011); Executive Vice President and General Counsel of HarbourView Asset Management Corporation (since January 2011); Assistant Secretary (since January 2011) and Director (since January 2011) of OppenheimerFunds International Ltd. and OppenheimerFunds plc; Vice President and Director of Oppenheimer Partnership Holdings, Inc. (since January 2011); Director of Oppenheimer Real Asset Management, Inc. (since January 2011); Executive Vice President and General Counsel of Shareholder Financial Services, Inc. and Shareholder Services, Inc. (since January 2011); Executive Vice President and General Counsel of OFI Private Investments, Inc. (since January 2011); Vice President of OppenheimerFunds Legacy Program (January 2011-January 2012); Executive Vice President and General Counsel of OFI Institutional Asset Management, Inc. (since January 2011); General Counsel, Asset Management of the Manager (May 2010-December 2010); Principal, The Vanguard Group (November 2005-April 2010); District Administrator, U.S. Securities and Exchange Commission (January 2003-October 2005). An officer of 95 portfolios in the OppenheimerFunds complex. |
| |
Christina M. Nasta, Vice President and Chief Business Officer (since 2011) Age: 39 | | Senior Vice President of the Manager (since July 2010); Vice President of the Manager (since January 2003); Vice President of OppenheimerFunds Distributor, Inc. (since January 2003). An officer of 95 portfolios in the OppenheimerFunds complex. |
| |
Mark S. Vandehey, Vice President and Chief Compliance Officer (since 2004) Age: 61 | | Senior Vice President and Chief Compliance Officer of the Manager (since March 2004); Chief Compliance Officer of OppenheimerFunds Distributor, Inc., Centennial Asset Management and Shareholder Services, Inc. (since March 2004); Vice President of OppenheimerFunds Distributor, Inc., Centennial Asset Management Corporation and Shareholder Services, Inc. (since June 1983). An officer of 95 portfolios in the OppenheimerFunds complex. |
| | | | |
| 112 | | | | OPPENHEIMER ROCHESTER NATIONAL MUNICIPALS |
| | |
Brian W. Wixted, Treasurer and Principal Financial & Accounting Officer (since 1999) Age: 52 | | Senior Vice President of the Manager (since March 1999); Treasurer of the Manager and the following: HarbourView Asset Management Corporation, Shareholder Financial Services, Inc., Shareholder Services, Inc., Oppenheimer Real Asset Management, Inc. and Oppenheimer Partnership Holdings, Inc. (March 1999-June 2008), OFI Private Investments, Inc. (March 2000-June 2008), OppenheimerFunds International Ltd. and OppenheimerFunds plc (since May 2000), OFI Institutional Asset Management, Inc. (since November 2000), and OppenheimerFunds Legacy Program (charitable trust program established by the Manager) (June 2003-January 2012); Treasurer and Chief Financial Officer of OFI Trust Company (trust company subsidiary of the Manager) (since May 2000); Assistant Treasurer of OAC (March 1999-June 2008). An officer of 95 portfolios in the OppenheimerFunds complex. |
The Fund’s Statement of Additional Information contains additional information about the Fund’s Trustees and Officers and is available without charge upon request, by calling 1.800.CALL OPP (225.5677).
| | | | |
| 113 | | | | OPPENHEIMER ROCHESTER NATIONAL MUNICIPALS |
OPPENHEIMER ROCHESTER NATIONAL MUNICIPALS FUND
| | |
| A Series of Oppenheimer Multi-State Municipal Trust |
| Manager | | OppenheimerFunds, Inc. |
| Distributor | | OppenheimerFunds Distributor, Inc. |
| Transfer and Shareholder Servicing Agent | | OppenheimerFunds Services |
Independent
Registered Public Accounting Firm | | KPMGLLP |
| Legal Counsel | | Kramer Levin Naftalis & Frankel LLP |
©2012 OppenheimerFunds, Inc. All rights reserved.
| | | | |
| 114 | | | | OPPENHEIMER ROCHESTER NATIONAL MUNICIPALS |
PRIVACY POLICY NOTICE
As an Oppenheimer fund shareholder, you are entitled to know how we protect your personal information and how we limit its disclosure.
Information Sources
We obtain nonpublic personal information about our shareholders from the following sources:
| l | | Applications or other forms |
| l | | When you create a user ID and password for online account access |
| l | | When you enroll in eDocs Direct, our electronic document delivery service |
| l | | Your transactions with us, our affiliates or others |
| l | | A software program on our website, often referred to as a “cookie,” which indicates which parts of our site you’ve visited |
| l | | When you set up challenge questions to reset your password online |
If you visit oppenheimerfunds.com and do not log on to the secure account information areas, we do not obtain any personal information about you. When you do log on to a secure area, we do obtain your user ID and password to identify you. We also use this information to provide you with products and services you have requested, to inform you about products and services that you may be interested in and assist you in other ways.
We do not collect personal information through our website unless you willingly provide it to us, either directly by email or in those areas of the website that request information. In order to update your personal information (including your mailing address, email address and phone number) you must first log on and visit your user profile.
If you have set your browser to warn you before accepting cookies, you will receive the warning message with each cookie. You can refuse cookies by turning them off in your browser. However, doing so may limit your access to certain sections of our website.
We use cookies to help us improve and manage our website. For example, cookies help us recognize new versus repeat visitors to the site, track the pages visited, and enable some special features on the website. This data helps us provide a better service for our website visitors.
Protection of Information
We do not disclose any non-public personal information (such as names on a customer list) about current or former customers to anyone, except as permitted by law.
Disclosure of Information
We send your financial advisor (as designated by you) copies of confirmations, account statements and other documents reporting activity in your fund accounts. We may also use details about you and your investments to help us, our financial service affiliates, or firms that jointly market their financial products and services with ours, to better serve your investment needs or suggest financial services or educational material that may be of interest to you. If this requires us to provide you with an opportunity to “opt in” or “opt out” of such information sharing with a firm not affiliated with us, you will receive notification on how to do so, before any such sharing takes place.
Right of Refusal
We will not disclose your personal information to unaffiliated third parties (except as permitted by law), unless we first offer you a reasonable opportunity to refuse or “opt out” of such disclosure.
| | | | |
| 115 | | | | OPPENHEIMER ROCHESTER NATIONAL MUNICIPALS |
PRIVACY POLICY NOTICE
Internet Security and Encryption
In general, the email services provided by our website are encrypted and provide a secure and private means of communication with us. To protect your own privacy, confidential and/or personal information should only be communicated via email when you are advised that you are using a secure website.
As a security measure, we do not include personal or account information in non-secure emails, and we advise you not to send such information to us in non-secure emails. Instead, you may take advantage of the secure features of our website to encrypt your email correspondence. To do this, you will need to use a browser that supports Secure Sockets Layer (SSL) protocol.
We do not guarantee or warrant that any part of our website, including files available for download, are free of viruses or other harmful code. It is your responsibility to take appropriate precautions, such as use of an anti-virus software package, to protect your computer hardware and software.
| l | | All transactions, including redemptions, exchanges and purchases, are secured by SSL and 128-bit encryption. SSL is used to establish a secure connection between your PC and OppenheimerFunds’ server. It transmits information in an encrypted and scrambled format. |
| l | | Encryption is achieved through an electronic scrambling technology that uses a “key” to code and then decode the data. Encryption acts like the cable converter box you may have on your television set. It scrambles data with a secret code so that no one can make sense of it while it is being transmitted. When the data reaches its destination, the same software unscrambles the data. |
| l | | You can exit the secure area by either closing your browser, or for added security, you can use the Log Out button before you close your browser. |
Other Security Measures
We maintain physical, electronic and procedural safeguards to protect your personal account information. Our employees and agents have access to that information only so that they may offer you products or provide services, for example, when responding to your account questions.
How You Can Help
You can also do your part to keep your account information private and to prevent unauthorized transactions. If you obtain a user ID and password for your account, do not allow it to be used by anyone else. Also, take special precautions when accessing your account on a computer used by others.
Who We Are
This joint notice describes the privacy policies of the Oppenheimer funds, OppenheimerFunds Distributor, Inc., the trustee of OppenheimerFunds Individual Retirement Accounts (IRAs) and the custodian of the OppenheimerFunds 403(b)(7) tax sheltered custodial accounts. It applies to all Oppenheimer fund accounts you presently have, or may open in the future, using your Social Security number—whether or not you remain a shareholder of our funds. This notice was last updated January 16, 2004. In the event it is updated or changed, we will post an updated notice on our website at oppenheimerfunds.com. If you have any questions about these privacy policies, write to us at P.O. Box 5270, Denver, CO 80217-5270, email us by clicking on the Contact Us section of our website at oppenheimerfunds.com or call us at 1.800.CALL OPP (225.5677).
| | | | |
| 116 | | | | OPPENHEIMER ROCHESTER NATIONAL MUNICIPALS |
Item 2. Code of Ethics.
The registrant has adopted a code of ethics that applies to the registrant’s principal executive officer, principal financial officer, principal accounting officer or controller or persons performing similar functions.
Item 3. Audit Committee Financial Expert.
The Board of Trustees of the registrant has determined that David Downes, the Board’s Audit Committee Chairman, is an audit committee financial expert and that Mr. Downes is “independent” for purposes of this Item 3.
Item 4. Principal Accountant Fees and Services.
The principal accountant for the audit of the registrant’s annual financial statements billed $136,300 in fiscal 2012 and $133,600 in fiscal 2011.
The principal accountant for the audit of the registrant’s annual financial statements billed $7,500 in fiscal 2012 and $7,857 in fiscal 2011.
The principal accountant for the audit of the registrant’s annual financial statements billed $324,306 in fiscal 2012 and $168,500 in fiscal 2011 to the registrant’s investment adviser or any entity controlling, controlled by, or under common control with the adviser that provides ongoing services to the registrant.
Such services include: Internal control reviews, compliance procedures, and GIPS attestation procedures
The principal accountant for the audit of the registrant’s annual financial statements billed $10,650 in fiscal 2012 and $2,850 in fiscal 2011.
The principal accountant for the audit of the registrant’s annual financial statements billed $317,764 in fiscal 2012 and no such fees in fiscal 2011 to the registrant’s investment adviser or any entity controlling, controlled by, or under common control with the adviser that provides ongoing services to the registrant.
Such services include: tax compliance, tax planning and tax advice. Tax compliance generally involves preparation of original and amended tax returns, claims for a refund and tax payment-planning
services. Tax planning and tax advice includes assistance with tax audits and appeals, tax advice related to mergers and acquisitions and requests for rulings or technical advice from taxing authorities.
The principal accountant for the audit of the registrant’s annual financial statements billed no such fees in fiscal 2012 and no such fees in fiscal 2011.
The principal accountant for the audit of the registrant’s annual financial statements billed no such fees in fiscal 2012 and no such fees in fiscal 2011 to the registrant’s investment adviser or any entity controlling, controlled by, or under common control with the adviser that provides ongoing services to the registrant.
Such fees would include the cost to the principal accountant of attending audit committee meetings and consultations regarding the registrant’s retirement plan with respect to its Trustees.
| (e) | (1) During its regularly scheduled periodic meetings, the registrant’s audit committee will pre-approve all audit, audit-related, tax and other services to be provided by the principal accountants of the registrant. |
The audit committee has delegated pre-approval authority to its Chairman for any subsequent new engagements that arise between regularly scheduled meeting dates provided that any fees such pre-approved are presented to the audit committee at its next regularly scheduled meeting.
Under applicable laws, pre-approval of non-audit services maybe waived provided that: 1) the aggregate amount of all such services provided constitutes no more than five percent of the total amount of fees paid by the registrant to it principal accountant during the fiscal year in which services are provided 2) such services were not recognized by the registrant at the time of engagement as non-audit services and 3) such services are promptly brought to the attention of the audit committee of the registrant and approved prior to the completion of the audit.
(2) 100%
| (f) | Not applicable as less than 50%. |
| (g) | The principal accountant for the audit of the registrant’s annual financial statements billed $660,220 in fiscal 2012 and $179,207 in fiscal 2011 to the registrant and the registrant’s investment adviser or any entity controlling, controlled by, or under common control with the adviser that provides ongoing services to the registrant related to non-audit fees. Those billings did not include any prohibited non-audit services as defined by the Securities Exchange Act of 1934. |
| (h) | The registrant’s audit committee of the board of Trustees has considered whether the provision of non-audit services that were rendered to the registrant’s investment adviser, and any entity controlling, controlled by, or under common control with the investment adviser that provides ongoing services to the registrant that were not pre-approved pursuant to paragraph (c)(7)(ii) of Rule 2-01 of Regulation S-X is compatible with maintaining the principal accountant’s independence. No such services were rendered. |
Item 5. Audit Committee of Listed Registrants
Not applicable.
Item 6. Schedule of Investments.
a) Not applicable. The complete schedule of investments is included in Item 1 of this Form N-CSR.
b) Not applicable.
Item 7. Disclosure of Proxy Voting Policies and Procedures for Closed-End Management Investment Companies.
Not applicable.
Item 8. Portfolio Managers of Closed-End Management Investment Companies.
Not applicable.
Item 9. Purchases of Equity Securities by Closed-End Management Investment Company and Affiliated Purchasers.
Not applicable.
Item 10. Submission of Matters to a Vote of Security Holders.
The Fund’s Governance Committee Provisions with Respect to Nominations of Directors/Trustees to the Respective Boards
| 1. | The Fund’s Governance Committee (the “Committee”) will evaluate potential Board candidates to assess their qualifications. The Committee shall have the authority, upon approval of the Board, to retain an executive search firm to assist in this effort. The Committee may consider recommendations by business and personal contacts of current Board members and by executive search firms which the Committee may engage from time |
| | to time and may also consider shareholder recommendations. The Committee may consider the advice and recommendation of the Funds’ investment manager and its affiliates in making the selection. |
| 2. | The Committee shall screen candidates for Board membership. The Committee has not established specific qualifications that it believes must be met by a trustee nominee. In evaluating trustee nominees, the Committee considers, among other things, an individual’s background, skills, and experience; whether the individual is an “interested person” as defined in the Investment Company Act of 1940; and whether the individual would be deemed an “audit committee financial expert” within the meaning of applicable SEC rules. The Committee also considers whether the individual’s background, skills, and experience will complement the background, skills, and experience of other nominees and will contribute to the Board. There are no differences in the manner in which the Committee evaluates nominees for trustees based on whether the nominee is recommended by a shareholder. |
| 3. | The Committee may consider nominations from shareholders for the Board at such times as the Committee meets to consider new nominees for the Board. The Committee shall have the sole discretion to determine the candidates to present to the Board and, in such cases where required, to shareholders. Recommendations for trustee nominees should, at a minimum, be accompanied by the following: |
| | • | | the name, address, and business, educational, and/or other pertinent background of the person being recommended; |
| | • | | a statement concerning whether the person is an “interested person” as defined in the Investment Company Act of 1940; |
| | • | | any other information that the Funds would be required to include in a proxy statement concerning the person if he or she was nominated; and |
| | • | | the name and address of the person submitting the recommendation and, if that person is a shareholder, the period for which that person held Fund shares. |
The recommendation also can include any additional information which the person submitting it believes would assist the Committee in evaluating the recommendation.
| 4. | Shareholders should note that a person who owns securities issued by Massachusetts Mutual Life Insurance Company (the parent company of the Funds’ investment adviser) would be deemed an “interested person” under the Investment Company Act of 1940. In addition, certain other relationships with Massachusetts Mutual Life Insurance Company or its subsidiaries, with registered broker-dealers, or with the Funds’ outside legal counsel may cause a person to be deemed an “interested person.” |
| 5. | Before the Committee decides to nominate an individual as a trustee, Committee members and other directors customarily interview the individual in person. In addition, the individual |
| | customarily is asked to complete a detailed questionnaire which is designed to elicit information which must be disclosed under SEC and stock exchange rules and to determine whether the individual is subject to any statutory disqualification from serving as a trustee of a registered investment company. |
Item 11. Controls and Procedures.
Based on their evaluation of the registrant’s disclosure controls and procedures (as defined in rule 30a-3(c) under the Investment Company Act of 1940 (17 CFR 270.30a-3(c)) as of 7/31/2012, the registrant’s principal executive officer and principal financial officer found the registrant’s disclosure controls and procedures to provide reasonable assurances that information required to be disclosed by the registrant in the reports that it files under the Securities Exchange Act of 1934 (a) is accumulated and communicated to registrant’s management, including its principal executive officer and principal financial officer, to allow timely decisions regarding required disclosure, and (b) is recorded, processed, summarized and reported, within the time periods specified in the rules and forms adopted by the U.S. Securities and Exchange Commission.
There have been no changes in the registrant’s internal controls over financial reporting that occurred during the registrant’s second fiscal quarter of the period covered by this report that have materially affected, or are reasonably likely to materially affect, the registrant’s internal control over financial reporting.
Item 12. Exhibits.
| (a) | (1) Exhibit attached hereto. |
(2) Exhibits attached hereto.
(3) Not applicable.
| (b) | Exhibit attached hereto. |
SIGNATURES
Pursuant to the requirements of the Securities Exchange Act of 1934 and the Investment Company Act of 1940, the registrant has duly caused this report to be signed on its behalf by the undersigned, thereunto duly authorized.
| | | | |
| Oppenheimer Multi-State Municipal Trust |
| | |
| By: | | /s/ William F. Glavin, Jr. | | |
| | William F. Glavin, Jr. | | |
| | Principal Executive Officer | | |
| Date: | | 9/11/2012 | | |
Pursuant to the requirements of the Securities Exchange Act of 1934 and the Investment Company Act of 1940, this report has been signed below by the following persons on behalf of the registrant and in the capacities and on the dates indicated.
| | | | |
| By: | | /s/ William F. Glavin, Jr. | | |
| | William F. Glavin, Jr. | | |
| | Principal Executive Officer | | |
| Date: | | 9/11/2012 | | |
| | |
| By: | | /s/ Brian W. Wixted | | |
| | Brian W. Wixted | | |
| | Principal Financial Officer | | |
| Date: | | 9/11/2012 | | |