UNITED STATES
SECURITIES AND EXCHANGE COMMISSION
WASHINGTON, D.C. 20549
FORM N-CSR
CERTIFIED SHAREHOLDER REPORT OF REGISTERED MANAGEMENT
INVESTMENT COMPANIES
Investment Company Act file number 811-5867
Oppenheimer Multi-State Municipal Trust
(Exact name of registrant as specified in charter)
6803 South Tucson Way, Centennial, Colorado 80112-3924
(Address of principal executive offices) (Zip code)
Robert G. Zack, Esq.
OppenheimerFunds, Inc.
Two World Financial Center, New York, New York 10281-1008
(Name and address of agent for service)
Registrant’s telephone number, including area code: (303) 768-3200
Date of fiscal year end: July 31
Date of reporting period: 07/31/2009
Item 1. Reports to Stockholders.
TOP HOLDINGS AND ALLOCATIONS
| | | | | |
| Top Ten Categories | | | | |
| |
| Tobacco—Master Settlement Agreement | | | 17.3 | % |
| Hospital/Health Care | | | 15.2 | |
| Airlines | | | 8.4 | |
| General Obligation | | | 7.0 | |
| Water Utilities | | | 6.4 | |
| Highways/Commuter Facilities | | | 5.9 | |
| Higher Education | | | 5.9 | |
| Special Tax | | | 5.6 | |
| Adult Living Facilities | | | 3.7 | |
| Electric Utilities | | | 3.6 | |
Portfolio holdings are subject to change. Percentages are as of July 31, 2009, and are based on total assets.
| | | | | |
| Credit Allocation | | | | |
| |
| AAA | | | 9.0 | % |
| AA | | | 10.8 | |
| A | | | 18.9 | |
| BBB | | | 42.3 | |
| BB or lower | | | 19.0 | |
Allocations are subject to change. Percentages are as of July 31, 2009, and are dollar-weighted based on the total market value of investments. Market value, the total value of the Fund’s securities, does not include cash. Securities rated by any rating organization are included in the equivalent Standard & Poor’s rating category in the allocation above. The allocation above also includes unrated securities whose ratings have been assigned by the Manager; these unrated securities, currently 17.66% of the Fund’s market value, are deemed comparable in the Manager’s judgment to the rated securities in each category. Credit ratings of AAA, AA, A and BBB and their equivalents denote investment-grade securities.
14 | OPPENHEIMER NEW JERSEY MUNICIPAL FUND
FUND PERFORMANCE DISCUSSION
How has the Fund performed? Below is a discussion by OppenheimerFunds, Inc., of the Fund’s performance during its fiscal year ended July 31, 2009, followed by a graphical comparison of the Fund’s performance to appropriate broad-based market indices.
Management’s Discussion of Fund Performance. The 12-month period ended July 31, 2009, will long be remembered for the credit market’s volatility and illiquidity in its early months and the recovery in municipal bond prices that began in the waning weeks of 2008. Despite the mid-period turnaround, the net asset value (NAV) of Oppenheimer New Jersey Municipal Fund’s Class A shares declined between July 31, 2008, and July 31, 2009, causing the Fund to produce negative total returns. The 1-year total return for Class A shares was -7.63% at NAV and -12.02% at the maximum offering price (or with sales charge). As of July 31, 2009, the Fund’s Class A shares nonetheless provided the highest level of tax-free income among its peer funds, according to Lipper Inc., and more income on a tax-equivalent basis than many corporate fixed-income alternatives. As of July 31, 2009, the distribution yield for the Fund’s Class A shares was 6.60% at NAV.1
During this reporting period, the Fund distributed 55.5 cents per Class A share, including a small amount of taxable income. The monthly dividend rate for Class A shares rose to 4.7 cents with the May payout, from 4.6 cents. We believe the Fund’s distributions this reporting period demonstrate the benefits of our yield-driven approach to municipal investing.
At the end of this reporting period, the Fund had nearly 260 holdings and an average credit quality of BBB-plus. Despite the broad turmoil in the municipal market in the first half of this reporting period, the default rate for bonds in the portfolio remained within expectations throughout this reporting period.
As the charts on pages 21 to 23 show, the Fund’s total returns were negative this reporting period, the first half of which was characterized at times by sharp declines in equity and credit markets, heightened investor concern about risk, and widening credit spreads. Credit spread widening is typically more detrimental to the sectors and types of securities this Fund favors than to the Fund’s benchmark. Because our approach to fund management involves creating broad portfolios with holdings from across the full credit spectrum, this Fund’s performance can be undercut by prolonged cycles of credit spread widening. Widening spreads typically have the greatest negative effect on BBB-rated, lower-rated and unrated securities. The reverse is also true: as spreads tighten, BBB-rated, lower-rated and unrated securities typically outperform other securities. While we believe that this latest cycle of spread widening has run its course, this Fund continues to feel its impact. We still believe that our Fund’s investments offer structural advantages over the long term, and we encourage investors to remain focused on their long-term financial objectives for high levels of tax-free income.
1. Falling share prices artificially increase yields.
15 | OPPENHEIMER NEW JERSEY MUNICIPAL FUND
FUND PERFORMANCE DISCUSSION
Securities issued in the Commonwealth of Puerto Rico represented 30.9% of the Fund’s net assets on July 31, 2009. Most of the Fund’s investments involve “creatures of the state”—that is, securities that are supported by taxes and designed to help finance electric utilities, highways and education. Facing a $3.2 billion budget deficit, Gov. Luis Fortuño signed legislation early this reporting period allowing the Commonwealth to subsidize its operating expenses with money borrowed from its financing arm, the Government Development Bank for Puerto Rico (the GDB). The deficit grew to an estimated $3.4 billion by March 2009 and, one month later, the GDB said that it would offer as much as $4 billion of the proposed new sales-tax bonds. This increase, by the way, represented a clear signal as to the renewed strength of the credit markets, which were deemed to have the capacity for this larger new issuance.
The credit rating agencies continued to view the Commonwealth favorably. When the Puerto Rico Sales Tax Financing Corporation came to market with $3.5 billion in new debt in late June, it was rated A-plus by Standard & Poor’s, A2 by Moody’s Investors Service and A by Fitch Ratings. Existing sales-tax debt had received an upgrade earlier in the period. Additionally, the Commonwealth, its agencies and the GDB retained their investment-grade ratings from S&P and Moody’s this reporting period. (Fitch does not directly rate Puerto Rico’s general obligation debt.)
We remain confident in the Commonwealth’s ability to collect taxes and make its bond payments and believe that Gov. Fortuño, a fiscal conservative, is correctly focused on reducing government spending, eliminating the deficit by fiscal 2013 and growing the island’s economy. At $7.7 billion, the proposed budget for fiscal year 2010 is $1.8 billion smaller than the current budget, a sign that the governor is willing to take harsh steps in the name of fiscal responsibility.
The Fund’s underperformance can be attributed, in part, to its holdings in bonds backed by proceeds from the tobacco Master Settlement Agreement (the MSA), the national litigation settlement with U.S. tobacco manufacturers. At the end of this reporting period, MSA-backed tobacco bonds accounted for 17.3% of the Fund’s total assets and comprised the Fund’s largest sector.2
2. Investments in “tobacco bonds,” which are backed by the proceeds a state or territory receives from the 1998 national litigation settlement with tobacco manufacturers, may be vulnerable to economic and/or legislative events that affect issuers in a particular municipal market sector. Annual payments by MSA-participating manufacturers, for example, hinge on many factors, including annual domestic cigarette shipments, inflation and the relative market share of non-participating manufacturers. While consumption has largely been in line with the assumptions used to structure MSA-backed bonds, future MSA payments could be reduced if consumption were to fall more rapidly than originally forecast.
16 | OPPENHEIMER NEW JERSEY MUNICIPAL FUND
The sector typically offers high-yielding securities, many of which are prone to price volatility. Widening credit spreads and other market factors (like supply and demand) can contribute to volatility. S&P and Fitch each revised their assessments of this sector during this reporting period, but we do not believe that the prices of “tobacco bonds” were affected consequentially.
In the latter half of this reporting period, media reports focused on two tobacco-related developments: the April 1 increase in cigarette taxes and the President’s signature on the Family Smoking Prevention and Tobacco Control Act, which put the Food and Drug Administration in charge of regulating the making and marketing of cigarettes and other tobacco products.
We do not agree with the analysts who opined that these developments represent new threats to the MSA or the bonds backed by MSA payments. Nor are we concerned about the long-term viability of the MSA. Here’s why: First, consumption trends over the years have largely tracked the forecasts that were built into MSA-backed bonds, and this has been true even as the cost of a pack of cigarettes has steadily risen. There is little reason to believe that the new tax will significantly alter consumers’ smoking habits. Second, putting the FDA in charge of tobacco regulation was strongly advocated by Philip Morris, the country’s leading cigarette manufacturer. We think it unlikely that the company would have backed a plan that it thought would hurt its industry. Further, the company is not alone in believing that smaller companies will have a harder time complying with new regulations and will thus cede share to the market’s leading players. This, in turn, should improve MSA revenues and encourage early redemptions of existing bonds.
We continue to believe that the carefully researched tobacco bonds this Fund owns remain fundamentally sound. As they always have, the tobacco bonds this Fund held during this reporting period made all scheduled interest payments in a timely manner. Thus, these bonds helped the Fund provide significant yield advantages to shareholders.
As of July 31, 2009, the Fund was invested in the hospital/health care sector, representing 15.2% of the Fund’s total assets, and in the water and electric utilities sectors, representing 6.4% and 3.6% of the Fund’s total assets, respectively. Our holdings in these sectors consist of securities in the mid-range of the credit spectrum as well as some insured bonds. The overall fundamentals in these sectors remained stable this reporting period, but widening credit spreads during the first half of the reporting period were detrimental to 12-month performance. Since the beginning of calendar year 2009, these sectors have posted positive results.
Overall, the Rochester investment team believes these sectors can produce long-term value. For example, as of July 31, 2009, the Fund held tax-exempt bonds issued by Port Authority of New York and New Jersey (KIAC). We believe that these securities,
17 | OPPENHEIMER NEW JERSEY MUNICIPAL FUND
FUND PERFORMANCE DISCUSSION
which helped finance power facilities that produce steam and electricity at John F. Kennedy International Airport, demonstrate the benefits of careful due diligence as practiced by our credit research analysts. Calpine Corporation, which owns and operates these facilities, filed for bankruptcy protection in late 2005, a move that triggered concerns among bondholders about potential interruptions to debt service.3 When Calpine emerged from bankruptcy late in 2007, it affirmed the lease on its facilities, erasing any lingering concerns about its intentions to honor these bond agreements. In April 2009, this Fund invested in these bonds, which have a coupon of 6.75% and were yielding, at purchase, 11.00% to an average life of 7.5 years. We believe this investment reflects the strength of Rochester’s yield-driven, team-oriented and security-specific approach.
The Fund’s airline holdings represented 8.4% of total assets as of July 31, 2009. Many of the Fund’s holdings are backed by a security interest in the airport terminal buildings or maintenance facilities whose construction they finance and, as a result, these bonds offer investors valuable collateral. Fuel costs, which had peaked at $147 a barrel in July 2008, fell back considerably by the end of this reporting period. However, both Moody’s and S&P remain pessimistic about industry economics, and bond prices remained volatile this reporting period. As a result, the sector was detrimental to Fund performance this reporting period. Our experience in this sector nonetheless leads us to believe that most issuers of airline-backed securities in this Fund will remain current with the principal and interest payments, as they have done in the past.
The Fund’s holdings include securities insured by Ambac Assurance Corporation, which lost its investment-grade status when it was re-assessed by S&P and Moody’s late in this reporting period. The downgrades reflected the credit rating agencies’ concerns that policyholder’s surplus at Ambac—that is, the amount by which assets exceed liabilities—could limit Ambac’s ability to pay claims should an underlying bond miss a scheduled payment of interest or principal. Most of the underlying bonds of our Ambac-insured holdings have investment-grade ratings or have been deemed to be investment-grade equivalents by our in-house credit team. We remain confident that these bonds should exhibit the same credit qualities as similar investment-grade securities. As of July 31, 2009, 7.23% of the Fund’s total assets were insured by Ambac. Typically, when an insurer is downgraded, the market for its bonds becomes more limited; funds
3. This Fund was not among the Oppenheimer Rochester municipal bond funds that were invested in these bonds during the bankruptcy proceedings but first became a bondholder in April 2009. At the time, this Fund was aware that other Oppenheimer Rochester funds had received all scheduled principal and interest payments throughout Calpine’s bankruptcy proceedings.
18 | OPPENHEIMER NEW JERSEY MUNICIPAL FUND
that can only hold investment-grade securities may be required to sell their holdings. At OppenheimerFunds/Rochester, however, we continue to believe that insured bonds can play a vital role in creating shareholder value over the long term.
During this reporting period, the Fund remained invested in municipal inverse-floating-rate securities, which are tax-exempt securities with interest payments that move inversely to changes in short-term interest rates. These “inverse floaters” generally offer higher tax-free yields than fixed-rate bonds of comparable maturity and credit quality, but they often face greater price volatility, too. When the short-term market faced unprecedented turmoil in the first half of this reporting period, the income that muni funds across the industry earned from this type of security was diminished. We continue to believe that “inverse floaters” belong in our fund portfolios because they produce attractive yields under most market conditions.
Other floating-rate bonds performed poorly this reporting period as short-term variable rates declined.
Additionally, the Fund’s line of credit increased partway through this reporting period. The Fund used its line of credit at times to avoid having to sell tax-free assets at lower-than-acceptable prices. The Fund also used it opportunistically to buy yield-enhancing securities.
Our approach to municipal bond investing is flexible and responsive to market conditions. Shareholders should note that market conditions during this reporting period did not affect the Fund’s overall investment strategies or cause it to pay any capital gain distributions. In closing, we believe that the Fund’s structure and composition as well as our time-tested strategies will continue to benefit long-term investors through interest rate and economic cycles.
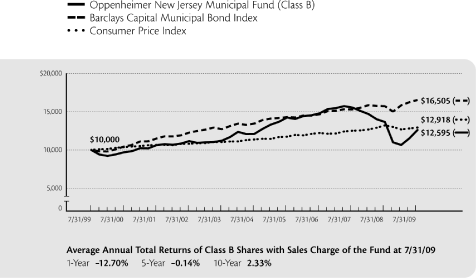
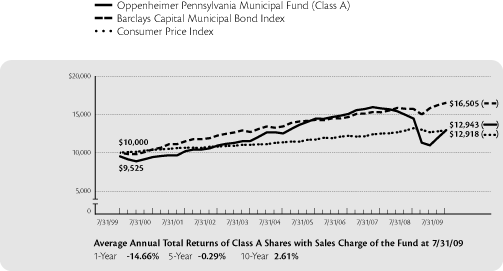
Comparing the Fund’s Performance to the Market. The graphs that follow show the performance of a hypothetical $10,000 investment in each class of shares of the Fund held until July 31, 2009. In the case of Class A, Class B and Class C shares, performance is measured over a ten-year period. The Fund’s performance reflects the deduction of the maximum initial sales charge on Class A shares, the applicable contingent deferred sales charge on Class B and Class C shares, and reinvestments of all dividends and capital gains distributions. Past performance cannot guarantee future results.
The Fund’s performance is compared to the performance of the Barclays Capital Municipal Bond Index, an unmanaged index of a broad range of investment grade municipal bonds that is widely regarded as a measure of the performance of the general municipal bond market. Index performance reflects the reinvestment of income but does not consider the effect of
19 | OPPENHEIMER NEW JERSEY MUNICIPAL FUND
FUND PERFORMANCE DISCUSSION
transaction costs, and none of the data in the graphs shows the effect of taxes. The Fund’s performance is also compared to the Consumer Price Index, a non-securities index that measures changes in the inflation rate. The Fund’s performance reflects the effects of the Fund’s business and operating expenses. While index comparisons may be useful to provide a benchmark for the Fund’s performance, it must be noted that the Fund’s investments are not limited to the investments in the index.
20 | OPPENHEIMER NEW JERSEY MUNICIPAL FUND
Class A Shares
Comparison of Change in Value of $10,000 Hypothetical Investments in:
The performance data quoted represents past performance, which does not guarantee future results. The investment return and principal value of an investment in the Fund will fluctuate so that an investor’s shares, when redeemed, may be worth more or less than their original cost. Current performance may be lower or higher than the performance quoted. For performance data current to the most recent month end, visit us at www.oppenheimerfunds.com, or call us at 1.800.525.7048. Fund returns include changes in share price, reinvested distributions, and the applicable sales charge for Class A shares, the current maximum initial sales charge of 4.75%; for Class B shares, the contingent deferred sales charge of 5% (1-year) and 2% (5-year); and for Class C shares, the 1% contingent deferred sales charge for the 1-year period. Because Class B shares convert to Class A shares 72 months after purchase, the 10-year return for Class B uses Class A performance for the period after conversion. See page 24 for further information.
21 | OPPENHEIMER NEW JERSEY MUNICIPAL FUND
FUND PERFORMANCE DISCUSSION
Class B Shares
Comparison of Change in Value of $10,000 Hypothetical Investments in:
22 | OPPENHEIMER NEW JERSEY MUNICIPAL FUND
Class C Shares
Comparison of Change in Value of $10,000 Hypothetical Investments in:
The performance data quoted represents past performance, which does not guarantee future results. The investment return and principal value of an investment in the Fund will fluctuate so that an investor’s shares, when redeemed, may be worth more or less than their original cost. Current performance may be lower or higher than the performance quoted. For performance data current to the most recent month end, visit us at www.oppenheimerfunds.com, or call us at 1.800.525.7048. Fund returns include changes in share price, reinvested distributions, and the applicable sales charge for Class A shares, the current maximum initial sales charge of 4.75%; for Class B shares, the contingent deferred sales charge of 5% (1-year) and 2% (5-year); and for Class C shares, the 1% contingent deferred sales charge for the 1-year period. Because Class B shares convert to Class A shares 72 months after purchase, the 10-year return for Class B uses Class A performance for the period after conversion. See page 24 for further information.
23 | OPPENHEIMER NEW JERSEY MUNICIPAL FUND
NOTES
Total returns and the ending account values in the graphs include changes in share price and reinvestment of dividends and capital gains distributions in a hypothetical investment for the periods shown. Cumulative total returns are not annualized. The Fund’s total returns shown do not reflect the deduction of income taxes on an individual’s investment. Taxes may reduce your actual investment returns on income or gains paid by the Fund or any gains you may realize if you sell your shares.
This annual report must be preceded or accompanied by the current prospectus of Oppenheimer New Jersey Municipal Fund. Before investing in any of the Oppenheimer funds, investors should carefully consider a fund’s investment objectives, risks, charges and expenses. Fund prospectuses contain this and other information about the funds. For more information, ask your financial advisor, call us at 1.800.525.7048, or visit our website at www.oppenheimerfunds.com. Read prospectuses carefully before investing.
The Fund’s investment strategy and focus can change over time. The mention of specific fund holdings does not constitute a recommendation by OppenheimerFunds, Inc.
Class A shares of the Fund were first publicly offered on 3/1/94. Unless otherwise noted, Class A returns include the current maximum initial sales charge of 4.75%.
Class B shares of the Fund were first publicly offered on 3/1/94. Unless otherwise noted, Class B returns include the applicable contingent deferred sales charge of 5% (1-year) and 2% (5-year). Because Class B shares convert to Class A shares 72 months after purchase, the 10-year return for Class B uses Class A performance for the period after conversion. Class B shares are subject to an annual 0.75% asset-based sales charge.
Class C shares of the Fund were first publicly offered on 8/29/95. Unless otherwise noted, Class C returns include the applicable 1% contingent deferred sales charge for the 1-year period. Class C shares are subject to an annual 0.75% asset-based sales charge.
An explanation of the calculation of performance is in the Fund’s Statement of Additional Information.
24 | OPPENHEIMER NEW JERSEY MUNICIPAL FUND
FUND EXPENSES
Fund Expenses. As a shareholder of the Fund, you incur two types of costs: (1) transaction costs, which may include sales charges (loads) on purchase payments, contingent deferred sales charges on redemptions; and redemption fees (if applicable); and (2) ongoing costs, including management fees; distribution and service fees; and other Fund expenses. These examples are intended to help you understand your ongoing costs (in dollars) of investing in the Fund and to compare these costs with the ongoing costs of investing in other mutual funds.
The examples are based on an investment of $1,000.00 invested at the beginning of the period and held for the entire 6-month period ended July 31, 2009.
Actual Expenses. The first section of the table provides information about actual account values and actual expenses. You may use the information in this section for the class of shares you hold, together with the amount you invested, to estimate the expense that you paid over the period. Simply divide your account value by $1,000.00 (for example, an $8,600.00 account value divided by $1,000.00 = 8.60), then multiply the result by the number in the first section under the heading entitled “Expenses Paid During Period” to estimate the expenses you paid on your account during this period.
Hypothetical Example for Comparison Purposes. The second section of the table provides information about hypothetical account values and hypothetical expenses based on the Fund’s actual expense ratio for each class of shares, and an assumed rate of return of 5% per year for each class before expenses, which is not the actual return. The hypothetical account values and expenses may not be used to estimate the actual ending account balance or expenses you paid for the period. You may use this information to compare the ongoing costs of investing in the Fund and other funds. To do so, compare this 5% hypothetical example for the class of shares you hold with the 5% hypothetical examples that appear in the shareholder reports of the other funds.
Please note that the expenses shown in the table are meant to highlight your ongoing costs only and do not reflect any transactional costs, such as front-end or contingent deferred sales charges (loads), or a $12.00 fee imposed annually on accounts valued at less than $500.00 (subject to exceptions described in the Statement of Additional Information). Therefore, the “hypothetical” section of
25 | OPPENHEIMER NEW JERSEY MUNICIPAL FUND
FUND EXPENSES Continued
the table is useful in comparing ongoing costs only, and will not help you determine the relative total costs of owning different funds. In addition, if these transactional costs were included, your costs would have been higher.
| | | | | | | | | | | | | |
| | | Beginning | | | Ending | | | Expenses | |
| | | Account | | | Account | | | Paid During | |
| | | Value | | | Value | | | 6 Months Ended | |
| | | February 1, 2009 | | | July 31, 2009 | | | July 31, 2009 | |
| |
Actual | | | | | | | | | | | | |
| Class A | | $ | 1,000.00 | | | $ | 1,182.80 | | | $ | 11.20 | |
| Class B | | | 1,000.00 | | | | 1,179.00 | | | | 15.88 | |
| Class C | | | 1,000.00 | | | | 1,178.00 | | | | 15.49 | |
| | | | | | | | | | | | | |
Hypothetical
(5% return before expenses) | | | | | | | | | | | | |
| Class A | | | 1,000.00 | | | | 1,014.58 | | | | 10.34 | |
| Class B | | | 1,000.00 | | | | 1,010.31 | | | | 14.66 | |
| Class C | | | 1,000.00 | | | | 1,010.66 | | | | 14.31 | |
Expenses are equal to the Fund’s annualized expense ratio for that class, multiplied by the average account value over the period, multiplied by 181/365 (to reflect the one-half year period). Those annualized expense ratios based on the 6-month period ended July 31, 2009 are as follows:
| | | | | |
| Class | | Expense Ratios |
| |
| Class A | | | 2.06 | % |
| Class B | | | 2.92 | |
| Class C | | | 2.85 | |
The expense ratios reflect reduction to custodian expenses. The “Financial Highlights” tables in the Fund’s financial statements, included in this report, also show the gross expense ratios, without such waivers or reimbursements and reduction to custodian expenses, if applicable.
26 | OPPENHEIMER NEW JERSEY MUNICIPAL FUND
STATEMENT OF INVESTMENTS July 31, 2009
| | | | | | | | | | | | | | | | | |
| Principal | | | | | | | | | | | | |
| Amount | | | | | Coupon | | | Maturity | | | Value | |
| |
| Municipal Bonds and Notes—129.7% | | | | | | | | | | | | |
| New Jersey—93.2% | | | | | | | | | | | | |
| $ | 445,000 | | | Atlantic County, NJ Utilities Authority Solid Waste1 | | | 7.125 | % | | | 03/01/2016 | | | $ | 443,305 | |
| | 3,755,000 | | | Bayonne, NJ Parking Authority (City Parking)1 | | | 5.000 | | | | 06/15/2027 | | | | 2,764,581 | |
| | 6,065,000 | | | Bayonne, NJ Redevel. Agency1 | | | 7.625 | | | | 04/01/2038 | | | | 6,405,671 | |
| | 545,000 | | | Bayonne, NJ Redevel. Agency (Royal Caribbean)1 | | | 4.750 | | | | 11/01/2016 | | | | 396,526 | |
| | 10,000 | | | Bergen County, NJ HDC1 | | | 6.750 | | | | 10/01/2018 | | | | 10,021 | |
| | 75,000 | | | Bergen County, NJ Utilities Authority1 | | | 5.500 | | | | 12/15/2016 | | | | 75,217 | |
| | 20,000 | | | Berkeley, NJ HFC (Bayville Hsg.)1 | | | 5.750 | | | | 08/01/2014 | | | | 20,042 | |
| | 3,000,000 | | | Burlington County, NJ Bridge Commission Economic Devel. (The Evergreens)1 | | | 5.625 | | | | 01/01/2038 | | | | 2,040,570 | |
| | 75,000 | | | Camden County, NJ PCFA (Camden County Energy Recovery Associates) | | | 7.500 | | | | 12/01/2009 | | | | 74,838 | |
| | 415,000 | | | Camden County, NJ PCFA (Camden County Energy Recovery Associates) | | | 7.500 | | | | 12/01/2010 | | | | 414,444 | |
| | 25,000 | | | Essex County, NJ Improvement Authority (Mt. Carmel Towers)1 | | | 4.850 | | | | 11/01/2032 | | | | 23,118 | |
| | 20,000 | | | Essex County, NJ Improvement Authority (Sportsplex) | | | 5.625 | | | | 10/01/2023 | | | | 20,007 | |
| | 105,000 | | | Essex County, NJ Improvement Authority (Sportsplex) | | | 5.625 | | | | 10/01/2027 | | | | 105,008 | |
| | 945,000 | | | Gloucester County, NJ HDC (Colonial Park)1 | | | 6.200 | | | | 09/15/2011 | | | | 925,760 | |
| | 5,000 | | | Gloucester County, NJ Utilities Authority1 | | | 5.125 | | | | 01/01/2013 | | | | 5,015 | |
| | 3,860,000 | | | Hudson County, NJ Solid Waste Improvement Authority (Koppers Site)1 | | | 6.125 | | | | 01/01/2029 | | | | 3,093,790 | |
| | 1,000,000 | | | Hudson County, NJ Solid Waste Improvement Authority, Series 11 | | | 6.000 | | | | 01/01/2029 | | | | 781,940 | |
| | 5,000 | | | Jackson, NJ Township Municipal Utilities Authority1 | | | 5.500 | | | | 12/01/2015 | | | | 5,028 | |
| | 35,000 | | | Middlesex County, NJ Improvement Authority (Edison Township)1 | | | 5.650 | | | | 09/15/2011 | | | | 35,135 | |
| | 825,000 | | | Middlesex County, NJ Improvement Authority (Heldrich Center Hotel)1 | | | 5.000 | | | | 01/01/2015 | | | | 652,724 | |
| | 500,000 | | | Middlesex County, NJ Improvement Authority (Heldrich Center Hotel)1 | | | 5.000 | | | | 01/01/2020 | | | | 296,745 | |
| | 2,535,000 | | | Middlesex County, NJ Improvement Authority (Heldrich Center Hotel)1 | | | 5.000 | | | | 01/01/2032 | | | | 1,429,461 | |
| | 1,100,000 | | | Middlesex County, NJ Improvement Authority (Heldrich Center Hotel)1 | | | 5.125 | | | | 01/01/2037 | | | | 606,298 | |
| | 20,000 | | | Middlesex County, NJ Improvement Authority (South Plainfield Urban Renewal)1 | | | 5.500 | | | | 09/01/2030 | | | | 18,926 | |
| | 35,000 | | | Morris-Union, NJ Joint Commission COP2 | | | 7.300 | | | | 08/01/2009 | | | | 35,000 | |
| | 35,000 | | | New Brunswick, NJ Hsg. & Urban Devel. Authority1 | | | 5.500 | | | | 08/01/2011 | | | | 35,113 | |
| | 50,000 | | | Newark, NJ Hsg. Authority (Lock Street Urban Renewal Partnership)1 | | | 6.400 | | | | 01/20/2034 | | | | 51,040 | |
| | 2,250,000 | | | Newark, NJ Hsg. Authority (South Ward Police Facility)1 | | | 6.750 | | | | 12/01/2038 | | | | 2,410,560 | |
F1 | OPPENHEIMER NEW JERSEY MUNICIPAL FUND
STATEMENT OF INVESTMENTS Continued
| | | | | | | | | | | | | | | | | |
| Principal | | | | | | | | | | | | |
| Amount | | | | | Coupon | | | Maturity | | | Value | |
| |
| New Jersey Continued | | | | | | | | | | | | |
| $ | 2,045,000 | | | NJ EDA (American Airlines) | | | 7.100 | % | | | 11/01/2031 | | | $ | 796,285 | |
| | 3,060,000 | | | NJ EDA (Applewood Estates)1 | | | 5.000 | | | | 10/01/2035 | | | | 2,190,929 | |
| | 50,000 | | | NJ EDA (Bristol Glen)1 | | | 5.750 | | | | 07/01/2029 | | | | 37,893 | |
| | 1,045,000 | | | NJ EDA (Cadbury at Cherry Hill)1 | | | 5.500 | | | | 07/01/2018 | | | | 869,764 | |
| | 25,000 | | | NJ EDA (Cadbury at Cherry Hill)1 | | | 5.500 | | | | 07/01/2028 | | | | 17,055 | |
| | 10,000 | | | NJ EDA (Cigarette Tax)1 | | | 5.625 | | | | 06/15/2017 | | | | 9,627 | |
| | 25,000 | | | NJ EDA (Consumers New Jersey Water Company)1 | | | 5.100 | | | | 09/01/2032 | | | | 21,213 | |
| | 580,000 | | | NJ EDA (Continental Airlines)1 | | | 5.500 | | | | 04/01/2028 | | | | 318,298 | |
| | 17,590,000 | | | NJ EDA (Continental Airlines)1 | | | 6.250 | | | | 09/15/2019 | | | | 13,625,566 | |
| | 4,375,000 | | | NJ EDA (Continental Airlines)1 | | | 6.250 | | | | 09/15/2029 | | | | 3,017,831 | |
| | 7,240,000 | | | NJ EDA (Continental Airlines)1 | | | 6.400 | | | | 09/15/2023 | | | | 5,373,094 | |
| | 3,940,000 | | | NJ EDA (Continental Airlines)1 | | | 6.625 | | | | 09/15/2012 | | | | 3,626,061 | |
| | 11,430,000 | | | NJ EDA (Continental Airlines)1 | | | 7.000 | | | | 11/15/2030 | | | | 8,579,815 | |
| | 9,475,000 | | | NJ EDA (Continental Airlines)1 | | | 9.000 | | | | 06/01/2033 | | | | 8,770,250 | |
| | 5,000,000 | | | NJ EDA (Converted Organics of Woodbridge)3 | | | 8.000 | | | | 08/01/2002 | | | | 3,246,900 | |
| | 3,100,000 | | | NJ EDA (Cranes Mill)1 | | | 5.100 | | | | 06/01/2027 | | | | 2,438,553 | |
| | 160,000 | | | NJ EDA (Dept. of Human Services)1 | | | 6.250 | | | | 07/01/2024 | | | | 164,584 | |
| | 115,000 | | | NJ EDA (Devereux Foundation)1 | | | 5.450 | | | | 05/01/2027 | | | | 107,780 | |
| | 2,610,000 | | | NJ EDA (Elizabethtown Water Company)1 | | | 5.600 | | | | 12/01/2025 | | | | 2,509,880 | |
| | 2,999,948 | | | NJ EDA (Empowerment Zone-Cumberland)3 | | | 7.750 | | | | 08/01/2021 | | | | 1,609,502 | |
| | 6,000,000 | | | NJ EDA (GMT Realty)1 | | | 6.875 | | | | 01/01/2037 | | | | 4,577,520 | |
| | 25,000 | | | NJ EDA (Greater New York Councils Boy Scouts of America)1 | | | 5.450 | | | | 09/01/2023 | | | | 25,003 | |
| | 425,000 | | | NJ EDA (Hackensack Water Company)1 | | | 5.900 | | | | 03/01/2024 | | | | 424,562 | |
| | 18,650,000 | | | NJ EDA (Hamilton Care)1 | | | 6.650 | | | | 11/01/2037 | | | | 13,956,355 | |
| | 3,100,000 | | | NJ EDA (JVG Properties)1 | | | 5.375 | | | | 03/01/2019 | | | | 3,075,820 | |
| | 2,500,000 | | | NJ EDA (Kapkowski Road Landfill)1 | | | 6.500 | | | | 04/01/2031 | | | | 1,886,350 | |
| | 130,000 | | | NJ EDA (Keswick Pines)1 | | | 5.600 | | | | 01/01/2012 | | | | 127,446 | |
| | 75,000 | | | NJ EDA (Keswick Pines)1 | | | 5.750 | | | | 01/01/2024 | | | | 57,727 | |
| | 40,000 | | | NJ EDA (Kullman Associates)1 | | | 6.125 | | | | 06/01/2018 | | | | 30,611 | |
| | 130,000 | | | NJ EDA (Kullman Associates)1 | | | 6.750 | | | | 07/01/2019 | | | | 107,695 | |
| | 160,000 | | | NJ EDA (Leisure Park)1 | | | 5.875 | | | | 12/01/2027 | | | | 120,970 | |
| | 810,000 | | | NJ EDA (Lions Gate)1 | | | 5.750 | | | | 01/01/2025 | | | | 674,236 | |
| | 1,345,000 | | | NJ EDA (Lions Gate)1 | | | 5.875 | | | | 01/01/2037 | | | | 1,007,970 | |
| | 30,000 | | | NJ EDA (Manchester Manor)1 | | | 6.700 | | | | 08/01/2022 | | | | 30,030 | |
| | 1,000,000 | | | NJ EDA (Marcus L. Ward Home)1 | | | 5.750 | | | | 11/01/2024 | | | | 924,360 | |
| | 1,200,000 | | | NJ EDA (Marcus L. Ward Home)1 | | | 5.800 | | | | 11/01/2031 | | | | 1,067,004 | |
| | 2,280,000 | | | NJ EDA (Masonic Charity Foundation of New Jersey)1 | | | 5.500 | | | | 06/01/2031 | | | | 2,121,107 | |
| | 90,000 | | | NJ EDA (Metromall Urban Renewal)1 | | | 6.500 | | | | 04/01/2031 | | | | 67,234 | |
| | 525,000 | | | NJ EDA (Middlesex Water Company)1 | | | 5.250 | | | | 10/01/2023 | | | | 505,166 | |
F2 | OPPENHEIMER NEW JERSEY MUNICIPAL FUND
| | | | | | | | | | | | | | | | | |
| Principal | | | | | | | | | | | | |
| Amount | | | | | Coupon | | | Maturity | | | Value | |
| |
| New Jersey Continued | | | | | | | | | | | | |
| $ | 1,100,000 | | | NJ EDA (Middlesex Water Company)1 | | | 5.250 | % | | | 02/01/2029 | | | $ | 981,552 | |
| | 770,000 | | | NJ EDA (Middlesex Water Company)1 | | | 5.350 | | | | 02/01/2038 | | | | 670,062 | |
| | 5,000 | | | NJ EDA (New Jersey American Water Company)1 | | | 5.250 | | | | 11/01/2032 | | | | 4,330 | |
| | 2,800,000 | | | NJ EDA (New Jersey American Water Company)1 | | | 5.250 | | | | 07/01/2038 | | | | 2,349,228 | |
| | 255,000 | | | NJ EDA (New Jersey American Water Company)1 | | | 5.350 | | | | 06/01/2023 | | | | 255,036 | |
| | 150,000 | | | NJ EDA (New Jersey American Water Company)1 | | | 5.350 | | | | 06/01/2023 | | | | 150,047 | |
| | 4,685,000 | | | NJ EDA (New Jersey American Water Company)1 | | | 5.375 | | | | 05/01/2032 | | | | 4,133,529 | |
| | 1,020,000 | | | NJ EDA (New Jersey American Water Company)1 | | | 5.500 | | | | 06/01/2023 | | | | 986,371 | |
| | 11,855,000 | | | NJ EDA (New Jersey American Water Company)1 | | | 5.950 | | | | 11/01/2029 | | | | 11,501,128 | |
| | 1,350,000 | | | NJ EDA (New Jersey American Water Company)1 | | | 6.000 | | | | 05/01/2036 | | | | 1,269,621 | |
| | 7,395,000 | | | NJ EDA (New Jersey American Water Company)1 | | | 6.875 | | | | 11/01/2034 | | | | 7,396,627 | |
| | 120,000 | | | NJ EDA (New Jersey Natural Gas Company)1 | | | 5.000 | | | | 12/01/2038 | | | | 98,692 | |
| | 10,000 | | | NJ EDA (New Jersey Transit Corp.)1 | | | 5.750 | | | | 12/15/2017 | | | | 10,031 | |
| | 30,000 | | | NJ EDA (New Jersey Transit Corp.)1 | | | 5.750 | | | | 12/15/2017 | | | | 30,094 | |
| | 400,000 | | | NJ EDA (Newark Downtown District Management Corp.)1 | | | 5.125 | | | | 06/15/2027 | | | | 329,464 | |
| | 700,000 | | | NJ EDA (Newark Downtown District Management Corp.)1 | | | 5.125 | | | | 06/15/2037 | | | | 522,956 | |
| | 3,995,000 | | | NJ EDA (Nui Corp.)1 | | | 5.250 | | | | 11/01/2033 | | | | 3,014,627 | |
| | 8,000,000 | | | NJ EDA (Pingry School)1 | | | 5.000 | | | | 11/01/2038 | | | | 5,377,760 | |
| | 115,000 | | | NJ EDA (Public Service Electric and Gas)1 | | | 6.400 | | | | 05/01/2032 | | | | 115,017 | |
| | 1,165,000 | | | NJ EDA (Reformed Church Ministries to the Aging The Particulare Synod Mid-Atlantics)1 | | | 5.375 | | | | 12/01/2018 | | | | 981,722 | |
| | 18,080,000 | | | NJ EDA (School Facilities Construction)4 | | | 5.125 | | | | 03/01/2028 | | | | 18,461,669 | |
| | 36,180,000 | | | NJ EDA (School Facilities Construction)4 | | | 5.125 | | | | 03/01/2030 | | | | 36,695,384 | |
| | 1,215,000 | | | NJ EDA (St. Francis Life Care Corp.)1 | | | 5.700 | | | | 10/01/2017 | | | | 1,066,661 | |
| | 2,230,000 | | | NJ EDA (St. Francis Life Care Corp.)1 | | | 5.750 | | | | 10/01/2023 | | | | 1,731,617 | |
| | 10,000 | | | NJ EDA (The Presbyterian Home at Montgomery)1 | | | 6.250 | | | | 11/01/2020 | | | | 8,547 | |
| | 115,000 | | | NJ EDA (The Presbyterian Home at Montgomery)1 | | | 6.375 | | | | 11/01/2031 | | | | 88,364 | |
| | 20,000 | | | NJ EDA (United Methodist Homes of New Jersey)1 | | | 5.125 | | | | 07/01/2018 | | | | 16,627 | |
| | 5,000 | | | NJ EDA (United Methodist Homes of New Jersey)1 | | | 7.100 | | | | 07/01/2010 | | | | 4,954 | |
| | 25,000 | | | NJ EDA (United Methodist Homes of New Jersey)1 | | | 7.200 | | | | 07/01/2010 | | | | 25,000 | |
| | 2,500,000 | | | NJ EDA Retirement Community (Seabrook Village)1 | | | 5.250 | | | | 11/15/2026 | | | | 1,934,550 | |
| | 3,500,000 | | | NJ EDA Retirement Community (Seabrook Village)1 | | | 5.250 | | | | 11/15/2036 | | | | 2,459,870 | |
| | 625,000 | | | NJ Educational Facilities Authority (Fairleigh Dickinson University), Series D1 | | | 5.250 | | | | 07/01/2032 | | | | 539,506 | |
| | 17,000,000 | | | NJ Educational Facilities Authority (Fairleigh Dickinson University), Series D1 | | | 6.000 | | | | 07/01/2025 | | | | 16,921,460 | |
| | 5,000 | | | NJ Educational Facilities Authority (Jersey City State College)1 | | | 6.250 | | | | 07/01/2010 | | | | 5,020 | |
F3 | OPPENHEIMER NEW JERSEY MUNICIPAL FUND
STATEMENT OF INVESTMENTS Continued
| | | | | | | | | | | | | | | | | |
| Principal | | | | | | | | | | | | |
| Amount | | | | | Coupon | | | Maturity | | | Value | |
| |
| New Jersey Continued | | | | | | | | | | | | |
| $ | 5,000 | | | NJ Educational Facilities Authority (Stevens Institute of Technology)1 | | | 5.000 | % | | | 07/01/2018 | | | $ | 5,299 | |
| | 4,250,000 | | | NJ Educational Facilities Authority (Stevens Institute of Technology)1 | | | 5.000 | | | | 07/01/2034 | | | | 3,659,718 | |
| | 475,000 | | | NJ Health Care Facilities Financing Authority (Avalon at Hillsborough)1 | | | 6.150 | | | | 07/01/2020 | | | | 414,742 | |
| | 750,000 | | | NJ Health Care Facilities Financing Authority (Avalon at Hillsborough)1 | | | 6.375 | | | | 07/01/2025 | | | | 629,175 | |
| | 565,000 | | | NJ Health Care Facilities Financing Authority (Avalon at Hillsborough)1 | | | 6.625 | | | | 07/01/2035 | | | | 444,779 | |
| | 5,245,000 | | | NJ Health Care Facilities Financing Authority (Bayonne Hospital)1 | | | 6.250 | | | | 07/01/2012 | | | | 5,168,790 | |
| | 39,155,000 | | | NJ Health Care Facilities Financing Authority (CHE/MM/MC Obligated Group)1 | | | 1.392 | 5 | | | 11/15/2033 | | | | 25,068,989 | |
| | 1,000,000 | | | NJ Health Care Facilities Financing Authority (Children’s Specialized Hospital)1 | | | 5.500 | | | | 07/01/2036 | | | | 811,070 | |
| | 60,000 | | | NJ Health Care Facilities Financing Authority (Chilton Memorial Hospital)1 | | | 5.000 | | | | 07/01/2013 | | | | 60,028 | |
| | 50,000 | | | NJ Health Care Facilities Financing Authority (CoMC/KMCC Obligated Group)1 | | | 5.500 | | | | 07/01/2017 | | | | 50,011 | |
| | 35,000 | | | NJ Health Care Facilities Financing Authority (CoMC/KMCC Obligated Group)1 | | | 5.500 | | | | 07/01/2027 | | | | 32,263 | |
| | 7,000,000 | | | NJ Health Care Facilities Financing Authority (Deborah Heart & Lung Center)1 | | | 6.300 | | | | 07/01/2023 | | | | 6,961,080 | |
| | 750,000 | | | NJ Health Care Facilities Financing Authority (Hebrew Old Age Center of Atlantic City)1 | | | 5.300 | | | | 11/01/2026 | | | | 546,728 | |
| | 1,000,000 | | | NJ Health Care Facilities Financing Authority (Hebrew Old Age Center of Atlantic City)1 | | | 5.375 | | | | 11/01/2036 | | | | 660,940 | |
| | 1,260,000 | | | NJ Health Care Facilities Financing Authority (Holy Name Hospital)1 | | | 5.000 | | | | 07/01/2036 | | | | 927,562 | |
| | 5,485,000 | | | NJ Health Care Facilities Financing Authority (Jersey Shore University Medical Center)1 | | | 6.750 | | | | 07/01/2019 | | | | 5,491,143 | |
| | 50,000 | | | NJ Health Care Facilities Financing Authority (Palisades Medical Center)1 | | | 5.200 | | | | 07/01/2019 | | | | 39,639 | |
| | 435,000 | | | NJ Health Care Facilities Financing Authority (Palisades Medical Center)1 | | | 5.250 | | | | 07/01/2028 | | | | 289,162 | |
| | 1,395,666 | | | NJ Health Care Facilities Financing Authority (Pascack Valley Hospital Assoc.)3 | | | 5.125 | | | | 07/01/2018 | | | | 35,729 | |
| | 5,616,796 | | | NJ Health Care Facilities Financing Authority (Pascack Valley Hospital Assoc.)3 | | | 5.125 | | | | 07/01/2028 | | | | 143,790 | |
| | 131,636 | | | NJ Health Care Facilities Financing Authority (Pascack Valley Hospital Assoc.)3 | | | 6.625 | | | | 07/01/2036 | | | | 3,370 | |
| | 1,000,000 | | | NJ Health Care Facilities Financing Authority (Raritan Bay Medical Center)1 | | | 7.250 | | | | 07/01/2014 | | | | 951,460 | |
F4 | OPPENHEIMER NEW JERSEY MUNICIPAL FUND
| | | | | | | | | | | | | | | | | |
| Principal | | | | | | | | | | | | |
| Amount | | | | | Coupon | | | Maturity | | | Value | |
| |
| New Jersey Continued | | | | | | | | | | | | |
| $ | 9,830,000 | | | NJ Health Care Facilities Financing Authority (Raritan Bay Medical Center)1 | | | 7.250 | % | | | 07/01/2027 | | | $ | 8,270,372 | |
| | 25,000 | | | NJ Health Care Facilities Financing Authority (Society of the Valley Hospital) | | | 5.375 | | | | 07/01/2025 | | | | 22,510 | |
| | 10,000 | | | NJ Health Care Facilities Financing Authority (Somerset Medical Center)1 | | | 5.500 | | | | 07/01/2023 | | | | 6,648 | |
| | 70,000 | | | NJ Health Care Facilities Financing Authority (Somerset Medical Center)1 | | | 5.500 | | | | 07/01/2033 | | | | 38,546 | |
| | 250,000 | | | NJ Health Care Facilities Financing Authority (South Jersey Hospital System)1 | | | 5.000 | | | | 07/01/2036 | | | | 221,358 | |
| | 37,955,000 | | | NJ Health Care Facilities Financing Authority (St. Barnabas Corp./St. Barnabas Medical Center Obligated Group) | | | 6.250 | 6 | | | 07/01/2030 | | | | 6,347,594 | |
| | 45,000 | | | NJ Health Care Facilities Financing Authority (St. Barnabas)1 | | | 5.000 | | | | 07/01/2024 | | | | 35,512 | |
| | 10,000,000 | | | NJ Health Care Facilities Financing Authority (St. Joseph’s Hospital & Medical Center)1 | | | 6.625 | | | | 07/01/2038 | | | | 8,453,300 | |
| | 500,000 | | | NJ Health Care Facilities Financing Authority (St. Peter’s University Hospital/Margaret McLaughlin McCarrick Care Center Obligated Group)1 | | | 6.875 | | | | 07/01/2020 | | | | 502,970 | |
| | 1,050,000 | | | NJ Health Care Facilities Financing Authority (St. Peter’s University Hospital/Margaret McLaughlin McCarrick Care Center Obligated Group)1 | | | 6.875 | | | | 07/01/2030 | | | | 1,033,347 | |
| | 50,000 | | | NJ Health Care Facilities Financing Authority (THGS/THGSF Obligated Group)1 | | | 5.200 | | | | 07/01/2031 | | | | 38,918 | |
| | 2,000,000 | | | NJ Health Care Facilities Financing Authority (Trinitas Hospital)1 | | | 5.250 | | | | 07/01/2030 | | | | 1,490,360 | |
| | 5,880,000 | | | NJ Health Care Facilities Financing Authority (Trinitas Hospital/Marillac Corp. Obligated Group)1 | | | 5.250 | | | | 07/01/2030 | | | | 4,381,658 | |
| | 15,000 | | | NJ HFA1 | | | 5.250 | | | | 11/01/2015 | | | | 15,022 | |
| | 30,000 | | | NJ Higher Education Student Assistance Authority (Student Loans)1 | | | 5.250 | | | | 06/01/2018 | | | | 30,121 | |
| | 80,000 | | | NJ Higher Education Student Assistance Authority (Student Loans)1 | | | 5.300 | | | | 06/01/2017 | | | | 80,342 | |
| | 330,000 | | | NJ Higher Education Student Assistance Authority (Student Loans)1 | | | 6.000 | | | | 06/01/2015 | | | | 337,960 | |
| | 30,000,000 | | | NJ Higher Education Student Assistance Authority (Student Loans)4 | | | 6.125 | | | | 06/01/2030 | | | | 30,210,278 | |
| | 10,000 | | | NJ Higher Education Student Assistance Authority (Student Loans)1 | | | 6.150 | | | | 06/01/2019 | | | | 10,169 | |
| | 85,000 | | | NJ Hsg. & Mtg. Finance Agency (Homebuyer)1 | | | 5.150 | | | | 10/01/2018 | | | | 86,073 | |
| | 2,145,000 | | | NJ Hsg. & Mtg. Finance Agency (Multifamily)1 | | | 4.900 | | | | 11/01/2026 | | | | 2,009,179 | |
| | 1,000,000 | | | NJ Hsg. & Mtg. Finance Agency (Multifamily)1 | | | 5.000 | | | | 11/01/2036 | | | | 908,400 | |
F5 | OPPENHEIMER NEW JERSEY MUNICIPAL FUND
STATEMENT OF INVESTMENTS Continued
| | | | | | | | | | | | | | | | | |
| Principal | | | | | | | | | | | | |
| Amount | | | | | Coupon | | | Maturity | | | Value | |
| |
| New Jersey Continued | | | | | | | | | | | | |
| $ | 225,000 | | | NJ Hsg. & Mtg. Finance Agency (Multifamily)1 | | | 5.150 | % | | | 11/01/2030 | | | $ | 216,272 | |
| | 45,000 | | | NJ Hsg. & Mtg. Finance Agency (Multifamily)1 | | | 5.400 | | | | 11/01/2017 | | | | 45,070 | |
| | 10,000,000 | | | NJ Hsg. & Mtg. Finance Agency (Single Family Hsg.)4 | | | 4.550 | | | | 10/01/2022 | | | | 9,573,574 | |
| | 5,000,000 | | | NJ Hsg. & Mtg. Finance Agency (Single Family Hsg.)4 | | | 4.625 | | | | 10/01/2027 | | | | 4,491,525 | |
| | 370,000 | | | NJ Hsg. & Mtg. Finance Agency (Single Family Hsg.)1 | | | 4.800 | | | | 10/01/2047 | | | | 317,479 | |
| | 4,500,000 | | | NJ Hsg. & Mtg. Finance Agency (Single Family Hsg.)4 | | | 5.000 | | | | 10/01/2037 | | | | 4,131,225 | |
| | 5,970,000 | | | NJ Hsg. & Mtg. Finance Agency (Single Family Hsg.)4 | | | 5.375 | | | | 04/01/2030 | | | | 5,907,166 | |
| | 2,225,000 | | | NJ Hsg. & Mtg. Finance Agency, Series A1 | | | 4.850 | | | | 11/01/2039 | | | | 1,965,543 | |
| | 1,910,000 | | | NJ Hsg. & Mtg. Finance Agency, Series A1 | | | 4.950 | | | | 11/01/2048 | | | | 1,686,473 | |
| | 130,000 | | | NJ Hsg. & Mtg. Finance Agency, Series A1 | | | 5.550 | | | | 05/01/2027 | | | | 129,992 | |
| | 1,525,000 | | | NJ Hsg. & Mtg. Finance Agency, Series M1 | | | 5.000 | | | | 10/01/2036 | | | | 1,382,367 | |
| | 55,000 | | | NJ Hsg. & Mtg. Finance Agency, Series T1 | | | 5.600 | | | | 04/01/2017 | | | | 55,158 | |
| | 75,000 | | | NJ Hsg. & Mtg. Finance Agency, Series U1 | | | 5.550 | | | | 10/01/2011 | | | | 75,226 | |
| | 750,000 | | | NJ Hsg. & Mtg. Finance Agency, Series U1 | | | 5.850 | | | | 04/01/2029 | | | | 750,390 | |
| | 200,000 | | | NJ South Jersey Port Corp.1 | | | 5.250 | | | | 01/01/2030 | | | | 180,508 | |
| | 17,245,000 | | | NJ Tobacco Settlement Financing Corp.1 | | | 4.500 | | | | 06/01/2023 | | | | 14,796,210 | |
| | 48,000,000 | | | NJ Tobacco Settlement Financing Corp.1 | | | 4.625 | | | | 06/01/2026 | | | | 33,254,880 | |
| | 30,035,000 | | | NJ Tobacco Settlement Financing Corp.1 | | | 4.750 | | | | 06/01/2034 | | | | 17,519,716 | |
| | 11,585,000 | | | NJ Tobacco Settlement Financing Corp.1 | | | 5.000 | | | | 06/01/2029 | | | | 7,887,184 | |
| | 200,950,000 | | | NJ Tobacco Settlement Financing Corp. | | | 5.812 | 6 | | | 06/01/2041 | | | | 7,824,993 | |
| | 417,450,000 | | | NJ Tobacco Settlement Financing Corp. | | | 6.292 | 6 | | | 06/01/2041 | | | | 18,351,102 | |
| | 15,000 | | | NJ Wastewater Treatment1 | | | 5.200 | | | | 09/01/2010 | | | | 15,054 | |
| | 20,000 | | | Pompton Lakes, NJ School District1 | | | 5.500 | | | | 08/01/2009 | | | | 20,000 | |
| | 1,535,000 | | | Port Authority NY/NJ (JFK International Air Terminal)1 | | | 5.750 | | | | 12/01/2022 | | | | 1,412,661 | |
| | 5,485,000 | | | Port Authority NY/NJ (JFK International Air Terminal)1 | | | 5.750 | | | | 12/01/2025 | | | | 4,896,789 | |
| | 2,650,000 | | | Port Authority NY/NJ (KIAC)1 | | | 6.750 | | | | 10/01/2011 | | | | 2,638,738 | |
| | 3,605,000 | | | Port Authority NY/NJ (KIAC)1 | | | 6.750 | | | | 10/01/2019 | | | | 2,905,378 | |
| | 9,235,000 | | | Port Authority NY/NJ, 127th Series4 | | | 5.250 | | | | 12/15/2032 | | | | 9,193,464 | |
| | 10,500,000 | | | Port Authority NY/NJ, 143rd Series4 | | | 5.000 | | | | 10/01/2030 | | | | 10,199,018 | |
| | 20,000 | | | Riverside, NJ Township GO2 | | | 5.450 | | | | 12/01/2010 | | | | 20,054 | |
| | 215,000 | | | Salem County, NJ IPCFA (Atlantic City Electric Company)1 | | | 5.600 | | | | 11/01/2025 | | | | 215,002 | |
| | 60,000 | | | Salem County, NJ IPCFA (Atlantic City Electric Company)1 | | | 5.600 | | | | 11/01/2025 | | | | 60,001 | |
| | 1,440,000 | | | Salem County, NJ IPCFA (Public Service Electric & Gas)1 | | | 5.750 | | | | 04/01/2031 | | | | 1,358,280 | |
| | 65,000 | | | Union County, NJ Improvement Authority (Linden Airport)1 | | | 5.000 | | | | 03/01/2028 | | | | 58,718 | |
| | 50,000 | | | Union County, NJ Utilities Authority (County Deficiency)1 | | | 5.000 | | | | 06/15/2028 | | | | 46,419 | |
| | 50,000 | | | Union County, NJ Utilities Authority (County Deficiency)1 | | | 5.000 | | | | 06/15/2028 | | | | 50,230 | |
F6 | OPPENHEIMER NEW JERSEY MUNICIPAL FUND
| | | | | | | | | | | | | | | | | |
| Principal | | | | | | | | | | | | |
| Amount | | | | | Coupon | | | Maturity | | | Value | |
| |
| New Jersey Continued | | | | | | | | | | | | |
| $ | 15,000 | | | Union County, NJ Utilities Authority (Ogden Martin Systems of Union)1 | | | 5.000 | % | | | 06/01/2016 | | | $ | 14,688 | |
| | 1,770,000 | | | Union County, NJ Utilities Authority (Ogden Martin Systems of Union)1 | | | 5.000 | | | | 06/01/2023 | | | | 1,586,009 | |
| | 185,000 | | | Union County, NJ Utilities Authority (Ogden Martin Systems of Union)1 | | | 5.350 | | | | 06/01/2023 | | | | 172,405 | |
| | 185,000 | | | Union County, NJ Utilities Authority (Ogden Martin Systems of Union)1 | | | 5.375 | | | | 06/01/2018 | | | | 181,032 | |
| | 350,000 | | | Union County, NJ Utilities Authority (Ogden Martin Systems of Union)1 | | | 5.375 | | | | 06/01/2019 | | | | 340,704 | |
| | 120,000 | | | Union County, NJ Utilities Authority (Ogden Martin Systems of Union)1 | | | 5.375 | | | | 06/01/2020 | | | | 115,324 | |
| | | | | | | | | | | | | | | | |
| | | | | | | | | | | | | | | | 514,399,177 | |
| U.S. Possessions—36.5% | | | | | | | | | | | | |
| | 5,570,000 | | | Guam GO1 | | | 5.125 | | | | 11/15/2027 | | | | 4,681,808 | |
| | 1,455,000 | | | Guam GO1 | | | 5.400 | | | | 11/15/2018 | | | | 1,236,925 | |
| | 400,000 | | | Guam GO1 | | | 6.750 | | | | 11/15/2029 | | | | 402,096 | |
| | 600,000 | | | Guam GO1 | | | 7.000 | | | | 11/15/2039 | | | | 601,872 | |
| | 2,500,000 | | | Guam Government Waterworks Authority & Wastewater System1 | | | 5.875 | | | | 07/01/2035 | | | | 2,215,725 | |
| | 3,900,000 | | | Guam Government Waterworks Authority & Wastewater System1 | | | 6.000 | | | | 07/01/2025 | | | | 3,629,613 | |
| | 50,000 | | | Guam Power Authority, Series A1 | | | 5.125 | | | | 10/01/2029 | | | | 41,911 | |
| | 395,000 | | | Northern Mariana Islands Commonwealth, Series A1 | | | 5.000 | | | | 06/01/2017 | | | | 351,052 | |
| | 4,625,000 | | | Northern Mariana Islands Commonwealth, Series A1 | | | 5.000 | | | | 06/01/2030 | | | | 3,351,275 | |
| | 300,000 | | | Northern Mariana Islands Commonwealth, Series A1 | | | 6.750 | | | | 10/01/2033 | | | | 271,143 | |
| | 1,200,000 | | | Northern Mariana Islands Ports Authority, Series A1 | | | 5.500 | | | | 03/15/2031 | | | | 797,748 | |
| | 3,145,000 | | | Northern Mariana Islands Ports Authority, Series A | | | 6.250 | | | | 03/15/2028 | | | | 2,096,551 | |
| | 2,500,000 | | | Puerto Rico Aqueduct & Sewer Authority1 | | | 0.000 | 7 | | | 07/01/2024 | | | | 2,008,050 | |
| | 10,000,000 | | | Puerto Rico Aqueduct & Sewer Authority4 | | | 5.125 | | | | 07/01/2047 | | | | 9,642,608 | |
| | 5,200,000 | | | Puerto Rico Children’s Trust Fund (TASC)1 | | | 5.500 | | | | 05/15/2039 | | | | 3,731,364 | |
| | 3,000,000 | | | Puerto Rico Children’s Trust Fund (TASC)1 | | | 5.625 | | | | 05/15/2043 | | | | 2,145,600 | |
| | 26,000,000 | | | Puerto Rico Children’s Trust Fund (TASC) | | | 7.031 | 6 | | | 05/15/2055 | | | | 303,420 | |
| | 350,000 | | | Puerto Rico Commonwealth GO1 | | | 5.000 | | | | 07/01/2025 | | | | 307,227 | |
| | 50,000 | | | Puerto Rico Commonwealth GO1 | | | 5.000 | | | | 07/01/2026 | | | | 43,670 | |
| | 4,685,000 | | | Puerto Rico Commonwealth GO1 | | | 5.000 | | | | 07/01/2034 | | | | 3,960,371 | |
| | 3,170,000 | | | Puerto Rico Commonwealth GO1 | | | 5.125 | | | | 07/01/2031 | | | | 2,760,943 | |
| | 945,000 | | | Puerto Rico Commonwealth GO1 | | | 5.250 | | | | 07/01/2030 | | | | 839,510 | |
| | 1,750,000 | | | Puerto Rico Commonwealth GO1 | | | 5.250 | | | | 07/01/2031 | | | | 1,550,185 | |
| | 950,000 | | | Puerto Rico Commonwealth GO1 | | | 5.250 | | | | 07/01/2032 | | | | 840,304 | |
| | 11,035,000 | | | Puerto Rico Commonwealth GO1 | | | 5.250 | | | | 07/01/2034 | | | | 9,674,936 | |
F7 | OPPENHEIMER NEW JERSEY MUNICIPAL FUND
STATEMENT OF INVESTMENTS Continued
| | | | | | | | | | | | | | | | | |
| Principal | | | | | | | | | | | | |
| Amount | | | | | Coupon | | | Maturity | | | Value | |
| |
| U.S. Possessions Continued | | | | | | | | | | | | |
| $ | 6,200,000 | | | Puerto Rico Electric Power Authority, Series UU1 | | | 1.080 | %5 | | | 07/01/2025 | | | $ | 3,073,650 | |
| | 20,500,000 | | | Puerto Rico Electric Power Authority, Series UU1 | | | 1.100 | 5 | | | 07/01/2031 | | | | 10,080,875 | |
| | 810,000 | | | Puerto Rico Highway & Transportation Authority, Series G1 | | | 5.000 | | | | 07/01/2042 | | | | 668,355 | |
| | 16,000,000 | | | Puerto Rico Highway & Transportation Authority, Series L1 | | | 5.250 | | | | 07/01/2038 | | | | 13,909,280 | |
| | 41,000,000 | | | Puerto Rico Highway & Transportation Authority, Series N1 | | | 0.930 | 5 | | | 07/01/2045 | | | | 21,227,750 | |
| | 450,000 | | | Puerto Rico Highway & Transportation Authority, Series N1 | | | 5.250 | | | | 07/01/2039 | | | | 388,854 | |
| | 1,000,000 | | | Puerto Rico Infrastructure1 | | | 5.000 | | | | 07/01/2027 | | | | 866,340 | |
| | 5,000,000 | | | Puerto Rico Infrastructure1 | | | 5.000 | | | | 07/01/2037 | | | | 4,044,800 | |
| | 5,000,000 | | | Puerto Rico Infrastructure1 | | | 5.000 | | | | 07/01/2037 | | | | 4,044,800 | |
| | 9,750,000 | | | Puerto Rico Infrastructure1 | | | 5.000 | | | | 07/01/2041 | | | | 7,802,535 | |
| | 20,100,000 | | | Puerto Rico Infrastructure1 | | | 5.000 | | | | 07/01/2046 | | | | 15,911,562 | |
| | 930,000 | | | Puerto Rico ITEMECF (Ana G. Mendez University)1 | | | 5.000 | | | | 03/01/2036 | | | | 653,567 | |
| | 100,000 | | | Puerto Rico ITEMECF (Ana G. Mendez University)1 | | | 5.375 | | | | 02/01/2019 | | | | 89,985 | |
| | 555,000 | | | Puerto Rico ITEMECF (Ana G. Mendez University)1 | | | 5.375 | | | | 02/01/2029 | | | | 439,704 | |
| | 1,710,000 | | | Puerto Rico ITEMECF (Cogeneration Facilities)1 | | | 6.625 | | | | 06/01/2026 | | | | 1,711,573 | |
| | 205,000 | | | Puerto Rico ITEMECF (Dr. Pila Hospital)1 | | | 6.250 | | | | 08/01/2032 | | | | 205,008 | |
| | 1,000,000 | | | Puerto Rico ITEMECF (Polytechnic University)1 | | | 5.000 | | | | 08/01/2032 | | | | 683,190 | |
| | 265,000 | | | Puerto Rico ITEMECF (SEAM/Hospital Espanol Auxillio Obligated Group)1 | | | 6.250 | | | | 07/01/2024 | | | | 265,061 | |
| | 500,000 | | | Puerto Rico Municipal Finance Agency, Series A1 | | | 5.250 | | | | 08/01/2024 | | | | 454,045 | |
| | 3,250,000 | | | Puerto Rico Municipal Finance Agency, Series A1 | | | 5.250 | | | | 08/01/2025 | | | | 2,933,385 | |
| | 18,350,000 | | | Puerto Rico Port Authority (American Airlines), Series A | | | 6.300 | | | | 06/01/2023 | | | | 7,380,003 | |
| | 80,000 | | | Puerto Rico Port Authority, Series D1 | | | 6.000 | | | | 07/01/2021 | | | | 80,014 | |
| | 265,000 | | | Puerto Rico Public Buildings Authority1 | | | 5.125 | | | | 07/01/2024 | | | | 237,281 | |
| | 4,535,000 | | | Puerto Rico Public Buildings Authority1 | | | 5.250 | | | | 07/01/2029 | | | | 3,975,336 | |
| | 305,000 | | | Puerto Rico Public Buildings Authority1 | | | 5.250 | | | | 07/01/2033 | | | | 258,704 | |
| | 200,000 | | | Puerto Rico Public Buildings Authority1 | | | 7.000 | | | | 07/01/2025 | | | | 208,516 | |
| | 1,530,000 | | | Puerto Rico Public Buildings Authority, Series D1 | | | 5.250 | | | | 07/01/2036 | | | | 1,286,577 | |
| | 9,000,000 | | | Puerto Rico Sales Tax Financing Corp., Series A4 | | | 5.250 | | | | 08/01/2057 | | | | 8,754,720 | |
| | 14,000,000 | | | Puerto Rico Sales Tax Financing Corp., Series C4 | | | 5.750 | | | | 08/01/2057 | | | | 14,353,150 | |
| | 1,000,000 | | | University of Puerto Rico1 | | | 5.000 | | | | 06/01/2025 | | | | 901,460 | |
| | 3,350,000 | | | University of Puerto Rico1 | | | 5.000 | | | | 06/01/2025 | | | | 3,019,891 | |
| | 3,000,000 | | | University of Puerto Rico, Series Q1 | | | 5.000 | | | | 06/01/2030 | | | | 2,563,110 | |
| | 150,000 | | | University of V.I., Series A1 | | | 5.250 | | | | 12/01/2023 | | | | 140,231 | |
| | 710,000 | | | University of V.I., Series A1 | | | 5.375 | | | | 06/01/2034 | | | | 612,148 | |
| | 1,000,000 | | | University of V.I., Series A1 | | | 6.000 | | | | 12/01/2024 | | | | 784,590 | |
F8 | OPPENHEIMER NEW JERSEY MUNICIPAL FUND
| | | | | | | | | | | | | | | | | |
| Principal | | | | | | | | | | | | |
| Amount | | | | | Coupon | | | Maturity | | | Value | |
| |
| U.S. Possessions Continued | | | | | | | | | | | | |
| $ | 40,000 | | | University of V.I., Series A1 | | | 6.250 | % | | | 12/01/2029 | | | $ | 30,430 | |
| | 40,000 | | | V.I. HFA, Series A1 | | | 6.500 | | | | 03/01/2025 | | | | 40,022 | |
| | 5,000,000 | | | V.I. Public Finance Authority (Hovensa Coker)1 | | | 6.500 | | | | 07/01/2021 | | | | 4,973,050 | |
| | 1,515,000 | | | V.I. Public Finance Authority, Series A1 | | | 6.375 | | | | 10/01/2019 | | | | 1,530,665 | |
| | 325,000 | | | V.I. Public Finance Authority, Series E1 | | | 5.875 | | | | 10/01/2018 | | | | 318,087 | |
| | 2,500,000 | | | V.I. Public Finance Authority, Series E1 | | | 6.000 | | | | 10/01/2022 | | | | 2,389,400 | |
| | 1,100,000 | | | V.I. Tobacco Settlement Financing Corp. | | | 6.500 | 6 | | | 05/15/2035 | | | | 79,926 | |
| | 2,050,000 | | | V.I. Tobacco Settlement Financing Corp. | | | 6.875 | 6 | | | 05/15/2035 | | | | 126,116 | |
| | 3,100,000 | | | V.I. Tobacco Settlement Financing Corp. | | | 7.625 | 6 | | | 05/15/2035 | | | | 164,331 | |
| | 175,000 | | | V.I. Water & Power Authority1 | | | 5.300 | | | | 07/01/2021 | | | | 150,764 | |
| | | | | | | | | | | | | | | | |
| | | | | | | | | | | | | | | | 201,298,748 | |
| | | | | | | | | | | | | | | | |
| Total Municipal Bonds and Notes (Cost $897,520,153) | | | | | | | | | | | 715,697,925 | |
| | | | | | | | | | | | | | | | | |
| Units | | | | | Strike Price | | | Expiration | | | | | |
| |
| Rights, Warrants, and Certificates—0.0% | | | | | | | | | | | | |
| | 652,688 | | | Converted Organics, Inc. Wts. (Cost $0) | | $ | 11.000 | | | | 02/13/2012 | | | | 195,806 | |
| | |
| Total Investments, at Value (Cost $897,520,153)—129.7% | | | | | | | | | | | 715,893,731 | |
| Liabilities in Excess of Other Assets—(29.7) | | | | | | | | | | | (164,121,929 | ) |
| | | | | | | | | | | | | | | | |
| | | | | | | | | | | | | | | | | |
| Net Assets—100.0% | | | | | | | | | | $ | 551,771,802 | |
| | | | | | | | | | | | | | | | |
Footnotes to Statement of Investments
| 1. | | All or a portion of the security has been segregated for collateral to cover borrowings. See Note 6 of accompanying Notes. |
| |
| 2. | | Illiquid security. The aggregate value of illiquid securities as of July 31, 2009 was $55,054, which represents 0.01% of the Fund’s net assets. See Note 5 of accompanying Notes. |
| |
| 3. | | Issue is in default. See Note 1 of accompanying Notes. |
| |
| 4. | | Security represents the underlying municipal bond on an inverse floating rate security. The bond was purchased by the Fund and subsequently segregated and transferred to a trust. See Note 1 of accompanying Notes. |
| |
| 5. | | Represents the current interest rate for a variable or increasing rate security. |
| |
| 6. | | Zero coupon bond reflects effective yield on the date of purchase. |
| |
| 7. | | Denotes a step bond: a zero coupon bond that converts to a fixed or variable interest rate at a designated future date. |
F9 | OPPENHEIMER NEW JERSEY MUNICIPAL FUND
STATEMENT OF INVESTMENTS Continued
Footnotes to Statement of Investments Continued
Valuation Inputs
Various data inputs are used in determining the value of each of the Fund’s investments as of the reporting period end. These data inputs are categorized in the following hierarchy under applicable financial accounting standards:
| | 1) | | Level 1—unadjusted quoted prices in active markets for identical assets or liabilities (including securities actively traded on a securities exchange) |
| |
| | 2) | | Level 2—inputs other than unadjusted quoted prices that are observable for the asset (such as unadjusted quoted prices for similar assets and market corroborated inputs such as interest rates, prepayment speeds, credit risks, etc.) |
| |
| | 3) | | Level 3—significant unobservable inputs (including the Manager’s own judgments about assumptions that market participants would use in pricing the asset). |
The table below categorizes amounts that are included in the Fund’s Statement of Assets and Liabilities as of July 31, 2009 based on valuation input level:
| | | | | | | | | | | | | | | | | |
| | | | | | | | | | | Level 3- | | | | |
| | | Level 1- | | | Level 2- | | | Significant | | | | |
| | | Unadjusted | | | Other Significant | | | Unobservable | | | | |
| | | Quoted prices | | | Observable Inputs | | | Inputs | | | Value | |
| |
Assets Table | | | | | | | | | | | | | | | | |
Investments, at Value: | | | | | | | | | | | | | | | | |
| Municipal Bonds and Notes | | | | | | | | | | | | | | | | |
| New Jersey | | $ | — | | | $ | 514,399,177 | | | $ | — | | | $ | 514,399,177 | |
| U.S. Possessions | | | — | | | | 201,298,748 | | | | — | | | | 201,298,748 | |
| Rights, Warrants, and Certificates | | | 195,806 | | | | — | | | | — | | | | 195,806 | |
| | | |
| Total Assets | | $ | 195,806 | | | $ | 715,697,925 | | | $ | — | | | $ | 715,893,731 | |
| | | |
Currency contracts and forwards, if any, are reported at their unrealized appreciation/depreciation at measurement date, which represents the change in the contract’s value from trade date. Futures, if any, are reported at their variation margin at measurement date, which represents the amount due to/from the Fund at that date. All additional assets and liabilities included in the above table are reported at their market value at measurement date.
See the accompanying Notes for further discussion of the methods used in determining value of the Fund’s investments, and a summary of changes to the valuation techniques, if any, during the reporting period.
To simplify the listings of securities, abbreviations are used per the table below:
| | | |
| CHE | | Catholic Health East |
| COP | | Certificates of Participation |
| CoMC | | Community Medical Center |
| DRIVERS | | Derivative Inverse Tax Exempt Receipts |
| EDA | | Economic Devel. Authority |
| GO | | General Obligation |
| HDC | | Housing Devel. Corp. |
| HFA | | Housing Finance Agency |
| HFC | | Housing Finance Corp. |
| IPCFA | | Industrial Pollution Control Financing Authority |
| ITEMECF | | Industrial, Tourist, Educational, Medical and Environmental Community Facilities |
| JFK | | John Fitzgerald Kennedy |
| KMCC | | Kensington Manor Care Center |
| MC | | McCauley Center |
| MM | | Mercy Medical |
| NY/NJ | | New York/New Jersey |
| PCFA | | Pollution Control Finance Authority |
| ROLs | | Residual Options Longs |
| SEAM | | Sociedad Espanola de Auxilio Mutuo |
| TASC | | Tobacco Settlement Asset-Backed Bonds |
| THGS | | The House of the Good Shepard |
| THGSF | | The House of the Good Shepard Foundation |
| V.I. | | United States Virgin Islands |
See accompanying Notes to Financial Statements.
F10 | OPPENHEIMER NEW JERSEY MUNICIPAL FUND
STATEMENT OF ASSETS AND LIABILITIES July 31, 2009
| | | | | |
Assets | | | | |
| Investments, at value (cost $897,520,153)—see accompanying statement of investments | | $ | 715,893,731 | |
| Cash | | | 541,014 | |
| Receivables and other assets: | | | | |
| Interest | | | 8,110,227 | |
| Shares of beneficial interest sold | | | 745,696 | |
| Investments sold | | | 5,000 | |
| Other | | | 363,388 | |
| | | | |
| Total assets | | | 725,659,056 | |
| | | | | |
Liabilities | | | | |
| Payables and other liabilities: | | | | |
| Payable for short-term floating rate notes issued (See Note 1) | | | 111,325,000 | |
| Payable on borrowings (See Note 6) | | | 60,900,000 | |
| Shares of beneficial interest redeemed | | | 847,279 | |
| Dividends | | | 308,470 | |
| Investments purchased | | | 105,054 | |
| Trustees’ compensation | | | 83,945 | |
| Distribution and service plan fees | | | 67,294 | |
| Shareholder communications | | | 28,698 | |
| Interest expense on borrowings | | | 28,010 | |
| Transfer and shareholder servicing agent fees | | | 26,365 | |
| Other | | | 167,139 | |
| | | | |
| Total liabilities | | | 173,887,254 | |
| | | | | |
Net Assets | | $ | 551,771,802 | |
| | | | |
| | | | | |
Composition of Net Assets | | | | |
| Paid-in capital | | $ | 782,352,055 | |
| Accumulated net investment income | | | 5,298,332 | |
| Accumulated net realized loss on investments | | | (54,252,163 | ) |
| Net unrealized depreciation on investments | | | (181,626,422 | ) |
| | | | |
| | |
Net Assets | | $ | 551,771,802 | |
| | | | |
F11 | OPPENHEIMER NEW JERSEY MUNICIPAL FUND
STATEMENT OF ASSETS AND LIABILITIES Continued
| | | | | |
Net Asset Value Per Share | | | | |
| | |
| Class A Shares: | | | | |
| Net asset value and redemption price per share (based on net assets of $361,112,699 and 41,833,889 shares of beneficial interest outstanding) | | $ | 8.63 | |
| Maximum offering price per share (net asset value plus sales charge of 4.75% of offering price) | | $ | 9.06 | |
| | |
| Class B Shares: | | | | |
| Net asset value, redemption price (excludes applicable contingent deferred sales charge) and offering price per share (based on net assets of $37,076,492 and 4,288,691 shares of beneficial interest outstanding) | | $ | 8.65 | |
| | |
| Class C Shares: | | | | |
| Net asset value, redemption price (excludes applicable contingent deferred sales charge) and offering price per share (based on net assets of $153,582,611 and 17,776,703 shares of beneficial interest outstanding) | | $ | 8.64 | |
See accompanying Notes to Financial Statements.
F12 | OPPENHEIMER NEW JERSEY MUNICIPAL FUND
STATEMENT OF OPERATIONS For the Year Ended July 31, 2009
| | | | | |
Investment Income | | | | |
| Interest | | $ | 51,417,171 | |
| Other income | | | 396 | |
| | | | |
| Total investment income | | | 51,417,567 | |
| | | | | |
Expenses | | | | |
| Management fees | | | 2,906,963 | |
| Distribution and service plan fees: | | | | |
| Class A | | | 513,679 | |
| Class B | | | 350,330 | |
| Class C | | | 1,303,205 | |
| Transfer and shareholder servicing agent fees: | | | | |
| Class A | | | 172,204 | |
| Class B | | | 44,179 | |
| Class C | | | 99,233 | |
| Shareholder communications: | | | | |
| Class A | | | 21,386 | |
| Class B | | | 9,583 | |
| Class C | | | 19,050 | |
| Borrowing fees | | | 3,250,078 | |
| Interest expense and fees on short-term floating rate notes issued (See Note 1) | | | 2,731,196 | |
| Interest expense on borrowings | | | 1,608,930 | |
| Trustees’ compensation | | | 23,508 | |
| Custodian fees and expenses | | | 7,766 | |
| Other | | | 119,052 | |
| | | | |
| Total expenses | | | 13,180,342 | |
| Less reduction to custodian expenses | | | (965 | ) |
| | | | |
| Net expenses | | | 13,179,377 | |
| | | | | |
Net Investment Income | | | 38,238,190 | |
| | |
Realized and Unrealized Loss | | | | |
| Net realized loss on investments | | | (29,157,553 | ) |
| Net change in unrealized depreciation on investments | | | (75,259,531 | ) |
| | | | | |
Net Decrease in Net Assets Resulting from Operations | | $ | (66,178,894 | ) |
| | | | |
See accompanying Notes to Financial Statements.
F13 | OPPENHEIMER NEW JERSEY MUNICIPAL FUND
STATEMENTS OF CHANGES IN NET ASSETS
| | | | | | | | | |
| Year Ended July 31, | | 2009 | | | 2008 | |
| |
Operations | | | | | | | | |
| Net investment income | | $ | 38,238,190 | | | $ | 39,061,867 | |
| Net realized loss | | | (29,157,553 | ) | | | (23,834,879 | ) |
| Net change in unrealized depreciation | | | (75,259,531 | ) | | | (121,570,462 | ) |
| | | |
| Net decrease in net assets resulting from operations | | | (66,178,894 | ) | | | (106,343,474 | ) |
| | | | | | | | | |
Dividends and/or Distributions to Shareholders | | | | | | | | |
| Dividends from net investment income: | | | | | | | | |
| Class A | | | (23,337,815 | ) | | | (26,304,136 | ) |
| Class B | | | (2,253,792 | ) | | | (2,582,285 | ) |
| Class C | | | (8,447,046 | ) | | | (8,530,712 | ) |
| | | |
| | | | (34,038,653 | ) | | | (37,417,133 | ) |
| | | | | | | | | |
Beneficial Interest Transactions | | | | | | | | |
| Net decrease in net assets resulting from beneficial interest transactions: | | | | | | | | |
| Class A | | | (39,552,338 | ) | | | (27,574,196 | ) |
| Class B | | | (8,320,135 | ) | | | (9,377,328 | ) |
| Class C | | | (3,873,039 | ) | | | (10,784,825 | ) |
| | | |
| | | | (51,745,512 | ) | | | (47,736,349 | ) |
| | | | | | | | | |
Net Assets | | | | | | | | |
| Total decrease | | | (151,963,059 | ) | | | (191,496,956 | ) |
| Beginning of period | | | 703,734,861 | | | | 895,231,817 | |
| | | |
| | | | | | | | | |
| End of period (including accumulated net investment income of $5,298,332 and $1,223,631, respectively) | | $ | 551,771,802 | | | $ | 703,734,861 | |
| | | |
See accompanying Notes to Financial Statements.
F14 | OPPENHEIMER NEW JERSEY MUNICIPAL FUND
STATEMENT OF CASH FLOWS For the Year Ended July 31, 2009
| | | | | |
Cash Flows from Operating Activities | | | | |
| Net decrease in net assets from operations | | $ | (66,178,894 | ) |
| Adjustments to reconcile net decrease in net assets from operations to net cash provided by operating activities: | | | | |
| Purchase of investment securities | | | (81,107,493 | ) |
| Proceeds from disposition of investment securities | | | 127,986,294 | |
| Short-term investment securities, net | | | 32,477,684 | |
| Premium amortization | | | 1,204,768 | |
| Discount accretion | | | (7,719,501 | ) |
| Net realized loss on investments | | | 29,157,553 | |
| Net change in unrealized depreciation on investments | | | 75,259,531 | |
| Decrease in interest receivable | | | 728,232 | |
| Decrease in receivable for securities sold | | | 197,091 | |
| Increase in other assets | | | (296,883 | ) |
| Decrease in payable for securities purchased | | | (10,784,784 | ) |
| Increase in payable for accrued expenses | | | 22,640 | |
| | | | |
| Net cash provided by operating activities | | | 100,946,238 | |
| | | | | |
Cash Flows from Financing Activities | | | | |
| Proceeds from bank borrowings | | | 275,700,000 | |
| Payments on bank borrowings | | | (251,300,000 | ) |
| Payments on short-term floating rate notes issued | | | (39,185,000 | ) |
| Proceeds from shares sold | | | 98,057,935 | |
| Payments on shares redeemed | | | (170,826,442 | ) |
| Cash distributions paid | | | (13,321,316 | ) |
| | | | |
| Net cash used in financing activities | | | (100,874,823 | ) |
| Net increase in cash | | | 71,415 | |
| Cash, beginning balance | | | 469,599 | |
| | | | |
| Cash, ending balance | | $ | 541,014 | |
| | | | |
Supplemental disclosure of cash flow information:
Noncash financing activities not included herein consist of reinvestment of dividends and distributions of $21,193,579.
Cash paid for interest on bank borrowings—$1,654,435.
Cash paid for interest on short-term floating rate notes issued—$2,731,196.
See accompanying Notes to Financial Statements.
F15 | OPPENHEIMER NEW JERSEY MUNICIPAL FUND
FINANCIAL HIGHLIGHTS
| | | | | | | | | | | | | | | | | | | | | |
| Class A Year Ended July 31, | | 2009 | | | 2008 | | | 2007 | | | 2006 | | | 2005 | |
| |
Per Share Operating Data | | | | | | | | | | | | | | | | | | | | |
| Net asset value, beginning of period | | $ | 10.00 | | | $ | 11.98 | | | $ | 11.90 | | | $ | 12.03 | | | $ | 10.76 | |
| |
| Income (loss) from investment operations: | | | | | | | | | | | | | | | | | | | | |
Net investment income1 | | | .61 | | | | .57 | | | | .52 | | | | .55 | | | | .62 | |
| Net realized and unrealized gain (loss) | | | (1.42 | ) | | | (2.01 | ) | | | .09 | | | | (.09 | ) | | | 1.32 | |
| | | |
| Total from investment operations | | | (.81 | ) | | | (1.44 | ) | | | .61 | | | | .46 | | | | 1.94 | |
| |
| Dividends and/or distributions to shareholders: | | | | | | | | | | | | | | | | | | | | |
| Dividends from net investment income | | | (.56 | ) | | | (.54 | ) | | | (.53 | ) | | | (.59 | ) | | | (.67 | ) |
| |
| | | | | | | | | | | | | | | | | | | | | |
| Net asset value, end of period | | $ | 8.63 | | | $ | 10.00 | | | $ | 11.98 | | | $ | 11.90 | | | $ | 12.03 | |
| | | |
| | | | | | | | | | | | | | | | | | | | | |
Total Return, at Net Asset Value2 | | | (7.63 | )% | | | (12.20 | )% | | | 5.13 | % | | | 3.93 | % | | | 18.46 | % |
| | | | | | | | | | | | | | | | | | | | | |
Ratios/Supplemental Data | | | | | | | | | | | | | | | | | | | | |
| Net assets, end of period (in thousands) | | $ | 361,113 | | | $ | 467,974 | | | $ | 591,238 | | | $ | 371,295 | | | $ | 200,831 | |
| |
| Average net assets (in thousands) | | $ | 352,897 | | | $ | 526,573 | | | $ | 486,782 | | | $ | 287,248 | | | $ | 133,634 | |
| |
Ratios to average net assets:3 | | | | | | | | | | | | | | | | | | | | |
| Net investment income | | | 7.40 | % | | | 5.20 | % | | | 4.32 | % | | | 4.67 | % | | | 5.41 | % |
| Expenses excluding interest and fees on short-term floating rate notes issued | | | 1.67 | % | | | 0.84 | % | | | 0.82 | % | | | 0.90 | % | | | 0.91 | % |
Interest and fees on short-term floating rate notes issued4 | | | 0.51 | % | | | 0.70 | % | | | 0.62 | % | | | 0.63 | % | | | 0.35 | % |
| | | |
| Total expenses | | | 2.18 | % | | | 1.54 | % | | | 1.44 | % | | | 1.53 | % | | | 1.26 | % |
| Expenses after payments, waivers and/or reimbursements and reduction to custodian expenses | | | 2.18 | % | | | 1.54 | % | | | 1.44 | % | | | 1.47 | % | | | 1.06 | % |
| |
| Portfolio turnover rate | | | 14 | % | | | 31 | % | | | 18 | % | | | 19 | % | | | 7 | % |
| | |
| 1. | | Per share amounts calculated based on the average shares outstanding during the period. |
| |
| 2. | | Assumes an investment on the business day before the first day of the fiscal period, with all dividends and distributions reinvested in additional shares on the reinvestment date, and redemption at the net asset value calculated on the last business day of the fiscal period. Sales charges are not reflected in the total returns. Total returns are not annualized for periods less than one full year. Returns do not reflect the deduction of taxes that a shareholder would pay on fund distributions or the redemption of fund shares. |
| |
| 3. | | Annualized for periods less than one full year. |
| |
| 4. | | Interest and fee expense relates to the Fund’s liability for short-term floating rate notes issued in conjunction with inverse floating rate security transactions. |
See accompanying Notes to Financial Statements.
F16 | OPPENHEIMER NEW JERSEY MUNICIPAL FUND
| | | | | | | | | | | | | | | | | | | | | |
| Class B Year Ended July 31, | | 2009 | | | 2008 | | | 2007 | | | 2006 | | | 2005 | |
| |
Per Share Operating Data | | | | | | | | | | | | | | | | | | | | |
| Net asset value, beginning of period | | $ | 10.02 | | | $ | 11.99 | | | $ | 11.91 | | | $ | 12.05 | | | $ | 10.78 | |
| |
| Income (loss) from investment operations: | | | | | | | | | | | | | | | | | | | | |
Net investment income1 | | | .54 | | | | .48 | | | | .43 | | | | .47 | | | | .54 | |
| Net realized and unrealized gain (loss) | | | (1.43 | ) | | | (1.99 | ) | | | .08 | | | | (.11 | ) | | | 1.31 | |
| | | |
| Total from investment operations | | | (.89 | ) | | | (1.51 | ) | | | .51 | | | | .36 | | | | 1.85 | |
| |
| Dividends and/or distributions to shareholders: | | | | | | | | | | | | | | | | | | | | |
| Dividends from net investment income | | | (.48 | ) | | | (.46 | ) | | | (.43 | ) | | | (.50 | ) | | | (.58 | ) |
| |
| | | | | | | | | | | | | | | | | | | | | |
| Net asset value, end of period | | $ | 8.65 | | | $ | 10.02 | | | $ | 11.99 | | | $ | 11.91 | | | $ | 12.05 | |
| | | |
| | | | | | | | | | | | | | | | | | | | | |
Total Return, at Net Asset Value2 | | | (8.39 | )% | | | (12.81 | )% | | | 4.30 | % | | | 3.03 | % | | | 17.53 | % |
| | | | | | | | | | | | | | | | | | | | | |
Ratios/Supplemental Data | | | | | | | | | | | | | | | | | | | | |
| Net assets, end of period (in thousands) | | $ | 37,076 | | | $ | 52,981 | | | $ | 73,579 | | | $ | 73,887 | | | $ | 62,399 | |
| |
| Average net assets (in thousands) | | $ | 39,035 | | | $ | 61,772 | | | $ | 75,560 | | | $ | 68,065 | | | $ | 56,755 | |
| |
Ratios to average net assets:3 | | | | | | | | | | | | | | | | | | | | |
| Net investment income | | | 6.56 | % | | | 4.39 | % | | | 3.55 | % | | | 3.93 | % | | | 4.74 | % |
| Expenses excluding interest and fees on short-term floating rate notes issued | | | 2.52 | % | | | 1.64 | % | | | 1.61 | % | | | 1.69 | % | | | 1.68 | % |
Interest and fees on short-term floating rate notes issued4 | | | 0.51 | % | | | 0.70 | % | | | 0.62 | % | | | 0.63 | % | | | 0.35 | % |
| | | |
| Total expenses | | | 3.03 | % | | | 2.34 | % | | | 2.23 | % | | | 2.32 | % | | | 2.03 | % |
| Expenses after payments, waivers and/or reimbursements and reduction to custodian expenses | | | 3.03 | % | | | 2.34 | % | | | 2.23 | % | | | 2.24 | % | | | 1.83 | % |
| |
| Portfolio turnover rate | | | 14 | % | | | 31 | % | | | 18 | % | | | 19 | % | | | 7 | % |
| | |
| 1. | | Per share amounts calculated based on the average shares outstanding during the period. |
| |
| 2. | | Assumes an investment on the business day before the first day of the fiscal period, with all dividends and distributions reinvested in additional shares on the reinvestment date, and redemption at the net asset value calculated on the last business day of the fiscal period. Sales charges are not reflected in the total returns. Total returns are not annualized for periods less than one full year. Returns do not reflect the deduction of taxes that a shareholder would pay on fund distributions or the redemption of fund shares. |
| |
| 3. | | Annualized for periods less than one full year. |
| |
| 4. | | Interest and fee expense relates to the Fund’s liability for short-term floating rate notes issued in conjunction with inverse floating rate security transactions. |
See accompanying Notes to Financial Statements.
F17 | OPPENHEIMER NEW JERSEY MUNICIPAL FUND
FINANCIAL HIGHLIGHTS Continued
| | | | | | | | | | | | | | | | | | | | | |
| Class C Year Ended July 31, | | 2009 | | | 2008 | | | 2007 | | | 2006 | | | 2005 | |
| |
Per Share Operating Data | | | | | | | | | | | | | | | | | | | | |
| Net asset value, beginning of period | | $ | 10.01 | | | $ | 11.99 | | | $ | 11.91 | | | $ | 12.04 | | | $ | 10.77 | |
| |
| Income (loss) from investment operations: | | | | | | | | | | | | | | | | | | | | |
Net investment income1 | | | .55 | | | | .48 | | | | .43 | | | | .46 | | | | .53 | |
| Net realized and unrealized gain (loss) | | | (1.43 | ) | | | (2.00 | ) | | �� | .09 | | | | (.09 | ) | | | 1.32 | |
| | | |
| Total from investment operations | | | (.88 | ) | | | (1.52 | ) | | | .52 | | | | .37 | | | | 1.85 | |
| |
| Dividends and/or distributions to shareholders: | | | | | | | | | | | | | | | | | | | | |
| Dividends from net investment income | | | (.49 | ) | | | (.46 | ) | | | (.44 | ) | | | (.50 | ) | | | (.58 | ) |
| |
| | | | | | | | | | | | | | | | | | | | | |
| Net asset value, end of period | | $ | 8.64 | | | $ | 10.01 | | | $ | 11.99 | | | $ | 11.91 | | | $ | 12.04 | |
| | | |
| | | | | | | | | | | | | | | | | | | | | |
Total Return, at Net Asset Value2 | | | (8.35 | )% | | | (12.87 | )% | | | 4.33 | % | | | 3.14 | % | | | 17.54 | % |
| | | | | | | | | | | | | | | | | | | | | |
Ratios/Supplemental Data | | | | | | | | | | | | | | | | | | | | |
| Net assets, end of period (in thousands) | | $ | 153,583 | | | $ | 182,780 | | | $ | 230,415 | | | $ | 138,581 | | | $ | 70,128 | |
| |
| Average net assets (in thousands) | | $ | 144,708 | | | $ | 202,047 | | | $ | 188,557 | | | $ | 104,423 | | | $ | 40,717 | |
| |
Ratios to average net assets:3 | | | | | | | | | | | | | | | | | | | | |
| Net investment income | | | 6.63 | % | | | 4.43 | % | | | 3.55 | % | | | 3.90 | % | | | 4.57 | % |
| Expenses excluding interest and fees on short-term floating rate notes issued | | | 2.46 | % | | | 1.61 | % | | | 1.58 | % | | | 1.66 | % | | | 1.67 | % |
Interest and fees on short-term floating rate notes issued4 | | | 0.51 | % | | | 0.70 | % | | | 0.62 | % | | | 0.63 | % | | | 0.35 | % |
| | | |
| Total expenses | | | 2.97 | % | | | 2.31 | % | | | 2.20 | % | | | 2.29 | % | | | 2.02 | % |
| Expenses after payments, waivers and/or reimbursements and reduction to custodian expenses | | | 2.97 | % | | | 2.31 | % | | | 2.20 | % | | | 2.23 | % | | | 1.82 | % |
| |
| Portfolio turnover rate | | | 14 | % | | | 31 | % | | | 18 | % | | | 19 | % | | | 7 | % |
| | |
| 1. | | Per share amounts calculated based on the average shares outstanding during the period. |
| |
| 2. | | Assumes an investment on the business day before the first day of the fiscal period, with all dividends and distributions reinvested in additional shares on the reinvestment date, and redemption at the net asset value calculated on the last business day of the fiscal period. Sales charges are not reflected in the total returns. Total returns are not annualized for periods less than one full year. Returns do not reflect the deduction of taxes that a shareholder would pay on fund distributions or the redemption of fund shares. |
| |
| 3. | | Annualized for periods less than one full year. |
| |
| 4. | | Interest and fee expense relates to the Fund’s liability for short-term floating rate notes issued in conjunction with inverse floating rate security transactions. |
See accompanying Notes to Financial Statements.
F18 | OPPENHEIMER NEW JERSEY MUNICIPAL FUND
NOTES TO FINANCIAL STATEMENTS Unaudited
1. Significant Accounting Policies
Oppenheimer New Jersey Municipal Fund (the “Fund”) is a separate series of Oppenheimer Multi-State Municipal Trust, a non-diversified, open-end management investment company registered under the Investment Company Act of 1940, as amended. The Fund’s investment objective is to seek as high a level of current interest income exempt from federal and New Jersey income taxes for individual investors as is consistent with preservation of capital. The Fund’s investment adviser is OppenheimerFunds, Inc. (the “Manager”).
The Fund offers Class A, Class B and Class C shares. Class A shares are sold at their offering price, which is normally net asset value plus a front-end sales charge. Class B and Class C shares are sold without a front-end sales charge but may be subject to a contingent deferred sales charge (“CDSC”). All classes of shares have identical rights and voting privileges with respect to the Fund in general and exclusive voting rights on matters that affect that class alone. Earnings, net assets and net asset value per share may differ due to each class having its own expenses, such as transfer and shareholder servicing agent fees and shareholder communications, directly attributable to that class. Class A, B and C have separate distribution and/or service plans. Class B shares will automatically convert to Class A shares 72 months after the date of purchase.
The following is a summary of significant accounting policies consistently followed by the Fund.
Securities Valuation. The Fund calculates the net asset value of its shares as of the close of the New York Stock Exchange (the “Exchange”), normally 4:00 P.M. Eastern time, on each day the Exchange is open for trading.
Each investment asset or liability of the Fund is assigned a level at measurement date based on the significance and source of the inputs to its valuation. Unadjusted quoted prices in active markets for identical securities are classified as “Level 1,” inputs other than unadjusted quoted prices for an asset that are observable are classified as “Level 2” and unobservable inputs, including the Manager’s judgment about the assumptions that a market participant would use in pricing an asset or liability are classified as “Level 3.” The inputs used for valuing securities are not necessarily an indication of the risks associated with investing in those securities. A table summarizing the Fund’s investments under these levels of classification is included following the Statement of Investments.
Securities are valued using unadjusted quoted market prices, when available, as supplied primarily either by portfolio pricing services approved by the Board of Trustees or dealers.
Securities traded on a registered U.S. securities exchange are valued based on the last sale price of the security reported on the principal exchange on which traded, prior to the time when the Fund’s assets are valued. Securities whose principal exchange is NASDAQ® are valued based on the official closing prices reported by NASDAQ prior to the time when the Fund’s assets are valued. In the absence of a sale, the security is valued at the last sale price on the prior trading day, if it is within the spread of the current day’s closing “bid” and “asked” prices, and if not, at the current day’s closing bid price. A foreign security traded on a foreign exchange is valued based on the last sale price on the principal
F19 | OPPENHEIMER NEW JERSEY MUNICIPAL FUND
NOTES TO FINANCIAL STATEMENTS Unaudited / Continued
1. Significant Accounting Policies Continued
exchange on which the security is traded, as identified by the portfolio pricing service used by the Manager, prior to the time when the Fund’s assets are valued. In the absence of a sale, the security is valued at the most recent official closing price on the principal exchange on which it is traded.
Shares of a registered investment company that are not traded on an exchange are valued at that investment company’s net asset value per share.
Corporate, government and municipal debt instruments having a remaining maturity in excess of sixty days and all mortgage-backed securities, collateralized mortgage obligations and other asset-backed securities are valued at the mean between the “bid” and “asked” prices.
“Money market-type” debt instruments with remaining maturities of sixty days or less are valued at cost adjusted by the amortization of discount or premium to maturity (amortized cost), which approximates market value.
In the absence of a readily available unadjusted quoted market price, including for securities whose values have been materially affected by what the Manager identifies as a significant event occurring before the Fund’s assets are valued but after the close of the securities’ respective exchanges, the Manager, acting through its internal valuation committee, in good faith determines the fair valuation of that asset using consistently applied procedures under the supervision of the Board of Trustees (which reviews those fair valuations by the Manager). Those procedures include certain standardized methodologies to fair value securities. Such methodologies include, but are not limited to, pricing securities initially at cost and subsequently adjusting the value based on: changes in company specific fundamentals, changes in an appropriate securities index, or changes in the value of similar securities which may be adjusted for any discounts related to resale restrictions. When possible, such methodologies use observable market inputs such as unadjusted quoted prices of similar securities, observable interest rates, currency rates and yield curves. The methodologies used for valuing securities are not necessarily an indication of the risks associated with investing in those securities.
There have been no significant changes to the fair valuation methodologies during the period.
Inverse Floating Rate Securities. The Fund invests in inverse floating rate securities that pay interest at a rate that varies inversely with short-term interest rates. Certain of these securities may be leveraged, whereby the interest rate varies inversely at a multiple of the change in short-term rates. As interest rates rise, inverse floaters produce less current income. The price of such securities is more volatile than comparable fixed rate securities. The Fund may expose up to 20% of its total assets to the effects of leverage from its investments in inverse floaters. The Fund’s exposure to the effects of leverage from its investments in inverse floaters amount to $111,325,000 as of July 31, 2009, which represents 15.34% of the Fund’s total assets.
F20 | OPPENHEIMER NEW JERSEY MUNICIPAL FUND
Certain inverse floating rate securities are created when the Fund purchases and subsequently transfers a municipal bond security (the “municipal bond”) to a broker dealer. The municipal bond is typically a fixed rate security. The broker dealer (the “sponsor”) creates a trust (the “Trust”) and deposits the municipal bond. The Trust issues short-term floating rate notes available to third parties and a residual interest in the municipal bond (referred to as an “inverse floating rate security”) to the Fund. The terms of these inverse floating rate securities grant the Fund the right to require that the Trust issuing the inverse floating rate security compel a tender of the short-term floating rate notes to facilitate the Fund’s repurchase of the underlying municipal bond. Following such a request, the Fund pays the sponsor the principal amount due to the holders of the short-term floating rate notes issued by the Trust and exchanges the inverse floating rate security for the underlying municipal bond. These transactions are considered secured borrowings for financial reporting purposes. As a result of such accounting treatments, the Fund includes the municipal bond position on its Statement of Investments (but does not separately include the inverse floating rate securities received). The Fund also includes the value of the municipal bond and a payable amount equal to the short-term floating rate notes issued by the Trust on its Statement of Assets and Liabilities. The interest rates on these short-term floating rate notes reset periodically, usually weekly. The holders of these short-term floating rate notes have the option to tender their investment, to the sponsor or the Trust’s liquidity provider, for redemption at par at each reset date. Income from the municipal bond position and the interest expense on the payable for the short-term floating rate notes issued by the Trust are recorded on the Fund’s Statement of Operations. At July 31, 2009, municipal bond holdings with a value of $161,613,781 shown on the Fund’s Statement of Investments are held by such Trusts and serve as collateral for the $111,325,000 in short-term floating rate notes issued and outstanding at that date.
The Fund’s investments in inverse floaters involve certain risks. The market value of an inverse floating rate security can be more volatile than that of a conventional fixed-rate bond having similar credit quality, maturity and redemption provisions. Typically, an inverse floating rate security tends to underperform fixed rate bonds when long-term interest rates are rising but tends to outperform fixed rate bonds when long-term interest rates are stable or falling. An inverse floating rate security entails a degree of leverage because the trust issues short-term securities in a ratio to the inverse floating rate security with the underlying long-term bond providing collateral for the obligation to pay the principal value of the short-term securities if and when they are tendered. If the Fund has created the inverse floater by depositing a long-term bond into a trust, it may be required to provide additional collateral for the short-term securities if the value of the underlying bond deposited in the trust falls.
F21 | OPPENHEIMER NEW JERSEY MUNICIPAL FUND
NOTES TO FINANCIAL STATEMENTS Unaudited / Continued
1. Significant Accounting Policies Continued
At July 31, 2009, the Fund’s residual exposure to these types of inverse floating rate securities were as follows:
| | | | | | | | | | | | | | | | | |
| Principal | | | | | Coupon | | | Maturity | | | | |
| Amount | | | Inverse Floater1 | | Rate2 | | | Date | | | Value | |
| |
| $ | 4,520,000 | | | NJ EDA ROLs3 | | | 12.012 | % | | | 3/1/28 | | | $ | 4,901,669 | |
| | 9,045,000 | | | NJ EDA ROLs3 | | | 12.012 | | | | 3/1/30 | | | | 9,560,384 | |
| | 7,950,000 | | | NJ Higher Education Assistance
Authority (Student Loans) ROLs | | | 17.137 | | | | 6/1/30 | | | | 8,160,278 | |
| | 2,500,000 | | | NJ Hsg. & Mtg. Finance Agency
(Single Family Hsg.) DRIVERS | | | 7.021 | | | | 10/1/27 | | | | 1,991,525 | |
| | 2,985,000 | | | NJ Hsg. & Mtg. Finance Agency
(Single Family Hsg.) DRIVERS | | | 8.322 | | | | 4/1/30 | | | | 2,922,166 | |
| | 2,250,000 | | | NJ Hsg. & Mtg. Finance Agency
(Single Family Hsg.) DRIVERS | | | 7.671 | | | | 10/1/37 | | | | 1,881,225 | |
| | 2,840,000 | | | NJ Hsg. & Mtg. Finance Agency ROLs3 | | | 12.596 | | | | 10/1/22 | | | | 2,413,574 | |
| | 2,305,000 | | | Port Authority NY/NJ, 238th Series ROLs | | | 15.153 | | | | 12/15/32 | | | | 2,263,464 | |
| | 5,250,000 | | | Port Authority NY/NJ, 3205th Series | | | 7.721 | | | | 10/1/46 | | | | 4,949,018 | |
| | 4,995,000 | | | Puerto Rico Aqueduct & Sewer
Authority ROLs | | | 7.764 | | | | 7/1/47 | | | | 4,637,608 | |
| | 3,000,000 | | | Puerto Rico Sales Tax Financing Corp.
ROLs3 | | | 11.398 | | | | 8/1/57 | | | | 2,754,720 | |
| | 3,500,000 | | | Puerto Rico Sales Tax Financing Corp.
ROLs3 | | | 8.350 | | | | 8/1/57 | | | | 3,853,150 | |
| | | | | | | | | | | | | | | | |
| | | | | | | | | | | | | | | $ | 50,288,781 | |
| | | | | | | | | | | | | | | | |
| | |
| 1. | | For a list of abbreviations used in the Inverse Floater table see the Portfolio Abbreviations table on page F10 of the Statement of Investments. |
| |
| 2. | | Represents the current interest rate for a variable rate bond known as an “inverse floater.” |
| |
| 3. | | Security is subject to a shortfall and forbearance agreement. |
The Fund enters into shortfall and forbearance agreements with the sponsors of certain inverse floaters held by the Fund. These agreements commit the Fund to reimburse the sponsor of the inverse floater, in certain circumstances, for the amount of the difference between the liquidation value of the underlying security (which is the basis of the inverse floater) and the principal amount due to the holders of the short-term floating rate notes issued by the Trust in conjunction with the inverse floating rate security. Under the standard terms of an inverse floating rate security, absent such a shortfall and forbearance agreement, the Fund would not be required to make such a reimbursement. The Manager monitors the Fund’s potential exposure with respect to these agreements on a daily basis and intends to take action to terminate the Fund’s investment in such inverse floating rate securities, if it deems it appropriate to do so. As of July 31, 2009, in addition to the exposure detailed in the preceding table, the Fund’s maximum exposure under such agreements is estimated at $64,355,000.
F22 | OPPENHEIMER NEW JERSEY MUNICIPAL FUND
Credit Risk. The Fund invests in high-yield, non-investment-grade bonds, which may be subject to a greater degree of credit risk. Credit risk relates to the ability of the issuer to meet interest or principal payments or both as they become due. The Fund may acquire securities in default, and is not obligated to dispose of securities whose issuers subsequently default. Information concerning securities in default as of July 31, 2009 is as follows:
| | | | | |
| Cost | | $ | 10,548,580 | |
| Market Value | | $ | 5,039,291 | |
| Market Value as a % of Net Assets | | | 0.91 | % |
Concentration Risk. There are certain risks arising from geographic concentration in any state. Certain economic, regulatory or political developments occurring in the state may impair the ability of certain issuers of municipal securities to pay principal and interest on their obligations.
Allocation of Income, Expenses, Gains and Losses. Income, expenses (other than those attributable to a specific class), gains and losses are allocated on a daily basis to each class of shares based upon the relative proportion of net assets represented by such class Operating expenses directly attributable to a specific class are charged against the operations of that class.
Federal Taxes. The Fund intends to comply with provisions of the Internal Revenue Code applicable to regulated investment companies and to distribute substantially all of its investment company taxable income, including any net realized gain on investments not offset by capital loss carryforwards, if any, to shareholders. Therefore, no federal income or excise tax provision is required. The Fund files income tax returns in U.S. federal and applicable state jurisdictions. The statute of limitations on the Fund’s tax return filings generally remain open for the three preceding fiscal reporting period ends.
The tax components of capital shown in the following table represent distribution requirements the Fund must satisfy under the income tax regulations, losses the Fund may be able to offset against income and gains realized in future years and unrealized appreciation or depreciation of securities and other investments for federal income tax purposes.
| | | | | | | | | | | | | | | | | |
| | | | | | | | | | | | | | | Net Unrealized | |
| | | | | | | | | | | | | | | Depreciation | |
| | | | | | | | | | | | | | | Based on Cost of | |
| | | | | | | | | | | | | | | Securities and | |
| Undistributed | | | | | Undistributed | | | Accumulated | | | Other Investments | |
| Net Investment | | | | | Long-Term | | | Loss | | | for Federal Income | |
| Income | | | | | Gain | | | Carryforward1,2,3,4 | | | Tax Purposes | |
| |
| $ | 5,993,413 | | | | | $ | — | | | $ | 47,906,921 | | | $ | 187,971,667 | |
1. As of July 31, 2009, the Fund had $21,311,716 of net capital loss carryforwards available to offset future realized capital gains, if any, and thereby reduce future taxable gain distributions. As of July 31, 2009, details of the capital loss carryforwards were as follows:
F23 | OPPENHEIMER NEW JERSEY MUNICIPAL FUND
NOTES TO FINANCIAL STATEMENTS Unaudited / Continued
1. Significant Accounting Policies Continued
| | | | | |
| Expiring | | | | |
| |
| 2010 | | $ | 1,401,537 | |
| 2012 | | | 115,750 | |
| 2014 | | | 34,199 | |
| 2016 | | | 1,646,477 | |
| 2017 | | | 18,113,753 | |
| | | | |
| Total | | $ | 21,311,716 | |
| | | | |
2. As of July 31, 2009, the Fund had $26,595,205 of post-October losses available to offset future realized capital gains, if any. Such losses, if unutilized, will expire in 2018.
3. During the fiscal year ended July 31, 2009, the Fund did not utilize any capital loss carryforward.
4. During the fiscal year ended July 31, 2008, the Fund did not utilize any capital loss carryforward.
Net investment income (loss) and net realized gain (loss) may differ for financial statement and tax purposes. The character of dividends and distributions made during the fiscal year from net investment income or net realized gains may differ from their ultimate characterization for federal income tax purposes. Also, due to timing of dividends and distributions, the fiscal year in which amounts are distributed may differ from the fiscal year in which the income or net realized gain was recorded by the Fund.
Accordingly, the following amounts have been reclassified for July 31, 2009. Net assets of the Fund were unaffected by the reclassifications.
| | | | | | | | | |
| Reduction to | | | | | Reduction to | |
| Accumulated | | | | | Accumulated Net | |
| Net Investment | | | | | Realized Loss | |
| Income | | | | | on Investments | |
| |
| $ | 124,836 | | | | | $ | 124,836 | |
The tax character of distributions paid during the years ended July 31, 2009 and July 31, 2008 was as follows:
| | | | | | | | | |
| | | Year Ended | | | Year Ended | |
| | | July 31, 2009 | | | July 31, 2008 | |
| |
| Distributions paid from: | | | | | | | | |
| Exempt-interest dividends | | $ | 33,981,047 | | | $ | 37,375,134 | |
| Ordinary income | | | 57,606 | | | | 41,999 | |
| | | |
| Total | | $ | 34,038,653 | | | $ | 37,417,133 | |
| | | |
The aggregate cost of securities and other investments and the composition of unrealized appreciation and depreciation of securities and other investments for federal income tax purposes as of July 31, 2009 are noted in the following table. The primary difference between book and tax appreciation or depreciation of securities and other investments, if applicable, is attributable to the tax deferral of losses or tax realization of financial statement unrealized gain or loss.
| | | | | |
| Federal tax cost of securities | | $ | 791,162,301 | |
| | | | |
| | |
| Gross unrealized appreciation | | $ | 10,075,186 | |
| Gross unrealized depreciation | | | (198,046,853 | ) |
| | | | |
| Net unrealized depreciation | | $ | (187,971,667 | ) |
| | | | |
F24 | OPPENHEIMER NEW JERSEY MUNICIPAL FUND
Trustees’ Compensation. The Fund has adopted an unfunded retirement plan (the “Plan”) for the Fund’s independent trustees. Benefits are based on years of service and fees paid to each trustee during their period of service. The Plan was frozen with respect to adding new participants effective December 31, 2006 (the “Freeze Date”) and existing Plan Participants as of the Freeze Date will continue to receive accrued benefits under the Plan. Active independent trustees as of the Freeze Date have each elected a distribution method with respect to their benefits under the Plan. During the year ended July 31, 2009, the Fund’s projected benefit obligations, payments to retired trustees and accumulated liability were as follows:
| | | | | |
| Projected Benefit Obligations Increased | | $ | 7,042 | |
| Payments Made to Retired Trustees | | | 5,485 | |
| Accumulated Liability as of July 31, 2009 | | | 55,558 | |
The Board of Trustees has adopted a compensation deferral plan for independent trustees that enables trustees to elect to defer receipt of all or a portion of the annual compensation they are entitled to receive from the Fund. For purposes of determining the amount owed to the Trustee under the plan, deferred amounts are treated as though equal dollar amounts had been invested in shares of the Fund or in other Oppenheimer funds selected by the Trustee. The Fund purchases shares of the funds selected for deferral by the Trustee in amounts equal to his or her deemed investment, resulting in a Fund asset equal to the deferred compensation liability. Such assets are included as a component of “Other” within the asset section of the Statement of Assets and Liabilities. Deferral of trustees’ fees under the plan will not affect the net assets of the Fund, and will not materially affect the Fund’s assets, liabilities or net investment income per share. Amounts will be deferred until distributed in accordance to the compensation deferral plan.
Dividends and Distributions to Shareholders. Dividends and distributions to shareholders, which are determined in accordance with income tax regulations and may differ from U.S. generally accepted accounting principles, are recorded on the ex-dividend date. Income distributions, if any, are declared daily and paid monthly. Capital gain distributions, if any, are declared and paid annually.
Investment Income. Interest income is recognized on an accrual basis. Discount and premium, which are included in interest income on the Statement of Operations, are amortized or accreted daily.
Custodian Fees. “Custodian fees and expenses” in the Statement of Operations may include interest expense incurred by the Fund on any cash overdrafts of its custodian account during the period. Such cash overdrafts may result from the effects of failed trades in portfolio securities and from cash outflows resulting from unanticipated shareholder redemption activity. The Fund pays interest to its custodian on such cash overdrafts, to the extent they are not offset by positive earnings on cash balances maintained by the Fund, at a rate equal to the 1 Month LIBOR Rate plus 2.00%. The “Reduction to custodian expenses” line item, if applicable, represents earnings on cash balances maintained by the Fund during the period. Such interest expense and other custodian fees may be paid with these earnings.
F25 | OPPENHEIMER NEW JERSEY MUNICIPAL FUND
NOTES TO FINANCIAL STATEMENTS Unaudited / Continued
1. Significant Accounting Policies Continued
Security Transactions. Security transactions are recorded on the trade date. Realized gains and losses on securities sold are determined on the basis of identified cost.
Indemnifications. The Fund’s organizational documents provide current and former trustees and officers with a limited indemnification against liabilities arising in connection with the performance of their duties to the Fund. In the normal course of business, the Fund may also enter into contracts that provide general indemnifications. The Fund’s maximum exposure under these arrangements is unknown as this would be dependent on future claims that may be made against the Fund. The risk of material loss from such claims is considered remote.
Other. The preparation of financial statements in conformity with accounting principles generally accepted in the United States of America requires management to make estimates and assumptions that affect the reported amounts of assets and liabilities and disclosure of contingent assets and liabilities at the date of the financial statements and the reported amounts of increases and decreases in net assets from operations during the reporting period. Actual results could differ from those estimates.
2. Shares of Beneficial Interest
The Fund has authorized an unlimited number of no par value shares of beneficial interest of each class. Transactions in shares of beneficial interest were as follows:
| | | | | | | | | | | | | | | | | |
| | | Year Ended July 31, 2009 | | | Year Ended July 31, 2008 | |
| | | Shares | | | Amount | | | Shares | | | Amount | |
| |
Class A | | | | | | | | | | | | | | | | |
| Sold | | | 7,688,444 | | | $ | 64,119,263 | | | | 14,838,614 | | | $ | 164,225,523 | |
| Dividends and/or distributions reinvested | | | 1,793,924 | | | | 14,627,633 | | | | 1,548,571 | | | | 16,757,573 | |
| Redeemed | | | (14,426,064 | ) | | | (118,299,234 | ) | | | (18,964,978 | ) | | | (208,557,292 | ) |
| | | |
| Net decrease | | | (4,943,696 | ) | | $ | (39,552,338 | ) | | | (2,577,793 | ) | | $ | (27,574,196 | ) |
| | | |
| | | | | | | | | | | | | | | | | |
Class B | | | | | | | | | | | | | | | | |
| Sold | | | 440,979 | | | $ | 3,678,061 | | | | 589,209 | | | $ | 6,462,965 | |
| Dividends and/or distributions reinvested | | | 175,807 | | | | 1,430,440 | | | | 151,893 | | | | 1,646,057 | |
| Redeemed | | | (1,616,788 | ) | | | (13,428,636 | ) | | | (1,586,728 | ) | | | (17,486,350 | ) |
| | | |
| Net decrease | | | (1,000,002 | ) | | $ | (8,320,135 | ) | | | (845,626 | ) | | $ | (9,377,328 | ) |
| | | |
| | | | | | | | | | | | | | | | | |
Class C | | | | | | | | | | | | | | | | |
| Sold | | | 3,613,638 | | | $ | 29,497,258 | | | | 4,914,635 | | | $ | 53,827,810 | |
| Dividends and/or distributions reinvested | | | 631,561 | | | | 5,135,506 | | | | 475,838 | | | | 5,148,837 | |
| Redeemed | | | (4,724,645 | ) | | | (38,505,803 | ) | | | (6,355,032 | ) | | | (69,761,472 | ) |
| | | |
| Net decrease | | | (479,446 | ) | | $ | (3,873,039 | ) | | | (964,559 | ) | | $ | (10,784,825 | ) |
| | | |
F26 | OPPENHEIMER NEW JERSEY MUNICIPAL FUND
3. Purchases and Sales of Securities
The aggregate cost of purchases and proceeds from sales of securities, other than short-term obligations, for the year ended July 31, 2009, were as follows:
| | | | | | | | | |
| | | Purchases | | | Sales | |
| |
| Investment securities | | $ | 81,107,493 | | | $ | 127,986,294 | |
4. Fees and Other Transactions with Affiliates
Management Fees. Under the investment advisory agreement, the Fund pays the Manager a management fee based on the daily net assets of the Fund at an annual rate as shown in the following table:
| | | | | |
| Fee Schedule | | | | |
| |
| Up to $200 million | | | 0.60 | % |
| Next $100 million | | | 0.55 | |
| Next $200 million | | | 0.50 | |
| Next $250 million | | | 0.45 | |
| Next $250 million | | | 0.40 | |
| Over $1 billion | | | 0.35 | |
Transfer Agent Fees. OppenheimerFunds Services (“OFS”), a division of the Manager, acts as the transfer and shareholder servicing agent for the Fund. The Fund pays OFS a per account fee. For the year ended July 31, 2009, the Fund paid $317,184 to OFS for services to the Fund.
Distribution and Service Plan (12b-1) Fees. Under its General Distributor’s Agreement with the Fund, OppenheimerFunds Distributor, Inc. (the “Distributor”) acts as the Fund’s principal underwriter in the continuous public offering of the Fund’s classes of shares.
Service Plan for Class A Shares. The Fund has adopted a Service Plan (the “Plan”) for Class A shares under Rule 12b-1 of the Investment Company Act of 1940. Under the Plan, the Fund reimburses the Distributor for a portion of its costs incurred for services provided to accounts that hold Class A shares. Reimbursement is made periodically at an annual rate of up to 0.15% of the daily net assets of Class A shares of the Fund. The Distributor currently uses all of those fees to pay dealers, brokers, banks and other financial institutions periodically for providing personal service and maintenance of accounts of their customers that hold Class A shares. Any unreimbursed expenses the Distributor incurs with respect to Class A shares in any fiscal year cannot be recovered in subsequent periods. Fees incurred by the Fund under the Plan are detailed in the Statement of Operations.
Distribution and Service Plans for Class B and Class C Shares. The Fund has adopted Distribution and Service Plans (the “Plans”) for Class B and Class C shares under Rule 12b-1 of the Investment Company Act of 1940 to compensate the Distributor for its services in connection with the distribution of those shares and servicing accounts. Under the Plans, the Fund pays the Distributor an annual asset-based sales charge of 0.75% on Class B and Class C shares daily net assets. The Distributor also receives a service fee of 0.15% per year under each plan. If either the Class B or Class C plan is terminated by the Fund or by the
F27 | OPPENHEIMER NEW JERSEY MUNICIPAL FUND
NOTES TO FINANCIAL STATEMENTS Unaudited / Continued
4. Fees and Other Transactions with Affiliates Continued
shareholders of a class, the Board of Trustees and its independent trustees must determine whether the Distributor shall be entitled to payment from the Fund of all or a portion of the service fee and/or asset-based sales charge in respect to shares sold prior to the effective date of such termination. Fees incurred by the Fund under the Plans are detailed in the Statement of Operations. The Distributor determines its uncompensated expenses under the Plans at calendar quarter ends. The Distributor’s aggregate uncompensated expenses under the Plans at June 30, 2009 were as follows:
| | | | | |
| Class B | | $ | 2,173,638 | |
| Class C | | | 2,940,863 | |
Sales Charges. Front-end sales charges and contingent deferred sales charges (“CDSC”) do not represent expenses of the Fund. They are deducted from the proceeds of sales of Fund shares prior to investment or from redemption proceeds prior to remittance, as applicable. The sales charges retained by the Distributor from the sale of shares and the CDSC retained by the Distributor on the redemption of shares is shown in the following table for the period indicated.
| | | | | | | | | | | | | | | | | |
| | | | | | | Class A | | | Class B | | | Class C | |
| | | | | | | Contingent | | | Contingent | | | Contingent | |
| | | Class A | | | Deferred Sales | | | Deferred Sales | | | Deferred Sales | |
| | | Front-End Sales | | | Charges | | | Charges | | | Charges | |
| | | Charges Retained | | | Retained by | | | Retained by | | | Retained by | |
| Year Ended | | by Distributor | | | Distributor | | | Distributor | | | Distributor | |
| |
| July 31, 2009 | | $ | 103,170 | | | $ | 3,195 | | | $ | 135,674 | | | $ | 23,057 | |
Waivers and Reimbursements of Expenses. OFS has voluntarily agreed to limit transfer and shareholder servicing agent fees for all classes to 0.35% of average annual net assets per class. This undertaking may be amended or withdrawn at any time.
5. Illiquid Securities
As of July 31, 2009, investments in securities included issues that are illiquid. Investments may be illiquid because they do not have an active trading market, making it difficult to value them or dispose of them promptly at an acceptable price. The Fund will not invest more than 15% of its net assets (determined at the time of purchase and reviewed periodically) in illiquid securities. Securities that are illiquid are marked with an applicable footnote on the Statement of Investments.
6. Borrowings
The Fund can borrow money from banks in amounts up to one third of its total assets (including the amount borrowed) less all liabilities and indebtedness other than borrowings. The Fund can use those borrowings for investment-related purposes such as purchasing portfolio securities. The Fund can also borrow for other purposes, such as to raise money to unwind or “collapse” trusts that issued “inverse floaters” to the Fund, or to contribute to such trusts to enable them to meet tenders of their short-term securities
F28 | OPPENHEIMER NEW JERSEY MUNICIPAL FUND
by the holders of those securities. The Fund also may borrow to meet redemption obligations or for temporary and emergency purposes. The purchase of securities with borrowed funds creates leverage in the Fund. The use of leverage will subject the Fund to greater costs than funds that do not borrow for leverage, and may also make the Fund’s share price more sensitive to interest changes. The interest on borrowed money is an expense that might reduce the Fund’s yield. Expenses incurred by the Fund with respect to interest on borrowings and commitment fees are disclosed separately or as other expenses on the Statement of Operations.
The Fund entered into a Revolving Credit and Security Agreement (the “Agreement”) with a conduit lender and a bank which enables it to participate with certain other Oppenheimer funds in a committed, secured borrowing facility that permits borrowings of up to $3.0 billion, collectively. To secure the loan, the Fund pledges investment securities in accordance with the terms of the Agreement. Interest is charged to the Fund, based on its borrowings, at current commercial paper issuance rates (0.437% as of July 31, 2009). The Fund pays additional fees annually to its lender on its outstanding borrowings to manage and administer the facility and is allocated its pro-rata share of an annual commitment fee on the amount of the unused portion of the total facility size. Total fees and interest that are included in expenses on the Fund’s Statement of Operations related to its participation in the borrowing facility during the year ended July 31, 2009 equal 0.91% of the Fund’s average net assets on an annualized basis. The Fund has the right to prepay such loans and terminate its participation in the conduit loan facility at any time upon prior notice.
As of July 31, 2009, the Fund had borrowings outstanding at an interest rate of 0.437%. Details of the borrowings for the year ended July 31, 2009 are as follows:
| | | | | |
| Average Daily Loan Balance | | $ | 79,318,082 | |
| Average Daily Interest Rate | | | 1.934 | % |
| Fees Paid | | $ | 3,482,158 | |
| Interest Paid | | $ | 1,654,435 | |
7. Subsequent Events Evaluation
The Fund has evaluated the need for disclosures and/or adjustments resulting from subsequent events through September 17, 2009, the date the financial statements were available to be issued. This evaluation determined that there are no subsequent events that necessitated disclosures and/or adjustments.
8. Pending Litigation
During 2009, a number of complaints have been filed in federal courts against the Manager, the Distributor, and certain mutual funds advised by the Manager and distributed by the Distributor—including the Fund. The complaints naming the Fund as a defendant also name certain officers, trustees and former trustees of the Fund. The plaintiffs are seeking class action status on behalf of purchasers of shares of the Fund during a particular time period. The complaints against the Fund raise claims under federal securities laws alleging that, among other things, the disclosure documents of the Fund contained misrepresentations
F29 | OPPENHEIMER NEW JERSEY MUNICIPAL FUND
NOTES TO FINANCIAL STATEMENTS Unaudited / Continued
8. Pending Litigation Continued
and omissions, that the Fund’s investment policies were not followed, and that the Fund and the other defendants violated federal securities laws and regulations and certain state laws. The plaintiffs seek unspecified damages, equitable relief and an award of attorneys’ fees and litigation expenses. The litigations involving certain other Oppenheimer funds are similar in nature.
A complaint has been brought in state court against the Manager, the Distributor and another subsidiary of the Manager (but not against the Fund), on behalf of the Oregon College Savings Plan Trust, and other complaints have been brought in state court against the Manager and that subsidiary (but not against the Fund), on behalf of the New Mexico Education Plan Trust. All of these complaints allege breach of contract, breach of fiduciary duty, negligence and violation of state securities laws, and seek compensatory damages, equitable relief and an award of attorneys’ fees and litigation expenses.
Other complaints have been filed in 2008 and 2009 in state and federal courts, by investors who made investments through an affiliate of the Manager, against the Manager and certain of its affiliates. Those complaints relate to the alleged investment fraud perpetrated by Bernard Madoff and his firm (“Madoff ”) and allege a variety of claims, including breach of fiduciary duty, fraud, negligent misrepresentation, unjust enrichment, and violation of federal and state securities laws and regulations, among others. They seek unspecified damages, equitable relief and an award of attorneys’ fees and litigation expenses. None of the suits have named the Distributor, any of the Oppenheimer mutual funds or any of their independent Trustees or Directors. None of the Oppenheimer funds invested in any funds or accounts managed by Madoff.
The Manager believes that the lawsuits described above are without legal merit and intends to defend them vigorously. The Fund’s Board of Trustees has also engaged counsel to defend the suits vigorously on behalf of the Fund, the Fund’s Board and the Trustees named in those suits. While it is premature to render any opinion as to the likelihood of an outcome in these lawsuits, or whether any costs that the Fund may bear in defending the suits might not be reimbursed by insurance or the Manager, the Manager believes that these suits should not have any material effect on the operations of the Fund and that the outcome of all of the suits together should not impair the ability of the Manager or the Distributor to perform their respective duties to the Fund.
F30 | OPPENHEIMER NEW JERSEY MUNICIPAL FUND
REPORT OF INDEPENDENT REGISTERED PUBLIC ACCOUNTING FIRM
The Board of Trustees and Shareholders of Oppenheimer Multi-State Municipal Trust:
We have audited the accompanying statement of assets and liabilities of Oppenheimer New Jersey Municipal Fund (one of the portfolios constituting the Oppenheimer Multi-State Municipal Trust), including the statement of investments, as of July 31, 2009, and the related statements of operations and cash flows for the year then ended, the statements of changes in net assets for each of the years in the two-year period then ended, and the financial highlights for each of the years in the five-year period then ended. These financial statements and financial highlights are the responsibility of the Fund’s management. Our responsibility is to express an opinion on these financial statements and financial highlights based on our audits.
We conducted our audits in accordance with the standards of the Public Company Accounting Oversight Board (United States). Those standards require that we plan and perform the audit to obtain reasonable assurance about whether the financial statements and financial highlights are free of material misstatement. An audit includes examining, on a test basis, evidence supporting the amounts and disclosures in the financial statements. Our procedures included confirmation of securities owned as of July 31, 2009, by correspondence with the custodian and brokers or by other appropriate auditing procedures where replies from brokers were not received. An audit also includes assessing the accounting principles used and significant estimates made by management, as well as evaluating the overall financial statement presentation. We believe that our audits provide a reasonable basis for our opinion.
In our opinion, the financial statements and financial highlights referred to above present fairly, in all material respects, the financial position of Oppenheimer New Jersey Municipal Fund as of July 31, 2009, the results of its operations and its cash flows for the year then ended, the changes in its net assets for each of the years in the two-year period then ended, and the financial highlights for each of the years in the five-year period then ended, in conformity with U.S. generally accepted accounting principles.
KPMG llp
Denver, Colorado
September 17, 2009
F31 | OPPENHEIMER NEW JERSEY MUNICIPAL FUND
FEDERAL INCOME TAX INFORMATION Unaudited
In early 2009, if applicable, shareholders of record received information regarding all dividends and distributions paid to them by the Fund during calendar year 2008. Regulations of the U.S. Treasury Department require the Fund to report this information to the Internal Revenue Service.
None of the dividends paid by the Fund during the fiscal year ended July 31, 2009 are eligible for the corporate dividend-received deduction. 99.83% of the dividends were derived from interest on municipal bonds and are not subject to federal income taxes. To the extent a shareholder is subject to any state or local tax laws, some or all of the dividends received may be taxable.
The foregoing information is presented to assist shareholders in reporting distributions received from the Fund to the Internal Revenue Service. Because of the complexity of the federal regulations which may affect your individual tax return and the many variations in state and local tax regulations, we recommend that you consult your tax advisor for specific guidance.
27 | OPPENHEIMER NEW JERSEY MUNICIPAL FUND
BOARD APPROVAL OF THE FUND’S INVESTMENT ADVISORY AGREEMENT Unaudited
Each year, the Board of Trustees (the “Board”), including a majority of the independent Trustees, is required to determine whether to renew the Fund’s investment advisory agreement (the “Agreement”). The Investment Company Act of 1940, as amended, requires that the Board request and evaluate, and that the Manager provide, such information as may be reasonably necessary to evaluate the terms of the Agreement. The Board employs an independent consultant to prepare a report that provides information, including comparative information that the Board requests for that purpose. In addition, the Board receives information throughout the year regarding Fund services, fees, expenses and performance.
The Manager and the independent consultant provided information to the Board on the following factors: (i) the nature, quality and extent of the Manager’s services, (ii) the investment performance of the Fund and the Manager, (iii) the fees and expenses of the Fund, including comparative expense information, (iv) the profitability of the Manager and its affiliates, including an analysis of the cost of providing services, (v) whether economies of scale are realized as the Fund grows and whether fee levels reflect these economies of scale for Fund investors and (vi) other benefits to the Manager from its relationship with the Fund. The Board was aware that there are alternatives to retaining the Manager.
Outlined below is a summary of the principal information considered by the Board as well as the Board’s conclusions.
Nature, Quality and Extent of Services. The Board considered information about the nature and extent of the services provided to the Fund and information regarding the Manager’s key personnel who provide such services. The Manager’s duties include providing the Fund with the services of the portfolio managers and the Manager’s investment team, who provide research, analysis and other advisory services in regard to the Fund’s investments; securities trading services; oversight of third party service providers; monitoring compliance with applicable Fund policies and procedures and adherence to the Fund’s investment restrictions. The Manager is responsible for providing certain administrative services to the Fund as well. Those services include providing and supervising all administrative and clerical personnel who are necessary in order to provide effective corporate administration for the Fund; compiling and maintaining records with respect to the Fund’s operations; preparing and filing reports required by the Securities and Exchange Commission; preparing periodic reports regarding the operations of the Fund for its shareholders; preparing proxy materials for shareholder meetings; and preparing the registration statements required by Federal and state securities laws for the sale of the Fund’s shares. The Manager also provides the Fund with office space, facilities and equipment.
28 | OPPENHEIMER NEW JERSEY MUNICIPAL FUND
The Board also considered the quality of the services provided and the quality of the Manager’s resources that are available to the Fund. The Board took account of the fact that the Manager has had over forty years of experience as an investment adviser and that its assets under management rank it among the top mutual fund managers in the United States. The Board evaluated the Manager’s advisory, administrative, accounting, legal and compliance services, and information the Board has received regarding the experience and professional qualifications of the Manager’s key personnel and the size and functions of its staff. In its evaluation of the quality of the portfolio management services provided, the Board considered the experience of Daniel Loughran, Scott Cottier, and Troy Willis, the portfolio managers for the Fund, and the Manager’s investment team and analysts. The Board members also considered the totality of their experiences with the Manager as directors or trustees of the Fund and other funds advised by the Manager. The Board considered information regarding the quality of services provided by affiliates of the Manager, which its members have become knowledgeable about in connection with the renewal of the Fund’s service agreements. The Board concluded, in light of the Manager’s experience, reputation, personnel, operations and resources that the Fund benefits from the services provided under the Agreement.
Investment Performance of the Manager and the Fund. Throughout the year, the Manager provided information on the investment performance of the Fund and the Manager, including comparative performance information. The Board also reviewed information, prepared by the Manager and by the independent consultant, comparing the Fund’s historical performance to relevant market indices and to the performance of other retail front-end load and no-load New Jersey municipal debt funds including funds advised by the Manager and funds advised by other investment advisers. The Board noted that the Fund’s one-year, three-year, five-year and ten-year performance was below its peer group median as of December 31, 2008. The Board also noted that the Fund’s recent performance has improved and its year-to date performance through June 5, 2009 (the most recent date available at the Board meeting at which the independent Trustees considered the matter) was in the top quintile of its peer group category.
Costs of Services by the Manager. The Board reviewed the fees paid to the Manager and the other expenses borne by the Fund. The Board also considered the comparability of the fees charged and the services provided to the Fund to the fees and services for other clients or accounts advised by the Manager. The independent consultant provided comparative data in regard to the fees and expenses of the Fund, other New Jersey municipal debt funds and other funds with comparable asset levels and distribution features. The Board noted that the Fund’s total expenses are lower than its peer group median although its contractual and actual management fees are higher than its peer group median.
29 | OPPENHEIMER NEW JERSEY MUNICIPAL FUND
BOARD APPROVAL OF THE FUND’S INVESTMENT ADVISORY AGREEMENT Unaudited / Continued
Economies of Scale and Profits Realized by the Manager. The Board considered information regarding the Manager’s costs in serving as the Fund’s investment adviser, including the costs associated with the personnel and systems necessary to manage the Fund, and information regarding the Manager’s profitability from its relationship with the Fund. The Board reviewed whether the Manager may realize economies of scale in managing and supporting the Fund. The Board noted that the Fund currently has management fee breakpoints, which are intended to share with Fund shareholders economies of scale that may exist as the Fund’s assets grow.
Other Benefits to the Manager. In addition to considering the profits realized by the Manager, the Board considered information that was provided regarding the direct and indirect benefits the Manager receives as a result of its relationship with the Fund, including compensation paid to the Manager’s affiliates. The Board also considered that the Manager must be able to pay and retain experienced professional personnel at competitive rates to provide quality services to the Fund.
Conclusions. These factors were also considered by the independent Trustees meeting separately from the full Board, assisted by experienced counsel to the Fund and to the independent Trustees. Fund counsel and the independent Trustees’ counsel are independent of the Manager within the meaning and intent of the Securities and Exchange Commission Rules.
Based on its review of the information it received and its evaluations described above, at meetings in June 2009, the Board, including a majority of the independent Trustees, decided to continue the Agreement for the period through November 30, 2009. In arriving at this decision, the Board did not single out any factor or factors as being more important than others, but considered all of the above information, and considered the terms and conditions of the Agreement, including the management fee, in light of all of the surrounding circumstances.
30 | OPPENHEIMER NEW JERSEY MUNICIPAL FUND
PORTFOLIO PROXY VOTING POLICIES AND PROCEDURES; UPDATES TO STATEMENTS OF INVESTMENTS Unaudited
The Fund has adopted Portfolio Proxy Voting Policies and Procedures under which the Fund votes proxies relating to securities (“portfolio proxies”) held by the Fund. A description of the Fund’s Portfolio Proxy Voting Policies and Procedures is available (i) without charge, upon request, by calling the Fund toll-free at 1.800.525.7048, (ii) on the Fund’s website at www.oppenheimerfunds.com, and (iii) on the SEC’s website at www.sec.gov. In addition, the Fund is required to file Form N-PX, with its complete proxy voting record for the 12 months ended June 30th, no later than August 31st of each year. The Fund’s voting record is available (i) without charge, upon request, by calling the Fund toll-free at 1.800.525.7048, and (ii) in the Form N-PX filing on the SEC’s website at www.sec.gov.
The Fund files its complete schedule of portfolio holdings with the SEC for the first quarter and the third quarter of each fiscal year on Form N-Q. The Fund’s Form N-Q filings are available on the SEC’s website at http://www.sec.gov. Those forms may be reviewed and copied at the SEC’s Public Reference Room in Washington, D.C. Information on the operation of the Public Reference Room may be obtained by calling 1-800-SEC-0330.
Householding—Delivery of Shareholder Documents
This is to inform you about OppenheimerFunds’ “householding” policy. If more than one member of your household maintains an account in a particular fund, OppenheimerFunds will mail only one copy of the fund’s prospectus, annual and semiannual report and privacy policy. The consolidation of these mailings, called householding, benefits your fund through reduced mailing expense, and benefits you by reducing the volume of mail you receive from OppenheimerFunds. Householding does not affect the delivery of your account statements.
Please note that we will continue to household these mailings for as long as you remain an OppenheimerFunds shareholder, unless you request otherwise. If you prefer to receive multiple copies of these materials, please call us at 1.800.CALL-OPP (225-5677). You may also notify us in writing or via email. We will begin sending you individual copies of the prospectus, reports and privacy policy within 30 days of receiving your request to stop householding.
31 | OPPENHEIMER NEW JERSEY MUNICIPAL FUND
TRUSTEES AND OFFICERS Unaudited
| | | |
| Name, Position(s) Held with the | | Principal Occupation(s) During the Past 5 Years; Other Trusteeships/Directorships |
| Fund, Length of Service, Age | | Held; Number of Portfolios in the Fund Complex Currently Overseen |
INDEPENDENT
TRUSTEES | | The address of each Trustee in the chart below is 6803 S. Tucson Way, Centennial, Colorado 80112-3924. Each Trustee serves for an indefinite term, or until his or her resignation, retirement, death or removal. |
| | | |
Brian F. Wruble,
Chairman of the Board of Trustees (since 2007), Trustee
(since 2005)
Age: 66 | | Chairman (since August 2007) and Trustee (since August 1991) of the Board of Trustees of The Jackson Laboratory (non-profit); Director of Special Value Opportunities Fund, LLC (registered investment company) (affiliate of the Manager’s parent company) (since September 2004); Member of Zurich Financial Investment Management Advisory Council (insurance) (since 2004); Treasurer and Trustee of the Institute for Advanced Study (non-profit educational institute) (since May 1992); General Partner of Odyssey Partners, L.P. (hedge fund) (September 1995-December 2007); Special Limited Partner of Odyssey Investment Partners, LLC (private equity investment) (January 1999-September 2004). Oversees 60 portfolios in the OppenheimerFunds complex. |
| | | |
David K. Downes,
Trustee (since 2007)
Age: 69 | | Independent Chairman GSK Employee Benefit Trust (since April 2006); Director of Correctnet (January 2006-2007); Trustee of Employee Trusts (since January 2006); Chief Executive Officer and Board Member of Community Capital Management (investment management company) (since January 2004); Director of Internet Capital Group (information technology company) (since October 2003); Independent Chairman of the Board of Trustees of Quaker Investment Trust (registered investment company) (2004-2007); President of The Community Reinvestment Act Qualified Investment Fund (investment management company) (since 2004); Chief Operating Officer and Chief Financial Officer of Lincoln National Investment Companies, Inc. (subsidiary of Lincoln National Corporation, a publicly traded company) and Delaware Investments U.S., Inc. (investment management subsidiary of Lincoln National Corporation) (1993-2003); President, Chief Executive Officer and Trustee of Delaware Investment Family of Funds (1993-2003); President and Board Member of Lincoln National Convertible Securities Funds, Inc. and the Lincoln National Income Funds, TDC (1993-2003); Chairman and Chief Executive Officer of Retirement Financial Services, Inc. (registered transfer agent and investment adviser and subsidiary of Delaware Investments U.S., Inc.) (1993- 2003); President and Chief Executive Officer of Delaware Service Company, Inc. (1995-2003); Chief Administrative Officer, Chief Financial Officer, Vice Chairman and Director of Equitable Capital Management Corporation (investment subsidiary of Equitable Life Assurance Society) (1985-1992); Corporate Controller of Merrill Lynch & Company (financial services holding company) (1977-1985); held the following positions at the Colonial Penn Group, Inc. (insurance company): Corporate Budget Director (1974-1977), Assistant Treasurer (1972-1974) and Director of Corporate Taxes (1969-1972); held the following positions at Price Waterhouse & Company (financial services firm): Tax Manager (1967-1969), Tax Senior (1965-1967) and Staff Accountant (1963-1965); United States Marine Corps (1957-1959). Oversees 60 portfolios in the OppenheimerFunds complex. |
| | | |
Matthew P. Fink,
Trustee (since 2005)
Age: 68 | | Trustee of the Committee for Economic Development (policy research founda- tion) (since 2005); Director of ICI Education Foundation (education foundation) (October 1991-August 2006); President of the Investment Company Institute (trade association) (October 1991-June 2004); Director of ICI Mutual Insurance Company (insurance company) (October 1991-June 2004). Oversees 60 portfolios in the OppenheimerFunds complex. |
32 | OPPENHEIMER NEW JERSEY MUNICIPAL FUND
| | | |
| Name, Position(s) Held with the | | Principal Occupation(s) During the Past 5 Years; Other Trusteeships/Directorships |
| Fund, Length of Service, Age | | Held; Number of Portfolios in the Fund Complex Currently Overseen |
Phillip A. Griffiths,
Trustee (since 1999)
Age: 70 | | Fellow of the Carnegie Corporation (since 2007); Distinguished Presidential Fellow for International Affairs (since 2002) and Member (since 1979) of the National Academy of Sciences; Council on Foreign Relations (since 2002); Director of GSI Lumonics Inc. (precision technology products company) (since 2001); Senior Advisor of The Andrew W. Mellon Foundation (since 2001); Chair of Science Initiative Group (since 1999); Member of the American Philosophical Society (since 1996); Trustee of Woodward Academy (since 1983); Foreign Associate of Third World Academy of Sciences; Director of the Institute for Advanced Study (1991-2004); Director of Bankers Trust New York Corporation (1994-1999); Provost at Duke University (1983- 1991). Oversees 60 portfolios in the OppenheimerFunds complex. |
| | | |
Mary F. Miller,
Trustee (since 2004)
Age: 66 | | Trustee of International House (not-for-profit) (since June 2007); Trustee of the American Symphony Orchestra (not-for-profit) (since October 1998); and Senior Vice President and General Auditor of American Express Company (financial services company) (July 1998-February 2003). Oversees 60 portfolios in the OppenheimerFunds complex. |
| | | |
Joel W. Motley,
Trustee (since 2002)
Age: 57 | | Managing Director of Public Capital Advisors, LLC (privately held financial advisor) (since January 2006); Managing Director of Carmona Motley, Inc. (privately-held financial advisor) (since January 2002); Director of Columbia Equity Financial Corp. (privately-held financial advisor) (2002-2007); Managing Director of Carmona Motley Hoffman Inc. (privately-held financial advisor) (January 1998-December 2001); Member of the Finance and Budget Committee of the Council on Foreign Relations, Member of the Investment Committee of the Episcopal Church of America, Member of the Investment Committee and Board of Human Rights Watch and Member of the Investment Committee of Historic Hudson Valley. Oversees 60 portfolios in the OppenheimerFunds complex. |
| | | |
Mary Ann Tynan,
Trustee (since 2008)
Age: 63 | | Vice Chair of Board of Trustees of Brigham and Women’s/Faulkner Hospital (non- profit hospital) (since 2000); Chair of Board of Directors of Faulkner Hospital (non- profit hospital) (since 1990); Member of Audit and Compliance Committee of Partners Health Care System (non-profit) (since 2004); Board of Trustees of Middlesex School (educational institution) (since 1994); Board of Directors of Idealswork, Inc. (financial services provider) (since 2003); Partner, Senior Vice President and Director of Regulatory Affairs of Wellington Management Company, LLP (global investment manager) (1976-2002); Vice President and Corporate Secretary, John Hancock Advisers, Inc. (mutual fund investment adviser) (1970- 1976). Oversees 60 portfolios in the OppenheimerFunds complex. |
| | | |
Joseph M. Wikler,
Trustee (since 2005)
Age: 68 | | Director of C-TASC (bio-statistics services (since 2007); Director of the following medical device companies: Medintec (since 1992) and Cathco (since 1996); Member of the Investment Committee of the Associated Jewish Charities of Baltimore (since 1994); Director of Lakes Environmental Association (environmental protection organization) (1996-2008); Director of Fortis/Hartford mutual funds (1994-December 2001). Oversees 60 portfolios in the OppenheimerFunds complex. |
| | | |
Peter I. Wold,
Trustee (since 2005)
Age: 61 | | Director and Chairman of Wyoming Enhanced Oil Recovery Institute Commission (enhanced oil recovery study) (since 2004); President of Wold Oil Properties, Inc. (oil and gas exploration and production company) (since 1994); Vice President of American Talc Company, Inc. (talc mining and milling) (since 1999); Managing Member of Hole-in-the-Wall Ranch (cattle ranching) (since 1979); Director and Chairman of the Denver Branch of the Federal Reserve Bank of Kansas City (1993- 1999); and Director of PacifiCorp. (electric utility) (1995-1999). Oversees 60 portfo- lios in the OppenheimerFunds complex. |
33 | OPPENHEIMER NEW JERSEY MUNICIPAL FUND
TRUSTEES AND OFFICERS Unaudited / Continued
| | | |
| Name, Position(s) Held with the | | Principal Occupation(s) During the Past 5 Years; Other Trusteeships/Directorships |
| Fund, Length of Service, Age | | Held; Number of Portfolios in the Fund Complex Currently Overseen |
INTERESTED TRUSTEE | | The address of Mr. Reynolds is 6803 S. Tucson Way, Centennial, Colorado 80112-3924. Mr. Reynolds serves for an indefinite term, or until his resignation, retirement, death or removal. Mr. Reynolds is an “Interested Trustee” because of a potential consulting rela- tionship between RSR Partners, which Mr. Reynolds may be deemed to control, and the Manager. |
| | | |
Russell S. Reynolds, Jr.,
Trustee (since 1989)
Age: 77 | | Chairman of RSR Partners (formerly “The Directorship Search Group, Inc.”) (corpo- rate governance consulting and executive recruiting) (since 1993); Retired CEO of Russell Reynolds Associates (executive recruiting) (October 1969-March 1993); Life Trustee of International House (non-profit educational organization); Former Trustee of The Historical Society of the Town of Greenwich; Former Director of Greenwich Hospital Association. Oversees 60 portfolios in the OppenheimerFunds complex. |
| | | |
INTERESTED TRUSTEE AND OFFICER | | The address of Mr. Murphy is Two World Financial Center, 225 Liberty Street, 11th Floor, New York, New York 10281-1008. Mr. Murphy serves as a Trustee for an indefinite term, or until his resignation, retirement, death or removal and as an Officer for an indefinite term, or until his resignation, retirement, death or removal. Mr. Murphy is an interested Trustee due to his positions with OppenheimerFunds, Inc. and its affiliates. |
| | | |
John V. Murphy,
Trustee, President and Principal Executive Officer
(since 2001)
Age: 60 | | Chairman and Director of the Manager (since June 2001); Chief Executive Officer of the Manager (June 2001-December 2008); President of the Manager (September 2000-February 2007); President and director or trustee of other Oppenheimer funds; President and Director of Oppenheimer Acquisition Corp. (“OAC”) (the Manager’s parent holding company) and of Oppenheimer Partnership Holdings, Inc. (holding company subsidiary of the Manager) (since July 2001); Director of OppenheimerFunds Distributor, Inc. (subsidiary of the Manager) (November 2001-December 2006); Chairman and Director of Shareholder Services, Inc. and of Shareholder Financial Services, Inc. (transfer agent subsidiaries of the Manager) (since July 2001); President and Director of OppenheimerFunds Legacy Program (charitable trust program established by the Manager) (since July 2001); Director of the following investment advisory subsidiaries of the Manager: OFI Institutional Asset Management, Inc., Centennial Asset Management Corporation and Trinity Investment Management Corporation (since November 2001), HarbourView Asset Management Corporation and OFI Private Investments, Inc. (since July 2001); President (since November 2001) and Director (since July 2001) of Oppenheimer Real Asset Management, Inc.; Executive Vice President of Massachusetts Mutual Life Insurance Company (OAC’s parent company) (since February 1997); Director of DLB Acquisition Corporation (holding company parent of Babson Capital Management LLC) (since June 1995); Chairman (since October 2007) and Member of the Investment Company Institute’s Board of Governors (since October 2003). Oversees 98 portfolios in the OppenheimerFunds complex. |
| | | |
OTHER OFFICERS OF THE FUND | | The addresses of the Officers in the chart below are as follows: for Mr. Zack, Two World Financial Center, 225 Liberty Street, New York, New York 10281-1008, for Messrs. Vandehey and Wixted, 6803 S. Tucson Way, Centennial, Colorado 80112-3924, for Messrs. Loughran, Cottier, Willis, DeMitry, Camarella and Stein, 350 Linden Oaks, Rochester, New York 14625. Each Officer serves for an indefinite term or until his or her resignation, retirement, death or removal. |
| | | |
Daniel G. Loughran,
Vice President and Senior Portfolio Manager
(since 2005)
Age: 45 | | Senior Vice President of the Manager (since August 2007); Vice President of the Manager (April 2001-July 2007) and a Portfolio Manager with the Manager (1999-2005). Team leader, a Senior Portfolio Manager, an officer and a trader for the Fund and other Oppenheimer funds. |
34 | OPPENHEIMER NEW JERSEY MUNICIPAL FUND
| | | |
| Name, Position(s) Held with the | | Principal Occupation(s) During the Past 5 Years; Other Trusteeships/Directorships |
| Fund, Length of Service, Age | | Held; Number of Portfolios in the Fund Complex Currently Overseen |
Scott S. Cottier,
Vice President (since 2005) and Senior Portfolio Manager
(since 2002)
Age: 37 | | Vice President of the Manager (since September 2002). Portfolio Manager and trader at Victory Capital Management (1999-2002). Senior Portfolio Manager, an officer and a trader for the Fund and other Oppenheimer funds. |
| | | |
Troy E. Willis,
Vice President (since 2005) and Senior Portfolio Manager
(since 2006)
Age: 36 | | Vice President of the Manager (since July 2009); Assistant Vice President of the Manager (July 2005-July 2009). Portfolio Manager of the Manager (2002- 2005). Corporate Attorney for Southern Resource Group (1999-2003). Senior Portfolio Manager, an officer and a trader for the Fund and other Oppenheimer funds. |
| | | |
Mark R. DeMitry,
Vice President and Senior Portfolio Manager
(since 2009)
Age: 33 | | Vice President of the Manager (since July 2009); Associate Portfolio Manager of the Fund (2006-2009). Research analyst of the Manager (June 2003-September 2006) and a credit analyst of the Manager (July 2001-May 2003). Senior Portfolio Manager, an officer and a trader for the Fund and other Oppenheimer funds. |
| | | |
Michael L. Camarella,
Vice President (since 2009) and Associate Portfolio
Manager (since 2008)
Age: 33 | | Assistant Vice President of the Manager (since July 2009). Research analyst of the Manager (February 2006-April 2008) and a credit analyst of the Manager (June 2003-January 2006). Associate Portfolio Manager, an officer and a trader for the Fund and other Oppenheimer funds. |
| | | |
Richard Stein,
Vice President (since 2007)
Age: 51 | | Director (since 2003) and head of the Rochester Credit Analysis team (since 1993). Vice President of the Manager (since 1997). An officer of the Fund and other Oppenheimer Funds. |
| | | |
Mark S. Vandehey,
Vice President and Chief Compliance Officer
(since 2004)
Age: 58 | | Senior Vice President and Chief Compliance Officer of the Manager (since March 2004); Chief Compliance Officer of OppenheimerFunds Distributor, Inc., Centennial Asset Management and Shareholder Services, Inc. (since March 2004); Vice President of OppenheimerFunds Distributor, Inc., Centennial Asset Management Corporation and Shareholder Services, Inc. (since June 1983); Former Vice President and Director of Internal Audit of the Manager (1997-February 2004). An officer of 98 portfolios in the OppenheimerFunds complex. |
| | | |
Brian W. Wixted,
Treasurer and Principal Financial & Accounting
Officer (since 1999)
Age: 49 | | Senior Vice President of the Manager (since March 1999); Treasurer of the Manager and the following: HarbourView Asset Management Corporation, Shareholder Financial Services, Inc., Shareholder Services, Inc., Oppenheimer Real Asset Management, Inc. and Oppenheimer Partnership Holdings, Inc. (March 1999-June 2008), OFI Private Investments, Inc. (March 2000-June 2008), OppenheimerFunds International Ltd. and OppenheimerFunds plc (since May 2000), OFI Institutional Asset Management, Inc. (since November 2000), and OppenheimerFunds Legacy Program (charitable trust program established by the Manager) (since June 2003); Treasurer and Chief Financial Officer of OFI Trust Company (trust company subsidiary of the Manager) (since May 2000); Assistant Treasurer of the following: OAC (March 1999-June 2008), Centennial Asset Management Corporation (March 1999-October 2003) and OppenheimerFunds Legacy Program (April 2000-June 2003). An officer of 98 portfolios in the OppenheimerFunds complex. |
35 | OPPENHEIMER NEW JERSEY MUNICIPAL FUND
TRUSTEES AND OFFICERS Unaudited / Continued
| | | |
| Name, Position(s) Held with the | | Principal Occupation(s) During the Past 5 Years; Other Trusteeships/Directorships |
| Fund, Length of Service, Age | | Held; Number of Portfolios in the Fund Complex Currently Overseen |
Robert G. Zack,
Secretary (since 2001)
Age: 60 | | Executive Vice President (since January 2004) and General Counsel (since March 2002) of the Manager; General Counsel and Director of the Distributor (since December 2001); General Counsel of Centennial Asset Management Corporation (since December 2001); Senior Vice President and General Counsel of HarbourView Asset Management Corporation (since December 2001); Secretary and General Counsel of OAC (since November 2001); Assistant Secretary (since September 1997) and Director (since November 2001) of OppenheimerFunds International Ltd. and OppenheimerFunds plc; Vice President and Director of Oppenheimer Partnership Holdings, Inc. (since December 2002); Director of Oppenheimer Real Asset Management, Inc. (since November 2001); Senior Vice President, General Counsel and Director of Shareholder Financial Services, Inc. and Shareholder Services, Inc. (since December 2001); Senior Vice President, General Counsel and Director of OFI Private Investments, Inc. and OFI Trust Company (since November 2001); Vice President of OppenheimerFunds Legacy Program (since June 2003); Senior Vice President and General Counsel of OFI Institutional Asset Management, Inc. (since November 2001); Director of OppenheimerFunds International Distributor Limited (since December 2003); Senior Vice President (May 1985- December 2003). An officer of 98 portfolios in the OppenheimerFunds complex. |
The Fund’s Statement of Additional Information contains additional information about the Fund’s Trustees and Officers and is available without charge upon request, by calling 1.800.525.7048.
36 | OPPENHEIMER NEW JERSEY MUNICIPAL FUND
TOP HOLDINGS AND ALLOCATIONS
| | | | | |
| Top Ten Categories | | | | |
| |
| Hospital/Health Care | | | 16.9 | % |
| Tobacco—Master Settlement Agreement | | | 16.5 | |
| Higher Education | | | 8.4 | |
| Single-Family Housing | | | 7.7 | |
| Adult Living Facilities | | | 4.8 | |
| Building Products | | | 4.5 | |
| Energy Equipment & Services | | | 3.1 | |
| Marine/Aviation Facilities | | | 3.1 | |
| General Obligation | | | 3.0 | |
| Electric Utilities | | | 2.9 | |
Portfolio holdings are subject to change. Percentages are as of July 31, 2009, and are based on total assets.
| | | | | |
| Credit Allocation | | | | |
| |
| AAA | | | 7.7 | % |
| AA | | | 27.5 | |
| A | | | 10.4 | |
| BBB | | | 34.8 | |
| BB or lower | | | 19.6 | |
Allocations are subject to change. Percentages are as of July 31, 2009, and are dollar-weighted based on the total market value of investments. Market value, the total value of the Fund’s securities, does not include cash. Securities rated by any rating organization are included in the equivalent Standard & Poor’s rating category in the allocation above. The allocation above also includes unrated securities whose ratings have been assigned by the Manager; these unrated securities, currently 15.68% of the Fund’s market value, are deemed comparable in the Manager’s judgment to the rated securities in each category. Credit ratings of AAA, AA, A and BBB and their equivalents denote investment-grade securities.
14 | OPPENHEIMER PENNSYLVANIA MUNICIPAL FUND
FUND PERFORMANCE DISCUSSION
How has the Fund performed? Below is a discussion by OppenheimerFunds, Inc., of the Fund’s performance during its fiscal year ended July 31, 2009, followed by a graphical comparison of the Fund’s performance to appropriate broad-based market indices.
Management’s Discussion of Fund Performance. The 12-month period ended July 31, 2009, will long be remembered for the credit market’s volatility and illiquidity in its early months and for the recovery in municipal bond prices that began in the waning weeks of 2008. Despite the mid-period turnaround, the net asset value (NAV) of Oppenheimer Pennsylvania Municipal Fund’s Class A shares declined between July 31, 2008, and July 31, 2009, causing the Fund to produce negative total returns. The 1-year total return for Class A shares was -10.41% at NAV and -14.66% at the maximum offering price (or with sales charge). As of July 31, 2009, the Fund’s Class A shares nonetheless provided the highest level of tax-free income among its peer funds, according to Lipper Inc., and more income on a tax-equivalent basis than many corporate fixed-income alternatives. As of July 31, 2009, the distribution yield for the Fund’s Class A shares was 6.90% at NAV.1
In all, the Fund distributed 62.9 cents per Class A share this reporting period, including a small amount of taxable income. The monthly dividend rate for Class A shares rose to 5.3 cents with the March 2009 payout, from 5.2 cents. We believe the Fund’s distributions this reporting period demonstrate the benefits of our yield-driven approach to municipal investing.
At the end of this reporting period, the Fund had nearly 425 holdings and an average credit quality of A-minus. Despite the broad turmoil in the municipal market, the default rate for bonds in the portfolio remained within expectations throughout this reporting period.
As the charts on pages 20 to 22 show, the Fund’s total returns were negative this reporting period, which was characterized at times by sharp declines in equity and credit markets, heightened investor concern about risk, and widening credit spreads. Credit spread widening is typically more detrimental to the sectors and types of securities this Fund favors than to the Fund’s benchmark. Because our approach to fund management involves creating broad portfolios with holdings from across the full credit spectrum, this Fund’s performance can be undercut by prolonged cycles of credit spread widening. Widening spreads typically have the greatest negative effect on BBB-rated, lower-rated and unrated securities. The reverse is also true: as spreads tighten, BBB-rated, lower-rated and unrated securities typically outperform other securities. While we believe that this latest cycle of spread widening has run its course, this Fund continues
| | |
| 1. | | Falling share prices artificially increase yields. |
15 | OPPENHEIMER PENNSYLVANIA MUNICIPAL FUND
FUND PERFORMANCE DISCUSSION
to feel its impact. We still believe that our Fund’s investments offer structural advantages over the long term, and we encourage investors to remain focused on their long-term financial objectives for high levels of tax-free income.
Securities issued in the Commonwealth of Puerto Rico represented 27.6% of the Fund’s net assets on July 31, 2009. Most of the Fund’s investments involve “creatures of the state”—that is, securities that are supported by taxes and designed to help finance electric utilities, highways and education. Facing a $3.2 billion budget deficit, Gov. Luis Fortuño signed legislation early this reporting period allowing the Commonwealth to subsidize its operating expenses with money borrowed from its financing arm, the Government Development Bank for Puerto Rico (the GDB). The deficit grew to an estimated $3.4 billion by March 2009 and, one month later, the GDB said that it would offer as much as $4 billion of the proposed new sales-tax bonds. This increase, by the way, represented a clear signal as to the renewed strength of the credit markets, which were deemed to have the capacity for this larger new issuance.
The credit rating agencies continued to view the Commonwealth favorably. When the Puerto Rico Sales Tax Financing Corporation came to market with $3.5 billion in new debt in late June, it was rated A-plus by Standard & Poor’s, A2 by Moody’s Investors Service and A by Fitch Ratings. Existing sales-tax debt had received an upgrade earlier in the period. Additionally, the Commonwealth, its agencies and the GDB retained their investment-grade ratings from S&P and Moody’s this reporting period (Fitch does not directly rate Puerto Rico’s general obligation debt.)
We remain confident in the Commonwealth’s ability to collect taxes and make its bond payments and believe that Gov. Fortuño, a fiscal conservative, is correctly focused on reducing government spending, eliminating the deficit by fiscal 2013 and growing the island’s economy. At $7.7 billion, the proposed budget for fiscal year 2010 is $1.8 billion smaller than the current budget, a sign that the governor is willing to take harsh steps in the name of fiscal responsibility.
As of July 31, 2009, the Fund was invested in the hospital/health care sector and in the electric utilities sector, representing 16.9% and 2.9% of the Fund’s total assets, respectively. Our holdings in these sectors consist of securities in the mid-range of the credit spectrum as well as some insured bonds. The overall fundamentals in these sectors remained stable this reporting period, but widening credit spreads during the first half of the reporting period were detrimental to 12-month performance. Since the beginning of calendar year 2009, these sectors have posted positive results.
16 | OPPENHEIMER PENNSYLVANIA MUNICIPAL FUND
In the oil, gas & consumable fuels sector, which represented 2.3% of the Fund’s total assets as of July 31, 2009, the Fund’s investments include bonds that finance pollution control facilities for one of the world’s largest refineries of heavy crude. The Hovensa facility—strategically located in the Virgin Islands, where it is among the largest private employers—is a joint venture between a Petroleos de Venezuela subsidiary and the Hess Corporation, which also manages it. With a processing capacity of nearly 500,000 barrels a day, the refinery produces gas and heating oil for the Gulf Coast and Eastern Seaboard alike. The bonds this Fund owns are secured by the first mortgage on the facility and offer attractive coupons of 5.875% and 6.125%. Additionally, income from this “territory” bond is exempt from federal, state and, where applicable, local taxes. Despite difficult economic conditions for refineries, shifting demand for fuel and an increasingly harsh regulatory environment—all of which wreaked havoc on equity positions in this sector this reporting period—the price of the bonds held by this Fund only declined modestly and the interest payments were made on schedule and in full.
The Fund’s underperformance can be attributed, in part, to its holdings in bonds backed by proceeds from the tobacco Master Settlement Agreement (the MSA), the national litigation settlement with U.S. tobacco manufacturers. At the end of this reporting period, MSA-backed tobacco bonds accounted for 16.5% of the Fund’s total assets and comprised the Fund’s second largest sector.2
The sector typically offers high-yielding securities, many of which are prone to price volatility. Widening credit spreads and other market factors (like supply and demand) typically contribute to this volatility. S&P and Fitch each revised their assessments of this sector during this reporting period, but we do not believe that the prices of “tobacco bonds” were affected consequentially.
In the latter half of this reporting period, media reports focused on two tobacco-related developments: the April 1 increase in cigarette taxes and the President’s signature on the Family Smoking Prevention and Tobacco Control Act, which put the Food and Drug Administration in charge of regulating the making and marketing of cigarettes and other tobacco products.
| | |
| 2. | | Investments in “tobacco bonds,” which are backed by the proceeds a state or territory receives from the 1998 national litigation settlement with tobacco manufacturers, may be vulnerable to economic and/or legislative events that affect issuers in a particular municipal market sector. Annual payments by MSA-participating manufacturers, for example, hinge on many factors, including annual domestic cigarette shipments, inflation and the relative market share of non-participating manufacturers. While consumption has largely been in line with the assumptions used to structure MSA-backed bonds, future MSA payments could be reduced if consumption were to fall more rapidly than originally forecast. |
17 | OPPENHEIMER PENNSYLVANIA MUNICIPAL FUND
FUND PERFORMANCE DISCUSSION
We do not agree with the analysts who opined that these developments represent new threats to the MSA or the bonds backed by MSA payments. Nor are we concerned about the long-term viability of the MSA. Here’s why: First, consumption trends over the years have largely tracked the forecasts that were built into MSA-backed bonds, and this has been true even as the cost of a pack of cigarettes has steadily risen. There is little reason to believe that the new tax will significantly alter consumers’ smoking habits. Second, putting the FDA in charge of tobacco regulation was strongly advocated by Philip Morris, the country’s leading cigarette manufacturer. We think it unlikely that the company would have backed a plan that it thought would hurt its industry. Further, the company is not alone in believing that smaller companies will have a harder time complying with new regulations and will thus cede share to the market’s leading players. This, in turn, should improve MSA revenues and encourage early redemptions of existing bonds.
We continue to believe that the carefully researched tobacco bonds this Fund owns remain fundamentally sound. As they always have, the tobacco bonds this Fund held during this reporting period made all scheduled interest payments in a timely manner. Thus, these bonds helped the Fund provide significant yield advantages to shareholders.
The Fund continues to favor the higher education sector, which constituted 8.4% of total assets as of July 31, 2009. The investment-grade bonds we hold in this sector have regularly provided high levels of tax-free income with what we believe to be far less credit risk than their external ratings would suggest. In addition, all of the higher education bonds owned by this Fund are current in their scheduled interest payments.
The national housing market remained challenging this reporting period and, as a result, the single-family and multifamily housing sectors continued to be volatile. Higher-grade housing bonds were generally better investments than lower-grade ones, but neither contributed positively to the Fund’s total return this reporting period. The securities held by this Fund continued to provide high levels of tax-free income and, we believe, long-term investors should ultimately benefit from this Fund’s carefully selected holdings in these housing sectors. As of July 31, 2009, bonds in the single-family and multifamily housing sectors represented 7.7% and 1.3% of the Fund’s total assets, respectively.
During this reporting period, the Fund remained invested in municipal inverse-floating-rate securities, which are tax-exempt securities with interest payments that move inversely to changes in short-term interest rates. These “inverse floaters” generally offer higher tax-free yields than fixed-rate bonds of comparable maturity and credit quality, but they often face greater price volatility, too. When the short-term market faced unprecedented turmoil in
18 | OPPENHEIMER PENNSYLVANIA MUNICIPAL FUND
the first half of this reporting period, the income that muni funds across the industry earned from this type of security was diminished. We continue to believe that “inverse floaters” belong in our fund portfolios because they produce attractive yields under most market conditions.
Other floating-rate bonds performed poorly this reporting period as short-term variable rates declined.
Additionally, the Fund’s line of credit increased partway through this reporting period. The Fund used its line of credit at times to avoid having to sell tax-free assets at lower-than-acceptable prices. The Fund also used it opportunistically to buy yield-enhancing securities.
Our approach to municipal bond investing is flexible and responsive to market conditions. Shareholders should note that market conditions during this reporting period did not affect the Fund’s overall investment strategies or cause it to pay any capital gain distributions. In closing, we believe that the Fund’s structure and composition as well as our time-tested strategies will continue to benefit long-term investors through interest rate and economic cycles.
Comparing the Fund’s Performance to the Market. The graphs that follow show the performance of a hypothetical $10,000 investment in each class of shares of the Fund held until July 31, 2009. In the case of Class A, Class B and Class C shares, performance is measured over a ten-year period. The Fund’s performance reflects the deduction of the maximum initial sales charge on Class A shares, the applicable contingent deferred sales charge on Class B and Class C shares, and reinvestments of all dividends and capital gains distributions. Past performance cannot guarantee future results.
The Fund’s performance is compared to the performance of the Barclays Capital Municipal Bond Index, an unmanaged index of a broad range of investment grade municipal bonds that is widely regarded as a measure of the performance of the general municipal bond market. Index performance reflects the reinvestment of income but does not consider the effect of transaction costs, and none of the data in the graphs shows the effect of taxes. The Fund’s performance is also compared to the Consumer Price Index, a non-securities index that measures changes in the inflation rate. The Fund’s performance reflects the effects of the Fund’s business and operating expenses. While index comparisons may be useful to provide a benchmark for the Fund’s performance, it must be noted that the Fund’s investments are not limited to the investments in the index.
19 | OPPENHEIMER PENNSYLVANIA MUNICIPAL FUND
FUND PERFORMANCE DISCUSSION
Class A Shares
Comparison of Change in Value of $10,000 Hypothetical Investments in:
20 | OPPENHEIMER PENNSYLVANIA MUNICIPAL FUND
Class B Shares
Comparison of Change in Value of $10,000 Hypothetical Investments in:
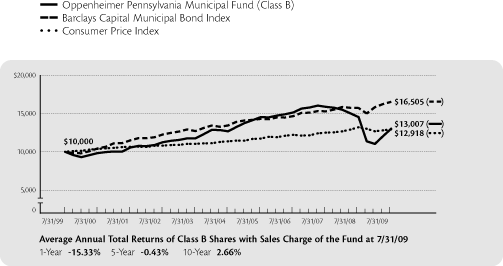
The performance data quoted represents past performance, which does not guarantee future results. The investment return and principal value of an investment in the Fund will fluctuate so that an investor’s shares, when redeemed, may be worth more or less than their original cost. Current performance may be lower or higher than the performance quoted. For performance data current to the most recent month end, visit us at www.oppenheimerfunds.com, or call us at 1.800.525.7048. Fund returns include changes in share price, reinvested distributions, and the applicable sales charge for Class A shares, the current maximum initial sales charge of 4.75%; for Class B shares, the contingent deferred sales charge of 5% (1-year) and 2% (5-year); and for Class C shares, the 1% contingent deferred sales charge for the 1-year period. Because Class B shares convert to Class A shares 72 months after purchase, the 10-year return for Class B uses Class A performance for the period after conversion. See page 23 for further information.
21 | OPPENHEIMER PENNSYLVANIA MUNICIPAL FUND
FUND PERFORMANCE DISCUSSION
Class C Shares
Comparison of Change in Value of $10,000 Hypothetical Investments in:
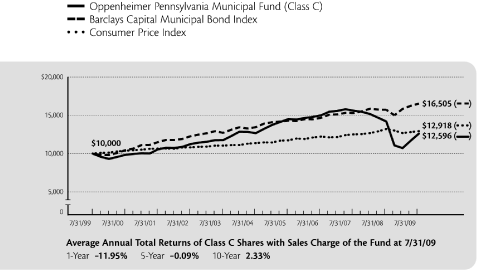
The performance data quoted represents past performance, which does not guarantee future results. The investment return and principal value of an investment in the Fund will fluctuate so that an investor’s shares, when redeemed, may be worth more or less than their original cost. Current performance may be lower or higher than the performance quoted. For performance data current to the most recent month end, visit us at www.oppenheimerfunds.com, or call us at 1.800.525.7048. Fund returns include changes in share price, reinvested distributions, and the applicable sales charge for Class A shares, the current maximum initial sales charge of 4.75%; for Class B shares, the contingent deferred sales charge of 5% (1-year) and 2% (5-year); and for Class C shares, the 1% contingent deferred sales charge for the 1-year period. Because Class B shares convert to Class A shares 72 months after purchase, the 10-year return for Class B uses Class A performance for the period after conversion. See page 23 for further information.
22 | OPPENHEIMER PENNSYLVANIA MUNICIPAL FUND
NOTES
Total returns and the ending account values in the graphs include changes in share price and reinvestment of dividends and capital gains distributions in a hypothetical investment for the periods shown. Cumulative total returns are not annualized. The Fund’s total returns shown do not reflect the deduction of income taxes on an individual’s investment. Taxes may reduce your actual investment returns on income or gains paid by the Fund or any gains you may realize if you sell your shares.
This annual report must be preceded or accompanied by the current prospectus of Oppenheimer Pennsylvania Municipal Fund. Before investing in any of the Oppenheimer funds, investors should carefully consider a fund’s investment objectives, risks, charges and expenses. Fund prospectuses contain this and other information about the funds. For more information, ask your financial advisor, call us at 1.800.525.7048, or visit our website at www.oppenheimerfunds.com. Read prospectuses carefully before investing.
The Fund’s investment strategy and focus can change over time. The mention of specific fund holdings does not constitute a recommendation by OppenheimerFunds, Inc.
Class A shares of the Fund were first publicly offered on 9/18/89. Unless otherwise noted, Class A returns include the current maximum initial sales charge of 4.75%
Class B shares of the Fund were first publicly offered on 5/3/93. Unless otherwise noted, Class B returns include the applicable contingent deferred sales charge of 5% (1-year) and 2% (5-year). Because Class B shares convert to Class A shares 72 months after purchase, the 10-year return for Class B uses Class A performance for the period after conversion. Class B shares are subject to an annual 0.75% asset-based sales charge.
Class C shares of the Fund were first publicly offered on 8/29/95. Unless otherwise noted, Class C returns include the applicable 1% contingent deferred sales charge for the 1-year period. Class C shares are subject to an annual 0.75% asset-based sales charge.
An explanation of the calculation of performance is in the Fund’s Statement of Additional Information.
23 | OPPENHEIMER PENNSYLVANIA MUNICIPAL FUND
FUND EXPENSES
Fund Expenses. As a shareholder of the Fund, you incur two types of costs: (1) transaction costs, which may include sales charges (loads) on purchase payments, contingent deferred sales charges on redemptions; and redemption fees (if applicable); and (2) ongoing costs, including management fees; distribution and service fees; and other Fund expenses. These examples are intended to help you understand your ongoing costs (in dollars) of investing in the Fund and to compare these costs with the ongoing costs of investing in other mutual funds.
The examples are based on an investment of $1,000.00 invested at the beginning of the period and held for the entire 6-month period ended July 31, 2009.
Actual Expenses. The first section of the table provides information about actual account values and actual expenses. You may use the information in this section for the class of shares you hold, together with the amount you invested, to estimate the expense that you paid over the period. Simply divide your account value by $1,000.00 (for example, an $8,600.00 account value divided by $1,000.00 = 8.60), then multiply the result by the number in the first section under the heading entitled “Expenses Paid During Period” to estimate the expenses you paid on your account during this period.
Hypothetical Example for Comparison Purposes. The second section of the table provides information about hypothetical account values and hypothetical expenses based on the Fund’s actual expense ratio for each class of shares, and an assumed rate of return of 5% per year for each class before expenses, which is not the actual return. The hypothetical account values and expenses may not be used to estimate the actual ending account balance or expenses you paid for the period. You may use this information to compare the ongoing costs of investing in the Fund and other funds. To do so, compare this 5% hypothetical example for the class of shares you hold with the 5% hypothetical examples that appear in the shareholder reports of the other funds.
Please note that the expenses shown in the table are meant to highlight your ongoing costs only and do not reflect any transactional costs, such as front-end or contingent deferred sales charges (loads), or a $12.00 fee imposed annually on accounts valued at less than $500.00 (subject to exceptions described in
24 | OPPENHEIMER PENNSYLVANIA MUNICIPAL FUND
the Statement of Additional Information). Therefore, the “hypothetical” section of the table is useful in comparing ongoing costs only, and will not help you determine the relative total costs of owning different funds. In addition, if these transactional costs were included, your costs would have been higher.
| | | | | | | | | | | | | |
| | | Beginning | | | Ending | | | Expenses | |
| | | Account | | | Account | | | Paid During | |
| | | Value | | | Value | | | 6 Months Ended | |
| | | February 1, 2009 | | | July 31, 2009 | | | July 31, 2009 | |
| |
| Actual |
| Class A | | $ | 1,000.00 | | | $ | 1,180.40 | | | $ | 12.23 | |
| Class B | | | 1,000.00 | | | | 1,175.50 | | | | 16.89 | |
| Class C | | | 1,000.00 | | | | 1,176.20 | | | | 16.46 | |
| | | | | | | | | | | | | |
Hypothetical
(5% return before expenses) | | | | | | | | | | | | |
| Class A | | | 1,000.00 | | | | 1,013.64 | | | | 11.30 | |
| Class B | | | 1,000.00 | | | | 1,009.37 | | | | 15.61 | |
| Class C | | | 1,000.00 | | | | 1,009.77 | | | | 15.21 | |
Expenses are equal to the Fund’s annualized expense ratio for that class, multiplied by the average account value over the period, multiplied by 181/365 (to reflect the one-half year period). Those annualized expense ratios based on the 6-month period ended July 31, 2009 are as follows:
| | | | | |
| Class | | Expense Ratios |
| |
| Class A | | | 2.25 | % |
| Class B | | | 3.11 | |
| Class C | | | 3.03 | |
The expense ratios reflect reduction to custodian expenses. The “Financial Highlights” tables in the Fund’s financial statements, included in this report, also show the gross expense ratios, without such waivers or reimbursements and reduction to custodian expenses, if applicable.
25 | OPPENHEIMER PENNSYLVANIA MUNICIPAL FUND
THIS PAGE INTENTIONALLY LEFT BLANK.
26 | OPPENHEIMER PENNSYLVANIA MUNICIPAL FUND
STATEMENT OF INVESTMENTS July 31, 2009
| | | | | | | | | | | | | | | | | |
| Principal | | | | | | | | | | | | |
| Amount | | | | | Coupon | | | Maturity | | | Value | |
| |
| Municipal Bonds and Notes—126.2% | | | | | | | | | | | | |
| Pennsylvania—94.4% | | | | | | | | | | | | |
| $ | 1,200,000 | | | Allegheny County, PA Airport Authority (Pittsburgh International Airport)1 | | | 6.000 | % | | | 01/01/2014 | | | $ | 1,218,984 | |
| | 10,000 | | | Allegheny County, PA COP1 | | | 5.000 | | | | 12/01/2028 | | | | 9,454 | |
| | 24,750,000 | | | Allegheny County, PA GO2 | | | 1.238 | 3 | | | 11/01/2026 | | | | 17,204,963 | |
| | 130,000 | | | Allegheny County, PA HDA (Catholic Health East)1 | | | 5.375 | | | | 11/15/2022 | | | | 130,785 | |
| | 75,000 | | | Allegheny County, PA HDA (Catholic Health East)1 | | | 5.500 | | | | 11/15/2032 | | | | 70,769 | |
| | 80,000 | | | Allegheny County, PA HDA (Jefferson Regional Medical Center)1 | | | 5.125 | | | | 05/01/2025 | | | | 68,753 | |
| | 25,000 | | | Allegheny County, PA HDA (Jefferson Regional Medical Center)1 | | | 5.125 | | | | 05/01/2029 | | | | 20,507 | |
| | 3,150,000 | | | Allegheny County, PA HDA (Ohio Valley General Hospital)1 | | | 5.125 | | | | 04/01/2035 | | | | 2,374,817 | |
| | 3,600,000 | | | Allegheny County, PA HDA (Ohio Valley General Hospital)1 | | | 5.450 | | | | 01/01/2028 | | | | 3,117,420 | |
| | 55,000 | | | Allegheny County, PA HDA (Pittsburgh Mercy Health System)1 | | | 5.625 | | | | 08/15/2026 | | | | 56,702 | |
| | 25,000 | | | Allegheny County, PA HDA (The Covenant at South Hills)4,5 | | | 7.700 | | | | 02/01/2009 | | | | 1,833 | |
| | 25,000 | | | Allegheny County, PA HDA (The Covenant at South Hills)4,5 | | | 7.800 | | | | 02/01/2009 | | | | 1,833 | |
| | 1,535,000 | | | Allegheny County, PA HDA (The Covenant at South Hills)4,5 | | | 8.625 | | | | 02/01/2021 | | | | 112,562 | |
| | 305,000 | | | Allegheny County, PA HDA (The Covenant at South Hills)4,5 | | | 8.750 | | | | 02/01/2031 | | | | 22,366 | |
| | 21,095,000 | | | Allegheny County, PA HDA (UPMC Health System)1 | | | 1.508 | 3 | | | 02/01/2037 | | | | 11,470,406 | |
| | 5,000 | | | Allegheny County, PA HDA (UPMC Health System)1 | | | 5.000 | | | | 11/01/2016 | | | | 5,053 | |
| | 10,000 | | | Allegheny County, PA HDA (UPMC Health System)1 | | | 5.000 | | | | 12/15/2018 | | | | 10,005 | |
| | 20,000 | | | Allegheny County, PA HDA (UPMC Health System)1 | | | 5.000 | | | | 11/01/2023 | | | | 20,034 | |
| | 5,000,000 | | | Allegheny County, PA HDA (UPMC Health System)1 | | | 5.375 | | | | 08/15/2029 | | | | 5,005,650 | |
| | 5,000,000 | | | Allegheny County, PA HDA (UPMC Health System)1 | | | 5.500 | | | | 08/15/2034 | | | | 4,913,150 | |
| | 10,000,000 | | | Allegheny County, PA HDA (UPMC Health System)1 | | | 5.625 | | | | 08/15/2039 | | | | 9,920,900 | |
| | 50,000 | | | Allegheny County, PA HEBA (Chatham College)1 | | | 5.250 | | | | 11/15/2019 | | | | 48,149 | |
| | 2,020,000 | | | Allegheny County, PA HEBA (Chatham College)1 | | | 5.750 | | | | 11/15/2028 | | | | 1,905,325 | |
| | 8,000,000 | | | Allegheny County, PA HEBA (Chatham College)1 | | | 5.750 | | | | 11/15/2035 | | | | 7,183,120 | |
| | 910,000 | | | Allegheny County, PA HEBA (Chatham College)1 | | | 5.850 | | | | 03/01/2022 | | | | 905,150 | |
| | 1,000,000 | | | Allegheny County, PA HEBA (Chatham College)1 | | | 5.950 | | | | 03/01/2032 | | | | 937,520 | |
| | 2,500,000 | | | Allegheny County, PA HEBA (Robert Morris University)1 | | | 5.900 | | | | 10/15/2028 | | | | 2,186,625 | |
| | 15,000 | | | Allegheny County, PA HEBA (Robert Morris University)1 | | | 6.000 | | | | 05/01/2028 | | | | 13,295 | |
| | 2,000,000 | | | Allegheny County, PA HEBA (Robert Morris University)1 | | | 6.000 | | | | 10/15/2038 | | | | 1,665,640 | |
| | 115,000 | | | Allegheny County, PA HEBA (Thiel College)1 | | | 5.375 | | | | 11/15/2019 | | | | 95,682 | |
F1 | OPPENHEIMER PENNSYLVANIA MUNICIPAL FUND
STATEMENT OF INVESTMENTS Continued
| | | | | | | | | | | | | | | | | |
| Principal | | | | | | | | | | | | |
| Amount | | | | | Coupon | | | Maturity | | | Value | |
| |
| Pennsylvania Continued | | | | | | | | | | | | |
| $ | 110,000 | | | Allegheny County, PA HEBA (Thiel College)1 | | | 5.375 | % | | | 11/15/2029 | | | $ | 78,624 | |
| | 3,245,000 | | | Allegheny County, PA HEBA (Waynesburg College)1 | | | 4.800 | | | | 05/01/2036 | | | | 2,545,897 | |
| | 10,000 | | | Allegheny County, PA IDA (ARC Allegheny Foundation)1 | | | 5.000 | | | | 12/01/2028 | | | | 8,648 | |
| | 1,000,000 | | | Allegheny County, PA IDA (RR/RRSW/RRDC Obligated Group)1 | | | 5.000 | | | | 09/01/2021 | | | | 891,120 | |
| | 1,250,000 | | | Allegheny County, PA IDA (RR/RRSW/RRDC Obligated Group)1 | | | 5.100 | | | | 09/01/2026 | | | | 1,060,663 | |
| | 1,360,000 | | | Allegheny County, PA IDA (RR/RRSW/RRDC Obligated Group)1 | | | 5.125 | | | | 09/01/2031 | | | | 1,093,508 | |
| | 100,000 | | | Allegheny County, PA IDA (USX Corp.)1 | | | 5.500 | | | | 12/01/2029 | | | | 93,939 | |
| | 400,000 | | | Allegheny County, PA IDA (USX Corp.)1 | | | 5.600 | | | | 09/01/2030 | | | | 380,292 | |
| | 25,000 | | | Allegheny County, PA IDA (USX Corp.)1 | | | 6.000 | | | | 01/15/2014 | | | | 25,006 | |
| | 270,000 | | | Allegheny County, PA IDA (USX Corp.)1 | | | 6.100 | | | | 01/15/2018 | | | | 269,984 | |
| | 20,000 | | | Allegheny County, PA IDA (USX Corp.)1 | | | 6.100 | | | | 07/15/2020 | | | | 19,933 | |
| | 1,970,000 | | | Allegheny County, PA Redevel. Authority (Pittsburgh Mills)1 | | | 5.100 | | | | 07/01/2014 | | | | 1,831,805 | |
| | 23,750,000 | | | Allegheny County, PA Redevel. Authority (Pittsburgh Mills)1 | | | 5.600 | | | | 07/01/2023 | | | | 18,423,588 | |
| | 255,000 | | | Allegheny County, PA Redevel. Authority (Robinson Mall)1 | | | 6.875 | | | | 11/01/2017 | | | | 252,284 | |
| | 90,000 | | | Allegheny County, PA Redevel. Authority (Robinson Mall)1 | | | 7.000 | | | | 11/01/2017 | | | | 90,525 | |
| | 1,770,000 | | | Allegheny County, PA Residential Finance Authority (Broadview Manor Apartments)1 | | | 5.950 | | | | 01/20/2043 | | | | 1,679,234 | |
| | 1,360,000 | | | Allegheny County, PA Residential Finance Authority (Independence House Apartments)1 | | | 6.100 | | | | 01/20/2043 | | | | 1,318,520 | |
| | 1,770,000 | | | Allegheny County, PA Residential Finance Authority (Versailles Apartments)1 | | | 6.160 | | | | 01/20/2043 | | | | 1,730,724 | |
| | 3,900,000 | | | Allegheny, PA Airport Authority (Pittsburgh International Airport)1 | | | 5.000 | | | | 01/01/2018 | | | | 3,797,976 | |
| | 5,000 | | | Armstrong County, PA IDA (Kittanning Care Center)1 | | | 5.375 | | | | 08/20/2012 | | | | 5,111 | |
| | 5,000 | | | Beaver County, PA Hospital Authority (Valley Health System)1 | | | 5.000 | | | | 05/15/2028 | | | | 4,892 | |
| | 13,000,000 | | | Berks County, PA Municipal Authority (Reading Hospital & Medical Center)1 | | | 5.500 | | | | 11/01/2031 | | | | 13,079,820 | |
| | 40,000 | | | Blair County, PA IDA (The Village at Penn State Retirement Community)1 | | | 6.400 | | | | 01/01/2012 | | | | 39,732 | |
| | 4,140,000 | | | Blair County, PA IDA (The Village at Penn State Retirement Community)1 | | | 6.900 | | | | 01/01/2022 | | | | 3,612,026 | |
| | 7,135,000 | | | Blair County, PA IDA (The Village at Penn State Retirement Community)1 | | | 7.000 | | | | 01/01/2034 | | | | 5,849,987 | |
| | 50,000 | | | Blair County, PA IDA (The Village at Penn State Retirement Community)4,5 | | | 10.000 | | | | 01/01/2012 | | | | 2,790 | |
| | 1,180,000 | | | Bonneauville Borough, PA Municipal Authority1 | | | 5.250 | | | | 06/01/2037 | | | | 1,030,730 | |
| | 2,000,000 | | | Bonneauville Borough, PA Municipal Authority1 | | | 5.300 | | | | 06/01/2043 | | | | 1,738,720 | |
| | 5,500,000 | | | Bradford County, PA IDA (International Paper Company)1 | | | 5.200 | | | | 12/01/2019 | | | | 4,806,670 | |
F2 | OPPENHEIMER PENNSYLVANIA MUNICIPAL FUND
| | | | | | | | | | | | | | | | | |
| Principal | | | | | | | | | | | | |
| Amount | | | | | Coupon | | | Maturity | | | Value | |
| |
| Pennsylvania Continued | | | | | | | | | | | | |
| $ | 1,000,000 | | | Bucks County, PA IDA (Chandler Hall Health Care Facility)1 | | | 6.200 | % | | | 05/01/2019 | | | $ | 861,750 | |
| | 10,000 | | | Bucks County, PA IDA (Chandler Hall Health Care Facility)1 | | | 6.300 | | | | 05/01/2029 | | | | 7,558 | |
| | 1,000,000 | | | Bucks County, PA IDA (Lutheran Community Telford Center)1 | | | 5.750 | | | | 01/01/2027 | | | | 761,200 | |
| | 8,255,000 | | | Bucks County, PA IDA (Pennsylvania Suburban Water Company)1 | | | 5.550 | | | | 09/01/2032 | | | | 7,609,954 | |
| | 80,000 | | | Bucks County, PA IDA (USX Corp.)1 | | | 5.600 | | | | 03/01/2033 | | | | 75,840 | |
| | 2,000,000 | | | Butler County, PA Hospital Authority (Butler Health System)1 | | | 7.250 | | | | 07/01/2039 | | | | 2,084,480 | |
| | 5,000 | | | Butler County, PA Hospital Authority (Butler Memorial Hospital)1 | | | 5.250 | | | | 07/01/2012 | | | | 5,012 | |
| | 145,000 | | | Butler County, PA Hospital Authority (Butler Memorial Hospital)1 | | | 5.250 | | | | 07/01/2016 | | | | 145,305 | |
| | 75,000 | | | Butler County, PA Hospital Authority (Butler Memorial Hospital)1 | | | 5.250 | | | | 07/01/2016 | | | | 75,158 | |
| | 480,000 | | | Butler County, PA IDA (Greenview Gardens Apartments)1 | | | 6.000 | | | | 07/01/2023 | | | | 405,403 | |
| | 880,000 | | | Butler County, PA IDA (Greenview Gardens Apartments)1 | | | 6.250 | | | | 07/01/2033 | | | | 685,045 | |
| | 100,000 | | | Cambridge, PA Area Joint Authority1 | | | 5.250 | | | | 12/01/2021 | | | | 99,997 | |
| | 2,865,000 | | | Cambridge, PA Area Joint Authority1 | | | 6.000 | | | | 12/01/2037 | | | | 2,457,626 | |
| | 25,000 | | | Carbondale, PA Hsg. Corp.1 | | | 8.125 | | | | 05/01/2019 | | | | 25,000 | |
| | 3,995,000 | | | Centre County, PA Hospital Authority (Mt. Nittany Medical Center)1 | | | 6.250 | | | | 11/15/2044 | | | | 4,083,090 | |
| | 900,000 | | | Chartiers Valley, PA Industrial and Commercial Devel. Authority (Asbury Health Center)1 | | | 5.750 | | | | 12/01/2022 | | | | 702,270 | |
| | 1,505,000 | | | Chester County, PA H&EFA (Chester County Hospital)1 | | | 6.750 | | | | 07/01/2021 | | | | 1,486,142 | |
| | 2,750,000 | | | Chester County, PA H&EFA (Chester County Hospital)1 | | | 6.750 | | | | 07/01/2031 | | | | 2,514,435 | |
| | 245,000 | | | Chester County, PA H&EFA (Devereaux Foundation)1 | | | 5.500 | | | | 05/01/2027 | | | | 245,162 | |
| | 25,000 | | | Chester County, PA H&EFA (Immaculata College)1 | | | 5.300 | | | | 10/15/2011 | | | | 24,718 | |
| | 30,000 | | | Chester County, PA H&EFA (Immaculata College)1 | | | 5.400 | | | | 10/15/2012 | | | | 29,458 | |
| | 65,000 | | | Chester County, PA H&EFA (Immaculata College)1 | | | 5.600 | | | | 10/15/2018 | | | | 57,024 | |
| | 25,000 | | | Chester County, PA H&EFA (Immaculata College)1 | | | 5.625 | | | | 10/15/2027 | | | | 19,051 | |
| | 45,000 | | | Chester County, PA H&EFA (Jefferson Health System)1 | | | 5.250 | | | | 05/15/2022 | | | | 45,193 | |
| | 23,915,000 | | | Chester County, PA IDA (Aqua Pennsylvania)6 | | | 5.000 | | | | 02/01/2041 | | | | 21,158,788 | |
| | 1,100,000 | | | Chester County, PA IDA (Collegium Charter School)1 | | | 5.000 | | | | 04/15/2022 | | | | 771,694 | |
| | 7,595,000 | | | Chester County, PA IDA (Collegium Charter School)1 | | | 5.500 | | | | 04/15/2031 | | | | 4,894,294 | |
| | 15,000 | | | Clarion County, PA Hospital Authority (Clarion Hospital)1 | | | 5.750 | | | | 07/01/2017 | | | | 15,019 | |
| | 800,000 | | | Crawford County, PA Hospital Authority (Wesbury United Methodist Community)1 | | | 6.125 | | | | 08/15/2019 | | | | 705,576 | |
| | 1,000,000 | | | Cumberland County, PA Municipal Authority (Diakon Lutheran Ministries)1 | | | 5.000 | | | | 01/01/2027 | | | | 847,690 | |
F3 | OPPENHEIMER PENNSYLVANIA MUNICIPAL FUND
STATEMENT OF INVESTMENTS Continued
| | | | | | | | | | | | | | | | | |
| Principal | | | | | | | | | | | | |
| Amount | | | | | Coupon | | | Maturity | | | Value | |
| |
| Pennsylvania Continued | | | | | | | | | | | | |
| $ | 12,000,000 | | | Cumberland County, PA Municipal Authority (Diakon Lutheran Ministries)1 | | | 5.000 | % | | | 01/01/2036 | | | $ | 9,293,400 | |
| | 1,000,000 | | | Cumberland County, PA Municipal Authority (Presbyterian Homes)1 | | | 5.000 | | | | 12/01/2020 | | | | 914,690 | |
| | 1,950,000 | | | Cumberland County, PA Municipal Authority (Presbyterian Homes)1 | | | 5.000 | | | | 12/01/2021 | | | | 1,764,224 | |
| | 6,605,000 | | | Delaware County, PA Authority (Cabrini College)1 | | | 5.500 | | | | 07/01/2024 | | | | 6,389,413 | |
| | 60,000 | | | Delaware County, PA Authority (CCMC)1 | | | 5.300 | | | | 12/01/2027 | | | | 47,894 | |
| | 2,500,000 | | | Delaware County, PA Authority (CCMC/CKHS/DCMH Obligated Group)1 | | | 5.000 | | | | 12/15/2026 | | | | 1,941,875 | |
| | 15,000 | | | Delaware County, PA Authority (CCMC/CKHS/DCMH Obligated Group)1 | | | 5.375 | | | | 12/01/2018 | | | | 13,655 | |
| | 25,000 | | | Delaware County, PA Authority (CCMC/CKHS/DCMH Obligated Group)1 | | | 6.250 | | | | 12/15/2022 | | | | 28,584 | |
| | 25,000 | | | Delaware County, PA Authority (CCMC/CKHS/DCMH Obligated Group)1 | | | 6.250 | | | | 12/15/2031 | | | | 28,584 | |
| | 120,000 | | | Delaware County, PA Authority (MAS/MCMCSPA/MHH/MHP/MHSSPA Obligated Group) | | | 5.375 | | | | 11/15/2023 | | | | 128,398 | |
| | 1,160,000 | | | Delaware County, PA Authority (Neumann College)1 | | | 6.000 | | | | 10/01/2025 | | | | 1,178,676 | |
| | 280,000 | | | Delaware County, PA Authority (Neumann College)1 | | | 6.000 | | | | 10/01/2030 | | | | 276,668 | |
| | 2,530,000 | | | Delaware County, PA Authority (Neumann College)1 | | | 6.000 | | | | 10/01/2031 | | | | 2,399,275 | |
| | 1,000,000 | | | Delaware County, PA Authority (Neumann College)1 | | | 6.125 | | | | 10/01/2034 | | | | 981,660 | |
| | 3,000,000 | | | Delaware County, PA Authority (Neumann College)1 | | | 6.250 | | | | 10/01/2038 | | | | 3,048,300 | |
| | 18,705,000 | | | Delaware County, PA IDA (Aqua Pennsylvania)6 | | | 5.000 | | | | 11/01/2038 | | | | 16,654,661 | |
| | 11,055,000 | | | Delaware County, PA IDA (Aqua Pennsylvania)6 | | | 5.000 | | | | 11/01/2038 | | | | 9,873,167 | |
| | 4,530,000 | | | Delaware County, PA IDA (Naamans Creek)1 | | | 7.000 | | | | 12/01/2036 | | | | 3,579,380 | |
| | 5,370,000 | | | Delaware County, PA IDA (Pennsylvania Suburban Water Company)1 | | | 5.150 | | | | 09/01/2032 | | | | 4,947,918 | |
| | 45,000 | | | Delaware County, PA IDA (Philadelphia Suburban Water Company)1 | | | 5.350 | | | | 10/01/2031 | | | | 42,974 | |
| | 45,000 | | | Delaware County, PA IDA (Philadelphia Suburban Water Company)1 | | | 6.000 | | | | 06/01/2029 | | | | 45,126 | |
| | 50,000 | | | Delaware River Port Authority PA/NJ1 | | | 5.000 | | | | 01/01/2026 | | | | 48,102 | |
| | 10,000 | | | Derry Township, PA GO1 | | | 5.700 | | | | 09/15/2013 | | | | 10,037 | |
| | 25,000 | | | Derry Township, PA Municipal Authority1 | | | 5.100 | | | | 12/01/2020 | | | | 25,018 | |
| | 15,000 | | | East Hempfield Township, PA IDA (Homestead Village)1 | | | 6.375 | | | | 11/01/2023 | | | | 11,440 | |
| | 140,000 | | | Erie County, PA IDA (International Paper Company)1 | | | 5.000 | | | | 11/01/2018 | | | | 121,367 | |
| | 10,000 | | | Erie County, PA IDA (International Paper Company)1 | | | 5.850 | | | | 12/01/2020 | | | | 9,048 | |
| | 3,000,000 | | | Erie, PA Higher Education Building Authority (Mercyhurst College)1 | | | 5.500 | | | | 03/15/2038 | | | | 2,574,300 | |
| | 2,240,000 | | | Erie-Western PA Port Authority1 | | | 5.125 | | | | 06/15/2016 | | | | 2,254,694 | |
F4 | OPPENHEIMER PENNSYLVANIA MUNICIPAL FUND
| | | | | | | | | | | | | | | | | |
| Principal | | | | | | | | | | | | |
| Amount | | | | | Coupon | | | Maturity | | | Value | |
| |
| Pennsylvania Continued | | | | | | | | | | | | |
| $ | 5,585,000 | | | Fayette County, PA Redevel. Authority (Fayette Crossing)1 | | | 7.000 | % | | | 09/01/2019 | | | $ | 5,110,945 | |
| | 45,000 | | | Franklin County, PA IDA (The Chambersburg Hospital)1 | | | 5.000 | | | | 07/01/2022 | | | | 39,879 | |
| | 10,000 | | | Gettysburg, PA Municipal Authority (Gettysburg College)1 | | | 5.000 | | | | 08/15/2023 | | | | 9,930 | |
| | 575,000 | | | Harveys Lake, PA General Municipal Authority (Misericordia University)1 | | | 6.000 | | | | 05/01/2019 | | | | 528,120 | |
| | 7,130,000 | | | Horsham, PA Industrial and Commercial Devel. Authority (Pennsylvania LTC)1 | | | 6.000 | | | | 12/01/2037 | | | | 4,872,143 | |
| | 90,000 | | | Indiana County, PA IDA Pollution Control (Metropolitan Edison Company)1 | | | 5.950 | | | | 05/01/2027 | | | | 84,371 | |
| | 115,000 | | | Indiana County, PA IDA Pollution Control (PSEG Power LLC)1 | | | 5.850 | | | | 06/01/2027 | | | | 106,592 | |
| | 1,530,000 | | | Jefferson County, PA GO1 | | | 5.625 | | | | 06/01/2028 | | | | 1,496,003 | |
| | 5,075,000 | | | Jefferson County, PA GO1 | | | 5.875 | | | | 06/01/2035 | | | | 4,770,348 | |
| | 25,000 | | | Lancaster County, PA Hospital Authority (Landis Homes Retirement Community)1 | | | 5.700 | | | | 09/01/2018 | | | | 20,876 | |
| | 20,000 | | | Lancaster County, PA Hospital Authority (Landis Homes Retirement Community)1 | | | 5.750 | | | | 09/01/2023 | | | | 14,970 | |
| | 25,000 | | | Lancaster County, PA Hospital Authority (St. Anne’s Home for the Aged)1 | | | 6.500 | | | | 04/01/2015 | | | | 24,956 | |
| | 25,000 | | | Lancaster County, PA Solid Waste Management Authority1 | | | 5.000 | | | | 12/15/2014 | | | | 24,701 | |
| | 10,000 | | | Latrobe, PA IDA (St. Vincent College)1 | | | 5.375 | | | | 05/01/2013 | | | | 10,557 | |
| | 10,000 | | | Latrobe, PA IDA (St. Vincent College)1 | | | 5.375 | | | | 05/01/2018 | | | | 9,930 | |
| | 35,000 | | | Latrobe, PA IDA (St. Vincent College)1 | | | 5.700 | | | | 05/01/2031 | | | | 31,128 | |
| | 13,850,000 | | | Lawrence County, PA IDA (Shenango Presbyterian Center)1 | | | 5.625 | | | | 11/15/2037 | | | | 9,329,776 | |
| | 1,020,000 | | | Lehigh County, PA GPA (Bible Fellowship Church Home)1 | | | 6.000 | | | | 12/15/2023 | | | | 829,852 | |
| | 1,060,000 | | | Lehigh County, PA GPA (Bible Fellowship Church Home)1 | | | 7.625 | | | | 11/01/2021 | | | | 1,033,956 | |
| | 750,000 | | | Lehigh County, PA GPA (Bible Fellowship Church Home)1 | | | 7.750 | | | | 11/01/2033 | | | | 683,580 | |
| | 1,265,000 | | | Lehigh County, PA GPA (Kidspeace Obligated Group) | | | 5.800 | | | | 11/01/2012 | | | | 1,140,233 | |
| | 8,190,000 | | | Lehigh County, PA GPA (Kidspeace Obligated Group) | | | 6.000 | | | | 11/01/2018 | | | | 6,085,825 | |
| | 2,000,000 | | | Lehigh County, PA GPA (Kidspeace Obligated Group) | | | 6.000 | | | | 11/01/2018 | | | | 1,486,160 | |
| | 1,100,000 | | | Lehigh County, PA GPA (Kidspeace Obligated Group) | | | 6.000 | | | | 11/01/2023 | | | | 715,132 | |
| | 3,600,000 | | | Lehigh County, PA GPA (Kidspeace Obligated Group) | | | 6.000 | | | | 11/01/2023 | | | | 2,340,432 | |
| | 115,000 | | | Lehigh County, PA GPA (Lehigh Valley Hospital)1 | | | 5.625 | | | | 07/01/2015 | | | | 115,097 | |
| | 10,000 | | | Luzerne County, PA Flood Protection Authority1 | | | 5.000 | | | | 01/15/2023 | | | | 9,932 | |
| | 22,500,000 | | | Luzerne County, PA IDA (Pennsylvania-American Water)6 | | | 5.100 | | | | 09/01/2034 | | | | 20,130,975 | |
| | 10,000 | | | Luzerne County, PA IDA (Pennsylvania-American Water)1 | | | 5.100 | | | | 09/01/2034 | | | | 8,947 | |
| | 170,000 | | | Lycoming County, PA Hospital Authority (MVH/DPH Obligated Group) | | | 5.250 | | | | 11/15/2015 | | | | 170,058 | |
| | 30,000 | | | Lycoming County, PA Hospital Authority (MVH/DPH Obligated Group) | | | 5.500 | | | | 11/15/2022 | | | | 27,820 | |
F5 | OPPENHEIMER PENNSYLVANIA MUNICIPAL FUND
STATEMENT OF INVESTMENTS Continued
| | | | | | | | | | | | | | | | | |
| Principal | | | | | | | | | | | | |
| Amount | | | | | Coupon | | | Maturity | | | Value | |
| |
| Pennsylvania Continued | | | | | | | | | | | | |
| $ | 70,000 | | | Lycoming County, PA Hospital Authority (WH/NCPHS Obligated Group) | | | 5.250 | % | | | 11/15/2015 | | | $ | 70,024 | |
| | 35,000 | | | Lycoming County, PA Hospital Authority (WH/NCPHS Obligated Group) | | | 5.375 | | | | 11/15/2010 | | | | 35,039 | |
| | 2,730,000 | | | McKean County, PA Hospital Authority (Bradford Hospital)1 | | | 5.000 | | | | 10/01/2020 | | | | 2,067,538 | |
| | 2,900,000 | | | McKean County, PA Hospital Authority (Bradford Hospital)1 | | | 5.250 | | | | 10/01/2030 | | | | 1,884,681 | |
| | 595,000 | | | Millcreek, PA Richland Joint Authority1 | | | 5.250 | | | | 08/01/2022 | | | | 562,811 | |
| | 1,355,000 | | | Millcreek, PA Richland Joint Authority1 | | | 5.375 | | | | 08/01/2027 | | | | 1,241,641 | |
| | 825,000 | | | Millcreek, PA Richland Joint Authority1 | | | 5.375 | | | | 08/01/2027 | | | | 755,981 | |
| | 1,000,000 | | | Millcreek, PA Richland Joint Authority1 | | | 5.500 | | | | 08/01/2037 | | | | 866,070 | |
| | 2,445,000 | | | Millcreek, PA Richland Joint Authority1 | | | 5.500 | | | | 08/01/2037 | | | | 2,117,541 | |
| | 75,000 | | | Monroe County, PA Hospital Authority (Pocono Medical Center)1 | | | 5.625 | | | | 01/01/2032 | | | | 65,787 | |
| | 10,000 | | | Montgomery County, PA HEHA (Abington Memorial Hospital) | | | 5.000 | | | | 06/01/2028 | | | | 8,788 | |
| | 20,000 | | | Montgomery County, PA HEHA (Abington Memorial Hospital)1 | | | 5.125 | | | | 06/01/2027 | | | | 18,365 | |
| | 20,000 | | | Montgomery County, PA HEHA (Abington Memorial Hospital)1 | | | 5.125 | | | | 06/01/2032 | | | | 17,479 | |
| | 110,000 | | | Montgomery County, PA HEHA (Holy Redeemer Health System)1 | | | 5.250 | | | | 10/01/2023 | | | | 94,909 | |
| | 50,000 | | | Montgomery County, PA HEHA (Holy Redeemer Health System)1 | | | 5.250 | | | | 10/01/2027 | | | | 39,899 | |
| | 80,000 | | | Montgomery County, PA HEHA (Holy Redeemer Physician & Ambulatory Services)1 | | | 5.250 | | | | 10/01/2023 | | | | 69,025 | |
| | 880,000 | | | Montgomery County, PA IDA (ACTS Retirement Life Community)1 | | | 5.250 | | | | 11/15/2028 | | | | 771,346 | |
| | 270,000 | | | Montgomery County, PA IDA (Pennsylvania-American Water Company)1 | | | 5.050 | | | | 06/01/2029 | | | | 241,037 | |
| | 3,840,000 | | | Montgomery County, PA IDA (Wordsworth Academy)1 | | | 8.000 | | | | 09/01/2024 | | | | 3,617,626 | |
| | 1,000,000 | | | Mount Lebanon, PA Hospital Authority (St. Claire Memorial Hospital)1 | | | 5.625 | | | | 07/01/2032 | | | | 941,720 | |
| | 90,000 | | | New Morgan, PA IDA (Browning-Ferris Industries)1 | | | 6.500 | | | | 04/01/2019 | | | | 89,933 | |
| | 2,085,000 | | | New Wilmington, PA Municipal Authority (Westminster College)1 | | | 5.000 | | | | 05/01/2027 | | | | 1,856,901 | |
| | 85,000 | | | Northampton County, PA IDA (Moravian Hall Square)2 | | | 5.350 | | | | 07/01/2010 | | | | 85,088 | |
| | 25,000 | | | Northampton County, PA IDA (Moravian Hall Square)1 | | | 5.550 | | | | 07/01/2014 | | | | 25,008 | |
| | 40,000 | | | Northampton County, PA IDA (Moravian Hall Square)1 | | | 5.700 | | | | 07/01/2020 | | | | 39,901 | |
| | 830,000 | | | Northumberland County, PA IDA (Aqua Pennsylvania)1 | | | 5.050 | | | | 10/01/2039 | | | | 684,634 | |
| | 1,205,000 | | | Northumberland County, PA IDA (NHS Youth Services)1 | | | 5.500 | | | | 02/15/2033 | | | | 809,531 | |
F6 | OPPENHEIMER PENNSYLVANIA MUNICIPAL FUND
| | | | | | | | | | | | | | | | | |
| Principal | | | | | | | | | | | | |
| Amount | | | | | Coupon | | | Maturity | | | Value | |
| |
| Pennsylvania Continued | | | | | | | | | | | | |
| $ | 1,770,000 | | | Northumberland County, PA IDA (NHS Youth Services)1 | | | 7.500 | % | | | 02/15/2029 | | | $ | 1,608,063 | |
| | 3,740,000 | | | Northumberland County, PA IDA (NHS Youth Services)1 | | | 7.750 | | | | 02/15/2029 | | | | 3,486,391 | |
| | 11,400,000 | | | PA EDFA (30th Street Garage)1 | | | 5.875 | | | | 06/01/2033 | | | | 9,874,908 | |
| | 10,000,000 | | | PA EDFA (Albert Einstein Healthcare)1 | | | 6.250 | | | | 10/15/2023 | | | | 10,081,400 | |
| | 50,000 | | | PA EDFA (Amtrak)1 | | | 6.000 | | | | 11/01/2011 | | | | 50,646 | |
| | 250,000 | | | PA EDFA (Amtrak)1 | | | 6.125 | | | | 11/01/2021 | | | | 230,338 | |
| | 5,005,000 | | | PA EDFA (Amtrak)1 | | | 6.250 | | | | 11/01/2031 | | | | 4,502,698 | |
| | 12,475,000 | | | PA EDFA (Amtrak)1 | | | 6.375 | | | | 11/01/2041 | | | | 11,182,715 | |
| | 40,000,000 | | | PA EDFA (Bionol Clearfield)1 | | | 8.500 | | | | 07/15/2015 | | | | 33,127,200 | |
| | 500,000 | | | PA EDFA (Fayette Thermal)1 | | | 5.250 | | | | 12/01/2016 | | | | 379,515 | |
| | 35,000 | | | PA EDFA (Fayette Thermal)1 | | | 5.500 | | | | 12/01/2021 | | | | 23,953 | |
| | 14,700,000 | | | PA EDFA (National Gypsum Company)1 | | | 6.125 | | | | 11/01/2027 | | | | 8,298,150 | |
| | 5,000,000 | | | PA EDFA (National Gypsum Company)1 | | | 6.250 | | | | 11/01/2027 | | | | 2,822,100 | |
| | 8,515,000 | | | PA EDFA (Northampton Generating)1 | | | 6.500 | | | | 01/01/2013 | | | | 6,236,131 | |
| | 21,800,000 | | | PA EDFA (Northampton Generating)1 | | | 6.600 | | | | 01/01/2019 | | | | 16,489,302 | |
| | 1,000,000 | | | PA EDFA (Northampton Generating) | | | 6.875 | | | | 01/01/2011 | | | | 623,740 | |
| | 12,000,000 | | | PA EDFA (Northampton Generating) | | | 6.950 | | | | 01/01/2021 | | | | 6,625,080 | |
| | 45,000 | | | PA EDFA (Northwestern Human Services)1 | | | 5.125 | | | | 06/01/2018 | | | | 35,951 | |
| | 3,000,000 | | | PA EDFA (Northwestern Human Services)1 | | | 5.250 | | | | 06/01/2028 | | | | 2,005,920 | |
| | 1,450,000 | | | PA EDFA (Reliant Energy)1 | | | 6.750 | | | | 12/01/2036 | | | | 1,358,056 | |
| | 1,575,000 | | | PA EDFA (Reliant Energy)1 | | | 6.750 | | | | 12/01/2036 | | | | 1,475,129 | |
| | 6,130,000 | | | PA EDFA (Reliant Energy/Reliant Seward Obligated Group)1 | | | 6.750 | | | | 12/01/2036 | | | | 5,741,297 | |
| | 57,825,000 | | | PA EDFA (USG Corp.)1 | | | 6.000 | | | | 06/01/2031 | | | | 37,422,027 | |
| | 4,870,000 | | | PA EDFA (Waste Management)1 | | | 5.100 | | | | 10/01/2027 | | | | 4,297,775 | |
| | 30,000,000 | | | PA Geisinger Authority Health System, Series A6 | | | 5.250 | | | | 06/01/2039 | | | | 29,798,250 | |
| | 400,000 | | | PA Harrisburg University Authority (Harrisburg University of Science)1 | | | 5.400 | | | | 09/01/2016 | | | | 387,748 | |
| | 50,000 | | | PA HEFA (Allegheny College)1 | | | 5.000 | | | | 11/01/2026 | | | | 49,999 | |
| | 755,000 | | | PA HEFA (Allegheny Delaware Valley Obligated Group)1 | | | 5.700 | | | | 11/15/2011 | | | | 730,244 | |
| | 3,185,000 | | | PA HEFA (Allegheny Delaware Valley Obligated Group)1 | | | 5.875 | | | | 11/15/2021 | | | | 2,601,827 | |
| | 1,025,000 | | | PA HEFA (Assoc. of Independent Colleges & Universities)1 | | | 5.125 | | | | 05/01/2032 | | | | 847,060 | |
| | 100,000 | | | PA HEFA (California University of Pennsylvania Student Assoc.)1 | | | 5.000 | | | | 07/01/2028 | | | | 61,450 | |
| | 115,000 | | | PA HEFA (California University of Pennsylvania Student Assoc.)1 | | | 6.750 | | | | 09/01/2032 | | | | 104,312 | |
| | 55,000 | | | PA HEFA (California University of Pennsylvania Student Assoc.)1 | | | 6.800 | | | | 09/01/2025 | | | | 52,874 | |
| | 1,475,000 | | | PA HEFA (College of Science & Agriculture)1 | | | 5.350 | | | | 04/15/2028 | | | | 1,173,068 | |
| | 1,460,000 | | | PA HEFA (Delaware Valley College of Science & Agriculture)1 | | | 5.650 | | | | 04/15/2025 | | | | 1,243,511 | |
| | 815,000 | | | PA HEFA (Delaware Valley College of Science & Agriculture)1 | | | 5.750 | | | | 04/15/2029 | | | | 668,936 | |
F7 | OPPENHEIMER PENNSYLVANIA MUNICIPAL FUND
STATEMENT OF INVESTMENTS Continued
| | | | | | | | | | | | | | | | | |
| Principal | | | | | | | | | | | | |
| Amount | | | | | Coupon | | | Maturity | | | Value | |
| |
| Pennsylvania Continued | | | | | | | | | | | | |
| $ | 220,000 | | | PA HEFA (Delaware Valley College of Science & Agriculture)1 | | | 5.750 | % | | | 04/15/2034 | | | $ | 173,983 | |
| | 3,210,000 | | | PA HEFA (Delaware Valley College of Science & Agriculture)1 | | | 5.800 | | | | 04/15/2030 | | | | 2,638,941 | |
| | 3,385,000 | | | PA HEFA (Delaware Valley College of Science & Agriculture)1 | | | 5.800 | | | | 04/15/2033 | | | | 2,714,939 | |
| | 55,000 | | | PA HEFA (Drexel University)1 | | | 5.750 | | | | 05/01/2022 | | | | 55,095 | |
| | 4,000,000 | | | PA HEFA (Edinboro University Foundation)1 | | | 5.750 | | | | 07/01/2028 | | | | 3,585,760 | |
| | 5,500,000 | | | PA HEFA (Edinboro University Foundation)1 | | | 5.875 | | | | 07/01/2038 | | | | 4,745,620 | |
| | 5,825,000 | | | PA HEFA (Edinboro University Foundation)1 | | | 6.000 | | | | 07/01/2042 | | | | 5,055,634 | |
| | 1,780,000 | | | PA HEFA (Elizabethtown College)1 | | | 5.000 | | | | 12/15/2021 | | | | 1,697,693 | |
| | 4,000,000 | | | PA HEFA (Elizabethtown College)1 | | | 5.000 | | | | 12/15/2027 | | | | 3,590,920 | |
| | 130,000 | | | PA HEFA (Frontier II)1 | | | 5.125 | | | | 04/01/2033 | | | | 102,753 | |
| | 2,000,000 | | | PA HEFA (La Salle University)1 | | | 5.000 | | | | 05/01/2037 | | | | 1,634,040 | |
| | 50,000 | | | PA HEFA (La Salle University)1 | | | 5.500 | | | | 05/01/2034 | | | | 43,882 | |
| | 1,490,000 | | | PA HEFA (Marywood University)1 | | | 5.125 | | | | 06/01/2029 | | | | 1,331,911 | |
| | 1,100,000 | | | PA HEFA (MCP/HUHS/AUS Obligated Group)1 | | | 5.600 | | | | 11/15/2010 | | | | 1,083,379 | |
| | 35,085,000 | | | PA HEFA (MCP/HUHS/AUS Obligated Group)1 | | | 5.875 | | | | 11/15/2016 | | | | 31,423,529 | |
| | 70,000 | | | PA HEFA (MCP/HUHS/AUS Obligated Group)1 | | | 5.875 | | | | 11/15/2016 | | | | 62,695 | |
| | 9,740,000 | | | PA HEFA (MCP/HUHS/AUS Obligated Group)1 | | | 5.875 | | | | 11/15/2021 | | | | 7,956,606 | |
| | 250,000 | | | PA HEFA (Philadelphia University)1 | | | 5.000 | | | | 06/01/2035 | | | | 190,868 | |
| | 3,000,000 | | | PA HEFA (Philadelphia University)1 | | | 5.125 | | | | 06/01/2025 | | | | 2,590,260 | |
| | 2,000,000 | | | PA HEFA (Philadelphia University)1 | | | 5.250 | | | | 06/01/2032 | | | | 1,623,160 | |
| | 2,005,000 | | | PA HEFA (Philadelphia University)1 | | | 5.500 | | | | 06/01/2020 | | | | 1,889,231 | |
| | 105,000 | | | PA HEFA (St. Francis University)1 | | | 5.750 | | | | 11/01/2023 | | | | 89,025 | |
| | 3,925,000 | | | PA HEFA (St. Francis University)1 | | | 6.250 | | | | 11/01/2018 | | | | 3,684,594 | |
| | 25,000 | | | PA HEFA (University of the Arts)1 | | | 5.750 | | | | 03/15/2030 | | | | 22,492 | |
| | 100,000 | | | PA HEFA (UPMC Health System)1 | | | 5.000 | | | | 08/01/2029 | | | | 100,056 | |
| | 30,000 | | | PA HEFA (UPMC Health System)1 | | | 6.000 | | | | 01/15/2031 | | | | 30,643 | |
| | 650,000 | | | PA HEFA (Widener University)1 | | | 5.000 | | | | 07/15/2026 | | | | 597,623 | |
| | 100,000 | | | PA HEFA (Widener University)1 | | | 5.250 | | | | 07/15/2024 | | | | 96,670 | |
| | 70,000 | | | PA HEFA (Widener University)1 | | | 5.400 | | | | 07/15/2036 | | | | 62,960 | |
| | 11,670,000 | | | PA HFA (Single Family Mtg.)6 | | | 4.700 | | | | 10/01/2037 | | | | 10,049,554 | |
| | 35,000 | | | PA HFA (Single Family Mtg.)1 | | | 4.700 | | | | 10/01/2037 | | | | 30,070 | |
| | 34,565,000 | | | PA HFA (Single Family Mtg.), Series 100A6 | | | 5.350 | | | | 10/01/2033 | | | | 33,560,011 | |
| | 15,000,000 | | | PA HFA (Single Family Mtg.), Series 102A6 | | | 5.500 | | | | 10/01/2034 | | | | 14,817,750 | |
| | 1,285,000 | | | PA HFA (Single Family Mtg.), Series 102A1 | | | 5.500 | | | | 10/01/2034 | | | | 1,269,374 | |
| | 9,180,000 | | | PA HFA (Single Family Mtg.), Series 61A6 | | | 5.450 | | | | 10/01/2021 | | | | 9,186,059 | |
| | 25,000 | | | PA HFA (Single Family Mtg.), Series 62A1 | | | 5.200 | | | | 10/01/2011 | | | | 25,221 | |
| | 570,000 | | | PA HFA (Single Family Mtg.), Series 63A1 | | | 5.448 | 7 | | | 04/01/2030 | | | | 164,650 | |
| | 60,000 | | | PA HFA (Single Family Mtg.), Series 641 | | | 5.000 | | | | 10/01/2017 | | | | 60,031 | |
| | 5,000 | | | PA HFA (Single Family Mtg.), Series 66A1 | | | 5.650 | | | | 04/01/2029 | | | | 4,980 | |
F8 | OPPENHEIMER PENNSYLVANIA MUNICIPAL FUND
| | | | | | | | | | | | | | | | | |
| Principal | | | | | | | | | | | | |
| Amount | | | | | Coupon | | | Maturity | | | Value | |
| |
| Pennsylvania Continued | | | | | | | | | | | | |
| $ | 18,000,000 | | | PA HFA (Single Family Mtg.), Series 72A6 | | | 5.350 | % | | | 10/01/2031 | | | $ | 17,610,120 | |
| | 190,000 | | | PA HFA (Single Family Mtg.), Series 72A1 | | | 5.350 | | | | 10/01/2031 | | | | 185,883 | |
| | 11,400,000 | | | PA HFA (Single Family Mtg.), Series 73A6 | | | 5.350 | | | | 10/01/2022 | | | | 11,484,816 | |
| | 11,020,000 | | | PA HFA (Single Family Mtg.), Series 74B6 | | | 5.150 | | | | 10/01/2022 | | | | 11,073,667 | |
| | 4,170,000 | | | PA HFA (Single Family Mtg.), Series 95A1 | | | 4.875 | | | | 10/01/2031 | | | | 3,828,185 | |
| | 30,515,000 | | | PA HFA (Single Family Mtg.), Series 96A6 | | | 4.700 | | | | 10/01/2037 | | | | 26,258,459 | |
| | 4,380,000 | | | PA HFA (Single Family Mtg.), Series 97A1 | | | 5.500 | | | | 10/01/2032 | | | | 4,398,396 | |
| | 9,000,000 | | | PA HFA (Single Family Mtg.), Series 99A6 | | | 5.250 | | | | 10/01/2032 | | | | 8,661,658 | |
| | 15,045,000 | | | PA HFA (Single Family Mtg.), Series 99A6 | | | 5.300 | | | | 10/01/2037 | | | | 14,150,969 | |
| | 1,265,000 | | | PA Southcentral General Authority (Hanover Hospital)1 | | | 5.000 | | | | 12/01/2020 | | | | 1,163,901 | |
| | 1,400,000 | | | PA Southcentral General Authority (Hanover Hospital)1 | | | 5.000 | | | | 12/01/2023 | | | | 1,220,156 | |
| | 2,245,000 | | | PA Southcentral General Authority (Hanover Hospital)1 | | | 5.000 | | | | 12/01/2025 | | | | 1,894,960 | |
| | 3,265,000 | | | PA Southcentral General Authority (Hanover Hospital)1 | | | 5.000 | | | | 12/01/2026 | | | | 2,735,972 | |
| | 900,000 | | | PA Southcentral General Authority (Hanover Hospital)1 | | | 5.000 | | | | 12/01/2027 | | | | 743,913 | |
| | 2,510,000 | | | PA Southcentral General Authority (Hanover Hospital)1 | | | 5.000 | | | | 12/01/2028 | | | | 2,043,993 | |
| | 1,470,000 | | | PA Southcentral General Authority (Hanover Hospital)1 | | | 5.000 | | | | 12/01/2030 | | | | 1,171,384 | |
| | 24,615,000 | | | PA Southcentral General Authority (Wellspan Health Obligated Group)6 | | | 6.000 | | | | 06/01/2029 | | | | 26,017,601 | |
| | 50,000 | | | PA St. Mary Hospital Authority (Franciscan Health)1 | | | 7.000 | | | | 06/15/2015 | | | | 50,033 | |
| | 15,000 | | | PA State Public School Building Authority (Butler College)1 | | | 5.400 | | | | 07/15/2012 | | | | 15,482 | |
| | 5,000 | | | PA State Public School Building Authority (Chester Upland School District)1 | | | 5.150 | | | | 11/15/2026 | | | | 5,033 | |
| | 5,000 | | | PA Turnpike Commission1 | | | 5.000 | | | | 12/01/2023 | | | | 4,964 | |
| | 300,000 | | | PA West Shore Area Hospital Authority (Holy Spirit Hospital)1 | | | 6.250 | | | | 01/01/2032 | | | | 261,324 | |
| | 5,000 | | | Patterson Township, PA Municipal Authority1 | | | 5.500 | | | | 04/15/2011 | | | | 5,009 | |
| | 25,000 | | | Penn Hills, PA GO1 | | | 5.850 | | | | 12/01/2014 | | | | 25,096 | |
| | 135,000 | | | Philadelphia, PA Airport1 | | | 5.375 | | | | 06/15/2015 | | | | 135,675 | |
| | 15,000 | | | Philadelphia, PA Airport, Series B1 | | | 5.250 | | | | 06/15/2031 | | | | 13,404 | |
| | 5,000 | | | Philadelphia, PA Authority for Industrial Devel.1 | | | 5.250 | | | | 10/01/2030 | | | | 5,521 | |
| | 6,720,000 | | | Philadelphia, PA Authority for Industrial Devel. (Aero Philadelphia)1 | | | 5.500 | | | | 01/01/2024 | | | | 4,606,090 | |
| | 3,870,000 | | | Philadelphia, PA Authority for Industrial Devel. (Air Cargo)1 | | | 7.500 | | | | 01/01/2025 | | | | 3,286,830 | |
| | 25,000 | | | Philadelphia, PA Authority for Industrial Devel. (American College of Physicians)1 | | | 6.000 | | | | 06/15/2030 | | | | 25,032 | |
| | 1,150,000 | | | Philadelphia, PA Authority for Industrial Devel. (Baptist Home of Philadelphia)1 | | | 5.500 | | | | 11/15/2018 | | | | 873,310 | |
| | 786,000 | | | Philadelphia, PA Authority for Industrial Devel. (Baptist Home of Philadelphia)1 | | | 5.600 | | | | 11/15/2028 | | | | 455,291 | |
F9 | OPPENHEIMER PENNSYLVANIA MUNICIPAL FUND
STATEMENT OF INVESTMENTS Continued
| | | | | | | | | | | | | | | | | |
| Principal | | | | | | | | | | | | |
| Amount | | | | | Coupon | | | Maturity | | | Value | |
| |
| Pennsylvania Continued | | | | | | | | | | | | |
| $ | 20,000 | | | Philadelphia, PA Authority for Industrial Devel. (Cathedral Village)1 | | | 5.600 | % | | | 04/01/2012 | | | $ | 19,785 | |
| | 35,000 | | | Philadelphia, PA Authority for Industrial Devel. (Cathedral Village)1 | | | 5.700 | | | | 04/01/2015 | | | | 33,002 | |
| | 450,000 | | | Philadelphia, PA Authority for Industrial Devel. (Cathedral Village)1 | | | 6.750 | | | | 04/01/2023 | | | | 385,205 | |
| | 2,600,000 | | | Philadelphia, PA Authority for Industrial Devel. (Cathedral Village)1 | | | 6.875 | | | | 04/01/2034 | | | | 2,098,798 | |
| | 2,750,000 | | | Philadelphia, PA Authority for Industrial Devel. (First Mtg.-CPAP)1 | | | 6.125 | | | | 04/01/2019 | | | | 1,628,138 | |
| | 30,000 | | | Philadelphia, PA Authority for Industrial Devel. (Philadelphia Airport)1 | | | 5.000 | | | | 07/01/2019 | | | | 29,042 | |
| | 10,000 | | | Philadelphia, PA Authority for Industrial Devel. (Philadelphia Airport)1 | | | 5.125 | | | | 07/01/2020 | | | | 9,763 | |
| | 3,915,000 | | | Philadelphia, PA Authority for Industrial Devel. (Philadelphia Airport)1 | | | 5.125 | | | | 07/01/2028 | | | | 3,588,411 | |
| | 115,000 | | | Philadelphia, PA Authority for Industrial Devel. (Philadelphia Airport)1 | | | 5.250 | | | | 07/01/2028 | | | | 107,037 | |
| | 5,000,000 | | | Philadelphia, PA Authority for Industrial Devel. (Philadelphia Airport), Series A1 | | | 5.400 | | | | 07/01/2022 | | | | 4,938,050 | |
| | 1,640,000 | | | Philadelphia, PA Authority for Industrial Devel. (Richard Allen Prep Charter School)1 | | | 6.250 | | | | 05/01/2033 | | | | 1,284,300 | |
| | 1,370,000 | | | Philadelphia, PA Authority for Industrial Devel. (Stapeley Germantown)1 | | | 5.000 | | | | 01/01/2015 | | | | 1,269,963 | |
| | 1,580,000 | | | Philadelphia, PA Authority for Industrial Devel. (Stapeley Germantown)1 | | | 5.125 | | | | 01/01/2021 | | | | 1,183,515 | |
| | 1,400,000 | | | Philadelphia, PA Authority for Industrial Devel. Senior Living (Arbor House)1 | | | 6.100 | | | | 07/01/2033 | | | | 1,110,256 | |
| | 780,000 | | | Philadelphia, PA Authority for Industrial Devel. Senior Living (GIH/PPAM)1 | | | 5.125 | | | | 07/01/2016 | | | | 705,206 | |
| | 1,240,000 | | | Philadelphia, PA Authority for Industrial Devel. Senior Living (Miriam and Robert M. Rieder House)1 | | | 6.100 | | | | 07/01/2033 | | | | 983,370 | |
| | 3,000,000 | | | Philadelphia, PA Authority for Industrial Devel. Senior Living (Presbyterian Homes Germantown)1 | | | 5.625 | | | | 07/01/2035 | | | | 2,206,530 | |
| | 1,160,000 | | | Philadelphia, PA Authority for Industrial Devel. Senior Living (Robert Saligman House)1 | | | 6.100 | | | | 07/01/2033 | | | | 919,926 | |
| | 25,000 | | | Philadelphia, PA Gas Works1 | | | 5.000 | | | | 07/01/2014 | | | | 25,050 | |
| | 15,000 | | | Philadelphia, PA Gas Works1 | | | 5.000 | | | | 07/01/2026 | | | | 15,004 | |
| | 1,210,000 | | | Philadelphia, PA H&HEFA (Centralized Comprehensive Human Services)1 | | | 7.250 | | | | 01/01/2021 | | | | 1,105,904 | |
| | 60,000 | | | Philadelphia, PA H&HEFA (North Philadelphia Health System)1 | | | 5.375 | | | | 01/01/2028 | | | | 60,084 | |
| | 19,420,000 | | | Philadelphia, PA H&HEFA (Temple University Hospital)1 | | | 5.500 | | | | 07/01/2026 | | | | 16,235,897 | |
F10 | OPPENHEIMER PENNSYLVANIA MUNICIPAL FUND
| | | | | | | | | | | | | | | | | |
| Principal | | | | | | | | | | | | |
| Amount | | | | | Coupon | | | Maturity | | | Value | |
| |
| Pennsylvania Continued | | | | | | | | | | | | |
| $ | 1,000,000 | | | Philadelphia, PA Municipal Authority1 | | | 6.500 | % | | | 04/01/2034 | | | $ | 1,009,880 | |
| | 5,000 | | | Philadelphia, PA New Public Housing Authority1 | | | 5.000 | | | | 04/01/2012 | | | | 5,453 | |
| | 20,000 | | | Philadelphia, PA Parking Authority, Series A1 | | | 5.250 | | | | 02/15/2029 | | | | 19,759 | |
| | 1,000,000 | | | Philadelphia, PA Redevel. Authority (Beech Student Hsg. Complex), Series A1 | | | 5.625 | | | | 07/01/2023 | | | | 725,270 | |
| | 1,500,000 | | | Philadelphia, PA Redevel. Authority (Beech Student Hsg. Complex), Series A1 | | | 5.625 | | | | 07/01/2028 | | | | 1,004,925 | |
| | 170,000 | | | Philadelphia, PA Redevel. Authority (Multifamily Hsg.)1 | | | 5.450 | | | | 02/01/2023 | | | | 177,291 | |
| | 2,580,000 | | | Philadelphia, PA Redevel. Authority (Pavilion Apartments)1 | | | 6.000 | | | | 10/01/2023 | | | | 2,136,472 | |
| | 4,100,000 | | | Philadelphia, PA Redevel. Authority (Pavilion Apartments)1 | | | 6.250 | | | | 10/01/2032 | | | | 3,106,980 | |
| | 9,645,000 | | | Philadelphia, PA Redevel. Authority (Residential Mtg.)1 | | | 4.750 | | | | 12/01/2028 | | | | 8,789,778 | |
| | 10,000 | | | Pittsburgh & Allegheny County, PA Public Auditorium Authority1 | | | 5.000 | | | | 02/01/2024 | | | | 9,818 | |
| | 50,000 | | | Pittsburgh & Allegheny County, PA Public Auditorium Authority1 | | | 5.000 | | | | 02/01/2029 | | | | 48,073 | |
| | 40,000 | | | Pittsburgh & Allegheny County, PA Public Auditorium Authority1 | | | 5.250 | | | | 02/01/2031 | | | | 37,928 | |
| | 3,000,000 | | | Pittsburgh, PA Urban Redevel. Authority (Marian Plaza)1 | | | 6.130 | | | | 01/20/2043 | | | | 2,941,410 | |
| | 20,000 | | | Pittsburgh, PA Urban Redevel. Authority, Series A1 | | | 5.200 | | | | 10/01/2020 | | | | 20,059 | |
| | 30,000 | | | Pittsburgh, PA Urban Redevel. Authority, Series A1 | | | 5.250 | | | | 10/01/2029 | | | | 29,594 | |
| | 775,000 | | | Pittsburgh, PA Urban Redevel. Authority, Series A1 | | | 6.250 | | | | 10/01/2028 | | | | 781,944 | |
| | 10,000 | | | Pittsburgh, PA Urban Redevel. Authority, Series A1 | | | 7.250 | | | | 02/01/2024 | | | | 10,011 | |
| | 40,000 | | | Pittsburgh, PA Urban Redevel. Authority, Series B1 | | | 5.350 | | | | 10/01/2022 | | | | 40,298 | |
| | 60,000 | | | Pittsburgh, PA Urban Redevel. Authority, Series C1 | | | 5.600 | | | | 04/01/2020 | | | | 60,025 | |
| | 25,000 | | | Pittsburgh, PA Urban Redevel. Authority, Series C1 | | | 5.700 | | | | 04/01/2030 | | | | 25,002 | |
| | 35,000 | | | Pittsburgh, PA Urban Redevel. Authority, Series C1 | | | 5.900 | | | | 10/01/2022 | | | | 35,049 | |
| | 750,000 | | | Pittsburgh, PA Urban Redevel. Authority, Series C1 | | | 5.950 | | | | 10/01/2029 | | | | 750,473 | |
| | 5,000 | | | Pittsburgh, PA Urban Redevel. Authority, Series C1 | | | 7.125 | | | | 08/01/2013 | | | | 5,009 | |
| | 30,000 | | | Potter County, PA Hospital Authority (Charles Cole Memorial Hospital)1 | | | 5.250 | | | | 08/01/2028 | | | | 25,278 | |
| | 120,000 | | | Potter County, PA Hospital Authority (Charles Cole Memorial Hospital)1 | | | 6.050 | | | | 08/01/2024 | | | | 119,056 | |
| | 1,000,000 | | | Pottsville, PA Hospital Authority (Pottsville Hospital & Warne Clinic)1 | | | 5.500 | | | | 07/01/2018 | | | | 867,750 | |
| | 390,000 | | | Pottsville, PA Hospital Authority (Pottsville Hospital & Warne Clinic)1 | | | 5.500 | | | | 07/01/2018 | | | | 338,423 | |
| | 4,170,000 | | | Pottsville, PA Hospital Authority (Pottsville Hospital & Warne Clinic)1 | | | 5.625 | | | | 07/01/2024 | | | | 3,284,709 | |
| | 235,000 | | | Pottsville, PA Hospital Authority (Pottsville Hospital & Warne Clinic)1 | | | 5.625 | | | | 07/01/2024 | | | | 185,110 | |
F11 | OPPENHEIMER PENNSYLVANIA MUNICIPAL FUND
STATEMENT OF INVESTMENTS Continued
| | | | | | | | | | | | | | | | | |
| Principal | | | | | | | | | | | | |
| Amount | | | | | Coupon | | | Maturity | | | Value | |
| |
| Pennsylvania Continued | | | | | | | | | | | | |
| $ | 10,000 | | | Schuylkill County, PA IDA (DOCNHS/BSVHS/WMHS Obligated Group)1 | | | 5.000 | % | | | 11/01/2028 | | | $ | 10,002 | |
| | 2,100,000 | | | Scranton, PA Parking Authority1 | | | 5.250 | | | | 06/01/2034 | | | | 1,738,170 | |
| | 8,500,000 | | | Scranton, PA Parking Authority1 | | | 5.250 | | | | 06/01/2039 | | | | 6,859,925 | |
| | 145,000 | | | Scranton, PA School District1 | | | 5.000 | | | | 04/01/2022 | | | | 146,069 | |
| | 5,000 | | | Sharon, PA Regional Health System Authority (SRPS/ SRHS Obligated Group)1 | | | 5.000 | | | | 12/01/2028 | | | | 4,385 | |
| | 245,000 | | | South Fork, PA Municipal Authority (Conemaugh Valley Memorial Hospital)1 | | | 5.000 | | | | 07/01/2028 | | | | 207,669 | |
| | 5,000 | | | South Fork, PA Municipal Authority (Conemaugh Valley Memorial Hospital)1 | | | 5.375 | | | | 07/01/2022 | | | | 4,713 | |
| | 355,000 | | | South Fork, PA Municipal Authority (Good Samaritan Medical Center of Johnstown)1 | | | 5.250 | | | | 07/01/2026 | | | | 318,918 | |
| | 15,000 | | | South Fork, PA Municipal Authority (Good Samaritan Medical Center of Johnstown)1 | | | 5.375 | | | | 07/01/2016 | | | | 15,035 | |
| | 100,000 | | | Susquehanna, PA Area Regional Airport Authority1 | | | 5.000 | | | | 01/01/2028 | | | | 82,343 | |
| | 45,000 | | | Susquehanna, PA Area Regional Airport Authority1 | | | 5.000 | | | | 01/01/2033 | | | | 34,327 | |
| | 140,000 | | | Susquehanna, PA Area Regional Airport Authority1 | | | 5.375 | | | | 01/01/2018 | | | | 116,875 | |
| | 4,300,000 | | | Susquehanna, PA Area Regional Airport Authority1 | | | 6.500 | | | | 01/01/2038 | | | | 3,674,350 | |
| | 1,000,000 | | | Susquehanna, PA Area Regional Airport Authority (Aero Harrisburg)1 | | | 5.500 | | | | 01/01/2024 | | | | 691,440 | |
| | 15,000 | | | Union County, PA Hospital Authority (United Methodist Continuing Care Services)1 | | | 6.250 | | | | 04/01/2012 | | | | 14,763 | |
| | 75,000 | | | Washington County, PA Hospital Authority (Washington Hospital)1 | | | 5.125 | | | | 07/01/2028 | | | | 63,142 | |
| | 8,000,000 | | | Washington County, PA Redevel. Authority (Victory Centre)1 | | | 5.450 | | | | 07/01/2035 | | | | 4,709,280 | |
| | 550,000 | | | Washington, PA Township Municipal Authority1 | | | 5.875 | | | | 12/15/2023 | | | | 418,303 | |
| | 2,475,000 | | | Washington, PA Township Municipal Authority1 | | | 6.000 | | | | 12/15/2033 | | | | 1,901,171 | |
| | 1,085,000 | | | Westmoreland County, PA IDA (Redstone Retirement Community)1 | | | 5.875 | | | | 01/01/2032 | | | | 788,979 | |
| | 35,000 | | | Westmoreland County, PA Redevel. Authority (Harmon House)1 | | | 5.400 | | | | 06/20/2028 | | | | 35,160 | |
| | 5,000,000 | | | Wilkes-Barre, PA Finance Authority (Wilkes University)1 | | | 5.000 | | | | 03/01/2027 | | | | 4,300,350 | |
| | 5,000,000 | | | Wilkes-Barre, PA Finance Authority (Wilkes University)1 | | | 5.000 | | | | 03/01/2037 | | | | 3,921,450 | |
| | 10,000 | | | York County, PA IDA (PSEG Power)1 | | | 5.500 | | | | 09/01/2020 | | | | 10,088 | |
| | 5,000 | | | York, PA Hsg. Corp. Mtg., Series A1 | | | 6.875 | | | | 11/01/2009 | | | | 5,016 | |
| | | | | | | | | | | | | | | | |
| | | | | | | | | | | | | | | | 933,090,726 | |
F12 | OPPENHEIMER PENNSYLVANIA MUNICIPAL FUND
| | | | | | | | | | | | | | | | | |
| Principal | | | | | | | | | | | | |
| Amount | | | | | Coupon | | | Maturity | | | Value | |
| |
| U.S. Possessions—31.8% | | | | | | | | | | | | |
| $ | 45,000 | | | Guam GO1 | | | 5.375 | % | | | 11/15/2013 | | | $ | 42,931 | |
| | 750,000 | | | Guam GO1 | | | 6.750 | | | | 11/15/2029 | | | | 753,930 | |
| | 1,000,000 | | | Guam GO1 | | | 7.000 | | | | 11/15/2039 | | | | 1,003,120 | |
| | 700,000 | | | Guam Hsg. Corp. (Single Family Mtg.)1 | | | 5.750 | | | | 09/01/2031 | | | | 722,176 | |
| | 4,325,000 | | | Guam Tobacco Settlement Economic Devel. & Commerce Authority (TASC)1 | | | 5.250 | | | | 06/01/2032 | | | | 3,219,487 | |
| | 1,500,000 | | | Guam Tobacco Settlement Economic Devel. & Commerce Authority (TASC)1 | | | 5.625 | | | | 06/01/2047 | | | | 1,066,830 | |
| | 38,902,000 | | | Guam Tobacco Settlement Economic Devel. & Commerce Authority (TASC) | | | 7.250 | 7 | | | 06/01/2057 | | | | 300,712 | |
| | 1,000,000 | | | Northern Mariana Islands Commonwealth, Series A1 | | | 5.000 | | | | 06/01/2017 | | | | 888,740 | |
| | 1,000,000 | | | Northern Mariana Islands Commonwealth, Series A1 | | | 5.000 | | | | 10/01/2022 | | | | 813,790 | |
| | 600,000 | | | Northern Mariana Islands Commonwealth, Series A1 | | | 6.750 | | | | 10/01/2033 | | | | 542,286 | |
| | 2,610,000 | | | Northern Mariana Islands Ports Authority, Series A1 | | | 5.500 | | | | 03/15/2031 | | | | 1,735,102 | |
| | 1,855,000 | | | Northern Mariana Islands Ports Authority, Series A | | | 6.250 | | | | 03/15/2028 | | | | 1,236,599 | |
| | 1,280,000 | | | Northern Mariana Islands Ports Authority, Series A1 | | | 6.600 | | | | 03/15/2028 | | | | 1,037,338 | |
| | 4,500,000 | | | Puerto Rico Aqueduct & Sewer Authority1 | | | 0.000 | 8 | | | 07/01/2024 | | | | 3,614,490 | |
| | 3,145,000 | | | Puerto Rico Aqueduct & Sewer Authority1 | | | 6.000 | | | | 07/01/2044 | | | | 3,051,027 | |
| | 29,080,000 | | | Puerto Rico Children’s Trust Fund (TASC)1 | | | 5.375 | | | | 05/15/2033 | | | | 25,608,139 | |
| | 88,895,000 | | | Puerto Rico Children’s Trust Fund (TASC)1 | | | 5.500 | | | | 05/15/2039 | | | | 63,788,385 | |
| | 68,835,000 | | | Puerto Rico Children’s Trust Fund (TASC)1 | | | 5.625 | | | | 05/15/2043 | | | | 49,230,792 | |
| | 457,500,000 | | | Puerto Rico Children’s Trust Fund (TASC) | | | 6.432 | 7 | | | 05/15/2050 | | | | 10,142,775 | |
| | 136,000,000 | | | Puerto Rico Children’s Trust Fund (TASC) | | | 7.325 | 7 | | | 05/15/2055 | | | | 1,587,120 | |
| | 1,817,000,000 | | | Puerto Rico Children’s Trust Fund (TASC) | | | 7.625 | 7 | | | 05/15/2057 | | | | 17,461,370 | |
| | 1,725,000 | | | Puerto Rico Commonwealth GO1 | | | 6.000 | | | | 07/01/2038 | | | | 1,665,298 | |
| | 13,300,000 | | | Puerto Rico Electric Power Authority, Series UU1 | | | 1.080 | 3 | | | 07/01/2025 | | | | 6,593,475 | |
| | 31,890,000 | | | Puerto Rico Electric Power Authority, Series UU1 | | | 1.100 | 3 | | | 07/01/2031 | | | | 15,681,908 | |
| | 25,000 | | | Puerto Rico Highway & Transportation Authority, Series A1 | | | 5.000 | | | | 07/01/2038 | | | | 20,813 | |
| | 445,000 | | | Puerto Rico Highway & Transportation Authority, Series AA1 | | | 5.000 | | | | 07/01/2035 | | | | 373,537 | |
| | 325,000 | | | Puerto Rico Highway & Transportation Authority, Series H1 | | | 5.000 | | | | 07/01/2028 | | | | 281,570 | |
| | 2,750,000 | | | Puerto Rico Highway & Transportation Authority, Series K1 | | | 5.000 | | | | 07/01/2027 | | | | 2,393,160 | |
| | 4,000,000 | | | Puerto Rico Highway & Transportation Authority, Series K1 | | | 5.000 | | | | 07/01/2030 | | | | 3,437,280 | |
| | 700,000 | | | Puerto Rico Highway & Transportation Authority, Series N1 | | | 5.250 | | | | 07/01/2039 | | | | 604,884 | |
| | 2,105,000 | | | Puerto Rico IMEPCF (American Airlines) | | | 6.450 | | | | 12/01/2025 | | | | 846,610 | |
F13 | OPPENHEIMER PENNSYLVANIA MUNICIPAL FUND
STATEMENT OF INVESTMENTS Continued
| | | | | | | | | | | | | | | | | |
| Principal | | | | | | | | | | | | |
| Amount | | | | | Coupon | | | Maturity | | | Value | |
| |
| U.S. Possessions Continued | | | | | | | | | | | | |
| $ | 12,000,000 | | | Puerto Rico Infrastructure1 | | | 5.000 | % | | | 07/01/2041 | | | $ | 9,603,120 | |
| | 700,000 | | | Puerto Rico Infrastructure (Mepsi Campus)1 | | | 6.500 | | | | 10/01/2037 | | | | 572,138 | |
| | 650,000 | | | Puerto Rico ITEMECF (Ana G. Mendez University)1 | | | 5.000 | | | | 03/01/2036 | | | | 456,794 | |
| | 235,000 | | | Puerto Rico ITEMECF (Ana G. Mendez University)1 | | | 5.375 | | | | 02/01/2019 | | | | 211,465 | |
| | 500,000 | | | Puerto Rico ITEMECF (Ana G. Mendez University)1 | | | 5.375 | | | | 02/01/2029 | | | | 396,130 | |
| | 790,000 | | | Puerto Rico ITEMECF (IEP/HESL/HECR Obligated Group)1 | | | 5.750 | | | | 06/01/2019 | | | | 393,973 | |
| | 26,535,000 | | | Puerto Rico Port Authority (American Airlines), Series A | | | 6.250 | | | | 06/01/2026 | | | | 10,673,969 | |
| | 1,170,000 | | | Puerto Rico Port Authority (American Airlines), Series A | | | 6.300 | | | | 06/01/2023 | | | | 470,551 | |
| | 75,000 | | | Puerto Rico Port Authority, Series D1 | | | 7.000 | | | | 07/01/2014 | | | | 75,144 | |
| | 1,000,000 | | | Puerto Rico Public Buildings Authority1 | | | 6.500 | | | | 07/01/2030 | | | | 1,007,190 | |
| | 1,000,000 | | | Puerto Rico Public Buildings Authority1 | | | 6.750 | | | | 07/01/2036 | | | | 1,017,260 | |
| | 1,015,000 | | | Puerto Rico Public Buildings Authority, Series D1 | | | 5.250 | | | | 07/01/2036 | | | | 853,514 | |
| | 10,500,000 | | | Puerto Rico Sales Tax Financing Corp., Series A1 | | | 6.125 | | | | 08/01/2029 | | | | 10,783,710 | |
| | 32,485,000 | | | Puerto Rico Sales Tax Financing Corp., Series A | | | 7.280 | 7 | | | 08/01/2034 | | | | 5,958,724 | |
| | 22,130,000 | | | Puerto Rico Sales Tax Financing Corp., Series C6 | | | 5.750 | | | | 08/01/2057 | | | | 22,688,482 | |
| | 1,075,000 | | | University of Puerto Rico, Series Q1 | | | 5.000 | | | | 06/01/2030 | | | | 918,448 | |
| | 6,645,000 | | | V.I. Government Refinery Facilities (Hovensa Coker)1 | | | 6.500 | | | | 07/01/2021 | | | | 6,609,183 | |
| | 25,000 | | | V.I. Public Finance Authority (Gross Receipts Taxes Loan)1 | | | 5.000 | | | | 10/01/2031 | | | | 21,249 | |
| | 4,000,000 | | | V.I. Public Finance Authority (Hovensa Coker)1 | | | 6.500 | | | | 07/01/2021 | | | | 3,978,440 | |
| | 8,500,000 | | | V.I. Public Finance Authority (Hovensa Refinery)1 | | | 4.700 | | | | 07/01/2022 | | | | 7,035,705 | |
| | 1,500,000 | | | V.I. Public Finance Authority (Hovensa Refinery)1 | | | 5.875 | | | | 07/01/2022 | | | | 1,410,690 | |
| | 5,000,000 | | | V.I. Public Finance Authority (Hovensa Refinery)1 | | | 6.125 | | | | 07/01/2022 | | | | 4,810,050 | |
| | 17,450,000 | | | V.I. Tobacco Settlement Financing Corp. | | | 6.250 | 7 | | | 05/15/2035 | | | | 1,419,383 | |
| | 2,195,000 | | | V.I. Tobacco Settlement Financing Corp. | | | 6.500 | 7 | | | 05/15/2035 | | | | 159,489 | |
| | 4,150,000 | | | V.I. Tobacco Settlement Financing Corp. | | | 6.875 | 7 | | | 05/15/2035 | | | | 255,308 | |
| | 7,000,000 | | | V.I. Tobacco Settlement Financing Corp. | | | 7.625 | 7 | | | 05/15/2035 | | | | 371,070 | |
| | 30,000 | | | V.I. Tobacco Settlement Financing Corp. (TASC)1 | | | 5.000 | | | | 05/15/2021 | | | | 26,354 | |
| | 2,235,000 | | | V.I. Tobacco Settlement Financing Corp. (TASC)1 | | | 5.000 | | | | 05/15/2031 | | | | 1,706,110 | |
| | 435,000 | | | V.I. Water & Power Authority, Series A1 | | | 5.000 | | | | 07/01/2031 | | | | 370,098 | |
| | | | | | | | | | | | | | | | |
| | | | | | | | | | | | | | | | 313,999,415 | |
| | | | | | | | | | | | | | | | | |
| Total Investments, at Value (Cost $1,467,492,491)—126.2% | | | | | | | 1,247,090,141 | |
| Liabilities in Excess of Other Assets—(26.2) | | | | | | | (258,809,717 | ) |
| | | | | | | | | | | | | | | | |
| Net Assets—100.0% | | | | | | $ | 988,280,424 | |
| | | | | | | | | | | | | | | | |
F14 | OPPENHEIMER PENNSYLVANIA MUNICIPAL FUND
Footnotes to Statement of Investments
| | |
| 1. | | All or a portion of the security has been segregated for collateral to cover borrowings. See Note 6 of accompanying Notes. |
| |
| 2. | | Illiquid security. The aggregate value of illiquid securities as of July 31, 2009 was $17,290,051, which represents 1.75% of the Fund’s net assets. See Note 5 of accompanying Notes. |
| |
| 3. | | Represents the current interest rate for a variable or increasing rate security. |
| |
| 4. | | Issue is in default. See Note 1 of accompanying Notes. |
| |
| 5. | | Non-income-accruing security. |
| |
| 6. | | Security represents the underlying municipal bond on an inverse floating rate security. The bond was purchased by the Fund and subsequently segregated and transferred to a trust. See Note 1 of accompanying Notes. |
| |
| 7. | | Zero coupon bond reflects effective yield on the date of purchase. |
| |
| 8. | | Denotes a step bond: a zero coupon bond that converts to a fixed or variable interest rate at a designated future date. |
Valuation Inputs
Various data inputs are used in determining the value of each of the Fund’s investments as of the reporting period end. These data inputs are categorized in the following hierarchy under applicable financial accounting standards:
| | 1) | | Level 1—unadjusted quoted prices in active markets for identical assets or liabilities (including securities actively traded on a securities exchange) |
| |
| | 2) | | Level 2—inputs other than unadjusted quoted prices that are observable for the asset (such as unadjusted quoted prices for similar assets and market corroborated inputs such as interest rates, prepayment speeds, credit risks, etc.) |
| |
| | 3) | | Level 3—significant unobservable inputs (including the Manager’s own judgments about assumptions that market participants would use in pricing the asset). |
The table below categorizes amounts that are included in the Fund’s Statement of Assets and Liabilities as of July 31, 2009 based on valuation input level:
| | | | | | | | | | | | | | | | | |
| | | | | | | | | | | Level 3— | | | | |
| | | Level 1— | | | Level 2— | | | Significant | | | | |
| | | Unadjusted | | | Other Significant | | | Unobservable | | | | |
| | | Quoted Prices | | | Observable Inputs | | | Inputs | | | Value | |
| |
Assets Table | | | | | | | | | | | | | | | | |
Investments, at Value: | | | | | | | | | | | | | | | | |
| Municipal Bonds and Notes | | | | | | | | | | | | | | | | |
| Pennsylvania | | $ | — | | | $ | 933,090,726 | | | $ | — | | | $ | 933,090,726 | |
| U.S. Possessions | | | — | | | | 313,999,415 | | | | — | | | | 313,999,415 | |
| | | |
| Total Assets | | $ | — | | | $ | 1,247,090,141 | | | $ | — | | | $ | 1,247,090,141 | |
| | | |
Currency contracts and forwards, if any, are reported at their unrealized appreciation/depreciation at measurement date, which represents the change in the contract’s value from trade date. Futures, if any, are reported at their variation margin at measurement date, which represents the amount due to/from the Fund at that date. All additional assets and liabilities included in the above table are reported at their market value at measurement date.
See the accompanying Notes for further discussion of the methods used in determining value of the Fund’s investments, and a summary of changes to the valuation techniques, if any, during the reporting period.
F15 | OPPENHEIMER PENNSYLVANIA MUNICIPAL FUND
STATEMENT OF INVESTMENTS Continued
Footnotes to Statement of Investments Continued
To simplify the listings of securities, abbreviations are used per the table below:
| | | |
| ACTS | | Adult Communities Total Services |
| ARC | | Assoc. of Retarded Citizens |
| AUS | | Allegheny United Hospital |
| BSVHS | | Baptist/St. Vincent’s Health System |
| CCMC | | Crozer-Chester Medical Center |
| CKHS | | Crozer-Keystone Health System |
| COP | | Certificates of Participation |
| CPAP | | Crime Prevention Assoc. of Philadelphia |
| DCMH | | Delaware County Memorial Hospital |
| DOCNHS | | Daughters of Charity National Health Systems |
| DPH | | Divine Providence Hospital |
| DRIVERS | | Derivative Inverse Tax Exempt Receipts |
| EDFA | | Economic Devel. Finance Authority |
| GIH | | Germantown Interfaith Housing |
| GO | | General Obligation |
| GPA | | General Purpose Authority |
| H&EFA | | Health and Educational Facilities Authority |
| H&HEFA | | Hospitals and Higher Education Facilities Authority |
| HDA | | Hospital Devel. Authority |
| HEBA | | Higher Education Building Authority |
| HECR | | Hospital Episcopal Cristo Redentor |
| HEFA | | Higher Education Facilities Authority |
| HEHA | | Higher Education and Health Authority |
| HESL | | Hospital Episcopal San Lucas |
| HFA | | Housing Finance Agency |
| HUHS | | Hahnemann University Hospital System |
| IDA | | Industrial Devel. Agency |
| IEP | | Iglesia Episcopal Puertorriquena |
| IMEPCF | | Industrial, Medical and Environmental Pollution Control Facilities |
| ITEMECF | | Industrial, Tourist, Educational, Medical and Environmental Community Facilities |
| MAS | | Mercy Adult Services |
| MCMCSPA | | Mercy Catholic Medical Center of Southeastern Pennsylvania |
| MCP | | Medical College Of Pennsylvania |
| MHH | | Mercy Haverford Hospital |
| MHP | | Mercy Health Plan |
| MHSSPA | | Mercy Health System of Southeastern Pennsylvania |
| MVH | | Muncy Valley Hospital |
| NCPHS | | North Central Pennsylvania Health System |
| PPAM | | Philadelphia Presbytery Apartments of Morrisville |
| PSEG | | Public Service Enterprise Group |
| ROLs | | Residual Option Longs |
| RR | | Residential Resources |
| RRDC | | Residential Resources Devel. Corp. |
| RRSW | | Residential Resources Southwest |
| SRHS | | Sharon Regional Health System |
| SRPS | | Sharon Regional Physicians Services |
| TASC | | Tobacco Settlement Asset-Backed Bonds |
| UPMC | | University of Pittsburgh Medical Center |
| V.I. | | United States Virgin Islands |
| WH | | Williamsport Hospital |
| WMHS | | Western Maryland Health Systems |
See accompanying Notes to Financial Statements.
F16 | OPPENHEIMER PENNSYLVANIA MUNICIPAL FUND
STATEMENT OF ASSETS AND LIABILITIES July 31, 2009
| | | | | |
Assets | | | | |
| Investments, at value (cost $1,467,492,491)—see accompanying statement of investments | | $ | 1,247,090,141 | |
| Cash | | | 641,221 | |
| Receivables and other assets: | | | | |
| Interest | | | 15,920,598 | |
| Investments sold | | | 6,879,595 | |
| Shares of beneficial interest sold | | | 1,637,382 | |
| Other | | | 1,338,774 | |
| | | | |
| Total assets | | | 1,273,507,711 | |
| | | | | |
Liabilities | | | | |
| Payables and other liabilities: | | | | |
| Payable for short-term floating rate notes issued (See Note 1) | | | 203,865,000 | |
| Payable on borrowings (See Note 6) | | | 78,500,000 | |
| Shares of beneficial interest redeemed | | | 1,655,062 | |
| Dividends | | | 583,346 | |
| Trustees’ compensation | | | 145,346 | |
| Distribution and service plan fees | | | 122,325 | |
| Transfer and shareholder servicing agent fees | | | 51,246 | |
| Shareholder communications | | | 43,369 | |
| Interest expense on borrowings | | | 35,277 | |
| Other | | | 226,316 | |
| | | | |
| Total liabilities | | | 285,227,287 | |
| | | | | |
Net Assets | | $ | 988,280,424 | |
| | | | |
| | | | | |
Composition of Net Assets | | | | |
| Paid-in capital | | $ | 1,329,770,367 | |
| Accumulated net investment income | | | 7,840,576 | |
| Accumulated net realized loss on investments | | | (128,928,169 | ) |
| Net unrealized depreciation on investments | | | (220,402,350 | ) |
| | | | |
Net Assets | | $ | 988,280,424 | |
| | | | |
F17 | OPPENHEIMER PENNSYLVANIA MUNICIPAL FUND
STATEMENT OF ASSETS AND LIABILITIES Continued
| | | | | |
Net Asset Value Per Share | | | | |
| | |
| Class A Shares: | | | | |
| Net asset value and redemption price per share (based on net assets of $675,030,831 and 72,718,255 shares of beneficial interest outstanding) | | $ | 9.28 | |
| Maximum offering price per share (net asset value plus sales charge of 4.75% of offering price) | | $ | 9.74 | |
| | | | | |
| Class B Shares: | | | | |
| Net asset value, redemption price (excludes applicable contingent deferred sales charge) and offering price per share (based on net assets of $69,650,482 and 7,506,405 shares of beneficial interest outstanding) | | $ | 9.28 | |
| | | | | |
| Class C Shares: | | | | |
| Net asset value, redemption price (excludes applicable contingent deferred sales charge) and offering price per share (based on net assets of $243,599,111 and 26,285,423 shares of beneficial interest outstanding) | | $ | 9.27 | |
See accompanying Notes to Financial Statements.
F18 | OPPENHEIMER PENNSYLVANIA MUNICIPAL FUND
STATEMENT OF OPERATIONS For the Year Ended July 31, 2009
| | | | | |
Investment Income | | | | |
| Interest | | $ | 90,855,163 | |
| Other income | | | 678 | |
| | | | |
| Total investment income | | | 90,855,841 | |
| | | | | |
Expenses | | | | |
| Management fees | | | 4,637,880 | |
| Distribution and service plan fees: | | | | |
| Class A | | | 951,978 | |
| Class B | | | 708,985 | |
| Class C | | | 2,044,504 | |
| Transfer and shareholder servicing agent fees: | | | | |
| Class A | | | 333,391 | |
| Class B | | | 92,493 | |
| Class C | | | 167,470 | |
| Shareholder communications: | | | | |
| Class A | | | 43,426 | |
| Class B | | | 16,792 | |
| Class C | | | 27,957 | |
| Borrowing fees | | | 6,371,193 | |
| Interest expense and fees on short-term floating rate notes issued (See Note 1) | | | 4,635,960 | |
| Interest expense on borrowings | | | 1,895,819 | |
| Trustees’ compensation | | | 41,906 | |
| Custodian fees and expenses | | | 11,283 | |
| Other | | | 164,211 | |
| | | | |
| Total expenses | | | 22,145,248 | |
| Less reduction to custodian expenses | | | (68 | ) |
| | | | |
| Net expenses | | | 22,145,180 | |
| |
Net Investment Income | | | 68,710,661 | |
| | | | | |
Realized and Unrealized Loss | | | | |
| Net realized loss on investments | | | (101,498,274 | ) |
| Net change in unrealized depreciation on investments | | | (108,702,389 | ) |
| |
Net Decrease in Net Assets Resulting from Operations | | $ | (141,490,002 | ) |
| | | | |
See accompanying Notes to Financial Statements.
F19 | OPPENHEIMER PENNSYLVANIA MUNICIPAL FUND
STATEMENTS OF CHANGES IN NET ASSETS
| | | | | | | | | |
| Year Ended July 31, | | 2009 | | | 2008 | |
| |
Operations | | | | | | | | |
| Net investment income | | $ | 68,710,661 | | | $ | 65,866,742 | |
| Net realized loss | | | (101,498,274 | ) | | | (28,869,031 | ) |
| Net change in unrealized depreciation | | | (108,702,389 | ) | | | (154,646,743 | ) |
| | | |
| Net decrease in net assets resulting from operations | | | (141,490,002 | ) | | | (117,649,032 | ) |
| | | | | | | | | |
Dividends and/or Distributions to Shareholders | | | | | | | | |
| Dividends from net investment income: | | | | | | | | |
| Class A | | | (44,125,525 | ) | | | (42,432,302 | ) |
| Class B | | | (4,766,155 | ) | | | (6,216,699 | ) |
| Class C | | | (13,920,491 | ) | | | (13,133,368 | ) |
| | | |
| | | | (62,812,171 | ) | | | (61,782,369 | ) |
| | | | | | | | | |
Beneficial Interest Transactions | | | | | | | | |
| Net increase (decrease) in net assets resulting from beneficial interest transactions: | | | | | | | | |
| Class A | | | (5,248,673 | ) | | | 65,431,917 | |
| Class B | | | (29,668,556 | ) | | | (39,865,791 | ) |
| Class C | | | (256,208 | ) | | | 11,416,068 | |
| | | |
| | | | (35,173,437 | ) | | | 36,982,194 | |
| | | | | | | | | |
Net Assets | | | | | | | | |
| Total decrease | | | (239,475,610 | ) | | | (142,449,207 | ) |
| Beginning of period | | | 1,227,756,034 | | | | 1,370,205,241 | |
| | | |
| |
| End of period (including accumulated net investment income of $7,840,576 and $4,639,350, respectively) | | $ | 988,280,424 | | | $ | 1,227,756,034 | |
| | | |
See accompanying Notes to Financial Statements.
F20 | OPPENHEIMER PENNSYLVANIA MUNICIPAL FUND
STATEMENT OF CASH FLOWS For the Year Ended July 31, 2009
| | | | | |
Cash Flows from Operating Activities | | | | |
| Net decrease in net assets from operations | | $ | (141,490,002 | ) |
| Adjustments to reconcile net decrease in net assets from operations to net cash provided by operating activities: | | | | |
| Purchase of investment securities | | | (330,459,638 | ) |
| Proceeds from disposition of investment securities | | | 323,960,465 | |
| Short-term investment securities, net | | | 48,794,872 | |
| Premium amortization | | | 1,724,889 | |
| Discount accretion | | | (10,580,865 | ) |
| Net realized loss on investments | | | 101,498,274 | |
| Net change in unrealized depreciation on investments | | | 108,702,389 | |
| Decrease in interest receivable | | | 451,261 | |
| Increase in receivable for securities sold | | | (2,058,101 | ) |
| Increase in other assets | | | (1,220,353 | ) |
| Decrease in payable for securities purchased | | | (2,827,688 | ) |
| Increase in payable for accrued expenses | | | 42,312 | |
| | | | |
| Net cash provided by operating activities | | | 96,537,815 | |
| | | | | |
Cash Flows from Financing Activities | | | | |
| Proceeds from bank borrowings | | | 566,700,000 | |
| Payments on bank borrowings | | | (533,300,000 | ) |
| Payments on short-term floating rate notes issued | | | (29,355,000 | ) |
| Proceeds from shares sold | | | 191,443,762 | |
| Payments on shares redeemed | | | (269,018,972 | ) |
| Cash distributions paid | | | (22,804,350 | ) |
| | | | |
| Net cash used in financing activities | | | (96,334,560 | ) |
| Net increase in cash | | | 203,255 | |
| Cash, beginning balance | | | 437,966 | |
| | | | |
| Cash, ending balance | | $ | 641,221 | |
| | | | |
Supplemental disclosure of cash flow information:
Noncash financing activities not included herein consist of reinvestment of dividends and distributions of $40,822,448.
Cash paid for interest on bank borrowings—$1,934,727.
Cash paid for interest on short-term floating rate notes issued—$4,635,960.
See accompanying Notes to Financial Statements.
F21 | OPPENHEIMER PENNSYLVANIA MUNICIPAL FUND
FINANCIAL HIGHLIGHTS
| | | | | | | | | | | | | | | | | | | | | |
| Class A Year Ended July 31, | | 2009 | | | 2008 | | | 2007 | | | 2006 | | | 2005 | |
| |
Per Share Operating Data | | | | | | | | | | | | | | | | | | | | |
| Net asset value, beginning of period | | $ | 11.12 | | | $ | 12.77 | | | $ | 12.75 | | | $ | 12.85 | | | $ | 11.76 | |
| |
| Income (loss) from investment operations: | | | | | | | | | | | | | | | | | | | | |
Net investment income1 | | | .69 | | | | .64 | | | | .59 | | | | .62 | | | | .67 | |
| Net realized and unrealized gain (loss) | | | (1.90 | ) | | | (1.69 | ) | | | .02 | | | | (.10 | ) | | | 1.10 | |
| | | |
| Total from investment operations | | | (1.21 | ) | | | (1.05 | ) | | | .61 | | | | .52 | | | | 1.77 | |
| |
| Dividends and/or distributions to shareholders: | | | | | | | | | | | | | | | | | | | | |
| Dividends from net investment income | | | (.63 | ) | | | (.60 | ) | | | (.59 | ) | | | (.62 | ) | | | (.68 | ) |
| |
| Net asset value, end of period | | $ | 9.28 | | | $ | 11.12 | | | $ | 12.77 | | | $ | 12.75 | | | $ | 12.85 | |
| | | |
| | | | | | | | | | | | | | | | | | | | | |
Total Return, at Net Asset Value2 | | | (10.41 | )% | | | (8.42 | )% | | | 4.81 | % | | | 4.21 | % | | | 15.43 | % |
| | | | | | | | | | | | | | | | | | | | | |
Ratios/Supplemental Data | | | | | | | | | | | | | | | | | | | | |
| Net assets, end of period (in thousands) | | $ | 675,031 | | | $ | 816,645 | | | $ | 868,070 | | | $ | 600,716 | | | $ | 384,863 | |
| |
| Average net assets (in thousands) | | $ | 640,109 | | | $ | 847,089 | | | $ | 747,558 | | | $ | 484,153 | | | $ | 295,002 | |
| |
Ratios to average net assets:3 | | | | | | | | | | | | | �� | | | | | | | |
| Net investment income | | | 7.53 | % | | | 5.33 | % | | | 4.57 | % | | | 4.88 | % | | | 5.35 | % |
| Expenses excluding interest and fees on short-term floating rate notes issued | | | 1.60 | % | | | 0.81 | % | | | 0.74 | % | | | 0.82 | % | | | 0.81 | % |
Interest and fees on short-term floating rate notes issued4 | | | 0.49 | % | | | 0.60 | % | | | 0.61 | % | | | 0.59 | % | | | 0.40 | % |
| | | |
| Total expenses | | | 2.09 | %5 | | | 1.41 | %5 | | | 1.35 | %5 | | | 1.41 | % | | | 1.21 | %5 |
| |
| Portfolio turnover rate | | | 30 | % | | | 51 | % | | | 4 | % | | | 19 | % | | | 14 | % |
| | |
| 1. | | Per share amounts calculated based on the average shares outstanding during the period. |
| |
| 2. | | Assumes an investment on the business day before the first day of the fiscal period, with all dividends and distributions reinvested in additional shares on the reinvestment date, and redemption at the net asset value calculated on the last business day of the fiscal period. Sales charges are not reflected in the total returns. Total returns are not annualized for periods less than one full year. Returns do not reflect the deduction of taxes that a shareholder would pay on fund distributions or the redemption of fund shares. |
| |
| 3. | | Annualized for periods less than one full year. |
| |
| 4. | | Interest and fee expense relates to the Fund’s liability for short-term floating rate notes issued in conjunction with inverse floating rate security transactions. |
| |
| 5. | | Reduction to custodian expenses less than 0.005%. |
See accompanying Notes to Financial Statements.
F22 | OPPENHEIMER PENNSYLVANIA MUNICIPAL FUND
| | | | | | | | | | | | | | | | | | | | | |
| Class B Year Ended July 31, | | 2009 | | | 2008 | | | 2007 | | | 2006 | | | 2005 | |
| |
Per Share Operating Data | | | | | | | | | | | | | | | | | | | | |
| Net asset value, beginning of period | | $ | 11.12 | | | $ | 12.76 | | | $ | 12.75 | | | $ | 12.85 | | | $ | 11.76 | |
| |
| Income (loss) from investment operations: | | | | | | | | | | | | | | | | | | | | |
Net investment income1 | | | .60 | | | | .54 | | | | .49 | | | | .53 | | | | .57 | |
| Net realized and unrealized gain (loss) | | | (1.89 | ) | | | (1.68 | ) | | | .01 | | | | (.10 | ) | | | 1.11 | |
| | | |
| Total from investment operations | | | (1.29 | ) | | | (1.14 | ) | | | .50 | | | | .43 | | | | 1.68 | |
| |
| Dividends and/or distributions to shareholders: | | | | | | | | | | | | | | | | | | | | |
| Dividends from net investment income | | | (.55 | ) | | | (.50 | ) | | | (.49 | ) | | | (.53 | ) | | | (.59 | ) |
| |
| Net asset value, end of period | | $ | 9.28 | | | $ | 11.12 | | | $ | 12.76 | | | $ | 12.75 | | | $ | 12.85 | |
| | | |
| | | | | | | | | | | | | | | | | | | | | |
Total Return, at Net Asset Value2 | | | (11.16 | )% | | | (9.07 | )% | | | 3.93 | % | | | 3.41 | % | | | 14.56 | % |
| | | | | | | | | | | | | | | | | | | | | |
Ratios/Supplemental Data | | | | | | | | | | | | | | | | | | | | |
| Net assets, end of period (in thousands) | | $ | 69,650 | | | $ | 119,418 | | | $ | 179,266 | | | $ | 196,704 | | | $ | 189,643 | |
| |
| Average net assets (in thousands) | | $ | 78,974 | | | $ | 148,180 | | | $ | 193,167 | | | $ | 193,225 | | | $ | 173,663 | |
| |
Ratios to average net assets:3 | | | | | | | | | | | | | | | | | | | | |
| Net investment income | | | 6.66 | % | | | 4.51 | % | | | 3.81 | % | | | 4.14 | % | | | 4.62 | % |
| Expenses excluding interest and fees on short-term floating rate notes issued | | | 2.40 | % | | | 1.60 | % | | | 1.52 | % | | | 1.59 | % | | | 1.59 | % |
Interest and fees on short-term floating rate notes issued4 | | | 0.49 | % | | | 0.60 | % | | | 0.61 | % | | | 0.59 | % | | | 0.40 | % |
| | | |
| Total expenses | | | 2.89 | %5 | | | 2.20 | %5 | | | 2.13 | %5 | | | 2.18 | % | | | 1.99 | %5 |
| |
| Portfolio turnover rate | | | 30 | % | | | 51 | % | | | 4 | % | | | 19 | % | | | 14 | % |
| | |
| 1. | | Per share amounts calculated based on the average shares outstanding during the period. |
| |
| 2. | | Assumes an investment on the business day before the first day of the fiscal period, with all dividends and distributions reinvested in additional shares on the reinvestment date, and redemption at the net asset value calculated on the last business day of the fiscal period. Sales charges are not reflected in the total returns. Total returns are not annualized for periods less than one full year. Returns do not reflect the deduction of taxes that a shareholder would pay on fund distributions or the redemption of fund shares. |
| |
| 3. | | Annualized for periods less than one full year. |
| |
| 4. | | Interest and fee expense relates to the Fund’s liability for short-term floating rate notes issued in conjunction with inverse floating rate security transactions. |
| |
| 5. | | Reduction to custodian expenses less than 0.005%. |
See accompanying Notes to Financial Statements.
F23 | OPPENHEIMER PENNSYLVANIA MUNICIPAL FUND
FINANCIAL HIGHLIGHTS Continued
| | | | | | | | | | | | | | | | | | | | | |
| Class C Year Ended July 31, | | 2009 | | | 2008 | | | 2007 | | | 2006 | | | 2005 | |
| |
Per Share Operating Data | | | | | | | | | | | | | | | | | | | | |
| Net asset value, beginning of period | | $ | 11.11 | | | $ | 12.75 | | | $ | 12.73 | | | $ | 12.83 | | | $ | 11.75 | |
| |
| Income (loss) from investment operations: | | | | | | | | | | | | | | | | | | | | |
Net investment income1 | | | .61 | | | | .55 | | | | .49 | | | | .52 | | | | .57 | |
| Net realized and unrealized gain (loss) | | | (1.89 | ) | | | (1.68 | ) | | | .02 | | | | (.09 | ) | | | 1.10 | |
| | | |
| Total from investment operations | | | (1.28 | ) | | | (1.13 | ) | | | .51 | | | | .43 | | | | 1.67 | |
| |
| Dividends and/or distributions to shareholders: | | | | | | | | | | | | | | | | | | | | |
| Dividends from net investment income | | | (.56 | ) | | | (.51 | ) | | | (.49 | ) | | | (.53 | ) | | | (.59 | ) |
| |
| Net asset value, end of period | | $ | 9.27 | | | $ | 11.11 | | | $ | 12.75 | | | $ | 12.73 | | | $ | 12.83 | |
| | | |
| | | | | | | | | | | | | | | | | | | | | |
Total Return, at Net Asset Value2 | | | (11.11 | )% | | | (9.05 | )% | | | 4.02 | % | | | 3.41 | % | | | 14.48 | % |
| | | | | | | | | | | | | | | | | | | | | |
Ratios/Supplemental Data | | | | | | | | | | | | | | | | | | | | |
| Net assets, end of period (in thousands) | | $ | 243,599 | | | $ | 291,693 | | | $ | 322,869 | | | $ | 220,256 | | | $ | 133,569 | |
| |
| Average net assets (in thousands) | | $ | 227,214 | | | $ | 309,446 | | | $ | 274,274 | | | $ | 174,354 | | | $ | 96,508 | |
| |
Ratios to average net assets:3 | | | | | | | | | | | | | | | | | | | | |
| Net investment income | | | 6.74 | % | | | 4.56 | % | | | 3.80 | % | | | 4.10 | % | | | 4.56 | % |
| Expenses excluding interest and fees on short-term floating rate notes issued | | | 2.37 | % | | | 1.58 | % | | | 1.50 | % | | | 1.58 | % | | | 1.59 | % |
Interest and fees on short-term floating rate notes issued4 | | | 0.49 | % | | | 0.60 | % | | | 0.61 | % | | | 0.59 | % | | | 0.40 | % |
| | | |
| Total expenses | | | 2.86 | %5 | | | 2.18 | %5 | | | 2.11 | %5 | | | 2.17 | % | | | 1.99 | %5 |
| |
| Portfolio turnover rate | | | 30 | % | | | 51 | % | | | 4 | % | | | 19 | % | | | 14 | % |
| | |
| 1. | | Per share amounts calculated based on the average shares outstanding during the period. |
| |
| 2. | | Assumes an investment on the business day before the first day of the fiscal period, with all dividends and distributions reinvested in additional shares on the reinvestment date, and redemption at the net asset value calculated on the last business day of the fiscal period. Sales charges are not reflected in the total returns. Total returns are not annualized for periods less than one full year. Returns do not reflect the deduction of taxes that a shareholder would pay on fund distributions or the redemption of fund shares. |
| |
| 3. | | Annualized for periods less than one full year. |
| |
| 4. | | Interest and fee expense relates to the Fund’s liability for short-term floating rate notes issued in conjunction with inverse floating rate security transactions. |
| |
| 5. | | Reduction to custodian expenses less than 0.005%. |
See accompanying Notes to Financial Statements.
F24 | OPPENHEIMER PENNSYLVANIA MUNICIPAL FUND
NOTES TO FINANCIAL STATEMENTS Unaudited
1. Significant Accounting Policies
Oppenheimer Pennsylvania Municipal Fund (the “Fund”) is a separate series of Oppenheimer Multi-State Municipal Trust, a non-diversified, open-end management investment company registered under the Investment Company Act of 1940, as amended. The Fund’s investment objective is to seek as high a level of current interest income exempt from federal and Pennsylvania personal income taxes as is available from municipal securities, consistent with preservation of capital. The Fund’s investment adviser is OppenheimerFunds, Inc. (the “Manager”).
The Fund offers Class A, Class B and Class C shares. Class A shares are sold at their offering price, which is normally net asset value plus a front-end sales charge. Class B and Class C shares are sold without a front-end sales charge but may be subject to a contingent deferred sales charge (“CDSC”). All classes of shares have identical rights and voting privileges with respect to the Fund in general and exclusive voting rights on matters that affect that class alone. Earnings, net assets and net asset value per share may differ due to each class having its own expenses, such as transfer and shareholder servicing agent fees and shareholder communications, directly attributable to that class. Class A, B and C have separate distribution and/or service plans. Class B shares will automatically convert to Class A shares 72 months after the date of purchase.
The following is a summary of significant accounting policies consistently followed by the Fund.
Securities Valuation. The Fund calculates the net asset value of its shares as of the close of the New York Stock Exchange (the “Exchange”), normally 4:00 P.M. Eastern time, on each day the Exchange is open for trading.
Each investment asset or liability of the Fund is assigned a level at measurement date based on the significance and source of the inputs to its valuation. Unadjusted quoted prices in active markets for identical securities are classified as “Level 1,” inputs other than unadjusted quoted prices for an asset that are observable are classified as “Level 2” and unobservable inputs, including the Manager’s judgment about the assumptions that a market participant would use in pricing an asset or liability are classified as “Level 3.” The inputs used for valuing securities are not necessarily an indication of the risks associated with investing in those securities. A table summarizing the Fund’s investments under these levels of classification is included following the Statement of Investments.
Securities are valued using unadjusted quoted market prices, when available, as supplied primarily either by portfolio pricing services approved by the Board of Trustees or dealers.
Securities traded on a registered U.S. securities exchange are valued based on the last sale price of the security reported on the principal exchange on which traded, prior to the time when the Fund’s assets are valued. Securities whose principal exchange is NASDAQ® are valued based on the official closing prices reported by NASDAQ prior to the time when the Fund’s assets are valued. In the absence of a sale, the security is valued at the last sale price on the prior trading day, if it is within the spread of the current day’s closing
F25 | OPPENHEIMER PENNSYLVANIA MUNICIPAL FUND
NOTES TO FINANCIAL STATEMENTS Unaudited / Continued
1. Significant Accounting Policies Continued
“bid” and “asked” prices, and if not, at the current day’s closing bid price. A foreign security traded on a foreign exchange is valued based on the last sale price on the principal exchange on which the security is traded, as identified by the portfolio pricing service used by the Manager, prior to the time when the Fund’s assets are valued. In the absence of a sale, the security is valued at the most recent official closing price on the principal exchange on which it is traded.
Shares of a registered investment company that are not traded on an exchange are valued at that investment company’s net asset value per share.
Corporate, government and municipal debt instruments having a remaining maturity in excess of sixty days and all mortgage-backed securities, collateralized mortgage obligations and other asset-backed securities are valued at the mean between the “bid” and “asked” prices.
“Money market-type” debt instruments with remaining maturities of sixty days or less are valued at cost adjusted by the amortization of discount or premium to maturity (amortized cost), which approximates market value.
In the absence of a readily available unadjusted quoted market price, including for securities whose values have been materially affected by what the Manager identifies as a significant event occurring before the Fund’s assets are valued but after the close of the securities’ respective exchanges, the Manager, acting through its internal valuation committee, in good faith determines the fair valuation of that asset using consistently applied procedures under the supervision of the Board of Trustees (which reviews those fair valuations by the Manager). Those procedures include certain standardized methodologies to fair value securities. Such methodologies include, but are not limited to, pricing securities initially at cost and subsequently adjusting the value based on: changes in company specific fundamentals, changes in an appropriate securities index, or changes in the value of similar securities which may be adjusted for any discounts related to resale restrictions. When possible, such methodologies use observable market inputs such as unadjusted quoted prices of similar securities, observable interest rates, currency rates and yield curves. The methodologies used for valuing securities are not necessarily an indication of the risks associated with investing in those securities.
There have been no significant changes to the fair valuation methodologies during the period.
Inverse Floating Rate Securities. The Fund invests in inverse floating rate securities that pay interest at a rate that varies inversely with short-term interest rates. Certain of these securities may be leveraged, whereby the interest rate varies inversely at a multiple of the change in short-term rates. As interest rates rise, inverse floaters produce less current income. The price of such securities is more volatile than comparable fixed rate securities. The Fund may expose up to 20% of its total assets to the effects of leverage from its investments in inverse floaters. The Fund’s exposure to the effects of leverage from
F26 | OPPENHEIMER PENNSYLVANIA MUNICIPAL FUND
its investments in inverse floaters amount to $203,865,000 as of July 31, 2009, which represents 16.01% of the Fund’s total assets.
Certain inverse floating rate securities are created when the Fund purchases and subsequently transfers a municipal bond security (the “municipal bond”) to a broker dealer. The municipal bond is typically a fixed rate security. The broker dealer (the “sponsor”) creates a trust (the “Trust”) and deposits the municipal bond. The Trust issues short-term floating rate notes available to third parties and a residual interest in the municipal bond (referred to as an “inverse floating rate security”) to the Fund. The terms of these inverse floating rate securities grant the Fund the right to require that the Trust issuing the inverse floating rate security compel a tender of the short-term floating rate notes to facilitate the Fund’s repurchase of the underlying municipal bond. Following such a request, the Fund pays the sponsor the principal amount due to the holders of the short-term floating rate notes issued by the Trust and exchanges the inverse floating rate security for the underlying municipal bond. These transactions are considered secured borrowings for financial reporting purposes. As a result of such accounting treatments, the Fund includes the municipal bond position on its Statement of Investments (but does not separately include the inverse floating rate securities received). The Fund also includes the value of the municipal bond and a payable amount equal to the short-term floating rate notes issued by the Trust on its Statement of Assets and Liabilities. The interest rates on these short-term floating rate notes reset periodically, usually weekly. The holders of these short-term floating rate notes have the option to tender their investment, to the sponsor or the Trust’s liquidity provider, for redemption at par at each reset date. Income from the municipal bond position and the interest expense on the payable for the short-term floating rate notes issued by the Trust are recorded on the Fund’s Statement of Operations. At July 31, 2009, municipal bond holdings with a value of $303,174,987 shown on the Fund’s Statement of Investments are held by such Trusts and serve as collateral for the $203,865,000 in short-term floating rate notes issued and outstanding at that date.
The Fund’s investments in inverse floaters involve certain risks. The market value of an inverse floating rate security can be more volatile than that of a conventional fixed-rate bond having similar credit quality, maturity and redemption provisions. Typically, an inverse floating rate security tends to underperform fixed rate bonds when long-term interest rates are rising but tends to outperform fixed rate bonds when long-term interest rates are stable or falling. An inverse floating rate security entails a degree of leverage because the trust issues short-term securities in a ratio to the inverse floating rate security with the underlying long-term bond providing collateral for the obligation to pay the principal value of the short-term securities if and when they are tendered. If the Fund has created the inverse floater by depositing a long-term bond into a trust, it may be required to provide additional collateral for the short-term securities if the value of the underlying bond deposited in the trust falls.
F27 | OPPENHEIMER PENNSYLVANIA MUNICIPAL FUND
NOTES TO FINANCIAL STATEMENTS Unaudited / Continued
1. Significant Accounting Policies Continued
At July 31, 2009, the Fund’s residual exposure to these types of inverse floating rate securities were as follows:
| | | | | | | | | | | | | | | | | |
| Principal | | | | | Coupon | | | Maturity | | | | |
| Amount | | | Inverse Floater1 | | Rate2 | | | Date | | | Value | |
| |
| $ | 7,980,000 | | | Chester County, PA IDA (Water Facilities Authority)3 | | | 4.890 | % | | | 2/1/41 | | | $ | 5,223,788 | |
| | 3,690,000 | | | Delaware County, PA IDA ROLs3 | | | 10.313 | | | | 11/1/37 | | | | 2,508,167 | |
| | 6,240,000 | | | Delaware County, PA IDA ROLs3 | | | 10.318 | | | | 11/1/38 | | | | 4,189,661 | |
| | 7,500,000 | | | Luzerne County, PA IDA (Water Facility) ROLs3 | | | 11.046 | | | | 9/1/34 | | | | 5,130,975 | |
| | 9,000,000 | | | PA Austin Trust Various States Inverse Certificates | | | 8.091 | | | | 10/1/31 | | | | 8,610,120 | |
| | 7,500,000 | | | PA Austin Trust Various States Inverse Certificates | | | 8.351 | | | | 10/1/34 | | | | 7,317,750 | |
| | 7,965,000 | | | PA Austin Trust Various States Inverse Certificates | | | 8.093 | | | | 10/1/33 | | | | 7,501,517 | |
| | 7,500,000 | | | PA Geisinger Authority Health System DRIVERS | | | 15.065 | | | | 6/1/39 | | | | 7,298,250 | |
| | 5,700,000 | | | PA HFA (Single Family Mtg.) DRIVERS | | | 7.957 | | | | 10/1/22 | | | | 5,784,816 | |
| | 5,510,000 | | | PA HFA (Single Family Mtg.) DRIVERS | | | 7.611 | | | | 10/1/22 | | | | 5,563,667 | |
| | 2,295,000 | | | PA HFA (Single Family Mtg.) ROLs | | | 16.145 | | | | 10/1/21 | | | | 2,301,059 | |
| | 4,320,000 | | | PA HFA (Single Family Mtg.) ROLs3 | | | 8.369 | | | | 10/1/32 | | | | 3,981,658 | |
| | 6,525,000 | | | PA HFA (Single Family Mtg.) ROLs | | | 16.217 | | | | 10/1/37 | | | | 8,120,819 | |
| | 5,170,000 | | | PA HFA (Single Family Mtg.) ROLs3 | | | 14.313 | | | | 10/1/33 | | | | 4,628,494 | |
| | 4,395,000 | | | PA HFA (Single Family Mtg.) ROLs3 | | | 13.655 | | | | 10/1/37 | | | | 3,500,969 | |
| | 6,450,000 | | | PA HFA (Single Family Mtg.) ROLs3 | | | 10.249 | | | | 10/1/37 | | | | 3,997,194 | |
| | 6,155,000 | | | PA Southcentral General Authority (Hanover Hospital) ROLs | | | 17.244 | | | | 6/1/29 | | | | 7,557,601 | |
| | 5,535,000 | | | Puerto Rico Sales Tax Financing Corp. ROLs3 | | | 8.346 | | | | 8/1/57 | | | | 6,093,482 | |
| | | | | | | | | | | | | | | | |
| | | | | | | | | | | | | | | $ | 99,309,987 | |
| | | | | | | | | | | | | | | | |
| | |
| 1. | | For a list of abbreviations used in the Inverse Floater table see the Portfolio Abbreviations table on page F16 of the Statement of Investments. |
| |
| 2. | | Represents the current interest rate for a variable rate bond known as an “inverse floater.” |
| |
| 3. | | Security is subject to a shortfall and forbearance agreement. |
The Fund enters into shortfall and forbearance agreements with the sponsors of certain inverse floaters held by the Fund. These agreements commit the Fund to reimburse the sponsor of the inverse floater, in certain circumstances, for the amount of the difference between the liquidation value of the underlying security (which is the basis of the inverse floater) and the principal amount due to the holders of the short-term floating rate notes issued by the Trust in conjunction with the inverse floating rate security. Under the standard terms of an inverse floating rate security, absent such a shortfall and forbearance agreement, the Fund would not be required to make such a reimbursement. The Manager monitors the Fund’s potential exposure with respect to these agreements on a daily basis and intends to take action to terminate the Fund’s investment in such inverse floating rate securities, if it deems it appropriate to do so. As of July 31, 2009, in addition to the exposure detailed in the preceding table, the Fund’s maximum exposure under such agreements is estimated at $107,225,000.
F28 | OPPENHEIMER PENNSYLVANIA MUNICIPAL FUND
Credit Risk. The Fund invests in high-yield, non-investment-grade bonds, which may be subject to a greater degree of credit risk. Credit risk relates to the ability of the issuer to meet interest or principal payments or both as they become due. The Fund may acquire securities in default, and is not obligated to dispose of securities whose issuers subsequently default. Information concerning securities in default as of July 31, 2009 is as follows:
| | | | | |
| Cost | | $ | 1,851,422 | |
| Market Value | | $ | 141,384 | |
| Market Value as a % of Net Assets | | | 0.01 | % |
Concentration Risk. There are certain risks arising from geographic concentration in any state. Certain economic, regulatory or political developments occurring in the state may impair the ability of certain issuers of municipal securities to pay principal and interest on their obligations.
Allocation of Income, Expenses, Gains and Losses. Income, expenses (other than those attributable to a specific class), gains and losses are allocated on a daily basis to each class of shares based upon the relative proportion of net assets represented by such class. Operating expenses directly attributable to a specific class are charged against the operations of that class.
Federal Taxes. The Fund intends to comply with provisions of the Internal Revenue Code applicable to regulated investment companies and to distribute substantially all of its investment company taxable income, including any net realized gain on investments not offset by capital loss carryforwards, if any, to shareholders. Therefore, no federal income or excise tax provision is required. The Fund files income tax returns in U.S. federal and applicable state jurisdictions. The statute of limitations on the Fund’s tax return filings generally remain open for the three preceding fiscal reporting period ends.
The tax components of capital shown in the following table represent distribution requirements the Fund must satisfy under the income tax regulations, losses the Fund may be able to offset against income and gains realized in future years and unrealized appreciation or depreciation of securities and other investments for federal income tax purposes.
| | | | | | | | | | | | | |
| | | | | | | | | | | Net Unrealized | |
| | | | | | | | | | | Depreciation | |
| | | | | | | | | | | Based on Cost of | |
| | | | | | | | | | | Securities and | |
| Undistributed | | Undistributed | | | Accumulated | | | Other Investments | |
| Net Investment | | Long-Term | | | Loss | | | for Federal Income | |
| Income | | Gain | | | Carryforward1,2,3,4 | | | Tax Purposes | |
| |
| $8,586,968 | | $ | — | | | $ | 113,095,434 | | | $ | 236,235,088 | |
| | |
| 1. | | As of July 31, 2009, the Fund had $53,776,864 of net capital loss carryforwards available to offset future realized capital gains, if any, and thereby reduce future taxable gain distributions. As of July 31, 2009, details of the capital loss carryforwards were as follows: |
F29 | OPPENHEIMER PENNSYLVANIA MUNICIPAL FUND
NOTES TO FINANCIAL STATEMENTS Unaudited / Continued
1. Significant Accounting Policies Continued
| | | | | |
Expiring | | | | |
| 2013 | | $ | 1,195,731 | |
| 2016 | | | 3,710,588 | |
| 2017 | | | 48,870,545 | |
| | | | |
| Total | | $ | 53,776,864 | |
| | | | |
| | |
| 2. | | As of July 31, 2009, the Fund had $59,318,570 of post-October losses available to offset future realized capital gains, if any. Such losses, if unutilized, will expire in 2018. |
| |
| 3. | | During the fiscal year ended July 31, 2009, the Fund did not utilize any capital loss carryforward. |
| |
| 4. | | During the fiscal year ended July 31, 2008, the Fund did not utilize any capital loss carryforward. |
Net investment income (loss) and net realized gain (loss) may differ for financial statement and tax purposes. The character of dividends and distributions made during the fiscal year from net investment income or net realized gains may differ from their ultimate characterization for federal income tax purposes. Also, due to timing of dividends and distributions, the fiscal year in which amounts are distributed may differ from the fiscal year in which the income or net realized gain was recorded by the Fund.
Accordingly, the following amounts have been reclassified for July 31, 2009. Net assets of the Fund were unaffected by the reclassifications.
| | | | | |
| Reduction to | | Reduction to | |
| Accumulated | | Accumulated Net | |
| Net Investment | | Realized Loss | |
| Income | | on Investments | |
| |
| $2,697,264 | | $ | 2,697,264 | |
The tax character of distributions paid during the years ended July 31, 2009 and July 31, 2008 was as follows:
| | | | | | | | | |
| | | Year Ended | | | Year Ended | |
| | | July 31, 2009 | | | July 31, 2008 | |
| |
| Distributions paid from: | | | | | | | | |
| Exempt-interest dividends | | $ | 62,777,844 | | | $ | 61,443,123 | |
| Ordinary income | | | 34,327 | | | | 339,246 | |
| | | |
| Total | | $ | 62,812,171 | | | $ | 61,782,369 | |
| | | |
The aggregate cost of securities and other investments and the composition of unrealized appreciation and depreciation of securities and other investments for federal income tax purposes as of July 31, 2009 are noted in the following table. The primary difference between book and tax appreciation or depreciation of securities and other investments, if applicable, is attributable to the tax deferral of losses or tax realization of financial statement unrealized gain or loss.
| | | | | |
| Federal tax cost of securities | | $ | 1,290,804,617 | |
| | | | |
| | |
| Gross unrealized appreciation | | $ | 21,859,709 | |
| Gross unrealized depreciation | | | (258,094,797 | ) |
| | | | |
| Net unrealized depreciation | | $ | (236,235,088 | ) |
| | | | |
F30 | OPPENHEIMER PENNSYLVANIA MUNICIPAL FUND
Trustees’ Compensation. The Fund has adopted an unfunded retirement plan (the “Plan”) for the Fund’s independent trustees. Benefits are based on years of service and fees paid to each trustee during their period of service. The Plan was frozen with respect to adding new participants effective December 31, 2006 (the “Freeze Date”) and existing Plan Participants as of the Freeze Date will continue to receive accrued benefits under the Plan. Active independent trustees as of the Freeze Date have each elected a distribution method with respect to their benefits under the Plan. During the year ended July 31, 2009, the Fund’s projected benefit obligations, payments to retired trustees and accumulated liability were as follows:
| | | | | |
| Projected Benefit Obligations Increased | | $ | 13,432 | |
| Payments Made to Retired Trustees | | | 9,215 | |
| Accumulated Liability as of July 31, 2009 | | | 93,531 | |
The Board of Trustees has adopted a compensation deferral plan for independent trustees that enables trustees to elect to defer receipt of all or a portion of the annual compensation they are entitled to receive from the Fund. For purposes of determining the amount owed to the Trustee under the plan, deferred amounts are treated as though equal dollar amounts had been invested in shares of the Fund or in other Oppenheimer funds selected by the Trustee. The Fund purchases shares of the funds selected for deferral by the Trustee in amounts equal to his or her deemed investment, resulting in a Fund asset equal to the deferred compensation liability. Such assets are included as a component of “Other” within the asset section of the Statement of Assets and Liabilities. Deferral of trustees’ fees under the plan will not affect the net assets of the Fund, and will not materially affect the Fund’s assets, liabilities or net investment income per share. Amounts will be deferred until distributed in accordance to the compensation deferral plan.
Dividends and Distributions to Shareholders. Dividends and distributions to shareholders, which are determined in accordance with income tax regulations and may differ from U.S. generally accepted accounting principles, are recorded on the ex-dividend date. Income distributions, if any, are declared daily and paid monthly. Capital gain distributions, if any, are declared and paid annually.
Investment Income. Interest income is recognized on an accrual basis. Discount and premium, which are included in interest income on the Statement of Operations, are amortized or accreted daily.
Custodian Fees. “Custodian fees and expenses” in the Statement of Operations may include interest expense incurred by the Fund on any cash overdrafts of its custodian account during the period. Such cash overdrafts may result from the effects of failed trades in portfolio securities and from cash outflows resulting from unanticipated shareholder redemption activity. The Fund pays interest to its custodian on such cash overdrafts, to the extent they are not offset by positive earnings on cash balances maintained by the Fund, at a rate equal to the 1 Month LIBOR Rate plus 2.00%. The “Reduction to custodian expenses” line item, if applicable, represents earnings on
F31 | OPPENHEIMER PENNSYLVANIA MUNICIPAL FUND
NOTES TO FINANCIAL STATEMENTS Unaudited / Continued
1. Significant Accounting Policies Continued
cash balances maintained by the Fund during the period. Such interest expense and other custodian fees may be paid with these earnings.
Security Transactions. Security transactions are recorded on the trade date. Realized gains and losses on securities sold are determined on the basis of identified cost.
Indemnifications. The Fund’s organizational documents provide current and former trustees and officers with a limited indemnification against liabilities arising in connection with the performance of their duties to the Fund. In the normal course of business, the Fund may also enter into contracts that provide general indemnifications. The Fund’s maximum exposure under these arrangements is unknown as this would be dependent on future claims that may be made against the Fund. The risk of material loss from such claims is considered remote.
Other. The preparation of financial statements in conformity with accounting principles generally accepted in the United States of America requires management to make estimates and assumptions that affect the reported amounts of assets and liabilities and disclosure of contingent assets and liabilities at the date of the financial statements and the reported amounts of increases and decreases in net assets from operations during the reporting period. Actual results could differ from those estimates.
2. Shares of Beneficial Interest
The Fund has authorized an unlimited number of no par value shares of beneficial interest of each class. Transactions in shares of beneficial interest were as follows:
| | | | | | | | | | | | | | | | | |
| | | Year Ended July 31, 2009 | | | Year Ended July 31, 2008 | |
| | | Shares | | | Amount | | | Shares | | | Amount | |
| |
Class A | | | | | | | | | | | | | | | | |
| Sold | | | 15,579,306 | | | $ | 139,183,042 | | | | 21,573,103 | | | $ | 259,898,687 | |
| Dividends and/or distributions reinvested | | | 3,275,494 | | | | 28,958,010 | | | | 2,369,899 | | | | 28,250,705 | |
| Redeemed | | | (19,560,021 | ) | | | (173,389,725 | ) | | | (18,514,493 | ) | | | (222,717,475 | ) |
| | | |
| Net increase (decrease) | | | (705,221 | ) | | $ | (5,248,673 | ) | | | 5,428,509 | | | $ | 65,431,917 | |
| | | |
| | | | | | | | | | | | | | | | | |
Class B | | | | | | | | | | | | | | | | |
| Sold | | | 814,483 | | | $ | 7,347,046 | | | | 906,865 | | | $ | 10,869,239 | |
| Dividends and/or distributions reinvested | | | 336,886 | | | | 2,975,814 | | | | 314,181 | | | | 3,754,212 | |
| Redeemed | | | (4,385,820 | ) | | | (39,991,416 | ) | | | (4,526,798 | ) | | | (54,489,242 | ) |
| | | |
| Net decrease | | | (3,234,451 | ) | | $ | (29,668,556 | ) | | | (3,305,752 | ) | | $ | (39,865,791 | ) |
| | | |
| | | | | | | | | | | | | | | | | |
Class C | | | | | | | | | | | | | | | | |
| Sold | | | 5,064,611 | | | $ | 44,530,477 | | | | 7,042,961 | | | $ | 84,742,682 | |
| Dividends and/or distributions reinvested | | | 1,008,767 | | | | 8,888,624 | | | | 710,354 | | | | 8,456,138 | |
| Redeemed | | | (6,052,932 | ) | | | (53,675,309 | ) | | | (6,814,346 | ) | | | (81,782,752 | ) |
| | | |
| Net increase (decrease) | | | 20,446 | | | $ | (256,208 | ) | | | 938,969 | | | $ | 11,416,068 | |
| | | |
F32 | OPPENHEIMER PENNSYLVANIA MUNICIPAL FUND
3. Purchases and Sales of Securities
The aggregate cost of purchases and proceeds from sales of securities, other than short-term obligations, for the year ended July 31, 2009, were as follows:
| | | | | | | | | |
| | | Purchases | | | Sales | |
| |
| Investment securities | | $ | 330,459,638 | | | $ | 323,960,465 | |
4. Fees and Other Transactions with Affiliates
Management Fees. Under the investment advisory agreement, the Fund pays the Manager a management fee based on the daily net assets of the Fund at an annual rate as shown in the following table:
| | | | | |
Fee Schedule | | | | |
| Up to $200 million | | | 0.60 | % |
| Next $100 million | | | 0.55 | |
| Next $200 million | | | 0.50 | |
| Next $250 million | | | 0.45 | |
| Next $250 million | | | 0.40 | |
| Over $1 billion | | | 0.35 | |
Transfer Agent Fees. OppenheimerFunds Services (“OFS”), a division of the Manager, acts as the transfer and shareholder servicing agent for the Fund. The Fund pays OFS a per account fee. For the year ended July 31, 2009, the Fund paid $592,779 to OFS for services to the Fund.
Distribution and Service Plan (12b-1) Fees. Under its General Distributor’s Agreement with the Fund, OppenheimerFunds Distributor, Inc. (the “Distributor”) acts as the Fund’s principal underwriter in the continuous public offering of the Fund’s classes of shares.
Service Plan for Class A Shares. The Fund has adopted a Service Plan (the “Plan”) for Class A shares under Rule 12b-1 of the Investment Company Act of 1940. Under the Plan, the Fund reimburses the Distributor for a portion of its costs incurred for services provided to accounts that hold Class A shares. Reimbursement is made periodically at an annual rate of up to 0.15% of the daily net assets of Class A shares of the Fund. The Distributor currently uses all of those fees to pay dealers, brokers, banks and other financial institutions periodically for providing personal service and maintenance of accounts of their customers that hold Class A shares. Any unreimbursed expenses the Distributor incurs with respect to Class A shares in any fiscal year cannot be recovered in subsequent periods. Fees incurred by the Fund under the Plan are detailed in the Statement of Operations.
Distribution and Service Plans for Class B and Class C Shares. The Fund has adopted Distribution and Service Plans (the “Plans”) for Class B and Class C shares under Rule 12b-1 of the Investment Company Act of 1940 to compensate the Distributor for its services in connection with the distribution of those shares and servicing accounts. Under the Plans, the Fund pays the Distributor an annual asset-based sales charge of 0.75% on Class B and Class C shares daily net assets. The Distributor also receives a service fee of 0.15% per year under each plan. If either the Class B or Class C plan is terminated by the Fund or by the
F33 | OPPENHEIMER PENNSYLVANIA MUNICIPAL FUND
NOTES TO FINANCIAL STATEMENTS Unaudited / Continued
4. Fees and Other Transactions with Affiliates Continued
shareholders of a class, the Board of Trustees and its independent trustees must determine whether the Distributor shall be entitled to payment from the Fund of all or a portion of the service fee and/or asset-based sales charge in respect to shares sold prior to the effective date of such termination. Fees incurred by the Fund under the Plans are detailed in the Statement of Operations. The Distributor determines its uncompensated expenses under the Plans at calendar quarter ends. The Distributor’s aggregate uncompensated expenses under the Plans at June 30, 2009 were as follows:
| | | | | |
| Class B | | $ | 3,437,106 | |
| Class C | | | 4,388,583 | |
Sales Charges. Front-end sales charges and contingent deferred sales charges (“CDSC”) do not represent expenses of the Fund. They are deducted from the proceeds of sales of Fund shares prior to investment or from redemption proceeds prior to remittance, as applicable. The sales charges retained by the Distributor from the sale of shares and the CDSC retained by the Distributor on the redemption of shares is shown in the following table for the period indicated.
| | | | | | | | | | | | | | | | | |
| | | | | | | Class A | | | Class B | | | Class C | |
| | | Class A | | | Contingent | | | Contingent | | | Contingent | |
| | | Front-End | | | Deferred | | | Deferred | | | Deferred | |
| | | Sales Charges | | | Sales Charges | | | Sales Charges | | | Sales Charges | |
| | | Retained by | | | Retained by | | | Retained by | | | Retained by | |
| Year Ended | | Distributor | | | Distributor | | | Distributor | | | Distributor | |
| |
| July 31, 2009 | | $ | 293,891 | | | $ | 20,254 | | | $ | 197,807 | | | $ | 35,385 | |
Waivers and Reimbursements of Expenses. OFS has voluntarily agreed to limit transfer and shareholder servicing agent fees for all classes to 0.35% of average annual net assets per class. This undertaking may be amended or withdrawn at any time.
5. Illiquid Securities
As of July 31, 2009, investments in securities included issues that are illiquid. Investments may be illiquid because they do not have an active trading market, making it difficult to value them or dispose of them promptly at an acceptable price. The Fund will not invest more than 15% of its net assets (determined at the time of purchase and reviewed periodically) in illiquid securities. Securities that are illiquid are marked with an applicable footnote on the Statement of Investments.
6. Borrowings
The Fund can borrow money from banks in amounts up to one third of its total assets (including the amount borrowed) less all liabilities and indebtedness other than borrowings. The Fund can use those borrowings for investment-related purposes such as purchasing portfolio securities. The Fund can also borrow for other purposes, such as to raise money to unwind or “collapse” trusts that issued “inverse floaters” to the Fund, or to contribute to such trusts to enable them to meet tenders of their short-term
F34 | OPPENHEIMER PENNSYLVANIA MUNICIPAL FUND
securities by the holders of those securities. The Fund also may borrow to meet redemption obligations or for temporary and emergency purposes. The purchase of securities with borrowed funds creates leverage in the Fund. The use of leverage will subject the Fund to greater costs than funds that do not borrow for leverage, and may also make the Fund’s share price more sensitive to interest changes. The interest on borrowed money is an expense that might reduce the Fund’s yield. Expenses incurred by the Fund with respect to interest on borrowings and commitment fees are disclosed separately or as other expenses on the Statement of Operations.
The Fund entered into a Revolving Credit and Security Agreement (the “Agreement”) with a conduit lender and a bank which enables it to participate with certain other Oppenheimer funds in a committed, secured borrowing facility that permits borrowings of up to $3.0 billion, collectively. To secure the loan, the Fund pledges investment securities in accordance with the terms of the Agreement. Interest is charged to the Fund, based on its borrowings, at current commercial paper issuance rates (0.437% as of July 31, 2009). The Fund pays additional fees annually to its lender on its outstanding borrowings to manage and administer the facility and is allocated its pro-rata share of an annual commitment fee on the amount of the unused portion of the total facility size. Total fees and interest that are included in expenses on the Fund’s Statement of Operations related to its participation in the borrowing facility during the year ended July 31, 2009 equal 0.87% of the Fund’s average net assets on an annualized basis. The Fund has the right to prepay such loans and terminate its participation in the conduit loan facility at any time upon prior notice.
As of July 31, 2009, the Fund had borrowings outstanding at an interest rate of 0.437%. Details of the borrowings for the year ended July 31, 2009 are as follows:
| | | | | |
| Average Daily Loan Balance | | $ | 96,714,795 | |
| Average Daily Interest Rate | | | 1.934 | % |
| Fees Paid | | $ | 7,506,719 | |
| Interest Paid | | $ | 1,934,727 | |
7. Subsequent Events Evaluation
The Fund has evaluated the need for disclosures and/or adjustments resulting from subsequent events through September 17, 2009, the date the financial statements were available to be issued. This evaluation determined that there are no subsequent events that necessitated disclosures and/or adjustments.
8. Pending Litigation
During 2009, a number of complaints have been filed in federal courts against the Manager, the Distributor, and certain mutual funds advised by the Manager and distributed by the Distributor—including the Fund. The complaints naming the Fund as a defendant also name certain officers, trustees and former trustees of the Fund. The plaintiffs are seeking class action status on behalf of purchasers of shares of the Fund during a particular time
F35 | OPPENHEIMER PENNSYLVANIA MUNICIPAL FUND
NOTES TO FINANCIAL STATEMENTS Unaudited / Continued
8. Pending Litigation Continued
period. The complaints against the Fund raise claims under federal securities laws alleging that, among other things, the disclosure documents of the Fund contained misrepresentations and omissions, that the Fund’s investment policies were not followed, and that the Fund and the other defendants violated federal securities laws and regulations and certain state laws. The plaintiffs seek unspecified damages, equitable relief and an award of attorneys’ fees and litigation expenses. The litigations involving certain other Oppenheimer funds are similar in nature.
A complaint has been brought in state court against the Manager, the Distributor and another subsidiary of the Manager (but not against the Fund), on behalf of the Oregon College Savings Plan Trust, and other complaints have been brought in state court against the Manager and that subsidiary (but not against the Fund), on behalf of the New Mexico Education Plan Trust. All of these complaints allege breach of contract, breach of fiduciary duty, negligence and violation of state securities laws, and seek compensatory damages, equitable relief and an award of attorneys’ fees and litigation expenses.
Other complaints have been filed in 2008 and 2009 in state and federal courts, by investors who made investments through an affiliate of the Manager, against the Manager and certain of its affiliates. Those complaints relate to the alleged investment fraud perpetrated by Bernard Madoff and his firm (“Madoff ”) and allege a variety of claims, including breach of fiduciary duty, fraud, negligent misrepresentation, unjust enrichment, and violation of federal and state securities laws and regulations, among others. They seek unspecified damages, equitable relief and an award of attorneys’ fees and litigation expenses. None of the suits have named the Distributor, any of the Oppenheimer mutual funds or any of their independent Trustees or Directors. None of the Oppenheimer funds invested in any funds or accounts managed by Madoff.
The Manager believes that the lawsuits described above are without legal merit and intends to defend them vigorously. The Fund’s Board of Trustees has also engaged counsel to defend the suits vigorously on behalf of the Fund, the Fund’s Board and the Trustees named in those suits. While it is premature to render any opinion as to the likelihood of an outcome in these lawsuits, or whether any costs that the Fund may bear in defending the suits might not be reimbursed by insurance or the Manager, the Manager believes that these suits should not have any material effect on the operations of the Fund and that the outcome of all of the suits together should not impair the ability of the Manager or the Distributor to perform their respective duties to the Fund.
F36 | OPPENHEIMER PENNSYLVANIA MUNICIPAL FUND
REPORT OF INDEPENDENT REGISTERED PUBLIC ACCOUNTING FIRM
The Board of Trustees and Shareholders of
Oppenheimer Multi-State Municipal Trust:
We have audited the accompanying statement of assets and liabilities of Oppenheimer Pennsylvania Municipal Fund (one of portfolios constituting the Oppenheimer Multi-State Municipal Trust), including the statement of investments, as of July 31, 2009, and the related statements of operations and cash flows for the year then ended, the statements of changes in net assets for each of the years in the two-year period then ended, and the financial highlights for each of the years in the five-year period then ended. These financial statements and financial highlights are the responsibility of the Fund’s management. Our responsibility is to express an opinion on these financial statements and financial highlights based on our audits.
We conducted our audits in accordance with the standards of the Public Company Accounting Oversight Board (United States). Those standards require that we plan and perform the audit to obtain reasonable assurance about whether the financial statements and financial highlights are free of material misstatement. An audit includes examining, on a test basis, evidence supporting the amounts and disclosures in the financial statements. Our procedures included confirmation of securities owned as of July 31, 2009, by correspondence with the custodian. An audit also includes assessing the accounting principles used and significant estimates made by management, as well as evaluating the overall financial statement presentation. We believe that our audits provide a reasonable basis for our opinion.
In our opinion, the financial statements and financial highlights referred to above present fairly, in all material respects, the financial position of Oppenheimer Pennsylvania Municipal Fund as of July 31, 2009, the results of its operations and its cash flows for the year then ended, the changes in its net assets for each of the years in the two-year period then ended, and the financial highlights for each of the years in the five-year period then ended, in conformity with U.S. generally accepted accounting principles.
KPMG llp
Denver, Colorado
September 17, 2009
F37 | OPPENHEIMER PENNSYLVANIA MUNICIPAL FUND
THIS PAGE INTENTIONALLY LEFT BLANK.
F38 | OPPENHEIMER PENNSYLVANIA MUNICIPAL FUND
FEDERAL INCOME TAX INFORMATION Unaudited
In early 2009, if applicable, shareholders of record received information regarding all dividends and distributions paid to them by the Fund during calendar year 2008. Regulations of the U.S. Treasury Department require the Fund to report this information to the Internal Revenue Service.
None of the dividends paid by the Fund during the fiscal year ended July 31, 2009 are eligible for the corporate dividend-received deduction. 99.95% of the dividends were derived from interest on municipal bonds and are not subject to federal income taxes. To the extent a shareholder is subject to any state or local tax laws, some or all of the dividends received may be taxable.
The foregoing information is presented to assist shareholders in reporting distributions received from the Fund to the Internal Revenue Service. Because of the complexity of the federal regulations which may affect your individual tax return and the many variations in state and local tax regulations, we recommend that you consult your tax advisor for specific guidance.
27 | OPPENHEIMER PENNSYLVANIA MUNICIPAL FUND
BOARD APPROVAL OF THE FUND’S INVESTMENT ADVISORY AGREEMENT Unaudited
Each year, the Board of Trustees (the “Board”), including a majority of the independent Trustees, is required to determine whether to renew the Fund’s investment advisory agreement (the “Agreement”). The Investment Company Act of 1940, as amended, requires that the Board request and evaluate, and that the Manager provide, such information as may be reasonably necessary to evaluate the terms of the Agreement. The Board employs an independent consultant to prepare a report that provides information, including comparative information, that the Board requests for that purpose. In addition, the Board receives information throughout the year regarding Fund services, fees, expenses and performance.
The Manager and the independent consultant provided information to the Board on the following factors: (i) the nature, quality and extent of the Manager’s services, (ii) the investment performance of the Fund and the Manager, (iii) the fees and expenses of the Fund, including comparative expense information, (iv) the profitability of the Manager and its affiliates, including an analysis of the cost of providing services, (v) whether economies of scale are realized as the Fund grows and whether fee levels reflect these economies of scale for Fund investors and (vi) other benefits to the Manager from its relationship with the Fund. The Board was aware that there are alternatives to retaining the Manager.
Outlined below is a summary of the principal information considered by the Board as well as the Board’s conclusions.
Nature, Quality and Extent of Services. The Board considered information about the nature and extent of the services provided to the Fund and information regarding the Manager’s key personnel who provide such services. The Manager’s duties include providing the Fund with the services of the portfolio managers and the Manager’s investment team, who provide research, analysis and other advisory services in regard to the Fund’s investments; securities trading services; oversight of third party service providers; monitoring compliance with applicable Fund policies and procedures and adherence to the Fund’s investment restrictions. The Manager is responsible for providing certain administrative services to the Fund as well. Those services include providing and supervising all administrative and clerical personnel who are necessary in order to provide effective corporate administration for the Fund; compiling and maintaining records with respect to the Fund’s operations; preparing and filing reports required by the Securities and Exchange Commission; preparing periodic reports regarding the operations of the Fund for its shareholders; preparing proxy materials for shareholder meetings; and preparing the registration statements required by Federal and state securities laws for the sale of the Fund’s shares. The Manager also provides the Fund with office space, facilities and equipment.
The Board also considered the quality of the services provided and the quality of the Manager’s resources that are available to the Fund. The Board took account of the fact that the Manager has had over forty years of experience as an investment adviser and that its assets under management rank it among the top mutual fund managers in the United States. The Board evaluated the Manager’s advisory, administrative, accounting, legal and compliance services, and information the Board has received regarding the
28 | OPPENHEIMER PENNSYLVANIA MUNICIPAL FUND
experience and professional qualifications of the Manager’s key personnel and the size and functions of its staff. In its evaluation of the quality of the portfolio management services provided, the Board considered the experience of Daniel Loughran, Scott Cottier and Troy Willis, the portfolio managers for the Fund, and the Manager’s investment team and analysts. The Board members also considered the totality of their experiences with the Manager as directors or trustees of the Fund and other funds advised by the Manager. The Board considered information regarding the quality of services provided by affiliates of the Manager, which its members have become knowledgeable about in connection with the renewal of the Fund’s service agreements. The Board concluded, in light of the Manager’s experience, reputation, personnel, operations and resources, that the Fund benefits from the services provided under the Agreement.
Investment Performance of the Manager and the Fund. Throughout the year, the Manager provided information on the investment performance of the Fund and the Manager, including comparative performance information. The Board also reviewed information, prepared by the Manager and by the independent consultant, comparing the Fund’s historical performance to relevant market indices and to the performance of other retail front-end load and no-load Pennsylvania municipal debt funds. The Board noted that the Fund’s one-year, three-year, five-year and ten-year performance was below its peer group median as of December 31, 2008. The Board also noted that the Fund’s recent performance has improved and its year-to date performance through June 5, 2009 (the most recent date available at the Board meeting at which the independent Trustees considered the matter) was in the top quintile of its peer group category.
Costs of Services by the Manager. The Board reviewed the fees paid to the Manager and the other expenses borne by the Fund. The Board also considered the comparability of the fees charged and the services provided to the Fund to the fees and services for other clients or accounts advised by the Manager. The independent consultant provided comparative data in regard to the fees and expenses of the Fund and other Pennsylvania municipal debt funds with comparable asset levels and distribution features. The Board noted that the Fund’s contractual management fees are equal to its peer group median and total expenses are lower than its peer group median, although its actual management fees are higher than its peer group median.
Economies of Scale and Profits Realized by the Manager. The Board considered information regarding the Manager’s costs in serving as the Fund’s investment adviser, including the costs associated with the personnel and systems necessary to manage the Fund, and information regarding the Manager’s profitability from its relationship with the Fund. The Board reviewed whether the Manager may realize economies of scale in managing and supporting the Fund. The Board noted that the Fund currently has management fee breakpoints, which are intended to share with Fund shareholders economies of scale that may exist as the Fund’s assets grow.
Other Benefits to the Manager. In addition to considering the profits realized by the Manager, the Board considered information that was provided regarding the direct and indirect benefits the Manager receives as a result of its relationship with the Fund, including
29 | OPPENHEIMER PENNSYLVANIA MUNICIPAL FUND
BOARD APPROVAL OF THE FUND’S INVESTMENT ADVISORY AGREEMENT Unaudited / Continued
compensation paid to the Manager’s affiliates. The Board also considered that the Manager must be able to pay and retain experienced professional personnel at competitive rates to provide quality services to the Fund.
Conclusions. These factors were also considered by the independent Trustees meeting separately from the full Board, assisted by experienced counsel to the Fund and to the independent Trustees. Fund counsel and the independent Trustees’ counsel are independent of the Manager within the meaning and intent of the Securities and Exchange Commission Rules.
Based on its review of the information it received and its evaluations described above, at meetings in June 2009, the Board, including a majority of the independent Trustees, decided to continue the Agreement for the period through November 30, 2009. In arriving at this decision, the Board did not single out any factor or factors as being more important than others, but considered all of the above information, and considered the terms and conditions of the Agreement, including the management fee, in light of all of the surrounding circumstances.
30 | OPPENHEIMER PENNSYLVANIA MUNICIPAL FUND
PORTFOLIO PROXY VOTING POLICIES AND PROCEDURES; UPDATES TO STATEMENTS OF INVESTMENTS Unaudited
The Fund has adopted Portfolio Proxy Voting Policies and Procedures under which the Fund votes proxies relating to securities (“portfolio proxies”) held by the Fund. A description of the Fund’s Portfolio Proxy Voting Policies and Procedures is available (i) without charge, upon request, by calling the Fund toll-free at 1.800.525.7048, (ii) on the Fund’s website at www.oppenheimerfunds.com, and (iii) on the SEC’s website at www.sec.gov. In addition, the Fund is required to file Form N-PX, with its complete proxy voting record for the 12 months ended June 30th, no later than August 31st of each year. The Fund’s voting record is available (i) without charge, upon request, by calling the Fund toll-free at 1.800.525.7048, and (ii) in the Form N-PX filing on the SEC’s website at www.sec.gov.
The Fund files its complete schedule of portfolio holdings with the SEC for the first quarter and the third quarter of each fiscal year on Form N-Q. The Fund’s Form N-Q filings are available on the SEC’s website at http://www.sec.gov. Those forms may be reviewed and copied at the SEC’s Public Reference Room in Washington, D.C. Information on the operation of the Public Reference Room may be obtained by calling 1-800-SEC-0330.
Householding—Delivery of Shareholder Documents
This is to inform you about OppenheimerFunds’ “householding” policy. If more than one member of your household maintains an account in a particular fund, OppenheimerFunds will mail only one copy of the fund’s prospectus, annual and semiannual report and privacy policy. The consolidation of these mailings, called householding, benefits your fund through reduced mailing expense, and benefits you by reducing the volume of mail you receive from OppenheimerFunds. Householding does not affect the delivery of your account statements.
Please note that we will continue to household these mailings for as long as you remain an OppenheimerFunds shareholder, unless you request otherwise. If you prefer to receive multiple copies of these materials, please call us at 1.800.CALL-OPP (225-5677). You may also notify us in writing or via email. We will begin sending you individual copies of the prospectus, reports and privacy policy within 30 days of receiving your request to stop householding.
31 | OPPENHEIMER PENNSYLVANIA MUNICIPAL FUND
TRUSTEES AND OFFICERS Unaudited
| | | |
Name, Position(s) Held with the
Fund, Length of Service, Age | | Principal Occupation(s) During the Past 5 Years; Other Trusteeships/Directorships Held; Number of Portfolios in the Fund Complex Currently Overseen |
INDEPENDENT TRUSTEES | | The address of each Trustee in the chart below is 6803 S. Tucson Way, Centennial, Colorado 80112-3924. Each Trustee serves for an indefinite term, or until his or her resignation, retirement, death or removal. |
| | | |
Brian F. Wruble,
Chairman of the Board of Trustees (since 2007),
Trustee (since 2005)
Age: 66 | | Chairman (since August 2007) and Trustee (since August 1991) of the Board of Trustees of The Jackson Laboratory (non-profit); Director of Special Value Opportunities Fund, LLC (registered investment company) (affiliate of the Manager’s parent company) (since September 2004); Member of Zurich Financial Investment Management Advisory Council (insurance) (since 2004); Treasurer and Trustee of the Institute for Advanced Study (non-profit educational institute) (since May 1992); General Partner of Odyssey Partners, L.P. (hedge fund) (September 1995-December 2007); Special Limited Partner of Odyssey Investment Partners, LLC (private equity investment) (January 1999-September 2004). Oversees 60 portfolios in the OppenheimerFunds complex. |
| | | |
David K. Downes,
Trustee (since 2007)
Age: 69 | | Independent Chairman GSK Employee Benefit Trust (since April 2006); Director of Correctnet (January 2006-2007); Trustee of Employee Trusts (since January 2006); Chief Executive Officer and Board Member of Community Capital Management (investment management company) (since January 2004); Director of Internet Capital Group (information technology company) (since October 2003); Independent Chairman of the Board of Trustees of Quaker Investment Trust (registered investment company) (2004-2007); President of The Community Reinvestment Act Qualified Investment Fund (investment management company) (since 2004); Chief Operating Officer and Chief Financial Officer of Lincoln National Investment Companies, Inc. (subsidiary of Lincoln National Corporation, a publicly traded company) and Delaware Investments U.S., Inc. (investment management subsidiary of Lincoln National Corporation) (1993-2003); President, Chief Executive Officer and Trustee of Delaware Investment Family of Funds (1993-2003); President and Board Member of Lincoln National Convertible Securities Funds, Inc. and the Lincoln National Income Funds, TDC (1993-2003); Chairman and Chief Executive Officer of Retirement Financial Services, Inc. (registered transfer agent and investment adviser and subsidiary of Delaware Investments U.S., Inc.) (1993-2003); President and Chief Executive Officer of Delaware Service Company, Inc. (1995-2003); Chief Administrative Officer, Chief Financial Officer, Vice Chairman and Director of Equitable Capital Management Corporation (investment subsidiary of Equitable Life Assurance Society) (1985-1992); Corporate Controller of Merrill Lynch & Company (financial services holding company) (1977-1985); held the following positions at the Colonial Penn Group, Inc. (insurance company): Corporate Budget Director (1974-1977), Assistant Treasurer (1972-1974) and Director of Corporate Taxes (1969-1972); held the following positions at Price Waterhouse & Company (financial services firm): Tax Manager (1967-1969), Tax Senior (1965-1967) and Staff Accountant (1963-1965); United States Marine Corps (1957-1959). Oversees 60 portfolios in the OppenheimerFunds complex. |
| | | |
Matthew P. Fink,
Trustee (since 2005)
Age: 68 | | Trustee of the Committee for Economic Development (policy research foundation) (since 2005); Director of ICI Education Foundation (education foundation) (October 1991-August 2006); President of the Investment Company Institute (trade association) (October 1991-June 2004); Director of ICI Mutual Insurance Company (insurance company) (October 1991-June 2004). Oversees 60 portfolios in the OppenheimerFunds complex. |
32 | OPPENHEIMER PENNSYLVANIA MUNICIPAL FUND
| | | |
Name, Position(s) Held with the
Fund, Length of Service, Age | | Principal Occupation(s) During the Past 5 Years; Other Trusteeships/Directorships Held; Number of Portfolios in the Fund Complex Currently Overseen |
Phillip A. Griffiths,
Trustee (since 1999)
Age: 70 | | Fellow of the Carnegie Corporation (since 2007); Distinguished Presidential Fellow for International Affairs (since 2002) and Member (since 1979) of the National Academy of Sciences; Council on Foreign Relations (since 2002); Director of GSI Lumonics Inc. (precision technology products company) (since 2001); Senior Advisor of The Andrew W. Mellon Foundation (since 2001); Chair of Science Initiative Group (since 1999); Member of the American Philosophical Society (since 1996); Trustee of Woodward Academy (since 1983); Foreign Associate of Third World Academy of Sciences; Director of the Institute for Advanced Study (1991-2004); Director of Bankers Trust New York Corporation (1994-1999); Provost at Duke University (1983-1991). Oversees 60 portfolios in the OppenheimerFunds complex. |
| | | |
Mary F. Miller,
Trustee (since 2004)
Age: 66 | | Trustee of International House (not-for-profit) (since June 2007); Trustee of the American Symphony Orchestra (not-for-profit) (since October 1998); and Senior Vice President and General Auditor of American Express Company (financial services company) (July 1998-February 2003). Oversees 60 portfolios in the OppenheimerFunds complex. |
| | | |
Joel W. Motley,
Trustee (since 2002)
Age: 57 | | Managing Director of Public Capital Advisors, LLC (privately held financial advisor) (since January 2006); Managing Director of Carmona Motley, Inc. (privately-held financial advisor) (since January 2002); Director of Columbia Equity Financial Corp. (privately-held financial advisor) (2002-2007); Managing Director of Carmona Motley Hoffman Inc. (privately-held financial advisor) (January 1998-December 2001); Member of the Finance and Budget Committee of the Council on Foreign Relations, Member of the Investment Committee of the Episcopal Church of America, Member of the Investment Committee and Board of Human Rights Watch and Member of the Investment Committee of Historic Hudson Valley. Oversees 60 portfolios in the OppenheimerFunds complex. |
| | | |
Mary Ann Tynan,
Trustee (since 2008)
Age: 63 | | Vice Chair of Board of Trustees of Brigham and Women’s/Faulkner Hospital (non-profit hospital) (since 2000); Chair of Board of Directors of Faulkner Hospital (non-profit hospital) (since 1990); Member of Audit and Compliance Committee of Partners Health Care System (non-profit) (since 2004); Board of Trustees of Middlesex School (educational institution) (since 1994); Board of Directors of Idealswork, Inc. (financial services provider) (since 2003); Partner, Senior Vice President and Director of Regulatory Affairs of Wellington Management Company, LLP (global investment manager) (1976-2002); Vice President and Corporate Secretary, John Hancock Advisers, Inc. (mutual fund investment adviser) (1970-1976). Oversees 60 portfolios in the OppenheimerFunds complex. |
| | | |
Joseph M. Wikler,
Trustee (since 2005)
Age: 68 | | Director of C-TASC (bio-statistics services (since 2007); Director of the following medical device companies: Medintec (since 1992) and Cathco (since 1996); Member of the Investment Committee of the Associated Jewish Charities of Baltimore (since 1994); Director of Lakes Environmental Association (environmental protection organization) (1996-2008); Director of Fortis/Hartford mutual funds (1994-December 2001). Oversees 60 portfolios in the OppenheimerFunds complex. |
| | | |
Peter I. Wold,
Trustee (since 2005)
Age: 61 | | Director and Chairman of Wyoming Enhanced Oil Recovery Institute Commission (enhanced oil recovery study) (since 2004); President of Wold Oil Properties, Inc. (oil and gas exploration and production company) (since 1994); Vice President of American Talc Company, Inc. (talc mining and milling) (since 1999); Managing Member of Hole-in-the-Wall Ranch (cattle ranching) (since 1979); Director and Chairman of the Denver Branch of the Federal Reserve Bank of Kansas City (1993-1999); and Director of PacifiCorp. (electric utility) (1995-1999). Oversees 60 portfolios in the OppenheimerFunds complex. |
33 | OPPENHEIMER PENNSYLVANIA MUNICIPAL FUND
TRUSTEES AND OFFICERS Unaudited / Continued
| | | |
Name, Position(s) Held with the
Fund, Length of Service, Age | | Principal Occupation(s) During the Past 5 Years; Other Trusteeships/Directorships Held; Number of Portfolios in the Fund Complex Currently Overseen |
INTERESTED TRUSTEE | | The address of Mr. Reynolds is 6803 S. Tucson Way, Centennial, Colorado 80112-3924. Mr. Reynolds serves for an indefinite term, or until his resignation, retirement, death or removal. Mr. Reynolds is an “Interested Trustee” because of a potential consulting relationship between RSR Partners, which Mr. Reynolds may be deemed to control, and the Manager. |
| | | |
Russell S. Reynolds, Jr.,
Trustee (since 1989)
Age: 77 | | Chairman of RSR Partners (formerly “The Directorship Search Group, Inc.”) (corporate governance consulting and executive recruiting) (since 1993); Retired CEO of Russell Reynolds Associates (executive recruiting) (October 1969-March 1993); Life Trustee of International House (non-profit educational organization); Former Trustee of The Historical Society of the Town of Greenwich; Former Director of Greenwich Hospital Association. Oversees 60 portfolios in the OppenheimerFunds complex. |
| | | |
INTERESTED TRUSTEE
AND OFFICER | | The address of Mr. Murphy is Two World Financial Center, 225 Liberty Street, 11th Floor, New York, New York 10281-1008. Mr. Murphy serves as a Trustee for an indefinite term, or until his resignation, retirement, death or removal and as an Officer for an indefinite term, or until his resignation, retirement, death or removal. Mr. Murphy is an interested Trustee due to his positions with OppenheimerFunds, Inc. and its affiliates. |
| | | |
John V. Murphy,
Trustee, President and
Principal Executive Officer
(since 2001)
Age: 60 | | Chairman and Director of the Manager (since June 2001); Chief Executive Officer of the Manager (June 2001-December 2008); President of the Manager (September 2000-February 2007); President and director or trustee of other Oppenheimer funds; President and Director of Oppenheimer Acquisition Corp. (“OAC”) (the Manager’s parent holding company) and of Oppenheimer Partnership Holdings, Inc. (holding company subsidiary of the Manager) (since July 2001); Director of OppenheimerFunds Distributor, Inc. (subsidiary of the Manager) (November 2001-December 2006); Chairman and Director of Shareholder Services, Inc. and of Shareholder Financial Services, Inc. (transfer agent subsidiaries of the Manager) (since July 2001); President and Director of OppenheimerFunds Legacy Program (charitable trust program established by the Manager) (since July 2001); Director of the following investment advisory subsidiaries of the Manager: OFI Institutional Asset Management, Inc., Centennial Asset Management Corporation and Trinity Investment Management Corporation (since November 2001), HarbourView Asset Management Corporation and OFI Private Investments, Inc. (since July 2001); President (since November 2001) and Director (since July 2001) of Oppenheimer Real Asset Management, Inc.; Executive Vice President of Massachusetts Mutual Life Insurance Company (OAC’s parent company) (since February 1997); Director of DLB Acquisition Corporation (holding company parent of Babson Capital Management LLC) (since June 1995); Chairman (since October 2007) and Member of the Investment Company Institute’s Board of Governors (since October 2003). Oversees 98 portfolios in the OppenheimerFunds complex. |
| | | |
OTHER OFFICERS OF
THE FUND | | The addresses of the Officers in the chart below are as follows: for Mr. Zack, Two World Financial Center, 225 Liberty Street, New York, New York 10281-1008, for Messrs. Vandehey and Wixted, 6803 S. Tucson Way, Centennial, Colorado 80112-3924, for Messrs. Loughran, Cottier, Willis, DeMitry, Camarella and Stein, 350 Linden Oaks, Rochester, New York 14625. Each Officer serves for an indefinite term or until his or her resignation, retirement, death or removal. |
34 | OPPENHEIMER PENNSYLVANIA MUNICIPAL FUND
| | | |
Name, Position(s) Held with the
Fund, Length of Service, Age | | Principal Occupation(s) During the Past 5 Years; Other Trusteeships/Directorships Held; Number of Portfolios in the Fund Complex Currently Overseen |
Daniel G. Loughran,
Vice President and Senior
Portfolio Manager
(since 2005)
Age: 45 | | Senior Vice President of the Manager (since August 2007); Vice President of the Manager (April 2001-July 2007) and a Portfolio Manager with the Manager (1999-2005). Team leader, a Senior Portfolio Manager, an officer and a trader for the Fund and other Oppenheimer funds. |
| | | |
Scott S. Cottier,
Vice President
(since 2005)
and Senior Portfolio
Manager
(since 2002)
Age: 37 | | Vice President of the Manager (since September 2002). Portfolio Manager and trader at Victory Capital Management (1999-2002). Senior Portfolio Manager, an officer and a trader for the Fund and other Oppenheimer funds. |
| | | |
Troy E. Willis,
Vice President
(since 2005)
and Senior Portfolio
Manager
(since 2006)
Age: 36 | | Vice President of the Manager (since July 2009); Assistant Vice President of the Manager (July 2005-July 2009). Portfolio Manager of the Manager (2002- 2005). Corporate Attorney for Southern Resource Group (1999-2003). Senior Portfolio Manager, an officer and a trader for the Fund and other Oppenheimer funds. |
| | | |
Mark R. DeMitry,
Vice President and Senior
Portfolio Manager
(since 2009)
Age: 33 | | Vice President of the Manager (since July 2009); Associate Portfolio Manager of the Fund (2006-2009). Research analyst of the Manager (June 2003-September 2006) and a credit analyst of the Manager (July 2001-May 2003). Senior Portfolio Manager, an officer and a trader for the Fund and other Oppenheimer funds. |
| | | |
Michael L. Camarella,
Vice President
(since 2009)
and Associate Portfolio
Manager (since 2008)
Age: 33 | | Assistant Vice President of the Manager (since July 2009). Research analyst of the Manager (February 2006-April 2008) and a credit analyst of the Manager (June 2003-January 2006). Associate Portfolio Manager, an officer and a trader for the Fund and other Oppenheimer funds. |
| | | |
Richard Stein,
Vice President
(since 2007)
Age: 51 | | Director (since 2003) and head of the Rochester Credit Analysis team (since 1993). Vice President of the Manager (since 1997). An officer of the Fund and other Oppenheimer Funds. |
| | | |
Mark S. Vandehey,
Vice President and Chief
Compliance Officer
(since 2004)
Age: 58 | | Senior Vice President and Chief Compliance Officer of the Manager (since March 2004); Chief Compliance Officer of OppenheimerFunds Distributor, Inc., Centennial Asset Management and Shareholder Services, Inc. (since March 2004); Vice President of OppenheimerFunds Distributor, Inc., Centennial Asset Management Corporation and Shareholder Services, Inc. (since June 1983); Former Vice President and Director of Internal Audit of the Manager (1997-February 2004). An officer of 98 portfolios in the OppenheimerFunds complex. |
| | | |
Brian W. Wixted,
Treasurer and Principal
Financial & Accounting
Officer (since 1999)
Age: 49 | | Senior Vice President of the Manager (since March 1999); Treasurer of the Manager and the following: HarbourView Asset Management Corporation, Shareholder Financial Services, Inc., Shareholder Services, Inc., Oppenheimer Real Asset Management, Inc. and Oppenheimer Partnership Holdings, Inc. (March 1999-June 2008), OFI Private Investments, Inc. (March 2000-June 2008), OppenheimerFunds International Ltd. and OppenheimerFunds plc (since May 2000), OFI Institutional Asset Management, Inc. (since November 2000), and OppenheimerFunds Legacy Program (charitable trust program established by the Manager) (since June 2003); Treasurer and Chief Financial Officer of OFI Trust Company (trust company subsidiary of the Manager) (since May 2000); Assistant Treasurer of the following: OAC (March 1999-June 2008), Centennial Asset Management Corporation (March 1999-October 2003) and OppenheimerFunds Legacy Program (April 2000-June 2003). An officer of 98 portfolios in the OppenheimerFunds complex. |
35 | OPPENHEIMER PENNSYLVANIA MUNICIPAL FUND
TRUSTEES AND OFFICERS Unaudited / Continued
| | | |
Name, Position(s) Held with the
Fund, Length of Service, Age | | Principal Occupation(s) During the Past 5 Years; Other Trusteeships/Directorships Held; Number of Portfolios in the Fund Complex Currently Overseen |
Robert G. Zack,
Secretary (since 2001)
Age: 60 | | Executive Vice President (since January 2004) and General Counsel (since March 2002) of the Manager; General Counsel and Director of the Distributor (since December 2001); General Counsel of Centennial Asset Management Corporation (since December 2001); Senior Vice President and General Counsel of HarbourView Asset Management Corporation (since December 2001); Secretary and General Counsel of OAC (since November 2001); Assistant Secretary (since September 1997) and Director (since November 2001) of OppenheimerFunds International Ltd. and OppenheimerFunds plc; Vice President and Director of Oppenheimer Partnership Holdings, Inc. (since December 2002); Director of Oppenheimer Real Asset Management, Inc. (since November 2001); Senior Vice President, General Counsel and Director of Shareholder Financial Services, Inc. and Shareholder Services, Inc. (since December 2001); Senior Vice President, General Counsel and Director of OFI Private Investments, Inc. and OFI Trust Company (since November 2001); Vice President of OppenheimerFunds Legacy Program (since June 2003); Senior Vice President and General Counsel of OFI Institutional Asset Management, Inc. (since November 2001); Director of OppenheimerFunds International Distributor Limited (since December 2003); Senior Vice President (May 1985- December 2003). An officer of 98 portfolios in the OppenheimerFunds complex. |
The Fund’s Statement of Additional Information contains additional information about the Fund’s Trustees and Officers and is available without charge upon request, by calling 1.800.525.7048.
36 | OPPENHEIMER PENNSYLVANIA MUNICIPAL FUND
| July 31, 2009 Oppenheimer Management Rochester National Commentaries and Municipals Annual Report M A N A G E M E N T C O M M E N TA R I E S An Interview with Your Fund’s Portfolio Managers A N N U A L R E P O RT Listing of Top Holdings Fund Performance Discussion Listing of Investments Financial Statements “Technology allows investors to be more informed than ever, but it doesn’t change our advice to shareholders: Invest for the long term and let tax-free income compound over time.” — Dan Loughran, Senior Vice President, Senior Portfolio Manager and Team Leader, OppenheimerFunds/Rochester |
TOP HOLDINGS AND ALLOCATIONS
| | | | | |
| Top Ten Categories | | | | |
| |
| Tobacco—Master Settlement Agreement | | | 18.3 | % |
| Special Assessment | | | 15.6 | |
| Airlines | | | 14.3 | |
| Hospital/Health Care | | | 6.9 | |
| Gas Utilities | | | 6.6 | |
| Multifamily Housing | | | 4.4 | |
| Tax Increment Financing (TIF) | | | 4.3 | |
| Adult Living Facilities | | | 3.3 | |
| Energy Equipment & Services | | | 2.7 | |
| Electric Utilities | | | 2.1 | |
Portfolio holdings are subject to change. Percentages are as of July 31, 2009, and are based on total assets.
| | | | | |
| Credit Allocation | | | | |
| |
| AAA | | | 19.0 | % |
| AA | | | 14.7 | |
| A | | | 2.0 | |
| BBB | | | 18.5 | |
| BB or lower | | | 45.8 | |
Allocations are subject to change. Percentages are as of July 31, 2009, and are dollar-weighted based on the total market value of investments. Market value, the total value of the Fund’s securities, does not include cash. Securities rated by any rating organization are included in the equivalent Standard & Poor’s rating category in the allocation above. The allocation above also includes unrated securities whose ratings have been assigned by the Manager; these unrated securities, currently 44.43% of the Fund’s market value, are deemed comparable in the Manager’s judgment to the rated securities in each category. Credit ratings of AAA, AA, A and BBB and their equivalents denote investment-grade securities.
13 | OPPENHEIMER ROCHESTER NATIONAL MUNICIPALS
FUND PERFORMANCE DISCUSSION
How has the Fund performed? Below is a discussion by OppenheimerFunds, Inc., of the Fund’s performance during its fiscal year ended July 31, 2009, followed by a graphical comparison of the Fund’s performance to appropriate broad-based market indices.
Management’s Discussion of Fund Performance. The 12-month period ended July 31, 2009, will long be remembered for the credit market’s volatility and illiquidity in its early months and for the recovery in municipal bond prices that began in the waning weeks of 2008. Despite the mid-period turnaround, the net asset value (NAV) of Oppenheimer Rochester National Municipals’ Class A shares declined between July 31, 2008, and July 31, 2009, causing the Fund to produce negative total returns. The
1-year total return for Class A shares was –26.44% at NAV and –29.94% at the maximum offering price (or with sales charges). As of July 31, 2009, the Fund’s Class A shares nonetheless provided the highest level of tax-free income among its peer funds, according to Lipper Inc., and more income on a tax-equivalent basis than many corporate fixed-income alternatives. As of July 31, 2009, the distribution yield for the Fund’s Class A shares was 9.39% at NAV.1
In all, Oppenheimer Rochester National Municipals distributed 62.9 cents per Class A share this reporting period, including a small amount of taxable income. The Fund’s dividend came under sharp pressure in the latter half of this reporting period and had to be reduced by 1.1 cents per share, to 4.6, starting with the March payout.
At the end of this reporting period, the Fund had nearly 1,275 holdings and an average credit quality of BBB. Despite the broad turmoil in the municipal market in the first half of this reporting period, the default rate for bonds in the portfolio remained within expectations throughout this reporting period.
As the charts on pages 20 to 22 show, the Fund’s total returns were negative this reporting period, which was characterized at times by sharp declines in equity and credit markets, heightened investor concern about risk, and widening credit spreads. Credit spread widening is typically more detrimental to the sectors and types of securities this Fund favors than to the Fund’s benchmark. Because our approach to fund management involves creating broad portfolios with holdings from across the full credit spectrum, this Fund’s performance can be undercut by prolonged cycles of credit spread widening. Widening spreads typically have the greatest negative effect on BBB-rated, lower-rated and unrated securities. The reverse is also true: as spreads tighten, BBB-rated, lower-rated and unrated securities typically outperform other securities. While we believe that this latest cycle of spread widening has run its course, this Fund continues to feel its impact. We still believe that our Fund’s investments offer structural advantages over the long term, and we encourage investors to remain focused on their long-term financial objectives for high levels of tax-free income.
| | |
| 1. | | Falling share prices artificially increase yields. |
14 | OPPENHEIMER ROCHESTER NATIONAL MUNICIPALS
The Fund’s underperformance can be attributed, in part, to its holdings in bonds backed by proceeds from the tobacco Master Settlement Agreement (the MSA), the national litigation settlement with U.S. tobacco manufacturers. At the end of this reporting period, MSA-backed tobacco bonds accounted for 18.3% of the Fund’s total assets and comprised the Fund’s largest sector.2
The sector typically offers high-yielding securities, many of which are prone to price volatility. Widening credit spreads and other market factors (like supply and demand) typically contribute to volatility. S&P and Fitch each revised their assessments of this sector during this reporting period, but we do not believe that the prices of “tobacco bonds” were affected consequentially.
In the latter half of this reporting period, media reports focused on two tobacco-related developments: the April 1 increase in cigarette taxes and the President’s signature on the Family Smoking Prevention and Tobacco Control Act, which put the Food and Drug Administration in charge of regulating the making and marketing of cigarettes and other tobacco products.
We do not agree with the analysts who opined that these developments represent new threats to the MSA or the bonds backed by MSA payments. Nor are we concerned about the long-term viability of the MSA. Here’s why: First, consumption trends over the years have largely tracked the forecasts that were built into MSA-backed bonds, and this has been true even as the cost of a pack of cigarettes has steadily risen. There is little reason to believe that the new tax will significantly alter consumers’ smoking habits. Second, putting the FDA in charge of tobacco regulation was strongly advocated by Philip Morris, the country’s leading cigarette manufacturer. We think it unlikely that the company would have backed a plan that it thought would hurt its industry. Further, the company is not alone in believing that smaller companies will have a harder time complying with new regulations and will thus cede share to the market’s leading players. This, in turn, should improve MSA revenues and encourage early redemptions of existing bonds.
| | |
| 2. | | Investments in “tobacco bonds,” which are backed by the proceeds a state or territory receives from the 1998 national litigation settlement with tobacco manufacturers, may be vulnerable to economic and/or legislative events that affect issuers in a particular municipal market sector. Annual payments by MSA-participating manufacturers, for example, hinge on many factors, including annual domestic cigarette shipments, inflation and the relative market share of non-participating manufacturers. While consumption has largely been in line with the assumptions used to structure MSA-backed bonds, future MSA payments could be reduced if consumption were to fall more rapidly than originally forecast. |
15 | OPPENHEIMER ROCHESTER NATIONAL MUNICIPALS
FUND PERFORMANCE DISCUSSION
We continue to believe that the carefully researched tobacco bonds this Fund owns remain fundamentally sound. As they always have, the tobacco bonds this Fund held during this reporting period made all scheduled interest payments in a timely manner. Thus, these bonds helped the Fund provide significant yield advantages to shareholders.
Also this reporting period, the Fund remained invested in land development (or “dirt”) bonds, which are Special Assessment and Special Tax bonds that help finance the infrastructure needs of new real estate development. At the end of this reporting period, the Special Assessment and Special Tax sectors represented 15.6% and 2.0% of the Fund’s total assets, respectively. While the short-term performance of these bonds was detrimental to Fund performance this reporting period, the Fund’s land development holdings typically offer attractive yields. These in turn can help the Fund generate high levels of tax-free income, as we have seen this reporting period.
In our opinion, these bonds have several appealing characteristics: their credit ratings typically improve over time, the debt service payments securing these bonds are on parity with real estate taxes and senior to mortgage payments, and assessments or taxes must be paid by whoever owns the land when the tax bill comes due. These characteristics give us confidence that most “dirt bonds” represent good values for our long-time shareholders.
Nonetheless, the market continues to exhibit unusual price pressure on “dirt bonds,” even those with improving credit qualities. For example, the Fund has invested in Villa Portofino West (Fla.) Community Development District bonds, which were purchased at par based on several attractive characteristics, including a favorable land-to-lien ratio (1.8 to 1). We also liked that the proceeds from these Special Assessment bonds, issued in 2006, would be used to repay an experienced developer who had already completed the property’s master infrastructure. The developer has since built and sold 98% of the property’s townhouses and, as a result, the land-to-lien ratio has jumped to an estimated 11.5 to 1. Despite the sharply improved ratio, which serves to strengthen the credit, the price on these bonds has declined (as have the prices on many lower-rated or unrated bonds in this and other muni sectors).
The majority of the Fund’s investments in Special Tax and Special Assessment bonds have generated high levels of tax-free income this reporting period. However, the same cannot be said of some of the “dirt bonds” issued in Florida. Many were placed on non-accrual, reflecting our belief that scheduled interest payments might not be made in accordance with the bond covenant. For example, the Fund’s non-accrual list includes some bonds for which issuers used debt-service reserves to make the May interest payment. Our current expectation is that some Florida issuers will rectify their covenant
16 | OPPENHEIMER ROCHESTER NATIONAL MUNICIPALS
violations once the tax certification process helps them replenish debt service reserves, and that banks and/or new developers will assume responsibility for some other payments. While it is always disappointing to see an issuer violate its bond covenant, we remain optimistic about these sectors in general and are confident that our value-driven approach to security selection should continue to deliver above-market yields for years to come.
The Fund’s airline holdings represented 14.3% of total assets as of July 31, 2009. Many of the Fund’s holdings are backed by a security interest in the airport terminal buildings or maintenance facilities whose construction they finance and, as a result, these bonds offer investors valuable collateral. Fuel costs, which had peaked at $147 a barrel in July 2008, fell back considerably by the end of this reporting period. However, both Moody’s and S&P remain pessimistic about industry economics, and their reports contributed to price volatility this reporting period. As a result, the sector was detrimental to Fund performance this reporting period. Our experience in this sector nonetheless leads us to believe that most issuers of airline-backed securities in this Fund will remain current with the principal and interest payments, as they have done in the past.
As of July 31, 2009, the Fund was invested in the hospital/health care sector (6.9% of the Fund’s total assets) and in the gas and electric utilities sectors (6.6% and 2.1% of the Fund’s total assets, respectively). Our holdings in these sectors consist of securities in the mid-range of the credit spectrum as well as some insured bonds. The overall fundamentals in these sectors remained stable this reporting period, but widening credit spreads during the first half of the reporting period were detrimental to 12-month performance. Since the beginning of calendar year 2009, these sectors have posted positive results.
Investments in bonds backed by two companies that filed for bankruptcy this reporting period also contributed to the Fund’s underperformance. Securities issued to finance pollution control efforts at General Motors were adversely affected by the automaker’s bankruptcy filing. When the reorganization was completed, about half of the Fund’s holdings in GM-backed bonds were affirmed as they were tied to assets of the “new GM.” The Fund’s unsecured GM credits experienced sharp price declines this reporting period and are not expected to have any meaningful recovery; they constituted less than one-twentieth of 1% of net assets as of July 31, 2009. This outcome, though less than initially anticipated, is superior to the one faced by investors in GM’s corporate bonds or stock. The Fund was also an unsecured creditor of AbitibiBowater, Inc., a large newsprint maker that sought bankruptcy protection in April 2009. Bond prices suffered despite the company’s progress in its efforts to streamline U.S and Canadian operations and to simplify its management structure. It did not help that the company’s efforts coincided with record losses
17 | OPPENHEIMER ROCHESTER NATIONAL MUNICIPALS
FUND PERFORMANCE DISCUSSION
for the top 100 global forest, paper and packaging companies, according to an annual PricewaterhouseCoopers study. These bonds represented less than one-fifth of 1% of net assets at the end of that reporting period.
As reported in the July 31, 2008, report to shareholders, the operators of the E-3 Mead-Biofuels plant filed for bankruptcy protection after escalating repair costs derailed the plant’s start-up. The Fund holds Saunders County, Nebraska, Industrial Development revenue bonds that helped finance the plant, which was designed to make methane from manure and to manufacture ethanol. The issuer has failed to make scheduled interest payments. We have helped management identify potential buyers for the plant and are cautiously optimistic that a buyer can be found; were this to occur, we believe that the Fund would recoup some of the value that has been lost. As of July 31, 2009, the investment represented less than one-fifth of 1% of the Fund’s net assets. The Energy Equipment & Services sector comprised 2.7% of the Fund’s total assets on that date.
During this reporting period, the Fund remained invested in municipal inverse-floating-rate securities, which are tax-exempt securities with interest payments that move inversely to changes in short-term interest rates. These “inverse floaters” generally offer higher tax-free yields than fixed-rate bonds of comparable maturity and credit quality, but they often face greater price volatility, too. When the short-term market faced unprecedented turmoil in the first half of this reporting period, the income that muni funds across the industry earned from this type of security was diminished. We continue to believe that “inverse floaters” belong in our fund portfolios because they produce attractive yields under most market conditions.
Other floating-rate bonds performed poorly this reporting period as short-term variable rates declined.
Additionally, the Fund’s line of credit increased partway through this reporting period. The Fund used its line of credit at times to avoid having to sell tax-free assets at lower-than-acceptable prices. The Fund also used it opportunistically to buy yield-enhancing securities.
Our approach to municipal bond investing is flexible and responsive to market conditions. Shareholders should note that market conditions during this reporting period did not affect the Fund’s overall investment strategies or cause it to pay any capital gain distributions. In closing, we believe that the Fund’s structure and composition as well as our time-tested strategies will continue to benefit long-term investors through interest rate and economic cycles.
18 | OPPENHEIMER ROCHESTER NATIONAL MUNICIPALS
Comparing the Fund’s Performance to the Market. The graphs that follow show the performance of a hypothetical $10,000 investment in each class of shares of the Fund held until July 31, 2009. In the case of Class A, Class B and Class C shares, performance is measured over a ten-year period. The Fund’s performance reflects the deduction of the maximum initial sales charge on Class A shares, the applicable contingent deferred sales charge on Class B and Class C shares, and reinvestments of all dividends and capital gains distributions. Past performance cannot guarantee future results.
The Fund’s performance is compared to the performance of the Barclays Capital Municipal Bond Index, an unmanaged index of a broad range of investment grade municipal bonds that is widely regarded as a measure of the performance of the general municipal bond market. Index performance reflects the reinvestment of income but does not consider the effect of transaction costs, and none of the data in the graphs shows the effect of taxes. The Fund’s performance is also compared to the Consumer Price Index, a non-securities index that measures changes in the inflation rate. The Fund’s performance reflects the effects of the Fund’s business and operating expenses. While index comparisons may be useful to provide a benchmark for the Fund’s performance, it must be noted that the Fund’s investments are not limited to the investments in the index.
19 | OPPENHEIMER ROCHESTER NATIONAL MUNICIPALS
FUND PERFORMANCE DISCUSSION
Class A Shares
Comparison of Change in Value of $10,000 Hypothetical Investments in:
20 | OPPENHEIMER ROCHESTER NATIONAL MUNICIPALS
Class B Shares
Comparison of Change in Value of $10,000 Hypothetical Investments in:
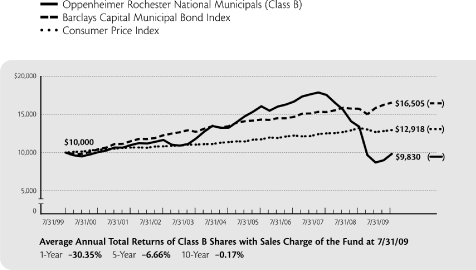
The performance data quoted represents past performance, which does not guarantee future results. The investment return and principal value of an investment in the Fund will fluctuate so that an investor’s shares, when redeemed, may be worth more or less than their original cost. Current performance may be lower or higher than the performance quoted. For performance data current to the most recent month end, visit us at www.oppenheimerfunds.com, or call us at 1.800.525.7048. Fund returns include changes in share price, reinvested distributions, and the applicable sales charge for Class A shares, the current maximum initial sales charge of 4.75%; for Class B shares, the contingent deferred sales charge of 5% (1-year) and 2% (5-year); and for Class C shares, the 1% contingent deferred sales charge for the 1-year period. Because Class B shares convert to Class A shares 72 months after purchase, the 10-year return for Class B uses Class A performance for the period after conversion. See page 23 for further information.
21 | OPPENHEIMER ROCHESTER NATIONAL MUNICIPALS
FUND PERFORMANCE DISCUSSION
Class C Shares
Comparison of Change in Value of $10,000 Hypothetical Investments in:
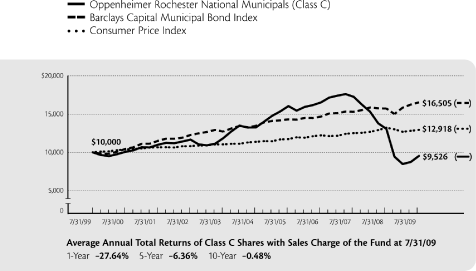
The performance data quoted represents past performance, which does not guarantee future results. The investment return and principal value of an investment in the Fund will fluctuate so that an investor’s shares, when redeemed, may be worth more or less than their original cost. Current performance may be lower or higher than the performance quoted. For performance data current to the most recent month end, visit us at www.oppenheimerfunds.com, or call us at 1.800.525.7048. Fund returns include changes in share price, reinvested distributions, and the applicable sales charge for Class A shares, the current maximum initial sales charge of 4.75%; for Class B shares, the contingent deferred sales charge of 5% (1-year) and 2% (5-year); and for Class C shares, the 1% contingent deferred sales charge for the 1-year period. Because Class B shares convert to Class A shares 72 months after purchase, the 10-year return for Class B uses Class A performance for the period after conversion. See page 23 for further information.
22 | OPPENHEIMER ROCHESTER NATIONAL MUNICIPALS
NOTES
Total returns and the ending account values in the graphs include changes in share price and reinvestment of dividends and capital gains distributions in a hypothetical investment for the periods shown. Cumulative total returns are not annualized. The Fund’s total returns shown do not reflect the deduction of income taxes on an individual’s investment. Taxes may reduce your actual investment returns on income or gains paid by the Fund or any gains you may realize if you sell your shares.
This annual report must be preceded or accompanied by the current prospectus of the Oppenheimer Rochester National Municipals. Before investing in any of the Oppenheimer funds, investors should carefully consider a fund’s investment objectives, risks, charges and expenses. Fund prospectuses contain this and other information about the funds. For more information, ask your financial advisor, call us at 1.800.525.7048, or visit our website at www.oppenheimerfunds.com. Read prospectuses carefully before investing.
The Fund’s investment strategy and focus can change over time. The mention of specific fund holdings does not constitute a recommendation by OppenheimerFunds, Inc.
Class A shares of the Fund were first publicly offered on 10/1/93. The average annual total returns are shown net of the applicable 4.75% maximum initial sales charge.
Class B shares of the Fund were first publicly offered on 10/1/93. The average annual total returns are shown net of the applicable contingent deferred sales charge of 5% (1-year) and 2% (5-year). Because Class B shares convert to Class A shares 72 months after purchase, the 10-year return for Class B uses Class A performance for the period after conversion. Class B shares are subject to an annual 0.75% asset-based sales charge.
Class C shares of the Fund were first publicly offered on 8/29/95. The average annual total returns are shown net of the applicable 1% contingent deferred sales charge for the 1-year period. Class C shares are subject to an annual 0.75% asset-based sales charge.
An explanation of the calculation of performance is in the Fund’s Statement of Additional Information.
23 | OPPENHEIMER ROCHESTER NATIONAL MUNICIPALS
FUND EXPENSES
Fund Expenses. As a shareholder of the Fund, you incur two types of costs: (1) transaction costs, which may include sales charges (loads) on purchase payments, contingent deferred sales charges on redemptions; and redemption fees (if applicable); and (2) ongoing costs, including management fees; distribution and service fees; and other Fund expenses. These examples are intended to help you understand your ongoing costs (in dollars) of investing in the Fund and to compare these costs with the ongoing costs of investing in other mutual funds.
The examples are based on an investment of $1,000.00 invested at the beginning of the period and held for the entire 6-month period ended July 31, 2009.
Actual Expenses. The first section of the table provides information about actual account values and actual expenses. You may use the information in this section for the class of shares you hold, together with the amount you invested, to estimate the expense that you paid over the period. Simply divide your account value by $1,000.00 (for example, an $8,600.00 account value divided by $1,000.00 = 8.60), then multiply the result by the number in the first section under the heading entitled “Expenses Paid During Period” to estimate the expenses you paid on your account during this period.
Hypothetical Example for Comparison Purposes. The second section of the table provides information about hypothetical account values and hypothetical expenses based on the Fund’s actual expense ratio for each class of shares, and an assumed rate of return of 5% per year for each class before expenses, which is not the actual return. The hypothetical account values and expenses may not be used to estimate the actual ending account balance or expenses you paid for the period. You may use this information to compare the ongoing costs of investing in the Fund and other funds. To do so, compare this 5% hypothetical example for the class of shares you hold with the 5% hypothetical examples that appear in the shareholder reports of the other funds.
Please note that the expenses shown in the table are meant to highlight your ongoing costs only and do not reflect any transactional costs, such as front-end or contingent deferred sales charges (loads), or a $12.00 fee imposed annually on accounts valued at less than $500.00 (subject to exceptions described in
24 | OPPENHEIMER ROCHESTER NATIONAL MUNICIPALS
the Statement of Additional Information). Therefore, the “hypothetical” section of the table is useful in comparing ongoing costs only, and will not help you determine the relative total costs of owning different funds. In addition, if these transactional costs were included, your costs would have been higher.
| | | | | | | | | | | | | |
| | | Beginning | | | Ending | | | Expenses | |
| | | Account | | | Account | | | Paid During | |
| | | Value | | | Value | | | 6 Months Ended | |
| | | February 1, 2009 | | | July 31, 2009 | | | July 31, 2009 | |
| |
| Actual |
| Class A | | $ | 1,000.00 | | | $ | 1,129.70 | | | $ | 16.17 | |
| Class B | | | 1,000.00 | | | | 1,126.50 | | | | 20.80 | |
| Class C | | | 1,000.00 | | | | 1,125.60 | | | | 20.31 | |
| | | | | | | | | | | | | |
Hypothetical
(5% return before expenses) | | | | | | | | | | | | |
| Class A | | | 1,000.00 | | | | 1,009.72 | | | | 15.26 | |
| Class B | | | 1,000.00 | | | | 1,005.41 | | | | 19.63 | |
| Class C | | | 1,000.00 | | | | 1,005.85 | | | | 19.18 | |
Expenses are equal to the Fund’s annualized expense ratio for that class, multiplied by the average account value over the period, multiplied by 181/365 (to reflect the one-half year period). Those annualized expense ratios based on the 6-month period ended July 31, 2009 are as follows:
| | | | | |
| Class | | Expense Ratios |
| |
| Class A | | | 3.04 | % |
| Class B | | | 3.91 | |
| Class C | | | 3.82 | |
The expense ratios reflect reduction to custodian expenses. The “Financial Highlights” tables in the Fund’s financial statements, included in this report, also show the gross expense ratios, without such waivers or reimbursements and reduction to custodian expenses, if applicable.
25 | OPPENHEIMER ROCHESTER NATIONAL MUNICIPALS
THIS PAGE INTENTIONALLY LEFT BLANK.
26 | OPPENHEIMER ROCHESTER NATIONAL MUNICIPALS
STATEMENT OF INVESTMENTS July 31, 2009
| | | | | | | | | | | | | | | | | |
| Principal | | | | | | | | | | | | |
| Amount | | | | | Coupon | | | Maturity | | | Value | |
| |
| Municipal Bonds and Notes—139.3% | | | | | | | | | | | | |
| Alabama—1.0% | | | | | | | | | | | | |
| $ | 15,560,000 | | | AL HFA (Single Family)1 | | | 5.450 | % | | | 10/01/2032 | | | $ | 15,660,315 | |
| | 15,000 | | | AL HFA (South Bay Apartments)2 | | | 5.950 | | | | 02/01/2033 | | | | 15,227 | |
| | 16,120,000 | | | AL IDA Solid Waste Disposal (Pine City Fiber Company)2 | | | 6.450 | | | | 12/01/2023 | | | | 8,606,468 | |
| | 7,665,000 | | | AL IDA Solid Waste Disposal (Pine City Fiber Company)2 | | | 6.450 | | | | 12/01/2023 | | | | 4,072,261 | |
| | 9,670,000 | | | AL Space Science Exhibit Finance Authority2 | | | 6.000 | | | | 10/01/2025 | | | | 7,290,697 | |
| | 10,000 | | | Alexander City, AL GO2 | | | 5.625 | | | | 05/01/2021 | | | | 9,311 | |
| | 1,810,000 | | | Andalusia-Opp, AL Airport Authority2 | | | 5.000 | | | | 08/01/2026 | | | | 1,270,312 | |
| | 7,050,000 | | | Governmental Utility Services Corp. of Moody, AL2 | | | 7.500 | | | | 03/01/2038 | | | | 5,427,725 | |
| | 25,000 | | | Mobile, AL Industrial Devel. Board (International Paper Company)2 | | | 6.450 | | | | 05/15/2019 | | | | 24,190 | |
| | 2,200,000 | | | Rainbow City, AL Special Health Care Facilities Financing Authority (Regency Pointe)3,4 | | | 8.250 | | | | 01/01/2031 | | | | 1,605,340 | |
| | 10,000 | | | Selma, AL Industrial Devel. Board (International Paper Company)2 | | | 6.000 | | | | 05/01/2025 | | | | 8,589 | |
| | 7,220,000 | | | Tuscaloosa, AL Educational Building Authority (Stillman College)2 | | | 5.000 | | | | 06/01/2026 | | | | 5,651,311 | |
| | | | | | | | | | | | | | | | |
| | | | | | | | | | | | | | | | 49,641,746 | |
| | | | | | | | | | | | | | | | | |
| Alaska—0.3% | | | | | | | | | | | | |
| | 20,000 | | | AK HFC, Series A-12 | | | 6.100 | | | | 06/01/2030 | | | | 20,058 | |
| | 40,000 | | | AK Industrial Devel. & Export Authority (Snettisham)2 | | | 6.000 | | | | 01/01/2014 | | | | 40,321 | |
| | 2,250,000 | | | AK Industrial Devel. and Export Authority (Anchorage Sportsplex/Grace Community Church Obligated Group) | | | 6.150 | | | | 08/01/2031 | | | | 1,451,475 | |
| | 1,650,000 | | | AK Industrial Devel. and Export Authority Community Provider (Boys & Girls Home)2 | | | 5.875 | | | | 12/01/2027 | | | | 1,138,451 | |
| | 500,000 | | | AK Industrial Devel. and Export Authority Community Provider (Boys & Girls Home)2 | | | 6.000 | | | | 12/01/2036 | | | | 322,030 | |
| | 5,000,000 | | | AK Northern Tobacco Securitization Corp. (TASC)2 | | | 5.000 | | | | 06/01/2032 | | | | 3,281,100 | |
| | 10,000,000 | | | AK Northern Tobacco Securitization Corp. (TASC)2 | | | 5.000 | | | | 06/01/2046 | | | | 5,470,700 | |
| | 31,850,000 | | | AK Northern Tobacco Securitization Corp. (TASC) | | | 6.125 | 5 | | | 06/01/2046 | | | | 813,131 | |
| | 20,860,000 | | | AK Northern Tobacco Securitization Corp. (TASC) | | | 6.375 | 5 | | | 06/01/2046 | | | | 439,312 | |
| | | | | | | | | | | | | | | | |
| | | | | | | | | | | | | | | | 12,976,578 | |
| | | | | | | | | | | | | | | | | |
| Arizona—5.0% | | | | | | | | | | | | |
| | 297,650,000 | | | AZ Health Facilities Authority (Banner Health System)1 | | | 1.210 | 6 | | | 01/01/2037 | | | | 164,905,473 | |
| | 3,000,000 | | | Buckeye, AZ Watson Road Community Facilities District2 | | | 5.750 | | | | 07/01/2022 | | | | 2,147,070 | |
| | 5,000,000 | | | Buckeye, AZ Watson Road Community Facilities District2 | | | 6.000 | | | | 07/01/2030 | | | | 3,166,000 | |
| | 14,719,000 | | | East San Luis, AZ Community Facilities District Special Assessment (Area One)2 | | | 6.375 | | | | 01/01/2028 | | | | 9,402,203 | |
F1 | OPPENHEIMER ROCHESTER NATIONAL MUNICIPALS
STATEMENT OF INVESTMENTS Continued
| | | | | | | | | | | | | | | | | |
| Principal | | | | | | | | | | | | |
| Amount | | | | | Coupon | | | Maturity | | | Value | |
| |
| Arizona Continued | | | | | | | | | | | | |
| $ | 810,000 | | | Estrella Mountain Ranch, AZ Community Facilities District2 | | | 5.625 | % | | | 07/15/2025 | | | $ | 581,037 | |
| | 400,000 | | | Estrella Mountain Ranch, AZ Community Facilities District2 | | | 5.800 | | | | 07/15/2030 | | | | 269,000 | |
| | 1,382,000 | | | Estrella Mountain Ranch, AZ Community Facilities District (Golf Village)2 | | | 6.000 | | | | 07/01/2017 | | | | 1,154,454 | |
| | 1,260,000 | | | Estrella Mountain Ranch, AZ Community Facilities District (Golf Village)2 | | | 6.375 | | | | 07/01/2022 | | | | 959,213 | |
| | 3,135,000 | | | Estrella Mountain Ranch, AZ Community Facilities District (Golf Village)2 | | | 6.750 | | | | 07/01/2032 | | | | 2,143,117 | |
| | 500,000 | | | Gladden Farms, AZ Community Facilities District2 | | | 5.500 | | | | 07/15/2031 | | | | 302,725 | |
| | 1,000,000 | | | Goodyear, AZ IDA Water and Sewer (Litchfield Park Service Company)2 | | | 6.750 | | | | 10/01/2031 | | | | 787,730 | |
| | 4,000,000 | | | Maricopa County, AZ IDA (Christian Care Apartments)2 | | | 6.500 | | | | 01/01/2036 | | | | 3,361,200 | |
| | 1,885,000 | | | Maricopa County, AZ IDA (Immanuel Campus Care)2 | | | 8.500 | | | | 04/20/2041 | | | | 1,573,636 | |
| | 355,000 | | | Maricopa County, AZ IDA (Sun King Apartments)2 | | | 6.750 | | | | 11/01/2018 | | | | 312,691 | |
| | 500,000 | | | Maricopa County, AZ IDA (Sun King Apartments)2 | | | 6.750 | | | | 05/01/2031 | | | | 388,650 | |
| | 3,725,000 | | | Maricopa County, AZ IDA (Sun King Apartments)2 | | | 9.500 | | | | 11/01/2031 | | | | 2,977,206 | |
| | 456,000 | | | Merrill Ranch, AZ Community Facilities District No. 1 Special Assessment Lien2 | | | 5.250 | | | | 07/01/2024 | | | | 304,280 | |
| | 368,000 | | | Merrill Ranch, AZ Community Facilities District No. 2 Special Assessment Lien2 | | | 5.250 | | | | 07/01/2024 | | | | 245,559 | |
| | 926,000 | | | Merrill Ranch, AZ Community Facilities District No. 2 Special Assessment Lien2 | | | 5.300 | | | | 07/01/2030 | | | | 552,396 | |
| | 235,000 | | | Navajo County, AZ IDA (Stone Container Corp.)3,7 | | | 7.200 | | | | 06/01/2027 | | | | 108,100 | |
| | 1,445,000 | | | Navajo County, AZ IDA (Stone Container Corp.)3,7 | | | 7.400 | | | | 04/01/2026 | | | | 664,700 | |
| | 1,125,000 | | | Palm Valley, AZ Community Facility District No. 32 | | | 5.300 | | | | 07/15/2031 | | | | 648,203 | |
| | 420,000 | | | Parkway, AZ Community Facilities District No. 1 (Prescott Valley)2 | | | 5.300 | | | | 07/15/2025 | | | | 274,121 | |
| | 350,000 | | | Parkway, AZ Community Facilities District No. 1 (Prescott Valley)2 | | | 5.350 | | | | 07/15/2031 | | | | 205,209 | |
| | 3,275,000 | | | Phoenix, AZ IDA (America West Airlines) | | | 6.250 | | | | 06/01/2019 | | | | 2,139,066 | |
| | 7,500,000 | | | Phoenix, AZ IDA (America West Airlines) | | | 6.300 | | | | 04/01/2023 | | | | 4,525,350 | |
| | 1,650,000 | | | Phoenix, AZ IDA (Espiritu Community Devel. Corp.)2 | | | 6.250 | | | | 07/01/2036 | | | | 1,189,650 | |
| | 1,935,000 | | | Phoenix, AZ IDA (Gourmet Boutique West)2 | | | 5.875 | | | | 11/01/2037 | | | | 1,235,014 | |
| | 1,100,000 | | | Phoenix, AZ IDA (Royal Paper Converting)2 | | | 7.000 | | | | 03/01/2014 | | | | 1,010,284 | |
| | 5,000,000 | | | Pima County, AZ IDA (American Charter Schools Foundation)2 | | | 5.625 | | | | 07/01/2038 | | | | 3,384,850 | |
| | 1,935,000 | | | Pima County, AZ IDA (Christian Senior Living)2 | | | 5.050 | | | | 01/01/2037 | | | | 1,546,781 | |
| | 400,000 | | | Pima County, AZ IDA (Desert Technology Schools)3,4 | | | 6.375 | | | | 02/01/2014 | | | | 124,128 | |
| | 1,000,000 | | | Pima County, AZ IDA (Desert Technology Schools)3,4 | | | 7.000 | | | | 02/01/2024 | | | | 301,240 | |
| | 1,250,000 | | | Pima County, AZ IDA (Facility Choice Education & Devel. Corp.)2 | | | 6.250 | | | | 06/01/2026 | | | | 973,050 | |
F2 | OPPENHEIMER ROCHESTER NATIONAL MUNICIPALS
| | | | | | | | | | | | | | | | | |
| Principal | | | | | | | | | | | | |
| Amount | | | | | Coupon | | | Maturity | | | Value | |
| |
| Arizona Continued | | | | | | | | | | | | |
| $ | 2,350,000 | | | Pima County, AZ IDA (Facility Choice Education & Devel. Corp.)2 | | | 6.375 | % | | | 06/01/2036 | | | $ | 1,699,732 | |
| | 1,500,000 | | | Pima County, AZ IDA (P.L.C. Charter Schools)2 | | | 6.750 | | | | 04/01/2036 | | | | 1,155,735 | |
| | 250,000 | | | Pima County, AZ IDA (Paradise Education Center)2 | | | 5.875 | | | | 06/01/2022 | | | | 184,378 | |
| | 550,000 | | | Pima County, AZ IDA (Paradise Education Center)2 | | | 6.000 | | | | 06/01/2036 | | | | 350,339 | |
| | 1,600,000 | | | Pima County, AZ IDA (Sonoran Science Academy)2 | | | 5.670 | | | | 12/01/2027 | | | | 1,170,512 | |
| | 1,960,000 | | | Pima County, AZ IDA (Sonoran Science Academy)2 | | | 5.750 | | | | 12/01/2037 | | | | 1,319,766 | |
| | 3,410,000 | | | Pima County, AZ IDA Water & Wastewater (Global Water Resources)2 | | | 5.450 | | | | 12/01/2017 | | | | 3,252,629 | |
| | 2,215,000 | | | Pima County, AZ IDA Water & Wastewater (Global Water Resources)2 | | | 5.600 | | | | 12/01/2022 | | | | 1,656,953 | |
| | 11,100,000 | | | Pima County, AZ IDA Water & Wastewater (Global Water Resources)2 | | | 5.750 | | | | 12/01/2032 | | | | 7,473,519 | |
| | 10,000,000 | | | Pima County, AZ IDA Water & Wastewater (Global Water Resources)2 | | | 6.550 | | | | 12/01/2037 | | | | 7,293,100 | |
| | 1,495,000 | | | Pinal County, AZ IDA (San Manuel Facility)2 | | | 6.250 | | | | 06/01/2026 | | | | 1,163,768 | |
| | 1,385,000 | | | Prescott Valley, AZ Southside Community Facilities District No. 12 | | | 7.250 | | | | 07/01/2032 | | | | 1,014,817 | |
| | 1,500,000 | | | Quail Creek, AZ Community Facilities District2 | | | 5.550 | | | | 07/15/2030 | | | | 936,555 | |
| | 265,000 | | | Show Low Bluff, AZ Community Facilities District2 | | | 5.600 | | | | 07/01/2031 | | | | 172,950 | |
| | 275,000 | | | Show Low Bluff, AZ Community Facilities District Special Assessment2 | | | 5.200 | | | | 07/01/2017 | | | | 231,215 | |
| | 730,000 | | | Tucson, AZ IDA (Joint Single Family Mtg.)2 | | | 5.000 | | | | 01/01/2039 | | | | 686,762 | |
| | 4,000,000 | | | Verrado, AZ Community Facilities District No. 12 | | | 5.350 | | | | 07/15/2031 | | | | 2,570,240 | |
| | | | | | | | | | | | | | | | |
| | | | | | | | | | | | | | | | 246,196,356 | |
| | | | | | | | | | | | | | | | | |
| Arkansas—0.2% | | | | | | | | | | | | |
| | 555,000 | | | Calhoun County, AR Solid Waste Disposal (Georgia-Pacific Corp.)2 | | | 6.375 | | | | 11/01/2026 | | | | 439,643 | |
| | 7,700,000 | | | Cave Springs, AR Municipal Property (Creeks Special Sewer District)2 | | | 6.250 | | | | 02/01/2038 | | | | 4,847,689 | |
| | 1,345,000 | | | Little River County, AR (Georgia-Pacific Corp.)2 | | | 5.600 | | | | 10/01/2026 | | | | 974,103 | |
| | 25,000 | | | Pine Bluff, AR (International Paper Company)2 | | | 5.550 | | | | 08/15/2022 | | | | 21,806 | |
| | 5,460,000 | | | Sebastian County, AR Health Facilities Board (Sparks Regional Medical Center) | | | 5.625 | | | | 11/01/2031 | | | | 2,510,836 | |
| | | | | | | | | | | | | | | | |
| | | | | | | | | | | | | | | | 8,794,077 | |
| | | | | | | | | | | | | | | | | |
| California—17.9% | | | | | | | | | | | | |
| | 695,000 | | | Azusa, CA Special Tax Community Facilities District No. 05-12 | | | 5.000 | | | | 09/01/2027 | | | | 454,606 | |
| | 1,840,000 | | | Azusa, CA Special Tax Community Facilities District No. 05-12 | | | 5.000 | | | | 09/01/2037 | | | | 1,846,606 | |
| | 8,800,000 | | | CA Access to Loans for Learning Student Loan Corp.2 | | | 7.375 | | | | 01/01/2042 | | | | 8,495,256 | |
F3 | OPPENHEIMER ROCHESTER NATIONAL MUNICIPALS
STATEMENT OF INVESTMENTS Continued
| | | | | | | | | | | | | | | | | |
| Principal | | | | | | | | | | | | |
| Amount | | | | | Coupon | | | Maturity | | | Value | |
| |
| California Continued | | | | | | | | | | | | |
| $ | 127,310,000 | | | CA County Tobacco Securitization Agency | | | 6.489 | %5 | | | 06/01/2046 | | | $ | 3,194,208 | |
| | 107,400,000 | | | CA County Tobacco Securitization Agency | | | 6.619 | 5 | | | 06/01/2050 | | | | 1,294,170 | |
| | 33,920,000 | | | CA County Tobacco Securitization Agency | | | 6.650 | 5 | | | 06/01/2046 | | | | 801,869 | |
| | 215,100,000 | | | CA County Tobacco Securitization Agency | | | 7.000 | 5 | | | 06/01/2055 | | | | 1,507,851 | |
| | 117,250,000 | | | CA County Tobacco Securitization Agency | | | 7.129 | 5 | | | 06/01/2055 | | | | 1,062,285 | |
| | 143,610,000 | | | CA County Tobacco Securitization Agency | | | 7.300 | 5 | | | 06/01/2046 | | | | 4,045,494 | |
| | 246,760,000 | | | CA County Tobacco Securitization Agency | | | 7.477 | 5 | | | 06/01/2055 | | | | 1,512,639 | |
| | 11,485,000 | | | CA County Tobacco Securitization Agency | | | 8.150 | 5 | | | 06/01/2033 | | | | 1,082,232 | |
| | 102,000,000 | | | CA County Tobacco Securitization Agency | | | 8.550 | 5 | | | 06/01/2055 | | | | 625,260 | |
| | 36,000,000 | | | CA County Tobacco Securitization Agency (TASC)2 | | | 0.000 | 8 | | | 06/01/2041 | | | | 19,209,240 | |
| | 56,530,000 | | | CA County Tobacco Securitization Agency (TASC)2 | | | 0.000 | 8 | | | 06/01/2046 | | | | 29,975,033 | |
| | 255,000 | | | CA County Tobacco Securitization Agency (TASC)2 | | | 5.250 | | | | 06/01/2045 | | | | 141,007 | |
| | 19,000,000 | | | CA County Tobacco Securitization Agency (TASC)2 | | | 5.250 | | | | 06/01/2046 | | | | 10,480,210 | |
| | 2,435,000 | | | CA County Tobacco Securitization Agency (TASC)2 | | | 5.500 | | | | 06/01/2033 | | | | 1,845,365 | |
| | 2,610,000 | | | CA County Tobacco Securitization Agency (TASC)2 | | | 5.875 | | | | 06/01/2035 | | | | 1,793,723 | |
| | 7,285,000 | | | CA County Tobacco Securitization Agency (TASC)2 | | | 5.875 | | | | 06/01/2043 | | | | 4,874,976 | |
| | 2,930,000 | | | CA County Tobacco Securitization Agency (TASC)2 | | | 6.000 | | | | 06/01/2042 | | | | 2,008,720 | |
| | 5,000,000 | | | CA County Tobacco Securitization Agency (TASC)2 | | | 6.125 | | | | 06/01/2038 | | | | 3,522,450 | |
| | 57,000,000 | | | CA County Tobacco Securitization Agency (TASC) | | | 6.400 | 5 | | | 06/01/2046 | | | | 1,347,480 | |
| | 525,920,000 | | | CA County Tobacco Securitization Agency (TASC) | | | 6.664 | 5 | | | 06/01/2050 | | | | 8,277,981 | |
| | 14,855,000 | | | CA Dept. of Veterans Affairs Home Purchase1 | | | 5.200 | | | | 12/01/2028 | | | | 14,855,817 | |
| | 30,000,000 | | | CA Educational Funding Services2 | | | 6.250 | | | | 12/01/2042 | | | | 17,511,000 | |
| | 24,000,000 | | | CA Golden State Tobacco Securitization Corp. (TASC)2 | | | 5.000 | | | | 06/01/2033 | | | | 15,190,320 | |
| | 19,815,000 | | | CA Golden State Tobacco Securitization Corp. (TASC)2 | | | 5.125 | | | | 06/01/2047 | | | | 10,714,763 | |
| | 228,715,000 | | | CA Golden State Tobacco Securitization Corp. (TASC)1 | | | 5.750 | | | | 06/01/2047 | | | | 137,228,946 | |
| | 340,000,000 | | | CA Golden State Tobacco Securitization Corp. (TASC) | | | 6.000 | 5 | | | 06/01/2047 | | | | 7,578,600 | |
| | 1,296,000,000 | | | CA Golden State Tobacco Securitization Corp. (TASC) | | | 6.082 | 5 | | | 06/01/2047 | | | | 34,590,240 | |
| | 160,600,000 | | | CA Silicon Valley Tobacco Securitization Authority | | | 8.147 | 5 | | | 06/01/2056 | | | | 1,010,174 | |
| | 15,000,000 | | | CA Silicon Valley Tobacco Securitization Authority | | | 8.150 | 5 | | | 06/01/2041 | | | | 620,550 | |
| | 82,250,000 | | | CA Silicon Valley Tobacco Securitization Authority | | | 8.435 | 5 | | | 06/01/2056 | | | | 451,553 | |
| | 4,660,000 | | | CA Statewide CDA (Aspire Public Schools)2 | | | 7.250 | | | | 08/01/2031 | | | | 4,084,490 | |
| | 14,400,000 | | | CA Statewide CDA (Fairfield Apartments)3,4 | | | 7.250 | | | | 01/01/2035 | | | | 5,040,000 | |
| | 16,000,000 | | | CA Statewide CDA (Microgy Holdings) | | | 9.000 | | | | 12/01/2038 | | | | 12,860,640 | |
| | 1,500,000 | | | CA Statewide CDA (Notre Dame de Namur University)2 | | | 6.625 | | | | 10/01/2033 | | | | 1,022,850 | |
| | 1,500,000 | | | CA Statewide CDA (Thomas Jefferson School of Law)2 | | | 7.250 | | | | 10/01/2038 | | | | 1,251,585 | |
| | 555,300,000 | | | CA Statewide Financing Authority Tobacco Settlement2 | | | 7.001 | 5 | | | 06/01/2055 | | | | 3,892,653 | |
| | 260,000,000 | | | CA Statewide Financing Authority Tobacco Settlement | | | 7.876 | 5 | | | 06/01/2055 | | | | 1,593,800 | |
| | 301,950,000 | | | CA Statewide Financing Authority Tobacco Settlement | | | 8.000 | 5 | | | 06/01/2046 | | | | 7,575,926 | |
| | 4,500,000 | | | CA Statewide Financing Authority Tobacco Settlement (TASC)2 | | | 6.000 | | | | 05/01/2037 | | | | 3,124,530 | |
F4 | OPPENHEIMER ROCHESTER NATIONAL MUNICIPALS
| | | | | | | | | | | | | | | | | |
| Principal | | | | | | | | | | | | |
| Amount | | | | | Coupon | | | Maturity | | | Value | |
| |
| California Continued | | | | | | | | | | | | |
| $ | 1,405,000 | | | CA Statewide Financing Authority Tobacco Settlement (TASC)2 | | | 6.000 | % | | | 05/01/2043 | | | $ | 958,842 | |
| | 100,000 | | | CA Statewide Financing Authority Tobacco Settlement (TASC)2 | | | 6.000 | | | | 05/01/2043 | | | | 68,245 | |
| | 11,400,000 | | | CA Valley Health System COP | | | 6.875 | | | | 05/15/2023 | | | | 6,267,720 | |
| | 25,000 | | | CA Western Hills Water District Special Tax (Diablo Grande Community Facilities)2 | | | 6.700 | | | | 09/01/2020 | | | | 17,818 | |
| | 10,465,000 | | | Cerritos, CA Community College District1 | | | 5.250 | | | | 08/01/2033 | | | | 10,611,335 | |
| | 165,000 | | | Chino, CA Community Facilities District Special Tax2 | | | 5.000 | | | | 09/01/2026 | | | | 118,046 | |
| | 990,000 | | | Chino, CA Community Facilities District Special Tax No. 2005-12 | | | 5.000 | | | | 09/01/2023 | | | | 634,085 | |
| | 1,500,000 | | | Chino, CA Community Facilities District Special Tax No. 2005-12 | | | 5.000 | | | | 09/01/2036 | | | | 795,390 | |
| | 80,000,000 | | | Inland, CA Empire Tobacco Securitization Authority (TASC) | | | 6.750 | 5 | | | 06/01/2047 | | | | 1,816,000 | |
| | 10,000,000 | | | Inland, CA Empire Tobacco Securitization Authority (TASC) | | | 7.587 | 5 | | | 06/01/2036 | | | | 700,000 | |
| | 432,795,000 | | | Inland, CA Empire Tobacco Securitization Authority (TASC) | | | 7.626 | 5 | | | 06/01/2057 | | | | 2,445,292 | |
| | 1,000,000,000 | | | Inland, CA Empire Tobacco Securitization Authority (TASC) | | | 8.001 | 5 | | | 06/01/2057 | | | | 4,910,000 | |
| | 450,000 | | | Jurupa, CA Community Services District Special Tax Community Facilities District No. 292 | | | 8.250 | | | | 09/01/2029 | | | | 444,092 | |
| | 1,000,000 | | | Jurupa, CA Community Services District Special Tax Community Facilities District No. 292 | | | 8.625 | | | | 09/01/2039 | | | | 992,760 | |
| | 1,000,000 | | | Lake Elsinore, CA Unified School District Community Facilities District No. 04-32 | | | 5.250 | | | | 09/01/2029 | | | | 605,090 | |
| | 1,365,000 | | | Lathrop, CA Special Tax Community Facilities District No. 03-22 | | | 7.000 | | | | 09/01/2033 | | | | 1,194,593 | |
| | 98,250,000 | | | Long Beach, CA Bond Finance Authority Natural Gas2 | | | 2.142 | 6 | | | 11/15/2033 | | | | 68,283,750 | |
| | 13,000,000 | | | Long Beach, CA Harbor1 | | | 5.200 | | | | 05/15/2027 | | | | 12,475,074 | |
| | 8,755,000 | | | Los Angeles County, CA Unified School District1 | | | 5.000 | | | | 01/01/2034 | | | | 8,466,971 | |
| | 31,940,000 | | | Los Angeles, CA Dept. of Airports (Los Angeles International Airport)1 | | | 5.375 | | | | 05/15/2030 | | | | 31,264,788 | |
| | 5,000,000 | | | Los Angeles, CA Dept. of Water & Power1 | | | 5.000 | | | | 07/01/2034 | | | | 4,915,900 | |
| | 5,000,000 | | | Los Angeles, CA Dept. of Water & Power1 | | | 5.000 | | | | 07/01/2039 | | | | 4,856,325 | |
| | 16,260,000 | | | Los Angeles, CA Harbor Dept.1 | | | 5.250 | | | | 08/01/2039 | | | | 16,138,782 | |
| | 5,700,000 | | | Los Angeles, CA Regional Airports Improvement Corp. (Air Canada) | | | 8.750 | | | | 10/01/2014 | | | | 4,674,855 | |
| | 20,000 | | | Los Angeles, CA Regional Airports Improvement Corp. (American Airlines)2 | | | 7.000 | | | | 12/01/2012 | | | | 18,156 | |
| | 5,350,000 | | | Los Angeles, CA Regional Airports Improvement Corp. (American Airlines)2 | | | 7.125 | | | | 12/01/2024 | | | | 4,150,156 | |
F5 | OPPENHEIMER ROCHESTER NATIONAL MUNICIPALS
STATEMENT OF INVESTMENTS Continued
| | | | | | | | | | | | | | | | | |
| Principal | | | | | | | | | | | | |
| Amount | | | | | Coupon | | | Maturity | | | Value | |
| |
| California Continued | | | | | | | | | | | | |
| $ | 17,810,000 | | | Los Angeles, CA Regional Airports Improvement Corp. (American Airlines)2 | | | 7.500 | % | | | 12/01/2024 | | | $ | 13,872,387 | |
| | 74,145,000 | | | Los Angeles, CA Regional Airports Improvement Corp. (American Airlines)2 | | | 7.500 | | | | 12/01/2024 | | | | 57,752,282 | |
| | 2,825,000 | | | Los Angeles, CA Regional Airports Improvement Corp. (Continental Airlines)2 | | | 5.650 | | | | 08/01/2017 | | | | 2,250,706 | |
| | 1,135,000 | | | Los Angeles, CA Regional Airports Improvement Corp. (Delta Airlines)2 | | | 6.350 | | | | 11/01/2025 | | | | 826,167 | |
| | 12,900,000 | | | Los Angeles, CA Regional Airports Improvement Corp. (Delta-Continental Airlines)2 | | | 9.250 | | | | 08/01/2024 | | | | 12,338,721 | |
| | 400,000 | | | Los Angeles, CA Regional Airports Improvement Corp. (United Airlines)3,4 | | | 6.875 | | | | 11/15/2012 | | | | 387,032 | |
| | 2,580,000 | | | Los Angeles, CA Regional Airports Improvement Corp. (United Airlines)3,4 | | | 8.800 | | | | 11/15/2021 | | | | 2,395,582 | |
| | 11,000,000 | | | Los Angeles, CA Unified School District1 | | | 5.000 | | | | 07/01/2032 | | | | 10,735,780 | |
| | 30,000,000 | | | Los Angeles, CA Unified School District1 | | | 5.000 | | | | 07/01/2032 | | | | 29,279,400 | |
| | 7,330,000 | | | Los Angeles, CA Unified School District1 | | | 5.000 | | | | 01/01/2034 | | | | 7,088,661 | |
| | 10,550,000 | | | Los Angeles, CA Unified School District1 | | | 5.000 | | | | 01/01/2034 | | | | 10,202,787 | |
| | 11,535,000 | | | Newport Beach, CA (Presbyterian Hoag Memorial Hospital)1 | | | 5.000 | | | | 12/01/2024 | | | | 11,723,102 | |
| | 115,975,000 | | | Northern CA Tobacco Securitization Authority (TASC) | | | 6.375 | 5 | | | 06/01/2045 | | | | 3,035,066 | |
| | 5,925,000 | | | Palm Desert, CA Improvement Bond Act 19152 | | | 5.100 | | | | 09/02/2037 | | | | 3,432,530 | |
| | 2,200,000 | | | San Diego County, CA COP2 | | | 5.700 | | | | 02/01/2028 | | | | 1,490,192 | |
| | 15,000,000 | | | San Diego, CA Public Facilities Financing Authority1 | | | 5.375 | | | | 08/01/2034 | | | | 15,056,475 | |
| | 22,110,000 | | | San Francisco, CA Bay Area Toll Authority1 | | | 5.000 | | | | 04/01/2031 | | | | 22,042,343 | |
| | 16,260,000 | | | San Francisco, CA Bay Area Toll Authority1 | | | 5.125 | | | | 04/01/2047 | | | | 15,760,520 | |
| | 12,000,000 | | | Southern CA Metropolitan Water District1 | | | 5.000 | | | | 07/01/2035 | | | | 12,102,300 | |
| | 45,440,000 | | | Southern CA Tobacco Securitization Authority2 | | | 5.125 | | | | 06/01/2046 | | | | 24,499,885 | |
| | 195,570,000 | | | Southern CA Tobacco Securitization Authority | | | 6.383 | 5 | | | 06/01/2046 | | | | 4,906,851 | |
| | 41,325,000 | | | Southern CA Tobacco Securitization Authority | | | 6.400 | 5 | | | 06/01/2046 | | | | 976,923 | |
| | 143,080,000 | | | Southern CA Tobacco Securitization Authority | | | 7.100 | 5 | | | 06/01/2046 | | | | 2,656,996 | |
| | 5,125,000 | | | Southern CA Tobacco Securitization Authority (TASC)2 | | | 5.000 | | | | 6/01/2037 | | | | 3,095,039 | |
| | 5,425,000 | | | Temecula, CA Public Financing Authority Community Facilities District (Roripaugh)2 | | | 5.450 | | | | 09/01/2026 | | | | 2,718,251 | |
| | 4,000,000 | | | Temecula, CA Public Financing Authority Community Facilities District (Roripaugh)2 | | | 5.500 | | | | 09/01/2036 | | | | 1,776,160 | |
| | 60,000 | | | West Patterson, CA Financing Authority Special Tax2 | | | 6.700 | | | | 09/01/2032 | | | | 47,271 | |
| | 15,000 | | | West Patterson, CA Financing Authority Special Tax2 | | | 6.750 | | | | 09/01/2036 | | | | 11,749 | |
| | 35,000 | | | West Patterson, CA Financing Authority Special Tax Community Facilities District No. 2001-1-A2 | | | 6.500 | | | | 09/01/2026 | | | | 28,331 | |
F6 | OPPENHEIMER ROCHESTER NATIONAL MUNICIPALS
| | | | | | | | | | | | | | | | | |
| Principal | | | | | | | | | | | | |
| Amount | | | | | Coupon | | | Maturity | | | Value | |
| |
| California Continued | | | | | | | | | | | | |
| $ | 15,000,000 | | | Westminster, CA Redevel. Agency Tax Allocation1 | | | 5.750 | % | | | 11/01/2045 | | | $ | 14,239,725 | |
| | 7,500,000 | | | Westminster, CA Redevel. Agency Tax Allocation1 | | | 6.250 | | | | 11/01/2039 | | | | 7,813,163 | |
| | | | | | | | | | | | | | | | |
| | | | | | | | | | | | | | | | 871,963,540 | |
| | | | | | | | | | | | | | | | | |
| Colorado—4.6% | | | | | | | | | | | | |
| | 1,000,000 | | | CO Andonea Metropolitan District No. 22 | | | 6.125 | | | | 12/01/2025 | | | | 662,910 | |
| | 2,380,000 | | | CO Andonea Metropolitan District No. 32 | | | 6.250 | | | | 12/01/2035 | | | | 1,404,628 | |
| | 5,000,000 | | | CO Arista Metropolitan District2 | | | 6.750 | | | | 12/01/2035 | | | | 3,172,500 | |
| | 14,000,000 | | | CO Arista Metropolitan District | | | 9.250 | | | | 12/01/2037 | | | | 11,204,760 | |
| | 2,620,000 | | | CO Beacon Point Metropolitan District2 | | | 6.125 | | | | 12/01/2025 | | | | 1,940,975 | |
| | 3,500,000 | | | CO Beacon Point Metropolitan District2 | | | 6.250 | | | | 12/01/2035 | | | | 2,390,010 | |
| | 1,000,000 | | | CO Castle Oaks Metropolitan District2 | | | 6.000 | | | | 12/01/2025 | | | | 698,030 | |
| | 1,500,000 | | | CO Castle Oaks Metropolitan District2 | | | 6.125 | | | | 12/01/2035 | | | | 956,805 | |
| | 5,755,000 | | | CO Central Marksheffel Metropolitan District2 | | | 7.250 | | | | 12/01/2029 | | | | 4,394,921 | |
| | 1,000,000 | | | CO Confluence Metropolitan District2 | | | 5.400 | | | | 12/01/2027 | | | | 658,110 | |
| | 1,000,000 | | | CO Copperleaf Metropolitan District No. 22 | | | 5.850 | | | | 12/01/2026 | | | | 632,970 | |
| | 1,850,000 | | | CO Copperleaf Metropolitan District No. 22 | | | 5.950 | | | | 12/01/2036 | | | | 1,039,515 | |
| | 1,025,000 | | | CO Country Club Highlands Metropolitan District2 | | | 7.250 | | | | 12/01/2037 | | | | 755,425 | |
| | 1,700,000 | | | CO Crystal Crossing Metropolitan District2 | | | 6.000 | | | | 12/01/2036 | | | | 962,506 | |
| | 585,000 | | | CO Educational and Cultural Facilities Authority (Carbon Valley Academy Charter School)2 | | | 5.625 | | | | 12/01/2036 | | | | 390,651 | |
| | 2,475,000 | | | CO Educational and Cultural Facilities Authority (Inn at Auraria) | | | 5.375 | | | | 07/01/2015 | | | | 1,919,214 | |
| | 24,295,000 | | | CO Educational and Cultural Facilities Authority (Inn at Auraria) | | | 6.000 | | | | 07/01/2042 | | | | 13,492,228 | |
| | 1,335,000 | | | CO Elbert and Highway 86 Metropolitan District2 | | | 5.750 | | | | 12/01/2036 | | | | 762,832 | |
| | 5,000,000 | | | CO Elbert and Highway 86 Metropolitan District2 | | | 7.500 | | | | 12/01/2032 | | | | 3,683,050 | |
| | 2,468,000 | | | CO Elkhorn Ranch Metropolitan District2 | | | 6.375 | | | | 12/01/2035 | | | | 1,553,803 | |
| | 700,000 | | | CO Fallbrook Metropolitan District2 | | | 5.625 | | | | 12/01/2026 | | | | 472,185 | |
| | 1,225,000 | | | CO Health Facilities Authority Health & Residential Care Facilities (Volunteers of America)2 | | | 5.300 | | | | 07/01/2037 | | | | 848,104 | |
| | 2,960,000 | | | CO Heritage Todd Creek Metropolitan District2 | | | 5.500 | | | | 12/01/2037 | | | | 1,790,741 | |
| | 5,325,000 | | | CO High Plains Metropolitan District2 | | | 6.125 | | | | 12/01/2025 | | | | 3,687,989 | |
| | 10,875,000 | | | CO High Plains Metropolitan District2 | | | 6.250 | | | | 12/01/2035 | | | | 6,726,623 | |
| | 1,060,000 | | | CO Horse Creek Metropolitan District2 | | | 5.750 | | | | 12/01/2036 | | | | 669,941 | |
| | 220,000 | | | CO Hsg. & Finance Authority2 | | | 6.400 | | | | 11/01/2024 | | | | 227,993 | |
| | 290,000 | | | CO Hsg. & Finance Authority2 | | | 8.400 | | | | 10/01/2021 | | | | 318,745 | |
| | 5,000 | | | CO Hsg. & Finance Authority (Single Family)2 | | | 6.500 | | | | 11/01/2029 | | | | 5,147 | |
| | 15,000 | | | CO Hsg. & Finance Authority (Single Family)2 | | | 6.800 | | | | 04/01/2030 | | | | 15,379 | |
| | 5,000 | | | CO Hsg. & Finance Authority (Single Family)2 | | | 7.000 | | | | 05/01/2026 | | | | 5,093 | |
| | 24,000 | | | CO Hsg. & Finance Authority (Single Family)2 | | | 7.250 | | | | 05/01/2027 | | | | 24,451 | |
F7 | OPPENHEIMER ROCHESTER NATIONAL MUNICIPALS
STATEMENT OF INVESTMENTS Continued
| | | | | | | | | | | | | | | | | |
| Principal | | | | | | | | | | | | |
| Amount | | | | | Coupon | | | Maturity | | | Value | |
| |
| Colorado Continued | | | | | | | | | | | | |
| $ | 1,700,000 | | | CO Huntington Trails Metropolitan District | | | 0.000 | %8 | | | 12/01/2037 | | | $ | 1,540,574 | |
| | 500,000 | | | CO Huntington Trails Metropolitan District2 | | | 6.250 | | | | 12/01/2036 | | | | 307,945 | |
| | 7,050,000 | | | CO International Center Metropolitan District No. 32 | | | 6.500 | | | | 12/01/2035 | | | | 4,310,652 | |
| | 1,145,000 | | | CO Liberty Ranch Metropolitan District2 | | | 6.250 | | | | 12/01/2036 | | | | 705,194 | |
| | 1,875,000 | | | CO Madre Metropolitan District No. 22 | | | 5.500 | | | | 12/01/2036 | | | | 924,488 | |
| | 2,800,000 | | | CO Mountain Shadows Metropolitan District2 | | | 5.625 | | | | 12/01/2037 | | | | 1,488,032 | |
| | 1,740,000 | | | CO Multifamily Hsg. Revenue Bond Pass-Through Certificates (MS Loveland/American International Obligated Group)2 | | | 6.000 | 6 | | | 11/01/2033 | | | | 1,465,498 | |
| | 3,000,000 | | | CO Murphy Creek Metropolitan District No. 32 | | | 6.000 | | | | 12/01/2026 | | | | 2,118,420 | |
| | 10,060,000 | | | CO Murphy Creek Metropolitan District No. 32 | | | 6.125 | | | | 12/01/2035 | | | | 6,416,972 | |
| | 2,275,000 | | | CO Neu Towne Metropolitan District3 | | | 7.250 | | | | 12/01/2034 | | | | 726,180 | |
| | 1,290,000 | | | CO North Range Metropolitan District No. 2 | | | 5.500 | | | | 12/15/2018 | | | | 941,313 | |
| | 1,000,000 | | | CO North Range Metropolitan District No. 22 | | | 5.500 | | | | 12/15/2037 | | | | 538,870 | |
| | 4,500,000 | | | CO Northwest Metropolitan District No. 32 | | | 6.125 | | | | 12/01/2025 | | | | 2,640,465 | |
| | 7,855,000 | | | CO Northwest Metropolitan District No. 32 | | | 6.250 | | | | 12/01/2035 | | | | 4,168,806 | |
| | 13,305,000 | | | CO Park Valley Water and Sanitation Metropolitan District | | | 6.000 | 5 | | | 12/15/2017 | | | | 8,458,654 | |
| | 320,000 | | | CO Potomac Farms Metropolitan District2 | | | 0.000 | 8 | | | 12/01/2023 | | | | 260,010 | |
| | 1,590,000 | | | CO Potomac Farms Metropolitan District2 | | | 7.250 | | | | 12/01/2037 | | | | 1,067,383 | |
| | 850,000 | | | CO Prairie Center Metropolitan District No. 32 | | | 5.250 | | | | 12/15/2021 | | | | 640,679 | |
| | 1,250,000 | | | CO Prairie Center Metropolitan District No. 32 | | | 5.400 | | | | 12/15/2031 | | | | 818,325 | |
| | 1,000,000 | | | CO Prairie Center Metropolitan District No. 32 | | | 5.400 | | | | 12/15/2031 | | | | 654,660 | |
| | 2,275,000 | | | CO Regency Metropolitan District2 | | | 5.750 | | | | 12/01/2036 | | | | 1,239,375 | |
| | 1,750,000 | | | CO Serenity Ridge Metropolitan District No. 2 | | | 7.500 | | | | 12/01/2034 | | | | 785,750 | |
| | 1,320,000 | | | CO Silver Peaks Metropolitan District2 | | | 5.750 | | | | 12/01/2036 | | | | 792,528 | |
| | 10,230,000 | | | CO Sorrell Ranch Metropolitan District2 | | | 5.750 | | | | 12/01/2036 | | | | 6,142,092 | |
| | 1,735,000 | | | CO Sorrell Ranch Metropolitan District | | | 6.750 | | | | 12/15/2036 | | | | 1,145,048 | |
| | 1,330,000 | | | CO Stoneridge Metropolitan District2 | | | 5.625 | | | | 12/01/2036 | | | | 783,157 | |
| | 2,065,000 | | | CO Tallgrass Metropolitan District2 | | | 5.250 | | | | 12/01/2037 | | | | 1,201,706 | |
| | 500,000 | | | CO Tallyns Reach Metropolitan District No. 32 | | | 5.200 | | | | 12/01/2036 | | | | 362,385 | |
| | 8,000,000 | | | CO Talon Pointe Metropolitan District2 | | | 8.000 | | | | 12/01/2039 | | | | 6,440,400 | |
| | 655,000 | | | CO Todd Creek Farms Metropolitan District No. 1 | | | 6.125 | | | | 12/01/2019 | | | | 414,032 | |
| | 695,000 | | | CO Traditions Metropolitan District No. 22 | | | 5.750 | | | | 12/01/2036 | | | | 439,254 | |
| | 4,390,000 | | | CO Traditions Metropolitan District No. 2 CAB | | | 0.000 | 8 | | | 12/15/2037 | | | | 2,819,960 | |
| | 3,780,000 | | | CO Waterview I Metropolitan District2 | | | 8.000 | | | | 12/15/2032 | | | | 3,084,745 | |
| | 500,000 | | | CO Wheatlands Metropolitan District2 | | | 6.000 | | | | 12/01/2025 | | | | 349,015 | |
| | 2,500,000 | | | CO Wheatlands Metropolitan District2 | | | 6.125 | | | | 12/01/2035 | | | | 1,594,675 | |
| | 4,000,000 | | | CO Wheatlands Metropolitan District No. 2 | | | 8.250 | | | | 12/15/2035 | | | | 3,040,960 | |
| | 3,875,000 | | | CO Woodmen Heights Metropolitan District No. 12 | | | 6.750 | | | | 12/01/2020 | | | | 3,201,719 | |
F8 | OPPENHEIMER ROCHESTER NATIONAL MUNICIPALS
| | | | | | | | | | | | | | | | | |
| Principal | | | | | | | | | | | | |
| Amount | | | | | Coupon | | | Maturity | | | Value | |
| |
| Colorado Continued | | | | | | | | | | | | |
| $ | 21,195,000 | | | CO Woodmen Heights Metropolitan District No. 12 | | | 7.000 | % | | | 12/01/2030 | | | $ | 15,662,045 | |
| | 500,000 | | | CO Wyndham Hill Metropolitan District2 | | | 6.250 | | | | 12/01/2025 | | | | 359,135 | |
| | 892,000 | | | CO Wyndham Hill Metropolitan District2 | | | 6.375 | | | | 12/01/2035 | | | | 589,460 | |
| | 18,510,000 | | | Colorado Springs, CO Urban Renewal (University Village Colorado)2 | | | 7.000 | | | | 12/01/2029 | | | | 14,435,024 | |
| | 63,375,000 | | | Denver, CO City & County Airport Special Facilities (United Air Lines)2 | | | 5.250 | | | | 10/01/2032 | | | | 32,518,346 | |
| | 35,200,000 | | | Denver, CO City & County Airport Special Facilities (United Air Lines)2 | | | 5.750 | | | | 10/01/2032 | | | | 19,385,344 | |
| | 375,000 | | | Eagle County, CO Airport Terminal Corp.2 | | | 5.250 | | | | 05/01/2020 | | | | 261,818 | |
| | | | | | | | | | | | | | | | |
| | | | | | | | | | | | | | | | 224,709,327 | |
| | | | | | | | | | | | | | | | | |
| Connecticut—0.2% | | | | | | | | | | | | |
| | 145,000 | | | CT Devel. Authority (Bridgeport Hydraulic Company)2 | | | 6.150 | | | | 04/01/2035 | | | | 128,663 | |
| | 125,000 | | | CT Devel. Authority (Bridgeport Hydraulic Company)2 | | | 6.150 | | | | 04/01/2035 | | | | 115,611 | |
| | 1,500,000 | | | CT Devel. Authority Airport Facility (Learjet)2 | | | 7.950 | | | | 04/01/2026 | | | | 1,515,270 | |
| | 80,000 | | | CT H&EFA (Bridgeport Hospital/Bridgeport Hospital Foundation Obligated Group)2 | | | 6.500 | | | | 07/01/2012 | | | | 80,138 | |
| | 20,000 | | | CT H&EFA (St. Mary’s Hospital Corp.)2 | | | 5.500 | | | | 07/01/2012 | | | | 19,375 | |
| | 475,000 | | | Georgetown, CT Special Taxing District2 | | | 5.125 | | | | 10/01/2036 | | | | 219,545 | |
| | 3,750,000 | | | Mashantucket, CT Western Pequot Tribe, Series B2 | | | 5.500 | | | | 09/01/2036 | | | | 1,818,638 | |
| | 1,750,000 | | | Mashantucket, CT Western Pequot Tribe, Series B2 | | | 5.750 | | | | 09/01/2027 | | | | 981,698 | |
| | 6,000,000 | | | Mashantucket, CT Western Pequot Tribe, Series B2,9 | | | 6.500 | | | | 09/01/2031 | | | | 3,466,320 | |
| | 1,715,000 | | | West Haven, CT Hsg. Authority (Meadow Landing Apartments)2 | | | 6.000 | | | | 01/01/2028 | | | | 1,403,556 | |
| | | | | | | | | | | | | | | | |
| | | | | | | | | | | | | | | | 9,748,814 | |
| | | | | | | | | | | | | | | | | |
| Delaware—0.1% | | | | | | | | | | | | |
| | 15,000 | | | DE Hsg. Authority (Single Family Mtg.)2 | | | 6.000 | | | | 07/01/2018 | | | | 15,015 | |
| | 55,000 | | | DE Hsg. Authority (Single Family Mtg.)2 | | | 6.000 | | | | 07/01/2032 | | | | 55,220 | |
| | 6,939,000 | | | Millsboro, DE Special Obligation (Plantation Lakes)2 | | | 5.450 | | | | 07/01/2036 | | | | 3,978,961 | |
| | | | | | | | | | | | | | | | |
| | | | | | | | | | | | | | | | 4,049,196 | |
| | | | | | | | | | | | | | | | | |
| District of Columbia—1.5% | | | | | | | | | | | | |
| | 170,000 | | | District of Columbia HFA (Benning Road Apartments)2 | | | 6.300 | | | | 01/01/2012 | | | | 163,640 | |
| | 10,380,000 | | | District of Columbia HFA (Shipley Park Apartments)1 | | | 4.800 | | | | 06/01/2038 | | | | 9,872,678 | |
| | 105,000 | | | District of Columbia Tobacco Settlement Financing Corp.2 | | | 6.250 | | | | 05/15/2024 | | | | 101,454 | |
| | 32,680,000 | | | District of Columbia Tobacco Settlement Financing Corp.2 | | | 6.750 | | | | 05/15/2040 | | | | 27,496,298 | |
| | 515,000,000 | | | District of Columbia Tobacco Settlement Financing Corp. (TASC) | | | 6.367 | 5 | | | 06/15/2046 | | | | 12,602,050 | |
| | 1,375,680,000 | | | District of Columbia Tobacco Settlement Financing Corp. (TASC) | | | 6.897 | 5 | | | 06/15/2055 | | | | 8,845,622 | |
F9 | OPPENHEIMER ROCHESTER NATIONAL MUNICIPALS
STATEMENT OF INVESTMENTS Continued
| | | | | | | | | | | | | | | | | |
| Principal | | | | | | | | | | | | |
| Amount | | | | | Coupon | | | Maturity | | | Value | |
| |
| District of Columbia Continued | | | | | | | | | | | | |
| $ | 1,055,000,000 | | | District of Columbia Tobacco Settlement Financing Corp. (TASC) | | | 7.250 | %5 | | | 06/15/2055 | | | $ | 5,180,050 | |
| | 12,100,000 | | | Metropolitan Washington D.C. Airport Authority, Series B1 | | | 5.000 | | | | 10/01/2034 | | | | 11,031,250 | |
| | | | | | | | | | | | | | | | |
| | | | | | | | | | | | | | | | 75,293,042 | |
| | | | | | | | | | | | | | | | | |
| Florida—20.6% | | | | | | | | | | | | |
| | 1,110,000 | | | Aberdeen, FL Community Devel. District | | | 5.250 | | | | 11/01/2015 | | | | 670,029 | |
| | 340,000 | | | Aberdeen, FL Community Devel. District2 | | | 5.500 | | | | 11/01/2011 | | | | 243,035 | |
| | 22,800,000 | | | Aberdeen, FL Community Devel. District | | | 5.500 | | | | 05/01/2036 | | | | 12,427,368 | |
| | 8,000,000 | | | Alachua County, FL Industrial Devel. Revenue (North Florida Retirement Village)2 | | | 5.875 | | | | 11/15/2042 | | | | 5,560,000 | |
| | 5,350,000 | | | Amelia Concourse, FL Community Devel. District3 | | | 5.750 | | | | 05/01/2038 | | | | 2,562,329 | |
| | 1,770,000 | | | Amelia Walk, FL Community Devel. District Special Assessment3 | | | 5.500 | | | | 05/01/2037 | | | | 947,516 | |
| | 12,205,000 | | | Arborwood, FL Community Devel. District (Centex Homes)2 | | | 5.250 | | | | 05/01/2016 | | | | 9,443,863 | |
| | 13,895,000 | | | Arlington Ridge, FL Community Devel. District | | | 5.500 | | | | 05/01/2036 | | | | 6,105,463 | |
| | 9,115,000 | | | Ave Maria Stewardship, FL Community Devel. District2 | | | 5.125 | | | | 05/01/2038 | | | | 4,709,629 | |
| | 2,200,000 | | | Avelar Creek, FL Community Devel. District2 | | | 5.375 | | | | 05/01/2036 | | | | 1,289,134 | |
| | 1,045,000 | | | Avignon Villages, FL Community Devel. District3,4 | | | 5.300 | | | | 05/01/2014 | | | | 402,325 | |
| | 755,000 | | | Avignon Villages, FL Community Devel. District3,4 | | | 5.400 | | | | 05/01/2037 | | | | 290,728 | |
| | 1,000,000 | | | Bahia Lakes, FL Community Devel. District2 | | | 5.450 | | | | 05/01/2037 | | | | 589,920 | |
| | 2,585,000 | | | Bainebridge, FL Community Devel. District2 | | | 5.500 | | | | 05/01/2038 | | | | 1,429,091 | |
| | 10,000,000 | | | Baker, FL Correctional Devel. Corp. (Detention Center)2 | | | 7.500 | | | | 02/01/2030 | | | | 8,497,800 | |
| | 5,165,000 | | | Bay Laurel Center, FL Community Devel. District Special Assessment2 | | | 5.450 | | | | 05/01/2037 | | | | 3,237,680 | |
| | 225,000 | | | Bayshore, FL Hsg. Corp.3 | | | 8.000 | | | | 12/01/2016 | | | | 64,413 | |
| | 4,385,000 | | | Baywinds, FL Community Devel. District3 | | | 4.900 | | | | 05/01/2012 | | | | 1,972,812 | |
| | 10,650,000 | | | Baywinds, FL Community Devel. District | | | 5.250 | | | | 05/01/2037 | | | | 4,866,518 | |
| | 4,200,000 | | | Beacon Lakes, FL Community Devel. District Special Assessment2 | | | 6.000 | | | | 05/01/2038 | | | | 2,667,882 | |
| | 3,380,000 | | | Beacon Lakes, FL Community Devel. District Special Assessment2 | | | 6.200 | | | | 05/01/2038 | | | | 2,103,712 | |
| | 1,955,000 | | | Beacon, FL Tradeport Community Devel. District2 | | | 7.250 | | | | 05/01/2033 | | | | 1,681,417 | |
| | 10,640,000 | | | Bella Verde, FL Golf Community Devel. District3,4,7 | | | 7.250 | | | | 05/15/2009 | | | | 3,936,800 | |
| | 10,000,000 | | | Bonnet Creek, FL Resort Community Devel. District Special Assessment2 | | | 7.375 | | | | 05/01/2034 | | | | 8,125,900 | |
| | 9,625,000 | | | Bonnet Creek, FL Resort Community Devel. District Special Assessment2 | | | 7.500 | | | | 05/01/2034 | | | | 7,936,679 | |
| | 3,950,000 | | | Boynton Village, FL Community Devel. District Special Assessment2 | | | 6.000 | | | | 05/01/2038 | | | | 2,592,267 | |
F10 | OPPENHEIMER ROCHESTER NATIONAL MUNICIPALS
| | | | | | | | | | | | | | | | | |
| Principal | | | | | | | | | | | | |
| Amount | | | | | Coupon | | | Maturity | | | Value | |
| |
| Florida Continued | | | | | | | | | | | | |
| $ | 75,000 | | | Broward County, FL Educational Facilities Authority (Pompano Oaks Apartments)2 | | | 6.000 | % | | | 12/01/2027 | | | $ | 75,054 | |
| | 25,000 | | | Broward County, FL HFA (Cross Keys Apartments)2 | | | 5.750 | | | | 10/01/2028 | | | | 23,773 | |
| | 12,475,000 | | | Broward County, FL HFA (Pembroke Village Apartments)2 | | | 7.000 | | | | 06/01/2046 | | | | 12,020,411 | |
| | 595,000 | | | Broward County, FL HFA (Single Family)2 | | | 5.000 | | | | 10/01/2039 | | | | 545,758 | |
| | 15,000 | | | Broward County, FL HFA (Stirling Apartments)2 | | | 5.600 | | | | 10/01/2018 | | | | 15,079 | |
| | 125,000 | | | Broward County, FL HFA (Stirling Apartments)2 | | | 5.750 | | | | 04/01/2038 | | | | 125,114 | |
| | 16,500,000 | | | Broward County, FL Water and Sewer1 | | | 5.250 | | | | 10/01/2034 | | | | 16,696,350 | |
| | 5,955,000 | | | Buckeye Park, FL Community Devel. District3 | | | 7.875 | | | | 05/01/2038 | | | | 2,931,885 | |
| | 800,000 | | | Cascades, FL Groveland Community Devel. District2 | | | 5.300 | | | | 05/01/2036 | | | | 355,168 | |
| | 25,790,000 | | | CFM, FL Community Devel. District, Series A2 | | | 6.250 | | | | 05/01/2035 | | | | 12,963,601 | |
| | 2,500,000 | | | Chapel Creek, FL Community Devel. District Special Assessment | | | 5.200 | | | | 05/01/2011 | | | | 1,222,425 | |
| | 3,665,000 | | | Chapel Creek, FL Community Devel. District Special Assessment | | | 5.250 | | | | 05/01/2015 | | | | 1,625,061 | |
| | 12,480,000 | | | Chapel Creek, FL Community Devel. District Special Assessment | | | 5.500 | | | | 05/01/2038 | | | | 5,673,283 | |
| | 4,100,000 | | | City Center, FL Community Devel. District | | | 6.000 | | | | 05/01/2038 | | | | 2,133,025 | |
| | 7,430,000 | | | City Center, FL Community Devel. District | | | 6.125 | | | | 05/01/2036 | | | | 4,080,556 | |
| | 26,530,000 | | | Clearwater Cay, FL Community Devel. District | | | 5.500 | | | | 05/01/2037 | | | | 12,120,496 | |
| | 55,000 | | | Collier County, FL IDA (Allete)2 | | | 6.500 | | | | 10/01/2025 | | | | 52,320 | |
| | 16,110,000 | | | Concord Stations, FL Community Devel. District | | | 5.300 | | | | 05/01/2035 | | | | 7,520,792 | |
| | 3,775,000 | | | Connerton West, FL Community Devel. District | | | 5.125 | | | | 05/01/2016 | | | | 1,797,542 | |
| | 4,310,000 | | | Connerton West, FL Community Devel. District2 | | | 5.400 | | | | 05/01/2038 | | | | 2,032,898 | |
| | 4,910,000 | | | Copperstone, FL Community Devel. District2 | | | 5.200 | | | | 05/01/2038 | | | | 2,612,169 | |
| | 7,400,000 | | | Cordoba Ranch, FL Community Devel. District Special Assessment3 | | | 5.550 | | | | 05/01/2037 | | | | 2,916,044 | |
| | 3,125,000 | | | Coronado, FL Community Devel. District2 | | | 6.000 | | | | 05/01/2038 | | | | 2,001,406 | |
| | 3,230,000 | | | Creekside, FL Community Devel. District2 | | | 5.200 | | | | 05/01/2038 | | | | 1,656,150 | |
| | 1,100,000 | | | Crestview II, FL Community Devel. District Special Assessment2 | | | 5.600 | | | | 05/01/2037 | | | | 731,192 | |
| | 2,625,000 | | | Crosscreek, FL Community Devel. District2 | | | 5.500 | | | | 05/01/2017 | | | | 733,163 | |
| | 1,280,000 | | | Crosscreek, FL Community Devel. District2 | | | 5.600 | | | | 05/01/2039 | | | | 357,491 | |
| | 9,440,000 | | | Cypress Creek of Hillsborough County, FL Community Devel. District2 | | | 5.350 | | | | 05/01/2037 | | | | 4,537,714 | |
| | 70,000 | | | Dade City, FL (First Mtg.-Retirement Care)2 | | | 8.000 | | | | 01/01/2025 | | | | 70,652 | |
| | 45,000 | | | Dade County, FL HFA (Golden Lakes Apartments)2 | | | 6.050 | | | | 11/01/2039 | | | | 43,719 | |
| | 90,000 | | | Dade County, FL HFA (Siesta Pointe Apartments)2 | | | 5.650 | | | | 09/01/2017 | | | | 90,071 | |
| | 8,569 | | | Dade County, FL HFA (Single Family Mtg.)2 | | | 6.100 | | | | 04/01/2027 | | | | 8,624 | |
| | 1,700,000 | | | Dade County, FL IDA (Miami Cerebral Palsy Residence)2 | | | 8.000 | | | | 06/01/2022 | | | | 1,447,601 | |
F11 | OPPENHEIMER ROCHESTER NATIONAL MUNICIPALS
STATEMENT OF INVESTMENTS Continued
| | | | | | | | | | | | | | | |
| Principal | | | | | | | | |
| Amount | | | | Coupon | | | Maturity | | Value | |
| |
| Florida Continued | | | | | | | | | | |
| $ | 115,000 | | | Dade County, FL Res Rec2 | | | 5.500 | % | | 10/01/2013 | | $ | 115,108 | |
| | 7,815,000 | | | Deer Run, FL Community Devel. District Special Assessment2 | | | 7.625 | | | 05/01/2039 | | | 5,945,339 | |
| | 3,015,000 | | | Durbin Crossing, FL Community Devel. District Special Assessment2 | | | 5.250 | | | 11/01/2015 | | | 1,938,344 | |
| | 2,355,000 | | | East Homestead, FL Community Devel. District2 | | | 5.375 | | | 05/01/2036 | | | 1,304,599 | |
| | 900,000 | | | East Homestead, FL Community Devel. District2 | | | 5.450 | | | 11/01/2036 | | | 568,242 | |
| | 2,225,000 | | | East Park, FL Community Devel. District Special Assessment2 | | | 7.500 | | | 05/01/2039 | | | 1,711,314 | |
| | 1,095,000 | | | Easton Park, FL Community Devel. District2 | | | 5.200 | | | 05/01/2037 | | | 623,186 | |
| | 5,000 | | | Edgewater, FL Water & Sewer2 | | | 7.000 | | | 10/01/2021 | | | 5,020 | |
| | 1,500,000 | | | Enclave at Black Point Marina, FL Community Devel. District3 | | | 5.200 | | | 05/01/2014 | | | 917,355 | |
| | 1,225,000 | | | Enclave at Black Point Marina, FL Community Devel. District3 | | | 5.400 | | | 05/01/2037 | | | 607,576 | |
| | 75,000 | | | Escambia County, FL HFA (Single Family Mtg.)2 | | | 5.500 | | | 10/01/2031 | | | 75,271 | |
| | 21,000,000 | | | Fiddler’s Creek, FL Community Devel. District No. 2 | | | 6.000 | | | 05/01/2038 | | | 12,030,270 | |
| | 175,000 | | | FL Capital Projects Finance Authority (Peerless Group)2 | | | 7.500 | | | 08/01/2019 | | | 138,733 | |
| | 26,200,000 | | | FL Capital Trust Agency (AHF Florida LLC) | | | 8.125 | | | 10/01/2038 | | | 15,783,404 | |
| | 3,085,000 | | | FL Capital Trust Agency (American Opportunity)2 | | | 5.750 | �� | | 06/01/2023 | | | 2,174,431 | |
| | 2,000,000 | | | FL Capital Trust Agency (American Opportunity)2 | | | 5.875 | | | 06/01/2038 | | | 1,230,400 | |
| | 950,000 | | | FL Capital Trust Agency (American Opportunity) | | | 7.250 | | | 06/01/2038 | | | 486,210 | |
| | 690,000 | | | FL Capital Trust Agency (American Opportunity)2 | | | 8.250 | | | 12/01/2038 | | | 321,650 | |
| | 7,000,000 | | | FL Capital Trust Agency (Atlantic Hsg. Foundation)2 | | | 7.000 | | | 07/15/2032 | | | 5,783,750 | |
| | 13,000,000 | | | FL Capital Trust Agency (Atlantic Hsg. Foundation)2 | | | 8.260 | | | 07/15/2038 | | | 10,727,210 | |
| | 2,460,000 | | | FL Gateway Services Community Devel. District (Sun City Center)2 | | | 6.500 | | | 05/01/2033 | | | 2,068,122 | |
| | 30,000 | | | FL HFA (Hsg. Partners of Panama City)2 | | | 5.700 | | | 05/01/2037 | | | 28,211 | |
| | 100,000 | | | FL HFA (Mar Lago Village Apartments)2 | | | 5.900 | | | 12/01/2027 | | | 87,513 | |
| | 115,000 | | | FL HFA (Reserve at Kanapaha)2 | | | 5.700 | | | 07/01/2037 | | | 104,582 | |
| | 20,000 | | | FL HFA (Spinnaker Cove Apartments)2 | | | 6.500 | | | 07/01/2036 | | | 20,003 | |
| | 1,345,000 | | | FL HFA (St. Cloud Village Associates) | | | 8.000 | | | 02/15/2030 | | | 1,000,008 | |
| | 75,000 | | | FL HFA (Stoddert Arms Apartments)2 | | | 6.250 | | | 09/01/2026 | | | 75,016 | |
| | 15,000 | | | FL HFA (Wentworth Apartments)2 | | | 5.450 | | | 10/01/2037 | | | 12,313 | |
| | 50,000 | | | FL HFA (Willow Lake Apartments)2 | | | 5.250 | | | 01/01/2021 | | | 46,152 | |
| | 100,000 | | | FL HFA (Willow Lake Apartments)2 | | | 5.350 | | | 07/01/2027 | | | 86,528 | |
| | 100,000 | | | FL HFC (Ashton Point Apartments)2 | | | 5.750 | | | 07/01/2036 | | | 100,156 | |
| | 85,000 | | | FL HFC (Brittany of Rosemont)2 | | | 6.250 | | | 07/01/2035 | | | 83,496 | |
| | 20,000 | | | FL HFC (East Lake Apartments)2 | | | 5.050 | | | 10/01/2026 | | | 18,047 | |
| | 45,000 | | | FL HFC (Grande Pointe Apartments)2 | | | 6.000 | | | 07/01/2038 | | | 45,203 | |
| | 8,535,000 | | | FL HFC (Homeowner Mtg.)1 | | | 5.150 | | | 07/01/2038 | | | 8,271,380 | |
F12 | OPPENHEIMER ROCHESTER NATIONAL MUNICIPALS
| | | | | | | | | | | | | | | | | |
| Principal | | | | | | | | | | | | |
| Amount | | | | | Coupon | | | Maturity | | | Value | |
| |
| Florida Continued | | | | | | | | | | | | |
| $ | 120,000 | | | FL HFC (Homeowner Mtg.) | | | 5.573 | %5 | | | 01/01/2029 | | | $ | 38,665 | |
| | 15,000 | | | FL HFC (Homeowner Mtg.)2 | | | 6.250 | | | | 07/01/2022 | | | | 15,493 | |
| | 145,000 | | | FL HFC (Logan Heights Apartments)2 | | | 6.000 | | | | 10/01/2039 | | | | 141,436 | |
| | 25,000 | | | FL HFC (Mystic Pointe II)2 | | | 6.100 | | | | 12/01/2035 | | | | 25,373 | |
| | 25,000 | | | FL HFC (Raceway Pointe Apartments)2 | | | 5.950 | | | | 09/01/2032 | | | | 23,971 | |
| | 10,000 | | | FL HFC (River Trace Senior Apartments)2 | | | 5.800 | | | | 01/01/2041 | | | | 10,021 | |
| | 10,000 | | | FL HFC (Sanctuary Winterlakes)2 | | | 5.850 | | | | 09/01/2026 | | | | 10,101 | |
| | 20,000 | | | FL HFC (Sheridan Place of Bredenton)2 | | | 5.500 | | | | 10/01/2036 | | | | 20,089 | |
| | 95,000 | | | FL HFC (Spring Harbor Apartments)2 | | | 5.900 | | | | 08/01/2039 | | | | 95,336 | |
| | 10,000 | | | FL HFC (Sundance Pointe Associates)2 | | | 5.850 | | | | 02/01/2037 | | | | 10,031 | |
| | 10,000 | | | FL HFC (Villas De Mallorca)2 | | | 5.750 | | | | 07/01/2027 | | | | 10,140 | |
| | 5,075,000 | | | FL HFC (Westchase Apartments) | | | 6.610 | | | | 07/01/2038 | | | | 3,330,621 | |
| | 8,630,000 | | | FL Island at Doral III Community Devel. District Special Assessment2 | | | 5.900 | | | | 05/01/2035 | | | | 5,362,423 | |
| | 3,400,000 | | | FL Lake Ashton II Community Devel. District2 | | | 5.375 | | | | 05/01/2036 | | | | 2,015,350 | |
| | 2,910,000 | | | FL Mira Lago West Community Devel. District2 | | | 5.375 | | | | 05/01/2036 | | | | 1,796,110 | |
| | 1,555,000 | | | FL New Port Tampa Bay Community Devel. District7 | | | 5.300 | | | | 11/01/2012 | | | | 543,317 | �� |
| | 24,390,000 | | | FL New Port Tampa Bay Community Devel. District7 | | | 5.875 | | | | 05/01/2038 | | | | 8,521,866 | |
| | 1,500,000 | | | FL Parker Road Community Devel. District2 | | | 5.350 | | | | 05/01/2015 | | | | 901,800 | |
| | 1,480,000 | | | FL Parker Road Community Devel. District2 | | | 5.600 | | | | 05/01/2038 | | | | 811,514 | |
| | 1,500,000 | | | Flora Ridge, FL Educational Facilities Benefit District2 | | | 5.300 | | | | 05/01/2037 | | | | 950,910 | |
| | 5,300,000 | | | Fontainbleau Lakes, FL Community Devel. District2 | | | 6.000 | | | | 05/01/2015 | | | | 2,824,529 | |
| | 4,000,000 | | | Fontainbleau Lakes, FL Community Devel. District2 | | | 6.000 | | | | 05/01/2038 | | | | 2,230,200 | |
| | 9,575,000 | | | Forest Creek, FL Community Devel. District3 | | | 5.450 | | | | 05/01/2036 | | | | 4,409,479 | |
| | 7,915,000 | | | Glades, FL Correctional Devel. Corp. (Glades County Detention)2 | | | 7.375 | | | | 03/01/2030 | | | | 6,473,679 | |
| | 10,000,000 | | | Grand Bay at Doral, FL Community Devel. District2 | | | 6.000 | | | | 05/01/2017 | | | | 6,668,400 | |
| | 8,735,000 | | | Grand Bay at Doral, FL Community Devel. District2 | | | 6.000 | | | | 05/01/2039 | | | | 4,530,582 | |
| | 12,200,000 | | | Greater Lakes/Sawgrass Bay, FL Community Devel. District | | | 5.500 | | | | 05/01/2038 | | | | 6,124,522 | |
| | 7,505,000 | | | Greater Orlando, FL Aviation Authority (JetBlue Airways Corp.) | | | 6.375 | | | | 11/15/2026 | | | | 5,113,457 | |
| | 14,965,000 | | | Greater Orlando, FL Aviation Authority (JetBlue Airways Corp.) | | | 6.500 | | | | 11/15/2036 | | | | 9,679,661 | |
| | 2,830,000 | | | Greyhawk Landing, FL Community Devel. District Special Assessment2 | | | 7.000 | | | | 05/01/2033 | | | | 2,580,479 | |
| | 100,000 | | | Gulf Breeze, FL GO2 | | | 5.900 | | | | 12/01/2015 | | | | 100,086 | |
| | 5,855,000 | | | Hammocks, FL Community Devel. District Special Assessment2 | | | 5.500 | | | | 05/01/2037 | | | | 3,059,238 | |
| | 8,800,000 | | | Harrison Ranch, FL Community Devel. District2 | | | 5.300 | | | | 05/01/2038 | | | | 4,950,968 | |
| | 1,125,000 | | | Hawks Point, FL Community Devel. District2 | | | 5.300 | | | | 05/01/2039 | | | | 629,955 | |
F13 | OPPENHEIMER ROCHESTER NATIONAL MUNICIPALS
STATEMENT OF INVESTMENTS Continued
| | | | | | | | | | | | | | | | | |
| Principal | | | | | | | | | | | | |
| Amount | | | | | Coupon | | | Maturity | | | Value | |
| |
| Florida Continued | | | | | | | | | | | | |
| $ | 15,435,000 | | | Heritage Bay, FL Community Devel. District2 | | | 5.500 | % | | | 05/01/2036 | | | $ | 9,207,595 | |
| | 14,980,000 | | | Heritage Harbour North, FL Community Devel. District2 | | | 6.375 | | | | 05/01/2038 | | | | 10,184,602 | |
| | 1,910,000 | | | Heritage Plantation, FL Community Devel. District | | | 5.100 | | | | 11/01/2013 | | | | 1,298,991 | |
| | 3,480,000 | | | Heritage Plantation, FL Community Devel. District | | | 5.400 | | | | 05/01/2037 | | | | 1,725,697 | |
| | 12,000,000 | | | Hialeah Gardens, FL Health Facilities Authority (CHS/SJRNC/VMNRC/SJR/CHFTEH/SANC Obligated Group)2 | | | 5.250 | | | | 08/15/2031 | | | | 11,269,560 | |
| | 930,000 | | | Highland Meadows, FL Community Devel. District Special Assessment, Series A2 | | | 5.500 | | | | 05/01/2036 | | | | 409,674 | |
| | 4,035,000 | | | Highlands, FL Community Devel. District3 | | | 5.550 | | | | 05/01/2036 | | | | 2,059,868 | |
| | 2,000,000 | | | Hillsborough County, FL IDA (National Gypsum Company)2 | | | 7.125 | | | | 04/01/2030 | | | | 1,127,800 | |
| | 9,250,000 | | | Hillsborough County, FL IDA (Senior Care Group)2 | | | 6.700 | | | | 07/01/2021 | | | | 7,603,593 | |
| | 6,035,000 | | | Hillsborough County, FL IDA (Senior Care Group)2 | | | 6.750 | | | | 07/01/2029 | | | | 4,762,339 | |
| | 11,300,000 | | | Indigo, FL Community Devel. District2 | | | 5.750 | | | | 05/01/2036 | | | | 5,859,615 | |
| | 715,000 | | | Jacksonville, FL Water and Sewage (United Waterworks)2 | | | 6.350 | | | | 08/01/2025 | | | | 714,979 | |
| | 1,405,000 | | | K-Bar Ranch, FL Community Devel. District Special Assessment3 | | | 5.450 | | | | 05/01/2036 | | | | 646,581 | |
| | 2,800,000 | | | Keys Cove, FL Community Devel. District2 | | | 5.500 | | | | 05/01/2036 | | | | 1,859,620 | |
| | 1,160,000 | | | Keys Cove, FL Community Devel. District2 | | | 5.875 | | | | 05/01/2035 | | | | 876,925 | |
| | 920,000 | | | Lake Frances, FL Community Devel. District Special Assessment3 | | | 5.300 | | | | 05/01/2037 | | | | 459,393 | |
| | 2,000,000 | | | Lakeside Landings, FL Devel. District3 | | | 5.250 | | | | 05/01/2013 | | | | 918,400 | |
| | 750,000 | | | Lakeside Landings, FL Devel. District3 | | | 5.500 | | | | 05/01/2038 | | | | 341,903 | |
| | 9,260,000 | | | Lakewood Ranch, FL Stewardship District2 | | | 5.500 | | | | 05/01/2036 | | | | 5,544,703 | |
| | 12,000,000 | | | Lakewood Ranch, FL Stewardship District (Country Club East Investors)2 | | | 5.400 | | | | 05/01/2037 | | | | 7,107,960 | |
| | 14,500,000 | | | Landmark at Doral, FL Community Devel. District Special Assessment | | | 5.200 | | | | 05/01/2015 | | | | 5,175,775 | |
| | 8,000,000 | | | Landmark at Doral, FL Community Devel. District Special Assessment | | | 5.500 | | | | 05/01/2038 | | | | 2,811,120 | |
| | 69,247 | | | Largo, FL Sun Coast Health System (Sun Coast Hospital) | | | 6.200 | | | | 03/01/2013 | | | | 35,323 | |
| | 65,000 | | | Lee County, FL HFA (Single Family Mtg.)2 | | | 7.200 | | | | 03/01/2033 | | | | 66,195 | |
| | 1,200,000 | | | Legends Bay, FL Community Devel. District3 | | | 5.500 | | | | 05/01/2014 | | | | 607,464 | |
| | 1,500,000 | | | Legends Bay, FL Community Devel. District3 | | | 5.875 | | | | 05/01/2038 | | | | 754,980 | |
| | 100,000 | | | Leon County, FL Educational Facilities Authority (Southgate Residence Hall)3 | | | 6.750 | | | | 09/01/2028 | | | | 60,904 | |
| | 1,385,000 | | | Liberty County, FL Revenue (Twin Oaks) | | | 8.250 | | | | 07/01/2028 | | | | 1,166,392 | |
| | 7,955,000 | | | Madeira, FL Community Devel. District2 | | | 5.250 | | | | 11/01/2014 | | | | 4,007,411 | |
| | 8,045,000 | | | Madeira, FL Community Devel. District2 | | | 5.450 | | | | 05/01/2039 | | | | 3,941,809 | |
| | 1,550,000 | | | Madison County, FL Mtg. (Twin Oaks)2 | | | 6.000 | | | | 07/01/2025 | | | | 1,139,219 | |
F14 | OPPENHEIMER ROCHESTER NATIONAL MUNICIPALS
| | | | | | | | | | | | | | | | | |
| Principal | | | | | | | | | | | | |
| Amount | | | | | Coupon | | | Maturity | | | Value | |
| |
| Florida Continued | | | | | | | | | | | | |
| $ | 5,000,000 | | | Magnolia Creek, FL Community Devel. District2 | | | 5.600 | % | | | 05/01/2014 | | | $ | 3,143,000 | |
| | 5,360,000 | | | Magnolia Creek, FL Community Devel. District2 | | | 5.900 | | | | 05/01/2039 | | | | 2,982,518 | |
| | 2,855,000 | | | Magnolia West, FL Community Devel. District Special Assessment2 | | | 5.350 | | | | 05/01/2037 | | | | 1,547,496 | |
| | 3,000,000 | | | Main Street, FL Community Devel. District2 | | | 6.800 | | | | 05/01/2038 | | | | 2,229,930 | |
| | 14,255,000 | | | Martin County, FL IDA (Indiantown Cogeneration)2 | | | 7.875 | | | | 12/15/2025 | | | | 14,136,684 | |
| | 1,035,000 | | | Martin County, FL IDA (Indiantown Cogeneration)2 | | | 8.050 | | | | 12/15/2025 | | | | 1,034,783 | |
| | 4,800,000 | | | Meadow Woods, FL Community Devel. District Special Assessment2 | | | 6.050 | | | | 05/01/2035 | | | | 2,524,368 | |
| | 3,980,000 | | | Mediterranea, FL Community Devel. District Special Assessment2 | | | 5.600 | | | | 05/01/2037 | | | | 2,283,008 | |
| | 1,025,000 | | | Miami Beach, FL Health Facilities Authority (Mt. Sinai Medical Center)2 | | | 6.700 | | | | 11/15/2019 | | | | 895,174 | |
| | 540,000 | | | Miami Beach, FL Health Facilities Authority (Mt. Sinai Medical Center)2 | | | 6.800 | | | | 11/15/2031 | | | | 398,963 | |
| | 15,000,000 | | | Miami-Dade County, FL Aviation (Miami International Airport)1 | | | 5.000 | | | | 10/01/2040 | | | | 13,103,850 | |
| | 10,000,000 | | | Miami-Dade County, FL School Board COP1 | | | 5.000 | | | | 02/01/2027 | | | | 9,963,450 | |
| | 10,000,000 | | | Miami-Dade County, FL School Board COP1 | | | 5.250 | | | | 02/01/2027 | | | | 10,172,150 | |
| | 50,000,000 | | | Miami-Dade County, FL School Board COP1 | | | 5.375 | | | | 02/01/2034 | | | | 50,414,750 | |
| | 11,590,000 | | | Miromar Lakes, FL Community Devel. District2 | | | 6.875 | | | | 05/01/2035 | | | | 8,319,997 | |
| | 9,740,000 | | | Miromar Lakes, FL Community Devel. District2 | | | 7.375 | | | | 05/01/2032 | | | | 7,554,344 | |
| | 16,955,000 | | | Montecito, FL Community Devel. District | | | 5.100 | | | | 05/01/2013 | | | | 8,046,843 | |
| | 5,535,000 | | | Montecito, FL Community Devel. District | | | 5.500 | | | | 05/01/2037 | | | | 2,528,720 | |
| | 680,000 | | | Moody River, FL Estates Community Devel. District2 | | | 5.350 | | | | 05/01/2036 | | | | 363,807 | |
| | 16,670,000 | | | Myrtle Creek, FL Improvement District Special Assessment2 | | | 5.200 | | | | 05/01/2037 | | | | 8,872,274 | |
| | 11,150,000 | | | Nassau County, FL (Nassau Care Centers)2 | | | 6.900 | | | | 01/01/2038 | | | | 8,676,707 | |
| | 20,000 | | | Nassau County, FL Pollution Control (ITT Rayonier)2 | | | 6.200 | | | | 07/01/2015 | | | | 18,674 | |
| | 1,735,000 | | | Naturewalk, FL Community Devel. District2 | | | 5.300 | | | | 05/01/2016 | | | | 891,252 | |
| | 5,425,000 | | | Naturewalk, FL Community Devel. District2 | | | 5.500 | | | | 05/01/2038 | | | | 2,692,699 | |
| | 2,465,000 | | | North Springs, FL Improvement District (Heron Bay North Assessment) | | | 5.200 | | | | 05/01/2027 | | | | 1,477,447 | |
| | 14,940,000 | | | North Springs, FL Improvement District (Parkland Golf-Country Club) | | | 5.450 | | | | 05/01/2026 | | | | 9,090,990 | |
| | 750,000 | | | Northern Palm Beach, FL Improvement District2 | | | 5.350 | | | | 08/01/2041 | | | | 426,053 | |
| | 3,995,000 | | | Oak Creek, FL Community Devel. District Special Assessment2 | | | 5.800 | | | | 05/01/2035 | | | | 2,443,781 | |
| | 2,750,000 | | | Oakmont Grove, FL Community Devel. District Special Assessment3 | | | 5.250 | | | | 05/01/2012 | | | | 1,253,808 | |
| | 4,595,000 | | | Oakmont Grove, FL Community Devel. District Special Assessment3 | | | 5.400 | | | | 05/01/2038 | | | | 1,881,928 | |
F15 | OPPENHEIMER ROCHESTER NATIONAL MUNICIPALS
STATEMENT OF INVESTMENTS Continued
| | | | | | | | | | | | | | | | | |
| Principal | | | | | | | | | | | | |
| Amount | | | | | Coupon | | | Maturity | | | Value | |
| |
| Florida Continued | | | | | | | | | | | | |
| $ | 3,340,000 | | | Old Palm, FL Community Devel. District (Palm Beach Gardens)2 | | | 5.375 | % | | | 05/01/2014 | | | $ | 2,773,670 | |
| | 1,535,000 | | | Orange County, FL Health Facilities Authority (GF Orlando/CFGH Obligated Group)2 | | | 8.875 | | | | 07/01/2021 | | | | 1,555,523 | |
| | 3,200,000 | | | Orange County, FL Health Facilities Authority (GF Orlando/CFGH Obligated Group)2 | | | 9.000 | | | | 07/01/2031 | | | | 3,201,120 | |
| | 750,000 | | | Orange County, FL Health Facilities Authority (Orlando Lutheran Tower)2 | | | 5.500 | | | | 07/01/2032 | | | | 499,440 | |
| | 1,125,000 | | | Orange County, FL Health Facilities Authority (Orlando Lutheran Tower)2 | | | 5.500 | | | | 07/01/2038 | | | | 724,523 | |
| | 6,020,000 | | | Orange County, FL HFA (Dunwoodie Apartments)2 | | | 6.500 | | | | 07/01/2035 | | | | 4,013,052 | |
| | 10,000 | | | Orange County, FL HFA (Homeowner)2 | | | 5.200 | | | | 09/01/2023 | | | | 10,003 | |
| | 135,000 | | | Orange County, FL HFA (Homeowner) | | | 5.420 | 5 | | | 03/01/2028 | | | | 47,592 | |
| | 15,000 | | | Orange County, FL HFA (Homeowner)2 | | | 5.550 | | | | 09/01/2033 | | | | 15,097 | |
| | 5,000 | | | Orange County, FL HFA (Park Avenue Villas)2 | | | 5.250 | | | | 09/01/2031 | | | | 5,006 | |
| | 15,000,000 | | | Orlando, FL Utilities Commission1 | | | 5.000 | | | | 10/01/2033 | | | | 15,000,900 | |
| | 18,500,000 | | | Orlando, FL Utilities Commission1 | | | 5.250 | | | | 10/01/2039 | | | | 18,680,283 | |
| | 3,750,000 | | | Palm Bay, FL Educational Facilities (Patriot Charter School)3 | | | 7.000 | | | | 07/01/2036 | | | | 2,249,550 | |
| | 55,000 | | | Palm Beach County, FL HFA (Golden Lake Hsg. Assoc.)2 | | | 6.100 | | | | 08/01/2029 | | | | 55,028 | |
| | 13,995,000 | | | Palm Coast Park, FL Community Devel. District Special Assessment2 | | | 5.700 | | | | 05/01/2037 | | | | 7,699,909 | |
| | 2,700,000 | | | Palm Glades, FL Community Devel. District2 | | | 5.300 | | | | 05/01/2036 | | | | 1,618,488 | |
| | 6,565,000 | | | Palm Glades, FL Community Devel. District Special Assessment2 | | | 7.125 | | | | 05/01/2039 | | | | 4,635,153 | |
| | 1,850,000 | | | Palm River, FL Community Devel. District3 | | | 5.150 | | | | 05/01/2013 | | | | 828,615 | |
| | 935,000 | | | Palm River, FL Community Devel. District2 | | | 5.375 | | | | 05/01/2036 | | | | 418,787 | |
| | 1,500,000 | | | Parkway Center, FL Community Devel. District, Series A2 | | | 6.300 | | | | 05/01/2034 | | | | 954,165 | |
| | 2,565,000 | | | Paseo, FL Community Devel. District3 | | | 5.000 | | | | 02/01/2011 | | | | 1,473,387 | |
| | 6,480,000 | | | Pine Ridge Plantation, FL Community Devel. District2 | | | 5.400 | | | | 05/01/2037 | | | | 3,263,522 | |
| | 4,625,000 | | | Pinellas County, FL Health Facility Authority (St. Mark Village)2 | | | 5.650 | | | | 05/01/2037 | | | | 3,094,634 | |
| | 35,000 | | | Pinellas County, FL HFA (Single Family Hsg.)2 | | | 5.200 | | | | 03/01/2037 | | | | 31,549 | |
| | 115,000 | | | Pinellas County, FL HFA (Single Family Hsg.)2 | | | 5.250 | | | | 03/01/2038 | | | | 98,276 | |
| | 1,815,000 | | | Poinciana West, FL Community Devel. District Special Assessment2 | | | 6.000 | | | | 05/01/2037 | | | | 1,303,733 | |
| | 2,100,000 | | | Port St. Lucie, FL Special Assessment (Peacock & Lowry)2 | | | 5.350 | | | | 07/01/2027 | | | | 1,423,359 | |
| | 10,700,000 | | | Portico, FL Community Devel. District2 | | | 5.450 | | | | 05/01/2037 | | | | 5,940,961 | |
| | 1,500,000 | | | Portofino Cove, FL Community Devel. District Special Assessment3 | | | 5.500 | | | | 05/01/2038 | | | | 819,165 | |
F16 | OPPENHEIMER ROCHESTER NATIONAL MUNICIPALS
| | | | | | | | | | | | | | | | | |
| Principal | | | | | | | | | | | | |
| Amount | | | | | Coupon | | | Maturity | | | Value | |
| |
| Florida Continued |
| $ | 2,815,000 | | | Portofino Isles, FL Community Devel. District (Portofino Court) | | | 5.600 | % | | | 05/01/2036 | | | $ | 1,485,335 | |
| | 1,000,000 | | | Portofino Landings, FL Community Devel. District Special Assessment3 | | | 5.200 | | | | 05/01/2017 | | | | 734,420 | |
| | 2,000,000 | | | Portofino Landings, FL Community Devel. District Special Assessment3 | | | 5.400 | | | | 05/01/2038 | | | | 1,100,660 | |
| | 900,000 | | | Portofino Springs, FL Community Devel. District Special Assessment3 | | | 5.500 | | | | 05/01/2038 | | | | 414,945 | |
| | 2,470,000 | | | Portofino Vista, FL Community Devel. District2 | | | 5.000 | | | | 05/01/2013 | | | | 1,695,581 | |
| | 3,615,000 | | | Quarry, FL Community Devel. District2 | | | 5.250 | | | | 05/01/2036 | | | | 1,961,716 | |
| | 8,980,000 | | | Quarry, FL Community Devel. District2 | | | 5.500 | | | | 05/01/2036 | | | | 5,076,125 | |
| | 485,000 | | | Renaissance Commons, FL Community Devel. District, Series A2 | | | 5.600 | | | | 05/01/2036 | | | | 297,887 | |
| | 6,795,000 | | | Renaissance, FL Community Devel. District2 | | | 7.000 | | | | 05/01/2033 | | | | 6,195,885 | |
| | 6,400,000 | | | Reunion East, FL Community Devel. District2 | | | 5.800 | | | | 05/01/2036 | | | | 3,321,024 | |
| | 10,000,000 | | | Reunion East, FL Community Devel. District, Series A2 | | | 7.375 | | | | 05/01/2033 | | | | 6,540,700 | |
| | 22,335,000 | | | Reunion West, FL Community Devel. District | | | 6.250 | | | | 05/01/2036 | | | | 9,792,111 | |
| | 4,545,000 | | | Ridgewood Trails, FL Community Devel. District2 | | | 5.650 | | | | 05/01/2038 | | | | 2,406,441 | |
| | 9,375,000 | | | River Bend, FL Community Devel. District | | | 5.450 | | | | 05/01/2035 | | | | 4,903,781 | |
| | 6,415,000 | | | River Bend, FL Community Devel. District3 | | | 7.125 | | | | 11/01/2015 | | | | 4,522,639 | |
| | 7,890,000 | | | River Glen, FL Community Devel. District Special Assessment3 | | | 5.450 | | | | 05/01/2038 | | | | 3,448,088 | |
| | 3,495,000 | | | Riverwood Estates, FL Community Devel. District Special Assessment3,4 | | | 5.350 | | | | 05/01/2037 | | | | 1,220,454 | |
| | 2,485,000 | | | Rolling Hills, FL Community Devel. District2 | | | 5.125 | | | | 11/01/2013 | | | | 1,767,307 | |
| | 1,290,000 | | | Rolling Hills, FL Community Devel. District2 | | | 5.450 | | | | 05/01/2037 | | | | 808,288 | |
| | 200,000 | | | Santa Rosa Bay, FL Bridge Authority | | | 6.250 | | | | 07/01/2028 | | | | 116,612 | |
| | 23,200,000 | | | Sarasota, FL National Community Devel. District Special Assessment2 | | | 5.300 | | | | 05/01/2039 | | | | 12,345,648 | |
| | 4,475,000 | | | Seminole County, FL IDA (Progressive Health)2 | | | 7.500 | | | | 03/01/2035 | | | | 3,770,322 | |
| | 6,850,000 | | | Shingle Creek, FL Community Devel. District | | | 6.100 | | | | 05/01/2025 | | | | 3,880,662 | |
| | 25,060,000 | | | Shingle Creek, FL Community Devel. District | | | 6.125 | | | | 05/01/2037 | | | | 12,267,622 | |
| | 930,000 | | | Six Mile Creek, FL Community Devel. District2 | | | 5.500 | | | | 05/01/2017 | | | | 506,153 | |
| | 8,625,000 | | | Six Mile Creek, FL Community Devel. District2 | | | 5.875 | | | | 05/01/2038 | | | | 3,736,264 | |
| | 6,900,000 | | | South Bay, FL Community Devel. District3 | | | 5.125 | | | | 11/01/2009 | | | | 2,402,580 | |
| | 12,035,000 | | | South Bay, FL Community Devel. District3 | | | 5.375 | | | | 05/01/2013 | | | | 4,190,587 | |
| | 16,775,000 | | | South Bay, FL Community Devel. District3 | | | 5.950 | | | | 05/01/2036 | | | | 5,841,055 | |
| | 11,400,000 | | | South Fork East, FL Community Devel. District2 | | | 5.350 | | | | 05/01/2036 | | | | 6,598,092 | |
| | 3,595,000 | | | South Fork East, FL Community Devel. District3 | | | 6.500 | | | | 05/01/2038 | | | | 2,255,503 | |
| | 6,415,000 | | | South Fork East, FL Community Devel. District3 | | | 7.000 | | | | 11/01/2015 | | | | 4,216,002 | |
| | 100,000 | | | South Lake County, FL Hospital District (Orlando Regional Healthcare System)2 | | | 6.000 | | | | 10/01/2022 | | | | 100,191 | |
F17 | OPPENHEIMER ROCHESTER NATIONAL MUNICIPALS
STATEMENT OF INVESTMENTS Continued
| | | | | | | | | | | | | | | | | |
| Principal | | | | | | | | | | | | |
| Amount | | | | | Coupon | | | Maturity | | | Value | |
| |
| Florida Continued |
| $ | 4,405,000 | | | St. John’s Forest, FL Community Devel. District, Series A2 | | | 6.125 | % | | | 05/01/2034 | | | $ | 3,128,255 | |
| | 3,100,000 | | | St. Johns County, FL IDA (Glenmoor Health Care)2 | | | 5.375 | | | | 01/01/2040 | | | | 1,989,456 | |
| | 565,000 | | | St. Johns County, FL IDA (St. John’s County Welfare Federation)2 | | | 5.200 | | | | 10/01/2027 | | | | 399,890 | |
| | 1,000,000 | | | St. Johns County, FL IDA (St. John’s County Welfare Federation)2 | | | 5.250 | | | | 10/01/2041 | | | | 628,950 | |
| | 1,940,000 | | | Stonebrier, FL Community Devel. District2 | | | 5.500 | | | | 05/01/2037 | | | | 1,090,726 | |
| | 4,665,000 | | | Stoneybrook, FL South Community Devel. District2 | | | 5.800 | | | | 05/01/2039 | | | | 2,416,470 | |
| | 2,500,000 | | | Summerville, FL Community Devel. District3 | | | 5.500 | | | | 05/01/2036 | | | | 1,313,950 | |
| | 5,315,000 | | | Sumter County, FL IDA (North Sumter Utility Company)2 | | | 6.800 | | | | 10/01/2032 | | | | 4,564,788 | |
| | 5,900,000 | | | Sweetwater Creek, FL Community Devel. District2 | | | 5.500 | | | | 05/01/2038 | | | | 3,162,282 | |
| | 14,000,000 | | | Tampa Bay, FL Regional Water Supply Authority1 | | | 5.000 | | | | 10/01/2034 | | | | 14,075,810 | |
| | 9,460,000 | | | Tern Bay, FL Community Devel. District3 | | | 5.000 | | | | 05/01/2015 | | | | 3,304,378 | |
| | 19,075,000 | | | Tern Bay, FL Community Devel. District3 | | | 5.375 | | | | 05/01/2037 | | | | 6,662,898 | |
| | 33,650,000 | | | Tolomato, FL Community Devel. District Special Assessment2 | | | 6.650 | | | | 05/01/2040 | | | | 23,104,427 | |
| | 2,880,000 | | | Town Center, FL at Palm Coast Community Devel. District2 | | | 6.000 | | | | 05/01/2036 | | | | 1,715,933 | |
| | 5,000,000 | | | Treeline, FL Preservation Community Devel. District2 | | | 6.800 | | | | 05/01/2039 | | | | 3,269,250 | |
| | 735,000 | | | Turnbull Creek, FL Community Devel. District Special Assessment3 | | | 5.250 | | | | 05/01/2037 | | | | 396,114 | |
| | 1,390,000 | | | Two Creeks, FL Community Devel. District3 | | | 5.250 | | | | 05/01/2037 | | | | 670,411 | |
| | 10,590,000 | | | Verandah East, FL Community Devel. District2 | | | 5.400 | | | | 05/01/2037 | | | | 6,088,509 | |
| | 7,805,000 | | | Verano Center, FL Community Devel. District2 | | | 5.375 | | | | 05/01/2037 | | | | 3,645,872 | |
| | 2,500,000 | | | Villa Portofino East, FL Community Devel. District2 | | | 5.200 | | | | 05/01/2037 | | | | 1,575,100 | |
| | 1,720,000 | | | Villa Portofino West, FL Community Devel. District2 | | | 5.350 | | | | 05/01/2036 | | | | 1,162,359 | |
| | 1,265,000 | | | Villa Vizcaya, FL Community Devel. District Special Assessment2 | | | 5.550 | | | | 05/01/2039 | | | | 703,403 | |
| | 1,975,000 | | | Villages of Westport, FL Community Devel. District2 | | | 5.700 | | | | 05/01/2035 | | | | 1,144,868 | |
| | 2,775,000 | | | Villagewalk of Bonita Springs, FL Community Devel. District2 | | | 5.150 | | | | 05/01/2038 | | | | 1,463,618 | |
| | 1,395,000 | | | Waterford Estates, FL Community Devel. District Special Assessment3 | | | 5.125 | | | | 05/01/2013 | | | | 634,111 | |
| | 3,350,000 | | | Waterford Estates, FL Community Devel. District Special Assessment3 | | | 5.500 | | | | 05/01/2037 | | | | 1,482,040 | |
| | 3,735,000 | | | Watergrass, FL Community Devel. District Special Assessment2 | | | 5.125 | | | | 11/01/2014 | | | | 1,968,121 | |
| | 2,370,000 | | | Watergrass, FL Community Devel. District Special Assessment2 | | | 5.375 | | | | 05/01/2039 | | | | 1,137,482 | |
| | 3,190,000 | | | Waterlefe, FL Community Devel. District Golf Course7 | | | 8.125 | | | | 10/01/2025 | | | | 63,800 | |
| | 6,710,000 | | | Waters Edge, FL Community Devel. District2 | | | 5.350 | | | | 05/01/2039 | | | | 3,338,762 | |
| | 3,025,000 | | | Waters Edge, FL Community Devel. District2 | | | 5.400 | | | | 05/01/2039 | | | | 1,505,180 | |
F18 | OPPENHEIMER ROCHESTER NATIONAL MUNICIPALS
| | | | | | | | | | | | | | | | | |
| Principal | | | | | | | | | | | | |
| Amount | | | | | Coupon | | | Maturity | | | Value | |
| |
| Florida Continued |
| $ | 5,800,000 | | | Waterstone, FL Community Devel. District3 | | | 5.500 | % | | | 05/01/2018 | | | $ | 2,939,556 | |
| | 6,250,000 | | | Wentworth Estates, FL Community Devel. District2 | | | 5.125 | | | | 11/01/2012 | | | | 3,250,688 | |
| | 27,815,000 | | | Wentworth Estates, FL Community Devel. District2 | | | 5.625 | | | | 05/01/2037 | | | | 13,544,514 | |
| | 3,100,000 | | | West Villages, FL Improvement District2 | | | 5.350 | | | | 05/01/2015 | | | | 2,386,752 | |
| | 10,175,000 | | | West Villages, FL Improvement District3 | | | 5.500 | | | | 05/01/2037 | | | | 4,800,260 | |
| | 21,125,000 | | | West Villages, FL Improvement District2 | | | 5.500 | | | | 05/01/2038 | | | | 10,441,665 | |
| | 18,550,000 | | | West Villages, FL Improvement District2 | | | 5.800 | | | | 05/01/2036 | | | | 9,721,128 | |
| | 14,925,000 | | | Westridge, FL Community Devel. District | | | 5.800 | | | | 05/01/2037 | | | | 5,970,000 | |
| | 11,210,000 | | | Westside, FL Community Devel. District | | | 5.650 | | | | 05/01/2037 | | | | 5,795,794 | |
| | 17,340,000 | | | Westside, FL Community Devel. District | | | 7.200 | | | | 05/01/2038 | | | | 11,176,324 | |
| | 2,085,000 | | | World Commerce, FL Community Devel. District Special Assessment3 | | | 5.500 | | | | 05/01/2038 | | | | 816,799 | |
| | 1,000,000 | | | World Commerce, FL Community Devel. District Special Assessment3 | | | 6.500 | | | | 05/01/2036 | | | | 401,830 | |
| | 7,420,000 | | | Wyld Palms, FL Community Devel. District | | | 5.400 | | | | 05/01/2015 | | | | 3,078,558 | |
| | 4,340,000 | | | Wyld Palms, FL Community Devel. District | | | 5.500 | | | | 05/01/2038 | | | | 1,745,548 | |
| | 2,040,000 | | | Zephyr Ridge, FL Community Devel. District3 | | | 5.250 | | | | 05/01/2013 | | | | 917,592 | |
| | 2,665,000 | | | Zephyr Ridge, FL Community Devel. District3 | | | 5.625 | | | | 05/01/2037 | | | | 1,205,513 | |
| | | | | | | | | | | | | | | | |
| | | | | | | | | | | | | | | | 1,005,585,583 | |
| | | | | | | | | | | | | | | | | |
| Georgia—0.7% |
| | 60,000 | | | Acworth, GA Hsg. Authority (Wingate Falls Apartments)2 | | | 6.200 | | | | 03/01/2027 | | | | 60,035 | |
| | 25,000 | | | Acworth, GA Hsg. Authority (Wingate Falls Apartments)2 | | | 6.200 | | | | 03/01/2029 | | | | 25,011 | |
| | 50,000 | | | Americus-Sumter County, GA Hospital Authority (South Georgia Methodist Home for the Aging)2 | | | 6.250 | | | | 05/15/2016 | | | | 45,295 | |
| | 3,000,000 | | | Atlanta, GA Devel. Authority Student Hsg. (Clark Atlanta University)2 | | | 6.250 | | | | 07/01/2036 | | | | 1,790,850 | |
| | 140,000 | | | Atlanta, GA Urban Residential Finance Authority (Spring Branch Apartments) | | | 8.500 | | | | 04/01/2026 | | | | 63,494 | |
| | 200,000 | | | Brunswick and Glynn County, GA Devel. Authority (Georgia-Pacific Corp.)2 | | | 5.550 | | | | 03/01/2026 | | | | 144,820 | |
| | 295,000 | | | Charlton County, GA Solid Waste Management Authority (Chesser Island Road Landfill)2 | | | 7.375 | | | | 04/01/2018 | | | | 258,556 | |
| | 35,000 | | | Cherokee County, GA Hospital Authority (RT Jones Memorial Hospital)2 | | | 7.300 | | | | 12/01/2013 | | | | 38,742 | |
| | 50,000 | | | Crisp County, GA Devel. Authority (International Paper Company)2 | | | 6.200 | | | | 02/01/2020 | | | | 46,761 | |
| | 1,680,000 | | | Effingham County, GA Devel. Authority (Fort James Corp.)2 | | | 5.625 | | | | 07/01/2018 | | | | 1,368,007 | |
| | 125,000 | | | Fulton County, GA Airport (Delta Airlines)3,4,7 | | | 5.300 | | | | 05/01/2013 | | | | 1 | |
F19 | OPPENHEIMER ROCHESTER NATIONAL MUNICIPALS
STATEMENT OF INVESTMENTS Continued
| | | | | | | | | | | | | | | | | |
| Principal | | | | | | | | | | | | |
| Amount | | | | | Coupon | | | Maturity | | | Value | |
| |
| Georgia Continued |
| $ | 250,000 | | | Fulton County, GA Airport (Delta Airlines)3,4,7 | | | 5.450 | % | | | 05/01/2023 | | | $ | 3 | |
| | 25,000 | | | Fulton County, GA Airport (Delta Airlines)3,4,7 | | | 5.500 | | | | 05/01/2033 | | | | — | |
| | 80,000 | | | Fulton County, GA Airport (Delta Airlines)3,4,7 | | | 6.950 | | | | 11/01/2012 | | | | 1 | |
| | 895,000 | | | Fulton County, GA Devel. Authority (Catholic Health East)2 | | | 5.250 | | | | 11/15/2020 | | | | 892,664 | |
| | 915,000 | | | Fulton County, GA Devel. Authority (Catholic Health East)2 | | | 5.500 | | | | 11/15/2021 | | | | 916,976 | |
| | 4,000,000 | | | Fulton County, GA Residential Care Facilities (Lenbrook Square Foundation)2 | | | 5.000 | | | | 07/01/2027 | | | | 2,872,120 | |
| | 1,000,000 | | | Fulton County, GA Residential Care Facilities (Lenbrook Square Foundation)2 | | | 5.125 | | | | 07/01/2042 | | | | 612,630 | |
| | 15,000 | | | GA Hsg. and Finance Authority (Single Family Mtg.)2 | | | 5.400 | | | | 12/01/2031 | | | | 15,008 | |
| | 24,150,000 | | | Irwin County, GA COP | | | 8.000 | | | | 08/01/2037 | | | | 20,792,426 | |
| | 2,000,000 | | | Marietta, GA Devel. Authority (University Facilities)2 | | | 7.000 | | | | 06/15/2039 | | | | 1,636,920 | |
| | 100,000 | | | McDuffie County, GA County Devel. Authority (Temple-Inland)2 | | | 6.950 | | | | 12/01/2023 | | | | 87,766 | |
| | 10,000 | | | Peach County, GA Devel. Authority Healthcare Facility2 | | | 8.500 | | | | 03/01/2034 | | | | 8,886 | |
| | 430,000 | | | Savannah, GA EDA (Skidway Health & Living Services)2 | | | 6.850 | | | | 01/01/2019 | | | | 413,987 | |
| | 1,055,000 | | | Savannah, GA EDA (Skidway Health & Living Services)2 | | | 7.400 | | | | 01/01/2024 | | | | 1,018,307 | |
| | 2,985,000 | | | Savannah, GA EDA (Skidway Health & Living Services)2 | | | 7.400 | | | | 01/01/2034 | | | | 2,783,274 | |
| | | | | | | | | | | | | | | | |
| | | | | | | | | | | | | | | | 35,892,540 | |
| | | | | | | | | | | | | | | | | |
| Hawaii—0.1% |
| | 400,000 | | | HI Dept. of Transportation (Continental Airlines)2 | | | 5.625 | | | | 11/15/2027 | | | | 254,072 | |
| | 7,415,000 | | | HI Dept. of Transportation (Continental Airlines)2 | | | 7.000 | | | | 06/01/2020 | | | | 5,999,847 | |
| | | | | | | | | | | | | | | | |
| | | | | | | | | | | | | | | | 6,253,919 | |
| | | | | | | | | | | | | | | | | |
| Idaho—0.0% |
| | 5,000 | | | ID Hsg. & Finance Assoc. (Single Family Mtg.)2 | | | 5.350 | | | | 01/01/2025 | | | | 4,998 | |
| | 45,000 | | | ID Hsg. Agency (Single Family Mtg.)2 | | | 6.200 | | | | 07/01/2025 | | | | 46,067 | |
| | 25,000 | | | Power County, ID Industrial Devel. Corp. (FMC Corp.)2 | | | 6.450 | | | | 08/01/2032 | | | | 23,227 | |
| | | | | | | | | | | | | | | | |
| | | | | | | | | | | | | | | | 74,292 | |
| | | | | | | | | | | | | | | | | |
| Illinois—6.8% |
| | 1,700,000 | | | Annawan, IL Tax Increment (Patriot Renewable Fuels)2 | | | 5.625 | | | | 01/01/2018 | | | | 1,195,933 | |
| | 34,581,350 | | | Aurora, IL Single Family Mtg.1 | | | 5.500 | | | | 12/01/2039 | | | | 33,789,292 | |
| | 45,631,641 | | | Aurora, IL Single Family Mtg.1 | | | 6.300 | | | | 12/01/2045 | | | | 46,812,506 | |
| | 1,750,000 | | | Belleville, IL Tax Increment (Frank Scott Parkway Redevel.)2 | | | 5.700 | | | | 05/01/2036 | | | | 994,175 | |
| | 4,145,000 | | | Bolingbrook, IL Will and Du Page Counties Wastewater Facilities (Crossroads Treatment)2 | | | 6.600 | | | | 01/01/2035 | | | | 2,887,366 | |
| | 30,775,000 | | | Caseyville, IL Tax (Forest Lakes) | | | 7.000 | | | | 12/30/2022 | | | | 18,662,883 | |
F20 | OPPENHEIMER ROCHESTER NATIONAL MUNICIPALS
| | | | | | | | | | | | | | | | | |
| Principal | | | | | | | | | | | | |
| Amount | | | | | Coupon | | | Maturity | | | Value | |
| |
| Illinois Continued |
| $ | 8,000,000 | | | Centerpoint, IL Intermodal Center Program2 | | | 10.000 | %6 | | | 06/15/2023 | | | $ | 4,178,320 | |
| | 20,000 | | | Chicago, IL (Single Family Mtg.)2 | | | 6.350 | | | | 10/01/2030 | | | | 20,753 | |
| | 35,000 | | | Chicago, IL Midway Airport, Series B2 | | | 5.625 | | | | 01/01/2029 | | | | 33,973 | |
| | 35,000 | | | Chicago, IL Multifamily Hsg. (Cottage View Terrace)2 | | | 6.125 | | | | 02/20/2042 | | | | 35,777 | |
| | 16,845,000 | | | Chicago, IL O’Hare International Airport (Delta Airlines)2 | | | 6.450 | | | | 05/01/2018 | | | | 11,948,664 | |
| | 5,300,000 | | | Cortland, IL Special Tax (Sheaffer System)2 | | | 5.500 | | | | 03/01/2017 | | | | 3,268,934 | |
| | 1,500,000 | | | Deerfield, IL Educational Facilities (Chicagoland Jewish High School)2 | | | 6.000 | | | | 05/01/2041 | | | | 749,820 | |
| | 1,000,000 | | | Du Page County, IL Special Service Area No. 31 Special Tax (Monarch Landing)2 | | | 5.625 | | | | 03/01/2036 | | | | 614,630 | |
| | 3,750,000 | | | Gilberts, IL Special Service Area No. 19 Special Tax (Conservancy)2 | | | 5.375 | | | | 03/01/2016 | | | | 2,076,750 | |
| | 1,375,000 | | | Godfrey, IL (United Methodist Village)2 | | | 5.875 | | | | 11/15/2029 | | | | 777,618 | |
| | 1,725,000 | | | Hampshire, IL Special Service Area No. 16 (Crown Devel.-Prairie Ridge)2 | | | 5.625 | | | | 03/01/2022 | | | | 1,054,993 | |
| | 3,135,000 | | | Hampshire, IL Special Service Area No. 16 (Crown Devel.-Prairie Ridge)2 | | | 6.000 | | | | 03/01/2046 | | | | 1,598,913 | |
| | 1,160,000 | | | Hampshire, IL Special Service Area No. 17 (Crown Devel.-Oakstead)2 | | | 5.625 | | | | 03/01/2022 | | | | 709,444 | |
| | 7,450,000 | | | Hampshire, IL Special Service Area No. 17 (Crown Devel.-Oakstead)2 | | | 6.000 | | | | 03/01/2045 | | | | 3,755,247 | |
| | 1,215,000 | | | Hampshire, IL Special Service Area No. 18 (Crown Devel.-Tamms Farm)2 | | | 6.000 | | | | 03/01/2044 | | | | 613,599 | |
| | 4,270,000 | | | Hampshire, IL Special Service Area No. 19 (Crown Devel.-Prairie Ridge East)2 | | | 6.000 | | | | 03/01/2046 | | | | 2,148,664 | |
| | 22,478 | | | IL Devel. Finance Authority (Community Rehabilitation Providers)2 | | | 8.250 | | | | 08/01/2012 | | | | 18,020 | |
| | 115,000 | | | IL Devel. Finance Authority Solid Waste (WSREC)2 | | | 8.250 | | | | 04/01/2023 | | | | 115,163 | |
| | 11,600,000 | | | IL Educational Facilities Authority (Plum Creek Rolling Meadows)2 | | | 6.500 | | | | 12/01/2037 | | | | 8,572,980 | |
| | 3,195,000 | | | IL Finance Authority (Bethel Terrace Apartments)2 | | | 5.375 | | | | 09/01/2035 | | | | 2,179,949 | |
| | 1,200,000 | | | IL Finance Authority (Central Baptist Village)2 | | | 5.375 | | | | 11/15/2039 | | | | 766,056 | |
| | 4,000,000 | | | IL Finance Authority (Clare Oaks)2 | | | 6.000 | | | | 11/15/2039 | | | | 2,745,120 | |
| | 1,000,000 | | | IL Finance Authority (DeKalb Supportive Living)2 | | | 6.100 | | | | 12/01/2041 | | | | 690,620 | |
| | 2,250,000 | | | IL Finance Authority (Franciscan Communities)2 | | | 5.500 | | | | 05/15/2027 | | | | 1,579,703 | |
| | 2,750,000 | | | IL Finance Authority (Franciscan Communities)2 | | | 5.500 | | | | 05/15/2037 | | | | 1,714,873 | |
| | 2,000,000 | | | IL Finance Authority (Friendship Village Schaumburg)2 | | | 5.375 | | | | 02/15/2025 | | | | 1,492,160 | |
| | 2,000,000 | | | IL Finance Authority (Friendship Village Schaumburg)2 | | | 5.625 | | | | 02/15/2037 | | | | 1,344,920 | |
| | 30,000,000 | | | IL Finance Authority (Illinois River Energy)2 | | | 8.500 | | | | 07/01/2019 | | | | 21,943,200 | |
| | 850,000 | | | IL Finance Authority (Luther Oaks)2 | | | 6.000 | | | | 08/15/2026 | | | | 636,710 | |
| | 1,500,000 | | | IL Finance Authority (Luther Oaks)2 | | | 6.000 | | | | 08/15/2039 | | | | 1,030,365 | |
F21 | OPPENHEIMER ROCHESTER NATIONAL MUNICIPALS
STATEMENT OF INVESTMENTS Continued
| | | | | | | | | | | | | | | | | |
| Principal | | | | | | | | | | | | |
| Amount | | | | | Coupon | | | Maturity | | | Value | |
| |
| Illinois Continued |
| $ | 3,265,000 | | | IL Finance Authority (Lutheran Social Services of Illinois/Vesper Management Corp. Obligated Group)2 | | | 5.000 | % | | | 08/15/2024 | | | $ | 2,341,070 | |
| | 3,640,000 | | | IL Finance Authority (Lutheran Social Services of Illinois/Vesper Management Corp. Obligated Group)2 | | | 5.125 | | | | 08/15/2028 | | | | 2,469,412 | |
| | 2,500,000 | | | IL Finance Authority (Monarch Landing)2 | | | 7.000 | | | | 12/01/2027 | | | | 1,568,625 | |
| | 12,250,000 | | | IL Finance Authority (Monarch Landing)2 | | | 7.000 | | | | 12/01/2037 | | | | 6,976,253 | |
| | 30,000,000 | | | IL Finance Authority (Monarch Landing)2 | | | 7.000 | | | | 12/01/2042 | | | | 16,623,000 | |
| | 1,250,000 | | | IL Finance Authority (Montgomery Place)2 | | | 5.500 | | | | 05/15/2026 | | | | 911,050 | |
| | 2,050,000 | | | IL Finance Authority (Montgomery Place)2 | | | 5.750 | | | | 05/15/2038 | | | | 1,413,660 | |
| | 21,000,000 | | | IL Finance Authority (Provena Health)2 | | | 7.750 | | | | 08/15/2034 | | | | 21,158,760 | |
| | 2,000,000 | | | IL Finance Authority (Sedgebrook)2 | | | 6.000 | | | | 11/15/2027 | | | | 1,128,180 | |
| | 9,000,000 | | | IL Finance Authority (Sedgebrook)2 | | | 6.000 | | | | 11/15/2037 | | | | 4,509,270 | |
| | 8,500,000 | | | IL Finance Authority (Sedgebrook)2 | | | 6.000 | | | | 11/15/2042 | | | | 4,123,605 | |
| | 750,000 | | | IL Finance Authority (Three Crowns Park Plaza)2 | | | 5.875 | | | | 02/15/2038 | | | | 549,510 | |
| | 8,700,000 | | | IL Health Facilities Authority3 | | | 6.900 | | | | 11/15/2033 | | | | 3,833,220 | |
| | 100,000 | | | IL Health Facilities Authority (Delnor Community Resource Living)2 | | | 6.000 | | | | 11/15/2017 | | | | 87,074 | |
| | 1,170,000 | | | IL Hsg. Devel. Authority (Riverwoods Apartments)2 | | | 5.550 | | | | 01/01/2048 | | | | 1,125,634 | |
| | 7,140,000 | | | Lake County, IL Special Service Area No. 82 | | | 7.125 | | | | 03/01/2037 | | | | 4,968,797 | |
| | 13,635,000 | | | Lombard, IL Public Facilities Corp. (Conference Center & Hotel)2 | | | 7.125 | | | | 01/01/2036 | | | | 11,030,306 | |
| | 3,760,000 | | | Manhattan, IL Special Service Area Special Tax (Groebe Farm-Stonegate)2 | | | 5.750 | | | | 03/01/2022 | | | | 2,345,112 | |
| | 4,000,000 | | | Manhattan, IL Special Service Area Special Tax (Groebe Farm-Stonegate)2 | | | 6.125 | | | | 03/01/2040 | | | | 1,930,080 | |
| | 1,810,000 | | | Manhattan, IL Special Service Area Special Tax (Lakeside Towns Liberty)2 | | | 5.750 | | | | 03/01/2022 | | | | 1,128,897 | |
| | 380,000 | | | Peoria, IL Hsg. (Peoria Oak Woods Apartments)2 | | | 7.750 | | | | 10/15/2033 | | | | 318,250 | |
| | 3,500,000 | | | Plano, IL Special Service Area No. 52 | | | 6.000 | | | | 03/01/2036 | | | | 2,198,735 | |
| | 3,750,000 | | | Quad Cities, IL Regional EDA (Heritage Woods Moline)2 | | | 6.000 | | | | 12/01/2041 | | | | 2,482,500 | |
| | 6,195,000 | | | Quad Cities, IL Regional EDA (Pheasant Ridge Apartments)2 | | | 6.375 | | | | 08/01/2040 | | | | 3,966,411 | |
| | 47,033 | | | Robbins, IL Res Rec (Robbins Res Rec Partners) | | | 5.873 | 5 | | | 10/15/2009 | | | | 46,050 | |
| | 347 | | | Robbins, IL Res Rec (Robbins Res Rec Partners)2 | | | 7.250 | | | | 10/15/2009 | | | | 345 | |
| | 162 | | | Robbins, IL Res Rec (Robbins Res Rec Partners)2 | | | 7.250 | | | | 10/15/2024 | | | | 140 | |
| | 10,000 | | | Rockford, IL Mtg. (Faust Landmark Partnership)2 | | | 6.200 | | | | 01/01/2028 | | | | 10,067 | |
| | 2,500,000 | | | Southwestern IL Devel. Authority (Comprehensive Mental Health Center)2 | | | 6.625 | | | | 06/01/2037 | | | | 1,894,775 | |
| | 1,500,000 | | | Southwestern IL Devel. Authority (Eden Retirement Center)2 | | | 5.850 | | | | 12/01/2036 | | | | 1,066,365 | |
| | 16,865,000 | | | Southwestern IL Devel. Authority (Local Government Programming)2 | | | 7.000 | | | | 10/01/2022 | | | | 14,808,145 | |
F22 | OPPENHEIMER ROCHESTER NATIONAL MUNICIPALS
| | | | | | | | | | | | | | | | | |
| Principal | | | | | | | | | | | | |
| Amount | | | | | Coupon | | | Maturity | | | Value | |
| |
| Illinois Continued |
| $ | 3,650,000 | | | Southwestern IL Devel. Authority (Village of Sauget)2 | | | 5.625 | % | | | 11/01/2026 | | | $ | 2,369,361 | |
| | 15,230,000 | | | Southwestern IL Devel. Authority Solid Waste Disposal (Center Ethanol Company)2 | | | 8.250 | | | | 12/01/2019 | | | | 9,851,069 | |
| | 8,450,000 | | | Upper, IL River Valley Devel. Authority (Living Springs McHenry)2 | | | 6.100 | | | | 12/01/2041 | | | | 5,867,849 | |
| | 3,025,000 | | | Vernon Hills, IL Tax Increment (Town Center)2 | | | 6.250 | | | | 12/30/2026 | | | | 2,374,050 | |
| | 3,180,000 | | | Volo Village, IL Special Service Area (Lancaster Falls)2 | | | 5.750 | | | | 03/01/2036 | | | | 1,852,954 | |
| | 5,559,000 | | | Volo Village, IL Special Service Area (Remington Pointe)2 | | | 6.450 | | | | 03/01/2034 | | | | 3,626,803 | |
| | 5,170,000 | | | Yorkville, IL United City Special Services Area Special Tax (Bristol Bay)2 | | | 5.875 | | | | 03/01/2036 | | | | 3,699,911 | |
| | | | | | | | | | | | | | | | |
| | | | | | | | | | | | | | | | 329,413,388 | |
| | | | | | | | | | | | | | | | | |
| Indiana—1.7% |
| | 8,080,000 | | | Anderson, IN Multifamily Hsg. (Cross Lakes Apartments)2 | | | 6.500 | 10 | | | 07/01/2033 | | | | 5,218,872 | |
| | 20,210,000 | | | Bluffton, IN Solid Waste Disposal Facility (Bluffton Subordinate Industrial Bio-Energy)2 | | | 7.500 | | | | 09/01/2019 | | | | 13,583,545 | |
| | 1,475,000 | | | East Chicago, IN Solid Waste Disposal (USG Corp.)2 | | | 5.500 | | | | 09/01/2028 | | | | 912,037 | |
| | 5,805,000 | | | East Chicago, IN Solid Waste Disposal (USG Corp.)2 | | | 6.375 | | | | 08/01/2029 | | | | 3,990,241 | |
| | 25,000 | | | Fort Wayne, IN Pollution Control (General Motors Corp.)3 | | | 6.200 | | | | 10/15/2025 | | | | 2,500 | |
| | 20,000 | | | IN Bond Bank (Southwestern Bartholomew Water Corp.)2 | | | 6.625 | | | | 06/01/2012 | | | | 20,010 | |
| | 925,000 | | | IN Finance Authority Educational Facilities (Irvington Community)2 | | | 9.000 | | | | 07/01/2039 | | | | 970,297 | |
| | 1,835,000 | | | IN Health Facility Financing Authority (Methodist Hospitals)2 | | | 5.500 | | | | 09/15/2031 | | | | 1,320,356 | |
| | 550,000 | | | IN Pollution Control (General Motors Corp.)3,7 | | | 5.625 | | | | 04/01/2011 | | | | 55,000 | |
| | 9,365,000 | | | Indianapolis, IN Multifamily Hsg. (Covered Bridge)2 | | | 6.000 | 10 | | | 04/01/2030 | | | | 6,131,734 | |
| | 75,000 | | | Jasper County, IN Economic Devel. (Georgia-Pacific Corp.)2 | | | 5.600 | | | | 04/01/2029 | | | | 53,109 | |
| | 215,000 | | | Jasper County, IN Economic Devel. (Georgia-Pacific Corp.)2 | | | 5.625 | | | | 12/01/2027 | | | | 154,374 | |
| | 560,000 | | | Jasper County, IN Economic Devel. (Georgia-Pacific Corp.)2 | | | 6.700 | | | | 04/01/2029 | | | | 453,639 | |
| | 30,000 | | | North Manchester, IN (Estelle Peabody Memorial Home)3 | | | 6.500 | | | | 07/01/2015 | | | | 18,687 | |
| | 17,505,000 | | | North Manchester, IN (Estelle Peabody Memorial Home)3 | | | 7.250 | | | | 07/01/2033 | | | | 10,903,865 | |
| | 60,000 | | | Petersburg, IN Pollution Control (Indianapolis Power & Light Company)2 | | | 6.375 | | | | 11/01/2029 | | | | 55,176 | |
| | 6,820,000 | | | Shelbyville, IN Redevel. District Tax Increment (Central Shelbyville Economic)2 | | | 6.500 | | | | 07/01/2022 | | | | 5,557,141 | |
F23 | OPPENHEIMER ROCHESTER NATIONAL MUNICIPALS
STATEMENT OF INVESTMENTS Continued
| | | | | | | | | | | | | | | | | |
| Principal | | | | | | | | | | | | |
| Amount | | | | | Coupon | | | Maturity | | | Value | |
| |
| Indiana Continued |
| $ | 230,000 | | | St. Joseph County, IN Economic Devel. (Holy Cross Village Notre Dame)2 | | | 5.550 | % | | | 05/15/2019 | | | $ | 190,571 | |
| | 4,875,000 | | | Vigo County, IN Hospital Authority (Union Hospital)2 | | | 5.800 | | | | 09/01/2047 | | | | 3,449,794 | |
| | 6,215,000 | | | Vincennes, IN Economic Devel. (Southwest Indiana Regional Youth Village)2 | | | 6.250 | | | | 01/01/2024 | | | | 4,659,448 | |
| | 25,000,000 | | | Wabash County, IN Economic Devel. (North Manchester Ethanol) | | | 9.250 | | | | 07/01/2020 | | | | 20,494,500 | |
| | 4,500,000 | | | Wabash County, IN Economic Devel. (North Manchester Ethanol) | | | 14.000 | | | | 07/01/2020 | | | | 3,644,550 | |
| | | | | | | | | | | | | | | | |
| | | | | | | | | | | | | | | | 81,839,446 | |
| | | | | | | | | | | | | | | | | |
| Iowa—2.2% |
| | 500,000 | | | Cedar Rapids, IA (Cottage Grove Place) | | | 5.875 | | | | 07/01/2028 | | | | 356,860 | |
| | 3,095,000 | | | Cedar Rapids, IA (Cottage Grove Place) | | | 6.000 | | | | 07/01/2014 | | | | 2,824,188 | |
| | 5,475,000 | | | Dickinson County, IA Hsg. (Spirit Lake) | | | 5.875 | | | | 12/01/2036 | | | | 3,641,368 | |
| | 440,000 | | | IA Finance Authority (Amity Fellowserve)2 | | | 5.900 | | | | 10/01/2016 | | | | 383,293 | |
| | 825,000 | | | IA Finance Authority (Amity Fellowserve)2 | | | 6.000 | | | | 10/01/2028 | | | | 585,956 | |
| | 940,000 | | | IA Finance Authority (Amity Fellowserve)2 | | | 6.375 | | | | 10/01/2026 | | | | 721,130 | |
| | 2,190,000 | | | IA Finance Authority (Amity Fellowserve)2 | | | 6.500 | | | | 10/01/2036 | | | | 1,618,848 | |
| | 1,160,000 | | | IA Finance Authority (Boys & Girls Home and Family Services)2 | | | 5.900 | | | | 12/01/2028 | | | | 791,712 | |
| | 900,000 | | | IA Finance Authority Retirement Community (Friendship Haven)2 | | | 6.125 | | | | 11/15/2032 | | | | 676,935 | |
| | 1,000,000 | | | IA Finance Authority Senior Hsg. (Bethany Manor)2 | | | 5.550 | | | | 11/01/2041 | | | | 642,160 | |
| | 1,300,000 | | | IA Finance Authority Senior Hsg. (Wedum Walnut Ridge)2 | | | 5.375 | | | | 06/01/2025 | | | | 827,190 | |
| | 36,910,000 | | | IA Tobacco Settlement Authority2 | | | 5.375 | | | | 06/01/2038 | | | | 22,075,871 | |
| | 45,000,000 | | | IA Tobacco Settlement Authority2 | | | 5.500 | | | | 06/01/2042 | | | | 26,917,200 | |
| | 190,800,000 | | | IA Tobacco Settlement Authority | | | 6.250 | 5 | | | 06/01/2046 | | | | 3,787,380 | |
| | 360,990,000 | | | IA Tobacco Settlement Authority | | | 7.125 | 5 | | | 06/01/2046 | | | | 5,057,470 | |
| | 60,000,000 | | | IA Tobacco Settlement Authority (TASC)2 | | | 5.625 | | | | 06/01/2046 | | | | 36,156,000 | |
| | | | | | | | | | | | | | | | |
| | | | | | | | | | | | | | | | 107,063,561 | |
| | | | | | | | | | | | | | | | | |
| Kansas—0.3% |
| | 70,000 | | | Goddard, KS Industrial Revenue (IFR Systems)2 | | | 6.250 | | | | 05/01/2012 | | | | 70,410 | |
| | 55,000 | | | KS Devel. Finance Authority (VS/VSCF/JGCCF Obligated Group)2 | | | 5.500 | | | | 11/15/2015 | | | | 49,955 | |
| | 1,270,000 | | | Lenexa, KS Multifamily Hsg. (Meadows Apartments)2 | | | 7.950 | | | | 10/15/2035 | | | | 900,100 | |
| | 4,500,000 | | | Olathe, KS Tax Increment (Gateway) | | | 5.000 | | | | 03/01/2026 | | | | 2,366,505 | |
| | 2,500,000 | | | Olathe, KS Transportation Devel. District (Gateway) | | | 5.000 | | | | 12/01/2028 | | | | 1,255,950 | |
| | 8,795,000 | | | Sedgwick & Shawnee Counties, KS Hsg. (Single Family Mtg.)1 | | | 5.500 | | | | 12/01/2038 | | | | 8,927,941 | |
F24 | OPPENHEIMER ROCHESTER NATIONAL MUNICIPALS
| | | | | | | | | | | | | | | | | |
| Principal | | | | | | | | | | | | |
| Amount | | | | | Coupon | | | Maturity | | | Value | |
| |
| Kansas Continued |
| $ | 135,000 | | | Sedgwick & Shawnee Counties, KS Hsg. (Single Family Mtg.)2 | | | 7.600 | % | | | 12/01/2031 | | | $ | 137,557 | |
| | 325,000 | | | Sedgwick & Shawnee Counties, KS Hsg. (Single Family Mtg.)2 | | | 7.600 | | | | 12/01/2031 | | | | 331,156 | |
| | 1,590,000 | | | Wichita, KS Hsg. (Innes Station Apartments)2 | | | 6.250 | | | | 03/01/2028 | | | | 1,177,522 | |
| | 2,475,000 | | | Wyandotte County/Kansas City, KS Unified Government Industrial Devel. (Crestwood Apartments)3 | | | 6.950 | | | | 06/01/2037 | | | | 992,277 | |
| | 1,400,000 | | | Wyandotte County/Kansas City, KS Unified Government Pollution Control (General Motors)3 | | | 6.000 | | | | 06/01/2025 | | | | 567,000 | |
| | | | | | | | | | | | | | | | |
| | | | | | | | | | | | | | | | 16,776,373 | |
| | | | | | | | | | | | | | | | | |
| Kentucky—0.3% |
| | 15,000 | | | Elizabethtown, KY Industrial Building (Elizabethtown Medical Rehabilitation)2 | | | 10.250 | | | | 12/01/2016 | | | | 15,044 | |
| | 150,000 | | | Kenton County, KY Airport (Delta Airlines)3,4,7 | | | 8.000 | | | | 12/01/2015 | | | | 2 | |
| | 28,805,000 | | | Kenton County, KY Airport (Delta Airlines)3,4,7 | | | 8.000 | | | | 12/01/2015 | | | | 288 | |
| | 31,750,000 | | | Kenton County, KY Airport (Delta Airlines)3,4,7 | | | 8.000 | | | | 12/01/2015 | | | | 318 | |
| | 27,170,000 | | | Kenton County, KY Airport (Delta Airlines)3,4,7 | | | 8.000 | | | | 12/01/2015 | | | | 272 | |
| | 45,560,000 | | | Kenton County, KY Airport (Delta Airlines)3,4,7 | | | 8.000 | | | | 12/01/2015 | | | | 456 | |
| | 2,520,000 | | | Kuttawa, KY (1st Mtg.-GF/Kentucky)2 | | | 6.750 | | | | 03/01/2029 | | | | 2,084,947 | |
| | 14,000,000 | | | KY EDFA (Baptist Healthcare System)1 | | | 5.375 | | | | 08/15/2024 | | | | 14,794,850 | |
| | 5,000 | | | KY EDFA (Norton)2 | | | 6.125 | | | | 10/01/2010 | | | | 5,045 | |
| | 2,900,000 | | | Morgantown, KY Solid Waste Disposal (Imco Recycling)3,7 | | | 6.000 | | | | 05/01/2023 | | | | 29,000 | |
| | 4,600,000 | | | Morgantown, KY Solid Waste Disposal (Imco Recycling)3,7 | | | 7.450 | | | | 05/01/2022 | | | | 46,000 | |
| | 5,740,000 | | | Morgantown, KY Solid Waste Disposal (Imco Recycling)3,7 | | | 7.650 | | | | 05/01/2016 | | | | 57,400 | |
| | | | | | | | | | | | | | | | |
| | | | | | | | | | | | | | | | 17,033,622 | |
| | | | | | | | | | | | | | | | | |
| Louisiana—1.5% |
| | 175,000 | | | Caddo Parish, LA Industrial Devel. Board (Pennzoil Products Company)2 | | | 5.600 | | | | 12/01/2028 | | | | 167,423 | |
| | 20,000 | | | De Soto Parish, LA Environmental Improvement (International Paper Company)2 | | | 5.600 | | | | 11/01/2022 | | | | 16,627 | |
| | 1,600,000 | | | Juban Park, LA Community Devel. District Special Assessment2 | | | 5.150 | | | | 10/01/2014 | | | | 1,335,968 | |
| | 3,710,000 | | | LA CDA (Eunice Student Hsg. Foundation) | | | 7.375 | | | | 09/01/2033 | | | | 2,431,497 | |
| | 40,000 | | | LA HFA (Single Family Mtg.)2 | | | 6.300 | | | | 06/01/2020 | | | | 40,763 | |
| | 1,020,000 | | | LA Local Government EF&CD Authority (Cypress Apartments)2 | | | 8.000 | | | | 04/20/2028 | | | | 826,016 | |
| | 465,000 | | | LA Local Government EF&CD Authority (Sharlo Apartments)2 | | | 8.000 | | | | 06/20/2028 | | | | 369,596 | |
F25 | OPPENHEIMER ROCHESTER NATIONAL MUNICIPALS
STATEMENT OF INVESTMENTS Continued
| | | | | | | | | | | | | | | | | |
| Principal | | | | | | | | | | | | |
| Amount | | | | | Coupon | | | Maturity | | | Value | |
| |
| Louisiana Continued | | | | | | | | | | | | |
| $ | 5,350,000 | | | LA Public Facilities Authority (Progressive Healthcare)2 | | | 6.375 | % | | | 10/01/2028 | | | $ | 3,963,441 | |
| | 70,080,000 | | | LA Tobacco Settlement Financing Corp. (TASC)2 | | | 5.875 | | | | 05/15/2039 | | | | 56,239,901 | |
| | 7,400,000 | | | Lakeshore Villages, LA Master Community Devel. District2 | | | 5.250 | | | | 07/01/2017 | | | | 5,793,386 | |
| | 60,000 | | | New Orleans, LA Sewage Service2 | | | 5.400 | | | | 06/01/2017 | | | | 53,464 | |
| | 30,000 | | | Tensas Parish, LA Law Enforcement District COP7 | | | 8.000 | | | | 10/01/2010 | | | | 29,305 | |
| | 10,000 | | | West Feliciana Parish, LA Pollution Control (Entergy Gulf States)2 | | | 6.600 | | | | 09/01/2028 | | | | 10,002 | |
| | | | | | | | | | | | | | | | |
| | | | | | | | | | | | | | | | 71,277,389 | |
| | | | | | | | | | | | | | | | | |
| Maine—0.3% | | | | | | | | | | | | |
| | 56,390,000 | | | ME Finance Authority Solid Waste Recycling Facilities (Great Northern Paper)3,7 | | | 7.750 | | | | 10/01/2022 | | | | 5,639,000 | |
| | 20,000 | | | North Berwick, ME (Hussey Seating Company)2 | | | 7.000 | | | | 12/01/2013 | | | | 19,972 | |
| | 4,800,000 | | | Rumford, ME Pollution Control (Boise Cascade Corp.)2 | | | 6.625 | | | | 07/01/2020 | | | | 2,841,456 | |
| | 14,265,000 | | | Rumford, ME Solid Waste Disposal (Boise Cascade Corp.)2 | | | 6.875 | | | | 10/01/2026 | | | | 7,749,747 | |
| | | | | | | | | | | | | | | | |
| | | | | | | | | | | | | | | | 16,250,175 | |
| | | | | | | | | | | | | | | | | |
| Maryland—0.3% | | | | | | | | | | | | |
| | 6,810,000 | | | Brunswick, MD Special Obligation (Brunswick Crossing)2 | | | 5.500 | | | | 07/01/2036 | | | | 3,976,631 | |
| | 5,135,000 | | | MD EDC Student Hsg. (Bowie State University)2 | | | 6.000 | | | | 06/01/2023 | | | | 3,844,883 | |
| | 400,000 | | | MD EDC Student Hsg. (University of Maryland)2 | | | 5.625 | | | | 10/01/2023 | | | | 281,684 | |
| | 8,500,000 | | | MD EDC Student Hsg. (University of Maryland)2 | | | 5.750 | | | | 10/01/2033 | | | | 5,325,845 | |
| | 600,000 | | | MD H&HEFA (King Farm Presbyterian Community)2 | | | 5.300 | | | | 01/01/2037 | | | | 356,460 | |
| | 925,000 | | | MD H&HEFA (Washington Christian Academy) | | | 5.500 | | | | 07/01/2038 | | | | 464,507 | |
| | 2,250,000 | | | Salisbury, MD Special Obligation (Villages at Aydelotte Farm)2 | | | 5.250 | | | | 01/01/2037 | | | | 1,218,758 | |
| | | | | | | | | | | | | | | | |
| | | | | | | | | | | | | | | | 15,468,768 | |
| | | | | | | | | | | | | | | | | |
| Massachusetts—2.1% | | | | | | | | | | | | |
| | 800,000 | | | MA Devel. Finance Agency (Eastern Nazarene College)2 | | | 5.625 | | | | 04/01/2019 | | | | 684,512 | |
| | 2,630,000 | | | MA Devel. Finance Agency (Eastern Nazarene College)2 | | | 5.625 | | | | 04/01/2029 | | | | 1,863,723 | |
| | 1,800,000 | | | MA Devel. Finance Agency (Linden Ponds)2 | | | 5.750 | | | | 11/15/2042 | | | | 1,069,110 | |
| | 300,000 | | | MA Devel. Finance Agency (Regis College)2 | | | 5.250 | | | | 10/01/2018 | | | | 240,957 | |
| | 1,000,000 | | | MA Devel. Finance Agency (VOA Concord)2 | | | 5.200 | | | | 11/01/2041 | | | | 636,250 | |
| | 30,000,000 | | | MA Educational Financing Authority, Series H1 | | | 6.350 | | | | 01/01/2030 | | | | 30,114,196 | |
| | 65,000 | | | MA H&EFA (Holyoke Hospital)2 | | | 6.500 | | | | 07/01/2015 | | | | 57,728 | |
| | 50,080,000 | | | MA HFA, Series A1 | | | 5.250 | | | | 07/01/2025 | | | | 49,072,252 | |
| | 10,500,000 | | | MA HFA, Series A1 | | | 5.300 | | | | 06/01/2049 | | | | 9,643,129 | |
| | 8,330,000 | | | MA HFA, Series C1 | | | 5.400 | | | | 12/01/2049 | | | | 7,873,125 | |
| | 50,000 | | | MA Port Authority (Delta Air Lines) | | | 5.000 | | | | 01/01/2027 | | | | 28,653 | |
| | | | | | | | | | | | | | | | |
| | | | | | | | | | | | | | | | 101,283,635 | |
F26 | OPPENHEIMER ROCHESTER NATIONAL MUNICIPALS
| | | | | | | | | | | | | | | | | |
| Principal | | | | | | | | | | | | |
| Amount | | | | | Coupon | | | Maturity | | | Value | |
| |
| Michigan—2.1% | | | | | | | | | | | | |
| $ | 3,460,000 | | | Detroit, MI Local Devel. Finance Authority2 | | | 6.700 | % | | | 05/01/2021 | | | $ | 1,635,992 | |
| | 2,145,000 | | | Detroit, MI Local Devel. Finance Authority2 | | | 6.850 | | | | 05/01/2021 | | | | 1,014,049 | |
| | 585,000 | | | Detroit, MI Local Devel. Finance Authority (Chrysler Corp.)2 | | | 5.375 | | | | 05/01/2018 | | | | 272,423 | |
| | 35,095,000 | | | Detroit, MI Sewer Disposal System1 | | | 1.000 | 6 | | | 07/01/2032 | | | | 22,810,031 | |
| | 5,845,000 | | | Detroit, MI Sewer Disposal System2 | | | 1.000 | 6 | | | 07/01/2032 | | | | 3,800,711 | |
| | 760,000 | | | East Lansing, MI Economic Corp. (Burcham Hills)2 | | | 5.250 | | | | 07/01/2037 | | | | 467,271 | |
| | 1,400,000 | | | Kalamazoo, MI EDC (Heritage Community)2 | | | 5.500 | | | | 05/15/2036 | | | | 901,404 | |
| | 2,500,000 | | | Kent, MI Hospital Finance Authority2 | | | 6.250 | | | | 07/01/2040 | | | | 1,816,800 | |
| | 65,000 | | | MI Hospital Finance Authority (Detroit Medical Center)2 | | | 6.500 | | | | 08/15/2018 | | | | 57,377 | |
| | 900,000 | | | MI Public Educational Facilities Authority (American Montessori)2 | | | 6.500 | | | | 12/01/2037 | | | | 647,136 | |
| | 1,500,000 | | | MI Public Educational Facilities Authority (Old Redford Academy)2 | | | 6.000 | | | | 12/01/2035 | | | | 1,083,105 | |
| | 5,515,000 | | | MI Strategic Fund Limited Obligation (Ford Motor Company), Series A | | | 6.550 | | | | 10/01/2022 | | | | 3,719,923 | |
| | 1,500,000 | | | MI Strategic Fund Limited Obligation (Wolverine Human Services)2 | | | 7.875 | | | | 08/31/2028 | | | | 1,288,050 | |
| | 4,730,000 | | | MI Strategic Fund Pollution Control (General Motors Corp.)3 | | | 6.200 | | | | 09/01/2020 | | | | 473,000 | |
| | 4,400,000 | | | MI Strategic Fund Solid Waste (Genesee Power Station)2 | | | 7.500 | | | | 01/01/2021 | | | | 3,633,476 | |
| | 428,990,000 | | | MI Tobacco Settlement Finance Authority | | | 7.286 | 5 | | | 06/01/2052 | | | | 5,855,714 | |
| | 3,048,780,000 | | | MI Tobacco Settlement Finance Authority | | | 8.877 | 5 | | | 06/01/2058 | | | | 16,859,753 | |
| | 27,930,000 | | | Wayne County, MI Airport Authority1 | | | 5.000 | | | | 12/01/2029 | | | | 25,844,278 | |
| | 14,500,000 | | | Wayne, MI Charter County Airport Facilities (Northwest Airlines)2 | | | 6.000 | | | | 12/01/2029 | | | | 9,664,975 | |
| | | | | | | | | | | | | | | | |
| | | | | | | | | | | | | | | | 101,845,468 | |
| | | | | | | | | | | | | | | | | |
| Minnesota—1.3% | | | | | | | | | | | | |
| | 1,530,000 | | | Burnsville, MN Commercial Devel. (Holiday Inn)3,7 | | | 5.900 | | | | 04/01/2008 | | | | 642,600 | |
| | 1,000,000 | | | Cokato, MN Senior Hsg. (Cokato Charitable Trust)2 | | | 5.400 | | | | 12/01/2036 | | | | 681,120 | |
| | 1,750,000 | | | Cottage Grove, MN Senior Hsg.2 | | | 6.000 | | | | 12/01/2046 | | | | 1,351,385 | |
| | 175,000 | | | Eden Prairie, MN Multifamily Hsg. (Sterling Ponds) | | | 6.250 | | | | 12/01/2029 | | | | 139,232 | |
| | 2,000,000 | | | Elysian, MN Senior Hsg. (Kingsway Ministries)2 | | | 5.350 | | | | 05/01/2042 | | | | 1,367,140 | |
| | 1,000,000 | | | Eveleth, MN Multifamily (Manor House Woodland)2 | | | 5.500 | | | | 10/01/2025 | | | | 776,440 | |
| | 2,000,000 | | | Eveleth, MN Multifamily (Manor House Woodland)2 | | | 5.700 | | | | 10/01/2036 | | | | 1,416,760 | |
| | 2,160,000 | | | Green Isle, MN Senior Hsg. (Kingsway Ministries)2 | | | 5.500 | | | | 05/01/2042 | | | | 1,480,939 | |
| | 525,000 | | | International Falls, MN Pollution Control (Boise Cascade Corp.)2 | | | 5.500 | | | | 04/01/2023 | | | | 272,333 | |
| | 3,250,000 | | | International Falls, MN Pollution Control (Boise Cascade Corp.)2 | | | 5.650 | | | | 12/01/2022 | | | | 1,730,495 | |
F27 | OPPENHEIMER ROCHESTER NATIONAL MUNICIPALS
STATEMENT OF INVESTMENTS Continued
| | | | | | | | | | | | | | | | | |
| Principal | | | | | | | | | | | | |
| Amount | | | | | Coupon | | | Maturity | | | Value | |
| |
| Minnesota Continued | | | | | | | | | | | | |
| $ | 6,370,000 | | | International Falls, MN Solid Waste Disposal (Boise Cascade Corp.)2 | | | 6.850 | % | | | 12/01/2029 | | | $ | 3,314,120 | |
| | 14,680,000 | | | Lamberton, MN Solid Waste (Highwater Ethanol)2 | | | 8.500 | | | | 12/01/2022 | | | | 11,510,588 | |
| | 9,545,000 | | | Mankato, MN Industrial Devel. (Environ Biocomposites Holdings)3,4 | | | 7.250 | | | | 12/01/2025 | | | | 4,074,665 | |
| | 7,451,106 | | | Minneapolis & St. Paul, MN Hsg. Finance Board (Single Family Mtg.)1 | | | 5.000 | | | | 11/01/2038 | | | | 7,059,311 | |
| | 47,015,000 | | | Minneapolis & St. Paul, MN Metropolitan Airports Commission (Northwest Airlines)3,4,7 | | | 7.000 | | | | 04/01/2025 | | | | 470 | |
| | 16,400,000 | | | Minneapolis & St. Paul, MN Metropolitan Airports Commission (Northwest Airlines)3,4,7 | | | 7.375 | | | | 04/01/2025 | | | | 164 | |
| | 100,000 | | | Minneapolis, MN Multifamily Hsg. (Belmont Apartments)2 | | | 7.625 | | | | 11/01/2027 | | | | 89,733 | |
| | 730,000 | | | Minneapolis, MN Multifamily Hsg. (Blaisdell Apartments)2 | | | 5.400 | | | | 04/01/2028 | | | | 505,138 | |
| | 5,340,000 | | | Minneapolis, MN Multifamily Hsg. (Blaisdell Apartments)2 | | | 5.500 | | | | 04/01/2042 | | | | 3,340,330 | |
| | 500,000 | | | Minneapolis, MN Tax Increment (Ivy Tower)2 | | | 5.500 | | | | 02/01/2022 | | | | 362,905 | |
| | 1,000,000 | | | Minneapolis, MN Tax Increment (Ivy Tower)2 | | | 5.700 | | | | 02/01/2029 | | | | 642,990 | |
| | 900,000 | | | New Hope, MN Hsg. & Health Care Facilities (Minnesota Masonic Home North Ridge)2 | | | 5.900 | | | | 03/01/2019 | | | | 786,825 | |
| | 80,000 | | | New Hope, MN Multifamily (Chardon Court) | | | 7.250 | | | | 06/01/2026 | | | | 48,618 | |
| | 25,000 | | | Northfield, MN Lease (Village School of Northfield)3,4,7 | | | 6.500 | | | | 12/01/2014 | | | | 5,524 | |
| | 330,000 | | | Northfield, MN Lease (Village School of Northfield)3,4,7 | | | 7.500 | | | | 12/01/2024 | | | | 66,545 | |
| | 2,100,000 | | | Northwest MN Multi-County Hsg. and Redevel. Authority2 | | | 5.450 | | | | 07/01/2041 | | | | 1,313,277 | |
| | 1,500,000 | | | Oronoco, MN Multifamily Hsg. (Wedum Shorewood Campus)2 | | | 5.400 | | | | 06/01/2041 | | | | 1,040,880 | |
| | 10,170,000 | | | Otter Tail County, MN GO2 | | | 7.500 | | | | 11/01/2019 | | | | 3,571,501 | |
| | 1,715,000 | | | Pine City, MN Health Care & Hsg. (North Branch)2 | | | 6.125 | | | | 10/20/2047 | | | | 1,370,525 | |
| | 6,200,000 | | | Richfield, MN Senior Hsg. (Richfield Senior Hsg.)2 | | | 6.625 | | | | 12/01/2039 | | | | 5,008,236 | |
| | 515,000 | | | Rochester, MN Multifamily Hsg. (Eastridge Estates)2 | | | 7.750 | | | | 12/15/2034 | | | | 433,733 | |
| | 830,000 | | | St. Anthony, MN Hsg. & Redevel. Authority (Silver Lake Village)2 | | | 5.375 | | | | 08/01/2021 | | | | 600,015 | |
| | 790,000 | | | St. Anthony, MN Hsg. & Redevel. Authority (Silver Lake Village)2 | | | 5.625 | | | | 02/01/2031 | | | | 484,175 | |
| | 90,000 | | | St. Cloud, MN Hsg. & Redevel. Authority (Germain Towers)2 | | | 5.900 | | | | 09/01/2020 | | | | 71,834 | |
| | 1,280,000 | | | St. Paul, MN Hsg. & Redevel. Authority (Bridgecreek Senior Place)2 | | | 7.000 | | | | 09/15/2037 | | | | 943,603 | |
| | 1,963,205 | | | St. Paul, MN Hsg. & Redevel. Authority (Episcopal Nursing Home)2 | | | 5.630 | | | | 10/01/2033 | | | | 1,396,585 | |
| | 3,000,000 | | | St. Paul, MN Hsg. & Redevel. Authority (Great Northern Lofts)2 | | | 6.250 | | | | 03/01/2029 | | | | 2,049,720 | |
F28 | OPPENHEIMER ROCHESTER NATIONAL MUNICIPALS
| | | | | | | | | | | | | | | | | |
| Principal | | | | | | | | | | | | |
| Amount | | | | | Coupon | | | Maturity | | | Value | |
| |
| Minnesota Continued | | | | | | | | | | | | |
| $ | 400,000 | | | St. Paul, MN Hsg. & Redevel. Authority (Hmong Academy)2 | | | 5.750 | % | | | 09/01/2026 | | | $ | 310,888 | |
| | 650,000 | | | St. Paul, MN Hsg. & Redevel. Authority (Hmong Academy)2 | | | 6.000 | | | | 09/01/2036 | | | | 477,490 | |
| | 1,900,000 | | | St. Paul, MN Hsg. & Redevel. Authority (Upper Landing)2 | | | 6.800 | | | | 03/01/2029 | | | | 1,387,456 | |
| | 1,246,000 | | | St. Paul, MN Hsg. & Redevel. Authority (Upper Landing)2 | | | 7.000 | | | | 03/01/2029 | | | | 931,173 | |
| | 905,000 | | | St. Paul, MN Port Authority (Great Northern)2 | | | 6.000 | | | | 03/01/2030 | | | | 591,200 | |
| | 560,000 | | | St. Paul, MN Port Authority Parking Revenue (4th Parking Ramp) | | | 8.000 | | | | 12/01/2027 | | | | 140,179 | |
| | 1,545,000 | | | Wadena, MN Hsg. & Redevel. Authority (Humphrey Manor East)2 | | | 6.000 | | | | 02/01/2019 | | | | 1,292,223 | |
| | | | | | | | | | | | | | | | |
| | | | | | | | | | | | | | | | 65,081,063 | |
| | | | | | | | | | | | | | | | | |
| Mississippi—0.3% | | | | | | | | | | | | |
| | 175,000 | | | Jackson, MS Hsg. Authority (Elton Park Apartments)2 | | | 5.400 | | | | 04/01/2039 | | | | 177,622 | |
| | 5,000,000 | | | MS Business Finance Corp. (Intrinergy Wiggins)2 | | | 8.000 | | | | 01/01/2023 | | | | 4,163,200 | |
| | 16,410,000 | | | Stonebridge, MS Public Improvement District Special Assessment2 | | | 7.500 | | | | 10/01/2042 | | | | 10,509,949 | |
| | 270,000 | | | Warren County, MS Environmental Improvement (International Paper Company)2 | | | 5.550 | | | | 08/15/2022 | | | | 229,767 | |
| | 175,000 | | | Warren County, MS Environmental Improvement (International Paper Company)2 | | | 6.250 | | | | 09/01/2023 | | | | 159,630 | |
| | | | | | | | | | | | | | | | |
| | | | | | | | | | | | | | | | 15,240,168 | |
| | | | | | | | | | | | | | | | | |
| Missouri—1.6% | | | | | | | | | | | | |
| | 250,000 | | | Belton, MO Tax Increment (Belton Town Center)2 | | | 5.500 | | | | 03/01/2020 | | | | 201,535 | |
| | 400,000 | | | Belton, MO Tax Increment (Belton Town Center)2 | | | 5.625 | | | | 03/01/2025 | | | | 293,496 | |
| | 325,000 | | | Branson Hills, MO Infrastructure Facilities2 | | | 5.000 | | | | 04/01/2010 | | | | 324,103 | |
| | 580,000 | | | Branson Hills, MO Infrastructure Facilities2 | | | 5.000 | | | | 04/01/2012 | | | | 564,120 | |
| | 500,000 | | | Branson Hills, MO Infrastructure Facilities2 | | | 5.000 | | | | 04/01/2016 | | | | 445,070 | |
| | 500,000 | | | Branson Hills, MO Infrastructure Facilities2 | | | 5.000 | | | | 04/01/2017 | | | | 431,875 | |
| | 730,000 | | | Branson Hills, MO Infrastructure Facilities2 | | | 5.500 | | | | 04/01/2022 | | | | 584,015 | |
| | 750,000 | | | Branson Hills, MO Infrastructure Facilities2 | | | 5.500 | | | | 04/01/2027 | | | | 553,980 | |
| | 4,900,000 | | | Branson, MO Commerce Park Community Improvement District2 | | | 5.750 | | | | 06/01/2026 | | | | 3,653,244 | |
| | 2,485,000 | | | Branson, MO IDA (Branson Hills Redevel.)2 | | | 5.750 | | | | 05/01/2026 | | | | 1,743,749 | |
| | 13,000,000 | | | Branson, MO IDA (Branson Hills Redevel.)2 | | | 7.050 | | | | 05/01/2027 | | | | 10,423,530 | |
| | 1,940,000 | | | Branson, MO IDA (Branson Landing)2 | | | 5.250 | | | | 06/01/2021 | | | | 1,345,700 | |
| | 2,470,000 | | | Branson, MO IDA (Branson Landing)2 | | | 5.500 | | | | 06/01/2029 | | | | 1,467,896 | |
| | 24,545,000 | | | Branson, MO IDA (Branson Shoppe Redevel.)2 | | | 5.950 | | | | 11/01/2029 | | | | 16,679,064 | |
| | 5,000,000 | | | Branson, MO Regional Airport (Branson Airport) | | | 6.000 | | | | 07/01/2025 | | | | 3,516,500 | |
| | 570,000 | | | Broadway-Fairview, MO Transportation Devel. District (Columbia)2 | | | 6.125 | | | | 12/01/2036 | | | | 336,642 | |
F29 | OPPENHEIMER ROCHESTER NATIONAL MUNICIPALS
STATEMENT OF INVESTMENTS Continued
| | | | | | | | | | | | | | | | | |
| Principal | | | | | | | | �� | | | | |
| Amount | | | | | Coupon | | | Maturity | | | Value | |
| |
| Missouri Continued | | | | | | | | | | | | |
| $ | 1,215,000 | | | Chillicothe, MO Tax Increment (South U.S. 65)2 | | | 5.500 | % | | | 04/01/2021 | | | $ | 987,613 | |
| | 1,100,000 | | | Chillicothe, MO Tax Increment (South U.S. 65)2 | | | 5.625 | | | | 04/01/2027 | | | | 820,985 | |
| | 35,000 | | | Fenton, MO Tax Increment (Dierbergs)2 | | | 7.250 | | | | 10/01/2021 | | | | 33,080 | |
| | 200,000 | | | Jackson County, MO IDA (Avila College)2 | | | 6.500 | | | | 12/02/2025 | | | | 180,190 | |
| | 1,250,000 | | | Jennings, MO Tax Increment & Community Improvement (Northland Redevel. Area)2 | | | 5.000 | | | | 11/01/2023 | | | | 950,613 | |
| | 500,000 | | | Kansas City, MO IDA (Plaza Library)2 | | | 5.900 | | | | 03/01/2024 | | | | 402,975 | |
| | 1,352,000 | | | Kansas City, MO IDA (West Paseo)2 | | | 6.750 | | | | 07/01/2036 | | | | 1,019,557 | |
| | 440,000 | | | Kansas City, MO IDA (Woodbridge Apartments) | | | 6.700 | | | | 08/01/2015 | | | | 418,968 | |
| | 3,750,000 | | | Kansas City, MO Tax Increment (Briarcliff West)2 | | | 5.400 | | | | 06/01/2024 | | | | 2,830,163 | |
| | 1,735,000 | | | Lees Summit, MO IDA (Kensington Farms)2 | | | 5.500 | | | | 03/01/2021 | | | | 1,417,478 | |
| | 750,000 | | | Lees Summit, MO IDA (Kensington Farms)2 | | | 5.750 | | | | 03/01/2029 | | | | 551,708 | |
| | 3,065,000 | | | Liberty, MO Tax Increment (Liberty Triangle)2 | | | 5.875 | | | | 10/01/2029 | | | | 2,246,860 | |
| | 3,290,000 | | | MO Dardenne Town Square Transportation Devel. District | | | 5.000 | | | | 05/01/2026 | | | | 1,882,571 | |
| | 3,825,000 | | | MO Dardenne Town Square Transportation Devel. District | | | 5.000 | | | | 05/01/2036 | | | | 1,881,441 | |
| | 2,720,000 | | | MO Enright Arlington Community Improvement District2 | | | 5.400 | | | | 03/01/2026 | | | | 2,017,125 | |
| | 2,000,000 | | | MO Good Shepard Nursing Home District2 | | | 5.900 | | | | 08/15/2023 | | | | 1,599,900 | |
| | 230,000 | | | MO Grindstone Plaza Transportation Devel. District2 | | | 5.250 | | | | 10/01/2021 | | | | 121,187 | |
| | 400,000 | | | MO Grindstone Plaza Transportation Devel. District2 | | | 5.400 | | | | 10/01/2026 | | | | 210,760 | |
| | 115,000 | | | MO Grindstone Plaza Transportation Devel. District2 | | | 5.550 | | | | 10/01/2036 | | | | 60,595 | |
| | 3,915,000 | | | MO HDC (Mansion Apartments Phase II)2 | | | 6.170 | | | | 04/01/2032 | | | | 2,794,292 | |
| | 10,000 | | | MO HDC (Single Family Mtg.)2 | | | 5.500 | | | | 09/01/2033 | | | | 10,143 | |
| | 50,000 | | | MO HDC (Single Family Mtg.)2 | | | 6.400 | | | | 03/01/2029 | | | | 51,146 | |
| | 788,000 | | | Northwoods, MO Transportation Devel. District2 | | | 5.850 | | | | 02/01/2031 | | | | 533,578 | |
| | 2,000,000 | | | St. Joseph, MO IDA (Living Community of St. Joseph)2 | | | 7.000 | | | | 08/15/2032 | | | | 1,708,580 | |
| | 2,000,000 | | | St. Joseph, MO IDA (Shoppes at North Village)2 | | | 5.500 | | | | 11/01/2027 | | | | 1,563,240 | |
| | 10,000 | | | St. Louis County, MO IDA (Century Garden Apartments)2 | | | 5.700 | | | | 08/20/2039 | | | | 10,037 | |
| | 2,454,000 | | | St. Louis, MO Tax Increment (1601 Washington Redevel.)2 | | | 6.000 | | | | 08/21/2026 | | | | 1,565,603 | |
| | 2,034,000 | | | St. Louis, MO Tax Increment (Pet Building Redevel.) | | | 5.500 | | | | 05/29/2028 | | | | 1,143,840 | |
| | 1,660,000 | | | St. Louis, MO Tax Increment (Printers Lofts)2 | | | 6.000 | | | | 08/21/2026 | | | | 1,059,047 | |
| | 3,045,000 | | | St. Louis, MO Tax Increment (Security Building Redevel.)2 | | | 6.300 | | | | 04/01/2027 | | | | 2,000,474 | |
| | 2,437,000 | | | St. Louis, MO Tax Increment (Washington East Condominiums)2 | | | 5.500 | | | | 01/20/2028 | | | | 1,369,082 | |
| | 1,600,000 | | | St. Louis, MO Tax Increment (Washington East Condominiums)2 | | | 5.500 | | | | 01/20/2028 | | | | 898,864 | |
F30 | OPPENHEIMER ROCHESTER NATIONAL MUNICIPALS
| | | | | | | | | | | | | | | | | |
| Principal | | | | | | | | | | | | |
| Amount | | | | | Coupon | | | Maturity | | | Value | |
| |
| Missouri Continued | | | | | | | | | | | | |
| $ | 1,115,000 | | | St. Louis, MO Tax Increment Financing, Series A2 | | | 5.500 | % | | | 09/02/2028 | | | $ | 621,390 | |
| | 1,865,000 | | | Stone Canyon, MO Improvement District (Infrastructure)2 | | | 5.700 | | | | 04/01/2022 | | | | 1,483,496 | |
| | 975,000 | | | Stone Canyon, MO Improvement District (Infrastructure)2 | | | 5.750 | | | | 04/01/2027 | | | | 720,866 | |
| | | | | | | | | | | | | | | | |
| | | | | | | | | | | | | | | | 79,731,966 | |
| | | | | | | | | | | | | | | | | |
| Montana—0.2% | | | | | | | | | | | | |
| | 4,360,000 | | | Hardin, MT Tax Increment Industrial Infrastructure Devel. (Rocky Mountain Power)2 | | | 0.000 | 8 | | | 09/01/2031 | | | | 1,958,556 | |
| | 6,800,000 | | | MT Board of Investment Exempt Facilities (Stillwater Mining Company)2 | | | 8.000 | | | | 07/01/2020 | | | | 4,738,172 | |
| | 1,125,000 | | | MT Facilities Finance Authority (St. John’s Lutheran)2 | | | 6.000 | | | | 05/15/2025 | | | | 873,506 | |
| | 1,650,000 | | | MT Facilities Finance Authority (St. John’s Lutheran)2 | | | 6.125 | | | | 05/15/2036 | | | | 1,170,609 | |
| | 1,810,000 | | | MT Health Facilities Authority (CoMC)2 | | | 6.375 | | | | 06/01/2018 | | | | 1,810,163 | |
| | | | | | | | | | | | | | | | |
| | | | | | | | | | | | | | | | 10,551,006 | |
| | | | | | | | | | | | | | | | | |
| Multi States—0.1% | | | | | | | | | | | | |
| | 8,000,000 | | | Munimae TE Bond Subsidiary2 | | | 5.900 | | | | 11/29/2049 | | | | 4,076,000 | |
| Nebraska—0.7% | | | | | | | | | | | | |
| | 1,360,000 | | | Beatrice, NE Community Redevel. Authority (Beatrice Biodiesel) | | | 6.625 | | | | 12/01/2021 | | | | 783,986 | |
| | 50,000 | | | Dawson County, NE Sanitation & Improvement District2 | | | 5.650 | | | | 02/01/2022 | | | | 39,337 | |
| | 20,000,000 | | | Douglas County, NE Hospital Authority (Methodist Health System)1 | | | 5.750 | | | | 11/01/2048 | | | | 20,987,080 | |
| | 1,200,000 | | | Douglas County, NE Hsg. Authority (Orchard Gardens)2 | | | 5.150 | | | | 10/01/2032 | | | | 1,016,148 | |
| | 1,250,000 | | | Mead Village, NE Tax Increment (Biofuels-Mead)2 | | | 5.750 | | | | 01/01/2022 | | | | 528,013 | |
| | 2,400,000 | | | NE Educational Facilities Authority (Midland Lutheran College)2 | | | 5.600 | | | | 09/15/2029 | | | | 1,742,448 | |
| | 65,000 | | | NE Student Loans (Nebhelp)2 | | | 6.250 | | | | 06/01/2018 | | | | 69,239 | |
| | 20,000 | | | NE Student Loans (Nebhelp)2 | | | 6.450 | | | | 06/01/2018 | | | | 20,608 | |
| | 45,745,000 | | | Saunders County, NE Individual Devel. (Mead Biofuels)3,4 | | | 7.000 | | | | 12/01/2026 | | | | 9,121,553 | |
| | | | | | | | | | | | | | | | |
| | | | | | | | | | | | | | | | 34,308,412 | |
| | | | | | | | | | | | | | | | | |
| Nevada—0.2% | | | | | | | | | | | | |
| | 1,000,000 | | | Clark County, NV Improvement District2 | | | 5.000 | | | | 02/01/2026 | | | | 491,590 | |
| | 770,000 | | | Clark County, NV Improvement District2 | | | 5.050 | | | | 02/01/2031 | | | | 347,185 | |
| | 25,000 | | | Clark County, NV Pollution Control (Nevada Power Company)2 | | | 5.450 | | | | 10/01/2023 | | | | 22,346 | |
| | 10,000,000 | | | Director of the State of NV Dept. of Business & Industry (Las Ventanas Retirement) | | | 7.000 | | | | 11/15/2034 | | | | 5,349,800 | |
| | 100,000 | | | Las Vegas, NV Paiute Tribe, Series A | | | 6.625 | | | | 11/01/2017 | | | | 85,743 | |
F31 | OPPENHEIMER ROCHESTER NATIONAL MUNICIPALS
STATEMENT OF INVESTMENTS Continued
| | | | | | | | | | | | | | | | | |
| Principal | | | | | | | | | | | | |
| Amount | | | | | Coupon | | | Maturity | | | Value | |
| |
| Nevada Continued | | | | | | | | | | | | |
| $ | 130,000 | | | Mesquite, NV Special Improvement District (Canyon Creek)2 | | | 5.400 | % | | | 08/01/2020 | | | $ | 87,762 | |
| | 520,000 | | | Mesquite, NV Special Improvement District (Canyon Creek)2 | | | 5.500 | | | | 08/01/2025 | | | | 305,682 | |
| | 2,000,000 | | | Mesquite, NV Special Improvement District No. 07-01 (Anthem at Mesquite)2 | | | 6.150 | | | | 08/01/2037 | | | | 1,207,520 | |
| | | | | | | | | | | | | | | | |
| | | | | | | | | | | | | | | | 7,897,628 | |
| | | | | | | | | | | | | | | | | |
| New Hampshire—0.1% | | | | | | | | | | | | |
| | 2,020,000 | | | NH Business Finance Authority (Air Cargo at Pease) | | | 6.750 | | | | 04/01/2024 | | | | 1,493,608 | |
| | 70,000 | | | NH Business Finance Authority
(Connecticut Light & Power)2 | | | 5.850 | | | | 12/01/2022 | | | | 70,043 | |
| | 4,000,000 | | | NH H&EFA (Franklin Pierce College)2 | | | 6.050 | | | | 10/01/2034 | | | | 2,491,520 | |
| | | | | | | | | | | | | | | | |
| | | | | | | | | | | | | | | | 4,055,171 | |
| | | | | | | | | | | | | | | | | |
| New Jersey—11.3% | | | | | | | | | | | | |
| | 1,400,000 | | | NJ EDA (Continental Airlines)2 | | | 5.500 | | | | 04/01/2028 | | | | 768,306 | |
| | 42,830,000 | | | NJ EDA (Continental Airlines)2 | | | 6.250 | | | | 09/15/2019 | | | | 33,176,975 | |
| | 64,685,000 | | | NJ EDA (Continental Airlines)2 | | | 6.250 | | | | 09/15/2029 | | | | 44,619,066 | |
| | 16,375,000 | | | NJ EDA (Continental Airlines)2 | | | 6.400 | | | | 09/15/2023 | | | | 12,152,543 | |
| | 1,600,000 | | | NJ EDA (Continental Airlines)2 | | | 6.625 | | | | 09/15/2012 | | | | 1,472,512 | |
| | 25,935,000 | | | NJ EDA (Continental Airlines)2 | | | 7.000 | | | | 11/15/2030 | | | | 19,467,848 | |
| | 16,920,000 | | | NJ EDA (Continental Airlines)2 | | | 7.200 | | | | 11/15/2030 | | | | 13,000,820 | |
| | 16,500,000 | | | NJ EDA (Continental Airlines)2 | | | 9.000 | | | | 06/01/2033 | | | | 15,272,730 | |
| | 12,500,000 | | | NJ EDA (Converted Organics of Woodbridge)3 | | | 8.000 | | | | 08/01/2027 | | | | 8,117,250 | |
| | 1,109,191 | | | NJ EDA (Empowerment Zone-Cumberland)3 | | | 7.750 | | | | 08/01/2021 | | | | 595,092 | |
| | 9,000,000 | | | NJ EDA (GMT Realty)2 | | | 6.875 | | | | 01/01/2037 | | | | 6,866,280 | |
| | 34,350,000 | | | NJ Health Care Facilities Financing Authority (CHE/MM/MC Obligated Group)2 | | | 1.392 | 6 | | | 11/15/2033 | | | | 21,992,588 | |
| | 6,130,000 | | | NJ Health Care Facilities Financing Authority (Raritan Bay Medical Center)2 | | | 7.250 | | | | 07/01/2027 | | | | 5,157,414 | |
| | 154,940,000 | | | NJ Tobacco Settlement Financing Corp.1 | | | 4.750 | | | | 06/01/2034 | | | | 90,172,395 | |
| | 96,125,000 | | | NJ Tobacco Settlement Financing Corp.1 | | | 5.000 | | | | 06/01/2029 | | | | 65,390,800 | |
| | 375,020,000 | | | NJ Tobacco Settlement Financing Corp.2 | | | 5.000 | | | | 06/01/2041 | | | | 203,039,578 | |
| | 198,050,000 | | | NJ Tobacco Settlement Financing Corp. | | | 7.389 | 5 | | | 06/01/2041 | | | | 8,706,278 | |
| | | | | | | | | | | | | | | | |
| | | | | | | | | | | | | | | | 549,968,475 | |
| | | | | | | | | | | | | | | | | |
| New Mexico—0.3% | | | | | | | | | | | | |
| | 525,000 | | | Dona Ana County, NM Multifamily (Montana Meadows Apartments)2 | | | 8.500 | | | | 12/01/2015 | | | | 524,139 | |
| | 5,300,000 | | | Eldorado, NM Area Water and Sanitation District2 | | | 6.000 | | | | 02/01/2025 | | | | 4,096,423 | |
| | 50,000 | | | Farmington, NM Pollution Control
(Public Service Company of New Mexico)2 | | | 6.600 | | | | 10/01/2029 | | | | 44,014 | |
F32 | OPPENHEIMER ROCHESTER NATIONAL MUNICIPALS
| | | | | | | | | | | | | | | | | |
| Principal | | | | | | | | | | | | |
| Amount | | | | | Coupon | | | Maturity | | | Value | |
| | | | | |
| New Mexico Continued | | | | | | | | | | | | |
| $ | 1,100,000 | | | Mariposa East, NM Public Improvement District2 | | | 5.500 | % | | | 09/01/2016 | | | $ | 927,740 | |
| | 500,000 | | | Mariposa East, NM Public Improvement District2 | | | 5.750 | | | | 09/01/2021 | | | | 371,405 | |
| | 500,000 | | | Mariposa East, NM Public Improvement District2 | | | 6.000 | | | | 09/01/2032 | | | | 314,935 | |
| | 900,000 | | | Montecito Estates, NM Public Improvement District2 | | | 7.000 | | | | 10/01/2037 | | | | 604,836 | |
| | 20,000 | | | NM Educational Assistance Foundation2 | | | 6.650 | | | | 11/01/2025 | | | | 20,010 | |
| | 5,000 | | | NM Mtg. Finance Authority, Series C2 | | | 6.500 | | | | 07/01/2025 | | | | 5,236 | |
| | 209,000 | | | NM Regional Hsg. Authority (Wildewood Apartments)2 | | | 8.750 | | | | 12/01/2020 | | | | 206,454 | |
| | 1,925,000 | | | NM Trails Public Improvement District2 | | | 7.750 | | | | 10/01/2038 | | | | 1,494,763 | |
| | 4,805,000 | | | Saltillo, NM Improvement District2 | | | 7.625 | | | | 10/01/2037 | | | | 3,762,171 | |
| | 1,000,000 | | | Ventana West, NM Public Improvement District Special Levy2 | | | 6.875 | | | | 08/01/2033 | | | | 744,950 | |
| | | | | | | | | | | | | | | | |
| | | | | | | | | | | | | | | | 13,117,076 | |
| | | | | | | | | | | | | | | | | |
| New York—4.6% | | | | | | | | | | | | |
| | 3,000,000 | | | Albany, NY IDA (New Covenant Charter School) | | | 7.000 | 10 | | | 05/01/2035 | | | | 1,882,530 | |
| | 17,700,000 | | | Erie County, NY Tobacco Asset Securitization Corp. | | | 6.656 | 5 | | | 06/01/2055 | | | | 118,413 | |
| | 412,100,000 | | | NY Counties Tobacco Trust V | | | 7.151 | 5 | | | 06/01/2060 | | | | 1,594,827 | |
| | 500,000,000 | | | NY Counties Tobacco Trust V | | | 7.836 | 5 | | | 06/01/2060 | | | | 1,935,000 | |
| | 5,895,000 | | | NYC GO1 | | | 5.000 | | | | 05/15/2031 | | | | 5,944,590 | |
| | 3,500,000 | | | NYC GO1 | | | 5.000 | | | | 05/15/2033 | | | | 3,508,348 | |
| | 21,575,000 | | | NYC GO1 | | | 5.000 | | | | 05/15/2036 | | | | 21,447,570 | |
| | 10,000,000 | | | NYC GO1 | | | 5.375 | | | | 04/01/2036 | | | | 10,322,700 | |
| | 2,815,000 | | | NYC IDA (American Airlines) | | | 5.400 | | | | 07/01/2020 | | | | 1,103,959 | |
| | 11,055,000 | | | NYC IDA (American Airlines) | | | 6.900 | | | | 08/01/2024 | | | | 4,473,074 | |
| | 4,500,000 | | | NYC IDA (American Airlines)2 | | | 7.500 | | | | 08/01/2016 | | | | 3,753,270 | |
| | 28,500,000 | | | NYC IDA (American Airlines)2 | | | 7.625 | | | | 08/01/2025 | | | | 22,533,810 | |
| | 37,000,000 | | | NYC IDA (American Airlines)2 | | | 7.750 | | | | 08/01/2031 | | | | 28,526,260 | |
| | 10,000,000 | | | NYC IDA (Bronx Parking Devel.) | | | 5.750 | | | | 10/01/2037 | | | | 6,071,000 | |
| | 500,000 | | | NYC IDA (JFK International Airport)2 | | | 8.000 | | | | 08/01/2012 | | | | 473,765 | |
| | 20,000,000 | | | NYC Municipal Water Finance Authority1 | | | 5.000 | | | | 06/15/2036 | | | | 20,007,500 | |
| | 20,000,000 | | | NYC Municipal Water Finance Authority1 | | | 5.000 | | | | 06/15/2039 | | | | 19,929,800 | |
| | 10,000,000 | | | NYS DA (Personal Income Tax)1 | | | 5.000 | | | | 03/15/2038 | | | | 9,999,450 | |
| | 12,075,000 | | | NYS DA (State Personal Income Tax Authority)1 | | | 5.000 | | | | 03/15/2035 | | | | 12,097,771 | |
| | 50,000,000 | | | NYS IDA (Bronx Parking Devel. Company) | | | 5.875 | | | | 10/01/2046 | | | | 30,548,000 | |
| | 20,000,000 | | | NYS UDC (State Personal Income Tax Authority)1 | | | 5.000 | | | | 03/15/2037 | | | | 19,994,300 | |
| | | | | | | | | | | | | | | | |
| | | | | | | | | | | | | | | | 226,265,937 | |
| | | | | | | | | | | | | | | | | |
| North Carolina—0.9% | | | | | | | | | | | | |
| | 46,700,000 | | | Charlotte, NC Douglas International Airport Special Facilities (US Airways)2 | | | 5.600 | | | | 07/01/2027 | | | | 28,580,867 | |
F33 | OPPENHEIMER ROCHESTER NATIONAL MUNICIPALS
STATEMENT OF INVESTMENTS Continued
| | | | | | | | | | | | | | | | | |
| Principal | | | | | | | | | | | | |
| Amount | | | | | Coupon | | | Maturity | | | Value | |
| |
| North Carolina Continued | | | | | | | | | | | | |
| $ | 14,235,000 | | | Charlotte, NC Douglas International Airport Special Facilities (US Airways)2 | | | 7.750 | % | | | 02/01/2028 | | | $ | 11,175,187 | |
| | 4,380,000 | | | Gaston, NC IF&PCFA (National Gypsum)2 | | | 5.750 | | | | 08/01/2035 | | | | 2,473,342 | |
| | 2,775,000 | | | NC Medical Care Commission Retirement Facilities (Village at Brookwood)2 | | | 5.250 | | | | 01/01/2032 | | | | 1,819,679 | |
| | | | | | | | | | | | | | | | |
| | | | | | | | | | | | | | | | 44,049,075 | |
| | | | | | | | | | | | | | | | | |
| North Dakota—0.1% | | | | | | | | | | | | |
| | 1,000,000 | | | Cando, ND Nursing Facility (Towner County Medical Center)2 | | | 7.125 | | | | 08/01/2022 | | | | 905,340 | |
| | 100,000 | | | Cass County, ND Industrial Devel. Revenue (Fraser Ltd.)2 | | | 7.000 | | | | 11/01/2015 | | | | 91,208 | |
| | 10,000 | | | ND HFA (Home Mtg.)2 | | | 5.400 | | | | 01/01/2034 | | | | 10,006 | |
| | 10,000 | | | ND HFA (Home Mtg.)2 | | | 5.550 | | | | 07/01/2022 | | | | 10,016 | |
| | 2,880,000 | | | Richland County, ND Hsg. (Birchwood Properties)2 | | | 6.750 | | | | 05/01/2029 | | | | 2,091,197 | |
| | | | | | | | | | | | | | | | |
| | | | | | | | | | | | | | | | 3,107,767 | |
| | | | | | | | | | | | | | | | | |
| Ohio—3.8% | | | | | | | | | | | | |
| | 3,960,000 | | | Buckeye, OH Tobacco Settlement Financing Authority (TASC)2 | | | 5.875 | | | | 06/01/2030 | | | | 2,789,899 | |
| | 43,905,000 | | | Buckeye, OH Tobacco Settlement Financing Authority (TASC)2 | | | 5.875 | | | | 06/01/2047 | | | | 25,207,178 | |
| | 2,345,000,000 | | | Buckeye, OH Tobacco Settlement Financing Authority (TASC) | | | 7.501 | 5 | | | 06/01/2052 | | | | 19,111,750 | |
| | 1,415,000 | | | Butler County, OH Hsg. (Anthony Wayne Apartments)2 | | | 6.500 | | | | 09/01/2030 | | | | 981,034 | |
| | 6,495,000 | | | Centerville, OH Health Care (Bethany Lutheran Village)2 | | | 6.000 | | | | 11/01/2038 | | | | 4,647,822 | |
| | 21,625,000 | | | Cleveland, OH Airport (Continental Airlines)2 | | | 5.375 | | | | 09/15/2027 | | | | 12,251,428 | |
| | 24,260,000 | | | Cleveland, OH Airport (Continental Airlines)2 | | | 5.700 | | | | 12/01/2019 | | | | 16,651,821 | |
| | 1,500,000 | | | Cleveland-Cuyahoga County, OH Port Authority (St. Clarence)2 | | | 6.250 | | | | 05/01/2038 | | | | 880,455 | |
| | 7,500,000 | | | Grove City, OH Tax Increment Financing2 | | | 5.375 | | | | 12/01/2031 | | | | 4,541,925 | |
| | 4,500,000 | | | Hickory Chase, OH Community Authority Infrastructure Improvement2 | | | 7.000 | | | | 12/01/2038 | | | | 2,933,280 | |
| | 810,000 | | | Lorain County, OH Port Authority (Alumalloy LLC)2 | | | 6.000 | | | | 11/15/2025 | | | | 556,640 | |
| | 15,770,000 | | | Mahoning County, OH Hospital Facilities (Forum Health/Trumbull Memorial Hospital/Beeghly Oaks) | | | 6.000 | | | | 11/15/2032 | | | | 9,939,516 | |
| | 960,000 | | | Moraine, OH Solid Waste Disposal (General Motors Corp.)3 | | | 5.650 | | | | 07/01/2024 | | | | 96,000 | |
| | 3,225,000 | | | Moraine, OH Solid Waste Disposal (General Motors Corp.)3 | | | 6.750 | | | | 07/01/2014 | | | | 322,500 | |
| | 14,300,000 | | | OH Air Quality Devel. Authority (Fostoria Ethanol)2 | | | 8.500 | | | | 02/01/2020 | | | | 9,892,025 | |
| | 14,300,000 | | | OH Air Quality Devel. Authority (Marion Ethanol)2 | | | 8.500 | | | | 02/01/2020 | | | | 9,892,025 | |
| | 50,000 | | | OH Environmental Facilities (Ford Motor Company) | | | 5.750 | | | | 04/01/2035 | | | | 30,620 | |
F34 | OPPENHEIMER ROCHESTER NATIONAL MUNICIPALS
| | | | | | | | | | | | | | | | | |
| Principal | | | | | | | | | | | | |
| Amount | | | | | Coupon | | | Maturity | | | Value | |
| |
| Ohio Continued | | | | | | | | | | | | |
| $ | 520,000 | | | OH Environmental Facilities (Ford Motor Company) | | | 5.950 | % | | | 09/01/2029 | | | $ | 321,823 | |
| | 100,000 | | | OH Environmental Facilities (Ford Motor Company) | | | 6.150 | | | | 06/01/2030 | | | | 63,051 | |
| | 550,000 | | | OH Pollution Control (General Motors Corp.)3 | | | 5.625 | | | | 03/01/2015 | | | | 55,000 | |
| | 2,050,000 | | | OH Port Authority of Columbiana Solid Waste (A&L Salvage)3,4,7 | | | 14.500 | | | | 07/01/2028 | | | | — | |
| | 16,320,000 | | | OH Port Authority of Columbiana Solid Waste (Apex Environmental)2 | | | 7.250 | | | | 08/01/2034 | | | | 11,462,189 | |
| | 14,000,000 | | | OH Solid Waste (General Motors Corp.)3 | | | 6.300 | | | | 12/01/2032 | | | | 1,400,000 | |
| | 29,515,000 | | | OH Solid Waste Disposal (USG Corp.) | | | 5.600 | | | | 08/01/2032 | | | | 17,860,412 | |
| | 38,910,000 | | | OH Solid Waste Disposal (USG Corp.)2 | | | 5.650 | | | | 03/01/2033 | | | | 23,616,425 | |
| | 6,640,000 | | | OH Solid Waste Disposal (USG Corp.)2 | | | 6.050 | | | | 08/01/2034 | | | | 4,235,390 | |
| | 70,000 | | | Pike County, OH Hospital Facilities (Pike Health Services)2 | | | 7.000 | | | | 07/01/2022 | | | | 61,880 | |
| | 450,000 | | | Toledo-Lucas County, OH Port Authority (Northwest Ohio)2 | | | 5.125 | | | | 11/15/2025 | | | | 305,865 | |
| | 3,415,000 | | | Warren County, OH Port Authority (Corridor 75 Park)2 | | | 7.500 | | | | 12/01/2034 | | | | 2,722,028 | |
| | | | | | | | | | | | | | | | |
| | | | | | | | | | | | | | | | 182,829,981 | |
| | | | | | | | | | | | | | | | | |
| Oklahoma—1.1% | | | | | | | | | | | | |
| | 1,700,000 | | | Ardmore, OK Devel. Authority (Airpark Increment District)2 | | | 5.750 | | | | 11/01/2022 | | | | 1,361,683 | |
| | 1,500,000 | | | Atoka County, OK Healthcare Authority (Atoka Memorial Hospital)2 | | | 6.625 | | | | 10/01/2037 | | | | 1,033,575 | |
| | 1,650,000 | | | Cleveland County, OK IDA (Vaughn Foods) | | | 7.750 | | | | 12/01/2012 | | | | 1,477,971 | |
| | 2,365,000 | | | Cleveland County, OK IDA (Vaughn Foods) | | | 8.100 | | | | 12/01/2024 | | | | 1,726,237 | |
| | 320,000 | | | Grady County, OK Industrial Authority (Correctional Facilities) | | | 7.000 | | | | 11/01/2011 | | | | 257,213 | |
| | 2,610,000 | | | Jackson County, OK Memorial Hospital Authority (Jackson County Memorial)2 | | | 7.300 | | | | 08/01/2015 | | | | 2,609,896 | |
| | 95,000 | | | OK HFA (Single Family Mtg.) | | | 5.686 | 5 | | | 09/01/2030 | | | | 28,751 | |
| | 50,000 | | | OK Ordnance Works Authority Sewer & Solid Waste Disposal Facilities (Ralston Purina Group)2 | | | 6.500 | | | | 09/01/2026 | | | | 50,036 | |
| | 1,500,000 | | | Oklahoma City, OK Industrial & Cultural Facilities (Aero Obligated Group)2 | | | 6.750 | | | | 01/01/2023 | | | | 1,228,350 | |
| | 2,950,000 | | | Oklahoma County, OK Finance Authority (Var-Sail Assoc.)2 | | | 5.250 | | | | 05/15/2041 | | | | 2,812,737 | |
| | 4,075,000 | | | Tulsa, OK Municipal Airport Trust (American Airlines)2 | | | 6.250 | | | | 06/01/2020 | | | | 2,987,179 | |
| | 215,000 | | | Tulsa, OK Municipal Airport Trust (American Airlines)2 | | | 7.350 | | | | 12/01/2011 | | | | 203,644 | |
| | 43,980,000 | | | Tulsa, OK Municipal Airport Trust (American Airlines) | | | 7.750 | | | | 06/01/2035 | | | | 36,214,891 | |
| | | | | | | | | | | | | | | | |
| | | | | | | | | | | | | | | | 51,992,163 | |
F35 | OPPENHEIMER ROCHESTER NATIONAL MUNICIPALS
STATEMENT OF INVESTMENTS Continued
| | | | | | | | | | | | | | | | | |
| Principal | | | | | | | | | | | | |
| Amount | | | | | Coupon | | | Maturity | | | Value | |
| |
| Oregon—0.2% | | | | | | | | | | | | |
| $ | 20,000 | | | Lane County, OR Hsg. Authority & Community Services (Firewood)2 | | | 6.600 | % | | | 11/01/2015 | | | $ | 18,823 | |
| | 1,095,000 | | | OR Economic Devel. (Georgia-Pacific Corp.)2 | | | 5.700 | | | | 12/01/2025 | | | | 817,001 | |
| | 2,325,000 | | | OR Economic Devel. (Georgia-Pacific Corp.)2 | | | 6.350 | | | | 08/01/2025 | | | | 1,852,839 | |
| | 10,000 | | | OR GO (Elderly & Disabled Hsg.)2 | | | 5.250 | | | | 08/01/2031 | | | | 9,659 | |
| | 8,270,000 | | | OR Solid Waste Disposal (USG Corp.)2 | | | 6.400 | | | | 12/01/2029 | | | | 5,687,362 | |
| | 50,000 | | | Port Astoria, OR Pollution Control (James River)2 | | | 6.550 | | | | 02/01/2015 | | | | 45,838 | |
| | 3,655,000 | | | Port of St. Helen’s, OR Pollution Control (Boise Cascade Corp.)2 | | | 5.650 | | | | 12/01/2027 | | | | 1,766,535 | |
| | 1,150,000 | | | Western Generation, OR Agency Cogeneration (Wauna Cogeneration)2 | | | 5.000 | | | | 01/01/2021 | | | | 910,547 | |
| | | | | | | | | | | | | | | | |
| | | | | | | | | | | | | | | | 11,108,604 | |
| | | | | | | | | | | | | | | | | |
| Pennsylvania—3.3% | | | | | | | | | | | | |
| | 1,250,000 | | | Allegheny County, PA HDA (The Covenant at South Hills)3 | | | 8.750 | | | | 02/01/2031 | | | | 91,663 | |
| | 54,250,000 | | | Allegheny County, PA HDA (West Penn Allegheny Health System)2 | | | 5.375 | | | | 11/15/2040 | | | | 32,695,933 | |
| | 10,000,000 | | | Allegheny County, PA HDA (WPAHS/AG/Forbes Health System/WPH/WPAON Obligated Group)2 | | | 5.000 | | | | 11/15/2028 | | | | 6,417,100 | |
| | 35,000 | | | Chester Guaranteed Host Community, Series B2 | | | 5.800 | | | | 12/01/2013 | | | | 32,872 | |
| | 10,000 | | | Erie County, PA IDA (International Paper Company)2 | | | 5.850 | | | | 12/01/2020 | | | | 9,048 | |
| | 42,230,000 | | | Lehigh County, PA GPA (St. Lukes Hospital Bethlehem)2 | | | 1.512 | 6 | | | 08/15/2033 | | | | 20,924,965 | |
| | 24,000,000 | | | Lehigh County, PA GPA (St. Lukes Hospital Bethlehem)2 | | | 1.612 | 6 | | | 08/15/2042 | | | | 12,720,000 | |
| | 25,000,000 | | | PA EDFA (Bionol Clearfield)2 | | | 8.500 | | | | 07/15/2015 | | | | 20,704,500 | |
| | 5,000,000 | | | PA EDFA (National Gypsum Company)2 | | | 6.250 | | | | 11/01/2027 | | | | 2,822,100 | |
| | 5,000,000 | | | PA EDFA (Northampton Generating)2 | | | 6.500 | | | | 01/01/2013 | | | | 3,661,850 | |
| | 5,000,000 | | | PA EDFA (Northampton Generating)2 | | | 6.600 | | | | 01/01/2019 | | | | 3,781,950 | |
| | 1,905,000 | | | PA EDFA (Reliant Energy)2 | | | 6.750 | | | | 12/01/2036 | | | | 1,784,204 | |
| | 14,200,000 | | | PA EDFA (Reliant Energy)2 | | | 6.750 | | | | 12/01/2036 | | | | 13,299,578 | |
| | 8,865,000 | | | PA EDFA (Reliant Energy)2 | | | 6.750 | | | | 12/01/2036 | | | | 8,302,870 | |
| | 9,100,000 | | | PA EDFA (Reliant Energy)2 | | | 6.750 | | | | 12/01/2036 | | | | 8,522,969 | |
| | 11,470,000 | | | PA EDFA (USG Corp.)2 | | | 6.000 | | | | 06/01/2031 | | | | 7,422,925 | |
| | 11,500,000 | | | PA Geisinger Authority Health System, Series A1 | | | 5.250 | | | | 06/01/2039 | | | | 11,422,663 | |
| | 100,000 | | | Philadelphia, PA H&HEFA (Temple University Hospital)2 | | | 6.625 | | | | 11/15/2023 | | | | 98,672 | |
| | 10,000,000 | | | Sayre, PA Health Care Facilities Authority (Guthrie Healthcare System)2 | | | 1.227 | 6 | | | 12/01/2024 | | | | 5,757,500 | |
| | | | | | | | | | | | | | | | |
| | | | | | | | | | | | | | | | 160,473,362 | |
| | | | | | | | | | | | | | | | | |
| Rhode Island—2.5% | | | | | | | | | | | | |
| | 45,000,000 | | | Central Falls, RI Detention Facility2 | | | 7.250 | | | | 07/15/2035 | | | | 31,500,450 | |
| | 45,000 | | | RI Health & Educational Building Corp. (Roger Williams General Hospital)2 | | | 5.500 | | | | 07/01/2018 | | | | 43,043 | |
F36 | OPPENHEIMER ROCHESTER NATIONAL MUNICIPALS
| | | | | | | | | | | | | | | | | |
| Principal | | | | | | | | | | | | |
| Amount | | | | | Coupon | | | Maturity | | | Value | |
| |
| Rhode Island Continued |
| $ | 11,500,000 | | | RI Hsg. & Mtg. Finance Corp.1 | | | 5.000 | % | | | 10/01/2048 | | | $ | 9,273,434 | |
| | 12,835,000 | | | RI Hsg. & Mtg. Finance Corp. (Homeownership Opportunity)1 | | | 5.200 | | | | 10/01/2047 | | | | 11,754,450 | |
| | 52,090,000 | | | RI Tobacco Settlement Financing Corp. (TASC) | | | 6.125 | 5 | | | 06/01/2052 | | | | 537,048 | |
| | 32,675,000 | | | RI Tobacco Settlement Financing Corp. (TASC)2 | | | 6.250 | | | | 06/01/2042 | | | | 25,318,224 | |
| | 1,839,245,000 | | | RI Tobacco Settlement Financing Corp. (TASC) | | | 7.054 | 5 | | | 06/01/2052 | | | | 22,310,042 | |
| | 42,825,000 | | | RI Tobacco Settlement Financing Corp. (TASC) | | | 7.868 | 5 | | | 06/01/2052 | | | | 299,347 | |
| | 25,605,000 | | | RI Tobacco Settlement Financing Corp. (TASC), Series A2 | | | 6.125 | | | | 06/01/2032 | | | | 21,273,658 | |
| | | | | | | | | | | | | | | | |
| | | | | | | | | | | | | | | | 122,309,696 | |
| | | | | | | | | | | | | | | | | |
| South Carolina—0.6% |
| | 1,375,000 | | | Allendale County, SC School District Energy Savings Special Obligation2 | | | 8.500 | | | | 12/01/2018 | | | | 1,376,760 | |
| | 15,000 | | | Georgetown County, SC Environmental Improvement (International Paper Company)2 | | | 6.250 | | | | 09/01/2023 | | | | 13,683 | |
| | 7,285,000 | | | Hardeeville, SC Assessment Revenue (Anderson Tract Municipal Improvement District)2 | | | 7.750 | | | | 11/01/2039 | | | | 5,587,449 | |
| | 5,000 | | | Horry County, SC Airport2 | | | 5.600 | | | | 07/01/2017 | | | | 5,003 | |
| | 5,220,000 | | | Lancaster County, SC (Edenmoor Improvement District)2 | | | 5.750 | | | | 12/01/2037 | | | | 2,617,099 | |
| | 1,000,000 | | | Myrtle Beach, SC Tax Increment (Myrtle Beach Air Force Base)2 | | | 5.250 | | | | 11/01/2026 | | | | 643,730 | |
| | 2,000,000 | | | Myrtle Beach, SC Tax Increment (Myrtle Beach Air Force Base)2 | | | 5.300 | | | | 11/01/2035 | | | | 1,136,580 | |
| | 16,963,000 | | | Richland County, SC Assessment Revenue (Village at Sandhill Improvement District)2 | | | 6.200 | | | | 11/01/2036 | | | | 10,776,255 | |
| | 500,000 | | | Richland County, SC Environmental Improvement2 | | | 5.950 | | | | 09/01/2031 | | | | 400,820 | |
| | 200,000 | | | SC Connector 2000 Assoc. Toll Road, Series B | | | 6.300 | 5 | | | 01/01/2026 | | | | 35,488 | |
| | 7,620,000 | | | SC Connector 2000 Assoc. Toll Road, Series B | | | 6.453 | 5 | | | 01/01/2020 | | | | 2,151,812 | |
| | 8,500,000 | | | SC Connector 2000 Assoc. Toll Road, Series B | | | 6.621 | 5 | | | 01/01/2024 | | | | 1,692,180 | |
| | 50,000 | | | SC Jobs-EDA (JDAM/LH/Franke Home/LS Obligated Group)2 | | | 5.650 | | | | 05/01/2018 | | | | 43,624 | |
| | 500,000 | | | SC Jobs-EDA (Lutheran Homes)2 | | | 5.625 | | | | 05/01/2042 | | | | 334,835 | |
| | 5,035,000 | | | York County, SC (Hoechst Celanese Corp.)2 | | | 5.700 | | | | 01/01/2024 | | | | 3,593,580 | |
| | 790,000 | | | York County, SC Pollution Control (Bowater)3,7 | | | 7.400 | | | | 01/01/2010 | | | | 79,000 | |
| | | | | | | | | | | | | | | | |
| | | | | | | | | | | | | | | | 30,487,898 | |
| | | | | | | | | | | | | | | | | |
| South Dakota—0.8% |
| | 19,000,000 | | | Brown County, SD Solid Waste Facilities (Heartland Grain Fuels)3 | | | 8.250 | | | | 01/01/2018 | | | | 4,814,600 | |
| | 1,000,000 | | | Lower Brule, SD Sioux Tribe, Series B2 | | | 5.500 | | | | 05/01/2019 | | | | 799,520 | |
| | 33,445,000 | | | SD Educational Enhancement Funding Corp. Tobacco Settlement2 | | | 6.500 | | | | 06/01/2032 | | | | 28,301,159 | |
F37 | OPPENHEIMER ROCHESTER NATIONAL MUNICIPALS
STATEMENT OF INVESTMENTS Continued
| | | | | | | | | | | | | | | | | |
| Principal | | | | | | | | | | | | |
| Amount | | | | | Coupon | | | Maturity | | | Value | |
| |
| South Dakota Continued |
| $ | 4,999,161 | | | Sioux Falls, SD Economic Devel. (City Centre Hotel)2 | | | 7.000 | %6 | | | 11/01/2016 | | | $ | 4,999,311 | |
| | 1,425,000 | | | Turner County, SD Tax Increment2 | | | 5.000 | | | | 12/15/2026 | | | | 985,687 | |
| | | | | | | | | | | | | | | | |
| | | | | | | | | | | | | | | | 39,900,277 | |
| | | | | | | | | | | | | | | | | |
| Tennessee—0.8% |
| | 45,000 | | | Blount County, TN H&EFB (Asbury)2 | | | 4.750 | | | | 04/01/2012 | | | | 43,726 | |
| | 4,850,000 | | | Blount County, TN H&EFB (Asbury)2 | | | 5.125 | | | | 04/01/2023 | | | | 3,519,694 | |
| | 845,000 | | | Chattanooga, TN HE&HFB (Campus Devel. Foundation Phase I)2 | | | 5.500 | | | | 10/01/2020 | | | | 702,034 | |
| | 21,710,000 | | | Maury County, TN Industrial Devel. Board (General Motors Corp.)3 | | | 6.500 | | | | 09/01/2024 | | | | 8,792,550 | |
| | 15,480,000 | | | McMinn County, TN Industrial Devel. Board Pollution Control (Calhoun Newsprint)3,7 | | | 7.625 | | | | 03/01/2016 | | | | 1,548,000 | |
| | 19,575,000 | | | McMinn County, TN Industrial Devel. Board Solid Waste (Calhoun Newsprint)3,7 | | | 7.400 | | | | 12/01/2022 | | | | 1,957,500 | |
| | 1,840,000 | | | Memphis, TN HE&HFB (NH/Mendenhall Hsg./Highland Hsg./NTH/VH Obligated Group)7 | | | 1.760 | 6 | | | 04/01/2042 | | | | 1,417,352 | |
| | 9,080,000 | | | Memphis, TN HE&HFB (NH/Mendenhall Hsg./Highland Hsg./NTH/VH Obligated Group)2 | | | 5.750 | | | | 04/01/2042 | | | | 5,478,327 | |
| | 215,000 | | | Memphis-Shelby County, TN Airport Authority (Express Airlines)2 | | | 6.125 | | | | 12/01/2016 | | | | 175,141 | |
| | 7,870,000 | | | Metropolitan Knoxville, TN Airport Authority (Northwest Airlines)2 | | | 8.000 | | | | 04/01/2032 | | | | 6,640,863 | |
| | 515,000 | | | Shelby County, TN HE&HF (Lapaloma Apartments)2 | | | 7.750 | | | | 12/01/2029 | | | | 397,194 | |
| | 10,000,000 | | | TN Energy Acquisition Corp., Series B2 | | | 5.625 | | | | 09/01/2026 | | | | 7,915,200 | |
| | | | | | | | | | | | | | | | |
| | | | | | | | | | | | | | | | 38,587,581 | |
| | | | | | | | | | | | | | | | | |
| Texas—27.5% |
| | 20,000 | | | Abilene, TX HFDC (Hendrick Medical Center)2 | | | 6.000 | | | | 09/01/2013 | | | | 20,021 | |
| | 45,625,000 | | | Alliance Airport Authority, TX (American Airlines) | | | 5.250 | | | | 12/01/2029 | | | | 15,603,750 | |
| | 93,500,000 | | | Alliance Airport Authority, TX (American Airlines) | | | 5.750 | | | | 12/01/2029 | | | | 32,906,390 | |
| | 305,000 | | | Alliance Airport Authority, TX (American Airlines) | | | 7.000 | | | | 12/01/2011 | | | | 171,477 | |
| | 230,000 | | | Beaumont, TX Multifamily HDC (Madison on the Lake Apartments)2 | | | 7.750 | | | | 12/01/2028 | | | | 197,869 | |
| | 305,000 | | | Bexar County, TX HFC (American Opportunity Hsg.)2 | | | 7.500 | | | | 01/01/2013 | | | | 285,919 | |
| | 980,000 | | | Bexar County, TX HFC (American Opportunity Hsg.)2 | | | 8.000 | | | | 01/01/2031 | | | | 759,765 | |
| | 1,130,000 | | | Bexar County, TX HFC (American Opportunity Hsg.-Nob Hill Apartments)3,4 | | | 8.500 | | | | 06/01/2031 | | | | 568,503 | |
| | 995,000 | | | Bexar County, TX HFC (Doral Club)2 | | | 8.750 | | | | 10/01/2036 | | | | 735,992 | |
| | 200,000 | | | Bexar County, TX HFC (Honey Creek LLC)2 | | | 8.000 | | | | 04/01/2030 | | | | 134,830 | |
| | 100,000 | | | Bexar County, TX HFC (Honey Creek LLC) | | | 9.000 | | | | 04/01/2030 | | | | 70,155 | |
| | 1,460,000 | | | Bexar County, TX HFC (Perrin Square)3 | | | 9.750 | | | | 11/20/2031 | | | | 1,224,546 | |
F38 | OPPENHEIMER ROCHESTER NATIONAL MUNICIPALS
| | | | | | | | | | | | | | | | | |
| Principal | | | | | | | | | | | | |
| Amount | | | | | Coupon | | | Maturity | | | Value | |
| |
| Texas Continued |
| $ | 41,315,000 | | | Brazos River Authority, TX Pollution Control (TXU Energy Company) | | | 5.000 | % | | | 03/01/2041 | | | $ | 16,419,820 | |
| | 13,500,000 | | | Brazos River Authority, TX Pollution Control (TXU Energy Company) | | | 5.400 | | | | 05/01/2029 | | | | 5,430,645 | |
| | 2,345,000 | | | Brazos River Authority, TX Pollution Control (TXU Energy Company) | | | 6.300 | | | | 07/01/2032 | | | | 1,013,673 | |
| | 14,080,000 | | | Brazos River Authority, TX Pollution Control (TXU Energy Company) | | | 6.750 | | | | 04/01/2038 | | | | 9,527,373 | |
| | 11,420,000 | | | Brazos River Authority, TX Pollution Control (TXU Energy Company) | | | 6.750 | | | | 10/01/2038 | | | | 5,223,965 | |
| | 10,000,000 | | | Brazos River Authority, TX Pollution Control (TXU Energy Company) | | | 7.700 | | | | 03/01/2032 | | | | 4,722,300 | |
| | 28,120,000 | | | Brazos River Authority, TX Pollution Control (TXU Energy Company) | | | 7.700 | | | | 04/01/2033 | | | | 13,278,826 | |
| | 17,065,000 | | | Cambridge, TX Student Hsg. (Cambridge Student Hsg. Devel.)2 | | | 7.000 | | | | 11/01/2039 | | | | 13,426,059 | |
| | 190,000 | | | Cass County, TX IDC (International Paper Company)2 | | | 6.600 | | | | 03/15/2024 | | | | 177,612 | |
| | 45,125,000 | | | Dallas, TX Area Rapid Transit1 | | | 5.250 | | | | 12/01/2048 | | | | 45,563,291 | |
| | 10,000,000 | | | Dallas-Fort Worth, TX International Airport1 | | | 5.000 | | | | 11/01/2035 | | | | 8,510,600 | |
| | 20,000 | | | Dallas-Fort Worth, TX International Airport2 | | | 5.750 | | | | 11/01/2030 | | | | 19,997 | |
| | 32,500,000 | | | Dallas-Fort Worth, TX International Airport (American Airlines/AMR Corp. Obligated Group) | | | 5.500 | | | | 11/01/2030 | | | | 11,441,300 | |
| | 320,000 | | | Dallas-Fort Worth, TX International Airport Facility (American Airlines) | | | 6.000 | | | | 11/01/2014 | | | | 154,275 | |
| | 63,880,000 | | | Dallas-Fort Worth, TX International Airport Facility (American Airlines) | | | 6.375 | | | | 05/01/2035 | | | | 23,757,611 | |
| | 305,000 | | | Dallas-Fort Worth, TX International Airport Facility (American Airlines) | | | 8.250 | | | | 11/01/2036 | | | | 128,673 | |
| | 22,100,000 | | | Dallas-Fort Worth, TX International Airport Facility Improvement Corp. | | | 9.000 | | | | 05/01/2029 | | | | 10,871,432 | |
| | 45,945,000 | | | Dallas-Fort Worth, TX International Airport Facility Improvement Corp. | | | 9.125 | | | | 05/01/2029 | | | | 21,228,887 | |
| | 2,115,000 | | | Danbury, TX Higher Education Finance Corp. (Island Foundation)2 | | | 6.250 | | | | 02/15/2036 | | | | 1,550,105 | |
| | 450,000 | | | Decatur, TX Hospital Authority (Wise Regional Health System)2 | | | 5.625 | | | | 09/01/2013 | | | | 448,632 | |
| | 22,950,000 | | | Donna, TX GO2 | | | 6.250 | | | | 02/15/2037 | | | | 16,382,858 | |
| | 61 | | | El Paso, TX HFC (Single Family)2 | | | 6.180 | | | | 04/01/2033 | | | | 64 | |
| | 55,000 | | | Gainesville, TX Hsg. Authority2 | | | 6.800 | | | | 12/01/2020 | | | | 49,158 | |
| | 25,000 | | | Galveston County, TX HFC (Friendswood)2 | | | 6.200 | | | | 10/01/2021 | | | | 25,022 | |
| | 1,000,000 | | | Grapevine, TX IDC (Air Cargo)2 | | | 6.500 | | | | 01/01/2024 | | | | 809,520 | |
F39 | OPPENHEIMER ROCHESTER NATIONAL MUNICIPALS
STATEMENT OF INVESTMENTS Continued
| | | | | | | | | | | | | | | | | |
| Principal | | | | | | | | | | | | |
| Amount | | | | | Coupon | | | Maturity | | | Value | |
| |
| Texas Continued |
| $ | 31,000,000 | | | Gulf Coast, TX IDA (Microgy Holdings) | | | 7.000 | % | | | 12/01/2036 | | | $ | 13,684,330 | |
| | 70,000 | | | Gulf Coast, TX Waste Disposal Authority (FMC Corp.)2 | | | 7.050 | | | | 10/01/2009 | | | | 70,044 | |
| | 150,000 | | | Gulf Coast, TX Waste Disposal Authority (Valero Energy Corp.)2 | | | 5.700 | | | | 04/01/2032 | | | | 127,758 | |
| | 5,440,000 | | | Harris County, TX IDC (Continental Airlines)2 | | | 5.375 | | | | 07/01/2019 | | | | 3,904,070 | |
| | 1,750,000 | | | HFDC of Central TX (Legacy at Willow Bend Retirement Community)2 | | | 5.625 | | | | 11/01/2026 | | | | 1,270,850 | |
| | 2,750,000 | | | HFDC of Central TX (Legacy at Willow Bend Retirement Community)2 | | | 5.750 | | | | 11/01/2036 | | | | 1,844,480 | |
| | 2,000,000 | | | HFDC of Central TX (Lutheran Social Services of the South)2 | | | 6.875 | | | | 02/15/2032 | | | | 1,607,140 | |
| | 4,000,000 | | | HFDC of Central TX (Villa De San Antonio) | | | 6.250 | | | | 05/15/2036 | | | | 2,464,400 | |
| | 7,940,000 | | | Houston, TX Airport Special Facilities (Continental Airlines)2 | | | 5.700 | | | | 07/15/2029 | | | | 5,055,954 | |
| | 7,290,000 | | | Houston, TX Airport Special Facilities (Continental Airlines)2 | | | 5.700 | | | | 07/15/2029 | | | | 4,642,053 | |
| | 18,840,000 | | | Houston, TX Airport Special Facilities (Continental Airlines)2 | | | 6.125 | | | | 07/15/2017 | | | | 14,976,670 | |
| | 18,735,000 | | | Houston, TX Airport Special Facilities (Continental Airlines)2 | | | 6.125 | | | | 07/15/2027 | | | | 12,838,346 | |
| | 20,245,000 | | | Houston, TX Airport Special Facilities (Continental Airlines)2 | | | 6.125 | | | | 07/15/2027 | | | | 13,873,089 | |
| | 65,165,000 | | | Houston, TX Airport Special Facilities (Continental Airlines)2 | | | 6.750 | | | | 07/01/2029 | | | | 48,502,961 | |
| | 100,000 | | | Houston, TX Airport Special Facilities (Continental Airlines)2 | | | 7.000 | | | | 07/01/2029 | | | | 75,597 | |
| | 3,520,000 | | | Houston, TX Airport Special Facilities (Continental Airlines)2 | | | 7.375 | | | | 07/01/2022 | | | | 2,899,459 | |
| | 8,860,000 | | | Houston, TX HFC (Hometowne on Bellfort)1 | | | 5.250 | | | | 12/01/2040 | | | | 8,372,317 | |
| | 470,000 | | | Houston, TX IDC (Air Cargo)2 | | | 6.375 | | | | 01/01/2023 | | | | 379,168 | |
| | 10,000,000 | | | La Vernia, TX Higher Education Finance Corp.2 | | | 7.125 | | | | 02/15/2038 | | | | 8,838,600 | |
| | 1,840,000 | | | Lubbock, TX HFC (Las Colinas Quail Creek Apartments)2 | | | 6.000 | | | | 07/01/2032 | | | | 1,236,480 | |
| | 15,000 | | | Lubbock, TX HFC, Series A2 | | | 6.150 | | | | 10/01/2030 | | | | 15,611 | |
| | 575,000 | | | Matagorda County, TX Navigation District (Reliant Energy)2 | | | 5.950 | | | | 05/01/2030 | | | | 482,672 | |
| | 690,000 | | | Midlothian, TX Devel. Authority Tax Increment2 | | | 5.125 | | | | 11/15/2026 | | | | 482,834 | |
| | 38,000,000 | | | North Central TX HFDC (Children’s Medical Center)1 | | | 5.750 | | | | 08/15/2039 | | | | 38,345,420 | |
| | 100,000 | | | Northwest Harris County, TX Municipal Utility District (Waterworks & Sewer)2 | | | 6.100 | | | | 04/01/2012 | | | | 100,023 | |
| | 6,120,000 | | | Port of Bay City, TX (Hoechst Celanese Corp.)2 | | | 6.500 | | | | 05/01/2026 | | | | 4,584,186 | |
F40 | OPPENHEIMER ROCHESTER NATIONAL MUNICIPALS
| | | | | | | | | | | | | | | | | |
| Principal | | | | | | | | | | | | |
| Amount | | | | | Coupon | | | Maturity | | | Value | |
| |
| Texas Continued |
| $ | 15,000,000 | | | Port of Corpus Christi, TX Authority (CNA Holdings)2 | | | 6.700 | % | | | 11/01/2030 | | | $ | 11,164,200 | |
| | 5,711,433 | | | Sabine Neches, TX HFC (Single Family Mtg.)1 | | | 4.875 | | | | 12/01/2039 | | | | 5,623,023 | |
| | 4,100,000 | | | Sabine, TX River Authority Pollution Control (TXU Electric Company) | | | 6.150 | | | | 08/01/2022 | | | | 1,833,684 | |
| | 1,800,000 | | | Sabine, TX River Authority Pollution Control (TXU Electric Company) | | | 6.450 | | | | 06/01/2021 | | | | 840,852 | |
| | 25,000 | | | San Antonio, TX HFC (La Risa Apartments) | | | 8.250 | | | | 01/01/2026 | | | | 20,306 | |
| | 10,500 | | | San Antonio, TX HFC (Point East Section 8)3,4,7 | | | 7.500 | | | | 08/01/2023 | | | | 1 | |
| | 6,800,000 | | | San Jacinto, TX Community College District1 | | | 5.000 | | | | 02/15/2033 | | | | 6,811,594 | |
| | 10,000,000 | | | San Jacinto, TX Community College District1 | | | 5.125 | | | | 02/15/2038 | | | | 10,044,450 | |
| | 3,600,000 | | | Southeast TX HFC (Forest View Apartments) | | | 6.750 | | | | 07/01/2037 | | | | 1,806,696 | |
| | 6,030,000 | | | Springhill, TX Courtland Heights Public Facility Corp.2 | | | 5.850 | | | | 12/01/2028 | | | | 3,587,729 | |
| | 14,000,000 | | | Tarrant County, TX Cultural Education Facilities Finance Corp. (Baylor Health Care System)1 | | | 5.750 | | | | 11/15/2024 | | | | 14,129,080 | |
| | 34,000,000 | | | Tarrant County, TX Cultural Education Facilities Finance Corp. (Baylor Health Care System)1 | | | 6.250 | | | | 11/15/2029 | | | | 35,034,280 | |
| | 4,250,000 | | | Tarrant County, TX Cultural Education Facilities Finance Corp. (Buckingham Senior Living Community)2 | | | 5.750 | | | | 11/15/2037 | | | | 3,185,928 | |
| | 1,600,000 | | | Travis County, TX HFDC (Querencia Barton Creek)2 | | | 5.650 | | | | 11/15/2035 | | | | 1,059,040 | |
| | 2,495,000 | | | Trinity, TX River Authority (TXU Energy Company) | | | 6.250 | | | | 05/01/2028 | | | | 1,028,115 | |
| | 20,500,000 | | | Trophy Club, TX Public Improvement (Highlands Trophy Club)2 | | | 7.750 | | | | 10/01/2037 | | | | 16,497,170 | |
| | 2,320,000 | | | TX Affordable Hsg. Corp. (American Hsg. Foundation)3,4 | | | 8.000 | | | | 03/01/2032 | | | | 233,624 | |
| | 6,170,000 | | | TX Affordable Hsg. Corp. (South Texas Affordable Properties Corp.)3 | | | 8.000 | | | | 03/01/2032 | | | | 3,107,212 | |
| | 36,000,000 | | | TX Angelina & Neches River Authority (Aspen Power)2 | | | 6.500 | | | | 11/01/2029 | | | | 21,195,720 | |
| | 45,000 | | | TX Angelina & Neches River Authority Solid Waste (Champion International Corp.)2 | | | 6.300 | | | | 04/01/2018 | | | | 43,055 | |
| | 250,000 | | | TX Angelina & Neches River Authority Waste Disposal (Temple-Inland)2 | | | 6.950 | | | | 05/01/2023 | | | | 222,865 | |
| | 15,000 | | | TX Dept. of Hsg. & Community Affairs2 | | | 5.350 | | | | 07/01/2033 | | | | 13,893 | |
| | 155,000 | | | TX Dept. of Hsg. & Community Affairs (Sugar Creek Apartments)2 | | | 6.000 | | | | 01/01/2042 | | | | 161,684 | |
| | 6,750,000 | | | TX Dept. of Hsg. & Community Affairs (Summit Point Apartments)1 | | | 5.250 | | | | 06/20/2047 | | | | 6,592,455 | |
| | 38,380,000 | | | TX Multifamily Housing Options (Affordable Hsg.) | | | 0.600 | 6 | | | 01/01/2039 | | | | 14,177,572 | |
| | 1,480,000 | | | TX Multifamily Hsg. Revenue Bond Pass-Through Certificates (Skyway Villas)2 | | | 5.950 | | | | 11/01/2034 | | | | 1,385,828 | |
| | 5,960,000 | | | TX Municipal Gas Acquisition & Supply Corp.2 | | | 1.872 | 6 | | | 12/15/2026 | | | | 3,861,782 | |
| | 259,560,000 | | | TX Municipal Gas Acquisition & Supply Corp.1 | | | 5.625 | | | | 12/15/2017 | | | | 246,962,913 | |
| | 481,755,000 | | | TX Municipal Gas Acquisition & Supply Corp.1 | | | 6.250 | | | | 12/15/2026 | | | | 465,883,816 | |
F41 | OPPENHEIMER ROCHESTER NATIONAL MUNICIPALS
STATEMENT OF INVESTMENTS Continued
| | | | | | | | | | | | | | | | | |
| Principal | | | | | | | | | | | | |
| Amount | | | | | Coupon | | | Maturity | | | Value | |
| |
| Texas Continued | | | | | | | | | | | | |
| $ | 4,360,000 | | | TX Panhandle HFA (Amarillo Affordable Hsg.)3 | | | 6.750 | % | | | 03/01/2031 | | | $ | 2,183,139 | |
| | 3,075,000 | | | TX Public Finance Authority Charter School Finance Corp. (Cosmos Foundation)2 | | | 5.375 | | | | 02/15/2037 | | | | 2,132,605 | |
| | 1,600,000 | | | TX Public Finance Authority Charter School Finance Corp.
(Ed-Burnham Wood)2 | | | 6.250 | | | | 09/01/2036 | | | | 1,176,736 | |
| | 25,000 | | | TX Student Hsg. Corp. (University of North Texas)2 | | | 6.000 | | | | 07/01/2011 | | | | 24,098 | |
| | 635,000 | | | TX Student Hsg. Corp. (University of North Texas)2 | | | 6.750 | | | | 07/01/2021 | | | | 510,197 | |
| | 200,000 | | | TX Student Hsg. Corp. (University of North Texas)2 | | | 6.850 | | | | 07/01/2031 | | | | 145,842 | |
| | 2,115,000 | | | Vintage Township, TX Public Facilities Corp.2 | | | 7.375 | | | | 10/01/2038 | | | | 1,670,194 | |
| | 1,279,000 | | | Vintage Township, TX Public Facilities Corp.2 | | | 7.375 | | | | 10/01/2038 | | | | 1,010,014 | |
| | | | | | | | | | | | | | | | |
| | | | | | | | | | | | | | | | 1,338,876,819 | |
| | | | | | | | | | | | | | | | | |
| U.S. Possessions—0.6% | | | | | | | | | | | | |
| | 700,000 | | | Northern Mariana Islands Commonwealth, Series A2 | | | 6.750 | | | | 10/01/2033 | | | | 632,667 | |
| | 11,000,000 | | | Puerto Rico Sales Tax Financing Corp., Series A1 | | | 5.250 | | | | 08/01/2057 | | | | 10,699,941 | |
| | 17,000,000 | | | Puerto Rico Sales Tax Financing Corp., Series C1 | | | 5.750 | | | | 08/01/2057 | | | | 17,428,825 | |
| | | | | | | | | | | | | | | | |
| | | | | | | | | | | | | | | | 28,761,433 | |
| | | | | | | | | | | | | | | | | |
| Utah—0.1% | | | | | | | | | | | | |
| | 85,000 | | | Emery County, UT Pollution Control (Pacificorp)2 | | | 5.625 | | | | 11/01/2023 | | | | 85,134 | |
| | 1,780,000 | | | UT HFA (RHA Community Service of Utah)2 | | | 6.875 | | | | 07/01/2027 | | | | 1,428,308 | |
| | 1,315,000 | | | Utah County, UT Charter School (Lincoln Academy)2 | | | 5.875 | | | | 06/15/2037 | | | | 939,620 | |
| | 825,000 | | | Utah County, UT Charter School (Renaissance Academy)2 | | | 5.625 | | | | 07/15/2037 | | | | 574,126 | |
| | 4,425,000 | | | West Valley City, UT Sewer (East Hollywood High School)2 | | | 5.625 | | | | 06/15/2037 | | | | 2,977,715 | |
| | | | | | | | | | | | | | | | |
| | | | | | | | | | | | | | | | 6,004,903 | |
| | | | | | | | | | | | | | | | | |
| Vermont—0.1% | | | | | | | | | | | | |
| | 2,000,000 | | | VT EDA (Wake Robin Corp.)2 | | | 5.375 | | | | 05/01/2036 | | | | 1,471,440 | |
| | 10,000 | | | VT EDA (Wake Robin Corp.)2 | | | 6.000 | | | | 03/01/2022 | | | | 9,231 | |
| | 2,604,663 | | | VT Educational & Health Buildings Financing Agency (Marlboro College)2 | | | 2.779 | | | | 04/01/2019 | | | | 1,804,537 | |
| | | | | | | | | | | | | | | | |
| | | | | | | | | | | | | | | | 3,285,208 | |
| | | | | | | | | | | | | | | | | |
| Virginia—1.7% | | | | | | | | | | | | |
| | 570,000 | | | Bedford County, VA IDA (Georgia-Pacific Corp.)2 | | | 5.600 | | | | 12/01/2025 | | | | 415,581 | |
| | 595,000 | | | Bedford County, VA IDA (Georgia-Pacific Corp.)2 | | | 6.300 | | | | 12/01/2025 | | | | 469,705 | |
| | 2,535,000 | | | Bedford County, VA IDA (Georgia-Pacific Corp.)2 | | | 6.550 | | | | 12/01/2025 | | | | 2,045,796 | |
| | 14,857,000 | | | Farms New Kent, VA Community Devel. Authority Special Assessment2 | | | 5.125 | | | | 03/01/2036 | | | | 8,087,259 | |
| | 9,200,000 | | | Farms New Kent, VA Community Devel. Authority Special Assessment2 | | | 5.450 | | | | 03/01/2036 | | | | 5,232,316 | |
F42 | OPPENHEIMER ROCHESTER NATIONAL MUNICIPALS
| | | | | | | | | | | | | | | | | |
| Principal | | | | | | | | | | | | |
| Amount | | | | | Coupon | | | Maturity | | | Value | |
| |
| Virginia Continued | | | | | | | | | | | | |
| $ | 3,206,000 | | | Farms New Kent, VA Community Devel. Authority Special Assessment2 | | | 5.800 | % | | | 03/01/2036 | | | $ | 1,888,013 | |
| | 475,000 | | | Giles County, VA IDA (Hoechst Celanese Corp.)2 | | | 5.950 | | | | 12/01/2025 | | | | 335,645 | |
| | 10,000,000 | | | Giles County, VA IDA (Hoechst Celanese Corp.)2 | | | 6.450 | | | | 05/01/2026 | | | | 7,449,100 | |
| | 7,930,000 | | | Giles County, VA IDA (Hoechst Celanese Corp.)2 | | | 6.625 | | | | 12/01/2022 | | | | 6,212,441 | |
| | 235,000 | | | Goochland County, VA IDA (Georgia-Pacific Corp.)2 | | | 5.650 | | | | 12/01/2025 | | | | 172,676 | |
| | 4,000,000 | | | Lewistown, VA Commerce Center Community Devel. Authority2 | | | 6.050 | | | | 03/01/2027 | | | | 2,618,400 | |
| | 3,000,000 | | | New Port, VA CDA2 | | | 5.600 | | | | 09/01/2036 | | | | 1,557,000 | |
| | 2,050,000 | | | Norfolk, VA EDA, Series A2 | | | 6.000 | | | | 11/01/2036 | | | | 1,236,437 | |
| | 1,085,000 | | | Norfolk, VA Redevel. & Hsg. Authority (First Mtg.-Retirement Community)2 | | | 6.125 | | | | 01/01/2035 | | | | 779,008 | |
| | 10,425,000 | | | Peninsula, VA Town Center Community Devel. Authority Special Obligation2 | | | 6.450 | | | | 09/01/2037 | | | | 7,628,598 | |
| | 24,550,000 | | | Richmond, VA Public Utility1 | | | 5.000 | | | | 01/15/2040 | | | | 24,752,129 | |
| | 5,300,000 | | | VA Celebrate South CDA Special Assessment2 | | | 6.250 | | | | 03/01/2037 | | | | 3,417,599 | |
| | 3,400,000 | | | VA H2O Community Devel. Authority2 | | | 5.200 | | | | 09/01/2037 | | | | 1,800,640 | |
| | 228,700,000 | | | VA Tobacco Settlement Authority | | | 7.075 | 5 | | | 06/01/2047 | | | | 5,342,432 | |
| | 2,500,000 | | | West Point, VA IDA Solid Waste (Chesapeake Corp.)3,7 | | | 6.375 | | | | 03/01/2019 | | | | 62,500 | |
| | | | | | | | | | | | | | | | |
| | | | | | | | | | | | | | | | 81,503,275 | |
| | | | | | | | | | | | | | | | | |
| Washington—3.5% | | | | | | | | | | | | |
| | 11,480,000 | | | Chelan County, WA Public Utility District No. 001 (Chelan Hydropower)1 | | | 5.600 | | | | 01/01/2036 | | | | 10,589,056 | |
| | 25,000 | | | King County, WA Hsg. Authority (Cascadian Apartments)2 | | | 6.800 | | | | 07/01/2019 | | | | 25,130 | |
| | 15,000 | | | King County, WA Hsg. Authority (Kona Village)2 | | | 6.700 | | | | 01/01/2020 | | | | 13,686 | |
| | 125,000 | | | King County, WA Hsg. Authority (Southwood Square Apartments)2 | | | 6.100 | | | | 10/01/2021 | | | | 105,480 | |
| | 725,000 | | | King County, WA Hsg. Authority (Southwood Square Apartments)2 | | | 6.200 | | | | 10/01/2031 | | | | 556,481 | |
| | 35,000 | | | King County, WA Hsg. Authority (Woodridge Park)2 | | | 6.250 | | | | 05/01/2015 | | | | 35,126 | |
| | 50,000 | | | King County, WA Hsg. Authority (Woodridge Park)2 | | | 6.350 | | | | 05/01/2025 | | | | 50,122 | |
| | 22,595,000 | | | King County, WA Sewer1 | | | 5.750 | | | | 01/01/2043 | | | | 23,683,642 | |
| | 1,885,000 | | | Kitsap County, WA Consolidated Hsg. Authority2 | | | 5.500 | | | | 06/01/2027 | | | | 1,383,307 | |
| | 2,350,000 | | | Kitsap County, WA Consolidated Hsg. Authority2 | | | 5.600 | | | | 06/01/2037 | | | | 1,575,534 | |
| | 50,000 | | | Kitsap County, WA Consolidated Hsg. Authority (Heritage Apartments)2 | | | 6.100 | | | | 10/01/2031 | | | | 37,885 | |
| | 2,465,000 | | | Port Camas, WA Public Industrial Corp. (James River Corp. of Virginia)2 | | | 6.700 | | | | 04/01/2023 | | | | 2,087,954 | |
| | 36,900,000 | | | Port of Seattle, WA1 | | | 5.000 | | | | 10/01/2032 | | | | 34,546,186 | |
| | 26,110,000 | | | Port of Seattle, WA Special Facilities2 | | | 6.250 | | | | 09/01/2026 | | | | 26,293,553 | |
F43 | OPPENHEIMER ROCHESTER NATIONAL MUNICIPALS
STATEMENT OF INVESTMENTS Continued
| | | | | | | | | | | | | | | | | |
| Principal | | | | | | | | | | | | |
| Amount | | | | | Coupon | | | Maturity | | | Value | |
| |
| Washington Continued | | | | | | | | | | | | |
| $ | 5,000,000 | | | Port of Seattle, WA Special Facility (Northwest Airlines)2 | | | 7.125 | % | | | 04/01/2020 | | | $ | 4,179,750 | |
| | 13,600,000 | | | Port of Seattle, WA Special Facility (Northwest Airlines)2 | | | 7.250 | | | | 04/01/2030 | | | | 10,694,360 | |
| | 2,425,000 | | | Snohomish County, WA Hsg. Authority (Westwood Crossing Apartments)2 | | | 5.250 | | | | 05/01/2037 | | | | 1,538,638 | |
| | 100,000 | | | Snohomish County, WA Hsg. Authority (Whispering Pines Apartments)2 | | | 5.100 | | | | 09/01/2015 | | | | 90,891 | |
| | 1,675,000 | | | Snohomish County, WA Hsg. Authority (Whispering Pines Apartments)2 | | | 5.600 | | | | 09/01/2025 | | | | 1,290,219 | |
| | 1,250,000 | | | Snohomish County, WA Hsg. Authority (Whispering Pines Apartments)2 | | | 5.750 | | | | 09/01/2030 | | | | 919,763 | |
| | 1,500,000 | | | Tes Properties, WA1 | | | 5.500 | | | | 12/01/2029 | | | | 1,534,193 | |
| | 12,000,000 | | | Tes Properties, WA1 | | | 5.625 | | | | 12/01/2038 | | | | 12,002,340 | |
| | 19,500,000 | | | WA Health Care Facilities Authority (Peacehealth)1 | | | 5.000 | | | | 11/01/2018 | | | | 19,455,930 | |
| | 10,760,000 | | | WA Kalispel Tribe Indians Priority District2 | | | 6.750 | | | | 01/01/2038 | | | | 7,800,354 | |
| | 14,285,000 | | | WA Tobacco Settlement Authority (TASC)2 | | | 6.625 | | | | 06/01/2032 | | | | 12,146,536 | |
| | | | | | | | | | | | | | | | |
| | | | | | | | | | | | | | | | 172,636,116 | |
| | | | | | | | | | | | | | | | | |
| West Virginia—0.5% | | | | | | | | | | | | |
| | 13,435,000 | | | Harrison County, WV Tax Increment (Charles Pointe)2 | | | 7.000 | | | | 06/01/2028 | | | | 10,449,877 | |
| | 1,840,000 | | | Harrison County, WV Tax Increment (Charles Pointe)2 | | | 7.000 | | | | 06/01/2035 | | | | 1,353,412 | |
| | 13,710,000 | | | Harrison County, WV Tax Increment (Charles Pointe)2 | | | 7.000 | | | | 06/01/2035 | | | | 10,084,391 | |
| | 25,000 | | | Kingswood, WV Sewage System2 | | | 6.000 | | | | 10/01/2025 | | | | 21,115 | |
| | 15,000 | | | WV Hospital Finance Authority (Charleston Area Medical Center)2 | | | 7.250 | | | | 10/01/2014 | | | | 15,032 | |
| | | | | | | | | | | | | | | | |
| | | | | | | | | | | | | | | | 21,923,827 | |
| | | | | | | | | | | | | | | | | |
| Wisconsin—0.7% | | | | | | | | | | | | |
| | 27,100,000 | | | Aztalan, WI Exempt Facility (Renew Energy)3,7 | | | 7.500 | | | | 05/01/2018 | | | | 1,422,750 | |
| | 645,000 | | | Milwaukee, WI (Aero Milwaukee)2 | | | 6.500 | | | | 01/01/2025 | | | | 518,045 | |
| | 1,220,000 | | | Milwaukee, WI (Air Cargo)2 | | | 7.500 | | | | 01/01/2025 | | | | 1,058,399 | |
| | 3,970,000 | | | Necedah, WI Community Devel. Authority Exempt | | | | | | | | | | | | |
| | | | | Facility (Castle Rock Renewable Fuels)2 | | | 7.500 | | | | 03/01/2018 | | | | 2,395,538 | |
| | 165,000 | | | New Berlin, WI Hsg. Authority (Pinewood Creek)2 | | | 6.800 | | | | 11/01/2012 | | | | 162,999 | |
| | 160,000 | | | New Berlin, WI Hsg. Authority (Pinewood Creek)2 | | | 6.850 | | | | 05/01/2013 | | | | 157,598 | |
| | 1,595,000 | | | New Berlin, WI Hsg. Authority (Pinewood Creek)2 | | | 7.125 | | | | 05/01/2024 | | | | 1,438,212 | |
| | 200,000 | | | Reedsburg, WI Industrial Devel. Revenue (Seats, Inc.)2 | | | 6.250 | | | | 05/01/2019 | | | | 168,486 | |
| | 1,750,000 | | | Sokaogon, WI Chippewa Community (Gaming)2 | | | 7.000 | | | | 01/01/2026 | | | | 1,293,723 | |
| | 1,800,000 | | | Sokaogon, WI Chippewa Community (Gaming)2 | | | 8.250 | | | | 01/01/2017 | | | | 1,432,638 | |
| | 3,000,000 | | | WI H&EFA (AE Nursing Centers)2 | | | 7.250 | | | | 06/01/2038 | | | | 2,503,110 | |
| | 55,000 | | | WI H&EFA (Aurora Health Care)2 | | | 5.625 | | | | 02/15/2029 | | | | 49,716 | |
| | 1,600,000 | | | WI H&EFA (Catholic Residential Services)2 | | | 5.250 | | | | 05/01/2028 | | | | 1,129,216 | |
| | 1,000,000 | | | WI H&EFA (Eastcastle Place)2 | | | 6.125 | | | | 12/01/2034 | | | | 736,110 | |
F44 | OPPENHEIMER ROCHESTER NATIONAL MUNICIPALS
| | | | | | | | | | | | | | | | | |
| Principal | | | | | | | | | | | | |
| Amount | | | | | Coupon | | | Maturity | | | Value | |
| |
| Wisconsin Continued | | | | | | | | | | | | |
| $ | 70,000 | | | WI H&EFA (Marshfield Clinic)2 | | | 6.250 | % | | | 02/15/2029 | | | $ | 66,157 | |
| | 7,335,000 | | | WI H&EFA (Wellington Homes)2 | | | 6.750 | | | | 09/01/2037 | | | | 5,586,776 | |
| | 500,000 | | | WI H&EFA (Wisconsin Illinois Senior Hsg.)2 | | | 5.650 | | | | 08/01/2021 | | | | 412,780 | |
| | 2,385,000 | | | WI H&EFA (Wisconsin Illinois Senior Hsg.)2 | | | 5.800 | | | | 08/01/2029 | | | | 1,820,126 | |
| | 10,540,000 | | | WI Hsg. & EDA (Home Ownership), Series D1 | | | 5.100 | | | | 09/01/2024 | | | | 10,333,258 | |
| | | | | | | | | | | | | | | | |
| | | | | | | | | | | | | | | | 32,685,637 | |
| | | | | | | | | | | | | | | | |
| Total Municipal Bonds and Notes (Cost $9,757,438,922) | | | | | | | | | | | 6,790,247,359 | |
| | | | | | | | | | | | | | | | | |
| Corporate Bonds and Notes—0.2% | | | | | | | | | | | | |
| | 17,181,803 | | | Delta Air Lines, Inc. Sr. Unsec. Nts.2,11 (Cost $17,009,987) | | | 8.000 | | | | 12/01/2015 | | | | 8,071,324 | |
| | | | | | | | | |
| Shares | | | | |
| |
| Common Stocks—0.0% | | | | |
| | 139,762 | Delta Air Lines, Inc.4,11 (Cost $860,880) | | | 968,551 | |
| | | | | | | | | | | | | | | | | |
| Units | | | | | Strike Price | | | Expiration | | | | | |
| |
| Rights, Warrants, and Certificates—0.0% | | | | | | | | | | | | |
| | 1,631,721 | | | Converted Organics, Inc. Wts.4 (Cost $0) | | $ | 11.000 | | | | 02/13/2012 | | | | 489,516 | |
| Total Investments, at Value (Cost $9,775,309,789)—139.5% | | | | | | | | | | | 6,799,776,750 | |
| Liabilities in Excess of Other Assets—(39.5) | | | | | | | | | | | (1,923,941,322 | ) |
| | | | | | | | | | | | | | | | |
| Net Assets—100.0% | | | | | | | | | | $ | 4,875,835,428 | |
| | | | | | | | | | | | | | | | |
| | | |
| Footnotes to Statement of Investments |
| |
| 1. | | Security represents the underlying municipal bond on an inverse floating rate security. The bond was purchased by the Fund and subsequently segregated and transferred to a trust. See Note 1 of accompanying Notes. |
| |
| 2. | | All or a portion of the security has been segregated for collateral to cover borrowings. See Note 7 of accompanying Notes. |
| |
| 3. | | Issue is in default. See Note 1 of accompanying Notes. |
| |
| 4. | | Non-income producing security. |
| |
| 5. | | Zero coupon bond reflects effective yield on the date of purchase. |
| |
| 6. | | Represents the current interest rate for a variable or increasing rate security. |
| |
| 7. | | Illiquid security. The aggregate value of illiquid securities as of July 31, 2009 was $26,898,035, which represents 0.55% of the Fund’s net assets. See Note 6 of accompanying Notes. |
| |
| 8. | | Denotes a step bond: a zero coupon bond that converts to a fixed or variable interest rate at a designated future date. |
| |
| 9. | | Represents securities sold under Rule 144A, which are exempt from registration under the Securities Act of 1933, as amended. These securities have been determined to be liquid under guidelines established by the Board of Trustees. These securities amount to $3,466,320 or 0.07% of the Fund’s net assets as of July 31, 2009. |
| |
| 10. | | Subject to a deferred-interest forebearance agreement. Rate shown is current rate. See Note 1 of accompanying Notes. |
| |
| 11. | | Received as the result of a corporate action. |
F45 | OPPENHEIMER ROCHESTER NATIONAL MUNICIPALS
STATEMENT OF INVESTMENTS Continued
Footnotes to Statement of Investments Continued
Valuation Inputs
Various data inputs are used in determining the value of each of the Fund’s investments as of the reporting period end. These data inputs are categorized in the following hierarchy under applicable financial accounting standards:
| | 1) | | Level 1—unadjusted quoted prices in active markets for identical assets or liabilities (including securities actively traded on a securities exchange) |
| |
| | 2) | | Level 2—inputs other than unadjusted quoted prices that are observable for the asset (such as unadjusted quoted prices for similar assets and market corroborated inputs such as interest rates, prepayment speeds, credit risks, etc.) |
| |
| | 3) | | Level 3—significant unobservable inputs (including the Manager’s own judgments about assumptions that market participants would use in pricing the asset). |
The table below categorizes amounts that are included in the Fund’s Statement of Assets and Liabilities as of July 31, 2009 based on valuation input level:
| | | | | | | | | | | | | | | | | |
| | | | | | | | | | | Level 3— | | | | |
| | | Level 1— | | | Level 2— | | | Significant | | | | |
| | | Unadjusted | | | Other Significant | | | Unobservable | | | | |
| | | Quoted prices | | | Observable Inputs | | | Inputs | | | Value | |
| |
Assets Table | | | | | | | | | | | | | | | | |
Investments, at Value: | | | | | | | | | | | | | | | | |
| Municipal Bonds and Notes | | | | | | | | | | | | | | | | |
| Alabama | | $ | — | | | $ | 49,641,746 | | | $ | — | | | $ | 49,641,746 | |
| Alaska | | | — | | | | 12,976,578 | | | | — | | | | 12,976,578 | |
| Arizona | | | — | | | | 246,196,356 | | | | — | | | | 246,196,356 | |
| Arkansas | | | — | | | | 8,794,077 | | | | — | | | | 8,794,077 | |
| California | | | — | | | | 871,963,540 | | | | — | | | | 871,963,540 | |
| Colorado | | | — | | | | 224,709,327 | | | | — | | | | 224,709,327 | |
| Connecticut | | | — | | | | 9,748,814 | | | | — | | | | 9,748,814 | |
| Delaware | | | — | | | | 4,049,196 | | | | — | | | | 4,049,196 | |
| District of Columbia | | | — | | | | 75,293,042 | | | | — | | | | 75,293,042 | |
| Florida | | | — | | | | 1,005,585,583 | | | | — | | | | 1,005,585,583 | |
| Georgia | | | — | | | | 35,892,540 | | | | — | | | | 35,892,540 | |
| Hawaii | | | — | | | | 6,253,919 | | | | — | | | | 6,253,919 | |
| Idaho | | | — | | | | 74,292 | | | | — | | | | 74,292 | |
| Illinois | | | — | | | | 329,413,388 | | | | — | | | | 329,413,388 | |
| Indiana | | | — | | | | 81,839,446 | | | | — | | | | 81,839,446 | |
| Iowa | | | — | | | | 107,063,561 | | | | — | | | | 107,063,561 | |
| Kansas | | | — | | | | 16,776,373 | | | | — | | | | 16,776,373 | |
| Kentucky | | | — | | | | 17,033,622 | | | | — | | | | 17,033,622 | |
| Louisiana | | | — | | | | 71,277,389 | | | | — | | | | 71,277,389 | |
| Maine | | | — | | | | 16,250,175 | | | | — | | | | 16,250,175 | |
| Maryland | | | — | | | | 15,468,768 | | | | — | | | | 15,468,768 | |
| Massachusetts | | | — | | | | 101,283,635 | | | | — | | | | 101,283,635 | |
| Michigan | | | — | | | | 101,845,468 | | | | — | | | | 101,845,468 | |
| Minnesota | | | — | | | | 65,081,063 | | | | — | | | | 65,081,063 | |
| Mississippi | | | — | | | | 15,240,168 | | | | — | | | | 15,240,168 | |
| Missouri | | | — | | | | 79,731,966 | | | | — | | | | 79,731,966 | |
| Montana | | | — | | | | 10,551,006 | | | | — | | | | 10,551,006 | |
| Multi States | | | — | | | | 4,076,000 | | | | — | | | | 4,076,000 | |
| Nebraska | | | — | | | | 34,308,412 | | | | — | | | | 34,308,412 | |
| Nevada | | | — | | | | 7,897,628 | | | | — | | | | 7,897,628 | |
F46 | OPPENHEIMER ROCHESTER NATIONAL MUNICIPALS
| | | | | | | | | | | | | | | | | |
| | | | | | | | | | | Level 3— | | | | |
| | | Level 1— | | | Level 2— | | | Significant | | | | |
| | | Unadjusted | | | Other Significant | | | Unobservable | | | | |
| | | Quoted prices | | | Observable Inputs | | | Inputs | | | Value | |
| |
| New Hampshire | | $ | — | | | $ | 4,055,171 | | | $ | — | | | $ | 4,055,171 | |
| New Jersey | | | — | | | | 549,968,475 | | | | — | | | | 549,968,475 | |
| New Mexico | | | — | | | | 13,117,076 | | | | — | | | | 13,117,076 | |
| New York | | | — | | | | 226,265,937 | | | | — | | | | 226,265,937 | |
| North Carolina | | | — | | | | 44,049,075 | | | | — | | | | 44,049,075 | |
| North Dakota | | | — | | | | 3,107,767 | | | | — | | | | 3,107,767 | |
| Ohio | | | — | | | | 182,829,981 | | | | — | | | | 182,829,981 | |
| Oklahoma | | | — | | | | 51,992,163 | | | | — | | | | 51,992,163 | |
| Oregon | | | — | | | | 11,108,604 | | | | — | | | | 11,108,604 | |
| Pennsylvania | | | — | | | | 160,473,362 | | | | — | | | | 160,473,362 | |
| Rhode Island | | | — | | | | 122,309,696 | | | | — | | | | 122,309,696 | |
| South Carolina | | | — | | | | 30,487,898 | | | | — | | | | 30,487,898 | |
| South Dakota | | | — | | | | 39,900,277 | | | | — | | | | 39,900,277 | |
| Tennessee | | | — | | | | 38,587,581 | | | | — | | | | 38,587,581 | |
| Texas | | | — | | | | 1,324,699,247 | | | | 14,177,572 | | | | 1,338,876,819 | |
| U.S. Possessions | | | — | | | | 28,761,433 | | | | — | | | | 28,761,433 | |
| Utah | | | — | | | | 6,004,903 | | | | — | | | | 6,004,903 | |
| Vermont | | | — | | | | 3,285,208 | | | | — | | | | 3,285,208 | |
| Virginia | | | — | | | | 81,503,275 | | | | — | | | | 81,503,275 | |
| Washington | | | — | | | | 172,636,116 | | | | — | | | | 172,636,116 | |
| West Virginia | | | — | | | | 21,923,827 | | | | — | | | | 21,923,827 | |
| Wisconsin | | | — | | | | 32,685,637 | | | | — | | | | 32,685,637 | |
| Corporate Bonds and Notes | | | — | | | | 8,071,324 | | | | — | | | | 8,071,324 | |
| Common Stocks | | | 968,551 | | | | — | | | | — | | | | 968,551 | |
| Rights, Warrants, and Certificates | | | 489,516 | | | | — | | | | — | | | | 489,516 | |
| | | |
| Total Assets | | $ | 1,458,067 | | | $ | 6,784,141,111 | | | $ | 14,177,572 | | | $ | 6,799,776,750 | |
| | | |
Currency contracts and forwards, if any, are reported at their unrealized appreciation/depreciation at measurement date, which represents the change in the contract’s value from trade date. Futures, if any, are reported at their variation margin at measurement date, which represents the amount due to/from the Fund at that date. All additional assets and liabilities included in the above table are reported at their market value at measurement date.
The following is a reconciliation of assets in which significant observable inputs (level 3) were used in determining fair value:
| | | | | | | | | |
| | | Investments | | | Other Financial | |
| | | in Securities | | | Instruments | |
| |
Valuation Description | | | | | | | | |
| Value as of July 31, 2008: | | $ | 35,823,892 | | | $ | — | |
| Realized gain (loss) | | | — | | | | — | |
| Change in unrealized appreciation (depreciation) | | | (22,215,423 | ) | | | — | |
Accretion/(amortization) of premium discount1 | | | 110,819 | | | | — | |
| Net purchases (sales) | | | (147,306 | ) | | | — | |
| Transfers in and out of Level 3 | | | 605,590 | | | | — | |
| | | |
| Value as of July 31, 2009 | | $ | 14,177,572 | | | $ | — | |
| | | |
| | |
| 1. | | Included in net investment income for fixed income securities. |
See the accompanying Notes for further discussion of the methods used in determining value of the Fund’s investments, and a summary of changes to the valuation techniques, if any, during the reporting period.
F47 | OPPENHEIMER ROCHESTER NATIONAL MUNICIPALS
STATEMENT OF INVESTMENTS Continued
Footnotes to Statement of Investments Continued
To simplify the listings of securities, abbreviations are used per the table below:
| | | |
| AG | | Allegheny General Hospital |
| AHF | | American Housing Foundation |
| CAB | | Capital Appreciation Bond |
| CDA | | Communities Devel. Authority |
| CFGH | | Central Florida Group Homes |
| CHE | | Catholic Health East |
| CHFTEH | | Catholic Housing for the Elderly & Handicapped |
| CHS | | Catholic Health Services |
| COP | | Certificates of Participation |
| CoMC | | Community Medical Center |
| DA | | Dormitory Authority |
| DRIVERS | | Derivative Inverse Tax Exempt Receipts |
| EDA | | Economic Devel. Authority |
| EDC | | Economic Devel. Corp. |
| EDFA | | Economic Devel. Finance Authority |
| EF&CD | | Environmental Facilities and Community Devel. |
| GO | | General Obligation |
| GPA | | General Purpose Authority |
| H&EFA | | Health and Educational Facilities Authority |
| H&EFB | | Health and Educational Facilities Board |
| H&HEFA | | Hospitals and Higher Education Facilities Authority |
| HDA | | Hospital Devel. Authority |
| HDC | | Housing Devel. Corp. |
| HE&HF | | Higher Educational and Housing Facilities |
| HE&HFB | | Health Educational and Housing Facility Board |
| HFA | | Housing Finance Agency |
| HFC | | Housing Finance Corp. |
| HFDC | | Health Facilities Devel. Corp. |
| IDA | | Industrial Devel. Agency |
| IDC | | Industrial Devel. Corp. |
| IF&PCFA | | Industrial Facilities and Pollution Control Financing Authority |
| JDAM | | Julia Dyckman Andrus Memorial |
| JFK | | John Fitzgerald Kennedy |
| JGCCF | | Jewish Geriatric & Convalescent Center Foundation |
| LH | | Lowman Home |
| LS | | Lutheran Services |
| MC | | Mccauley Center |
| MM | | Mercy Medical |
| NH | | Northgate Housing |
| NTH | | North Terrace Housing |
| NYC | | New York City |
| NYS | | New York State |
| Res Rec | | Resource Recovery Facility |
| RHA | | Resource Healthcare of America |
| RITES | | Residual Interest Tax Exempt Security |
| ROLs | | Residual Option Longs |
| SANC | | St. Anne’s Nursing Center |
| SJR | | St. Joseph Residence |
| SJRNC | | St. Johns Rehabilitation and Nursing Center |
| TASC | | Tobacco Settlement Asset-Backed Bonds |
| UDC | | Urban Devel. Corp. |
| VH | | Village Housing |
| VMNRC | | Villa Marina Nursing & Rehabilitation Center |
| VS | | Village Shalom |
| VSCF | | Village Shalom Charitable Foundation |
| WPAHS | | West Penn Allegheny Health System |
| WPAON | | West Penn Allegheny Oncology Network |
| WPH | | Western Pennsylvania Hospital |
| WSREC | | West Suburban Recycling and Energy Corp. |
See accompanying Notes to Financial Statements.
F48 | OPPENHEIMER ROCHESTER NATIONAL MUNICIPALS
STATEMENT OF ASSETS AND LIABILITIES July 31, 2009
| | | | | |
Assets | | | | |
| Investments, at value (cost $9,775,309,789)—see accompanying statement of investments | | $ | 6,799,776,750 | |
| Cash | | | 1,708,811 | |
| Receivables and other assets: | | | | |
| Interest | | | 109,010,762 | |
| Shares of beneficial interest sold | | | 19,307,846 | |
| Investments sold (including $1,925,919 sold on a when-issued or delayed delivery basis) | | | 9,496,479 | |
| Other | | | 6,751,188 | |
| | | | |
| Total assets | | | 6,946,051,836 | |
| | | | | |
Liabilities | | | | |
| Payables and other liabilities: | | | | |
| Payable for short-term floating rate notes issued (See Note 1) | | | 1,586,890,000 | |
| Payable on borrowings (See Note 7) | | | 464,200,000 | |
| Shares of beneficial interest redeemed | | | 10,211,046 | |
| Dividends | | | 3,965,791 | |
| Investments purchased | | | 1,775,220 | |
| Trustees’ compensation | | | 705,504 | |
| Distribution and service plan fees | | | 612,413 | |
| Transfer and shareholder servicing agent fees | | | 324,637 | |
| Interest expense on borrowings | | | 247,654 | |
| Shareholder communications | | | 107,830 | |
| Other | | | 1,176,313 | |
| | | | |
| Total liabilities | | | 2,070,216,408 | |
| | | | | |
Net Assets | | $ | 4,875,835,428 | |
| | | | |
| | | | | |
Composition of Net Assets | | | | |
| Paid-in capital | | $ | 9,347,684,036 | |
| Accumulated net investment income | | | 15,903,740 | |
| Accumulated net realized loss on investments | | | (1,512,219,309 | ) |
| Net unrealized depreciation on investments | | | (2,975,533,039 | ) |
| | | | |
Net Assets | | $ | 4,875,835,428 | |
| | | | |
F49 | OPPENHEIMER ROCHESTER NATIONAL MUNICIPALS
STATEMENT OF ASSETS AND LIABILITIES Continued
| | | | | |
Net Asset Value Per Share | | | | |
| |
| Class A Shares: | | | | |
| Net asset value and redemption price per share (based on net assets of $3,408,946,230 and 577,491,462 shares of beneficial interest outstanding) | | $ | 5.90 | |
| Maximum offering price per share (net asset value plus sales charge of 4.75% of offering price) | | $ | 6.19 | |
| |
| Class B Shares: | | | | |
| Net asset value, redemption price (excludes applicable contingent deferred sales charge) and offering price per share (based on net assets of $212,744,844 and 35,931,506 shares of beneficial interest outstanding) | | $ | 5.92 | |
| |
| Class C Shares: | | | | |
| Net asset value, redemption price (excludes applicable contingent deferred sales charge) and offering price per share (based on net assets of $1,254,144,354 and 212,920,914 shares of beneficial interest outstanding) | | $ | 5.89 | |
See accompanying Notes to Financial Statements.
F50 | OPPENHEIMER ROCHESTER NATIONAL MUNICIPALS
STATEMENT OF OPERATIONS For the Year Ended July 31, 2009
| | | | | |
Investment Income | | | | |
| Interest | | $ | 615,233,523 | |
| Other income | | | 2,215 | |
| | | | |
| Total investment income | | | 615,235,738 | |
| | | | | |
Expenses | | | | |
| Management fees | | | 18,123,863 | |
| Distribution and service plan fees: | | | | |
| Class A | | | 4,944,617 | |
| Class B | | | 2,093,905 | |
| Class C | | | 10,940,058 | |
| Transfer and shareholder servicing agent fees: | | | | |
| Class A | | | 2,204,769 | |
| Class B | | | 366,152 | |
| Class C | | | 1,169,602 | |
| Shareholder communications: | | | | |
| Class A | | | 165,647 | |
| Class B | | | 32,717 | |
| Class C | | | 98,736 | |
| Interest expense and fees on short-term floating rate notes issued (See Note 1) | | | 64,045,423 | |
| |
| Borrowing fees | | | 36,063,729 | |
| |
| Interest expense on borrowings | | | 12,226,362 | |
| |
| Trustees’ compensation | | | 218,778 | |
| |
| Custodian fees and expenses | | | 98,228 | |
| |
| Other | | | 672,860 | |
| | | | |
| Total expenses | | | 153,465,446 | |
| Less reduction to custodian expenses | | | (314 | ) |
| | | | |
| Net expenses | | | 153,465,132 | |
| | | | | |
Net Investment Income | | | 461,770,606 | |
| | | | | |
Realized and Unrealized Gain (Loss) | | | | |
| Net realized gain (loss) on: | | | | |
| Investments (including premiums on options exercised) | | | (1,006,679,800 | ) |
| Closing and expiration of option contracts written | | | 30,013 | |
| | | | |
| | | | | |
| Net realized loss | | | (1,006,649,787 | ) |
| |
| Net change in unrealized appreciation (depreciation) on: | | | | |
| Investments | | | (1,152,869,115 | ) |
| Option contracts written | | | 14,583 | |
| | | | |
| Net change in unrealized depreciation | | | (1,152,854,532 | ) |
| | | | | |
Net Decrease in Net Assets Resulting from Operations | | $ | (1,697,733,713 | ) |
| | | | |
See accompanying Notes to Financial Statements.
F51 | OPPENHEIMER ROCHESTER NATIONAL MUNICIPALS
STATEMENTS OF CHANGES IN NET ASSETS
| | | | | | | | | |
| Year Ended July 31, | | 2009 | | | 2008 | |
| |
Operations | | | | | | | | |
| Net investment income | | $ | 461,770,606 | | | $ | 462,074,895 | |
| |
| Net realized loss | | | (1,006,649,787 | ) | | | (504,607,864 | ) |
| |
| Net change in unrealized depreciation | | | (1,152,854,532 | ) | | | (1,935,297,605 | ) |
| | | |
| | | | | | | | | |
| Net decrease in net assets resulting from operations | | | (1,697,733,713 | ) | | | (1,977,830,574 | ) |
| | | | | | | | | |
Dividends and/or Distributions to Shareholders | | | | | | | | |
| Dividends from net investment income: | | | | | | | | |
| Class A | | | (326,236,980 | ) | | | (315,036,292 | ) |
| Class B | | | (20,619,463 | ) | | | (25,507,935 | ) |
| Class C | | | (109,271,240 | ) | | | (102,017,272 | ) |
| | | |
| | | | | | | | | |
| | | | (456,127,683 | ) | | | (442,561,499 | ) |
| | | | | | | | | |
Beneficial Interest Transactions | | | | | | | | |
| Net increase (decrease) in net assets resulting from beneficial interest transactions: | | | | | | | | |
| Class A | | | 392,780,817 | | | | 274,523,857 | |
| Class B | | | (31,165,765 | ) | | | (75,415,052 | ) |
| Class C | | | 149,550,201 | | | | 141,440,580 | |
| | | |
| | | | | | | | | |
| | | | 511,165,253 | | | | 340,549,385 | |
| | | | | | | | | |
Net Assets | | | | | | | | |
| Total decrease | | | (1,642,696,143 | ) | | | (2,079,842,688 | ) |
| |
| Beginning of period | | | 6,518,531,571 | | | | 8,598,374,259 | |
| | | |
| | | | | | | | | |
| End of period (including accumulated net investment income of $15,903,740 and $18,047,181, respectively) | | $ | 4,875,835,428 | | | $ | 6,518,531,571 | |
| | | |
See accompanying Notes to Financial Statements.
F52 | OPPENHEIMER ROCHESTER NATIONAL MUNICIPALS
STATEMENT OF CASH FLOWS For the Year Ended July 31, 2009
| | | | | |
Cash Flows from Operating Activities | | | | |
| Net decrease in net assets from operations | | $ | (1,697,733,713 | ) |
| |
| Adjustments to reconcile net decrease in net assets from operations to net cash provided by operating activities: | | | | |
| Purchase of investment securities | | | (1,381,286,295 | ) |
| Proceeds from disposition of investment securities | | | 1,240,867,491 | |
| Short-term investment securities, net | | | 307,508,201 | |
| Premium amortization | | | 4,236,682 | |
| Discount accretion | | | (88,213,165 | ) |
| Net realized loss on investments | | | 1,006,649,787 | |
| Net change in unrealized depreciation on investments | | | 1,152,854,532 | |
| Decrease in interest receivable | | | 4,259,578 | |
| Decrease in receivable for securities sold | | | 57,075,161 | |
| Increase in other assets | | | (6,169,914 | ) |
| Decrease in payable for options written | | | (78,060 | ) |
| Decrease in payable for securities purchased | | | (68,303,531 | ) |
| Decrease in payable for accrued expenses | | | (361,418 | ) |
| | | | |
| Net cash provided by operating activities | | | 531,305,336 | |
| | | | | |
Cash Flows from Financing Activities | | | | |
| Proceeds from bank borrowings | | | 2,383,800,000 | |
| Payments on bank borrowings | | | (2,317,800,000 | ) |
| Payments on short-term floating rate notes issued | | | (643,892,000 | ) |
| Proceeds from shares sold | | | 2,220,249,761 | |
| Payments on shares redeemed | | | (1,979,749,823 | ) |
| Cash distributions paid | | | (192,680,103 | ) |
| | | | |
| Net cash used in financing activities | | | (530,072,165 | ) |
| |
| Net increase in cash | | | 1,233,171 | |
| |
| Cash, beginning balance | | | 475,640 | |
| | | | |
| Cash, ending balance | | $ | 1,708,811 | |
| | | | |
Supplemental disclosure of cash flow information:
Noncash financing activities not included herein consist of reinvestment of dividends and distributions of $269,818,450.
Cash paid for interest on bank borrowings—$12,902,606.
Cash paid for interest on short-term floating rate notes issued—$64,045,423.
See accompanying Notes to Financial Statements.
F53 | OPPENHEIMER ROCHESTER NATIONAL MUNICIPALS
FINANCIAL HIGHLIGHTS
| | | | | | | | | | | | | | | | | | | | | |
| Class A Year Ended July 31, | | 2009 | | | 2008 | | | 2007 | | | 2006 | | | 2005 | |
| |
Per Share Operating Data | | | | | | | | | | | | | | | | | | | | |
| Net asset value, beginning of period | | $ | 8.89 | | | $ | 12.43 | | | $ | 12.47 | | | $ | 12.69 | | | $ | 11.13 | |
| |
| Income (loss) from investment operations: | | | | | | | | | | | | | | | | | | | | |
Net investment income1 | | | .62 | | | | .70 | | | | .67 | | | | .69 | | | | .78 | |
| Net realized and unrealized gain (loss) | | | (2.98 | ) | | | (3.57 | ) | | | (.03 | ) | | | (.24 | ) | | | 1.59 | |
| | | |
| Total from investment operations | | | (2.36 | ) | | | (2.87 | ) | | | .64 | | | | .45 | | | | 2.37 | |
| |
| Dividends and/or distributions to shareholders: | | | | | | | | | | | | | | | | | | | | |
| Dividends from net investment income | | | (.63 | ) | | | (.67 | ) | | | (.68 | ) | | | (.67 | ) | | | (.81 | ) |
| |
| | | | | | | | | | | | | | | | | | | | | |
| Net asset value, end of period | | $ | 5.90 | | | $ | 8.89 | | | $ | 12.43 | | | $ | 12.47 | | | $ | 12.69 | |
| | | |
| | | | | | | | | | | | | | | | | | | | | |
Total Return, at Net Asset Value2 | | | (26.44 | )% | | | (23.62 | )% | | | 5.16 | % | | | 3.79 | % | | | 21.97 | % |
| | | | | | | | | | | | | | | | | | | | | |
Ratios/Supplemental Data | | | | | | | | | | | | | | | | | | | | |
| Net assets, end of period (in thousands) | | $ | 3,408,946 | | | $ | 4,503,510 | | | $ | 5,886,284 | | | $ | 3,439,135 | | | $ | 2,309,856 | |
| |
| Average net assets (in thousands) | | $ | 3,338,722 | | | $ | 4,903,394 | | | $ | 4,813,462 | | | $ | 2,721,861 | | | $ | 1,366,113 | |
| |
Ratios to average net assets:3 | | | | | | | | | | | | | | | | | | | | |
| Net investment income | | | 9.89 | % | | | 6.70 | % | | | 5.23 | % | | | 5.60 | % | | | 6.46 | % |
| Expenses excluding interest and fees on short-term floating rate notes issued | | | 1.63 | % | | | 0.79 | % | | | 0.63 | % | | | 0.67 | % | | | 0.69 | % |
Interest and fees on short-term floating rate notes issued4 | | | 1.34 | % | | | 1.25 | % | | | 0.84 | % | | | 0.81 | % | | | 0.39 | % |
| | | |
| Total expenses | | | 2.97 | %5 | | | 2.04 | %5 | | | 1.47 | %5 | | | 1.48 | % | | | 1.08 | %5 |
| |
| Portfolio turnover rate | | | 20 | % | | | 37 | % | | | 6 | % | | | 24 | % | | | 6 | % |
| | |
| 1. | | Per share amounts calculated based on the average shares outstanding during the period. |
| |
| 2. | | Assumes an investment on the business day before the first day of the fiscal period, with all dividends and distributions reinvested in additional shares on the reinvestment date, and redemption at the net asset value calculated on the last business day of the fiscal period. Sales charges are not reflected in the total returns. Total returns are not annualized for periods less than one full year. Returns do not reflect the deduction of taxes that a shareholder would pay on fund distributions or the redemption of fund shares. |
| |
| 3. | | Annualized for periods less than one full year. |
| |
| 4. | | Interest and fee expense relates to the Fund’s liability for short-term floating rate notes issued in conjunction with inverse floating rate security transactions. See Note 1 of accompanying Notes. |
| |
| 5. | | Reduction to custodian expenses less than 0.005%. |
See accompanying Notes to Financial Statements.
F54 | OPPENHEIMER ROCHESTER NATIONAL MUNICIPALS
| | | | | | | | | | | | | | | | | | | | | |
| Class B Year Ended July 31, | | 2009 | | | 2008 | | | 2007 | | | 2006 | | | 2005 | |
| |
Per Share Operating Data | | | | | | | | | | | | | | | | | | | | |
| Net asset value, beginning of period | | $ | 8.91 | | | $ | 12.46 | | | $ | 12.50 | | | $ | 12.72 | | | $ | 11.15 | |
| |
| Income (loss) from investment operations: | | | | | | | | | | | | | | | | | | | | |
Net investment income1 | | | .57 | | | | .62 | | | | .57 | | | | .60 | | | | .70 | |
| Net realized and unrealized gain (loss) | | | (2.99 | ) | | | (3.58 | ) | | | (.02 | ) | | | (.24 | ) | | | 1.59 | |
| | | |
| Total from investment operations | | | (2.42 | ) | | | (2.96 | ) | | | .55 | | | | .36 | | | | 2.29 | |
| |
| Dividends and/or distributions to shareholders: | | | | | | | | | | | | | | | | | | | | |
| Dividends from net investment income | | | (.57 | ) | | | (.59 | ) | | | (.59 | ) | | | (.58 | ) | | | (.72 | ) |
| |
| |
| Net asset value, end of period | | $ | 5.92 | | | $ | 8.91 | | | $ | 12.46 | | | $ | 12.50 | | | $ | 12.72 | |
| | | |
| | | | | | | | | | | | | | | | | | | | | |
Total Return, at Net Asset Value2 | | | (27.02 | )% | | | (24.27 | )% | | | 4.34 | % | | | 2.97 | % | | | 21.09 | % |
| | | | | | | | | | | | | | | | | | | | | |
Ratios/Supplemental Data | | | | | | | | | | | | | | | | | | | | |
| Net assets, end of period (in thousands) | | $ | 212,745 | | | $ | 356,192 | | | $ | 586,763 | | | $ | 558,386 | | | $ | 528,192 | |
| |
| Average net assets (in thousands) | | $ | 232,793 | | | $ | 458,627 | | | $ | 587,412 | | | $ | 533,869 | | | $ | 410,031 | |
| |
Ratios to average net assets:3 | | | | | | | | | | | | | | | | | | | | |
| Net investment income | | | 8.99 | % | | | 5.86 | % | | | 4.49 | % | | | 4.84 | % | | | 5.80 | % |
| Expenses excluding interest and fees on short-term floating rate notes issued | | | 2.47 | % | | | 1.60 | % | | | 1.41 | % | | | 1.46 | % | | | 1.48 | % |
Interest and fees on short-term floating rate notes issued4 | | | 1.34 | % | | | 1.25 | % | | | 0.84 | % | | | 0.81 | % | | | 0.39 | % |
| | | |
| Total expenses | | | 3.81 | %5 | | | 2.85 | %5 | | | 2.25 | %5 | | | 2.27 | % | | | 1.87 | %5 |
| |
| Portfolio turnover rate | | | 20 | % | | | 37 | % | | | 6 | % | | | 24 | % | | | 6 | % |
| | |
| 1. | | Per share amounts calculated based on the average shares outstanding during the period. |
| |
| 2. | | Assumes an investment on the business day before the first day of the fiscal period, with all dividends and distributions reinvested in additional shares on the reinvestment date, and redemption at the net asset value calculated on the last business day of the fiscal period. Sales charges are not reflected in the total returns. Total returns are not annualized for periods less than one full year. Returns do not reflect the deduction of taxes that a shareholder would pay on fund distributions or the redemption of fund shares. |
| |
| 3. | | Annualized for periods less than one full year. |
| |
| 4. | | Interest and fee expense relates to the Fund’s liability for short-term floating rate notes issued in conjunction with inverse floating rate security transactions. See Note 1 of accompanying Notes. |
| |
| 5. | | Reduction to custodian expenses less than 0.005%. |
See accompanying Notes to Financial Statements.
F55 | OPPENHEIMER ROCHESTER NATIONAL MUNICIPALS
FINANCIAL HIGHLIGHTS Continued
| | | | | | | | | | | | | | | | | | | | | |
| | | | | | | | | | | | | | | | |
| Class C Year Ended July 31, | | 2009 | | | 2008 | | | 2007 | | | 2006 | | | 2005 | |
| |
Per Share Operating Data | | | | | | | | | | | | | | | | | | | | |
| Net asset value, beginning of period | | $ | 8.87 | | | $ | 12.41 | | | $ | 12.45 | | | $ | 12.67 | | | $ | 11.11 | |
| |
| Income (loss) from investment operations: | | | | | | | | | | | | | | | | | | | | |
Net investment income1 | | | .57 | | | | .62 | | | | .57 | | | | .60 | | | | .68 | |
| Net realized and unrealized gain (loss) | | | (2.97 | ) | | | (3.57 | ) | | | (.02 | ) | | | (.24 | ) | | | 1.60 | |
| | | |
| Total from investment operations | | | (2.40 | ) | | | (2.95 | ) | | | .55 | | | | .36 | | | | 2.28 | |
| |
| Dividends and/or distributions to shareholders: | | | | | | | | | | | | | | | | | | | | |
| Dividends from net investment income | | | (.58 | ) | | | (.59 | ) | | | (.59 | ) | | | (.58 | ) | | | (.72 | ) |
| |
| |
| Net asset value, end of period | | $ | 5.89 | | | $ | 8.87 | | | $ | 12.41 | | | $ | 12.45 | | | $ | 12.67 | |
| | | |
| | | | | | | | | | | | | | | | | | | | | |
Total Return, at Net Asset Value2 | | | (26.98 | )% | | | (24.26 | )% | | | 4.38 | % | | | 3.01 | % | | | 21.08 | % |
| | | | | | | | | | | | | | | | | | | | | |
Ratios/Supplemental Data | | | | | | | | | | | | | | | | | | | | |
| Net assets, end of period (in thousands) | | $ | 1,254,144 | | | $ | 1,658,830 | | | $ | 2,125,327 | | | $ | 1,299,995 | | | $ | 868,108 | |
| |
| Average net assets (in thousands) | | $ | 1,215,913 | | | $ | 1,800,637 | | | $ | 1,756,797 | | | $ | 1,050,344 | | | $ | 488,562 | |
| |
Ratios to average net assets:3 | | | | | | | | | | | | | | | | | | | | |
| Net investment income | | | 9.09 | % | | | 5.93 | % | | | 4.47 | % | | | 4.83 | % | | | 5.68 | % |
| Expenses excluding interest and fees on short-term floating rate notes issued | | | 2.41 | % | | | 1.56 | % | | | 1.39 | % | | | 1.44 | % | | | 1.46 | % |
Interest and fees on short-term floating rate notes issued4 | | | 1.34 | % | | | 1.25 | % | | | 0.84 | % | | | 0.81 | % | | | 0.39 | % |
| | | |
| Total expenses | | | 3.75 | %5 | | | 2.81 | %5 | | | 2.23 | %5 | | | 2.25 | % | | | 1.85 | %5 |
| |
| Portfolio turnover rate | | | 20 | % | | | 37 | % | | | 6 | % | | | 24 | % | | | 6 | % |
| | |
| 1. | | Per share amounts calculated based on the average shares outstanding during the period. |
| |
| 2. | | Assumes an investment on the business day before the first day of the fiscal period, with all dividends and distributions reinvested in additional shares on the reinvestment date, and redemption at the net asset value calculated on the last business day of the fiscal period. Sales charges are not reflected in the total returns. Total returns are not annualized for periods of less than one full year. Returns do not reflect the deduction of taxes that a shareholder would pay on fund distributions or the redemption of fund shares. |
| |
| 3. | | Annualized for periods less than one full year. |
| |
| 4. | | Interest and fee expense relates to the Fund’s liability for short-term floating rate notes issued in conjunction with inverse floating rate security transactions. See Note 1 of accompanying Notes. |
| |
| 5. | | Reduction to custodian expenses less than 0.005%. |
See accompanying Notes to Financial Statements.
F56 | OPPENHEIMER ROCHESTER NATIONAL MUNICIPALS
NOTES TO FINANCIAL STATEMENTS
1. Significant Accounting Policies
Oppenheimer Rochester National Municipals (the “Fund”) is a separate series of Oppenheimer Multi-State Municipal Trust, an open-end management investment company registered under the Investment Company Act of 1940, as amended. The Fund’s investment objective is to seek a high level of current income exempt from federal income taxes for individual investors by investing in a diversified portfolio of high-yield municipal securities. The Fund’s investment adviser is OppenheimerFunds, Inc. (the “Manager”).
The Fund offers Class A, Class B and Class C shares. Class A shares are sold at their offering price, which is normally net asset value plus a front-end sales charge. Class B and Class C shares are sold without a front-end sales charge but may be subject to a contingent deferred sales charge (“CDSC”). All classes of shares have identical rights and voting privileges with respect to the Fund in general and exclusive voting rights on matters that affect that class alone. Earnings, net assets and net asset value per share may differ due to each class having its own expenses, such as transfer and shareholder servicing agent fees and shareholder communications, directly attributable to that class. Class A, B and C have separate distribution and/or service plans. Class B shares will automatically convert to Class A shares 72 months after the date of purchase.
The following is a summary of significant accounting policies consistently followed by the Fund.
Securities Valuation. The Fund calculates the net asset value of its shares as of the close of the New York Stock Exchange (the “Exchange”), normally 4:00 P.M. Eastern time, on each day the Exchange is open for trading.
Each investment asset or liability of the Fund is assigned a level at measurement date based on the significance and source of the inputs to its valuation. Unadjusted quoted prices in active markets for identical securities are classified as “Level 1,” inputs other than unadjusted quoted prices for an asset that are observable are classified as “Level 2” and unobservable inputs, including the Manager’s judgment about the assumptions that a market participant would use in pricing an asset or liability are classified as “Level 3.” The inputs used for valuing securities are not necessarily an indication of the risks associated with investing in those securities. A table summarizing the Fund’s investments under these levels of classification is included following the Statement of Investments.
Securities are valued using unadjusted quoted market prices, when available, as supplied primarily either by portfolio pricing services approved by the Board of Trustees or dealers.
Securities traded on a registered U.S. securities exchange are valued based on the last sale price of the security reported on the principal exchange on which traded, prior to the time when the Fund’s assets are valued. Securities whose principal exchange is NASDAQ® are valued based on the official closing prices reported by NASDAQ prior to the time when the Fund’s assets are valued. In the absence of a sale, the security is valued at the last sale price on the prior trading day, if it is within the spread of the current day’s closing “bid” and “asked” prices, and if not, at the current day’s closing bid price. A foreign security traded on a foreign exchange is valued based on the last sale price on the principal
F57 | OPPENHEIMER ROCHESTER NATIONAL MUNICIPALS
NOTES TO FINANCIAL STATEMENTS Continued
1. Significant Accounting Policies Continued
exchange on which the security is traded, as identified by the portfolio pricing service used by the Manager, prior to the time when the Fund’s assets are valued. In the absence of a sale, the security is valued at the most recent official closing price on the principal exchange on which it is traded.
Shares of a registered investment company that are not traded on an exchange are valued at that investment company’s net asset value per share.
Corporate, government and municipal debt instruments having a remaining maturity in excess of sixty days and all mortgage-backed securities, collateralized mortgage obligations and other asset-backed securities are valued at the mean between the “bid” and “asked” prices.
“Money market-type” debt instruments with remaining maturities of sixty days or less are valued at cost adjusted by the amortization of discount or premium to maturity (amortized cost), which approximates market value.
In the absence of a readily available unadjusted quoted market price, including for securities whose values have been materially affected by what the Manager identifies as a significant event occurring before the Fund’s assets are valued but after the close of the securities’ respective exchanges, the Manager, acting through its internal valuation committee, in good faith determines the fair valuation of that asset using consistently applied procedures under the supervision of the Board of Trustees (which reviews those fair valuations by the Manager). Those procedures include certain standardized methodologies to fair value securities. Such methodologies include, but are not limited to, pricing securities initially at cost and subsequently adjusting the value based on: changes in company specific fundamentals, changes in an appropriate securities index, or changes in the value of similar securities which may be adjusted for any discounts related to resale restrictions. When possible, such methodologies use observable market inputs such as unadjusted quoted prices of similar securities, observable interest rates, currency rates and yield curves. The methodologies used for valuing securities are not necessarily an indication of the risks associated with investing in those securities.
There have been no significant changes to the fair valuation methodologies during the period.
Securities on a When-Issued or Delayed Delivery Basis. The Fund may purchase securities on a “when-issued” basis, and may purchase or sell securities on a “delayed delivery” basis. “When-issued” or “delayed delivery” refers to securities whose terms and indenture are available and for which a market exists, but which are not available for immediate delivery. Delivery and payment for securities that have been purchased by the Fund on a when-issued basis normally takes place within six months and possibly as long as two years or more after the trade date. During this period, such securities do not earn interest, are subject to market fluctuation and may increase or decrease in value prior to their delivery. The purchase of securities on a when-issued basis may increase the volatility of the Fund’s net asset value to the extent the Fund executes such transactions while
F58 | OPPENHEIMER ROCHESTER NATIONAL MUNICIPALS
remaining substantially fully invested. When the Fund engages in when-issued or delayed delivery transactions, it relies on the buyer or seller, as the case may be, to complete the transaction. Their failure to do so may cause the Fund to lose the opportunity to obtain or dispose of the security at a price and yield it considers advantageous. The Fund maintains internally designated assets with a market value equal to or greater than the amount of its purchase commitments. The Fund may also sell securities that it purchased on a when-issued basis or forward commitment prior to settlement of the original purchase.
As of July 31, 2009, the Fund had purchased securities issued on a when-issued or delayed delivery basis and sold securities issued on a delayed delivery basis as follows:
| | | | | |
| | | When-Issued or Delayed Delivery | |
| | | Basis Transactions | |
| |
| Sold securities | | | $1,925,919 | |
Inverse Floating Rate Securities. The Fund invests in inverse floating rate securities that pay interest at a rate that varies inversely with short-term interest rates. Certain of these securities may be leveraged, whereby the interest rate varies inversely at a multiple of the change in short-term rates. As interest rates rise, inverse floaters produce less current income. The price of such securities is more volatile than comparable fixed rate securities. The Fund may expose up to 35% of its total assets to the effects of leverage from its investments in inverse floaters. The Fund’s exposure to the effects of leverage from its investments in inverse floaters amount to $1,586,890,000 as of July 31, 2009, which represents 22.85% of the Fund’s total assets.
Certain inverse floating rate securities are created when the Fund purchases and subsequently transfers a municipal bond security (the “municipal bond”) to a broker dealer. The municipal bond is typically a fixed rate security. The broker dealer (the “sponsor”) creates a trust (the “Trust”) and deposits the municipal bond. The Trust issues short-term floating rate notes available to third parties and a residual interest in the municipal bond (referred to as an “inverse floating rate security”) to the Fund. The terms of these inverse floating rate securities grant the Fund the right to require that the Trust issuing the inverse floating rate security compel a tender of the short-term floating rate notes to facilitate the Fund’s repurchase of the underlying municipal bond. Following such a request, the Fund pays the sponsor the principal amount due to the holders of the short-term floating rate notes issued by the Trust and exchanges the inverse floating rate security for the underlying municipal bond. These transactions are considered secured borrowings for financial reporting purposes. As a result of such accounting treatments, the Fund includes the municipal bond position on its Statement of Investments (but does not separately include the inverse floating rate securities received). The Fund also includes the value of the municipal bond and a payable amount equal to the short-term floating rate notes issued by the Trust on its Statement of Assets and Liabilities. The interest rates on these short-term floating rate notes reset periodically, usually weekly. The holders of these short-term floating rate notes have the option to tender their investment, to the sponsor or the Trust’s liquidity provider, for redemption at par at each reset date. Income from the
F59 | OPPENHEIMER ROCHESTER NATIONAL MUNICIPALS
NOTES TO FINANCIAL STATEMENTS Continued
1. Significant Accounting Policies Continued
municipal bond position and the interest expense on the payable for the short-term floating rate notes issued by the Trust are recorded on the Fund’s Statement of Operations. At July 31, 2009, municipal bond holdings with a value of $2,400,599,334 shown on the Fund’s Statement of Investments are held by such Trusts and serve as collateral for the $1,586,890,000 in short-term floating rate notes issued and outstanding at that date.
The Fund’s investments in inverse floaters involve certain risks. The market value of an inverse floating rate security can be more volatile than that of a conventional fixed-rate bond having similar credit quality, maturity and redemption provisions. Typically, an inverse floating rate security tends to underperform fixed rate bonds when long-term interest rates are rising but tends to outperform fixed rate bonds when long-term interest rates are stable or falling. An inverse floating rate security entails a degree of leverage because the trust issues short-term securities in a ratio to the inverse floating rate security with the underlying long-term bond providing collateral for the obligation to pay the principal value of the short-term securities if and when they are tendered. If the Fund has created the inverse floater by depositing a long-term bond into a trust, it may be required to provide additional collateral for the short-term securities if the value of the underlying bond deposited in the trust falls.
At July 31, 2009, the Fund’s residual exposure to these types of inverse floating rate securities were as follows:
| | | | | | | | | | | | | | | | | |
| Principal | | | Inverse | | Coupon | | | Maturity | | | | |
| Amount | | | Floater1 | | Rate2 | | | Date | | | Value | |
| |
| $ | 4,150,000 | | | AL HFA (Single Family Mtg.) ROLs3 | | | 14.988 | % | | | 10/1/32 | | | $ | 4,175,315 | |
| | 7,066,000 | | | Aurora, IL Single Family Mtg. ROLs3 | | | 8.649 | | | | 12/1/45 | | | | 6,264,292 | |
| | 9,140,000 | | | Aurora, IL Single Family Mtg. ROLs3 | | | 10.824 | | | | 12/1/39 | | | | 10,317,506 | |
| | 163,925,000 | | | AZ Health Facilities Authority ROLs3 | | | 1.264 | | | | 1/1/37 | | | | 71,387,698 | |
| | 17,620,000 | | | AZ Health Facilities Authority ROLs3 | | | 1.264 | | | | 1/1/37 | | | | 7,673,334 | |
| | 53,605,000 | | | AZ Health Facilities Authority ROLs3 | | | 1.264 | | | | 1/1/37 | | | | 23,344,441 | |
| | 4,125,000 | | | Broward County, FL Water and Sewer ROLs3 | | | 15.240 | | | | 10/1/34 | | | | 4,321,350 | |
| | 3,715,000 | | | CA Dept. of Veterans Affairs Home Purchase ROLs3 | | | 15.151 | | | | 12/1/28 | | | | 3,715,817 | |
| | 139,520,000 | | | CA Golden State Tobacco Securitization Corp. ROLs3 | | | 6.230 | | | | 6/1/47 | | | | 48,033,946 | |
| | 2,615,000 | | | Cerritos, CA Community College District DRIVERS | | | 14.935 | | | | 8/1/33 | | | | 2,761,335 | |
| | 4,710,000 | | | Chelan County, WA Public Utility District No.1 ROLs3 | | | 10.026 | | | | 1/1/36 | | | | 3,819,056 | |
| | 11,985,000 | | | Dallas, TX Area Rapid Transit ROLs3 | | | 14.403 | | | | 12/1/48 | | | | 12,423,291 | |
| | 2,500,000 | | | Dallas-Fort Worth, TX International Airport ROLs3 | | | 13.321 | | | | 11/1/35 | | | | 1,010,600 | |
| | 7,025,000 | | | Detroit, MI Sewer Disposal System ROLs3 | | | 0.000 | 4 | | | 7/1/32 | | | | (5,259,969 | ) |
| | 2,595,000 | | | District of Columbia HFA RITES | | | 13.736 | | | | 6/1/38 | | | | 2,087,678 | |
| | 4,675,000 | | | Douglas County, NE Hospital Authority ROLs3 | | | 17.696 | | | | 11/1/48 | | | | 5,662,080 | |
| | 2,145,000 | | | FL HFC ROLs3 | | | 14.879 | | | | 7/1/38 | | | | 1,881,380 | |
| | 4,345,000 | | | Houston, TX HFC ROLs3 | | | 8.057 | | | | 12/1/40 | | | | 3,857,317 | |
F60 | OPPENHEIMER ROCHESTER NATIONAL MUNICIPALS
| | | | | | | | | | | | | | | | | |
| Principal | | | Inverse | | Coupon | | | Maturity | | | | |
| Amount | | | Floater1 | | Rate2 | | | Date | | | Value | |
| |
| $ | 5,650,000 | | | King County, WA Sewer ROLs3 | | | 16.975 | % | | | 1/1/43 | | | $ | 6,738,642 | |
| | 3,500,000 | | | KY EDFA (Baptist Healthcare System) ROLs3 | | | 15.764 | | | | 8/15/24 | | | | 4,294,850 | |
| | 4,330,000 | | | Long Beach, CA Harbor DRIVERS | | | 10.746 | | | | 5/15/27 | | | | 3,805,074 | |
| | 7,985,000 | | | Los Angeles, CA Dept. of Airports (Los Angeles International Airport) DRIVERS | | | 15.138 | | | | 5/15/30 | | | | 7,309,788 | |
| | 1,250,000 | | | Los Angeles, CA Dept. of Water & Power DRIVERS | | | 14.271 | | | | 7/1/34 | | | | 1,165,900 | |
| | 1,250,000 | | | Los Angeles, CA Dept. of Water & Power DRIVERS | | | 14.271 | | | | 7/1/39 | | | | 1,106,325 | |
| | 4,065,000 | | | Los Angeles, CA Harbor Dept. DRIVERS | | | 15.155 | | | | 8/1/39 | | | | 3,943,782 | |
| | 2,750,000 | | | Los Angeles, CA Unified School District ROLs3 | | | 14.101 | | | | 7/1/32 | | | | 2,485,780 | |
| | 1,835,000 | | | Los Angeles, CA Unified School District ROLs3 | | | 14.443 | | | | 1/1/34 | | | | 1,593,661 | |
| | 2,640,000 | | | Los Angeles, CA Unified School District ROLs3 | | | 14.448 | | | | 1/1/34 | | | | 2,292,787 | |
| | 2,190,000 | | | Los Angeles, CA Unified School District ROLs3 | | | 14.543 | | | | 1/1/34 | | | | 1,901,971 | |
| | 7,500,000 | | | Los Angeles, CA Unified School District ROLs3 | | | 14.161 | | | | 7/1/32 | | | | 6,779,400 | |
| | 9,165,000 | | | MA Educational Financing Authority ROLs3 | | | 15.604 | | | | 1/1/30 | | | | 9,279,196 | |
| | 3,940,000 | | | MA HFA ROLs3 | | | 10.134 | | | | 6/1/49 | | | | 3,083,129 | |
| | 3,125,000 | | | MA HFA ROLs3 | | | 10.367 | | | | 12/1/49 | | | | 2,668,125 | |
| | 13,020,000 | | | MA HFA ROLs3 | | | 14.209 | | | | 7/1/25 | | | | 12,012,252 | |
| | 4,035,000 | | | Metropolitan Washington D.C. Airport Authority, Series B DRIVERS | | | 10.122 | | | | 10/1/34 | | | | 2,966,250 | |
| | 5,000,000 | | | Miami-Dade County, FL Aviation ROLs3 | | | 10.986 | | | | 10/1/40 | | | | 3,103,850 | |
| | 2,500,000 | | | Miami-Dade County, FL School Board ROLs3 | | | 15.330 | | | | 2/1/27 | | | | 2,672,150 | |
| | 2,500,000 | | | Miami-Dade County, FL School Board ROLs3 | | | 14.461 | | | | 2/1/27 | | | | 2,463,450 | |
| | 12,500,000 | | | Miami-Dade County, FL School Board ROLs3 | | | 15.764 | | | | 2/1/34 | | | | 12,914,750 | |
| | 1,903,645 | | | Minneapolis & St. Paul, MN Hsg. Finance Board (Single Family Mtg.) ROLs3 | | | 7.049 | | | | 11/1/38 | | | | 1,499,311 | |
| | 2,885,000 | | | Newport Beach, CA GO ROLs3 | | | 14.455 | | | | 12/1/24 | | | | 3,073,102 | |
| | 60,560,000 | | | NJ Tobacco Settlement Financing Corp. ROLs3 | | | 4.709 | | | | 6/1/29 | | | | 29,825,800 | |
| | 117,755,000 | | | NJ Tobacco Settlement Financing Corp. ROLs3 | | | 3.929 | | | | 6/1/34 | | | | 52,987,395 | |
| | 9,500,000 | | | North Central Texas HFDC (Children’s Medical Center) DRIVERS | | | 16.736 | | | | 8/15/39 | | | | 9,845,420 | |
| | 2,500,000 | | | NYC GO ROLs3 | | | 15.705 | | | | 4/1/36 | | | | 2,822,700 | |
| | 1,475,000 | | | NYC GO ROLs3 | | | 14.539 | | | | 5/15/31 | | | | 1,524,590 | |
| | 875,000 | | | NYC GO ROLs3 | | | 14.551 | | | | 5/15/33 | | | | 883,348 | |
| | 5,395,000 | | | NYC GO ROLs3 | | | 14.548 | | | | 5/15/36 | | | | 5,267,570 | |
| | 5,000,000 | | | NYC Municipal Water Finance Authority DRIVERS | | | 14.199 | | | | 6/15/36 | | | | 5,007,500 | |
| | 5,000,000 | | | NYC Municipal Water Finance Authority DRIVERS | | | 14.199 | | | | 6/15/39 | | | | 4,929,800 | |
| | 3,020,000 | | | NYS DA (State Personal Income Tax Authority) DRIVERS | | | 14.193 | | | | 3/15/35 | | | | 3,042,771 | |
| | 2,500,000 | | | NYS DA ROLs3 | | | 14.401 | | | | 3/15/38 | | | | 2,499,450 | |
| | 5,000,000 | | | NYS UDC (State Personal Income Tax Authority) DRIVERS | | | 14.199 | | | | 3/15/37 | | | | 4,994,300 | |
| | 4,625,000 | | | Orlando, FL Utilities Commission ROLs | | | 15.330 | | | | 10/1/39 | | | | 4,805,283 | |
| | 3,750,000 | | | Orlando, FL Utilities Commission ROLs3 | | | 14.461 | | | | 10/1/33 | | | | 3,750,900 | |
| | 2,875,000 | | | PA Geisinger Authority Health System, Series A DRIVERS | | | 15.065 | | | | 6/1/39 | | | | 2,797,663 | |
| | 11,070,000 | | | Port of Seattle, WA Special Facilities ROLs3 | | | 11.791 | | | | 10/1/32 | | | | 8,716,186 | |
F61 | OPPENHEIMER ROCHESTER NATIONAL MUNICIPALS
NOTES TO FINANCIAL STATEMENTS Continued
1. Significant Accounting Policies Continued
| | | | | | | | | | | | | | | | | |
| Principal | | | Inverse | | Coupon | | | Maturity | | | | |
| Amount | | | Floater1 | | Rate2 | | | Date | | | Value | |
| |
| $ | 3,670,000 | | | Puerto Rico Sales Tax Financing Corp. DRIVERS | | | 11.606 | % | | | 8/1/57 | | | $ | 3,369,941 | |
| | 4,250,000 | | | Puerto Rico Sales Tax Financing Corp. ROLs3 | | | 8.350 | | | | 8/1/57 | | | | 4,678,825 | |
| | 3,210,000 | | | RI Hsg. & Mtg. Finance Corp. ROLs3 | | | 15.121 | | | | 10/1/47 | | | | 2,129,450 | |
| | 6,785,000 | | | RI Hsg. & Mtg. Finance Corp. ROLs3 | | | 6.528 | | | | 10/1/48 | | | | 4,558,434 | |
| | 6,140,000 | | | Richmond, VA Public Utility ROLs3 | | | 14.456 | | | | 1/15/40 | | | | 6,342,129 | |
| | 1,472,000 | | | Sabine Neches, TX HFC (Single Family Mtg.) ROLs | | | 7.822 | | | | 12/1/39 | | | | 1,343,023 | |
| | 3,750,000 | | | San Diego, CA Public Facilities Financing Authority DRIVERS | | | 15.588 | | | | 8/1/34 | | | | 3,806,475 | |
| | 5,425,000 | | | San Francisco, CA Bay Area Toll Authority ROLs3 | | | 11.502 | | | | 4/1/47 | | | | 4,925,520 | |
| | 7,370,000 | | | San Francisco, CA Bay Area Toll Authority ROLs3 | | | 11.186 | | | | 4/1/31 | | | | 7,302,343 | |
| | 1,700,000 | | | San Jacinto, TX Community College District ROLs3 | | | 14.011 | | | | 2/15/33 | | | | 1,711,594 | |
| | 2,500,000 | | | San Jacinto, TX Community College District ROLs3 | | | 14.445 | | | | 2/15/38 | | | | 2,544,450 | |
| | 3,700,000 | | | Sedgwick & Shawnee Counties, KS Hsg. (Single Family Mtg.) | | | 9.713 | | | | 12/1/38 | | | | 3,832,941 | |
| | 3,000,000 | | | Southern CA Metropolitan Water District DRIVERS | | | 14.288 | | | | 7/1/35 | | | | 3,102,300 | |
| | 3,500,000 | | | Tampa Bay, FL Regional Water Supply Authority DRIVERS | | | 14.139 | | | | 10/1/34 | | | | 3,575,810 | |
| | 3,500,000 | | | Tarrant County, TX Cultural Education Facilities Finance Corp. ROLs3 | | | 16.618 | | | | 11/15/24 | | | | 3,629,080 | |
| | 8,500,000 | | | Tarrant County, TX Cultural Education Facilities Finance Corp. ROLs3 | | | 18.356 | | | | 11/15/29 | | | | 9,534,280 | |
| | 375,000 | | | Tes Properties, WA DRIVERS | | | 15.870 | | | | 12/1/29 | | | | 409,193 | |
| | 3,000,000 | | | Tes Properties, WA DRIVERS | | | 16.303 | | | | 12/1/38 | | | | 3,002,340 | |
| | 3,375,000 | | | TX Dept. of Hsg. & Community Affairs (Multifamily Hsg.) ROLs3 | | | 7.925 | | | | 6/20/47 | | | | 3,217,455 | |
| | 103,825,000 | | | TX Municipal Gas Acquisition & Supply Corp. ROLs3 | | | 8.568 | | | | 12/15/17 | | | | 91,227,913 | |
| | 192,705,000 | | | TX Municipal Gas Acquisition & Supply Corp. ROLs3 | | | 9.926 | | | | 12/15/26 | | | | 176,833,816 | |
| | 4,875,000 | | | WA Health Care Facilities Authority ROLs3 | | | 14.371 | | | | 11/1/18 | | | | 4,830,930 | |
| | 5,670,000 | | | Wayne County, MI Airport Authority ROLs3 | | | 10.980 | | | | 12/1/29 | | | | 4,400,430 | |
| | 3,645,000 | | | Wayne County, MI Airport Authority ROLs3 | | | 10.981 | | | | 12/1/29 | | | | 2,828,848 | |
| | 1,875,000 | | | Westminster, CA Redevel. Agency Tax Allocation ROLs3 | | | 18.956 | | | | 11/1/39 | | | | 2,188,163 | |
| | 3,750,000 | | | Westminster, CA Redevel. Agency Tax Allocation ROLs3 | | | 17.218 | | | | 11/1/45 | | | | 2,989,725 | |
| | 5,270,000 | | | WI Hsg. & EDA DRIVERS | | | 7.887 | | | | 9/1/24 | | | | 5,063,258 | |
| | | | | | | | | | | | | | | | |
| | | | | | | | | | | | | | | $ | 813,709,334 | |
| | | | | | | | | | | | | | | | |
| | |
| 1. | | For a list of abbreviations used in the Inverse Floater table see the Portfolio Abbreviations table on page F48 of the Statement of Investments. |
| |
| 2. | | Represents the current interest rate for a variable rate bond known as an “inverse floater.” |
| |
| 3. | | Security is subject to a shortfall and forbearance agreement. |
| |
| 4. | | Interest rate is less than 0.0005%. |
F62 | OPPENHEIMER ROCHESTER NATIONAL MUNICIPALS
The Fund enters into shortfall and forbearance agreements with the sponsors of certain inverse floaters held by the Fund. These agreements commit the Fund to reimburse the sponsor of the inverse floater, in certain circumstances, for the amount of the difference between the liquidation value of the underlying security (which is the basis of the inverse floater) and the principal amount due to the holders of the short-term floating rate notes issued by the Trust in conjunction with the inverse floating rate security. Under the standard terms of an inverse floating rate security, absent such a shortfall and forbearance agreement, the Fund would not be required to make such a reimbursement. The Manager monitors the Fund’s potential exposure with respect to these agreements on a daily basis and intends to take action to terminate the Fund’s investment in such inverse floating rate securities, if it deems it appropriate to do so. As of July 31, 2009, in addition to the exposure detailed in the preceding table, the Fund’s maximum exposure under such agreements is estimated at $1,337,705,013.
Credit Risk. The Fund invests in high-yield, non-investment-grade bonds, which may be subject to a greater degree of credit risk. Credit risk relates to the ability of the issuer to meet interest or principal payments or both as they become due. The Fund may acquire securities in default, and is not obligated to dispose of securities whose issuers subsequently default. Information concerning securities in default as of July 31, 2009 is as follows:
| | | | | |
| Cost | | $ | 544,035,215 | |
| Market Value | | $ | 176,761,136 | |
| Market Value as a % of Net Assets | | | 3.63 | % |
The Fund has entered into forbearance agreements with certain obligors under which the Fund has agreed to temporarily forego payment of the original principal or coupon interest rates. As of July 31, 2009, securities with an aggregate market value of $13,233,136, representing 0.27% of the Fund’s net assets, were subject to these forbearance agreements. Principal payments of $735,000 are contractually owed to the Fund with respect to these securities and will not be collected under these forbearance agreements.
Allocation of Income, Expenses, Gains and Losses. Income, expenses (other than those attributable to a specific class), gains and losses are allocated on a daily basis to each class of shares based upon the relative proportion of net assets represented by such class. Operating expenses directly attributable to a specific class are charged against the operations of that class.
Federal Taxes. The Fund intends to comply with provisions of the Internal Revenue Code applicable to regulated investment companies and to distribute substantially all of its investment company taxable income, including any net realized gain on investments not offset by capital loss carryforwards, if any, to shareholders. Therefore, no federal income or excise tax provision is required. The Fund files income tax returns in U.S. federal and applicable state jurisdictions. The statute of limitations on the Fund’s tax return filings generally remain open for the three preceding fiscal reporting period ends.
F63 | OPPENHEIMER ROCHESTER NATIONAL MUNICIPALS
NOTES TO FINANCIAL STATEMENTS Continued
1. Significant Accounting Policies Continued
The tax components of capital shown in the following table represent distribution requirements the Fund must satisfy under the income tax regulations, losses the Fund may be able to offset against income and gains realized in future years and unrealized appreciation or depreciation of securities and other investments for federal income tax purposes.
| | | | | | | | | | | | | |
| | | | | | | | | | | Net Unrealized | |
| | | | | | | | | | | Depreciation | |
| | | | | | | | | | | Based on Cost | |
| | | | | | | | | | | of Securities and | |
| Undistributed | | Undistributed | | | Accumulated | | | Other Investments | |
| Net Investment | | Long-Term | | | Loss | | | for Federal Income | |
| Income | | Gain | | | Carryforward1,2,3,4 | | | Tax Purposes | |
| |
| $34,491,971 | | $ | — | | | $ | 1,478,155,014 | | | $ | 3,009,361,337 | |
| | |
| 1. | | As of July 31, 2009, the Fund had $648,457,056 of net capital loss carryforwards available to offset future realized capital gains, if any, and thereby reduce future taxable gain distributions. As of July 31, 2009, details of the capital loss carryforwards were as follows: |
| | | | | |
| Expiring | | | | |
| |
| 2014 | | $ | 187,364 | |
| 2016 | | | 81,480,187 | |
| 2017 | | | 566,789,505 | |
| | | | |
| Total | | $ | 648,457,056 | |
| | | | |
| | |
| 2. | | As of July 31, 2009, the Fund had $829,697,958 of post-October losses available to offset future realized capital gains, if any. Such losses, if unutilized, will expire in 2018. |
| |
| 3. | | During the fiscal year ended July 31, 2009, the Fund did not utilize any capital loss carryforward. |
| |
| 4. | | During the fiscal year ended July 31, 2008, the Fund did not utilize any capital loss carryforward. |
Net investment income (loss) and net realized gain (loss) may differ for financial statement and tax purposes. The character of dividends and distributions made during the fiscal year from net investment income or net realized gains may differ from their ultimate characterization for federal income tax purposes. Also, due to timing of dividends and distributions, the fiscal year in which amounts are distributed may differ from the fiscal year in which the income or net realized gain was recorded by the Fund.
Accordingly, the following amounts have been reclassified for July 31, 2009. Net assets of the Fund were unaffected by the reclassifications.
| | | | | |
| Reduction | | Reduction | |
| to Accumulated | | to Accumulated | |
| Net Investment | | Net Realized Loss | |
| Income | | on Investments | |
| |
| $7,786,364 | | $ | 7,786,364 | |
F64 | OPPENHEIMER ROCHESTER NATIONAL MUNICIPALS
The tax character of distributions paid during the years ended July 31, 2009 and July 31, 2008 was as follows:
| | | | | | | | | |
| | | Year Ended | | | Year Ended | |
| | | July 31, 2009 | | | July 31, 2008 | |
| |
| Distributions paid from: | | | | | | | | |
| Exempt-interest dividends | | $ | 453,500,939 | | | $ | 439,859,049 | |
| Ordinary income | | | 2,626,744 | | | | 2,702,450 | |
| | | |
| Total | | $ | 456,127,683 | | | $ | 442,561,499 | |
| | | |
The aggregate cost of securities and other investments and the composition of unrealized appreciation and depreciation of securities and other investments for federal income tax purposes as of July 31, 2009 are noted in the following table. The primary difference between book and tax appreciation or depreciation of securities and other investments, if applicable, is attributable to the tax deferral of losses or tax realization of financial statement unrealized gain or loss.
| | | | | |
| Federal tax cost of securities | | $ | 8,079,682,952 | |
| | | | |
| |
| Gross unrealized appreciation | | $ | 165,130,985 | |
| Gross unrealized depreciation | | | (3,174,492,322 | ) |
| | | | |
| Net unrealized depreciation | | $ | (3,009,361,337 | ) |
| | | | |
Trustees’ Compensation. The Fund has adopted an unfunded retirement plan (the “Plan”) for the Fund’s independent trustees. Benefits are based on years of service and fees paid to each trustee during their period of service. The Plan was frozen with respect to adding new participants effective December 31, 2006 (the “Freeze Date”) and existing Plan Participants as of the Freeze Date will continue to receive accrued benefits under the Plan. Active independent trustees as of the Freeze Date have each elected a distribution method with respect to their benefits under the Plan. During the year ended July 31, 2009, the Fund’s projected benefit obligations, payments to retired trustees and accumulated liability were as follows:
| | | | | |
| Projected Benefit Obligations Increased | | $ | 70,394 | |
| Payments Made to Retired Trustees | | | 45,754 | |
| Accumulated Liability as of July 31, 2009 | | | 465,816 | |
The Board of Trustees has adopted a compensation deferral plan for independent trustees that enables trustees to elect to defer receipt of all or a portion of the annual compensation they are entitled to receive from the Fund. For purposes of determining the amount owed to the Trustee under the plan, deferred amounts are treated as though equal dollar amounts had been invested in shares of the Fund or in other Oppenheimer funds selected by the Trustee. The Fund purchases shares of the funds selected for deferral by the Trustee in amounts equal to his or her deemed investment, resulting in a Fund asset equal to the deferred compensation liability. Such assets are included as a component of “Other” within the asset section of the Statement of Assets and Liabilities. Deferral of trustees’ fees under
F65 | OPPENHEIMER ROCHESTER NATIONAL MUNICIPALS
NOTES TO FINANCIAL STATEMENTS Continued
1. Significant Accounting Policies Continued
the plan will not affect the net assets of the Fund, and will not materially affect the Fund’s assets, liabilities or net investment income per share. Amounts will be deferred until distributed in accordance to the compensation deferral plan.
Dividends and Distributions to Shareholders. Dividends and distributions to shareholders, which are determined in accordance with income tax regulations and may differ from U.S. generally accepted accounting principles, are recorded on the ex-dividend date. Income distributions, if any, are declared daily and paid monthly. Capital gain distributions, if any, are declared and paid annually.
Investment Income. Interest income is recognized on an accrual basis. Discount and premium, which are included in interest income on the Statement of Operations, are amortized or accreted daily.
Custodian Fees. “Custodian fees and expenses” in the Statement of Operations may include interest expense incurred by the Fund on any cash overdrafts of its custodian account during the period. Such cash overdrafts may result from the effects of failed trades in portfolio securities and from cash outflows resulting from unanticipated shareholder redemption activity. The Fund pays interest to its custodian on such cash overdrafts, to the extent they are not offset by positive earnings on cash balances maintained by the Fund, at a rate equal to the 1 Month LIBOR Rate plus 2.00%. The “Reduction to custodian expenses” line item, if applicable, represents earnings on cash balances maintained by the Fund during the period. Such interest expense and other custodian fees may be paid with these earnings.
Security Transactions. Security transactions are recorded on the trade date. Realized gains and losses on securities sold are determined on the basis of identified cost.
Indemnifications. The Fund’s organizational documents provide current and former trustees and officers with a limited indemnification against liabilities arising in connection with the performance of their duties to the Fund. In the normal course of business, the Fund may also enter into contracts that provide general indemnifications. The Fund’s maximum exposure under these arrangements is unknown as this would be dependent on future claims that may be made against the Fund. The risk of material loss from such claims is considered remote.
Other. The preparation of financial statements in conformity with accounting principles generally accepted in the United States of America requires management to make estimates and assumptions that affect the reported amounts of assets and liabilities and disclosure of contingent assets and liabilities at the date of the financial statements and the reported amounts of increases and decreases in net assets from operations during the reporting period. Actual results could differ from those estimates.
F66 | OPPENHEIMER ROCHESTER NATIONAL MUNICIPALS
2. Shares of Beneficial Interest
The Fund has authorized an unlimited number of no par value shares of beneficial interest of each class. Transactions in shares of beneficial interest were as follows:
| | | | | | | | | | | | | | | | | |
| | | Year Ended July 31, 2009 | | | Year Ended July 31, 2008 | |
| | | Shares | | | Amount | | | Shares | | | Amount | |
| |
Class A | | | | | | | | | | | | | | | | |
| Sold | | | 276,370,390 | | | $ | 1,681,940,175 | | | | 278,856,237 | | | $ | 2,916,922,847 | |
| Dividends and/or distributions reinvested | | | 32,720,913 | | | | 198,677,274 | | | | 18,646,375 | | | | 191,467,084 | |
| Redeemed | | | (238,364,361 | ) | | | (1,487,836,632 | ) | | | (264,338,488 | ) | | | (2,833,866,074 | ) |
| | | |
| Net increase | | | 70,726,942 | | | $ | 392,780,817 | | | | 33,164,124 | | | $ | 274,523,857 | |
| | | |
| | | | | | | | | | | | | | | | | |
Class B | | | | | | | | | | | | | | | | |
| Sold | | | 8,133,260 | | | $ | 50,040,887 | | | | 6,521,405 | | | $ | 67,139,700 | |
| Dividends and/or distributions reinvested | | | 1,784,195 | | | | 10,905,137 | | | | 1,277,996 | | | | 13,230,189 | |
| Redeemed | | | (13,955,886 | ) | | | (92,111,789 | ) | | | (14,920,016 | ) | | | (155,784,941 | ) |
| | | |
| Net decrease | | | (4,038,431 | ) | | $ | (31,165,765 | ) | | | (7,120,615 | ) | | $ | (75,415,052 | ) |
| | | |
| | | | | | | | | | | | | | | | | |
Class C | | | | | | | | | | | | | | | | |
| Sold | | | 77,123,003 | | | $ | 473,777,038 | | | | 86,844,863 | | | $ | 900,968,735 | |
| Dividends and/or distributions reinvested | | | 9,966,026 | | | | 60,236,039 | | | | 5,305,983 | | | | 54,272,275 | |
| Redeemed | | | (61,182,005 | ) | | | (384,462,876 | ) | | | (76,450,271 | ) | | | (813,800,430 | ) |
| | | |
| Net increase | | | 25,907,024 | | | $ | 149,550,201 | | | | 15,700,575 | | | $ | 141,440,580 | |
| | | |
The Fund may participate in the ReFlow, LLC (“ReFlow”) liquidity program which is designed to provide an alternative source of funding to meet shareholder redemptions. ReFlow provides liquidity by being prepared to purchase Fund shares at the closing net asset value equal to the amount of the net redemptions on any given day. On subsequent days, when the Fund experiences net subscriptions, ReFlow redeems its holdings at the net asset value on that day, subject to maximum holding period restrictions set by ReFlow. The Fund will waive its transaction fees with respect to redemptions by ReFlow. When participating in the ReFlow program, the Fund pays ReFlow a fee equal to the value of shares purchased for the period held times a rate determined by a daily auction with other participating mutual funds in the ReFlow program. ReFlow is prohibited from acquiring more than 3% of the outstanding shares of the Fund and there is no assurance that ReFlow will have sufficient funds available to meet the Fund’s liquidity needs on a particular day. Fees incurred by the Fund during the period, if any, under the ReFlow liquidity program are included in “Other Expenses” per the Statement of Operations and fees payable by the Fund to ReFlow at period end, if any, are included in “Other Liabilities” per the Statement of Assets and Liabilities. As of July 31, 2009, ReFlow did not hold any shares of the Fund.
F67 | OPPENHEIMER ROCHESTER NATIONAL MUNICIPALS
NOTES TO FINANCIAL STATEMENTS Continued
3. Purchases and Sales of Securities
The aggregate cost of purchases and proceeds from sales of securities, other than short-term obligations, for the year ended July 31, 2009, were as follows:
| | | | | | | | | |
| | | Purchases | | | Sales | |
| |
| Investment securities | | $ | 1,381,286,295 | | | $ | 1,240,867,491 | |
4. Fees and Other Transactions with Affiliates
Management Fees. Under the investment advisory agreement, the Fund pays the Manager a management fee based on the daily net assets of the Fund at an annual rate as shown in the following table:
| | | | | |
| Fee Schedule from Aug. 1, 2008 to Aug. 31, 2008 |
| |
| Up to $200 million | | | 0.60 | % |
| Next $100 million | | | 0.55 | |
| Next $200 million | | | 0.50 | |
| Next $250 million | | | 0.45 | |
| Next $250 million | | | 0.40 | |
| Over $1 billion | | | 0.35 | |
| | | | | |
| Fee Schedule from Sept. 1, 2008 to July 31, 2009 |
| |
| Up to $200 million | | | 0.60 | % |
| Next $100 million | | | 0.55 | |
| Next $200 million | | | 0.50 | |
| Next $250 million | | | 0.45 | |
| Next $250 million | | | 0.40 | |
| Next $10 billion | | | 0.35 | |
| Over $11 billion | | | 0.34 | |
Transfer Agent Fees. OppenheimerFunds Services (“OFS”), a division of the Manager, acts as the transfer and shareholder servicing agent for the Fund. The Fund pays OFS a per account fee. For the year ended July 31, 2009, the Fund paid $3,727,760 to OFS for services to the Fund.
Distribution and Service Plan (12b-1) Fees. Under its General Distributor’s Agreement with the Fund, OppenheimerFunds Distributor, Inc. (the “Distributor”) acts as the Fund’s principal underwriter in the continuous public offering of the Fund’s classes of shares.
Service Plan for Class A Shares. The Fund has adopted a Service Plan (the “Plan”) for Class A shares under Rule 12b-1 of the Investment Company Act of 1940. Under the Plan, the Fund reimburses the Distributor for a portion of its costs incurred for services provided to accounts that hold Class A shares. Reimbursement is made periodically at an annual rate of up to 0.15% of the daily net assets of Class A shares of the Fund. The Distributor currently uses all of those fees to pay dealers, brokers, banks and other financial institutions periodically for providing personal service and maintenance of accounts of their customers that hold Class A shares. Any unreimbursed expenses the Distributor incurs with respect to Class A shares in any fiscal year cannot be recovered in subsequent periods. Fees incurred by the Fund under the Plan are detailed in the Statement of Operations.
Distribution and Service Plans for Class B and Class C Shares. The Fund has adopted Distribution and Service Plans (the “Plans”) for Class B and Class C shares under Rule 12b-1 of the Investment Company Act of 1940 to compensate the Distributor for its services in connection with the distribution of those shares and servicing accounts. Under the Plans,
F68 | OPPENHEIMER ROCHESTER NATIONAL MUNICIPALS
the Fund pays the Distributor an annual asset-based sales charge of 0.75% on Class B and Class C shares daily net assets. The Distributor also receives a service fee of 0.15% per year under each plan. If either the Class B or Class C plan is terminated by the Fund or by the shareholders of a class, the Board of Trustees and its independent trustees must determine whether the Distributor shall be entitled to payment from the Fund of all or a portion of the service fee and/or asset-based sales charge in respect to shares sold prior to the effective date of such termination. Fees incurred by the Fund under the Plans are detailed in the Statement of Operations. The Distributor determines its uncompensated expenses under the Plans at calendar quarter ends. The Distributor’s aggregate uncompensated expenses under the Plans at June 30, 2009 were as follows:
| | | | | |
| Class B | | $ | 14,402,276 | |
| Class C | | | 31,902,928 | |
Sales Charges. Front-end sales charges and contingent deferred sales charges (“CDSC”) do not represent expenses of the Fund. They are deducted from the proceeds of sales of Fund shares prior to investment or from redemption proceeds prior to remittance, as applicable. The sales charges retained by the Distributor from the sale of shares and the CDSC retained by the Distributor on the redemption of shares is shown in the following table for the period indicated.
| | | | | | | | | | | | | | | | | |
| | | | | | | Class A | | | Class B | | | Class C | |
| | | Class A | | | Contingent | | | Contingent | | | Contingent | |
| | | Front-End | | | Deferred | | | Deferred | | | Deferred | |
| | | Sales Charges | | | Sales Charges | | | Sales Charges | | | Sales Charges | |
| | | Retained by | | | Retained by | | | Retained by | | | Retained by | |
| Year Ended | | Distributor | | | Distributor | | | Distributor | | | Distributor | |
| |
| July 31, 2009 | | $ | 2,295,822 | | | $ | 624,341 | | | $ | 829,525 | | | $ | 536,559 | |
Waivers and Reimbursements of Expenses. OFS has voluntarily agreed to limit transfer and shareholder servicing agent fees for all classes to 0.35% of average annual net assets per class. This undertaking may be amended or withdrawn at any time.
5. Option Activity
The Fund may buy and sell put and call options, or write put and covered call options. When an option is written, the Fund receives a premium and becomes obligated to sell or purchase the underlying security at a fixed price, upon exercise of the option.
Options are valued daily based upon the last sale price on the principal exchange on which the option is traded. The difference between the premium received or paid, and market value of the option, is recorded as unrealized appreciation or depreciation. The net change in unrealized appreciation or depreciation is reported in the Statement of Operations. When an option is exercised, the cost of the security purchased or the proceeds of the security sale are adjusted by the amount of premium received or paid. Upon the expiration or closing of the option transaction, a gain or loss is reported in the Statement of Operations.
F69 | OPPENHEIMER ROCHESTER NATIONAL MUNICIPALS
NOTES TO FINANCIAL STATEMENTS
5. Option Activity Continued
Securities designated to cover outstanding call or put options are noted in the Statement of Investments where applicable. Options written are reported in a schedule following the Statement of Investments and as a liability in the Statement of Assets and Liabilities.
The risk in writing a call option is that the Fund gives up the opportunity for profit if the market price of the security increases and the option is exercised. The risk in writing a put option is that the Fund may incur a loss if the market price of the security decreases and the option is exercised. The risk in buying an option is that the Fund pays a premium whether or not the option is exercised. The Fund also has the additional risk that there may be an illiquid market where the Fund is unable to close the contract.
Additional associated risks to the Fund include counterparty credit risk for over-the-counter options and liquidity risk.
Written option activity for the year ended July 31, 2009 was as follows:
| | | | | | | | | |
| | | Call Options | |
| | | Number of | | | Amount of | |
| | | Contracts | | | Premiums | |
| | |
| Options outstanding as of July 31, 2008 | | | 439 | | | $ | 63,477 | |
| Options closed or expired | | | (191 | ) | | | (30,013 | ) |
| Options exercised | | | (248 | ) | | | (33,464 | ) |
| | | |
| Options outstanding as of July 31, 2009 | | | — | | | $ | — | |
| | | |
6. Illiquid Securities
As of July 31, 2009, investments in securities included issues that are illiquid. Investments may be illiquid because they do not have an active trading market, making it difficult to value them or dispose of them promptly at an acceptable price. The Fund will not invest more than 15% of its net assets (determined at the time of purchase and reviewed periodically) in illiquid securities. Securities that are illiquid are marked with an applicable footnote on the Statement of Investments.
7. Borrowings
The Fund can borrow money from banks in amounts up to one third of its total assets (including the amount borrowed) less all liabilities and indebtedness other than borrowings. The Fund can use those borrowings for investment-related purposes such as purchasing portfolio securities. The Fund can also borrow for other purposes, such as to raise money to unwind or “collapse” trusts that issued “inverse floaters” to the Fund, or to contribute to such trusts to enable them to meet tenders of their short-term securities by the holders of those securities. The Fund also may borrow to meet redemption obligations or for temporary and emergency purposes. The purchase of securities with borrowed funds
F70 | OPPENHEIMER ROCHESTER NATIONAL MUNICIPALS
creates leverage in the Fund. The use of leverage will subject the Fund to greater costs than funds that do not borrow for leverage, and may also make the Fund’s share price more sensitive to interest changes. The interest on borrowed money is an expense that might reduce the Fund’s yield. Expenses incurred by the Fund with respect to interest on borrowings and commitment fees are disclosed separately or as other expenses on the Statement of Operations.
The Fund entered into a Revolving Credit and Security Agreement (the “Agreement”) with a conduit lender and a bank which enables it to participate with certain other Oppenheimer funds in a committed, secured borrowing facility that permits borrowings of up to $3.0 billion, collectively. To secure the loan, the Fund pledges investment securities in accordance with the terms of the Agreement. Interest is charged to the Fund, based on its borrowings, at current commercial paper issuance rates (0.437% as of July 31, 2009). The Fund pays additional fees annually to its lender on its outstanding borrowings to manage and administer the facility and is allocated its pro-rata share of an annual commitment fee on the amount of the unused portion of the total facility size. Total fees and interest that are included in expenses on the Fund’s Statement of Operations related to its participation in the borrowing facility during the year ended July 31, 2009 equal 1.01% of the Fund’s average net assets on an annualized basis. The Fund has the right to prepay such loans and terminate its participation in the conduit loan facility at any time upon prior notice.
As of July 31, 2009, the Fund had borrowings outstanding at an interest rate of 0.437%. Details of the borrowings for the year ended July 31, 2009 are as follows:
| | | | | |
| Average Daily Loan Balance | | $ | 601,371,233 | |
| Average Daily Interest Rate | | | 1.934 | % |
| Fees Paid | | $ | 41,562,861 | |
| Interest Paid | | $ | 12,902,606 | |
8. Subsequent Events Evaluation
The Fund has evaluated the need for disclosures and/or adjustments resulting from subsequent events through September 17, 2009, the date the financial statements were available to be issued. This evaluation determined that there are no subsequent events that necessitated disclosures and/or adjustments.
9. Pending Litigation
During 2009, a number of complaints have been filed in federal courts against the Manager, the Distributor, and certain mutual funds advised by the Manager and distributed by the Distributor—including the Fund. The complaints naming the Fund as a defendant also name certain officers, trustees and former trustees of the Fund. The plaintiffs are seeking class action status on behalf of purchasers of shares of the Fund during a particular time period. The complaints against the Fund raise claims under federal securities laws alleging that, among other things, the disclosure documents of the Fund contained misrepresentations
F71 | OPPENHEIMER ROCHESTER NATIONAL MUNICIPALS
NOTES TO FINANCIAL STATEMENTS Continued
9. Pending Litigation Continued
and omissions, that the Fund’s investment policies were not followed, and that the Fund and the other defendants violated federal securities laws and regulations and certain state laws. The plaintiffs seek unspecified damages, equitable relief and an award of attorneys’ fees and litigation expenses. The litigations involving certain other Oppenheimer funds are similar in nature.
A complaint has been brought in state court against the Manager, the Distributor and another subsidiary of the Manager (but not against the Fund), on behalf of the Oregon College Savings Plan Trust, and other complaints have been brought in state court against the Manager and that subsidiary (but not against the Fund), on behalf of the New Mexico Education Plan Trust. All of these complaints allege breach of contract, breach of fiduciary duty, negligence and violation of state securities laws, and seek compensatory damages, equitable relief and an award of attorneys’ fees and litigation expenses.
Other complaints have been filed in 2008 and 2009 in state and federal courts, by investors who made investments through an affiliate of the Manager, against the Manager and certain of its affiliates. Those complaints relate to the alleged investment fraud perpetrated by Bernard Madoff and his firm (“Madoff”) and allege a variety of claims, including breach of fiduciary duty, fraud, negligent misrepresentation, unjust enrichment, and violation of federal and state securities laws and regulations, among others. They seek unspecified damages, equitable relief and an award of attorneys’ fees and litigation expenses. None of the suits have named the Distributor, any of the Oppenheimer mutual funds or any of their independent Trustees or Directors. None of the Oppenheimer funds invested in any funds or accounts managed by Madoff.
The Manager believes that the lawsuits described above are without legal merit and intends to defend them vigorously. The Fund’s Board of Trustees has also engaged counsel to defend the suits vigorously on behalf of the Fund, the Fund’s Board and the Trustees named in those suits. While it is premature to render any opinion as to the likelihood of an outcome in these lawsuits, or whether any costs that the Fund may bear in defending the suits might not be reimbursed by insurance or the Manager, the Manager believes that these suits should not have any material effect on the operations of the Fund and that the outcome of all of the suits together should not impair the ability of the Manager or the Distributor to perform their respective duties to the Fund.
F72 | OPPENHEIMER ROCHESTER NATIONAL MUNICIPALS
REPORT OF INDEPENDENT REGISTERED PUBLIC ACCOUNTING FIRM
The Board of Trustees and Shareholders of
Oppenheimer Multi-State Municipal Trust:
We have audited the accompanying statement of assets and liabilities of Oppenheimer Rochester National Municipals (one of the portfolios constituting the Oppenheimer Multi-State Municipal Trust), including the statement of investments, as of July 31, 2009, and the related statements of operations and cash flows for the year then ended, the statements of changes in net assets for each of the years in the two-year period then ended, and the financial highlights for each of the years in the five-year period then ended. These financial statements and financial highlights are the responsibility of the Fund’s management. Our responsibility is to express an opinion on these financial statements and financial highlights based on our audits.
We conducted our audits in accordance with the standards of the Public Company Accounting Oversight Board (United States). Those standards require that we plan and perform the audit to obtain reasonable assurance about whether the financial statements and financial highlights are free of material misstatement. An audit includes examining, on a test basis, evidence supporting the amounts and disclosures in the financial statements. Our procedures included confirmation of securities owned as of July 31, 2009, by correspondence with the custodian and brokers or by other appropriate auditing procedures where replies from brokers were not received. An audit also includes assessing the accounting principles used and significant estimates made by management, as well as evaluating the overall financial statement presentation. We believe that our audits provide a reasonable basis for our opinion.
In our opinion, the financial statements and financial highlights referred to above present fairly, in all material respects, the financial position of Oppenheimer Rochester National Municipals as of July 31, 2009, the results of its operations and its cash flows for the year then ended, the changes in its net assets for each of the years in the two-year period then ended, and the financial highlights for each of the years in the five-year period then ended, in conformity with U.S. generally accepted accounting principles.
KPMG llp
Denver, Colorado
September 17, 2009
F73 | OPPENHEIMER ROCHESTER NATIONAL MUNICIPALS
THIS PAGE INTENTIONALLY LEFT BLANK.
F74 | OPPENHEIMER ROCHESTER NATIONAL MUNICIPALS
FEDERAL INCOME TAX INFORMATION Unaudited
In early 2009, if applicable, shareholders of record received information regarding all dividends and distributions paid to them by the Fund during calendar year 2008. Regulations of the U.S. Treasury Department require the Fund to report this information to the Internal Revenue Service.
None of the dividends paid by the Fund during the fiscal year ended July 31, 2009 are eligible for the corporate dividend-received deduction. 99.42% of the dividends were derived from interest on municipal bonds and are not subject to federal income taxes. To the extent a shareholder is subject to any state or local tax laws, some or all of the dividends received may be taxable.
The foregoing information is presented to assist shareholders in reporting distributions received from the Fund to the Internal Revenue Service. Because of the complexity of the federal regulations which may affect your individual tax return and the many variations in state and local tax regulations, we recommend that you consult your tax advisor for specific guidance.
27 | OPPENHEIMER ROCHESTER NATIONAL MUNICIPALS
BOARD APPROVAL OF THE FUND’S INVESTMENT ADVISORY AGREEMENT Unaudited
Each year, the Board of Trustees (the “Board”), including a majority of the independent Trustees, is required to determine whether to renew the Fund’s investment advisory agreement (the “Agreement”). The Investment Company Act of 1940, as amended, requires that the Board request and evaluate, and that the Manager provide, such information as may be reasonably necessary to evaluate the terms of the Agreement. The Board employs an independent consultant to prepare a report that provides information, including comparative information, that the Board requests for that purpose. In addition, the Board receives information throughout the year regarding Fund services, fees, expenses and performance.
The Manager and the independent consultant provided information to the Board on the following factors: (i) the nature, quality and extent of the Manager’s services, (ii) the investment performance of the Fund and the Manager, (iii) the fees and expenses of the Fund, including comparative expense information, (iv) the profitability of the Manager and its affiliates, including an analysis of the cost of providing services, (v) whether economies of scale are realized as the Fund grows and whether fee levels reflect these economies of scale for Fund investors and (vi) other benefits to the Manager from its relationship with the Fund. The Board was aware that there are alternatives to retaining the Manager.
Outlined below is a summary of the principal information considered by the Board as well as the Board’s conclusions.
Nature, Quality and Extent of Services. The Board considered information about the nature and extent of the services provided to the Fund and information regarding the Manager’s key personnel who provide such services. The Manager’s duties include providing the Fund with the services of the portfolio managers and the Manager’s investment team, who provide research, analysis and other advisory services in regard to the Fund’s investments; securities trading services; oversight of third party service providers; monitoring compliance with applicable Fund policies and procedures and adherence to the Fund’s investment restrictions. The Manager is responsible for providing certain administrative services to the Fund as well. Those services include providing and supervising all administrative and clerical personnel who are necessary in order to provide effective corporate administration for the Fund; compiling and maintaining records with respect to the Fund’s operations; preparing and filing reports required by the Securities and Exchange Commission; preparing periodic reports regarding the operations of the Fund for its shareholders; preparing proxy materials for shareholder meetings; and preparing the registration statements required by Federal and state securities laws for the sale of the Fund’s shares. The Manager also provides the Fund with office space, facilities and equipment.
The Board also considered the quality of the services provided and the quality of the Manager’s resources that are available to the Fund. The Board took account of the fact
28 | OPPENHEIMER ROCHESTER NATIONAL MUNICIPALS
that the Manager has had over forty years of experience as an investment adviser and that its assets under management rank it among the top mutual fund managers in the United States. The Board evaluated the Manager’s advisory, administrative, accounting, legal and compliance services, and information the Board has received regarding the experience and professional qualifications of the Manager’s key personnel and the size and functions of its staff. In its evaluation of the quality of the portfolio management services provided, the Board considered the experience of Daniel Loughran, Scott Cottier and Troy Willis, the portfolio managers for the Fund, and the Manager’s investment team and analysts. The Board members also considered the totality of their experiences with the Manager as directors or trustees of the Fund and other funds advised by the Manager. The Board considered information regarding the quality of services provided by affiliates of the Manager, which its members have become knowledgeable about in connection with the renewal of the Fund’s service agreements. The Board concluded, in light of the Manager’s experience, reputation, personnel, operations and resources, that the Fund benefits from the services provided under the Agreement.
Investment Performance of the Manager and the Fund. Throughout the year, the Manager provided information on the investment performance of the Fund and the Manager, including comparative performance information. The Board also reviewed information, prepared by the Manager and by the independent consultant, comparing the Fund’s historical performance to relevant market indices and to the performance of other retail front-end load and no-load high yield municipal debt funds. The Board noted that the Fund’s one-year, three-year, five-year and ten-year performance was below its peer group median as of December 31, 2008. The Board also noted that the Fund’s recent performance has improved and its year-to date performance through June 5, 2009 (the most recent date available at the Board meeting at which the independent Trustees considered the matter) was in the top quintile of its peer group category.
Costs of Services by the Manager. The Board reviewed the fees paid to the Manager and the other expenses borne by the Fund. The Board also considered the comparability of the fees charged and the services provided to the Fund to the fees and services for other clients or accounts advised by the Manager. The independent consultant provided comparative data in regard to the fees and expenses of the Fund and other high yield municipal debt funds with comparable asset levels and distribution features. The Board noted that the Fund’s contractual and actual management fees and total expenses are lower than its peer group median.
Economies of Scale and Profits Realized by the Manager. The Board considered information regarding the Manager’s costs in serving as the Fund’s investment adviser,
29 | OPPENHEIMER ROCHESTER NATIONAL MUNICIPALS
BOARD APPROVAL OF THE FUND’S INVESTMENT ADVISORY AGREEMENT Unaudited / Continued
including the costs associated with the personnel and systems necessary to manage the Fund, and information regarding the Manager’s profitability from its relationship with the Fund. The Board reviewed whether the Manager may realize economies of scale in managing and supporting the Fund. The Board noted that the Fund currently has management fee breakpoints, which are intended to share with Fund shareholders economies of scale that may exist as the Fund’s assets grow. The Board also noted that effective September 1, 2008, the Fund pays the Manager an advisory fee at the following annual rate that declines as the Fund’s assets grow: 0.60% of the first $200 million of average annual net assets, 0.55% of the next $100 million, 0.50% of the next $200 million, 0.45% of the next $250 million, 0.40% of the next $250 million, 0.35% of the next $10 billion, and 0.34% of average annual net assets in excess over $11 billion.
Other Benefits to the Manager. In addition to considering the profits realized by the Manager, the Board considered information that was provided regarding the direct and indirect benefits the Manager receives as a result of its relationship with the Fund, including compensation paid to the Manager’s affiliates. The Board also considered that the Manager must be able to pay and retain experienced professional personnel at competitive rates to provide quality services to the Fund.
Conclusions. These factors were also considered by the independent Trustees meeting separately from the full Board, assisted by experienced counsel to the Fund and to the independent Trustees. Fund counsel and the independent Trustees’ counsel are independent of the Manager within the meaning and intent of the Securities and Exchange Commission Rules.
Based on its review of the information it received and its evaluations described above, at meetings in June 2009, the Board, including a majority of the independent Trustees, decided to continue the Agreement for the period through November 30, 2009. In arriving at this decision, the Board did not single out any factor or factors as being more important than others, but considered all of the above information, and considered the terms and conditions of the Agreement, including the management fee, in light of all of the surrounding circumstances.
30 | OPPENHEIMER ROCHESTER NATIONAL MUNICIPALS
PORTFOLIO PROXY VOTING POLICIES AND PROCEDURES; UPDATES TO STATEMENTS OF INVESTMENTS Unaudited
The Fund has adopted Portfolio Proxy Voting Policies and Procedures under which the Fund votes proxies relating to securities (“portfolio proxies”) held by the Fund. A description of the Fund’s Portfolio Proxy Voting Policies and Procedures is available (i) without charge, upon request, by calling the Fund toll-free at 1.800.525.7048, (ii) on the Fund’s website at www.oppenheimerfunds.com, and (iii) on the SEC’s website at www.sec.gov. In addition, the Fund is required to file Form N-PX, with its complete proxy voting record for the 12 months ended June 30th, no later than August 31st of each year. The Fund’s voting record is available (i) without charge, upon request, by calling the Fund toll-free at 1.800.525.7048, and (ii) in the Form N-PX filing on the SEC’s website at www.sec.gov.
The Fund files its complete schedule of portfolio holdings with the SEC for the first quarter and the third quarter of each fiscal year on Form N-Q. The Fund’s Form N-Q filings are available on the SEC’s website at http://www.sec.gov. Those forms may be reviewed and copied at the SEC’s Public Reference Room in Washington, D.C. Information on the operation of the Public Reference Room may be obtained by calling 1-800-SEC-0330.
Householding—Delivery of Shareholder Documents
This is to inform you about OppenheimerFunds’ “householding” policy. If more than one member of your household maintains an account in a particular fund, OppenheimerFunds will mail only one copy of the fund’s prospectus, annual and semiannual report and privacy policy. The consolidation of these mailings, called householding, benefits your fund through reduced mailing expense, and benefits you by reducing the volume of mail you receive from OppenheimerFunds. Householding does not affect the delivery of your account statements.
Please note that we will continue to household these mailings for as long as you remain an OppenheimerFunds shareholder, unless you request otherwise. If you prefer to receive multiple copies of these materials, please call us at 1.800.CALL-OPP (225-5677). You may also notify us in writing or via email. We will begin sending you individual copies of the prospectus, reports and privacy policy within 30 days of receiving your request to stop householding.
31 | OPPENHEIMER ROCHESTER NATIONAL MUNICIPALS
TRUSTEES AND OFFICERS Unaudited
| | | |
| Name, Position(s) Held with the | | Principal Occupation(s) During the Past 5 Years; Other Trusteeships/Directorships Held; Number of Portfolios |
| Fund, Length of Service, Age | | in the Fund Complex Currently Overseen |
INDEPENDENT
TRUSTEES | | The address of each Trustee in the chart below is 6803 S. Tucson Way, Centennial, Colorado 80112-3924. Each Trustee serves for an indefinite term, or until his or her resignation, retirement, death or removal. |
| | | |
Brian F. Wruble,
Chairman of the Board
of Trustees (since 2007), Trustee (since 2005)
Age: 66 | | Chairman (since August 2007) and Trustee (since August 1991) of the Board of Trustees of The Jackson Laboratory (non-profit); Director of Special Value Opportunities Fund, LLC (registered investment company) (affiliate of the Manager’s parent company) (since September 2004); Member of Zurich Financial Investment Management Advisory Council (insurance) (since 2004); Treasurer and Trustee of the Institute for Advanced Study (non-profit educational institute) (since May 1992); General Partner of Odyssey Partners, L.P. (hedge fund) (September 1995-December 2007); Special Limited Partner of Odyssey Investment Partners, LLC (private equity investment) (January 1999- September 2004). Oversees 60 portfolios in the OppenheimerFunds complex. |
| | | |
David K. Downes,
Trustee (since 2007)
Age: 69 | | Independent Chairman GSK Employee Benefit Trust (since April 2006); Director of Correctnet (January 2006-2007); Trustee of Employee Trusts (since January 2006); Chief Executive Officer and Board Member of Community Capital Management (investment management company) (since January 2004); Director of Internet Capital Group (information technology company) (since October 2003); Independent Chairman of the Board of Trustees of Quaker Investment Trust (registered investment company) (2004-2007); President of The Community Reinvestment Act Qualified Investment Fund (investment management company) (since 2004); Chief Operating Officer and Chief Financial Officer of Lincoln National Investment Companies, Inc. (subsidiary of Lincoln National Corporation, a publicly traded company) and Delaware Investments U.S., Inc. (investment management subsidiary of Lincoln National Corporation) (1993-2003); President, Chief Executive Officer and Trustee of Delaware Investment Family of Funds (1993-2003); President and Board Member of Lincoln National Convertible Securities Funds, Inc. and the Lincoln National Income Funds, TDC (1993-2003); Chairman and Chief Executive Officer of Retirement Financial Services, Inc. (registered transfer agent and investment adviser and subsidiary of Delaware Investments U.S., Inc.) (1993-2003); President and Chief Executive Officer of Delaware Service Company, Inc. (1995-2003); Chief Administrative Officer, Chief Financial Officer, Vice Chairman and Director of Equitable Capital Management Corporation (investment subsidiary of Equitable Life Assurance Society) (1985- 1992); Corporate Controller of Merrill Lynch & Company (financial services holding company) (1977-1985); held the following positions at the Colonial Penn Group, Inc. (insurance company): Corporate Budget Director (1974-1977), Assistant Treasurer (1972-1974) and Director of Corporate Taxes (1969-1972); held the following positions at Price Waterhouse & Company (financial services firm): Tax Manager (1967-1969), Tax Senior (1965-1967) and Staff Accountant (1963-1965); United States Marine Corps (1957-1959). Oversees 60 portfolios in the OppenheimerFunds complex. |
| | | |
Matthew P. Fink,
Trustee (since 2005)
Age: 68 | | Trustee of the Committee for Economic Development (policy research foundation) (since 2005); Director of ICI Education Foundation (education foundation) (October 1991-August 2006); President of the Investment Company Institute (trade association) (October 1991-June 2004); Director of ICI Mutual Insurance Company (insurance company) (October 1991-June 2004). Oversees 60 portfolios in the OppenheimerFunds complex. |
32 | OPPENHEIMER ROCHESTER NATIONAL MUNICIPALS
| | | |
| Name, Position(s) Held with the | | Principal Occupation(s) During the Past 5 Years; Other Trusteeships/Directorships Held; Number of Portfolios |
| Fund, Length of Service, Age | | in the Fund Complex Currently Overseen |
Phillip A. Griffiths,
Trustee (since 1999)
Age: 70 | | Fellow of the Carnegie Corporation (since 2007); Distinguished Presidential Fellow for International Affairs (since 2002) and Member (since 1979) of the National Academy of Sciences; Council on Foreign Relations (since 2002); Director of GSI Lumonics Inc. (precision technology products company) (since 2001); Senior Advisor of The Andrew W. Mellon Foundation (since 2001); Chair of Science Initiative Group (since 1999); Member of the American Philosophical Society (since 1996); Trustee of Woodward Academy (since 1983); Foreign Associate of Third World Academy of Sciences; Director of the Institute for Advanced Study (1991-2004); Director of Bankers Trust New York Corporation (1994-1999); Provost at Duke University (1983-1991). Oversees 60 portfolios in the OppenheimerFunds complex. |
| | | |
Mary F. Miller,
Trustee (since 2004)
Age: 66 | | Trustee of International House (not-for-profit) (since June 2007); Trustee of the American Symphony Orchestra (not-for-profit) (since October 1998); and Senior Vice President and General Auditor of American Express Company (financial services company) (July 1998-February 2003). Oversees 60 portfolios in the OppenheimerFunds complex. |
| | | |
Joel W. Motley,
Trustee (since 2002)
Age: 57 | | Managing Director of Public Capital Advisors, LLC (privately held financial advisor) (since January 2006); Managing Director of Carmona Motley, Inc. (privately-held financial advisor) (since January 2002); Director of Columbia Equity Financial Corp. (privately-held financial advisor) (2002-2007); Managing Director of Carmona Motley Hoffman Inc. (privately-held financial advisor) (January 1998-December 2001); Member of the Finance and Budget Committee of the Council on Foreign Relations, Member of the Investment Committee of the Episcopal Church of America, Member of the Investment Committee and Board of Human Rights Watch and Member of the Investment Committee of Historic Hudson Valley. Oversees 60 portfolios in the OppenheimerFunds complex. |
| | | |
Mary Ann Tynan,
Trustee (since 2008)
Age: 63
| | Vice Chair of Board of Trustees of Brigham and Women’s/Faulkner Hospital (non-profit hospital) (since 2000); Chair of Board of Directors of Faulkner Hospital (non-profit hospital) (since 1990); Member of Audit and Compliance Committee of Partners Health Care System (non-profit) (since 2004); Board of Trustees of Middlesex School (educational institution) (since 1994); Board of Directors of Idealswork, Inc. (financial services provider) (since 2003); Partner, Senior Vice President and Director of Regulatory Affairs of Wellington Management Company, LLP (global investment manager) (1976-2002); Vice President and Corporate Secretary, John Hancock Advisers, Inc. (mutual fund investment adviser) (1970-1976). Oversees 60 portfolios in the OppenheimerFunds complex. |
| | | |
Joseph M. Wikler,
Trustee (since 2005)
Age: 68 | | Director of C-TASC (bio-statistics services (since 2007); Director of the following medical device companies: Medintec (since 1992) and Cathco (since 1996); Member of the Investment Committee of the Associated Jewish Charities of Baltimore (since 1994); Director of Lakes Environmental Association (environmental protection organization) (1996-2008); Director of Fortis/Hartford mutual funds (1994-December 2001). Oversees 60 portfolios in the OppenheimerFunds complex. |
| | | |
Peter I. Wold,
Trustee (since 2005)
Age: 61 | | Director and Chairman of Wyoming Enhanced Oil Recovery Institute Commission (enhanced oil recovery study) (since 2004); President of Wold Oil Properties, Inc. (oil and gas exploration and production company) (since 1994); Vice President of American Talc Company, Inc. (talc mining and milling) (since 1999); Managing Member of Hole-in-the-Wall Ranch (cattle ranching) (since 1979); Director and Chairman of the Denver Branch of the Federal Reserve Bank of Kansas City (1993-1999); and Director of PacifiCorp. (electric utility) (1995-1999). Oversees 60 portfolios in the OppenheimerFunds complex. |
33 | OPPENHEIMER ROCHESTER NATIONAL MUNICIPALS
TRUSTEES AND OFFICERS Unaudited / Continued
| | | |
| Name, Position(s) Held with the | | Principal Occupation(s) During the Past 5 Years; Other Trusteeships/Directorships Held; Number of Portfolios |
| Fund, Length of Service, Age | | in the Fund Complex Currently Overseen |
INTERESTED TRUSTEE | | The address of Mr. Reynolds is 6803 S. Tucson Way, Centennial, Colorado 80112-3924. Mr. Reynolds serves for an indefinite term, or until his resignation, retirement, death or removal. Mr. Reynolds is an “Interested Trustee” because of a potential consulting relationship between RSR Partners, which Mr. Reynolds may be deemed to control, and the Manager. |
| | | |
Russell S. Reynolds, Jr.,
Trustee (since 1989)
Age: 77 | | Chairman of RSR Partners (formerly “The Directorship Search Group, Inc.”) (corporate governance consulting and executive recruiting) (since 1993); Retired CEO of Russell Reynolds Associates (executive recruiting) (October 1969-March 1993); Life Trustee of International House (non-profit educational organization); Former Trustee of The Historical Society of the Town of Greenwich; Former Director of Greenwich Hospital Association. Oversees 60 portfolios in the OppenheimerFunds complex. |
| | | |
INTERESTED TRUSTEE
AND OFFICER | | The address of Mr. Murphy is Two World Financial Center, 225 Liberty Street, 11th Floor, New York, New York 10281-1008. Mr. Murphy serves as a Trustee for an indefinite term, or until his resignation, retirement, death or removal and as an Officer for an indefinite term, or until his resignation, retirement, death or removal. Mr. Murphy is an interested Trustee due to his positions with OppenheimerFunds, Inc. and its affiliates. |
| | | |
John V. Murphy,
Trustee, President and Principal Executive Officer
(since 2001)
Age: 60 | | Chairman and Director of the Manager (since June 2001); Chief Executive Officer of the Manager (June 2001-December 2008); President of the Manager (September 2000-February 2007); President and director or trustee of other Oppenheimer funds; President and Director of Oppenheimer Acquisition Corp. (“OAC”) (the Manager’s parent holding company) and of Oppenheimer Partnership Holdings, Inc. (holding company subsidiary of the Manager) (since July 2001); Director of OppenheimerFunds Distributor, Inc. (subsidiary of the Manager) (November 2001-December 2006); Chairman and Director of Shareholder Services, Inc. and of Shareholder Financial Services, Inc. (transfer agent subsidiaries of the Manager) (since July 2001); President and Director of OppenheimerFunds Legacy Program (charitable trust program established by the Manager) (since July 2001); Director of the following investment advisory subsidiaries of the Manager: OFI Institutional Asset Management, Inc., Centennial Asset Management Corporation and Trinity Investment Management Corporation (since November 2001), HarbourView Asset Management Corporation and OFI Private Investments, Inc. (since July 2001); President (since November 2001) and Director (since July 2001) of Oppenheimer Real Asset Management, Inc.; Executive Vice President of Massachusetts Mutual Life Insurance Company (OAC’s parent company) (since February 1997); Director of DLB Acquisition Corporation (holding company parent of Babson Capital Management LLC) (since June 1995); Chairman (since October 2007) and Member of the Investment Company Institute’s Board of Governors (since October 2003). Oversees 98 port- folios in the OppenheimerFunds complex. |
| | | |
OTHER OFFICERS OF
THE FUND | | The addresses of the Officers in the chart below are as follows: for Mr. Zack, Two World Financial Center, 225 Liberty Street, New York, New York 10281-1008, for Messrs. Vandehey and Wixted, 6803 S. Tucson Way, Centennial, Colorado 80112-3924, for Messrs. Loughran, Cottier, Willis, DeMitry, Camarella and Stein, 350 Linden Oaks, Rochester, New York 14625. Each Officer serves for an indefinite term or until his or her resignation, retirement, death or removal. |
34 | OPPENHEIMER ROCHESTER NATIONAL MUNICIPALS
| | | |
| Name, Position(s) Held with the | | Principal Occupation(s) During the Past 5 Years; Other Trusteeships/Directorships Held; Number of Portfolios |
| Fund, Length of Service, Age | | in the Fund Complex Currently Overseen |
Daniel G. Loughran,
Vice President and Senior
Portfolio Manager
(since 2005)
Age: 45 | | Senior Vice President of the Manager (since August 2007); Vice President of the Manager (April 2001-July 2007) and a Portfolio Manager with the Manager (1999-2005). Team leader, a Senior Portfolio Manager, an officer and a trader for the Fund and other Oppenheimer funds. |
| | | |
Scott S. Cottier,
Vice President (since 2005)
and Senior Portfolio Manager
(since 2002)
Age: 37 | | Vice President of the Manager (since September 2002). Portfolio Manager and trader at Victory Capital Management (1999-2002). Senior Portfolio Manager, an officer and a trader for the Fund and other Oppenheimer funds. |
| | | |
Troy E. Willis,
Vice President (since 2005)
and Senior Portfolio Manager
(since 2006)
Age: 36 | | Vice President of the Manager (since July 2009); Assistant Vice President of the Manager (July 2005-July 2009). Portfolio Manager of the Manager (2002- 2005). Corporate Attorney for Southern Resource Group (1999-2003). Senior Portfolio Manager, an officer and a trader for the Fund and other Oppenheimer funds. |
| | | |
Mark R. DeMitry,
Vice President and Senior
Portfolio Manager
(since 2009)
Age: 33 | | Vice President of the Manager (since July 2009); Associate Portfolio Manager of the Fund (2006-2009). Research analyst of the Manager (June 2003-September 2006) and a credit analyst of the Manager (July 2001-May 2003). Senior Portfolio Manager, an officer and a trader for the Fund and other Oppenheimer funds. |
| | | |
Michael L. Camarella,
Vice President (since 2009) and Associate Portfolio Manager (since 2008)
Age: 33 | | Assistant Vice President of the Manager (since July 2009). Research analyst of the Manager (February 2006-April 2008) and a credit analyst of the Manager (June 2003-January 2006). Associate Portfolio Manager, an officer and a trader for the Fund and other Oppenheimer funds. |
| | | |
Richard Stein,
Vice President
(since 2007)
Age: 51 | | Director (since 2003) and head of the Rochester Credit Analysis team (since 1993). Vice President of the Manager (since 1997). An officer of the Fund and other Oppenheimer Funds. |
| | | |
Mark S. Vandehey,
Vice President and Chief Compliance Officer
(since 2004)
Age: 58 | | Senior Vice President and Chief Compliance Officer of the Manager (since March 2004); Chief Compliance Officer of OppenheimerFunds Distributor, Inc., Centennial Asset Management and Shareholder Services, Inc. (since March 2004); Vice President of OppenheimerFunds Distributor, Inc., Centennial Asset Management Corporation and Shareholder Services, Inc. (since June 1983); Former Vice President and Director of Internal Audit of the Manager (1997-February 2004). An officer of 98 portfolios in the OppenheimerFunds complex. |
| | | |
| | | |
Brian W. Wixted,
Treasurer and Principal Financial & Accounting Officer (since 1999)
Age: 49 | | Senior Vice President of the Manager (since March 1999); Treasurer of the Manager and the following: HarbourView Asset Management Corporation, Shareholder Financial Services, Inc., Shareholder Services, Inc., Oppenheimer Real Asset Management, Inc. and Oppenheimer Partnership Holdings, Inc. (March 1999-June 2008), OFI Private Investments, Inc. (March 2000-June 2008), OppenheimerFunds International Ltd. and OppenheimerFunds plc (since May 2000), OFI Institutional Asset Management, Inc. (since November 2000), and OppenheimerFunds Legacy Program (charitable trust program established by the Manager) (since June 2003); Treasurer and Chief Financial Officer of OFI Trust Company (trust company subsidiary of the Manager) (since May 2000); Assistant Treasurer of the following: OAC (March 1999-June 2008), Centennial Asset Management Corporation (March 1999- October 2003) and OppenheimerFunds Legacy Program (April 2000-June 2003). An officer of 98 portfolios in the OppenheimerFunds complex. |
35 | OPPENHEIMER ROCHESTER NATIONAL MUNICIPALS
TRUSTEES AND OFFICERS Unaudited / Continued
| | | |
| Name, Position(s) Held with the | | Principal Occupation(s) During the Past 5 Years; Other Trusteeships/Directorships Held; Number of Portfolios |
| Fund, Length of Service, Age | | in the Fund Complex Currently Overseen |
Robert G. Zack,
Secretary
(since 2001)
Age: 60 | | Executive Vice President (since January 2004) and General Counsel (since March 2002) of the Manager; General Counsel and Director of the Distributor (since December 2001); General Counsel of Centennial Asset Management Corporation (since December 2001); Senior Vice President and General Counsel of HarbourView Asset Management Corporation (since December 2001); Secretary and General Counsel of OAC (since November 2001); Assistant Secretary (since September 1997) and Director (since November 2001) of OppenheimerFunds International Ltd. and OppenheimerFunds plc; Vice President and Director of Oppenheimer Partnership Holdings, Inc. (since December 2002); Director of Oppenheimer Real Asset Management, Inc. (since November 2001); Senior Vice President, General Counsel and Director of Shareholder Financial Services, Inc. and Shareholder Services, Inc. (since December 2001); Senior Vice President, General Counsel and Director of OFI Private Investments, Inc. and OFI Trust Company (since November 2001); Vice President of OppenheimerFunds Legacy Program (since June 2003); Senior Vice President and General Counsel of OFI Institutional Asset Management, Inc. (since November 2001); Director of OppenheimerFunds International Distributor Limited (since December 2003); Senior Vice President (May 1985- December 2003). An officer of 98 portfolios in the OppenheimerFunds complex. |
The Fund’s Statement of Additional Information contains additional information about the Fund’s Trustees and Officers and is available without charge upon request, by calling 1.800.525.7048.
36 | OPPENHEIMER ROCHESTER NATIONAL MUNICIPALS
Item 2. Code of Ethics.
The registrant has adopted a code of ethics that applies to the registrant’s principal executive officer, principal financial officer, principal accounting officer or controller or persons performing similar functions.
Item 3. Audit Committee Financial Expert.
The Board of Trustees of the registrant has determined that David Downes, the Board’s Audit Committee Chairman, is an audit committee financial expert and that Mr. Downes is “independent” for purposes of this Item 3.
Item 4. Principal Accountant Fees and Services.
The principal accountant for the audit of the registrant’s annual financial statements billed $133,600 in fiscal 2009 and $106,000 in fiscal 2008.
The principal accountant for the audit of the registrant’s annual financial statements billed $7,896 in fiscal 2009 and $4,026 in fiscal 2008.
The principal accountant for the audit of the registrant’s annual financial statements billed $271,540 in fiscal 2009 and $250,000 in fiscal 2008 to the registrant’s investment adviser or any entity controlling, controlled by, or under common control with the adviser that provides ongoing services to the registrant.
Such services include: agreed upon procedures, internal control reviews and professional services for FAS 157.
The principal accountant for the audit of the registrant’s annual financial statements billed $21,672 in fiscal 2009 and no such fees in fiscal 2008.
The principal accountant for the audit of the registrant’s annual financial statements billed no such fees to the registrant during the last two fiscal years. to the registrant’s investment adviser or any entity controlling, controlled by, or under common control with the adviser that provides ongoing services to the registrant.
Such services include: Preparation and review of tax returns.
The principal accountant for the audit of the registrant’s annual financial statements billed no such fees during the last two fiscal years.
The principal accountant for the audit of the registrant’s annual financial statements billed no such fees during the last two fiscal years to the registrant’s investment adviser or any entity controlling, controlled by, or under common control with the adviser that provides ongoing services to the registrant.
| (e) | | (1) During its regularly scheduled periodic meetings, the registrant’s audit committee will pre-approve all audit, audit-related, tax and other services to be provided by the principal accountants of the registrant. |
| | | The audit committee has delegated pre-approval authority to its Chairman for any subsequent new engagements that arise between regularly scheduled meeting dates provided that any fees such pre-approved are presented to the audit committee at its next regularly scheduled meeting. |
| |
| | | Under applicable laws, pre-approval of non-audit services maybe waived provided that: 1) the aggregate amount of all such services provided constitutes no more than five percent of the total amount of fees paid by the registrant to it principal accountant during the fiscal year in which services are provided 2) such services were not recognized by the registrant at the time of engagement as non-audit services and 3) such services are promptly brought to the attention of the audit committee of the registrant and approved prior to the completion of the audit. |
| |
| | | (2) 100% |
| |
| (f) | | Not applicable as less than 50%. |
| |
| (g) | | The principal accountant for the audit of the registrant’s annual financial statements billed $301,108 in fiscal 2009 and $254,026 in fiscal 2008 to the registrant and the registrant’s investment adviser or any entity controlling, controlled by, or under common control with the adviser that provides ongoing services to the registrant related to non-audit fees. Those billings did not include any prohibited non-audit services as defined by the Securities Exchange Act of 1934. |
| |
| (h) | | The registrant’s audit committee of the board of trustees has considered whether the provision of non-audit services that were rendered to the registrant’s investment adviser, and any entity controlling, controlled by, or under common control with the investment adviser that provides ongoing services to the registrant that were not pre-approved pursuant to paragraph (c)(7)(ii) of Rule 2-01 of Regulation S-X is compatible with maintaining the principal accountant’s independence. No such services were rendered. |
Item 5. Audit Committee of Listed Registrants
Not applicable.
Item 6. Schedule of Investments.
a) Not applicable.
b) Not applicable.
Item 7. Disclosure of Proxy Voting Policies and Procedures for Closed-End Management Investment Companies.
Not applicable.
Item 8. Portfolio Managers of Closed-End Management Investment Companies.
Not applicable.
Item 9. Purchases of Equity Securities by Closed-End Management Investment Company and Affiliated Purchasers.
Not applicable.
Item 10. Submission of Matters to a Vote of Security Holders.
The Fund’s Governance Committee Provisions with Respect to Nominations of Directors/Trustees to the Respective Boards
| 1. | | The Fund’s Governance Committee (the “Committee”) will evaluate potential Board candidates to assess their qualifications. The Committee shall have the authority, upon approval of the Board, to retain an executive search firm to assist in this effort. The Committee may consider recommendations by business and personal contacts of current Board members and by executive search firms which the Committee may engage from time to time and may also consider shareholder recommendations. The Committee may consider the advice and recommendation of the Funds’ investment manager and its affiliates in making the selection. |
| |
| 2. | | The Committee shall screen candidates for Board membership. The Committee has not established specific qualifications that it believes must be met by a trustee nominee. In evaluating trustee nominees, the Committee considers, among other things, an individual’s background, skills, and experience; whether the individual is an “interested person” as defined in the Investment Company Act of 1940; and whether the individual would be deemed an “audit committee financial expert” within the meaning of applicable SEC rules. The Committee also considers whether the individual’s background, skills, and experience will complement the background, skills, and experience of other nominees and will contribute to the Board. There are no differences in the manner in which the Committee evaluates nominees for trustees based on whether the nominee is recommended by a shareholder. |
| |
| 3. | | The Committee may consider nominations from shareholders for the Board at such times as the Committee meets to consider new nominees for the Board. The Committee shall have the sole discretion to determine the candidates to present to the Board and, in such cases where required, to shareholders. Recommendations for trustee nominees should, at a minimum, be accompanied by the following: |
| | • | | the name, address, and business, educational, and/or other pertinent background of the person being recommended; |
| |
| | • | | a statement concerning whether the person is an “interested person” as defined in the Investment Company Act of 1940; |
| |
| | • | | any other information that the Funds would be required to include in a proxy statement concerning the person if he or she was nominated; and |
| |
| | • | | the name and address of the person submitting the recommendation and, if that person is a shareholder, the period for which that person held Fund shares. |
| | | The recommendation also can include any additional information which the person submitting it believes would assist the Committee in evaluating the recommendation. |
| |
| 4. | | Shareholders should note that a person who owns securities issued by Massachusetts Mutual Life Insurance Company (the parent company of the Funds’ investment adviser) would be deemed an “interested person” under the Investment Company Act of 1940. In addition, certain other relationships with Massachusetts Mutual Life Insurance Company or its subsidiaries, with registered broker-dealers, or with the Funds’ outside legal counsel may cause a person to be deemed an “interested person.” |
| |
| 5. | | Before the Committee decides to nominate an individual as a trustee, Committee members and other directors customarily interview the individual in person. In addition, the individual customarily is asked to complete a detailed questionnaire which is designed to elicit information which must be disclosed under SEC and stock exchange rules and to determine whether the individual is subject to any statutory disqualification from serving as a trustee of a registered investment company. |
Item 11. Controls and Procedures.
Based on their evaluation of the registrant’s disclosure controls and procedures (as defined in rule 30a-3(c) under the Investment Company Act of 1940 (17 CFR 270.30a-3(c)) as of 07/31/2009, the registrant’s principal executive officer and principal financial officer found the registrant’s disclosure controls and procedures to provide reasonable assurances that information required to be disclosed by the registrant in the reports that it files under the Securities Exchange Act of 1934 (a) is accumulated and communicated to registrant’s management, including its principal executive officer and principal financial officer, to allow timely decisions regarding required disclosure, and (b) is recorded, processed, summarized and reported, within the time periods specified in the rules and forms adopted by the U.S. Securities and Exchange Commission.
There have been no changes in the registrant’s internal controls over financial reporting that occurred during the registrant’s second fiscal quarter of the period covered by this report that have materially affected, or are reasonably likely to materially affect, the registrant’s internal control over financial reporting.
Item 12. Exhibits.
| (a) | | (1) Exhibit attached hereto. |
(2) Exhibits attached hereto.
(3) Not applicable.
| (b) | | Exhibit attached hereto. |
SIGNATURES
Pursuant to the requirements of the Securities Exchange Act of 1934 and the Investment Company Act of 1940, the registrant has duly caused this report to be signed on its behalf by the undersigned, thereunto duly authorized.
Oppenheimer Multi-State Municipal Trust
| | | | | |
| By: | | /s/ John V. Murphy John V. Murphy | | |
| | | Principal Executive Officer | | |
| | |
| Date: 09/11/2009 | | |
Pursuant to the requirements of the Securities Exchange Act of 1934 and the Investment Company Act of 1940, this report has been signed below by the following persons on behalf of the registrant and in the capacities and on the dates indicated.
| | | | | |
| By: | | /s/ John V. Murphy John V. Murphy | | |
| | | Principal Executive Officer | | |
| | |
| Date: 09/11/2009 | | |
| | | | | |
| By: | | /s/ Brian W. Wixted Brian W. Wixted | | |
| | | Principal Financial Officer | | |
| | |
| Date: 09/11/2009 | | |