UNITED STATES
SECURITIES AND EXCHANGE COMMISSION
Washington, D.C. 20549
FORM N-CSR
CERTIFIED SHAREHOLDER REPORT OF REGISTERED
MANAGEMENT INVESTMENT COMPANIES
Investment Company Act file number | 811-5857 | |||||||
| ||||||||
CMG Fund Trust | ||||||||
(Exact name of registrant as specified in charter) | ||||||||
| ||||||||
One Financial Center, Boston, Massachusetts |
| 02111 | ||||||
(Address of principal executive offices) |
| (Zip code) | ||||||
| ||||||||
James R. Bordewick, Jr., Esq. | ||||||||
(Name and address of agent for service) | ||||||||
| ||||||||
Registrant’s telephone number, including area code: | 1-617-426-3750 |
| ||||||
| ||||||||
Date of fiscal year end: | July 31, 2006 |
| ||||||
| ||||||||
Date of reporting period: |
| |||||||
Form N-CSR is to be used by management investment companies to file reports with the Commission not later than 10 days after the transmission to stockholders of any report that is required to be transmitted to stockholders under Rule 30e-1 under the Investment Company Act of 1940 (17 CFR 270.30e-1). The Commission may use the information provided on Form N-CSR in its regulatory, disclosure review, inspection, and policymaking roles.
A registrant is required to disclose the information specified by Form N-CSR, and the Commission will make this information public. A registrant is not required to respond to the collection of information contained in Form N-CSR unless the Form displays a currently valid Office of Management and Budget (“OMB”) control number. Please direct comments concerning the accuracy of the information collection burden estimate and any suggestions for reducing the burden to Secretary, Securities and Exchange Commission, 450 Fifth Street, NW, Washington, DC 20549-0609. The OMB has reviewed this collection of information under the clearance requirements of 44 U.S.C. § 3507.
Item 1. Reports to Stockholders.
![]()
CMG CORE BOND FUND
CMG SHORT TERM BOND FUND
CMG ULTRA SHORT TERM BOND FUND
CMG HIGH YIELD FUND
PORTFOLIOS OF CMG FUND TRUST
Semiannual Report
January 31, 2006
Advised by Columbia Management Advisors, LLC.
Not FDIC
Insured
May Lose Value
No Bank Guarantee
Columbia Management is the primary investment management division of Bank of America Corporation. Columbia Management entities furnish investment management services and advise institutional and mutual fund portfolios. CMG Funds are distributed by Columbia Management Distributors, Inc., member of NASD, SIPC, part of Columbia Management and an affiliate of Bank of America Corporation.
Columbia Management Advisors, Inc. combined with Banc of America Capital Management, LLC on September 30, 2005. At that time, the newly combined advisor underwent a name change to Columbia Management Advisors, LLC and continues to operate as a SEC-registered investment advisor, wholly owned subsidiary of Bank of America, N.A. and is part of Columbia Management.
| Table of Contents | |||
Management Discussion of Fund Performance
| CMG Core Bond Fund | 1 | ||||||
| CMG Short Term Bond Fund | 6 | ||||||
| CMG Ultra Short Term Bond Fund | 11 | ||||||
| CMG High Yield Fund | 16 | ||||||
Financial Statements
| Financial Highlights | 21 | ||||||
| Schedule of Investments | 25 | ||||||
| Statements of Assets and Liabilities | 59 | ||||||
| Statements of Operations | 60 | ||||||
| Statements of Changes in Net Assets | 61 | ||||||
| Notes to Financial Statements | 63 | ||||||
| Board Consideration and Approval of Investment Advisory Agreements | 71 | ||||||
| Summary of Management Fee Evaluation by Independent Fee Consultant | 74 | ||||||
The views expressed in the portfolio commentaries reflect the current views of the Portfolio Managers. These views are not guarantees of future performance and involve certain risks, uncertainties and assumptions that are difficult to predict so actual outcomes and results may differ significantly from the views expressed. These views are subject to change at any time based upon economic, market or other conditions and the Portfolio Managers disclaim any responsibility to update such views. These views may not be relied on as investment advice and, because investment decisions for a CMG Fund are based on numerous factors, may not be relied on as an indication of trading intent on behalf of any particular CMG Fund. References to specific company securities should not be constructed as a recommendation or investment advice.
Performance data quoted represents past performance and current performance may be lower or higher. Past performance is no guarantee of future results. The investment return and principal value will fluctuate so that shares, when redeemed, may be worth more or less than the original cost. Please visit www.columbiamanagement.com for daily and most recent month-end performance updates.
CMG CORE BOND FUND
A Portfolio of CMG Fund Trust
MANAGEMENT DISCUSSION OF FUND PERFORMANCE
For the six-month period ended January 31, 2006, the CMG Core Bond Fund returned 0.84%. The fund matched the Lehman Brothers Aggregate Bond Index,1 which also returned 0.84%. It outperformed the average return of its peer group, the Lipper Corporate Debt Funds A-Rated Category, which was 0.49% over the same period.2 The fund's decision to keep a relatively short duration compared to its benchmark aided its ability to produce competitive performance during the period.
During the six-month reporting period, the yield curve flattened as the spread between short- and long-term rates narrowed markedly. The Federal Reserve Board (the Fed) raised the federal funds rate to 4.50%, acting with quarter-point increases on five separate occasions. Meanwhile, the yield on two-year Treasury notes rose 50 basis points to 4.50%, while 10-year Treasury note yields rose just 21 basis points to 4.52%.
Against this backdrop, we took a barbell approach to the fund's positioning, concentrating the fund's investments at both the short and long end of the yield curve. The fund's short-term investments helped preserve the flexibility to reinvest at higher rates as securities matured. The fund's long-term investments performed relatively well because long-term interest rates rose less than short-term interest rates. This strategy aided overall performance.
A sizeable position in mortgage-backed securities—53% of the portfolio's holdings—also aided the fund's relative performance as mortgage-backed securities outperformed Treasury securities of comparable maturities during the period. We generally maintained this weight throughout the period, making slight adjustments to the type of mortgage holdings in the fund. As the period wore on, we moved money into commercial mortgage-backed securities, which are secured by commercial properties and tend to be less sensitive to changing interest rates than residential mortgages.
The fund was also overweight in corporate bonds, which detracted somewhat from performance relative to the benchmark. Overall, corporate bonds underperformed comparable Treasury securities by 36 basis points during the reporting period. We trimmed our corporate holdings by two percentage point, from 28% to 26% during the reporting period.
As we look ahead, we believe that one of the developments of the past six months could have enduring significance on the fixed income markets: the ascension of Ben Bernanke to chairman of the Fed, replacing longstanding chairman Alan Greenspan. The introduction of a new chairman along with the removal of the word "measured" in the Fed's stated policy toward further interest-rate increases adds additional uncertainty to the market. In response, we have adopted a more neutral stance relative to the fund's benchmark. Most notably, we decided late in the period to extend the duration of the fund to match the duration of the fund's benchmark. However, we have maintained the fund's net overweight in mortgages and corporate bonds. The fund also has a position in Treasury Inflation Protected Securities, which has the potential to provide an element of stability to the portfolio in the event that inflation exceeds current expectations.
1
The fund's top ten holdings (as a percentage of net assets) as of January 31, 2006 were (%):
| U.S. Treasury Bonds, 6.250% 08/15/2023 | 9.7 | ||||||
| Federal National Mortgage Association, 5.500% 11/01/2035 | 4.0 | ||||||
| Federal Home Loan Mortgage Corp., 5.500% 08/01/2035 | 3.3 | ||||||
| Federal Home Loan Mortgage Corp., 4.500% 03/15/2018 | 3.2 | ||||||
| Federal Home Loan Mortgage Corp., 5.000% 06/01/2020 | 2.6 | ||||||
| Washington Mutual Mortgage Securities Corp., 5.500% 10/25/2035 | 2.5 | ||||||
| Federal Home Loan Banks, 4.375% 09/11/2009 | 2.4 | ||||||
| Structured Asset Securities Corp., 5.500% 07/25/2033 | 2.3 | ||||||
| Countrywide Alternative Loan Trust, 5.250% 03/25/2035 | 2.1 | ||||||
| Federal Home Loan Mortgage Corp., 4.000% 07/15/2014 | 2.1 | ||||||
We appreciate your continued confidence in the CMG Core Bond Fund.
Leonard A. Aplet has co-managed the CMG Core Bond Fund since September 2000 and has been with the advisor or its predecessors or affiliate organizations since 1987.

Richard R. Cutts has co-managed the fund since November 2000 and has been with the advisor or its predecessors or affiliate organizations since 1994.

Investing in fixed-income securities may involve certain risks, including the credit quality of individual issuers, possible prepayments, market or economic developments and yields and share price fluctuations due to changes in interest rates. When interest rates go up, bond prices typically drop, and vice versa.
Holdings are calculated as a percentage of net assets, and are subject to change. Because the fund is actively managed, there is no guarantee the fund will continue to maintain the holdings breakdown listed. The fund's holdings and their weights within the portfolio may change as market conditions change.
1 The Lehman Brothers Aggregate Bond Index is a market value-weighted index that tracks the daily price, coupon, pay-downs, and total return performance of fixed-rate, publicly placed, dollar-denominated non-convertible investment grade debt issues with at least $250 million par amount outstanding and with at least one year to final maturity. Unlike the fund, indices are not investments, they do not incur fees or expenses and are not professionally managed. It is not possible to invest directly in an index. Securities in the fund may not match those in an index.
2 Lipper Inc., a widely respected data provider in the industry, calculates an average total return (assuming reinvestment of distributions) for mutual funds with investment objectives similar to those of the fund. Lipper makes no adjustment for the effect of sales loads.
2
Average annual total return as of January 31, 2006 (%)
| Inception | 6-month (cumulative) | 1-year | 5-year | Life | |||||||||||||||||||
| CMG Core Bond Fund | 9/1/00 | 0.84 | 1.98 | 5.05 | 5.93 | ||||||||||||||||||
| Lehman Brothers Aggregate Bond Index | 0.84 | 1.80 | 5.53 | 6.34 | |||||||||||||||||||
Average annual total return as of December 31, 2005 (%)
| Inception | 6-month (cumulative) | 1-year | 5-year | Life | |||||||||||||||||||
| CMG Core Bond Fund | 9/1/00 | 0.01 | 2.56 | 5.36 | 6.02 | ||||||||||||||||||
| Lehman Brothers Aggregate Bond Index | -0.08 | 2.43 | 5.87 | 6.44 | |||||||||||||||||||
Performance data quoted represents past performance and current performance may be lower or higher. Past performance is no guarantee of future results. The investment return and principal value will fluctuate so that shares, when redeemed, may be worth more or less than the original cost. Please visit www.columbiamanagement.com for daily and most recent month-end performance updates.
Performance results may reflect any voluntary waivers or reimbursement of fund expenses by the advisor or its affiliates. Absent these waivers or reimbursement arrangements, performance results would have been lower. All results shown assume reinvestment of distributions.
Growth of a $10,000 investment, September 1, 2000 to January 31, 2006
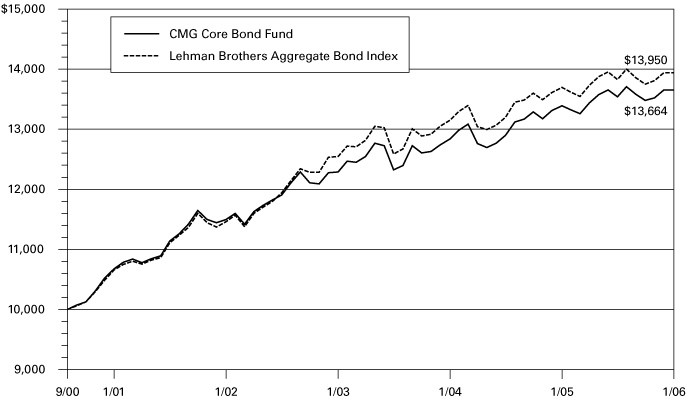
The chart above shows the growth in value of a hypothetical $10,000 investment in the fund compared to the index during the stated time period, and does not reflect the deduction of taxes that a shareholder would pay on fund distributions or the redemption of fund shares.
Index performance is from September 1, 2000.
The Lehman Brothers Aggregate Bond Index is a market value-weighted index that tracks the daily price, coupon, pay-downs, and total return performance of fixed-rate, publicly placed, dollar-denominated non-convertible investment grade debt issues with at least $250 million par amount outstanding and with at least one year to final maturity. Unlike the fund, indices are not investments, they do not incur fees or expenses and are not professionally managed. It is not possible to invest directly in an index. Securities in the fund may not match those in an index.
3
UNDERSTANDING YOUR EXPENSES – CMG Core Bond Fund
As a fund shareholder, you incur two types of costs. There are transaction costs and also ongoing costs, which generally include investment advisory fees and other fund expenses. The information on this page is intended to help you understand your ongoing costs of investing in the fund and to compare these costs with the ongoing costs of investing in other mutual funds.
Analyzing your fund's expenses
To illustrate these ongoing costs, we have provided an example and calculated the expenses paid by investors during the reporting period. The information in the following table is based on an initial investment of $1,000, which is invested at the beginning of the reporting period and held for the entire period. Expense information is calculated two ways and each method provides you with different information. The amount listed in the "actual" column is calculated using the fund's actual operating expenses and total return for the period. The amount listed in the "hypothetical" column assumes that the return each year is 5% before expenses and includes the fund's actual expense ratio. You should not use the hypothetical account values and expenses to estimate either your actual account balance at the end of the period or the expenses you paid during this reporting period.
Estimating your actual expenses
To estimate the expenses that you paid over the period, first you will need your account balance at the end of the period:
1. Divide your ending account balance by $1,000. For example, if an account balance was $8,600 at the end of the period, the result would be 8.6.
2. In the section of the table below titled "Expenses paid during the period," locate the amount under "actual." Multiply this number by the result from step 1. Your answer is an estimate of the expenses you paid on your account during the period.
August 1, 2005 – January 31, 2006
| Account value at the beginning of the period ($) | Account value at the end of the period ($) | Expenses paid during the period ($) | Fund's annualized expense ratio (%) | ||||||||||||||||||||||||||||
| Actual | Hypothetical | Actual | Hypothetical | Actual | Hypothetical | ||||||||||||||||||||||||||
| 1,000.00 | 1,000.00 | 1,008.47 | 1,023.95 | 1.27 | 1.28 | 0.25 | |||||||||||||||||||||||||
Expenses paid during the period are equal to the annualized expense ratio of 0.25%, multiplied by the average account value over the period, then multiplied by the number of days in the fund's most recent fiscal half- year and divided by 365.
Had the Investment Advisor not reimbursed a portion of expenses, total return would have been reduced.
It is important to note that the expense amounts shown in the table are meant to highlight only ongoing costs of investing in the fund and do not reflect any transaction costs, such as sales charges, redemption or exchange fees. Therefore, the hypothetical examples provided may not help you determine the relative total costs of owning shares of different funds. If these transaction costs were included, your costs would have been higher.
4
Compare with other funds
Since all mutual funds are required to include the same hypothetical calculations about expenses in shareholder reports, you can use this information to compare the ongoing cost of investing in the fund with other funds. To do so, compare the 5% hypothetical example with the 5% hypothetical examples that appear in the shareholder reports of other funds. As you compare hypothetical examples of other funds, it is important to note that hypothetical examples are meant to highlight the continuing costs of investing in a fund and do not reflect any transaction costs, such as sales charges or redemption or exchange fees.
5
Performance data quoted represents past performance and current performance may be lower or higher. Past performance is no guarantee of future results. The investment return and principal value will fluctuate so that shares, when redeemed, may be worth more or less than the original cost. Please visit www.columbiamanagement.com for daily and most recent month-end performance updates.
CMG SHORT TERM BOND FUND
A Portfolio of CMG Fund Trust
MANAGEMENT DISCUSSION OF FUND PERFORMANCE
CMG Short Term Bond Fund returned 1.46% for the six-month period ended January 31, 2006. The fund outperformed the Merrill Lynch 1-3 Year Treasury Index,1 which returned 1.24% during the period. The fund also outperformed the average return of its peer group, the Lipper Short Investment Grade Debt Funds Category, which was 1.17%.2 Floating-rate notes and a relatively short duration aided the fund's performance during the period.
During the six-month reporting period, the yield curve flattened as the spread between short- and long-term rates narrowed markedly. The Federal Reserve Board (the Fed) raised the federal funds rate to 4.50% in five quarter-point increments. Meanwhile, the yield on two-year Treasury notes rose 50 basis points to 4.50%, while 10-year Treasury yields rose just 21 basis points to 4.52%.
We were well positioned for this move with a barbell strategy, concentrating the fund's investments at both the short and long ends of the fund's maturity range. The fund's short-term investments gave us the flexibility to reinvest at higher rates as securities matured. The fund's longer-term investments performed relatively well because longer-term interest rates rose less than short-term interest rates. By underweighting two-year securities, we avoided the maturity range that struggled most to retain value as interest rates rose. This strategy, plus the use of floating-rate securities, aided performance.
The fund's sizeable position in mortgage-backed securities—52% of the portfolio's holdings—also aided the fund's relative performance as mortgage-backed securities outperformed Treasury securities of comparable maturities during the period. We generally maintained this weight throughout the period, making slight adjustments to the type of mortgage holdings in the fund. Toward the end of the period, we moved money into areas of the mortgage market that historically have been less sensitive to changing interest rates, including short-term Planned Amortization Classes and pass-through securities with maturities of 15 years or less. The fund also benefited from its position in asset-backed securities.
A slight overweight in corporate bonds detracted somewhat from performance relative to the fund's benchmark. Overall, corporate bonds underperformed comparable Treasury securities by 36 basis points during the reporting period. However, the impact of this performance shortfall had limited impact on the fund's overall performance because it focused on short-term corporate securities, which outperformed longer-term bonds, and because we trimmed the fund's corporate holdings.
As we look ahead, we believe that one of the developments of the past six months could have enduring significance: the ascension of Ben Bernanke to chairman of the Fed, where he replaces longstanding chairman Alan Greenspan. The introduction of a new chairman along with the removal of the word "measured" in the Fed's stated policy toward further interest rate increases adds additional uncertainty to the market. In response, we have adopted a more neutral stance
6
relative to the fund's benchmark. Most notably, we decided late in the period to extend the fund's duration to match its benchmark. We also have maintained a position in Treasury Inflation Protected Securities, which have the potential to provide an element of stability to the portfolio in the event that inflation exceeds current expectations.
The fund's top ten holdings (as a percentage of net assets) as of January 31, 2006 were (%):
| SLM Student Loan Trust, 5.090% 01/25/2013 | 4.7 | ||||||
| U.S. Treasury Notes, 3.375% 10/15/2009 | 4.3 | ||||||
| U.S. Treasury Notes, 3.875% 01/15/2009 | 3.3 | ||||||
| Federal National Mortgage Association, 4.000% 10/16/2006 | 2.9 | ||||||
| Prudential Securities Secured Financing Corp., 6.480% 11/01/2031 | 2.5 | ||||||
| Federal National Mortgage Association, 4.500% 01/01/2020 | 2.5 | ||||||
| Long Beach Auto Receivables Trust, 4.050% 04/15/2011 | 2.4 | ||||||
| Federal Home Loan Mortgage Corp., 5.500% 07/01/2019 | 2.3 | ||||||
| Federal Home Loan Mortgage Corp., 4.000% 05/01/2011 | 2.3 | ||||||
| Countrywide Alternative Loan Trust, 5.500% 02/25/2036 | 2.2 | ||||||
We appreciate your continued confidence in the CMG Short Term Bond Fund.
Leonard A. Aplet has co-managed the CMG Short Term Bond Fund since February 1998 and has been with the advisor or its predecessors or affiliate organizations since 1987.

Richard R. Cutts has co-managed the fund since November 2000 and has been with the advisor or its predecessors or affiliate organizations since 1994.

Investing in fixed-income securities may involves certain risks, including the credit quality of individual issuers, possible prepayments, market or economic developments and yields and share price fluctuations due to changes in interest rates. When interest rates go up, bond prices typically drop, and vice versa.
Holdings are calculated as a percentage of net assets, and are subject to change. Because the fund is actively managed, there is no guarantee the fund will continue to maintain the holdings breakdown listed. The fund's holdings and their weights within the portfolio may change as market conditions change.
1 The Merrill Lynch 1-3 Year Treasury Index measures the return of Treasury bills with maturities of 1-3 years. Unlike the fund, indices are not investments, do not incur fees or expenses and are not professionally managed. It is not possible to invest directly in an index. Securities in the fund may not match those in an index.
2 Lipper Inc., a widely respected data provider in the industry, calculates an average total return (assuming reinvestment of distributions) for mutual funds with investment objectives similar to those of the fund. Lipper makes no adjustment for the effect of sales loads.
7
Average annual total return as of January 31, 2006 (%)
| Inception | 6-month (cumulative) | 1-year | 5-year | Life | |||||||||||||||||||
| CMG Short Term Bond Fund | 2/2/98 | 1.46 | 2.57 | 3.90 | 4.89 | ||||||||||||||||||
| Merrill Lynch 1-3 Year Treasury Index | 1.24 | 1.87 | 3.44 | 4.43 | |||||||||||||||||||
Average annual total return as of December 31, 2005 (%)
| Inception | 6-month (cumulative) | 1-year | 5-year | Life | |||||||||||||||||||
| CMG Short Term Bond Fund | 2/2/98 | 1.01 | 2.35 | 4.13 | 4.91 | ||||||||||||||||||
| Merrill Lynch 1-3 Year Treasury Index | 0.78 | 1.67 | 3.67 | 4.46 | |||||||||||||||||||
Performance data quoted represents past performance and current performance may be lower or higher. Past performance is no guarantee of future results. The investment return and principal value will fluctuate so that shares, when redeemed, may be worth more or less than the original cost. Please visit www.columbiamanagement.com for daily and most recent month-end performance updates.
Performance results may reflect any voluntary waivers or reimbursement of fund expenses by the advisor or its affiliates. Absent these waivers or reimbursement arrangements, performance results would have been lower. All results shown assume reinvestment of distributions.
Growth of a $10,000 investment, February 2, 1998 to January 31, 2006
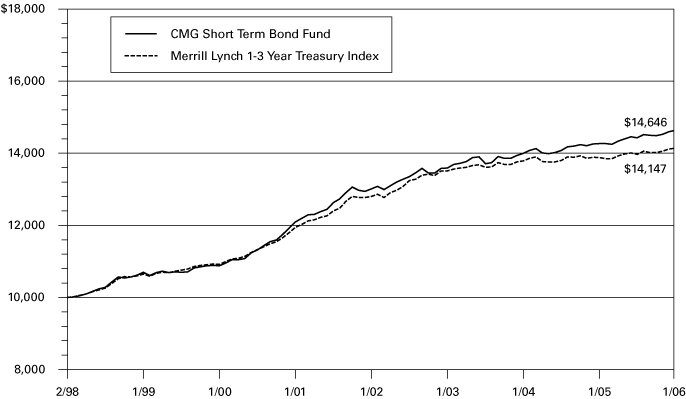
The chart above shows the growth in value of a hypothetical $10,000 investment in the fund compared to the index during the stated time period, and does not reflect the deduction of taxes that a shareholder would pay on fund distributions or the redemption of fund shares.
Index performance is from February 2, 1998.
The Merrill Lynch 1-3 Year Treasury Index measures the return of Treasury bills with maturities of 1-3 years. Unlike the fund, indices are not investments, do not incur fees or expenses and are not professionally managed. It is not possible to invest directly in an index. Securities in the fund may not match those in an index.
8
UNDERSTANDING YOUR EXPENSES – CMG Short Term Bond Fund
As a fund shareholder, you incur two types of costs. There are transaction costs and also ongoing costs, which generally include investment advisory fees and other fund expenses. The information on this page is intended to help you understand your ongoing costs of investing in the fund and to compare these costs with the ongoing costs of investing in other mutual funds.
Analyzing your fund's expenses
To illustrate these ongoing costs, we have provided an example and calculated the expenses paid by investors during the reporting period. The information in the following table is based on an initial investment of $1,000, which is invested at the beginning of the reporting period and held for the entire period. Expense information is calculated two ways and each method provides you with different information. The amount listed in the "actual" column is calculated using the fund's actual operating expenses and total return for the period. The amount listed in the "hypothetical" column assumes that the return each year is 5% before expenses and includes the fund's actual expense ratio. You should not use the hypothetical account values and expenses to estimate either your actual account balance at the end of the period or the expenses you paid during this reporting period.
Estimating your actual expenses
To estimate the expenses that you paid over the period, first you will need your account balance at the end of the period:
1. Divide your ending account balance by $1,000. For example, if an account balance was $8,600 at the end of the period, the result would be 8.6.
2. In the section of the table below titled "Expenses paid during the period," locate the amount under "actual." Multiply this number by the result from step 1. Your answer is an estimate of the expenses you paid on your account during the period.
August 1, 2005 – January 31, 2006
| Account value at the beginning of the period ($) | Account value at the end of the period ($) | Expenses paid during the period ($) | Fund's annualized expense ratio (%) | ||||||||||||||||||||||||||||
| Actual | Hypothetical | Actual | Hypothetical | Actual | Hypothetical | ||||||||||||||||||||||||||
| 1,000.00 | 1,000.00 | 1,014.57 | 1,023.95 | 1.27 | 1.28 | 0.25 | |||||||||||||||||||||||||
Expenses paid during the period are equal to the annualized expense ratio of 0.25%, multiplied by the average account value over the period, then multiplied by the number of days in the fund's most recent fiscal half-year and divided by 365.
Had the Investment Advisor not reimbursed a portion of expenses, total return would have been reduced.
It is important to note that the expense amounts shown in the table are meant to highlight only ongoing costs of investing in the fund and do not reflect any transaction costs, such as sales charges, redemption or exchange fees. Therefore, the hypothetical examples provided may not help you determine the relative total costs of owning shares of different funds. If these transaction costs were included, your costs would have been higher.
9
Compare with other funds
Since all mutual funds are required to include the same hypothetical calculations about expenses in shareholder reports, you can use this information to compare the ongoing cost of investing in the fund with other funds. To do so, compare the 5% hypothetical example with the 5% hypothetical examples that appear in the shareholder reports of other funds. As you compare hypothetical examples of other funds, it is important to note that hypothetical examples are meant to highlight the continuing costs of investing in a fund and do not reflect any transaction costs, such as sales charges or redemption or exchange fees.
10
Performance data quoted represents past performance and current performance may be lower or higher. Past performance is no guarantee of future results. The investment return and principal value will fluctuate so that shares, when redeemed, may be worth more or less than the original cost. Please visit www.columbiamanagement.com for daily and most recent month-end performance updates.
CMG ULTRA SHORT TERM BOND FUND
A Portfolio of CMG Fund Trust
MANAGEMENT DISCUSSION OF FUND PERFORMANCE
CMG Ultra Short Term Bond Fund returned 1.75% for the six-month period ended January 31, 2006. The fund outperformed the Citigroup One-Year U.S. Treasury Bill Index1 and the average return of the Lipper Short Investment Grade Debt Funds Category.2 Both returned 1.51% for the period. We believe that the fund's return was aided by positive performance from higher quality issues in the asset-backed, finance and government agency sectors as well as from floating-rate corporate notes.
The six-month period ended January 31, 2006, proved to be a challenging environment for short-term and ultra short-term bonds. In five of the six months, the Federal Reserve Board raised short-term interest rates by a quarter of a percentage point (for a total of 1.25 percentage points) and the federal funds rate finished the period at 4.50%. The continued cycle of interest rate increases had a negative impact on bond prices, particularly those on the short end of the maturity spectrum. The US Treasury yield curve also continued to flatten during the period, which reduced the appetite for risk among bond investors. As a result, the fund's continued emphasis on higher quality issues, particularly asset-backed securities, helped performance.
A large position in floating rate notes also aided performance as it helped cushion the fund against rising rates. Government agency bonds and corporate bonds in the financial sector, which outperformed Treasuries during the six-month period, also contributed to the fund's positive return. The fund's emphasis on higher quality corporate issues also helped buffer the portfolio from a period of general market malaise during the fourth quarter of 2005, which hurt bonds that trade on their spread to Treasuries, in general, and lower-rated bonds in particular.
The spread between short- and long-term yields narrowed to the point where the yield curve neared inversion at the end of the period. While this phenomenon has historically signaled an impending economic slowdown, we do not envision an economic recession unfolding even if the economy experiences a slowdown later in 2006. However, we will continue to maintain the fund's quality focus in this uncertain environment. We plan to continue to seek opportunities to add to the fund's high quality mortgage-backed position as well as to the fund's asset-backed holdings. We plan to scale back the fund's corporate exposure to help build these positions.
11
The fund's top ten holdings (as a percentage of net assets) as of January 31, 2006 were (%):
| Federal Home Loan Mortgage Corp., 4.125% 04/02/2007 | 2.4 | ||||||
| Federal Home Loan Mortgage Corp., 2.875% 12/15/2006 | 2.3 | ||||||
| Federal Home Loan Mortgage Corp., 5.500% 04/15/2027 | 2.3 | ||||||
| Federal Home Loan Mortgage Corp., 5.000% 12/01/2019 | 2.0 | ||||||
| SLM Corp., 4.691% 09/15/2006 | 1.8 | ||||||
| Goldman Sachs Group Inc., 4.255% 01/09/2007 | 1.8 | ||||||
| Morgan Stanley, 4.540% 11/24/2006 | 1.8 | ||||||
| Federal Home Loan Mortgage Corp., 2.750% 10/15/2006 | 1.8 | ||||||
| Providian Gateway Master Trust, 3.350% 09/15/2011 | 1.7 | ||||||
| Federal National Mortgage Association 6.000% 09/01/2019 | 1.7 | ||||||
We appreciate your continued confidence in the CMG Ultra Short Term Bond Fund.
Guy C. Holbrook has managed the fund since its inception and has been with the advisor or its predecessors or affiliate organizations since 1998.

Investing in fixed-income securities offers the potential for attractive current income and total returns, but also involves certain risks. The value and return of your investment may fluctuate as a result of changes in interest rates, the financial strength of issuers of lower-rated bonds or political and economic developments.
Holdings are calculated as a percentage of net assets, and are subject to change. Because the fund is actively managed, there is no guarantee the fund will continue to maintain the holdings breakdown listed. The fund's holdings and their weights within the portfolio may change as market conditions change.
1 The Citigroup One-Year U.S. Treasury Bill Index consists of a single 1-year US Treasury Bill whose return is tracked until its maturity. Unlike the fund, indices are not investments, do not incur fees or expenses and are not professionally managed. It is not possible to invest directly in an index. Securities in the fund may not match those in an index.
2 Lipper Inc., a widely respected data provider in the industry, calculates an average total return (assuming reinvestment of distributions) for mutual funds with similar investment objectives as those of the fund. Lipper makes no adjustments for the effect of sales loads.
12
Average annual total return as of January 31, 2006 (%)
| Inception | 6-month (cumulative) | 1-year | Life | ||||||||||||||||
| CMG Ultra Short Term Bond Fund | 03/08/04 | 1.75 | 2.83 | 1.83 | |||||||||||||||
| Citigroup One-Year U.S. Treasury Bill Index | 1.51 | 2.49 | 1.53 | ||||||||||||||||
Average annual total return as of December 31, 2005 (%)
| Inception | 6-month (cumulative) | 1-year | Life | ||||||||||||||||
| CMG Ultra Short Term Bond Fund | 03/08/04 | 1.39 | 2.34 | 1.72 | |||||||||||||||
| Citigroup One-Year U.S. Treasury Bill Index | 1.25 | 2.31 | 1.46 | ||||||||||||||||
Performance data quoted represents past performance and current performance may be lower or higher. Past performance is no guarantee of future results. The investment return and principal value will fluctuate so that shares, when redeemed, may be worth more or less than the original cost. Please visit www.columbiamanagement.com for daily and most recent month-end performance updates.
Performance results may reflect any voluntary waivers or reimbursement of fund expenses by the advisor or its affiliates. Absent these waivers or reimbursement arrangements, performance results would have been lower. All results shown assume reinvestment of distributions.
Growth of a $10,000 investment, March 8, 2004 to January 31, 2006
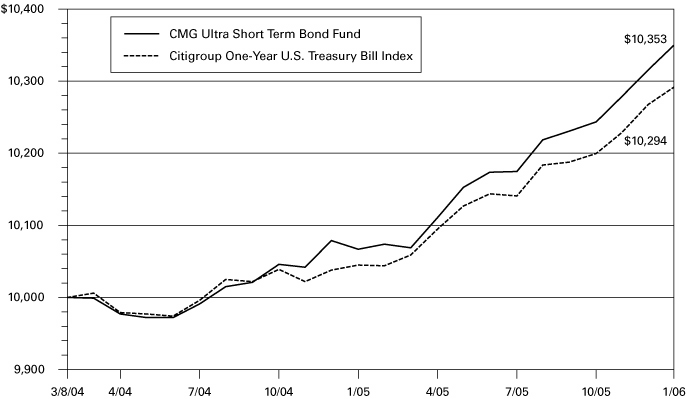
The chart above shows the growth in value of a hypothetical $10,000 investment in the fund compared to the index during the stated time period, and does not reflect the deduction of taxes that a shareholder would pay on fund distributions or the redemption of fund shares.
Index performance is from March 8, 2004.
The Citigroup One-Year U.S. Treasury Bill Index consists of a single 1-year US Treasury Bill whose return is tracked until its maturity. Unlike the fund, indices are not investments, do not incur fees or expenses and are not professionally managed. It is not possible to invest directly in an index. Securities in the fund may not match those in an index.
13
UNDERSTANDING YOUR EXPENSES – CMG Ultra Short Term Bond Fund
As a fund shareholder, you incur two types of costs. There are transaction costs and also ongoing costs, which generally include investment advisory fees and other fund expenses. The information on this page is intended to help you understand your ongoing costs of investing in the fund and to compare these costs with the ongoing costs of investing in other mutual funds.
Analyzing your fund's expenses
To illustrate these ongoing costs, we have provided an example and calculated the expenses paid by investors during the reporting period. The information in the following table is based on an initial investment of $1,000, which is invested at the beginning of the reporting period and held for the entire period. Expense information is calculated two ways and each method provides you with different information. The amount listed in the "actual" column is calculated using the fund's actual operating expenses and total return for the period. The amount listed in the "hypothetical" column assumes that the return each year is 5% before expenses and includes the fund's actual expense ratio. You should not use the hypothetical account values and expenses to estimate either your actual account balance at the end of the period or the expenses you paid during this reporting period.
Estimating your actual expenses
To estimate the expenses that you paid over the period, first you will need your account balance at the end of the period:
1. Divide your ending account balance by $1,000. For example, if an account balance was $8,600 at the end of the period, the result would be 8.6.
2. In the section of the table below titled "Expenses paid during the period," locate the amount under "actual." Multiply this number by the result from step 1. Your answer is an estimate of the expenses you paid on your account during the period.
August 1, 2005 – January 31, 2006
| Account value at the beginning of the period ($) | Account value at the end of the period ($) | Expenses paid during the period ($) | Fund's annualized expense ratio (%) | ||||||||||||||||||||||||||||
| Actual | Hypothetical | Actual | Hypothetical | Actual | Hypothetical | ||||||||||||||||||||||||||
| 1,000.00 | 1,000.00 | 1,017.49 | 1,023.95 | 1.27 | 1.28 | 0.25 | |||||||||||||||||||||||||
Expenses paid during the period are equal to the annualized expense ratio of 0.25%, multiplied by the average account value over the period, then multiplied by the number of days in the fund's most recent fiscal half-year and divided by 365.
Had the Investment Advisor not reimbursed a portion of expenses, total return would have been reduced.
It is important to note that the expense amounts shown in the table are meant to highlight only ongoing costs of investing in the fund and do not reflect any transaction costs, such as sales charges, redemption or exchange fees. Therefore, the hypothetical examples provided may not help you determine the relative total costs of owning shares of different funds. If these transaction costs were included, your costs would have been higher.
14
Compare with other funds
Since all mutual funds are required to include the same hypothetical calculations about expenses in shareholder reports, you can use this information to compare the ongoing cost of investing in the fund with other funds. To do so, compare the 5% hypothetical example with the 5% hypothetical examples that appear in the shareholder reports of other funds. As you compare hypothetical examples of other funds, it is important to note that hypothetical examples are meant to highlight the continuing costs of investing in a fund and do not reflect any transaction costs, such as sales charges or redemption or exchange fees.
15
Performance data quoted represents past performance and current performance may be lower or higher. Past performance is no guarantee of future results. The investment return and principal value will fluctuate so that shares, when redeemed, may be worth more or less than the original cost. Please visit www.columbiamanagement.com for most recent daily and month-end performance updates.
CMG HIGH YIELD FUND
A Portfolio of CMG Fund Trust
MANAGEMENT DISCUSSION OF FUND PERFORMANCE
For the six-month period ended January 31, 2006, the CMG High Yield Fund returned 1.73%. It outperformed the Merrill Lynch U.S. High Yield, Cash Pay Index and JPMorgan Chase Developed BB High Yield Index1, which returned 1.63% and 1.65%, respectively. However, it felt short of the Merrill Lynch Intermediate BB Index2 and the Lipper High Current Yields Category average3, which returned 1.87% and 1.83%, respectively for the period.
For most of the six-month period, investors demonstrated caution about the prospects for high-yield investments and returns were nearly flat going into 2006. However, a rally in January, which historically has been a strong month for high yield, pushed the sector higher and accounted for most of its positive performance for the period.
Concerns about the deteriorating financial positions of Ford and General Motors dominated investor thinking as the period began, and this caution translated into outright avoidance of the lower quality segments of the market. Securities with "CCC" ratings returned just 0.3% for the six months, whereas the remainder of the high-yield market returned just under 2.0%.
The fund benefited from its very low exposure to CCC-rated securities—2.0% versus 20% for the benchmark. However, the advantage gained by its high-quality orientation was partially offset by below-benchmark exposure to the wireline and wireless telecommunications industries, which were the strongest performers for the period.
The fund was significantly underweight in the auto/transportation sector at a time when concerns about future pension and health care costs and weak operating results led to negative returns. Our decision to underweight the auto industry produced positive relative results.
During the fourth quarter of 2005, we began to restructure the fund's industry weights to bring them more in line with its benchmarks. We also took steps to broaden the fund's diversification. We established 20+ new positions, bringing the total number of fund holdings to 139 by the end of the six-month period. We also trimmed holdings in print media companies R.H. Donnelley Finance Corp. and Dex Media West LLC after the two companies reached a merger agreement. The merger, which was completed in January, brought the portfolio weight of the combined companies above our comfort level and we brought it down to a level that was more in line with fund risk tolerance.
While we broadened the fund's holdings, we also preserved the fund's conservative orientation and with it a significant underweight of CCC-rated investments versus its benchmark and competitive universe. We believe this positioning is prudent in light of the fund's conservative nature and our assessment that the high-yield market is currently fairly valued.
16
The fund's top ten issuers (as a percentage of net assets) as of January 31, 2006 were (%):
| Teekay Shipping Corp., 8.875% 07/15/2011 | 2.3 | ||||||
| Cott Beverages, Inc., 8.000% 12/15/2011 | 1.7 | ||||||
| AES Corp., 7.750% 03/01/2014 | 1.6 | ||||||
| Texas Genco LLC, 6.875% 12/15/2014 | 1.6 | ||||||
| MGM Mirage, 6.000% 10/01/2009 | 1.5 | ||||||
| Williams Companies, Inc., 8.125% 03/15/2012 | 1.5 | ||||||
| AutoNation, Inc., 9.000% 08/01/2008 | 1.5 | ||||||
| Chesapeake Energy Corp., 6.375% 06/15/2015 | 1.5 | ||||||
| Coventry Health Care, Inc., 5.875% 01/15/2012 | 1.5 | ||||||
| Fisher Scientific International, Inc., 6.750% 08/15/2014 | 1.4 | ||||||
We appreciate your continued confidence in the CMG High Yield Fund.
Stephen Peacher, lead manager for CMG High Yield Fund, has co-managed the fund since September 2005. He has been with the advisor or its predecessors since April 2005.

Kevin L. Cronk has co-managed the fund since September 2005. He has been with the advisor or its predecessors or affiliate organizations since August 1999.

Thomas A. LaPointe has co-managed the fund since September 2005. He has been with the advisor or its predecessors or affiliate organizations since February 1999.

Investing in fixed-income securities may involves certain risks, including the credit quality of individual issuers, possible prepayments, market or economic developments and yields and share price fluctuations due to changes in interest rates. When interest rates go up, bond prices typically drop, and vice versa.
Investments in high yield or "junk" bonds offer the potential for higher income than investments in investment-grade bonds but they also have a higher degree of risk. Changes in economic conditions or other circumstances may adversely affect a high-yield bond issuer's ability to make timely principal and interest payments.
Holdings are calculated as a percentage of net assets, and are subject to change. Because the fund is actively managed, there is no guarantee the fund will continue to maintain the holdings breakdown listed. The fund's holdings and their weights within the portfolio may change as market conditions change.
1 The Merrill Lynch U.S. High Yield, Cash Pay Index is an unmanaged index that tracks the performance of non-investment-grade corporate bonds. The JPMorgan Chase Developed BB High Yield Index is an index that is designed to mirror the investable universe of the US dollar developed, BB-rated, high yield corporate debt market.
2 The Merrill Lynch Intermediate BB Index is a market-weighted index, consisting of BB cash pay bonds, which are US dollar denominated bonds issued in the US domestic market with maturities between 1 and 10 years. Unlike the fund, indices are not investments, they do not incur fees or expenses and are not professionally managed. It is not possible to invest directly in an index. Securities in the fund may not match those in an index.
3 Lipper Inc., a widely respected data provider in the industry, calculates an average total return (assuming reinvestment of distributions) for mutual funds with investment objectives similar to those of the fund. Lipper makes no adjustment for the effect of sales loads.
4 Holdings are disclosed as a percentage of net assets on January 31, 2006, and are subject to change: R.H. Donnelley Finance Corp. (1.0%) and Dex Media West LLC (0.8%).
17
Average annual total return as of January 31, 2006 (%)
| Inception | 6-month (cumulative) | 1-year | 5-year | 10-year | |||||||||||||||||||
| CMG High Yield Fund | 7/6/94 | 1.73 | 4.01 | 6.14 | 6.98 | ||||||||||||||||||
| JPMorgan Chase Developed BB High Yield Index | 1.65 | 3.57 | 8.68 | 8.23 | |||||||||||||||||||
| Merrill Lynch U.S. High Yield, Cash Pay Index | 1.63 | 4.55 | 7.84 | 6.80 | |||||||||||||||||||
| Merrill Lynch Intermediate BB Index | 1.87 | 4.64 | 6.52 | 6.49 | |||||||||||||||||||
Average annual total return as of December 31, 2005 (%)
| Inception | 6-month (cumulative) | 1-year | 5-year | 10-year | |||||||||||||||||||
| CMG High Yield Fund | 7/6/94 | 1.62 | 2.98 | 6.75 | 7.04 | ||||||||||||||||||
| JPMorgan Chase Developed BB High Yield Index | 0.98 | 2.58 | 9.34 | 8.24 | |||||||||||||||||||
| Merrill Lynch U.S. High Yield, Cash Pay Index | 1.59 | 2.83 | 8.76 | 6.80 | |||||||||||||||||||
| Merrill Lynch Intermediate BB Index | 1.23 | 2.98 | 6.99 | 6.46 | |||||||||||||||||||
Performance data quoted represents past performance and current performance may be lower or higher. Past performance is no guarantee of future results. The investment return and principal value will fluctuate so that shares, when redeemed, may be worth more or less than the original cost. Please visit www.columbiamanagement.com for daily and most recent month-end performance updates.
Performance results may reflect any voluntary waivers or reimbursement of fund expenses by the advisor or its affiliates. Absent these waivers or reimbursement arrangements, performance results would have been lower. All results shown assume reinvestment of distributions.
Growth of a $10,000 investment, February 1, 1996 to January 31, 2006
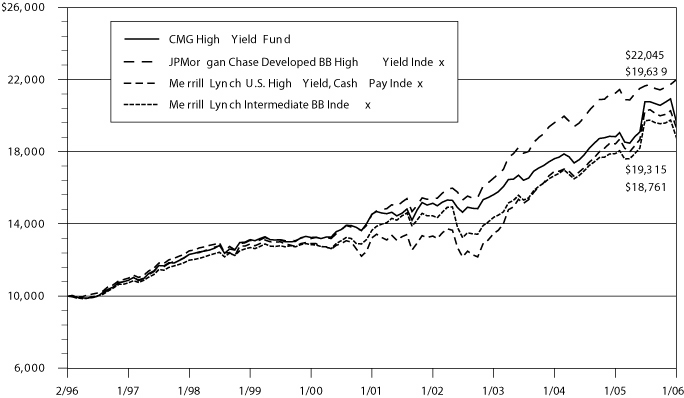
The chart above shows the growth in value of a hypothetical $10,000 investment in the fund compared to the indices during the stated time period, and does not reflect the deduction of taxes that a shareholder would pay on fund distributions or the redemption of fund shares.
Beginning in 2005, the Fund's benchmark was changed to the JPMorgan Chase Developed BB High Yield Index, an index that is designed to mirror the investable universe of the US dollar developed, BB-rated, high yield corporate debt market.
The Merrill Lynch Intermediate BB Index is a market-weighted index, consisting of BB cash pay bonds, which are US dollar denominated bonds issued in the US domestic market with maturities between 1 and 10 years. The Merrill Lynch U.S. High Yield, Cash Pay Index is an unmanaged index that tracks the performance of non-investment-grade corporate bonds. Unlike the fund, indices are not investments, they do not incur fees or expenses and are not professionally managed. It is not possible to invest directly in an index. Securities in the fund may not match those in an index.
18
UNDERSTANDING YOUR EXPENSES – CMG High Yield Fund
As a fund shareholder, you incur two types of costs. There are transaction costs and also ongoing costs, which generally include investment advisory fees and other fund expenses. The information on this page is intended to help you understand your ongoing costs of investing in the fund and to compare these costs with the ongoing costs of investing in other mutual funds.
Analyzing your fund's expenses
To illustrate these ongoing costs, we have provided an example and calculated the expenses paid by investors during the reporting period. The information in the following table is based on an initial investment of $1,000, which is invested at the beginning of the reporting period and held for the entire period. Expense information is calculated two ways and each method provides you with different information. The amount listed in the "actual" column is calculated using the fund's actual operating expenses and total return for the period. The amount listed in the "hypothetical" column assumes that the return each year is 5% before expenses and includes the fund's actual expense ratio. You should not use the hypothetical account values and expenses to estimate either your actual account balance at the end of the period or the expenses you paid during this reporting period.
Estimating your actual expenses
To estimate the expenses that you paid over the period, first you will need your account balance at the end of the period:
1. Divide your ending account balance by $1,000. For example, if an account balance was $8,600 at the end of the period, the result would be 8.6.
2. In the section of the table below titled "Expenses paid during the period," locate the amount under "actual." Multiply this number by the result from step 1. Your answer is an estimate of the expenses you paid on your account during the period.
August 1, 2005 – January 31, 2006
| Account value at the beginning of the period ($) | Account value at the end of the period ($) | Expenses paid during the period ($) | Fund's annualized expense ratio (%) | ||||||||||||||||||||||||||||
| Actual | Hypothetical | Actual | Hypothetical | Actual | Hypothetical | ||||||||||||||||||||||||||
| 1,000.00 | 1,000.00 | 1,017.29 | 1,023.19 | 2.03 | 2.04 | 0.40 | |||||||||||||||||||||||||
Expenses paid during the period are equal to the annualized expense ratio of 0.40%, multiplied by the average account value over the period, then multiplied by the number of days in the fund's most recent fiscal half-year and divided by 365.
Had the Investment Advisor not reimbursed a portion of expenses, total return would have been reduced.
It is important to note that the expense amounts shown in the table are meant to highlight only ongoing costs of investing in the fund and do not reflect any transaction costs, such as sales charges, redemption or exchange fees. Therefore, the hypothetical examples provided may not help you determine the relative total costs of owning shares of different funds. If these transaction costs were included, your costs would have been higher.
19
Compare with other funds
Since all mutual funds are required to include the same hypothetical calculations about expenses in shareholder reports, you can use this information to compare the ongoing cost of investing in the fund with other funds. To do so, compare the 5% hypothetical example with the 5% hypothetical examples that appear in the shareholder reports of other funds. As you compare hypothetical examples of other funds, it is important to note that hypothetical examples are meant to highlight the continuing costs of investing in a fund and do not reflect any transaction costs, such as sales charges or redemption or exchange fees.
20
CMG CORE BOND FUND
A Portfolio of CMG Fund Trust
FINANCIAL HIGHLIGHTS
(For a Fund Share Outstanding Throughout Each Period)
| (Unaudited) Six Months Ended January 31, | Year Ended July 31, | Period Ended July 31, | Year Ended October 31, | Period Ended October 31, | |||||||||||||||||||||||||||
| 2006 | 2005 | 2004 | 2003 (a) | 2002 | 2001 | 2000 (b) | |||||||||||||||||||||||||
| Net asset value, beginning of period | $ | 10.42 | $ | 10.36 | $ | 10.38 | $ | 10.52 | $ | 10.83 | $ | 10.02 | $ | 10.00 | |||||||||||||||||
| Income from investment operations: | |||||||||||||||||||||||||||||||
| Net investment income | 0.23 | (c) | 0.42 | (c) | 0.37 | (c) | 0.31 | (c) | 0.56 | (c)(d) | 0.65 | 0.11 | |||||||||||||||||||
| Net realized and unrealized gain (loss) on investments and futures contracts | (0.14 | ) | 0.09 | 0.11 | (0.12 | ) | (0.15 | ) (d) | 0.81 | 0.02 | |||||||||||||||||||||
| Total from investment operations | 0.09 | 0.51 | 0.48 | 0.19 | 0.41 | 1.46 | 0.13 | ||||||||||||||||||||||||
| Less distributions declared to shareholders: | |||||||||||||||||||||||||||||||
| From net investment income | (0.25 | ) | (0.45 | ) | (0.41 | ) | (0.33 | ) | (0.58 | ) | (0.65 | ) | (0.11 | ) | |||||||||||||||||
| From net realized gains | (0.01 | ) | - | (0.09 | ) | - | (0.14 | ) | - | (e) | - | ||||||||||||||||||||
| Total distributions | (0.26 | ) | (0.45 | ) | (0.50 | ) | (0.33 | ) | (0.72 | ) | (0.65 | ) | (0.11 | ) | |||||||||||||||||
| Net asset value, end of period | $ | 10.25 | $ | 10.42 | $ | 10.36 | $ | 10.38 | $ | 10.52 | $ | 10.83 | $ | 10.02 | |||||||||||||||||
| Total return (f)(g) | 0.84 | %(h) | 4.98 | % | 4.67 | % | 1.76 | %(h) | 3.97 | % | 15.01 | % | 1.31 | %(h) | |||||||||||||||||
| Ratios/Supplemental data: | |||||||||||||||||||||||||||||||
| Net assets, end of period (000's) | $ | 48,609 | $ | 79,102 | $ | 32,810 | $ | 30,512 | $ | 27,412 | $ | 28,774 | $ | 10,866 | |||||||||||||||||
| Ratio of net expenses to average net assets (i) | 0.25 | %(j) | 0.25 | % | 0.35 | % | 0.40 | %(j) | 0.40 | % | 0.40 | % | 0.40 | %(j) | |||||||||||||||||
| Ratio of investment income to average net assets (i) | 4.48 | %(j) | 4.01 | % | 3.54 | % | 3.95 | %(j) | 5.34 | %(d) | 6.14 | % | 6.57 | %(j) | |||||||||||||||||
| Waiver/reimbursement | 0.07 | %(j) | 0.06 | % | 0.25 | % | 0.29 | %(j) | 0.16 | % | 0.25 | % | 1.06 | %(j) | |||||||||||||||||
| Portfolio turnover rate | 77 | %(h) | 130 | % | 231 | % | 181 | %(h) | 147 | % | 140 | % | 103 | %(h) | |||||||||||||||||
(a) The Fund changed its fiscal year end from October 31 to July 31.
(b) The Fund commenced investment operations on September 1, 2000. Per share data, total return and portfolio turnover rate reflect activity from that date.
(c) Per share data was calculated using average shares outstanding during the period.
(d) Effective November 1, 2001, the Fund adopted the provisions of the AICPA Audit and Accounting Guide for Investment Companies and began amortizing premium and accreting discount on all debt securities. The effect of this change for the year ended October 31, 2002, was to decrease net investment income per share by $0.02, decrease net realized and unrealized loss per share by $0.02 and decrease the ratio of net investment income to average net assets from 5.53% to 5.34%. Per share data and ratios for periods prior to October 31, 2002 have not been restated to reflect this change in presentation.
(e) Rounds to less than $0.01 per share.
(f) Total return at net asset value assuming all distributions reinvested.
(g) Had the Investment Advisor not reimbursed a portion of expenses, total return would have been reduced.
(h) Not annualized.
(i) The benefits derived from custody credits had an impact of less than 0.01%.
(j) Annualized.
See Accompanying Notes to Financial Statements.
21
CMG SHORT TERM BOND FUND
A Portfolio of CMG Fund Trust
FINANCIAL HIGHLIGHTS
(For a Fund Share Outstanding Throughout Each Period)
| (Unaudited) Six Months Ended January 31, | Year Ended July 31, | Period Ended July 31, | Year Ended October 31, | ||||||||||||||||||||||||||||
| 2006 | 2005 | 2004 | 2003 (a) | 2002 | 2001 | 2000 | |||||||||||||||||||||||||
| Net asset value, beginning of period | $ | 11.79 | $ | 11.95 | $ | 12.01 | $ | 12.15 | $ | 12.41 | $ | 11.73 | $ | 11.72 | |||||||||||||||||
| Income from investment operations: | |||||||||||||||||||||||||||||||
| Net investment income | 0.24 | (b) | 0.40 | (b) | 0.35 | (b) | 0.34 | (b) | 0.59 | (b)(c) | 0.76 | 0.77 | |||||||||||||||||||
| Net realized and unrealized gain (loss) on investments, foreign currency transactions and futures contracts | (0.07 | ) | (0.11 | ) | (0.03 | ) | (0.11 | ) | (0.22 | ) (c) | 0.68 | 0.01 | |||||||||||||||||||
| Total from investment operations | 0.17 | 0.29 | 0.32 | 0.23 | 0.37 | 1.44 | 0.78 | ||||||||||||||||||||||||
| Less distributions declared to shareholders: | |||||||||||||||||||||||||||||||
| From net investment income | (0.26 | ) | (0.45 | ) | (0.38 | ) | (0.37 | ) | (0.63 | ) | (0.76 | ) | (0.77 | ) | |||||||||||||||||
| Net asset value, end of period | $ | 11.70 | $ | 11.79 | $ | 11.95 | $ | 12.01 | $ | 12.15 | $ | 12.41 | $ | 11.73 | |||||||||||||||||
| Total return (d)(e) | 1.46 | %(f) | 2.47 | % | 2.72 | % | 1.91 | %(f) | 3.12 | % | 12.62 | % | 6.92 | % | |||||||||||||||||
| Ratios/Supplemental data: | |||||||||||||||||||||||||||||||
| Net assets, end of period (000's) | $ | 68,987 | $ | 95,842 | $ | 119,125 | $ | 113,193 | $ | 140,757 | $ | 89,791 | $ | 82,809 | |||||||||||||||||
| Ratio of net expenses to average net assets (g) | 0.25 | %(h) | 0.25 | % | 0.25 | % | 0.25 | %(h) | 0.25 | % | 0.25 | % | 0.25 | % | |||||||||||||||||
| Ratio of interest expense to average net assets | - | (h) | - | - | - | (h)(i) | - | - | - | ||||||||||||||||||||||
| Ratio of net investment income to average net assets (g) | 4.01 | %(h) | 3.38 | % | 2.91 | % | 3.79 | %(h) | 4.73 | %(c) | 6.27 | % | 6.56 | % | |||||||||||||||||
| Waiver/reimbursement | 0.06 | %(h) | 0.04 | % | 0.10 | % | 0.08 | %(h) | 0.05 | % | 0.08 | % | 0.08 | % | |||||||||||||||||
| Portfolio turnover rate | 63 | %(f) | 51 | % | 79 | % | 93 | %(f) | 132 | % | 82 | % | 86 | % | |||||||||||||||||
(a) The Fund changed its fiscal year end from October 31 to July 31.
(b) Per share data was calculated using average shares outstanding during the period.
(c) Effective November 1, 2001, the Fund adopted the provisions of the AICPA Audit and Accounting Guide for Investment Companies and began amortizing premium and accreting discount on all debt securities. The effect of this change for the year ended October 31, 2002, was to decrease net investment income per share by $0.04, decrease net realized and unrealized loss per share by $0.04 and decrease the ratio of net investment income to average net assets from 5.08% to 4.73%. Per share data and ratios for periods prior to October 31, 2002 have not been restated to reflect this change in presentation.
(d) Total return at net asset value assuming all distributions reinvested.
(e) Had the Investment Advisor not reimbursed a portion of expenses, total return would have been reduced.
(f) Not annualized.
(g) The benefits derived from custody credits had an impact of less than 0.01%.
(h) Annualized.
(i) Rounds to less than 0.01%.
See Accompanying Notes to Financial Statements.
22
CMG ULTRA SHORT TERM BOND FUND
A Portfolio of CMG Fund Trust
FINANCIAL HIGHLIGHTS
(For a Fund Share Outstanding Throughout the Period)
| (Unaudited) Six Months Ended January 31, 2006 | Year Ended July 31, 2005 | Period Ended July 31, 2004 (a) | |||||||||||||
| Net asset value, beginning of period | $ | 9.67 | $ | 9.88 | $ | 10.00 | |||||||||
| Income from investment operations: | |||||||||||||||
| Net investment income (b) | 0.17 | 0.24 | 0.07 | ||||||||||||
| Net realized and unrealized loss on investments | - | (c) | (0.06 | ) | (0.08 | ) | |||||||||
| Total from investment operations | 0.17 | 0.18 | (0.01 | ) | |||||||||||
| Less distributions declared to shareholders: | |||||||||||||||
| From net investment income | (0.20 | ) | (0.36 | ) | (0.11 | ) | |||||||||
| Return of capital | - | (0.03 | ) | - | |||||||||||
| Total distributions | (0.20 | ) | (0.39 | ) | (0.11 | ) | |||||||||
| Net asset value, end of period | $ | 9.64 | $ | 9.67 | $ | 9.88 | |||||||||
| Total return (d)(e) | 1.75 | %(f) | 1.83 | % | (0.08 | )%(f) | |||||||||
| Ratios/Supplemental data: | |||||||||||||||
| Net assets, end of period (000's) | $ | 83,949 | $ | 81,575 | $ | 67,235 | |||||||||
| Ratio of net expenses to average net assets | 0.25 | %(g) | 0.25 | % | 0.25 | %(g) | |||||||||
| Ratio of net investment income to average net assets | 3.54 | %(g) | 2.44 | % | 1.69 | %(g) | |||||||||
| Waiver/reimbursement | 0.06 | %(g) | 0.05 | % | 0.22 | %(g) | |||||||||
| Portfolio turnover rate | 30 | %(f) | 75 | % | 12 | %(f) | |||||||||
(a) The Fund commenced investment operations on March 8, 2004. Per share data, total return and portfolio turnover reflect activity from that date.
(b) Per share data was calculated using average shares outstanding during the period.
(c) Rounds to less than $0.01 per share.
(d) Total return at net asset value assuming all distributions reinvested.
(e) Had the Investment Advisor not reimbursed a portion of expenses, total return would have been reduced.
(f) Not annualized.
(g) Annualized.
See Accompanying Notes to Financial Statements.
23
CMG HIGH YIELD FUND
A Portfolio of CMG Fund Trust
FINANCIAL HIGHLIGHTS
(For a Fund Share Outstanding Throughout Each Period)
| (Unaudited) Six Months Ended January 31, | Year Ended July 31, | Period Ended July 31, | Year Ended October 31, | ||||||||||||||||||||||||||||
| 2006 | 2005 | 2004 | 2003 (a) | 2002 | 2001 | 2000 | |||||||||||||||||||||||||
| Net asset value, beginning of period | $ | 8.08 | $ | 8.00 | $ | 7.90 | $ | 7.55 | $ | 8.14 | $ | 8.30 | $ | 8.54 | |||||||||||||||||
| Income from investment operations: | |||||||||||||||||||||||||||||||
| Net investment income | 0.25 | (b) | 0.51 | (b) | 0.53 | (b) | 0.43 | (b) | 0.64 | (b)(c) | 0.72 | 0.73 | |||||||||||||||||||
| Net realized and unrealized gain (loss) on investments | (0.11 | ) | 0.11 | 0.14 | 0.37 | (0.58 | ) (c) | (0.16 | ) | (0.24 | ) | ||||||||||||||||||||
| Total from investment operations | 0.14 | 0.62 | 0.67 | 0.80 | 0.06 | 0.56 | 0.49 | ||||||||||||||||||||||||
| Less distributions declared to shareholders: | |||||||||||||||||||||||||||||||
| From net investment income | (0.27 | ) | (0.54 | ) | (0.57 | ) | (0.45 | ) | (0.65 | ) | (0.72 | ) | (0.73 | ) | |||||||||||||||||
| Net asset value, end of period | $ | 7.95 | $ | 8.08 | $ | 8.00 | $ | 7.90 | $ | 7.55 | $ | 8.14 | $ | 8.30 | |||||||||||||||||
| Total return (d) | 1.73 | %(e)(f) | 7.98 | %(e) | 8.60 | %(e) | 10.67 | %(e)(f) | 0.60 | % | 6.92 | % | 6.01 | % | |||||||||||||||||
| Ratios/Supplemental data: | |||||||||||||||||||||||||||||||
| Net assets, end of period (000's) | $ | 196,697 | $ | 269,243 | $ | 382,157 | $ | 429,042 | $ | 286,228 | $ | 348,979 | $ | 319,985 | |||||||||||||||||
| Ratio of net expenses to average net assets (g) | 0.40 | %(h) | 0.40 | % | 0.40 | % | 0.42 | %(h) | 0.42 | % | 0.44 | % | 0.43 | % | |||||||||||||||||
| Ratio of investment income to average net assets (g) | 6.22 | %(h) | 6.26 | % | 6.64 | % | 7.32 | %(h) | 7.98 | %(c) | 8.63 | % | 8.70 | % | |||||||||||||||||
| Waiver/reimbursement | 0.03 | %(h) | 0.02 | % | 0.02 | % | 0.01 | %(h) | - | - | - | ||||||||||||||||||||
| Portfolio turnover rate | 18 | %(f) | 39 | % | 47 | % | 47 | %(f) | 62 | % | 59 | % | 56 | % | |||||||||||||||||
(a) The Fund changed its fiscal year end from October 31 to July 31.
(b) Per share data was calculated using average shares outstanding during the period.
(c) Effective November 1, 2001, the Fund adopted the provisions of the AICPA Audit and Accounting Guide for Investment Companies and began amortizing premium and accreting discount on all debt securities. The effect of this change for the year ended October 31, 2002, was to decrease net investment income per share by $0.01, decrease net realized and unrealized loss per share by $0.01 and decrease the ratio of net investment income to average net assets from 8.11% to 7.98%. Per share data and ratios for periods prior to October 31, 2002 have not been restated to reflect this change in presentation.
(d) Total return at net asset value assuming all distributions reinvested.
(e) Had the Investment Advisor not reimbursed a portion of expenses, total return would have been reduced.
(f) Not annualized.
(g) The benefits derived from custody credits had an impact of less than 0.01%.
(h) Annualized.
See Accompanying Notes to Financial Statements.
24
CMG CORE BOND FUND
A Portfolio of CMG Fund Trust
SCHEDULE OF INVESTMENTS
January 31, 2006 (Unaudited)
| Par | Value | ||||||||||
| Collateralized Mortgage Obligations (26.9%) | |||||||||||
| Agency (15.1%) | |||||||||||
| Federal Home Loan Mortgage Corp. | |||||||||||
| 4.000% 07/15/14 | $ | 1,020,000 | $ | 998,807 | |||||||
| 4.000% 09/15/15 | 860,000 | 832,986 | |||||||||
| 4.000% 10/15/26 | 925,000 | 902,786 | |||||||||
| 4.500% 03/15/18 | 1,580,000 | 1,541,913 | |||||||||
| 4.500% 10/15/18 | 220,000 | 216,933 | |||||||||
| 4.500% 02/15/27 | 900,000 | 879,866 | |||||||||
| 6.500% 10/15/23 | 100,000 | 103,749 | |||||||||
| Federal National Mortgage Association | |||||||||||
| 4.500% 11/25/14 | 900,000 | 885,345 | |||||||||
| 6.500% 07/25/30 | 5,110 | 5,100 | |||||||||
| Government National Mortgage Association | |||||||||||
| 4.500% 04/16/28 | 1,000,000 | 981,496 | |||||||||
| 7,348,981 | |||||||||||
| Non-Agency (11.8%) | |||||||||||
| Bear Stearns Asset Backed Securities, Inc. | |||||||||||
| 5.000% 01/25/34 | 304,727 | 300,497 | |||||||||
| Countrywide Alternative Loan Trust | |||||||||||
| 4.930% 03/25/34 (a) | 187,110 | 187,632 | |||||||||
| 5.250% 03/25/35 | 1,021,821 | 1,001,803 | |||||||||
| 5.250% 08/25/35 | 883,473 | 879,321 | |||||||||
| 5.500% 10/25/35 | 802,720 | 801,853 | |||||||||
| Countrywide Home Loan Mortgage Pass Through Trust | |||||||||||
| 4.590% 12/19/33 (a) | 257,025 | 246,530 | |||||||||
| Structured Asset Securities Corp. | |||||||||||
| 5.500% 07/25/33 | 1,145,555 | 1,137,045 | |||||||||
| Washington Mutual Mortgage Securities Corp. | |||||||||||
| 5.500% 10/25/35 | 1,200,000 | 1,198,308 | |||||||||
| 5,752,989 | |||||||||||
| Total Collateralized Mortgage Obligations (Cost of $13,286,093) | 13,101,970 | ||||||||||
| Corporate Fixed-Income Bonds & Notes (25.9%) | |||||||||||
| Basic Materials (0.7%) | |||||||||||
| Forest Products & Paper (0.4%) | |||||||||||
| International Paper Co. | |||||||||||
| 4.250% 01/15/09 | 175,000 | 169,748 | |||||||||
| Metals & Mining (0.3%) | |||||||||||
| Alcan, Inc. | |||||||||||
| 4.500% 05/15/13 | 175,000 | 165,130 | |||||||||
| 334,878 | |||||||||||
| Communications (2.7%) | |||||||||||
| Media (0.8%) | |||||||||||
| Jones Intercable, Inc. | |||||||||||
| 7.625% 04/15/08 | 200,000 | 209,356 | |||||||||
See Accompanying Notes to Financial Statements.
25
CMG CORE BOND FUND
A Portfolio of CMG Fund Trust
SCHEDULE OF INVESTMENTS
| Par | Value | ||||||||||
| Corporate Fixed-Income Bonds & Notes (continued) | |||||||||||
| Media (continued) | |||||||||||
| Time Warner, Inc. | |||||||||||
| 6.625% 05/15/29 | $ | 200,000 | $ | 200,214 | |||||||
| 409,570 | |||||||||||
| Telecommunication Services (1.9%) | |||||||||||
| Deutsche Telekom International Finance | |||||||||||
| 8.000% 06/15/10 | 150,000 | 166,127 | |||||||||
| Sprint Capital Corp. | |||||||||||
| 6.875% 11/15/28 | 200,000 | 217,238 | |||||||||
| Verizon Global Funding Corp. | |||||||||||
| 7.250% 12/01/10 | 300,000 | 323,772 | |||||||||
| Vodafone Group PLC | |||||||||||
| 7.750% 02/15/10 | 200,000 | 218,240 | |||||||||
| 925,377 | |||||||||||
| 1,334,947 | |||||||||||
| Consumer Cyclical (1.4%) | |||||||||||
| Auto Manufacturers (0.4%) | |||||||||||
| DaimlerChrysler NA Holding Corp. | |||||||||||
| 8.500% 01/18/31 | 150,000 | 181,363 | |||||||||
| Retail (1.0%) | |||||||||||
| Lowe's Companies, Inc. | |||||||||||
| 6.500% 03/15/29 | 175,000 | 191,305 | |||||||||
| Wal-Mart Stores, Inc. | |||||||||||
| 4.000% 01/15/10 | 300,000 | 289,749 | |||||||||
| 481,054 | |||||||||||
| 662,417 | |||||||||||
| Consumer Non-Cyclical (2.9%) | |||||||||||
| Beverages (0.1%) | |||||||||||
| Anheuser-Busch Companies, Inc. | |||||||||||
| 5.750% 04/01/10 | 50,000 | 51,271 | |||||||||
| Food (1.1%) | |||||||||||
| General Mills, Inc. | |||||||||||
| 2.625% 10/24/06 | 200,000 | 196,714 | |||||||||
| Kroger Co. | |||||||||||
| 6.200% 06/15/12 | 185,000 | 189,245 | |||||||||
| Safeway, Inc. | |||||||||||
| 4.950% 08/16/10 | 170,000 | 165,342 | |||||||||
| 551,301 | |||||||||||
| Healthcare Products (0.6%) | |||||||||||
| Baxter FinCo BV | |||||||||||
| 4.750% 10/15/10 (b) | 275,000 | 269,173 | |||||||||
| Healthcare Services (0.6%) | |||||||||||
| UnitedHealth Group, Inc. | |||||||||||
| 3.375% 08/15/07 | 200,000 | 195,280 | |||||||||
See Accompanying Notes to Financial Statements.
26
CMG CORE BOND FUND
A Portfolio of CMG Fund Trust
SCHEDULE OF INVESTMENTS
| Par | Value | ||||||||||
| Corporate Fixed-Income Bonds & Notes (continued) | |||||||||||
| Healthcare Services (continued) | |||||||||||
| WellPoint, Inc. | |||||||||||
| 6.800% 08/01/12 | $ | 100,000 | $ | 107,986 | |||||||
| 303,266 | |||||||||||
| Household Products/Wares (0.5%) | |||||||||||
| Fortune Brands, Inc. | |||||||||||
| 5.375% 01/15/16 | 250,000 | 245,945 | |||||||||
| 1,420,956 | |||||||||||
| Energy (1.7%) | |||||||||||
| Oil & Gas (1.3%) | |||||||||||
| ChevronTexaco Capital Co. | |||||||||||
| 3.500% 09/17/07 | 200,000 | 195,722 | |||||||||
| Devon Energy Corp. | |||||||||||
| 7.950% 04/15/32 | 175,000 | 222,951 | |||||||||
| Marathon Oil Corp. | |||||||||||
| 6.800% 03/15/32 | 175,000 | 198,256 | |||||||||
| 616,929 | |||||||||||
| Pipelines (0.4%) | |||||||||||
| Kinder Morgan Energy Partners LP | |||||||||||
| 7.300% 08/15/33 | 175,000 | 199,378 | |||||||||
| 816,307 | |||||||||||
| Financials (12.9%) | |||||||||||
| Banks (2.2%) | |||||||||||
| U.S. Bank NA | |||||||||||
| 6.375% 08/01/11 | 275,000 | 291,288 | |||||||||
| Wachovia Corp. | |||||||||||
| 4.875% 02/15/14 | 400,000 | 387,232 | |||||||||
| Wells Fargo & Co. | |||||||||||
| 4.520% 03/10/08 (a) | 380,000 | 380,145 | |||||||||
| 1,058,665 | |||||||||||
| Diversified Financial Services (8.3%) | |||||||||||
| American Express Credit Corp. | |||||||||||
| 3.000% 05/16/08 | 300,000 | 287,253 | |||||||||
| American General Finance Corp. | |||||||||||
| 5.375% 09/01/09 | 50,000 | 50,325 | |||||||||
| Bear Stearns Co., Inc. | |||||||||||
| 6.500% 05/01/06 | 200,000 | 200,810 | |||||||||
| Capital One Financial Corp. | |||||||||||
| 5.500% 06/01/15 | 210,000 | 207,287 | |||||||||
| CIT Group, Inc. | |||||||||||
| 4.125% 02/21/06 | 150,000 | 149,951 | |||||||||
| Citigroup, Inc. | |||||||||||
| 5.000% 09/15/14 | 430,000 | 421,753 | |||||||||
| Countrywide Home Loans, Inc. | |||||||||||
| 2.875% 02/15/07 | 200,000 | 195,550 | |||||||||
| General Electric Capital Corp. | |||||||||||
| 5.000% 01/08/16 | 500,000 | 490,815 | |||||||||
See Accompanying Notes to Financial Statements.
27
CMG CORE BOND FUND
A Portfolio of CMG Fund Trust
SCHEDULE OF INVESTMENTS
| Par | Value | ||||||||||
| Corporate Fixed-Income Bonds & Notes (continued) | |||||||||||
| Diversified Financial Services (continued) | |||||||||||
| Goldman Sachs Group, Inc. | |||||||||||
| 6.345% 02/15/34 | $ | 325,000 | $ | 337,642 | |||||||
| HSBC Finance Corp. | |||||||||||
| 5.000% 06/30/15 | 350,000 | 336,787 | |||||||||
| JPMorgan Chase Capital XV | |||||||||||
| 5.875% 03/15/35 | 325,000 | 318,766 | |||||||||
| Lehman Brothers Holdings, Inc. | |||||||||||
| 5.000% 01/14/11 | 225,000 | 223,978 | |||||||||
| Merrill Lynch & Co., Inc. | |||||||||||
| 4.125% 01/15/09 | 200,000 | 194,982 | |||||||||
| Morgan Stanley | |||||||||||
| 4.750% 04/01/14 | 200,000 | 189,862 | |||||||||
| SLM Corp. | |||||||||||
| 5.125% 08/27/12 | 425,000 | 423,168 | |||||||||
| 4,028,929 | |||||||||||
| Insurance (1.3%) | |||||||||||
| Allstate Financial Global Funding II | |||||||||||
| 2.625% 10/22/06 (b) | 150,000 | 147,216 | |||||||||
| American International Group, Inc. | |||||||||||
| 2.875% 05/15/08 | 325,000 | 310,141 | |||||||||
| Genworth Financial, Inc. | |||||||||||
| 4.750% 06/15/09 | 200,000 | 197,710 | |||||||||
| 655,067 | |||||||||||
| Real Estate Investment Trusts (0.3%) | |||||||||||
| Health Care Property Investors, Inc. | |||||||||||
| 6.450% 06/25/12 | 150,000 | 156,252 | |||||||||
| Savings & Loans (0.8%) | |||||||||||
| Washington Mutual, Inc. | |||||||||||
| 4.200% 01/15/10 | 400,000 | 386,528 | |||||||||
| 6,285,441 | |||||||||||
| Industrials (1.5%) | |||||||||||
| Aerospace & Defense (0.7%) | |||||||||||
| Lockheed Martin Corp. | |||||||||||
| 8.500% 12/01/29 | 160,000 | 215,266 | |||||||||
| United Technologies Corp. | |||||||||||
| 7.125% 11/15/10 | 100,000 | 108,610 | |||||||||
| 323,876 | |||||||||||
| Environmental Control (0.3%) | |||||||||||
| Waste Management, Inc. | |||||||||||
| 7.375% 08/01/10 | 150,000 | 162,100 | |||||||||
| Transportation (0.5%) | |||||||||||
| Canadian National Railway Co. | |||||||||||
| 7.195% 01/02/16 | 74,295 | 84,392 | |||||||||
See Accompanying Notes to Financial Statements.
28
CMG CORE BOND FUND
A Portfolio of CMG Fund Trust
SCHEDULE OF INVESTMENTS
| Par | Value | ||||||||||
| Corporate Fixed-Income Bonds & Notes (continued) | |||||||||||
| Transportation (continued) | |||||||||||
| Union Pacific Corp. | |||||||||||
| 3.875% 02/15/09 | $ | 185,000 | $ | 178,514 | |||||||
| 262,906 | |||||||||||
| 748,882 | |||||||||||
| Technology (0.6%) | |||||||||||
| Computers (0.6%) | |||||||||||
| International Business Machines Corp. | |||||||||||
| 6.220% 08/01/27 | 250,000 | 267,773 | |||||||||
| Utilities (1.5%) | |||||||||||
| Electric (1.3%) | |||||||||||
| CenterPoint Energy Houston Electric | |||||||||||
| 5.750% 01/15/14 | 175,000 | 178,580 | |||||||||
| Exelon Generation Co. | |||||||||||
| 6.950% 06/15/11 | 175,000 | 187,791 | |||||||||
| Scottish Power PLC | |||||||||||
| 5.375% 03/15/15 | 250,000 | 248,665 | |||||||||
| 615,036 | |||||||||||
| Gas (0.2%) | |||||||||||
| Sempra Energy | |||||||||||
| 4.750% 05/15/09 | 100,000 | 98,688 | |||||||||
| 713,724 | |||||||||||
| Total Corporate Fixed-Income Bonds & Notes (Cost of $12,728,376) | 12,585,325 | ||||||||||
| Mortgage-Backed Securities (20.6%) | |||||||||||
| Federal Home Loan Mortgage Corp. | |||||||||||
| 3.500% 10/01/18 | 305,653 | 282,894 | |||||||||
| 4.000% 11/01/20 | 275,973 | 262,202 | |||||||||
| 5.000% 01/01/19 | 734,966 | 727,351 | |||||||||
| 5.000% 07/01/19 | 579,447 | 572,854 | |||||||||
| 5.000% 06/01/20 | 1,300,161 | 1,284,617 | |||||||||
| 5.500% 11/01/17 | 115,128 | 115,842 | |||||||||
| 5.500% 03/01/18 | 95,113 | 95,703 | |||||||||
| 5.500% 08/01/35 | 1,611,441 | 1,595,722 | |||||||||
| 6.000% 05/01/17 | 167,791 | 171,020 | |||||||||
| Federal National Mortgage Association | |||||||||||
| 5.000% 02/01/20 | 504,161 | 498,123 | |||||||||
| 5.500% 09/01/35 | 516,691 | 511,328 | |||||||||
| 5.500% 10/01/35 | 984,542 | 974,322 | |||||||||
| 5.500% 11/01/35 | 1,976,259 | 1,955,744 | |||||||||
| 5.500% 12/01/35 | 908,991 | 899,555 | |||||||||
| Government National Mortgage Association | |||||||||||
| 7.000% 01/15/32 | 11,086 | 11,644 | |||||||||
| 7.000% 03/15/32 | 41,940 | 44,047 | |||||||||
| Total Mortgage-Backed Securities (Cost of $10,105,621) | 10,002,968 | ||||||||||
See Accompanying Notes to Financial Statements.
29
CMG CORE BOND FUND
A Portfolio of CMG Fund Trust
SCHEDULE OF INVESTMENTS
| Par | Value | ||||||||||
| Government & Agency Obligations (19.0%) | |||||||||||
| Foreign Government Obligations (2.4%) | |||||||||||
| Province of Ontario | |||||||||||
| 3.500% 09/17/07 | $ | 350,000 | $ | 343,140 | |||||||
| Province of Quebec | |||||||||||
| 7.000% 01/30/07 | 275,000 | 280,761 | |||||||||
| Republic of Italy | |||||||||||
| 2.500% 03/31/06 | 300,000 | 298,917 | |||||||||
| United Mexican States | |||||||||||
| 7.500% 04/08/33 | 205,000 | 239,338 | |||||||||
| 1,162,156 | |||||||||||
| U.S. Government Agencies (2.6%) | |||||||||||
| Federal Home Loan Bank | |||||||||||
| 3.000% 05/15/06 (c) | 100,000 | 99,527 | |||||||||
| 4.375% 09/11/09 | 1,210,000 | 1,190,302 | |||||||||
| 1,289,829 | |||||||||||
| U.S. Government Obligations (14.0%) | |||||||||||
| U.S. Treasury Bonds | |||||||||||
| 6.250% 08/15/23 | 3,995,000 | 4,702,866 | |||||||||
| 7.250% 05/15/16 | 715,000 | 868,390 | |||||||||
| U.S. Treasury Notes | |||||||||||
| 3.375% 10/15/09 | 300,000 | 288,586 | |||||||||
| 3.875% 01/15/09 | 876,389 | 927,055 | |||||||||
| 6,786,897 | |||||||||||
| Total Government & Agency Obligations (Cost of $9,234,960) | 9,238,882 | ||||||||||
| Commercial Mortgage-Backed Securities (4.9%) | |||||||||||
| Asset Securitization Corp. | |||||||||||
| 7.400% 10/13/26 | 504,828 | 511,649 | |||||||||
| CS First Boston Mortgage Securities Corp. | |||||||||||
| 4.512% 07/15/37 | 500,000 | 488,340 | |||||||||
| LB-UBS Commercial Mortgage Trust | |||||||||||
| 5.103% 11/15/30 | 600,000 | 599,886 | |||||||||
| Merrill Lynch Mortgage Trust | |||||||||||
| 5.240% 11/12/37 | 720,000 | 721,123 | |||||||||
| Nationslink Funding Corp. | |||||||||||
| 6.888% 11/10/30 | 90,000 | 91,887 | |||||||||
| Total Commercial Mortgage-Backed Securities (Cost of $2,443,592) | 2,412,885 | ||||||||||
| Asset-Backed Securities (0.8%) | |||||||||||
| ABFS Mortgage Loan Trust | |||||||||||
| 4.430% 12/15/33 | 205,119 | 199,745 | |||||||||
| IMC Home Equity Loan Trust | |||||||||||
| 7.310% 11/20/28 | 64,202 | 64,115 | |||||||||
| 7.520% 08/20/28 | 34,617 | 34,542 | |||||||||
| New Century Home Equity Loan Trust | |||||||||||
| 7.320% 07/25/29 | 3,253 | 3,257 | |||||||||
See Accompanying Notes to Financial Statements.
30
CMG CORE BOND FUND
A Portfolio of CMG Fund Trust
SCHEDULE OF INVESTMENTS
| Par | Value | ||||||||||
| Asset-Backed Securities (continued) | |||||||||||
| Wilshire Mortgage Loan Trust | |||||||||||
| 7.255% 05/25/28 | $ | 71,725 | $ | 71,450 | |||||||
| Total Asset-Backed Securities (Cost of $385,623) | 373,109 | ||||||||||
| Short-Term Obligation (1.5%) | |||||||||||
| Repurchase agreement with State Street Bank & Trust Co., dated 01/31/06, due 02/01/06 at 4.270%, collateralized by a U.S. Treasury Bond maturing 05/15/15, market value of $736,988 (repurchase proceeds $721,086) | 721,000 | 721,000 | |||||||||
| Total Short-Term Obligation (Cost of $721,000) | 721,000 | ||||||||||
| Total Investments (99.6%) (Cost of $48,905,265) (d) | 48,436,139 | ||||||||||
| Other Assets & Liabilities, Net (0.4%) | 172,555 | ||||||||||
| Net Assets (100.0%) | $ | 48,608,694 | |||||||||
Notes to Schedule of Investments:
(a) The interest rate shown on floating rate or variable rate securities reflects the rate at January 31, 2006.
(b) Security exempt from registration pursuant to Rule 144A under the Securities Act of 1933. These securities may be resold in transactions exempt from registration, normally to qualified institutional buyers. At January 31, 2006, these securities, which are not Illiquid, amount to $416,389, which represents 0.9% of net assets.
(c) Security pledged as collateral for open futures contracts.
(d) Cost for federal income tax purposes is $48,993,367.
At January 31, 2006, the Fund held the following open short future contracts:
| Type | Number of Contracts | Value | Aggregate Face Value | Expiration Date | Unrealized Appreciation | ||||||||||||||||||
| 2 Year U. S. Treasury Note | 15 | $ | 3,072,656 | $ | 3,078,281 | Mar-2006 | $ | 5,625 | |||||||||||||||
At January 31, 2006, the asset allocation of the Fund is as follows:
Asset allocation | % of Net Assets | ||||||
| Collateralized Mortgage Obligations | 26.9 | % | |||||
| Corporate Fixed-Income Bonds & Notes | 25.9 | ||||||
| Mortgage-Backed Securities | 20.6 | ||||||
| Government & Agency Obligations | 19.0 | ||||||
| Commercial Mortgage-Backed Securities | 4.9 | ||||||
| Asset-Backed Securities | 0.8 | ||||||
| Short-Term Obligation | 1.5 | ||||||
| Other Assets & Liabilities, Net | 0.4 | ||||||
| 100.0 | % | ||||||
See Accompanying Notes to Financial Statements.
31
CMG SHORT TERM BOND FUND
A Portfolio of CMG Fund Trust
SCHEDULE OF INVESTMENTS
January 31, 2006 (Unaudited)
| Par | Value | ||||||||||
| Corporate Fixed-Income Bonds & Notes (32.2%) | |||||||||||
| Basic Materials (0.3%) | |||||||||||
| Forest Products & Paper (0.3%) | |||||||||||
| International Paper Co. | |||||||||||
| 4.250% 01/15/09 | $ | 200,000 | $ | 193,998 | |||||||
| Communications (3.5%) | |||||||||||
| Media (0.7%) | |||||||||||
| Jones Intercable, Inc. | |||||||||||
| 7.625% 04/15/08 | 110,000 | 115,146 | |||||||||
| Time Warner, Inc. | |||||||||||
| 6.125% 04/15/06 | 400,000 | 400,780 | |||||||||
| 515,926 | |||||||||||
| Telecommunication Services (2.8%) | |||||||||||
| Deutsche Telekom International Finance BV | |||||||||||
| 8.500% 06/15/10 | 250,000 | 276,878 | |||||||||
| New Cingular Wireless Services, Inc | |||||||||||
| 7.500% 05/01/07 | 300,000 | 308,961 | |||||||||
| SBC Communications, Inc. | |||||||||||
| 5.750% 05/02/06 | 325,000 | 325,676 | |||||||||
| Sprint Capital Corp. | |||||||||||
| 6.375% 05/01/09 | 245,000 | 252,972 | |||||||||
| Verizon Global Funding Corp. | |||||||||||
| 7.600% 03/15/07 | 575,000 | 590,772 | |||||||||
| Vodafone Group PLC | |||||||||||
| 7.750% 02/15/10 | 150,000 | 163,680 | |||||||||
| 1,918,939 | |||||||||||
| 2,434,865 | |||||||||||
| Consumer Cyclical (1.2%) | |||||||||||
| Auto Manufacturers (0.3%) | |||||||||||
| DaimlerChrysler NA Holding Corp. | |||||||||||
| 4.750% 01/15/08 | 200,000 | 197,890 | |||||||||
| Retail (0.9%) | |||||||||||
| Costco Wholesale Corp. | |||||||||||
| 5.500% 03/15/07 | 275,000 | 276,502 | |||||||||
| Wal-Mart Stores, Inc. | |||||||||||
| 4.000% 01/15/10 | 375,000 | 362,186 | |||||||||
| 638,688 | |||||||||||
| 836,578 | |||||||||||
| Consumer Non-Cyclical (4.7%) | |||||||||||
| Beverages (1.6%) | |||||||||||
| Bottling Group LLC | |||||||||||
| 2.450% 10/16/06 | 375,000 | 368,692 | |||||||||
| Coca-Cola Enterprises, Inc. | |||||||||||
| 5.750% 11/01/08 | 325,000 | 331,757 | |||||||||
See Accompanying Notes to Financial Statements.
32
CMG SHORT TERM BOND FUND
A Portfolio of CMG Fund Trust
SCHEDULE OF INVESTMENTS
| Par | Value | ||||||||||
| Corporate Fixed-Income Bonds & Notes (continued) | |||||||||||
| Beverages (continued) | |||||||||||
| Diageo Capital PLC | |||||||||||
| 3.375% 03/20/08 | $ | 400,000 | $ | 386,624 | |||||||
| 1,087,073 | |||||||||||
| Food (1.4%) | |||||||||||
| General Mills, Inc. | |||||||||||
| 2.625% 10/24/06 | 450,000 | 442,606 | |||||||||
| Kroger Co. | |||||||||||
| 7.650% 04/15/07 | 275,000 | 282,508 | |||||||||
| Safeway, Inc. | |||||||||||
| 4.950% 08/16/10 | 280,000 | 272,328 | |||||||||
| 997,442 | |||||||||||
| Healthcare Products (0.3%) | |||||||||||
| Baxter FinCo BV | |||||||||||
| 4.750% 10/15/10 (a) | 250,000 | 244,703 | |||||||||
| Healthcare Services (0.9%) | |||||||||||
| UnitedHealth Group, Inc. | |||||||||||
| 3.375% 08/15/07 | 350,000 | 341,740 | |||||||||
| WellPoint, Inc. | |||||||||||
| 6.375% 06/15/06 | 250,000 | 251,350 | |||||||||
| 593,090 | |||||||||||
| Household Products/Wares (0.5%) | |||||||||||
| Fortune Brands, Inc. | |||||||||||
| 5.125% 01/15/11 | 325,000 | 323,346 | |||||||||
| 3,245,654 | |||||||||||
| Energy (1.6%) | |||||||||||
| Oil & Gas (1.6%) | |||||||||||
| ChevronTexaco Capital Co. | |||||||||||
| 3.500% 09/17/07 | 375,000 | 366,979 | |||||||||
| Devon Energy Corp. | |||||||||||
| 2.750% 08/01/06 | 400,000 | 395,640 | |||||||||
| Marathon Oil Corp. | |||||||||||
| 5.375% 06/01/07 | 350,000 | 351,452 | |||||||||
| 1,114,071 | |||||||||||
| Financials (15.2%) | |||||||||||
| Banks (3.2%) | |||||||||||
| Marshall & Ilsley Corp. | |||||||||||
| 4.375% 08/01/09 | 425,000 | 416,810 | |||||||||
| U.S. Bancorp | |||||||||||
| 3.125% 03/15/08 | 450,000 | 433,872 | |||||||||
| Wachovia Corp. | |||||||||||
| 3.500% 08/15/08 | 600,000 | 580,518 | |||||||||
| Wells Fargo & Co. | |||||||||||
| 4.520% 03/10/08 (b) | 750,000 | 750,285 | |||||||||
| 2,181,485 | |||||||||||
See Accompanying Notes to Financial Statements.
33
CMG SHORT TERM BOND FUND
A Portfolio of CMG Fund Trust
SCHEDULE OF INVESTMENTS
| Par | Value | ||||||||||
| Corporate Fixed-Income Bonds & Notes (continued) | |||||||||||
| Diversified Financial Services (8.7%) | |||||||||||
| American Express Credit Corp. | |||||||||||
| 3.000% 05/16/08 | $ | 350,000 | $ | 335,128 | |||||||
| American General Finance Corp. | |||||||||||
| 3.000% 11/15/06 | 175,000 | 172,379 | |||||||||
| Bear Stearns Co. Inc. | |||||||||||
| 6.500% 05/01/06 | 225,000 | 225,911 | |||||||||
| Capital One Bank | |||||||||||
| 4.875% 05/15/08 | 150,000 | 148,961 | |||||||||
| Caterpillar Financial Services Corp. | |||||||||||
| 3.625% 11/15/07 | 425,000 | 415,017 | |||||||||
| CIT Group, Inc. | |||||||||||
| 4.125% 02/21/06 | 250,000 | 249,917 | |||||||||
| Citigroup, Inc. | |||||||||||
| 4.250% 07/29/09 | 450,000 | 439,839 | |||||||||
| Countrywide Home Loans, Inc. | |||||||||||
| 2.875% 02/15/07 | 350,000 | 342,212 | |||||||||
| Credit Suisse First Boston USA, Inc. | |||||||||||
| 4.875% 08/15/10 | 250,000 | 247,320 | |||||||||
| General Electric Capital Corp. | |||||||||||
| 4.250% 01/15/08 | 500,000 | 493,600 | |||||||||
| Goldman Sachs Group, Inc. | |||||||||||
| 5.000% 01/15/11 | 375,000 | 372,679 | |||||||||
| HSBC Finance Corp. | |||||||||||
| 6.400% 06/17/08 | 350,000 | 360,276 | |||||||||
| JPMorgan Chase & Co. | |||||||||||
| 3.800% 10/02/09 | 550,000 | 526,834 | |||||||||
| Lehman Brothers Holdings, Inc. | |||||||||||
| 5.000% 01/14/11 | 350,000 | 348,411 | |||||||||
| Merrill Lynch & Co., Inc. | |||||||||||
| 4.125% 01/15/09 | 325,000 | 316,846 | |||||||||
| Morgan Stanley | |||||||||||
| 3.875% 01/15/09 | 475,000 | 459,524 | |||||||||
| Pitney Bowes Credit Corp. | |||||||||||
| 5.750% 08/15/08 | 250,000 | 254,540 | |||||||||
| USA Education, Inc. | |||||||||||
| 5.625% 04/10/07 | 300,000 | 302,274 | |||||||||
| 6,011,668 | |||||||||||
| Insurance (1.7%) | |||||||||||
| Allstate Financial Global Funding II | |||||||||||
| 2.625% 10/22/06 (a) | 350,000 | 343,504 | |||||||||
| American International Group, Inc. | |||||||||||
| 2.875% 05/15/08 | 500,000 | 477,140 | |||||||||
| Genworth Financial, Inc. | |||||||||||
| 4.750% 06/15/09 | 350,000 | 345,993 | |||||||||
| 1,166,637 | |||||||||||
| Real Estate Investment Trusts (0.6%) | |||||||||||
| American Health Properties | |||||||||||
| 7.500% 01/15/07 | 400,000 | 408,208 | |||||||||
See Accompanying Notes to Financial Statements.
34
CMG SHORT TERM BOND FUND
A Portfolio of CMG Fund Trust
SCHEDULE OF INVESTMENTS
| Par | Value | ||||||||||
| Corporate Fixed-Income Bonds & Notes (continued) | |||||||||||
| Savings & Loans (1.0%) | |||||||||||
| Washington Mutual, Inc. | |||||||||||
| 4.200% 01/15/10 | $ | 475,000 | $ | 459,002 | |||||||
| World Savings Bank | |||||||||||
| 4.125% 03/10/08 | 250,000 | 245,980 | |||||||||
| 704,982 | |||||||||||
| 10,472,980 | |||||||||||
| Industrials (3.4%) | |||||||||||
| Aerospace & Defense (1.1%) | |||||||||||
| Boeing Co. | |||||||||||
| 8.100% 11/15/06 | 375,000 | 383,985 | |||||||||
| United Technologies Corp. | |||||||||||
| 4.875% 11/01/06 | 400,000 | 399,728 | |||||||||
| 783,713 | |||||||||||
| Environmental Control (0.5%) | |||||||||||
| USA Waste Services, Inc. | |||||||||||
| 7.125% 10/01/07 | 300,000 | 309,978 | |||||||||
| Machinery (0.4%) | |||||||||||
| John Deere Capital Corp. | |||||||||||
| 4.625% 04/15/09 | 300,000 | 296,451 | |||||||||
| Transportation (1.4%) | |||||||||||
| Canadian National Railway Co. | |||||||||||
| 6.450% 07/15/06 (b) | 425,000 | 427,890 | |||||||||
| CSX Corp. | |||||||||||
| 6.750% 03/15/11 | 225,000 | 239,618 | |||||||||
| Union Pacific Corp. | |||||||||||
| 3.875% 02/15/09 | 325,000 | 313,606 | |||||||||
| 981,114 | |||||||||||
| 2,371,256 | |||||||||||
| Technology (0.6%) | |||||||||||
| Computers (0.6%) | |||||||||||
| International Business Machines Corp. | |||||||||||
| 4.250% 09/15/09 | 400,000 | 391,036 | |||||||||
| Utilities (1.7%) | |||||||||||
| Electric (0.9%) | |||||||||||
| Exelon Generation Co. LLC | |||||||||||
| 6.950% 06/15/11 | 350,000 | 375,581 | |||||||||
| Scottish Power PLC | |||||||||||
| 4.910% 03/15/10 | 275,000 | 271,538 | |||||||||
| 647,119 | |||||||||||
| Gas (0.8%) | |||||||||||
| Kinder Morgan Energy Partners LP | |||||||||||
| 6.750% 03/15/11 | 275,000 | 291,646 | |||||||||
See Accompanying Notes to Financial Statements.
35
CMG SHORT TERM BOND FUND
A Portfolio of CMG Fund Trust
SCHEDULE OF INVESTMENTS
| Par | Value | ||||||||||
| Corporate Fixed-Income Bonds & Notes (continued) | |||||||||||
| Gas (continued) | |||||||||||
| Sempra Energy | |||||||||||
| 4.750% 05/15/09 | $ | 250,000 | $ | 246,720 | |||||||
| 538,366 | |||||||||||
| 1,185,485 | |||||||||||
| Total Corporate Fixed-Income Bonds & Notes (Cost of $22,563,813) | 22,245,923 | ||||||||||
| Asset-Backed Securities (16.8%) | |||||||||||
| Ameriquest Mortgage Securities, Inc. | |||||||||||
| 4.730% 05/25/33 (b) | 60,856 | 60,856 | |||||||||
| Bear Stearns Asset Backed Securities, Inc. | |||||||||||
| 4.490% 06/25/35 (b) | 605,555 | 605,749 | |||||||||
| CIT Equipment Collateral | |||||||||||
| 2.200% 03/20/08 | 85,741 | 84,526 | |||||||||
| Cityscape Home Equity Loan Trust | |||||||||||
| 7.410% 05/25/28 | 63,597 | 63,429 | |||||||||
| 7.650% 09/25/25 | 332,102 | 331,030 | |||||||||
| Countrywide Asset-Backed Certificates | |||||||||||
| 4.470% 08/25/35 (b) | 317,166 | 317,192 | |||||||||
| IMC Home Equity Loan Trust | |||||||||||
| 7.500% 04/25/26 | 457,013 | 458,139 | |||||||||
| 7.520% 08/20/28 | 82,549 | 82,369 | |||||||||
| KeyCorp Student Loan Trust | |||||||||||
| 4.400% 08/27/25 (b) | 673,115 | 675,764 | |||||||||
| 4.940% 01/27/23 (a)(b) | 866,033 | 872,399 | |||||||||
| Long Beach Auto Receivables Trust | |||||||||||
| 4.050% 04/15/11 | 1,700,000 | 1,667,462 | |||||||||
| Mastr Asset Backed Securities Trust | |||||||||||
| 4.530% 11/25/35 (b) | 1,075,656 | 1,076,204 | |||||||||
| New Century Home Equity Loan Trust | |||||||||||
| 4.750% 01/25/34 (b) | 204,267 | 204,961 | |||||||||
| Novastar Home Equity Loan | |||||||||||
| 4.510% 01/25/36 (b) | 600,679 | 600,932 | |||||||||
| SLM Student Loan Trust | |||||||||||
| 5.090% 01/25/13 (b) | 3,140,000 | 3,225,785 | |||||||||
| UCFC Home Equity Loan | |||||||||||
| 6.315% 04/15/30 | 294,833 | 295,004 | |||||||||
| WFS Financial Owner Trust | |||||||||||
| 2.810% 08/22/11 | 1,000,000 | 979,630 | |||||||||
| Total Asset-Backed Securities (Cost of $11,560,211) | 11,601,431 | ||||||||||
See Accompanying Notes to Financial Statements.
36
CMG SHORT TERM BOND FUND
A Portfolio of CMG Fund Trust
SCHEDULE OF INVESTMENTS
| Par | Value | ||||||||||
| Collateralized Mortgage Obligations (16.4%) | |||||||||||
| Agency (4.4%) | |||||||||||
| Federal Home Loan Mortgage Corp. | |||||||||||
| 3.000% 06/15/09 | $ | 890,657 | $ | 886,544 | |||||||
| 4.000% 09/15/15 | 640,000 | 623,563 | |||||||||
| 4.500% 02/15/15 | 1,300,000 | 1,282,518 | |||||||||
| 6.500% 11/15/30 | 45,304 | 45,431 | |||||||||
| Federal National Mortgage Association | |||||||||||
| 4.930% 09/25/18 (b) | 205,827 | 205,105 | |||||||||
| 3,043,161 | |||||||||||
| Non-Agency (12.0%) | |||||||||||
| Bear Stearns Adjustable Rate Mortgage Trust | |||||||||||
| 3.512% 06/25/34 (b) | 1,000,000 | 978,000 | |||||||||
| Bear Stearns Asset Backed Securities, Inc. | |||||||||||
| 5.000% 01/25/34 (b) | 989,836 | 976,097 | |||||||||
| Countrywide Alternative Loan Trust | |||||||||||
| 5.250% 08/25/35 | 1,325,210 | 1,318,981 | |||||||||
| 5.500% 02/25/36 | 1,495,127 | 1,491,255 | |||||||||
| Countrywide Home Loan Mortgage Pass Through Trust | |||||||||||
| 5.000% 02/25/33 | 1,300,000 | 1,283,282 | |||||||||
| IMPAC CMB Trust | |||||||||||
| 4.760% 12/25/33 (b) | 287,439 | 287,913 | |||||||||
| Ocwen Residential MBS Corp. | |||||||||||
| 7.000% 10/25/40 (a)(b) | 20,406 | 20,340 | |||||||||
| PNC Mortgage Securities Corp. | |||||||||||
| 1.000% 04/28/27 (b) | 6,933 | 6,344 | |||||||||
| SACO I, Inc. | |||||||||||
| 4.580% 04/25/35 (a)(b) | 918,406 | 918,001 | |||||||||
| 7.000% 08/25/36 (a) | 201,565 | 199,650 | |||||||||
| Structured Asset Securities Corp. | |||||||||||
| 5.750% 04/25/33 | 791,044 | 782,931 | |||||||||
| 8,262,794 | |||||||||||
| Total Collateralized Mortgage Obligations (Cost of $11,372,049) | 11,305,955 | ||||||||||
| Mortgage-Backed Securities (13.6%) | |||||||||||
| Federal Home Loan Mortgage Corp. | |||||||||||
| 4.000% 05/01/11 | 1,607,740 | 1,561,916 | |||||||||
| 4.500% 11/01/07 | 565,963 | 562,758 | |||||||||
| 5.000% 11/01/20 | 986,288 | 974,496 | |||||||||
| 5.500% 07/01/19 | 1,559,775 | 1,568,569 | |||||||||
| 5.500% 01/01/21 | 800,000 | 804,570 | |||||||||
| Federal National Mortgage Association | |||||||||||
| 4.500% 01/01/20 | 1,798,980 | 1,751,017 | |||||||||
| 5.000% 08/01/19 | 749,694 | 741,166 | |||||||||
| 5.000% 05/01/20 | 229,087 | 226,343 | |||||||||
| 6.000% 03/01/09 | 26,246 | 26,360 | |||||||||
| 6.000% 05/01/09 | 276,806 | 277,999 | |||||||||
See Accompanying Notes to Financial Statements.
37
CMG SHORT TERM BOND FUND
A Portfolio of CMG Fund Trust
SCHEDULE OF INVESTMENTS
| Par | Value | ||||||||||
| Mortgage-Backed Securities (continued) | |||||||||||
| Small Business Administration | |||||||||||
| 4.875% 10/25/21 (b) | $ | 15,976 | $ | 15,982 | |||||||
| 4.875% 03/25/22 (b) | 122,208 | 122,257 | |||||||||
| 4.875% 06/25/22 (b) | 406,355 | 406,535 | |||||||||
| 5.000% 07/25/21 (b) | 54,213 | 53,306 | |||||||||
| 5.000% 11/25/21 (b) | 52,807 | 52,850 | |||||||||
| 5.375% 01/25/17 (b) | 221,927 | 220,140 | |||||||||
| Total Mortgage-Backed Securities (Cost of $9,493,688) | 9,366,264 | ||||||||||
| Government & Agency Obligations (13.2%) | |||||||||||
| Foreign Government Obligations (2.5%) | |||||||||||
| Morocco Government AID Bond | |||||||||||
| 2.464% 05/01/23 (b) | 350,000 | 348,250 | |||||||||
| Province of Ontario | |||||||||||
| 6.000% 02/21/06 | 250,000 | 250,173 | |||||||||
| Province of Quebec | |||||||||||
| 7.000% 01/30/07 | 450,000 | 459,427 | |||||||||
| Republic of Italy | |||||||||||
| 2.500% 03/31/06 | 400,000 | 398,556 | |||||||||
| United Mexican States | |||||||||||
| 4.625% 10/08/08 | 275,000 | 273,075 | |||||||||
| 1,729,481 | |||||||||||
| U.S. Government Agencies (3.1%) | |||||||||||
| Federal Home Loan Bank | |||||||||||
| 3.000% 05/15/06 | 125,000 | 124,409 | |||||||||
| Federal National Mortgage Association | |||||||||||
| 4.000% 10/16/06 | 2,000,000 | 1,988,604 | |||||||||
| 2,113,013 | |||||||||||
| U.S. Government Obligations (7.6%) | |||||||||||
| U.S. Treasury Notes | |||||||||||
| 3.375% 10/15/09 | 3,110,000 | 2,991,674 | |||||||||
| 3.875% 01/15/09 | 2,145,239 | 2,269,259 | |||||||||
| 5,260,933 | |||||||||||
| Total Government & Agency Obligations (Cost of $9,211,111) | 9,103,427 | ||||||||||
| Commercial Mortgage-Backed Securities (5.2%) | |||||||||||
| LB-UBS Commercial Mortgage Trust | |||||||||||
| 5.642% 12/15/25 | 777,590 | 783,056 | |||||||||
| Nationslink Funding Corp. | |||||||||||
| 6.888% 11/10/30 | 500,000 | 510,485 | |||||||||
| Nomura Asset Securities Corp. | |||||||||||
| 7.120% 04/13/39 | 530,000 | 530,991 | |||||||||
| Prudential Securities Secured Financing Corp. | |||||||||||
| 6.480% 11/01/31 | 1,719,646 | 1,757,719 | |||||||||
| Total Commercial Mortgage-Backed Securities (Cost of $3,710,234) | 3,582,251 | ||||||||||
See Accompanying Notes to Financial Statements.
38
CMG SHORT TERM BOND FUND
A Portfolio of CMG Fund Trust
SCHEDULE OF INVESTMENTS
| Par | Value | ||||||||||
| Short-Term Obligation (2.4%) | |||||||||||
| Repurchase agreement with State Street Bank & Trust Co., dated 01/31/06, due 02/01/06 at 4.270%, collateralized by a U.S. Government Agency Obligation maturing 05/15/15, market value of $1,654,744 (repurchase proceeds $1,621,192) | $ | 1,621,000 | $ | 1,621,000 | |||||||
| Total Short-Term Obligation (Cost of $1,621,000) | 1,621,000 | ||||||||||
| Total Investments (99.8%) (Cost of $69,532,106) (c) | 68,826,251 | ||||||||||
| Other Assets & Liabilities, Net (0.2%) | 160,825 | ||||||||||
| Net Assets (100.0%) | $ | 68,987,076 | |||||||||
Notes to Schedule of Investments:
(a) Security exempt from registration pursuant to Rule 144A under the Securities Act of 1933. These securities may be resold in transactions exempt from registration, normally to qualified institutional buyers. At January 31, 2006, these securities, which are not illiquid, amounted to $2,598,597, which represents 3.8% of net assets.
(b) The interest rate shown on floating rate or variable rate securities reflects the rate at January 31, 2006.
(c) Cost for federal income tax purposes is $69,890,501.
At January 31,2006, the Fund held the following open short futures contract:
| Type | Contracts | Value | Aggregate Face Value | Expiration Date | Unrealized Appreciation | ||||||||||||||||||
| 2-Year U.S. Treasury Note | 30 | $ | 6,145,313 | $ | 6,156,563 | Mar-2006 | $ | 11,250 | |||||||||||||||
On January 31, 2006, cash of $10,500 was pledged as collateral for open futures contracts and was being held by the broker of the futures contracts.
At January 31, 2006, the asset allocation of the Fund is as follows:
Asset Allocation | % of Net Assets | ||||||
| Corporate Fixed-Income Bonds & Notes | 32.2 | % | |||||
| Asset-Backed Securities | 16.8 | ||||||
| Collateralized Mortgage Obligations | 16.4 | ||||||
| Mortgage-Backed Securities | 13.6 | ||||||
| Government & Agency Obligations | 13.2 | ||||||
| Commercial Mortgage-Backed Securities | 5.2 | ||||||
| Short-Term Obligation | 2.4 | ||||||
| Other Assets & Liabilities, Net | 0.2 | ||||||
| 100.0 | % | ||||||
See Accompanying Notes to Financial Statements.
39
CMG ULTRA SHORT TERM BOND FUND
A Portfolio of CMG Fund Trust
SCHEDULE OF INVESTMENTS
January 31, 2006 (Unaudited)
| Par | Value | ||||||||||
| Corporate Fixed-Income Bonds & Notes (34.5%) | |||||||||||
| Communications (1.2%) | |||||||||||
| Telecommunications (1.2%) | |||||||||||
| France Telecom SA | |||||||||||
| 7.200% 03/01/06 | $ | 400,000 | $ | 400,732 | |||||||
| Sprint Capital Corp. | |||||||||||
| 4.780% 08/17/06 | 600,000 | 599,478 | |||||||||
| 1,000,210 | |||||||||||
| Consumer Cyclical (5.4%) | |||||||||||
| Apparel (1.5%) | |||||||||||
| Jones Apparel Group, Inc. | |||||||||||
| 7.875% 06/15/06 | 500,000 | 504,815 | |||||||||
| Nike, Inc. | |||||||||||
| 5.500% 08/15/06 | 750,000 | 752,355 | |||||||||
| 1,257,170 | |||||||||||
| Auto Manufacturers (1.2%) | |||||||||||
| DaimlerChrysler North America Holding Corp. | |||||||||||
| 4.990% 05/24/06 (a) | 600,000 | 600,300 | |||||||||
| 6.400% 05/15/06 | 455,000 | 456,574 | |||||||||
| 1,056,874 | |||||||||||
| Retail (1.8%) | |||||||||||
| McDonald's Corp. | |||||||||||
| 5.375% 04/30/07 | 610,000 | 612,074 | |||||||||
| Target Corp. | |||||||||||
| 5.950% 05/15/06 | 885,000 | 887,823 | |||||||||
| 1,499,897 | |||||||||||
| Textiles (0.9%) | |||||||||||
| Cintas Corp. | |||||||||||
| 5.125% 06/01/07 | 750,000 | 751,568 | |||||||||
| 4,565,509 | |||||||||||
| Consumer Non-Cyclical (5.2%) | |||||||||||
| Agriculture (0.8%) | |||||||||||
| Altria Group, Inc. | |||||||||||
| 6.375% 02/01/06 | 200,000 | 199,972 | |||||||||
| Cargill, Inc. | |||||||||||
| 6.250% 05/01/06 (b) | 500,000 | 501,625 | |||||||||
| 701,597 | |||||||||||
| Beverages (1.5%) | |||||||||||
| Bottling Group LLC | |||||||||||
| 2.450% 10/16/06 | 700,000 | 688,226 | |||||||||
| Coca-Cola Enterprises, Inc. | |||||||||||
| 5.375% 08/15/06 | 550,000 | 551,546 | |||||||||
| 1,239,772 | |||||||||||
| Food (1.8%) | |||||||||||
| Campbell Soup Co. | |||||||||||
| 6.900% 10/15/06 | 750,000 | 759,615 | |||||||||
See Accompanying Notes to Financial Statements.
40
CMG ULTRA SHORT TERM BOND FUND
A Portfolio of CMG Fund Trust
SCHEDULE OF INVESTMENTS
| Par | Value | ||||||||||
| Corporate Fixed-Income Bonds & Notes (continued) | |||||||||||
| Food (continued) | |||||||||||
| Sysco Corp. | |||||||||||
| 7.000% 05/01/06 | $ | 750,000 | $ | 753,967 | |||||||
| 1,513,582 | |||||||||||
| Healthcare Services (0.6%) | |||||||||||
| WellPoint, Inc. | |||||||||||
| 3.750% 12/14/07 | 500,000 | 488,100 | |||||||||
| Pharmaceuticals (0.5%) | |||||||||||
| Abbott Laboratories | |||||||||||
| 5.625% 07/01/06 | 400,000 | 401,264 | |||||||||
| 4,344,315 | |||||||||||
| Energy (0.5%) | |||||||||||
| Oil & Gas (0.5%) | |||||||||||
| Ras Laffan Liquefied Natural Gas Co., Ltd. | |||||||||||
| 3.437% 09/15/09 (b) | 409,750 | 394,454 | |||||||||
| Financials (18.7%) | |||||||||||
| Banks (0.6%) | |||||||||||
| Bank One Corp. | |||||||||||
| 4.590% 02/27/06 (a) | 545,000 | 544,896 | |||||||||
| Diversified Financial Services (15.3%) | |||||||||||
| American Honda Finance Corp. | |||||||||||
| 4.400% 08/23/07 (a)(b) | 500,000 | 500,130 | |||||||||
| Capital One Bank | |||||||||||
| 6.875% 02/01/06 | 925,000 | 925,055 | |||||||||
| CIT Group, Inc. | |||||||||||
| 4.540% 02/15/07 (a) | 1,000,000 | 1,001,800 | |||||||||
| 6.500% 02/07/06 | 360,000 | 360,065 | |||||||||
| Countrywide Home Loans, Inc. | |||||||||||
| 3.250% 05/21/08 | 500,000 | 479,280 | |||||||||
| Credit Suisse First Boston USA, Inc. | |||||||||||
| 4.840% 02/15/07 (a) | 1,000,000 | 1,004,850 | |||||||||
| 4.875% 08/15/10 | 200,000 | 197,856 | |||||||||
| Ford Motor Credit Co. | |||||||||||
| 6.875% 02/01/06 | 150,000 | 149,975 | |||||||||
| General Electric Capital Corp. | |||||||||||
| 5.350% 03/30/06 | 500,000 | 500,535 | |||||||||
| 6.500% 12/10/07 | 500,000 | 513,475 | |||||||||
| Goldman Sachs Group, Inc. | |||||||||||
| 4.255% 01/09/07 (a) | 1,500,000 | 1,501,530 | |||||||||
| Household Financial Corp. | |||||||||||
| 7.650% 05/15/07 | 650,000 | 671,067 | |||||||||
| John Deere Capital Corp. | |||||||||||
| 3.625% 05/25/07 | 500,000 | 491,570 | |||||||||
| Merrill Lynch & Co. | |||||||||||
| 3.000% 04/30/07 | 200,000 | 195,378 | |||||||||
| 4.697% 06/06/06 (a) | 700,000 | 700,497 | |||||||||
| 4.773% 05/22/06 (a) | 600,000 | 603,728 | |||||||||
See Accompanying Notes to Financial Statements.
41
CMG ULTRA SHORT TERM BOND FUND
A Portfolio of CMG Fund Trust
SCHEDULE OF INVESTMENTS
| Par | Value | ||||||||||
| Corporate Fixed-Income Bonds & Notes (continued) | |||||||||||
| Diversified Financial Services (continued) | |||||||||||
| Morgan Stanley | |||||||||||
| 4.540% 11/24/06 (a) | $ | 1,500,000 | $ | 1,500,660 | |||||||
| SLM Corp. | |||||||||||
| 4.691% 09/15/06 (a) | 1,510,000 | 1,510,317 | |||||||||
| 12,807,768 | |||||||||||
| Insurance (2.2%) | |||||||||||
| Berkshire Hathaway Finance Corp. | |||||||||||
| 4.400% 05/16/08 (a) | 500,000 | 499,930 | |||||||||
| Genworth Financial, Inc. | |||||||||||
| 4.641% 06/15/07 (a) | 1,100,000 | 1,101,485 | |||||||||
| Prudential Financial, Inc. | |||||||||||
| 4.104% 11/15/06 | 225,000 | 223,601 | |||||||||
| 1,825,016 | |||||||||||
| Savings & Loans (0.6%) | |||||||||||
| World Savings Bank FSB | |||||||||||
| 4.125% 03/10/08 | 500,000 | 491,960 | |||||||||
| 15,669,640 | |||||||||||
| Industrials (1.0%) | |||||||||||
| Aerospace & Defense (0.6%) | |||||||||||
| United Technologies Corp. | |||||||||||
| 7.000% 09/15/06 | 500,000 | 506,765 | |||||||||
| Transportation (0.4%) | |||||||||||
| CSX Corp. | |||||||||||
| 4.561% 08/03/06 (a) | 387,000 | 387,000 | |||||||||
| 893,765 | |||||||||||
| Information Technology (0.3%) | |||||||||||
| IT Services (0.3%) | |||||||||||
| First Data Corp. | |||||||||||
| 4.700% 11/01/06 | 300,000 | 299,244 | |||||||||
| Utilities (2.2%) | |||||||||||
| Electric (2.2%) | |||||||||||
| Alabama Power Co. | |||||||||||
| 2.650% 02/15/06 | 400,000 | 399,604 | |||||||||
| 2.800% 12/01/06 | 400,000 | 392,824 | |||||||||
| Georgia Power Co. | |||||||||||
| 6.200% 02/01/06 | 300,000 | 299,958 | |||||||||
| Wisconsin Electric Power Co. | |||||||||||
| 3.500% 12/01/07 | 750,000 | 730,095 | |||||||||
| 1,822,481 | |||||||||||
| Total Corporate Fixed-Income Bonds & Notes (Cost of $29,100,398) | 28,989,618 | ||||||||||
See Accompanying Notes to Financial Statements.
42
CMG ULTRA SHORT TERM BOND FUND
A Portfolio of CMG Fund Trust
SCHEDULE OF INVESTMENTS
| Par | Value | ||||||||||
| Asset-Backed Securities (27.7%) | |||||||||||
| AmeriCredit Automobile Receivables Trust | |||||||||||
| 3.930% 10/06/11 | $ | 500,000 | $ | 485,890 | |||||||
| 4.310% 09/08/08 | 1,100,000 | 1,097,481 | |||||||||
| Ameriquest Mortgage Securities, Inc. | |||||||||||
| 5.000% 06/25/06 I.O. (c) | 4,412,500 | 82,337 | |||||||||
| Capital One Auto Finance Trust | |||||||||||
| 4.790% 05/15/09 | 1,000,000 | 999,140 | |||||||||
| Centex Home Equity | |||||||||||
| 4.490% 10/25/35 (a) | 855,102 | 855,512 | |||||||||
| 6.540% 01/25/32 | 289,728 | 288,033 | |||||||||
| Chase Credit Card Master Trust | |||||||||||
| 4.490% 02/15/10 (a) | 1,000,000 | 1,003,040 | |||||||||
| Chase Funding Mortgage Loan Asset-Backed Certificates | |||||||||||
| 7.140% 09/25/28 | 181,403 | 180,977 | |||||||||
| Chase Manhattan Auto Owner Trust | |||||||||||
| 4.770% 03/15/08 | 800,000 | 799,512 | |||||||||
| DaimlerChrysler Auto Trust | |||||||||||
| 3.090% 01/08/08 | 212,304 | 211,358 | |||||||||
| Franklin Auto Trust | |||||||||||
| 3.130% 11/15/11 | 500,000 | 489,835 | |||||||||
| 4.910% 04/20/10 | 1,000,000 | 999,500 | |||||||||
| Gracechurch Card Funding PLC | |||||||||||
| 4.480% 03/15/10 (a) | 1,000,000 | 1,002,330 | |||||||||
| GS Auto Loan Trust | |||||||||||
| 4.320% 05/15/08 | 750,000 | 748,073 | |||||||||
| Harley-Davidson Motorcycle Trust | |||||||||||
| 2.630% 11/15/10 | 195,290 | 191,290 | |||||||||
| Honda Auto Receivables Owner Trust | |||||||||||
| 4.850% 06/18/08 | 750,000 | 749,723 | |||||||||
| Household Automotive Trust | |||||||||||
| 2.220% 11/17/09 | 750,000 | 738,548 | |||||||||
| Long Beach Auto Receivables Trust | |||||||||||
| 4.050% 04/15/11 | 800,000 | 784,688 | |||||||||
| 4.080% 06/15/10 | 700,000 | 692,153 | |||||||||
| 4.325% 06/15/09 | 850,000 | 847,169 | |||||||||
| Long Beach Mortgage Loan Trust | |||||||||||
| 4.500% 12/25/06 I.O. (c) | 3,663,688 | 101,704 | |||||||||
| MBNA Credit Card Master Note Trust | |||||||||||
| 5.750% 10/15/08 (d) | 439,000 | 440,357 | |||||||||
| Nissan Auto Lease Trust | |||||||||||
| 2.570% 06/15/09 | 298,291 | 295,758 | |||||||||
| 4.271% 11/15/06 | 638,751 | 638,087 | |||||||||
| Onyx Acceptance Grantor Trust | |||||||||||
| 2.400% 12/15/07 | 39,417 | 39,346 | |||||||||
| 3.090% 09/15/08 | 307,638 | 304,977 | |||||||||
| Ownit Mortgage Loan Asset Backed Certificates | |||||||||||
| 5.424% 12/25/36 (a) | 726,000 | 725,492 | |||||||||
| Providian Gateway Master Trust | |||||||||||
| 3.350% 09/15/11 (b) | 1,500,000 | 1,462,815 | |||||||||
See Accompanying Notes to Financial Statements.
43
CMG ULTRA SHORT TERM BOND FUND
A Portfolio of CMG Fund Trust
SCHEDULE OF INVESTMENTS
| Par | Value | ||||||||||
| Asset-Backed Securities (continued) | |||||||||||
| Residential Asset Mortgage Products, Inc. | |||||||||||
| 3.420% 10/25/27 (a) | $ | 1,056,447 | $ | 1,046,929 | |||||||
| 3.810% 01/25/26 | 456,444 | 453,495 | |||||||||
| Residential Funding Mortgage Securities II, Inc. | |||||||||||
| 4.500% 09/25/35 (a) | 866,365 | 866,729 | |||||||||
| Soundview Home Equity Loan Trust | |||||||||||
| 4.550% 04/25/35 (a) | 260,852 | 260,933 | |||||||||
| USAA Auto Owner Trust | |||||||||||
| 2.930% 07/16/07 | 116,149 | 115,762 | |||||||||
| Volkswagen Auto Loan Enhanced Trust | |||||||||||
| 2.270% 10/22/07 | 95,916 | 95,239 | |||||||||
| WFS Financial Owner Trust | |||||||||||
| 1.760% 01/21/08 | 10,742 | 10,728 | |||||||||
| 2.850% 09/22/08 | 489,599 | 486,602 | |||||||||
| 3.020% 05/20/11 | 739,122 | 727,806 | |||||||||
| 3.150% 05/20/11 | 1,000,000 | 985,270 | |||||||||
| 3.250% 05/20/11 | 1,000,000 | 985,230 | |||||||||
| Total Asset-Backed Securities (Cost of $23,394,055) | 23,289,848 | ||||||||||
| Government & Agency Obligations (14.8%) | |||||||||||
| Foreign Government Bonds (1.2%) | |||||||||||
| Italy Government International Bond | |||||||||||
| 4.000% 06/16/08 | 1,000,000 | 982,700 | |||||||||
| U.S. Government Agencies (11.5%) | |||||||||||
| Federal Home Loan Bank | |||||||||||
| 2.625% 02/16/07 | 500,000 | 488,793 | |||||||||
| 5.375% 02/15/07 | 1,250,000 | 1,256,458 | |||||||||
| Federal Home Loan Mortgage Corp. | |||||||||||
| 2.750% 10/15/06 | 1,500,000 | 1,479,172 | |||||||||
| 2.810% 02/02/06 | 1,000,000 | 999,948 | |||||||||
| 2.875% 12/15/06 | 2,000,000 | 1,967,112 | |||||||||
| 3.750% 11/15/06 | 1,000,000 | 991,985 | |||||||||
| 4.125% 04/02/07 | 2,000,000 | 1,983,704 | |||||||||
| Federal National Mortgage Association | |||||||||||
| 4.325% 09/07/06 (a) | 500,000 | 499,920 | |||||||||
| 9,667,092 | |||||||||||
| U.S. Government Obligations (2.1%) | |||||||||||
| U.S. Treasury Notes | |||||||||||
| 2.500% 10/31/06 | 1,300,000 | 1,280,297 | |||||||||
| 3.125% 01/31/07 | 500,000 | 492,832 | |||||||||
| 1,773,129 | |||||||||||
| Total Government & Agency Obligations (Cost of $12,528,835) | 12,422,921 | ||||||||||
See Accompanying Notes to Financial Statements.
44
CMG ULTRA SHORT TERM BOND FUND
A Portfolio of CMG Fund Trust
SCHEDULE OF INVESTMENTS
| Par | Value | ||||||||||
| Collateralized Mortgage Obligations (9.5%) | |||||||||||
| Agency (6.6%) | |||||||||||
| Federal Home Loan Mortgage Corp. | |||||||||||
| 4.000% 05/15/14 | $ | 100,000 | $ | 97,763 | |||||||
| 4.000% 07/15/24 | 551,491 | 542,629 | |||||||||
| 4.250% 03/15/17 | 913,926 | 906,649 | |||||||||
| 5.000% 11/15/15 | 299,676 | 298,721 | |||||||||
| 5.000% 02/15/16 | 1,003,187 | 999,650 | |||||||||
| 5.500% 04/15/27 | 1,937,586 | 1,949,871 | |||||||||
| Federal National Mortgage Association | |||||||||||
| 5.000% 01/25/23 | 761,160 | 757,961 | |||||||||
| 5,553,244 | |||||||||||
| Non-Agency (2.9%) | |||||||||||
| Opteum Mortgage Acceptance Corp. | |||||||||||
| 5.470% 12/25/35 | 792,928 | 792,167 | |||||||||
| Paragon Mortgages PLC | |||||||||||
| 4.370% 06/15/41 (a)(b) | 500,000 | 500,000 | |||||||||
| Washington Mutual | |||||||||||
| 3.624% 04/25/35 (a) | 300,155 | 299,089 | |||||||||
| 4.843% 10/25/35 (a) | 799,736 | 792,706 | |||||||||
| 2,383,962 | |||||||||||
| Total Collateralized Mortgage Obligations (Cost of $8,010,383) | 7,937,206 | ||||||||||
| Municipal Bonds (5.0%) | |||||||||||
| CA El Dorado Irrigation District Certificates of Participation | |||||||||||
| Series 2004 B, | |||||||||||
| 2.950% 03/01/34 (a)(e) | 500,000 | 499,820 | |||||||||
| KS Wyandotte County Kansas City Unified Government Special Obligation Revenue, | |||||||||||
| 1 st Lien, | |||||||||||
| Series 2005, | |||||||||||
| 4.670% 12/01/09 (a)(e) | 500,000 | 495,650 | |||||||||
| NJ Camden County Improvement Authority | |||||||||||
| Series 2005, | |||||||||||
| 4.220% 08/03/06 (a)(e) | 500,000 | 498,160 | |||||||||
| NY City | |||||||||||
| Series 2005 L, | |||||||||||
| 4.000% 12/01/06 (a)(e) | 300,000 | 297,576 | |||||||||
| NY Urban Development Corp. Revenue | |||||||||||
| Series 2004 B-3, | |||||||||||
| 3.580% 12/15/07 (a)(e) | 800,000 | 781,000 | |||||||||
| OH Knowledge Works Foundation Student Loan Revenue | |||||||||||
| Series 2000 A-3, | |||||||||||
| 4.181% 11/01/35 (a)(e) | 500,000 | 500,000 | |||||||||
| OK Student Loan Authority | |||||||||||
| Series 2000 A-1, | |||||||||||
| 4.320% 06/01/30 (a)(e) | 500,000 | 500,000 | |||||||||
See Accompanying Notes to Financial Statements.
45
CMG ULTRA SHORT TERM BOND FUND
A Portfolio of CMG Fund Trust
SCHEDULE OF INVESTMENTS
| Par | Value | ||||||||||
| Municipal Bonds (continued) | |||||||||||
| PA Convention Center Authority Revenue | |||||||||||
| Series A, | |||||||||||
| 4.380% 03/01/06 (a)(e) | $ | 625,000 | $ | 625,000 | |||||||
| Total Municipal Bonds (Cost of $4,225,888) | 4,197,206 | ||||||||||
| Mortgage-Backed Securities (4.1%) | |||||||||||
| Federal Home Loan Mortgage Corp. | |||||||||||
| 5.000% 12/01/19 | 1,719,694 | 1,700,128 | |||||||||
| Federal National Mortgage Association | |||||||||||
| 6.000% 09/01/19 | 1,381,596 | 1,411,917 | |||||||||
| 6.500% 07/01/34 | 281,668 | 289,221 | |||||||||
| Total Mortgage-Backed Obligations (Cost of $3,484,730) | 3,401,266 | ||||||||||
| Short-Term Obligation (4.2%) | |||||||||||
| Repurchase agreement with State Street Bank & Trust Co., dated 01/31/06, due 02/01/06 at 4.270%, collateralized by a U.S. Treasury Bond maturing 02/15/26, market value of $3,604,920 (repurchase proceeds $3,532,419). | 3,532,000 | 3,532,000 | |||||||||
| Total Short-Term Obligation (Cost of $3,532,000) | 3,532,000 | ||||||||||
| Total Investments (99.8%) (Cost of $84,276,289) (f) | 83,770,065 | ||||||||||
| Other Assets & Liabilities, Net (0.2%) | 179,245 | ||||||||||
| Net Assets (100.0%) | $ | 83,949,310 | |||||||||
| Notes to Schedule of Investments: | |||||||||||
(a) The interest rate shown on floating rate or variable rate securities reflects the rate at January 31, 2006.
(b) Security exempt from registration pursuant to Rule 144A under the Securities Act of 1933. These securities may be resold in transactions exempt from registration, normally to qualified institutional buyers. At January 31, 2006, these securities, which are not illiquid, amounted to $3,359,024, which represents 4.0% of net assets.
(c) Accrued interest accumulates in the value of this security and is payable at redemption.
(d) Investments in affiliates during the six months ended January 31, 2006:
Security name: MBNA Credit Card Master Note Trust, 5.750% 10/15/08
| Par as of 07/31/05: | $ | 439,000 | |||||
| Par purchased: | - | ||||||
| Par sold: | - | ||||||
| Par as of 01/31/06: | $ | 439,000 | |||||
| Net realized gain: | $ | - | |||||
| Interest income earned: | $ | 2,104 | |||||
| Value at end of period: | $ | 440,357 | |||||
(e) Auction rate security. A debt security in which the interest rate is reset periodically, at intervals established at the time of issuance.
(f) Cost for federal income tax purposes is $84,540,977.
See Accompanying Notes to Financial Statements.
46
CMG ULTRA SHORT TERM BOND FUND
A Portfolio of CMG Fund Trust
SCHEDULE OF INVESTMENTS
At January 31, 2006, the asset allocation of the Fund is as follows:
Asset Allocation | % of Net Assets | ||||||
| Corporate Fixed-Income Bonds & Notes | 34.5 | % | |||||
| Asset-Backed Securities | 27.7 | ||||||
| Government & Agency Obligations | 14.8 | ||||||
| Collateralized Mortgage Obligations | 9.5 | ||||||
| Municipal Bonds | 5.0 | ||||||
| Mortgage-Backed Securities | 4.1 | ||||||
| Short-Term Obligation | 4.2 | ||||||
| Other Assets & Liabilities, Net | 0.2 | ||||||
| 100.0 | % | ||||||
| Acronym | Name | ||||||
| I.O. | Interest only security | ||||||
See Accompanying Notes to Financial Statements.
47
CMG HIGH YIELD FUND
A Portfolio of CMG Fund Trust
SCHEDULE OF INVESTMENTS
January 31, 2006 (Unaudited)
| Par | Value | ||||||||||
| Corporate Fixed-Income Bonds & Notes (95.3%) | |||||||||||
| Basic Materials (5.3%) | |||||||||||
| Chemicals (3.0%) | |||||||||||
| Chemicals-Diversified (1.5%) | |||||||||||
| EquiStar Chemicals LP | |||||||||||
| 10.125% 09/01/08 | $ | 950,000 | $ | 1,030,750 | |||||||
| 10.625% 05/01/11 | 585,000 | 643,500 | |||||||||
| NOVA Chemicals Corp. | |||||||||||
| 6.500% 01/15/12 | 855,000 | 822,937 | |||||||||
| 7.561% 11/15/13 (a)(b) | 380,000 | 383,800 | |||||||||
| 2,880,987 | |||||||||||
| Chemicals-Specialty (0.7%) | |||||||||||
| Nalco Co. | |||||||||||
| 7.750% 11/15/11 | 1,385,000 | 1,416,163 | |||||||||
| Industrial-Gases (0.8%) | |||||||||||
| Airgas, Inc. | |||||||||||
| 9.125% 10/01/11 | 1,545,000 | 1,645,425 | |||||||||
| 5,942,575 | |||||||||||
| Forest Products & Paper (1.3%) | |||||||||||
| Paper & Related Products (1.3%) | |||||||||||
| Boise Cascade LLC | |||||||||||
| 7.125% 10/15/14 | 2,660,000 | 2,467,150 | |||||||||
| Iron/Steel (1.0%) | |||||||||||
| Steel-Producers (1.0%) | |||||||||||
| Russel Metals, Inc. | |||||||||||
| 6.375% 03/01/14 | 1,260,000 | 1,231,650 | |||||||||
| United States Steel Corp. | |||||||||||
| 9.750% 05/15/10 | 750,000 | 818,438 | |||||||||
| 2,050,088 | |||||||||||
| 10,459,813 | |||||||||||
| Communications (10.3%) | |||||||||||
| Media (6.4%) | |||||||||||
| Cable TV (2.3%) | |||||||||||
| DirecTV Holdings LLC | |||||||||||
| 8.375% 03/15/13 | 909,000 | 978,311 | |||||||||
| EchoStar DBS Corp. | |||||||||||
| 5.750% 10/01/08 | 250,000 | 246,875 | |||||||||
| 6.625% 10/01/14 | 1,270,000 | 1,235,075 | |||||||||
| Rogers Cable, Inc. | |||||||||||
| 7.875% 05/01/12 | 1,880,000 | 2,030,400 | |||||||||
| 4,490,661 | |||||||||||
| Multimedia (1.5%) | |||||||||||
| Emmis Operating Co. | |||||||||||
| 6.875% 05/15/12 | 1,495,000 | 1,453,888 | |||||||||
See Accompanying Notes to Financial Statements.
48
CMG HIGH YIELD FUND
A Portfolio of CMG Fund Trust
SCHEDULE OF INVESTMENTS
| Par | Value | ||||||||||
| Corporate Fixed-Income Bonds & Notes (continued) | |||||||||||
| Media (continued) | |||||||||||
| Lamar Media Corp. | |||||||||||
| 7.250% 01/01/13 | $ | 1,475,000 | $ | 1,534,000 | |||||||
| 2,987,888 | |||||||||||
| Publishing-Periodicals (1.9%) | |||||||||||
| Dex Media West LLC | |||||||||||
| 5.875% 11/15/11 | 245,000 | 246,837 | |||||||||
| 9.875% 08/15/13 | 1,260,000 | 1,392,300 | |||||||||
| R.H. Donnelley Finance Corp. | |||||||||||
| 10.875% 12/15/12 (a) | 1,820,000 | 2,047,500 | |||||||||
| 3,686,637 | |||||||||||
| Television (0.7%) | |||||||||||
| LIN Television Corp. | |||||||||||
| 6.500% 05/15/13 | 1,350,000 | 1,275,750 | |||||||||
| 12,440,936 | |||||||||||
| Telecommunication Services (3.9%) | |||||||||||
| Cellular Telecommunications (2.2%) | |||||||||||
| Nextel Communications, Inc. | |||||||||||
| 7.375% 08/01/15 | 1,835,000 | 1,936,916 | |||||||||
| Rogers Wireless, Inc. | |||||||||||
| 7.500% 03/15/15 | 850,000 | 924,375 | |||||||||
| 8.000% 12/15/12 | 1,485,000 | 1,577,812 | |||||||||
| 4,439,103 | |||||||||||
| Telephone-Integrated (1.7%) | |||||||||||
| Citizens Communications Co. | |||||||||||
| 9.000% 08/15/31 | 1,150,000 | 1,184,500 | |||||||||
| Qwest Corp. | |||||||||||
| 8.875% 03/15/12 | 1,890,000 | 2,090,813 | |||||||||
| 3,275,313 | |||||||||||
| 7,714,416 | |||||||||||
| 20,155,352 | |||||||||||
| Consumer Cyclical (22.7%) | |||||||||||
| Apparel (0.5%) | |||||||||||
| Apparel Manufacturers (0.5%) | |||||||||||
| Phillips-Van Heusen Corp. | |||||||||||
| 7.250% 02/15/11 | 900,000 | 929,250 | |||||||||
| Auto Manufacturers (0.4%) | |||||||||||
| Auto-Medium & Heavy Duty Trucks (0.4%) | |||||||||||
| Navistar International Corp. | |||||||||||
| 7.500% 06/15/11 | 840,000 | 831,600 | |||||||||
| Auto Parts & Equipment (1.0%) | |||||||||||
| Auto/Truck Parts & Equipment-Original (1.0%) | |||||||||||
| Accuride Corp. | |||||||||||
| 8.500% 02/01/15 | 1,075,000 | 1,069,625 | |||||||||
See Accompanying Notes to Financial Statements.
49
CMG HIGH YIELD FUND
A Portfolio of CMG Fund Trust
SCHEDULE OF INVESTMENTS
| Par | Value | ||||||||||
| Corporate Fixed-Income Bonds & Notes (continued) | |||||||||||
| Auto/Truck Parts & Equipment-Original (continued) | |||||||||||
| TRW Automotive, Inc. | |||||||||||
| 9.375% 02/15/13 | $ | 750,000 | $ | 817,500 | |||||||
| 1,887,125 | |||||||||||
| Entertainment (3.1%) | |||||||||||
| Music (1.0%) | |||||||||||
| Warner Music Group | |||||||||||
| 7.375% 04/15/14 | 2,035,000 | 2,024,825 | |||||||||
| Racetracks (1.2%) | |||||||||||
| Speedway Motorsports, Inc. | |||||||||||
| 6.750% 06/01/13 | 2,340,000 | 2,386,800 | |||||||||
| Theaters (0.9%) | |||||||||||
| Cinemark USA, Inc. | |||||||||||
| 9.000% 02/01/13 | 1,695,000 | 1,779,750 | |||||||||
| 6,191,375 | |||||||||||
| Home Builders (3.3%) | |||||||||||
| Building-Residential/Commercial (3.3%) | |||||||||||
| Beazer Homes USA, Inc. | |||||||||||
| 6.875% 07/15/15 (a) | 1,350,000 | 1,316,250 | |||||||||
| K. Hovnanian Enterprises, Inc. | |||||||||||
| 6.000% 01/15/10 | 875,000 | 846,562 | |||||||||
| 6.375% 12/15/14 | 750,000 | 716,250 | |||||||||
| 6.500% 01/15/14 | 1,050,000 | 1,017,187 | |||||||||
| KB Home | |||||||||||
| 7.750% 02/01/10 | 225,000 | 233,438 | |||||||||
| 8.625% 12/15/08 | 2,160,000 | 2,268,000 | |||||||||
| 6,397,687 | |||||||||||
| Home Furnishings (0.7%) | |||||||||||
| Sealy Mattress Co. | |||||||||||
| 8.250% 06/15/14 | 1,365,000 | 1,409,363 | |||||||||
| Leisure Time (2.1%) | |||||||||||
| Cruise Lines (1.3%) | |||||||||||
| Royal Caribbean Cruises Ltd. | |||||||||||
| 6.875% 12/01/13 | 1,300,000 | 1,386,125 | |||||||||
| 8.750% 02/02/11 | 1,030,000 | 1,163,900 | |||||||||
| 2,550,025 | |||||||||||
| Leisure & Recreational Products (0.8%) | |||||||||||
| Leslie's Poolmart | |||||||||||
| 7.750% 02/01/13 | 1,605,000 | 1,621,050 | |||||||||
| 4,171,075 | |||||||||||
See Accompanying Notes to Financial Statements.
50
CMG HIGH YIELD FUND
A Portfolio of CMG Fund Trust
SCHEDULE OF INVESTMENTS
| Par | Value | ||||||||||
| Corporate Fixed-Income Bonds & Notes (continued) | |||||||||||
| Lodging (7.5%) | |||||||||||
| Casino Hotels (5.9%) | |||||||||||
| CCM Merger, Inc. | |||||||||||
| 8.000% 08/01/13 (a) | $ | 1,240,000 | $ | 1,209,000 | |||||||
| Chukchansi Economic Development Authority | |||||||||||
| 8.000% 11/15/13 (a) | 710,000 | 730,413 | |||||||||
| Kerzner International Ltd. | |||||||||||
| 6.750% 10/01/15 (a) | 1,270,000 | 1,235,075 | |||||||||
| MGM Mirage | |||||||||||
| 6.000% 10/01/09 | 3,010,000 | 2,998,712 | |||||||||
| 8.500% 09/15/10 | 740,000 | 804,750 | |||||||||
| Station Casinos, Inc. | |||||||||||
| 6.875% 03/01/16 | 2,465,000 | 2,495,812 | |||||||||
| Wynn Las Vegas LLC | |||||||||||
| 6.625% 12/01/14 | 2,105,000 | 2,052,375 | |||||||||
| 11,526,137 | |||||||||||
| Hotels & Motels (1.6%) | |||||||||||
| Hilton Hotels Corp. | |||||||||||
| 7.500% 12/15/17 | 500,000 | 542,190 | |||||||||
| Starwood Hotels & Resorts Worldwide, Inc. | |||||||||||
| 7.875% 05/01/12 | 2,360,000 | 2,590,100 | |||||||||
| 3,132,290 | |||||||||||
| 14,658,427 | |||||||||||
| Retail (4.1%) | |||||||||||
| Retail-Automobiles (2.2%) | |||||||||||
| AutoNation, Inc. | |||||||||||
| 9.000% 08/01/08 | 2,745,000 | 2,950,875 | |||||||||
| Group 1 Automotive, Inc. | |||||||||||
| 8.250% 08/15/13 | 1,390,000 | 1,355,250 | |||||||||
| 4,306,125 | |||||||||||
| Retail-Convenience Store (1.0%) | |||||||||||
| Couche-Tard | |||||||||||
| 7.500% 12/15/13 | 1,855,000 | 1,919,925 | |||||||||
| Retail-Propane Distributors (0.2%) | |||||||||||
| AmeriGas Partners LP. | |||||||||||
| 7.125% 05/20/16 | 480,000 | 478,200 | |||||||||
| Retail-Restaurants (0.7%) | |||||||||||
| Domino's, Inc. | |||||||||||
| 8.250% 07/01/11 | 1,300,000 | 1,352,000 | |||||||||
| 8,056,250 | |||||||||||
| 44,532,152 | |||||||||||
See Accompanying Notes to Financial Statements.
51
CMG HIGH YIELD FUND
A Portfolio of CMG Fund Trust
SCHEDULE OF INVESTMENTS
| Par | Value | ||||||||||
| Corporate Fixed-Income Bonds & Notes (continued) | |||||||||||
| Consumer Non-Cyclical (17.5%) | |||||||||||
| Beverages (3.0%) | |||||||||||
| Beverages-Non-Alcoholic (1.7%) | |||||||||||
| Cott Beverages, Inc. | |||||||||||
| 8.000% 12/15/11 | $ | 3,185,000 | $ | 3,264,625 | |||||||
| Beverages-Wine/Spirits (1.3%) | |||||||||||
| Constellation Brands, Inc. | |||||||||||
| 8.125% 01/15/12 | 2,455,000 | 2,571,612 | |||||||||
| 5,836,237 | |||||||||||
| Commercial Services (5.0%) | |||||||||||
| Commercial Services (2.2%) | |||||||||||
| Iron Mountain, Inc. | |||||||||||
| 7.750% 01/15/15 | 1,850,000 | 1,882,375 | |||||||||
| 8.625% 04/01/13 | 1,175,000 | 1,227,875 | |||||||||
| Mac-Gray Corp. | |||||||||||
| 7.625% 08/15/15 (a) | 1,340,000 | 1,360,100 | |||||||||
| 4,470,350 | |||||||||||
| Funeral Services & Related Items (0.7%) | |||||||||||
| Stewart Enterprises, Inc. | |||||||||||
| 7.250% 02/15/13 (a) | 1,395,000 | 1,353,150 | |||||||||
| Private Corrections (1.1%) | |||||||||||
| Corrections Corp. of America | |||||||||||
| 6.250% 03/15/13 | 765,000 | 753,525 | |||||||||
| 7.500% 05/01/11 | 1,330,000 | 1,371,562 | |||||||||
| 2,125,087 | |||||||||||
| Rental Auto/Equipment (1.0%) | |||||||||||
| NationsRent Companies, Inc. | |||||||||||
| 9.500% 10/15/10 | 620,000 | 678,900 | |||||||||
| United Rentals, Inc. | |||||||||||
| 7.000% 02/15/14 | 600,000 | 567,000 | |||||||||
| 7.750% 11/15/13 | 725,000 | 715,938 | |||||||||
| 1,961,838 | |||||||||||
| 9,910,425 | |||||||||||
| Food (0.7%) | |||||||||||
| Food-Miscellaneous/Diversified (0.7%) | |||||||||||
| Del Monte Corp. | |||||||||||
| 6.750% 02/15/15 (a) | 1,325,000 | 1,321,688 | |||||||||
| Healthcare Services (6.8%) | |||||||||||
| Medical-HMO (1.5%) | |||||||||||
| Coventry Health Care, Inc. | |||||||||||
| 5.875% 01/15/12 | 2,925,000 | 2,943,281 | |||||||||
See Accompanying Notes to Financial Statements.
52
CMG HIGH YIELD FUND
A Portfolio of CMG Fund Trust
SCHEDULE OF INVESTMENTS
| Par | Value | ||||||||||
| Corporate Fixed-Income Bonds & Notes (continued) | |||||||||||
| Healthcare Services (continued) | |||||||||||
| Medical-Hospitals (2.9%) | |||||||||||
| Community Health Systems | |||||||||||
| 6.500% 12/15/12 | $ | 450,000 | $ | 442,125 | |||||||
| HCA, Inc. | |||||||||||
| 6.950% 05/01/12 | 2,480,000 | 2,550,358 | |||||||||
| Triad Hospitals, Inc. | |||||||||||
| 7.000% 05/15/12 | 2,700,000 | 2,767,500 | |||||||||
| 5,759,983 | |||||||||||
| Medical-Nursing Homes (0.7%) | |||||||||||
| Extendicare Health Services, Inc. | |||||||||||
| 6.875% 05/01/14 | 1,200,000 | 1,170,000 | |||||||||
| 9.500% 07/01/10 | 255,000 | 269,662 | |||||||||
| 1,439,662 | |||||||||||
| Medical-Outpatient/Home Medical (0.2%) | |||||||||||
| Select Medical Corp. | |||||||||||
| 7.625% 02/01/15 | 410,000 | 364,900 | |||||||||
| Medical Products (1.5%) | |||||||||||
| Fisher Scientific International, Inc. | |||||||||||
| 6.750% 08/15/14 | 2,730,000 | 2,846,025 | |||||||||
| 13,353,851 | |||||||||||
| Household Products/Wares (0.6%) | |||||||||||
| Consumer Products-Miscellaneous (0.6%) | |||||||||||
| Scotts Co. | |||||||||||
| 6.625% 11/15/13 | 1,180,000 | 1,203,600 | |||||||||
| Pharmaceuticals (1.4%) | |||||||||||
| Medical-Generic Drugs (0.5%) | |||||||||||
| Mylan Laboratories, Inc. | |||||||||||
| 6.375% 08/15/15 (a) | 1,020,000 | 1,030,200 | |||||||||
| Medical-Wholesale Drug Distribution (0.7%) | |||||||||||
| AmerisourceBergen Corp. | |||||||||||
| 5.625% 09/15/12 (a) | 1,330,000 | 1,326,675 | |||||||||
| Pharmacy Services (0.2%) | |||||||||||
| Omnicare, Inc. | |||||||||||
| 6.750% 12/15/13 | 510,000 | 510,000 | |||||||||
| 2,866,875 | |||||||||||
| 34,492,676 | |||||||||||
| Energy (13.5%) | |||||||||||
| Coal (3.0%) | |||||||||||
| Arch Western Finance LLC | |||||||||||
| 6.750% 07/01/13 | 2,130,000 | 2,161,950 | |||||||||
See Accompanying Notes to Financial Statements.
53
CMG HIGH YIELD FUND
A Portfolio of CMG Fund Trust
SCHEDULE OF INVESTMENTS
| Par | Value | ||||||||||
| Corporate Fixed-Income Bonds & Notes (continued) | |||||||||||
| Coal (continued) | |||||||||||
| Massey Energy Co. | |||||||||||
| 6.875% 12/15/13 (a) | $ | 1,115,000 | $ | 1,128,937 | |||||||
| Peabody Energy Corp. | |||||||||||
| 6.875% 03/15/13 | 2,435,000 | 2,532,400 | |||||||||
| 5,823,287 | |||||||||||
| Oil & Gas (5.8%) | |||||||||||
| Oil & Gas Drilling (0.8%) | |||||||||||
| Pride International, Inc. | |||||||||||
| 7.375% 07/15/14 | �� | 1,410,000 | 1,519,275 | ||||||||
| Oil Companies-Exploration & Production (4.7%) | |||||||||||
| Chesapeake Energy Corp. | |||||||||||
| 6.375% 06/15/15 | 2,960,000 | 2,945,200 | |||||||||
| Compton Petroleum Corp. | |||||||||||
| 7.625% 12/01/13 (a) | 620,000 | 626,200 | |||||||||
| Newfield Exploration Co. | |||||||||||
| 6.625% 09/01/14 | 1,580,000 | 1,631,350 | |||||||||
| Plains Exploration & Production Co. | |||||||||||
| 7.125% 06/15/14 | 2,035,000 | 2,136,750 | |||||||||
| Pogo Producing Co. | |||||||||||
| 6.625% 03/15/15 (a) | 2,025,000 | 1,994,625 | |||||||||
| 9,334,125 | |||||||||||
| Oil Refining & Marketing (0.3%) | |||||||||||
| Tesoro Corp. | |||||||||||
| 6.625% 11/01/15 (a) | 665,000 | 667,494 | |||||||||
| 11,520,894 | |||||||||||
| Oil & Gas Services (2.1%) | |||||||||||
| Oil-Field Services (1.6%) | |||||||||||
| Compagnie Generale de Geophysique SA | |||||||||||
| 7.500% 05/15/15 (a) | 100,000 | 103,531 | |||||||||
| Hornbeck Offshore Services, Inc. | |||||||||||
| 6.125% 12/01/14 | 1,480,000 | 1,480,000 | |||||||||
| Universal Compression, Inc. | |||||||||||
| 7.250% 05/15/10 | 1,615,000 | 1,667,488 | |||||||||
| 3,251,019 | |||||||||||
| Oil Field Machinery & Equipment (0.5%) | |||||||||||
| Grant Prideco, Inc. | |||||||||||
| 6.125% 08/15/15 (a) | 890,000 | 892,225 | |||||||||
| 4,143,244 | |||||||||||
| Pipelines (2.6%) | |||||||||||
| Atlas Pipeline Partners LP | |||||||||||
| 8.125% 12/15/15 (a) | 475,000 | 488,656 | |||||||||
| MarkWest Energy Partners LP | |||||||||||
| 6.875% 11/01/14 (a) | 1,560,000 | 1,427,400 | |||||||||
See Accompanying Notes to Financial Statements.
54
CMG HIGH YIELD FUND
A Portfolio of CMG Fund Trust
SCHEDULE OF INVESTMENTS
| Par | Value | ||||||||||
| Corporate Fixed-Income Bonds & Notes (continued) | |||||||||||
| Pipelines (continued) | |||||||||||
| Williams Companies, Inc. | |||||||||||
| 6.375% 10/01/10 (a) | $ | 190,000 | $ | 190,950 | |||||||
| 8.125% 03/15/12 | 2,740,000 | 2,993,450 | |||||||||
| 5,100,456 | |||||||||||
| 26,587,881 | |||||||||||
| Financials (1.5%) | |||||||||||
| Diversified Financial Services (0.7%) | |||||||||||
| Finance-Investment Banker/Broker (0.7%) | |||||||||||
| E*Trade Financial Corp. | |||||||||||
| 7.375% 09/15/13 (a) | 1,290,000 | 1,319,025 | |||||||||
| LaBranche & Co., Inc. | |||||||||||
| 11.000% 05/15/12 | 125,000 | 138,438 | |||||||||
| 1,457,463 | |||||||||||
| Real Estate Investment Trusts (0.8%) | |||||||||||
| REITs-Hotels (0.8%) | |||||||||||
| Host Marriott LP | |||||||||||
| 6.375% 03/15/15 | 1,515,000 | 1,503,637 | �� | ||||||||
| 2,961,100 | |||||||||||
| Industrials (16.0%) | |||||||||||
| Aerospace & Defense (1.9%) | |||||||||||
| Aerospace/Defense-Equipment (1.2%) | |||||||||||
| DRS Technologies, Inc. | |||||||||||
| 6.625% 02/01/16 | 700,000 | 701,750 | |||||||||
| Sequa Corp. | |||||||||||
| 9.000% 08/01/09 | 715,000 | 777,563 | |||||||||
| TransDigm, Inc. | |||||||||||
| 8.375% 07/15/11 | 840,000 | 884,100 | |||||||||
| 2,363,413 | |||||||||||
| Electronics-Military (0.7%) | |||||||||||
| L-3 Communications Corp. | |||||||||||
| 6.375% 10/15/15 (a) | 1,460,000 | 1,452,700 | |||||||||
| 3,816,113 | |||||||||||
| Environmental Control (1.4%) | |||||||||||
| Non-Hazardous Waste Disposal (1.4%) | |||||||||||
| Allied Waste North America, Inc. | |||||||||||
| 5.750% 02/15/11 | 10,000 | 9,550 | |||||||||
| 6.375% 04/15/11 | 2,725,000 | 2,684,125 | |||||||||
| 6.500% 11/15/10 | 20,000 | 19,975 | |||||||||
| 2,713,650 | |||||||||||
| Machinery-Diversified (2.0%) | |||||||||||
| Machinery-General Industry (2.0%) | |||||||||||
| Manitowoc Co., Inc. | |||||||||||
| 7.125% 11/01/13 | 1,195,000 | 1,230,850 | |||||||||
| Westinghouse Air Brake Technologies, Inc. | |||||||||||
| 6.875% 07/31/13 | 2,590,000 | 2,654,750 | |||||||||
| 3,885,600 | |||||||||||
See Accompanying Notes to Financial Statements.
55
CMG HIGH YIELD FUND
A Portfolio of CMG Fund Trust
SCHEDULE OF INVESTMENTS
| Par | Value | ||||||||||
| Corporate Fixed-Income Bonds & Notes (continued) | |||||||||||
| Miscellaneous Manufacturing (0.7%) | |||||||||||
| Diversified Manufacturing Operators (0.7%) | |||||||||||
| Bombardier, Inc. | |||||||||||
| 6.300% 05/01/14 (a) | $ | 1,000,000 | $ | 910,000 | |||||||
| Trinity Industries, Inc. | |||||||||||
| 6.500% 03/15/14 | 435,000 | 437,175 | |||||||||
| 1,347,175 | |||||||||||
| Packaging & Containers (4.9%) | |||||||||||
| Containers-Metal/Glass (4.1%) | |||||||||||
| Ball Corp. | |||||||||||
| 6.875% 12/15/12 | 1,945,000 | 1,983,900 | |||||||||
| Crown Americas | |||||||||||
| 7.750% 11/15/15 (a) | 775,000 | 802,125 | |||||||||
| Owens-Brockway Glass Container, Inc. | |||||||||||
| 8.875% 02/15/09 | 1,115,000 | 1,163,782 | |||||||||
| Owens-Illinois, Inc. | |||||||||||
| 7.500% 05/15/10 | 1,900,000 | 1,928,500 | |||||||||
| Silgan Holdings, Inc. | |||||||||||
| 6.750% 11/15/13 | 2,180,000 | 2,174,550 | |||||||||
| 8,052,857 | |||||||||||
| Containers-Paper/Plastic (0.8%) | |||||||||||
| Smurfit-Stone Container Corp. | |||||||||||
| 8.375% 07/01/12 | 1,555,000 | 1,483,081 | |||||||||
| Stone Container Finance | |||||||||||
| 7.375% 07/15/14 | 75,000 | 67,500 | |||||||||
| 1,550,581 | |||||||||||
| 9,603,438 | |||||||||||
| Transportation (5.1%) | |||||||||||
| Transportation-Marine (4.2%) | |||||||||||
| Overseas Shipholding Group | |||||||||||
| 8.250% 03/15/13 | 1,855,000 | 1,989,487 | |||||||||
| Stena AB | |||||||||||
| 7.500% 11/01/13 | 1,765,000 | 1,742,938 | |||||||||
| Teekay Shipping Corp. | |||||||||||
| 8.875% 07/15/11 | 4,030,000 | 4,503,525 | |||||||||
| 8,235,950 | |||||||||||
| Transportation-Services (0.9%) | |||||||||||
| Offshore Logistics, Inc. | |||||||||||
| 6.125% 06/15/13 | 1,935,000 | 1,843,087 | |||||||||
| 10,079,037 | |||||||||||
| 31,445,013 | |||||||||||
| Technology (1.0%) | |||||||||||
| Office/Business Equipment (0.3%) | |||||||||||
| Office Automation & Equipment (0.3%) | |||||||||||
| Xerox Corp. | |||||||||||
| 7.125% 06/15/10 | 600,000 | 624,750 | |||||||||
See Accompanying Notes to Financial Statements.
56
CMG HIGH YIELD FUND
A Portfolio of CMG Fund Trust
SCHEDULE OF INVESTMENTS
| Par | Value | ||||||||||
| Corporate Fixed-Income Bonds & Notes (continued) | |||||||||||
| Semiconductors (0.7%) | |||||||||||
| Electronic Components - Semiconductors (0.7%) | |||||||||||
| Freescale Semiconductor, Inc. | |||||||||||
| 6.875% 07/15/11 | $ | 1,330,000 | $ | 1,389,850 | |||||||
| 2,014,600 | |||||||||||
| Utilities (7.5%) | |||||||||||
| Electric (7.0%) | |||||||||||
| Electric-Generation (3.5%) | |||||||||||
| AES Corp. | |||||||||||
| 7.750% 03/01/14 | 3,035,000 | 3,201,925 | |||||||||
| Edison Mission Energy | |||||||||||
| 7.730% 06/15/09 | 490,000 | 506,537 | |||||||||
| Texas Genco LLC | |||||||||||
| 6.875% 12/15/14 (a) | 2,885,000 | 3,133,110 | |||||||||
| 6,841,572 | |||||||||||
| Electric-Integrated (2.3%) | |||||||||||
| CMS Energy Corp. | |||||||||||
| 6.875% 12/15/15 | 410,000 | 416,150 | |||||||||
| 8.500% 04/15/11 | 260,000 | 282,425 | |||||||||
| Nevada Power Co. | |||||||||||
| 5.875% 01/15/15 | 705,000 | 709,406 | |||||||||
| 6.500% 04/15/12 | 735,000 | 763,481 | |||||||||
| NorthWestern Corp. | |||||||||||
| 5.875% 11/01/14 | 175,000 | 174,563 | |||||||||
| TECO Energy, Inc. | |||||||||||
| 6.750% 05/01/15 | 1,280,000 | 1,347,200 | |||||||||
| 7.000% 05/01/12 | 840,000 | 886,200 | |||||||||
| 4,579,425 | |||||||||||
| Independent Power Producer (1.2%) | |||||||||||
| Mirant North America LLC | |||||||||||
| 7.375% 12/31/13 (a) | 935,000 | 951,363 | |||||||||
| MSW Energy Holdings LLC | |||||||||||
| 7.375% 09/01/10 | 540,000 | 556,200 | |||||||||
| NRG Energy, Inc. | |||||||||||
| 7.250% 02/01/14 | 380,000 | 386,175 | |||||||||
| 7.375% 02/01/16 | 380,000 | 387,125 | |||||||||
| 2,280,863 | |||||||||||
| 13,701,860 | |||||||||||
| Gas (0.5%) | |||||||||||
| Gas-Distribution (0.5%) | |||||||||||
| Colorado Interstate Gas Co. | |||||||||||
| 6.800% 11/15/15 (a) | 1,055,000 | 1,103,794 | |||||||||
| 14,805,654 | |||||||||||
| Total Corporate Fixed-Income Bonds & Notes (Cost of $188,222,795) | 187,454,241 | ||||||||||
See Accompanying Notes to Financial Statements.
57
CMG HIGH YIELD FUND
A Portfolio of CMG Fund Trust
SCHEDULE OF INVESTMENTS
| Par | Value | ||||||||||
| Short-Term Obligation (2.8%) | |||||||||||
| Repurchase agreement with State Street Bank & Trust Co., dated 01/31/06, due 02/01/06 at 4.270%, collateralized by a U.S. Treasury Bond maturing 05/15/15, market value of $5,584,150 (repurchase proceeds $5,473,649) | $ | 5,473,000 | $ | 5,473,000 | |||||||
| Total Short-Term Obligation (Cost of $5,473,000) | 5,473,000 | ||||||||||
| Total Investments (98.1%) (Cost of $193,695,795) (c) | 192,927,241 | ||||||||||
| Other Assets & Liabilities, Net (1.9%) | 3,769,955 | ||||||||||
| Net Assets (100.0%) | $ | 196,697,196 | |||||||||
| Notes to Schedule of Investments: | |||||||||||
(a) Security exempt from registration pursuant to Rule 144A under the Securities Act of 1933. These securities may be resold in transactions exempt from registration, normally to qualified institutional buyers. At January 31, 2006, these securities, which are not illiquid, amounted to $30,505,986, which represents 15.5% of net assets.
(b) The interest rate shown on floating rate or variable rate securities reflects the rate at January 31, 2006.
(c) Cost for federal income tax purposes is $194,815,500.
At January 31, 2006, the asset allocation of the Fund is as follows:
Asset allocation | % of Net Assets | ||||||
| Consumer Cyclical | 22.7 | % | |||||
| Consumer Non-Cyclical | 17.5 | ||||||
| Industrials | 16.0 | ||||||
| Energy | 13.5 | ||||||
| Communications | 10.3 | ||||||
| Utilities | 7.5 | ||||||
| Basic Materials | 5.3 | ||||||
| Financials | 1.5 | ||||||
| Technology | 1.0 | ||||||
| Short-Term Obligation | 2.8 | ||||||
| Other Assets & Liabilities, Net | 1.9 | ||||||
| 100.0 | % | ||||||
See Accompanying Notes to Financial Statements.
58
STATEMENTS OF ASSETS AND LIABILITIES
January 31, 2006 (Unaudited)
| CMG Core Bond Fund | CMG Short Term Bond Fund | CMG Ultra Short Term Bond Fund | CMG High Yield Fund | ||||||||||||||||
| ASSETS: | |||||||||||||||||||
| Investments, at identified cost (including repurchase agreements) | $ | 48,905,265 | $ | 69,532,106 | $ | 83,816,779 | $ | 193,695,795 | |||||||||||
| Affiliated investments, at cost | - | - | 459,510 | - | |||||||||||||||
| Investments, at value | $ | 47,715,139 | $ | 67,205,251 | $ | 79,797,708 | $ | 187,454,241 | |||||||||||
| Affiliated investments, at value | - | - | 440,357 | - | |||||||||||||||
| Repurchase agreement | 721,000 | 1,621,000 | 3,532,000 | 5,473,000 | |||||||||||||||
| Cash | 983 | - | 648 | 297 | |||||||||||||||
| Cash at broker | - | 10,500 | - | - | |||||||||||||||
| Receivable for: | - | ||||||||||||||||||
| Investments sold | 238,724 | - | 980,951 | 1,457,053 | |||||||||||||||
| Fund shares sold | - | - | 62,000 | 173,363 | |||||||||||||||
| Interest | 453,778 | 469,846 | 654,574 | 3,498,884 | |||||||||||||||
| Foreign tax reclaim | - | - | 822 | - | |||||||||||||||
| Futures variation margin | 703 | 1,406 | - | - | |||||||||||||||
| Expense reimbursement due from Investment Advisor | 6,545 | 4,938 | 6,853 | 6,569 | |||||||||||||||
| Deferred Trustees' compensation plan | 2,746 | 3,880 | 1,883 | 6,039 | |||||||||||||||
| Other assets | 1,253 | - | 1,377 | 3,782 | |||||||||||||||
| Total Assets | 49,140,871 | 69,316,821 | 85,479,173 | 198,073,228 | |||||||||||||||
| LIABILITIES: | |||||||||||||||||||
| Payable for: | |||||||||||||||||||
| Payable to custodian bank | - | 9,670 | - | - | |||||||||||||||
| Investments purchased | 338,490 | - | 1,299,308 | 864,875 | |||||||||||||||
| Fund shares repurchased | - | 163,414 | - | 114,417 | |||||||||||||||
| Distributions | 163,394 | 117,646 | 194,771 | 303,025 | |||||||||||||||
| Investment advisory fee | 11,751 | 17,253 | 17,290 | 69,054 | |||||||||||||||
| Audit fee | 15,304 | 15,457 | 16,111 | 18,347 | |||||||||||||||
| Trustee legal council fees | 492 | 580 | 500 | 275 | |||||||||||||||
| Deferred Trustees' fees | 2,746 | 3,880 | 1,883 | 6,039 | |||||||||||||||
| Other liabilities | - | 1,845 | - | - | |||||||||||||||
| Total liabilities | 532,177 | 329,745 | 1,529,863 | 1,376,032 | |||||||||||||||
| NET ASSETS | $ | 48,608,694 | $ | 68,987,076 | $ | 83,949,310 | $ | 196,697,196 | |||||||||||
| NET ASSETS consist of: | |||||||||||||||||||
| Paid-in capital | $ | 50,249,507 | $ | 73,992,790 | $ | 85,922,629 | $ | 244,403,910 | |||||||||||
| Overdistributed net investment income | (248,250 | ) | (548,262 | ) | (814,815 | ) | (1,830,586 | ) | |||||||||||
| Accumulated net realized gain (loss) | (929,062 | ) | (3,762,847 | ) | (652,280 | ) | (45,107,574 | ) | |||||||||||
| Net unrealized appreciation (depreciation) on: | |||||||||||||||||||
| Investments | (469,126 | ) | (705,855 | ) | (506,224 | ) | (768,554 | ) | |||||||||||
| Futures contracts | 5,625 | 11,250 | - | - | |||||||||||||||
| NET ASSETS | $ | 48,608,694 | $ | 68,987,076 | $ | 83,949,310 | $ | 196,697,196 | |||||||||||
| Shares of capital stock outstanding | 4,744,027 | 5,898,800 | 8,712,078 | 24,751,508 | |||||||||||||||
| Net asset value, offering and redemption price per share | $ | 10.25 | $ | 11.70 | $ | 9.64 | $ | 7.95 | |||||||||||
See Accompanying Notes to Financial Statements.
59
STATEMENTS OF OPERATIONS
For the Six Months Ended January 31, 2006 (Unaudited)
| CMG Core Bond Fund | CMG Short Term Bond Fund | CMG Ultra Short Term Bond Fund | CMG High Yield Fund | ||||||||||||||||
| NET INVESTMENT INCOME: | |||||||||||||||||||
| Income: | |||||||||||||||||||
| Interest | $ | 1,597,867 | $ | 1,672,467 | $ | 1,592,347 | $ | 7,832,178 | |||||||||||
| Interest from affiliates | - | - | 2,104 | - | |||||||||||||||
| Total investment income | 1,597,867 | 1,672,467 | 1,594,451 | 7,832,178 | |||||||||||||||
| Expenses: | |||||||||||||||||||
| Investment advisory fee | 84,791 | 98,313 | 105,121 | 474,794 | |||||||||||||||
| Trustees' fees | 5,314 | 5,065 | 5,240 | 8,132 | |||||||||||||||
| Audit fee | 16,796 | 17,024 | 16,111 | 18,864 | |||||||||||||||
| Trustee legal counsel fees | 1,929 | 2,283 | 2,270 | 7,060 | |||||||||||||||
| Non-recurring costs (See Note 8) | 519 | 591 | 642 | 1,800 | |||||||||||||||
| Total expenses | 109,349 | 123,276 | 129,384 | 510,650 | |||||||||||||||
| Fees and expenses waived or reimbursed by Investment Advisor | (24,039 | ) | (24,372 | ) | (23,621 | ) | (34,056 | ) | |||||||||||
| Non-recurring costs assumed by Investment Advisor (See Note 8) | (519 | ) | (591 | ) | (642 | ) | (1,800 | ) | |||||||||||
| Net expenses | 84,791 | 98,313 | 105,121 | 474,794 | |||||||||||||||
| Net investment income | 1,513,076 | 1,574,154 | 1,489,330 | 7,357,384 | |||||||||||||||
| NET REALIZED AND UNREALIZED GAIN (LOSS) ON INVESTMENTS AND FUTURES CONTRACTS: | |||||||||||||||||||
| Net realized gain (loss) on: | |||||||||||||||||||
| Investments | (927,229 | ) | (292,430 | ) | (107,090 | ) | 306,912 | ||||||||||||
| Foreign currency transactions | - | (3,646 | ) | - | - | ||||||||||||||
| Futures contracts | 68,186 | 74,749 | - | - | |||||||||||||||
| Net realized gain (loss) | (859,043 | ) | (221,327 | ) | (107,090 | ) | 306,912 | ||||||||||||
| Net change in unrealized appreciation (depreciation) on: | |||||||||||||||||||
| Investments | (188,476 | ) | (169,378 | ) | 28,314 | (4,489,627 | ) | ||||||||||||
| Futures contracts | (44,063 | ) | (38,437 | ) | - | - | |||||||||||||
| Net change in unrealized appreciation (depreciation) | (232,539 | ) | (207,815 | ) | 28,314 | (4,489,627 | ) | ||||||||||||
| Net gain (loss) | (1,091,582 | ) | (429,142 | ) | (78,776 | ) | (4,182,715 | ) | |||||||||||
| NET INCREASE IN NET ASSETS FROM OPERATIONS | $ | 421,494 | $ | 1,145,012 | $ | 1,410,554 | $ | 3,174,669 | |||||||||||
See Accompanying Notes to Financial Statements.
60
STATEMENTS OF CHANGES IN NET ASSETS
| CMG Core Bond Fund | CMG Short Term Bond Fund | ||||||||||||||||||
| (Unaudited) Six Months Ended January 31, 2006 | Year Ended July 31, 2005 | (Unaudited) Six Months Ended January 31, 2006 | Year Ended July 31, 2005 | ||||||||||||||||
| Operations: | |||||||||||||||||||
| Net investment income | $ | 1,513,076 | $ | 2,383,988 | $ | 1,574,154 | $ | 3,601,627 | |||||||||||
| Net realized gain (loss) on investments, foreign currency transactions and futures contracts | (859,043 | ) | 176,270 | (221,327 | ) | (176,900 | ) | ||||||||||||
| Net change in unrealized appreciation (depreciation) on investments, foreign currency transactions and futures contracts | (232,539 | ) | (216,570 | ) | (207,815 | ) | (877,571 | ) | |||||||||||
| Net increase from operations | 421,494 | 2,343,688 | 1,145,012 | 2,547,156 | |||||||||||||||
| Distributions declared to shareholders: | |||||||||||||||||||
| From net investment income | (1,631,717 | ) | (2,560,924 | ) | (1,719,845 | ) | (4,015,551 | ) | |||||||||||
| From net realized gains | (21,839 | ) | - | - | - | ||||||||||||||
| Total distributions declared to shareholders | (1,653,556 | ) | (2,560,924 | ) | (1,719,845 | ) | (4,015,551 | ) | |||||||||||
| Share transactions: | |||||||||||||||||||
| Subscriptions | 1,593,316 | 58,926,891 | 11,247,614 | 26,264,611 | |||||||||||||||
| Distributions reinvested | 308,187 | 329,461 | 975,876 | 2,577,783 | |||||||||||||||
| Redemptions | (31,163,211 | ) | (12,746,687 | ) | (38,503,625 | ) | (50,657,075 | ) | |||||||||||
| Net increase (decrease) in share transactions | (29,261,708 | ) | 46,509,665 | (26,280,135 | ) | (21,814,681 | ) | ||||||||||||
| Net increase (decrease) in net assets | (30,493,770 | ) | 46,292,429 | (26,854,968 | ) | (23,283,076 | ) | ||||||||||||
| NET ASSETS: | |||||||||||||||||||
| Beginning of period | 79,102,464 | 32,810,035 | 95,842,044 | 119,125,120 | |||||||||||||||
| End of period | $ | 48,608,694 | $ | 79,102,464 | $ | 68,987,076 | $ | 95,842,044 | |||||||||||
| Overdistributed net investment income | $ | (248,250 | ) | $ | (129,609 | ) | $ | (548,262 | ) | $ | (402,571 | ) | |||||||
| Changes in shares: | |||||||||||||||||||
| Subscriptions | 154,080 | 5,606,416 | 957,850 | 2,196,838 | |||||||||||||||
| Issued for distributions reinvested | 29,852 | 31,434 | 83,102 | 216,646 | |||||||||||||||
| Redemptions | (3,031,432 | ) | (1,214,434 | ) | (3,274,537 | ) | (4,251,192 | ) | |||||||||||
| Net increase (decrease) | (2,847,500 | ) | 4,423,416 | (2,233,585 | ) | (1,837,708 | ) | ||||||||||||
See Accompanying Notes to Financial Statements.
61
STATEMENTS OF CHANGES IN NET ASSETS
| CMG Ultra Short Term Bond Fund | CMG High Yield Fund | ||||||||||||||||||
| (Unaudited) Six Months Ended January 31, 2006 | Year Ended July 31, 2005 | (Unaudited) Six Months Ended January 31, 2006 | Year Ended July 31, 2005 | ||||||||||||||||
| Operations: | |||||||||||||||||||
| Net investment income | $ | 1,489,330 | $ | 1,798,336 | $ | 7,357,384 | $ | 21,282,171 | |||||||||||
| Net realized gain (loss) on investments | (107,090 | ) | (23,356 | ) | 306,912 | 8,588,241 | |||||||||||||
| Net change in unrealized appreciation (depreciation) on investments | 28,314 | (366,837 | ) | (4,489,627 | ) | (3,213,339 | ) | ||||||||||||
| Net increase from operations | 1,410,554 | 1,408,143 | 3,174,669 | 26,657,073 | |||||||||||||||
| Distributions declared to shareholders: | |||||||||||||||||||
| From net investment income | (1,707,445 | ) | (2,717,420 | ) | (7,841,505 | ) | (22,727,424 | ) | |||||||||||
| Return of capital | - | (206,594 | ) | - | - | ||||||||||||||
| Total distributions declared to shareholders | (1,707,445 | ) | (2,924,014 | ) | (7,841,505 | ) | (22,727,424 | ) | |||||||||||
| Share transactions: | |||||||||||||||||||
| Subscriptions | 15,473,913 | 36,802,190 | 6,208,509 | 32,168,726 | |||||||||||||||
| Distributions reinvested | 688,106 | 1,256,886 | 5,786,557 | 17,597,737 | |||||||||||||||
| Redemptions | (13,491,021 | ) | (22,203,245 | ) | (79,873,645 | ) | (166,610,851 | ) | |||||||||||
| Net increase (decrease) in share transactions | 2,670,998 | 15,855,831 | (67,878,579 | ) | (116,844,388 | ) | |||||||||||||
| Net increase (decrease) in net assets | 2,374,107 | 14,339,960 | (72,545,415 | ) | (112,914,739 | ) | |||||||||||||
| NET ASSETS: | |||||||||||||||||||
| Beginning of period | 81,575,203 | 67,235,243 | 269,242,611 | 382,157,350 | |||||||||||||||
| End of period | $ | 83,949,310 | $ | 81,575,203 | $ | 196,697,196 | $ | 269,242,611 | |||||||||||
| Overdistributed net investment income | $ | (814,815 | ) | $ | (596,700 | ) | $ | (1,830,586 | ) | $ | (1,346,465 | ) | |||||||
| Changes in shares: | |||||||||||||||||||
| Subscriptions | 1,603,668 | 3,774,819 | 781,012 | 3,950,673 | |||||||||||||||
| Issued for distributions reinvested | 71,290 | 128,653 | 728,266 | 2,166,477 | |||||||||||||||
| Redemptions | (1,397,755 | ) | (2,274,518 | ) | (10,087,609 | ) | (20,573,327 | ) | |||||||||||
| Net increase (decrease) | 277,203 | 1,628,954 | (8,578,331 | ) | (14,456,177 | ) | |||||||||||||
See Accompanying Notes to Financial Statements.
62
NOTES TO FINANCIAL STATEMENTS
January 31, 2006 (Unaudited)
Note 1. Organization
CMG Fund Trust (the "Trust") is an Oregon business trust registered under the Investment Company Act of 1940, as amended, as an open-end management investment company. Information presented in these financial statements pertains to the following diversified funds (individually referred to as a "Fund", collectively referred to as the "Funds"):
CMG Core Bond Fund
CMG Short Term Bond Fund
CMG Ultra Short Term Bond Fund
CMG High Yield Fund
Investment goals. The CMG Core Bond Fund seeks a high level of current income consistent with capital preservation. The CMG Short Term Bond Fund seeks a high level of current income consistent with a high degree of stability of principal. The CMG Ultra Short Term Bond Fund seeks a high level of current income consistent with the maintenance of liquidity and the preservation of capital. The CMG High Yield Fund seeks a high level of current income. Capital appreciation is a secondary objective when consistent with a high level of current income.
Fund shares. Each Fund may issue an unlimited number of shares of no par value capital stock, which are offered continuously at net asset value.
Note 2. Significant accounting policies
Use of estimates. The preparation of financial statements in conformity with accounting principles generally accepted in the United States of America ("GAAP") requires management to make estimates and assumptions that affect the reported amounts of assets and liabilities, the disclosure of contingent assets and liabilities at the date of the financial statements and the reported amounts of revenue and expenses during the reporting period. Actual results could differ from those estimates. The following is a summary of significant accounting policies consistently followed by the Funds in the preparation of their financial statements.
Security valuation. Debt securities generally are valued by pricing services approved by the Trust's Board of Trustees, based upon market transactions for normal, institutional-size trading units of similar securities. The services may use various pricing techniques which take into account appropriate factors such as yield, quality, coupon rate, maturity, type of issue, trading characteristics and other data, as well as broker quotes. Debt securities for which quotations are readily available are valued at an over-the-counter or exchange bid quotation. Certain debt securities, which tend to be more thinly traded and of lesser quality, are priced based on fundamental analysis of the financial condition of the issuer and the estimated value of any collateral. Valuations developed through pricing techniques may vary from the actual amounts realized upon sale of the securities, and the potential variation may be greater for those securities valued using fundamental analysis.
Short-term debt obligations maturing within 60 days are valued at amortized cost, which approximates market value.
Futures contracts are valued at the settlement price established each day by the board of trade or exchange on which they are traded.
63
NOTES TO FINANCIAL STATEMENTS (continued)
January 31, 2006 (Unaudited)
Investments for which market quotations are not readily available, or that have quotations which management believes are not appropriate, are valued at fair value as determined in good faith under consistently applied procedures established by and under the general supervision of the Board of Trustees. If a security is valued at a "fair value", such value is likely to be different from the last quoted market price for the security.
Security transactions. Security transactions are accounted for on the trade date. Cost is determined and gains (losses) are based upon the specific identification method for both financial statement and federal income tax purposes.
Futures contracts. Each Fund may invest in municipal and U.S. Treasury futures contracts. The Funds will invest in these instruments to hedge against the effects of changes in the value of portfolio securities due to anticipated changes in interest rates and/or market conditions, for duration management, or when the transactions are economically appropriate to the reduction of risk inherent in the management of the Funds and not for trading purposes. The use of futures contracts involves certain risks, which include: (1) imperfect correlation between the price movement of the instruments and the underlying securities, (2) inability to close out positions due to differing trading hours, or the temporary absence of a liquid market, for either the instrument or the underlying securities, or (3) an inaccurate prediction by Columbia Management Advisors, Inc. of t he future direction of interest rates. Any of these risks may involve amounts exceeding the variation margin recorded in the Funds' Statement of Assets and Liabilities at any given time.
Upon entering into a futures contract, each Fund deposits cash or securities with the broker in an amount sufficient to meet the initial margin requirement. Subsequent payments are made or received by the Funds equal to the daily change in the contract value and are recorded as variation margin receivable or payable and offset in unrealized gains or losses. Each Fund also identifies portfolio securities as segregated with the custodian in a separate account in an amount equal to the futures contract. The Funds recognize a realized gain or loss when the contract is closed or expires.
Repurchase agreements. Each Fund may engage in repurchase agreement transactions with institutions that the Funds' investment advisor has determined are creditworthy. Each Fund, through its custodian, receives delivery of underlying securities collateralizing a repurchase agreement. Collateral is at least equal, at all times, to the value of the repurchase obligation including interest. A repurchase agreement transaction involves certain risks in the event of default or insolvency of the counterparty. These risks include possible delays or restrictions upon each Fund's ability to dispose of the underlying securities and a possible decline in the value of the underlying securities during the period while the Funds seek to assert their rights.
Delayed delivery securities. The Funds may trade securities on other than normal settlement terms, including securities purchased or sold on a "when-issued" basis. This may increase the risk if the other party to the transaction fails to deliver and causes the Funds to subsequently invest at less advantageous prices. The Funds identify cash or liquid portfolio securities as segregated with the custodian in an amount equal to the delayed delivery commitment.
Treasury Inflation Indexed Securities. The Fund may invest in Treasury Inflation-Indexed Securities ("TIPS"). The principal amount of TIPS is adjusted periodically for inflation based on a monthly published index. Interest payments are based on the inflation-adjusted principal at the time the interest is paid.
Interest Only Securities. The Fund may invest in Interest Only Securities ("IO"). Interest Only securities are stripped mortgage backed securities entitled to receive all of the security's interest, but none of its principal. Interest is accrued daily. The daily accrual factor is adjusted each month to reflect the pay down of principal.
Income recognition. Interest income is recorded on the accrual basis and includes accretion of discounts, amortization of premiums and paydown gains and losses, net of any non-reclaimable tax witholdings of foreign securities.
64
NOTES TO FINANCIAL STATEMENTS (continued)
January 31, 2006 (Unaudited)
Federal income tax status. Each Fund intends to qualify each year as a "regulated investment company" under Subchapter M of the Internal Revenue Code, as amended, and will distribute substantially all of its taxable income, if any, for its tax year, and as such will not be subject to federal income taxes. In addition, each Fund intends to distribute in each calendar year substantially all of its net investment income, capital gains and certain other amounts, if any, such that each Fund should not be subject to federal excise tax. Therefore, no federal income or excise tax provision is recorded.
Distributions to shareholders. Dividends from net investment income, if any, are generally declared daily and paid monthly. Net realized capital gains, if any, are distributed at least annually.
Note 3. Federal tax information
The tax character of distributions paid during the years ended July 31, 2005 and July 31, 2004 was as follows:
| July 31, 2005 | |||||||||||||||
| Ordinary Income* | Long-term Capital Gains | Tax Return of Capital | |||||||||||||
| CMG Core Bond Fund | $ | 2,560,924 | $ | - | $ | - | |||||||||
| CMG Short Term Bond Fund | 4,015,551 | - | - | ||||||||||||
| CMG Ultra Short Term Bond Fund | 2,717,420 | - | 206,594 | ||||||||||||
| CMG High Yield Fund | 22,727,424 | - | - | ||||||||||||
| July 31, 2004 | |||||||||||||||
| Ordinary Income* | Long-term Capital Gains | Tax Return of Capital | |||||||||||||
| CMG Core Bond Fund | $ | 1,801,868 | $ | 241,107 | $ | - | |||||||||
| CMG Short Term Bond Fund | 3,965,886 | - | - | ||||||||||||
| CMG Ultra Short Term Bond Fund | 387,092 | - | - | ||||||||||||
| CMG High Yield Fund | 30,204,485 | - | - | ||||||||||||
*For tax purposes short-term capital gains distributions, if any, are considered ordinary income distributions.
Unrealized appreciation and depreciation, at January 31, 2006, based on cost of investments for federal income tax purposes, was:
| Unrealized Appreciation | Unrealized Depreciation | Net Unrealized Appreciation (Depreciation) | |||||||||||||
| CMG Core Bond Fund | $ | 200,091 | $ | (757,319 | ) | $ | (557,228 | ) | |||||||
| CMG Short Term Bond Fund | 111,356 | (1,175,606 | ) | (1,064,250 | ) | ||||||||||
| CMG Ultra Short Term Bond Fund | 35,954 | (806,866 | ) | (770,912 | ) | ||||||||||
| CMG High Yield Fund | 1,857,569 | (3,745,828 | ) | (1,888,259 | ) | ||||||||||
65
NOTES TO FINANCIAL STATEMENTS (continued)
January 31, 2006 (Unaudited)
The following capital loss carryforwards, determined as of July 31, 2005, may be available to reduce taxable income arising from future net realized gains on investments, if any, to the extent permitted by the Internal Revenue Code:
| 2008 | 2009 | 2010 | 2012 | 2013 | Total | ||||||||||||||||||||||
| CMG Short Term Bond Fund | $ | 537,548 | $ | - | $ | 2,365,257 | $ | 19,156 | $ | 25,391 | $ | 2,947,352 | |||||||||||||||
| CMG Ultra Short Term Bond Fund | - | - | - | 29,640 | 47,961 | 77,601 | |||||||||||||||||||||
| CMG High Yield Fund | - | 20,199,377 | 25,194,365 | - | 45,393,742 | ||||||||||||||||||||||
Capital loss carryforwards of $6,361,581, for CMG High Yield Fund, were utilized during the year ended July 31, 2005. Any capital loss carryforwards acquired as part of a merger that are permanently lost due to provisions under Internal Revenue Code are included as being expired. Expired capital loss carryforwards are recorded as a reduction of paid-in capital.
Utilization of these losses could be subject to limitations imposed by the Internal Revenue Code.
Under current tax rules, certain capital losses realized after October 31 may be deferred and treated as occurring on the first day of the following fiscal year. As of July 31, 2005, post-October capital losses of $532,109 and 467,588 attributed to security transactions were deferred to August 1, 2005 for the CMG Short Term Bond Fund and CMG Ultra Short Term Bond Fund, respectively.
Note 4. Fees and compensation paid to affiliates
Investment advisory fee. Columbia Management Advisors, LLC ("Columbia"), an indirect, wholly-owned subsidiary of Bank of America Corporation ("BOA"), is the investment advisor to the Funds. Prior to September 30, 2005, Columbia Management Advisors, Inc. was investment advisor to the Funds under the same fee structure. On September 30, 2005, Columbia Management Advisors, Inc. merged into Banc of America Capital Management, LLC. At that time, the investment advisor was then renamed Columbia Management Advisors, LLC.
Each Fund's investment advisory fee is a unified fee. Columbia, out of the unified fee it receives from the Funds, pays all accounting fees, legal fees, pricing & bookkeeping fees, transfer agent fees, custody fees, expenses of the Chief Compliance Officer, fees for Sarbanes-Oxley compliance, the commitment fee for the line of credit and miscellaneous expenses of the Funds. The unified fee does not include brokerage fees, taxes, Trustees' fees, Trustee legal counsel fees, audit fees, interest expense associated with any borrowings by the Funds or extraordinary expenses, if any. The unified fees are paid monthly to Columbia based on each Fund's average daily net assets at the following annual rates:
CMG Core Bond Fund 0.25%
CMG Short Term Bond Fund 0.25%
CMG Ultra Short Term Bond Fund 0.25%
CMG High Yield Fund 0.40%
Pricing & bookkeeping fees. Columbia is responsible for providing pricing and bookkeeping services to each Fund under a pricing, bookkeeping and fund administration agreement. Under a separate agreement (the "Outsourcing Agreement"), Columbia has delegated certain of those functions to State Street Bank and Trust Company ("State Street"). As a result, Columbia pays fees to State Street under the Outsourcing Agreement. The pricing and bookkeeping fees for the Funds are paid by Columbia.
Transfer agent fee. Columbia Management Services, Inc. (formerly Columbia Funds Services, Inc.) (the "Transfer Agent"), an affiliate of Columbia and an indirect, wholly-owned subsidiary of BOA, provides shareholder services to the Fund and has contracted with Boston Financial Data Services ("BFDS") to serve as sub-transfer agent. The transfer
66
NOTES TO FINANCIAL STATEMENTS (continued)
January 31, 2006 (Unaudited)
agent fees for the Funds are paid by Columbia. The Transfer Agent may also retain, as additional compensation for its services, fees for wire, telephone and redemption orders, IRA trustee agent fees and account transcript fees due the Transfer Agent from shareholders of the Funds and credits (net of bank charges) earned with respect to balances in accounts the Transfer Agent maintains in connection with its services to the Funds.
Fee waivers. Columbia has contractually agreed to reimburse the Funds through March 1, 2009 for certain expenses so that the expenses incurred by the Funds, including the investment advisory fees, will not exceed the following annual rates based on each Fund's average daily net assets:
| CMG Core Bond Fund | 0.25 | % | |||||
| CMG Short Term Bond Fund | 0.25 | % | |||||
| CMG Ultra Short Term Bond Fund | 0.25 | % | |||||
| CMG High Yield Fund | 0.40 | % | |||||
Fees paid to officers and trustees. All officers of the Funds, with the exception of the Fund's Chief Compliance Officer, are employees of Columbia, or its affiliates and receive no compensation from the Funds. The Board of Trustees has appointed a Chief Compliance Officer to the Funds in accordance with federal securities regulations. The expenses of the Chief Compliance Officer are paid by Columbia.
The Funds' Trustees may participate in a deferred compensation plan which may be terminated at any time. Obligations of the plan will be paid solely out of the Funds' assets.
Other. Columbia provides certain services to the Funds related to Sarbanes-Oxley compliance. The fees for such services are paid by Columbia.
Note 5. Portfolio information
For the six months ended January 31, 2006, the cost of purchases and proceeds from sales of securities, excluding short-term obligations, were as follows:
| U.S. Government Securities | Other Investment Securities | ||||||||||||||||||
| Purchases | Sales | Purchases | Sales | ||||||||||||||||
| CMG Core Bond Fund | $ | 42,952,009 | $ | 59,256,377 | $ | 6,899,114 | $ | 15,302,117 | |||||||||||
| CMG Short Term Bond Fund | 33,389,841 | 36,189,945 | 13,446,013 | 37,069,606 | |||||||||||||||
| CMG Ultra Short Term Bond Fund | 12,313,019 | 9,092,124 | 12,816,961 | 13,104,865 | |||||||||||||||
| CMG High Yield Fund | - | - | 38,464,306 | 90,672,865 | |||||||||||||||
Note 6. Line of credit
The Funds and other affiliated funds participate in a $350,000,000 committed unsecured revolving line of credit provided by State Street Bank and Trust Company. Borrowings are used for temporary or emergency purposes to facilitate portfolio liquidity. Interest is charged to each participating fund based on its borrowings at a rate per annum equal to the Federal Funds rate plus 0.50%. In addition, a commitment fee of 0.10% per annum is accrued and apportioned among the participating funds based on their pro-rata portion of the unutilized line of credit.
For the six months ended January 31, 2006, the Funds did not borrow under this arrangement.
67
NOTES TO FINANCIAL STATEMENTS (continued)
January 31, 2006 (Unaudited)
Note 7. Shares of Beneficial Interest
As of January 31, 2006, the Funds had shareholders whose shares were beneficially owned by participant accounts over which Bank of America and/or its affiliates had either sole or joint investment discretion. Subscription and redemption activity of these accounts may have a significant effect on the operations of the Funds. The numbers of accounts and the percentages of shares of beneficial interest outstanding held therein are as follows:
| Number of Shareholders | % of Shares Outstanding Held | ||||||||||
| CMG Core Bond Fund | 1 | 99.9 | % | ||||||||
| CMG Short Term Bond Fund | 1 | 85.9 | % | ||||||||
| CMG Ultra Short Term Bond Fund | 1 | 99.8 | % | ||||||||
| CMG High Yield Fund | 1 | 36.3 | % | ||||||||
As of January 31, 2006, two of the Funds had shareholders that held greater than 5% of the shares outstanding and Bank of America and/or its affiliates did not have investment discretion. Subscription and redemption activity of these shareholders may have a material effect on the Funds. The numbers of accounts and the percentages of shares of beneficial interest outstanding held therein are as follows:
| Number of Shareholders | % of Shares Outstanding Held | ||||||||||
| CMG Short Term Bond Fund | 1 | 6.4 | % | ||||||||
| CMG High Yield Fund | 4 | 43.1 | % | ||||||||
Note 8. Disclosure of significant risks and contingencies
High-yield securities. Investing in high-yield securities may involve greater credit risk and considerations not typically associated with investing in U.S. government bonds and other higher quality fixed income securities. These securities are non-investment grade securities, often referred to as "junk bonds." Economic downturns may disrupt the high yield market and impair the ability of issuers to repay principal and interest. Also, an increase in interest rates would likely have an adverse impact on the value of such obligations. Moreover, high-yield securities may be less liquid to the extent that there is no established secondary market.
Industry focus. The Funds may focus their investments in certain industries, subjecting them to greater risk than a fund that is more diversified.
Legal proceedings. On February 9, 2005, Columbia Management Advisors, Inc. (which has since merged into Banc of America Capital Management, LLC (now named Columbia Management Advisors, LLC)) ("Columbia") and Columbia Funds Distributor, Inc. (which has been renamed Columbia Management Distributors, Inc.) (the "Distributor") (collectively, the "Columbia Group") entered into an Assurance of Discontinuance with the New York Attorney General ("NYAG") (the "NYAG Settlement") and consented to the entry of a cease-and-desist order by the Securities and Exchange Commission ("SEC") (the "SEC Order"). The SEC Order and the NYAG Settlement are referred to collectively as the "Settlements". The Settlements contain substantially the same terms and conditions as outlined in the agreements in principle which Columbia Group entered into with the SEC and NYAG in March 2004.
68
NOTES TO FINANCIAL STATEMENTS (continued)
January 31, 2006 (Unaudited)
Under the terms of the SEC Order, the Columbia Group has agreed among other things, to: pay $70 million in disgorgement and $70 million in civil money penalties; cease and desist from violations of the antifraud provisions and certain other provisions of the federal securities laws; maintain certain compliance and ethics oversight structures; retain an independent consultant to review the Columbia Group's applicable supervisory, compliance, control and other policies and procedures; and retain an independent distribution consultant (see below). The Columbia Funds have also voluntarily undertaken to implement certain governance measures designed to maintain the independence of their boards of trustees. The NYAG Settlement also, among other things, requires Columbia and its affiliates to reduce certain Columbia Funds (including the former Nations Funds) and other mutual funds management fees collectively by $32 million per year fo r five years, for a projected total of $160 million in management fee reductions.
Pursuant to the procedures set forth in the SEC order, the $140 million in settlement amounts described above will be distributed in accordance with a distribution plan developed by an independent distribution consultant and agreed to by the staff of the SEC. The independent distribution consultant has been in consultation with the Staff, and has submitted a draft proposed plan of distribution, but has not yet submitted a final proposed plan of distribution.
As a result of these matters or any adverse publicity or other developments resulting from them, there may be increased redemptions or reduced sales of fund shares, which could increase transaction costs or operating expenses, or have other adverse consequences for the funds.
A copy of the SEC Order is available on the SEC website at http://www.sec.gov. A copy of the NYAG Settlement is available as part of the Bank of America Corporation Form 8-K filing on February 10, 2005.
In connection with the events described in detail above, various parties have filed suit against certain funds, the Trustees of the Columbia Funds, FleetBoston Financial Corporation and its affiliated entities and/or Bank of America and its affiliated entities.
On February 20, 2004, the Judicial Panel on Multidistrict Litigation transferred these cases and cases against several other mutual fund companies based on similar allegations to the United States District Court in Maryland for consolidated or coordinated pretrial proceedings (the "MDL"). Subsequently, additional related cases were transferred to the MDL. On September 29, 2004, the plaintiffs in the MDL filed amended and consolidated complaints. One of these amended complaints is a putative class action that includes claims under the federal securities laws and state common law, and that names Columbia, the Distributor, the Trustees of the Columbia Funds, Bank of America Corporation and others as defendants. Another of the amended complaints is a derivative action purportedly on behalf of the Columbia Funds that asserts claims under federal securities laws and state common law.
On February 25, 2005, Columbia and other defendants filed motions to dismiss the claims in the pending cases. On March 1, 2006, for reasons stated in the court's memoranda dated November 3, 2005, the U.S. District Court for the District of Maryland granted in part and denied in part the defendants' motions to dismiss. The court dismissed all of the class action claims pending against the Columbia Funds. As to Columbia, the Distributor and the Trustees of the Columbia Funds, the claims under the Securities Act of 1933, the claims under Sections 34(b) and 36(a) of the Investment Company Act of 1940 (ICA) and the state law claims were dismissed. The claims under Sections 10(b) and 20(a) of the Securities Exchange Act of 1934 and claims under Section 36(b) of the ICA along with related claims under Section 48(a) of the ICA were not dismissed.
69
NOTES TO FINANCIAL STATEMENTS (continued)
January 31, 2006 (Unaudited)
On March 21, 2005 purported class action plaintiffs filed suit in Massachusetts state court alleging that the conduct, including market timing, entitles Class B shareholders in certain Columbia funds to an exemption from contingent deferred sales charges upon early redemption ("the CDSC Lawsuit"). The CDSC Lawsuit has been removed to federal court in Massachusetts and the federal Judicial Panel has transferred the CDSC Lawsuit to the MDL.
The MDL is ongoing. Accordingly, an estimate of the financial impact of this litigation on any fund, if any, cannot currently be made.
In 2004, certain Columbia funds, the Trustees of the Columbia Funds, advisers and affiliated entities were named as defendants in certain purported shareholder class and derivative actions making claims, including claims under the Investment Company and the Investment Advisers Acts of 1940 and state law. The suits allege, inter alia, that the fees and expenses paid by the funds are excessive and that the advisers and their affiliates inappropriately used fund assets to distribute the funds and for other improper purpose. On March 2, 2005, the actions were consolidated in the Massachusetts federal court as In re Columbia Entities Litigation. The plaintiffs filed a consolidated amended complaint on June 9, 2005. On November 30, 2005, the judge dismissed all claims by plaintiffs and ordered that the case be closed. The plaintiffs filed a notice of appeal on December 30, 2005 and this appeal is pending.
For the six months ended January 31, 2006, Columbia has assumed legal, consulting services and Trustees' fees incurred by the Fund in connection with these matters as follows:
| CMG Core Bond Fund | $ | 519 | |||||
| CMG Short Term Bond Fund | 591 | ||||||
| CMG Ultra Short Term Bond Fund | 642 | ||||||
| CMG High Yield Fund | 1,800 | ||||||
Note 9. Subsequent events
On March 27, 2006, each Fund will be re-domiciled into a new series of Columbia Funds Institutional Trust. Columbia Funds Institutional Trust is registered under the Investment Company Act of 1940, as amended, as an open-end management investment company.
70
Board Consideration and Approval of Investment Advisory Agreements
The Advisory Fees and Expenses Committee of the Board of Trustees meets one or more times annually, usually in late summer, to review the advisory agreements (collectively, the "Agreements") of the funds for which the Trustees serve as trustees or directors (each a "fund") and determine whether to recommend that the full Board approve the continuation of the Agreements for an additional one-year period. After the Committee has made its recommendation, the full Board, including the Independent Trustees, determines whether to approve the continuation of the Agreements. In addition, the Board, including the Independent Trustees, considers matters bearing on the Agreements at most of its other meetings throughout the year and meets regularly with the heads of each investment area within Columbia. The Trustees also meet with selected fund portfolio managers at various times throughout the year.
The Trustees receive and review all materials that they, their legal counsel or Columbia, the funds' investment adviser, believe to be reasonably necessary for the Trustees to evaluate the Agreements and determine whether to approve the continuation of the Agreements. Those materials generally include, among other items, (i) information on the investment performance of each fund relative to the performance of peer groups of mutual funds and the fund's performance benchmarks, (ii) information on each fund's advisory fees and other expenses, including information comparing the fund's expenses to those of peer groups of mutual funds and information about any applicable expense caps and fee "breakpoints," (iii) sales and redemption data, (iv) information about the profitability of the Agreements to Columbia, and potential "fall-out" or ancillary benefits that Columbia and its affiliates may receive as a result of their relationships with the funds and (v) information obtained through Columbia's response to a questionnaire prepared at the request of the Trustees by counsel to the funds and independent legal counsel to the Independent Trustees. The Trustees also consider other information such as (vi) Columbia's financial results and financial condition, (vii) each fund's investment objective and strategies and the size, education and experience of Columbia's investment staffs and their use of technology, external research and trading cost measurement tools, (viii) the allocation of the funds' brokerage, if any, including allocations to brokers affiliated with Columbia and the use of "soft" commission dollars to pay fund expenses and to pay for research products and services, (ix) Columbia's resources devoted to, and its record of compliance with, the funds' investment policies and restrictions, policies on personal securities transactions and other compliance policies, (x) Columbia's response to various legal and regulatory proceedings since 2003 and (xi) the economic outlook generally and for the mutual fund industry in particular. In addition, the Trustees confer with their independent fee consultant and review materials relating to the Agreements that the independent fee consultant provides. Throughout the process, the Trustees have the opportunity to ask questions of and request additional materials from Columbia and to consult independent legal counsel to the Independent Trustees.
The Board of Trustees most recently approved the continuation of the Agreements at its October, 2005 meeting, following meetings of the Advisory Fees and Expenses Committee held in August, September, and October, 2005. In considering whether to approve the continuation of the Agreements, the Trustees, including the Independent Trustees, did not identify any single factor as determinative, and each weighed various factors as he or she deemed appropriate. The Trustees considered the following matters in connection with their approval of the continuation of the Agreements:
The nature, extent and quality of the services provided to the funds under the Agreements. The Trustees considered the nature, extent and quality of the services provided by Columbia and its affiliates to the funds and the resources dedicated to the funds by Columbia and its affiliates. Among other things, the Trustees considered (i) Columbia's ability, including its resources, compensation programs for personnel involved in fund management, reputation and other attributes, to attract and retain highly qualified research, advisory and supervisory investment professionals; (ii) the portfolio management services provided by those investment professionals; and (iii) the trade execution services provided on behalf of the funds. For each fund, the Trustees also considered the benefits to shareholders of investing in a mutual fund that is part of a family o f funds offering exposure to a variety of asset classes and investment disciplines and providing for a variety of fund and shareholder services. After reviewing those and related factors, the Trustees concluded, within the context of their overall conclusions regarding each of the Agreements, that the nature, extent and quality of services provided supported the continuation of the Agreements.
Investment performance of the funds and Columbia. The Trustees reviewed information about the performance of each fund over various time periods, including information prepared by an independent third party that compared the performance of each fund to the performance of peer groups of mutual funds and performance benchmarks. The Trustees also reviewed a description of the third party's methodology for identifying each fund's peer group for
71
Board Consideration and Approval of Investment Advisory Agreements (continued)
purposes of performance and expense comparisons. The Trustees also considered additional information that the Advisory Fees and Expenses Committee requested from Columbia relating to funds that presented relatively weaker performance and/or relatively higher expenses.
In the case of each fund that had performance that lagged that of a relevant peer group for certain (although not necessarily all) periods, the Trustees concluded that other factors relevant to performance were sufficient, in light of other considerations, to warrant continuation of the fund's Agreements. Those factors varied from fund to fund, but included one or more of the following: (i) that the fund's performance, although lagging in certain recent periods, was stronger over the longer term; (ii) that the underperformance was attributable, to a significant extent, to investment decisions that were reasonable and consistent with the fund's investment strategy and policies and that the fund was performing as expected, given market conditions and the fund's investment strategy; (iii) that the fund's performance was competitive when compared to other relevant performance benchmarks or peer groups; (iv) that Columbia had taken o r was taking steps designed to help improve the fund's investment performance, including, but not limited to, replacing portfolio managers or modifying investment strategies; (v) that the fund's advisory fee had recently been, or was proposed to be, reduced, with the goal of helping the fund's net return to shareholders become more competitive; and (vi) that other fund expenses, such as transfer agency or fund accounting fees, have recently been reduced, with the goal of helping the fund's net return to shareholders become more competitive.
The Trustees also considered Columbia's performance and reputation generally, the funds' performance as a fund family generally, and Columbia's historical responsiveness to Trustee concerns about performance and Columbia's willingness to take steps intended to improve performance.
After reviewing those and related factors, the Trustees concluded, within the context of their overall conclusions regarding each of the Agreements, that the performance of each fund and Columbia was sufficient, in light of other considerations, to warrant the continuation of the Agreements.
The costs of the services provided and profits realized by Columbia and its affiliates from their relationships with the funds. The Trustees considered the fees charged to the funds for advisory services as well as the total expense levels of the funds. That information included comparisons (provided both by management and by an independent third party) of the funds' advisory fees and total expense levels to those of their peer groups and information about the advisory fees charged by Columbia to comparable accounts. In considering the fees charged to comparable accounts, the Trustees took into account, among other things, management's representations about the differences between managing mutual funds as compared to other types of accounts, including the additional resources required to effectively manage mutual funds and distribute mutual fund share s. In evaluating each fund's advisory fees, the Trustees also took into account the demands, complexity and quality of the investment management of the fund. The Trustees considered reductions in advisory fee rates, implementation of advisory fee breakpoints, institution of advisory fee waivers, and changes to expense caps, which benefited a number of the funds. Furthermore, the Trustees considered the projected impact on expenses resulting from the overall cost reductions that management anticipated would result from the shift to a common group of service providers for transfer agency, fund accounting and custody services for mutual funds advised by Bank of America affiliates. The Trustees also noted management's stated justification for the fees charged to the funds, which included information about the performance of the funds, the services provided to the funds and management's view as to why it was appropriate that some funds bear advisory fees or total expenses greater than their peer group medians.
The Trustees also considered the compensation directly or indirectly received by Columbia and its affiliates from their relationships with the funds. The Trustees reviewed information provided by management as to the profitability to Columbia and its affiliates of their relationships with the funds, and information about the allocation of expenses used to calculate profitability. When reviewing profitability, the Trustees also considered court cases in which adviser profitability was an issue in whole or in part, the performance of the relevant funds, the expense levels of the funds, and whether Columbia had implemented breakpoints and/or expense caps with respect to the funds.
After reviewing those and related factors, the Trustees concluded, within the context of their overall conclusions regarding each of the Agreements, that the advisory fees charged to each of the funds were fair and reasonable, and that the costs of the advisory services generally, and the related profitability to Columbia and its affiliates of their relationships with the funds, supported the continuation of the Agreements.
72
Board Consideration and Approval of Investment Advisory Agreements (continued)
Economies of Scale. The Trustees considered the existence of any economies of scale in the provision of services by Columbia to each fund and whether those economies were shared with the fund through breakpoints in the investment advisory fees or other means, such as expense waivers. The Trustees noted that many of the funds benefited from breakpoints, expense caps, or both. In considering those issues, the Trustees also took note of the costs of the services provided (both on an absolute and a relative basis) and the profitability to Columbia and its affiliates of their relationships with the funds, as discussed above.
After reviewing those and related factors, the Trustees concluded, within the context of their overall conclusions regarding each of the Agreements, that the extent to which economies of scale were shared with the funds supported the continuation of the Agreements.
Other Factors. The Trustees also considered other factors, which included but were not limited to the following:
• the extent to which each fund had operated in accordance with its investment objective and its record of compliance with its investment restrictions, and the compliance programs of the funds and Columbia. They also considered the compliance-related resources that Columbia and its affiliates were providing to the funds.
• the nature, quality, cost and extent of administrative and shareholder services performed by Columbia and its affiliates, both under the Agreements and under separate agreements for the provision of transfer agency and administrative services.
• so-called "fall-out benefits" to Columbia, such as the engagement of its affiliates to provide distribution, brokerage and transfer agency services to the funds, and the benefits of research made available to Columbia by reason of brokerage commissions generated by the funds' securities transactions, as well as possible conflicts of interest associated with those fall-out and other benefits, and the reporting, disclosure and other processes in place to disclose and monitor those possible conflicts of interest.
• the draft report provided by the independent fee consultant, which included information about and analysis of the funds' fees, expenses and performance.
Based on their evaluation of all factors that they deemed to be material, including those factors described above, and assisted by the advice of independent counsel and the independent fee consultant, the Trustees, including the Independent Trustees, approved the continuance of each of the Agreements through October 31, 2006.
73
Summary of Management Fee Evaluation by Independent Fee Consultant
Prepared Pursuant to the February 9, 2005 Assurance of Discontinuance between the Office of
Attorney General of New York State and Columbia Management Advisors, Inc. and
Columbia Funds Distributor, Inc. October 11, 2005
I. Overview
Columbia Management Advisors, Inc. ("CMA") and Columbia Funds Distributors, Inc. ("CFD") (CFD together with CMA referred to herein as Columbia Management Group or "CMG1"), entered into an agreement with the New York Attorney General's Office in the form of an Assurance of Discontinuance (the "AOD"). The AOD stipulated that CMA would be permitted to manage or advise the Columbia Funds only if the Independent Members (as such term is defined in the AOD) of the Columbia Funds' Board of Trustees/Directors (collectively the "Trustees") appointed a Senior Officer or an Independent Fee Consultant ("IFC") who, among other things, is to manage the process by which management fees are negotiated. On May 15, 2005, the Independent Members of the Board appointed me as the IFC for the Columbia Funds. This report is the annual written evaluation of the Columbia Funds for 2005 that I have prepared in my capacity as IFC, as required b y the AOD.
A. Duties of the Independent Fee Consultant
As part of the AOD, the Independent Members of the Columbia Funds' Board of Trustees/Directors agreed to retain an independent fee consultant who was to participate in the management fee negotiation process. The IFC is charged with "... duties and responsibilities [that] include managing the process by which proposed management fees (including, but not limited to, advisory fees) to be charged the Columbia Fund[s] are negotiated so that they are negotiated in a manner which is at arms length and reasonable and consistent with this Assurance of Discontinuance." However, the IFC does not replace the Trustees in their role of negotiating management and other fees with CMG and its affiliates. In particular, the AOD states that "Columbia Advisors may manage or advise a Columbia Fund only if the reasonableness of the proposed management fees is determined by the Board of Trustees of the Columbia Fund using ... an annual independent wri tten evaluation prepared by or under the direction of the ... Independent Fee Consultant...." This report, pursuant to the AOD, constitutes the "annual independent written evaluation prepared by or under the direction of the... Independent Fee Consultant."
The AOD requires the IFC report to consider at least the following:
a) Management fees (including any components thereof) charged by other mutual fund companies for like services;
b) Management fees (including any components thereof) charged to institutional and other clients of CMA for like services;
c) Costs to CMA and its affiliates of supplying services pursuant to the management fee agreements, excluding any intra-corporate profit;
d) Profit margins of CMA and its affiliates from supplying such services;
e) Possible economies of scale as the CMA fund grows larger; and
f) The nature and quality of CMA services, including Columbia Funds' performance.
This report is designed to assist the Board in evaluating the 2005 contract renewal for Columbia Funds. In addition, this report points out areas where the Board may deem additional information and analysis to be appropriate over time.
1 Prior to the date of this report, CMA merged into an affiliated entity, Banc of America Capital Management, LLC ("BACAP"), and BACAP then changed its name to Columbia Management Advisors, LLC which carries on the business of CMA, and CFD changed its name to Columbia Management Distributors, Inc.
74
Summary of Management Fee Evaluation by Independent Fee Consultant (continued)
B. Sources of information used in my evaluation
I have requested data from CMG and various third party industry data sources or independent research companies that work in the mutual fund arena. The following list generally describes the types of information I requested.
1. I collected data on performance, management fees, and expense ratios of both Columbia Funds and comparable non-Columbia Funds. The sources of this information were CMG, Lipper Inc. ("Lipper") and Morningstar Inc. ("Morningstar"). While Lipper and Morningstar each selected a different group of peer funds it deemed appropriate against which to measure the relative performance and fees of Columbia Funds, I conducted an independent review of the appropriateness of each peer group.
2. I reviewed data on CMG's expense and profitability that I obtained from CMA directly.
3. I have reviewed data on the organizational structure of CMG in general.
4. I collected information on profitability from Strategic Insight Mutual Fund Research and Consulting, LLC ("Strategic Insight"). I used this third-party independent research as an additional method to gauge the accuracy of the data collected in (2) above.
5. I conducted interviews with various CMG staff, including members of the senior management team, legal staff, heads of affiliates, portfolio managers, and financial personnel.
6. I reviewed current 2005 Section 15(c) material provided to the Board and material presented to the Board in the 2004 fee and performance evaluation.
7. I have reviewed various academic research papers, industry publications, and other available literature dealing with mutual fund operations, profitability, and other issues. In addition, I have reviewed SEC releases and studies of mutual fund expenses.
8. I have reviewed documents pertaining to recent mutual fund litigation in general and publicly available information about litigation where CMG has been involved.
In addition, I have engaged NERA Economic Consulting ("NERA") and independent consultant Dr. John Rea to assist me in data management and analysis. Both NERA and Dr. Rea have extensive experience in the mutual fund industry through consulting, government positions, or industry trade groups that provide unique insights and special knowledge pertaining to my independent analysis of fees, performance, and profitability. I have also retained Shearman & Sterling LLP as outside counsel to advise me in connection with my review.
C. Qualifications and independence
I am the Walter H. Carpenter Chair and Professor of Finance at Babson College. Before this I was the Chief Economist of the U.S. Securities and Exchange Commission. I have no material relationship with Bank of America or CMG aside from acting as IFC, and am aware of no relationship with any of their affiliates. [Resume omitted]
II. Evaluation of the general process used to negotiate the advisory contract
A. General considerations
My analysis considered all factors and information I reviewed on the finances and operations of Columbia Funds. I gave each factor an appropriate weight in my overall findings, and no single factor was in itself the sole criterion for a finding or conclusion. My objective was to assess all of the information provided and conduct a robust evaluation of Columbia Funds' operations, fees, and performance.
My analysis and thought processes will and, I believe, should, differ in certain ways from the processes used by Trustees in their evaluation of the management agreements. In particular, because of my technical and quantitative background, I may use techniques and data that Trustees have not previously felt would be useful. I view this supplemental analysis as appropriate because my role is to assist Trustees in their decisions, and to the extent that I bring new ideas or analysis to the evaluation, I believe this improves the process by which management fees for the Columbia Funds may be negotiated in accordance with the AOD.
75
Summary of Management Fee Evaluation by Independent Fee Consultant (continued)
Finally, as part of my role as IFC, I have, from time to time, sent to Trustees additional papers and reports produced by third parties that I felt had bearing on the fee negotiation process. I viewed these materials as educational in nature and felt they would aid Trustees in placing their work in context.
B. CMG management interviews
As a starting point of my analysis, I have met with members of CMG staff to gain an understanding of the organizational structure and personnel involved in running the Columbia fund family.
I have had general discussions and have received information about the management structure of CMG. My conversations with management have been informative. In addition, I have participated in Board meetings where Trustees and management have discussed issues relating to management agreements and performance of Columbia Funds. When I felt it was appropriate, I added my opinions on particular matters, such as fund performance or fee levels, to the discussion.
C. Trustees' Fee and Performance Evaluation Process
After making initial requests for information, members of the Trustees of the Columbia Funds met in advance of the October Section 15(c) contract approval meeting to review certain fee, performance and other data for the Columbia Funds and to ask questions and make requests of management. Trustees have developed a process to evaluate the fee and expense levels and performance of Columbia Funds. This process is used to highlight those funds that have been performing poorly, may have had higher management fees or expense ratios, or both.
The process involves providing instructions to Lipper to prepare specific data analyses tailored to the Trustees review framework. These instructions include highlighting funds that hit one or more fee performance "screens." The six screens the Trustees use are as follows:
a. 5th Lipper quintile in actual management fee;
b. 5th Lipper quintile in total expense ratio;
c. Three or more 5th Lipper quintile rankings in the 1-, 3-, 5- or 10-year performance rankings;
d. Sum of the Lipper Quintile Rank (1-year performance) and the Lipper Quintile Rank (actual management fee) totals a number equal to or higher than 8;
e. Sum of the Lipper Quintile Rank (1-year performance) and the Lipper Quintile Rank (total expense ratio) totals a number equal to or higher than 8; and
f. Sum of the Lipper Quintile Rank (3-year performance) and the Lipper Quintile Rank (total expense ratio) totals a number equal to or higher than 8.
If a fund hits one or more of these screens, it is highlighted for additional review by the Trustees. This method is only used as an aid for Trustees to highlight funds and is not the sole test of whether the Board will determine to take particular actions concerning fees or performance. Funds that have not been flagged by this screen also may be singled out for fee and performance reasons, and the Trustees may determine not to take action with respect to the fees or performance of funds that have been flagged by the screen. These screens contribute to the basis for discussions on Trustees' views on the Columbia Funds.
III. Findings
My findings based on my work as IFC are as follows:
1. The Trustees have the relevant information necessary to form an opinion on the reasonableness of fees and evaluate the performance of the Columbia Funds. The process the Trustees used in preparing to reach their determination has been open and informative. In my view, the 2005 process by which the management fees of the Columbia Funds have been negotiated thus far has been, to the extent practicable, at arm's length and reasonable and consistent with the AOD.
76
Summary of Management Fee Evaluation by Independent Fee Consultant (continued)
2. Columbia Funds demonstrated a range of performance relative to their peers. I find that across the fund complex, 54.26 percent of Columbia Funds have performance higher than the median of their respective Lipper performance universe, and 42.55 percent of Columbia Funds have performance higher than the median of their respective Lipper performance group. In addition, Lipper performance universe and group comparison showed that Columbia Funds were distributed roughly evenly across these quintiles. The Trustees have worked with management to address issues of funds that have demonstrated consistent or significant underperformance.
3. Columbia Funds demonstrate a range of management fees and expense ratios relative to their peers. I find that across the fund complex, 58.51 percent of Columbia Funds have expenses below the median of their Lipper expense universe, and 53.19 percent of Columbia Funds have expenses below the median of their Lipper expense group. In addition, Lipper expense universe and group comparisons show that Columbia Funds are distributed roughly evenly across these quintiles. The Trustees have taken steps to limit shareholder expenses for certain funds having management fees significantly above their peers, often though the use of fee waivers to which CMG has agreed. Consolidation of various funds and fund families managed by CMG has resulted in substantial savings in non-advisory expenses.
4. Profitability to CMG of the individual funds ranges widely, but the overall profitability to CMG of its relationship with the Columbia Funds appears to fall within a reasonable range. The method of cost allocation to funds is addressed in the material provided by CMG to the Trustees, but additional information may be necessary to make a judgment on fund level profitability. My review of profitability and cost allocation is ongoing, and I plan to continue to develop my views with regard to fund level profitability.
5. Columbia Funds have instituted fee schedules with breakpoints designed to enable investors to benefit from fund economies of scale, although 71% of the funds have not yet reached their first breakpoint. My analysis of the appropriateness of the breakpoint levels, which I expect will take into account the cost and profitability of the individual funds, is ongoing.
My work is ongoing and my views may develop over time in light of new information and analysis.
Respectfully submitted,
Erik R. Sirri
77
CMG FUND TRUST
1300 S.W. SIXTH AVENUE, PORTLAND, OREGON 97201
- INVESTMENT ADVISOR -
COLUMBIA MANAGEMENT ADVISORS, LLC
100 FEDERAL STREET
BOSTON, MASSACHUSETTS 02110-2624
- LEGAL COUNSEL -
ROPES & GRAY LLP
ONE INTERNATIONAL PLACE
BOSTON, MASSACHUSETTS 02110-2624
- TRANSFER AGENT -
COLUMBIA MANAGEMENT SERVICES, INC.
P.O. BOX 8081
BOSTON, MASSACHUSETTS 02266-8081
SHC-44/106205-0106 (03/06) 06/10286
A description of the funds' proxy voting policies and procedures is available (i) on the funds' website, www.columbiamanagement.com; (ii) on the Securities and Exchange Commission's website at www.sec.gov, and (iii) without charge, upon request, by calling 800-368-0346. Information regarding how the funds voted proxies relating to portfolio securities during the 12-month period ended June 30 is available from the SEC's website. Information regarding how the funds voted proxies relating to portfolio securities is also available from the funds' website.
Each fund files a complete schedule of portfolio holdings with the SEC for the first and third quarters of each fiscal year on Form N-Q. Each fund's Form N-Q is available on the SEC's website at www.sec.gov and may be reviewed and copied at the SEC's Public Reference Room in Washington, D.C. Information on the operation of the Public Reference Room may be obtained by calling 1-800-SEC-0330.
The CMG funds are offered by prospectus through Columbia Management Distributors, Inc. Please consider the investment objectives, risks, charges and expenses of a mutual fund carefully before investing. Contact your Columbia Management representative or visit www.columbiamanagement.com for a prospectus, which contains this and other important information about the fund. Read it carefully before you invest.
Fund distributed by Columbia Management Distributors, Inc., One Financial Center, Boston, MA 02111-2621
![]()
CMG ENHANCED S&P 500® INDEX FUND
CMG LARGE CAP GROWTH FUND
CMG LARGE CAP VALUE FUND
CMG MID CAP GROWTH FUND
CMG MID CAP VALUE FUND
CMG SMALL CAP GROWTH FUND
CMG SMALL CAP VALUE FUND
CMG SMALL/MID CAP FUND
CMG INTERNATIONAL STOCK FUND
PORTFOLIOS OF CMG FUND TRUST
Semiannual Report
January 31, 2006
Advised by Columbia Management Advisors, LLC.
Not FDIC
Insured
May Lose Value
No Bank Guarantee
Columbia Management is the primary investment management division of Bank of America Corporation. Columbia Management entities furnish investment management services and advise institutional and mutual fund portfolios. CMG Funds are distributed by Columbia Management Distributors, Inc., member of NASD, SIPC, part of Columbia Management and an affiliate of Bank of America Corporation.
Columbia Management Advisors, Inc. combined with Banc of America Capital Management, LLC on September 30, 2005. At that time, the newly combined advisor underwent a name change to Columbia Management Advisors, LLC and continues to operate as a SEC-registered investment advisor, wholly owned subsidiary of Bank of America, N.A. and is part of Columbia Management.
Table of Contents
| Management Discussion of Fund Performance | |||||||
| CMG Enhanced S&P 500® Index Fund | 1 | ||||||
| CMG Large Cap Growth Fund | 6 | ||||||
| CMG Large Cap Value Fund | 12 | ||||||
| CMG Mid Cap Growth Fund | 18 | ||||||
| CMG Mid Cap Value Fund | 23 | ||||||
| CMG Small Cap Growth Fund | 29 | ||||||
| CMG Small Cap Value Fund | 34 | ||||||
| CMG Small/Mid Cap Fund | 40 | ||||||
| CMG International Stock Fund | 45 | ||||||
| Financial Statements | |||||||
| Financial Highlights | 51 | ||||||
| Schedules of Investments | 60 | ||||||
| Statements of Assets and Liabilities | 124 | ||||||
| Statements of Operations | 126 | ||||||
| Statements of Changes in Net Assets | 128 | ||||||
| Notes to Financial Statements | 133 | ||||||
| Board Consideration and Approval of Investment Advisory Agreements | 142 | ||||||
| Summary of Management Fee Evaluation by Independent Fee Consultant | 145 | ||||||
The views expressed in the portfolio commentaries reflect the current views of the Portfolio Managers. These views are not guarantees of future performance and involve certain risks, uncertainties and assumptions that are difficult to predict so actual outcomes and results may differ significantly from the views expressed. These views are subject to change at any time based upon economic, market or other conditions and the Portfolio Managers disclaim any responsibility to update such views. These views may not be relied on as investment advice and, because investment decisions for a CMG Fund are based on numerous factors, may not be relied on as an indication of trading intent on behalf of any particular CMG Fund. References to specific company securities should not be constructed as a recommendation or investment advice.
Performance data quoted represents past performance and current performance may be lower or higher. Past performance is no guarantee of future results. The investment return and principal value will fluctuate so that shares, when redeemed, may be worth more or less than the original cost. Please visit www.columbiamanagement.com for daily and most recent month-end performance updates.
CMG ENHANCED S&P 500® INDEX FUND
A Portfolio of CMG Fund Trust
MANAGEMENT DISCUSSION OF FUND PERFORMANCE
CMG Enhanced S&P 500® Index Fund returned 6.44% for the six-month period ended January 31, 2006. The fund's return was higher than that of the S&P 500 Index,1 which was 4.68% for the same period. The fund also outperformed the 5.09% average return for the Lipper Large Cap Core Funds Category.2 Stock selection accounted for the fund's strong performance during the period.
The US stock market delivered solid, positive returns despite rising energy prices, higher borrowing costs and the after effects of two hurricanes, which devastated the Gulf Coast states. The pace of economic growth slowed, but positive factors outweighed negative factors as the job market remained resilient and corporate profits experienced double-digit growth.
With the exception of telecommunications, which was flat for the period, all sectors made positive contributions to the fund's return. The fund's investments in the consumer discretionary, materials and health care sectors were particularly strong. Darden Restaurants, Inc. and McDonald's Corp. gained significant ground as did Harley-Davidson, Inc., Sherwin-Williams Co., and AutoZone, Inc.3 In the materials sector, Freeport-McMoRan Copper & Gold, Inc. and Phelps Dodge Corp. benefited from a surge in the price of gold and other metals. Nucor Corp., a steel producer, was the beneficiary of solid global economic expansion. In health care, solid performance from a range of sub-sectors contributed to the fund's above-benchmark return. UnitedHealth Group, Inc., a health care insurer; Gilead Sciences, Inc., a biotech company; Cardinal Health, Inc., a pharmaceuticals distributor; and Express Scripts, Inc., a leading pharma cy benefits manager, all generated double-digit gains. Their returns helped offset weak performance among major pharmaceutical manufacturers.
Although the fund owned many strong performers in both the industrials and technology sectors, overall return was dragged down by weak showings from selected companies. In the industrials sector, Deere & Co., a farm equipment manufacturer, and Cendant Corp., a hotel, entertainment and travel services holding company, detracted from performance. Deere announced that it would incur charges associated with a major plant closing. We sold the stock. Cendant reported significantly higher earnings for the fourth quarter of 2005 but reduced its forecast for first quarter 2006, and the stock suffered a 20% decline.
The fund's technology holdings also produced some solid winners, such as Hewlett-Packard Co. and Apple Computer, Inc. However, positions in Dell, Inc. and Intel Corp. cut into these gains and detracted from performance during a period that was generally weak for the technology sector.
Looking ahead, we believe that the US economy is positioned for another year of growth, especially if energy prices decline and monthly job gains continue to ease the unemployment rate. However, the dollar is poised to move lower against both the euro and the yen in 2006 and that could have a negative impact on corporate profits. In this environment, we believe the outlook for large cap stocks is positive. Large, proven companies have the potential to hold up better than smaller, less established companies in a slowing economy. And because many of
1
these companies also participate in multiple global markets, they may be better positioned than smaller companies to weather a declining dollar.
The fund's top ten holdings (as a percentage of net assets) as of January 31, 2006 were:
| (%) | |||||||
| Exxon Mobil | 3.6 | ||||||
| Microsoft | 2.1 | ||||||
| General Electric | 2.1 | ||||||
| Intel | 1.9 | ||||||
| Cisco Systems | 1.9 | ||||||
| Pfizer | 1.8 | ||||||
| Citigroup | 1.8 | ||||||
| Procter & Gamble | 1.7 | ||||||
| Johnson & Johnson | 1.6 | ||||||
| American International Group | 1.5 | ||||||
We appreciate your continued confidence in CMG Enhanced S&P 500® Index Fund.
Vikram Kuriyan has managed the CMG Enhanced S&P 500® Index Fund since June 2005 and has been with the advisor or its predecessors or affiliate organizations since 2000.

Equity investments are affected by stock market fluctuations that occur in response to economic and business developments.
Investing in the fund also includes market risk and tracking error risk. Unlike the S&P 500 Index, the fund incurs administrative expenses and transaction costs in trading stocks. The composition of the S&P 500 Index and the stocks held by the fund may occasionally diverge.
1 The Standard & Poor's (S&P) 500 Index tracks the performance of 500 widely held, large-capitalization US stocks. Unlike the fund, indices are not investments, they do not incur fees or expenses and are not professionally managed. It is not possible to invest directly in an index. Securities in the fund may not match those in an index.
2 Lipper Inc., a widely respected data provider in the industry, calculates an average total return (assuming reinvestment of distributions) for mutual funds with investment objectives similar to those of the fund. Lipper makes no adjustment for the effect of sales loads.
3 Holdings are calculated as a percentage of net assets on January 31, 2006, and are subject to change: Darden Restaurants, Inc. (0.7%), McDonald's Corp. (1.0%), Harley-Davidson, Inc. (0.9%), Sherwin-Williams Co. (0.4%), and AutoZone, Inc. (0.2%), Freeport-McMoRan Copper & Gold, Inc. (0.5%), Phelps Dodge Corp. (0.7%), Nucor Corp. (1.2%), UnitedHealth Group, Inc. (1.0%), Gilead Sciences, Inc. (0.7%), Cardinal Health, Inc. (0.4%), Express Scripts, Inc. (0.2%), Cendant Corp. (0.7%), Hewlett-Packard Co. (1.2%), Apple Computer, Inc. (0.1%), Dell, Inc. (0.8%), Intel Corp. (1.9%).
Holdings are calculated as a percentage of net assets and are subject to change. Because the fund is actively managed, there is no guarantee the fund will continue to maintain the holdings breakdown listed. The fund's holdings and their weights within the portfolio may change as market conditions change.
2
Average annual total return as of January 31, 2006 (%)
| Inception | 6-month (cumulative) | 1-year | Life | ||||||||||||||||
| CMG Enhanced S&P 500® Index Fund | 05/05/03 | 6.44 | 12.36 | 15.26 | |||||||||||||||
| S&P 500 Index | 4.68 | 10.38 | 14.52 | ||||||||||||||||
Average annual total return as of December 31, 2005 (%)
| Inception | 6-month (cumulative) | 1-year | Life | ||||||||||||||||
| CMG Enhanced S&P 500® Index Fund | 05/05/03 | 7.40 | 6.83 | 14.64 | |||||||||||||||
| S&P 500 Index | 5.77 | 4.91 | 13.89 | ||||||||||||||||
Index performance is from May 5, 2003.
Performance data quoted represents past performance and current performance may be lower or higher. Past performance is no guarantee of future results. The investment return and principal value will fluctuate so that shares may be worth more or less than the original cost. Please visit www.columbiamanagement.com for daily and most recent month-end performance updates.
Performance results may reflect any voluntary waivers or reimbursement of fund expenses by the advisor or its affiliates. Absent these waivers or reimbursement arrangements, performance results would have been lower. All results shown assume reinvestment of distributions.
Growth of a $10,000 investment, May 5, 2003 to January 31, 2006
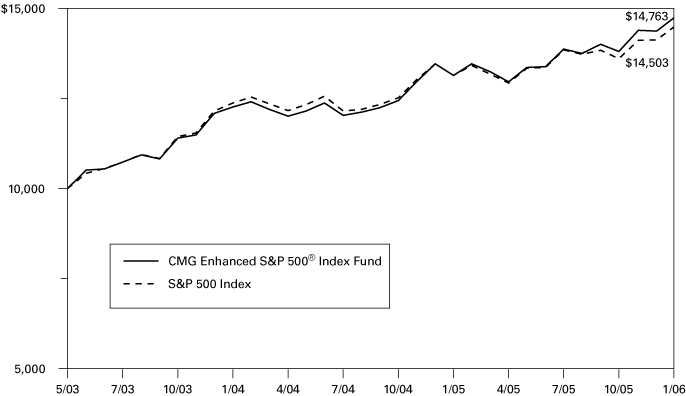
The Standard & Poor's (S&P) 500 Index tracks the performance of 500 widely held, large-capitalization US stocks. Unlike the fund, indices are not investments, they do not incur fees or expenses and are not professionally managed. It is not possible to invest directly in an index. Securities in the fund may not match those in an index.
The chart above shows the growth in value of a hypothetical $10,000 investment in the fund compared to the index during the stated time period, and does not reflect the deduction of taxes that a shareholder would pay on fund distributions or the redemption of fund shares.
3
UNDERSTANDING YOUR EXPENSES – CMG Enhanced S&P 500® Index Fund
As a fund shareholder, you incur two types of costs. There are transaction costs and also ongoing costs, which generally include investment advisory fees and other fund expenses. The information on this page is intended to help you understand your ongoing costs of investing in the fund and to compare these costs with the ongoing costs of investing in other mutual funds.
Analyzing your fund's expenses
To illustrate these ongoing costs, we have provided an example and calculated the expenses paid by investors during the reporting period. The information in the following table is based on an initial investment of $1,000, which is invested at the beginning of the reporting period and held for the entire period. Expense information is calculated two ways and each method provides you with different information. The amount listed in the "actual" column is calculated using the fund's actual operating expenses and total return for the period. The amount listed in the "hypothetical" column assumes that the return each year is 5% before expenses and includes the fund's actual expense ratio. You should not use the hypothetical account values and expenses to estimate either your actual account balance at the end of the period or the expenses you paid during this reporting period.
Estimating your actual expenses
To estimate the expenses that you paid over the period, first you will need your account balance at the end of the period:
1. Divide your ending account balance by $1,000. For example, if an account balance was $8,600 at the end of the period, the result would be 8.6.
2. In the section of the table below titled "Expenses paid during the period," locate the amount under "actual." Multiply this number by the result from step 1. Your answer is an estimate of the expenses you paid on your account during the period.
August 1, 2005 – January 31, 2006
| Account value at the beginning of the period ($) | Account value at the end of the period ($) | Expenses paid during the period ($) | Fund's annualized expense ratio (%) | ||||||||||||||||||||||||||||||||
| Actual | Hypothetical | Actual | Hypothetical | Actual | Hypothetical | ||||||||||||||||||||||||||||||
| 1,000.00 | 1,000.00 | 1,064.43 | 1,023.95 | 1.30 | 1.28 | 0.25 | |||||||||||||||||||||||||||||
Expenses paid during the period are equal to the fund's annualized expense ratio of 0.25%, multiplied by the average account value over the period, then multiplied by the number of days in the fund's most recent fiscal half-year and divided by 365.
Had the Investment Advisor not reimbursed a portion of expenses, total return would have been reduced.
It is important to note that the expense amounts shown in the table are meant to highlight only ongoing costs of investing in the fund and do not reflect any transaction costs, such as sales charges, redemption or exchange fees. Therefore, the hypothetical examples provided may not help you determine the relative total costs of owning shares of different funds. If these transaction costs were included, your costs would have been higher.
4
Compare with other funds
Since all mutual funds are required to include the same hypothetical calculations about expenses in shareholder reports, you can use this information to compare the ongoing cost of investing in the fund with other funds. To do so, compare the 5% hypothetical example with the 5% hypothetical examples that appear in the shareholder reports of other funds. As you compare hypothetical examples of other funds, it is important to note that hypothetical examples are meant to highlight the continuing costs of investing in a fund and do not reflect any transaction costs, such as sales charges or redemption or exchange fees.
5
Performance data quoted represents past performance and current performance may be lower or higher. Past performance is no guarantee of future results. The investment return and principal value will fluctuate so that shares, when redeemed, may be worth more or less than the original cost. Please visit www.columbiamanagement.com for most recent daily and month-end performance updates.
CMG LARGE CAP GROWTH FUND
A Portfolio of CMG Fund Trust
MANAGEMENT DISCUSSION OF FUND PERFORMANCE
CMG Large Cap Growth Fund returned 7.20% for the six-month period ended January 31, 2006. The fund outperformed the Russell 1000 Growth Index1 and the Morningstar Large Growth Category average, which returned 3.91% and 6.96%, respectively, over the same period.2 We found attractive growth stocks in most sectors, but particularly in health care and technology. We focused on large companies with strong competitive positions; high, sustainable profits; good balance sheets and above-average earnings growth. In fact, the fund outperformed its peer group even though it stayed relatively close to the market cap range of the index during a period dominated by the smallest of large cap stocks, which we believe were favored by many competing funds.
In health care, the fund's focus on companies that could benefit from newer technologies paid off. Varian Medical Systems, Inc., which develops radiation and imaging systems, rallied sharply in the midst of a favorable new product cycle (1.4% of net assets). Amylin Pharmaceuticals, Inc., a biotechnology company developing advanced therapies for diabetes, also produced very strong gains. We took profits and sold the stock. A decision to bypass large US pharmaceutical companies also benefited performance as these companies faced headwinds from maturing product lines and pending patent expirations. We focused, instead, on non-US pharmaceutical companies, such as Teva Pharmaceutical Industries Ltd. (1.4% of net assets). An Israeli-based generics manufacturer, Teva rallied following the announcement that it would merge with IVAX Corp. (0.8% of net assets).
Stock selection across an array of technology subsectors further bolstered returns. Among the standouts were Google, Inc., which is the fastest growing Internet advertiser; Broadcom Corp., which makes specialized integrated circuits for a variety of products, including the new video i-pods; and MEMC Electronic Materials, Inc., which supplies the silicon used in semiconductor chips and solar cells (2.6% and 1.4% of net assets, respectively). We took profits and eliminated MEMC from the portfolio. Although these and other winners dominated returns, the fund had a few detractors, including McAfee, Inc., best known for its anti-virus software, and Dell, Inc. We sold both stocks.
Investments in the financials and energy sectors further aided performance. Within financials, we focused on companies that could benefit from strong capital markets activity or from a rebound in insurance pricing. In this regard, broker Merrill Lynch & Co., Inc. and insurer American International Group, Inc. were both positive contributors (1.0% and 0.9% of net assets, respectively). Energy stocks rallied sharply as growing global demand kept commodity prices at historically high levels. The fund benefited from an above-average stake in the sector coupled with good stock selection.
Consumer discretionary stock selection detracted from returns. Although we did well to hold a relatively small stake in what was a weak sector, many of the stocks in the portfolio lost ground. In particular, Bed, Bath & Beyond, Inc. suffered as operating and revenue results fell short of expectations, and CVS Corp. lost momentum as it completed the Eckerd acquisition. We sold both names. Office Depot, Inc. was one of the few bright spots, benefiting from a turnaround in its business (1.6% of net assets).
6
Looking ahead, we believe the outlook for large-cap growth stocks is positive. Valuations remain attractive, plus large-cap stocks have the potential to hold up well if economic growth slows. With consumers no longer able to bank on the multi-year bull market in housing to fuel the economy, we plan to seek opportunities within industrial and infrastructure-related sectors, as well as sectors that are not directly tied to the economic cycle, such as health care. We also may add to investments in financial stocks, which could stand to benefit as the Federal Reserve's efforts to boost short-term interest rates wind down.
The fund's top ten holdings (as a percentage of net assets) as of January 31, 2006 were:
| (%) | |||||||
| Microsoft | 5.0 | ||||||
| General Electric | 3.1 | ||||||
| 2.6 | |||||||
| Wal-Mart Stores | 1.9 | ||||||
| Novartis | 1.9 | ||||||
| International Business Machines | 1.8 | ||||||
| Medtronic | 1.7 | ||||||
| Yahoo! | 1.7 | ||||||
| Office Depot | 1.6 | ||||||
| SAP | 1.6 | ||||||
Thank you for investing in CMG Large Cap Growth Fund.
Paul J. Berlinguet, lead manager for CMG Large Cap Growth Fund, has managed or co-managed the fund since October 2003 and has been with the advisor or its predecessors or affiliate organizations since 2003.

Edward Hickey has co-managed the fund since June 2005 and has been with the advisor or its predecessors or affiliate organizations since 1998.

7
Mary-Ann Ward has co-managed the fund since June 2005 and has been with the advisor or its predecessors or affiliate organizations since 1997.

Roger Sullivan has co-managed the fund since June 2005 and has been with the advisor or its predecessors or affiliate organizations since January 2005.

John T. Wilson has co-managed the fund since August 2005 and has been with the advisor or its predecessors since July 2005.

Equity investments are affected by stock market fluctuations that occur in response to economic and business developments.
Investing in growth stocks incurs the possibility of losses because their prices are sensitive to changes in current or expected earnings.
1 The Russell 1000 Growth Index measures the performance of those Russell 1000 Index companies with higher price-to-book ratios and higher forecasted growth values. Unlike the fund, indices are not investments, they do not incur fees or expenses and are not professionally managed. It is not possible to invest directly in an index. Securities in the fund may not match those in an index.
2 ©2006 by Morningstar, Inc. All rights reserved. The information contained herein is the proprietary information of Morningstar, Inc., may not be copied or redistributed for any purpose and may only be used for noncommercial, personal purposes. The information contained herein is not represented or warranted to be accurate, correct, complete or timely. Morningstar, Inc. shall not be responsible for investment decisions, damages or other losses resulting from the use of this information. Past performance is no guarantee of future performance. Morningstar, Inc. has not granted consent for it to be considered or deemed an "expert" under the Securities Act of 1933.
Morningstar Categories compare the performance of funds with similar investment objectives and strategies.
Holdings are calculated as a percentage of net assets, and are subject to change. Because the fund is actively managed, there is no guarantee the fund will continue to maintain the holdings breakdown listed. The fund's holdings and their weights within the portfolio may change as market conditions change.
8
Average annual total return as of January 31, 2006 (%)
| Inception | 6-month (cumulative) | 1-year | Life | ||||||||||||||||
| CMG Large Cap Growth Fund | 09/10/03 | 7.20 | 12.11 | 10.12 | |||||||||||||||
| Russell 1000 Growth Index | 3.91 | 10.81 | 8.62 | ||||||||||||||||
Average annual total return as of December 31, 2005 (%)
| Inception | 6-month (cumulative) | 1-year | Life | ||||||||||||||||
| CMG Large Cap Growth Fund | 09/10/03 | 7.32 | 5.82 | 8.90 | |||||||||||||||
| Russell 1000 Growth Index | 7.11 | 5.26 | 8.13 | ||||||||||||||||
Index performance is from September 10, 2003.
Performance data quoted represents past performance and current performance may be lower or higher. Past performance is no guarantee of future results. The investment return and principal value will fluctuate so that shares, when redeemed, may be worth more or less than the original cost. Please visit www.columbiamanagement.com for daily and most recent month-end performance updates.
Performance results may reflect any voluntary waivers or reimbursement of fund expenses by the advisor or its affiliates. Absent these waivers or reimbursement arrangements, performance results would have been lower. All results shown assume reinvestment of distributions.
Growth of a $10,000 investment, September 10, 2003 to January 31, 2006
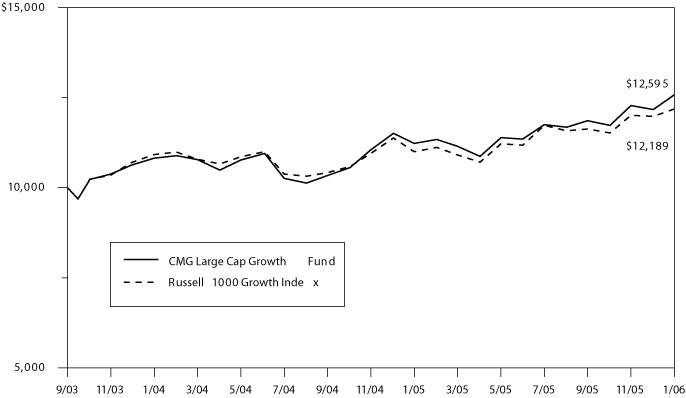
The Russell 1000 Growth Index measures the performance of those Russell 1000 Index companies with higher price-to-book ratios and higher forecasted growth values. Unlike the fund, indices are not investments, they do not incur fees or expenses and are not professionally managed. It is not possible to invest directly in an index. Securities in the fund may not match those in an index.
The chart above shows the growth in value of a hypothetical $10,000 investment in the fund compared to the index during the stated time period, and does not reflect the deduction of taxes that a shareholder would pay on fund distributions or the redemption of fund shares.
9
UNDERSTANDING YOUR EXPENSES – CMG Large Cap Growth Fund
As a fund shareholder, you incur two types of costs. There are transaction costs and also ongoing costs, which generally include investment advisory fees and other fund expenses. The information on this page is intended to help you understand your ongoing costs of investing in the fund and to compare these costs with the ongoing costs of investing in other mutual funds.
Analyzing your fund's expenses
To illustrate these ongoing costs, we have provided an example and calculated the expenses paid by investors during the reporting period. The information in the following table is based on an initial investment of $1,000, which is invested at the beginning of the reporting period and held for the entire period. Expense information is calculated two ways and each method provides you with different information. The amount listed in the "actual" column is calculated using the fund's actual operating expenses and total return for the period. The amount listed in the "hypothetical" column assumes that the return each year is 5% before expenses and includes the fund's actual expense ratio. You should not use the hypothetical account values and expenses to estimate either your actual account balance at the end of the period or the expenses you paid during this reporting period.
Estimating your actual expenses
To estimate the expenses that you paid over the period, first you will need your account balance at the end of the period:
1. Divide your ending account balance by $1,000. For example, if an account balance was $8,600 at the end of the period, the result would be 8.6.
2. In the section of the table below titled "Expenses paid during the period," locate the amount under "actual." Multiply this number by the result from step 1. Your answer is an estimate of the expenses you paid on your account during the period.
August 1, 2005 – January 31, 2006
| Account value at the beginning of the period ($) | Account value at the end of the period ($) | Expenses paid during the period ($) | Fund's annualized expense ratio (%) | ||||||||||||||||||||||||||||||||
| Actual | Hypothetical | Actual | Hypothetical | Actual | Hypothetical | ||||||||||||||||||||||||||||||
| 1,000.00 | 1,000.00 | 1,072.04 | 1,022.68 | 2.61 | 2.55 | 0.50 | |||||||||||||||||||||||||||||
Expenses paid during the period are equal to the fund's annualized expense ratio of 0.50%, multiplied by the average account value over the period, then multiplied by the number of days in the fund's most recent fiscal half-year and divided by 365.
Had the Investment Advisor not reimbursed a portion of expenses, total return would have been reduced.
It is important to note that the expense amounts shown in the table are meant to highlight only ongoing costs of investing in the fund and do not reflect any transaction costs, such as sales charges, redemption or exchange fees. Therefore, the hypothetical examples provided may not help you determine the relative total costs of owning shares of different funds. If these transaction costs were included, your costs would have been higher.
10
Compare with other funds
Since all mutual funds are required to include the same hypothetical calculations about expenses in shareholder reports, you can use this information to compare the ongoing cost of investing in the fund with other funds. To do so, compare the 5% hypothetical example with the 5% hypothetical examples that appear in the shareholder reports of other funds. As you compare hypothetical examples of other funds, it is important to note that hypothetical examples are meant to highlight the continuing costs of investing in a fund and do not reflect any transaction costs, such as sales charges or redemption or exchange fees.
11
Performance data quoted represents past performance and current performance may be lower or higher. Past performance is no guarantee of future results. The investment return and principal value will fluctuate so that shares, when redeemed, may be worth more or less than the original cost. Please visit www.columbiamanagement.com for daily and most recent month-end performance updates.
CMG LARGE CAP VALUE FUND
A Portfolio of CMG Fund Trust
MANAGEMENT DISCUSSION OF FUND PERFORMANCE
CMG Large Cap Value Fund returned 7.54% for the six-month period ended January 31, 2006. The Russell 1000 Value Index1 returned 6.21%, and the average return of the Morningstar Large Value Category was 5.26%.2 During the period, we experienced strong stock selection in energy, financials and health care. Strong gains from these areas overshadowed some weakness from investments in retailing, technology and capital goods sectors.
The energy sector was the fund's strongest performer during the period, despite some weakness at the end of the year. Shares of Halliburton Co. and Schlumberger Ltd. rose nicely (1.1% and 0.9% of net assets, respectively). Halliburton experienced strong growth on the back of increased global demand for many of its operations, higher drilling activity and improved pricing. Schlumberger also benefited from high demand for oilfield service, with strong pricing and accelerating technology delivery. The fund also enjoyed gains from Occidental Petroleum Corp. and Marathon Oil Corp., both beneficiaries of rising oil prices as continued strong demand outstripped tight supply (2.2% and 1.0% of net assets, respectively).
A decision to maintain an underweight in financial stocks aided relative return as rising interest rates and a flattening yield curve had a negative impact on operating margins, most notably, among consumer credit companies, banks and thrifts. However, the sector was not without its winners. Good performance was garnered from our investments in Merrill Lynch & Co., Inc., Goldman Sachs Group, Inc. and Wachovia Corp.—all companies that are less sensitive to interest-rate changes (2.2%, 1.0% and 2.5% of net assets, respectively). That said, we believe that the Federal Reserve Board may be at or near the end of its cycle of short-term interest rates increases, which could make the banking sector more attractive. We plan to look for companies that could experience net interest margin expansion in an environment of stable to lower interest rates.
Solid stock selection in health care and a decision to largely avoid domestic large-cap pharmaceutical stocks, which declined through most of the period, also aided the fund's overall performance. We focused on European pharmaceutical stocks, including AstraZeneca PLC and Novartis AG, which we believe are less vulnerable to competition from generic drug manufacturers than US companies and better positioned given their product pipelines (1.0% and 1.0% of net assets, respectively). Additionally, service and supply companies such as CIGNA Corp. and Aetna, Inc. benefited from rising margins and contributed to the fund's positive performance (1.1% and 0.7% of net assets, respectively).
On the negative side, stock selection in retail and technology detracted from performance. The fund's two largest retail positions, J.C. Penney Co., Inc. and Federated Department Stores, Inc., suffered a mid-period correction as investors expressed their fears that rising energy prices would keep their target customers away (1.4% and 1.2% of net assets, respectively). In
12
technology, disappointing performance from International Business Machines Corp. and Dell, Inc., both of which failed to meet the market's earnings expectations, more than offset strong gains from Taiwan Semiconductor Manufacturing Co., Ltd. and Agilent Technologies, Inc. (0.8%, 0.2%, 0.8% and 0.5% of net assets, respectively).
Looking ahead, we plan to continue our focus on attractively-valued companies that have demonstrated the potential to increase their earnings through margin expansion and sales growth. Additionally, we plan to continue seeking companies that we believe have the potential to produce rising returns on capital and return that capital to shareholders through dividends and share repurchase. We also plan to take advantage of the strength we see in commodity-related industries, if demand for copper, iron ore and aluminum continues to increase. In the capital goods sector, we foresee increased prospects for commercial aerospace fueled by new aircraft demand resulting from growth in emerging market and developed foreign market air traffic.
The fund's top ten holdings (as a percentage of net assets) as of January 31, 2006 were:
| (%) | |||||||
| Exxon Mobil | 3.4 | ||||||
| Wachovia | 2.5 | ||||||
| Citigroup | 2.3 | ||||||
| Merrill Lynch & Co. | 2.2 | ||||||
| Wells Fargo | 2.2 | ||||||
| Occidental Petroleum | 2.2 | ||||||
| U.S. Bancorp | 2.2 | ||||||
| Altria Group | 2.1 | ||||||
| Exelon | 1.7 | ||||||
| Burlington Northern Santa Fe | 1.5 | ||||||
Thank you for investing in CMG Large Cap Value Fund.
Lori J. Ensinger is the lead manager for CMG Large Cap Value Fund and has managed the fund since August 2005. She has been with the advisor or its predecessors or affiliate organizations since 2001.

David I. Hoffman has co-managed the fund since August 2005 and has been with the advisor or its predecessors or affiliate organizations since 2001.

13
Noah J. Petrucci has co-managed the fund since August 2005 and has been with the advisor or its predecessors or affiliate organizations since 2002.

Diane L. Sobin has co-managed the fund since August 2005 and has been with the advisor or its predecessors or affiliate organizations since 2001.

Equity investments are affected by stock market fluctuations that occur in response to economic and business developments.
Value stocks are stocks of companies that may have experienced adverse business or industry developments or may be subject to special risks that have caused the stocks to be out of favor and, in the advisor's opinion, undervalued. If the advisor's assessment of a company's prospects is wrong, the price of the company's stock may not approach the value the advisor has placed on it.
1 The Russell 1000 Value Index measures the performance of those Russell 1000 Index companies with lower price-to-book ratios and lower forecasted growth values. Unlike the fund, indices are not investments, they do not incur fees or expenses and are not professionally managed. It is not possible to invest directly in an index. Securities in the fund may not match those in an index.
2 ©2006 by Morningstar, Inc. All rights reserved. The information contained herein is the proprietary information of Morningstar, Inc., may not be copied or redistributed for any purpose and may only be used for noncommercial, personal purposes. The information contained herein is not represented or warranted to be accurate, correct, complete or timely. Morningstar, Inc. shall not be responsible for investment decisions, damages or other losses resulting from the use of this information. Past performance is no guarantee of future performance. Morningstar, Inc. has not granted consent for it to be considered or deemed an "expert" under the Securities Act of 1933.
Morningstar Categories compare the performance of funds with similar investment objectives and strategies.
Holdings are calculated as a percentage of net assets and are subject to change. Because the fund is actively managed, there is no guarantee the fund will continue to maintain the holdings breakdown listed. The fund's holdings and their weights within the portfolio may change as market conditions change.
14
Average annual total return as of January 31, 2006 (%)
| Inception | 6-month (cumulative) | 1-year | Life | ||||||||||||||||
| CMG Large Cap Value Fund | 09/10/03 | 7.54 | 13.23 | 14.38 | |||||||||||||||
| Russell 1000 Value Index | 6.21 | 13.22 | 16.69 | ||||||||||||||||
Average annual total return as of December 31, 2005 (%)
| Inception | 6-month (cumulative) | 1-year | Life | ||||||||||||||||
| CMG Large Cap Value Fund | 09/10/03 | 6.10 | 7.24 | 13.04 | |||||||||||||||
| Russell 1000 Value Index | 5.20 | 7.05 | 15.43 | ||||||||||||||||
Index performance is from September 10, 2003.
Performance data quoted represents past performance and current performance may be lower or higher. Past performance is no guarantee of future results. The investment return and principal value will fluctuate so that shares, when redeemed, may be worth more or less than the original cost. Please visit www.columbiamanagement.com for daily and most recent month-end performance updates.
Performance results may reflect any voluntary waivers or reimbursement of fund expenses by the advisor or its affiliates. Absent these waivers or reimbursement arrangements, performance results would have been lower. All results shown assume reinvestment of distributions.
Growth of a $10,000 investment, September 10, 2003 to January 31, 2006
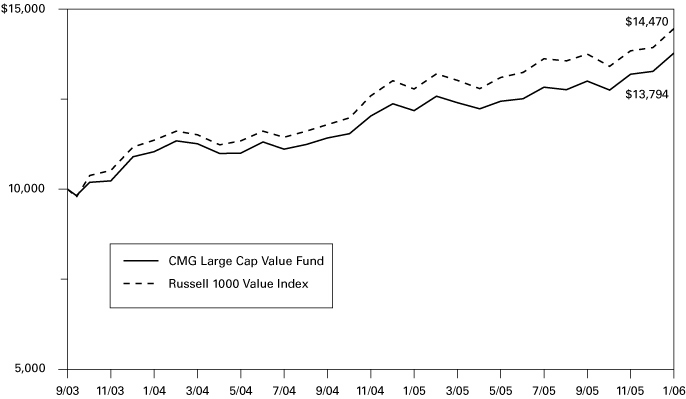
The Russell 1000 Value Index measures the performance of those Russell 1000 Index companies with lower price-to-book ratios and lower forecasted growth values. Unlike the fund, indices are not investments, they do not incur fees or expenses and are not professionally managed. It is not possible to invest directly in an index. Securities in the fund may not match those in an index.
The chart above shows the growth in value of a hypothetical $10,000 investment in the fund compared to the index during the stated time period, and does not reflect the deduction of taxes that a shareholder would pay on fund distributions or the redemption of fund shares.
15
UNDERSTANDING YOUR EXPENSES – CMG Large Cap Value Fund
As a fund shareholder, you incur two types of costs. There are transaction costs and also ongoing costs, which generally include investment advisory fees and other fund expenses. The information on this page is intended to help you understand your ongoing costs of investing in the fund and to compare these costs with the ongoing costs of investing in other mutual funds.
Analyzing your fund's expenses
To illustrate these ongoing costs, we have provided an example and calculated the expenses paid by investors during the reporting period. The information in the following table is based on an initial investment of $1,000, which is invested at the beginning of the reporting period and held for the entire period. Expense information is calculated two ways and each method provides you with different information. The amount listed in the "actual" column is calculated using the fund's actual operating expenses and total return for the period. The amount listed in the "hypothetical" column assumes that the return each year is 5% before expenses and includes the fund's actual expense ratio. You should not use the hypothetical account values and expenses to estimate either your actual account balance at the end of the period or the expenses you paid during this reporting period.
Estimating your actual expenses
To estimate the expenses that you paid over the period, first you will need your account balance at the end of the period:
1. Divide your ending account balance by $1,000. For example, if an account balance was $8,600 at the end of the period, the result would be 8.6.
2. In the section of the table below titled "Expenses paid during the period," locate the amount under "actual." Multiply this number by the result from step 1. Your answer is an estimate of the expenses you paid on your account during the period.
August 1, 2005 – January 31, 2006
| Account value at the beginning of the period ($) | Account value at the end of the period ($) | Expenses paid during the period ($) | Fund's annualized expense ratio (%) | ||||||||||||||||||||||||||||||||
| Actual | Hypothetical | Actual | Hypothetical | Actual | Hypothetical | ||||||||||||||||||||||||||||||
| 1,000.00 | 1,000.00 | 1,075.41 | 1,022.68 | 2.62 | 2.55 | 0.50 | |||||||||||||||||||||||||||||
Expenses paid during the period are equal to the fund's annualized expense ratio of 0.50%, multiplied by the average account value over the period, then multiplied by the number of days in the fund's most recent fiscal half-year and divided by 365.
Had the Investment Advisor not reimbursed a portion of expenses, total return would have been reduced.
It is important to note that the expense amounts shown in the table are meant to highlight only ongoing costs of investing in the fund and do not reflect any transaction costs, such as sales charges, redemption or exchange fees. Therefore, the hypothetical examples provided may not help you determine the relative total costs of owning shares of different funds. If these transaction costs were included, your costs would have been higher.
16
Compare with other funds
Since all mutual funds are required to include the same hypothetical calculations about expenses in shareholder reports, you can use this information to compare the ongoing cost of investing in the fund with other funds. To do so, compare the 5% hypothetical example with the 5% hypothetical examples that appear in the shareholder reports of other funds. As you compare hypothetical examples of other funds, it is important to note that hypothetical examples are meant to highlight the continuing costs of investing in a fund and do not reflect any transaction costs, such as sales charges or redemption or exchange fees.
17
Performance data quoted represents past performance and current performance may be lower or higher. Past performance is no guarantee of future results. The investment return and principal value will fluctuate so that shares, when redeemed, may be worth more or less than the original cost. Please visit www.columbiamanagement.com for daily and most recent month-end performance updates.
CMG MID CAP GROWTH FUND
A Portfolio of CMG Fund Trust
MANAGEMENT DISCUSSION OF FUND PERFORMANCE
CMG Mid Cap Growth Fund returned 17.04% for the six-month period ended January 31, 2006. The fund surpassed the 10.38% return of the Russell Midcap Growth Index1 and the 10.59% average of the Morningstar Mid-Cap Growth Category for the same period.2
In an environment that was generally favorable for mid-cap stocks, strong stock selection across a variety of sectors led to the fund's outperformance for the six-month period. Within information technology, Broadcom Corp. benefited from several design wins in high volume markets and an ability to maintain higher-than-expected gross margins that translated into strong profit growth (2.9% of net assets). Broadcom makes integrated circuits, which are used for digital set-top boxes, cable modems, servers, and local-area and home networking gear. Semiconductor designer Marvell Technology Group Ltd. continued to dominate its market and grow at a rate that exceeded investor expectations (1.4% of net assets).
Participation in the energy sector also had a positive impact on fund performance. Southwestern Energy Co., EOG Resources, Inc. and XTO Energy, Inc. were among the portfolio's top contributors, benefiting from high natural gas prices (1.2%, 1.3% and 1.2% of net assets, respectively). One disappointment was Teekay Shipping Corp., which was sold from the portfolio on concerns about future incremental supply of tankers.
The fund's health care holdings outperformed the index and made a solid contribution to returns. Amylin Pharmaceuticals, Inc. surged as Byetta, a new drug treating patients with type-2 diabetes, experienced strong initial demand (0.7% of net assets). Varian Medical Systems, Inc., a provider of medical equipment for cancer treatment, also gained during the period (1.0% of net assets). The fund was hurt by not owning Express Scripts, Inc., a pharmacy benefits manager that gained approximately 75% in the period.
The fund outperformed the index in the industrials, telecommunication services and financial sectors. A constructive outlook on machinery stocks warranted the fund's sizeable positions in Terex Corp. and Joy Global, Inc., both of which benefited from exposure to mining and construction customers (1.0% and 1.4% of net assets, respectively). In financials, Lazard Ltd. rose 51%, benefiting from increased activity in mergers and acquisitions (1.0% of net assets). Finally, Millicom International Cellular SA, which provides cellular phone service to emerging markets, gained 81% during the period and attracted numerous unsolicited acquisition offers by larger firms seeking entry to its markets (0.9% of net assets).
The consumer staples and consumer discretionary sectors were two areas of weakness for the fund, as both sectors declined. Among consumer staples stocks, Tyson Foods, Inc. struggled to improve margins (0.2% of net assets). Corn Products International, Inc. suffered from reduced profit expectations and the position was eliminated. Among consumer discretionary names, XM Satellite Radio Holdings, Inc. (1.2% of net assets) declined as investors worried about the competitive impact from Sirius Satellite Radio, Inc. We sold Tempur-Pedic International, Inc. from the portfolio due to concerns that competitive pricing could lead to slower profit growth.
We continue to believe that the economy is growing at a healthy rate and that inflation is relatively contained. We remain bullish on the energy and materials sectors for long-term structural reasons and continue to hold a number of later-cycle positions in the industrial sector. Accordingly, we are watchful for signs of decelerating growth that could provoke a reassessment of the strength and duration of the current economic expansion. Finally, we
18
believe that the interest rate environment and valuations are supportive of traditional growth stocks relative to value stocks, and we continue to seek candidates with strong earnings prospects and attractive valuations.
The fund's top ten holdings (as a percentage of net assets) as of January 31, 2006 were:
| (%) | |||||||
| Broadcom | 2.9 | ||||||
| Chico's FAS | 1.8 | ||||||
| Potash Corp. of Saskatchewan | 1.5 | ||||||
| American Tower | 1.5 | ||||||
| Joy Global | 1.4 | ||||||
| Marvell Technology Group | 1.4 | ||||||
| Coach | 1.3 | ||||||
| Corporate Executive Board | 1.3 | ||||||
| EOG Resources | 1.3 | ||||||
| XTO Energy | 1.2 | ||||||
Thank you for investing in CMG Mid Cap Growth Fund.
Kenneth A. Korngiebel has managed the CMG Mid Cap Growth Fund since June 2004 and has been with the advisor or its predecessors or affiliate organizations since 1996.

Equity investments are affected by stock market fluctuations that occur in response to economic and business developments.
Investing in growth stocks incurs the possibility of losses because their prices are sensitive to changes in current or expected earnings.
Investing in mid-cap stocks may present special risks, including possible illiquidity and greater price volatility than stocks of larger, more established companies.
1 The Russell Midcap Growth Index measures the performance of those Russell Midcap companies with higher price-to-book ratios and higher forecasted growth values. Unlike the fund, indices are not investments, they do not incur fees or expenses and are not professionally managed. It is not possible to invest directly in an index. Securities in the fund may not match those in an index.
2 ©2006 by Morningstar, Inc. All rights reserved. The information contained herein is the proprietary information of Morningstar, Inc., may not be copied or redistributed for any purpose and may only be used for noncommercial, personal purposes. The information contained herein is not represented or warranted to be accurate, correct, complete or timely. Morningstar, Inc. shall not be responsible for investment decisions, damages or other losses resulting from the use of this information. Past performance is no guarantee of future performance. Morningstar, Inc. has not granted consent for it to be considered or deemed an "expert" under the Securities Act of 1933.
Morningstar Categories compare the performance of funds with similar investment objectives and strategies.
Holdings are calculated as a percentage of net assets and are subject to change. Because the fund is actively managed, there is no guarantee the fund will continue to maintain the holdings breakdown listed. The fund's holdings and their weights within the portfolio may change as market conditions change.
19
Average annual total return as of January 31, 2006 (%)
| Inception | 6-month (cumulative) | 1-year | Life | ||||||||||||||||
| CMG Mid Cap Growth Fund | 05/05/03 | 17.04 | 28.99 | 20.22 | |||||||||||||||
| Russell Midcap Growth Index | 10.38 | 22.08 | 23.54 | ||||||||||||||||
Average annual total return as of December 31, 2005 (%)
| Inception | 6-month (cumulative) | 1-year | Life | ||||||||||||||||
| CMG Mid Cap Growth Fund | 05/05/03 | 14.73 | 16.93 | 17.26 | |||||||||||||||
| Russell Midcap Growth Index | 10.22 | 12.10 | 21.68 | ||||||||||||||||
Index performance is from May 5, 2003.
Performance data quoted represents past performance and current performance may be lower or higher. Past performance is no guarantee of future results. The investment return and principal value will fluctuate so that shares, when redeemed, may be worth more or less than the original cost. Please visit www.columbiamanagement.com for daily and most recent month-end performance updates.
Performance results may reflect any voluntary waivers or reimbursement of fund expenses by the advisor or its affiliates. Absent these reimbursement arrangements, performance results would have been lower. All results shown assume reinvestment of distributions.
Growth of a $10,000 investment, May 5, 2003 to January 31, 2006
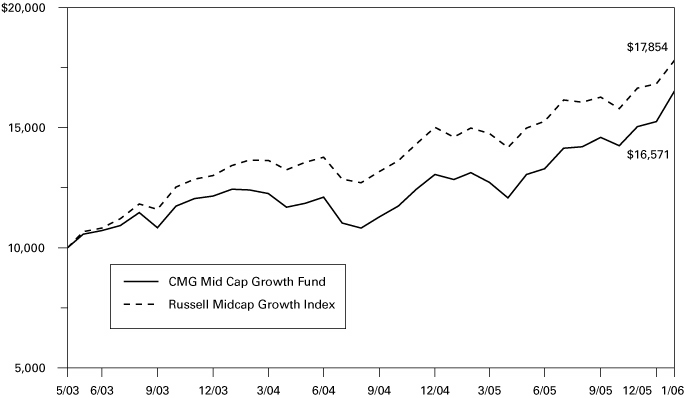
The Russell Midcap Growth Index measures the performance of those Russell Midcap companies with higher price-to-book ratios and higher forecasted growth values. Unlike the fund, indices are not investments, they do not incur fees or expenses and are not professionally managed. It is not possible to invest directly in an index. Securities in the fund may not match those in an index
The chart above shows the growth in value of a hypothetical $10,000 investment in the fund compared to the index during the stated time period, and does not reflect the deduction of taxes that a shareholder would pay on fund distributions or the redemption of fund shares.
20
UNDERSTANDING YOUR EXPENSES – CMG Mid Cap Growth Fund
As a fund shareholder, you incur two types of costs. There are transaction costs and also ongoing costs, which generally include investment advisory fees and other fund expenses. The information on this page is intended to help you understand your ongoing costs of investing in the fund and to compare these costs with the ongoing costs of investing in other mutual funds.
Analyzing your fund's expenses
To illustrate these ongoing costs, we have provided an example and calculated the expenses paid by investors during the reporting period. The information in the following table is based on an initial investment of $1,000, which is invested at the beginning of the reporting period and held for the entire period. Expense information is calculated two ways and each method provides you with different information. The amount listed in the "actual" column is calculated using the fund's actual operating expenses and total return for the period. The amount listed in the "hypothetical" column assumes that the return each year is 5% before expenses and includes the fund's actual expense ratio. You should not use the hypothetical account values and expenses to estimate either your actual account balance at the end of the period or the expenses you paid during this reporting period.
Estimating your actual expenses
To estimate the expenses that you paid over the period, first you will need your account balance at the end of the period:
1. Divide your ending account balance by $1,000. For example, if an account balance was $8,600 at the end of the period, the result would be 8.6.
2. In the section of the table below titled "Expenses paid during the period," locate the amount under "actual." Multiply this number by the result from step 1. Your answer is an estimate of the expenses you paid on your account during the period.
August 1, 2005 – January 31, 2006
| Account value at the beginning of the period ($) | Account value at the end of the period ($) | Expenses paid during the period ($) | Fund's annualized expense ratio (%) | ||||||||||||||||||||||||||||||||
| Actual | Hypothetical | Actual | Hypothetical | Actual | Hypothetical | ||||||||||||||||||||||||||||||
| 1,000.00 | 1,000.00 | 1,170.44 | 1,021.68 | 3.83 | 3.57 | 0.70 | |||||||||||||||||||||||||||||
Expenses paid during the period are equal to the fund's annualized expense ratio of 0.70%, multiplied by the average account value over the period, then multiplied by the number of days in the fund's most recent fiscal half-year and divided by 365.
Had the Investment Advisor not reimbursed a portion of expenses, total return would have been reduced.
It is important to note that the expense amounts shown in the table are meant to highlight only ongoing costs of investing in the fund and do not reflect any transaction costs, such as sales charges, redemption or exchange fees. Therefore, the hypothetical examples provided may not help you determine the relative total costs of owning shares of different funds. If these transaction costs were included, your costs would have been higher.
21
Compare with other funds
Since all mutual funds are required to include the same hypothetical calculations about expenses in shareholder reports, you can use this information to compare the ongoing cost of investing in the fund with other funds. To do so, compare the 5% hypothetical example with the 5% hypothetical examples that appear in the shareholder reports of other funds. As you compare hypothetical examples of other funds, it is important to note that hypothetical examples are meant to highlight the continuing costs of investing in a fund and do not reflect any transaction costs, such as sales charges or redemption or exchange fees.
22
Performance data quoted represents past performance and current performance may be lower or higher. Past performance is no guarantee of future results. The investment return and principal value will fluctuate so that shares, when redeemed, may be worth more or less than the original cost. Please visit www.columbiamanagement.com for daily and most recent month-end performance updates.
CMG MID CAP VALUE FUND
A Portfolio of CMG Fund Trust
MANAGEMENT DISCUSSION OF FUND PERFORMANCE
CMG Mid Cap Value Fund returned 8.84% for the six-month period ended January 31, 2006. The fund outperformed the 6.32% return of the Russell Midcap Value Index1 for the same period. The fund's investments in commercial services, diversified manufacturing and basic industries all contributed to the fund's above-benchmark performance, as did its energy holdings.
Domestic equity markets ended the year on a positive note, despite the negative impact of hurricanes Katrina and Rita. A late-year market rally was broad based, covering multiple capitalization and style categories. The stock market benefited from a robust economic environment, heightened capital expenditures and strengthening of consumer confidence. However, mid-cap stocks got the biggest boost from these positive factors.
The fund was positioned to take advantage of opportunities in the commercial services and diversified manufacturing industries, and both market segments contributed positively to the fund's performance. In the commercial services industry, solid returns were posted by Jacobs Engineering Group, Inc., Fluor Corp. and Technip SA–all global engineering companies (0.7%, 0.6% and 0.6% of net assets, respectively). Heavy machinery companies also did well, including United Rentals, Inc., Parker Hannifin Corp. and Dover Corp. (0.7%, 0.9% and 1.0% of net assets, respectively).
Basic industries companies fared well and Peabody Energy Corp. and Freeport-McMoRan Copper & Gold, Inc. posted strong returns (0.6% and 0.6% of net assets, respectively). Peabody, a coal producer and supplier, benefited as the global supply-demand balance for coal remained extremely tight. Demand continues to be driven by strong economic growth in the United States and China, and increasing demand for electricity generation and steel production in the Pacific Rim. Global and US coal-fueled power generation is expected to reach record levels in 2006. Additionally, Freeport-McMoRan advanced on strong copper and gold prices.
In the energy sector, oilfield service companies Weatherford International Ltd. and National-Oilwell Varco, Inc. were each up roughly 40% over the period and significant contributors to the fund's performance (0.9% and 0.6% of net assets, respectively). Energy prices have been quite volatile and much discussion has centered on the balance between global demand and supply. As a result of increased global demand, National-Oilwell Varco and Weatherford benefited from an increase in driller activity levels.
By contrast, the fund's holdings in the finance, technology and, to a lesser extent, health care sectors provided less positive performance. In the finance sector, Endurance Specialty Holdings Ltd., an insurance company, suffered a significant decline as the company released preliminary estimates of losses from the hurricanes (0.8% of net assets). Although the stock rebounded in
23
the days that followed this announcement, it did not fully recover. In technology, Flextronics International Ltd., an electronics services company, fell sharply during the period as it posted worse-than-expected earnings and management lowered its guidance on future earnings. We sold the stock because we did not believe that the company was likely to achieve significant operating leverage due to weak end-market demand.
Looking ahead, we plan to maintain the fund's exposure to cyclical sectors and industries and to focus on attractively-valued companies that provide reasonable opportunities for earnings growth driven by sales growth and profit margin expansion. We believe that the Federal Reserve Board may be near the end of its cycle of short-term interest rate hikes. As such, we will keep an eye on the banking sector, looking for companies that could experience net margin expansion in an environment of stable to lower interest rates.
We also plan to take advantage of the strength we see in commodity-related industries, if demand for copper, iron ore and aluminum continues to increase. In the capital goods sector, we foresee increased prospects for commercial aerospace fueled by new aircraft demand resulting from growth in emerging market and developed foreign market air traffic.
The fund's top ten holdings (as a percentage of net assets) as of January 31, 2006 were:
| (%) | |||||||
| CIGNA | 1.3 | ||||||
| PG&E | 1.2 | ||||||
| J.C. Penney Co. | 1.2 | ||||||
| Marshall & Illsley | 1.1 | ||||||
| Office Depot | 1.1 | ||||||
| Zions Bancorporation | 1.1 | ||||||
| Williams Companies | 1.1 | ||||||
| Bear Stearns Companies | 1.1 | ||||||
| TJX Companies | 1.1 | ||||||
| Exelon | 1.1 | ||||||
Diane L. Sobin has co-managed the CMG Mid Cap Value Fund since September 2004 and has been with the advisor or its predecessors or affiliate organizations since 2001.

David I. Hoffman has co-managed the fund since September 2004 and has been with the advisor or its predecessors or affiliate organizations since 2001.

24
Lori J. Ensinger has co-managed the fund since September 2004 and has been with the advisor or its predecessors or affiliate organizations since 2001.

Noah J. Petrucci has co-managed the fund since September 2004 and has been with the advisor or its predecessors or affiliate organizations since 2002.

Equity investments are affected by stock market fluctuations that occur in response to economic and business developments.
Investing in mid-cap stocks may present special risks, including possible illiquidity and greater price volatility than stocks of larger, more established companies.
Value stocks are stocks of companies that may have experienced adverse business or industry developments or may be subject to special risks that have caused the stocks to be out of favor and, in the advisor's opinion, undervalued. If the advisor's assessment of a company's prospects is wrong, the price of the company's stock may not approach the value the advisor has placed on it.
1 The Russell Midcap Value Index measures the performance of those Russell Midcap Index companies with lower price-to-book ratios and lower forecasted growth values. The stocks are also members of the Russell 1000 Value index. Unlike the fund, indices are not investments, they do not incur fees or expenses and are not professionally managed. It is not possible to invest directly in indices. Securities in the fund may not match those in an index.
Holdings are calculated as a percentage of net assets, and are subject to change. Because the fund is actively managed, there is no guarantee the fund will continue to maintain the holdings breakdown listed. The fund's holdings and their weights within the portfolio may change as market conditions change.
25
Average annual total return as of January 31, 2006 (%)
| Inception | 6-month (cumulative) | 1-year | Life | ||||||||||||||||
| CMG Mid Cap Value Fund | 05/05/03 | 8.84 | 20.51 | 20.71 | |||||||||||||||
| Russell Midcap Value Index | 6.32 | 20.33 | 26.75 | ||||||||||||||||
Average annual total return as of December 31, 2005 (%)
| Inception | 6-month (cumulative) | 1-year | Life | ||||||||||||||||
| CMG Mid Cap Value Fund | 05/05/03 | 8.40 | 12.67 | 19.21 | |||||||||||||||
| Russell Midcap Value Index | 6.76 | 12.65 | 25.69 | ||||||||||||||||
Index performance is from May 5, 2003.
Performance data quoted represents past performance and current performance may be lower or higher. Past performance is no guarantee of future results. The investment return and principal value will fluctuate so that shares, when redeemed, may be worth more or less than the original cost. Please visit www.columbiamanagement.com for daily and most recent month-end performance updates.
Performance results may reflect any voluntary waivers or reimbursement of fund expenses by the advisor or its affiliates. Absent these reimbursement arrangements, performance results would have been lower. All results shown assume reinvestment of distributions.
Growth of a $10,000 investment, May 5, 2003 to January 31, 2006
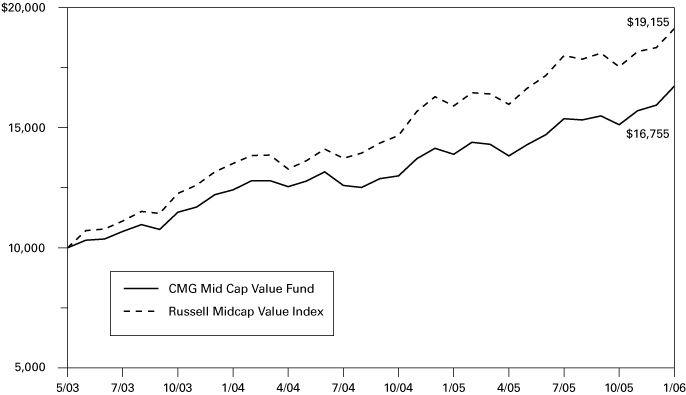
The Russell Midcap Value Index measures the performance of those Russell Midcap Index companies with lower price-to-book ratios and lower forecasted growth values. The stocks are also members of the Russell 1000 Value Index. Unlike the fund, indices are not investments, they do not incur fees or expenses and are not professionally managed. It is not possible to invest directly in indices. Securities in the fund may not match those in an index.
The chart above shows the growth in value of a hypothetical $10,000 investment in the fund compared to the index during the stated time period, and does not reflect the deduction of taxes that a shareholder would pay on fund distributions or the redemption of fund shares.
26
UNDERSTANDING YOUR EXPENSES – CMG Mid Cap Value Fund
As a fund shareholder, you incur two types of costs. There are transaction costs and also ongoing costs, which generally include investment advisory fees and other fund expenses. The information on this page is intended to help you understand your ongoing costs of investing in the fund and to compare these costs with the ongoing costs of investing in other mutual funds.
Analyzing your fund's expenses
To illustrate these ongoing costs, we have provided an example and calculated the expenses paid by investors during the reporting period. The information in the following table is based on an initial investment of $1,000, which is invested at the beginning of the reporting period and held for the entire period. Expense information is calculated two ways and each method provides you with different information. The amount listed in the "actual" column is calculated using the fund's actual operating expenses and total return for the period. The amount listed in the "hypothetical" column assumes that the return each year is 5% before expenses and includes the fund's actual expense ratio. You should not use the hypothetical account values and expenses to estimate either your actual account balance at the end of the period or the expenses you paid during this reporting period.
Estimating your actual expenses
To estimate the expenses that you paid over the period, first you will need your account balance at the end of the period:
1. Divide your ending account balance by $1,000. For example, if an account balance was $8,600 at the end of the period, the result would be 8.6.
2. In the section of the table below titled "Expenses paid during the period," locate the amount under "actual." Multiply this number by the result from step 1. Your answer is an estimate of the expenses you paid on your account during the period.
August 1, 2005 – January 31, 2006
| Account value at the beginning of the period ($) | Account value at the end of the period ($) | Expenses paid during the period ($) | Fund's annualized expense ratio (%) | ||||||||||||||||||||||||||||||||
| Actual | Hypothetical | Actual | Hypothetical | Actual | Hypothetical | ||||||||||||||||||||||||||||||
| 1,000.00 | 1,000.00 | 1,088.37 | 1,021.68 | 3.68 | 3.57 | 0.70 | |||||||||||||||||||||||||||||
Expenses paid during the period are equal to the fund's annualized expense ratio of 0.70%, multiplied by the average account value over the period, then multiplied by the number of days in the fund's most recent fiscal half-year and divided by 365.
Had the Investment Advisor not reimbursed a portion of expenses, total return would have been reduced.
It is important to note that the expense amounts shown in the table are meant to highlight only ongoing costs of investing in the fund and do not reflect any transaction costs, such as sales charges, redemption or exchange fees. Therefore, the hypothetical examples provided may not help you determine the relative total costs of owning shares of different funds. If these transaction costs were included, your costs would have been higher.
27
Compare with other funds
Since all mutual funds are required to include the same hypothetical calculations about expenses in shareholder reports, you can use this information to compare the ongoing cost of investing in the fund with other funds. To do so, compare the 5% hypothetical example with the 5% hypothetical examples that appear in the shareholder reports of other funds. As you compare hypothetical examples of other funds, it is important to note that hypothetical examples are meant to highlight the continuing costs of investing in a fund and do not reflect any transaction costs, such as sales charges or redemption or exchange fees.
28
Performance data quoted represents past performance and current performance may be lower or higher. Past performance is no guarantee of future results. The investment return and principal value will fluctuate so that shares, when redeemed, may be worth more or less than the original cost. Please visit www.columbiamanagement.com most recent daily and month-end performance updates.
CMG SMALL CAP GROWTH FUND
A Portfolio of CMG Fund Trust
MANAGEMENT DISCUSSION OF FUND PERFORMANCE
CMG Small Cap Growth Fund returned 14.74% for the six-month period ended January 31, 2006. For the same period, the Russell 2000 Growth Index1 and the Morningstar Small Growth Category average, returned 10.71% and 9.78%, respectively.2 A new management team took the helm in September and restructured the portfolio. The team's strong stock decisions helped the fund outperform its benchmark and peer group for the period.
In an environment that was generally favorable for small-cap stocks, solid stock picking and an overweight position in the industrials sector enhanced performance. A constructive outlook on machinery stocks warranted the fund's sizeable positions in Terex Corp. and Joy Global, Inc., which benefited from their exposure to mining and construction customers (1.3% and 1.5% of net assets, respectively). Ceradyne, Inc., which develops ceramic products and components, benefited from a ramp up in military orders for body and vehicle armor (1.9% of net assets). On the downside, LECG Corp. fell short of expected productivity and we reduced the fund's position (0.5% of net assets).
Participation in the energy sector—particularly in the energy service group—had a positive impact on fund performance. Atwood Oceanics, Inc., which engages in offshore drilling, and Veritas DGC, Inc., which provides seismic surveying, benefited from healthy spending by exploration and production customers (1.0% and 1.0% of net assets, respectively). A holdover from previous management, Spinnaker Exploration Co., made the greatest contribution in the sector, and we locked in gains and sold the stock from the portfolio.
The information technology sector was strong during the period. F5 Networks, Inc. reported strong results and continued to take share in the Layer 4-7 networking market (1.0% of net assets). In addition, Global Payments, Inc. appreciated on entering into an agreement with another company to access the Asian market (1.3% of net assets). SiRF Technology Holdings, Inc., a supplier of chipsets for global positioning systems for consumer and business applications, also performed well (1.6% of net assets). A setback was Ultratech, Inc., which was inherited from previous management and was sold from the portfolio.
The telecommunications and consumer discretionary sectors provided some standout performers. Millicom International Cellular SA which provides cellular phone service to emerging markets, rose 106% during the period and attracted numerous unsolicited acquisition offers by larger firms seeking entry to its markets (0.9% of net assets). VistaPrint Ltd., which supplies customized printed products for consumers and small businesses and leverages the Internet for delivery, soared 98%, and we remain optimistic about the potential size of its market (1.3% of net assets).
Consumer staples stocks posted a slight decline during the period. Elizabeth Arden, Inc. was sold from the portfolio as excitement around the Britney Spears product line waned and competitors gained market share. USANA Health Sciences, Inc. struggled with concerns about growth rates as its entry to a new foreign market was delayed (0.7% of net assets). The fund also experienced relative weakness in the health care sector, where stocks underperformed. Pharmaceutical companies Nabi Biopharmaceuticals, Rigel Pharmaceuticals, Inc. and Alexion Pharmaceuticals, Inc. suffered from disappointments in clinical development and were sold from the portfolio.
29
We believe that the economy is growing at a healthy rate and that inflation is relatively contained. We are bullish on the energy and materials sectors for long-term structural reasons and continue to hold a number of later-cycle positions in the industrial sector. Accordingly, we are watchful for signs of decelerating growth that could provoke a reassessment of the strength and duration of the current economic expansion. Finally, we believe that the interest rate environment and valuations are supportive of traditional growth stocks relative to value stocks, and we are seeking candidates with strong earnings prospects and attractive valuations.
The fund's top ten holdings (as a percentage of net assets) as of January 31, 2006 were:
| (%) | |||||||
| Affiliated Managers Group | 2.0 | ||||||
| Wabtec | 2.0 | ||||||
| Ceradyne | 1.9 | ||||||
| HealthExtras | 1.6 | ||||||
| SiRF Technology Holdings | 1.6 | ||||||
| Corporate Executive Board | 1.5 | ||||||
| Joy Global | 1.5 | ||||||
| VistaPrint | 1.3 | ||||||
| Terex | 1.3 | ||||||
| Scientific Games | 1.3 | ||||||
Thank you for investing in CMG Small Cap Growth Fund.
Kenneth A. Korngiebel has managed the CMG Small Cap Growth Fund since September 2005 and has been with the advisor or its predecessors of affiliate organizations since 1996.

Equity investments are affected by stock market fluctuations that occur in response to economic and business developments.
Investing in growth stocks incurs the possibility of losses because their prices are sensitive to changes in current or expected earnings.
Investments in small-cap stocks may be subject to greater volatility and price fluctuations because they may be thinly traded and less liquid than investments in larger companies.
1 The Russell 2000 Growth Index measures the performance of those Russell 2000 Index companies with higher price-to-book ratios and higher forecasted growth values. Unlike the fund, indices are not investments, they do not incur fees or expenses and are not professionally managed. It is not possible to invest directly in an index. Securities in the fund may not match those in an index.
2 ©2006 by Morningstar, Inc. All rights reserved. The information contained herein is the proprietary information of Morningstar, Inc., may not be copied or redistributed for any purpose and may only be used for noncommercial, personal purposes. The information contained herein is not represented or warranted to be accurate, correct, complete or timely. Morningstar, Inc. shall not be responsible for investment decisions, damages or other losses resulting from the use of this information. Past performance is no guarantee of future performance. Morningstar, Inc. has not granted consent for it to be considered or deemed an "expert" under the Securities Act of 1933.
Morningstar Categories compare the performance of funds with similar investment objectives and strategies.
Holdings are calculated as a percentage of net assets, and are subject to change. Because the fund is actively managed, there is no guarantee the fund will continue to maintain the holdings breakdown listed. The fund's holdings and their weights within the portfolio may change as market conditions change.
30
Average annual total return as of January 31, 2006 (%)
| Inception | 6-month (cumulative) | 1-year | Life | ||||||||||||||||
| CMG Small Cap Growth Fund | 05/05/03 | 14.74 | 24.27 | 22.65 | |||||||||||||||
| Russell 2000 Growth Index | 10.71 | 19.59 | 23.52 | ||||||||||||||||
Average annual total return as of December 31, 2005 (%)
| Inception | 6-month (cumulative) | 1-year | Life | ||||||||||||||||
| CMG Small Cap Growth Fund | 05/05/03 | 10.10 | 6.02 | 18.76 | |||||||||||||||
| Russell 2000 Growth Index | 8.02 | 4.15 | 20.12 | ||||||||||||||||
Index performance is from May 5, 2003.
Performance data quoted represents past performance and current performance may be lower or higher. Past performance is no guarantee of future results. The investment return and principal value will fluctuate so that shares, when redeemed, may be worth more or less than the original cost. Please visit www.columbiamanagement.com for daily and most recent month-end performance updates.
Performance results may reflect any voluntary waivers or reimbursement of fund expenses by the advisor or its affiliates. Absent these reimbursement arrangements, performance results would have been lower. All results shown assume reinvestment of distributions.
Growth of a $10,000 investment, May 5, 2003 to January 31, 2006
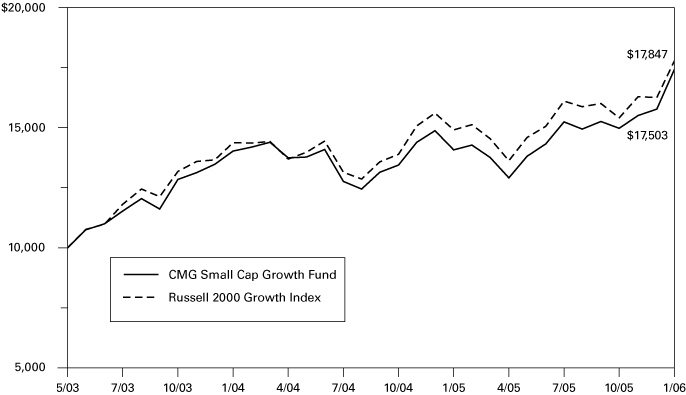
The Russell 2000 Growth Index measures the performance of those Russell 2000 Index companies with higher price-to-book ratios and higher forecasted growth values. Unlike the fund, indices are not investments, they do not incur fees or expenses and are not professionally managed. It is not possible to invest directly in an index. Securities in the fund may not match those in an index.
The chart above shows the growth in value of a hypothetical $10,000 investment in the fund compared to the index during the stated time period, and does not reflect the deduction of taxes that a shareholder would pay on fund distributions or the redemption of fund shares.
31
UNDERSTANDING YOUR EXPENSES — CMG Small Cap Growth Fund
As a fund shareholder, you incur two types of costs. There are transaction costs and also ongoing costs, which generally include investment advisory fees and other fund expenses. The information on this page is intended to help you understand your ongoing costs of investing in the fund and to compare these costs with the ongoing costs of investing in other mutual funds.
Analyzing your fund's expenses
To illustrate these ongoing costs, we have provided an example and calculated the expenses paid by investors during the reporting period. The information in the following table is based on an initial investment of $1,000, which is invested at the beginning of the reporting period and held for the entire period. Expense information is calculated two ways and each method provides you with different information. The amount listed in the "actual" column is calculated using the fund's actual operating expenses and total return for the period. The amount listed in the "hypothetical" column assumes that the return each year is 5% before expenses and includes the fund's actual expense ratio. You should not use the hypothetical account values and expenses to estimate either your actual account balance at the end of the period or the expenses you paid during this reporting period.
Estimating your actual expenses
To estimate the expenses that you paid over the period, first you will need your account balance at the end of the period:
1. Divide your ending account balance by $1,000. For example, if an account balance was $8,600 at the end of the period, the result would be 8.6.
2. In the section of the table below titled "Expenses paid during the period," locate the amount under "actual." Multiply this number by the result from step 1. Your answer is an estimate of the expenses you paid on your account during the period.
August 1, 2005 – January 31, 2006
| Account value at the beginning of the period ($) | Account value at the end of the period ($) | Expenses paid during the period ($) | Fund's annualized expense ratio (%) | ||||||||||||||||||||||||||||
| Actual | Hypothetical | Actual | Hypothetical | Actual | Hypothetical | ||||||||||||||||||||||||||
| 1,000.00 | 1,000.00 | 1,147.40 | 1,021.17 | 4.33 | 4.08 | 0.80 | |||||||||||||||||||||||||
Expenses paid during the period are equal to the fund's annualized expense ratio of 0.80%, multiplied by the average account value over the period, then multiplied by the number of days in the fund's most recent fiscal half-year and divided by 365.
Had the Investment Advisor not reimbursed a portion of expenses, total return would have been reduced.
It is important to note that the expense amounts shown in the table are meant to highlight only ongoing costs of investing in the fund and do not reflect any transaction costs, such as sales charges, redemption or exchange fees. Therefore, the hypothetical examples provided may not help you determine the relative total costs of owning shares of different funds. If these transaction costs were included, your costs would have been higher.
32
Compare with other funds
Since all mutual funds are required to include the same hypothetical calculations about expenses in shareholder reports, you can use this information to compare the ongoing cost of investing in the fund with other funds. To do so, compare the 5% hypothetical example with the 5% hypothetical examples that appear in the shareholder reports of other funds. As you compare hypothetical examples of other funds, it is important to note that hypothetical examples are meant to highlight the continuing costs of investing in a fund and do not reflect any transaction costs, such as sales charges or redemption or exchange fees.
33
Performance data quoted represents past performance and current performance may be lower or higher. Past performance is no guarantee of future results. The investment return and principal value will fluctuate so that shares, when redeemed, may be worth more or less than the original cost. Please visit www.columbiamanagement.com for daily and most recent month-end performance updates.
CMG SMALL CAP VALUE FUND
A Portfolio of CMG Fund Trust
MANAGEMENT DISCUSSION OF FUND PERFORMANCE
CMG Small Cap Value Fund returned 9.38% for the six-month period ended January 31, 2006. The fund outperformed its benchmark, the Russell 2000 Value Index1, which returned 6.31%. Its return was also higher than the average return of the Morningstar Small Value Category, which was 6.64% over the same period.2 Strong stock selection among financials, technology and energy aided performance relative to these competitive measures.
Small-cap stocks gained momentum during the six-month reporting period, as relatively low interest rates, a pickup in capital markets activity and sustained economic growth instilled investor confidence in the small-cap portion of the market. The fund's solid performance was indicative of these trends.
Stock selection within the financials sector aided relative performance. Standouts for the period included Argonaut Group, Inc., a little known Texas-based property and casualty insurer, which rallied amid expectations of improved industry pricing following the Gulf Coast hurricanes (0.4% of net assets). In the banking sector, the fund benefited from focusing on commercial lenders, which tend to be less vulnerable to rising interest rates than thrifts or more retail-oriented banks. The group's top performer for the period was KHD Humboldt Wedag International Ltd., a Hong-Kong based financial institution that specializes in corporate banking services (0.9% of net assets). The fund also did well to underweight real estate investment trusts, which faltered as short-term interest rates rose.
The fund's technology holdings also contributed to its above-index return. Winners included Brightpoint, Inc., a leading distributor of cell phones, which rose sharply as strong revenues and earnings gains attracted growing investor attention (1.0% of net assets). The fund also profited from its overweight in semiconductor chip and semiconductor capital stocks, which posted sizable gains fueled by dwindling inventories, accelerating production and improved pricing. Among chip makers, MEMC Electronic Materials, Inc. and Standard Microsystems Corp. were the fund's top performers (0.4% and 0.7% of net assets, respectively). MEMC supplies silicon wafers to some of the world's leading semiconductor makers and Standard Microsystems makes input/output chips used by leading computer manufacturers.
The energy sector was another source of strong performance for the fund. We had more exposure than the index to energy, which was one of the market's strongest performers throughout 2005. Strong stock selection within energy also aided return. As record commodity prices fueled sharp sector gains, we shifted away from exploration and production companies and toward energy service companies that we believed could benefit as capital spending increases. Lufkin Industries, Inc., which sells a diversified line of pumps and components, did particularly well (1.1% of net assets). In addition, the fund had a bias toward coal producers whose stock valuations seemed attractive and which did well during the period.
34
The fund gave up some ground relative to the index with its health care holdings. It did not have as much exposure as the index to biotechnology and specialty pharmaceutical stocks, which climbed sharply on new product announcements. We avoided both industries as a matter of policy. Neither met our investment criteria, which emphasizes earnings growth potential. In that regard, the fund owned less volatile stocks, which did not fare as well as the higher-risk segments of the sector. However, we believe our approach to health care is a more prudent strategy over the long term.
Going forward, we believe that small-cap stocks have the potential to keep pace with the overall stock market even though they may no longer have a valuation advantage over large-cap stocks. We have positioned the fund with a bias toward technology and capital goods companies and away from sectors that have historically been vulnerable to a slowdown in consumer spending. Within those sectors, we plan to stay focused on higher quality companies with the potential to grow their businesses and earnings in any market environment.
The fund's top ten holdings (as a percentage of net assets) as of January 31, 2006 were:
| (%) | |||||||
| Watsco | 1.3 | ||||||
| Lufkin Industries | 1.1 | ||||||
| Harsco | 1.0 | ||||||
| Eagle Materials | 1.0 | ||||||
| Brightpoint | 1.0 | ||||||
| Precision Castparts | 1.0 | ||||||
| Pediatrix Medical Group | 0.9 | ||||||
| KHD Humboldt Wedag International | 0.9 | ||||||
| MPS Group | 0.9 | ||||||
| Range Resources | 0.9 | ||||||
Thank you for investing in CMG Small Cap Value Fund.
Stephen Barbaro has managed or co-managed the CMG Small Cap Value Fund since the fund's inception and has been with the advisor or its predecessors or affiliate organizations since 1976.

Jeremy Javidi has co-managed the fund since August 2005 and has been with the advisor or its predecessors or affiliate organizations since January 2000.

35
Equity investments are affected by stock market fluctuations that occur in response to economic and business developments.
Investments in small-cap stocks may be subject to greater volatility and price fluctuations because they may be thinly traded and less liquid than investments in larger companies.
Value stocks are stocks of companies that may have experienced adverse business or industry developments or may be subject to special risks that have caused the stocks to be out of favor and, in the advisor's opinion, undervalued. If the advisor's assessment of a company's prospects is wrong, the price of the company's stock may not approach the value the advisor has placed on it.
1 The Russell 2000 Value Index tracks the performance of those Russell 2000 Index companies with lower price-to-book ratios and lower forecasted growth values. The Russell 2000 Index is an unmanaged index that tracks the performance of the 2,000 smallest of the 3,000 largest U.S. companies based on market capitalization. Unlike the fund, indices are not investments, they do not incur fees or expenses and are not professionally managed. It is not possible to invest directly in indices. Securities in the fund may not match those in an index.
2 ©2006 by Morningstar, Inc. All rights reserved. The information contained herein is the proprietary information of Morningstar, Inc., may not be copied or redistributed for any purpose and may only be used for noncommercial, personal purposes. The information contained herein is not represented or warranted to be accurate, correct, complete or timely. Morningstar, Inc. shall not be responsible for investment decisions, damages or other losses resulting from the use of this information. Past performance is no guarantee of future performance. Morningstar, Inc. has not granted consent for it to be considered or deemed an "expert" under the Securities Act of 1933.
Morningstar Categories compare the performance of funds with similar investment objectives and strategies.
Holdings are calculated as a percentage of net assets, and are subject to change. Because the fund is actively managed, there is no guarantee the fund will continue to maintain the holdings breakdown listed. The fund's holdings and their weights within the portfolio may change as market conditions change.
36
Average annual total return as of January 31, 2006 (%)
| Inception | 6-month (cumulative) | 1-year | Life | ||||||||||||||||
| CMG Small Cap Value Fund | 05/05/03 | 9.38 | 18.86 | 26.84 | |||||||||||||||
| Russell 2000 Value Index | 6.31 | 17.93 | 26.42 | ||||||||||||||||
| Russell 2000 Index | 8.50 | 18.89 | 25.07 | ||||||||||||||||
Average annual total return as of December 31, 2005 (%)
| Inception | 6-month (cumulative) | 1-year | Life | ||||||||||||||||
| CMG Small Cap Value Fund | 05/05/03 | 6.78 | 5.80 | 24.00 | |||||||||||||||
| Russell 2000 Value Index | 3.78 | 4.71 | 23.62 | ||||||||||||||||
| Russell 2000 Index | 5.88 | 4.55 | 21.96 | ||||||||||||||||
Index performance is from May 5, 2003.
Performance data quoted represents past performance and current performance may be lower or higher. Past performance is no guarantee of future results. The investment return and principal value will fluctuate so that shares, when redeemed, may be worth more or less than the original cost. Please visit www.columbiamanagement.com for daily and most recent month-end performance updates.
Performance results may reflect any voluntary waivers or reimbursement of fund expenses by the advisor or its affiliates. Absent these waivers or reimbursement arrangements, performance results would have been lower. All results shown assume reinvestment of distributions.
Growth of a $10,000 investment, May 5, 2003 to January 31, 2006
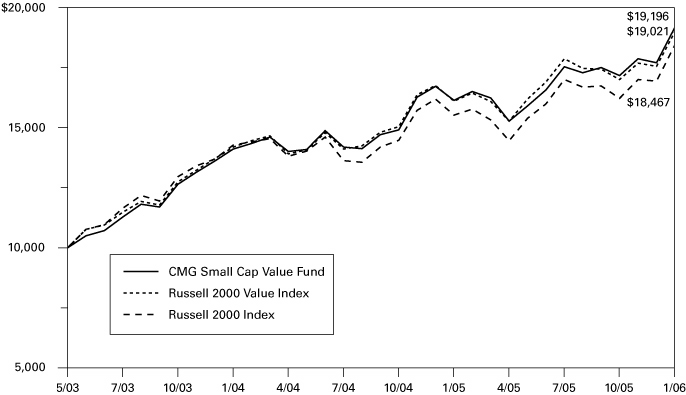
The Russell 2000 Value index tracks the performance of those Russell 2000 Index companies with lower price-to-book ratios and lower forecasted growth values. The Russell 2000 Index tracks the performance of the 2000 smallest of the 3,000 largest U.S. companies based on market capitalization. Unlike the fund, indices are not investments, they do not incur fees or expenses and are not professionally managed. It is not possible to invest directly in indices. Securities in the fund may not match those in an index.
The chart above shows the growth in value of a hypothetical $10,000 investment in the fund compared to the indices during the stated time period, and does not reflect the deduction of taxes that a shareholder would pay on fund distributions or the redemption of fund shares.
37
UNDERSTANDING YOUR EXPENSES — CMG Small Cap Value Fund
As a fund shareholder, you incur two types of costs. There are transaction costs and also ongoing costs, which generally include investment advisory fees and other fund expenses. The information on this page is intended to help you understand your ongoing costs of investing in the fund and to compare these costs with the ongoing costs of investing in other mutual funds.
Analyzing your fund's expenses
To illustrate these ongoing costs, we have provided an example and calculated the expenses paid by investors during the reporting period. The information in the following table is based on an initial investment of $1,000, which is invested at the beginning of the reporting period and held for the entire period. Expense information is calculated two ways and each method provides you with different information. The amount listed in the "actual" column is calculated using the fund's actual operating expenses and total return for the period. The amount listed in the "hypothetical" column assumes that the return each year is 5% before expenses and includes the fund's actual expense ratio. You should not use the hypothetical account values and expenses to estimate either your actual account balance at the end of the period or the expenses you paid during this reporting period.
Estimating your actual expenses
To estimate the expenses that you paid over the period, first you will need your account balance at the end of the period:
1. Divide your ending account balance by $1,000. For example, if an account balance was $8,600 at the end of the period, the result would be 8.6.
2. In the section of the table below titled "Expenses paid during the period," locate the amount under "actual." Multiply this number by the result from step 1. Your answer is an estimate of the expenses you paid on your account during the period.
August 1, 2005 – January 31, 2006
| Account value at the beginning of the period ($) | Account value at the end of the period ($) | Expenses paid during the period ($) | Fund's annualized expense ratio (%) | ||||||||||||||||||||||||||||
| Actual | Hypothetical | Actual | Hypothetical | Actual | Hypothetical | ||||||||||||||||||||||||||
| 1,000.00 | 1,000.00 | 1,093.81 | 1,021.17 | 4.22 | 4.08 | 0.80 | |||||||||||||||||||||||||
Expenses paid during the period are equal to the fund's annualized expense ratio of 0.80%, multiplied by the average account value over the period, then multiplied by the number of days in the fund's most recent fiscal half-year and divided by 365.
Had the Investment Advisor not reimbursed a portion of expenses, total return would have been reduced.
It is important to note that the expense amounts shown in the table are meant to highlight only ongoing costs of investing in the fund and do not reflect any transaction costs, such as sales charges, redemption or exchange fees. Therefore, the hypothetical examples provided may not help you determine the relative total costs of owning shares of different funds. If these transaction costs were included, your costs would have been higher.
38
Compare with other funds
Since all mutual funds are required to include the same hypothetical calculations about expenses in shareholder reports, you can use this information to compare the ongoing cost of investing in the fund with other funds. To do so, compare the 5% hypothetical example with the 5% hypothetical examples that appear in the shareholder reports of other funds. As you compare hypothetical examples of other funds, it is important to note that hypothetical examples are meant to highlight the continuing costs of investing in a fund and do not reflect any transaction costs, such as sales charges or redemption or exchange fees.
39
Performance data quoted represents past performance and current performance may be lower or higher. Past performance is no guarantee of future results. The investment return and principal value will fluctuate so that shares, when redeemed, may be worth more or less than the original cost. Please visit www.columbiamanagement.com for daily and most recent month-end performance updates.
CMG SMALL/MID CAP FUND
A Portfolio of CMG Fund Trust
MANAGEMENT DISCUSSION OF FUND PERFORMANCE
CMG Small/Mid Cap Fund returned 16.65% for the six-month period ended January 31, 2006, outpacing both the Russell 2500 Growth Index and the Russell 2500 Index1, which returned 10.29% and 7.96%, respectively. The fund also surpassed the average return of the Morningstar Mid-Cap Growth Category, which was 10.59%2 for the same period.
In an environment that was generally favorable for small- and mid-cap stocks, stock selection across a variety of sectors aided returns. Within information technology, Micromuse, Inc. advanced 75% during the period on news of its acquisition. Broadcom Corp. benefited from several design wins in high volume markets and an ability to maintain higher-than-expected gross margins that translated into strong profit growth (1.2% of net assets). Broadcom makes integrated circuits, which are used for digital set-top boxes, cable modems, servers and local-area and home networking gear. Semiconductor designer Marvell Technology Group Ltd. continued to dominate its markets and grow at rates that surpassed investor expectations (1.0% of net assets). SiRF Technology Holdings Inc., a supplier of chipsets for global positioning systems for consumer and business applications, also performed well (1.0% of net assets). Ixia was a disappointment, f alling 36% as orders slipped (0.5% of net assets). We used this opportunity to add to the fund's position in the stock because we believe that long-term prospects remain compelling.
Stock selection and an overweight position in the industrials sector also enhanced performance. A constructive outlook on machinery stocks warranted the fund's sizeable positions in Terex Corp. and Joy Global, Inc., which benefited from their exposure to mining and construction customers (1.5% and 1.5% of net assets, respectively). Ceradyne, Inc., which develops ceramic products and components, benefited from a ramp up in military orders for body and vehicle armor (1.9% of net assets).
The health care sector was another area of outperformance. Amylin Pharmaceuticals, Inc., surged as Byetta, a new drug treating patients with type-2 diabetes, experienced strong initial demand (0.7% of net assets). HealthExtras, Inc., a pharmacy benefits manager, continued to win new business from its larger competitors (1.6% of net assets). On the downside, we sold Kinetic Concepts, Inc. as litigation issues, slower growth and higher expenses took a toll on profit growth.
Participation in the energy sector had a positive impact on fund performance. Southwestern Energy Co. benefited from high natural gas prices, and Arch Coal, Inc.'s performance received a boost from its production out of the Powder River Basin (0.9% and 0.7% of net assets, respectively). We sold Teekay Shipping Corp. from the portfolio on concerns about future incremental supply of tankers.
The fund experienced losses in the consumer staples and consumer discretionary sectors. Corn Products International, Inc. suffered from reduced profit expectations and was sold from the portfolio, and Tyson Foods, Inc. struggled to improve margins (0.2% of net assets). XM Satellite Radio Holdings, Inc. (0.8% of net assets) declined as investors worried about the competitive impact from Sirius Satellite Radio, Inc. We sold Tempur-Pedic International, Inc. from the portfolio due to concerns about competitive pricing that could lead to slower profit growth. A bright spot was VistaPrint Ltd., a supplier of customized printed products for consumers and small businesses (0.9% of net assets). The stock soared 98%, and we are optimistic about the size of its potential market.
We continue to believe that the economy is growing at a healthy rate and that inflation is relatively contained. We remain bullish on the energy and materials sectors for long-term
40
structural reasons and continue to hold a number of later-cycle positions in the industrial sector. Accordingly, we are watchful for signs of decelerating growth that could provoke a reassessment of the strength and duration of the current economic expansion. Finally, we believe that the interest rate environment and valuations are supportive of traditional growth stocks relative to value stocks, and we continue to seek candidates with strong earnings prospects and attractive valuations.
The fund's top ten holdings (as a percentage of net assets) as of January 31, 2006 were:
| (%) | |||||||
| Ceradyne | 1.9 | ||||||
| Affiliated Managers Group | 1.7 | ||||||
| HealthExtras | 1.6 | ||||||
| Joy Global | 1.5 | ||||||
| Terex | 1.5 | ||||||
| Wabtec | 1.4 | ||||||
| Potash Corp. of Saskatchewan | 1.3 | ||||||
| Broadcom | 1.2 | ||||||
| Euronet Worldwide | 1.2 | ||||||
| Chico's FAS | 1.1 | ||||||
We appreciate your continued confidence in the CMG Small/Mid Cap Fund.
Kenneth A. Korngiebel has managed the CMG Small/Mid Cap Fund since June 2004 and has been with the advisor or its predecessors or affiliate organizations since 1996.

Equity investments are affected by stock market fluctuations that occur in response to economic and business developments.
Investing in growth stocks incurs the possibility of losses because their prices are sensitive to changes in current or expected earnings.
Investments in small- and mid-cap stocks may present special risks. They tend to be more volatile and may be less liquid than the stocks of larger companies. Small-cap stocks often have narrower markets, limited financial resources and tend to be more thinly traded than stocks of larger companies.
1 The Russell 2500 Growth Index measures the performance of those Russell 2500 Index companies with higher price-to-book ratios and higher forecasted growth values. The Russell 2500 Index tracks the performance of the 2,500 smallest companies of the Russell 3000 Index. Unlike the fund, indices are not investments, they do not incur fees or expenses and are not professionally managed. It is not possible to invest directly in an index. Securities in the fund may not match those in an index.
2 ©2006 by Morningstar, Inc. All rights reserved. The information contained herein is the proprietary information of Morningstar, Inc., may not be copied or redistributed for any purpose and may only be used for noncommercial, personal purposes. The information contained herein is not represented or warranted to be accurate, correct, complete or timely. Morningstar, Inc. shall not be responsible for investment decisions, damages or other losses resulting from the use of this information. Past performance is no guarantee of future performance. Morningstar, Inc. has not granted consent for it to be considered or deemed an "expert" under the Securities Act of 1933.
Morningstar Categories compare the performance of funds with similar investment objectives and strategies.
Holdings are calculated as a percentage of net assets, and are subject to change. Because the fund is actively managed, there is no guarantee the fund will continue to maintain the holdings breakdown listed. The fund's holdings and their weights within the portfolio may change as market conditions change.
41
Average annual total return as of January 31, 2006 (%)
| Inception | 6-month (cumulative) | 1-year | 5-year | Life | |||||||||||||||||||
| CMG Small/Mid Cap Fund | 12/01/00 | 16.65 | 31.54 | 4.45 | 5.83 | ||||||||||||||||||
| Russell 2500 Growth Index | 10.29 | 20.62 | 2.99 | 5.36 | |||||||||||||||||||
| Russell 2500 Index | 7.96 | 19.78 | 9.93 | 12.05 | |||||||||||||||||||
Average annual total return as of December 31, 2005 (%)
| Inception | 6-month (cumulative) | 1-year | 5-year | Life | |||||||||||||||||||
| CMG Small/Mid Cap Fund | 12/01/00 | 12.43 | 15.76 | 2.30 | 3.87 | ||||||||||||||||||
| Russell 2500 Growth Index | 9.18 | 8.17 | 2.78 | 3.95 | |||||||||||||||||||
| Russell 2500 Index | 6.78 | 8.11 | 9.14 | 10.76 | |||||||||||||||||||
Index performance is from December 1, 2000.
Performance data quoted represents past performance and current performance may be lower or higher. Past performance is no guarantee of future results. The investment return and principal value will fluctuate so that shares, when redeemed, may be worth more or less than the original cost. Please visit www.columbiamanagement.com for daily and most recent month-end performance updates.
Performance results may reflect any reimbursement of fund expenses by the advisor or its affiliates. Absent these reimbursement arrangements, performance results would have been lower. All results shown assume reinvestment of distributions.
Growth of a $10,000 investment, December 1, 2000 to January 31, 2006

The Russell 2500 Growth Index measures the performance of those Russell 2500 Index companies with higher price-to-book ratios and higher forecasted growth values. The Russell 2500 Index tracks the performance of the 2,500 smallest companies of the Russell 3000 Index. Unlike the fund, indices are not investments, they do not incur fees or expenses and are not professionally managed. It is not possible to invest directly in indices. Securities in the fund may not match those in an index.
The chart above shows the growth in value of a hypothetical $10,000 investment in the fund compared to the indices during the stated time period, and does not reflect the deduction of taxes that a shareholder would pay on fund distributions or the redemption of fund shares.
42
UNDERSTANDING YOUR EXPENSES — CMG Small/Mid Cap Fund
As a fund shareholder, you incur two types of costs. There are transaction costs and also ongoing costs, which generally include investment advisory fees and other fund expenses. The information on this page is intended to help you understand your ongoing costs of investing in the fund and to compare these costs with the ongoing costs of investing in other mutual funds.
Analyzing your fund's expenses
To illustrate these ongoing costs, we have provided an example and calculated the expenses paid by investors during the reporting period. The information in the following table is based on an initial investment of $1,000, which is invested at the beginning of the reporting period and held for the entire period. Expense information is calculated two ways and each method provides you with different information. The amount listed in the "actual" column is calculated using the fund's actual operating expenses and total return for the period. The amount listed in the "hypothetical" column assumes that the return each year is 5% before expenses and includes the fund's actual expense ratio. You should not use the hypothetical account values and expenses to estimate either your actual account balance at the end of the period or the expenses you paid during this reporting period.
Estimating your actual expenses
To estimate the expenses that you paid over the period, first you will need your account balance at the end of the period:
1. Divide your ending account balance by $1,000. For example, if an account balance was $8,600 at the end of the period, the result would be 8.6.
2. In the section of the table below titled "Expenses paid during the period," locate the amount under "actual." Multiply this number by the result from step 1. Your answer is an estimate of the expenses you paid on your account during the period.
August 1, 2005 – January 31, 2006
| Account value at the beginning of the period ($) | Account value at the end of the period ($) | Expenses paid during the period ($) | Fund's annualized expense ratio (%) | ||||||||||||||||||||||||||||
| Actual | Hypothetical | Actual | Hypothetical | Actual | Hypothetical | ||||||||||||||||||||||||||
| 1,000.00 | 1,000.00 | 1,166.56 | 1,021.42 | 4.10 | 3.82 | 0.75 | |||||||||||||||||||||||||
Expenses paid during the period are equal to the fund's annualized expense ratio of 0.75%, multiplied by the average account value over the period, then multiplied by the number of days in the fund's most recent fiscal half-year and divided by 365.
Had the Investment Advisor not reimbursed a portion of expenses, total return would have been reduced.
It is important to note that the expense amounts shown in the table are meant to highlight only ongoing costs of investing in the fund and do not reflect any transaction costs, such as sales charges, redemption or exchange fees. Therefore, the hypothetical examples provided may not help you determine the relative total costs of owning shares of different funds. If these transaction costs were included, your costs would have been higher.
43
Compare with other funds
Since all mutual funds are required to include the same hypothetical calculations about expenses in shareholder reports, you can use this information to compare the ongoing cost of investing in the fund with other funds. To do so, compare the 5% hypothetical example with the 5% hypothetical examples that appear in the shareholder reports of other funds. As you compare hypothetical examples of other funds, it is important to note that hypothetical examples are meant to highlight the continuing costs of investing in a fund and do not reflect any transaction costs, such as sales charges or redemption or exchange fees.
44
Performance data quoted represents past performance and current performance may be lower or higher. Past performance is no guarantee of future results. The investment return and principal value will fluctuate so that shares, when redeemed, may be worth more or less than the original cost. Please visit www.columbiamanagement.com for most recent daily and month-end performance updates.
CMG INTERNATIONAL STOCK FUND
A Portfolio of CMG Fund Trust
MANAGEMENT DISCUSSION OF FUND PERFORMANCE
For the six-month period ended January 31, 2006, CMG International Stock Fund returned 19.30%. It outperformed the MSCI EAFE Index1, which posted an 18.31% return during the period, but underperformed the average return of the Morningstar Foreign Large Blend Category, which was 19.43%.2 The fund's out-of-benchmark weight in emerging markets aided relative performance, as emerging markets outperformed all other global markets during the six months. The portfolio also benefited from an above-index weight in Japan, the best-performing developed market.
Throughout 2005, we saw a marked improvement in investor sentiment toward Japan, as the re-election of Prime Minister Koizumi lifted hopes for economic reforms. The portfolio's two top performers were Japanese stocks Komatsu Ltd., a manufacturer of heavy equipment, and Yamada Denki Co., Ltd. a consumer electronics retailer (0.9% and 0.6% of net assets, respectively). We invested in Komatsu because we believed that the market had underestimated the company's growth potential from a recovery in infrastructure spending from incremental orders for US highway construction projects. We were drawn to Yamada Denki because of its good brand recognition, superior business model and industry bargaining power. We also believed that the company's potential for cash-flow generation was underappreciated by the market.
The fund's performance was also aided by a decision to underweight the United Kingdom (UK). A relatively tight monetary policy had a negative impact on UK stocks and the UK was one of the worst-performing markets for the period.
As international markets moved higher, prices on certain stocks were bid up well beyond what we believed they deserved on the basis of their earnings potential. As a result, our focus on stocks with attractive valuations, which is a key component of the fund's investment strategy, kept us out of some big performers. Softbank Corp., a Japanese Internet incubator company, is an example of a stock that looked expensive, but which had tremendous performance for the index. We did not own steel companies, which rallied because of strong demand from China. An underweight in materials also held back return, as did stock selection within the sector.
On a more positive note, paring back the energy position and locking in gains before energy prices began to decline boosted performance. EnCana Corp., one of the largest oil and gas exploration companies in North America was particularly strong through September, but then sold off sharply for the remainder of the period (0.5% of net assets). The company's annual production growth and operating margins were substantially above its industry peers, and it was rewarded with a significantly higher return.
45
Other individual contributors included CapitaLand Ltd., a Singapore-based real estate company, which benefited from property price inflation throughout Asia, and Atlas Copco AB, a Swedish industrial company, which was buoyed by strong global demand for machinery and mining equipment (0.7% and 0.7% of net assets, respectively).
We believe that relatively low global interest rates, modest inflation and continued global economic growth has the potential to support the equity markets over the next several months. We think that the emerging markets may continue to have some of the best opportunities for growth and we plan to maintain the fund's out-of-benchmark weight in that sector. After the dollar's strong run-up in 2005, we believe that it could decline over the next several months. A lower dollar should be positive for US-based investors, because the value of their investments would be enhanced when converted back to a weaker currency.
The fund's top ten holdings and countries (as a percentage of net assets) as of January 31, 2006 were:
| Holdings | (%) | Countries | (%) | ||||||||||||
| Nestle | 1.9 | Japan | 27.2 | ||||||||||||
| BP | 1.8 | United Kingdom | 16.8 | ||||||||||||
| Toyota Motor | 1.8 | France | 9.0 | ||||||||||||
| Total | 1.7 | Germany | 8.9 | ||||||||||||
| E.ON | 1.6 | Switzerland | 7.5 | ||||||||||||
| ENI | 1.6 | Spain | 3.1 | ||||||||||||
| Banco Bilbao Vizcaya Argentaria | 1.5 | Sweden | 2.9 | ||||||||||||
| Barclays | 1.5 | Finland | 2.9 | ||||||||||||
| Nokia | 1.4 | Norway | 2.7 | ||||||||||||
| BASF | 1.4 | Singapore | 2.4 | ||||||||||||
We appreciate your continued confidence in the CMG International Stock Fund.
Fred Copper has managed or co-managed the CMG International Stock Fund since October 2005 and has been with the advisor or its predecessors since 2005.

Equity investments are affected by stock market fluctuations that occur in response to economic and business developments.
International investing involves special risks, including foreign taxation, currency fluctuation, risks associated with possible differences in financial standards and other monetary and political risks.
A concentration of investments in a specific sector, such as the technology sector, may cause the fund to experience increased volatility.
46
1 The Morgan Stanley Capital International (MSCI) Europe, Australasia, Far East (EAFE) Index is a free float-adjusted market capitalization index that is designed to measure developed market equity performance, excluding the US and Canada. The Morgan Stanley Capital International (MSCI) All Country (AC) World ex U.S. Index is an unmanaged index of global stock market performance that includes developed and emerging markets but excludes the U.S. Unlike the fund, indices are not investments, they do not incur fees or expenses and are not professionally managed. It is not possible to invest directly in an index. Securities in the fund may not match those in an index.
2 ©2006 by Morningstar, Inc. All rights reserved. The information contained herein is the proprietary information of Morningstar, Inc., may not be copied or redistributed for any purpose and may only be used for noncommercial, personal purposes. The information contained herein is not represented or warranted to be accurate, correct, complete or timely. Morningstar, Inc. shall not be responsible for investment decisions, damages or other losses resulting from the use of this information. Past performance is no guarantee of future performance. Morningstar, Inc. has not granted consent for it to be considered or deemed an "expert" under the Securities Act of 1933.
Morningstar Categories compare the performance of funds with similar investment objectives and strategies.
Holdings and country breakdowns are disclosed as a percentage of net assets, and are subject to change. Because the fund is actively managed, there is no guarantee the fund will continue to maintain the holdings and country breakdown listed. The fund's holdings and their weights within the portfolio may change as market conditions change.
47
Average annual total return as of January 31, 2006 (%)
| Inception | 6-month (cumulative) | 1-year | 5-year | 10-year | |||||||||||||||||||
| CMG International Stock Fund | 02/01/94 | 19.30 | 23.15 | 5.13 | 8.12 | ||||||||||||||||||
| MSCI EAFE Index | 18.31 | 22.76 | 5.82 | 6.43 | |||||||||||||||||||
| MSCI All Country World ex US Index | 20.44 | 27.47 | 7.79 | 7.27 | |||||||||||||||||||
Average annual total return as of December 31, 2005 (%)
| Inception | 6-month (cumulative) | 1-year | 5-year | 10-year | |||||||||||||||||||
| CMG International Stock Fund | 02/01/94 | 15.61 | 12.82 | 3.61 | 7.64 | ||||||||||||||||||
| MSCI EAFE Index | 14.88 | 13.54 | 4.55 | 5.84 | |||||||||||||||||||
| MSCI All Country World ex US Index | 16.74 | 17.11 | 6.66 | 6.70 | |||||||||||||||||||
Performance data quoted represents past performance and current performance may be lower or higher. Past performance is no guarantee of future results. The investment return and principal value will fluctuate so that shares, when redeemed, may be worth more or less than the original cost. Please visit www.columbiamanagement.com for daily and most recent month-end performance updates.
Performance results may reflect any voluntary waivers or reimbursement of fund expenses by the advisor or its affiliates. Absent these waivers or reimbursement arrangements, performance results would have been lower. All results shown assume reinvestment of distributions.
Growth of a $10,000 investment, February 1, 1996 to January 31, 2006
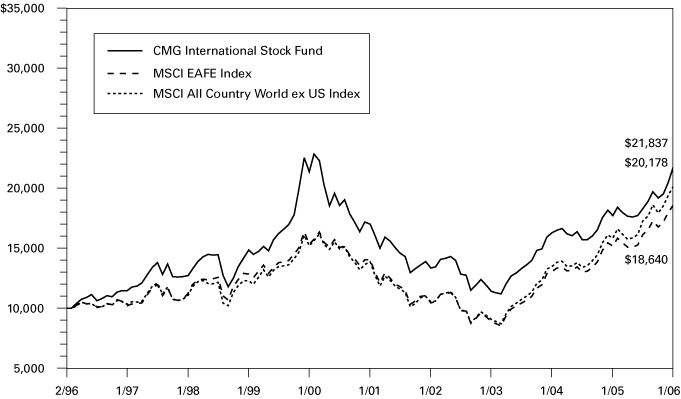
The Morgan Stanley Capital International (MSCI) Europe, Australasia, Far East (EAFE) Index is a free float-adjusted market capitalization index that is designed to measure developed market equity performance, excluding the US and Canada. The Morgan Stanley Capital International (MSCI) All Country (AC) World ex U.S. Index is an unmanaged index of global stock market performance that includes developed and emerging markets but excludes the U.S. Unlike the fund, indices are not investments, they do not incur fees or expenses and are not professionally managed. It is not possible to invest directly in an index. Securities in the fund may not match those in an index.
The chart above shows the growth in value of a hypothetical $10,000 investment in the fund compared to the indices during the stated time period, and does not reflect the deduction of taxes that a shareholder would pay on fund distributions or the redemption of fund shares.
48
UNDERSTANDING YOUR EXPENSES — CMG International Stock Fund
As a fund shareholder, you incur two types of costs. There are transaction costs and also ongoing costs, which generally include investment advisory fees and other fund expenses. The information on this page is intended to help you understand your ongoing costs of investing in the fund and to compare these costs with the ongoing costs of investing in other mutual funds.
Analyzing your fund's expenses
To illustrate these ongoing costs, we have provided an example and calculated the expenses paid by investors during the reporting period. The information in the following table is based on an initial investment of $1,000, which is invested at the beginning of the reporting period and held for the entire period. Expense information is calculated two ways and each method provides you with different information. The amount listed in the "actual" column is calculated using the fund's actual operating expenses and total return for the period. The amount listed in the "hypothetical" column assumes that the return each year is 5% before expenses and includes the fund's actual expense ratio. You should not use the hypothetical account values and expenses to estimate either your actual account balance at the end of the period or the expenses you paid during this reporting period.
Estimating your actual expenses
To estimate the expenses that you paid over the period, first you will need your account balance at the end of the period:
1. Divide your ending account balance by $1,000. For example, if an account balance was $8,600 at the end of the period, the result would be 8.6.
2. In the section of the table below titled "Expenses paid during the period," locate the amount under "actual." Multiply this number by the result from step 1. Your answer is an estimate of the expenses you paid on your account during the period.
August 1, 2005 – January 31, 2006
| Account value at the beginning of the period ($) | Account value at the end of the period ($) | Expenses paid during the period ($) | Fund's annualized expense ratio (%) | ||||||||||||||||||||||||||||
| Actual | Hypothetical | Actual | Hypothetical | Actual | Hypothetical | ||||||||||||||||||||||||||
| 1,000.00 | 1,000.00 | 1,193.02 | 1,021.42 | 4.15 | 3.82 | 0.75 | |||||||||||||||||||||||||
Expenses paid during the period are equal to the fund's annualized expense ratio of 0.75%, multiplied by the average account value over the period, then multiplied by the number of days in the fund's most recent fiscal half-year and divided by 365.
Had the Investment Advisor not reimbursed a portion of expenses, total return would have been reduced.
It is important to note that the expense amounts shown in the table are meant to highlight only ongoing costs of investing in the fund and do not reflect any transaction costs, such as sales charges, redemption or exchange fees. Therefore, the hypothetical examples provided may not help you determine the relative total costs of owning shares of different funds. If these transaction costs were included, your costs would have been higher.
49
Compare with other funds
Since all mutual funds are required to include the same hypothetical calculations about expenses in shareholder reports, you can use this information to compare the ongoing cost of investing in the fund with other funds. To do so, compare the 5% hypothetical example with the 5% hypothetical examples that appear in the shareholder reports of other funds. As you compare hypothetical examples of other funds, it is important to note that hypothetical examples are meant to highlight the continuing costs of investing in a fund and do not reflect any transaction costs, such as sales charges or redemption or exchange fees.
50
CMG ENHANCED S&P 500® INDEX FUND
A Portfolio of CMG Fund Trust
FINANCIAL HIGHLIGHTS
(For a Fund Share Outstanding Throughout Each Period)
| (Unaudited) Six Months Ended | Period Ended | ||||||||||||||||||
| January 31, | Year Ended July 31, | July 31, | |||||||||||||||||
| 2006 | 2005 | 2004 | 2003 (a) | ||||||||||||||||
| Net asset value, beginning of period | $ | 13.49 | $ | 11.97 | $ | 10.73 | $ | 10.00 | |||||||||||
| Income from investment operations: | |||||||||||||||||||
| Net investment income (b) | 0.11 | 0.24 | (c) | 0.17 | 0.04 | ||||||||||||||
| Net realized and unrealized gain on investments | 0.74 | 1.58 | 1.13 | 0.69 | |||||||||||||||
| Total from investment operations | 0.85 | 1.82 | 1.30 | 0.73 | |||||||||||||||
| Less distributions declared to shareholders: | |||||||||||||||||||
| From net investment income | (0.25 | ) | (0.20 | ) | (0.05 | ) | - | ||||||||||||
| From net realized gains | (0.71 | ) | (0.10 | ) | (0.01 | ) | - | ||||||||||||
| Total distributions declared to shareholders | (0.96 | ) | (0.30 | ) | (0.06 | ) | - | ||||||||||||
| Net asset value, end of period | $ | 13.38 | $ | 13.49 | $ | 11.97 | $ | 10.73 | |||||||||||
| Total return (d)(e) | 6.44 | %(f) | 15.32 | % | 12.08 | % | 7.30 | %(f) | |||||||||||
| Ratios/Supplemental data: | |||||||||||||||||||
| Net assets, end of period (000's) | $ | 86,919 | $ | 91,633 | $ | 98,247 | $ | 9,134 | |||||||||||
| Ratio of operating expenses to average net assets | 0.25 | %(g) | 0.25 | % | 0.25 | % | 0.25 | %(g) | |||||||||||
| Ratio of interest expense to average net assets | - | %(g)(h) | - | - | - | ||||||||||||||
| Ratio of net expenses to average net assets | 0.25 | %(g) | 0.25 | % | 0.25 | % | 0.25 | %(g) | |||||||||||
| Ratio of net investment income to average net assets | 1.68 | %(g) | 1.91 | % | 1.43 | % | 1.50 | %(g) | |||||||||||
| Reimbursement | 0.05 | %(g) | 0.04 | % | 0.05 | % | 1.37 | %(g) | |||||||||||
| Portfolio turnover rate | 28 | %(f) | 49 | % | 60 | % | 2 | %(f) | |||||||||||
(a) The Fund commenced investment operations on May 5, 2003. Per share data, total return and portfolio turnover rate reflect activity from that date.
(b) Per share data was calculated using average shares outstanding during the period.
(c) Net investment income per share reflects a special dividend. The effect of this dividend amounted to $0.04 per share.
(d) Total return at net asset value assuming all distributions reinvested.
(e) Had the Investment Advisor not reimbursed a portion of expenses, total return would have been reduced.
(f) Not annualized.
(g) Annualized.
(h) Rounds to less than 0.01%.
See Accompanying Notes to Financial Statements.
51
CMG LARGE CAP GROWTH FUND
A Portfolio of CMG Fund Trust
FINANCIAL HIGHLIGHTS
(For a Fund Share Outstanding Throughout Each Period)
| (Unaudited) Six Months Ended January 31, 2006 | Year Ended July 31, 2005 | Period Ended July 31, 2004 (a) | |||||||||||||
| Net asset value, beginning of period | $ | 11.65 | $ | 10.25 | $ | 10.00 | |||||||||
| Income from investment operations: | |||||||||||||||
| Net investment income (b) | 0.03 | 0.12 | (c) | 0.03 | |||||||||||
| Net realized and unrealized gain on investments | 0.79 | 1.37 | 0.23 | ||||||||||||
| Total from investment operations | 0.82 | 1.49 | 0.26 | ||||||||||||
| Less distributions declared to shareholders: | |||||||||||||||
| From net investment income | (0.08 | ) | (0.09 | ) | (0.01 | ) | |||||||||
| From net realized gains | (0.66 | ) | - | - | |||||||||||
| Total distributions declared to shareholders | (0.74 | ) | (0.09 | ) | (0.01 | ) | |||||||||
| Net asset value, end of period | $ | 11.73 | $ | 11.65 | $ | 10.25 | |||||||||
| Total return (d)(e) | 7.20 | %(f) | 14.55 | % | 2.57 | %(f) | |||||||||
| Ratios/Supplemental data: | |||||||||||||||
| Net assets, end of period (000's) | $ | 38,255 | $ | 40,312 | $ | 40,684 | |||||||||
| Ratio of operating expenses to average net assets | 0.50 | %(g) | 0.50 | % | 0.50 | %(g) | |||||||||
| Ratio of interest expense to average net assets | - | %(g)(h) | - | - | |||||||||||
| Ratio of net expenses to average net assets | 0.50 | %(g) | 0.50 | % | 0.50 | %(g) | |||||||||
| Ratio of net investment income to average net assets | 0.49 | %(g) | 1.07 | % | 0.31 | %(g) | |||||||||
| Reimbursement | 0.12 | %(g) | 0.07 | % | 0.14 | %(g) | |||||||||
| Portfolio turnover rate | 65 | %(f) | 120 | % | 114 | %(f) | |||||||||
(a) The Fund commenced investment operations on September 10, 2003. Per share data, total return and portfolio turnover rate reflect activity from that date.
(b) Per share data was calculated using average shares outstanding during the period.
(c) Net investment income per share reflects a special dividend. The effect of this dividend amounted to $0.05 per share.
(d) Total return at net asset value assuming all distributions reinvested.
(e) Had the Investment Advisor not reimbursed a portion of expenses, total return would have been reduced.
(f) Not annualized.
(g) Annualized.
(h) Rounds to less than 0.01%.
See Accompanying Notes to Financial Statements.
52
CMG LARGE CAP VALUE FUND
A Portfolio of CMG Fund Trust
FINANCIAL HIGHLIGHTS
(For a Fund Share Outstanding Throughout Each Period)
| (Unaudited) Six Months Ended January 31, 2006 | Year Ended July 31, 2005 | Period Ended July 31, 2004 (a) | |||||||||||||
| Net asset value, beginning of period | $ | 12.54 | $ | 11.09 | $ | 10.00 | |||||||||
| Income from investment operations: | |||||||||||||||
| Net investment income (b) | 0.11 | 0.24 | 0.18 | ||||||||||||
| Net realized and unrealized gain on investments | 0.78 | 1.46 | 0.93 | ||||||||||||
| Total from investment operations | 0.89 | 1.70 | 1.11 | ||||||||||||
| Less distributions declared to shareholders: | |||||||||||||||
| From net investment income | (0.28 | ) | (0.22 | ) | (0.02 | ) | |||||||||
| From net realized gains | (1.51 | ) | (0.03 | ) | - | ||||||||||
| Total distributions declared to shareholders | (1.79 | ) | (0.25 | ) | (0.02 | ) | |||||||||
| Net asset value, end of period | $ | 11.64 | $ | 12.54 | $ | 11.09 | |||||||||
| Total return (c)(d) | 7.54 | %(e)(f) | 15.41 | %(g) | 11.15 | %(e) | |||||||||
| Ratios/Supplemental data: | |||||||||||||||
| Net assets, end of period (000's) | $ | 36,722 | $ | 38,731 | $ | 47,855 | |||||||||
| Ratio of net expenses to average net assets | 0.50 | %(h) | 0.50 | % | 0.50 | %(h) | |||||||||
| Ratio of net investment income to average net assets | 1.69 | %(h) | 1.99 | % | 1.86 | %(h) | |||||||||
| Reimbursement | 0.12 | %(h) | 0.07 | % | 0.14 | %(h) | |||||||||
| Portfolio turnover rate | 62 | %(e) | 45 | % | 46 | %(e) | |||||||||
(a) The Fund commenced investment operations on September 10, 2003. Per share data, total return and portfolio turnover rate reflect activity from that date.
(b) Per share data was calculated using average shares outstanding during the period.
(c) Total return at net asset value assuming all distributions reinvested.
(d) Had the Investment Advisor not reimbursed a portion of expenses, total return would have been reduced.
(e) Not annualized.
(f) Total return includes a voluntary reimbursement by the Investment Advisor for a realized investment loss due to a trading error. This reimbursement had an impact of less than 0.01% on the Fund's total return.
(g) Total return includes a reimbursement of loss experienced by the Fund due to a compliance violation. The reimbursement had an impact of less than 0.01% on the Fund's total return.
(h) Annualized.
See Accompanying Notes to Financial Statements.
53
CMG MID CAP GROWTH FUND
A Portfolio of CMG Fund Trust
FINANCIAL HIGHLIGHTS
(For a Fund Share Outstanding Throughout Each Period)
| (Unaudited) Six Months Ended | Period Ended | ||||||||||||||||||
| January 31, | Year Ended July 31, | July 31, | |||||||||||||||||
| 2006 | 2005 | 2004 | 2003 (a) | ||||||||||||||||
| Net asset value, beginning of period | $ | 14.15 | $ | 11.04 | $ | 10.93 | $ | 10.00 | |||||||||||
| Income from investment operations: | |||||||||||||||||||
| Net investment loss (b) | - | (c) | (0.03 | ) | (0.05 | ) | (0.01 | ) | |||||||||||
| Net realized and unrealized gain on investments | 2.38 | 3.14 | 0.17 | 0.94 | |||||||||||||||
| Total from investment operations | 2.38 | 3.11 | 0.12 | 0.93 | |||||||||||||||
| Less distributions declared to shareholders: | |||||||||||||||||||
| From net realized gains | (0.38 | ) | - | (0.01 | ) | - | |||||||||||||
| Net asset value, end of period | $ | 16.15 | $ | 14.15 | $ | 11.04 | $ | 10.93 | |||||||||||
| Total return (d)(e) | 17.04 | % (f) | 28.17 | % | 1.06 | % | 9.30 | % (f) | |||||||||||
| Ratios/Supplemental data: | |||||||||||||||||||
| Net assets, end of period (000's) | $ | 26,227 | $ | 24,881 | $ | 19,284 | $ | 2,161 | |||||||||||
| Ratio of net expenses to average net assets | 0.70 | % (g) | 0.70 | % | 0.70 | % | 0.70 | % (g) | |||||||||||
| Ratio of net investment loss to average net assets | (0.06 | )%(g) | (0.21 | )% | (0.38 | )% | (0.44 | )%(g) | |||||||||||
| Reimbursement | 0.18 | % (g) | 0.21 | % | 0.22 | % | 3.85 | % (g) | |||||||||||
| Portfolio turnover rate | 25 | % (f) | 141 | % | 169 | % | 23 | % (f) | |||||||||||
(a) The Fund commenced investment operations on May 5, 2003. Per share data, total return and portfolio turnover rate reflect activity from that date.
(b) Per share data was calculated using average shares outstanding during the period.
(c) Rounds to less than $0.01 per share.
(d) Total return at net asset value assuming all distributions reinvested.
(e) Had the Investment Advisor not reimbursed a portion of expenses, total return would have been reduced.
(f) Not annualized.
(g) Annualized.
See Accompanying Notes to Financial Statements.
54
CMG MID CAP VALUE FUND
A Portfolio of CMG Fund Trust
FINANCIAL HIGHLIGHTS
(For a Fund Share Outstanding Throughout Each Period)
| (Unaudited) Six Months Ended | Period Ended | ||||||||||||||||||
| January 31, | Year Ended July 31, | July 31, | |||||||||||||||||
| 2006 | 2005 | 2004 | 2003 (a) | ||||||||||||||||
| Net asset value, beginning of period | $ | 15.17 | $ | 12.58 | $ | 10.69 | $ | 10.00 | |||||||||||
| Income from investment operations: | |||||||||||||||||||
| Net investment income (b) | 0.08 | 0.11 | 0.07 | 0.01 | |||||||||||||||
| Net realized and unrealized gain on investments | 1.15 | 2.66 | 1.84 | 0.68 | |||||||||||||||
| Total from investment operations | 1.23 | 2.77 | 1.91 | 0.69 | |||||||||||||||
| Less distributions declared to shareholders: | |||||||||||||||||||
| From net investment income | (0.16 | ) | (0.09 | ) | (0.02 | ) | - | ||||||||||||
| From net realized gains | (2.28 | ) | (0.09 | ) | - | (c) | - | ||||||||||||
| Total distributions declared to shareholders | (2.44 | ) | (0.18 | ) | (0.02 | ) | - | ||||||||||||
| Net asset value, end of period | $ | 13.96 | $ | 15.17 | $ | 12.58 | $ | 10.69 | |||||||||||
| Total return (d)(e) | 8.84 | %(f) | 22.14 | % | 17.91 | % | 6.90 | %(f) | |||||||||||
| Ratios/Supplemental data: | |||||||||||||||||||
| Net assets, end of period (000's) | $ | 18,422 | $ | 21,277 | $ | 21,994 | $ | 2,651 | |||||||||||
| Ratio of net expenses to average net assets | 0.70 | %(g) | 0.70 | % | 0.70 | % | 0.70 | %(g) | |||||||||||
| Ratio of net investment income to average net assets | 1.08 | %(g) | 0.78 | % | 0.54 | % | 0.49 | %(g) | |||||||||||
| Reimbursement | 0.23 | %(g) | 0.19 | % | 0.20 | % | 3.61 | %(g) | |||||||||||
| Portfolio turnover rate | 26 | %(f) | 59 | % | 9 | % | 2 | %(f) | |||||||||||
(a) The Fund commenced investment operations on May 5, 2003. Per share data, total return and portfolio turnover rate reflect activity from that date.
(b) Per share data was calculated using average shares outstanding during the period.
(c) Rounds to less than $0.01 per share.
(d) Total return at net asset value assuming all distributions reinvested.
(e) Had the Investment Advisor not reimbursed a portion of expenses, total return would have been reduced.
(f) Not annualized.
(g) Annualized.
See Accompanying Notes to Financial Statements.
55
CMG SMALL CAP GROWTH FUND
A Portfolio of CMG Fund Trust
FINANCIAL HIGHLIGHTS
(For a Fund Share Outstanding Throughout Each Period)
| (Unaudited) Six Months Ended | Period Ended | ||||||||||||||||||
| January 31, | Year Ended July 31, | July 31, | |||||||||||||||||
| 2006 | 2005 | 2004 | 2003 (a) | ||||||||||||||||
| Net asset value, beginning of period | $ | 13.56 | $ | 11.99 | $ | 11.53 | $ | 10.00 | |||||||||||
| Income from investment operations: | |||||||||||||||||||
| Net investment loss (b) | (0.04 | ) | (0.07 | ) | (0.08 | ) | (0.02 | ) | |||||||||||
| Net realized and unrealized gain on investments | 1.85 | 2.38 | 1.35 | 1.55 | |||||||||||||||
| Total from investment operations | 1.81 | 2.31 | 1.27 | 1.53 | |||||||||||||||
| Less distributions declared to shareholders: | |||||||||||||||||||
| From net realized gains | (1.77 | ) | (0.74 | ) | (0.81 | ) | - | ||||||||||||
| Net asset value, end of period | $ | 13.60 | $ | 13.56 | $ | 11.99 | $ | 11.53 | |||||||||||
| Total return (c)(d) | 14.74 | % (e) | 19.47 | % | 10.74 | % | 15.30 | % (e) | |||||||||||
| Ratios/Supplemental data: | |||||||||||||||||||
| Net assets, end of period (000's) | $ | 41,190 | $ | 38,645 | $ | 35,727 | $ | 21,006 | |||||||||||
| Ratio of operating expenses to average net assets | 0.80 | % (f) | 0.80 | % | 0.80 | % | 0.80 | % (f) | |||||||||||
| Ratio of interest expense to average net assets | - | % (f)(g) | - | - | - | ||||||||||||||
| Ratio of net expenses to average net assets | 0.80 | % (f) | 0.80 | % | 0.80 | % | 0.80 | % (f) | |||||||||||
| Ratio of net investment loss to average net assets | (0.60 | )%(f) | (0.56 | )% | (0.60 | )% | (0.62 | )%(f) | |||||||||||
| Reimbursement | 0.12 | % (f) | 0.12 | % | 0.10 | % | 0.35 | % (f) | |||||||||||
| Portfolio turnover rate | 141 | % (e) | 48 | % | 66 | % | 37 | % (e) | |||||||||||
(a) The Fund commenced investment operations on May 5, 2003. Per share data, total return and portfolio turnover rate reflect activity from that date.
(b) Per share data was calculated using average shares outstanding during the period.
(c) Total return at net asset value assuming all distributions reinvested.
(d) Had the Investment Advisor not reimbursed a portion of expenses, total return would have been reduced.
(e) Not annualized.
(f) Annualized.
(g) Rounds to less than 0.01%.
See Accompanying Notes to Financial Statements.
56
CMG SMALL CAP VALUE FUND
A Portfolio of CMG Fund Trust
FINANCIAL HIGHLIGHTS
(For a Fund Share Outstanding Throughout Each Period)
| (Unaudited) Six Months Ended | Period Ended | ||||||||||||||||||
| January 31, | Year Ended July 31, | July 31, | |||||||||||||||||
| 2006 | 2005 | 2004 | 2003 (a) | ||||||||||||||||
| Net asset value, beginning of period | $ | 16.06 | $ | 13.91 | $ | 11.29 | $ | 10.00 | |||||||||||
| Income from investment operations: | |||||||||||||||||||
| Net investment income (b) | 0.04 | 0.11 | 0.11 | 0.02 | |||||||||||||||
| Net realized and unrealized gain on investments | 1.32 | 3.11 | 2.79 | 1.27 | |||||||||||||||
| Total from investment operations | 1.36 | 3.22 | 2.90 | 1.29 | |||||||||||||||
| Less distributions declared to shareholders: | |||||||||||||||||||
| From net investment income | (0.13 | ) | (0.10 | ) | (0.06 | ) | - | ||||||||||||
| From net realized gains | (1.77 | ) | (0.97 | ) | (0.22 | ) | - | ||||||||||||
| Total distributions declared to shareholders | (1.90 | ) | (1.07 | ) | (0.28 | ) | - | ||||||||||||
| Net asset value, end of period | $ | 15.52 | $ | 16.06 | $ | 13.91 | $ | 11.29 | |||||||||||
| Total return (c)(d) | 9.38 | %(e)(f) | 23.57 | % | 25.79 | % | 12.90 | %(e) | |||||||||||
| Ratios/Supplemental data: | |||||||||||||||||||
| Net assets, end of period (000's) | $ | 37,661 | $ | 36,989 | $ | 40,356 | $ | 21,356 | |||||||||||
| Ratio of operating expenses to average net assets | 0.80 | %(g) | 0.80 | % | 0.80 | % | 0.80 | %(g) | |||||||||||
| Ratio of interest expense to average net assets | - | %(g)(h) | - | - | - | ||||||||||||||
| Ratio of net expenses to average net assets | 0.80 | %(g) | 0.80 | % | 0.80 | % | 0.80 | %(g) | |||||||||||
| Ratio of net investment income to average net assets | 0.56 | %(g) | 0.77 | % | 0.82 | % | 0.66 | %(g) | |||||||||||
| Reimbursement | 0.12 | %(g) | 0.12 | % | 0.09 | % | 0.36 | %(g) | |||||||||||
| Portfolio turnover rate | 17 | %(e) | 41 | % | 53 | % | 5 | %(e) | |||||||||||
(a) The Fund commenced investment operations on May 5, 2003. Per share data, total return and portfolio turnover rate reflect activity from that date.
(b) Per share data was calculated using average shares outstanding during the period.
(c) Total return at net asset value assuming all distributions reinvested.
(d) Had the Investment Advisor not reimbursed a portion of expenses, total return would have been reduced.
(e) Not annualized.
(f) Total return includes a voluntary reimbursement by the Investment Advisor for a realized investment loss due to a trading error. This reimbursement had an impact of less than 0.01% on the Fund's total return.
(g) Annualized.
(h) Rounds to less than 0.01%.
See Accompanying Notes to Financial Statements.
57
CMG SMALL/MID CAP FUND
A Portfolio of CMG Fund Trust
FINANCIAL HIGHLIGHTS
(For a Fund Share Outstanding Throughout Each Period)
| (Unaudited) Six Months Ended | Period Ended | Year Ended | Period Ended | ||||||||||||||||||||||||
| January 31, | Year Ended July 31, | July 31, | October 31, | October 31, | |||||||||||||||||||||||
| 2006 | 2005 | 2004 | 2003 (a) | 2002 | 2001 (b) | ||||||||||||||||||||||
| Net asset value, beginning of period | $ | 11.49 | $ | 8.77 | $ | 8.30 | $ | 6.96 | $ | 8.00 | $ | 10.00 | |||||||||||||||
| Income from investment operations: | |||||||||||||||||||||||||||
| Net investment loss | (0.03 | )(c) | (0.04 | )(c) | (0.05 | )(c) | (0.03 | )(c) | (0.04 | )(c) | (0.02 | ) | |||||||||||||||
| Net realized and unrealized gain (loss) on investments | 1.82 | 2.76 | 0.52 | 1.37 | (1.00 | ) | (1.98 | ) | |||||||||||||||||||
| Total from investment operations | 1.79 | 2.72 | 0.47 | 1.34 | (1.04 | ) | (2.00 | ) | |||||||||||||||||||
| Less distributions declared to shareholders: | |||||||||||||||||||||||||||
| From net realized gains | (1.27 | ) | - | - | - | - | - | ||||||||||||||||||||
| Net asset value, end of period | $ | 12.01 | $ | 11.49 | $ | 8.77 | $ | 8.30 | $ | 6.96 | $ | 8.00 | |||||||||||||||
| Total return (d)(e) | 16.65 | % (f) | 31.01 | % | 5.66 | % | 19.25 | % (f) | (13.00 | )% | (20.00 | )%(f) | |||||||||||||||
| Ratios/Supplemental data: | |||||||||||||||||||||||||||
| Net assets, end of period (000's) | $ | 15,290 | $ | 38,755 | $ | 50,662 | $ | 73,926 | $ | 54,769 | $ | 49,391 | |||||||||||||||
| Ratio of net expenses to average net assets | 0.75 | % (g) | 0.75 | % | 0.75 | % | 0.78 | % (g)(h) | 0.80 | % (h) | 0.80 | % (g)(h) | |||||||||||||||
| Ratio of net investment loss to average net assets | (0.47 | )%(g) | (0.37 | )% | (0.49 | )% | (0.50 | )%(g)(h) | (0.45 | )%(h) | (0.23 | )%(g)(h) | |||||||||||||||
| Reimbursement | 0.14 | % (g) | 0.09 | % | 0.06 | % | 0.06 | % (g) | 0.06 | % | 0.17 | % (g) | |||||||||||||||
| Portfolio turnover rate | 59 | % (f) | 170 | % | 91 | % | 84 | % (f) | 125 | % | 167 | % (f) | |||||||||||||||
(a) The Fund changed its fiscal year end from October 31 to July 31.
(b) The Fund commenced investment operations on December 1, 2000. Per share data, total return and portfolio turnover rate reflect activity from that date.
(c) Per share data was calculated using average shares outstanding during the period.
(d) Total return at net asset value assuming all distributions reinvested.
(e) Had the Investment Advisor not reimbursed a portion of expenses, total return would have been reduced.
(f) Not annualized.
(g) Annualized.
(h) The benefits derived from custody credits had an impact of less than 0.01%.
See Accompanying Notes to Financial Statements.
58
CMG INTERNATIONAL STOCK FUND
A Portfolio of CMG Fund Trust
FINANCIAL HIGHLIGHTS
(For a Fund Share Outstanding Throughout Each Period)
| (Unaudited) Six Months Ended | Period Ended | ||||||||||||||||||||||||||||||
| January 31, | Year Ended July 31, | July 31, | Year Ended October 31, | ||||||||||||||||||||||||||||
| 2006 | 2005 | 2004 | 2003 (a) | 2002 | 2001 | 2000 | |||||||||||||||||||||||||
| Net asset value, beginning of period | $ | 13.76 | $ | 12.17 | $ | 10.33 | $ | 9.32 | $ | 10.42 | $ | 16.20 | $ | 17.86 | |||||||||||||||||
| Income from investment operations: | |||||||||||||||||||||||||||||||
| Net investment income | 0.06 | (b) | 0.19 | (b) | 0.14 | (b) | 0.11 | (b) | 0.02 | (b) | 0.03 | 0.04 | |||||||||||||||||||
| Net realized and unrealized gain (loss) on investments, foreign currency and foreign capital gains tax | 2.46 | 1.79 | 1.76 | 0.95 | (1.09 | ) | (3.09 | ) | (0.36 | ) | |||||||||||||||||||||
| Total from investment operations | 2.52 | 1.98 | 1.90 | 1.06 | (1.07 | ) | (3.06 | ) | (0.32 | ) | |||||||||||||||||||||
| Less distributions declared to shareholders: | |||||||||||||||||||||||||||||||
| From net investment income. | (0.27 | ) | (0.10 | ) | (0.06 | ) | (0.05 | ) | (0.03 | ) | - | - | |||||||||||||||||||
| From net realized gains. | (1.97 | ) | (0.29 | ) | - | - | - | (2.72 | ) | (1.34 | ) | ||||||||||||||||||||
| Total distributions declared to shareholders | (2.24 | ) | (0.39 | ) | (0.06 | ) | (0.05 | ) | (0.03 | ) | (2.72 | ) | (1.34 | ) | |||||||||||||||||
| Net asset value, end of period | $ | 14.04 | $ | 13.76 | $ | 12.17 | $ | 10.33 | $ | 9.32 | $ | 10.42 | $ | 16.20 | |||||||||||||||||
| Total return (c) | 19.30 | %(d)(e) | 16.31 | %(d) | 18.40 | %(d) | 11.39 | %(d)(e) | (10.28 | )% | (22.46 | )% | (3.58 | )% | |||||||||||||||||
| Ratios/Supplemental data: | |||||||||||||||||||||||||||||||
| Net assets, end of period (000's) | $ | 115,281 | $ | 136,144 | $ | 152,251 | $ | 58,488 | $ | 20,616 | $ | 20,553 | $ | 22,975 | |||||||||||||||||
| Ratio of operating expenses to average net assets | 0.75 | %(f) | 0.75 | % | 0.75 | % | 0.93 | %(f)(g) | 1.31 | %(g) | 1.26 | %(g) | 1.11 | %(g) | |||||||||||||||||
| Ratio of interest expense to average net assets | 0.01 | %(f) | - | - | - | - | - | - | |||||||||||||||||||||||
| Ratio of net expenses to average net assets | 0.76 | %(f) | 0.75 | % | 0.75 | % | 0.93 | %(f)(g) | 1.31 | %(g) | 1.26 | %(g) | 1.11 | %(g) | |||||||||||||||||
| Ratio of net investment income to average net assets | 0.82 | %(f) | 1.47 | % | 1.16 | % | 1.50 | %(f)(g) | 0.21 | %(g) | 0.29 | %(g) | 0.12 | %(g) | |||||||||||||||||
| Reimbursement | 0.04 | %(f) | 0.03 | % | 0.05 | % | 0.06 | %(f) | - | - | - | ||||||||||||||||||||
| Portfolio turnover rate | 47 | %(e) | 68 | % | 91 | % | 59 | %(e) | 111 | % | 117 | % | 140 | % | |||||||||||||||||
(a) The Fund changed its fiscal year end from October 31 to July 31.
(b) Per share data was calculated using average shares outstanding during the period.
(c) Total return at net asset value assuming all distributions reinvested.
(d) Had the Investment Advisor not reimbursed a portion of expenses, total return would have been reduced.
(e) Not annualized.
(f) Annualized.
(g) The benefits derived from custody credits had an impact of less than 0.01%.
See Accompanying Notes to Financial Statements.
59
CMG ENHANCED S&P 500® INDEX FUND
A Portfolio of CMG Fund Trust
SCHEDULE OF INVESTMENTS
January 31, 2006 (Unaudited)
| Shares | Value | ||||||||||
| Common Stocks (96.0%) | |||||||||||
| Consumer Discretionary (10.3%) | |||||||||||
| Automobiles (0.9%) | |||||||||||
| Harley-Davidson, Inc. | 14,800 | $ | 792,244 | ||||||||
| Distributors (0.1%) | |||||||||||
| Genuine Parts Co. | 2,300 | 97,819 | |||||||||
| Hotels, Restaurants & Leisure (2.1%) | |||||||||||
| Darden Restaurants, Inc. | 14,100 | 573,306 | |||||||||
| Hilton Hotels Corp. | 3,900 | 97,227 | |||||||||
| International Game Technology | 3,700 | 132,386 | |||||||||
| McDonald's Corp. | 25,100 | 878,751 | |||||||||
| Starwood Hotels & Resorts Worldwide, Inc. | 400 | 24,324 | |||||||||
| Yum! Brands, Inc. | 2,700 | 133,569 | |||||||||
| 1,839,563 | |||||||||||
| Household Durables (0.4%) | |||||||||||
| Pulte Homes, Inc. | 8,400 | 335,160 | |||||||||
| Media (2.6%) | |||||||||||
| CBS Corp. | 24,600 | 642,798 | |||||||||
| McGraw-Hill Companies, Inc. | 7,000 | 357,280 | |||||||||
| Time Warner, Inc. | 47,300 | 829,169 | |||||||||
| Viacom, Inc.,Class B (a) | 8,400 | 348,432 | |||||||||
| Walt Disney Co. | 4,400 | 111,364 | |||||||||
| 2,289,043 | |||||||||||
| Multiline Retail (0.9%) | |||||||||||
| Dollar General Corp. | 19,100 | 322,790 | |||||||||
| J.C. Penney Co., Inc. | 3,500 | 195,300 | |||||||||
| Nordstrom, Inc. | 5,600 | 233,632 | |||||||||
| 751,722 | |||||||||||
| Specialty Retail (3.2%) | |||||||||||
| Autonation, Inc. (a) | 33,200 | 740,028 | |||||||||
| AutoZone, Inc. (a) | 1,400 | 136,850 | |||||||||
| Barnes & Noble, Inc. | 6,000 | 254,520 | |||||||||
| Gap, Inc. | 4,700 | 85,023 | |||||||||
| Home Depot, Inc. | 23,200 | 940,760 | |||||||||
| Limited Brands, Inc. | 4,800 | 113,568 | |||||||||
| Lowe's Companies, Inc. | 300 | 19,065 | |||||||||
| Sherwin-Williams Co. | 6,100 | 322,690 | |||||||||
| Staples, Inc. | 7,700 | 182,567 | |||||||||
| 2,795,071 | |||||||||||
| Textiles, Apparel & Luxury Goods (0.1%) | |||||||||||
| Coach, Inc. (a) | 1,300 | 46,735 | |||||||||
| NIKE, Inc., Class B | 500 | 40,475 | |||||||||
| 87,210 | |||||||||||
See Accompanying Notes to Financial Statements.
60
CMG ENHANCED S&P 500® INDEX FUND
A Portfolio of CMG Fund Trust
SCHEDULE OF INVESTMENTS
| Shares | Value | ||||||||||
| Common Stocks (continued) | |||||||||||
| Consumer Staples (8.9%) | |||||||||||
| Beverages (2.1%) | |||||||||||
| Coca-Cola Co. | 28,200 | $ | 1,166,916 | ||||||||
| PepsiCo, Inc. | 12,200 | 697,596 | |||||||||
| 1,864,512 | |||||||||||
| Food & Staples Retailing (1.4%) | |||||||||||
| Kroger Co. (a) | 13,700 | 252,080 | |||||||||
| Safeway, Inc. | 8,600 | 201,584 | |||||||||
| SUPERVALU, Inc. | 3,700 | 118,141 | |||||||||
| Sysco Corp. | 1,100 | 33,748 | |||||||||
| Wal-Mart Stores, Inc. | 12,900 | 594,819 | |||||||||
| 1,200,372 | |||||||||||
| Food Products (1.3%) | |||||||||||
| Archer-Daniels-Midland Co. | 6,100 | 192,150 | |||||||||
| General Mills, Inc. | 3,300 | 160,413 | |||||||||
| H.J. Heinz Co. | 14,700 | 498,918 | |||||||||
| Kellogg Co. | 2,300 | 98,670 | |||||||||
| Tyson Foods, Inc., Class A | 12,400 | 177,692 | |||||||||
| 1,127,843 | |||||||||||
| Household Products (2.3%) | |||||||||||
| Clorox Co. | 3,800 | 227,430 | |||||||||
| Colgate-Palmolive Co. | 1,100 | 60,379 | |||||||||
| Kimberly-Clark Corp. | 4,200 | 239,904 | |||||||||
| Procter & Gamble Co. | 24,700 | 1,462,981 | |||||||||
| 1,990,694 | |||||||||||
| Tobacco (1.8%) | |||||||||||
| Altria Group, Inc. | 10,500 | 759,570 | |||||||||
| Reynolds American, Inc. | 7,600 | 768,588 | |||||||||
| 1,528,158 | |||||||||||
| Energy (10.0%) | |||||||||||
| Energy Equipment & Services (0.9%) | |||||||||||
| Baker Hughes, Inc. | 2,000 | 154,880 | |||||||||
| BJ Services Co. | 1,800 | 72,882 | |||||||||
| Schlumberger Ltd. | 4,200 | 535,290 | |||||||||
| 763,052 | |||||||||||
| Oil, Gas & Consumable Fuels (9.1%) | |||||||||||
| Amerada Hess Corp. | 2,200 | 340,560 | |||||||||
| Apache Corp. | 1,300 | 98,189 | |||||||||
| Burlington Resources, Inc. | 5,300 | 483,678 | |||||||||
| Chevron Corp. | 20,300 | 1,205,414 | |||||||||
| ConocoPhillips | 12,600 | 815,220 | |||||||||
| Devon Energy Corp. | 7,200 | 491,112 | |||||||||
| Exxon Mobil Corp. | 50,000 | 3,137,500 | |||||||||
| Kerr-McGee Corp. | 900 | 99,351 | |||||||||
| Marathon Oil Corp. | 4,300 | 330,541 | |||||||||
See Accompanying Notes to Financial Statements.
61
CMG ENHANCED S&P 500® INDEX FUND
A Portfolio of CMG Fund Trust
SCHEDULE OF INVESTMENTS
| Shares | Value | ||||||||||
| Common Stocks (continued) | |||||||||||
| Oil, Gas & Consumable Fuels (continued) | |||||||||||
| Occidental Petroleum Corp. | 1,200 | $ | 117,252 | ||||||||
| Sunoco, Inc. | 3,500 | 333,200 | |||||||||
| Valero Energy Corp. | 7,300 | 455,739 | |||||||||
| 7,907,756 | |||||||||||
| Financials (20.1%) | |||||||||||
| Capital Markets (4.9%) | |||||||||||
| Ameriprise Financial, Inc. | 1,500 | 61,035 | |||||||||
| Bank of New York Co., Inc. | 12,600 | 400,806 | |||||||||
| Charles Schwab Corp. | 13,300 | 196,707 | |||||||||
| E*TRADE Financial Corp. (a) | 3,900 | 92,781 | |||||||||
| Federated Investors, Inc., Class B | 5,800 | 223,938 | |||||||||
| Franklin Resources, Inc. | 3,000 | 295,500 | |||||||||
| Goldman Sachs Group, Inc. | 2,500 | 353,125 | |||||||||
| Lehman Brothers Holdings, Inc. | 2,700 | 379,215 | |||||||||
| Mellon Financial Corp. | 5,000 | 176,350 | |||||||||
| Merrill Lynch & Co., Inc. | 7,600 | 570,532 | |||||||||
| Morgan Stanley | 10,200 | 626,790 | |||||||||
| Northern Trust Corp. | 4,900 | 255,829 | |||||||||
| State Street Corp. | 8,100 | 489,726 | |||||||||
| T. Rowe Price Group, Inc. | 1,900 | 145,217 | |||||||||
| 4,267,551 | |||||||||||
| Commercial Banks (2.4%) | |||||||||||
| BB&T Corp. | 2,400 | 93,696 | |||||||||
| KeyCorp | 2,900 | 102,631 | |||||||||
| M&T Bank Corp. | 1,000 | 108,300 | |||||||||
| National City Corp. | 4,500 | 153,810 | |||||||||
| U.S. Bancorp | 22,800 | 681,948 | |||||||||
| UnionBanCal Corp. | 600 | 40,254 | |||||||||
| Wachovia Corp. | 9,300 | 509,919 | |||||||||
| Wells Fargo & Co. | 7,100 | 442,756 | |||||||||
| 2,133,314 | |||||||||||
| Consumer Finance (0.6%) | |||||||||||
| American Express Co. | 5,300 | 277,985 | |||||||||
| Capital One Financial Corp. | 2,600 | 216,580 | |||||||||
| 494,565 | |||||||||||
| Diversified Financial Services (3.2%) | |||||||||||
| Citigroup, Inc. | 33,600 | 1,565,088 | |||||||||
| JPMorgan Chase & Co. | 29,900 | 1,188,525 | |||||||||
| 2,753,613 | |||||||||||
| Insurance (7.7%) | |||||||||||
| Ace Ltd. | 5,000 | 273,750 | |||||||||
| AFLAC, Inc. | 5,600 | 262,920 | |||||||||
| Allstate Corp. | 13,200 | 687,060 | |||||||||
| American International Group, Inc. | 20,200 | 1,322,292 | |||||||||
| Aon Corp. | 2,300 | 78,706 | |||||||||
| Chubb Corp. | 1,900 | 179,265 | |||||||||
| First American Corp. | 5,000 | 234,100 | |||||||||
See Accompanying Notes to Financial Statements.
62
CMG ENHANCED S&P 500® INDEX FUND
A Portfolio of CMG Fund Trust
SCHEDULE OF INVESTMENTS
| Shares | Value | ||||||||||
| Common Stocks (continued) | |||||||||||
| Insurance (continued) | |||||||||||
| Hartford Financial Services Group, Inc. | 6,900 | $ | 567,387 | ||||||||
| Lincoln National Corp. | 3,900 | 212,667 | |||||||||
| MBIA, Inc. | 3,700 | 227,772 | |||||||||
| MetLife, Inc. | 6,800 | 341,088 | |||||||||
| Principal Financial Group, Inc. | 13,600 | 641,376 | |||||||||
| Prudential Financial, Inc. | 11,300 | 851,342 | |||||||||
| SAFECO Corp. | 9,100 | 475,475 | |||||||||
| St. Paul Travelers Companies, Inc. | 5,400 | 245,052 | |||||||||
| XL Capital Ltd., Class A | 1,300 | 87,958 | |||||||||
| 6,688,210 | |||||||||||
| Real Estate (0.1%) | |||||||||||
| Public Storage, Inc., REIT | 1,200 | 87,084 | |||||||||
| Thrifts & Mortgage Finance (1.2%) | |||||||||||
| Countrywide Financial Corp. | 16,000 | 535,040 | |||||||||
| Fannie Mae | 4,200 | 243,348 | |||||||||
| Freddie Mac | 2,000 | 135,720 | |||||||||
| Washington Mutual, Inc. | 2,300 | 97,336 | |||||||||
| 1,011,444 | |||||||||||
| Health Care (12.8%) | |||||||||||
| Biotechnology (1.9%) | |||||||||||
| Amgen, Inc. (a) | 14,500 | 1,056,905 | |||||||||
| Applera Corp.-Applied Biosystems Group | 800 | 22,672 | |||||||||
| Gilead Sciences, Inc. (a) | 9,800 | 596,526 | |||||||||
| 1,676,103 | |||||||||||
| Health Care Equipment & Supplies (1.3%) | |||||||||||
| Becton, Dickinson & Co. | 1,200 | 77,760 | |||||||||
| Boston Scientific Corp. (a) | 16,400 | 358,668 | |||||||||
| Fisher Scientific International, Inc. (a) | 3,200 | 213,984 | |||||||||
| Medtronic, Inc. | 8,200 | 463,054 | |||||||||
| 1,113,466 | |||||||||||
| Health Care Providers & Services (4.6%) | |||||||||||
| Aetna, Inc. | 300 | 29,040 | |||||||||
| AmerisourceBergen Corp. | 8,200 | 357,848 | |||||||||
| Cardinal Health, Inc. | 4,600 | 331,384 | |||||||||
| Caremark Rx, Inc. (a) | 8,400 | 414,120 | |||||||||
| CIGNA Corp. | 7,100 | 863,360 | |||||||||
| Express Scripts, Inc. (a) | 1,800 | 164,322 | |||||||||
| HCA, Inc. | 3,500 | 171,780 | |||||||||
| Humana, Inc. (a) | 2,600 | 145,002 | |||||||||
| McKesson Corp. | 6,100 | 323,300 | |||||||||
| UnitedHealth Group, Inc. | 14,700 | 873,474 | |||||||||
| WellPoint, Inc. (a) | 3,800 | 291,840 | |||||||||
| 3,965,470 | |||||||||||
See Accompanying Notes to Financial Statements.
63
CMG ENHANCED S&P 500® INDEX FUND
A Portfolio of CMG Fund Trust
SCHEDULE OF INVESTMENTS
| Shares | Value | ||||||||||
| Common Stocks (continued) | |||||||||||
| Pharmaceuticals (5.0%) | |||||||||||
| Abbott Laboratories | 11,400 | $ | 491,910 | ||||||||
| Forest Laboratories, Inc. (a) | 600 | 27,768 | |||||||||
| Johnson & Johnson | 24,900 | 1,432,746 | |||||||||
| King Pharmaceuticals, Inc. (a) | 1,600 | 30,000 | |||||||||
| Merck & Co., Inc. | 7,200 | 248,400 | |||||||||
| Pfizer, Inc. | 61,100 | 1,569,048 | |||||||||
| Watson Pharmaceuticals, Inc. (a) | 2,600 | 86,034 | |||||||||
| Wyeth | 10,400 | 481,000 | |||||||||
| 4,366,906 | |||||||||||
| Industrials (10.3%) | |||||||||||
| Aerospace & Defense (2.9%) | |||||||||||
| Boeing Co. | 13,000 | 888,030 | |||||||||
| General Dynamics Corp. | 3,600 | 418,896 | |||||||||
| Lockheed Martin Corp. | 6,400 | 432,960 | |||||||||
| Raytheon Co. | 7,300 | 299,081 | |||||||||
| Rockwell Collins, Inc. | 3,900 | 182,988 | |||||||||
| United Technologies Corp. | 6,100 | 356,057 | |||||||||
| 2,578,012 | |||||||||||
| Air Freight & Logistics (1.0%) | |||||||||||
| FedEx Corp. | 1,200 | 121,380 | |||||||||
| United Parcel Service, Inc., Class B | 10,200 | 764,082 | |||||||||
| 885,462 | |||||||||||
| Building Products (0.2%) | |||||||||||
| American Standard Companies, Inc. | 1,500 | 54,000 | |||||||||
| Masco Corp. | 3,400 | 100,810 | |||||||||
| 154,810 | |||||||||||
| Commercial Services & Supplies (1.2%) | |||||||||||
| Cendant Corp. | 36,400 | 609,336 | |||||||||
| Equifax, Inc. | 3,700 | 141,784 | |||||||||
| Monster Worldwide, Inc. (a) | 2,400 | 102,384 | |||||||||
| R.R. Donnelley & Sons Co. | 2,800 | 91,280 | |||||||||
| Robert Half International, Inc. | 2,600 | 94,978 | |||||||||
| 1,039,762 | |||||||||||
| Electrical Equipment (0.5%) | |||||||||||
| Emerson Electric Co. | 3,100 | 240,095 | |||||||||
| Rockwell Automation, Inc. | 2,800 | 184,996 | |||||||||
| 425,091 | |||||||||||
| Industrial Conglomerates (3.4%) | |||||||||||
| 3M Co. | 10,900 | 792,975 | |||||||||
| General Electric Co. | 54,700 | 1,791,425 | |||||||||
| Tyco International Ltd. | 15,000 | 390,750 | |||||||||
| 2,975,150 | |||||||||||
| Machinery (0.6%) | |||||||||||
| Cummins, Inc. | 500 | 48,650 | |||||||||
| Eaton Corp. | 400 | 26,480 | |||||||||
| Illinois Tool Works, Inc. | 2,400 | 202,296 | |||||||||
See Accompanying Notes to Financial Statements.
64
CMG ENHANCED S&P 500® INDEX FUND
A Portfolio of CMG Fund Trust
SCHEDULE OF INVESTMENTS
| Shares | Value | ||||||||||
| Common Stocks (continued) | |||||||||||
| Machinery (continued) | |||||||||||
| Ingersoll-Rand Co., Ltd., Class A | 2,400 | $ | 94,248 | ||||||||
| Parker Hannifin Corp. | 1,600 | 121,232 | |||||||||
| 492,906 | |||||||||||
| Road & Rail (0.4%) | |||||||||||
| Burlington Northern Santa Fe Corp. | 1,700 | 136,204 | |||||||||
| CSX Corp. | 1,700 | 91,001 | |||||||||
| Norfolk Southern Corp. | 2,200 | 109,648 | |||||||||
| 336,853 | |||||||||||
| Trading Companies & Distributors (0.1%) | |||||||||||
| W.W. Grainger, Inc. | 1,600 | 113,488 | |||||||||
| Information Technology (14.6%) | |||||||||||
| Communications Equipment (3.2%) | |||||||||||
| Cisco Systems, Inc. (a) | 87,900 | 1,632,303 | |||||||||
| Motorola, Inc. | 28,700 | 651,777 | |||||||||
| QUALCOMM, Inc. | 10,100 | 484,396 | |||||||||
| 2,768,476 | |||||||||||
| Computers & Peripherals (3.3%) | |||||||||||
| Apple Computer, Inc. (a) | 1,100 | 83,061 | |||||||||
| Dell, Inc. (a) | 23,900 | 700,509 | |||||||||
| EMC Corp. (a) | 8,300 | 111,220 | |||||||||
| Hewlett-Packard Co. | 33,500 | 1,044,530 | |||||||||
| International Business Machines Corp. | 11,400 | 926,820 | |||||||||
| 2,866,140 | |||||||||||
| Internet Software & Services (0.3%) | |||||||||||
| eBay, Inc. (a) | 4,400 | 189,640 | |||||||||
| Yahoo!, Inc. (a) | 2,000 | 68,680 | |||||||||
| 258,320 | |||||||||||
| IT Services (0.2%) | |||||||||||
| Computer Sciences Corp. (a) | 2,200 | 111,540 | |||||||||
| Fiserv, Inc. (a) | 2,300 | 101,154 | |||||||||
| 212,694 | |||||||||||
| Semiconductors & Semiconductor Equipment (3.9%) | |||||||||||
| Freescale Semiconductor, Inc., Class B (a) | 6,200 | 156,550 | |||||||||
| Intel Corp. | 78,500 | 1,669,695 | |||||||||
| Linear Technology Corp. | 7,900 | 293,959 | |||||||||
| LSI Logic Corp. (a) | 3,000 | 27,450 | |||||||||
| National Semiconductor Corp. | 5,500 | 155,155 | |||||||||
| NVIDIA Corp. (a) | 1,700 | 76,432 | |||||||||
| Texas Instruments, Inc. | 35,000 | 1,023,050 | |||||||||
| 3,402,291 | |||||||||||
| Software (3.7%) | |||||||||||
| Adobe Systems, Inc. | 5,300 | 210,516 | |||||||||
| Autodesk, Inc. | 5,300 | 215,127 | |||||||||
| CA, Inc. | 700 | 19,110 | |||||||||
| Intuit, Inc. (a) | 4,700 | 245,951 | |||||||||
See Accompanying Notes to Financial Statements.
65
CMG ENHANCED S&P 500® INDEX FUND
A Portfolio of CMG Fund Trust
SCHEDULE OF INVESTMENTS
| Shares | Value | ||||||||||
| Common Stocks (continued) | |||||||||||
| Software (continued) | |||||||||||
| Microsoft Corp. (b) | 63,800 | $ | 1,795,970 | ||||||||
| Oracle Corp. (a) | 54,700 | 687,579 | |||||||||
| Symantec Corp. (a) | 200 | 3,676 | |||||||||
| 3,177,929 | |||||||||||
| Materials (3.0%) | |||||||||||
| Chemicals (0.5%) | |||||||||||
| Dow Chemical Co. | 4,800 | 203,040 | |||||||||
| Eastman Chemical Co. | 2,400 | 115,704 | |||||||||
| PPG Industries, Inc. | 1,500 | 89,250 | |||||||||
| 407,994 | |||||||||||
| Containers & Packaging (0.1%) | |||||||||||
| Ball Corp. | 1,600 | 64,800 | |||||||||
| Metals & Mining (2.3%) | |||||||||||
| Freeport-McMoRan Copper & Gold, Inc., Class B | 7,000 | 449,750 | |||||||||
| Nucor Corp. | 11,900 | 1,002,337 | |||||||||
| Phelps Dodge Corp. | 3,600 | 577,800 | |||||||||
| 2,029,887 | |||||||||||
| Paper & Forest Products (0.1%) | |||||||||||
| MeadWestvaco Corp. | 4,000 | 106,760 | |||||||||
| Weyerhaeuser Co. | 100 | 6,976 | |||||||||
| 113,736 | |||||||||||
| Telecommunication Services (2.9%) | |||||||||||
| Diversified Telecommunication Services (2.4%) | |||||||||||
| AT&T, Inc. | 24,100 | 625,395 | |||||||||
| BellSouth Corp. | 28,000 | 805,560 | |||||||||
| CenturyTel, Inc. | 1,200 | 39,960 | |||||||||
| Verizon Communications, Inc. | 18,900 | 598,374 | |||||||||
| 2,069,289 | |||||||||||
| Wireless Telecommunication Services (0.5%) | |||||||||||
| Sprint Nextel Corp. | 19,000 | 434,910 | |||||||||
| Utilities (3.1%) | |||||||||||
| Electric Utilities (1.1%) | |||||||||||
| American Electric Power Co., Inc. | 15,800 | 589,656 | |||||||||
| FirstEnergy Corp. | 7,900 | 395,790 | |||||||||
| Progress Energy, Inc. | 200 | 8,724 | |||||||||
| 994,170 | |||||||||||
| Independent Power Producers & Energy Traders (1.0%) | |||||||||||
| Constellation Energy Group, Inc. | 100 | 5,827 | |||||||||
| Duke Energy Corp. | 18,300 | 518,805 | |||||||||
| TXU Corp. | 6,400 | 324,096 | |||||||||
| 848,728 | |||||||||||
See Accompanying Notes to Financial Statements.
66
CMG ENHANCED S&P 500® INDEX FUND
A Portfolio of CMG Fund Trust
SCHEDULE OF INVESTMENTS
| Shares | Value | ||||||||||
| Common Stocks (continued) | |||||||||||
| Multi-Utilities (1.0%) | |||||||||||
| CenterPoint Energy, Inc. | 38,500 | $ | 492,030 | ||||||||
| PG&E Corp. | 9,800 | 365,638 | |||||||||
| 857,668 | |||||||||||
| Total Common Stocks (Cost of $71,118,420) | 83,436,511 | ||||||||||
| Par | |||||||||||
| Short-Term Obligations (3.8%) | |||||||||||
| U.S. Government Obligations (0.3%) | |||||||||||
| U.S Treasury Bills 3.790% 03/16/06 (b)(c) | $ | 167,000 | 165,400 | ||||||||
| 3.850% 03/16/06 (b)(c) | 75,000 | 74,310 | |||||||||
| 239,710 | |||||||||||
| Repurchase Agreement (3.5%) | |||||||||||
| Repurchase agreement with State Street Bank & Trust Co., dated 01/31/06, due 02/01/06 at 4.270%, collateralized by a U.S. Treasury Bond maturing 02/15/26, market value of $3,136,518 (repurchase proceeds $3,070,364) | 3,070,000 | 3,070,000 | |||||||||
| Total Short-Term Obligations (Cost of $3,309,710) | 3,309,710 | ||||||||||
| Total Investments (99.8%) (Cost of $74,428,130) (d) | 86,746,221 | ||||||||||
| Other Assets & Liabilities, Net (0.2%) | 173,100 | ||||||||||
| Net Assets (100.0%) | $ | 86,919,321 | |||||||||
Notes to Schedule of Investments:
(a) Non-income producing security.
(b) The security or a portion of the security is pledged as collateral for open futures contracts. At January 31, 2006, the total market value of securities pledged amounted to $207,214.
(c) The rate shown represents the annualized yield at the date of purchase.
(d) Cost for federal income tax purposes is $74,428,130.
At January 31, 2006, the Fund held the following open long futures contracts:
| Type | Number of Contracts | Value | Aggregate Face Value | Expiration Date | Unrealized Appreciation | ||||||||||||||||||
| S&P 500® Index | 10 | $ | 3,209,000 | $ | 3,175,029 | Mar-2006 | $ | 33,971 | |||||||||||||||
See Accompanying Notes to Financial Statements.
67
CMG ENHANCED S&P 500® INDEX FUND
A Portfolio of CMG Fund Trust
SCHEDULE OF INVESTMENTS
At January 31, 2006, the Fund held investments in the following sectors:
| Sector | % of Net Assets | ||||||
| Financials | 20.1 | % | |||||
| Information Technology | 14.6 | ||||||
| Health Care | 12.8 | ||||||
| Industrials | 10.3 | ||||||
| Consumer Discretionary | 10.3 | ||||||
| Energy | 10.0 | ||||||
| Consumer Staples | 8.9 | ||||||
| Utilities | 3.1 | ||||||
| Materials | 3.0 | ||||||
| Telecommunication Services | 2.9 | ||||||
| Short-Term Obligations | 3.8 | ||||||
| Other Assets & Liabilities, Net | 0.2 | ||||||
| 100.0 | % | ||||||
| Acronym | Name | ||||||
| REIT | Real Estate Investment Trust | ||||||
See Accompanying Notes to Financial Statements.
68
CMG LARGE CAP GROWTH FUND
A Portfolio of CMG Fund Trust
SCHEDULE OF INVESTMENTS
January 31, 2006 (Unaudited)
| Shares | Value | ||||||||||
| Common Stocks (95.7%) | |||||||||||
| Consumer Discretionary (12.2%) | |||||||||||
| Hotels, Restaurants & Leisure (1.1%) | |||||||||||
| Marriott International, Inc., Class A | 3,130 | $ | 208,583 | ||||||||
| Starbucks Corp. (a) | 6,400 | 202,880 | |||||||||
| 411,463 | |||||||||||
| Internet & Catalog Retail (2.2%) | |||||||||||
| eBay, Inc. (a) | 13,200 | 568,920 | |||||||||
| Expedia, Inc. (a) | 11,000 | 286,220 | |||||||||
| 855,140 | |||||||||||
| Media (0.8%) | |||||||||||
| Getty Images, Inc. (a) | 3,700 | 302,105 | |||||||||
| Multiline Retail (0.8%) | |||||||||||
| Target Corp. | 5,600 | 306,600 | |||||||||
| Specialty Retail (6.3%) | |||||||||||
| Best Buy Co., Inc. | 2,800 | 141,848 | |||||||||
| Chico's FAS, Inc. (a) | 4,700 | 204,732 | |||||||||
| Home Depot, Inc. | 10,970 | 444,834 | |||||||||
| Lowe's Companies, Inc. | 8,670 | 550,978 | |||||||||
| Office Depot, Inc. (a) | 18,300 | 606,645 | |||||||||
| Tiffany & Co. | 12,700 | 478,790 | |||||||||
| 2,427,827 | |||||||||||
| Textiles, Apparel & Luxury Goods (1.0%) | |||||||||||
| Coach, Inc. (a) | 2,860 | 102,817 | |||||||||
| NIKE, Inc., Class B | 3,370 | 272,802 | |||||||||
| 375,619 | |||||||||||
| Consumer Staples (6.3%) | |||||||||||
| Beverages (1.4%) | |||||||||||
| PepsiCo, Inc. | 9,360 | 535,205 | |||||||||
| Food & Staples Retailing (1.9%) | |||||||||||
| Wal-Mart Stores, Inc. | 16,100 | 742,371 | |||||||||
| Food Products (0.1%) | |||||||||||
| Kellogg Co. | 1,220 | 52,338 | |||||||||
| Household Products (2.9%) | |||||||||||
| Colgate-Palmolive Co. | 9,300 | 510,477 | |||||||||
| Procter & Gamble Co. | 9,793 | 580,039 | |||||||||
| 1,090,516 | |||||||||||
| Energy (4.6%) | |||||||||||
| Energy Equipment & Services (0.9%) | |||||||||||
| Halliburton Co. | 4,300 | 342,065 | |||||||||
See Accompanying Notes to Financial Statements.
69
CMG LARGE CAP GROWTH FUND
A Portfolio of CMG Fund Trust
SCHEDULE OF INVESTMENTS
| Shares | Value | ||||||||||
| Common Stocks (continued) | |||||||||||
| Oil, Gas & Consumable Fuels (3.7%) | |||||||||||
| Anadarko Petroleum Corp. | 4,900 | $ | 528,318 | ||||||||
| EOG Resources, Inc. | 5,500 | 464,970 | |||||||||
| XTO Energy, Inc. | 8,200 | 402,456 | |||||||||
| 1,395,744 | |||||||||||
| Financials (8.9%) | |||||||||||
| Capital Markets (4.0%) | |||||||||||
| Bank of New York Co., Inc. | 15,800 | 502,598 | |||||||||
| Franklin Resources, Inc. | 3,200 | 315,200 | |||||||||
| Merrill Lynch & Co., Inc. | 5,000 | 375,350 | |||||||||
| State Street Corp. | 5,650 | 341,599 | |||||||||
| 1,534,747 | |||||||||||
| Commercial Banks (1.9%) | |||||||||||
| Wells Fargo & Co. | 6,490 | 404,716 | |||||||||
| Zions Bancorporation | 3,800 | 300,466 | |||||||||
| 705,182 | |||||||||||
| Consumer Finance (1.4%) | |||||||||||
| American Express Co. | 10,500 | 550,725 | |||||||||
| Insurance (1.6%) | |||||||||||
| American International Group, Inc. | 5,380 | 352,175 | |||||||||
| XL Capital Ltd., Class A | 4,000 | 270,640 | |||||||||
| 622,815 | |||||||||||
| Health Care (19.6%) | |||||||||||
| Biotechnology (2.7%) | |||||||||||
| Amgen, Inc. (a) | 7,210 | 525,537 | |||||||||
| Genentech, Inc. (a) | 2,900 | 249,168 | |||||||||
| Protein Design Labs, Inc. (a) | 9,100 | 265,265 | |||||||||
| 1,039,970 | |||||||||||
| Health Care Equipment & Supplies (6.5%) | |||||||||||
| Alcon, Inc. | 820 | 104,895 | |||||||||
| Baxter International, Inc. | 7,400 | 272,690 | |||||||||
| Medtronic, Inc. | 11,760 | 664,087 | |||||||||
| PerkinElmer, Inc. | 8,100 | 184,194 | |||||||||
| Thermo Electron Corp. (a) | 16,130 | 542,613 | |||||||||
| Varian Medical Systems, Inc. (a) | 8,830 | 531,654 | |||||||||
| Zimmer Holdings, Inc. (a) | 2,700 | 186,165 | |||||||||
| 2,486,298 | |||||||||||
| Health Care Providers & Services (3.4%) | |||||||||||
| Aetna, Inc. | 4,500 | 435,600 | |||||||||
| Caremark Rx, Inc. (a) | 7,410 | 365,313 | |||||||||
| UnitedHealth Group, Inc. | 8,500 | 505,070 | |||||||||
| 1,305,983 | |||||||||||
| Pharmaceuticals (7.0%) | |||||||||||
| IVAX Corp. (a)(b) | 10,190 | 317,113 | |||||||||
| Johnson & Johnson | 8,940 | 514,408 | |||||||||
See Accompanying Notes to Financial Statements.
70
CMG LARGE CAP GROWTH FUND
A Portfolio of CMG Fund Trust
SCHEDULE OF INVESTMENTS
| Shares | Value | ||||||||||
| Common Stocks (continued) | |||||||||||
| Pharmaceuticals (continued) | |||||||||||
| Novartis AG, ADR | 13,080 | $ | 721,493 | ||||||||
| Roche Holdings Ltd., ADR | 7,100 | 560,900 | |||||||||
| Teva Pharmaceutical Industries Ltd., ADR | 12,950 | 552,058 | |||||||||
| 2,665,972 | |||||||||||
| Industrials (13.4%) | |||||||||||
| Aerospace & Defense (1.3%) | |||||||||||
| United Technologies Corp. | 8,600 | 501,982 | |||||||||
| Air Freight & Logistics (1.2%) | |||||||||||
| United Parcel Service, Inc., Class B | 6,100 | 456,951 | |||||||||
| Commercial Services & Supplies (0.7%) | |||||||||||
| Waste Management, Inc. | 8,200 | 258,956 | |||||||||
| Construction & Engineering (1.2%) | |||||||||||
| Foster Wheeler Ltd. (a) | 8,900 | 438,325 | |||||||||
| Electrical Equipment (2.5%) | |||||||||||
| Emerson Electric Co. | 4,900 | 379,505 | |||||||||
| Rockwell Automation, Inc. | 8,680 | 573,487 | |||||||||
| 952,992 | |||||||||||
| Industrial Conglomerates (3.1%) | |||||||||||
| General Electric Co. | 36,600 | 1,198,650 | |||||||||
| Machinery (1.8%) | |||||||||||
| Caterpillar, Inc. | 7,400 | 502,460 | |||||||||
| ITT Industries, Inc. | 1,670 | 171,175 | |||||||||
| 673,635 | |||||||||||
| Road & Rail (1.6%) | |||||||||||
| Burlington Northern Santa Fe Corp. | 3,700 | 296,444 | |||||||||
| Canadian National Railway Co. | 3,600 | 325,404 | |||||||||
| 621,848 | |||||||||||
| Information Technology (28.1%) | |||||||||||
| Communications Equipment (4.5%) | |||||||||||
| Cisco Systems, Inc. (a) | 24,380 | 452,737 | |||||||||
| Corning, Inc. (a) | 13,200 | 321,420 | |||||||||
| F5 Networks, Inc. (a) | 1,800 | 116,460 | |||||||||
| Motorola, Inc. | 16,500 | 374,715 | |||||||||
| QUALCOMM, Inc. | 9,600 | 460,416 | |||||||||
| 1,725,748 | |||||||||||
| Computers & Peripherals (4.4%) | |||||||||||
| Apple Computer, Inc. (a) | 4,700 | 354,897 | |||||||||
| EMC Corp. (a) | 32,660 | 437,644 | |||||||||
See Accompanying Notes to Financial Statements.
71
CMG LARGE CAP GROWTH FUND
A Portfolio of CMG Fund Trust
SCHEDULE OF INVESTMENTS
| Shares | Value | ||||||||||
| Common Stocks (continued) | |||||||||||
| Computers & Peripherals (continued) | |||||||||||
| Hewlett-Packard Co. | 6,700 | $ | 208,906 | ||||||||
| International Business Machines Corp. | 8,500 | 691,050 | |||||||||
| 1,692,497 | |||||||||||
| Internet Software & Services (4.8%) | |||||||||||
| Akamai Technologies, Inc. (a) | 9,200 | 200,836 | |||||||||
| Google, Inc., Class A (a) | 2,300 | 996,475 | |||||||||
| Yahoo!, Inc. (a) | 19,020 | 653,147 | |||||||||
| 1,850,458 | |||||||||||
| Semiconductors & Semiconductor Equipment (6.8%) | |||||||||||
| Advanced Micro Devices, Inc. (a) | 4,700 | 196,742 | |||||||||
| Broadcom Corp., Class A (a) | 7,700 | 525,140 | |||||||||
| Intel Corp. | 10,910 | 232,056 | |||||||||
| Lam Research Corp. (a) | 12,700 | 589,661 | |||||||||
| Microchip Technology, Inc. | 7,650 | 286,951 | |||||||||
| National Semiconductor Corp. | 3,300 | 93,093 | |||||||||
| Novellus Systems, Inc. (a) | 7,100 | 201,285 | |||||||||
| Samsung Electronics Co., Ltd., GDR (c) | 500 | 191,500 | |||||||||
| Texas Instruments, Inc. | 9,110 | 266,285 | |||||||||
| 2,582,713 | |||||||||||
| Software (7.6%) | |||||||||||
| Adobe Systems, Inc. | 4,700 | 186,684 | |||||||||
| Autodesk, Inc. | 4,520 | 183,467 | |||||||||
| Microsoft Corp. | 68,620 | 1,931,653 | |||||||||
| SAP AG, ADR | 11,600 | 595,892 | |||||||||
| 2,897,696 | |||||||||||
| Materials (1.7%) | |||||||||||
| Chemicals (0.9%) | |||||||||||
| Monsanto Co. | 4,194 | 354,854 | |||||||||
| Metals & Mining (0.8%) | |||||||||||
| Phelps Dodge Corp. | 1,900 | 304,950 | |||||||||
| Telecommunication Services (0.9%) | |||||||||||
| Wireless Telecommunication Services (0.9%) | |||||||||||
| American Tower Corp., Class A (a) | 11,600 | 358,904 | |||||||||
| Total Common Stocks (Cost of $31,630,588) | 36,619,844 | ||||||||||
See Accompanying Notes to Financial Statements.
72
CMG LARGE CAP GROWTH FUND
A Portfolio of CMG Fund Trust
SCHEDULE OF INVESTMENTS
| Par | Value | ||||||||||
| Short-Term Obligation (3.0%) | |||||||||||
| Repurchase agreement with State Street Bank & Trust Co., dated 01/31/06, due 02/01/06 at 4.270%, collateralized by a U.S. Treasury Note maturing 11/15/08, market value of $1,174,098 (repurchase proceeds $1,149,136) | $ | 1,149,000 | $ | 1,149,000 | |||||||
| Total Short-Term Obligation (Cost of $1,149,000) | 1,149,000 | ||||||||||
| Total Investments (98.7%) (Cost of $32,779,588) (d) | 37,768,844 | ||||||||||
| Other Assets & Liabilities, Net (1.3%) | 486,281 | ||||||||||
| Net Assets (100.0%) | $ | 38,255,125 | |||||||||
Notes to Schedule of Investments:
(a) Non-income producing security.
(b) Represents fair value as determined in good faith under procedures approved by the Board of Trustees.
(c) Security exempt from registration pursuant to Rule 144A under the Securities Act of 1933. This security may be resold in transactions exempt from registration, normally to qualified institutional buyers. At January 31, 2006, the value of this security, which is not illiquid, represents 0.5% of net assets.
(d) Cost for federal income tax purposes is $32,779,588.
At January 31, 2006, the Fund held investments in the following sectors:
| Sector | % of Net Assets | ||||||
| Information Technology | 28.1 | % | |||||
| Health Care | 19.6 | ||||||
| Industrials | 13.4 | ||||||
| Consumer Discretionary | 12.2 | ||||||
| Financials | 8.9 | ||||||
| Consumer Staples | 6.3 | ||||||
| Energy | 4.6 | ||||||
| Materials | 1.7 | ||||||
| Telecommunication Services | 0.9 | ||||||
| Short-Term Obligation | 3.0 | ||||||
| Other Assets & Liabilities, Net | 1.3 | ||||||
| 100.0 | % | ||||||
| Acronym | Name | ||||||
| ADR | American Depositary Receipt | ||||||
| GDR | Global Depositary Receipt | ||||||
See Accompanying Notes to Financial Statements.
73
CMG LARGE CAP VALUE FUND
A Portfolio of CMG Fund Trust
SCHEDULE OF INVESTMENTS
January 31, 2006 (Unaudited)
| Shares | Value | ||||||||||
| Common Stocks (97.4%) | |||||||||||
| Consumer Discretionary (8.1%) | |||||||||||
| Auto Components (0.7%) | |||||||||||
| Johnson Controls, Inc. | 3,700 | $ | 256,188 | ||||||||
| Hotels, Restaurants & Leisure (3.0%) | |||||||||||
| Carnival Corp. | 3,500 | 181,160 | |||||||||
| McDonald's Corp. | 12,266 | 429,433 | |||||||||
| Starwood Hotels & Resorts Worldwide, Inc. | 7,900 | 480,399 | |||||||||
| 1,090,992 | |||||||||||
| Media (0.4%) | |||||||||||
| CBS Corp., Class A | 2,217 | 58,085 | |||||||||
| Viacom, Inc., Class A (a) | 2,217 | 92,006 | |||||||||
| 150,091 | |||||||||||
| Multiline Retail (2.6%) | |||||||||||
| Federated Department Stores, Inc. | 6,716 | 447,487 | |||||||||
| J.C. Penney Co., Inc. | 9,176 | 512,021 | |||||||||
| 959,508 | |||||||||||
| Specialty Retail (1.4%) | |||||||||||
| Office Depot, Inc. (a) | 7,200 | 238,680 | |||||||||
| Staples, Inc. | 12,100 | 286,891 | |||||||||
| 525,571 | |||||||||||
| Consumer Staples (4.9%) | |||||||||||
| Beverages (1.9%) | |||||||||||
| Diageo PLC, ADR | 5,999 | 360,060 | |||||||||
| PepsiCo, Inc. | 6,058 | 346,396 | |||||||||
| 706,456 | |||||||||||
| Food Products (0.9%) | |||||||||||
| Cadbury Schweppes PLC, ADR | 8,600 | 342,538 | |||||||||
| Tobacco (2.1%) | |||||||||||
| Altria Group, Inc. | 10,429 | 754,434 | |||||||||
| Energy (14.3%) | |||||||||||
| Energy Equipment & Services (3.4%) | |||||||||||
| Halliburton Co. | 5,277 | 419,785 | |||||||||
| Nabors Industries Ltd. (a) | 3,200 | 260,000 | |||||||||
| National-Oilwell Varco, Inc. (a) | 3,300 | 251,031 | |||||||||
| Schlumberger Ltd. | 2,625 | 334,556 | |||||||||
| 1,265,372 | |||||||||||
| Oil & Gas Services (10.9%) | |||||||||||
| Chevron Corp. | 5,685 | 337,575 | |||||||||
| ConocoPhillips | 4,032 | 260,871 | |||||||||
| Exxon Mobil Corp. | 19,835 | 1,244,646 | |||||||||
| Marathon Oil Corp. | 4,664 | 358,522 | |||||||||
| Murphy Oil Corp. | 2,700 | 153,900 | |||||||||
See Accompanying Notes to Financial Statements.
74
CMG LARGE CAP VALUE FUND
A Portfolio of CMG Fund Trust
SCHEDULE OF INVESTMENTS
| Shares | Value | ||||||||||
| Common Stocks (continued) | |||||||||||
| Oil & Gas Services (continued) | |||||||||||
| Occidental Petroleum Corp. | 8,300 | $ | 810,993 | ||||||||
| Valero Energy Corp. | 6,100 | 380,823 | |||||||||
| Williams Companies, Inc. | 18,700 | 445,808 | |||||||||
| 3,993,138 | |||||||||||
| Financials (34.7%) | |||||||||||
| Capital Markets (7.2%) | |||||||||||
| Bank of New York Co., Inc. | 11,995 | 381,561 | |||||||||
| Deutsche Bank AG, Registered Shares | 1,000 | 107,430 | |||||||||
| Franklin Resources, Inc. | 2,419 | 238,271 | |||||||||
| Goldman Sachs Group, Inc. | 2,655 | 375,019 | |||||||||
| Lehman Brothers Holdings, Inc. | 1,700 | 238,765 | |||||||||
| Merrill Lynch & Co., Inc. | 10,880 | 816,762 | |||||||||
| Morgan Stanley | 4,580 | 281,441 | |||||||||
| Nuveen Investments, Class A | 5,000 | 226,850 | |||||||||
| 2,666,099 | |||||||||||
| Commercial Banks (11.8%) | |||||||||||
| Marshall & Ilsley Corp. | 9,820 | 411,851 | |||||||||
| Mitsubishi UFJ Financial Group, Inc., ADR | 15,400 | 222,530 | |||||||||
| North Fork Bancorporation, Inc. | 14,522 | 373,506 | |||||||||
| PNC Financial Services Group, Inc. | 5,500 | 356,730 | |||||||||
| SunTrust Banks, Inc. | 2,400 | 171,480 | |||||||||
| U.S. Bancorp | 26,546 | 793,991 | |||||||||
| UnionBanCal Corp. | 4,000 | 268,360 | |||||||||
| Wachovia Corp. | 16,586 | 909,410 | |||||||||
| Wells Fargo & Co. | 13,028 | 812,426 | |||||||||
| 4,320,284 | |||||||||||
| Diversified Financial Services (3.9%) | |||||||||||
| CIT Group, Inc. | 4,700 | 250,698 | |||||||||
| Citigroup, Inc. | 18,085 | 842,399 | |||||||||
| JPMorgan Chase & Co. | 8,500 | 337,875 | |||||||||
| 1,430,972 | |||||||||||
| Insurance (7.5%) | |||||||||||
| ACE Ltd. | 3,300 | 180,675 | |||||||||
| Allstate Corp. | 6,314 | 328,644 | |||||||||
| Ambac Financial Group, Inc. | 4,635 | 356,014 | |||||||||
| American International Group, Inc. | 8,351 | 546,656 | |||||||||
| Genworth Financial, Inc., Class A | 9,500 | 311,220 | |||||||||
| Hartford Financial Services Group, Inc. | 4,055 | 333,443 | |||||||||
| St. Paul Travelers Companies, Inc. | 7,100 | 322,198 | |||||||||
| UnumProvident Corp. | 9,166 | 186,345 | |||||||||
| XL Capital Ltd., Class A | 2,741 | 185,456 | |||||||||
| 2,750,651 | |||||||||||
See Accompanying Notes to Financial Statements.
75
CMG LARGE CAP VALUE FUND
A Portfolio of CMG Fund Trust
SCHEDULE OF INVESTMENTS
| Shares | Value | ||||||||||
| Common Stocks (continued) | |||||||||||
| Real Estate (3.1%) | |||||||||||
| Archstone-Smith Trust, REIT | 6,055 | $ | 283,738 | ||||||||
| Host Marriott Corp., REIT | 15,900 | 317,205 | |||||||||
| Kimco Realty Corp., REIT | 8,836 | 310,055 | |||||||||
| ProLogis Trust, REIT | 4,400 | 225,368 | |||||||||
| 1,136,366 | |||||||||||
| Thrifts & Mortgage Finance (1.2%) | |||||||||||
| Golden West Financial Corp. | 6,400 | 451,968 | |||||||||
| Health Care (8.0%) | |||||||||||
| Health Care Equipment & Supplies (0.8%) | |||||||||||
| Baxter International, Inc. | 7,700 | 283,745 | |||||||||
| Health Care Providers & Services (1.8%) | |||||||||||
| Aetna, Inc. | 2,772 | 268,330 | |||||||||
| CIGNA Corp. | 3,252 | 395,443 | |||||||||
| 663,773 | |||||||||||
| Pharmaceuticals (5.4%) | |||||||||||
| AstraZeneca PLC, ADR | 7,400 | 359,936 | |||||||||
| GlaxoSmithKline PLC, ADR | 6,965 | 356,886 | |||||||||
| Novartis AG, ADR | 6,848 | 377,736 | |||||||||
| Pfizer, Inc. | 19,362 | 497,216 | |||||||||
| Sanofi-Aventis, ADR | 8,300 | 381,800 | |||||||||
| 1,973,574 | |||||||||||
| Industrials (10.1%) | |||||||||||
| Aerospace & Defense (3.4%) | |||||||||||
| General Dynamics Corp. | 3,187 | 370,839 | |||||||||
| Goodrich Corp. | 8,400 | 330,708 | |||||||||
| United Technologies Corp. | 9,496 | 554,282 | |||||||||
| 1,255,829 | |||||||||||
| Building Products (0.7%) | |||||||||||
| American Standard Companies, Inc. | 6,400 | 230,400 | |||||||||
| Industrial Conglomerates (0.9%) | |||||||||||
| General Electric Co. | 10,092 | 330,513 | |||||||||
| Machinery (3.0%) | |||||||||||
| Caterpillar, Inc. | 8,200 | 556,780 | |||||||||
| Eaton Corp. | 3,791 | 250,964 | |||||||||
| Ingersoll-Rand Co., Ltd., Class A | 7,700 | 302,379 | |||||||||
| 1,110,123 | |||||||||||
| Road & Rail (2.1%) | |||||||||||
| Burlington Northern Santa Fe Corp. | 7,100 | 568,852 | |||||||||
| Norfolk Southern Corp. | 3,900 | 194,376 | |||||||||
| 763,228 | |||||||||||
See Accompanying Notes to Financial Statements.
76
CMG LARGE CAP VALUE FUND
A Portfolio of CMG Fund Trust
SCHEDULE OF INVESTMENTS
| Shares | Value | ||||||||||
| Common Stocks (continued) | |||||||||||
| Information Technology (5.4%) | |||||||||||
| Communications Equipment (1.2%) | |||||||||||
| Motorola, Inc. | 8,700 | $ | 197,577 | ||||||||
| Nokia Oyj, ADR | 12,600 | 231,588 | |||||||||
| 429,165 | |||||||||||
| Computers & Peripherals (2.6%) | |||||||||||
| Dell, Inc. (a) | 2,700 | 79,137 | |||||||||
| Hewlett-Packard Co. | 18,000 | 561,240 | |||||||||
| International Business Machines Corp. | 3,736 | 303,737 | |||||||||
| 944,114 | |||||||||||
| Electronic Equipment & Instruments (0.5%) | |||||||||||
| Agilent Technologies, Inc. (a) | 5,300 | 179,723 | |||||||||
| Semiconductors & Semiconductor Equipment (1.1%) | |||||||||||
| Intel Corp. | 6,353 | 135,128 | |||||||||
| Taiwan Semiconductor Manufacturing Co., Ltd., ADR | 26,500 | 286,200 | |||||||||
| 421,328 | |||||||||||
| Materials (4.0%) | |||||||||||
| Chemicals (0.7%) | |||||||||||
| Rohm and Haas Co. | 5,500 | 279,950 | |||||||||
| Containers & Packaging (0.5%) | |||||||||||
| Crown Holdings, Inc. (a) | 9,500 | 177,745 | |||||||||
| Metals & Mining (2.8%) | |||||||||||
| Freeport-McMoRan Copper & Gold, Inc., Class B | 4,200 | 269,850 | |||||||||
| Nucor Corp. | 2,200 | 185,306 | |||||||||
| Rio Tinto PLC, ADR | 1,800 | 369,018 | |||||||||
| United States Steel Corp. | 3,200 | 191,200 | |||||||||
| 1,015,374 | |||||||||||
| Telecommunication Services (2.3%) | |||||||||||
| Diversified Telecommunication Services (2.3%) | |||||||||||
| AT&T, Inc. | 15,957 | 414,084 | |||||||||
| Verizon Communications, Inc. | 13,470 | 426,460 | |||||||||
| 840,544 | |||||||||||
| Utilities (5.6%) | |||||||||||
| Electric Utilities (4.7%) | |||||||||||
| Edison International | 7,600 | 333,032 | |||||||||
| Entergy Corp. | 5,873 | 408,232 | |||||||||
| Exelon Corp. | 10,851 | 623,065 | |||||||||
| FPL Group, Inc. | 8,900 | 371,931 | |||||||||
| 1,736,260 | |||||||||||
See Accompanying Notes to Financial Statements.
77
CMG LARGE CAP VALUE FUND
A Portfolio of CMG Fund Trust
SCHEDULE OF INVESTMENTS
| Shares | Value | ||||||||||
| Common Stocks (continued) | |||||||||||
| Multi-Utilities (0.9%) | |||||||||||
| PG&E Corp. | 8,833 | $ | 329,559 | ||||||||
| Total Common Stocks (Cost of $30,984,168) | 35,765,575 | ||||||||||
| Convertible Preferred Stock (0.5%) | |||||||||||
| Financials (0.5%) | |||||||||||
| Insurance (0.5%) | |||||||||||
| XL Capital Ltd., Class A, 7.000% | 7,160 | 181,435 | |||||||||
| Total Convertible Preferred Stock (Cost of $180,200) | 181,435 | ||||||||||
| Par | |||||||||||
| Short-Term Obligation (1.0%) | |||||||||||
| Repurchase agreement with State Street Bank & Trust Co., dated 01/31/06, due 02/01/06 at 4.270%, collateralized by a U.S. Treasury Note maturing 10/15/09, market value of $388,781 (repurchase proceeds $381,045) | $ | 381,000 | 381,000 | ||||||||
| Total Short-Term Obligation (Cost of $381,000) | 381,000 | ||||||||||
| Total Investments (98.9%) (Cost of $31,545,368) (b) | 36,328,010 | ||||||||||
| Other Assets & Liabilities, Net (1.1%) | 393,713 | ||||||||||
| Net Assets (100.0%) | $ | 36,721,723 | |||||||||
Notes to Schedule of Investments:
(a) Non-income producing security.
(b) Cost for federal income tax purposes is $31,545,368.
See Accompanying Notes to Financial Statements.
78
CMG LARGE CAP VALUE FUND
A Portfolio of CMG Fund Trust
SCHEDULE OF INVESTMENTS
At January 31, 2006, the Fund held investments in the following sectors:
| Sector | % of Net Assets | ||||||
| Financials | 35.2 | % | |||||
| Energy | 14.3 | ||||||
| Industrials | 10.1 | ||||||
| Consumer Discretionary | 8.1 | ||||||
| Health Care | 8.0 | ||||||
| Utilities | 5.6 | ||||||
| Information Technology | 5.4 | ||||||
| Consumer Staples | 4.9 | ||||||
| Materials | 4.0 | ||||||
| Telecommunication Services | 2.3 | ||||||
| Short-Term Obligation | 1.0 | ||||||
| Other Assets & Liabilities, Net | 1.1 | ||||||
| 100.0 | % | ||||||
| Acronym | Name | ||||||
| ADR | American Depositary Receipt | ||||||
| REIT | Real Estate Investment Trust | ||||||
See Accompanying Notes to Financial Statements.
79
CMG MID CAP GROWTH FUND
A Portfolio of CMG Fund Trust
SCHEDULE OF INVESTMENTS
January 31, 2006 (Unaudited)
| Shares | Value | ||||||||||
| Common Stocks (96.0%) | |||||||||||
| Consumer Discretionary (17.3%) | |||||||||||
| Auto Components (0.5%) | |||||||||||
| Autoliv, Inc. | 2,570 | $ | 125,904 | ||||||||
| Diversified Consumer Services (0.3%) | |||||||||||
| Education Management Corp. (a) | 2,680 | 82,062 | |||||||||
| Hotels, Restaurants & Leisure (5.4%) | |||||||||||
| Applebee's International, Inc. | 4,310 | 103,311 | |||||||||
| Brinker International, Inc. | 2,400 | 97,680 | |||||||||
| Cheesecake Factory, Inc. (a) | 5,800 | 213,730 | |||||||||
| Harrah's Entertainment, Inc. | 1,555 | 114,448 | |||||||||
| Hilton Hotels Corp. | 8,270 | 206,171 | |||||||||
| Marriott International, Inc., Class A | 1,990 | 132,614 | |||||||||
| Scientific Games Corp., Class A (a) | 3,290 | 105,445 | |||||||||
| Starwood Hotels & Resorts Worldwide, Inc. | 1,830 | 111,282 | |||||||||
| Wendy's International, Inc. | 1,850 | 109,057 | |||||||||
| Yum! Brands, Inc. | 4,460 | 220,636 | |||||||||
| 1,414,374 | |||||||||||
| Household Durables (1.0%) | |||||||||||
| Centex Corp. | 790 | 56,398 | |||||||||
| D.R. Horton, Inc. | 2,633 | 98,263 | |||||||||
| Fortune Brands, Inc. | 1,510 | 113,190 | |||||||||
| 267,851 | |||||||||||
| Internet & Catalog Retail (0.6%) | |||||||||||
| NetFlix, Inc. (a) | 6,110 | 168,331 | |||||||||
| Leisure Equipment & Products (0.5%) | |||||||||||
| SCP Pool Corp. | 3,010 | 120,039 | |||||||||
| Media (2.9%) | |||||||||||
| Cablevision Systems Corp. (a) | 2,500 | 61,500 | |||||||||
| Getty Images, Inc. (a) | 1,440 | 117,576 | |||||||||
| Grupo Televisa SA, ADR | 2,160 | 180,468 | |||||||||
| Lamar Advertising Co., Class A (a) | 1,870 | 85,870 | |||||||||
| XM Satellite Radio Holdings, Inc., Class A (a) | 11,670 | 305,521 | |||||||||
| 750,935 | |||||||||||
| Specialty Retail (4.8%) | |||||||||||
| Abercrombie & Fitch Co., Class A | 4,130 | 274,191 | |||||||||
| Chico's FAS, Inc. (a) | 11,030 | 480,467 | |||||||||
| Children's Place Retail Stores, Inc. (a) | 1,890 | 82,763 | |||||||||
| GameStop Corp., Class A (a) | 4,310 | 173,736 | |||||||||
| PETsMART, Inc. | 4,550 | 114,023 | |||||||||
| Urban Outfitters, Inc. (a) | 4,420 | 120,710 | |||||||||
| 1,245,890 | |||||||||||
See Accompanying Notes to Financial Statements.
80
CMG MID CAP GROWTH FUND
A Portfolio of CMG Fund Trust
SCHEDULE OF INVESTMENTS
| Shares | Value | ||||||||||
| Common Stocks (continued) | |||||||||||
| Textiles, Apparel & Luxury Goods (1.3%) | |||||||||||
| Coach, Inc. (a) | 9,790 | $ | 351,950 | ||||||||
| Consumer Staples (1.7%) | |||||||||||
| Food & Staples Retailing (0.5%) | |||||||||||
| Whole Foods Market, Inc. | 1,860 | 137,398 | |||||||||
| Food Products (0.5%) | |||||||||||
| H.J. Heinz Co. | 2,510 | 85,189 | |||||||||
| Tyson Foods, Inc., Class A | 3,590 | 51,445 | |||||||||
| 136,634 | |||||||||||
| Personal Products (0.5%) | |||||||||||
| Alberto-Culver Co., Class B | 1,780 | 78,854 | |||||||||
| Estee Lauder Companies, Inc., Class A | 1,710 | 62,364 | |||||||||
| 141,218 | |||||||||||
| Tobacco (0.2%) | |||||||||||
| UST, Inc. | 1,070 | 41,666 | |||||||||
| Energy (11.3%) | |||||||||||
| Energy Equipment & Services (5.4%) | |||||||||||
| BJ Services Co. | 3,300 | 133,617 | |||||||||
| Diamond Offshore Drilling, Inc. | 2,180 | 185,017 | |||||||||
| ENSCO International, Inc. | 2,830 | 144,670 | |||||||||
| FMC Technologies, Inc. (a) | 4,730 | 245,108 | |||||||||
| Grant Prideco, Inc. (a) | 3,820 | 191,344 | |||||||||
| Nabors Industries Ltd. (a) | 1,840 | 149,500 | |||||||||
| National-Oilwell Varco, Inc. (a) | 1,770 | 134,644 | |||||||||
| Smith International, Inc. | 5,260 | 236,700 | |||||||||
| 1,420,600 | |||||||||||
| Oil, Gas & Consumable Fuels (5.9%) | |||||||||||
| Chesapeake Energy Corp. | 3,010 | 105,470 | |||||||||
| EOG Resources, Inc. | 3,930 | 332,242 | |||||||||
| Massey Energy Co. | 3,070 | 126,638 | |||||||||
| Peabody Energy Corp. | 2,240 | 222,902 | |||||||||
| Southwestern Energy Co. (a) | 7,170 | 309,314 | |||||||||
| Tesoro Petroleum Corp. | 1,740 | 126,098 | |||||||||
| XTO Energy, Inc. | 6,314 | 309,891 | |||||||||
| 1,532,555 | |||||||||||
| Financials (6.7%) | |||||||||||
| Capital Markets (4.0%) | |||||||||||
| Affiliated Managers Group, Inc. (a) | 2,470 | 229,216 | |||||||||
| E*TRADE Financial Corp. (a) | 7,590 | 180,566 | |||||||||
| Lazard Ltd., Class A | 7,400 | 265,364 | |||||||||
| Legg Mason, Inc. | 1,300 | 168,610 | |||||||||
| T. Rowe Price Group, Inc. | 2,660 | 203,304 | |||||||||
| 1,047,060 | |||||||||||
See Accompanying Notes to Financial Statements.
81
CMG MID CAP GROWTH FUND
A Portfolio of CMG Fund Trust
SCHEDULE OF INVESTMENTS
| Shares | Value | ||||||||||
| Common Stocks (continued) | |||||||||||
| Commercial Banks (1.4%) | |||||||||||
| East West Bancorp, Inc. | 4,730 | $ | 174,584 | ||||||||
| Zions Bancorporation | 2,330 | 184,233 | |||||||||
| 358,817 | |||||||||||
| Diversified Financial Services (0.8%) | |||||||||||
| Chicago Mercantile Exchange | 510 | 215,857 | |||||||||
| Insurance (0.5%) | |||||||||||
| Ambac Financial Group, Inc. | 1,865 | 143,251 | |||||||||
| Health Care (17.6%) | |||||||||||
| Biotechnology (2.6%) | |||||||||||
| Amylin Pharmaceuticals, Inc. (a) | 4,330 | 183,592 | |||||||||
| Celgene Corp. (a) | 1,100 | 78,265 | |||||||||
| Invitrogen Corp. (a) | 730 | 50,282 | |||||||||
| MedImmune, Inc. (a) | 3,300 | 112,596 | |||||||||
| Nektar Therapeutics (a) | 5,610 | 111,078 | |||||||||
| Neurocrine Biosciences, Inc. (a) | 2,380 | 144,633 | |||||||||
| 680,446 | |||||||||||
| Health Care Equipment & Supplies (4.5%) | |||||||||||
| Biomet, Inc. | 4,800 | 181,488 | |||||||||
| DENTSPLY International, Inc. | 1,620 | 86,994 | |||||||||
| Gen-Probe, Inc. (a) | 3,790 | 191,130 | |||||||||
| ResMed, Inc. (a) | 3,972 | 156,656 | |||||||||
| Thermo Electron Corp. (a) | 5,430 | 182,665 | |||||||||
| Varian Medical Systems, Inc. (a) | 4,460 | 268,536 | |||||||||
| Waters Corp. (a) | 2,660 | 111,587 | |||||||||
| 1,179,056 | |||||||||||
| Health Care Providers & Services (6.9%) | |||||||||||
| Cerner Corp. (a) | 2,920 | 131,400 | |||||||||
| Community Health Systems, Inc. (a) | 3,175 | 115,538 | |||||||||
| Coventry Health Care, Inc. (a) | 5,050 | 300,829 | |||||||||
| DaVita, Inc. (a) | 4,767 | 260,993 | |||||||||
| Health Management Associates, Inc., Class A | 3,820 | 80,296 | |||||||||
| Henry Schein, Inc. (a) | 2,250 | 104,940 | |||||||||
| Humana, Inc. (a) | 3,760 | 209,695 | |||||||||
| Laboratory Corp. of America Holdings (a) | 3,350 | 196,478 | |||||||||
| Lincare Holdings, Inc. (a) | 1,280 | 54,093 | |||||||||
| Medco Health Solutions, Inc. (a) | 1,730 | 93,593 | |||||||||
| Quest Diagnostics, Inc. | 1,880 | 92,929 | |||||||||
| United Surgical Partners International, Inc. (a) | 4,120 | 159,691 | |||||||||
| 1,800,475 | |||||||||||
| Pharmaceuticals (3.6%) | |||||||||||
| Allergan, Inc. | 1,980 | 230,472 | |||||||||
| Endo Pharmaceuticals Holdings, Inc. (a) | 4,307 | 123,611 | |||||||||
| Forest Laboratories, Inc. (a) | 2,140 | 99,039 | |||||||||
| Medicis Pharmaceutical Corp., Class A | 3,770 | 116,531 | |||||||||
See Accompanying Notes to Financial Statements.
82
CMG MID CAP GROWTH FUND
A Portfolio of CMG Fund Trust
SCHEDULE OF INVESTMENTS
| Shares | Value | ||||||||||
| Common Stocks (continued) | |||||||||||
| Pharmaceuticals (continued) | |||||||||||
| Shire Pharmaceuticals Group PLC, ADR | 3,640 | $ | 177,450 | ||||||||
| Teva Pharmaceutical Industries Ltd., ADR | 4,820 | 205,476 | |||||||||
| 952,579 | |||||||||||
| Industrials (11.7%) | |||||||||||
| Aerospace & Defense (1.7%) | |||||||||||
| Armor Holdings, Inc. (a) | 2,490 | 118,698 | |||||||||
| BE Aerospace, Inc. (a) | 4,740 | 99,635 | |||||||||
| Rockwell Collins, Inc. | 4,640 | 217,709 | |||||||||
| 436,042 | |||||||||||
| Air Freight & Logistics (1.4%) | |||||||||||
| C.H. Robinson Worldwide, Inc. | 5,150 | 208,369 | |||||||||
| UTI Worldwide, Inc. | 1,630 | 170,710 | |||||||||
| 379,079 | |||||||||||
| Airlines (0.5%) | |||||||||||
| Southwest Airlines Co. | 8,610 | 141,721 | |||||||||
| Commercial Services & Supplies (3.5%) | |||||||||||
| ChoicePoint, Inc. (a) | 4,955 | 203,750 | |||||||||
| Cintas Corp. | 2,040 | 86,904 | |||||||||
| Corporate Executive Board Co. | 4,015 | 337,822 | |||||||||
| Robert Half International, Inc. | 8,180 | 298,815 | |||||||||
| 927,291 | |||||||||||
| Construction & Engineering (0.5%) | |||||||||||
| Jacobs Engineering Group, Inc. (a) | 1,500 | 125,055 | |||||||||
| Electrical Equipment (1.1%) | |||||||||||
| Rockwell Automation, Inc. | 3,520 | 232,566 | |||||||||
| Roper Industries, Inc. | 1,190 | 48,017 | |||||||||
| 280,583 | |||||||||||
| Machinery (2.5%) | |||||||||||
| Joy Global, Inc. | 6,965 | 376,388 | |||||||||
| Terex Corp. (a) | 3,770 | 265,785 | |||||||||
| 642,173 | |||||||||||
| Road & Rail (0.5%) | |||||||||||
| Landstar System, Inc. | 3,150 | 133,245 | |||||||||
| Information Technology (19.0%) | |||||||||||
| Communications Equipment (2.6%) | |||||||||||
| Comverse Technology, Inc. (a) | 9,250 | 253,358 | |||||||||
| CSR PLC (a) | 13,690 | 272,770 | |||||||||
| F5 Networks, Inc. (a) | 1,380 | 89,286 | |||||||||
| Harris Corp. | 1,570 | 72,895 | |||||||||
| 688,309 | |||||||||||
See Accompanying Notes to Financial Statements.
83
CMG MID CAP GROWTH FUND
A Portfolio of CMG Fund Trust
SCHEDULE OF INVESTMENTS
| Shares | Value | ||||||||||
| Common Stocks (continued) | |||||||||||
| Computers & Peripherals (0.3%) | |||||||||||
| Sun Microsystems, Inc. (a) | 15,340 | $ | 69,030 | ||||||||
| Electronic Equipment & Instruments (0.6%) | |||||||||||
| Trimble Navigation Ltd. (a) | 3,760 | 150,475 | |||||||||
| Internet Software & Services (0.5%) | |||||||||||
| VeriSign, Inc. (a) | 6,150 | 146,062 | |||||||||
| IT Services (3.8%) | |||||||||||
| Affiliated Computer Services, Inc., Class A (a) | 1,640 | 102,664 | |||||||||
| Alliance Data Systems Corp. (a) | 5,750 | 242,937 | |||||||||
| Cognizant Technology Solutions Corp., Class A (a) | 4,470 | 234,094 | |||||||||
| Fiserv, Inc. (a) | 2,020 | 88,840 | |||||||||
| Global Payments, Inc. | 3,490 | 177,746 | |||||||||
| Paychex, Inc. | 4,430 | 161,030 | |||||||||
| 1,007,311 | |||||||||||
| Semiconductors & Semiconductor Equipment (7.0%) | |||||||||||
| Advanced Micro Devices, Inc. (a) | 3,030 | 126,836 | |||||||||
| Broadcom Corp., Class A (a) | 11,330 | 772,706 | |||||||||
| Intersil Corp., Class A | 5,140 | 149,368 | |||||||||
| Marvell Technology Group Ltd. (a) | 5,370 | 367,416 | |||||||||
| MEMC Electronic Materials, Inc. (a) | 5,190 | 148,330 | |||||||||
| National Semiconductor Corp. | 4,690 | 132,305 | |||||||||
| NVIDIA Corp. (a) | 2,880 | 129,485 | |||||||||
| 1,826,446 | |||||||||||
| Software (4.2%) | |||||||||||
| Amdocs Ltd. (a) | 4,170 | 134,274 | |||||||||
| Autodesk, Inc. | 3,017 | 122,460 | |||||||||
| Check Point Software Technologies Ltd. (a) | 5,580 | 120,751 | |||||||||
| Citrix Systems, Inc. (a) | 7,040 | 217,114 | |||||||||
| Hyperion Solutions Corp. (a) | 3,840 | 132,135 | |||||||||
| McAfee, Inc. (a) | 2,160 | 50,090 | |||||||||
| Mercury Interactive Corp. (a) | 3,095 | 107,551 | |||||||||
| NAVTEQ Corp. (a) | 4,680 | 210,179 | |||||||||
| 1,094,554 | |||||||||||
| Materials (5.5%) | |||||||||||
| Chemicals (1.9%) | |||||||||||
| Ecolab, Inc. | 2,750 | 98,477 | |||||||||
| Potash Corp. of Saskatchewan, Inc. | 4,410 | 396,856 | |||||||||
| 495,333 | |||||||||||
| Construction Materials (1.1%) | |||||||||||
| Cemex SA de CV, ADR | 2,110 | 139,218 | |||||||||
| Eagle Materials, Inc. | 1,010 | 164,519 | |||||||||
| 303,737 | |||||||||||
See Accompanying Notes to Financial Statements.
84
CMG MID CAP GROWTH FUND
A Portfolio of CMG Fund Trust
SCHEDULE OF INVESTMENTS
| Shares | Value | ||||||||||
| Common Stocks (continued) | |||||||||||
| Metals & Mining (2.5%) | |||||||||||
| Allegheny Technologies, Inc. | 1,560 | $ | 80,886 | ||||||||
| Freeport-McMoRan Copper & Gold, Inc., Class B | 3,570 | 229,373 | |||||||||
| Inco Ltd. | 2,040 | 104,611 | |||||||||
| Phelps Dodge Corp. | 1,450 | 232,725 | |||||||||
| 647,595 | |||||||||||
| Telecommunication Services (4.2%) | |||||||||||
| Wireless Telecommunication Services (4.2%) | |||||||||||
| American Tower Corp., Class A (a) | 12,356 | 382,295 | |||||||||
| Crown Castle International Corp. (a) | 6,880 | 217,614 | |||||||||
| Millicom International Cellular SA (a) | 5,810 | 223,685 | |||||||||
| NII Holdings, Inc. (a) | 4,060 | 200,807 | |||||||||
| VimpelCom, ADR (a) | 1,860 | 87,048 | |||||||||
| 1,111,449 | |||||||||||
| Utilities (1.0%) | |||||||||||
| Independent Power Producers & Energy Traders (1.0%) | |||||||||||
| AES Corp. (a) | 14,580 | 248,443 | |||||||||
| Total Common Stocks (Cost of $17,961,140) | 25,168,881 | ||||||||||
| Par | |||||||||||
| Short-Term Obligation (3.7%) | |||||||||||
| Repurchase agreement with State Street Bank & Trust Co., dated 01/31/06, due 02/01/06 at 4.270%, collateralized by a U.S. Treasury Note maturing 11/15/08, market value of $1,001,287 (repurchase proceeds $981,116) | $ | 981,000 | 981,000 | ||||||||
| Total Short-Term Obligation (Cost of $981,000) | 981,000 | ||||||||||
| Total Investments (99.7%) (Cost of $18,942,140) (b) | 26,149,881 | ||||||||||
| Other Assets & Liabilities, Net (0.3%) | 77,565 | ||||||||||
| Net Assets (100.0%) | $ | 26,227,446 | |||||||||
Notes to Schedule of Investments:
(a) Non-income producing security.
(b) Cost for federal income tax purposes is $18,942,140.
See Accompanying Notes to Financial Statements.
85
CMG MID CAP GROWTH FUND
A Portfolio of CMG Fund Trust
SCHEDULE OF INVESTMENTS
At January 31, 2006, the Fund held investments in the following sectors:
| Sector | % of Net Assets | ||||||
| Information Technology | 19.0 | % | |||||
| Health Care | 17.6 | ||||||
| Consumer Discretionary | 17.3 | ||||||
| Industrials | 11.7 | ||||||
| Energy | 11.3 | ||||||
| Financials | 6.7 | ||||||
| Materials | 5.5 | ||||||
| Telecommunication Services | 4.2 | ||||||
| Consumer Staples | 1.7 | ||||||
| Utilities | 1.0 | ||||||
| Short -Term Obligation | 3.7 | ||||||
| Other Assets & Liabilities, Net | 0.3 | ||||||
| 100.0 | % | ||||||
| Acronym | Name | ||||||
| ADR | American Depositary Receipt | ||||||
See Accompanying Notes to Financial Statements.
86
CMG MID CAP VALUE FUND
A Portfolio of CMG Fund Trust
SCHEDULE OF INVESTMENTS
January 31, 2006 (Unaudited)
| Shares | Value | ||||||||||
| Common Stocks (95.0%) | |||||||||||
| Consumer Discretionary (10.2%) | |||||||||||
| Auto Components (1.5%) | |||||||||||
| BorgWarner, Inc. | 2,000 | $ | 110,260 | ||||||||
| Johnson Controls, Inc. | 2,500 | 173,100 | |||||||||
| 283,360 | |||||||||||
| Hotels, Restaurants & Leisure (2.3%) | |||||||||||
| Harrah's Entertainment, Inc. | 1,300 | 95,680 | |||||||||
| Outback Steakhouse, Inc. | 3,200 | 147,936 | |||||||||
| Starwood Hotels & Resorts Worldwide, Inc. | 2,900 | 176,349 | |||||||||
| 419,965 | |||||||||||
| Media (1.0%) | |||||||||||
| Dow Jones & Co., Inc. | 4,800 | 182,448 | |||||||||
| Multiline Retail (1.9%) | |||||||||||
| Federated Department Stores, Inc. | 2,108 | 140,456 | |||||||||
| J.C. Penney Co., Inc. | 3,800 | 212,040 | |||||||||
| 352,496 | |||||||||||
| Specialty Retail (3.5%) | |||||||||||
| Office Depot, Inc. (a) | 6,300 | 208,845 | |||||||||
| Pacific Sunwear of California, Inc. (a) | 3,900 | 95,589 | |||||||||
| Sherwin-Williams Co. | 2,700 | 142,830 | |||||||||
| TJX Companies, Inc. | 7,900 | 201,687 | |||||||||
| 648,951 | |||||||||||
| Consumer Staples (4.9%) | |||||||||||
| Beverages (0.8%) | |||||||||||
| Fomento Economico Mexicano SA de CV, ADR | 800 | 62,671 | |||||||||
| Pepsi Bottling Group, Inc. | 3,100 | 89,900 | |||||||||
| 152,571 | |||||||||||
| Food & Staples Retailing (1.7%) | |||||||||||
| Kroger Co. (a) | 6,600 | 121,440 | |||||||||
| SUPERVALU, Inc. | 5,900 | 188,387 | |||||||||
| 309,827 | |||||||||||
| Food Products (2.1%) | |||||||||||
| Corn Products International, Inc. | 4,849 | 132,232 | |||||||||
| Dean Foods Co. (a) | 4,600 | 174,478 | |||||||||
| Tyson Foods, Inc., Class A | 6,200 | 88,846 | |||||||||
| 395,556 | |||||||||||
| Tobacco (0.3%) | |||||||||||
| UST, Inc. | 1,200 | 46,728 | |||||||||
| Energy (7.1%) | |||||||||||
| Energy Equipment & Services (2.5%) | |||||||||||
| Dresser-Rand Group, Inc. (a) | 2,800 | 75,404 | |||||||||
| National-Oilwell Varco, Inc. (a) | 1,525 | 116,007 | |||||||||
See Accompanying Notes to Financial Statements.
87
CMG MID CAP VALUE FUND
A Portfolio of CMG Fund Trust
SCHEDULE OF INVESTMENTS
| Shares | Value | ||||||||||
| Common Stocks (continued) | |||||||||||
| Energy Equipment & Services (continued) | |||||||||||
| Technip SA, ADR | 1,500 | $ | 102,255 | ||||||||
| Weatherford International Ltd. (a) | 3,800 | 170,164 | |||||||||
| 463,830 | |||||||||||
| Oil, Gas & Consumable Fuels (4.6%) | |||||||||||
| Amerada Hess Corp. | 700 | 108,360 | |||||||||
| EOG Resources, Inc. | 700 | 59,178 | |||||||||
| Kerr-McGee Corp. | 1,300 | 143,507 | |||||||||
| Marathon Oil Corp. | 614 | 47,198 | |||||||||
| Murphy Oil Corp. | 1,200 | 68,400 | |||||||||
| Peabody Energy Corp. | 1,200 | 119,412 | |||||||||
| Williams Companies, Inc. | 8,500 | 202,640 | |||||||||
| XTO Energy, Inc. | 1,966 | 96,491 | |||||||||
| 845,186 | |||||||||||
| Financials (26.5%) | |||||||||||
| Capital Markets (1.8%) | |||||||||||
| Bear Stearns Companies, Inc. | 1,600 | 202,336 | |||||||||
| Nuveen Investments, Class A | 2,000 | 90,740 | |||||||||
| Waddell & Reed Financial, Inc., Class A | 2,000 | 44,560 | |||||||||
| 337,636 | |||||||||||
| Commercial Banks (9.8%) | |||||||||||
| Bank of Hawaii Corp. | 3,800 | 198,398 | |||||||||
| City National Corp. | 1,850 | 138,695 | |||||||||
| Comerica, Inc. | 3,100 | 171,957 | |||||||||
| Cullen/Frost Bankers, Inc. | 3,250 | 174,655 | |||||||||
| Marshall & Ilsley Corp. | 5,000 | 209,700 | |||||||||
| Mercantile Bankshares Corp. | 4,350 | 165,082 | |||||||||
| North Fork Bancorporation, Inc. | 6,950 | 178,754 | |||||||||
| SVB Financial Group (a) | 1,900 | 94,012 | |||||||||
| UnionBanCal Corp. | 2,300 | 154,307 | |||||||||
| Whitney Holding Corp. | 3,300 | 108,570 | |||||||||
| Zions Bancorporation | 2,600 | 205,582 | |||||||||
| 1,799,712 | |||||||||||
| Diversified Financial Services (0.9%) | |||||||||||
| CIT Group, Inc. | 3,200 | 170,688 | |||||||||
| Insurance (6.6%) | |||||||||||
| Ambac Financial Group, Inc. | 2,550 | 195,866 | |||||||||
| Conseco, Inc. (a) | 3,800 | 92,606 | |||||||||
| Endurance Specialty Holdings Ltd. | 4,500 | 148,185 | |||||||||
| Genworth Financial, Inc., Class A | 3,700 | 121,212 | |||||||||
| Lincoln National Corp. | 2,500 | 136,325 | |||||||||
| Loews Corp. | 1,400 | 138,166 | |||||||||
| Old Republic International Corp. | 7,625 | 163,556 | |||||||||
| Willis Group Holdings Ltd. | 4,100 | 142,311 | |||||||||
| XL Capital Ltd., Class A | 1,200 | 81,192 | |||||||||
| 1,219,419 | |||||||||||
See Accompanying Notes to Financial Statements.
88
CMG MID CAP VALUE FUND
A Portfolio of CMG Fund Trust
SCHEDULE OF INVESTMENTS
| Shares | Value | ||||||||||
| Common Stocks (continued) | |||||||||||
| Real Estate (4.6%) | |||||||||||
| Archstone-Smith Trust, REIT | 2,900 | $ | 135,894 | ||||||||
| Boston Properties, Inc., REIT | 2,400 | 187,824 | |||||||||
| Equity Office Properties Trust, REIT | 4,600 | 146,372 | |||||||||
| Host Marriott Corp., REIT | 9,200 | 183,540 | |||||||||
| ProLogis Trust, REIT | 3,700 | 189,514 | |||||||||
| 843,144 | |||||||||||
| Thrifts & Mortgage Finance (2.8%) | |||||||||||
| Golden West Financial Corp. | 2,600 | 183,612 | |||||||||
| PMI Group, Inc. | 4,600 | 198,858 | |||||||||
| Sovereign Bancorp, Inc. | 6,100 | 132,980 | |||||||||
| 515,450 | |||||||||||
| Health Care (5.8%) | |||||||||||
| Biotechnology (0.8%) | |||||||||||
| Charles River Laboratories International, Inc. (a) | 1,400 | 64,582 | |||||||||
| PDL BioPharma Inc. (a) | 3,100 | 90,365 | |||||||||
| 154,947 | |||||||||||
| Health Care Equipment & Supplies (1.5%) | |||||||||||
| Hospira, Inc. (a) | 2,800 | 125,300 | |||||||||
| Millipore Corp. (a) | 2,100 | 144,438 | |||||||||
| 269,738 | |||||||||||
| Health Care Providers & Services (2.0%) | |||||||||||
| CIGNA Corp. | 2,000 | 243,200 | |||||||||
| Community Health Systems, Inc. (a) | 3,400 | 123,726 | |||||||||
| 366,926 | |||||||||||
| Pharmaceuticals (1.5%) | |||||||||||
| IVAX Corp. (a)(b) | 4,000 | 124,480 | |||||||||
| Shire Pharmaceuticals Group PLC, ADR | 3,100 | 151,125 | |||||||||
| 275,605 | |||||||||||
| Industrials (14.5%) | |||||||||||
| Aerospace & Defense (1.0%) | |||||||||||
| Goodrich Corp. | 4,700 | 185,039 | |||||||||
| Building Products (0.7%) | |||||||||||
| American Standard Companies, Inc. | 3,800 | 136,800 | |||||||||
| Commercial Services & Supplies (1.8%) | |||||||||||
| ARAMARK Corp., Class B | 3,700 | 98,605 | |||||||||
| Avery Dennison Corp. | 1,800 | 107,532 | |||||||||
| Manpower, Inc. | 2,400 | 129,192 | |||||||||
| 335,329 | |||||||||||
See Accompanying Notes to Financial Statements.
89
CMG MID CAP VALUE FUND
A Portfolio of CMG Fund Trust
SCHEDULE OF INVESTMENTS
| Shares | Value | ||||||||||
| Common Stocks (continued) | |||||||||||
| Construction & Engineering (1.3%) | |||||||||||
| Fluor Corp. | 1,200 | $ | 105,540 | ||||||||
| Jacobs Engineering Group, Inc. (a) | 1,625 | 135,476 | |||||||||
| 241,016 | |||||||||||
| Electrical Equipment (0.8%) | |||||||||||
| Cooper Industries Ltd., Class A | 1,700 | 138,805 | |||||||||
| Industrial Conglomerates (1.1%) | |||||||||||
| Textron, Inc. | 2,300 | 194,258 | |||||||||
| Machinery (5.2%) | |||||||||||
| Dover Corp. | 4,150 | 190,609 | |||||||||
| Eaton Corp. | 2,300 | 152,260 | |||||||||
| Harsco Corp. | 1,400 | 110,908 | |||||||||
| Ingersoll-Rand Co., Ltd., Class A | 3,700 | 145,299 | |||||||||
| Kennametal, Inc. | 3,200 | 187,200 | |||||||||
| Parker Hannifin Corp. | 2,250 | 170,483 | |||||||||
| 956,759 | |||||||||||
| Marine (0.5%) | |||||||||||
| Alexander & Baldwin, Inc. | 1,700 | 89,369 | |||||||||
| Road & Rail (1.4%) | |||||||||||
| Burlington Northern Santa Fe Corp. | 1,400 | 112,168 | |||||||||
| Norfolk Southern Corp. | 2,975 | 148,274 | |||||||||
| 260,442 | |||||||||||
| Trading Companies & Distributors (0.7%) | |||||||||||
| United Rentals, Inc. (a) | 4,700 | 137,757 | |||||||||
| Information Technology (7.2%) | |||||||||||
| Electronic Equipment & Instruments (3.2%) | |||||||||||
| Agilent Technologies, Inc. (a) | 4,100 | 139,031 | |||||||||
| Arrow Electronics, Inc. (a) | 5,400 | 185,544 | |||||||||
| Mettler-Toledo International, Inc. (a) | 2,300 | 133,147 | |||||||||
| Tektronix, Inc. | 4,500 | 132,750 | |||||||||
| 590,472 | |||||||||||
| IT Services (0.7%) | |||||||||||
| Ingram Micro, Inc., Class A (a) | 6,800 | 131,580 | |||||||||
| Semiconductors & Semiconductor Equipment (2.2%) | |||||||||||
| ATI Technologies, Inc. (a) | 2,800 | 49,980 | |||||||||
| Cypress Semiconductor Corp. (a) | 2,600 | 44,018 | |||||||||
| Fairchild Semiconductor International, Inc. (a) | 2,700 | 53,865 | |||||||||
| KLA-Tencor Corp. | 1,700 | 88,366 | |||||||||
| Lam Research Corp. (a) | 1,200 | 55,716 | |||||||||
| MEMC Electronic Materials, Inc. (a) | 1,800 | 51,444 | |||||||||
| Novellus Systems, Inc. (a) | 1,800 | 51,030 | |||||||||
| 394,419 | |||||||||||
See Accompanying Notes to Financial Statements.
90
CMG MID CAP VALUE FUND
A Portfolio of CMG Fund Trust
SCHEDULE OF INVESTMENTS
| Shares | Value | ||||||||||
| Common Stocks (continued) | |||||||||||
| Software (1.1%) | |||||||||||
| Activision, Inc. (a) | 3,733 | $ | 53,531 | ||||||||
| Cadence Design Systems, Inc. (a) | 3,500 | 61,810 | |||||||||
| Electronic Arts, Inc. (a) | 800 | 43,664 | |||||||||
| Synopsys, Inc. (a) | 2,100 | 46,431 | |||||||||
| 205,436 | |||||||||||
| Materials (9.1%) | |||||||||||
| Chemicals (5.6%) | |||||||||||
| Air Products & Chemicals, Inc. | 2,400 | 148,056 | |||||||||
| Ashland, Inc. | 1,575 | 103,824 | |||||||||
| Celanese Corp., Series A | 5,200 | 106,444 | |||||||||
| Cytec Industries, Inc. | 2,100 | 104,160 | |||||||||
| Lubrizol Corp. | 3,200 | 146,368 | |||||||||
| Nalco Holding Co. (a) | 7,000 | 129,150 | |||||||||
| PPG Industries, Inc. | 1,750 | 104,125 | |||||||||
| Rohm and Haas Co. | 3,700 | 188,330 | |||||||||
| 1,030,457 | |||||||||||
| Construction Materials (0.6%) | |||||||||||
| Martin Marietta Materials, Inc. | 1,400 | 118,692 | |||||||||
| Containers & Packaging (1.0%) | |||||||||||
| Crown Holdings, Inc. (a) | 9,500 | 177,745 | |||||||||
| Metals & Mining (1.9%) | |||||||||||
| Alumina Ltd., ADR | 4,100 | 94,710 | |||||||||
| Freeport-McMoRan Copper & Gold, Inc., Class B | 1,600 | 102,800 | |||||||||
| Nucor Corp. | 1,750 | 147,403 | |||||||||
| 344,913 | |||||||||||
| Utilities (9.7%) | |||||||||||
| Electric Utilities (5.1%) | |||||||||||
| Edison International | 3,800 | 166,516 | |||||||||
| Entergy Corp. | 2,450 | 170,300 | |||||||||
| Exelon Corp. | 3,500 | 200,970 | |||||||||
| FPL Group, Inc. | 3,700 | 154,623 | |||||||||
| Hawaiian Electric Industries, Inc. | 3,500 | 91,805 | |||||||||
| PPL Corp. | 4,700 | 141,611 | |||||||||
| 925,825 | |||||||||||
| Gas Utilities (0.5%) | |||||||||||
| AGL Resources, Inc. | 2,700 | 96,606 | |||||||||
| Independent Power Producers & Energy Traders (1.3%) | |||||||||||
| AES Corp. (a) | 6,300 | 107,352 | |||||||||
| Constellation Energy Group, Inc. | 2,300 | 134,021 | |||||||||
| 241,373 | |||||||||||
See Accompanying Notes to Financial Statements.
91
CMG MID CAP VALUE FUND
A Portfolio of CMG Fund Trust
SCHEDULE OF INVESTMENTS
| Shares | Value | ||||||||||
| Common Stocks (continued) | |||||||||||
| Multi-Utilities (2.8%) | |||||||||||
| Energy East Corp. | 6,300 | $ | 156,555 | ||||||||
| PG&E Corp. | 5,800 | 216,398 | |||||||||
| Sempra Energy | 3,000 | 144,150 | |||||||||
| 517,103 | |||||||||||
| Total Common Stocks (Cost of $13,898,158) | 17,504,378 | ||||||||||
| Par | |||||||||||
| Convertible Bond (0.5%) | |||||||||||
| Communications (0.5%) | |||||||||||
| Telecommunication Services (0.5%) | |||||||||||
| Lucent Technologies, Inc. 2.750% 06/15/25 | $ | 81,000 | 83,227 | ||||||||
| Total Convertible Bond (Cost of $92,304) | 83,227 | ||||||||||
| Shares | |||||||||||
| Convertible Preferred Stocks (0.3%) | |||||||||||
| Financials (0.2%) | |||||||||||
| Insurance (0.2%) | |||||||||||
| XL Capital Ltd., Class A, 7.000% | 1,700 | 43,078 | |||||||||
| Materials (0.1%) | |||||||||||
| Chemicals (0.1%) | |||||||||||
| Celanese Corp., 4.250% | 700 | 20,563 | |||||||||
| Total Convertible Preferred Stocks (Cost of $62,854) | 63,641 | ||||||||||
See Accompanying Notes to Financial Statements.
92
CMG MID CAP VALUE FUND
A Portfolio of CMG Fund Trust
SCHEDULE OF INVESTMENTS
| Par | Value | ||||||||||
| Short-Term Obligation (4.1%) | |||||||||||
| Repurchase agreement with State Street Bank & Trust Co., dated 01/31/06, due 02/01/06 at 4.270%, collateralized by a U.S. Treasury Bond maturing 08/15/19, market value of $777,033 (repurchase proceeds $757,090) | $ | 757,000 | $ | 757,000 | |||||||
| Total Short-Term Obligation (Cost of $757,000) | 757,000 | ||||||||||
| Total Investments (99.9%) (Cost of $14,810,316) (c) | 18,408,246 | ||||||||||
| Other Assets & Liabilities, Net (0.1%) | 14,186 | ||||||||||
| Net Assets (100.0%) | $ | 18,422,432 | |||||||||
Notes to Schedule of Investments:
(a) Non-income producing security.
(b) Represents fair value as determined in good faith under procedures approved by the Board of Trustees.
(c) Cost for federal income tax purposes is $14,810,316.
At January 31, 2006, the Fund held investments in the following sectors:
| Sector | % of Net Assets | ||||||
| Financials | 26.7 | % | |||||
| Industrials | 14.5 | ||||||
| Consumer Discretionary | 10.2 | ||||||
| Utilities | 9.7 | ||||||
| Materials | 9.2 | ||||||
| Information Technology | 7.2 | ||||||
| Energy | 7.1 | ||||||
| Health Care | 5.8 | ||||||
| Consumer Staples | 4.9 | ||||||
| Telecommunication Services | 0.5 | ||||||
| Short-Term Obligation | 4.1 | ||||||
| Other Assets & Liabilities, Net | 0.1 | ||||||
| 100.0 | % | ||||||
| Acronym | Name | ||||||
| ADR | American Depositary Receipt | ||||||
| REIT | Real Estate Investment Trust | ||||||
See Accompanying Notes to Financial Statements.
93
CMG SMALL CAP GROWTH FUND
A Portfolio of CMG Fund Trust
SCHEDULE OF INVESTMENTS
January 31, 2006 (Unaudited)
| Shares | Value | ||||||||||
| Common Stocks (98.1%) | |||||||||||
| Consumer Discretionary (12.2%) | |||||||||||
| Diversified Consumer Services (0.4%) | |||||||||||
| Laureate Education, Inc. (a) | 2,940 | $ | 153,174 | ||||||||
| Hotels, Restaurants & Leisure (5.2%) | |||||||||||
| Cosi, Inc. (a) | 21,500 | 209,625 | |||||||||
| Pinnacle Entertainment, Inc. (a) | 11,910 | 343,246 | |||||||||
| RARE Hospitality International, Inc. (a) | 6,810 | 214,856 | |||||||||
| Red Robin Gourmet Burgers, Inc. (a) | 4,860 | 192,893 | |||||||||
| Ruby Tuesday, Inc. | 4,250 | 121,593 | |||||||||
| Scientific Games Corp., Class A (a) | 16,950 | 543,247 | |||||||||
| Shuffle Master, Inc. (a) | 8,080 | 205,232 | |||||||||
| Trump Entertainment Resorts, Inc. (a) | 15,340 | 300,664 | |||||||||
| 2,131,356 | |||||||||||
| Household Durables (0.2%) | |||||||||||
| Tupperware Brands Corp. | 3,140 | 69,708 | |||||||||
| Internet & Catalog Retail (2.6%) | |||||||||||
| NetFlix, Inc. (a) | 9,670 | 266,408 | |||||||||
| Nutri/System, Inc. (a) | 5,220 | 255,258 | |||||||||
| VistaPrint Ltd. (a) | 18,291 | 552,937 | |||||||||
| 1,074,603 | |||||||||||
| Leisure Equipment & Products (0.6%) | |||||||||||
| SCP Pool Corp. | 6,760 | 269,589 | |||||||||
| Media (0.4%) | |||||||||||
| Radio One, Inc., Class D (a) | 14,430 | 158,153 | |||||||||
| Specialty Retail (2.8%) | |||||||||||
| Aaron Rents, Inc. | 7,090 | 170,514 | |||||||||
| Children's Place Retail Stores, Inc. (a) | 7,530 | 329,739 | |||||||||
| GameStop Corp., Class A (a) | 7,013 | 282,694 | |||||||||
| Genesco, Inc. (a) | 1,900 | 74,005 | |||||||||
| Gymboree Corp. (a) | 8,283 | 204,093 | |||||||||
| Tractor Supply Co. (a) | 2,160 | 110,333 | |||||||||
| 1,171,378 | |||||||||||
| Consumer Staples (2.2%) | |||||||||||
| Beverages (0.3%) | |||||||||||
| Hansen Natural Corp. (a) | 1,310 | 115,018 | |||||||||
| Household Products (0.8%) | |||||||||||
| Central Garden & Pet Co. (a) | 6,840 | 339,127 | |||||||||
See Accompanying Notes to Financial Statements.
94
CMG SMALL CAP GROWTH FUND
A Portfolio of CMG Fund Trust
SCHEDULE OF INVESTMENTS
| Shares | Value | ||||||||||
| Common Stocks (continued) | |||||||||||
| Personal Products (1.1%) | |||||||||||
| Playtex Products, Inc. (a) | 11,320 | $ | 151,915 | ||||||||
| USANA Health Sciences, Inc. (a) | 7,410 | 297,215 | |||||||||
| 449,130 | |||||||||||
| Energy (9.4%) | |||||||||||
| Energy Equipment & Services (6.5%) | |||||||||||
| Atwood Oceanics, Inc. (a) | 4,160 | 404,061 | |||||||||
| CAL Dive International, Inc. (a) | 9,650 | 405,107 | |||||||||
| Core Laboratories NV (a) | 7,460 | 332,567 | |||||||||
| Grey Wolf, Inc. (a) | 45,520 | 400,576 | |||||||||
| Oil States International, Inc. (a) | 5,190 | 212,271 | |||||||||
| Tetra Technologies, Inc. (a) | 8,948 | 355,056 | |||||||||
| Todco, Class A | 3,420 | 152,532 | |||||||||
| Veritas DGC, Inc. (a) | 9,430 | 424,916 | |||||||||
| 2,687,086 | |||||||||||
| Oil, Gas & Consumable Fuels (2.9%) | |||||||||||
| Carrizo Oil & Gas, Inc. (a) | 11,775 | 339,827 | |||||||||
| Cheniere Energy, Inc. (a) | 5,190 | 201,787 | |||||||||
| Foundation Coal Holdings, Inc. | 4,420 | 196,513 | |||||||||
| Frontier Oil Corp. | 3,790 | 179,608 | |||||||||
| Holly Corp. | 3,680 | 270,848 | |||||||||
| 1,188,583 | |||||||||||
| Financials (6.3%) | |||||||||||
| Capital Markets (2.0%) | |||||||||||
| Affiliated Managers Group, Inc. (a) | 8,680 | 805,504 | |||||||||
| Commercial Banks (1.8%) | |||||||||||
| Signature Bank (a) | 9,480 | 288,666 | |||||||||
| Sterling Financial Corp. | 6,010 | 168,400 | |||||||||
| UCBH Holdings, Inc. | 9,100 | 157,885 | |||||||||
| Wintrust Financial Corp. | 2,270 | 121,899 | |||||||||
| 736,850 | |||||||||||
| Diversified Financial Services (0.6%) | |||||||||||
| IntercontinentalExchange, Inc. (a) | 2,076 | 105,502 | |||||||||
| Nasdaq Stock Market, Inc. (a) | 3,880 | 162,611 | |||||||||
| 268,113 | |||||||||||
| Insurance (1.9%) | |||||||||||
| Hanover Insurance Group, Inc. | 5,360 | 259,692 | |||||||||
| ProAssurance Corp. (a) | 9,880 | 505,758 | |||||||||
| 765,450 | |||||||||||
See Accompanying Notes to Financial Statements.
95
CMG SMALL CAP GROWTH FUND
A Portfolio of CMG Fund Trust
SCHEDULE OF INVESTMENTS
| Shares | Value | ||||||||||
| Common Stocks (continued) | |||||||||||
| Health Care (19.0%) | |||||||||||
| Biotechnology (3.9%) | |||||||||||
| Alkermes, Inc. (a) | 6,760 | $ | 164,538 | ||||||||
| Amylin Pharmaceuticals, Inc. (a) | 5,510 | 233,624 | |||||||||
| Digene Corp. (a) | 11,680 | 387,776 | |||||||||
| ICOS Corp. (a) | 5,450 | 135,433 | |||||||||
| Nektar Therapeutics (a) | 10,730 | 212,454 | |||||||||
| Neurocrine Biosciences, Inc. (a) | 4,390 | 266,780 | |||||||||
| United Therapeutics Corp. (a) | 3,250 | 210,178 | |||||||||
| 1,610,783 | |||||||||||
| Health Care Equipment & Supplies (5.9%) | |||||||||||
| ArthroCare Corp. (a) | 4,860 | 217,679 | |||||||||
| Foxhollow Technologies, Inc. (a) | 3,370 | 90,552 | |||||||||
| Haemonetics Corp. (a) | 5,720 | 297,440 | |||||||||
| Hologic, Inc. (a) | 3,013 | 155,049 | |||||||||
| Intuitive Surgical, Inc. (a) | 1,610 | 221,617 | |||||||||
| Iris International, Inc. (a) | 6,142 | 140,406 | |||||||||
| Kyphon, Inc. (a) | 7,430 | 308,865 | |||||||||
| OraSure Technologies, Inc. (a) | 31,130 | 339,628 | |||||||||
| Possis Medical, Inc. (a) | 2,683 | 26,293 | |||||||||
| ResMed, Inc. (a) | 13,620 | 537,173 | |||||||||
| Thoratec Corp. (a) | 3,310 | 83,743 | |||||||||
| 2,418,445 | |||||||||||
| Health Care Providers & Services (7.3%) | |||||||||||
| Allscripts Healthcare Solutions, Inc. (a) | 11,540 | 203,220 | |||||||||
| Cerner Corp. (a) | 6,000 | 270,000 | |||||||||
| DaVita, Inc. (a) | 5,000 | 273,750 | |||||||||
| HealthExtras, Inc. (a) | 20,370 | 670,173 | |||||||||
| ICON PLC, ADR (a) | 11,283 | 496,226 | |||||||||
| LHC Group, Inc. (a) | 7,638 | 121,444 | |||||||||
| Matria Healthcare, Inc. (a) | 6,550 | 279,489 | |||||||||
| Pediatrix Medical Group, Inc. (a) | 1,310 | 114,861 | |||||||||
| Psychiatric Solutions, Inc. (a) | 3,860 | 127,341 | |||||||||
| United Surgical Partners International, Inc. (a) | 11,700 | 453,492 | |||||||||
| 3,009,996 | |||||||||||
| Pharmaceuticals (1.9%) | |||||||||||
| Medicis Pharmaceutical Corp., Class A | 9,050 | 279,735 | |||||||||
| Salix Pharmaceuticals Ltd. (a) | 29,100 | 506,049 | |||||||||
| 785,784 | |||||||||||
| Industrials (21.2%) | |||||||||||
| Aerospace & Defense (3.7%) | |||||||||||
| Armor Holdings, Inc. (a) | 4,710 | 224,526 | |||||||||
| BE Aerospace, Inc. (a) | 24,207 | 508,831 | |||||||||
| Ceradyne, Inc. (a) | 13,942 | 798,040 | |||||||||
| 1,531,397 | |||||||||||
See Accompanying Notes to Financial Statements.
96
CMG SMALL CAP GROWTH FUND
A Portfolio of CMG Fund Trust
SCHEDULE OF INVESTMENTS
| Shares | Value | ||||||||||
| Common Stocks (continued) | |||||||||||
| Air Freight & Logistics (1.0%) | |||||||||||
| Forward Air Corp. | 4,247 | $ | 165,633 | ||||||||
| UTI Worldwide, Inc. | 2,380 | 249,258 | |||||||||
| 414,891 | |||||||||||
| Building Products (0.6%) | |||||||||||
| ElkCorp. | 7,390 | 259,906 | |||||||||
| Commercial Services & Supplies (5.6%) | |||||||||||
| Corporate Executive Board Co. | 7,400 | 622,636 | |||||||||
| Global Cash Access, Inc. (a) | 13,117 | 202,789 | |||||||||
| Huron Consulting Group, Inc. (a) | 9,610 | 270,714 | |||||||||
| Kenexa Corp. (a) | 17,911 | 430,760 | |||||||||
| LECG Corp. (a) | 12,548 | 210,555 | |||||||||
| Resources Connection, Inc. (a) | 14,550 | 395,615 | |||||||||
| Waste Connections, Inc. (a) | 4,260 | 148,844 | |||||||||
| 2,281,913 | |||||||||||
| Construction & Engineering (1.7%) | |||||||||||
| Perini Corp. (a) | 10,820 | 297,875 | |||||||||
| URS Corp. (a) | 9,580 | 409,832 | |||||||||
| 707,707 | |||||||||||
| Electrical Equipment (1.3%) | |||||||||||
| Evergreen Solar, Inc. (a) | 9,160 | 141,339 | |||||||||
| General Cable Corp. (a) | 9,290 | 227,605 | |||||||||
| Roper Industries, Inc. | 4,410 | 177,943 | |||||||||
| 546,887 | |||||||||||
| Machinery (6.3%) | |||||||||||
| ESCO Technologies, Inc. (a) | 7,481 | 367,616 | |||||||||
| Joy Global, Inc. | 11,300 | 610,652 | |||||||||
| RBC Bearings, Inc. (a) | 14,223 | 263,694 | |||||||||
| Terex Corp. (a) | 7,710 | 543,555 | |||||||||
| Wabtec Corp. | 25,450 | 803,457 | |||||||||
| 2,588,974 | |||||||||||
| Road & Rail (1.0%) | |||||||||||
| Landstar System, Inc. | 4,170 | 176,391 | |||||||||
| Old Dominion Freight Line, Inc. (a) | 7,534 | 215,020 | |||||||||
| 391,411 | |||||||||||
| Information Technology (23.1%) | |||||||||||
| Communications Equipment (3.0%) | |||||||||||
| CSR PLC (a) | 21,750 | 433,364 | |||||||||
| F5 Networks, Inc. (a) | 6,490 | 419,903 | |||||||||
| Ixia (a) | 29,894 | 376,665 | |||||||||
| 1,229,932 | |||||||||||
| Computers & Peripherals (2.4%) | |||||||||||
| Electronics for Imaging, Inc. (a) | 8,670 | 239,726 | |||||||||
| M-Systems Flash Disk Pioneers Ltd. (a) | 6,327 | 183,356 | |||||||||
See Accompanying Notes to Financial Statements.
97
CMG SMALL CAP GROWTH FUND
A Portfolio of CMG Fund Trust
SCHEDULE OF INVESTMENTS
| Shares | Value | ||||||||||
| Common Stocks (continued) | |||||||||||
| Computers & Peripherals (continued) | |||||||||||
| Presstek, Inc. (a) | 17,356 | $ | 180,502 | ||||||||
| Rackable Systems, Inc. (a) | 5,331 | 160,197 | |||||||||
| Synaptics, Inc. (a) | 8,670 | 238,598 | |||||||||
| 1,002,379 | |||||||||||
| Internet Software & Services (1.1%) | |||||||||||
| aQuantive, Inc. (a) | 9,130 | 237,471 | |||||||||
| Equinix, Inc. (a) | 4,970 | 233,242 | |||||||||
| 470,713 | |||||||||||
| IT Services (3.9%) | |||||||||||
| Acxiom Corp. | 10,080 | 238,594 | |||||||||
| CACI International, Inc., Class A (a) | 4,007 | 228,800 | |||||||||
| Euronet Worldwide, Inc. (a) | 15,916 | 513,609 | |||||||||
| Global Payments, Inc. | 10,120 | 515,412 | |||||||||
| Heartland Payment Systems, Inc. (a) | 4,650 | 114,436 | |||||||||
| 1,610,851 | |||||||||||
| Semiconductors & Semiconductor Equipment (7.2%) | |||||||||||
| Atheros Communications, Inc. (a) | 12,470 | 245,036 | |||||||||
| ATMI, Inc. (a) | 12,910 | 433,776 | |||||||||
| Hittite Microwave Corp. (a) | 16,770 | 469,560 | |||||||||
| Microsemi Corp. (a) | 7,910 | 240,780 | |||||||||
| Silicon Laboratories, Inc. (a) | 1,900 | 93,537 | |||||||||
| SiRF Technology Holdings, Inc. (a) | 19,399 | 653,552 | |||||||||
| Tessera Technologies, Inc. (a) | 10,820 | 349,270 | |||||||||
| Trident Microsystems, Inc. (a) | 17,698 | 462,272 | |||||||||
| 2,947,783 | |||||||||||
| Software (5.5%) | |||||||||||
| Embarcadero Technologies, Inc. (a) | 46,669 | 350,018 | |||||||||
| Epicor Software Corp. (a) | 20,850 | 277,305 | |||||||||
| Hyperion Solutions Corp. (a) | 5,845 | 201,126 | |||||||||
| Informatica Corp. (a) | 19,570 | 288,070 | |||||||||
| Kronos, Inc. (a) | 3,060 | 120,258 | |||||||||
| Micros Systems, Inc. (a) | 4,380 | 202,137 | |||||||||
| Quest Software, Inc. (a) | 15,600 | 247,104 | |||||||||
| Transaction Systems Architects, Inc. (a) | 7,260 | 239,507 | |||||||||
| Wind River Systems, Inc. (a) | 24,620 | 329,416 | |||||||||
| 2,254,941 | |||||||||||
| Materials (2.6%) | |||||||||||
| Construction Materials (0.8%) | |||||||||||
| Eagle Materials, Inc. | 1,920 | 312,749 | |||||||||
| Metals & Mining (1.8%) | |||||||||||
| Allegheny Technologies, Inc. | 6,600 | 342,210 | |||||||||
| Century Aluminum Co. (a) | 7,010 | 238,901 | |||||||||
| Cleveland-Cliffs, Inc. | 1,630 | 175,795 | |||||||||
| 756,906 | |||||||||||
See Accompanying Notes to Financial Statements.
98
CMG SMALL CAP GROWTH FUND
A Portfolio of CMG Fund Trust
SCHEDULE OF INVESTMENTS
| Shares | Value | ||||||||||
| Common Stocks (continued) | |||||||||||
| Telecommunication Services (2.1%) | |||||||||||
| Wireless Telecommunication Services (2.1%) | |||||||||||
| Dobson Communications Corp., Class A (a) | 26,810 | $ | 198,930 | ||||||||
| Millicom International Cellular SA (a) | 9,290 | 357,665 | |||||||||
| SBA Communications Corp., Class A (a) | 15,080 | 329,498 | |||||||||
| 886,093 | |||||||||||
| Total Common Stocks (Cost of $33,623,114) | 40,403,263 | ||||||||||
| Par | |||||||||||
| Short-Term Obligation (2.0%) | |||||||||||
| Repurchase agreement with State Street Bank & Trust Co., dated 01/31/06, due 02/01/06 at 4.270%, collateralized by a U.S. Treasury Note maturing 10/15/09, market value of $855,318 (repurchase proceeds $837,099) | $ | 837,000 | 837,000 | ||||||||
| Total Short-Term Obligation (Cost of $837,000) | 837,000 | ||||||||||
| Total Investments (100.1%) (Cost of $34,460,114) (b) | 41,240,263 | ||||||||||
| Other Assets & Liabilities, Net (-0.1%) | (50,573 | ) | |||||||||
| Net Assets (100.0%) | $ | 41,189,690 | |||||||||
Notes to Schedule of Investments:
(a) Non-income producing security.
(b) Cost for federal income tax purposes is $34,460,114.
See Accompanying Notes to Financial Statements.
99
CMG SMALL CAP GROWTH FUND
A Portfolio of CMG Fund Trust
SCHEDULE OF INVESTMENTS
At January 31, 2006, the Fund held investments in the following sectors:
| Sector | % of Net Assets | ||||||
| Information Technology | 23.1 | % | |||||
| Industrials | 21.2 | ||||||
| Health Care | 19.0 | ||||||
| Consumer Discretionary | 12.2 | ||||||
| Energy | 9.4 | ||||||
| Financials | 6.3 | ||||||
| Materials | 2.6 | ||||||
| Consumer Staples | 2.2 | ||||||
| Telecommunication Services | 2.1 | ||||||
| Short-Term Obligation | 2.0 | ||||||
| Other Assets & Liabilities, Net | (0.1 | ) | |||||
| 100.0 | % | ||||||
| Acronym | Name | ||||||
| ADR | American Depositary Receipt | ||||||
See Accompanying Notes to Financial Statements.
100
CMG SMALL CAP VALUE FUND
A Portfolio of CMG Fund Trust
SCHEDULE OF INVESTMENTS
January 31, 2006 (Unaudited)
| Shares | Value | ||||||||||
| Common Stocks (99.5%) | |||||||||||
| Consumer Discretionary (10.4%) | |||||||||||
| Auto Components (0.9%) | |||||||||||
| BorgWarner, Inc. | 3,600 | $ | 198,468 | ||||||||
| Modine Manufacturing Co. | 5,640 | 152,844 | |||||||||
| 351,312 | |||||||||||
| Distributors (0.5%) | |||||||||||
| Building Material Holding Corp. | 2,430 | 192,383 | |||||||||
| Hotels, Restaurants & Leisure (2.7%) | |||||||||||
| Bob Evans Farms, Inc. | 3,361 | 89,739 | |||||||||
| Dave & Buster's, Inc. (a) | 2,450 | 43,929 | |||||||||
| Landry's Restaurants, Inc. | 6,000 | 183,840 | |||||||||
| Lone Star Steakhouse & Saloon, Inc. | 8,000 | 216,720 | |||||||||
| Marcus Corp. | 3,750 | 90,262 | |||||||||
| Scientific Games Corp., Class A (a) | 8,170 | 261,848 | |||||||||
| Vail Resorts, Inc. (a) | 3,600 | 109,404 | |||||||||
| 995,742 | |||||||||||
| Household Durables (1.3%) | |||||||||||
| American Greetings Corp., Class A | 13,100 | 267,371 | |||||||||
| CSS Industries, Inc. | 3,700 | 96,200 | |||||||||
| Kimball International, Inc., Class B | 8,000 | 112,480 | |||||||||
| 476,051 | |||||||||||
| Media (1.1%) | |||||||||||
| 4Kids Entertainment, Inc. (a) | 7,100 | 121,907 | |||||||||
| Journal Communications, Inc., Class A | 6,560 | 78,458 | |||||||||
| Media General, Inc., Class A | 1,370 | 65,554 | |||||||||
| Reader's Digest Association, Inc. | 5,000 | 79,450 | |||||||||
| Scholastic Corp. (a) | 2,200 | 66,110 | |||||||||
| 411,479 | |||||||||||
| Specialty Retail (2.1%) | |||||||||||
| GameStop Corp., Class A (a) | 6,739 | 271,649 | |||||||||
| Monro Muffler, Inc. | 6,120 | 207,897 | |||||||||
| Movie Gallery, Inc. | 5,500 | 29,975 | |||||||||
| Payless Shoesource, Inc. (a) | 3,340 | 81,362 | |||||||||
| Pier 1 Imports, Inc. | 5,900 | 63,838 | |||||||||
| Rent-A-Center, Inc. (a) | 2,121 | 43,481 | |||||||||
| Zale Corp. (a) | 4,100 | 100,491 | |||||||||
| 798,693 | |||||||||||
| Textiles, Apparel & Luxury Goods (1.8%) | |||||||||||
| Delta Apparel, Inc. | 4,500 | 87,570 | |||||||||
| Hampshire Group Ltd. (a) | 8,300 | 185,920 | |||||||||
| Hartmarx Corp. (a) | 11,129 | 94,819 | |||||||||
| Stride Rite Corp. | 7,400 | 107,078 | |||||||||
| Wolverine World Wide, Inc. | 8,700 | 209,235 | |||||||||
| 684,622 | |||||||||||
See Accompanying Notes to Financial Statements.
101
CMG SMALL CAP VALUE FUND
A Portfolio of CMG Fund Trust
SCHEDULE OF INVESTMENTS
| Shares | Value | ||||||||||
| Common Stocks (continued) | |||||||||||
| Consumer Staples (3.0%) | |||||||||||
| Food & Staples Retailing (1.1%) | |||||||||||
| BJ's Wholesale Club, Inc. (a) | 3,200 | $ | 102,848 | ||||||||
| Weis Markets, Inc. | 7,270 | 304,976 | |||||||||
| 407,824 | |||||||||||
| Food Products (1.9%) | |||||||||||
| Flowers Foods, Inc. | 9,139 | 251,414 | |||||||||
| J & J Snack Foods Corp. | 3,990 | 120,817 | |||||||||
| Lancaster Colony Corp. | 2,712 | 112,467 | |||||||||
| Lance, Inc. | 5,800 | 125,628 | |||||||||
| Maui Land & Pineapple Co., Inc. (a) | 2,550 | 99,195 | |||||||||
| 709,521 | |||||||||||
| Energy (6.8%) | |||||||||||
| Energy Equipment & Services (3.1%) | |||||||||||
| Dresser-Rand Group, Inc. (a) | 1,425 | 38,375 | |||||||||
| Grey Wolf, Inc. (a) | 22,510 | 198,088 | |||||||||
| Lone Star Technologies, Inc. (a) | 1,350 | 76,815 | |||||||||
| Lufkin Industries, Inc. | 5,992 | 403,861 | |||||||||
| Maverick Tube Corp. (a) | 2,800 | 133,980 | |||||||||
| NS Group, Inc. (a) | 1,790 | 80,908 | |||||||||
| Superior Well Services, Inc. (a) | 1,700 | 47,617 | |||||||||
| Trico Marine Services, Inc. (a) | 5,623 | 188,146 | |||||||||
| 1,167,790 | |||||||||||
| Oil, Gas & Consumable Fuels (3.7%) | |||||||||||
| Alpha Natural Resources, Inc. (a) | 5,330 | 125,415 | |||||||||
| Bill Barrett Corp. (a) | 1,448 | 55,603 | |||||||||
| Bois d'Arc Energy, Inc. (a) | 5,328 | 100,273 | |||||||||
| Comstock Resources, Inc. (a) | 2,320 | 74,240 | |||||||||
| Harvest Natural Resources, Inc. (a) | 10,400 | 99,112 | |||||||||
| InterOil Corp. (a) | 3,000 | 55,500 | |||||||||
| Peabody Energy Corp. | 2,606 | 259,323 | |||||||||
| Range Resources Corp. | 11,050 | 330,063 | |||||||||
| Western Gas Resources, Inc. | 6,100 | 289,750 | |||||||||
| 1,389,279 | |||||||||||
| Financials (25.7%) | |||||||||||
| Capital Markets (0.4%) | |||||||||||
| Piper Jaffray Companies, Inc. (a) | 3,440 | 154,215 | |||||||||
| Commercial Banks (11.1%) | |||||||||||
| BancFirst Corp. | 1,310 | 108,940 | |||||||||
| BancorpSouth, Inc. | 7,200 | 165,888 | |||||||||
| BancTrust Financial Group, Inc. | 5,222 | 108,095 | |||||||||
| Bank of Granite Corp. | 6,274 | 128,805 | |||||||||
| Bryn Mawr Bank Corp. | 6,276 | 132,863 | |||||||||
| Capitol Bancorp Ltd. | 5,856 | 260,007 | |||||||||
| Chemical Financial Corp. | 5,925 | 186,341 | |||||||||
| Chittenden Corp. | 7,000 | 198,590 | |||||||||
See Accompanying Notes to Financial Statements.
102
CMG SMALL CAP VALUE FUND
A Portfolio of CMG Fund Trust
SCHEDULE OF INVESTMENTS
| Shares | Value | ||||||||||
| Common Stocks (continued) | |||||||||||
| Commercial Banks (continued) | |||||||||||
| Citizens Banking Corp. | 4,090 | $ | 113,784 | ||||||||
| City Holding Co. | 2,940 | 109,544 | |||||||||
| Columbia Banking System, Inc. | 4,750 | 153,188 | |||||||||
| Community Trust Bancorp, Inc. | 4,676 | 164,502 | |||||||||
| Corus Bankshares, Inc. | 3,600 | 231,156 | |||||||||
| First Citizens BancShares, Inc., Class A | 800 | 153,648 | |||||||||
| First Financial Bankshares, Inc. | 4,045 | 148,168 | |||||||||
| First Financial Corp. | 4,650 | 130,200 | |||||||||
| Greater Bay Bancorp | 5,050 | 130,997 | |||||||||
| Hancock Holding Co. | 3,173 | 130,093 | |||||||||
| Mass Financial Corp., Class A (a)(b)(c) | 13,100 | — | |||||||||
| Merchants Bancshares, Inc. | 4,442 | 107,274 | |||||||||
| Mid-State Bancshares | 7,600 | 212,648 | |||||||||
| Northrim BanCorp, Inc. | 3,900 | 89,856 | |||||||||
| Signature Bank (a) | 892 | 27,161 | |||||||||
| Sterling Bancshares, Inc. | 11,912 | 199,526 | |||||||||
| TriCo Bancshares | 7,880 | 191,327 | |||||||||
| TrustCo Bank Corp. NY | 9,790 | 124,137 | |||||||||
| UMB Financial Corp. | 3,500 | 235,760 | |||||||||
| Whitney Holding Corp. | 7,180 | 236,222 | |||||||||
| 4,178,720 | |||||||||||
| Consumer Finance (1.2%) | |||||||||||
| Advance America Cash Advance Centers, Inc. | 13,550 | 193,088 | |||||||||
| Cash America International, Inc. | 9,900 | 262,251 | |||||||||
| 455,339 | |||||||||||
| Insurance (6.7%) | |||||||||||
| AmerUs Group Co. | 2,900 | 177,973 | |||||||||
| Argonaut Group, Inc. (a) | 3,940 | 140,067 | |||||||||
| Baldwin & Lyons, Inc., Class B | 5,401 | 135,565 | |||||||||
| CNA Surety Corp. (a) | 9,820 | 158,004 | |||||||||
| Commerce Group, Inc. | 1,500 | 80,850 | |||||||||
| Delphi Financial Group, Inc., Class A | 4,800 | 228,768 | |||||||||
| Harleysville Group, Inc. | 6,450 | 177,762 | |||||||||
| Horace Mann Educators Corp. | 7,480 | 146,533 | |||||||||
| KMG America Corp. (a) | 12,379 | 111,411 | |||||||||
| National Western Life Insurance Co., Class A (a) | 369 | 79,704 | |||||||||
| Navigators Group, Inc. (a) | 6,794 | 303,488 | |||||||||
| Phoenix Companies, Inc. | 13,600 | 205,224 | |||||||||
| ProCentury Corp. | 12,051 | 135,815 | |||||||||
| Quanta Capital Holdings Ltd. (a) | 13,930 | 75,083 | |||||||||
| RLI Corp. | 3,522 | 192,477 | |||||||||
| United America Indemnity Ltd., Class A (a) | 8,470 | 179,140 | |||||||||
| 2,527,864 | |||||||||||
| Real Estate (6.3%) | |||||||||||
| Alexandria Real Estate Equities, Inc., REIT | 1,680 | 148,260 | |||||||||
| Bedford Property Investors, Inc., REIT | 6,372 | 147,830 | |||||||||
| Brandywine Realty Trust, REIT | 5,230 | 164,483 | |||||||||
| Cousins Properties, Inc., REIT | 4,290 | 133,934 | |||||||||
See Accompanying Notes to Financial Statements.
103
CMG SMALL CAP VALUE FUND
A Portfolio of CMG Fund Trust
SCHEDULE OF INVESTMENTS
| Shares | Value | ||||||||||
| Common Stocks (continued) | |||||||||||
| Real Estate (continued) | |||||||||||
| EastGroup Properties, Inc., REIT | 4,900 | $ | 231,378 | ||||||||
| Equity One, Inc., REIT | 6,400 | 153,408 | |||||||||
| Franklin Street Properties Corp., REIT | 7,066 | 146,549 | |||||||||
| Getty Realty Corp., REIT | 5,200 | 148,356 | |||||||||
| Healthcare Realty Trust, Inc. | 3,720 | 130,349 | |||||||||
| Lexington Corporate Properties Trust, REIT | 6,000 | 133,200 | |||||||||
| Mid-America Apartment Communities, Inc., REIT | 5,400 | 275,670 | |||||||||
| PS Business Parks, Inc., REIT | 5,600 | 307,160 | |||||||||
| Universal Health Realty Income Trust, REIT | 3,680 | 128,469 | |||||||||
| Urstadt Biddle Properties, Inc., Class A, REIT | 7,320 | 127,807 | |||||||||
| 2,376,853 | |||||||||||
| Health Care (9.5%) | |||||||||||
| Health Care Equipment & Supplies (4.3%) | |||||||||||
| Analogic Corp. | 2,150 | 119,325 | |||||||||
| Bio-Rad Laboratories, Inc., Class A (a) | 2,600 | 175,240 | |||||||||
| DJ Orthopedics, Inc. (a) | 2,840 | 93,237 | |||||||||
| Greatbatch, Inc. (a) | 4,010 | 104,420 | |||||||||
| Haemonetics Corp. (a) | 4,350 | 226,200 | |||||||||
| Invacare Corp. | 4,103 | 141,923 | |||||||||
| STERIS Corp. | 10,090 | 272,430 | |||||||||
| Sybron Dental Specialties, Inc. (a) | 5,160 | 219,816 | |||||||||
| Varian, Inc. (a) | 2,110 | 80,961 | |||||||||
| Viasys Healthcare, Inc. (a) | 3,500 | 99,120 | |||||||||
| Vital Signs, Inc. | 1,700 | 87,227 | |||||||||
| 1,619,899 | |||||||||||
| Health Care Providers & Services (5.2%) | |||||||||||
| Cross Country Healthcare, Inc. (a) | 9,350 | 184,756 | |||||||||
| Genesis HealthCare Corp. (a) | 4,800 | 175,920 | |||||||||
| Gentiva Health Services, Inc. (a) | 9,880 | 187,621 | |||||||||
| Hooper Holmes, Inc. | 16,100 | 56,350 | |||||||||
| Kindred Healthcare, Inc. (a) | 8,600 | 196,940 | |||||||||
| Owens & Minor, Inc. | 4,300 | 134,590 | |||||||||
| PAREXEL International Corp. (a) | 7,900 | 192,602 | |||||||||
| Pediatrix Medical Group, Inc. (a) | 4,000 | 350,720 | |||||||||
| Res-Care, Inc. (a) | 8,680 | 166,569 | |||||||||
| Symbion, Inc. (a) | 5,500 | 127,050 | |||||||||
| United Surgical Partners International, Inc. (a) | 4,350 | 168,606 | |||||||||
| 1,941,724 | |||||||||||
| Industrials (17.0%) | |||||||||||
| Aerospace & Defense (2.6%) | |||||||||||
| AAR Corp. (a) | 9,035 | 215,304 | |||||||||
| Esterline Technologies Corp. (a) | 6,200 | 256,494 | |||||||||
| Kaman Corp., Class A | 3,850 | 81,120 | |||||||||
| Moog, Inc., Class A (a) | 2,140 | 71,711 | |||||||||
| Precision Castparts Corp. | 7,400 | 369,630 | |||||||||
| 994,259 | |||||||||||
See Accompanying Notes to Financial Statements.
104
CMG SMALL CAP VALUE FUND
A Portfolio of CMG Fund Trust
SCHEDULE OF INVESTMENTS
| Shares | Value | ||||||||||
| Common Stocks (continued) | |||||||||||
| Air Freight & Logistics (0.4%) | |||||||||||
| Ryder System, Inc. | 2,900 | $ | 129,630 | ||||||||
| Airlines (1.0%) | |||||||||||
| JetBlue Airways Corp. (a) | 6,015 | 78,436 | |||||||||
| Republic Airways Holdings, Inc. (a) | 5,310 | 78,747 | |||||||||
| Skywest, Inc. | 6,800 | 198,424 | |||||||||
| 355,607 | |||||||||||
| Building Products (1.1%) | |||||||||||
| Lennox International, Inc. | 4,200 | 134,190 | |||||||||
| NCI Building Systems, Inc. (a) | 5,650 | 286,455 | |||||||||
| 420,645 | |||||||||||
| Commercial Services & Supplies (4.2%) | |||||||||||
| ABM Industries, Inc. | 6,700 | 128,037 | |||||||||
| Casella Waste Systems, Inc., Class A (a) | 14,100 | 188,376 | |||||||||
| CBIZ, Inc. (a) | 8,542 | 51,167 | |||||||||
| Consolidated Graphics, Inc. (a) | 6,300 | 323,568 | |||||||||
| Healthcare Services Group, Inc. | 7,889 | 154,388 | |||||||||
| Interpool, Inc. | 1,267 | 25,327 | |||||||||
| Korn/Ferry International (a) | 5,600 | 110,656 | |||||||||
| Nam Tai Electronics, Inc. | 2,830 | 66,137 | |||||||||
| NCO Group, Inc. (a) | 5,900 | 100,477 | |||||||||
| Sourcecorp, Inc. (a) | 4,300 | 113,176 | |||||||||
| TeleTech Holdings, Inc. (a) | 13,375 | 155,952 | |||||||||
| United Stationers, Inc. (a) | 2,970 | 148,589 | |||||||||
| 1,565,850 | |||||||||||
| Construction & Engineering (2.0%) | |||||||||||
| EMCOR Group, Inc. (a) | 2,100 | 172,242 | |||||||||
| KHD Humboldt Wedag International Ltd. (a) | 13,100 | 346,364 | |||||||||
| Washington Group International, Inc. (a) | 4,100 | 243,335 | |||||||||
| 761,941 | |||||||||||
| Electrical Equipment (1.3%) | |||||||||||
| Genlyte Group, Inc. (a) | 4,800 | 277,632 | |||||||||
| Woodward Governor Co. | 2,400 | 224,520 | |||||||||
| 502,152 | |||||||||||
| Machinery (1.9%) | |||||||||||
| Briggs & Stratton Corp. | 2,250 | 78,278 | |||||||||
| EnPro Industries, Inc. (a) | 6,800 | 208,624 | |||||||||
| Harsco Corp. | 4,900 | 388,178 | |||||||||
| Kadant, Inc. (a) | 2,963 | 57,008 | |||||||||
| 732,088 | |||||||||||
| Road & Rail (1.2%) | |||||||||||
| Dollar Thrifty Automotive Group, Inc. (a) | 2,100 | 79,653 | |||||||||
| Swift Transportation Co., Inc. (a) | 2,900 | 68,527 | |||||||||
| Werner Enterprises, Inc. | 13,480 | 290,494 | |||||||||
| 438,674 | |||||||||||
See Accompanying Notes to Financial Statements.
105
CMG SMALL CAP VALUE FUND
A Portfolio of CMG Fund Trust
SCHEDULE OF INVESTMENTS
| Shares | Value | ||||||||||
| Common Stocks (continued) | |||||||||||
| Trading Companies & Distributors (1.3%) | |||||||||||
| Watsco, Inc. | 7,073 | $ | 500,344 | ||||||||
| Information Technology (15.2%) | |||||||||||
| Communications Equipment (1.9%) | |||||||||||
| Anaren, Inc. (a) | 11,100 | 194,028 | |||||||||
| Belden CDT, Inc. | 4,150 | 112,465 | |||||||||
| Black Box Corp. | 2,600 | 131,638 | |||||||||
| Dycom Industries, Inc. (a) | 8,150 | 200,979 | |||||||||
| Tollgrade Communications, Inc. (a) | 6,800 | 79,288 | |||||||||
| 718,398 | |||||||||||
| Computers & Peripherals (1.6%) | |||||||||||
| Electronics for Imaging, Inc. (a) | 6,640 | 183,596 | |||||||||
| Hutchinson Technology, Inc. (a) | 4,970 | 137,569 | |||||||||
| Imation Corp. | 3,400 | 154,122 | |||||||||
| Intergraph Corp. (a) | 3,256 | 124,412 | |||||||||
| 599,699 | |||||||||||
| Electronic Equipment & Instruments (3.5%) | |||||||||||
| Agilysys, Inc. | 5,300 | 112,360 | |||||||||
| Anixter International, Inc. | 3,550 | 164,330 | |||||||||
| Benchmark Electronics, Inc. (a) | 5,300 | 193,609 | |||||||||
| Brightpoint, Inc. (a) | 17,158 | 387,599 | |||||||||
| Coherent, Inc. (a) | 2,090 | 64,706 | |||||||||
| MTS Systems Corp. | 4,800 | 175,920 | |||||||||
| Vishay Intertechnology, Inc. (a) | 14,300 | 226,369 | |||||||||
| 1,324,893 | |||||||||||
| Internet Software & Services (0.3%) | |||||||||||
| Digitas, Inc. (a) | 5,420 | 70,948 | |||||||||
| Keynote Systems, Inc. (a) | 3,091 | 39,101 | |||||||||
| 110,049 | |||||||||||
| IT Services (1.8%) | |||||||||||
| Acxiom Corp. | 9,460 | 223,919 | |||||||||
| MAXIMUS, Inc. | 2,910 | 113,839 | |||||||||
| MPS Group, Inc. (a) | 23,500 | 333,935 | |||||||||
| 671,693 | |||||||||||
| Semiconductors & Semiconductor Equipment (3.1%) | |||||||||||
| Actel Corp. (a) | 1,439 | 21,844 | |||||||||
| Advanced Energy Industries, Inc. (a) | 5,550 | 87,080 | |||||||||
| Asyst Technologies, Inc. (a) | 2,064 | 14,778 | |||||||||
| ATMI, Inc. (a) | 4,360 | 146,496 | |||||||||
| Brooks Automation, Inc. (a) | 5,650 | 95,259 | |||||||||
| Exar Corp. (a) | 8,100 | 109,107 | |||||||||
| Fairchild Semiconductor International, Inc. (a) | 9,330 | 186,133 | |||||||||
| MEMC Electronic Materials, Inc. (a) | 5,150 | 147,187 | |||||||||
| Sigmatel, Inc. (a) | 3,410 | 43,580 | |||||||||
| Standard Microsystems Corp. (a) | 7,200 | 247,968 | |||||||||
| Varian Semiconductor Equipment Associates, Inc. (a) | 1,360 | 67,361 | |||||||||
| 1,166,793 | |||||||||||
See Accompanying Notes to Financial Statements.
106
CMG SMALL CAP VALUE FUND
A Portfolio of CMG Fund Trust
SCHEDULE OF INVESTMENTS
| Shares | Value | ||||||||||
| Common Stocks (continued) | |||||||||||
| Software (3.0%) | |||||||||||
| Captaris, Inc. (a) | 16,700 | $ | 64,629 | ||||||||
| Internet Security Systems, Inc. (a) | 7,600 | 162,032 | |||||||||
| Lawson Software, Inc. (a) | 19,800 | 145,728 | |||||||||
| MSC.Software Corp. (a) | 10,600 | 196,630 | |||||||||
| Phoenix Technologies Ltd. (a) | 11,440 | 78,364 | |||||||||
| PLATO Learning, Inc. (a) | 6,500 | 53,560 | |||||||||
| SeaChange International, Inc. (a) | 3,300 | 27,456 | |||||||||
| Sybase, Inc. (a) | 6,800 | 146,812 | |||||||||
| Transaction Systems Architects, Inc. (a) | 8,000 | 263,920 | |||||||||
| 1,139,131 | |||||||||||
| Materials (8.1%) | |||||||||||
| Chemicals (2.5%) | |||||||||||
| Cytec Industries, Inc. | 3,800 | 188,480 | |||||||||
| H.B. Fuller Co. | 5,600 | 211,624 | |||||||||
| Minerals Technologies, Inc. | 2,900 | 162,023 | |||||||||
| Schulman (A.), Inc. | 7,500 | 184,875 | |||||||||
| Sensient Technologies Corp. | 4,900 | 92,904 | |||||||||
| Stepan Co. | 4,100 | 108,650 | |||||||||
| 948,556 | |||||||||||
| Construction Materials (1.0%) | |||||||||||
| Eagle Materials, Inc. | 2,380 | 387,678 | |||||||||
| Containers & Packaging (1.2%) | |||||||||||
| AptarGroup, Inc. | 2,800 | 158,032 | |||||||||
| Greif, Inc., Class A | 4,700 | 306,064 | |||||||||
| 464,096 | |||||||||||
| Metals & Mining (2.6%) | |||||||||||
| AMCOL International Corp. | 4,400 | 118,712 | |||||||||
| Carpenter Technology Corp. | 3,000 | 271,680 | |||||||||
| Metal Management, Inc. | 6,100 | 170,373 | |||||||||
| RTI International Metals, Inc. (a) | 4,200 | 190,050 | |||||||||
| Worthington Industries, Inc. | 11,190 | 230,850 | |||||||||
| 981,665 | |||||||||||
| Paper & Forest Products (0.8%) | |||||||||||
| Glatfelter | 11,150 | 158,553 | |||||||||
| Mercer International, Inc. (a) | 14,500 | 118,900 | |||||||||
| 277,453 | |||||||||||
| Telecommunication Services (0.4%) | |||||||||||
| Diversified Telecommunication Services (0.4%) | |||||||||||
| North Pittsburgh Systems, Inc. | 5,100 | 101,643 | |||||||||
| TALK America Holdings, Inc. (a) | 5,122 | 49,274 | |||||||||
| 150,917 | |||||||||||
See Accompanying Notes to Financial Statements.
107
CMG SMALL CAP VALUE FUND
A Portfolio of CMG Fund Trust
SCHEDULE OF INVESTMENTS
| Shares | Value | ||||||||||
| Common Stocks (continued) | |||||||||||
| Utilities (3.4%) | |||||||||||
| Electric Utilities (2.2%) | |||||||||||
| ALLETE, Inc. | 2,900 | $ | 128,441 | ||||||||
| Central Vermont Public Service Corp. | 7,100 | 137,385 | |||||||||
| El Paso Electric Co. (a) | 8,000 | 163,840 | |||||||||
| Maine & Maritimes Corp. | 1,600 | 27,040 | |||||||||
| MGE Energy, Inc. | 2,800 | 96,628 | |||||||||
| Otter Tail Corp. | 4,100 | 125,460 | |||||||||
| Puget Energy, Inc. | 6,900 | 145,521 | |||||||||
| 824,315 | |||||||||||
| Gas Utilities (0.6%) | |||||||||||
| Cascade Natural Gas Corp. | 3,815 | 76,834 | |||||||||
| Northwest Natural Gas Co. | 2,300 | 81,857 | |||||||||
| WGL Holdings, Inc. | 2,500 | 77,950 | |||||||||
| 236,641 | |||||||||||
| Multi-Utilities (0.6%) | |||||||||||
| CH Energy Group, Inc. | 4,800 | 225,120 | |||||||||
| Total Common Stocks (Cost of $25,412,849) | 37,467,597 | ||||||||||
| Par | |||||||||||
| Short-Term Obligation (0.5%) | |||||||||||
| Repurchase agreement with State Street Bank & Trust Co., dated 01/31/06, due 02/01/06 at 4.270%, collateralized by a U.S. Treasury Note maturing 10/15/09, market value of $213,829 (repurchase proceeds $206,024) | $ | 206,000 | 206,000 | ||||||||
| Total Short-Term Obligation (Cost of $206,000) | 206,000 | ||||||||||
| Total Investments (100.0%) (Cost of $25,618,849) (d) | 37,673,597 | ||||||||||
| Other Assets & Liabilities, Net (-0.0%) | (12,962 | ) | |||||||||
| Net Assets (100.0%) | $ | 37,660,635 | |||||||||
See Accompanying Notes to Financial Statements.
108
CMG SMALL CAP VALUE FUND
A Portfolio of CMG Fund Trust
SCHEDULE OF INVESTMENTS
Notes to Schedule of Investments:
(a) Non-income producing security.
(b) Represents fair value as determined in good faith under procedures approved by the Board of Trustees.
(c) Security has no value.
(d) Cost for federal income tax purposes is $25,618,849.
At January 31, 2006, the Fund held investments in the following sectors:
| Sector | % of Net Assets | ||||||
| Financials | 25.7 | % | |||||
| Industrials | 17.0 | ||||||
| Information Technology | 15.2 | ||||||
| Consumer Discretionary | 10.4 | ||||||
| Health Care | 9.5 | ||||||
| Materials | 8.1 | ||||||
| Energy | 6.8 | ||||||
| Utilities | 3.4 | ||||||
| Consumer Staples | 3.0 | ||||||
| Telecommunication Services | 0.4 | ||||||
| Short-Term Obligation | 0.5 | ||||||
| Other Assets & Liabilities, Net | (0.0 | )* | |||||
| 100.0 | % | ||||||
*Rounds to less than 0.1%.
| Acronym | Name | ||||||
| REIT | Real Estate Investment Trust | ||||||
See Accompanying Notes to Financial Statements.
109
CMG SMALL/MID CAP FUND
A Portfolio of CMG Fund Trust
SCHEDULE OF INVESTMENTS
January 31, 2006 (Unaudited)
| Shares | Value | ||||||||||
| Common Stocks (98.6%) | |||||||||||
| Consumer Discretionary (14.2%) | |||||||||||
| Diversified Consumer Services (0.4%) | |||||||||||
| Education Management Corp. (a) | 1,830 | $ | 56,035 | ||||||||
| Hotels, Restaurants & Leisure (4.9%) | |||||||||||
| Brinker International, Inc. | 2,060 | 83,842 | |||||||||
| Cheesecake Factory, Inc. (a) | 2,440 | 89,914 | |||||||||
| Hilton Hotels Corp. | 4,650 | 115,924 | |||||||||
| Pinnacle Entertainment, Inc. (a) | 4,040 | 116,433 | |||||||||
| RARE Hospitality International, Inc. (a) | 2,510 | 79,191 | |||||||||
| Red Robin Gourmet Burgers, Inc. (a) | 1,760 | 69,854 | |||||||||
| Scientific Games Corp., Class A (a) | 3,800 | 121,790 | |||||||||
| Trump Entertainment Resorts, Inc. (a) | 4,150 | 81,340 | |||||||||
| 758,288 | |||||||||||
| Household Durables (0.4%) | |||||||||||
| M.D.C. Holdings, Inc. | 510 | 32,359 | |||||||||
| Ryland Group, Inc. | 360 | 26,050 | |||||||||
| 58,409 | |||||||||||
| Internet & Catalog Retail (1.6%) | |||||||||||
| NetFlix, Inc. (a) | 3,490 | 96,149 | |||||||||
| VistaPrint Ltd. (a) | 4,768 | 144,137 | |||||||||
| 240,286 | |||||||||||
| Leisure Equipment & Products (0.6%) | |||||||||||
| SCP Pool Corp. | 2,410 | 96,111 | |||||||||
| Media (1.9%) | |||||||||||
| Getty Images, Inc. (a) | 750 | 61,237 | |||||||||
| Grupo Televisa SA, ADR | 1,310 | 109,450 | |||||||||
| XM Satellite Radio Holdings, Inc., Class A (a) | 4,570 | 119,643 | |||||||||
| 290,330 | |||||||||||
| Specialty Retail (4.0%) | |||||||||||
| Abercrombie & Fitch Co., Class A | 1,940 | 128,797 | |||||||||
| Chico's FAS, Inc. (a) | 3,990 | 173,804 | |||||||||
| Children's Place Retail Stores, Inc. (a) | 1,760 | 77,070 | |||||||||
| GameStop Corp., Class A (a) | 2,470 | 99,566 | |||||||||
| Gymboree Corp. (a) | 2,960 | 72,934 | |||||||||
| Urban Outfitters, Inc. (a) | 2,511 | 68,576 | |||||||||
| 620,747 | |||||||||||
| Textiles, Apparel & Luxury Goods (0.4%) | |||||||||||
| Coach, Inc. (a) | 1,600 | 57,520 | |||||||||
| Consumer Staples (1.9%) | |||||||||||
| Food Products (0.2%) | |||||||||||
| Tyson Foods, Inc., Class A | 2,040 | 29,233 | |||||||||
| Household Products (0.6%) | |||||||||||
| Central Garden & Pet Co. (a) | 2,000 | 99,160 | |||||||||
See Accompanying Notes to Financial Statements.
110
CMG SMALL/MID CAP FUND
A Portfolio of CMG Fund Trust
SCHEDULE OF INVESTMENTS
| Shares | Value | ||||||||||
| Common Stocks (continued) | |||||||||||
| Personal Products (1.1%) | |||||||||||
| Elizabeth Arden, Inc. (a) | 2,850 | $ | 60,249 | ||||||||
| USANA Health Sciences, Inc. (a) | 2,680 | 107,495 | |||||||||
| 167,744 | |||||||||||
| Energy (8.9%) | |||||||||||
| Energy Equipment & Services (4.9%) | |||||||||||
| CAL Dive International, Inc. (a) | 2,470 | 103,690 | |||||||||
| FMC Technologies, Inc. (a) | 1,300 | 67,366 | |||||||||
| Grant Prideco, Inc. (a) | 2,430 | 121,719 | |||||||||
| Nabors Industries Ltd. (a) | 1,380 | 112,125 | |||||||||
| Patterson-UTI Energy, Inc. | 1,930 | 72,607 | |||||||||
| Rowan Companies, Inc. | 1,740 | 78,004 | |||||||||
| Tetra Technologies, Inc. (a) | 2,735 | 108,525 | |||||||||
| Veritas DGC, Inc. (a) | 1,920 | 86,515 | |||||||||
| 750,551 | |||||||||||
| Oil, Gas & Consumable Fuels (4.0%) | |||||||||||
| Arch Coal, Inc. | 1,200 | 104,064 | |||||||||
| CONSOL Energy, Inc. | 610 | 44,469 | |||||||||
| EOG Resources, Inc. | 880 | 74,395 | |||||||||
| Frontier Oil Corp. | 1,700 | 80,563 | |||||||||
| Massey Energy Co. | 2,120 | 87,450 | |||||||||
| Southwestern Energy Co. (a) | 3,210 | 138,480 | |||||||||
| Tesoro Petroleum Corp. | 1,040 | 75,369 | |||||||||
| 604,790 | |||||||||||
| Financials (7.0%) | |||||||||||
| Capital Markets (3.2%) | |||||||||||
| Affiliated Managers Group, Inc. (a) | 2,760 | 256,128 | |||||||||
| E*TRADE Financial Corp. (a) | 4,060 | 96,588 | |||||||||
| Lazard Ltd., Class A | 3,700 | 132,682 | |||||||||
| 485,398 | |||||||||||
| Commercial Banks (1.4%) | |||||||||||
| East West Bancorp, Inc. | 2,870 | 105,932 | |||||||||
| Signature Bank (a) | 3,620 | 110,229 | |||||||||
| 216,161 | |||||||||||
| Insurance (2.4%) | |||||||||||
| Ambac Financial Group, Inc. | 870 | 66,825 | |||||||||
| Hanover Insurance Group, Inc. | 3,240 | 156,978 | |||||||||
| ProAssurance Corp. (a) | 2,840 | 145,379 | |||||||||
| 369,182 | |||||||||||
| Health Care (18.9%) | |||||||||||
| Biotechnology (3.5%) | |||||||||||
| Amylin Pharmaceuticals, Inc. (a) | 2,620 | 111,088 | |||||||||
| Digene Corp. (a) | 3,500 | 116,200 | |||||||||
| Invitrogen Corp. (a) | 390 | 26,863 | |||||||||
| Nektar Therapeutics (a) | 5,080 | 100,584 | |||||||||
See Accompanying Notes to Financial Statements.
111
CMG SMALL/MID CAP FUND
A Portfolio of CMG Fund Trust
SCHEDULE OF INVESTMENTS
| Shares | Value | ||||||||||
| Common Stocks (continued) | |||||||||||
| Biotechnology (continued) | |||||||||||
| Neurocrine Biosciences, Inc. (a) | 1,770 | $ | 107,563 | ||||||||
| PDL BioPharma Inc. (a) | 2,380 | 69,377 | |||||||||
| 531,675 | |||||||||||
| Health Care Equipment & Supplies (5.5%) | |||||||||||
| Biomet, Inc. | 1,850 | 69,948 | |||||||||
| Gen-Probe, Inc. (a) | 2,240 | 112,963 | |||||||||
| Haemonetics Corp. (a) | 2,560 | 133,120 | |||||||||
| OraSure Technologies, Inc. (a) | 10,970 | 119,683 | |||||||||
| Possis Medical, Inc. (a) | 3,530 | 34,594 | |||||||||
| ResMed, Inc. (a) | 3,758 | 148,216 | |||||||||
| Thermo Electron Corp. (a) | 2,680 | 90,155 | |||||||||
| Varian Medical Systems, Inc. (a) | 2,160 | 130,054 | |||||||||
| 838,733 | |||||||||||
| Health Care Providers & Services (7.1%) | |||||||||||
| Allscripts Healthcare Solutions, Inc. (a) | 3,053 | 53,763 | |||||||||
| Cerner Corp. (a) | 1,640 | 73,800 | |||||||||
| Community Health Systems, Inc. (a) | 1,330 | 48,399 | |||||||||
| DaVita, Inc. (a) | 3,077 | 168,466 | |||||||||
| HealthExtras, Inc. (a) | 7,585 | 249,546 | |||||||||
| ICON PLC, ADR (a) | 3,068 | 134,931 | |||||||||
| Laboratory Corp. of America Holdings (a) | 1,620 | 95,013 | |||||||||
| Lincare Holdings, Inc. (a) | 1,740 | 73,532 | |||||||||
| Matria Healthcare, Inc. (a) | 1,540 | 65,712 | |||||||||
| United Surgical Partners International, Inc. (a) | 3,175 | 123,063 | |||||||||
| 1,086,225 | |||||||||||
| Pharmaceuticals (2.8%) | |||||||||||
| Endo Pharmaceuticals Holdings, Inc. (a) | 1,964 | 56,367 | |||||||||
| Medicis Pharmaceutical Corp., Class A | 3,260 | 100,767 | |||||||||
| Salix Pharmaceuticals Ltd. (a) | 8,650 | 150,423 | |||||||||
| Shire Pharmaceuticals Group PLC, ADR | 2,490 | 121,387 | |||||||||
| 428,944 | |||||||||||
| Industrials (16.9%) | |||||||||||
| Aerospace & Defense (3.7%) | |||||||||||
| Armor Holdings, Inc. (a) | 1,580 | 75,319 | |||||||||
| BE Aerospace, Inc. (a) | 6,800 | 142,936 | |||||||||
| Ceradyne, Inc. (a) | 4,990 | 285,627 | |||||||||
| Rockwell Collins, Inc. | 1,360 | 63,811 | |||||||||
| 567,693 | |||||||||||
| Air Freight & Logistics (1.7%) | |||||||||||
| C.H. Robinson Worldwide, Inc. | 2,930 | 118,548 | |||||||||
| UTI Worldwide, Inc. | 1,270 | 133,007 | |||||||||
| 251,555 | |||||||||||
| Commercial Services & Supplies (3.8%) | |||||||||||
| ChoicePoint, Inc. (a) | 2,376 | 97,701 | |||||||||
| Global Cash Access, Inc. (a) | 4,751 | 73,450 | |||||||||
| Huron Consulting Group, Inc. (a) | 5,706 | 160,738 | |||||||||
| Kenexa Corp. (a) | 1,377 | 33,117 | |||||||||
See Accompanying Notes to Financial Statements.
112
CMG SMALL/MID CAP FUND
A Portfolio of CMG Fund Trust
SCHEDULE OF INVESTMENTS
| Shares | Value | ||||||||||
| Common Stocks (continued) | |||||||||||
| Commercial Services & Supplies (continued) | |||||||||||
| Resources Connection, Inc. (a) | 4,380 | $ | 119,092 | ||||||||
| Robert Half International, Inc. | 2,750 | 100,458 | |||||||||
| 584,556 | |||||||||||
| Construction & Engineering (1.0%) | |||||||||||
| Jacobs Engineering Group, Inc. (a) | 1,070 | 89,206 | |||||||||
| Perini Corp. (a) | 2,320 | 63,870 | |||||||||
| 153,076 | |||||||||||
| Electrical Equipment (1.2%) | |||||||||||
| Evergreen Solar, Inc. (a) | 3,240 | 49,993 | |||||||||
| Rockwell Automation, Inc. | 1,230 | 81,266 | |||||||||
| Roper Industries, Inc. | 1,330 | 53,666 | |||||||||
| 184,925 | |||||||||||
| Machinery (4.7%) | |||||||||||
| ESCO Technologies, Inc. (a) | 1,040 | 51,106 | |||||||||
| Joy Global, Inc. | 4,310 | 232,912 | |||||||||
| Terex Corp. (a) | 3,180 | 224,190 | |||||||||
| Wabtec Corp. | 6,740 | 212,782 | |||||||||
| 720,990 | |||||||||||
| Road & Rail (0.8%) | |||||||||||
| Landstar System, Inc. | 1,800 | 76,140 | |||||||||
| Old Dominion Freight Line, Inc. (a) | 1,710 | 48,803 | |||||||||
| 124,943 | |||||||||||
| Information Technology (23.8%) | |||||||||||
| Communications Equipment (3.6%) | |||||||||||
| Avocent Corp. (a) | 1,470 | 48,907 | |||||||||
| Comverse Technology, Inc. (a) | 2,530 | 69,297 | |||||||||
| CSR PLC (a) | 7,890 | 157,207 | |||||||||
| F5 Networks, Inc. (a) | 1,800 | 116,460 | |||||||||
| Harris Corp. | 1,650 | 76,609 | |||||||||
| Ixia (a) | 6,547 | 82,492 | |||||||||
| 550,972 | |||||||||||
| Computers & Peripherals (2.1%) | |||||||||||
| Electronics for Imaging, Inc. (a) | 3,090 | 85,438 | |||||||||
| M-Systems Flash Disk Pioneers Ltd. (a) | 1,470 | 42,601 | |||||||||
| Presstek, Inc. (a) | 6,969 | 72,478 | |||||||||
| Rackable Systems, Inc. (a) | 1,978 | 59,439 | |||||||||
| Synaptics, Inc. (a) | 2,350 | 64,672 | |||||||||
| 324,628 | |||||||||||
| Electronic Equipment & Instruments (0.6%) | |||||||||||
| Trimble Navigation Ltd. (a) | 2,120 | 84,842 | |||||||||
| Internet Software & Services (1.2%) | |||||||||||
| aQuantive, Inc. (a) | 3,310 | 86,093 | |||||||||
| Digital River, Inc. (a) | 2,690 | 90,330 | |||||||||
| 176,423 | |||||||||||
| IT Services (4.3%) | |||||||||||
| Alliance Data Systems Corp. (a) | 3,310 | 139,847 | |||||||||
| CACI International, Inc., Class A (a) | 1,270 | 72,517 | |||||||||
See Accompanying Notes to Financial Statements.
113
CMG SMALL/MID CAP FUND
A Portfolio of CMG Fund Trust
SCHEDULE OF INVESTMENTS
| Shares | Value | ||||||||||
| Common Stocks (continued) | |||||||||||
| IT Services (continued) | |||||||||||
| Cognizant Technology Solutions Corp., Class A (a) | 1,730 | $ | 90,600 | ||||||||
| Euronet Worldwide, Inc. (a) | 5,630 | 181,680 | |||||||||
| Global Payments, Inc. | 1,720 | 87,600 | |||||||||
| Heartland Payment Systems, Inc. (a) | 3,260 | 80,229 | |||||||||
| 652,473 | |||||||||||
| Semiconductors & Semiconductor Equipment (7.0%) | |||||||||||
| Broadcom Corp., Class A (a) | 2,670 | 182,094 | |||||||||
| Hittite Microwave Corp. (a) | 6,130 | 171,640 | |||||||||
| Intersil Corp., Class A | 2,900 | 84,274 | |||||||||
| Marvell Technology Group Ltd. (a) | 2,290 | 156,682 | |||||||||
| MEMC Electronic Materials, Inc. (a) | 3,100 | 88,598 | |||||||||
| Silicon Laboratories, Inc. (a) | 700 | 34,461 | |||||||||
| SiRF Technology Holdings, Inc. (a) | 4,630 | 155,984 | |||||||||
| Tessera Technologies, Inc. (a) | 2,260 | 72,953 | |||||||||
| Trident Microsystems, Inc. (a) | 4,990 | 130,339 | |||||||||
| 1,077,025 | |||||||||||
| Software (5.0%) | |||||||||||
| Adobe Systems, Inc. (b) | 1,161 | �� | 46,115 | ||||||||
| Amdocs Ltd. (a) | 3,630 | 116,886 | |||||||||
| Autodesk, Inc. | 1,050 | 42,620 | |||||||||
| Embarcadero Technologies, Inc. (a) | 8,880 | 66,600 | |||||||||
| Hyperion Solutions Corp. (a) | 1,905 | 65,551 | |||||||||
| Informatica Corp. (a) | 8,400 | 123,648 | |||||||||
| Mercury Interactive Corp. (a) | 1,490 | 51,777 | |||||||||
| NAVTEQ Corp. (a) | 2,390 | 107,335 | |||||||||
| Quest Software, Inc. (a) | 6,550 | 103,752 | |||||||||
| Wind River Systems, Inc. (a) | 3,460 | 46,295 | |||||||||
| 770,579 | |||||||||||
| Materials (3.4%) | |||||||||||
| Chemicals (1.7%) | |||||||||||
| OM Group, Inc. (a) | 2,861 | 61,540 | |||||||||
| Potash Corp. of Saskatchewan, Inc. | 2,270 | 204,277 | |||||||||
| 265,817 | |||||||||||
| Construction Materials (0.6%) | |||||||||||
| Eagle Materials, Inc. | 510 | 83,074 | |||||||||
| Metals & Mining (1.1%) | |||||||||||
| Century Aluminum Co. (a) | 2,600 | 88,608 | |||||||||
| Freeport-McMoRan Copper & Gold, Inc., Class B | 660 | 42,405 | |||||||||
| Inco Ltd. | 720 | 36,922 | |||||||||
| 167,935 | |||||||||||
| Telecommunication Services (3.6%) | |||||||||||
| Wireless Telecommunication Services (3.6%) | |||||||||||
| American Tower Corp., Class A (a) | 2,109 | 65,252 | |||||||||
| Crown Castle International Corp. (a) | 2,110 | 66,739 | |||||||||
| Dobson Communications Corp., Class A (a) | 9,580 | 71,084 | |||||||||
| Millicom International Cellular SA (a) | 3,380 | 130,130 | |||||||||
See Accompanying Notes to Financial Statements.
114
CMG SMALL/MID CAP FUND
A Portfolio of CMG Fund Trust
SCHEDULE OF INVESTMENTS
| Shares | Value | ||||||||||
| Common Stocks (continued) | |||||||||||
| Wireless Telecommunication Services (continued) | |||||||||||
| NII Holdings, Inc. (a) | 2,900 | $ | 143,434 | ||||||||
| VimpelCom, ADR (a) | 1,540 | 72,072 | |||||||||
| 548,711 | |||||||||||
| Total Common Stocks (Cost of $10,845,877) | 15,075,739 | ||||||||||
| Par | |||||||||||
| Short-Term Obligation (2.0%) | |||||||||||
| Repurchase agreement with State Street Bank & Trust Co., dated 01/31/06, due 02/01/06 at 4.270%, collateralized by a U.S. Treasury Bond maturing 05/15/15, market value of $307,519 (repurchase proceeds $300,036) | $ | 300,000 | 300,000 | ||||||||
| Total Short-Term Obligation (Cost of $300,000) | 300,000 | ||||||||||
| Total Investments (100.6%) (Cost of $11,145,877) (b) | 15,375,739 | ||||||||||
| Other Assets & Liabilities, Net (-0.6%) | (86,214 | ) | |||||||||
| Net Assets (100.0%) | $ | 15,289,525 | |||||||||
Notes to Schedule of Investments:
(a) Non-income producing security.
(b) Cost for federal income tax purposes is $11,145,877.
At January 31, 2006, the Fund held investments in the following sectors:
| Sector | % of Net Assets | ||||||
| Information Technology | 23.8 | % | |||||
| Health Care | 18.9 | ||||||
| Industrials | 16.9 | ||||||
| Consumer Discretionary | 14.2 | ||||||
| Energy | 8.9 | ||||||
| Financials | 7.0 | ||||||
| Telecommunication Services | 3.6 | ||||||
| Materials | 3.4 | ||||||
| Consumer Staples | 1.9 | ||||||
| Short-Term Obligation | 2.0 | ||||||
| Other Assets & Liabilities, Net | (0.6 | ) | |||||
| 100.0 | % | ||||||
| Acronym | Name | ||||||
| ADR | American Depositary Receipt | ||||||
See Accompanying Notes to Financial Statements.
115
CMG INTERNATIONAL STOCK FUND
A Portfolio of CMG Fund Trust
SCHEDULE OF INVESTMENTS
January 31, 2006 (Unaudited)
| Shares | Value | ||||||||||
| Common Stocks (97.9%) | |||||||||||
| Consumer Discretionary (10.3%) | |||||||||||
| Auto Components (2.2%) | |||||||||||
| Compagnie Generale des Etablissements Michelin, Class B | 15,336 | $ | 915,936 | ||||||||
| Continental AG | 8,057 | 784,216 | |||||||||
| Denso Corp. | 24,100 | 848,498 | |||||||||
| 2,548,650 | |||||||||||
| Automobiles (2.2%) | |||||||||||
| Renault SA | 4,999 | 471,991 | |||||||||
| Toyota Motor Corp. | 39,400 | 2,042,129 | |||||||||
| 2,514,120 | |||||||||||
| Household Durables (3.7%) | |||||||||||
| Daiwa House Industry Co., Ltd. | 37,000 | 621,372 | |||||||||
| JM AB | 9,300 | 476,995 | |||||||||
| Makita Corp. | 17,000 | 494,182 | |||||||||
| Matsushita Electric Industrial Co., Ltd. | 42,000 | 913,004 | |||||||||
| Sharp Corp. | 19,000 | 347,428 | |||||||||
| Sony Corp. | 11,200 | 544,222 | |||||||||
| Taylor Woodrow PLC | 129,782 | 900,440 | |||||||||
| 4,297,643 | |||||||||||
| Leisure Equipment & Products (0.3%) | |||||||||||
| Sega Sammy Holdings, Inc. | 10,800 | 387,605 | |||||||||
| Media (1.3%) | |||||||||||
| Vivendi Universal SA | 46,487 | 1,456,277 | |||||||||
| Specialty Retail (0.6%) | |||||||||||
| Yamada Denki Co., Ltd. | 5,600 | 721,811 | |||||||||
| Consumer Staples (6.2%) | |||||||||||
| Beverages (0.7%) | |||||||||||
| Diageo PLC | 53,993 | 803,487 | |||||||||
| Food & Staples Retailing (0.3%) | |||||||||||
| FamilyMart Co., Ltd. | 10,900 | 365,176 | |||||||||
| Food Products (2.8%) | |||||||||||
| Nestle SA, Registered Shares | 7,644 | 2,242,168 | |||||||||
| Unilever PLC | 93,057 | 978,391 | |||||||||
| 3,220,559 | |||||||||||
| Household Products (0.5%) | |||||||||||
| Kao Corp. | 21,000 | 605,089 | |||||||||
| Tobacco (1.9%) | |||||||||||
| British American Tobacco PLC | 43,361 | 977,353 | |||||||||
| Imperial Tobacco Group PLC | 24,080 | 716,256 | |||||||||
| Japan Tobacco, Inc. | 32 | 496,484 | |||||||||
| 2,190,093 | |||||||||||
See Accompanying Notes to Financial Statements.
116
CMG INTERNATIONAL STOCK FUND
A Portfolio of CMG Fund Trust
SCHEDULE OF INVESTMENTS
| Shares | Value | ||||||||||
| Common Stocks (continued) | |||||||||||
| Energy (10.5%) | |||||||||||
| Energy Equipment & Services (0.7%) | |||||||||||
| Saipem S.p.A. | 37,424 | $ | 745,348 | ||||||||
| Oil, Gas & Consumable Fuels (9.8%) | |||||||||||
| BP PLC, ADR | 29,080 | 2,102,775 | |||||||||
| CNOOC Ltd. | 479,000 | 407,008 | |||||||||
| EnCana Corp. | 10,800 | 538,080 | |||||||||
| ENI S.p.A. | 59,740 | 1,806,115 | |||||||||
| LUKOIL, ADR | 3,899 | 298,273 | |||||||||
| Norsk Hydro ASA | 11,200 | 1,374,620 | |||||||||
| PetroChina Co., Ltd., Class H | 458,000 | 454,242 | |||||||||
| Royal Dutch Shell PLC, Class A | 26,268 | 893,959 | |||||||||
| Royal Dutch Shell PLC, Class B | 20,585 | 738,273 | |||||||||
| Statoil ASA | 28,100 | 772,976 | |||||||||
| Total SA | 7,082 | 1,955,213 | |||||||||
| 11,341,534 | |||||||||||
| Financials (31.0%) | |||||||||||
| Capital Markets (4.5%) | |||||||||||
| Credit Suisse Group, Registered Shares | 19,405 | 1,133,078 | |||||||||
| Daiwa Securities Group, Inc. | 42,000 | 493,022 | |||||||||
| Deutsche Bank AG, Registered Shares | 12,494 | 1,341,792 | |||||||||
| Nomura Holdings, Inc. | 56,300 | 1,099,075 | |||||||||
| UBS AG, Registered Shares | 10,309 | 1,120,850 | |||||||||
| 5,187,817 | |||||||||||
| Commercial Banks (16.7%) | |||||||||||
| Australia & New Zealand Banking Group Ltd. | 33,353 | 629,719 | |||||||||
| Banco Bilbao Vizcaya Argentaria SA | 86,213 | 1,741,139 | |||||||||
| Banco Santander Central Hispano SA | 73,635 | 1,059,414 | |||||||||
| Barclays PLC | 160,737 | 1,718,565 | |||||||||
| BNP Paribas SA | 18,224 | 1,625,434 | |||||||||
| ForeningsSparbanken AB | 23,700 | 675,663 | |||||||||
| HBOS PLC | 92,091 | 1,619,457 | |||||||||
| HSBC Holdings PLC | 98,844 | 1,642,377 | |||||||||
| Industrial Bank of Korea | 40,700 | 723,584 | |||||||||
| Mitsubishi UFJ Financial Group, Inc. | 110 | 1,584,758 | |||||||||
| Mizuho Financial Group, Inc. | 174 | 1,423,980 | |||||||||
| Societe Generale | 10,817 | 1,428,782 | |||||||||
| Sumitomo Mitsui Financial Group, Inc. | 77 | 899,280 | |||||||||
| Sumitomo Trust & Banking Co., Ltd. | 58,000 | 638,319 | |||||||||
| United Overseas Bank Ltd. | 87,000 | 780,690 | |||||||||
| Westpac Banking Corp. | 56,725 | 1,000,883 | |||||||||
| 19,192,044 | |||||||||||
| Consumer Finance (1.1%) | |||||||||||
| Aiful Corp. | 9,550 | 644,781 | |||||||||
| ORIX Corp. | 2,400 | 620,945 | |||||||||
| 1,265,726 | |||||||||||
See Accompanying Notes to Financial Statements.
117
CMG INTERNATIONAL STOCK FUND
A Portfolio of CMG Fund Trust
SCHEDULE OF INVESTMENTS
| Shares | Value | ||||||||||
| Common Stocks (continued) | |||||||||||
| Diversified Financial Services (2.0%) | |||||||||||
| Fortis | 30,346 | $ | 1,055,729 | ||||||||
| ING Groep NV | 34,245 | 1,222,168 | |||||||||
| 2,277,897 | |||||||||||
| Insurance (5.0%) | |||||||||||
| Allianz AG, Registered Shares | 8,128 | 1,310,149 | |||||||||
| Aviva PLC | 75,368 | 966,043 | |||||||||
| AXA | 37,684 | 1,277,589 | |||||||||
| Muenchener Rueckversicherungs-Gesellschaft AG, Registered Shares | 5,019 | 681,423 | |||||||||
| Sampo Oyj, Class A | 56,300 | 1,097,343 | |||||||||
| Storebrand ASA | 45,200 | 460,316 | |||||||||
| 5,792,863 | |||||||||||
| Real Estate (1.7%) | |||||||||||
| CapitaLand Ltd. | 320,000 | 781,372 | |||||||||
| Sun Hung Kai Properties Ltd. | 41,000 | 424,151 | |||||||||
| Swire Pacific Ltd., Class A | 81,500 | 759,451 | |||||||||
| 1,964,974 | |||||||||||
| Health Care (8.7%) | |||||||||||
| Health Care Equipment & Supplies (0.6%) | |||||||||||
| GN Store Nord A/S | 48,400 | 691,423 | |||||||||
| Pharmaceuticals (8.1%) | |||||||||||
| Altana AG | 12,500 | 698,255 | |||||||||
| Astellas Pharma, Inc. | 8,400 | 347,300 | |||||||||
| AstraZeneca PLC | 31,526 | 1,526,626 | |||||||||
| Eisai Co., Ltd. | 10,800 | 461,259 | |||||||||
| GlaxoSmithKline PLC | 51,226 | 1,310,464 | |||||||||
| H Lundbeck A/S | 30,400 | 678,025 | |||||||||
| Novartis AG, Registered Shares | 21,966 | 1,206,158 | |||||||||
| Roche Holding AG, Genusschein Shares | 6,030 | 952,763 | |||||||||
| Sanofi-Aventis | 13,482 | 1,236,071 | |||||||||
| Takeda Pharmaceutical Co., Ltd. | 15,800 | 894,352 | |||||||||
| 9,311,273 | |||||||||||
| Industrials (10.1%) | |||||||||||
| Aerospace & Defense (0.4%) | |||||||||||
| Singapore Technologies Engineering Ltd. | 266,000 | 491,335 | |||||||||
| Air Freight & Logistics (0.4%) | |||||||||||
| Deutsche Post AG, Registered Shares | 14,467 | 407,670 | |||||||||
| Construction & Engineering (0.8%) | |||||||||||
| Shimizu Corp. | 111,000 | 876,228 | |||||||||
| Electrical Equipment (1.9%) | |||||||||||
| ABB Ltd. (a) | 68,524 | 745,030 | |||||||||
| Mitsubishi Electric Corp. | 123,000 | 1,001,364 | |||||||||
| Shanghai Electric Group Co., Ltd., Class H (a) | 1,266,000 | 502,404 | |||||||||
| 2,248,798 | |||||||||||
See Accompanying Notes to Financial Statements.
118
CMG INTERNATIONAL STOCK FUND
A Portfolio of CMG Fund Trust
SCHEDULE OF INVESTMENTS
| Shares | Value | ||||||||||
| Common Stocks (continued) | |||||||||||
| Industrial Conglomerates (0.8%) | |||||||||||
| Hutchison Whampoa Ltd. | 46,000 | $ | 470,622 | ||||||||
| SembCorp Industries Ltd. | 217,040 | 396,122 | |||||||||
| 866,744 | |||||||||||
| Machinery (3.5%) | |||||||||||
| Atlas Copco AB, Class B | 39,500 | 837,427 | |||||||||
| Komatsu Ltd. | 58,000 | 1,070,457 | |||||||||
| Saurer AG, Registered Shares | 6,500 | 459,111 | |||||||||
| Stork NV | 18,400 | 820,566 | |||||||||
| THK Co., Ltd. | 10,200 | 322,595 | |||||||||
| Volvo AB, Class B | 11,900 | 582,926 | |||||||||
| 4,093,082 | |||||||||||
| Road & Rail (1.0%) | |||||||||||
| Central Japan Railway Co. | 81 | 828,609 | |||||||||
| ComfortDelGro Corp., Ltd. | 289,000 | 303,042 | |||||||||
| 1,131,651 | |||||||||||
| Trading Companies & Distributors (1.3%) | |||||||||||
| Hitachi High-Technologies Corp. | 13,400 | 376,966 | |||||||||
| Mitsubishi Corp. | 47,100 | 1,100,158 | |||||||||
| 1,477,124 | |||||||||||
| Information Technology (6.6%) | |||||||||||
| Communications Equipment (2.1%) | |||||||||||
| Nokia Oyj | 91,100 | 1,666,037 | |||||||||
| Telefonaktiebolaget LM Ericsson, ADR | 21,500 | 784,320 | |||||||||
| 2,450,357 | |||||||||||
| Computers & Peripherals (0.7%) | |||||||||||
| FUJITSU Ltd. | 27,000 | 237,995 | |||||||||
| Toshiba Corp. | 85,000 | 544,179 | |||||||||
| 782,174 | |||||||||||
| Electronic Equipment & Instruments (0.5%) | |||||||||||
| Hoya Corp. | 16,000 | 641,064 | |||||||||
| IT Services (0.5%) | |||||||||||
| CGI Group, Inc. (a) | 68,200 | 532,883 | |||||||||
| Office Electronics (0.9%) | |||||||||||
| Canon, Inc. | 16,800 | 1,013,972 | |||||||||
| Semiconductors & Semiconductor Equipment (1.4%) | |||||||||||
| Advantest Corp. | 3,800 | 466,477 | |||||||||
| Samsung Electronics Co., Ltd. | 1,014 | 777,857 | |||||||||
| Taiwan Semiconductor Manufacturing Co., Ltd., ADR | 35,664 | 385,171 | |||||||||
| 1,629,505 | |||||||||||
| Software (0.5%) | |||||||||||
| Cognos, Inc. (a) | 15,300 | 582,930 | |||||||||
See Accompanying Notes to Financial Statements.
119
CMG INTERNATIONAL STOCK FUND
A Portfolio of CMG Fund Trust
SCHEDULE OF INVESTMENTS
| Shares | Value | ||||||||||
| Common Stocks (continued) | |||||||||||
| Materials (6.8%) | |||||||||||
| Chemicals (5.0%) | |||||||||||
| BASF AG | 20,951 | $ | 1,651,245 | ||||||||
| Bayer AG | 11,146 | 465,509 | |||||||||
| Shin-Etsu Chemical Co., Ltd. | 13,300 | 756,242 | |||||||||
| Sumitomo Chemical Co., Ltd. | 126,000 | 971,007 | |||||||||
| Syngenta AG (a) | 5,744 | 730,103 | |||||||||
| Teijin Ltd. | 90,000 | 613,785 | |||||||||
| Yara International ASA | 36,600 | 541,908 | |||||||||
| 5,729,799 | |||||||||||
| Metals & Mining (1.8%) | |||||||||||
| Anglo American PLC | 15,249 | 585,964 | |||||||||
| Kobe Steel Ltd. | 173,000 | 592,865 | |||||||||
| Rio Tinto PLC | 16,892 | 861,557 | |||||||||
| 2,040,386 | |||||||||||
| Telecommunication Services (3.7%) | |||||||||||
| Diversified Telecommunication Services (2.1%) | |||||||||||
| Deutsche Telekom AG, Registered Shares | 66,554 | 1,053,776 | |||||||||
| Nippon Telegraph & Telephone Corp. | 140 | 649,247 | |||||||||
| Telekom Austria AG | 31,533 | 763,281 | |||||||||
| 2,466,304 | |||||||||||
| Wireless Telecommunication Services (1.6%) | |||||||||||
| China Mobile Hong Kong Ltd. | 79,500 | 387,387 | |||||||||
| NTT DoCoMo, Inc. | 232 | 375,772 | |||||||||
| Vodafone Group PLC | 506,425 | 1,063,097 | |||||||||
| 1,826,256 | |||||||||||
| Utilities (4.0%) | |||||||||||
| Electric Utilities (2.7%) | |||||||||||
| E.ON AG | 16,760 | 1,872,238 | |||||||||
| Endesa SA | 27,700 | 797,733 | |||||||||
| Fortum Oyj | 24,800 | 554,196 | |||||||||
| 3,224,167 | |||||||||||
| Gas Utilities (0.5%) | |||||||||||
| Tokyo Gas Co., Ltd. | 117,000 | 543,583 | |||||||||
| Independent Power Producers & Energy Traders (0.8%) | |||||||||||
| Electric Power Development Co. | 25,200 | 889,374 | |||||||||
| Total Common Stocks (Cost of $87,597,648) | 112,826,795 | ||||||||||
See Accompanying Notes to Financial Statements.
120
CMG INTERNATIONAL STOCK FUND
A Portfolio of CMG Fund Trust
SCHEDULE OF INVESTMENTS
| Shares | Value | ||||||||||
| Investment Companies (1.4%) | |||||||||||
| iShares MSCI EAFE Index Fund | 7,663 | $ | 481,696 | ||||||||
| iShares MSCI South Korea Index Fund | 12,129 | 586,922 | |||||||||
| iShares MSCI Taiwan Index Fund | 40,431 | 545,819 | |||||||||
| Total Investment Companies (Cost of $1,376,763) | 1,614,437 | ||||||||||
| Units | |||||||||||
| Rights (0.0%) | |||||||||||
| Telecommunication Services (0.0%) | |||||||||||
| Wireless Telecommunication Services (0.0%) | |||||||||||
| 3 Italia S.p.A. (a)(b)(c) | 46 | - | |||||||||
| Total Rights (Cost of $-) | - | ||||||||||
| Par | |||||||||||
| Short-Term Obligation (1.4%) | |||||||||||
| Repurchase agreement with State Street Bank & Trust Co., dated 01/31/06, due 02/01/06 at 4.270%, collateralized by a U.S. Treasury Note maturing 11/15/08, market value of $1,636,621 (repurchase proceeds $1,604,190) | $ | 1,604,000 | 1,604,000 | ||||||||
| Total Short-Term Obligation (Cost of $1,604,000) | 1,604,000 | ||||||||||
| Total Investments (100.7%) (Cost of $90,578,411) (d) | 116,045,232 | ||||||||||
| Other Assets & Liabilities, Net (-0.7%) | (764,028 | ) | |||||||||
| Net Assets (100.0%) | $ | 115,281,204 | |||||||||
Notes to Schedule of Investments:
(a) Non-income producing security.
(b) Represents fair value as determined in good faith under procedures approved by the Board of Trustees.
(c) Security has no value.
(d) Cost for federal income tax purposes is $90,578,411.
See Accompanying Notes to Financial Statements.
121
CMG INTERNATIONAL STOCK FUND
A Portfolio of CMG Fund Trust
SCHEDULE OF INVESTMENTS
The Fund invested in the following countries at January 31, 2006:
| Summary of Securities by Country | Value | % of Total Investments | |||||||||
| Japan | $ | 31,366,010 | 27.0 | % | |||||||
| United Kingdom | 19,405,084 | 16.7 | |||||||||
| France | 10,367,293 | 8.9 | |||||||||
| Germany | 10,266,273 | 8.8 | |||||||||
| Switzerland | 8,589,261 | 7.4 | |||||||||
| Spain | 3,598,286 | 3.1 | |||||||||
| Sweden | 3,357,331 | 2.9 | |||||||||
| Finland | 3,317,576 | 2.9 | |||||||||
| Norway | 3,149,820 | 2.7 | |||||||||
| Singapore | 2,752,561 | 2.4 | |||||||||
| Italy | 2,551,463 | 2.2 | |||||||||
| Hong Kong | 2,448,619 | 2.1 | |||||||||
| South Korea | 2,088,363 | 1.8 | |||||||||
| United States* | 2,085,696 | 1.8 | |||||||||
| Netherlands | 2,042,734 | 1.8 | |||||||||
| Canada | 1,653,893 | 1.4 | |||||||||
| Australia | 1,630,602 | 1.4 | |||||||||
| Denmark | 1,369,448 | 1.2 | |||||||||
| Belgium | 1,055,729 | 0.9 | |||||||||
| China | 956,646 | 0.8 | |||||||||
| Taiwan | 930,990 | 0.8 | |||||||||
| Austria | 763,281 | 0.7 | |||||||||
| Russian Federation | 298,273 | 0.3 | |||||||||
| $ | 116,045,232 | 100.0 | % | ||||||||
*Includes short-term obligation.
Certain securities are listed by country of underlying exposure but may trade predominately on other exchanges.
| Acronym | Name | ||||||
| ADR | American Depositary Receipt | ||||||
See Accompanying Notes to Financial Statements.
122
This page is intentionally left blank.
STATEMENTS OF ASSETS AND LIABILITIES
January 31, 2006 (Unaudited)
| CMG Enhanced S&P 500® Index Fund | CMG Large Cap Growth Fund | CMG Large Cap Value Fund | CMG Mid Cap Growth Fund | CMG Mid Cap Value Fund | |||||||||||||||||||
| ASSETS: | |||||||||||||||||||||||
| Investments, at identified cost | $ | 74,428,130 | $ | 32,779,588 | $ | 31,545,368 | $ | 18,942,140 | $ | 14,810,316 | |||||||||||||
| Investments, at value | $ | 86,746,221 | $ | 37,768,844 | $ | 36,328,010 | $ | 26,149,881 | $ | 18,408,246 | |||||||||||||
| Cash | 58 | 125 | 331 | 576 | 116 | ||||||||||||||||||
| Receivable for: | |||||||||||||||||||||||
| Investments sold | 140,000 | 1,066,786 | 531,380 | 96,311 | 179,709 | ||||||||||||||||||
| Capital stock sold | - | - | - | - | - | ||||||||||||||||||
| Interest | 1,129 | 136 | 45 | 116 | 375 | ||||||||||||||||||
| Dividends | 64,179 | 11,497 | 30,306 | 4,122 | 11,970 | ||||||||||||||||||
| Foreign tax reclaims | - | - | - | - | 138 | ||||||||||||||||||
| Expense reimbursement due from Investment Advisor | 9,072 | 6,257 | 6,597 | 5,784 | 7,018 | ||||||||||||||||||
| Deferred Trustees' compensation plan | 2,977 | 2,483 | 2,542 | 2,351 | 2,340 | ||||||||||||||||||
| Other assets | 2,380 | 1,678 | 2,744 | 1,585 | 1,585 | ||||||||||||||||||
| Total assets | 86,966,016 | 38,857,806 | 36,901,955 | 26,260,726 | 18,611,497 | ||||||||||||||||||
| LIABILITIES: | |||||||||||||||||||||||
| Payable to custodian bank | - | - | - | - | - | ||||||||||||||||||
| Payable for: | |||||||||||||||||||||||
| Investments purchased | - | 568,209 | 146,321 | - | 159,892 | ||||||||||||||||||
| Futures variation margin | 12,250 | - | - | - | - | ||||||||||||||||||
| Investment advisory fee | 17,496 | 15,891 | 15,280 | 14,905 | 10,799 | ||||||||||||||||||
| Trustee legal counsel fees | 424 | 214 | 205 | 140 | 150 | ||||||||||||||||||
| Audit fee | 13,548 | 15,884 | 15,884 | 15,884 | 15,884 | ||||||||||||||||||
| Deferred Trustees' fees | 2,977 | 2,483 | 2,542 | 2,351 | 2,340 | ||||||||||||||||||
| Total liabilities | 46,695 | 602,681 | 180,232 | 33,280 | 189,065 | ||||||||||||||||||
| NET ASSETS | $ | 86,919,321 | $ | 38,255,125 | $ | 36,721,723 | $ | 26,227,446 | $ | 18,422,432 | |||||||||||||
| NET ASSETS consist of: | |||||||||||||||||||||||
| Paid-in-capital | $ | 72,171,926 | $ | 32,843,748 | $ | 30,466,810 | $ | 18,698,859 | $ | 13,864,932 | |||||||||||||
| Undistributed (overdistributed) net investment income | 20,027 | (7,476 | ) | 15,910 | - | (1,166 | ) | ||||||||||||||||
| Accumulated net investment loss | - | - | - | (9,136 | ) | - | |||||||||||||||||
| Accumulated net realized gain | 2,375,306 | 429,597 | 1,456,361 | 329,982 | 960,736 | ||||||||||||||||||
| Net unrealized appreciation (depreciation) on: | |||||||||||||||||||||||
| Investments | 12,318,091 | 4,989,256 | 4,782,642 | 7,207,741 | 3,597,930 | ||||||||||||||||||
| Foreign currency translations | - | - | - | - | - | ||||||||||||||||||
| Futures contracts | 33,971 | - | - | - | - | ||||||||||||||||||
| NET ASSETS | $ | 86,919,321 | $ | 38,255,125 | $ | 36,721,723 | $ | 26,227,446 | $ | 18,422,432 | |||||||||||||
| Shares of capital stock outstanding | 6,495,503 | 3,261,526 | 3,153,811 | 1,624,209 | 1,320,124 | ||||||||||||||||||
| Net asset value, offering and redemption price per share | $ | 13.38 | $ | 11.73 | $ | 11.64 | $ | 16.15 | $ | 13.96 | |||||||||||||
| CMG Small Cap Growth Fund | CMG Small Cap Value Fund | CMG Small/Mid Cap Fund | CMG International Stock Fund | ||||||||||||||||
| ASSETS: | |||||||||||||||||||
| Investments, at identified cost | $ | 34,460,114 | $ | 25,618,849 | $ | 11,145,877 | $ | 90,578,411 | |||||||||||
| Investments, at value | $ | 41,240,263 | $ | 37,673,597 | $ | 15,375,739 | $ | 116,045,232 | |||||||||||
| Cash | 764 | 627 | 666 | - | |||||||||||||||
| Receivable for: | |||||||||||||||||||
| Investments sold | 391,669 | 259,597 | 56,588 | 381,617 | |||||||||||||||
| Capital stock sold | - | - | - | 95,115 | |||||||||||||||
| Interest | 99 | 24 | 36 | 190 | |||||||||||||||
| Dividends | 96 | 24,358 | 499 | 97,486 | |||||||||||||||
| Foreign tax reclaims | - | - | - | 18,785 | |||||||||||||||
| Expense reimbursement due from Investment Advisor | 6,264 | 6,931 | 3,575 | 5,739 | |||||||||||||||
| Deferred Trustees' compensation plan | 2,494 | 2,560 | 2,779 | 5,183 | |||||||||||||||
| Other assets | 1,663 | 3,875 | 1,038 | 1,559 | |||||||||||||||
| Total assets | 41,643,312 | 37,971,569 | 15,440,920 | 116,650,906 | |||||||||||||||
| LIABILITIES: | |||||||||||||||||||
| Payable to custodian bank | - | - | - | 379,066 | |||||||||||||||
| Payable for: | |||||||||||||||||||
| Investments purchased | 409,100 | 267,076 | 122,083 | 899,503 | |||||||||||||||
| Futures variation margin | - | - | - | - | |||||||||||||||
| Investment advisory fee | 25,878 | 23,631 | 9,745 | 71,529 | |||||||||||||||
| Trustee legal counsel fees | 266 | 179 | 2,283 | 1,235 | |||||||||||||||
| Audit fee | 15,884 | 17,488 | 14,505 | 13,186 | |||||||||||||||
| Deferred Trustees' fees | 2,494 | 2,560 | 2,779 | 5,183 | |||||||||||||||
| Total liabilities | 453,622 | 310,934 | 151,395 | 1,369,702 | |||||||||||||||
| NET ASSETS | $ | 41,189,690 | $ | 37,660,635 | $ | 15,289,525 | $ | 115,281,204 | |||||||||||
| NET ASSETS consist of: | |||||||||||||||||||
| Paid-in-capital | $ | 33,973,084 | $ | 24,635,407 | $ | 7,177,620 | $ | 83,551,116 | |||||||||||
| Undistributed (overdistributed) net investment income | - | (7,381 | ) | - | (5,729 | ) | |||||||||||||
| Accumulated net investment loss | (117,378 | ) | - | (73,701 | ) | - | |||||||||||||
| Accumulated net realized gain | 553,835 | 977,861 | 3,955,744 | 6,274,418 | |||||||||||||||
| Net unrealized appreciation (depreciation) on: | |||||||||||||||||||
| Investments | 6,780,149 | 12,054,748 | 4,229,862 | 25,466,821 | |||||||||||||||
| Foreign currency translations | - | - | - | (5,422 | ) | ||||||||||||||
| Futures contracts | - | - | - | - | |||||||||||||||
| NET ASSETS | $ | 41,189,690 | $ | 37,660,635 | $ | 15,289,525 | $ | 115,281,204 | |||||||||||
| Shares of capital stock outstanding | 3,029,275 | 2,426,119 | 1,273,023 | 8,213,373 | |||||||||||||||
| Net asset value, offering and redemption price per share | $ | 13.60 | $ | 15.52 | $ | 12.01 | $ | 14.04 | |||||||||||
See Accompanying Notes to Financial Statements.
124
| CMG Small Cap Growth Fund | CMG Small Cap Value Fund | CMG Small/Mid Cap Fund | CMG International Stock Fund | ||||||||||||||||
| ASSETS: | |||||||||||||||||||
| Investments, at identified cost | $ | 34,460,114 | $ | 25,618,849 | $ | 11,145,877 | $ | 90,578,411 | |||||||||||
| Investments, at value | $ | 41,240,263 | $ | 37,673,597 | $ | 15,375,739 | $ | 116,045,232 | |||||||||||
| Cash | 764 | 627 | 666 | - | |||||||||||||||
| Receivable for: | |||||||||||||||||||
| Investments sold | 391,669 | 259,597 | 56,588 | 381,617 | |||||||||||||||
| Capital stock sold | - | - | - | 95,115 | |||||||||||||||
| Interest | 99 | 24 | 36 | 190 | |||||||||||||||
| Dividends | 96 | 24,358 | 499 | 97,486 | |||||||||||||||
| Foreign tax reclaims | - | - | - | 18,785 | |||||||||||||||
| Expense reimbursement due from Investment Advisor | 6,264 | 6,931 | 3,575 | 5,739 | |||||||||||||||
| Deferred Trustees' compensation plan | 2,494 | 2,560 | 2,779 | 5,183 | |||||||||||||||
| Other assets | 1,663 | 3,875 | 1,038 | 1,559 | |||||||||||||||
| Total assets | 41,643,312 | 37,971,569 | 15,440,920 | 116,650,906 | |||||||||||||||
| LIABILITIES: | |||||||||||||||||||
| Payable to custodian bank | - | - | - | 379,066 | |||||||||||||||
| Payable for: | |||||||||||||||||||
| Investments purchased | 409,100 | 267,076 | 122,083 | 899,503 | |||||||||||||||
| Futures variation margin | - | - | - | - | |||||||||||||||
| Investment advisory fee | 25,878 | 23,631 | 9,745 | 71,529 | |||||||||||||||
| Trustee legal counsel fees | 266 | 179 | 2,283 | 1,235 | |||||||||||||||
| Audit fee | 15,884 | 17,488 | 14,505 | 13,186 | |||||||||||||||
| Deferred Trustees' fees | 2,494 | 2,560 | 2,779 | 5,183 | |||||||||||||||
| Total liabilities | 453,622 | 310,934 | 151,395 | 1,369,702 | |||||||||||||||
| NET ASSETS | $ | 41,189,690 | $ | 37,660,635 | $ | 15,289,525 | $ | 115,281,204 | |||||||||||
| NET ASSETS consist of: | |||||||||||||||||||
| Paid-in-capital | $ | 33,973,084 | $ | 24,635,407 | $ | 7,177,620 | $ | 83,551,116 | |||||||||||
| Undistributed (overdistributed) net investment income | - | (7,381 | ) | - | (5,729 | ) | |||||||||||||
| Accumulated net investment loss | (117,378 | ) | - | (73,701 | ) | - | |||||||||||||
| Accumulated net realized gain | 553,835 | 977,861 | 3,955,744 | 6,274,418 | |||||||||||||||
| Net unrealized appreciation (depreciation) on: | |||||||||||||||||||
| Investments | 6,780,149 | 12,054,748 | 4,229,862 | 25,466,821 | |||||||||||||||
| Foreign currency translations | - | - | - | (5,422 | ) | ||||||||||||||
| Futures contracts | - | - | - | - | |||||||||||||||
| NET ASSETS | $ | 41,189,690 | $ | 37,660,635 | $ | 15,289,525 | $ | 115,281,204 | |||||||||||
| Shares of capital stock outstanding | 3,029,275 | 2,426,119 | 1,273,023 | 8,213,373 | |||||||||||||||
| Net asset value, offering and redemption price per share | $ | 13.60 | $ | 15.52 | $ | 12.01 | $ | 14.04 | |||||||||||
See Accompanying Notes to Financial Statements.
125
STATEMENTS OF OPERATIONS
For the Six Months Ended January 31, 2006 (Unaudited)
| CMG Enhanced S&P 500® Index Fund | CMG Large Cap Growth Fund | CMG Large Cap Value Fund | CMG Mid Cap Growth Fund | CMG Mid Cap Value Fund | |||||||||||||||||||
| NET INVESTMENT INCOME: | |||||||||||||||||||||||
| Income: | |||||||||||||||||||||||
| Dividends | $ | 828,970 | $ | 180,129 | $ | 400,902 | $ | 70,014 | $ | 168,497 | |||||||||||||
| Interest | 28,714 | 16,886 | 12,814 | 10,383 | 5,766 | ||||||||||||||||||
| Foreign withholding tax | - | (618 | ) | (258 | ) | - | - | ||||||||||||||||
| Total income | 857,684 | 196,397 | 413,458 | 80,397 | 174,263 | ||||||||||||||||||
| Expenses: | |||||||||||||||||||||||
| Investment advisory fee | 110,997 | 98,616 | 94,278 | 87,801 | 68,603 | ||||||||||||||||||
| Trustees' fees | 4,892 | 4,101 | 4,126 | 3,838 | 3,841 | ||||||||||||||||||
| Audit fee | 15,348 | 17,684 | 17,684 | 17,684 | 17,684 | ||||||||||||||||||
| Trustee legal counsel fees | 2,550 | 1,094 | 1,125 | 628 | 594 | ||||||||||||||||||
| Non-recurring costs (See Note 9) | 675 | 301 | 287 | 191 | 150 | ||||||||||||||||||
| Total operating expenses | 134,462 | 121,796 | 117,500 | 110,142 | 90,872 | ||||||||||||||||||
| Interest expense | 935 | 795 | - | - | - | ||||||||||||||||||
| Total expenses | 135,397 | 122,591 | 117,500 | 110,142 | 90,872 | ||||||||||||||||||
| Expense reimbursement from Investment Advisor | (22,790 | ) | (22,879 | ) | (22,935 | ) | (22,150 | ) | (22,119 | ) | |||||||||||||
| Non-recurring costs assumed by Investment Advisor (See Note 9) | (675 | ) | (301 | ) | (287 | ) | (191 | ) | (150 | ) | |||||||||||||
| Net expenses | 111,932 | 99,411 | 94,278 | 87,801 | 68,603 | ||||||||||||||||||
| Net investment income (loss) | 745,752 | 96,986 | 319,180 | (7,404 | ) | 105,660 | |||||||||||||||||
| NET REALIZED AND UNREALIZED GAIN (LOSS) ON INVESTMENTS, FOREIGN CURRENCY AND FUTURES CONTRACTS: | |||||||||||||||||||||||
| Net realized gain (loss) on: | |||||||||||||||||||||||
| Investments | 4,320,997 | 1,355,804 | 2,934,524 | 903,363 | 1,806,978 | ||||||||||||||||||
| Foreign currency transactions | - | (7 | ) | - | (528 | ) | 21 | ||||||||||||||||
| Futures contracts | 34,986 | - | - | - | - | ||||||||||||||||||
| Net realized loss on the disposal of investments purchased/sold in error (See Note 8) | - | - | - | - | - | ||||||||||||||||||
| Net realized gain | 4,355,983 | 1,355,797 | 2,934,524 | 902,835 | 1,806,999 | ||||||||||||||||||
| Net change in unrealized appreciation (depreciation) on: | |||||||||||||||||||||||
| Investments | 218,462 | 1,236,106 | (562,209 | ) | 3,102,251 | (367,374 | ) | ||||||||||||||||
| Foreign currency translations | - | - | - | - | (12 | ) | |||||||||||||||||
| Futures contracts | 33,971 | - | - | - | - | ||||||||||||||||||
| Net change in unrealized appreciation (depreciation) | 252,433 | 1,236,106 | (562,209 | ) | 3,102,251 | (367,386 | ) | ||||||||||||||||
| Net gain | 4,608,416 | 2,591,903 | 2,372,315 | 4,005,086 | 1,439,613 | ||||||||||||||||||
| NET INCREASE IN NET ASSETS FROM OPERATIONS | $ | 5,354,168 | $ | 2,688,889 | $ | 2,691,495 | $ | 3,997,682 | $ | 1,545,273 | |||||||||||||
See Accompanying Notes to Financial Statements.
126
| CMG Small Cap Growth Fund | CMG Small Cap Value Fund | CMG Small/Mid Cap Fund | CMG International Stock Fund | ||||||||||||||||
| NET INVESTMENT INCOME: | |||||||||||||||||||
| Income: | |||||||||||||||||||
| Dividends | $ | 24,386 | $ | 244,737 | $ | 33,994 | $ | 1,002,166 | |||||||||||
| Interest | 15,348 | 3,297 | 10,061 | 25,092 | |||||||||||||||
| Foreign withholding tax | - | - | (263 | ) | (46,755 | ) | |||||||||||||
| Total income | 39,734 | 248,034 | 43,792 | 980,503 | |||||||||||||||
| Expenses: | |||||||||||||||||||
| Investment advisory fee | 154,481 | 145,304 | 115,386 | 464,406 | |||||||||||||||
| Trustees' fees | 4,051 | 4,466 | 3,996 | 6,280 | |||||||||||||||
| Audit fee | 17,683 | 16,050 | 15,163 | 16,796 | |||||||||||||||
| Trustee legal counsel fees | 1,070 | 1,170 | 2,062 | 3,584 | |||||||||||||||
| Non-recurring costs (See Note 9) | 294 | 276 | 239 | 946 | |||||||||||||||
| Total operating expenses | 177,579 | 167,266 | 136,846 | 492,012 | |||||||||||||||
| Interest expense | 662 | 134 | - | 5,951 | |||||||||||||||
| Total expenses | 178,241 | 167,400 | 136,846 | 497,963 | |||||||||||||||
| Expense reimbursement from Investment Advisor | (22,804 | ) | (21,686 | ) | (21,221 | ) | (26,660 | ) | |||||||||||
| Non-recurring costs assumed by Investment Advisor (See Note 9) | (294 | ) | (276 | ) | (239 | ) | (946 | ) | |||||||||||
| Net expenses | 155,143 | 145,438 | 115,386 | 470,357 | |||||||||||||||
| Net investment income (loss) | (115,409 | ) | 102,596 | (71,594 | ) | 510,146 | |||||||||||||
| NET REALIZED AND UNREALIZED GAIN (LOSS) ON INVESTMENTS, FOREIGN CURRENCY AND FUTURES CONTRACTS: | |||||||||||||||||||
| Net realized gain (loss) on: | |||||||||||||||||||
| Investments | 3,837,977 | 2,137,669 | 5,102,783 | 12,659,911 | |||||||||||||||
| Foreign currency transactions | (1,881 | ) | - | (697 | ) | (108,522 | ) | ||||||||||||
| Futures contracts | - | - | - | - | |||||||||||||||
| Net realized loss on the disposal of investments purchased/sold in error (See Note 8) | - | - | - | - | |||||||||||||||
| Net realized gain | 3,836,096 | 2,137,669 | 5,102,086 | 12,551,389 | |||||||||||||||
| Net change in unrealized appreciation (depreciation) on: | |||||||||||||||||||
| Investments | 1,677,294 | 981,635 | (1,997,945 | ) | 8,398,547 | ||||||||||||||
| Foreign currency translations | - | - | - | 1,061 | |||||||||||||||
| Futures contracts | - | - | - | - | |||||||||||||||
| Net change in unrealized appreciation (depreciation) | 1,677,294 | 981,635 | (1,997,945 | ) | 8,399,608 | ||||||||||||||
| Net gain | 5,513,390 | 3,119,304 | 3,104,141 | 20,950,997 | |||||||||||||||
| NET INCREASE IN NET ASSETS FROM OPERATIONS | $ | 5,397,981 | $ | 3,221,900 | $ | 3,032,547 | $ | 21,461,143 | |||||||||||
See Accompanying Notes to Financial Statements.
127
STATEMENTS OF CHANGES IN NET ASSETS
| CMG Enhanced S&P 500® Index Fund | |||||||||||
| (Unaudited) Six Months Ended January 31, 2006 | Year Ended July 31, 2005 | ||||||||||
| Operations: | |||||||||||
| Net investment income | $ | 745,752 | $ | 1,901,574 | |||||||
| Net realized gain on investments and futures contracts | 4,355,983 | 2,731,812 | |||||||||
| Net change in unrealized appreciation (depreciation) on investments and futures contracts | 252,433 | 9,378,890 | |||||||||
| Net increase from operations | 5,354,168 | 14,012,276 | |||||||||
| Distributions declared to shareholders: | |||||||||||
| From net investment income | (1,547,386 | ) | (1,713,416 | ) | |||||||
| From net realized gains | (4,395,562 | ) | (896,196 | ) | |||||||
| Total distributions declared to shareholders | (5,942,948 | ) | (2,609,612 | ) | |||||||
| Share transactions: | |||||||||||
| Subscriptions | 8,059,337 | 17,245,602 | |||||||||
| Distributions reinvested | 1,192,965 | 408,128 | |||||||||
| Redemptions | (13,377,268 | ) | (35,670,610 | ) | |||||||
| Net decrease in share transactions | (4,124,966 | ) | (18,016,880 | ) | |||||||
| Net decrease in net assets | (4,713,746 | ) | (6,614,216 | ) | |||||||
| NET ASSETS: | |||||||||||
| Beginning of period | 91,633,067 | 98,247,283 | |||||||||
| End of period | $ | 86,919,321 | $ | 91,633,067 | |||||||
| Undistributed net investment income, at end of period | $ | 20,027 | $ | 821,661 | |||||||
| Change in shares: | |||||||||||
| Subscriptions | 599,755 | 1,353,553 | |||||||||
| Issued for distributions reinvested | 90,582 | 31,274 | |||||||||
| Redemptions | (985,744 | ) | (2,804,223 | ) | |||||||
| Net decrease | (295,407 | ) | (1,419,396 | ) | |||||||
See Accompanying Notes to Financial Statements.
128
STATEMENTS OF CHANGES IN NET ASSETS
| CMG Large Cap Growth Fund | CMG Large Cap Value Fund | ||||||||||||||||||
| (Unaudited) Six Months Ended January 31, 2006 | Year Ended July 31, 2005 | (Unaudited) Six Months Ended January 31, 2006 | Year Ended July 31, 2005 | ||||||||||||||||
| Operations: | |||||||||||||||||||
| Net investment income | $ | 96,986 | $ | 430,830 | $ | 319,180 | $ | 917,233 | |||||||||||
| Net realized gain on investments and foreign currency transactions | 1,355,797 | 2,173,562 | 2,934,524 | 2,822,819 | |||||||||||||||
| Net change in unrealized appreciation (depreciation) on investments | 1,236,106 | 2,991,580 | (562,209 | ) | 2,693,045 | ||||||||||||||
| Net increase from operations | 2,688,889 | 5,595,972 | 2,691,495 | 6,433,097 | |||||||||||||||
| Distributions declared to shareholders: | |||||||||||||||||||
| From net investment income | (244,682 | ) | (349,571 | ) | (786,000 | ) | (908,008 | ) | |||||||||||
| From net realized gains | (2,107,614 | ) | - | (4,217,978 | ) | (142,837 | ) | ||||||||||||
| Total distributions declared to shareholders | (2,352,296 | ) | (349,571 | ) | (5,003,978 | ) | (1,050,845 | ) | |||||||||||
| Share transactions: | |||||||||||||||||||
| Subscriptions | 507,997 | 4,995,496 | 2,030,070 | 2,725,323 | |||||||||||||||
| Distributions reinvested | 1,081,857 | 60,880 | 2,230,353 | 327,447 | |||||||||||||||
| Redemptions | (3,982,843 | ) | (10,674,833 | ) | (3,957,442 | ) | (17,558,515 | ) | |||||||||||
| Net increase (decrease) in share transactions | (2,392,989 | ) | (5,618,457 | ) | 302,981 | (14,505,745 | ) | ||||||||||||
| Net decrease in net assets | (2,056,396 | ) | (372,056 | ) | (2,009,502 | ) | (9,123,493 | ) | |||||||||||
| NET ASSETS: | |||||||||||||||||||
| Beginning of period | 40,311,521 | 40,683,577 | 38,731,225 | 47,854,718 | |||||||||||||||
| End of period | $ | 38,255,125 | $ | 40,311,521 | $ | 36,721,723 | $ | 38,731,225 | |||||||||||
| Undistributed (overdistributed) net investment income, at end of period | $ | (7,476 | ) | $ | 140,220 | $ | 15,910 | $ | 482,730 | ||||||||||
| Change in shares: | |||||||||||||||||||
| Subscriptions | 42,719 | 458,901 | 178,813 | 227,396 | |||||||||||||||
| Issued for distributions reinvested | 94,074 | 5,349 | 197,377 | 27,061 | |||||||||||||||
| Redemptions | (334,198 | ) | (974,348 | ) | (311,049 | ) | (1,480,049 | ) | |||||||||||
| Net increase (decrease) | (197,405 | ) | (510,098 | ) | 65,141 | (1,225,592 | ) | ||||||||||||
See Accompanying Notes to Financial Statements.
129
STATEMENTS OF CHANGES IN NET ASSETS
| CMG Mid Cap Growth Fund | CMG Mid Cap Value Fund | ||||||||||||||||||
| (Unaudited) Six Months Ended January 31, 2006 | Year Ended July 31, 2005 | (Unaudited) Six Months Ended January 31, 2006 | Year Ended July 31, 2005 | ||||||||||||||||
| Operations: | |||||||||||||||||||
| Net investment income (loss) | $ | (7,404 | ) | $ | (42,193 | ) | $ | 105,660 | $ | 177,527 | |||||||||
| Net realized gain on investments and foreign currency transactions | 902,835 | 1,198,457 | 1,806,999 | 2,034,357 | |||||||||||||||
| Net change in unrealized appreciation (depreciation) on investments and foreign currency translations | 3,102,251 | 3,842,377 | (367,386 | ) | 2,345,276 | ||||||||||||||
| Net increase from operations | 3,997,682 | 4,998,641 | 1,545,273 | 4,557,160 | |||||||||||||||
| Distributions declared to shareholders: | |||||||||||||||||||
| From net investment income | - | - | (193,534 | ) | (147,310 | ) | |||||||||||||
| From net realized gains | (596,195 | ) | - | (2,793,995 | ) | (163,069 | ) | ||||||||||||
| Total distributions declared to shareholders | (596,195 | ) | - | (2,987,529 | ) | (310,379 | ) | ||||||||||||
| Share transactions: | |||||||||||||||||||
| Subscriptions | 1,096,068 | 6,916,364 | 379,374 | 1,333,206 | |||||||||||||||
| Distributions reinvested | 256,151 | - | 1,221,997 | 93,631 | |||||||||||||||
| Redemptions | (3,406,968 | ) | (6,317,811 | ) | (3,013,978 | ) | (6,390,522 | ) | |||||||||||
| Net increase (decrease) in share transactions | (2,054,749 | ) | 598,553 | (1,412,607 | ) | (4,963,685 | ) | ||||||||||||
| Net increase (decrease) in net assets | 1,346,738 | 5,597,194 | (2,854,863 | ) | (716,904 | ) | |||||||||||||
| NET ASSETS: | |||||||||||||||||||
| Beginning of period | 24,880,708 | 19,283,514 | 21,277,295 | 21,994,199 | |||||||||||||||
| End of period | $ | 26,227,446 | $ | 24,880,708 | $ | 18,422,432 | $ | 21,277,295 | |||||||||||
| Undistributed (overdistributed) net investment income, at end of period | $ | - | $ | - | $ | (1,166 | ) | $ | 86,708 | ||||||||||
| Accumulated net investment loss, at end of period | $ | (9,136 | ) | $ | (1,732 | ) | $ | - | $ | - | |||||||||
| Change in shares: | |||||||||||||||||||
| Subscriptions | 73,925 | 523,196 | 25,218 | 99,662 | |||||||||||||||
| Issued for distributions reinvested | 17,122 | - | 91,535 | 6,769 | |||||||||||||||
| Redemptions | (224,835 | ) | (511,129 | ) | (198,792 | ) | (452,689 | ) | |||||||||||
| Net increase (decrease) | (133,788 | ) | 12,067 | (82,039 | ) | (346,258 | ) | ||||||||||||
See Accompanying Notes to Financial Statements.
130
STATEMENTS OF CHANGES IN NET ASSETS
| CMG Small Cap Growth Fund | CMG Small Cap Value Fund | ||||||||||||||||||
| (Unaudited) Six Months Ended January 31, 2006 | Year Ended July 31, 2005 | (Unaudited) Six Months Ended January 31, 2006 | Year Ended July 31, 2005 | ||||||||||||||||
| Operations: | |||||||||||||||||||
| Net investment income (loss) | $ | (115,409 | ) | $ | (210,173 | ) | $ | 102,596 | $ | 314,346 | |||||||||
| Net realized gain on investments and foreign currency transactions | 3,836,096 | 2,188,414 | 2,137,669 | 3,348,725 | |||||||||||||||
| Net change in unrealized appreciation (depreciation) on investments | 1,677,294 | 4,715,850 | 981,635 | 5,239,285 | |||||||||||||||
| Net increase from operations | 5,397,981 | 6,694,091 | 3,221,900 | 8,902,356 | |||||||||||||||
| Distributions declared to shareholders: | |||||||||||||||||||
| From net investment income | - | - | (279,581 | ) | (284,580 | ) | |||||||||||||
| From net realized gains | (4,969,355 | ) | (2,288,048 | ) | (3,938,120 | ) | (2,878,862 | ) | |||||||||||
| Total distributions declared to shareholders | (4,969,355 | ) | (2,288,048 | ) | (4,217,701 | ) | (3,163,442 | ) | |||||||||||
| Share transactions: | |||||||||||||||||||
| Subscriptions | 1,189,315 | 7,038,718 | 1,241,753 | 4,687,869 | |||||||||||||||
| Distributions reinvested | 3,547,179 | 1,423,106 | 2,926,706 | 1,901,545 | |||||||||||||||
| Redemptions | (2,620,262 | ) | (9,950,497 | ) | (2,501,300 | ) | (15,695,410 | ) | |||||||||||
| Net increase (decrease) in share transactions | 2,116,232 | (1,488,673 | ) | 1,667,159 | (9,105,996 | ) | |||||||||||||
| Net increase (decrease) in net assets | 2,544,858 | 2,917,370 | 671,358 | (3,367,082 | ) | ||||||||||||||
| NET ASSETS: | |||||||||||||||||||
| Beginning of period | 38,644,832 | 35,727,462 | 36,989,277 | 40,356,359 | |||||||||||||||
| End of period | $ | 41,189,690 | $ | 38,644,832 | $ | 37,660,635 | $ | 36,989,277 | |||||||||||
| Undistributed (overdistributed) net investment income, at end of period | $ | - | $ | - | $ | (7,381 | ) | $ | 169,604 | ||||||||||
| Accumulated net investment loss, at end of period | $ | (117,378 | ) | $ | (1,969 | ) | $ | - | $ | - | |||||||||
| Change in shares: | |||||||||||||||||||
| Subscriptions | 88,298 | 556,247 | 79,121 | 322,487 | |||||||||||||||
| Issued for distributions reinvested | 287,921 | 108,303 | 203,244 | 124,773 | |||||||||||||||
| Redemptions | (197,016 | ) | (793,968 | ) | (158,831 | ) | (1,045,818 | ) | |||||||||||
| Net increase (decrease) | 179,203 | (129,418 | ) | 123,534 | (598,558 | ) | |||||||||||||
See Accompanying Notes to Financial Statements.
131
STATEMENTS OF CHANGES IN NET ASSETS
| CMG Small/Mid Cap Fund | CMG International Stock Fund | ||||||||||||||||||
| (Unaudited) Six Months Ended January 31, 2006 | Year Ended July 31, 2005 | (Unaudited) Six Months Ended January 31, 2006 | Year Ended July 31, 2005 | ||||||||||||||||
| Operations: | |||||||||||||||||||
| Net investment income (loss) | $ | (71,594 | ) | $ | (162,021 | ) | $ | 510,146 | $ | 2,249,362 | |||||||||
| Net realized gain on investments and foreign currency transactions | 5,102,086 | 12,002,485 | 12,551,389 | 12,958,426 | |||||||||||||||
| Net change in unrealized appreciation (depreciation) on investments, foreign currency translations and foreign capital gains tax | (1,997,945 | ) | (736,986 | ) | 8,399,608 | 9,070,617 | |||||||||||||
| Net increase from operations | 3,032,547 | 11,103,478 | 21,461,143 | 24,278,405 | |||||||||||||||
| Distributions declared to shareholders: | |||||||||||||||||||
| From net investment income | - | - | (2,041,359 | ) | (1,284,092 | ) | |||||||||||||
| From net realized gains | (1,443,974 | ) | - | (14,728,493 | ) | (3,640,598 | ) | ||||||||||||
| Total distributions declared to shareholders | (1,443,974 | ) | - | (16,769,852 | ) | (4,924,690 | ) | ||||||||||||
| Share transactions: | |||||||||||||||||||
| Subscriptions | - | 4,646,441 | 3,539,305 | 15,229,078 | |||||||||||||||
| Distributions reinvested | 1,443,974 | - | 10,430,452 | 2,823,586 | |||||||||||||||
| Redemptions | (26,497,901 | ) | (27,656,623 | ) | (39,524,072 | ) | (53,513,076 | ) | |||||||||||
| Net decrease in share transactions | (25,053,927 | ) | (23,010,182 | ) | (25,554,315 | ) | (35,460,412 | ) | |||||||||||
| Net decrease in net assets | (23,465,354 | ) | (11,906,704 | ) | (20,863,024 | ) | (16,106,697 | ) | |||||||||||
| NET ASSETS: | |||||||||||||||||||
| Beginning of period | 38,754,879 | 50,661,583 | 136,144,228 | 152,250,925 | |||||||||||||||
| End of period | $ | 15,289,525 | $ | 38,754,879 | $ | 115,281,204 | $ | 136,144,228 | |||||||||||
| Undistributed (overdistributed) net investment income, at end of period | $ | - | $ | - | $ | (5,729 | ) | $ | 1,525,484 | ||||||||||
| Accumulated net investment loss, at end of period | $ | (73,701 | ) | $ | (2,107 | ) | $ | - | $ | - | |||||||||
| Change in shares: | |||||||||||||||||||
| Subscriptions | - | 439,948 | 247,493 | 1,177,932 | |||||||||||||||
| Issued for distributions reinvested | 132,353 | - | 788,394 | 209,932 | |||||||||||||||
| Redemptions | (2,231,586 | ) | (2,842,595 | ) | (2,718,127 | ) | (3,998,529 | ) | |||||||||||
| Net decrease | (2,099,233 | ) | (2,402,647 | ) | (1,682,240 | ) | (2,610,665 | ) | |||||||||||
See Accompanying Notes to Financial Statements.
132
NOTES TO FINANCIAL STATEMENTS
January 31, 2006 (Unaudited)
Note 1. Organization:
CMG Fund Trust (the "Trust") is an Oregon business trust registered under the Investment Company Act of 1940, as amended, as an open-end management investment company. Information presented in these financial statements pertains to the following diversified funds (individually referred to as a "Fund", collectively referred to as the "Funds"):
CMG Enhanced S&P 500® Index Fund
CMG Large Cap Growth Fund
CMG Large Cap Value Fund
CMG Mid Cap Growth Fund
CMG Mid Cap Value Fund
CMG Small Cap Growth Fund
CMG Small Cap Value Fund
CMG Small/Mid Cap Fund
CMG International Stock Fund
Investment goals. The CMG Enhanced S&P 500® Index Fund seeks to outperform the total return, over the long run, of the Standard & Poor's 500 Composite Stock Index (the "S&P 500®"). The CMG Large Cap Growth Fund and CMG Large Cap Value Fund seek long-term growth by investing primarily in large capitalization equities. The CMG Mid Cap Growth Fund and CMG Mid Cap Value Fund seek long-term growth by investing primarily in middle capitalization equities. The CMG Small Cap Growth Fund and CMG Small Cap Value Fund seek long-term growth by investing primarily in small capitalization equities. The CMG Small/Mid Cap Fund seeks long-term capital appreciation by investing in small and middle capitalization equities. The CMG International Stock Fund seeks long-term capital appreciation.
Fund shares. Each Fund may issue an unlimited number of shares of no par value capital stock, which are offered continuously at net asset value.
Note 2. Significant accounting policies:
Use of estimates. The preparation of financial statements in conformity with accounting principles generally accepted in the United States of America ("GAAP") requires management to make estimates and assumptions that affect the reported amounts of assets and liabilities, the disclosure of contingent assets and liabilities at the date of the financial statements and the reported amounts of revenue and expenses during the reporting period. Actual results could differ from those estimates. The following is a summary of significant accounting policies consistently followed by the Funds in the preparation of their financial statements.
Security valuation. Equity securities and exchange traded funds are valued at the last sale price on the principal exchange on which they trade, except for securities traded on the NASDAQ, which are valued at the NASDAQ official close price. Investments in open-end investment companies are valued at net asset value. Unlisted securities or listed securities for which there were no sales during the day are valued at the closing bid price on such exchanges or over-the-counter markets.
Short-term debt obligations maturing within 60 days are valued at amortized cost, which approximates market value.
Futures contracts are valued at the settlement price established each day by the board of trade or exchange on which they are traded.
133
NOTES TO FINANCIAL STATEMENTS (continued)
January 31, 2006 (Unaudited)
Foreign securities are generally valued at the last sale price on the foreign exchange or market on which they trade. If any foreign share prices are not readily available as a result of limited share activity, the securities are valued at the last sale price of the local shares in the principal market in which such securities are normally traded.
Generally, trading in foreign securities is substantially completed each day at various times prior to the close of the New York Stock Exchange ("NYSE"). The values of such securities used in computing the net asset value of the Funds' shares are determined as of such times. Foreign currency exchange rates are generally determined at 4:00 p.m. Eastern (U.S.) time. Events affecting the values of such foreign securities and such exchange rates may occur between the times at which they are determined and the close of the customary trading session of the NYSE, which would not be reflected in the computation of the Funds' net asset value. If events materially affecting the values of such foreign securities occur and it is determined that market quotations are not reliable, then these foreign securities will be valued at their fair value using procedures approved by the Board of Trustees. The CMG International Stock Fund may use a sys tematic fair valuation model provided by an independent third party to value securities principally traded in foreign markets in order to adjust for possible stale pricing that may occur between the close of the foreign exchanges and the time for valuation. If a security is valued at a "fair value", such value is likely to be different from the last quoted market price for the security.
Investments for which market quotations are not readily available, or that have quotations which management believes are not appropriate, are valued at fair value as determined in good faith under consistently applied procedures established by and under the general supervision of the Board of Trustees.
Security transactions. Security transactions are accounted for on the trade date. Cost is determined and gains (losses) are based upon the specific identification method for both financial statement and federal income tax purposes.
Repurchase agreements. Each Fund may engage in repurchase agreement transactions with institutions that the Funds' investment advisor has determined are creditworthy. Each Fund, through its custodian, receives delivery of underlying securities collateralizing a repurchase agreement. Collateral is at least equal, at all times, to the value of the repurchase obligation including interest. A repurchase agreement transaction involves certain risks in the event of default or insolvency of the counterparty. These risks include possible delays or restrictions upon each Fund's ability to dispose of the underlying securities and a possible decline in the value of the underlying securities during the period while the Funds seek to assert their rights.
Futures contracts. Certain Funds may invest in interest rate, index and foreign currency futures contracts. The Funds will invest in these instruments to hedge against the effects of changes in the value of portfolio securities due to anticipated changes in interest rates and/or market conditions, for duration management, or when the transactions are economically appropriate to the reduction of risk inherent in the management of the Funds and not for trading purposes. The use of futures contracts involves certain risks, which include: (1) imperfect correlation between the price movement of the instruments and the underlying securities, (2) inability to close out positions due to differing trading hours, or the temporary absence of a liquid market, for either the instrument or the underlying securities, or (3) an inaccurate prediction by Columbia Management A dvisors, LLC of the future direction of interest rates. Any of these risks may involve amounts exceeding the variation margin recorded in the Fund's Statement of Assets and Liabilities at any given time.
Income recognition. Interest income is recorded on the accrual basis. Corporate actions and dividend income are recorded on the ex-date, except for certain foreign securities which are recorded as soon after ex-date as the Funds become aware of such, net of non-reclaimable tax withholdings. Distributions paid by real estate investment trusts (REITs) in excess of their income are recorded as a reduction of the cost of the related investments. If the Funds no longer own the applicable securities, any distributions received in excess of income are recorded as realized gains.
Foreign currency transactions. The values of all assets and liabilities quoted in foreign currencies are translated into U.S. dollars at that day's exchange rates. Net realized and unrealized gains (losses) on foreign currency transactions include gains (losses) arising from the fluctuation in exchange rates between trade and settlement dates on securities transactions, gains (losses) arising from the disposition of foreign currency and currency gains (losses) between the accrual and payment dates on dividends, interest income and foreign withholding taxes.
134
NOTES TO FINANCIAL STATEMENTS (continued)
January 31, 2006 (Unaudited)
For financial statement purposes, the Funds do not distinguish that portion of gains (losses) on investments which is due to changes in foreign exchange rates from that which is due to changes in market prices of the investments. Such fluctuations are included with the net realized and unrealized gains (losses) on investments.
Federal income tax status. Each Fund intends to qualify each year as a "regulated investment company" under Subchapter M of the Internal Revenue Code, as amended, and will distribute substantially all of its taxable income, if any, for its tax year, and as such will not be subject to federal income taxes. In addition, each Fund intends to distribute in each calendar year substantially all of its net investment income, capital gains and certain other amounts, if any, such that each Fund should not be subject to federal excise tax. Therefore, no federal income or excise tax provision is recorded.
Distributions to shareholders. Distributions to shareholders are recorded on ex-date. Net realized capital gains, if any, are distributed at least annually.
Note 3. Federal tax information:
The tax character of distributions paid during the year ended July 31, 2005 was as follows:
| Ordinary Income* | Long-Term Capital Gains | ||||||||||
| CMG Enhanced S&P 500® Index Fund | $ | 2,576,992 | $ | 32,620 | |||||||
| CMG Large Cap Growth Fund | 349,571 | — | |||||||||
| CMG Large Cap Value Fund | 1,050,685 | 160 | |||||||||
| CMG Mid Cap Growth Fund | — | — | |||||||||
| CMG Mid Cap Value Fund | 303,737 | 6,642 | |||||||||
| CMG Small Cap Growth Fund | 1,856,510 | 431,538 | |||||||||
| CMG Small Cap Value Fund | 2,640,925 | 522,517 | |||||||||
| CMG Small/Mid Cap Fund | — | — | |||||||||
| CMG International Stock Fund | 1,263,220 | 3,661,470 | |||||||||
* For tax purposes short-term capital gains distributions, if any, are considered ordinary income distributions.
Unrealized appreciation and depreciation at January 31, 2006, based on cost of investments for federal income tax purposes, excluding any unrealized appreciation and depreciation from changes in the value of other assets and liabilities resulting from changes in exchange rates, was:
| Unrealized Appreciation | Unrealized Depreciation | Net Unrealized Appreciation | |||||||||||||
| CMG Enhanced S&P 500® Index Fund | $ | 14,013,647 | $ | (1,695,556 | ) | $ | 12,318,091 | ||||||||
| CMG Large Cap Growth Fund | 5,229,042 | (239,786 | ) | 4,989,256 | |||||||||||
| CMG Large Cap Value Fund | 5,210,410 | (427,768 | ) | 4,782,642 | |||||||||||
| CMG Mid Cap Growth Fund | 7,397,430 | (189,689 | ) | 7,207,741 | |||||||||||
| CMG Mid Cap Value Fund | 3,702,516 | (104,586 | ) | 3,597,930 | |||||||||||
| CMG Small Cap Growth Fund | 7,382,041 | (601,892 | ) | 6,780,149 | |||||||||||
| CMG Small Cap Value Fund | 12,770,258 | (715,510 | ) | 12,054,748 | |||||||||||
| CMG Small/Mid Cap Fund | 4,287,463 | (57,601 | ) | 4,229,862 | |||||||||||
| CMG International Stock Fund | 25,867,488 | (400,667 | ) | 25,466,821 | |||||||||||
135
NOTES TO FINANCIAL STATEMENTS (continued)
January 31, 2006 (Unaudited)
The following capital loss carryforwards, determined as of July 31, 2005, may be available to reduce taxable income arising from future net realized gains on investments, if any, to the extent permitted by the Internal Revenue Code:
| Year of Expiration | |||||||||||||||
| 2010 | 2011 | Total | |||||||||||||
| CMG International Stock Fund | $ | 2,719,144 | $ | 420,427 | $ | 3,139,571 | |||||||||
Note 4. Fees and compensation paid to affiliates:
Investment advisory fee. Columbia Management Advisors, LLC ("Columbia"), an indirect, wholly-owned subsidiary of Bank of America Corporation ("BOA"), is the investment advisor to the Funds. Prior to September 30, 2005, Columbia Management Advisors, Inc. was the investment advisor to the Funds under the same fee structure. On September 30, 2005, Columbia Management Advisors, Inc. merged into Banc of America Capital Management, LLC. At that time, the investment advisor was then renamed Columbia Management Advisors, LLC.
Each Fund's investment advisory fee is a unified fee. Columbia, out of the unified fee it receives from the Funds, pays all accounting fees, legal fees, pricing and bookkeeping fees, transfer agent fees, custody fees, expenses of the Chief Compliance Officer, fees for Sarbanes-Oxley compliance, the commitment fee for the line of credit and miscellaneous expenses of the Funds. The unified fee does not include brokerage fees, taxes, Trustees' fees, Trustee legal counsel fees, audit fees, interest expense associated with any borrowings by the Funds or extraordinary expenses, if any. The unified fees are paid monthly to Columbia based on each Fund's average daily net assets at the following annual rates:
| CMG Enhanced S&P 500® Index Fund | 0.25 | % | |||||
| CMG Large Cap Growth Fund | 0.50 | % | |||||
| CMG Large Cap Value Fund | 0.50 | % | |||||
| CMG Mid Cap Growth Fund | 0.70 | % | |||||
| CMG Mid Cap Value Fund | 0.70 | % | |||||
| CMG Small Cap Growth Fund | 0.80 | % | |||||
| CMG Small Cap Value Fund | 0.80 | % | |||||
| CMG Small/Mid Cap Fund | 0.75 | % | |||||
| CMG International Stock Fund | 0.75 | % | |||||
Pricing & bookkeeping fees. Columbia is responsible for providing pricing and bookkeeping services to each Fund under a pricing, bookkeeping and fund administration agreement. Under a separate agreement (the "Outsourcing Agreement"), Columbia has delegated certain of those functions to State Street Bank and Trust Company ("State Street"). As a result, Columbia pays fees to State Street under the Outsourcing Agreement. The pricing and bookkeeping fees for the Funds are paid by Columbia.
Transfer agent fee. Columbia Management Services, Inc. (formerly Columbia Funds Services, Inc.) (the "Transfer Agent"), an affiliate of Columbia and an indirect, wholly-owned subsidiary of BOA, provides shareholder services to the Funds and has contracted with Boston Financial Data Services ("BFDS") to serve as sub-transfer agent. The transfer agent fees for the Funds are paid by Columbia. The Transfer Agent may also retain, as additional compensation for its services, fees for wire, telephone and redemption orders, IRA trustee agent fees and account transcript fees due the Transfer Agent from shareholders of the Funds and credits (net of bank charges) earned with respect to balances in accounts the Transfer Agent maintains in connection with its services to the Funds.
Expense limits and fee waivers. Columbia has contractually agreed to reimburse the Funds through March 1, 2009 for certain expenses so that the expenses incurred by the Funds, including the investment advisory fees, will not exceed the following annual rates based on each Fund's average daily net assets:
| CMG Enhanced S&P 500® Index Fund | 0.25 | % | |||||
| CMG Large Cap Growth Fund | 0.50 | % | |||||
136
NOTES TO FINANCIAL STATEMENTS (continued)
January 31, 2006 (Unaudited)
| CMG Large Cap Value Fund | 0.50 | % | |||||
| CMG Mid Cap Growth Fund | 0.70 | % | |||||
| CMG Mid Cap Value Fund | 0.70 | % | |||||
| CMG Small Cap Growth Fund | 0.80 | % | |||||
| CMG Small Cap Value Fund | 0.80 | % | |||||
| CMG Small/Mid Cap Fund | 0.75 | % | |||||
| CMG International Stock Fund | 0.75 | % | |||||
Fees paid to officers and trustees. All officers of the Funds, with the exception of the Fund's Chief Compliance Officer, are employees of Columbia, or its affiliates and receive no compensation from the Funds. The Board of Trustees has appointed a Chief Compliance Officer to the Funds in accordance with federal securities regulations. The expenses of the Chief Compliance Officer are paid by Columbia.
The Funds' Trustees may participate in a deferred compensation plan which may be terminated at any time. Obligations of the plan will be paid solely out of the Funds' assets.
Other. Columbia provides certain services to the Funds related to Sarbanes-Oxley compliance. The fees for such services are paid by Columbia.
Note 5. Portfolio information:
For the six months ended January 31, 2006, the cost of purchases and proceeds from sales of securities, excluding short-term obligations, were as follows:
| Purchases | Sales | ||||||||||
| CMG Enhanced S&P 500® Index Fund | $ | 29,910,231 | $ | 36,096,034 | |||||||
| CMG Large Cap Growth Fund | 24,667,567 | 29,023,271 | |||||||||
| CMG Large Cap Value Fund | 22,843,926 | 27,619,317 | |||||||||
| CMG Mid Cap Growth Fund | 6,062,276 | 9,609,583 | |||||||||
| CMG Mid Cap Value Fund | 4,877,012 | 9,521,196 | |||||||||
| CMG Small Cap Growth Fund | 52,792,853 | 54,951,533 | |||||||||
| CMG Small Cap Value Fund | 6,183,029 | 8,717,867 | |||||||||
| CMG Small/Mid Cap Fund | 17,504,366 | 43,964,798 | |||||||||
| CMG International Stock Fund | 56,236,520 | 96,369,296 | |||||||||
Note 6. Line of credit:
The Funds and other affiliated funds participate in a $350,000,000 committed unsecured revolving line of credit provided by State Street Bank and Trust Company. Borrowings are used for temporary or emergency purposes to facilitate portfolio liquidity. Interest is charged to each participating fund based on its borrowings at a rate per annum equal to the Federal Funds rate plus 0.50%. In addition, a commitment fee of 0.10% per annum is accrued and apportioned among the participating funds based on their pro-rata portion of the unutilized line of credit. The commitment fee is paid by Columbia.
137
NOTES TO FINANCIAL STATEMENTS (continued)
January 31, 2006 (Unaudited)
For the six months ended January 31, 2006, the average daily loan balance outstanding on days where borrowings existed and the weighted average interest rates for Funds that participated in this arrangement are as follows:
| Average Borrowings | Weighted Average Interest Rates | ||||||||||
| CMG Enhanced S&P 500® Index Fund | $ | 2,000,000 | 4.27 | % | |||||||
| CMG Large Cap Growth Fund | 1,000,000 | 4.77 | % | ||||||||
| CMG Small Cap Growth Fund | 1,000,000 | 4.76 | % | ||||||||
| CMG Small Cap Value Fund | 1,000,000 | 4.81 | % | ||||||||
| CMG International Stock Fund | 6,428,571 | 4.77 | % | ||||||||
Note 7. Shares of beneficial interest:
As of January 31, 2006, the Funds had shareholders whose shares were beneficially owned by participant accounts over which BOA and/or its affiliates had either sole or joint investment discretion. Subscription and redemption activity of these accounts may have a significant effect on the operations of the Funds. The numbers of accounts and the percentages of shares of beneficial interest outstanding held therein are as follows:
| Number of Shareholders | % of Shares Outstanding Held | ||||||||||
| CMG Enhanced S&P 500® Index Fund | 1 | 100.0 | % | ||||||||
| CMG Large Cap Growth Fund | 1 | 100.0 | % | ||||||||
| CMG Large Cap Value Fund | 1 | 100.0 | % | ||||||||
| CMG Mid Cap Growth Fund | 1 | 100.0 | % | ||||||||
| CMG Mid Cap Value Fund | 1 | 100.0 | % | ||||||||
| CMG Small Cap Growth Fund | 1 | 97.6 | % | ||||||||
| CMG Small Cap Value Fund | 1 | 97.4 | % | ||||||||
| CMG International Stock Fund | 1 | 96.1 | % | ||||||||
As of January 31, 2006, one of the Funds had shareholders that held greater than 5% of the shares outstanding and Bank of America and/or its affiliates did not have investment discretion. Subscription and redemption activity of these shareholders may have a material effect on the Fund. The number of accounts and the percentage of shares of beneficial interest outstanding held therein are as follows:
| Number of Shareholders | % of Shares Outstanding Held | ||||||||||
| CMG Small/Mid Cap Fund | 3 | 100.0 | % | ||||||||
Note 8. Other:
During the six months ended January 31, 2006, CMG Large Cap Value Fund and CMG Small Cap Value Fund each had a realized loss due to a trading error. The losses of $1,748 and $474, respectively, were reimbursed by Columbia.
138
NOTES TO FINANCIAL STATEMENTS (continued)
January 31, 2006 (Unaudited)
Note 9. Disclosure of significant risks and contingencies:
Foreign securities. There are certain additional risks involved when investing in foreign securities that are not inherent with investments in domestic securities. These risks may involve foreign currency exchange rate fluctuations, adverse political and economic developments and the possible prevention of currency exchange or other foreign governmental laws or restrictions. In addition, the liquidity of foreign securities may be more limited than that of domestic securities.
Investments in emerging market countries are subject to additional risk. The risk of foreign investments is typically increased in less developed countries. These countries are also more likely to experience high levels of inflation, deflation or currency devaluation which could hurt their economies and securities markets.
Industry focus. The Funds may focus their investments in certain industries, subjecting them to greater risk than a fund that is more diversified.
Legal proceedings. On February 9, 2005, Columbia Management Advisors, Inc. (which has since merged into Banc of America Capital Management, LLC (now named Columbia Management Advisors, LLC)) ("Columbia") and Columbia Funds Distributor, Inc. (which has been renamed Columbia Management Distributors, Inc.) (the "Distributor") (collectively, the "Columbia Group") entered into an Assurance of Discontinuance with the New York Attorney General ("NYAG") (the "NYAG Settlement") and consented to the entry of a cease-and-desist order by the Securities and Exchange Commission ("SEC") (the "SEC Order"). The SEC Order and the NYAG Settlement are referred to collectively as the "Settlements". The Settlements contain substantially the same terms and conditions as outlined in the agreements in principle which Columbia Group entered into with the SEC and NYAG in March 2004.
Under the terms of the SEC Order, the Columbia Group has agreed among other things, to: pay $70 million in disgorgement and $70 million in civil money penalties; cease and desist from violations of the antifraud provisions and certain other provisions of the federal securities laws; maintain certain compliance and ethics oversight structures; retain an independent consultant to review the Columbia Group's applicable supervisory, compliance, control and other policies and procedures; and retain an independent distribution consultant (see below). The Columbia Funds have also voluntarily undertaken to implement certain governance measures designed to maintain the independence of their boards of trustees. The NYAG Settlement also, among other things, requires Columbia and its affiliates to reduce certain Columbia Funds (including the former Nations Funds) and other mutual funds management fees collectively by $32 million per year fo r five years, for a projected total of $160 million in management fee reductions.
Pursuant to the procedures set forth in the SEC order, the $140 million in settlement amounts described above will be distributed in accordance with a distribution plan developed by an independent distribution consultant and agreed to by the staff of the SEC. The independent distribution consultant has been in consultation with the Staff, and has submitted a draft proposed plan of distribution, but has not yet submitted a final proposed plan of distribution.
As a result of these matters or any adverse publicity or other developments resulting from them, there may be increased redemptions or reduced sales of fund shares, which could increase transaction costs or operating expenses, or have other adverse consequences for the funds.
A copy of the SEC Order is available on the SEC website at http://www.sec.gov. A copy of the NYAG Settlement is available as part of the Bank of America Corporation Form 8-K filing on February 10, 2005.
In connection with the events described in detail above, various parties have filed suit against certain funds, the Trustees of the Columbia Funds, FleetBoston Financial Corporation and its affiliated entities and/or Bank of America and its affiliated entities.
139
NOTES TO FINANCIAL STATEMENTS (continued)
January 31, 2006 (Unaudited)
On February 20, 2004, the Judicial Panel on Multidistrict Litigation transferred these cases and cases against several other mutual fund companies based on similar allegations to the United States District Court in Maryland for consolidated or coordinated pretrial proceedings (the "MDL"). Subsequently, additional related cases were transferred to the MDL. On September 29, 2004, the plaintiffs in the MDL filed amended and consolidated complaints. One of these amended complaints is a putative class action that includes claims under the federal securities laws and state common law, and that names Columbia, the Distributor, the Trustees of the Columbia Funds, Bank of America Corporation and others as defendants. Another of the amended complaints is a derivative action purportedly on behalf of the Columbia Funds that asserts claims under federal securities laws and state common law.
On February 25, 2005, Columbia and other defendants filed motions to dismiss the claims in the pending cases. On March 1, 2006, for reasons stated in the court's memoranda dated November 3, 2005, the U.S. District Court for the District of Maryland granted in part and denied in part the defendants' motions to dismiss. The court dismissed all of the class action claims pending against the Columbia Funds. As to Columbia, the Distributor and the Trustees of the Columbia Funds, the claims under the Securities Act of 1933, the claims under Sections 34(b) and 36(a) of the Investment Company Act of 1940 (ICA) and the state law claims were dismissed. The claims under Sections 10(b) and 20(a) of the Securities Exchange Act of 1934 and claims under Section 36(b) of the ICA along with related claims under Section 48(a) of the ICA were not dismissed.
On March 21, 2005 purported class action plaintiffs filed suit in Massachusetts state court alleging that the conduct, including market timing, entitles Class B shareholders in certain Columbia funds to an exemption from contingent deferred sales charges upon early redemption ("the CDSC Lawsuit"). The CDSC Lawsuit has been removed to federal court in Massachusetts and the federal Judicial Panel has transferred the CDSC Lawsuit to the MDL.
The MDL is ongoing. Accordingly, an estimate of the financial impact of this litigation on any fund, if any, cannot currently be made.
In 2004, certain Columbia funds, the Trustees of the Columbia Funds, advisers and affiliated entities were named as defendants in certain purported shareholder class and derivative actions making claims, including claims under the Investment Company and the Investment Advisers Acts of 1940 and state law. The suits allege, inter alia, that the fees and expenses paid by the funds are excessive and that the advisers and their affiliates inappropriately used fund assets to distribute the funds and for other improper purpose. On March 2, 2005, the actions were consolidated in the Massachusetts federal court as In re Columbia Entities Litigation. The plaintiffs filed a consolidated amended complaint on June 9, 2005. On November 30, 2005, the judge dismissed all claims by plaintiffs and ordered that the case be closed. The plaintiffs filed a notice of appeal on December 30, 2005 and this appeal is pending.
For the six months ended January 31, 2006, Columbia has assumed legal, consulting services and Trustees' fees incurred by the Funds in connection with these matters as follows:
| CMG Enhanced S&P 500® Index Fund | $ | 675 | |||||
| CMG Large Cap Growth Fund | 301 | ||||||
| CMG Large Cap Value Fund | 287 | ||||||
| CMG Mid Cap Growth Fund | 191 | ||||||
| CMG Mid Cap Value Fund | 150 | ||||||
| CMG Small Cap Growth Fund | 294 | ||||||
| CMG Small Cap Value Fund | 276 | ||||||
| CMG Small/Mid Cap Fund | 239 | ||||||
| CMG International Stock Fund | 946 | ||||||
140
NOTES TO FINANCIAL STATEMENTS (continued)
January 31, 2006 (Unaudited)
Note 10. Subsequent event:
On March 27, 2006, each Fund will be re-domiciled into a new series of Columbia Funds Institutional Trust. Columbia Funds Institutional Trust is registered under the Investment Company Act of 1940, as amended, as an open-end management investment company.
Immediately following the re-domiciling, CMG Small Cap Growth Fund will be reorganized into CMG Small Cap Fund. CMG Small Cap Fund will then change its name to CMG Small Cap Growth Fund.
141
Board Consideration and Approval of Investment Advisory Agreements
The Advisory Fees and Expenses Committee of the Board of Trustees meets one or more times annually, usually in late summer, to review the advisory agreements (collectively, the "Agreements") of the funds for which the Trustees serve as trustees or directors (each a "fund") and determine whether to recommend that the full Board approve the continuation of the Agreements for an additional one-year period. After the Committee has made its recommendation, the full Board, including the Independent Trustees, determines whether to approve the continuation of the Agreements. In addition, the Board, including the Independent Trustees, considers matters bearing on the Agreements at most of its other meetings throughout the year and meets regularly with the heads of each investment area within Columbia. The Trustees also meet with selected fund portfolio managers at various times throughout the year.
The Trustees receive and review all materials that they, their legal counsel or Columbia, the funds' investment adviser, believe to be reasonably necessary for the Trustees to evaluate the Agreements and determine whether to approve the continuation of the Agreements. Those materials generally include, among other items, (i) information on the investment performance of each fund relative to the performance of peer groups of mutual funds and the fund's performance benchmarks, (ii) information on each fund's advisory fees and other expenses, including information comparing the fund's expenses to those of peer groups of mutual funds and information about any applicable expense caps and fee "breakpoints," (iii) sales and redemption data, (iv) information about the profitability of the Agreements to Columbia, and potential "fall-out" or ancillary benefits that Columbia and its affiliates may receive as a result of their relationships with the funds and (v) information obtained through Columbia's response to a questionnaire prepared at the request of the Trustees by counsel to the funds and independent legal counsel to the Independent Trustees. The Trustees also consider other information such as (vi) Columbia's financial results and financial condition, (vii) each fund's investment objective and strategies and the size, education and experience of Columbia's investment staffs and their use of technology, external research and trading cost measurement tools, (viii) the allocation of the funds' brokerage, if any, including allocations to brokers affiliated with Columbia and the use of "soft" commission dollars to pay fund expenses and to pay for research products and services, (ix) Columbia's resources devoted to, and its record of compliance with, the funds' investment policies and restrictions, policies on personal securities transactions and other compliance policies, (x) Columbia's response to various legal and regulatory proceedings since 2003 and (xi) the economic outlook generally and for the mutual fund industry in particular. In addition, the Trustees confer with their independent fee consultant and review materials relating to the Agreements that the independent fee consultant provides. Throughout the process, the Trustees have the opportunity to ask questions of and request additional materials from Columbia and to consult independent legal counsel to the Independent Trustees.
The Board of Trustees most recently approved the continuation of the Agreements at its October, 2005 meeting, following meetings of the Advisory Fees and Expenses Committee held in August, September, and October, 2005. In considering whether to approve the continuation of the Agreements, the Trustees, including the Independent Trustees, did not identify any single factor as determinative, and each weighed various factors as he or she deemed appropriate. The Trustees considered the following matters in connection with their approval of the continuation of the Agreements:
The nature, extent and quality of the services provided to the funds under the Agreements. The Trustees considered the nature, extent and quality of the services provided by Columbia and its affiliates to the funds and the resources dedicated to the funds by Columbia and its affiliates. Among other things, the Trustees considered (i) Columbia's ability, including its resources, compensation programs for personnel involved in fund management, reputation and other attributes, to attract and retain highly qualified research, advisory and supervisory investment professionals; (ii) the portfolio management services provided by those investment professionals; and (iii) the trade execution services provided on behalf of the funds. For each fund, the Trustees also considered the benefits to shareholders of investing in a mutual fund that is part of a family o f funds offering exposure to a variety of asset classes and investment disciplines and providing for a variety of fund and shareholder services. After reviewing those and related factors, the Trustees concluded, within the context of their overall conclusions regarding each of the Agreements, that the nature, extent and quality of services provided supported the continuation of the Agreements.
Investment performance of the funds and Columbia. The Trustees reviewed information about the performance of each fund over various time periods, including information prepared by an independent third party that compared the performance of each fund to the performance of peer groups of mutual funds and performance benchmarks. The
142
Board Consideration and Approval of Investment Advisory Agreements (continued)
Trustees also reviewed a description of the third party's methodology for identifying each fund's peer group for purposes of performance and expense comparisons. The Trustees also considered additional information that the Advisory Fees and Expenses Committee requested from Columbia relating to funds that presented relatively weaker performance and/or relatively higher expenses.
In the case of each fund that had performance that lagged that of a relevant peer group for certain (although not necessarily all) periods, the Trustees concluded that other factors relevant to performance were sufficient, in light of other considerations, to warrant continuation of the fund's Agreements. Those factors varied from fund to fund, but included one or more of the following: (i) that the fund's performance, although lagging in certain recent periods, was stronger over the longer term; (ii) that the underperformance was attributable, to a significant extent, to investment decisions that were reasonable and consistent with the fund's investment strategy and policies and that the fund was performing as expected, given market conditions and the fund's investment strategy; (iii) that the fund's performance was competitive when compared to other relevant performance benchmarks or peer groups; (iv) that Columbia had taken o r was taking steps designed to help improve the fund's investment performance, including, but not limited to, replacing portfolio managers or modifying investment strategies; (v) that the fund's advisory fee had recently been, or was proposed to be, reduced, with the goal of helping the fund's net return to shareholders become more competitive; and (vi) that other fund expenses, such as transfer agency or fund accounting fees, have recently been reduced, with the goal of helping the fund's net return to shareholders become more competitive. The Trustees also considered Columbia's performance and reputation generally, the funds' performance as a fund family generally, and Columbia's historical responsiveness to Trustee concerns about performance and Columbia's willingness to take steps intended to improve performance. After reviewing those and related factors, the Trustees concluded, within the context of their overall conclusions regarding each of the Agreements, that the performance of each fund and Columbi a was sufficient, in light of other considerations, to warrant the continuation of the Agreements.
The costs of the services provided and profits realized by Columbia and its affiliates from their relationships with the funds. The Trustees considered the fees charged to the funds for advisory services as well as the total expense levels of the funds. That information included comparisons (provided both by management and by an independent third party) of the funds' advisory fees and total expense levels to those of their peer groups and information about the advisory fees charged by Columbia to comparable accounts. In considering the fees charged to comparable accounts, the Trustees took into account, among other things, management's representations about the differences between managing mutual funds as compared to other types of accounts, including the additional resources required to effectively manage mutual funds and distribute mutual fund share s. In evaluating each fund's advisory fees, the Trustees also took into account the demands, complexity and quality of the investment management of the fund. The Trustees considered reductions in advisory fee rates, implementation of advisory fee breakpoints, institution of advisory fee waivers, and reductions of expense caps, which benefited a number of the funds. Furthermore, the Trustees considered the projected impact on expenses resulting from the overall cost reductions that management anticipated would result from the shift to a common group of service providers for transfer agency, fund accounting and custody services for mutual funds advised by Bank of America affiliates. The Trustees also noted management's stated justification for the fees charged to the funds, which included information about the performance of the funds, the services provided to the funds and management's view as to why it was appropriate that some funds bear advisory fees or total expenses greater than their peer group medians.
The Trustees also considered the compensation directly or indirectly received by Columbia and its affiliates from their relationships with the funds. The Trustees reviewed information provided by management as to the profitability to Columbia and its affiliates of their relationships with the funds, and information about the allocation of expenses used to calculate profitability. When reviewing profitability, the Trustees also considered court cases in which adviser profitability was an issue in whole or in part, the performance of the relevant funds, the expense levels of the funds, and whether Columbia had implemented breakpoints and/or expense caps with respect to the funds.
After reviewing those and related factors, the Trustees concluded, within the context of their overall conclusions regarding each of the Agreements, that the advisory fees charged to each of the funds were fair and reasonable, and that the costs of the advisory services generally, and the related profitability to Columbia and its affiliates of their relationships with the funds, supported the continuation of the Agreements.
143
Board Consideration and Approval of Investment Advisory Agreements (continued)
Economies of Scale. The Trustees considered the existence of any economies of scale in the provision of services by Columbia to each fund and whether those economies were shared with the fund through breakpoints in the investment advisory fees or other means, such as expense waivers. The Trustees noted that many of the funds benefited from breakpoints, expense caps, or both. In considering those issues, the Trustees also took note of the costs of the services provided (both on an absolute and a relative basis) and the profitability to Columbia and its affiliates of their relationships with the funds, as discussed above.
After reviewing those and related factors, the Trustees concluded, within the context of their overall conclusions regarding each of the Agreements, that the extent to which economies of scale were shared with the funds supported the continuation of the Agreements.
Other Factors. The Trustees also considered other factors, which included but were not limited to the following:
• the extent to which each fund had operated in accordance with its investment objective and its record of compliance with its investment restrictions, and the compliance programs of the funds and Columbia. They also considered the compliance-related resources that Columbia and its affiliates were providing to the funds.
• the nature, quality, cost and extent of administrative and shareholder services performed by Columbia and its affiliates, both under the Agreements and under separate agreements for the provision of transfer agency and administrative services.
• so-called "fall-out benefits" to Columbia, such as the engagement of its affiliates to provide distribution, brokerage and transfer agency services to the funds, and the benefits of research made available to Columbia by reason of brokerage commissions generated by the funds' securities transactions, as well as possible conflicts of interest associated with those fall-out and other benefits, and the reporting, disclosure and other processes in place to disclose and monitor those possible conflicts of interest.
• the draft report provided by the independent fee consultant, which included information about and analysis of the funds' fees, expenses and performance.
Based on their evaluation of all factors that they deemed to be material, including those factors described above, and assisted by the advice of independent counsel and the independent fee consultant, the Trustees, including the Independent Trustees, approved the continuance of each of the Agreements through October 31, 2006.
144
Summary of Management Fee Evaluation by Independent Fee Consultant
Prepared Pursuant to the February 9, 2005 Assurance of Discontinuance between the Office of
Attorney General of New York State and Columbia Management Advisors, Inc. and
Columbia Funds Distributor, Inc. October 11, 2005
I. Overview
Columbia Management Advisors, Inc. ("CMA") and Columbia Funds Distributors, Inc. ("CFD") (CFD together with CMA referred to herein as Columbia Management Group or "CMG1"), entered into an agreement with the New York Attorney General's Office in the form of an Assurance of Discontinuance (the "AOD"). The AOD stipulated that CMA would be permitted to manage or advise the Columbia Funds only if the Independent Members (as such term is defined in the AOD) of the Columbia Funds' Board of Trustees/Directors (collectively the "Trustees") appointed a Senior Officer or an Independent Fee Consultant ("IFC") who, among other things, is to manage the process by which management fees are negotiated. On May 15, 2005, the Independent Members of the Board appointed me as the IFC for the Columbia Funds. This report is the annual written evaluation of the Columbia Funds for 2005 that I have prepared in my capacity as IFC, as required b y the AOD.
A. Duties of the Independent Fee Consultant
As part of the AOD, the Independent Members of the Columbia Funds' Board of Trustees/Directors agreed to retain an independent fee consultant who was to participate in the management fee negotiation process. The IFC is charged with "... duties and responsibilities [that] include managing the process by which proposed management fees (including, but not limited to, advisory fees) to be charged the Columbia Fund[s] are negotiated so that they are negotiated in a manner which is at arms length and reasonable and consistent with this Assurance of Discontinuance." However, the IFC does not replace the Trustees in their role of negotiating management and other fees with CMG and its affiliates. In particular, the AOD states that "Columbia Advisors may manage or advise a Columbia Fund only if the reasonableness of the proposed management fees is determined by the Board of Trustees of the Columbia Fund using ... an annual independent wri tten evaluation prepared by or under the direction of the ... Independent Fee Consultant...." This report, pursuant to the AOD, constitutes the "annual independent written evaluation prepared by or under the direction of the... Independent Fee Consultant."
The AOD requires the IFC report to consider at least the following:
a) Management fees (including any components thereof) charged by other mutual fund companies for like services;
b) Management fees (including any components thereof) charged to institutional and other clients of CMA for like services;
c) Costs to CMA and its affiliates of supplying services pursuant to the management fee agreements, excluding any intra-corporate profit;
d) Profit margins of CMA and its affiliates from supplying such services;
e) Possible economies of scale as the CMA fund grows larger; and
f) The nature and quality of CMA services, including Columbia Funds' performance.
This report is designed to assist the Board in evaluating the 2005 contract renewal for Columbia Funds. In addition, this report points out areas where the Board may deem additional information and analysis to be appropriate over time.
1 Prior to the date of this report, CMA merged into an affiliated entity, Banc of America Capital Management, LLC ("BACAP"), and BACAP then changed its name to Columbia Management Advisors, LLC which carries on the business of CMA, and CFD changed its name to Columbia Management Distributors, Inc.
145
Summary of Management Fee Evaluation by Independent Fee Consultant (continued)
B. Sources of Information Used in My Evaluation
I have requested data from CMG and various third party industry data sources or independent research companies that work in the mutual fund arena. The following list generally describes the types of information I requested.
1. I collected data on performance, management fees, and expense ratios of both Columbia Funds and comparable non-Columbia Funds. The sources of this information were CMG, Lipper Inc. ("Lipper") and Morningstar Inc. ("Morningstar"). While Lipper and Morningstar each selected a different group of peer funds it deemed appropriate against which to measure the relative performance and fees of Columbia Funds, I conducted an independent review of the appropriateness of each peer group.
2. I reviewed data on CMG's expense and profitability that I obtained from CMA directly.
3. I have reviewed data on the organizational structure of CMG in general.
4. I collected information on profitability from Strategic Insight Mutual Fund Research and Consulting, LLC ("Strategic Insight"). I used this third-party independent research as an additional method to gauge the accuracy of the data collected in (2) above.
5. I conducted interviews with various CMG staff, including members of the senior management team, legal staff, heads of affiliates, portfolio managers, and financial personnel.
6. I reviewed current 2005 Section 15(c) material provided to the Board and material presented to the Board in the 2004 fee and performance evaluation.
7. I have reviewed various academic research papers, industry publications, and other available literature dealing with mutual fund operations, profitability, and other issues. In addition, I have reviewed SEC releases and studies of mutual fund expenses.
8. I have reviewed documents pertaining to recent mutual fund litigation in general and publicly available information about litigation where CMG has been involved.
In addition, I have engaged NERA Economic Consulting ("NERA") and independent consultant Dr. John Rea to assist me in data management and analysis. Both NERA and Dr. Rea have extensive experience in the mutual fund industry through consulting, government positions, or industry trade groups that provide unique insights and special knowledge pertaining to my independent analysis of fees, performance, and profitability. I have also retained Shearman & Sterling LLP as outside counsel to advise me in connection with my review.
C. Qualifications and Independence
I am the Walter H. Carpenter Chair and Professor of Finance at Babson College. Before this I was the Chief Economist of the U.S. Securities and Exchange Commission. I have no material relationship with Bank of America or CMG aside from acting as IFC, and am aware of no relationship with any of their affiliates.
[Resume omitted]
II. Evaluation of the general process used to negotiate the advisory contract
A. General Considerations
My analysis considered all factors and information I reviewed on the finances and operations of Columbia Funds. I gave each factor an appropriate weight in my overall findings, and no single factor was in itself the sole criterion for a finding or conclusion. My objective was to assess all of the information provided and conduct a robust evaluation of Columbia Funds' operations, fees, and performance.
My analysis and thought processes will and, I believe, should, differ in certain ways from the processes used by Trustees in their evaluation of the management agreements. In particular, because of my technical and quantitative background, I may use techniques and data that Trustees have not previously felt would be useful. I view this supplemental analysis as appropriate because my role is to assist Trustees in their decisions, and to the extent that I bring new ideas or
146
Summary of Management Fee Evaluation by Independent Fee Consultant (continued)
analysis to the evaluation, I believe this improves the process by which management fees for the Columbia Funds may be negotiated in accordance with the AOD.
Finally, as part of my role as IFC, I have, from time to time, sent to Trustees additional papers and reports produced by third parties that I felt had bearing on the fee negotiation process. I viewed these materials as educational in nature and felt they would aid Trustees in placing their work in context.
B. CMG Management Interviews
As a starting point of my analysis, I have met with members of CMG staff to gain an understanding of the organizational structure and personnel involved in running the Columbia fund family.
I have had general discussions and have received information about the management structure of CMG. My conversations with management have been informative. In addition, I have participated in Board meetings where Trustees and management have discussed issues relating to management agreements and performance of Columbia Funds. When I felt it was appropriate, I added my opinions on particular matters, such as fund performance or fee levels, to the discussion.
C. Trustees' Fee and Performance Evaluation Process
After making initial requests for information, members of the Trustees of the Columbia Funds met in advance of the October Section 15(c) contract approval meeting to review certain fee, performance and other data for the Columbia Funds and to ask questions and make requests of management. Trustees have developed a process to evaluate the fee and expense levels and performance of Columbia Funds. This process is used to highlight those funds that have been performing poorly, may have had higher management fees or expense ratios, or both.
The process involves providing instructions to Lipper to prepare specific data analyses tailored to the Trustees review framework. These instructions include highlighting funds that hit one or more fee performance "screens." The six screens the Trustees use are as follows:
a. 5th Lipper quintile in actual management fee;
b. 5th Lipper quintile in total expense ratio;
c. Three or more 5th Lipper quintile rankings in the 1-, 3-, 5- or 10-year performance rankings;
d. Sum of the Lipper Quintile Rank (1-year performance) and the Lipper Quintile Rank (actual management fee) totals a number equal to or higher than 8;
e. Sum of the Lipper Quintile Rank (1-year performance) and the Lipper Quintile Rank (total expense ratio) totals a number equal to or higher than 8; and
f. Sum of the Lipper Quintile Rank (3-year performance) and the Lipper Quintile Rank (total expense ratio) totals a number equal to or higher than 8.
If a fund hits one or more of these screens, it is highlighted for additional review by the Trustees. This method is only used as an aid for Trustees to highlight funds and is not the sole test of whether the Board will determine to take particular actions concerning fees or performance. Funds that have not been flagged by this screen also may be singled out for fee and performance reasons, and the Trustees may determine not to take action with respect to the fees or performance of funds that have been flagged by the screen. These screens contribute to the basis for discussions on Trustees' views on the Columbia Funds.
III. Findings
My findings based on my work as IFC are as follows:
1. The Trustees have the relevant information necessary to form an opinion on the reasonableness of fees and evaluate the performance of the Columbia Funds. The process the Trustees used in preparing to reach their determination has been open and informative. In my view, the 2005 process by which the management fees of
147
Summary of Management Fee Evaluation by Independent Fee Consultant (continued)
the Columbia Funds have been negotiated thus far has been, to the extent practicable, at arm's length and reasonable and consistent with the AOD.
2. Columbia Funds demonstrated a range of performance relative to their peers. I find that across the fund complex, 54.26 percent of Columbia Funds have performance higher than the median of their respective Lipper performance universe, and 42.55 percent of Columbia Funds have performance higher than the median of their respective Lipper performance group. In addition, Lipper performance universe and group comparison showed that Columbia Funds were distributed roughly evenly across these quintiles. The Trustees have worked with management to address issues of funds that have demonstrated consistent or significant underperformance.
3. Columbia Funds demonstrate a range of management fees and expense ratios relative to their peers. I find that across the fund complex, 58.51 percent of Columbia Funds have expenses below the median of their Lipper expense universe, and 53.19 percent of Columbia Funds have expenses below the median of their Lipper expense group. In addition, Lipper expense universe and group comparisons show that Columbia Funds are distributed roughly evenly across these quintiles. The Trustees have taken steps to limit shareholder expenses for certain funds having management fees significantly above their peers, often though the use of fee waivers to which CMG has agreed. Consolidation of various funds and fund families managed by CMG has resulted in substantial savings in non-advisory expenses.
4. Profitability to CMG of the individual funds ranges widely, but the overall profitability to CMG of its relationship with the Columbia Funds appears to fall within a reasonable range. The method of cost allocation to funds is addressed in the material provided by CMG to the Trustees, but additional information may be necessary to make a judgment on fund level profitability. My review of profitability and cost allocation is ongoing, and I plan to continue to develop my views with regard to fund level profitability.
5. Columbia Funds have instituted fee schedules with breakpoints designed to enable investors to benefit from fund economies of scale, although 71% of the funds have not yet reached their first breakpoint. My analysis of the appropriateness of the breakpoint levels, which I expect will take into account the cost and profitability of the individual funds, is ongoing.
My work is ongoing and my views may develop over time in light of new information and analysis.
Respectfully submitted,
Erik R. Sirri
148
CMG FUND TRUST
1300 S.W. SIXTH AVENUE, PORTLAND, OREGON 97201
- INVESTMENT ADVISOR -
COLUMBIA MANAGEMENT ADVISORS, LLC
100 FEDERAL STREET
BOSTON, MASSACHUSETTS 02110-2624
- LEGAL COUNSEL -
ROPES & GRAY LLP
ONE INTERNATIONAL PLACE
BOSTON, MA 02110-2624
- TRANSFER AGENT -
COLUMBIA MANAGEMENT SERVICES, INC.
P.O. BOX 8081
BOSTON, MASSACHUSETTS 02266-8081
SHC-44/106109-0106 (03/06) 06/10225
A description of the funds' proxy voting policies and procedures is available (i) on the funds' website, www.columbiamanagement.com; (ii) on the Securities and Exchange Commission's website at www.sec.gov, and (iii) without charge, upon request, by calling 800-368-0346. Information regarding how the funds voted proxies relating to portfolio securities during the 12-month period ended June 30 is available from the SEC's website. Information regarding how the funds voted proxies relating to portfolio securities is also available from the funds' website.
Each fund files file a complete schedule of portfolio holdings with the SEC for the first and third quarters of each fiscal year on Form N-Q. Each fund's Form N-Q is available on the SEC's website at www.sec.gov and may be reviewed and copied at the SEC's Public Reference Room in Washington, D.C. Information on the operation of the Public Reference Room may be obtained by calling 1-800-SEC-0330.
The CMG funds are offered by prospectus through Columbia Management Distributors, Inc. Please consider the investment objectives, risks, charges and expenses of a mutual fund carefully before investing. Contact your Columbia Management representative or visit www.columbiamanagement.com for a prospectus, which contains this and other important information about the fund. Read it carefully before you invest.
Fund distributed by Columbia Management Distributors, Inc., One Financial Center, Boston, MA 02111-2621
![]()
CMG SMALL CAP FUND
A PORTFOLIO OF CMG FUND TRUST
Semiannual Report
January 31, 2006
Advised by Columbia Management Advisors, LLC
Not FDIC
Insured
May Lose Value
No Bank Guarantee
Columbia Management is the primary investment management division of Bank of America Corporation. Columbia Management entities furnish investment management services and advise institutional and mutual fund portfolios. CMG Funds are distributed by Columbia Management Distributors, Inc., member of NASD, SIPC, part of Columbia Management and an affiliate of Bank of America Corporation.
Columbia Management Advisors, Inc. combined with Banc of America Capital Management, LLC on September 30, 2005. At that time, the newly combined advisor underwent a name change to Columbia Management Advisors, LLC and continues to operate as a SEC-registered investment advisor, wholly owned subsidiary of Bank of America, N.A. and is part of Columbia Management.
The views expressed in the portfolio commentary reflect the current views of the Portfolio Manager. These views are not guarantees of future performance and involve certain risks, uncertainties and assumptions that are difficult to predict so actual outcomes and results may differ significantly from the views expressed. These views are subject to change at any time based upon economic, market or other conditions and the Portfolio Manager disclaims any responsibility to update such views. These views may not be relied on as investment advice and, because investment decisions for a CMG Fund are based on numerous factors, may not be relied on as an indication of trading intent on behalf of any particular CMG Fund. References to specific company securities should not be construed as a recommendation or investment advice.
Performance data quoted represents past performance and current performance may be lower or higher. Past performance is no guarantee of future results. The investment return and principal value will fluctuate so that shares, when redeemed, may be worth more or less than the original cost. Please visit www.columbiamanagement.com for daily and most recent month-end performance updates.
CMG SMALL CAP FUND
A Portfolio of CMG Fund Trust
MANAGEMENT DISCUSSION OF FUND PERFORMANCE
CMG Small Cap Fund returned 17.54% for the six-month period ended January 31, 2006. The fund surpassed the Russell 2000 Growth Index1 and the Russell 2000 Index1, which returned 10.71% and 8.50%, respectively, for the same period. The fund also beat the Morningstar Small Growth Category average of 9.78% for the period.2 Strong stock selection drove the fund's performance relative to its benchmarks and peer group.
In an environment that was generally favorable for small-cap stocks, solid stock picking and an overweight position in the industrials sector enhanced performance. A constructive outlook on machinery stocks warranted the fund's sizeable positions in Terex Corp. and Joy Global, Inc., which benefited from their exposure to mining and construction customers (1.3% and 1.5% of net assets, respectively). Ceradyne, Inc., which develops ceramic products and components, benefited from a ramp up in military orders for body and vehicle armor (1.9% of net assets). On the downside, LECG Corp. fell short of our expectations and we reduced the fund's position in the stock (0.5% of net assets).
The information technology sector was strong during the period, and three long-held stocks were among the top performers. F5 Networks, Inc. reported strong results and continued to take share in the Layer 4-7 networking market, and Global Payments, Inc. appreciated on entering into an agreement with another company to access the Asian market (1.0% and 1.2% of net assets, respectively). SiRF Technology Holdings, Inc., a supplier of chipsets for global positioning systems for consumer and business applications, also performed well (1.6% of net assets). A setback was Ixia, which fell 36% in the period as orders slipped; we used this opportunity to add to the fund's position in the stock because we believe its long-term prospects remained compelling (0.9% of net assets).
Participation in the energy sector—particularly in the energy service group—had a positive impact on fund performance. Atwood Oceanics, Inc., which engages in offshore drilling, and Veritas DGC, Inc., which provides seismic surveying, benefited from healthy spending by exploration and production customers (1.0% and 1.0% of net assets, respectively).
The telecommunications and consumer discretionary sectors provided some standout performers. Millicom International Cellular SA, which provides cellular phone service to emerging markets, rose 81% in the period and attracted numerous unsolicited acquisition offers by larger firms seeking entry to its markets (0.9% of net assets). VistaPrint Ltd., which supplies customized printed products for consumers and small businesses and leverages the Internet for delivery, soared 98%, and we remain optimistic about the potential size of its market (1.3% of net assets).
Consumer staples stocks detracted from results. Elizabeth Arden, Inc. was sold from the portfolio as excitement around the Britney Spears product line waned and competitors gained market share. USANA Health Sciences, Inc. struggled with concerns about growth rates as its entry to another foreign market was delayed (0.7% of net assets). The fund also experienced relative weakness in the materials and health care sectors, where stocks underperformed. OM Group, Inc. fell victim to deteriorating pricing in the nickel market and was sold. Pharmaceutical companies Nabi Biopharmaceuticals, Rigel Pharmaceuticals, Inc. and Alexion Pharmaceuticals, Inc., suffered from disappointments in clinical development and were sold from the portfolio.
1
We continue to believe that the economy is growing at a healthy rate and that inflation is relatively contained. We remain bullish on the energy and materials sectors for long-term structural reasons and continue to hold a number of later-cycle positions in the industrial sector. Accordingly, we are watchful for signs of decelerating growth that could provoke a reassessment of the strength and duration of the current economic expansion. Finally, we believe that the interest rate environment and valuations are supportive of traditional growth stocks relative to value stocks, and we continue to seek candidates with strong earnings prospects and attractive valuations.
The fund's top ten holdings (as a percentage of net assets) as of January 31, 2006 were:
| (%) | |||||||
| Wabtec | 2.0 | ||||||
| Affiliated Managers Group | 1.9 | ||||||
| Ceradyne | 1.9 | ||||||
| HealthExtras | 1.6 | ||||||
| SiRF Technology Holdings | 1.6 | ||||||
| Corporate Executive Board | 1.5 | ||||||
| Joy Global | 1.5 | ||||||
| VistaPrint | 1.3 | ||||||
| Terex | 1.3 | ||||||
| Scientific Games | 1.3 | ||||||
We appreciate your continued confidence in the CMG Small Cap Fund.
Kenneth A. Korngiebel has managed the CMG Small Cap Fund since July 2004 and has been with the advisor or its predecessors or affiliate organizations since 1996.

Equity investments are affected by stock market fluctuations that occur in response to economic and business developments.
Investing in growth stocks incurs the possibility of losses because their prices are sensitive to changes in current or expected earnings.
Investments in small-cap stocks may be subject to greater volatility and price fluctuations because small companies often have narrower markets and limited financial resources and their stocks tend to be thinly traded and less liquid than investments in larger companies.
1 The Russell 2000 Index tracks the performance of the 2,000 smallest of the 3,000 largest U.S. companies based on market capitalization. The Russell 2000 Growth Index measures the performance of those Russell 2000 Index companies with higher price-to-book ratios and higher forecasted growth values. Unlike the fund, indexes are not investments, do not incur fees or expenses and are not professionally managed. It is not possible to invest directly in an index. Securities in the fund may not match those in an index.
2 ©2006 by Morningstar, Inc. All rights reserved. The information contained herein is the proprietary information of Morningstar, Inc., may not be copied or redistributed for any purpose and may only be used for noncommercial, personal purposes. The information contained herein is not represented or warranted to be accurate, correct, complete or timely. Morningstar, Inc. shall not be responsible for investment decisions, damages or other losses resulting from the use of this information. Past performance is no guarantee of future performance. Morningstar, Inc. has not granted consent for it to be considered or deemed an "expert" under the Securities Act of 1933.
Morningstar Categories compare the performance of funds with similar investment objectives and strategies.
Holdings are calculated as a percentage of net assets and are subject to change. Because the fund is actively managed, there is no guarantee that the fund will continue to maintain the holdings breakdown listed. The fund's holdings and their weights within the portfolio may change as market conditions change.
2
Average annual total return as of January 31, 2006 (%)
| Inception | 6-month (cumulative) | 1-year | 5-year | 10-year | |||||||||||||||||||
| CMG Small Cap Fund | 08/30/89 | 17.54 | 37.65 | 5.39 | 12.42 | ||||||||||||||||||
| Russell 2000 Index | 8.50 | 18.89 | 8.99 | 10.22 | |||||||||||||||||||
| Russell 2000 Growth Index | 10.71 | 19.59 | 2.57 | 5.74 | |||||||||||||||||||
Average annual total return as of December 31, 2005 (%)
| Inception | 6-month (cumulative) | 1-year | 5-year | 10-year | |||||||||||||||||||
| CMG Small Cap Fund | 08/30/89 | 12.26 | 18.16 | 3.54 | 11.28 | ||||||||||||||||||
| Russell 2000 Index | 5.88 | 4.55 | 8.22 | 9.26 | |||||||||||||||||||
| Russell 2000 Growth Index | 8.02 | 4.15 | 2.28 | 4.69 | |||||||||||||||||||
Performance data quoted represents past performance and current performance may be lower or higher. Past performance is no guarantee of future results. The investment return and principal value will fluctuate so that shares, when redeemed, may be worth more or less than the original cost. Please visit www.columbiamanagement.com for daily and most recent month-end performance updates.
Performance results may reflect any voluntary waivers or reimbursement of fund expenses by the advisor or its affiliates. Absent these waivers or reimbursement arrangements, performance results would have been lower. All results shown assume reinvestment of distributions.
Growth of a $10,000 investment, February 1, 1996 to January 31, 2006
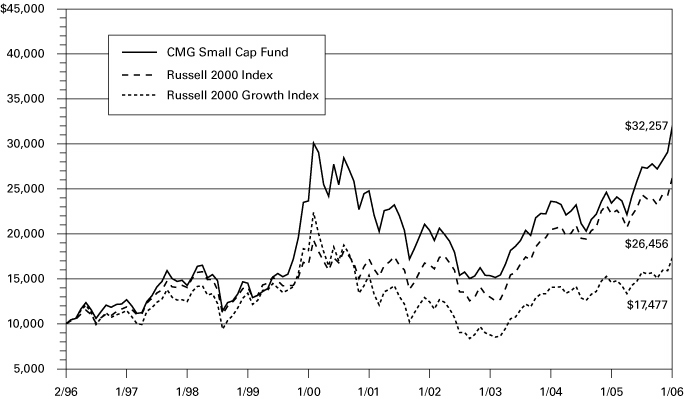
The Russell 2000 Index tracks the performance of the 2,000 smallest of the 3,000 largest U.S. companies based on market capitalization. The Russell 2000 Growth Index measures the performance of those Russell 2000 Index companies with higher price-to-book ratios and higher forecasted growth values. Unlike the fund, indices are not investments, do not incur fees or expenses and are not professionally managed. It is not possible to invest directly in an index. Securities in the fund may not match those in an index.
The chart above shows the growth in value of a hypothetical $10,000 investment in the fund compared to the indices during the period, and does not reflect the deduction of taxes that a shareholder would pay on fund distributions or the redemption of fund shares.
3
UNDERSTANDING YOUR EXPENSES – CMG Small Cap Fund
As a fund shareholder, you incur two types of costs. There are transaction costs and also ongoing costs, which generally include investment advisory fees and other fund expenses. The information on this page is intended to help you understand your ongoing costs of investing in the fund and to compare these costs with the ongoing costs of investing in other mutual funds.
Analyzing your fund's expenses
To illustrate these ongoing costs, we have provided an example and calculated the expenses paid by investors during the reporting period. The information in the following table is based on an initial investment of $1,000, which is invested at the beginning of the reporting period and held for the entire period. Expense information is calculated two ways and each method provides you with different information. The amount listed in the "actual" column is calculated using the fund's actual operating expenses and total return for the period. The amount listed in the "hypothetical" column assumes that the return each year is 5% before expenses and includes the fund's actual expense ratio. You should not use the hypothetical account values and expenses to estimate either your actual account balance at the end of the period or the expenses you paid during this reporting period.
Estimating your actual expenses
To estimate the expenses that you paid over the period, first you will need your account balance at the end of the period:
1. Divide your ending account balance by $1,000. For example, if an account balance was $8,600 at the end of the period, the result would be 8.6.
2. In the section of the table below titled "Expenses paid during the period," locate the amount under "actual." Multiply this number by the result from step 1. Your answer is an estimate of the expenses you paid on your account during the period.
August 1, 2005 – January 31, 2006
| Account value at the beginning of the period ($) | Account value at the end of the period ($) | Expenses paid during the period ($) | Fund's annualized expense ratio (%) | ||||||||||||||||||||||||||||
| Actual | Hypothetical | Actual | Hypothetical | Actual | Hypothetical | ||||||||||||||||||||||||||
| 1,000.00 | 1,000.00 | 1,175.38 | 1,018.90 | 6.85 | 6.36 | 1.25 | |||||||||||||||||||||||||
Expenses paid during the period are equal to the fund's annualized expense ratio of 1.25%, multiplied by the average account value over the period, then multiplied by the number of days in the fund's most recent fiscal half-year and divided by 365.
It is important to note that the expense amounts shown in the table are meant to highlight only ongoing costs of investing in the fund and do not reflect any transaction costs, such as sales charges, redemption or exchange fees. Therefore, the hypothetical examples provided may not help you determine the relative total costs of owning shares of different funds. If these transaction costs were included, your costs would have been higher.
4
Compare with other funds
Since all mutual funds are required to include the same hypothetical calculations about expenses in shareholder reports, you can use this information to compare the ongoing cost of investing in the fund with other funds. To do so, compare the 5% hypothetical example with the 5% hypothetical examples that appear in the shareholder reports of other funds. As you compare hypothetical examples of other funds, it is important to note that hypothetical examples are meant to highlight the continuing costs of investing in a fund and do not reflect any transaction costs, such as sales charges or redemption or exchange fees.
5
CMG SMALL CAP FUND
A Portfolio of CMG Fund Trust
FINANCIAL HIGHLIGHTS
(For a Fund Share Outstanding Throughout Each Period)
| (Unaudited) Six Months Ended January 31, | Year Ended July 31, | Period Ended July 31, | |||||||||||||||||
| 2006 | 2005 | 2004 | 2003(a) | ||||||||||||||||
| Net asset value, beginning of period | $ | 6.57 | $ | 5.07 | $ | 4.62 | $ | 3.67 | |||||||||||
| Income from investment operations: | |||||||||||||||||||
| Net investment loss | (0.03 | ) (b) | (0.03 | ) (b) | (0.03 | ) (b) | (0.02 | ) (b) | |||||||||||
| Net realized and unrealized gain (loss) on investments | 0.67 | 1.53 | 0.48 | 0.97 | |||||||||||||||
| Total from investment operations | 0.64 | 1.50 | 0.45 | 0.95 | |||||||||||||||
| Less distributions declared to shareholders: | |||||||||||||||||||
| From net realized gains | (5.05 | ) | - | - | - | ||||||||||||||
| Net asset value, end of period | $ | 2.16 | $ | 6.57 | $ | 5.07 | $ | 4.62 | |||||||||||
| Total return (d) | 17.54 | %(e)(f) | 29.59 | % | 9.74 | % | 25.89 | %(e) | |||||||||||
| Ratios/Supplemental data: | |||||||||||||||||||
| Net assets, end of period (000's) | $ | 12,994 | $ | 30,317 | $ | 292,028 | $ | 293,924 | |||||||||||
| Ratio of net expenses to average net assets (g) | 1.25 | %(h) | 0.85 | % | 0.79 | % | 0.81 | %(h) | |||||||||||
| Waiver/reimbursement | - | %(h)(i) | - | - | - | ||||||||||||||
| Ratio of net investment loss to average net assets (g) | (1.05 | )%(h) | (0.61 | )% | (0.62 | )% | (0.55 | )%(h) | |||||||||||
| Portfolio turnover rate | 71 | %(e) | 119 | % | 123 | % | 89 | %(e) | |||||||||||
| Year Ended October 31, | |||||||||||||||
| 2002 | 2001 | 2000 | |||||||||||||
| Net asset value, beginning of period | $ | 4.41 | $ | 18.78 | $ | 13.59 | |||||||||
| Income from investment operations: | |||||||||||||||
| Net investment loss | (0.02 | ) (b) | (0.01 | ) | (0.09 | ) | |||||||||
| Net realized and unrealized gain (loss) on investments | (0.72 | ) | (2.18 | ) | 6.80 | ||||||||||
| Total from investment operations | (0.74 | ) | (2.19 | ) | 6.71 | ||||||||||
| Less distributions declared to shareholders: | |||||||||||||||
| From net realized gains | - | (c) | (12.18 | ) | (1.52 | ) | |||||||||
| Net asset value, end of period | $ | 3.67 | $ | 4.41 | $ | 18.78 | |||||||||
| Total return (d) | (16.76 | )% | (28.84 | )% | 50.49 | % | |||||||||
| Ratios/Supplemental data: | |||||||||||||||
| Net assets, end of period (000's) | $ | 227,874 | $ | 283,521 | $ | 258,480 | |||||||||
| Ratio of net expenses to average net assets (g) | 0.79 | % | 0.82 | % | 0.79 | % | |||||||||
| Waiver/reimbursement | - | - | - | ||||||||||||
| Ratio of net investment loss to average net assets (g) | (0.49 | )% | (0.22 | )% | (0.39 | )% | |||||||||
| Portfolio turnover rate | 120 | % | 160 | % | 163 | % | |||||||||
(a) The Fund changed its fiscal year end from October 31 to July 31.
(b) Per share data was calculated using average shares outstanding during the period.
(c) Rounds to less than $0.01 per share.
(d) Total return at net asset value assuming all distributions reinvested.
(e) Not annualized.
(f) Had the Transfer Agent not waived or reimbursed a portion of expenses, total return would have been reduced.
(g) The benefits derived from custody credits had an impact of less than 0.01%.
(h) Annualized.
(i) Rounds to less than 0.01%.
See Accompanying Notes to Financial Statements.
6
CMG SMALL CAP FUND
A Portfolio of CMG Fund Trust
SCHEDULE OF INVESTMENTS
January 31, 2006 (Unaudited)
| Shares | Value | ||||||||||
| Common Stocks (97.1%) | |||||||||||
| Consumer Discretionary (12.1%) | |||||||||||
| Diversified Consumer Services (0.4%) | |||||||||||
| Laureate Education, Inc. (a) | 920 | $ | 47,932 | ||||||||
| Hotels, Restaurants & Leisure (5.1%) | |||||||||||
| Cosi, Inc. (a) | 6,770 | 66,008 | |||||||||
| Pinnacle Entertainment, Inc. (a) | 3,720 | 107,210 | |||||||||
| RARE Hospitality International, Inc. (a) | 2,130 | 67,201 | |||||||||
| Red Robin Gourmet Burgers, Inc. (a) | 1,520 | 60,329 | |||||||||
| Ruby Tuesday, Inc. | 1,330 | 38,051 | |||||||||
| Scientific Games Corp., Class A (a) | 5,320 | 170,506 | |||||||||
| Shuffle Master, Inc. (a) | 2,540 | 64,516 | |||||||||
| Trump Entertainment Resorts, Inc. (a) | 4,800 | 94,080 | |||||||||
| 667,901 | |||||||||||
| Household Durables (0.2%) | |||||||||||
| Tupperware Brands Corp. | 970 | 21,534 | |||||||||
| Internet & Catalog Retail (2.5%) | |||||||||||
| NetFlix, Inc. (a) | 3,010 | 82,926 | |||||||||
| Nutri/System, Inc. (a) | 1,470 | 71,883 | |||||||||
| VistaPrint Ltd. (a) | 5,715 | 172,765 | |||||||||
| 327,574 | |||||||||||
| Leisure Equipment & Products (0.6%) | |||||||||||
| SCP Pool Corp. | 2,110 | 84,147 | |||||||||
| Media (0.4%) | |||||||||||
| Radio One, Inc., Class D (a) | 4,510 | 49,430 | |||||||||
| Specialty Retail (2.9%) | |||||||||||
| Aaron Rents, Inc. | 2,210 | 53,151 | |||||||||
| Children's Place Retail Stores, Inc. (a) | 2,350 | 102,906 | |||||||||
| GameStop Corp., Class A (a) | 2,180 | 87,876 | |||||||||
| Genesco, Inc. (a) | 590 | 22,981 | |||||||||
| Gymboree Corp. (a) | 2,780 | 68,499 | |||||||||
| Tractor Supply Co. (a) | 680 | 34,734 | |||||||||
| 370,147 | |||||||||||
| Consumer Staples (2.2%) | |||||||||||
| Beverages (0.3%) | |||||||||||
| Hansen Natural Corp. (a) | 410 | 35,998 | |||||||||
| Household Products (0.8%) | |||||||||||
| Central Garden & Pet Co. (a) | 2,140 | 106,101 | |||||||||
See Accompanying Notes to Financial Statements.
7
CMG SMALL CAP FUND
A Portfolio of CMG Fund Trust
SCHEDULE OF INVESTMENTS
| Shares | Value | ||||||||||
| Common Stocks (continued) | |||||||||||
| Personal Products (1.1%) | |||||||||||
| Playtex Products, Inc. (a) | 3,540 | $ | 47,507 | ||||||||
| USANA Health Sciences, Inc. (a) | 2,310 | 92,654 | |||||||||
| 140,161 | |||||||||||
| Energy (9.4%) | |||||||||||
| Energy Equipment & Services (6.5%) | |||||||||||
| Atwood Oceanics, Inc. (a) | 1,300 | 126,269 | |||||||||
| CAL Dive International, Inc. (a) | 3,014 | 126,528 | |||||||||
| Core Laboratories NV (a) | 2,340 | 104,317 | |||||||||
| Grey Wolf, Inc. (a) | 14,210 | 125,048 | |||||||||
| Oil States International, Inc. (a) | 1,640 | 67,076 | |||||||||
| Tetra Technologies, Inc. (a) | 2,795 | 110,906 | |||||||||
| Todco, Class A | 1,070 | 47,722 | |||||||||
| Veritas DGC, Inc. (a) | 2,960 | 133,377 | |||||||||
| 841,243 | |||||||||||
| Oil, Gas & Consumable Fuels (2.9%) | |||||||||||
| Carrizo Oil & Gas, Inc. (a) | 3,705 | 106,927 | |||||||||
| Cheniere Energy, Inc. (a) | 1,640 | 63,763 | |||||||||
| Foundation Coal Holdings, Inc. | 1,380 | 61,355 | |||||||||
| Frontier Oil Corp. | 1,190 | 56,394 | |||||||||
| Holly Corp. | 1,160 | 85,376 | |||||||||
| 373,815 | |||||||||||
| Financials (6.2%) | |||||||||||
| Capital Markets (2.0%) | |||||||||||
| Affiliated Managers Group, Inc. (a) | 2,720 | 252,416 | |||||||||
| Commercial Banks (1.8%) | |||||||||||
| Signature Bank (a) | 2,970 | 90,436 | |||||||||
| Sterling Financial Corp. | 1,880 | 52,678 | |||||||||
| UCBH Holdings, Inc. | 2,840 | 49,274 | |||||||||
| Wintrust Financial Corp. | 710 | 38,127 | |||||||||
| 230,515 | |||||||||||
| Diversified Financial Services (0.6%) | |||||||||||
| IntercontinentalExchange, Inc. (a) | 643 | 32,677 | |||||||||
| Nasdaq Stock Market, Inc. (a) | 1,210 | 50,711 | |||||||||
| 83,388 | |||||||||||
| Insurance (1.8%) | |||||||||||
| Hanover Insurance Group, Inc. | 1,670 | 80,912 | |||||||||
| ProAssurance Corp. (a) | 3,090 | 158,177 | |||||||||
| 239,089 | |||||||||||
See Accompanying Notes to Financial Statements.
8
CMG SMALL CAP FUND
A Portfolio of CMG Fund Trust
SCHEDULE OF INVESTMENTS
| Shares | Value | ||||||||||
| Common Stocks (continued) | |||||||||||
| Health Care (18.7%) | |||||||||||
| Biotechnology (3.9%) | |||||||||||
| Alkermes, Inc. (a) | 2,090 | $ | 50,871 | ||||||||
| Amylin Pharmaceuticals, Inc. (a) | 1,720 | 72,928 | |||||||||
| Digene Corp. (a) | 3,650 | 121,180 | |||||||||
| ICOS Corp. (a) | 1,710 | 42,494 | |||||||||
| Nektar Therapeutics (a) | 3,350 | 66,330 | |||||||||
| Neurocrine Biosciences, Inc. (a) | 1,370 | 83,255 | |||||||||
| United Therapeutics Corp. (a) | 1,020 | 65,963 | |||||||||
| 503,021 | |||||||||||
| Health Care Equipment & Supplies (5.7%) | |||||||||||
| ArthroCare Corp. (a) | 1,520 | 68,081 | |||||||||
| Foxhollow Technologies, Inc. (a) | 1,050 | 28,213 | |||||||||
| Haemonetics Corp. (a) | 1,786 | 92,872 | |||||||||
| Hologic, Inc. (a) | 940 | 48,372 | |||||||||
| Intuitive Surgical, Inc. (a) | 500 | 68,825 | |||||||||
| Iris International, Inc. (a) | 1,924 | 43,983 | |||||||||
| Kyphon, Inc. (a) | 2,282 | 94,863 | |||||||||
| OraSure Technologies, Inc. (a) | 8,890 | 96,990 | |||||||||
| Possis Medical, Inc. (a) | 845 | 8,281 | |||||||||
| ResMed, Inc. (a) | 4,252 | 167,699 | |||||||||
| Thoratec Corp. (a) | 1,040 | 26,312 | |||||||||
| 744,491 | |||||||||||
| Health Care Providers & Services (7.2%) | |||||||||||
| Allscripts Healthcare Solutions, Inc. (a) | 3,622 | 63,783 | |||||||||
| Cerner Corp. (a) | 1,860 | 83,700 | |||||||||
| DaVita, Inc. (a) | 1,559 | 85,355 | |||||||||
| HealthExtras, Inc. (a) | 6,365 | 209,409 | |||||||||
| ICON PLC, ADR (a) | 3,552 | 156,217 | |||||||||
| LHC Group, Inc. (a) | 2,380 | 37,842 | |||||||||
| Matria Healthcare, Inc. (a) | 2,060 | 87,900 | |||||||||
| Pediatrix Medical Group, Inc. (a) | 410 | 35,949 | |||||||||
| Psychiatric Solutions, Inc. (a) | 1,180 | 38,928 | |||||||||
| United Surgical Partners International, Inc. (a) | 3,625 | 140,505 | |||||||||
| 939,588 | |||||||||||
| Pharmaceuticals (1.9%) | |||||||||||
| Medicis Pharmaceutical Corp., Class A | 2,830 | 87,475 | |||||||||
| Salix Pharmaceuticals Ltd. (a) | 9,095 | 158,162 | |||||||||
| 245,637 | |||||||||||
| Industrials (21.0%) | |||||||||||
| Aerospace & Defense (3.7%) | |||||||||||
| Armor Holdings, Inc. (a) | 1,470 | 70,075 | |||||||||
| BE Aerospace, Inc. (a) | 7,590 | 159,542 | |||||||||
| Ceradyne, Inc. (a) | 4,360 | 249,566 | |||||||||
| 479,183 | |||||||||||
See Accompanying Notes to Financial Statements.
9
CMG SMALL CAP FUND
A Portfolio of CMG Fund Trust
SCHEDULE OF INVESTMENTS
| Shares | Value | ||||||||||
| Common Stocks (continued) | |||||||||||
| Air Freight & Logistics (1.0%) | |||||||||||
| Forward Air Corp. | 1,329 | $ | 51,831 | ||||||||
| UTI Worldwide, Inc. | 750 | 78,548 | |||||||||
| 130,379 | |||||||||||
| Building Products (0.6%) | |||||||||||
| ElkCorp. | 2,310 | 81,243 | |||||||||
| Commercial Services & Supplies (5.5%) | |||||||||||
| Corporate Executive Board Co. | 2,313 | 194,616 | |||||||||
| Global Cash Access, Inc. (a) | 4,097 | 63,340 | |||||||||
| Huron Consulting Group, Inc. (a) | 3,025 | 85,214 | |||||||||
| Kenexa Corp. (a) | 5,477 | 131,722 | |||||||||
| LECG Corp. (a) | 3,932 | 65,979 | |||||||||
| Resources Connection, Inc. (a) | 4,540 | 123,442 | |||||||||
| Waste Connections, Inc. (a) | 1,330 | 46,470 | |||||||||
| 710,783 | |||||||||||
| Construction & Engineering (1.7%) | |||||||||||
| Perini Corp. (a) | 3,380 | 93,051 | |||||||||
| URS Corp. (a) | 3,000 | 128,340 | |||||||||
| 221,391 | |||||||||||
| Electrical Equipment (1.3%) | |||||||||||
| Evergreen Solar, Inc. (a) | 2,900 | 44,747 | |||||||||
| General Cable Corp. (a) | 2,900 | 71,050 | |||||||||
| Roper Industries, Inc. | 1,370 | 55,279 | |||||||||
| 171,076 | |||||||||||
| Machinery (6.3%) | |||||||||||
| ESCO Technologies, Inc. (a) | 2,342 | 115,086 | |||||||||
| Joy Global, Inc. | 3,545 | 191,572 | |||||||||
| RBC Bearings, Inc. (a) | 4,404 | 81,650 | |||||||||
| Terex Corp. (a) | 2,420 | 170,610 | |||||||||
| Wabtec Corp. | 8,060 | 254,454 | |||||||||
| 813,372 | |||||||||||
| Road & Rail (0.9%) | |||||||||||
| Landstar System, Inc. | 1,310 | 55,413 | |||||||||
| Old Dominion Freight Line, Inc. (a) | 2,357 | 67,269 | |||||||||
| 122,682 | |||||||||||
| Information Technology (22.9%) | |||||||||||
| Communications Equipment (3.0%) | |||||||||||
| CSR PLC (a) | 6,810 | 135,688 | |||||||||
| F5 Networks, Inc. (a) | 2,020 | 130,694 | |||||||||
| Ixia (a) | 9,353 | 117,848 | |||||||||
| 384,230 | |||||||||||
See Accompanying Notes to Financial Statements.
10
CMG SMALL CAP FUND
A Portfolio of CMG Fund Trust
SCHEDULE OF INVESTMENTS
| Shares | Value | ||||||||||
| Common Stocks (continued) | |||||||||||
| Computers & Peripherals (2.4%) | |||||||||||
| Electronics for Imaging, Inc. (a) | 2,784 | $ | 76,978 | ||||||||
| M-Systems Flash Disk Pioneers Ltd. (a) | 1,980 | 57,380 | |||||||||
| Presstek, Inc. (a) | 5,409 | 56,254 | |||||||||
| Rackable Systems, Inc. (a) | 1,665 | 50,033 | |||||||||
| Synaptics, Inc. (a) | 2,710 | 74,579 | |||||||||
| 315,224 | |||||||||||
| Internet Software & Services (1.1%) | |||||||||||
| aQuantive, Inc. (a) | 2,850 | 74,128 | |||||||||
| Equinix, Inc. (a) | 1,550 | 72,742 | |||||||||
| 146,870 | |||||||||||
| IT Services (3.9%) | |||||||||||
| Acxiom Corp. | 3,160 | 74,797 | |||||||||
| CACI International, Inc., Class A (a) | 1,252 | 71,489 | |||||||||
| Euronet Worldwide, Inc. (a) | 4,990 | 161,027 | |||||||||
| Global Payments, Inc. | 3,188 | 162,365 | |||||||||
| Heartland Payment Systems, Inc. (a) | 1,450 | 35,685 | |||||||||
| 505,363 | |||||||||||
| Semiconductors & Semiconductor Equipment (7.1%) | |||||||||||
| Atheros Communications, Inc. (a) | 3,900 | 76,635 | |||||||||
| ATMI, Inc. (a) | 4,040 | 135,744 | |||||||||
| Hittite Microwave Corp. (a) | 5,240 | 146,720 | |||||||||
| Microsemi Corp. (a) | 2,460 | 74,882 | |||||||||
| Silicon Laboratories, Inc. (a) | 590 | 29,046 | |||||||||
| SiRF Technology Holdings, Inc. (a) | 6,060 | 204,161 | |||||||||
| Tessera Technologies, Inc. (a) | 3,370 | 108,784 | |||||||||
| Trident Microsystems, Inc. (a) | 5,532 | 144,496 | |||||||||
| 920,468 | |||||||||||
| Software (5.4%) | |||||||||||
| Embarcadero Technologies, Inc. (a) | 14,560 | 109,200 | |||||||||
| Epicor Software Corp. (a) | 6,510 | 86,583 | |||||||||
| Hyperion Solutions Corp. (a) | 1,850 | 63,659 | |||||||||
| Informatica Corp. (a) | 6,120 | 90,086 | |||||||||
| Kronos, Inc. (a) | 940 | 36,942 | |||||||||
| Micros Systems, Inc. (a) | 1,369 | 63,179 | |||||||||
| Quest Software, Inc. (a) | 4,920 | 77,933 | |||||||||
| Transaction Systems Architects, Inc. (a) | 2,270 | 74,887 | |||||||||
| Wind River Systems, Inc. (a) | 7,690 | 102,892 | |||||||||
| 705,361 | |||||||||||
| Materials (2.5%) | |||||||||||
| Construction Materials (0.7%) | |||||||||||
| Eagle Materials, Inc. | 590 | 96,105 | |||||||||
See Accompanying Notes to Financial Statements.
11
CMG SMALL CAP FUND
A Portfolio of CMG Fund Trust
SCHEDULE OF INVESTMENTS
| Shares | Value | ||||||||||
| Common Stocks (continued) | |||||||||||
| Metals & Mining (1.8%) | |||||||||||
| Allegheny Technologies, Inc. | 2,030 | $ | 105,255 | ||||||||
| Century Aluminum Co. (a) | 2,190 | 74,635 | |||||||||
| Cleveland-Cliffs, Inc. | 510 | 55,004 | |||||||||
| 234,894 | |||||||||||
| Telecommunication Services (2.1%) | |||||||||||
| Wireless Telecommunication Services (2.1%) | |||||||||||
| Dobson Communications Corp., Class A (a) | 8,410 | 62,402 | |||||||||
| Millicom International Cellular SA (a) | 2,900 | 111,650 | |||||||||
| SBA Communications Corp., Class A (a) | 4,720 | 103,132 | |||||||||
| 277,184 | |||||||||||
| Total Common Stocks (Cost of $9,479,894) | 12,619,936 | ||||||||||
| Par | |||||||||||
| Short-Term Obligation (3.3%) | |||||||||||
| Repurchase agreement with State Street Bank & Trust Co., dated 01/31/06, due 02/01/06 at 4.270%, collateralized by a U.S. Treasury Note maturing 05/15/15, market value of $434,431 (repurchase proceeds $422,050) | $ | 422,000 | 422,000 | ||||||||
| Total Short-Term Obligation (Cost of $422,000) | 422,000 | ||||||||||
| Total Investments (100.4%) (Cost of $9,901,894) (b) | 13,041,936 | ||||||||||
| Other Assets & Liabilities, Net (-0.4%) | (47,737 | ) | |||||||||
| Net Assets (100.0%) | $ | 12,994,199 | |||||||||
| Notes to Schedule of Investments: | |||||||||||
(a) Non-income producing security.
(b) Cost for federal income tax purposes is $9,901,894.
See Accompanying Notes to Financial Statements.
12
CMG SMALL CAP FUND
A Portfolio of CMG Fund Trust
SCHEDULE OF INVESTMENTS
At January 31, 2006, the Fund held investment in the following sectors:
Sector | % of Net Assets | ||||||
| Information Technology | 22.9 | % | |||||
| Industrials | 21.0 | ||||||
| Health Care | 18.7 | ||||||
| Consumer Discretionary | 12.1 | ||||||
| Energy | 9.4 | ||||||
| Financials | 6.2 | ||||||
| Materials | 2.5 | ||||||
| Consumer Staples | 2.2 | ||||||
| Telecommunication Services | 2.1 | ||||||
| Short-Term Obligation | 3.3 | ||||||
| Other Assets & Liabilities, Net | (0.4 | ) | |||||
| 100.0 | % | ||||||
| Acronym | Name | ||||||
| ADR | American Depositary Receipt | ||||||
See Accompanying Notes to Financial Statements.
13
CMG SMALL CAP FUND
A Portfolio of CMG Fund Trust
STATEMENT OF ASSETS AND LIABILITIES
January 31, 2006 (Unaudited)
| ASSETS: | |||||||
| Investments, at identified cost | $ | 9,901,894 | |||||
| Investments, at value | $ | 13,041,936 | |||||
| Cash | 94 | ||||||
| Receivable for: | |||||||
| Investments sold | 123,626 | ||||||
| Interest | 50 | ||||||
| Dividends | 30 | ||||||
| Deferred Trustees' compensation plan | 6,357 | ||||||
| Total assets | 13,172,093 | ||||||
| LIABILITIES: | |||||||
| Payable for: | |||||||
| Investments purchased | 127,324 | ||||||
| Investment advisory fee | 10,012 | ||||||
| Transfer agent fee | 101 | ||||||
| Trustees' fees | 310 | ||||||
| Audit fee | 13,812 | ||||||
| Custody fee | 1,703 | ||||||
| Reports to shareholders | 13,956 | ||||||
| Chief compliance officer expenses | 318 | ||||||
| Deferred Trustees' fees | 6,357 | ||||||
| Other liabilities | 4,001 | ||||||
| Total liabilities | 177,894 | ||||||
| NET ASSETS | $ | 12,994,199 | |||||
| NET ASSETS consist of: | |||||||
| Paid-in capital | $ | 6,123,451 | |||||
| Accumulated net investment loss | (119,452 | ) | |||||
| Accumulated net realized gain | 3,850,158 | ||||||
| Net unrealized appreciation on investments | 3,140,042 | ||||||
| NET ASSETS | $ | 12,994,199 | |||||
| Shares of capital stock outstanding | 6,024,904 | ||||||
| Net asset value, offering and redemption price per share | $ | 2.16 | |||||
See Accompanying Notes to Financial Statements.
14
CMG SMALL CAP FUND
A Portfolio of CMG Fund Trust
STATEMENT OF OPERATIONS
For the Six Months Ended January 31, 2006 (Unaudited)
| NET INVESTMENT INCOME: | |||||||
| Income: | |||||||
| Dividends | $ | 9,447 | |||||
| Interest | 13,038 | ||||||
| Total income | 22,485 | ||||||
| Expenses: | |||||||
| Investment advisory fee | 82,307 | ||||||
| Transfer agent fee | 189 | ||||||
| Trustees' fees | 5,307 | ||||||
| Custody fee | 13,362 | ||||||
| Audit fee | 16,080 | ||||||
| Reports to shareholders | 7,220 | ||||||
| Chief compliance officer expenses (See Note 4) | 2,255 | ||||||
| Non-recurring costs (See Note 8) | 164 | ||||||
| Other expenses | 10,384 | ||||||
| Total expenses | 137,268 | ||||||
| Fees and expenses waived or reimbursed by Transfer Agent | (23 | ) | |||||
| Non-recurring costs assumed by Investment Advisor (See Note 8) | (164 | ) | |||||
| Custody earnings credit | (166 | ) | |||||
| Net expenses | 136,915 | ||||||
| Net investment loss | (114,430 | ) | |||||
| NET REALIZED AND UNREALIZED GAIN (LOSS) ON INVESTMENTS AND FOREIGN CURRENCY: | |||||||
| Net realized gain (loss) on: | |||||||
| Investments | 5,623,320 | ||||||
| Foreign currency transactions | (589 | ) | |||||
| Net realized gain | 5,622,731 | ||||||
| Net change in unrealized appreciation (depreciation) on investments | (3,512,046 | ) | |||||
| Net gain | 2,110,685 | ||||||
| NET INCREASE IN NET ASSETS FROM OPERATIONS | $ | 1,996,255 | |||||
See Accompanying Notes to Financial Statements.
15
CMG SMALL CAP FUND
A Portfolio of CMG Fund Trust
STATEMENT OF CHANGES IN NET ASSETS
| Increase (Decrease) in Net Assets: | (Unaudited) Six Months Ended January 31, 2006 | Year Ended July 31, 2005 | |||||||||
| Operations: | |||||||||||
| Net investment loss | $ | (114,430 | ) | $ | (677,591 | ) | |||||
| Net realized gain on investments and foreign currency transactions | 5,622,731 | 46,457,512 | |||||||||
| Net change in unrealized appreciation (depreciation) on investments | (3,512,046 | ) | (25,488,632 | ) | |||||||
| Net increase from operations | 1,996,255 | 20,291,289 | |||||||||
| Distributions Declared to Shareholders: | |||||||||||
| From net realized gains | (8,639,807 | ) | - | ||||||||
| Share Transactions: | |||||||||||
| Subscriptions | 3,300,000 | 4,562,259 | |||||||||
| Distributions reinvested | 5,234,864 | - | |||||||||
| Redemptions | (19,213,943 | ) | (286,564,984 | ) | |||||||
| Net decrease from share transactions | (10,679,079 | ) | (282,002,725 | ) | |||||||
| Total decrease in net assets | (17,322,631 | ) | (261,711,436 | ) | |||||||
| NET ASSETS: | |||||||||||
| Beginning of period | 30,316,830 | 292,028,266 | |||||||||
| End of period | $ | 12,994,199 | $ | 30,316,830 | |||||||
| Accumulated net investment loss | $ | (119,452 | ) | $ | (5,022 | ) | |||||
| Changes in Shares: | |||||||||||
| Subscriptions | 1,683,674 | 801,259 | |||||||||
| Issued for distributions reinvested | 2,670,849 | - | |||||||||
| Redemptions | (2,944,114 | ) | (53,836,059 | ) | |||||||
| Net increase (decrease) | 1,410,409 | (53,034,800 | ) | ||||||||
See Accompanying Notes to Financial Statements.
16
CMG SMALL CAP FUND
A Portfolio of CMG Fund Trust
NOTES TO FINANCIAL STATEMENTS
January 31, 2006 (Unaudited)
Note 1. Organization:
CMG Small Cap Fund (the "Fund"), a series of CMG Fund Trust (the "Trust"), is a diversified portfolio. The Trust is an Oregon business trust registered under the Investment Company Act of 1940, as amended, as an open-end management investment company.
Investment goal. The Fund seeks to provide investors with long-term capital appreciation, by investing primarily in smaller capitalization companies.
Fund shares. The Fund may issue an unlimited number of shares of no par value capital stock, which are offered continuously at net asset value.
Note 2. Significant accounting policies:
Use of estimates. The preparation of financial statements in conformity with accounting principles generally accepted in the United States of America ("GAAP") requires management to make estimates and assumptions that affect the reported amounts of assets and liabilities, the disclosure of contingent assets and liabilities at the date of the financial statements and the reported amounts of revenue and expenses during the reporting period. Actual results could differ from those estimates. The following is a summary of significant accounting policies consistently followed by the Fund in the preparation of its financial statements.
Security valuation. Equity securities are valued at the last sale price on the principal exchange on which they trade, except for securities traded on the NASDAQ, which are valued at the NASDAQ official close price. Unlisted securities or listed securities for which there were no sales during the day are valued at the closing bid price on such exchanges or over-the-counter markets.
Short-term debt obligations maturing within 60 days are valued at amortized cost, which approximates market value.
Investments for which market quotations are not readily available, or that have quotations which management believes are not appropriate, are valued at fair value as determined in good faith under consistently applied procedures established by and under the general supervision of the Board of Trustees. If a security is valued at a "fair value", such value is likely to be different from the last quoted market price for the security.
Security transactions. Security transactions are accounted for on the trade date. Cost is determined and gains (losses) are based upon the specific identification method for both financial statement and federal income tax purposes.
Repurchase agreements. The Fund may engage in repurchase agreement transactions with institutions that the Fund's investment advisor has determined are creditworthy. The Fund, through its custodian, receives delivery of underlying securities collateralizing a repurchase agreement. Collateral is at least equal, at all times, to the value of the repurchase obligation including interest. A repurchase agreement transaction involves certain risks in the event of default or insolvency of the counterparty. These risks include possible delays or restrictions upon the Fund's ability to dispose of the underlying securities and a possible decline in the value of the underlying securities during the period while the Fund seeks to assert its rights.
17
CMG SMALL CAP FUND
A Portfolio of CMG Fund Trust
NOTES TO FINANCIAL STATEMENTS
January 31, 2006 (Unaudited)
Income recognition. Interest income is recorded on the accrual basis. Corporate actions and dividend income are recorded on the ex-date. Awards from class action litigation are recorded as a reduction of cost if the Fund still owns the applicable securities on the payment date. If the Fund no longer owns the applicable securities, the proceeds are recorded as realized gains.
Foreign currency transactions. The values of all assets and liabilities quoted in foreign currencies are translated into U.S. dollars at that day's exchange rates. Net realized and unrealized gains (losses) on foreign currency transactions include gains (losses) arising from the fluctuation in exchange rates between trade and settlement dates on securities transactions, gains (losses) arising from the disposition of foreign currency and currency gains (losses) between the accrual and payment dates on dividends, interest income and foreign withholding taxes.
For financial statement purposes, the Fund does not distinguish that portion of gains (losses) on investments which is due to changes in foreign exchange rates from that which is due to changes in market prices of the investments. Such fluctuations are included with the net realized and unrealized gains (losses) on investments.
Federal income tax status. The Fund intends to qualify each year as a "regulated investment company" under Subchapter M of the Internal Revenue Code, as amended, and will distribute substantially all of its taxable income, if any, for its tax year, and as such will not be subject to federal income taxes. In addition, the Fund intends to distribute in each calendar year substantially all of its net investment income, capital gains and certain other amounts, if any, such that the Fund should not be subject to federal excise tax. Therefore, no federal income or excise tax provision is recorded.
Distributions to shareholders. Distributions to shareholders are recorded on ex-date. Net realized capital gains, if any, are distributed at least annually.
Note 3. Federal Tax Information:
Unrealized appreciation and depreciation at January 31, 2006, based on cost of investments for federal income tax purposes was:
| Unrealized appreciation | $ | 3,258,795 | |||||
| Unrealized depreciation | (118,753 | ) | |||||
| Net unrealized appreciation | $ | 3,140,042 | |||||
Note 4. Fees and Compensation Paid to Affiliates:
Investment advisory fee. Columbia Management Advisors, LLC ("Columbia"), an indirect, wholly-owned subsidiary of Bank of America Corporation ("BOA"), is the investment advisor to the Fund and provides administrative and other services to the Fund. Prior to September 30, 2005, Columbia Management Advisors, Inc. was the investment advisor to the Fund under the same fee structure. On September 30, 2005, Columbia Management Advisors, Inc. merged into Banc of America Capital Management, LLC. At that time, the investment advisor was then renamed Columbia Management Advisors, LLC. Columbia receives a monthly investment advisory fee at the annual rate of 0.75% of the Fund's average daily net assets.
Pricing & bookkeeping fees. Columbia is responsible for providing services to the Fund under a pricing, bookkeeping and fund administration agreement. Under a separate agreement (the "Outsourcing Agreement"), Columbia has
18
CMG SMALL CAP FUND
A Portfolio of CMG Fund Trust
NOTES TO FINANCIAL STATEMENTS
January 31, 2006 (Unaudited)
delegated certain of those functions to State Street Corporation ("State Street"). As a result, Columbia pays fees to State Street under the Outsourcing Agreement. The Fund is not charged a fee for pricing and bookkeeping services.
Transfer agent fee. Columbia Management Services, Inc. (formerly Columbia Funds Services, Inc.) (the "Transfer Agent"), an affiliate of Columbia and an indirect, wholly-owned subsidiary of BOA, provides shareholder services to the Fund and has contracted with Boston Financial Data Services ("BFDS") to serve as sub-transfer agent. The Transfer Agent is entitled to receive a fee for its services, paid monthly, at the annual rate of $15.23 per open account. Prior to November 1, 2005, the Transfer Agent received a fee at the annual rate of $28.00 per open account. The Transfer Agent may also retain, as additional compensation for its services, fees for wire, telephone and redemption orders, IRA trustee agent fees and account transcript fees due the Transfer Agent from shareholders of the Fund and credits (net of bank charges) earned with respect to balances in a ccounts the Transfer Agent maintains in connection with its services to the Fund.
For the period from September 1, 2005 through October 31, 2005, the Transfer Agent voluntarily waived a portion of its fees to reflect the reduced contractual fees charged to the Fund effective November 1, 2005. For the six months ended January 31, 2006, the Transfer Agent waived fees of $23 for the Fund.
For the six months ended January 31, 2006, the Fund's annualized effective transfer agent fee rate, net of fee waivers, was less than 0.01% of the Fund's average daily net assets.
Custody credits. The Fund has an agreement with its custodian bank under which custody fees may be reduced by balance credits. These credits are recorded as a reduction of total expenses on the Statement of Operations. The Fund could have invested a portion of the assets utilized in connection with the expense offset arrangement in an income-producing asset if it had not entered into such an agreement.
Fees paid to officers and trustees. All officers, with the exception of the Fund's Chief Compliance Officer, are employees of Columbia or its affiliates and receive no compensation from the Fund. The Board of Trustees has appointed a Chief Compliance Officer to the Fund in accordance with federal securities regulations. The Fund, along with other affiliated funds, pays its pro-rata share of the expenses associated with the Chief Compliance Officer. The Fund's expenses for the Chief Compliance Officer will not exceed $15,000 per year.
The Fund's Trustees may participate in a deferred compensation plan which may be terminated at any time. Obligations of the plan will be paid solely out of the Fund's assets.
Other. Columbia provides certain services to the Fund related to Sarbanes-Oxley compliance. For the six months ended January 31, 2006, the Fund paid $806 to Columbia for such services. This amount is included in "Other expenses" on the Statement of Operations.
Note 5. Portfolio Information:
For the six months ended January 31, 2006, the cost of purchases and proceeds from sales of securities, excluding short-term obligations, were $15,538,370 and $34,394,956, respectively.
Note 6. Line of Credit:
The Fund and other affiliated funds participate in a $350,000,000 committed unsecured revolving line of credit provided by State Street Bank and Trust Company. Borrowings are used for temporary or emergency purposes to facilitate portfolio liquidity. Interest is charged to each participating fund based on its borrowings at a rate per annum equal to the Federal Funds rate plus 0.50%. In addition, a commitment fee of 0.10% per annum is accrued and
19
CMG SMALL CAP FUND
A Portfolio of CMG Fund Trust
NOTES TO FINANCIAL STATEMENTS
January 31, 2006 (Unaudited)
apportioned among the participating funds based on their pro-rata portion of the unutilized line of credit. The commitment fee is included in "Other expenses" on the Statement of Operations.
For the six months ended January 31, 2006, the Fund did not borrow under this arrangement.
Note 7. Shares of Beneficial Interest:
As of January 31, 2006, the Fund had shareholders whose shares were beneficially owned by participant accounts over which Bank of America and/or its affiliates had either sole or joint investment discretion. Subscription and redemption activity of these accounts may have a significant effect on the operations of the Fund. The number of such accounts and the percentage of shares of beneficial interest outstanding held therein are as follows:
| Number of Shareholders | % of Shares Outstanding Held | ||||||
| 1 | 40.9 | % | |||||
As of January 31, 2006, the Fund also had other shareholders that held greater than 5% of the shares outstanding. Subscription and redemption activity of these accounts may have a significant effect on the operations of the Fund. The number of such accounts and the percentage of shares of beneficial interest outstanding held therein are as follows:
| Number of Shareholders | % of Shares Outstanding Held | ||||||
| 3 | 59.1 | % | |||||
Note 8. Disclosure of Significant Risks and Contingencies:
Industry Focus. The Fund may focus its investments in certain industries, subjecting it to greater risk than a fund that is more diversified.
Legal Proceedings. On February 9, 2005, Columbia Management Advisors, Inc. (which has since merged into Banc of America Capital Management, LLC (now named Columbia Management Advisors, LLC)) ("Columbia") and Columbia Funds Distributor, Inc. (which has been renamed Columbia Management Distributors, Inc.) (the "Distributor") (collectively, the "Columbia Group") entered into an Assurance of Discontinuance with the New York Attorney General ("NYAG") (the "NYAG Settlement") and consented to the entry of a cease-and-desist order by the Securities and Exchange Commission ("SEC") (the "SEC Order"). The SEC Order and the NYAG Settlement are referred to collectively as the "Settlements". The Settlements contain substantially the same terms and conditions as outlined in the agreements in principle which Columbia Group entered into with the SEC and NYAG in March 2004.
Under the terms of the SEC Order, the Columbia Group has agreed among other things, to: pay $70 million in disgorgement and $70 million in civil money penalties; cease and desist from violations of the antifraud provisions and certain other provisions of the federal securities laws; maintain certain compliance and ethics oversight structures; retain an independent consultant to review the Columbia Group's applicable supervisory, compliance, control and other policies and procedures; and retain an independent distribution consultant (see below). The Columbia Funds have also voluntarily undertaken to implement certain governance measures designed to maintain the independence of their boards of trustees. The NYAG Settlement also, among other things, requires Columbia and its affiliates to reduce certain Columbia Funds (including the former Nations Funds) and other mutual funds management fees collectively by $32 million per year fo r five years, for a projected total of $160 million in management fee reductions.
20
CMG SMALL CAP FUND
A Portfolio of CMG Fund Trust
NOTES TO FINANCIAL STATEMENTS
January 31, 2006 (Unaudited)
Pursuant to the procedures set forth in the SEC order, the $140 million in settlement amounts described above will be distributed in accordance with a distribution plan developed by an independent distribution consultant and agreed to by the staff of the SEC. The independent distribution consultant has been in consultation with the Staff, and has submitted a draft proposed plan of distribution, but has not yet submitted a final proposed plan of distribution.
As a result of these matters or any adverse publicity or other developments resulting from them, there may be increased redemptions or reduced sales of fund shares, which could increase transaction costs or operating expenses, or have other adverse consequences for the funds.
A copy of the SEC Order is available on the SEC website at http://www.sec.gov. A copy of the NYAG Settlement is available as part of the Bank of America Corporation Form 8-K filing on February 10, 2005.
In connection with the events described in detail above, various parties have filed suit against certain funds, the Trustees of the Columbia Funds, FleetBoston Financial Corporation and its affiliated entities and/or Bank of America and its affiliated entities.
On February 20, 2004, the Judicial Panel on Multidistrict Litigation transferred these cases and cases against several other mutual fund companies based on similar allegations to the United States District Court in Maryland for consolidated or coordinated pretrial proceedings (the "MDL"). Subsequently, additional related cases were transferred to the MDL. On September 29, 2004, the plaintiffs in the MDL filed amended and consolidated complaints. One of these amended complaints is a putative class action that includes claims under the federal securities laws and state common law, and that names Columbia, the Distributor, the Trustees of the Columbia Funds, Bank of America Corporation and others as defendants. Another of the amended complaints is a derivative action purportedly on behalf of the Columbia Funds that asserts claims under federal securities laws and state common law.
On February 25, 2005, Columbia and other defendants filed motions to dismiss the claims in the pending cases. On March 1, 2006, for reasons stated in the court's memoranda dated November 3, 2005, the U.S. District Court for the District of Maryland granted in part and denied in part the defendants' motions to dismiss. The court dismissed all of the class action claims pending against the Columbia Funds. As to Columbia, the Distributor and the Trustees of the Columbia Funds, the claims under the Securities Act of 1933, the claims under Sections 34(b) and 36(a) of the Investment Company Act of 1940 (ICA) and the state law claims were dismissed. The claims under Sections 10(b) and 20(a) of the Securities Exchange Act of 1934 and claims under Section 36(b) of the ICA along with related claims under Section 48(a) of the ICA were not dismissed.
On March 21, 2005 purported class action plaintiffs filed suit in Massachusetts state court alleging that the conduct, including market timing, entitles Class B shareholders in certain Columbia funds to an exemption from contingent deferred sales charges upon early redemption ("the CDSC Lawsuit"). The CDSC Lawsuit has been removed to federal court in Massachusetts and the federal Judicial Panel has transferred the CDSC Lawsuit to the MDL.
The MDL is ongoing. Accordingly, an estimate of the financial impact of this litigation on any fund, if any, cannot currently be made.
In 2004, certain Columbia funds, the Trustees of the Columbia Funds, advisers and affiliated entities were named as defendants in certain purported shareholder class and derivative actions making claims, including claims under the Investment Company and the Investment Advisers Acts of 1940 and state law. The suits allege, inter alia, that the fees and expenses paid by the funds are excessive and that the advisers and their affiliates inappropriately used fund assets to distribute the funds and for other improper purpose. On March 2, 2005, the actions were consolidated in the Massachusetts federal court as In re Columbia Entities Litigation. The plaintiffs filed a consolidated amended complaint on June 9, 2005. On November 30, 2005, the judge dismissed all claims by plaintiffs and ordered that the case be closed. The plaintiffs filed a notice of appeal on December 30, 2005 and this appeal is pending.
21
CMG SMALL CAP FUND
A Portfolio of CMG Fund Trust
NOTES TO FINANCIAL STATEMENTS
January 31, 2006 (Unaudited)
For the six months ended January 31, 2006, Columbia has assumed $164 of legal, consulting services and Trustees' fees incurred by the Fund in connection with these matters.
Note 9. Subsequent event
On March 27, 2006, the Fund will be re-domiciled into a new series of Columbia Funds Institutional Trust. Columbia Funds Institutional Trust is registered under the Investment Company Act of 1940, as amended, as an open-end management investment company.
Immediately following the re-domiciling, CMG Small Cap Growth Fund will be reorganized into the Fund. The Fund will then change its name to CMG Small Cap Growth Fund.
22
Board Consideration and Approval of Investment Advisory Agreements
The Advisory Fees and Expenses Committee of the Board of Trustees meets one or more times annually, usually in late summer, to review the advisory agreements (collectively, the "Agreements") of the funds for which the Trustees serve as trustees or directors (each a "fund") and determine whether to recommend that the full Board approve the continuation of the Agreements for an additional one-year period. After the Committee has made its recommendation, the full Board, including the Independent Trustees, determines whether to approve the continuation of the Agreements. In addition, the Board, including the Independent Trustees, considers matters bearing on the Agreements at most of its other meetings throughout the year and meets regularly with the heads of each investment area within Columbia. The Trustees also meet with selected fund portfolio managers at various times throughout the year.
The Trustees receive and review all materials that they, their legal counsel or Columbia, the funds' investment adviser, believe to be reasonably necessary for the Trustees to evaluate the Agreements and determine whether to approve the continuation of the Agreements. Those materials generally include, among other items, (i) information on the investment performance of each fund relative to the performance of peer groups of mutual funds and the fund's performance benchmarks, (ii) information on each fund's advisory fees and other expenses, including information comparing the fund's expenses to those of peer groups of mutual funds and information about any applicable expense caps and fee "breakpoints," (iii) sales and redemption data, (iv) information about the profitability of the Agreements to Columbia, and potential "fall-out" or ancillary benefits that Columbia and its affiliates may receive as a result of their relationships with the funds and (v) information obtained through Columbia's response to a questionnaire prepared at the request of the Trustees by counsel to the funds and independent legal counsel to the Independent Trustees. The Trustees also consider other information such as (vi) Columbia's financial results and financial condition, (vii) each fund's investment objective and strategies and the size, education and experience of Columbia's investment staffs and their use of technology, external research and trading cost measurement tools, (viii) the allocation of the funds' brokerage, if any, including allocations to brokers affiliated with Columbia and the use of "soft" commission dollars to pay fund expenses and to pay for research products and services, (ix) Columbia's resources devoted to, and its record of compliance with, the funds' investment policies and restrictions, policies on personal securities transactions and other compliance policies, (x) Columbia's response to various legal and regulatory proceedings since 2003 and (xi) the economic outlook generally and for the mutual fund industry in particular. In addition, the Trustees confer with their independent fee consultant and review materials relating to the Agreements that the independent fee consultant provides. Throughout the process, the Trustees have the opportunity to ask questions of and request additional materials from Columbia and to consult independent legal counsel to the Independent Trustees.
The Board of Trustees most recently approved the continuation of the Agreements at its October, 2005 meeting, following meetings of the Advisory Fees and Expenses Committee held in August, September, and October, 2005. In considering whether to approve the continuation of the Agreements, the Trustees, including the Independent Trustees, did not identify any single factor as determinative, and each weighed various factors as he or she deemed appropriate. The Trustees considered the following matters in connection with their approval of the continuation of the Agreements:
The nature, extent and quality of the services provided to the funds under the Agreements. The Trustees considered the nature, extent and quality of the services provided by Columbia and its affiliates to the funds and the resources dedicated to the funds by Columbia and its affiliates. Among other things, the Trustees considered (i) Columbia's ability, including its resources, compensation programs for personnel involved in fund management, reputation and other attributes, to attract and retain highly qualified research, advisory and supervisory investment professionals; (ii) the portfolio management services provided by those investment professionals; and (iii) the trade execution services provided on behalf of the funds. For each fund, the Trustees also considered the benefits to shareholders of investing in a mutual fund that is part of a family o f funds offering exposure to a variety of asset classes and investment disciplines and providing for a variety of fund and shareholder services. After reviewing those and related factors, the Trustees concluded, within the context of their overall conclusions regarding each of the Agreements, that the nature, extent and quality of services provided supported the continuation of the Agreements.
Investment performance of the funds and Columbia. The Trustees reviewed information about the performance of each fund over various time periods, including information prepared by an independent third party that compared the performance of each fund to the performance of peer groups of mutual funds and performance benchmarks. The Trustees also reviewed a description of the third party's methodology for identifying each fund's peer group for purposes of performance and expense comparisons. The Trustees also considered additional information that the
23
Board Consideration and Approval of Investment Advisory Agreements (continued)
Advisory Fees and Expenses Committee requested from Columbia relating to funds that presented relatively weaker performance and/or relatively higher expenses.
In the case of each fund that had performance that lagged that of a relevant peer group for certain (although not necessarily all) periods, the Trustees concluded that other factors relevant to performance were sufficient, in light of other considerations, to warrant continuation of the fund's Agreements. Those factors varied from fund to fund, but included one or more of the following: (i) that the fund's performance, although lagging in certain recent periods, was stronger over the longer term; (ii) that the underperformance was attributable, to a significant extent, to investment decisions that were reasonable and consistent with the fund's investment strategy and policies and that the fund was performing as expected, given market conditions and the fund's investment strategy; (iii) that the fund's performance was competitive when compared to other relevant performance benchmarks or peer groups; (iv) that Columbia had taken o r was taking steps designed to help improve the fund's investment performance, including, but not limited to, replacing portfolio managers or modifying investment strategies; (v) that the fund's advisory fee had recently been, or was proposed to be, reduced, with the goal of helping the fund's net return to shareholders become more competitive; and (vi) that other fund expenses, such as transfer agency or fund accounting fees, have recently been reduced, with the goal of helping the fund's net return to shareholders become more competitive. The Trustees also considered Columbia's performance and reputation generally, the funds' performance as a fund family generally, and Columbia's historical responsiveness to Trustee concerns about performance and Columbia's willingness to take steps intended to improve performance. After reviewing those and related factors, the Trustees concluded, within the context of their overall conclusions regarding each of the Agreements, that the performance of each fund and Columbi a was sufficient, in light of other considerations, to warrant the continuation of the Agreements.
The costs of the services provided and profits realized by Columbia and its affiliates from their relationships with the funds. The Trustees considered the fees charged to the funds for advisory services as well as the total expense levels of the funds. That information included comparisons (provided both by management and by an independent third party) of the funds' advisory fees and total expense levels to those of their peer groups and information about the advisory fees charged by Columbia to comparable accounts. In considering the fees charged to comparable accounts, the Trustees took into account, among other things, management's representations about the differences between managing mutual funds as compared to other types of accounts, including the additional resources required to effectively manage mutual funds and distribute mutual fund share s. In evaluating each fund's advisory fees, the Trustees also took into account the demands, complexity and quality of the investment management of the fund. The Trustees considered reductions in advisory fee rates, implementation of advisory fee breakpoints, institution of advisory fee waivers, and changes to expense caps, which benefited a number of the funds. Furthermore, the Trustees considered the projected impact on expenses resulting from the overall cost reductions that management anticipated would result from the shift to a common group of service providers for transfer agency, fund accounting and custody services for mutual funds advised by Bank of America affiliates. The Trustees also noted management's stated justification for the fees charged to the funds, which included information about the performance of the funds, the services provided to the funds and management's view as to why it was appropriate that some funds bear advisory fees or total expenses greater than their peer group medians.
The Trustees also considered the compensation directly or indirectly received by Columbia and its affiliates from their relationships with the funds. The Trustees reviewed information provided by management as to the profitability to Columbia and its affiliates of their relationships with the funds, and information about the allocation of expenses used to calculate profitability. When reviewing profitability, the Trustees also considered court cases in which adviser profitability was an issue in whole or in part, the performance of the relevant funds, the expense levels of the funds, and whether Columbia had implemented breakpoints and/or expense caps with respect to the funds.
After reviewing those and related factors, the Trustees concluded, within the context of their overall conclusions regarding each of the Agreements, that the advisory fees charged to each of the funds were fair and reasonable, and that the costs of the advisory services generally, and the related profitability to Columbia and its affiliates of their relationships with the funds, supported the continuation of the Agreements.
24
Board Consideration and Approval of Investment Advisory Agreements (continued)
Economies of Scale. The Trustees considered the existence of any economies of scale in the provision of services by Columbia to each fund and whether those economies were shared with the fund through breakpoints in the investment advisory fees or other means, such as expense waivers. The Trustees noted that many of the funds benefited from breakpoints, expense caps, or both. In considering those issues, the Trustees also took note of the costs of the services provided (both on an absolute and a relative basis) and the profitability to Columbia and its affiliates of their relationships with the funds, as discussed above.
After reviewing those and related factors, the Trustees concluded, within the context of their overall conclusions regarding each of the Agreements, that the extent to which economies of scale were shared with the funds supported the continuation of the Agreements.
Other Factors. The Trustees also considered other factors, which included but were not limited to the following:
• the extent to which each fund had operated in accordance with its investment objective and its record of compliance with its investment restrictions, and the compliance programs of the funds and Columbia. They also considered the compliance-related resources that Columbia and its affiliates were providing to the funds.
• the nature, quality, cost and extent of administrative and shareholder services performed by Columbia and its affiliates, both under the Agreements and under separate agreements for the provision of transfer agency and administrative services.
• so-called "fall-out benefits" to Columbia, such as the engagement of its affiliates to provide distribution, brokerage and transfer agency services to the funds, and the benefits of research made available to Columbia by reason of brokerage commissions generated by the funds' securities transactions, as well as possible conflicts of interest associated with those fall-out and other benefits, and the reporting, disclosure and other processes in place to disclose and monitor those possible conflicts of interest.
• the draft report provided by the independent fee consultant, which included information about and analysis of the funds' fees, expenses and performance.
Based on their evaluation of all factors that they deemed to be material, including those factors described above, and assisted by the advice of independent counsel and the independent fee consultant, the Trustees, including the Independent Trustees, approved the continuance of each of the Agreements through October 31, 2006.
25
Summary of Management Fee Evaluation by Independent Fee Consultant
Prepared Pursuant to the February 9, 2005 Assurance of Discontinuance between the Office of
Attorney General of New York State and Columbia Management Advisors, Inc. and
Columbia Funds Distributor, Inc. October 11, 2005
I. Overview
Columbia Management Advisors, Inc. ("CMA") and Columbia Funds Distributors, Inc. ("CFD") (CFD together with CMA referred to herein as Columbia Management Group or "CMG1"), entered into an agreement with the New York Attorney General's Office in the form of an Assurance of Discontinuance (the "AOD"). The AOD stipulated that CMA would be permitted to manage or advise the Columbia Funds only if the Independent Members (as such term is defined in the AOD) of the Columbia Funds' Board of Trustees/Directors (collectively the "Trustees") appointed a Senior Officer or an Independent Fee Consultant ("IFC") who, among other things, is to manage the process by which management fees are negotiated. On May 15, 2005, the Independent Members of the Board appointed me as the IFC for the Columbia Funds. This report is the annual written evaluation of the Columbia Funds for 2005 that I have prepared in my capacity as IFC, as required b y the AOD.
A. Duties of the Independent Fee Consultant
As part of the AOD, the Independent Members of the Columbia Funds' Board of Trustees/Directors agreed to retain an independent fee consultant who was to participate in the management fee negotiation process. The IFC is charged with "... duties and responsibilities [that] include managing the process by which proposed management fees (including, but not limited to, advisory fees) to be charged the Columbia Fund[s] are negotiated so that they are negotiated in a manner which is at arms length and reasonable and consistent with this Assurance of Discontinuance." However, the IFC does not replace the Trustees in their role of negotiating management and other fees with CMG and its affiliates. In particular, the AOD states that "Columbia Advisors may manage or advise a Columbia Fund only if the reasonableness of the proposed management fees is determined by the Board of Trustees of the Columbia Fund using ... an annual independent written evaluation prepared by or under the direction of the ... Independent Fee Consultant...." This report, pursuant to the AOD, constitutes the "annual independent written evaluation prepared by or under the direction of the... Independent Fee Consultant."
The AOD requires the IFC report to consider at least the following:
a) Management fees (including any components thereof) charged by other mutual fund companies for like services;
b) Management fees (including any components thereof) charged to institutional and other clients of CMA for like services;
c) Costs to CMA and its affiliates of supplying services pursuant to the management fee agreements, excluding any intra-corporate profit;
d) Profit margins of CMA and its affiliates from supplying such services;
e) Possible economies of scale as the CMA fund grows larger; and
f) The nature and quality of CMA services, including Columbia Funds' performance.
This report is designed to assist the Board in evaluating the 2005 contract renewal for Columbia Funds. In addition, this report points out areas where the Board may deem additional information and analysis to be appropriate over time.
1 Prior to the date of this report, CMA merged into an affiliated entity, Banc of America Capital Management, LLC ("BACAP"), and BACAP then changed its name to Columbia Management Advisors, LLC which carries on the business of CMA, and CFD changed its name to Columbia Management Distributors, Inc.
26
Summary of Management Fee Evaluation by Independent Fee Consultant (continued)
B. Sources of Information Used in My Evaluation
I have requested data from CMG and various third party industry data sources or independent research companies that work in the mutual fund arena. The following list generally describes the types of information I requested.
1. I collected data on performance, management fees, and expense ratios of both Columbia Funds and comparable non-Columbia Funds. The sources of this information were CMG, Lipper Inc. ("Lipper") and Morningstar Inc. ("Morningstar"). While Lipper and Morningstar each selected a different group of peer funds it deemed appropriate against which to measure the relative performance and fees of Columbia Funds, I conducted an independent review of the appropriateness of each peer group.
2. I reviewed data on CMG's expense and profitability that I obtained from CMA directly.
3. I have reviewed data on the organizational structure of CMG in general.
4. I collected information on profitability from Strategic Insight Mutual Fund Research and Consulting, LLC ("Strategic Insight"). I used this third-party independent research as an additional method to gauge the accuracy of the data collected in (2) above.
5. I conducted interviews with various CMG staff, including members of the senior management team, legal staff, heads of affiliates, portfolio managers, and financial personnel.
6. I reviewed current 2005 Section 15(c) material provided to the Board and material presented to the Board in the 2004 fee and performance evaluation.
7. I have reviewed various academic research papers, industry publications, and other available literature dealing with mutual fund operations, profitability, and other issues. In addition, I have reviewed SEC releases and studies of mutual fund expenses.
8. I have reviewed documents pertaining to recent mutual fund litigation in general and publicly available information about litigation where CMG has been involved.
In addition, I have engaged NERA Economic Consulting ("NERA") and independent consultant Dr. John Rea to assist me in data management and analysis. Both NERA and Dr. Rea have extensive experience in the mutual fund industry through consulting, government positions, or industry trade groups that provide unique insights and special knowledge pertaining to my independent analysis of fees, performance, and profitability. I have also retained Shearman & Sterling LLP as outside counsel to advise me in connection with my review.
C. Qualifications and Independence
I am the Walter H. Carpenter Chair and Professor of Finance at Babson College. Before this I was the Chief Economist of the U.S. Securities and Exchange Commission. I have no material relationship with Bank of America or CMG aside from acting as IFC, and am aware of no relationship with any of their affiliates.
[Resume omitted]
II. Evaluation of the general process used to negotiate the advisory contract
A. General Considerations
My analysis considered all factors and information I reviewed on the finances and operations of Columbia Funds. I gave each factor an appropriate weight in my overall findings, and no single factor was in itself the sole criterion for a finding or conclusion. My objective was to assess all of the information provided and conduct a robust evaluation of Columbia Funds' operations, fees, and performance.
My analysis and thought processes will and, I believe, should, differ in certain ways from the processes used by Trustees in their evaluation of the management agreements. In particular, because of my technical and quantitative background, I may use techniques and data that Trustees have not previously felt would be useful. I view this supplemental analysis as appropriate because my role is to assist Trustees in their decisions, and to the extent that I bring new ideas or analysis to the evaluation, I believe this improves the process by which management fees for the Columbia Funds may be negotiated in accordance with the AOD.
27
Summary of Management Fee Evaluation by Independent Fee Consultant (continued)
Finally, as part of my role as IFC, I have, from time to time, sent to Trustees additional papers and reports produced by third parties that I felt had bearing on the fee negotiation process. I viewed these materials as educational in nature and felt they would aid Trustees in placing their work in context.
B. CMG Management Interviews
As a starting point of my analysis, I have met with members of CMG staff to gain an understanding of the organizational structure and personnel involved in running the Columbia fund family.
I have had general discussions and have received information about the management structure of CMG. My conversations with management have been informative. In addition, I have participated in Board meetings where Trustees and management have discussed issues relating to management agreements and performance of Columbia Funds. When I felt it was appropriate, I added my opinions on particular matters, such as fund performance or fee levels, to the discussion.
C. Trustees' Fee and Performance Evaluation Process
After making initial requests for information, members of the Trustees of the Columbia Funds met in advance of the October Section 15(c) contract approval meeting to review certain fee, performance and other data for the Columbia Funds and to ask questions and make requests of management. Trustees have developed a process to evaluate the fee and expense levels and performance of Columbia Funds. This process is used to highlight those funds that have been performing poorly, may have had higher management fees or expense ratios, or both.
The process involves providing instructions to Lipper to prepare specific data analyses tailored to the Trustees review framework. These instructions include highlighting funds that hit one or more fee performance "screens." The six screens the Trustees use are as follows:
a. 5th Lipper quintile in actual management fee;
b. 5th Lipper quintile in total expense ratio;
c. Three or more 5th Lipper quintile rankings in the 1-, 3-, 5- or 10-year performance rankings;
d. Sum of the Lipper Quintile Rank (1-year performance) and the Lipper Quintile Rank (actual management fee) totals a number equal to or higher than 8;
e. Sum of the Lipper Quintile Rank (1-year performance) and the Lipper Quintile Rank (total expense ratio) totals a number equal to or higher than 8; and
f. Sum of the Lipper Quintile Rank (3-year performance) and the Lipper Quintile Rank (total expense ratio) totals a number equal to or higher than 8.
If a fund hits one or more of these screens, it is highlighted for additional review by the Trustees. This method is only used as an aid for Trustees to highlight funds and is not the sole test of whether the Board will determine to take particular actions concerning fees or performance. Funds that have not been flagged by this screen also may be singled out for fee and performance reasons, and the Trustees may determine not to take action with respect to the fees or performance of funds that have been flagged by the screen. These screens contribute to the basis for discussions on Trustees' views on the Columbia Funds.
III. FINDINGS
My findings based on my work as IFC are as follows:
1. The Trustees have the relevant information necessary to form an opinion on the reasonableness of fees and evaluate the performance of the Columbia Funds. The process the Trustees used in preparing to reach their determination has been open and informative. In my view, the 2005 process by which the management fees of the Columbia Funds have been negotiated thus far has been, to the extent practicable, at arm's length and reasonable and consistent with the AOD.
28
Summary of Management Fee Evaluation by Independent Fee Consultant (continued)
2. Columbia Funds demonstrated a range of performance relative to their peers. I find that across the fund complex, 54.26 percent of Columbia Funds have performance higher than the median of their respective Lipper performance universe, and 42.55 percent of Columbia Funds have performance higher than the median of their respective Lipper performance group. In addition, Lipper performance universe and group comparison showed that Columbia Funds were distributed roughly evenly across these quintiles. The Trustees have worked with management to address issues of funds that have demonstrated consistent or significant underperformance.
3. Columbia Funds demonstrate a range of management fees and expense ratios relative to their peers. I find that across the fund complex, 58.51 percent of Columbia Funds have expenses below the median of their Lipper expense universe, and 53.19 percent of Columbia Funds have expenses below the median of their Lipper expense group. In addition, Lipper expense universe and group comparisons show that Columbia Funds are distributed roughly evenly across these quintiles. The Trustees have taken steps to limit shareholder expenses for certain funds having management fees significantly above their peers, often though the use of fee waivers to which CMG has agreed. Consolidation of various funds and fund families managed by CMG has resulted in substantial savings in non-advisory expenses.
4. Profitability to CMG of the individual funds ranges widely, but the overall profitability to CMG of its relationship with the Columbia Funds appears to fall within a reasonable range. The method of cost allocation to funds is addressed in the material provided by CMG to the Trustees, but additional information may be necessary to make a judgment on fund level profitability. My review of profitability and cost allocation is ongoing, and I plan to continue to develop my views with regard to fund level profitability.
5. Columbia Funds have instituted fee schedules with breakpoints designed to enable investors to benefit from fund economies of scale, although 71% of the funds have not yet reached their first breakpoint. My analysis of the appropriateness of the breakpoint levels, which I expect will take into account the cost and profitability of the individual funds, is ongoing.
My work is ongoing and my views may develop over time in light of new information and analysis.
Respectfully submitted,
Erik R. Sirri
29
CMG FUND TRUST
1300 S.W. SIXTH AVENUE, PORTLAND, OREGON 97201
- INVESTMENT ADVISOR -
COLUMBIA MANAGEMENT ADVISORS, LLC
100 FEDERAL STREET
BOSTON, MASSACHUSETTS 02110-2624
- LEGAL COUNSEL -
ROPES & GRAY LLP
ONE INTERNATIONAL PLACE
BOSTON, MA 02110-2624
- TRANSFER AGENT -
COLUMBIA MANAGEMENT SERVICES, INC.
P.O. BOX 8081
BOSTON, MASSACHUSETTS 02266-8081
SHC-44/106106-0106 (03/06) 06/10062
A description of the fund's proxy voting policies and procedures is available (i) on the fund's website, www.columbiamanagement.com; (ii) on the Securities and Exchange Commission's website at www.sec.gov, and (iii) without charge, upon request, by calling 800-368-0346. Information regarding how the fund voted proxies relating to portfolio securities during the 12-month period ended June 30 is available from the SEC's website. Information regarding how the fund voted proxies relating to portfolio securities is also available from the fund's website.
The fund files a complete schedule of portfolio holdings with the SEC for the first and third quarters of each fiscal year on Form N-Q. The fund's Form N-Q is available on the SEC's website at www.sec.gov and may be reviewed and copied at the SEC's Public Reference Room in Washington, D.C. Information on the operation of the Public Reference Room may be obtained by calling 1-800-SEC-0330.
The CMG funds are offered by prospectus through Columbia Management Distributors, Inc. Please consider the investment objectives, risks, charges and expenses of a mutual fund carefully before investing. Contact your Columbia Management representative or visit www.columbiamanagement.com for a prospectus, which contains this and other important information about the fund. Read it carefully before you invest.
Fund distributed by Columbia Management Distributors, Inc., One Financial Center, Boston, Massachusetts 02111-2621
![]()
CMG STRATEGIC EQUITY FUND
A PORTFOLIO OF CMG FUND TRUST
Semiannual Report
January 31, 2006
Advised by Columbia Management Advisors, LLC.
Not FDIC
Insured
May Lose Value
No Bank Guarantee
Columbia Management is the primary investment management division of Bank of America Corporation. Columbia Management entities furnish investment management services and advise institutional and mutual fund portfolios. CMG Funds are distributed by Columbia Management Distributors, Inc., member of NASD, SIPC, part of Columbia Management and an affiliate of Bank of America Corporation.
Columbia Management Advisors, Inc. combined with Banc of America Capital Management, LLC on September 30, 2005. At that time, the newly combined advisor underwent a name change to Columbia Management Advisors, LLC and continues to operate as a SEC-registered investment advisor, wholly owned subsidiary of Bank of America, N.A. and is part of Columbia Management.
The views expressed in the portfolio commentary reflect the current views of the Portfolio Manager. These views are not guarantees of future performance and involve certain risks, uncertainties and assumptions that are difficult to predict so actual outcomes and results may differ significantly from the views expressed. These views are subject to change at any time based upon economic, market or other conditions and the Portfolio Manager disclaims any responsibility to update such views. These views may not be relied on as investment advice and, because investment decisions for a CMG Fund are based on numerous factors, may not be relied on as an indication of trading intent on behalf of any particular CMG Fund. References to specific company securities should not be construed as a recommendation or investment advice.
Performance data quoted represents past performance and current performance may be lower or higher. Past performance is no guarantee of future results. The investment return and principal value will fluctuate so that shares, when redeemed, may be worth more or less than the original cost. Please visit www.columbiamanagement.com for daily and most recent month-end performance updates.
CMG STRATEGIC EQUITY FUND
A Portfolio of CMG Fund Trust
MANAGEMENT DISCUSSION OF FUND PERFORMANCE
CMG Strategic Equity Fund returned 8.23% for the six-month period ended January 31, 2006. The fund performed better than the S&P 500 Index1 and the Morningstar Large Blend Category average2, which returned 4.68% and 5.78%, respectively. Shrewd stock picking—particularly in the information technology, financial and industrials sectors—resulted in the fund's solid performance during the period.
The financial sector was an area of relative strength for the fund. The portfolio's financial holdings in the Japanese market were particular standouts. Mizuho Financial Group, Inc. made the most significant positive impact in the sector, followed by Mitsubishi UFJ Financial Group, Inc., Mitsubishi Estate Co., Ltd. and Nomura Holdings, Inc.3 On the domestic front, Lazard Ltd. and Morgan Stanley made steady gains throughout the period.
The information technology sector proved to be another area of relative strength. Advanced Micro Devices, Inc. gained 108% in the period and helped performance, while Samsung Electronics Co., Ltd. was the sector's strongest contributor. Palm, Inc. and Corning, Inc. also made sizable contributions to the portfolio's return. Disappointments included Tandberg ASA and Plantronics, Inc., which were sold from the portfolio during the period.
In recent periods, the fund has benefited from targeting companies positioned to benefit from a strong commodities market. In the industrials sector, Hitachi Construction Machinery Co., Ltd. and Caterpillar, Inc. advanced during the reporting period. However, in the materials sector, several stocks performed worse than expected. The largest detractor was a previous performance leader: Potash Corp. of Saskatchewan, Inc.
The fund benefited from exposure to the energy sector, where its stocks performed better than the index. Oil service and offshore exploration holdings were particularly strong. Schlumberger Ltd., an oilfield services company, was the top contributor in the sector, followed by Transocean, Inc. and TGS Nopec Geophysical Co. Alpha Natural Resources, Inc., a coal producer, was a disappointment, and we eliminated this stock from the portfolio.
The fund experienced weakness in the consumer discretionary and consumer staples sectors, both of which declined during the period. In the consumer discretionary sector, tire manufacturer Nokian Renkaat Oyj slipped and detracted from returns, as did Media General, Inc. and Kohl's Corp. One bright spot in this sector was Finnish retailer Stockmann Oyj Abp. In the consumer staples sector, Walgreen Co., Wrigley (Wm.) Jr. Co. and Wal-Mart Stores, Inc. were disappointments and had a negative impact on fund performance. However, Altria Group, Inc. was a standout performer among consumer staples stocks.
At present, we believe that recent interest-rate increases could result in some slowing in the economy in 2006. As this economic cycle matures, we are currently seeking companies with less sensitivity to the economic cycles and an ability to maintain stable growth. In addition, we
1
will continue to evaluate investment opportunities overseas, considering areas with compelling growth trends and reasonable prices.
The fund's top ten holdings (as a percentage of net assets) as of January 31, 2006 were (%):
| Samsung Electronics Co., Ltd. | 2.2 | ||||||
| Schlumberger Ltd. | 1.8 | ||||||
| Exxon Mobil Corp. | 1.7 | ||||||
| Mizuho Financial Group, Inc. | 1.6 | ||||||
| Wal-Mart Stores, Inc. | 1.5 | ||||||
| General Electric Co. | 1.5 | ||||||
| Berkshire Hathaway, Inc. | 1.4 | ||||||
| Microsoft Corp. | 1.4 | ||||||
| Transocean, Inc. | 1.2 | ||||||
| Coca-Cola Co. | 1.2 | ||||||
We appreciate your continued confidence in CMG Strategic Equity Fund.
Emil A. Gjester has managed or co-managed the fund since January 2004 and has been with the advisor or its predecessors or affiliate organizations since 1996.

Equity investments are affected by stock market fluctuations that occur in response to economic and business developments.
International investing may involve certain risks, including foreign taxation, currency fluctuations, risks associated with possible differences in financial standards and other monetary and political risks.
Holdings are calculated as a percentage of net assets, and are subject to change. Because the fund is actively managed, there is no guarantee the fund will continue to maintain the holdings breakdown listed. The fund's holdings and their weighting within the portfolio may change as market conditions change.
1 The Standard & Poor's (S&P) 500 Index tracks the performance of 500 widely held, large-capitalization US stocks. Unlike the fund, indices are not investments, do not incur fees or expenses and are not professionally managed. It is not possible to invest directly in an index. Securities in the fund may not match those in an index.
2 ©2006 by Morningstar, Inc. All rights reserved. The information contained herein is the proprietary information of Morningstar, Inc., may not be copied or redistributed for any purpose and may only be used for noncommercial, personal purposes. The information contained herein is not represented or warranted to be accurate, correct, complete or timely. Morningstar, Inc. shall not be responsible for investment decisions, damages or other losses resulting from the use of this information. Past performance is no guarantee of future performance. Morningstar, Inc. has not granted consent for it to be considered or deemed an "expert" under the Securities Act of 1933.
Morningstar Categories compare the performance of funds with similar investment objectives and strategies.
3 Holdings are disclosed as a percentage of net assets on January 31, 2006, and are subject to change: Mizuho Financial Group, Inc. (1.6%), Mitsubishi UFJ Financial Group, Inc. (1.0%), Mitsubishi Estate Co., Ltd. (0.4%), Nomura Holdings, Inc. (0.6%), Lazard Ltd. (0.5%), Morgan Stanley (1.1%), Advanced Micro Devices, Inc. (0.6%), Samsung Electronics Co., Ltd. (2.2%), Palm, Inc. (0.9%), Corning, Inc. (0.7%), Hitachi Construction Machinery Co., Ltd. (0.7%), Caterpillar, Inc. (0.8%), Potash Corp. of Saskatchewan, Inc. (0.7%), Schlumberger Ltd. (1.8%), Transocean, Inc. (1.2%), TGS Nopec Geophysical Co. (0.5%), Nokian Renkaat Oyj (0.2%), Media General, Inc. (0.3%), Kohl's Corp. (0.6%), Stockmann Oyj Abp (0.9%), Walgreen Co. (1.1%), Wrigley (Wm.) Jr. Co. (1.0%), Wal-Mart Stores, Inc. (1.5%) and Altria Group, Inc. (1.1%).
2
Average annual total return as of January 31, 2006 (%)
| Inception | 6-month (cumulative) | 1-year | Life | ||||||||||||||||
| CMG Strategic Equity Fund | 10/09/01 | 8.23 | 14.95 | 14.46 | |||||||||||||||
| S&P 500 Index | 4.68 | 10.38 | 6.36 | ||||||||||||||||
Average annual total return as of December 31, 2005 (%)
| Inception | 6-month (cumulative) | 1-year | Life | ||||||||||||||||
| CMG Strategic Equity Fund | 10/09/01 | 8.39 | 7.87 | 13.72 | |||||||||||||||
| S&P 500 Index | 5.77 | 4.91 | 5.83 | ||||||||||||||||
Performance data quoted represents past performance and current performance may be lower or higher. Past performance is no guarantee of future results. The investment return and principal value will fluctuate so that shares, when redeemed, may be worth more or less than the original cost. Please visit www.columbiamanagement.com for daily and most recent month-end performance updates.
Performance results may reflect any voluntary waivers or reimbursement of fund expenses by the advisor or its affiliates. Absent these waivers or reimbursement arrangements, performance results would have been lower. All results shown assume reinvestment of distributions.
Growth of a $10,000 investment, October 9, 2001 to January 31, 2006
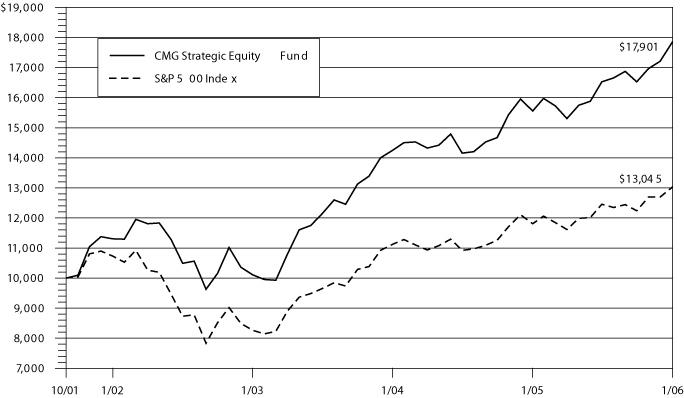
The chart above shows the growth in value of a hypothetical $10,000 investment in the fund compared to the index during the period, and does not reflect the deduction of taxes that a shareholder would pay on fund distributions or the redemption of fund shares.
Index performance is from October 9, 2001.
The Standard & Poor's (S&P) 500 Index tracks the performance of 500 widely held, large-capitalization US stocks. Unlike the fund, indices are not investments, they do not incur fees or expenses and are not professionally managed. It is not possible to invest directly in an index. Securities in the fund may not match those in an index.
3
UNDERSTANDING YOUR EXPENSES – CMG Strategic Equity Fund
As a fund shareholder, you incur two types of costs. There are transaction costs and also ongoing costs, which generally include investment advisory fees and other fund expenses. The information on this page is intended to help you understand your ongoing costs of investing in the fund and to compare these costs with the ongoing costs of investing in other mutual funds.
Analyzing your fund's expenses
To illustrate these ongoing costs, we have provided an example and calculated the expenses paid by investors during the reporting period. The information in the following table is based on an initial investment of $1,000, which is invested at the beginning of the reporting period and held for the entire period. Expense information is calculated two ways and each method provides you with different information. The amount listed in the "actual" column is calculated using the fund's actual operating expenses and total return for the period. The amount listed in the "hypothetical" column assumes that the return each year is 5% before expenses and includes the fund's actual expense ratio. You should not use the hypothetical account values and expenses to estimate either your actual account balance at the end of the period or the expenses you paid during this reporting period.
Estimating your actual expenses
To estimate the expenses that you paid over the period, first you will need your account balance at the end of the period:
1. Divide your ending account balance by $1,000. For example, if an account balance was $8,600 at the end of the period, the result would be 8.6.
2. In the section of the table below titled "Expenses paid during the period," locate the amount under "actual." Multiply this number by the result from step 1. Your answer is an estimate of the expenses you paid on your account during the period.
August 1, 2005 — January 31, 2006
| Account value at the beginning of the period ($) | Account value at the end of the period ($) | Expenses paid during the period ($) | Fund's annualized expense ratio (%) | ||||||||||||||||||||||||
| Actual | Hypothetical | Actual | Hypothetical | Actual | Hypothetical | ||||||||||||||||||||||
| 1,000.00 | 1,000.00 | 1,082.27 | 1,023.19 | 2.10 | 2.04 | 0.40 | |||||||||||||||||||||
Expenses paid during the period are equal to the annualized expense ratio of 0.40%, multiplied by the average account value over the period, then multiplied by the number of days in the fund's most recent fiscal half-year and divided by 365.
Had the Investment Advisor and/or Transfer Agent not reimbursed a portion of expenses, total return would have been reduced.
It is important to note that the expense amounts shown in the table are meant to highlight only ongoing costs of investing in the fund and do not reflect any transaction costs, such as sales charges, redemption or exchange fees. Therefore, the hypothetical examples provided may not help you determine the relative total costs of owning shares of different funds. If these transaction costs were included, your costs would have been higher.
Compare with other funds
Since all mutual funds are required to include the same hypothetical calculations about expenses in shareholder reports, you can use this information to compare the ongoing cost of investing in the fund with other funds. To do so, compare the 5% hypothetical example with the 5% hypothetical examples that appear in the shareholder reports of other funds. As you compare hypothetical examples of other funds, it is important to note that hypothetical examples are meant to highlight the continuing costs of investing in a fund and do not reflect any transaction costs, such as sales charges or redemption or exchange fees.
4
CMG STRATEGIC EQUITY FUND
A Portfolio of CMG Fund Trust
FINANCIAL HIGHLIGHTS
(For a Fund Share Outstanding Throughout Each Period)
| (Unaudited) Six Months Ended January 31, | Year Ended July 31, | Period Ended July 31, | Year Ended October 31, | Period Ended October 31, | |||||||||||||||||||||||
| 2006 | 2005 | 2004 | 2003 (a) | 2002 | 2001 (b) | ||||||||||||||||||||||
| Net asset value, beginning of period | $ | 15.22 | $ | 13.80 | $ | 12.06 | $ | 10.14 | $ | 10.10 | $ | 10.00 | |||||||||||||||
| Income from investment operations: | |||||||||||||||||||||||||||
| Net investment income | 0.08 | (c) | 0.19 | (c)(d) | 0.12 | (c) | 0.10 | (c) | 0.11 | (c) | - | (e) | |||||||||||||||
| Net realized and unrealized gain (loss) on investments and foreign currency | 1.00 | 2.09 | 1.87 | 1.88 | (0.05 | ) | 0.10 | ||||||||||||||||||||
| Total from investment operations | 1.08 | 2.28 | 1.99 | 1.98 | 0.06 | 0.10 | |||||||||||||||||||||
| Less distributions declared to shareholders: | |||||||||||||||||||||||||||
| From net investment income | (0.57 | ) | (0.14 | ) | (0.09 | ) | (0.06 | ) | (0.02 | ) | - | ||||||||||||||||
| From net realized gains | (4.41 | ) | (0.72 | ) | (0.16 | ) | - | - | - | ||||||||||||||||||
| Total distributions declared to shareholders | (4.98 | ) | (0.86 | ) | (0.25 | ) | (0.06 | ) | (0.02 | ) | - | ||||||||||||||||
| Net asset value, end of period | $ | 11.32 | $ | 15.22 | $ | 13.80 | $ | 12.06 | $ | 10.14 | $ | 10.10 | |||||||||||||||
| Total return (f)(g) | 8.23 | %(h) | 16.77 | % | 16.58 | % | 19.66 | %(h) | 0.53 | % | 1.00 | %(h) | |||||||||||||||
| Ratios/Supplemental data: | |||||||||||||||||||||||||||
| Net assets, end of period (000's) | $ | 183,346 | $ | 755,860 | $ | 618,714 | $ | 370,620 | $ | 188,179 | $ | 36,942 | |||||||||||||||
| Ratio of net expenses to average net assets (i) | 0.40 | %(j) | 0.40 | % | 0.40 | % | 0.40 | %(j) | 0.40 | % | 0.40 | %(j) | |||||||||||||||
| Ratio of net investment income to average net assets (i) | 1.07 | %(j) | 1.31 | % | 0.88 | % | 1.22 | %(j) | 1.01 | % | 0.04 | %(j) | |||||||||||||||
| Waiver/reimbursement | 0.06 | %(j) | 0.03 | % | 0.05 | % | 0.05 | %(j) | 0.07 | % | 0.80 | %(j) | |||||||||||||||
| Portfolio turnover rate | 19 | %(h) | 64 | % | 81 | % | 78 | %(h) | 172 | % | 14 | %(h) | |||||||||||||||
(a) The Fund changed its fiscal year end from October 31 to July 31.
(b) The Fund commenced investment operations on October 9, 2001. Per share data, total return and portfolio turnover rate reflect activity from that date.
(c) Per share data was calculated using average shares outstanding during the period.
(d) Net investment income per share reflects a special dividend. The effect of this dividend amount to $0.02 per share.
(e) Rounds to less than $0.01 per share.
(f) Total return at net asset value assuming all distributions reinvested.
(g) Had the Investment Advisor and or Transfer Agent not waived or reimbursed a portion of expenses, total return would have been reduced.
(h) Not annualized.
(i) The benefits derived from custody credits had an impact of less than 0.01%.
(j) Annualized.
See Accompanying Notes to Financial Statements.
5
CMG STRATEGIC EQUITY FUND
A Portfolio of CMG Fund Trust
SCHEDULE OF INVESTMENTS
January 31, 2006 (Unaudited)
| Shares | Value | ||||||||||
| Common Stocks (96.1%) | |||||||||||
| Consumer Discretionary (8.2%) | |||||||||||
| Auto Components (0.2%) | |||||||||||
| Nokian Renkaat Oyj | 22,690 | $ | 350,713 | ||||||||
| Hotels, Restaurants & Leisure (0.7%) | |||||||||||
| Yum! Brands, Inc. | 24,800 | 1,226,856 | |||||||||
| Internet & Catalog Retail (0.2%) | |||||||||||
| IAC/InterActiveCorp (a) | 14,370 | 417,017 | |||||||||
| Media (2.9%) | |||||||||||
| Cablevision Systems Corp. (a) | 22,440 | 552,024 | |||||||||
| CBS Corp. | 14,135 | 369,347 | |||||||||
| Comcast Corp., Class A (a) | 46,490 | 1,288,703 | |||||||||
| Media General, Inc., Class A | 12,660 | 605,781 | |||||||||
| News Corp., Class A | 47,548 | 749,356 | |||||||||
| Time Warner, Inc. | 70,330 | 1,232,885 | |||||||||
| Viacom, Inc., Class B (a) | 14,135 | 586,320 | |||||||||
| 5,384,416 | |||||||||||
| Multiline Retail (2.2%) | |||||||||||
| Federated Department Stores, Inc. | 9,128 | 608,199 | |||||||||
| Kohl's Corp. (a) | 23,770 | 1,055,150 | |||||||||
| Saks, Inc. (a) | 34,270 | 661,754 | |||||||||
| Stockmann Oyj Abp, Class B | 37,430 | 1,593,726 | |||||||||
| 3,918,829 | |||||||||||
| Specialty Retail (1.3%) | |||||||||||
| Bed Bath & Beyond, Inc. (a) | 22,000 | 823,020 | |||||||||
| Gap, Inc. | 33,880 | 612,889 | |||||||||
| Home Depot, Inc. | 6,710 | 272,091 | |||||||||
| TJX Companies, Inc. | 28,340 | 723,520 | |||||||||
| 2,431,520 | |||||||||||
| Textiles, Apparel & Luxury Goods (0.7%) | |||||||||||
| NIKE, Inc., Class B | 15,520 | 1,256,344 | |||||||||
| 14,985,695 | |||||||||||
| Consumer Staples (11.0%) | |||||||||||
| Beverages (1.7%) | |||||||||||
| Coca-Cola Co. | 52,930 | 2,190,243 | |||||||||
| PepsiCo, Inc. | 17,510 | 1,001,222 | |||||||||
| 3,191,465 | |||||||||||
| Food & Staples Retailing (3.1%) | |||||||||||
| United Natural Foods, Inc. (a) | 26,500 | 856,745 | |||||||||
See Accompanying Notes to Financial Statements.
6
CMG STRATEGIC EQUITY FUND
A Portfolio of CMG Fund Trust
SCHEDULE OF INVESTMENTS
| Shares | Value | ||||||||||
| Common Stocks (continued) | |||||||||||
| Food & Staples Retailing (continued) | |||||||||||
| Wal-Mart Stores, Inc. | 61,080 | $ | 2,816,399 | ||||||||
| Walgreen Co. | 48,370 | 2,093,454 | |||||||||
| 5,766,598 | |||||||||||
| Food Products (3.6%) | |||||||||||
| ConAgra Foods, Inc. | 20,610 | 427,245 | |||||||||
| General Mills, Inc. | 13,790 | 670,332 | |||||||||
| Nestle SA, Registered Shares | 7,140 | 2,094,333 | |||||||||
| Unilever NV, NY Registered Shares | 21,930 | 1,539,486 | |||||||||
| Wrigley (Wm.) Jr. Co. | 28,230 | 1,805,591 | |||||||||
| 6,536,987 | |||||||||||
| Household Products (1.1%) | |||||||||||
| Procter & Gamble Co. | 35,400 | 2,096,742 | |||||||||
| Personal Products (0.3%) | |||||||||||
| Avon Products, Inc. | 17,550 | 497,016 | |||||||||
| Tobacco (1.2%) | |||||||||||
| Altria Group, Inc. | 29,110 | 2,105,817 | |||||||||
| 20,194,625 | |||||||||||
| Energy (10.6%) | |||||||||||
| Energy Equipment & Services (5.1%) | |||||||||||
| Cooper Cameron Corp. (a) | 25,140 | 1,216,525 | |||||||||
| Dril-Quip, Inc. (a) | 9,400 | 591,918 | |||||||||
| Schlumberger Ltd. | 25,890 | 3,299,680 | |||||||||
| TGS Nopec Geophysical Co., ASA (a) | 16,800 | 873,764 | |||||||||
| Transocean, Inc. (a) | 27,230 | 2,209,715 | |||||||||
| Willbros Group, Inc. (a) | 53,140 | 1,089,370 | |||||||||
| 9,280,972 | |||||||||||
| Oil, Gas & Consumable Fuels (5.5%) | |||||||||||
| BP PLC, ADR | 16,590 | 1,199,623 | |||||||||
| Chevron Corp. | 21,000 | 1,246,980 | |||||||||
| ConocoPhillips | 24,570 | 1,589,679 | |||||||||
| Exxon Mobil Corp. | 50,750 | 3,184,562 | |||||||||
| Newfield Exploration Co. (a) | 40,600 | 2,127,440 | |||||||||
| Williams Companies, Inc. | 34,820 | 830,109 | |||||||||
| 10,178,393 | |||||||||||
| 19,459,365 | |||||||||||
| Financials (16.5%) | |||||||||||
| Capital Markets (3.0%) | |||||||||||
| Ameriprise Financial, Inc. | 17,600 | 716,144 | |||||||||
| Charles Schwab Corp. | 52,250 | 772,778 | |||||||||
See Accompanying Notes to Financial Statements.
7
CMG STRATEGIC EQUITY FUND
A Portfolio of CMG Fund Trust
SCHEDULE OF INVESTMENTS
| Shares | Value | ||||||||||
| Common Stocks (continued) | |||||||||||
| Capital Markets (continued) | |||||||||||
| Lazard Ltd., Class A | 25,840 | $ | 926,622 | ||||||||
| Morgan Stanley | 32,330 | 1,986,679 | |||||||||
| Nomura Holdings, Inc., ADR | 52,620 | 1,026,616 | |||||||||
| 5,428,839 | |||||||||||
| Commercial Banks (5.4%) | |||||||||||
| HSBC Holdings PLC, ADR | 14,840 | 1,234,391 | |||||||||
| ICICI Bank Ltd., ADR | 32,000 | 1,005,440 | |||||||||
| Mitsubishi UFJ Financial Group, Inc., ADR | 130,840 | 1,890,638 | |||||||||
| Mizuho Financial Group, Inc. | 360 | 2,946,166 | |||||||||
| Raiffeisen International Bank Holding AG (a) | 10,600 | 766,910 | |||||||||
| SunTrust Banks, Inc. | 11,500 | 821,675 | |||||||||
| U.S. Bancorp | 25,240 | 754,928 | |||||||||
| Wachovia Corp. | 7,130 | 390,938 | |||||||||
| 9,811,086 | |||||||||||
| Consumer Finance (1.5%) | |||||||||||
| American Express Co. | 26,600 | 1,395,170 | |||||||||
| SLM Corp. | 23,500 | 1,315,060 | |||||||||
| 2,710,230 | |||||||||||
| Diversified Financial Services (2.0%) | |||||||||||
| Citigroup, Inc. | 36,013 | 1,677,486 | |||||||||
| JPMorgan Chase & Co. | 51,386 | 2,042,593 | |||||||||
| 3,720,079 | |||||||||||
| Insurance (4.2%) | |||||||||||
| American International Group, Inc. | 25,504 | 1,669,492 | |||||||||
| Berkshire Hathaway, Inc., Class B (a) | 880 | 2,580,160 | |||||||||
| Chubb Corp. | 7,100 | 669,885 | |||||||||
| Hannover Rueckversicherung AG, Registered Shares | 32,570 | 1,230,066 | |||||||||
| Marsh & McLennan Companies, Inc. | 13,810 | 419,686 | |||||||||
| St. Paul Travelers Companies, Inc. | 25,400 | 1,152,652 | |||||||||
| 7,721,941 | |||||||||||
| Real Estate (0.4%) | |||||||||||
| Mitsubishi Estate Co., Ltd. | 34,870 | 810,032 | |||||||||
| 30,202,207 | |||||||||||
| Health Care (15.2%) | |||||||||||
| Biotechnology (2.7%) | |||||||||||
| Amgen, Inc. (a) | 17,760 | 1,294,526 | |||||||||
| Applera Corp. - Applied Biosystems Group | 43,520 | 1,233,357 | |||||||||
| Biogen Idec, Inc. (a) | 31,390 | 1,404,703 | |||||||||
| MedImmune, Inc. (a) | 16,680 | 569,122 | |||||||||
| Qiagen NV (a) | 34,410 | 407,414 | |||||||||
| 4,909,122 | |||||||||||
See Accompanying Notes to Financial Statements.
8
CMG STRATEGIC EQUITY FUND
A Portfolio of CMG Fund Trust
SCHEDULE OF INVESTMENTS
| Shares | Value | ||||||||||
| Common Stocks (continued) | |||||||||||
| Health Care Equipment & Supplies (4.7%) | |||||||||||
| Alcon, Inc. | 7,130 | $ | 912,070 | ||||||||
| Baxter International, Inc. | 42,000 | 1,547,700 | |||||||||
| Dentsply International, Inc. | 9,940 | 533,778 | |||||||||
| Hospira, Inc. (a) | 40,710 | 1,821,772 | |||||||||
| Medtronic, Inc. | 35,840 | 2,023,885 | |||||||||
| Viasys Healthcare, Inc. (a) | 21,010 | 595,003 | |||||||||
| Zimmer Holdings, Inc. (a) | 16,350 | 1,127,332 | |||||||||
| 8,561,540 | |||||||||||
| Health Care Providers & Services (2.9%) | |||||||||||
| Community Health Systems, Inc. (a) | 27,190 | 989,444 | |||||||||
| Henry Schein, Inc. (a) | 15,590 | 727,118 | |||||||||
| LifePoint Hospitals, Inc. (a) | 25,000 | 771,250 | |||||||||
| McKesson Corp. | 27,000 | 1,431,000 | |||||||||
| Omnicare, Inc. | 13,960 | 693,812 | |||||||||
| Patterson Companies, Inc. (a) | 22,530 | 777,961 | |||||||||
| 5,390,585 | |||||||||||
| Pharmaceuticals (4.9%) | |||||||||||
| Abbott Laboratories | 21,140 | 912,191 | |||||||||
| Andrx Corp. (a) | 43,400 | 761,670 | |||||||||
| Gedeon Richter Ltd. | 3,720 | 778,069 | |||||||||
| Johnson & Johnson | 34,030 | 1,958,086 | |||||||||
| Novartis AG, ADR | 26,480 | 1,460,637 | |||||||||
| Novo-Nordisk A/S, Class B | 10,680 | 598,110 | |||||||||
| Pfizer, Inc. | 24,580 | 631,214 | |||||||||
| Sanofi-Aventis, ADR | 11,600 | 533,600 | |||||||||
| Valeant Pharmaceuticals International | 34,380 | 617,465 | |||||||||
| Wyeth | 16,500 | 763,125 | |||||||||
| 9,014,167 | |||||||||||
| 27,875,414 | |||||||||||
| Industrials (8.9%) | |||||||||||
| Air Freight & Logistics (1.6%) | |||||||||||
| United Parcel Service, Inc., Class B | 26,740 | 2,003,094 | |||||||||
| Yamato Transport Co., Ltd. | 56,310 | 972,062 | |||||||||
| 2,975,156 | |||||||||||
| Commercial Services & Supplies (0.9%) | |||||||||||
| Avery Dennison Corp. | 16,890 | 1,009,008 | |||||||||
| ChoicePoint, Inc. (a) | 13,840 | 569,101 | |||||||||
| 1,578,109 | |||||||||||
| Electrical Equipment (0.4%) | |||||||||||
| Thomas & Betts Corp. (a) | 18,000 | 803,700 | |||||||||
See Accompanying Notes to Financial Statements.
9
CMG STRATEGIC EQUITY FUND
A Portfolio of CMG Fund Trust
SCHEDULE OF INVESTMENTS
| Shares | Value | ||||||||||
| Common Stocks (continued) | |||||||||||
| Industrial Conglomerates (2.0%) | |||||||||||
| General Electric Co. | 84,450 | $ | 2,765,737 | ||||||||
| Siemens AG, ADR | 8,800 | 806,080 | |||||||||
| 3,571,817 | |||||||||||
| Machinery (2.7%) | |||||||||||
| Caterpillar, Inc. | 20,780 | 1,410,962 | |||||||||
| Deere & Co. | 10,290 | 738,411 | |||||||||
| Eaton Corp. | 8,430 | 558,066 | |||||||||
| Hitachi Construction Machinery Co., Ltd. | 43,700 | 1,207,007 | |||||||||
| OSG Corp. | 17,340 | 358,463 | |||||||||
| Pall Corp. | 25,960 | 747,648 | |||||||||
| 5,020,557 | |||||||||||
| Marine (0.9%) | |||||||||||
| A.P. Moller - Maersk A/S | 120 | 1,195,595 | |||||||||
| Finnlines Oyj | 22,690 | 410,543 | |||||||||
| 1,606,138 | |||||||||||
| Trading Companies & Distributors (0.4%) | |||||||||||
| GATX Corp. | 17,890 | 710,412 | |||||||||
| 16,265,889 | |||||||||||
| Information Technology (18.4%) | |||||||||||
| Communications Equipment (3.4%) | |||||||||||
| Cisco Systems, Inc. (a) | 79,050 | 1,467,959 | |||||||||
| Corning, Inc. (a) | 52,000 | 1,266,200 | |||||||||
| CSR PLC (a) | 35,000 | 697,367 | |||||||||
| Motorola, Inc. | 17,350 | 394,019 | |||||||||
| Nokia Oyj, ADR | 61,150 | 1,123,937 | |||||||||
| QUALCOMM, Inc. | 27,320 | 1,310,267 | |||||||||
| 6,259,749 | |||||||||||
| Computers & Peripherals (2.3%) | |||||||||||
| EMC Corp. (a) | 52,390 | 702,026 | |||||||||
| Hewlett-Packard Co. | 36,510 | 1,138,382 | |||||||||
| International Business Machines Corp. | 9,400 | 764,220 | |||||||||
| Palm, Inc. (a) | 40,600 | 1,602,888 | |||||||||
| 4,207,516 | |||||||||||
| Electronic Equipment & Instruments (0.3%) | |||||||||||
| Murata Manufacturing Co., Ltd. | 8,400 | 608,670 | |||||||||
| Internet Software & Services (1.1%) | |||||||||||
| eBay, Inc. (a) | 21,770 | 938,287 | |||||||||
| Yahoo!, Inc. (a) | 28,610 | 982,467 | |||||||||
| 1,920,754 | |||||||||||
See Accompanying Notes to Financial Statements.
10
CMG STRATEGIC EQUITY FUND
A Portfolio of CMG Fund Trust
SCHEDULE OF INVESTMENTS
| Shares | Value | ||||||||||
| Common Stocks (continued) | |||||||||||
| IT Services (2.1%) | |||||||||||
| Automatic Data Processing, Inc. | 17,730 | $ | 779,056 | ||||||||
| DST Systems, Inc. (a) | 18,000 | 1,019,880 | |||||||||
| First Data Corp. | 27,760 | 1,251,976 | |||||||||
| Paychex, Inc. | 22,020 | 800,427 | |||||||||
| 3,851,339 | |||||||||||
| Office Electronics (0.6%) | |||||||||||
| Zebra Technologies Corp., Class A (a) | 23,025 | 1,036,816 | |||||||||
| Semiconductors & Semiconductor Equipment (5.8%) | |||||||||||
| Advanced Micro Devices, Inc. (a) | 27,080 | 1,133,569 | |||||||||
| Analog Devices, Inc. | 24,060 | 956,866 | |||||||||
| Applied Materials, Inc. | 34,850 | 663,892 | |||||||||
| ASML Holding N.V., N.Y. Registered Shares (a) | 16,000 | 361,440 | |||||||||
| Intel Corp. | 32,890 | 699,570 | |||||||||
| Intersil Corp., Class A | 17,170 | 498,960 | |||||||||
| Micron Technology, Inc. (a) | 36,310 | 533,031 | |||||||||
| Samsung Electronics Co., Ltd., GDR (b) | 10,500 | 4,021,500 | |||||||||
| Sanken Electric Co. Ltd. | 32,500 | 567,964 | |||||||||
| Texas Instruments, Inc. | 42,160 | 1,232,337 | |||||||||
| 10,669,129 | |||||||||||
| Software (2.8%) | |||||||||||
| Check Point Software Technologies Ltd. (a) | 17,160 | 371,342 | |||||||||
| Microsoft Corp. | 91,210 | 2,567,562 | |||||||||
| Novell, Inc. (a) | 34,500 | 336,030 | |||||||||
| Oracle Corp. (a) | 66,220 | 832,385 | |||||||||
| Quest Software, Inc. (a) | 34,640 | 548,698 | |||||||||
| Wind River Systems, Inc. (a) | 34,580 | 462,680 | |||||||||
| 5,118,697 | |||||||||||
| 33,672,670 | |||||||||||
| Materials (3.5%) | |||||||||||
| Chemicals (1.5%) | |||||||||||
| Air Products & Chemicals, Inc. | 13,880 | 856,257 | |||||||||
| International Flavors & Fragrances, Inc. | 21,240 | 700,071 | |||||||||
| Potash Corp. of Saskatchewan, Inc. | 13,880 | 1,249,061 | |||||||||
| 2,805,389 | |||||||||||
| Metals & Mining (1.6%) | |||||||||||
| Companhia Vale do Rio Doce, ADR | 17,480 | 896,200 | |||||||||
| Inco Ltd. | 19,960 | 1,023,549 | |||||||||
| Mittal Steel Co. NV, Class A | 29,000 | 1,049,800 | |||||||||
| 2,969,549 | |||||||||||
See Accompanying Notes to Financial Statements.
11
CMG STRATEGIC EQUITY FUND
A Portfolio of CMG Fund Trust
SCHEDULE OF INVESTMENTS
| Shares | Value | ||||||||||
| Common Stocks (continued) | |||||||||||
| Paper & Forest Products (0.4%) | |||||||||||
| Votorantim Celulose e Papel SA, ADR | 56,090 | $ | 699,442 | ||||||||
| 6,474,380 | |||||||||||
| Telecommunication Services (1.6%) | |||||||||||
| Diversified Telecommunication Services (1.6%) | |||||||||||
| BellSouth Corp. | 23,740 | 683,000 | |||||||||
| Chunghwa Telecom Co. Ltd. | 33,000 | 614,460 | |||||||||
| Telekomunikasi Indonesia, ADR | 39,000 | 1,079,520 | |||||||||
| Verizon Communications, Inc. | 17,670 | 559,432 | |||||||||
| 2,936,412 | |||||||||||
| Utilities (2.2%) | |||||||||||
| Electric Utilities (1.3%) | |||||||||||
| Edison International | 35,430 | 1,552,542 | |||||||||
| Exelon Corp. | 13,980 | 802,732 | |||||||||
| 2,355,274 | |||||||||||
| Independent Power Producers & Energy Traders (0.2%) | |||||||||||
| Duke Energy Corp. | 13,890 | 393,781 | |||||||||
| Multi-Utilities (0.7%) | |||||||||||
| Dominion Resources, Inc. | 8,470 | 639,739 | |||||||||
| TECO Energy, Inc. | 44,670 | 762,964 | |||||||||
| 1,402,703 | |||||||||||
| 4,151,758 | |||||||||||
| Total Common Stocks (Cost of $122,725,830) | 176,218,415 | ||||||||||
| Investment Company (0.7%) | |||||||||||
| iShares MSCI Japan Index Fund (Cost of $629,412) | 88,900 | 1,246,378 | |||||||||
| Par | |||||||||||
| Short-Term Obligation (3.3%) | |||||||||||
| Repurchase agreement with State Street Bank & Trust Co., dated 01/31/06, due 02/01/06 at 4.270%, collateralized by a U.S. Treasury Bond maturing 05/15/15, market value of $6,135,731 (repurchase proceeds $6,013,713) (Cost of $6,013,000) | $ | 6,013,000 | 6,013,000 | ||||||||
| Total Investments (100.1%) (Cost of $129,368,242) (c) | 183,477,793 | ||||||||||
| Other Assets & Liabilities, Net (-0.1%) | (132,045 | ) | |||||||||
| Net Assets (100.0%) | $ | 183,345,748 | |||||||||
See Accompanying Notes to Financial Statements.
12
CMG STRATEGIC EQUITY FUND
A Portfolio of CMG Fund Trust
SCHEDULE OF INVESTMENTS
| Notes to Schedule of Investments: | |||
(a) Non-income producing security.
(b) Security exempt from registration pursuant to Rule 144A under the Securities Act of 1933. This security, which is not illiquid, may be resold in transactions exempt from registration, normally to qualified institutional buyers. At January 31, 2006, the value of this security, which is not illiquid, represents 2.2% of net assets.
(c) Cost for federal income tax purposes is $129,368,242.
At January 31, 2006, the Fund held investments in the following sectors:
| Sector | % of Net Assets | ||||||
| Information Technology | 18.4 | % | |||||
| Financials | 16.5 | ||||||
| Health Care | 15.2 | ||||||
| Consumer Staples | 11.0 | ||||||
| Energy | 10.6 | ||||||
| Industrials | 8.9 | ||||||
| Consumer Discretionary | 8.2 | ||||||
| Materials | 3.5 | ||||||
| Utilities | 2.2 | ||||||
| Telecommunication Services | 1.6 | ||||||
| Investment Company | 0.7 | ||||||
| Short Term Obligation | 3.3 | ||||||
| Other Assets & Liabilities, Net | (0.1 | ) | |||||
| 100.0 | % | ||||||
| Acronym | Name | ||||||
| ADR | American Depositary Receipt | ||||||
| GDR | Global Depositary Receipt | ||||||
See Accompanying Notes to Financial Statements.
13
CMG STRATEGIC EQUITY FUND
A Portfolio of CMG Fund Trust
STATEMENT OF ASSETS AND LIABILITIES
January 31, 2006 (Unaudited)
| ASSETS: | |||||||
| Investments, at identified cost | $ | 129,368,242 | |||||
| Investments, at value | $ | 183,477,793 | |||||
| Cash | 241 | ||||||
| Receivable for: | |||||||
| Fund shares sold | 84,377 | ||||||
| Interest | 683 | ||||||
| Dividends | 136,565 | ||||||
| Foreign tax reclaims | 3,368 | ||||||
| Expense reimbursement due from Investment Advisor | 30,630 | ||||||
| Deferred Trustees' compensation plan | 8,577 | ||||||
| Total Assets | 183,742,234 | ||||||
| LIABILITIES: | |||||||
| Payable for: | |||||||
| Investments purchased | 91,641 | ||||||
| Fund shares repurchased | 197,692 | ||||||
| Investment advisory fee | 69,394 | ||||||
| Transfer agent fee | 394 | ||||||
| Custody fee | 5,920 | ||||||
| Reports to shareholders | 14,912 | ||||||
| Chief compliance officer expenses | 507 | ||||||
| Deferred Trustees' fees | 8,577 | ||||||
| Other liabilities | 7,449 | ||||||
| Total Liabilities | 396,486 | ||||||
| NET ASSETS | $ | 183,345,748 | |||||
| NET ASSETS consist of: | |||||||
| Paid-in capital | $ | 55,822,991 | |||||
| Accumulated net investment loss | (360,118 | ) | |||||
| Accumulated net realized gain | 73,773,088 | ||||||
| Net unrealized appreciation (depreciation) on: | |||||||
| Investments | 54,109,551 | ||||||
| Foreign currency translations | 236 | ||||||
| NET ASSETS | $ | 183,345,748 | |||||
| Shares of capital stock outstanding | 16,189,496 | ||||||
| Net asset value, offering and redemption price per share | $ | 11.32 | |||||
| See Accompanying Notes to Financial Statements. | |||
14
CMG STRATEGIC EQUITY FUND
A Portfolio of CMG Fund Trust
STATEMENT OF OPERATIONS
| For the Six Months Ended January 31, 2006 (Unaudited) | |||||||
| NET INVESTMENT INCOME: | |||||||
| Income: | |||||||
| Dividends | $ | 2,616,799 | |||||
| Interest | 1,052,043 | ||||||
| Foreign withholding tax | (20,085 | ) | |||||
| Total Investment Income | 3,648,757 | ||||||
| Expenses: | |||||||
| Investment advisory fee | 997,118 | ||||||
| Transfer agent fee | 959 | ||||||
| Trustees' fees | 13,581 | ||||||
| Custody fee | 37,666 | ||||||
| Chief compliance officer expenses (See Note 4) | 5,242 | ||||||
| Non-recurring costs (See Note 8) | 3,746 | ||||||
| Other expenses | 97,080 | ||||||
| Total Expenses | 1,155,392 | ||||||
| Fees and expenses waived or reimbursed by Investment Advisor | (153,716 | ) | |||||
| Fees and expenses waived or reimbursed by Transfer Agent | (146 | ) | |||||
| Non-recurring costs assumed by Investment Advisor (See Note 8) | (3,746 | ) | |||||
| Custody earnings credit | (667 | ) | |||||
| Net Expenses | 997,117 | ||||||
| Net Investment Income | 2,651,640 | ||||||
| NET REALIZED AND UNREALIZED GAIN (LOSS) ON INVESTMENTS AND FOREIGN CURRENCY: | |||||||
| Net realized gain (loss) on: | |||||||
| Investments | 109,776,969 | ||||||
| Foreign currency transactions | (147,398 | ) | |||||
| Net realized gain | 109,629,571 | ||||||
| Net change in unrealized appreciation (depreciation) on: | |||||||
| Investments | (90,903,605 | ) | |||||
| Foreign currency translations | 1,912 | ||||||
| Net change in unrealized appreciation (depreciation) | (90,901,693 | ) | |||||
| Net Gain | 18,727,878 | ||||||
| NET INCREASE IN NET ASSETS FROM OPERATIONS | $ | 21,379,518 | |||||
| See Accompanying Notes to Financial Statements. | |||
15
CMG STRATEGIC EQUITY FUND
A Portfolio of CMG Fund Trust
STATEMENT OF CHANGES IN NET ASSETS
| Increase (Decrease) in Net Assets: | (Unaudited) Six Months Ended January 31, 2006 | Year Ended July 31, 2005 | |||||||||
| Operations: | |||||||||||
| Net investment income | $ | 2,651,640 | $ | 9,248,695 | |||||||
| Net realized gain on investments and foreign currency transactions | 109,629,571 | 34,789,566 | |||||||||
| Net change in unrealized appreciation (depreciation) on investments and foreign currency translations | (90,901,693 | ) | 62,844,592 | ||||||||
| Net increase from operations | 21,379,518 | 106,882,853 | |||||||||
| Distributions declared to shareholders: | |||||||||||
| From net investment income | (8,532,614 | ) | (6,517,434 | ) | |||||||
| From net realized gains | (65,479,568 | ) | (33,081,757 | ) | |||||||
| Total distributions declared to shareholders | (74,012,182 | ) | (39,599,191 | ) | |||||||
| Share Transactions: | |||||||||||
| Subscriptions | 42,553,512 | 107,867,251 | |||||||||
| Distributions reinvested | 63,962,151 | 38,913,285 | |||||||||
| Redemptions | (626,396,999 | ) | (76,918,698 | ) | |||||||
| Net increase (decrease) from share transactions | (519,881,336 | ) | 69,861,838 | ||||||||
| Total increase (decrease) in net assets | (572,514,000 | ) | 137,145,500 | ||||||||
| NET ASSETS: | |||||||||||
| Beginning of period | 755,859,748 | 618,714,248 | |||||||||
| End of period | $ | 183,345,748 | $ | 755,859,748 | |||||||
| Undistributed (overdistributed) net investment income | $ | (360,118 | ) | $ | 5,520,856 | ||||||
| Changes in Shares: | |||||||||||
| Subscriptions | 3,139,401 | 7,444,993 | |||||||||
| Issued for distributions reinvested | 5,841,292 | 2,670,781 | |||||||||
| Redemptions | (42,455,246 | ) | (5,281,801 | ) | |||||||
| Net increase (decrease) | (33,474,553 | ) | 4,833,973 | ||||||||
| See Accompanying Notes to Financial Statements. | |||
16
CMG STRATEGIC EQUITY FUND
A Portfolio of CMG Fund Trust
NOTES TO FINANCIAL STATEMENTS
January 31, 2006 (Unaudited)
Note 1. Organization
CMG Strategic Equity Fund (the "Fund"), a series of CMG Fund Trust (the "Trust"), is a diversified portfolio. The Trust is an Oregon business trust registered under the Investment Company Act of 1940, as amended, as an open-end management investment company.
Investment goal. The Fund seeks long-term growth of capital and total returns greater than those of the market over time.
Fund shares. The Fund may issue an unlimited number of shares of no par value capital stock, which are offered continuously at net asset value.
Note 2. Significant accounting policies
Use of estimates. The preparation of financial statements in conformity with accounting principles generally accepted in the United States of America ("GAAP") requires management to make estimates and assumptions that affect the reported amounts of assets and liabilities, the disclosure of contingent assets and liabilities at the date of the financial statements and the reported amounts of revenue and expenses during the reporting period. Actual results could differ from those estimates. The following is a summary of significant accounting policies consistently followed by the Fund in the preparation of its financial statements.
Equity securities and certain investment companies are valued at the last sale price on the principal exchange on which they trade, except for securities traded on the NASDAQ, which are valued at the NASDAQ official close price. Unlisted securities or listed securities for which there were no sales during the day are valued at the closing bid price on such exchanges or over-the-counter markets.
Short-term debt obligations maturing within 60 days are valued at amortized cost, which approximates market value.
Foreign securities are generally valued at the last sale price on the foreign exchange or market on which they trade. If any foreign share prices are not readily available as a result of limited share activity, the securities are valued at the last sale price of the local shares in the principal market in which such securities are normally traded.
Generally, trading in foreign securities is substantially completed each day at various times prior to the close of the New York Stock Exchange ("NYSE"). The values of such securities used in computing the net asset value of the Fund's shares are determined as of such times. Foreign currency exchange rates are generally determined at 4:00 p.m. Eastern (U.S.) time. Events affecting the values of such foreign securities and such exchange rates may occur between the times at which they are determined and the close of the customary trading session of the NYSE, which would not be reflected in the computation of the Fund's net asset value. If events materially affecting the values of such foreign securities occur and it is determined that market quotations are not reliable, then these foreign securities will be valued at their fair value using procedures approved by the Board of Trustees.
Investments for which market quotations are not readily available, or that have quotations which management believes are not appropriate, are valued at fair value as determined in good faith under consistently applied procedures established by and under the general supervision of the Board of Trustees. If a security is valued at a "fair value", such value is likely to be different from the last quoted market price for the security.
17
CMG STRATEGIC EQUITY FUND
A Portfolio of CMG Fund Trust
NOTES TO FINANCIAL STATEMENTS
January 31, 2006 (Unaudited)
Security transactions. Security transactions are accounted for on the trade date. Cost is determined and gains (losses) are based upon the specific identification method for both financial statement and federal income tax purposes.
Repurchase agreements. The Fund may engage in repurchase agreement transactions with institutions that the Fund's investment advisor has determined are creditworthy. The Fund, through its custodian, receives delivery of underlying securities collateralizing a repurchase agreement. Collateral is at least equal, at all times, to the value of the repurchase obligation including interest. A repurchase agreement transaction involves certain risks in the event of default or insolvency of the counterparty. These risks include possible delays or restrictions upon the Fund's ability to dispose of the underlying securities and a possible decline in the value of the underlying securities during the period while the Fund seeks to assert its rights.
Income recognition. Interest income is recorded on the accrual basis. Corporate actions and dividend income are recorded on the ex-date, except for certain foreign securities which are recorded as soon after ex-date as the Fund becomes aware of such, net of non-reclaimable tax withholdings. Distributions paid by real estate investment trusts (REITs) in excess of their income are recorded as a reduction of the cost of the related investments. If the Fund no longer owns the applicable securities, any distributions received in excess of income are recorded as realized gains.
Foreign currency transactions. The values of all assets and liabilities quoted in foreign currencies are translated into U.S. dollars at that day's exchange rates. Net realized and unrealized gains (losses) on foreign currency transactions include gains (losses) arising from the fluctuation in exchange rates between trade and settlement dates on securities transactions, gains (losses) arising from the disposition of foreign currency and currency gains (losses) between the accrual and payment dates on dividends, interest income and foreign withholding taxes.
For financial statement purposes, the Fund does not distinguish that portion of gains (losses) on investments which is due to changes in foreign exchange rates from that which is due to changes in market prices of the investments. Such fluctuations are included with the net realized and unrealized gains (losses) on investments.
Federal income tax status. The Fund intends to qualify each year as a "regulated investment company" under Subchapter M of the Internal Revenue Code, as amended, and will distribute substantially all of its taxable income, if any, for its tax year, and as such will not be subject to federal income taxes. In addition, the Fund intends to distribute in each calendar year substantially all of its net investment income, capital gains and certain other amounts, if any, such that the Fund should not be subject to federal excise tax. Therefore, no federal income or excise tax provision is recorded.
Distributions to shareholders. Distributions to shareholders are recorded on ex-date. Net realized capital gains, if any, are distributed at least annually.
Note 3. Federal tax information
The tax character of distributions paid during the years ended July 31, 2005 was as follows:
| July 31, 2005 | |||||||
| Distributions paid from: | |||||||
| Ordinary Income* | $ | 20,070,000 | |||||
| Long-Term Capital Gains | 19,529,191 | ||||||
*For tax purposes short-term capital gains distributions, if any, are considered ordinary income distributions.
18
CMG STRATEGIC EQUITY FUND
A Portfolio of CMG Fund Trust
NOTES TO FINANCIAL STATEMENTS
January 31, 2006 (Unaudited)
Unrealized appreciation and depreciation at January 31, 2006, based on cost of investments for federal income tax purposes was:
| Unrealized appreciation | $ | 55,215,120 | |||||
| Unrealized depreciation | (1,105,569 | ) | |||||
| Net unrealized appreciation | $ | 54,109,551 | |||||
Note 4. Fees and compensation paid to affiliates
Investment advisory fee. Columbia Management Advisors, LLC ("Columbia"), an indirect, wholly-owned subsidiary of Bank of America Corporation ("BOA"), is the investment advisor to the Fund and provides administrative and other services to the Fund. Prior to September 30, 2005, Columbia Management Advisors, Inc. was investment advisor to the Fund under the same fee structure. On September 30, 2005, Columbia Management Advisors, Inc. merged into Banc of America Capital Management, LLC. At that time, the investment advisor was then renamed Columbia Management Advisors, LLC. Columbia receives a monthly investment advisory fee at the annual rate of 0.40% of the Fund's average daily net assets.
In addition to the investment advisory fee, each shareholder pays an annual fee calculated as a percentage of the shareholder's net assets in the Fund. The annual fee ranges between 0.20% on the first $25 million of the shareholder's net assets in the Fund, to 0.00% on the shareholder's net assets in the Fund in excess of $25 million.
Pricing & bookkeeping fees. Columbia is responsible for providing services to the Fund under a pricing, bookkeeping and fund administration agreement. Under a separate agreement (the "Outsourcing Agreement"), Columbia has delegated certain of those functions to State Street Corporation ("State Street"). As a result, Columbia pays fees to State Street under the Outsourcing Agreement. The Fund is not charged a fee for pricing and bookkeeping services.
Transfer agent fee. Columbia Management Services, Inc. (formerly Columbia Funds Services, Inc.) (the "Transfer Agent"), an affiliate of Columbia and an indirect, wholly-owned subsidiary of BOA, provides shareholder services to the Fund and has contracted with Boston Financial Data Services ("BFDS") to serve as sub-transfer agent. The Transfer Agent is entitled to receive a fee for its services, paid monthly, at the annual rate of $15.23 per open account. Prior to November 1, 2005, the Transfer Agent received a fee at the annual rate of $28.00 per open account. The Transfer Agent may also retain, as additional compensation for its services, fees for wire, telephone and redemption orders, IRA trustee agent fees and account transcript fees due the Transfer Agent from shareholders of the Fund and credits (net of bank charges) earned with respect to balances in a ccounts the Transfer Agent maintains in connection with its services to the Fund.
For the period from September 1, 2005 through October 31, 2005, the Transfer Agent voluntarily waived a portion of its fees to reflect the reduced contractual fees charged to the Fund effective November 1, 2005. For the six months ended January 31, 2006, the Transfer Agent waived fees of $146 for the Fund.
For the six months ended January 31, 2006, the Fund's annualized effective transfer agent fee rate, net of fee waivers, was less than 0.01% of the Fund's average daily net assets.
Expense limits and fee reimbursements. Columbia has contractually agreed to reimburse the Fund through November 30, 2006 for certain expenses so that the expenses incurred by the Fund exclusive of interest, taxes and extraordinary expenses will not exceed 0.40% of the Fund's average daily net assets.
19
CMG STRATEGIC EQUITY FUND
A Portfolio of CMG Fund Trust
NOTES TO FINANCIAL STATEMENTS
January 31, 2006 (Unaudited)
Custody credits. The Fund has an agreement with its custodian bank under which custody fees may be reduced by balance credits. These credits are recorded as a reduction of total expenses on the Statement of Operations. The Fund could have invested a portion of the assets utilized in connection with the expense offset arrangement in an income-producing asset if it had not entered into such an agreement.
Fees paid to officers and trustees. All officers of the Fund, with the exception of the Fund's Chief Compliance Officer, are employees of Columbia, or its affiliates and receive no compensation from the Fund. The Board of Trustees has appointed a Chief Compliance Officer to the Fund in accordance with federal securities regulations. The Fund, along with other affiliated funds, pays its pro-rata share of the expenses associated with the Chief Compliance Officer. The Fund's expenses for the Chief Compliance Officer will not exceed $15,000 per year.
The Fund's Trustees may participate in a deferred compensation plan which may be terminated at any time. Obligations of the plan will be paid solely out of the Fund's assets.
Other. Columbia provides certain services to the Fund related to Sarbanes-Oxley compliance. For the six months ended January 31, 2006, the Fund paid $1,108 to Columbia for such services. This amount is included in "Other expenses" on the Statement of Operations.
Note 5. Portfolio information
For the six months ended January 31, 2006, the cost of purchases and proceeds from sales of securities, excluding short-term obligations, were $81,338,756 and $547,088,707, respectively.
Note 6. Line of credit
The Fund and other affiliated funds participate in a $350,000,000 committed unsecured revolving line of credit provided by State Street Bank and Trust Company. Borrowings are used for temporary or emergency purposes to facilitate portfolio liquidity. Interest is charged to each participating fund based on its borrowings at a rate per annum equal to the Federal Funds rate plus 0.50%. In addition, a commitment fee of 0.10% per annum is accrued and apportioned among the participating funds based on their pro-rata portion of the unutilized line of credit. The commitment fee is included in "Other expenses" on the Statement of Operations.
For the six months ended January 31, 2006, the Fund did not borrow under this arrangement.
Note 7. Shares of beneficial interest
As of January 31, 2006, the Fund had shareholders whose shares were beneficially owned by participant accounts over which Bank of America and/or its affiliates had either sole or joint investment discretion. Subscription and redemption activity of these accounts may have a significant effect on the operations of the Fund. The number of such accounts and the percentage of shares of beneficial interest outstanding held therein are as follows:
| Number of Shareholders | % of Shares Outstanding Held | ||||||
| 1 | 54.5 | % | |||||
20
CMG STRATEGIC EQUITY FUND
A Portfolio of CMG Fund Trust
NOTES TO FINANCIAL STATEMENTS
January 31, 2006 (Unaudited)
As of January 31, 2006, the Fund also had other shareholders that held greater than 5% of the shares outstanding. Subscription and redemption activity of these accounts may have a significant effect on the operations of the Fund. The number of such accounts and the percentage of shares of beneficial interest outstanding held therein are as follows:
| Number of Shareholders | % of Shares Outstanding Held | ||||||
| 4 | 38.1 | % | |||||
Note 8. Disclosure of significant risks and contingencies
Industry focus. The Fund may focus its investments in certain industries, subjecting it to greater risk than a fund that is more diversified.
Foreign securities. There are certain additional risks involved when investing in foreign securities that are not inherent with investments in domestic securities. These risks may involve foreign currency exchange rate fluctuations, adverse political and economic developments and the possible prevention of currency exchange or other foreign governmental laws or restrictions. In addition, the liquidity of foreign securities may be more limited than that of domestic securities.
Legal Proceedings On February 9, 2005, Columbia Management Advisors, Inc. (which has since merged into Banc of America Capital Management, LLC (now named Columbia Management Advisors, LLC)) ("Columbia") and Columbia Funds Distributor, Inc. (which has been renamed Columbia Management Distributors, Inc.) (the "Distributor") (collectively, the "Columbia Group") entered into an Assurance of Discontinuance with the New York Attorney General ("NYAG") (the "NYAG Settlement") and consented to the entry of a cease-and-desist order by the Securities and Exchange Commission ("SEC") (the "SEC Order"). The SEC Order and the NYAG Settlement are referred to collectively as the "Settlements". The Settlements contain substantially the same terms and conditions as outlined in the agreements in principle which Columbia Group entered into with the SEC and NYAG in March 20 04.
Under the terms of the SEC Order, the Columbia Group has agreed among other things, to: pay $70 million in disgorgement and $70 million in civil money penalties; cease and desist from violations of the antifraud provisions and certain other provisions of the federal securities laws; maintain certain compliance and ethics oversight structures; retain an independent consultant to review the Columbia Group's applicable supervisory, compliance, control and other policies and procedures; and retain an independent distribution consultant (see below). The Columbia Funds have also voluntarily undertaken to implement certain governance measures designed to maintain the independence of their boards of trustees. The NYAG Settlement also, among other things, requires Columbia and its affiliates to reduce certain Columbia Funds (including the former Nations Funds) and other mutual funds management fees collectively by $32 million per year fo r five years, for a projected total of $160 million in management fee reductions.
Pursuant to the procedures set forth in the SEC order, the $140 million in settlement amounts described above will be distributed in accordance with a distribution plan developed by an independent distribution consultant and agreed to by the staff of the SEC. The independent distribution consultant has been in consultation with the Staff, and has submitted a draft proposed plan of distribution, but has not yet submitted a final proposed plan of distribution.
As a result of these matters or any adverse publicity or other developments resulting from them, there may be increased redemptions or reduced sales of fund shares, which could increase transaction costs or operating expenses, or have other adverse consequences for the funds.
A copy of the SEC Order is available on the SEC website at http://www.sec.gov. A copy of the NYAG Settlement is available as part of the Bank of America Corporation Form 8-K filing on February 10, 2005.
21
CMG STRATEGIC EQUITY FUND
A Portfolio of CMG Fund Trust
NOTES TO FINANCIAL STATEMENTS
January 31, 2006 (Unaudited)
In connection with the events described in detail above, various parties have filed suit against certain funds, the Trustees of the Columbia Funds, FleetBoston Financial Corporation and its affiliated entities and/or Bank of America and its affiliated entities.
On February 20, 2004, the Judicial Panel on Multidistrict Litigation transferred these cases and cases against several other mutual fund companies based on similar allegations to the United States District Court in Maryland for consolidated or coordinated pretrial proceedings (the "MDL"). Subsequently, additional related cases were transferred to the MDL. On September 29, 2004, the plaintiffs in the MDL filed amended and consolidated complaints. One of these amended complaints is a putative class action that includes claims under the federal securities laws and state common law, and that names Columbia, the Distributor, the Trustees of the Columbia Funds, Bank of America Corporation and others as defendants. Another of the amended complaints is a derivative action purportedly on behalf of the Columbia Funds that asserts claims under federal securities laws and state common law.
On February 25, 2005, Columbia and other defendants filed motions to dismiss the claims in the pending cases. On March 1, 2006, for reasons stated in the court's memoranda dated November 3, 2005, the U.S. District Court for the District of Maryland granted in part and denied in part the defendants' motions to dismiss. The court dismissed all of the class action claims pending against the Columbia Funds. As to Columbia, the Distributor and the Trustees of the Columbia Funds, the claims under the Securities Act of 1933, the claims under Sections 34(b) and 36(a) of the Investment Company Act of 1940 (ICA) and the state law claims were dismissed. The claims under Sections 10(b) and 20(a) of the Securities Exchange Act of 1934 and claims under Section 36(b) of the ICA along with related claims under Section 48(a) of the ICA were not dismissed.
On March 21, 2005 purported class action plaintiffs filed suit in Massachusetts state court alleging that the conduct, including market timing, entitles Class B shareholders in certain Columbia funds to an exemption from contingent deferred sales charges upon early redemption ("the CDSC Lawsuit"). The CDSC Lawsuit has been removed to federal court in Massachusetts and the federal Judicial Panel has transferred the CDSC Lawsuit to the MDL.
The MDL is ongoing. Accordingly, an estimate of the financial impact of this litigation on any fund, if any, cannot currently be made.
In 2004, certain Columbia funds, the Trustees of the Columbia Funds, advisers and affiliated entities were named as defendants in certain purported shareholder class and derivative actions making claims, including claims under the Investment Company and the Investment Advisers Acts of 1940 and state law. The suits allege, inter alia, that the fees and expenses paid by the funds are excessive and that the advisers and their affiliates inappropriately used fund assets to distribute the funds and for other improper purpose. On March 2, 2005, the actions were consolidated in the Massachusetts federal court as In re Columbia Entities Litigation. The plaintiffs filed a consolidated amended complaint on June 9, 2005. On November 30, 2005, the judge dismissed all claims by plaintiffs and ordered that the case be closed. The plaintiffs filed a notice of appeal on December 30, 2005 and this appeal is pending.
For the six months ended January 31, 2006, Columbia has assumed $3,746 of legal, consulting services and Trustees' fees incurred by the Fund in connection with these matters.
Note 9. Subsequent event
On March 27, 2006, the Fund will be re-domiciled into a new series of Columbia Funds Institutional Trust. Columbia Funds Institutional Trust is registered under the Investment Company Act of 1940, as amended, as an open-end management investment company.
22
Summary of Management Fee Evaluation by Independent Fee Consultant
Prepared Pursuant to the February 9, 2005 Assurance of Discontinuance between the Office of
Attorney General of New York State and Columbia Management Advisors, Inc. and
Columbia Funds Distributor, Inc. October 11, 2005
I. Overview
Columbia Management Advisors, Inc. ("CMA") and Columbia Funds Distributors, Inc. ("CFD") (CFD together with CMA referred to herein as Columbia Management Group or "CMG1"), entered into an agreement with the New York Attorney General's Office in the form of an Assurance of Discontinuance (the "AOD"). The AOD stipulated that CMA would be permitted to manage or advise the Columbia Funds only if the Independent Members (as such term is defined in the AOD) of the Columbia Funds' Board of Trustees/Directors (collectively the "Trustees") appointed a Senior Officer or an Independent Fee Consultant ("IFC") who, among other things, is to manage the process by which management fees are negotiated. On May 15, 2005, the Independent Members of the Board appointed me as the IFC for the Columbia Funds. This report is the annual written evaluation of the Columbia Funds for 2005 that I have prepared in my capacity as IFC, as required b y the AOD.
A. Duties of the Independent Fee Consultant
As part of the AOD, the Independent Members of the Columbia Funds' Board of Trustees/Directors agreed to retain an independent fee consultant who was to participate in the management fee negotiation process. The IFC is charged with "... duties and responsibilities [that] include managing the process by which proposed management fees (including, but not limited to, advisory fees) to be charged the Columbia Fund[s] are negotiated so that they are negotiated in a manner which is at arms length and reasonable and consistent with this Assurance of Discontinuance." However, the IFC does not replace the Trustees in their role of negotiating management and other fees with CMG and its affiliates. In particular, the AOD states that "Columbia Advisors may manage or advise a Columbia Fund only if the reasonableness of the proposed management fees is determined by the Board of Trustees of the Columbia Fund using ... an annual independent wri tten evaluation prepared by or under the direction of the ... Independent Fee Consultant...." This report, pursuant to the AOD, constitutes the "annual independent written evaluation prepared by or under the direction of the... Independent Fee Consultant."
The AOD requires the IFC report to consider at least the following:
a) Management fees (including any components thereof) charged by other mutual fund companies for like services;
b) Management fees (including any components thereof) charged to institutional and other clients of CMA for like services;
c) Costs to CMA and its affiliates of supplying services pursuant to the management fee agreements, excluding any intra-corporate profit;
d) Profit margins of CMA and its affiliates from supplying such services;
e) Possible economies of scale as the CMA fund grows larger; and
f) The nature and quality of CMA services, including Columbia Funds' performance.
This report is designed to assist the Board in evaluating the 2005 contract renewal for Columbia Funds. In addition, this report points out areas where the Board may deem additional information and analysis to be appropriate over time.
1 Prior to the date of this report, CMA merged into an affiliated entity, Banc of America Capital Management, LLC ("BACAP"), and BACAP then changed its name to Columbia Management Advisors, LLC which carries on the business of CMA, and CFD changed its name to Columbia Management Distributors, Inc.
23
Summary of Management Fee Evaluation by Independent Fee Consultant (continued)
B. Sources of information used in my evaluation
I have requested data from CMG and various third party industry data sources or independent research companies that work in the mutual fund arena. The following list generally describes the types of information I requested.
1. I collected data on performance, management fees, and expense ratios of both Columbia Funds and comparable non-Columbia Funds. The sources of this information were CMG, Lipper Inc. ("Lipper") and Morningstar Inc. ("Morningstar"). While Lipper and Morningstar each selected a different group of peer funds it deemed appropriate against which to measure the relative performance and fees of Columbia Funds, I conducted an independent review of the appropriateness of each peer group.
2. I reviewed data on CMG's expense and profitability that I obtained from CMA directly.
3. I have reviewed data on the organizational structure of CMG in general.
4. I collected information on profitability from Strategic Insight Mutual Fund Research and Consulting, LLC ("Strategic Insight"). I used this third-party independent research as an additional method to gauge the accuracy of the data collected in (2) above.
5. I conducted interviews with various CMG staff, including members of the senior management team, legal staff, heads of affiliates, portfolio managers, and financial personnel.
6. I reviewed current 2005 Section 15(c) material provided to the Board and material presented to the Board in the 2004 fee and performance evaluation.
7. I have reviewed various academic research papers, industry publications, and other available literature dealing with mutual fund operations, profitability, and other issues. In addition, I have reviewed SEC releases and studies of mutual fund expenses.
8. I have reviewed documents pertaining to recent mutual fund litigation in general and publicly available information about litigation where CMG has been involved.
In addition, I have engaged NERA Economic Consulting ("NERA") and independent consultant Dr. John Rea to assist me in data management and analysis. Both NERA and Dr. Rea have extensive experience in the mutual fund industry through consulting, government positions, or industry trade groups that provide unique insights and special knowledge pertaining to my independent analysis of fees, performance, and profitability. I have also retained Shearman & Sterling LLP as outside counsel to advise me in connection with my review.
C. Qualifications and independence
I am the Walter H. Carpenter Chair and Professor of Finance at Babson College. Before this I was the Chief Economist of the U.S. Securities and Exchange Commission. I have no material relationship with Bank of America or CMG aside from acting as IFC, and am aware of no relationship with any of their affiliates. [Resume omitted]
II. Evaluation of the general process used to negotiate the advisory contract
A. General considerations
My analysis considered all factors and information I reviewed on the finances and operations of Columbia Funds. I gave each factor an appropriate weight in my overall findings, and no single factor was in itself the sole criterion for a finding or conclusion. My objective was to assess all of the information provided and conduct a robust evaluation of Columbia Funds' operations, fees, and performance.
My analysis and thought processes will and, I believe, should, differ in certain ways from the processes used by Trustees in their evaluation of the management agreements. In particular, because of my technical and quantitative background, I may use techniques and data that Trustees have not previously felt would be useful. I view this supplemental analysis as appropriate because my role is to assist Trustees in their decisions, and to the extent that I bring new ideas or analysis to the evaluation, I believe this improves the process by which management fees for the Columbia Funds may be negotiated in accordance with the AOD.
24
Summary of Management Fee Evaluation by Independent Fee Consultant (continued)
Finally, as part of my role as IFC, I have, from time to time, sent to Trustees additional papers and reports produced by third parties that I felt had bearing on the fee negotiation process. I viewed these materials as educational in nature and felt they would aid Trustees in placing their work in context.
B. CMG management interviews
As a starting point of my analysis, I have met with members of CMG staff to gain an understanding of the organizational structure and personnel involved in running the Columbia fund family.
I have had general discussions and have received information about the management structure of CMG. My conversations with management have been informative. In addition, I have participated in Board meetings where Trustees and management have discussed issues relating to management agreements and performance of Columbia Funds. When I felt it was appropriate, I added my opinions on particular matters, such as fund performance or fee levels, to the discussion.
C. Trustees' Fee and Performance Evaluation Process
After making initial requests for information, members of the Trustees of the Columbia Funds met in advance of the October Section 15(c) contract approval meeting to review certain fee, performance and other data for the Columbia Funds and to ask questions and make requests of management. Trustees have developed a process to evaluate the fee and expense levels and performance of Columbia Funds. This process is used to highlight those funds that have been performing poorly, may have had higher management fees or expense ratios, or both.
The process involves providing instructions to Lipper to prepare specific data analyses tailored to the Trustees review framework. These instructions include highlighting funds that hit one or more fee performance "screens." The six screens the Trustees use are as follows:
a. 5th Lipper quintile in actual management fee;
b. 5th Lipper quintile in total expense ratio;
c. Three or more 5th Lipper quintile rankings in the 1-, 3-, 5- or 10-year performance rankings;
d. Sum of the Lipper Quintile Rank (1-year performance) and the Lipper Quintile Rank (actual management fee) totals a number equal to or higher than 8;
e. Sum of the Lipper Quintile Rank (1-year performance) and the Lipper Quintile Rank (total expense ratio) totals a number equal to or higher than 8; and
f. Sum of the Lipper Quintile Rank (3-year performance) and the Lipper Quintile Rank (total expense ratio) totals a number equal to or higher than 8.
If a fund hits one or more of these screens, it is highlighted for additional review by the Trustees. This method is only used as an aid for Trustees to highlight funds and is not the sole test of whether the Board will determine to take particular actions concerning fees or performance. Funds that have not been flagged by this screen also may be singled out for fee and performance reasons, and the Trustees may determine not to take action with respect to the fees or performance of funds that have been flagged by the screen. These screens contribute to the basis for discussions on Trustees' views on the Columbia Funds.
III. Findings
My findings based on my work as IFC are as follows:
1. The Trustees have the relevant information necessary to form an opinion on the reasonableness of fees and evaluate the performance of the Columbia Funds. The process the Trustees used in preparing to reach their determination has been open and informative. In my view, the 2005 process by which the management fees of the Columbia Funds have been negotiated thus far has been, to the extent practicable, at arm's length and reasonable and consistent with the AOD.
25
Summary of Management Fee Evaluation by Independent Fee Consultant (continued)
2. Columbia Funds demonstrated a range of performance relative to their peers. I find that across the fund complex, 54.26 percent of Columbia Funds have performance higher than the median of their respective Lipper performance universe, and 42.55 percent of Columbia Funds have performance higher than the median of their respective Lipper performance group. In addition, Lipper performance universe and group comparison showed that Columbia Funds were distributed roughly evenly across these quintiles. The Trustees have worked with management to address issues of funds that have demonstrated consistent or significant underperformance.
3. Columbia Funds demonstrate a range of management fees and expense ratios relative to their peers. I find that across the fund complex, 58.51 percent of Columbia Funds have expenses below the median of their Lipper expense universe, and 53.19 percent of Columbia Funds have expenses below the median of their Lipper expense group. In addition, Lipper expense universe and group comparisons show that Columbia Funds are distributed roughly evenly across these quintiles. The Trustees have taken steps to limit shareholder expenses for certain funds having management fees significantly above their peers, often though the use of fee waivers to which CMG has agreed. Consolidation of various funds and fund families managed by CMG has resulted in substantial savings in non-advisory expenses.
4. Profitability to CMG of the individual funds ranges widely, but the overall profitability to CMG of its relationship with the Columbia Funds appears to fall within a reasonable range. The method of cost allocation to funds is addressed in the material provided by CMG to the Trustees, but additional information may be necessary to make a judgment on fund level profitability. My review of profitability and cost allocation is ongoing, and I plan to continue to develop my views with regard to fund level profitability.
5. Columbia Funds have instituted fee schedules with breakpoints designed to enable investors to benefit from fund economies of scale, although 71% of the funds have not yet reached their first breakpoint. My analysis of the appropriateness of the breakpoint levels, which I expect will take into account the cost and profitability of the individual funds, is ongoing.
My work is ongoing and my views may develop over time in light of new information and analysis.
Respectfully submitted,
Erik R. Sirri
26
Board Consideration and Approval of Investment Advisory Agreements
The Advisory Fees and Expenses Committee of the Board of Trustees meets one or more times annually, usually in late summer, to review the advisory agreements (collectively, the "Agreements") of the funds for which the Trustees serve as trustees or directors (each a "fund") and determine whether to recommend that the full Board approve the continuation of the Agreements for an additional one-year period. After the Committee has made its recommendation, the full Board, including the Independent Trustees, determines whether to approve the continuation of the Agreements. In addition, the Board, including the Independent Trustees, considers matters bearing on the Agreements at most of its other meetings throughout the year and meets regularly with the heads of each investment area within Columbia. The Trustees also meet with selected fund portfolio managers at various times throughout the year.
The Trustees receive and review all materials that they, their legal counsel or Columbia, the funds' investment adviser, believe to be reasonably necessary for the Trustees to evaluate the Agreements and determine whether to approve the continuation of the Agreements. Those materials generally include, among other items, (i) information on the investment performance of each fund relative to the performance of peer groups of mutual funds and the fund's performance benchmarks, (ii) information on each fund's advisory fees and other expenses, including information comparing the fund's expenses to those of peer groups of mutual funds and information about any applicable expense caps and fee "breakpoints," (iii) sales and redemption data, (iv) information about the profitability of the Agreements to Columbia, and potential "fall-out" or ancillary benefits that Columbia and its affiliates may receive as a result of their relationships with the funds and (v) information obtained through Columbia's response to a questionnaire prepared at the request of the Trustees by counsel to the funds and independent legal counsel to the Independent Trustees. The Trustees also consider other information such as (vi) Columbia's financial results and financial condition, (vii) each fund's investment objective and strategies and the size, education and experience of Columbia's investment staffs and their use of technology, external research and trading cost measurement tools, (viii) the allocation of the funds' brokerage, if any, including allocations to brokers affiliated with Columbia and the use of "soft" commission dollars to pay fund expenses and to pay for research products and services, (ix) Columbia's resources devoted to, and its record of compliance with, the funds' investment policies and restrictions, policies on personal securities transactions and other compliance policies, (x) Columbia's response to various legal and regulatory proceedings since 2003 and (xi) the economic outlook generally and for the mutual fund industry in particular. In addition, the Trustees confer with their independent fee consultant and review materials relating to the Agreements that the independent fee consultant provides. Throughout the process, the Trustees have the opportunity to ask questions of and request additional materials from Columbia and to consult independent legal counsel to the Independent Trustees.
The Board of Trustees most recently approved the continuation of the Agreements at its October, 2005 meeting, following meetings of the Advisory Fees and Expenses Committee held in August, September, and October, 2005. In considering whether to approve the continuation of the Agreements, the Trustees, including the Independent Trustees, did not identify any single factor as determinative, and each weighed various factors as he or she deemed appropriate. The Trustees considered the following matters in connection with their approval of the continuation of the Agreements:
The nature, extent and quality of the services provided to the funds under the Agreements. The Trustees considered the nature, extent and quality of the services provided by Columbia and its affiliates to the funds and the resources dedicated to the funds by Columbia and its affiliates. Among other things, the Trustees considered (i) Columbia's ability, including its resources, compensation programs for personnel involved in fund management, reputation and other attributes, to attract and retain highly qualified research, advisory and supervisory investment professionals; (ii) the portfolio management services provided by those investment professionals; and (iii) the trade execution services provided on behalf of the funds. For each fund, the Trustees also considered the benefits to shareholders of investing in a mutual fund that is part of a family o f funds offering exposure to a variety of asset classes and investment disciplines and providing for a variety of fund and shareholder services. After reviewing those and related factors, the Trustees concluded, within the context of their overall conclusions regarding each of the Agreements, that the nature, extent and quality of services provided supported the continuation of the Agreements.
Investment performance of the funds and Columbia. The Trustees reviewed information about the performance of each fund over various time periods, including information prepared by an independent third party that compared the performance of each fund to the performance of peer groups of mutual funds and performance benchmarks. The Trustees also reviewed a description of the third party's methodology for identifying each fund's peer group for
27
Board Consideration and Approval of Investment Advisory Agreements (continued)
purposes of performance and expense comparisons. The Trustees also considered additional information that the Advisory Fees and Expenses Committee requested from Columbia relating to funds that presented relatively weaker performance and/or relatively higher expenses.
In the case of each fund that had performance that lagged that of a relevant peer group for certain (although not necessarily all) periods, the Trustees concluded that other factors relevant to performance were sufficient, in light of other considerations, to warrant continuation of the fund's Agreements. Those factors varied from fund to fund, but included one or more of the following: (i) that the fund's performance, although lagging in certain recent periods, was stronger over the longer term; (ii) that the underperformance was attributable, to a significant extent, to investment decisions that were reasonable and consistent with the fund's investment strategy and policies and that the fund was performing as expected, given market conditions and the fund's investment strategy; (iii) that the fund's performance was competitive when compared to other relevant performance benchmarks or peer groups; (iv) that Columbia had taken o r was taking steps designed to help improve the fund's investment performance, including, but not limited to, replacing portfolio managers or modifying investment strategies; (v) that the fund's advisory fee had recently been, or was proposed to be, reduced, with the goal of helping the fund's net return to shareholders become more competitive; and (vi) that other fund expenses, such as transfer agency or fund accounting fees, have recently been reduced, with the goal of helping the fund's net return to shareholders become more competitive.
The Trustees also considered Columbia's performance and reputation generally, the funds' performance as a fund family generally, and Columbia's historical responsiveness to Trustee concerns about performance and Columbia's willingness to take steps intended to improve performance.
After reviewing those and related factors, the Trustees concluded, within the context of their overall conclusions regarding each of the Agreements, that the performance of each fund and Columbia was sufficient, in light of other considerations, to warrant the continuation of the Agreements.
The costs of the services provided and profits realized by Columbia and its affiliates from their relationships with the funds. The Trustees considered the fees charged to the funds for advisory services as well as the total expense levels of the funds. That information included comparisons (provided both by management and by an independent third party) of the funds' advisory fees and total expense levels to those of their peer groups and information about the advisory fees charged by Columbia to comparable accounts. In considering the fees charged to comparable accounts, the Trustees took into account, among other things, management's representations about the differences between managing mutual funds as compared to other types of accounts, including the additional resources required to effectively manage mutual funds and distribute mutual fund share s. In evaluating each fund's advisory fees, the Trustees also took into account the demands, complexity and quality of the investment management of the fund. The Trustees considered reductions in advisory fee rates, implementation of advisory fee breakpoints, institution of advisory fee waivers, and changes to expense caps, which benefited a number of the funds. Furthermore, the Trustees considered the projected impact on expenses resulting from the overall cost reductions that management anticipated would result from the shift to a common group of service providers for transfer agency, fund accounting and custody services for mutual funds advised by Bank of America affiliates. The Trustees also noted management's stated justification for the fees charged to the funds, which included information about the performance of the funds, the services provided to the funds and management's view as to why it was appropriate that some funds bear advisory fees or total expenses greater than their peer group medians.
The Trustees also considered the compensation directly or indirectly received by Columbia and its affiliates from their relationships with the funds. The Trustees reviewed information provided by management as to the profitability to Columbia and its affiliates of their relationships with the funds, and information about the allocation of expenses used to calculate profitability. When reviewing profitability, the Trustees also considered court cases in which adviser profitability was an issue in whole or in part, the performance of the relevant funds, the expense levels of the funds, and whether Columbia had implemented breakpoints and/or expense caps with respect to the funds.
After reviewing those and related factors, the Trustees concluded, within the context of their overall conclusions regarding each of the Agreements, that the advisory fees charged to each of the funds were fair and reasonable, and that the costs of the advisory services generally, and the related profitability to Columbia and its affiliates of their relationships with the funds, supported the continuation of the Agreements.
28
Board Consideration and Approval of Investment Advisory Agreements (continued)
Economies of Scale. The Trustees considered the existence of any economies of scale in the provision of services by Columbia to each fund and whether those economies were shared with the fund through breakpoints in the investment advisory fees or other means, such as expense waivers. The Trustees noted that many of the funds benefited from breakpoints, expense caps, or both. In considering those issues, the Trustees also took note of the costs of the services provided (both on an absolute and a relative basis) and the profitability to Columbia and its affiliates of their relationships with the funds, as discussed above.
After reviewing those and related factors, the Trustees concluded, within the context of their overall conclusions regarding each of the Agreements, that the extent to which economies of scale were shared with the funds supported the continuation of the Agreements.
Other Factors. The Trustees also considered other factors, which included but were not limited to the following:
• the extent to which each fund had operated in accordance with its investment objective and its record of compliance with its investment restrictions, and the compliance programs of the funds and Columbia. They also considered the compliance-related resources that Columbia and its affiliates were providing to the funds.
• the nature, quality, cost and extent of administrative and shareholder services performed by Columbia and its affiliates, both under the Agreements and under separate agreements for the provision of transfer agency and administrative services.
• so-called "fall-out benefits" to Columbia, such as the engagement of its affiliates to provide distribution, brokerage and transfer agency services to the funds, and the benefits of research made available to Columbia by reason of brokerage commissions generated by the funds' securities transactions, as well as possible conflicts of interest associated with those fall-out and other benefits, and the reporting, disclosure and other processes in place to disclose and monitor those possible conflicts of interest.
• the draft report provided by the independent fee consultant, which included information about and analysis of the funds' fees, expenses and performance.
Based on their evaluation of all factors that they deemed to be material, including those factors described above, and assisted by the advice of independent counsel and the independent fee consultant, the Trustees, including the Independent Trustees, approved the continuance of each of the Agreements through October 31, 2006.
29
CMG FUND TRUST
1300 S.W. SIXTH AVENUE, PORTLAND, OREGON 97201
- INVESTMENT ADVISOR -
COLUMBIA MANAGEMENT ADVISORS, LLC
100 FEDERAL STREET
BOSTON, MASSACHUSETTS 02110-2624
- LEGAL COUNSEL -
ROPES & GRAY LLP
ONE INTERNATIONAL PLACE
BOSTON, MASSACHUSETTS 02110-2624
- TRANSFER AGENT -
COLUMBIA MANAGEMENT SERVICES, INC.
P.O. BOX 8081
BOSTON, MASSACHUSETTS 02266-8081
SHC-44/106304-0106 (03/06) 06/9983
A description of the fund's proxy voting policies and procedures is available (i) on the fund's website, www.columbiamanagement.com; (ii) on the Securities and Exchange Commission's website at www.sec.gov, and (iii) without charge, upon request, by calling 800-368-0346. Information regarding how the fund voted proxies relating to portfolio securities during the 12-month period ended June 30 is available from the SEC's website. Information regarding how the fund voted proxies relating to portfolio securities is also available from the fund's website.
The fund files a complete schedule of portfolio holdings with the SEC for the first and third quarters of each fiscal year on Form N-Q. The fund's Form N-Q is available on the SEC's website at www.sec.gov and may be reviewed and copied at the SEC's Public Reference Room in Washington, D.C. Information on the operation of the Public Reference Room may be obtained by calling 1-800-SEC-0330.
The CMG funds are offered by prospectus through Columbia Management Distributors, Inc. Please consider the investment objectives, risks, charges and expenses of a mutual fund carefully before investing. Contact your Columbia Management representative or visit www.columbiamanagement.com for a prospectus, which contains this and other important information about the fund. Read it carefully before you invest.
Fund distributed by Columbia Management Distributors, Inc., One Financial Center, Boston, MA 02111-2621
Item 2. Code of Ethics.
Not applicable at this time.
Item 3. Audit Committee Financial Expert.
Not applicable at this time.
Item 4. Principal Accountant Fees and Services.
Not applicable at this time.
Item 5. Audit Committee of Listed Registrants.
Not applicable.
Item 6. Schedule of Investments
The registrant’s “Schedule I – Investments in securities of unaffiliated issuers” (as set forth in 17 CFR 210.12-12) is included in
Item 1 of this Form N-CSR.
Item 7. Disclosure of Proxy Voting Policies and Procedures for Closed-End Management Investment Companies.
Not applicable.
Item 8. Portfolio Managers of Closed-End Management Investment Companies.
Not applicable.
Item 9. Purchases of Equity Securities by Closed-End Management Investment Company and Affiliated Purchasers.
Not applicable.
Item 10. Submission of Matters to a Vote of Security Holders.
There have not been any material changes to the procedures by which shareholders may recommend nominees to the registrant’s board of directors, since those procedures were last disclosed in response to the requirements of Item 7(d)(2)(ii)(G) of Schedule 14A or this Item.
Item 11. Controls and Procedures.
(a) The registrant’s principal executive officer and principal financial officers, based on their evaluation of the registrant’s disclosure controls and procedures as of a date within 90 days of the filing of this report, have concluded that such controls and procedures are adequately designed to ensure that information required to be disclosed by the registrant in Form N-CSR is accumulated and communicated to the registrant’s management, including the principal executive officer and principal financial officer, or persons performing similar functions, as appropriate to allow timely decisions regarding required disclosure.
(b) There were no changes in the registrant’s internal control over financial reporting that occurred during the registrant’s second fiscal quarter of the period covered by this report that has materially affected, or is reasonably likely to materially affect, the registrant’s internal control over financial reporting.
Item 12. Exhibits.
(a)(1) Code of ethics required to be disclosed under Item 2 of Form N-CSR: Not applicable at this time.
(a)(2) Certifications pursuant to Rule 30a-2(a) under the Investment Company Act of 1940 (17 CFR 270.30a-2(a)) attached hereto as Exhibit 99.CERT.
(a)(3) Not applicable.
(b) Certification pursuant to Rule 30a-2(b) under the Investment Company Act of 1940 (17 CFR 270.30a-2(b)) attached hereto as Exhibit 99.906CERT.
SIGNATURES
Pursuant to the requirements of the Securities Exchange Act of 1934 and the Investment Company Act of 1940, the registrant has duly caused this report to be signed on its behalf by the undersigned, thereunto duly authorized.
(registrant) |
| CMG Fund Trust | ||
|
|
| ||
By (Signature and Title) |
| /s/ Christopher L. Wilson | ||
|
| Christopher L. Wilson, President | ||
|
|
| ||
Date |
| March 27, 2006 | ||
Pursuant to the requirements of the Securities Exchange Act of 1934 and the Investment Company Act of 1940, this report has been signed below by the following persons on behalf of the registrant and in the capacities and on the dates indicated.
By (Signature and Title) |
| /s/ Christopher L. Wilson | |||
|
| Christopher L. Wilson, President | |||
|
|
| |||
Date |
| March 27, 2006 | |||
|
|
| |||
By (Signature and Title) |
| /s/ J. Kevin Connaughton | |||
|
| J. Kevin Connaughton, Treasurer | |||
|
|
| |||
Date |
| March 27, 2006 | |||